
Thesis - UvA-DARE (Digital Academic Repository ...
195
UvA-DARE is a service provided by the library of the University of Amsterdam (https://dare.uva.nl) UvA-DARE (Digital Academic Repository) Blood pressure analysis on time scales from seconds to days Westerhof, B.E. Publication date 2005 Document Version Final published version Link to publication Citation for published version (APA): Westerhof, B. E. (2005). Blood pressure analysis on time scales from seconds to days. General rights It is not permitted to download or to forward/distribute the text or part of it without the consent of the author(s) and/or copyright holder(s), other than for strictly personal, individual use, unless the work is under an open content license (like Creative Commons). Disclaimer/Complaints regulations If you believe that digital publication of certain material infringes any of your rights or (privacy) interests, please let the Library know, stating your reasons. In case of a legitimate complaint, the Library will make the material inaccessible and/or remove it from the website. Please Ask the Library: https://uba.uva.nl/en/contact, or a letter to: Library of the University of Amsterdam, Secretariat, Singel 425, 1012 WP Amsterdam, The Netherlands. You will be contacted as soon as possible. Download date:13 Jan 2022
-
Upload
khangminh22 -
Category
Documents
-
view
4 -
download
0
Transcript of Thesis - UvA-DARE (Digital Academic Repository ...

UvA-DARE is a service provided by the library of the University of Amsterdam (https://dare.uva.nl)
UvA-DARE (Digital Academic Repository)
Blood pressure analysis on time scales from seconds to days
Westerhof, B.E.
Publication date2005Document VersionFinal published version
Link to publication
Citation for published version (APA):Westerhof, B. E. (2005). Blood pressure analysis on time scales from seconds to days.
General rightsIt is not permitted to download or to forward/distribute the text or part of it without the consent of the author(s)and/or copyright holder(s), other than for strictly personal, individual use, unless the work is under an opencontent license (like Creative Commons).
Disclaimer/Complaints regulationsIf you believe that digital publication of certain material infringes any of your rights or (privacy) interests, pleaselet the Library know, stating your reasons. In case of a legitimate complaint, the Library will make the materialinaccessible and/or remove it from the website. Please Ask the Library: https://uba.uva.nl/en/contact, or a letterto: Library of the University of Amsterdam, Secretariat, Singel 425, 1012 WP Amsterdam, The Netherlands. Youwill be contacted as soon as possible.
Download date:13 Jan 2022

Berend E. Westerhof
Blood pressure analysis on tim
e scales from seconds to days B
erend E. Westerhof
Blood pressure analysison time scales from seconds to days
UitnodigingVoor het bijwonen van de openbare
verdediging van het proefschrift:
Blood pressure analysis on time scales
from seconds to days
van
Berend E. Westerhof
Op dinsdag 13 December 2005
om 12.00 uur
In de Aula van de Universiteit van Amsterdam, Oude Lutherse Kerk,
Singel 411 (hoek Spui)te Amsterdam
Receptie ter plaatsena afloop van de promotie
Berend E. WesterhofM. van Borsselenlaan 361181 DA Amstelveen
Tel: 020 6432746
Paranimfen:
Gabriela Montorzi-ThorellTel: +41 22 7430384
Claas WesterhofTel: 010 4258645

Blood pressure analysis
on time scales from seconds to days
Berend E. Westerhof

Blood pressure analysis on time scales from seconds to days
Thesis University of Amsterdam, the Netherlands
ISBN-10: 9090201580 ISBN-13: 9789090201580
© 2005 Berend E. Westerhof
Cover: Adapted homunculi representing the model of the systemic arterial system as
described by N. Westerhof in “Analog studies of human systemic arterial
hemodynamics”, Thesis, University of Pennsylvania, Philadelphia PA.
Financial support: BMEYE B.V.
Printed in 2005 by FEBODRUK, Enschede, the Netherlands

BLOOD PRESSURE ANALYSIS ON TIME SCALES
FROM SECONDS TO DAYS
ACADEMISCH PROEFSCHRIFT
ter verkrijging van de graad van doctor
aan de Universiteit van Amsterdam
op gezag van de Rector Magnificus
prof. mr. P.F. van der Heijden
ten overstaan van een door het college voor promoties ingestelde
commissie, in het openbaar te verdedigen in de Aula der Universiteit
op dinsdag 13 december 2005, te 12.00 uur
door
Berend Eric Westerhof
geboren te Washington DC, Verenigde Staten van Amerika

Promotiecommissie: Promotor: Prof. Dr. Ir. J.A.E. Spaan Prof. Ir. K.H. Wesseling, Emeritus Co-promotor: Dr. J.M. Karemaker Overige leden: Prof. Dr. Ir. C.A. Grimbergen
Prof. Dr. J.H. Ravesloot Prof. Dr. N. Stergiopulos Dr. W.J.W. Bos Faculteit der Geneeskunde

Aan Marleen, Marten en Rosa


7
Table of contents
1. Introduction 9
2. Sensitivity of pressure transfer to arterial parameters 29
3. Parameter adaptation to individualize pressure reconstruction 43
4. Quantification of wave reflection in the human aorta from pressure alone
59
5. Variations in cardiac oxygen supply and demand in hypertensive subjects after rising
77
6. Time-domain cross-correlation baroreflex sensitivity:
performance on the Eurobavar data set 89
7. Dynamics of baroreflex sensitivity during postural stress 109
8. Variable day/night bias in 24-h non-invasive finger pressure against intrabrachial artery pressure is removed by waveform filtering and level correction
129
9. Non-invasive blood pressure measurement in relation to a variety of basic and clinical applications
141
10. Summary and Conclusions 149
Appendix Assessing arterial baroreflex control of heart rate: new perspectives 157
Background 169
Samenvatting 179
Dankwoord 189
Overview of studies 191

8

9
“primum non nocere”
Chapter 1
Introduction
The maxim “First, do no harm” 1 is chosen as a motto for this thesis, as all exploration in
this work is directed towards methods that allow diagnosis based on non-invasive
measurements of blood pressure.
Blood pressure
Blood pressure is the result of the heart pumping against the arterial load. Pressure
should be maintained while different tissues tap flow according to their needs for oxygen
and nutrients. Particularly the brain and the heart muscle itself are very dependent on a
sufficient supply of oxygen at all time. Several activities influence blood pressure, for
instance tensing of the leg muscles returns venous blood to the heart which then will be
pumped out and increase pressure. Other processes may tend to decrease pressure by
requiring more flow, or in other words, by lowering the resistance. The autonomic
nervous system has several options to stabilize blood pressure. Changing venous
compliance greatly enhances filling of the heart; modulating the vascular resistance is
also very effective. Varying heart rate is less effective, but more noticeable. With fever,
the higher body temperature and thus metabolic rate requires more oxygen to be
delivered, often resulting in high heart rates and palpitations.
1 “First, do no harm” is widely believed to be part of the Hippocratic oath, which, however, it is not. Hippocrates did articulate a similar conviction in his Epidemics, Book I, Section XI: “(…) to help, or at least to do no harm”. The Greek physician Galen may have first used the phrase in Latin as cited above while working in Rome.

10
Continually interacting processes result in continually varying blood pressure and heart
rate. Simple daily activities such as talking or even breathing have an effect on blood
pressure. Blood pressure can double with anxiety, heart rate can triple with physical
activity, while cardiac output, the product of the volume pumped out by the heart per
beat (stroke volume) times heart rate can increase four- to perhaps six-fold in well-
trained athletes.
Clinical importance
When blood pressure is out of its normal range for longer periods, one speaks of high
blood pressure, hypertension, or low blood pressure, hypotension. Hypotension is
usually no threat to health in daily life as long as no light-headedness or fainting occurs.
It can pose an acute threat due to underperfusion in for instance sepsis patients.
Hypertension is an acute risk when extremely high, but even moderate hypertension is
considered to be very dangerous on the long run. Hypertension is defined when the
highest value of the pressure curve, the systolic blood pressure, exceeds 140 mmHg
(systolic hypertension) or when the lowest value, diastolic blood pressure, exceeds 90
mmHg (diastolic hypertension). Up to 30 % of the adult population in most countries
suffers from hypertension and it is one of the most important preventable causes of death
worldwide. Together with other modifiable risk factors including high cholesterol, diet,
inactive lifestyle and smoking, hypertension accounts for about 75 % of cardiovascular
diseases (WHO, Cardiovascular Disease: Prevention and Control. 2003).
Methods of measurements
Early and accurate diagnosis may be a key factor in prevention of or therapy for
hypertension. The feeling of the pulse is one of the oldest manners of diagnosis, believed
to be the invention of Herophilus (335 – 280 B.C.). It was centuries later before Hales2
performed quantitative measurements in 1733 (1). The level to which the blood of a
horse rose in the glass tubing connected to the ‘crural’ artery gave the level of blood
pressure in cmH20 (or cm blood, to be precise). Obviously this method was unfit for use
in humans. A breakthrough was made by Riva-Rocci in 1896 (2), the year when he
presented an air-inflatable arm cuff connected to a manometer; by deflating the cuff and
feeling for the pulse distal of the cuff systolic blood pressure could be determined. In
2 Often the reference to Hales’ measurement is accompanied by a well-known engraving by Cuzzo. This artist reconstruction was made in 1944 and shows the tube connected to the carotid artery in stead of to a crural artery as described by Hales.

11
1905 Korotkoff (3) refined the technique further with the auscultatory method. With the
introduction of the use of a stethoscope diastolic pressure could be determined as well.
The Riva-Rocci / Korotkoff method remains the standard for blood pressure
measurement until today. Nowadays, automated measurements, mostly with
oscillometric devices, are becoming more and more accepted. These devices measure the
pressure in a cuff, which is first inflated above systolic pressure and then deflated to
below diastolic pressure. Oscillation in the cuff pressure is maximal at mean arterial
pressure; mathematical algorithms determine systolic and diastolic values from the
oscillations. What was lost however, with these cuff methods, was the possibility to
observe the shape of the pulse wave.
Figure 1
Hales had noted the oscillation of the blood in his glass tube and later (1838) Poiseuille
designed an instrument specifically for the quantifying these variations, basically a
Ludwig’s Kymograph

12
mercury filled u-shaped tube with a scale. Ludwig (4) described the kymograph (Figure
1) in 1847 with which blood pressure oscillation could be recorded on a drum3. These
instruments measured invasively, thus restricting their use. One of the most accurate
apparatuses designed for non-invasive wave shape analysis was Marey’s (5)
sphygmograph (1860). A lever system amplified the radial pulse (Figure 2), which then
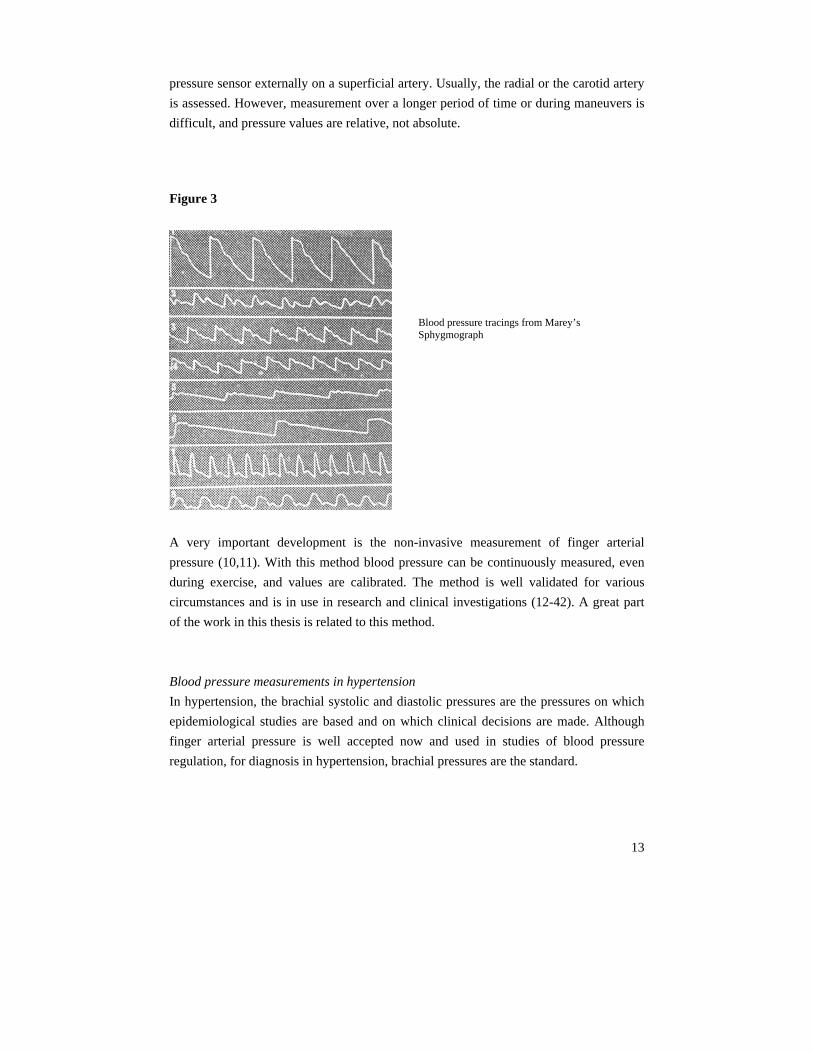
was graphed on a smoke-blackened moving strip (Figure 3).
Figure 2
Marey’s Sphygmograph
A technique that combines accuracy with maximal information is the continuous
pressure recording with the direct intra-arterial method. First mentions date back to
1914, when Bleichroeder (6) performed a catheterization of his own radial artery.
Whether he recorded his blood pressure is not clear, however, it would have been
possible at that time. Frank developed a manometer that could accurately measure
pulsatile pressure in 1903 (7). High fidelity catheter-tip manometers were introduced by
Millar in 1972 (8). Intra-arterial measurements are routinely performed in operation
theaters and intensive care settings, in other words, those circumstances in which it is
vital to continuously monitor blood pressure, mostly to prevent pressures to become too
low. When no such imperative reasons are present it may not be ethical to measure intra-
arterial pressure. If nonetheless the pressure wave shape is required, applanation
tonometry is a non-invasive alternative. Measurements are performed by placing a
3 Hoff and Geddes argue (4) that Ludwig may not have been the first to use graphic registration in physiology.
13
pressure sensor externally on a superficial artery. Usually, the radial or the carotid artery
is assessed. However, measurement over a longer period of time or during maneuvers is
difficult, and pressure values are relative, not absolute.
Figure 3
A very important development is the non-invasive measurement of finger arterial
pressure (10,11). With this method blood pressure can be continuously measured, even
during exercise, and values are calibrated. The method is well validated for various
circumstances and is in use in research and clinical investigations (12-42). A great part
of the work in this thesis is related to this method.
Blood pressure measurements in hypertension
In hypertension, the brachial systolic and diastolic pressures are the pressures on which
epidemiological studies are based and on which clinical decisions are made. Although
finger arterial pressure is well accepted now and used in studies of blood pressure
regulation, for diagnosis in hypertension, brachial pressures are the standard.
Blood pressure tracings from Marey’s Sphygmograph
14
Twenty-four hour recordings of blood pressure, or even 48 hours, are becoming more
frequent in studies on hypertension and for diagnosis (43). It is generally accepted
nowadays that 24-hour recordings of blood pressure are better predictors of
cardiovascular morbidity and mortality and to correlate closer to organ damage than
“office blood pressure”: the blood pressure determined by the doctor when examining
the patient. Here one enters the discussions of the “white coat effect” (44); the finding
that blood pressure can be elevated by the stress of the environment. Thus it plays a role
by whom and where the measurements are taken: measurement by nurse, doctor, or self,
measurement by machine at home or in the office, and combinations of all the above. A
special class is defined recently as the masked hypertensives (45): hypertensives who
remain undetected because they, for unknown reasons, have pressures below the limits
of hypertension when measured in the office, but have elevated blood pressures in daily
life. In other words, the time of measurement also plays an important role and this is why
an ambulatory method gives superior insight in the blood pressure of a person.
In the field of 24-hour recordings, patients can be classified as dippers, non-dippers, and
reverse dippers (46,47,48). Dippers lower their blood pressure by more than 10 mmHg
or by more than 10 % during the nighttime hours. Non-dippers decrease less in pressure
and reverse dippers increase their blood pressure during the night. All classes have been
associated with different levels of risk for cardiac and cerebrovascular incidents.
Ambulatory 24-hour measurements are generally carried out with oscillometric devices
on the upper arm, and usually these measurements give sufficient information for
diagnostic purposes. However, in research, continuous measurements are obviously
much more valuable. For instance, in the investigation of silent ischemia (49), i.e.
ischemia not noted by the patient but detectable from the ECG, oscillometric devices do
not have the required time-resolution. Another field in which interest is growing is sleep
apnea, known to be a risk factor for hypertension (50). The combination of continuous
blood pressure with ECG, ventilation and perhaps blood oxygenation gives much more
information needed for thorough research.
Limitations of the methods
Non-invasive pressure is, necessarily, measured in peripheral vessels, usually the
brachial, radial or finger arteries as mentioned. The amplitudes and the wave shapes of
these pressures differ from ascending aortic pressure and these differences are not
constant but variable, for instance during medication (51). It is central pressure that
forms the load on the heart during systole and that determines the perfusion pressure for
coronary circulation during diastole, the period in which most of the myocardial

15
perfusion takes place (52). Wave shape analysis, for instance to obtain a measure of
arterial stiffness, should preferably be performed on central pressure as well. Information
contained in the wave shape made available by continuous non-invasive methods from
peripheral vessels can nevertheless help to reconstruct central pressure. When only
systolic and diastolic pressures are available possibilities to reconstruct central pressure
are very limited.
Blood pressure not only varies with time within a heartbeat but also from one beat to
another and a single measurement is only of limited value. As pointed out, there is a
tendency to follow blood pressure over 24 hours or even two days, since not only the
absolute values are important, blood pressure variability is an important parameter as
well. With automated devices measurements can be taken at most every few minutes;
however, even more insight into the processes determining systemic pressure can be
obtained when beat-to-beat blood pressure values are available. In this case, heart rate
and pressure variability can be analyzed in great detail and baroreflex sensitivity can be
calculated from the relation between heart rate and blood pressure. The baroreflex is
important to stabilize blood pressure by increasing or decreasing heart rate in reaction to
pressure changes. Baroreflex sensitivity is a prognostic factor in cardiology (53,54,55).

16
This thesis
Overview
This thesis aims to improve the possibilities of retrieving information from blood
pressure measurements especially when this pressure is obtained non-invasively from the
finger.
First, an effort is made to develop and test transfer functions between central and
peripheral blood pressure. For this, continuous information on these pressures is required
and the systolic and diastolic pressure values are not sufficient. Transfer function
analysis is on a time scale of milliseconds. The main conclusion is that a single
generalized transfer function is usually sufficient to reconstruct central pressure from
peripheral pressure.
We also developed a new method to determine wave reflection in the aorta, which is a
measure of arterial stiffness, also on a time scale of milliseconds. Although this study
was performed using high fidelity central measurements of pressure and flow we expect
that the method is applicable without flow measurements with uncalibrated pressure
recording.
Having established that central pressure can be reconstructed from peripheral pressure
(15,20), this pressure signal can then be used to make a reasonable assumption about the
cardiac oxygen demand as measure of cardiac work and cardiac oxygen supply. Cardiac
oxygen supply and demand should be in balance, or else cardiac ischemia will develop.
A new method for the determination of baroreflex sensitivity is described next. The new
method is then used to investigate the dynamics of the baroreflex during orthostatic
stress. The processes related to oxygen supply/demand ratio and baroreceptor reflex take
place on the time scale of seconds.
A method to correct the pressure drop that may occur between brachial and finger
arterial pressure was examined (20,42). We showed that this method can correct the
differences between brachial and finger arterial pressure over 24 hours and it facilitates
the blood pressure measurement over days.

17
Below we will discuss the relevance of these studies in some detail.
Transfer functions
Non-invasive pressure measurements are typically obtained from peripheral sites as the
radial artery by applanation tonometry (56,57) or from the finger with the so-called
“volume-clamp”/“physiocal” method (10,11). Applanation of the carotid artery gives an
accepted “surrogate” of central arterial pressure. Pressure measurement by applanation
tonometry cannot give absolute values, since no objective criteria exist for the operator
to know if the pressure is indeed representing the intra-arterial values. Simply fitting the
measured curves to brachial diastolic and mean pressure (60) can give a reasonable
approximation. However, one can do much better using the concepts from signal
analysis directed to describing relationships between causally related signals. So-called
transfer functions form a powerful method to do so. Hence, the application of transfer
functions allows the calculation of central pressure from peripheral pressure and thereby
estimation of the inherent consequences of generated pressure for the heart. Transfer
functions are widely used in the literature nowadays and are advocated by many
(12,15,19-21,30,31,42,57-64). In contrast, some groups have proposed to distil important
parameters pertaining to cardiovascular condition directly form peripheral pressures
(65,66), thus circumventing the use of transfer functions.
In a physiological model we set out to investigate which vessel wall- and blood
properties have the largest influence on the pressure transfer. The results of this
sensitivity analysis are summarized in Chapter 2. The central to peripheral time delay of
the upstroke in pressure can be measured and we investigated the potential of this
parameter in adjusting the transfer function to improve reconstructed central pressures.
The findings of this research are presented in Chapter 3.
Reflection indices
The augmentation index (secondary rise in systolic pressure divided by pulse pressure) is
a popular construct used in trials and associated with virtually any other index in the
field of hemodynamics and hypertension. Originally, the index was devised to get an
indication of wave reflection, which in turn should give an indication of arterial stiffness.
A fundamentally better estimate of arterial stiffness is obtained by pulse wave velocity
measurement. Indeed these measurements are also performed frequently (67). The great
advantage of augmentation index measurement is that only one arterial site has to be
assessed, usually the carotid artery, whereas for pulse wave velocity measurements two
18
sites are required. Most customary sites are carotid and femoral artery, to have a
relatively large part of the aorta included in the measurement.
As will be discussed in Chapter 4 the calculation of the reflection index requires the
pressure wave as well as the flow wave. It has been suggested that the description of the
aortic valve flow wave by a triangular shape in systole would be a useful approximation
(68). This method simplifies the determination of the reflection index considerably.
Moreover, it circumvents a weakness of the augmentation index since this conventional
signal analysis cannot detect reflection when the summation of the reflected wave and
forward wave result in a waveform without discontinuity in the rising pressure
waveform. This new method opens the way to non-invasive measurements allowing
large-scale population research.
Cardiac oxygen supply and demand
Morning excess in cardiovascular incidents has always been attributed to an increase in
cardiac oxygen demand (69,70), caused by increasing blood pressure and heart rate. In
the literature, decreased oxygen supply has always been associated with increased
coronary tone, coronary vasospasm, stenosis or atherosclerosis, or heightened platelet
aggregability, but never with decreased cardiac oxygen supply potential (71). However,
we show that not only cardiac oxygen demand increases in the morning but that cardiac
oxygen supply-potential decreases as well. To estimate cardiac oxygen demand we used
the Rate-Pressure Product (52,72), an index that is well accepted; to estimate cardiac
supply potential we used the Diastolic Time Fraction, which is recently emerging as a
good indicator of subendocardial perfusion (73,74). Both indices show a strong
correlation with heart rate, oxygen demand increasing with increasing heart rate and
oxygen supply potential decreasing. In relation to the heart rate increase after rising it is
heartening to note that the hypertensive population in our study has a smaller increase
than the normotensives controls: this limits the morning imbalance between supply and
demand (Chapter 5).
Baroreflex sensitivity
Baroreflex can be calculated from changes in interbeat-interval following changes in
blood pressure. Blood pressure changes can be spontaneous or provoked. The
provocation of blood pressure changes can be accomplished by infusion of vasoactive
drugs. First, angiotensin was used (75), but this substance was shown to have a central
effect on the baroreflex. Later, phenylephrine and nitroprusside were used to increase
and decrease blood pressure, respectively (76). Both substances affect the baroreflex as
well (77,78) by changing the properties of the vascular wall where the receptors are
19
located. Another accepted method is neck suction or pressure (79). With a neck-cuff
pressure changes can be transferred to the carotid sinus, thus deceiving the system that
arterial pressure is too high or too low.
Using the spontaneous variations in interbeat interval and blood pressure allows much
more agreeable determination of baroreflex sensitivity. The so-called sequential method
(80) searches for sequences in which interbeat interval and blood pressure jointly
increase or decrease. When a sequence of three or more normal beats is recognized, the
linear regression through interbeat interval values as a function of blood pressure values
is calculated and the angle of the regression line is taken as baroreflex sensitivity.
Usually the delay between blood pressure and interbeat interval changes is prescribed at
zero or one beat.
In a recently proposed method, cross-correlations between pressure and interbeat interval
are calculated for time delays from 0 to 5 seconds of interbeat interval (41). The linear
regression with the highest coefficient of correlation renders the slope, quantifying the
baroreflex sensitivity. The time delay is not prescribed but retrieved from the
measurements, giving extra information. We call this the xBRS method for cross-
correlation baroreflex sensitivity.
This method was evaluated (Chapter 6) on a set of data of the EUROBAVAR working
group, available through the Internet for this purpose. We found that the method gives
results comparable to other methods using these data, but with a larger number of
estimations per unit of time and with less scatter. The publication was accompanied by
an editorial comment, which is included in an Appendix to this thesis.
The tilt table is an excellent method to challenge the baroreflex and we investigated
whether we could document that with our new method (Chapter 7). The baroreflex
sensitivity changed with the tilt angle, and the rate of change appears to be related to the
magnitude of change of the tilt angle. The BRS shows a linear relation to the sine of the
tilt angle as well: as vagal activity withdrew, the BRS decreased. This is associated by a
shift towards longer delays between blood pressure and interbeat interval changes.
Level correction
A transfer function is very useful in relating the waveforms measured at the periphery
and central. However, it does not entirely account for the differences in the measurement
of mean blood pressure. In Chapter 8 it is shown that finger blood pressure can be
reconstructed, with a transfer function and a level correction, to brachial blood pressure,
with acceptable errors, thus allowing the comparison to standard brachial values. The
level correction method (20) was originally developed for transversal use, i.e. for groups

20
of patients; we now show its usefulness longitudinally, i.e. over 24 hours (42). Tracking
is improved and the nocturnal dip is better described. Probably one calibration of
reconstructed pressure per day will suffice (21).
Conclusion
In this dissertation several methods are explored to advance the use of non-invasive
recording of arterial blood pressure for studies in physiology and diagnostics in
cardiovascular disease and hypertension. Ordered by increasing time scale, we will
describe a physiological model of pressure transfer, and consecutively propose a method
for individualization of a pressure transfer function.
Next a method is proposed to calculate the reflection index using pressure wave features.
Wave reflections are of interest since they are a measure of arterial stiffness and used as
a marker for cardiovascular morbidity and mortality. Usually the augmentation index is
calculated as an approximation of the reflection index. It will be show that the suggested
method gives results closer to measured reflection index than the established method of
augmentation index calculation.
Further, parameters for cardiac oxygen supply potential and cardiac oxygen demand are
studied. An accepted concept relates the elevated numbers of cardiovascular incidents in
the morning hours to increased cardiac oxygen demand after rising, However, we will
demonstrate that cardiac oxygen supply potential decreases as well.
An prognostic factor in cardiology is baroreflex sensitivity, a measure of autonomic
blood pressure control. We put forward a new method to determine baroreflex
sensitivity, giving more results per unit of time and additionally a time delay in
autonomic reaction. This delay may allow us to discriminate between the fast
parasympathetic and the slower sympathetic branch of the autonomic system. This
assumption will be considered in a study of the influence of orthostatic stress on
baroreflex sensitivity.
Finally, on a time scale of 24 hours, a method to improve the reconstruction of brachial
artery pressure from finger arterial pressure measurements is tested. We anticipate
showing that the diurnal blood pressure pattern can be more accurately described.
Dipping or non-dipping of nocturnal pressure is an issue in the classification of the
severity of hypertension and reliably discriminating dippers and non-dippers from non-
invasive pressures is a useful asset.

21
In conclusion, several new methods were investigated to advance diagnostics in
cardiovascular disease and hypertension, based on non-invasive blood pressure.

22
References
1. Hales S. An account of some hydraulic and hydrostatical experiments made on the blood and
blood-vessels of animals. 1733
Cited from: Hales S. Foundations of anesthesiology. An account of some hydraulic and
hydrostatical experiments made on the blood and blood-vessels of animals. J Clin Monit
Comput. 2000;16:45-7.
2. Riva-Rocci S. Un nuovo sfigmomanometro. Gazzetta Medica di Torino. 1896;47 981-1001
Cited from: Riva-Rocci S, Zanchetti A, Mancia G. A new sphygmomanometer.
Sphygmomanometric technique. J Hypertens. 1996;14:1-12.
3. Korotkoff N. To the question of methods of determining the blood pressure. Reports of the
Military Academy. 1905;11: 365-367.
Cited from: Korotkov NS. Concerning the problem of the methods of blood pressure
measurement. J Hypertens. 2005;23:5
4. Ludwig C. Beiträge zur Kenntniss des Einflusses der Respirations-bewegungen auf den
Blutlauf. Müller’s Arch. f. Anat. Physiol., u. Wissensch. Med. 1847, 242-302.
Cited from: Hoff HE, Geddes LA. Graphic registration before Ludwig; the antecedents of the
kymograph. Isis. 1959;50:5-21.
5. Marey E.J. La circulation du sang à l’état physiologique et dans les maladies. Paris: Masson
& Cie, 1881.
Cited from: Lawrence C. Physiological apparatus in the Wellcome Museum. 1. The Marey
sphygmograph. Med Hist. 1978;22:196-200.
6. Bleichroeder, Unger & Loeb, 1914. 1881.
Cited from: BPM Imholz. Noninvasive Finger Arterial Pressure Waveform Registration:
evaluation of Finapres and Portapres. Amsterdam: PhD Thesis, 1991.
7. Frank O. Kritik der Elasticchen manometer. Z. Biol. 1903;44:445-613.
Cited from: Nichols WW, O’Rourke MF. McDonald’s Blood Flow in Arteries, 3rd ed.
London, UK: Arnold;1990
8. Murgo JP, Millar H. A new cardiac catheter for high fidelity differential pressure recordings.
Proc. Ann Conf. Engng Med Biol. 1972;14:303-303
Cited from: Nichols WW, O’Rourke MF. McDonald’s Blood Flow in Arteries, 3rd ed.
London, UK: Arnold;1990
9. Nicolas Postel-Vinay, ed. A century of Arterial Hypertension 1896-1996. John Wiley and
Sons, Chichester. 1996.
10. Peñáz J, Photoelectric measurement of blood pressure, volume and flow in the finger. Digest
10th Int Conf Med Biol Engng, Dresden: 1973;page 104.
11. Wesseling KH, de Wit B, van der Hoeven GMA, van Goudoever J, Settels J: Physiocal,
calibrating finger vascular physiology for Finapres. Homeostasis. 1995;36: 67-82.

23
12. Blum V, Carriere EG, Kolsters W, Mosterd WL, Schiereck P, Wesseling KH. Aortic and
peripheral blood pressure during isometric and dynamic exercise. Int J Sports Med.
1997;18:30-4.
13. Bos WJ, Imholz BP, van Goudoever J, Wesseling KH, van Montfrans GA. The reliability of
noninvasive continuous finger blood pressure measurement in patients with both
hypertension and vascular disease. Am J Hypertens. 1992;5:529-35.
14. Bos WJ, van den Meiracker AH, Wesseling KH, Schalekamp MA. Effect of regional and
systemic changes in vasomotor tone on finger pressure amplification. Hypertension.
1995;26:315-20.
15. Bos WJ, van Goudoever J, van Montfrans GA, van den Meiracker, AH, Wesseling KH.
Reconstruction of brachial artery pressure from noninvasive finger pressure measurements.
Circulation. 1996;94:1870-5.
16. Dorlas JC, Nijboer JA, Butijn WT, van der Hoeven GM, Settels JJ, Wesseling KH: Effects of
peripheral vasoconstriction on the blood pressure in the finger, measured continuously by a
new noninvasive method (the Finapres). Anesthesiology. 1985;62:342-5.
17. Gisolf J, van Lieshout JJ, van Heusden K, Pott F, Stok WJ, Karemaker JM. Human cerebral
venous outflow pathway depends on posture and central venous pressure. J Physiol.
2004;560:317-27.
18. Gisolf J, Westerhof BE, van Dijk N, Wesseling KH, Wieling W, Karemaker JM. Sublingual
nitroglycerin used in routine tilt testing provokes a cardiac output-mediated vasovagal
response. J Am Coll Cardiol. 2004;44:588-93.
19. Gizdulich P, Imholz BP, van den Meiracker AH, Parati G, Wesseling KH. Finapres tracking
of systolic pressure and baroreflex sensitivity improved by waveform filtering. J Hypertens.
1996;14:243-50.
20. Gizdulich P, Prentza A, Wesseling KH. Models of brachial to finger pulse wave distortion
and pressure decrement. Cardiovasc Res. 1997;33:698-705.
21. Guelen I, Westerhof BE, Van Der Sar GL, Van Montfrans GA, Kiemeneij F, Wesseling KH,
Bos WJ. Finometer, finger pressure measurements with the possibility to reconstruct brachial
pressure. Blood Press Monit. 2003;8:27-30.
22. Harms MP, Wesseling KH, Pott F, Jenstrup M, van Goudoever J, Secher NH, van Lieshout
JJ: Continuous stroke volume monitoring by modeling flow from non-invasive measurement
of arterial pressure in humans under orthostatic stress. Clin Sci (Lond). 1999;97:291-301.
23. Idema RN, van den Meiracker AH, Imholz BP, Man in 't Veld AJ, Settels JJ, Ritsema van
Eck HJ, Schalekamp MA: Comparison of Finapres non-invasive beat-to-beat finger blood
pressure with intrabrachial artery pressure during and after bicycle ergometry. J. Hypertens.
1989;7:S58-9.
24. Imholz BP, Langewouters GJ, van Montfrans GA, Parati G, van Goudoever J, Wesseling
KH, Wieling W, Mancia G: Feasibility of ambulatory, continuous 24-hour finger arterial
pressure recording. Hypertension. 1993;21:65-73.

24
25. Imholz BP, Wieling W, van Montfrans GA, Wesseling KH: Fifteen years experience with
finger arterial pressure monitoring: assessment of the technology. Cardiovasc Res. 1998;38:
605-16.
26. Immink RV, van den Born BJ, van Montfrans GA, Koopmans RP, Karemaker JM, van
Lieshout JJ. Impaired cerebral autoregulation in patients with malignant hypertension.
Circulation. 2004;110:2241-5.
27. Jansen JR, Schreuder JJ, Mulier JP, Smith NT, Settels JJ, Wesseling KH. A comparison of
cardiac output derived from the arterial pressure wave against thermodilution in cardiac
surgery patients. Br J Anaesth. 2001;87:212-22.
28. Jellema WT, Imholz BP, van Goudoever J, Wesseling KH, van Lieshout JJ: Finger arterial
versus intrabrachial pressure and continuous cardiac output during head-up tilt testing in
healthy subjects. Clin Sci (Lond). 1996;91:193-200.
29. Jellema WT, Wesseling KH., Groeneveld AB., Stoutenbeek CP., Thijs LG., van Lieshout JJ:
Continuous cardiac output in septic shock by simulating a model of the aortic input
impedance: a comparison with bolus injection thermodilution. Anesthesiology.
1999;90:1317-28,
30. Meijboom LJ, Westerhof BE, Nollen GJ, Spaan JA, de Mol BA, Jacobs MJ, Mulder BJ.
Beta-blocking therapy in patients with the Marfan syndrome and entire aortic replacement.
Eur J Cardiothorac Surg. 2004;26:901-6.
31. Nollen GJ, Westerhof BE, Groenink M, Osnabrugge A, van der Wall EE, Mulder BJ. Aortic
pressure-area relation in Marfan patients with and without beta blocking agents: a new non-
invasive approach. Heart. 2004;90:314-8.
32. Omboni S, Parati G, Castiglioni P, Di Rienzo M, Imholz BP, Langewouters, GJ, Wesseling
KH, Mancia G. Estimation of blood pressure variability from 24-hour ambulatory finger
blood pressure. Hypertension. 1998;32:52-8.
33. Omboni S, Smit AA, van Lieshout JJ, Settels JJ, Langewouters GJ, Wieling W. Mechanisms
underlying the impairment in orthostatic tolerance after nocturnal recumbency in patients
with autonomic failure. Clin Sci (Lond). 2001;101:609-18.
34. Omboni S, Smit AA, Wieling W. Twenty four hour continuous non-invasive finger blood
pressure monitoring: a novel approach to the evaluation of treatment in patients with
autonomic failure. Br Heart J. 1995;73:290-2.
35. Voogel AJ, Stok WJ, Pretorius PJ, Van Montfrans GA, Langewouters GJ, Karemaker JM.
Circadian blood pressure and systemic hemodynamics during 42 days of 6 degrees head-
down tilt. Acta Physiol Scand. 1997;161:71-80.
36. Voogel AJ, van Montfrans GA: Reproducibility of twenty-four-hour finger arterial blood
pressure, variability and systemic hemodynamics. J Hypertens. 1997;15:1761-5.
37. Voogel AJ, van Steenwijk RP, Karemaker JM, van Montfrans GA. Effects of treatment of
obstructive sleep apnea on circadian hemodynamics. J Auton Nerv Syst. 1999;77:177-183.
38. Wesseling KH, Jansen JRC, Settels JJ, Schreuder JJ: Computation of aortic flow from
pressure in humans using a nonlinear, three-element model. JAP. 1993;74:2566-2573.

25
39. Wesseling KH, Settels JJ, van der Hoeven GMA, Nijboer JA, Butijn MWT, Dorlas JC:
Effects of peripheral vasoconstriction on the measurement of blood pressure in a finger.
Cardiovasc Res. 1985;19:139-145.
40. Wesseling KH: A century of noninvasive arterial pressure measurement: from Marey to
Peñáz and Finapres. Homeostasis. 1995;36:50-66.
41. Westerhof BE, Gisolf J, Stok WJ, Wesseling KH, Karemaker JM. Time-domain cross-
correlation baroreflex sensitivity: performance on the EUROBAVAR data set. J Hypertens.
2004;22:1371-80.
42. Westerhof BE, Guelen I, Parati G, Groppelli A, van Montfrans GA, Wieling W, Wesseling
KH, Bos WJ. Variable day/night bias in 24-h non-invasive finger pressure against
intrabrachial artery pressure is removed by waveform filtering and level correction. J
Hypertens. 2002;20:1981-6.
43. Mancia G, Parati G. Ambulatory blood pressure monitoring and organ damage.
Hypertension. 2000;36:894-900. Review.
44. Pickering TG, Hall JE, Appel LJ, Falkner BE, Graves J, Hill MN, Jones DW, Kurtz T, Sheps
SG, Roccella EJ. Recommendations for blood pressure measurement in humans and
experimental animals: part 1: blood pressure measurement in humans: a statement for
professionals from the subcommittee of professional and public education of the American
Heart Association council on high blood pressure research. Circulation. 2005;111:697-716.
45. Pickering TG, Davidson K, Gerin W, Schwartz JE. Masked hypertension. Hypertension.
2002;40:795-6.
46. O'Brien E, Sheridan J, O'Malley K. Dippers and non-dippers. Lancet. 1988 13;2(8607):397.
47. Pickering TG, James GD. Determinants and consequences of the diurnal rhythm of blood
pressure. Am J Hypertens. 1993;6:166S-169S. Review.
48. Parati G. Blood pressure reduction at night: sleep and beyond. J Hypertens. 2000;18:1725-9.
Review.
49. Boon D, Piek JJ, van Montfrans GA. Silent ischaemia and hypertension. J Hypertens.
2000;18:1355-64. Review.
50. Narkiewicz K, Somers VK. The sympathetic nervous system and obstructive sleep apnea:
implications for hypertension. J Hypertens. 1997;15:1613-9. Review.
51. Kelly RP, Gibbs HH, O'Rourke MF, Daley JE, Mang K, Morgan JJ, Avolio AP.
Nitroglycerin has more favourable effects on left ventricular afterload than apparent from
measurement of pressure in a peripheral artery. Eur Heart J. 1990;11:138-44.
52. Westerhof N, Stergiopulos N, Noble MIM. Snapshots of Hemodynamics. An aid for clinical
research and graduate education. New York, NY, USA: Springer; 2005.
53. Katsube Y, Saro H, Naka M, Kim B H, Kinoshita N, Hori M. Decreased baroreflex
sensitivity in patients with stable coronary artery disease is correlated with the severity of
coronary narrowing. Am J Cardiol. 1996;78:1007-1010.
54. La Rovere M T, Specchia G, Mortara A, Schwartz P J. Baroreflex sensitivity, clinical
correlates, and cardiovascular mortality among patients with a first myocardial infarction. A
prospective study. Circulation. 1988;78:816-824.

26
55. Laude D, Elghozi JL, Girard A, Bellard E, Bouhaddi M, Castiglioni P, Cerutti C, Cividjian
A, Di Rienzo M, Fortrat JO, Janssen B, Karemaker JM, Leftheriotis G, Parati G, Persson PB,
Porta A, Quintin L, Regnard J, Rudiger H, Stauss HM. Comparison of various techniques
used to estimate spontaneous baroreflex sensitivity (the EUROBAVAR study). Am J Physiol
Regul Integr Comp Physiol. 2004;286:R226-231.
56. Takazawa K, Tanaka N, Takeda K, Kurosu F, Ibukiyama C. Underestimation of vasodilator
effects of nitroglycerin by upper limb blood pressure. Hypertension. 1995;26:520-3.
57. Segers P, Carlier S, Pasquet A, Rabben SI, Hellevik LR, Remme E, De Backer T, De Sutter
J, Thomas JD, Verdonck P. Individualizing the aorto-radial pressure transfer function:
feasibility of a model-based approach. Am J Physiol Heart Circ Physiol. 2000;279:H542-9.
58. Karamanoglu M, Feneley MP. On-line synthesis of the human ascending aortic pressure
pulse from the finger pulse. Hypertension. 1997;30:1416-24.
59. Westerhof BE, Guelen I, Parati G, Groppelli A, van Montfrans GA, Wieling W, Wesseling
KH, Bos WJ. Variable day/night bias in 24-h non-invasive finger pressure against
intrabrachial artery pressure is removed by waveform filtering and level correction. J
Hypertens. 2002;20:1981-6.
60. Van Bortel LM, Balkestein EJ, van der Heijden-Spek JJ, Vanmolkot FH, Staessen JA,
Kragten JA, Vredeveld JW, Safar ME, Struijker Boudier HA, Hoeks AP. Non-invasive
assessment of local arterial pulse pressure: comparison of applanation tonometry and echo-
tracking. J Hypertens. 2001;19:1037-44.
61. Gallagher D, Adji A, O'Rourke MF. Validation of the transfer function technique for
generating central from peripheral upper limb pressure waveform. Am J Hypertens.
2004;17:1059-67. Review.
62. Chen C-H, Nevo E, Fetics B, Pak PH, Yin FCP, Maughan WL, Kass DA: Estimation of
central aortic pressure waveform by mathematical transformation of radial tonometry
pressure: validation of generalised transfer function. Circulation. 1997;95:1827–1836.
63. Karamanoglu M, Gallagher DE, Avolio AP, O’Rourke MF: Pressure wave propagation in a
multi-branched model of the human upper limb. Am J Physiol. 1995;269:H1363–H1369.
64. Fetics B, Nevo E, Chen CH, Kass DA. Parametric model derivation of transfer function for
noninvasive estimation of aortic pressure by radial tonometry. IEEE Trans Biomed Eng.
1999;46:698-706.
65. Chowienczyk PJ, Kelly RP, MacCallum H, Millasseau SC, Andersson TL, Gosling RG,
Ritter JM, Anggard EE. Photoplethysmographic assessment of pulse wave reflection: blunted
response to endothelium-dependent beta2-adrenergic vasodilation in type II diabetes mellitus.
J Am Coll Cardiol. 1999;34:2007-14.
66. Millasseau SC, Kelly RP, Ritter JM, Chowienczyk PJ. Determination of age-related increases
in large artery stiffness by digital pulse contour analysis. Clin Sci (Lond). 2002;103:371-7.
67. Asmar R, Topouchian J, Pannier B, Benetos A, Safar M; Scientific, Quality Control,
Coordination and Investigation Committees of the Complior Study. Pulse wave velocity as
endpoint in large-scale intervention trial. The Complior study. Scientific, Quality Control,

27
Coordination and Investigation Committees of the Complior Study. J Hypertens.
2001;19:813-8.
68. Avolio A, Cook D, Old R, Halliday A. Non-invasive assessment of wave reflection
phenomena in the central aorta. J Hypertens. 2002;20:S215. Abstract.
69. Deedwania PC. Increased demand versus reduced supply and the circadian variations in
ambulatory myocardial ischemia; therapeutic implications. Circulation. 1993;88:328-331.
70. Parker JD, Testa MA, Jimenez AH, Tofler GH, Muller JE, Parker JO, Stone PH. Morning
increase in ambulatory ischemia in patients with stable coronary artery disease; importance
of physical activity and increased cardiac demand. Circulation. 1994;89:604-614.
71. Pepine CJ. Circadian variations in myocardial ischemia. Implications for management.
JAMA. 1991;265:386-90. Review.
72. Rooke GA, Feigl EO. Work as a correlate of canine left ventricular oxygen consumption, and
the problem of catecholamine oxygen wasting. Circ Res. 1982;50:273-86.
73. Merkus D, Kajiya F, Vink H, Vergroesen I, Dankelman J, Goto M, Spaan JAE. Prolonged
diastolic time fraction protects myocardial perfusion when coronary blood flow is reduced,
Circulation. 1999;100:75-81.
74. Fokkema DS, VanTeeffelen JW, Dekker S, Vergroesen I, Reitsma JB, Spaan JA. Diastolic
time fraction as a determinant of subendocardial perfusion. Am J Physiol Heart Circ Physiol.
2005;288:H2450-6.
75. Smyth H S, Sleight P, Pickering G W. Reflex regulation of arterial pressure during sleep in
man. A quantitative method of assessing baroreflex sensitivity. Circ Res 24:109-121, 1969.
76. Pickering TG, Gribbin B, Sleight P. Comparison of the reflex heart rate response to rising
and falling arterial pressure in man. Cardiovasc Res. 1972;6:277-83.
77. Peveler RC, Bergel DH, Robinson JL, Sleight P. The effect of phenylephrine upon arterial
pressure, carotid sinus radius and baroreflex sensitivity in the conscious greyhound. Clin Sci
(Lond). 1983;64:455-461.
78. Casadei B, Paterson, DJ. Should we still use nitrovasodilators to test baroreflex sensitivity? J
Hypertens. 2000;18:3-6.
79. Eckberg D L, Abboud F M, Mark A L. Modulation of carotid baroreflex respon- siveness in
man: effects of posture and propranolol. J Appl Physiol. 1976;41:383-387.
80. Di Rienzo M, Bertinieri G, Mancia G, Pedotti A. A new method for evaluating the baroreflex
role by a joint pattern analysis of pulse interval and systolic blood pressure series. Med Biol
Engng Comput. 1985;23:313-314.

28

29
Chapter 2
Sensitivity of pressure transfer to arterial
parameters
Berend E Westerhof1, Ilja Guelen1, Wim J Stok2,
Karel H Wesseling1, Jos AE Spaan3, Nico Westerhof4,
Willem Jan W Bos5, Nikos Stergiopulos6
Transfer functions that calculate aortic pressure from peripheral pressures give the
opportunity to non-invasively obtain information on the cardiac load. Several approaches
have been taken to arrive at transfer functions. Chen et al. and Fetics et al. (5,7) used a
special mathematical transformation to deduce transfer functions from human data and
the averaged transfer function of a group of patients was used as “standard” transfer.
Karamanoglu et al. (15,16) used a segmented model of the arterial tree. Gizdulich et al.
(9,10) proposed a method to obtain brachial pressure from finger pressure by fitting a
second order filter to averaged data. Stergiopulos et al. (23) have recently shown that
splitting the brachial pressure in its backward and forward waves and by shifting these
waves with respect to each other over the travel time between aorta and brachial artery,
an accurate wave transformation can be obtained. Another topic in this field that has
received much attention is the calibration and level correction of non-invasively obtained
pressures (1,3,10,11,12,25).
1 BMEYE, Amsterdam, The Netherlands 2 Dept of Physiology, Academic Medical Center, University of Amsterdam, The Netherlands 3 Dept of Medical Physics, Academic Medical Center, University of Amsterdam, The Netherlands 4 Dept of Physiology, ICaR-VU, VU University medical center, Amsterdam, The Netherlands 5 Dept of Internal Medicine, St Antonius Ziekenhuis, Nieuwegein, The Netherlands 6 Biomedical Engineering Laboratory, Swiss Federal Institute of Technology, Lausanne, Switzerland

30
Thus, there are several approaches to describe pressure transfer from periphery to aorta.
Although several groups report favorably about the use of transfer functions, others are
more critical (13,21). To acquire more insight into the determinants of pressure transfer
we investigated the quantitative contribution of all known contributing arterial, blood
and distal arterial load properties to the transfer function and to the systolic and diastolic
pressure. This information allows us to determine the main contributing factors and to
obtain a description of the transfer function based on these major contributing
parameters only.
Methods For evaluation of the effect of parameters changes we use models between
brachiocephalic and brachial artery.
Tube model based on anatomy
We constructed a model, representing the human subclavian, axillary and brachial artery,
based on Womersley’s theory for an artery under stiff longitudinal constraint and
including viscous fluid damping (29). The wall is taken linear and viscoelastic. Wall
viscosity is modeled with a second order polynomial; the constants are taken from
Westerhof et al. (28). The tube system has a length of 42 cm and is tapering, according
to actual anatomical data, from a diameter of 8.1 mm proximal to 4.7 mm distal given by
Westerhof et al. (27). The tube system is divided in 7 segments, with length, radius and
wall thickness given in Table 1. Wave speed and damping (wave propagation coefficient
g and characteristic impedance) follow directly from longitudinal impedance based on
Womersley’s theory and from transverse impedance that is based on the (viscoelastic)
wall properties. The tube is loaded with a three-element Windkessel (20) as shown in
Figure 1A, representing the input impedance of the lower arm arteries.
Table 1 Dimensions of the tube model according to anatomy
Segment 1 2 3 4 5 6 7
Length (mm) 68 61 56 63 63 63 46
Radius (mm) 4.03 3.64 3.14 2.82 2.66 2.50 2.36
Wall thickness (mm) 0.66 0.62 0.57 0.55 0.53 0.52 0.50
The dimensions of the segments are listed from proximal (segment 1)
to distal (segment 7). Actual anatomical data from Westerhof et al. (27).
31
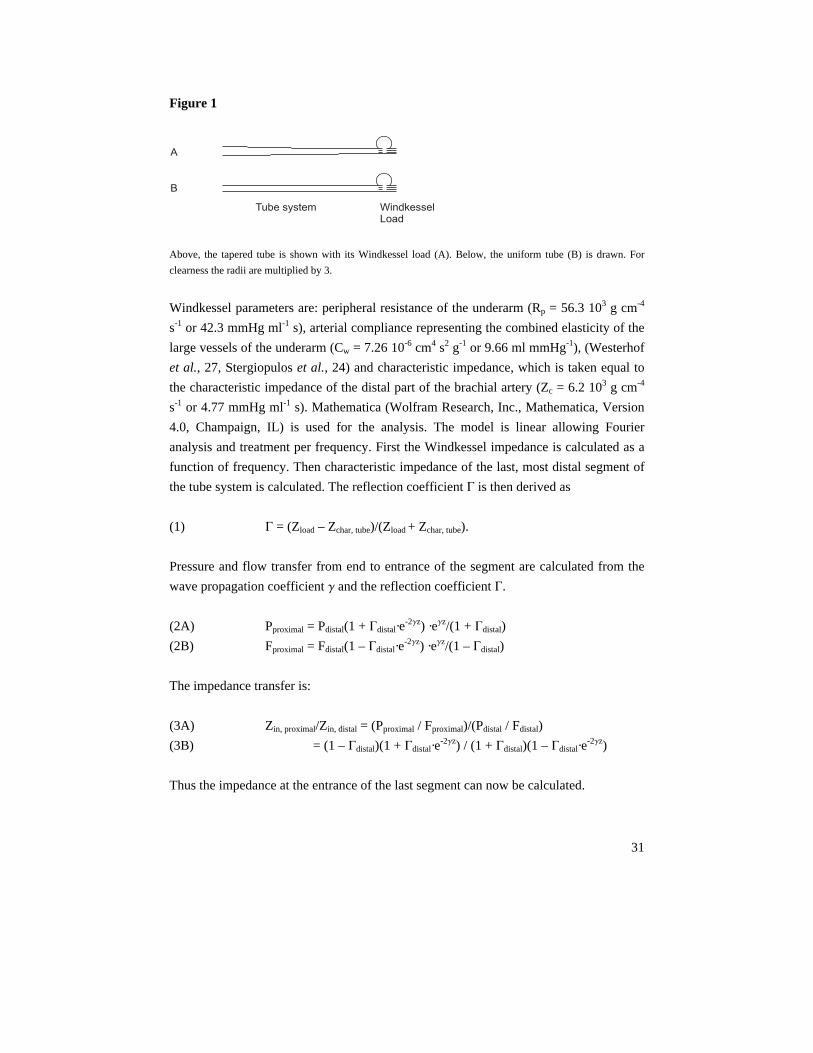
Figure 1
WindkesselLoad
Tube system
B
A
Above, the tapered tube is shown with its Windkessel load (A). Below, the uniform tube (B) is drawn. For
clearness the radii are multiplied by 3.
Windkessel parameters are: peripheral resistance of the underarm (Rp = 56.3 103 g cm-4
s-1 or 42.3 mmHg ml-1 s), arterial compliance representing the combined elasticity of the
large vessels of the underarm (Cw = 7.26 10-6 cm4 s2 g-1 or 9.66 ml mmHg-1), (Westerhof
et al., 27, Stergiopulos et al., 24) and characteristic impedance, which is taken equal to
the characteristic impedance of the distal part of the brachial artery (Zc = 6.2 103 g cm-4
s-1 or 4.77 mmHg ml-1 s). Mathematica (Wolfram Research, Inc., Mathematica, Version
4.0, Champaign, IL) is used for the analysis. The model is linear allowing Fourier
analysis and treatment per frequency. First the Windkessel impedance is calculated as a
function of frequency. Then characteristic impedance of the last, most distal segment of
the tube system is calculated. The reflection coefficient G is then derived as
(1) G = (Zload – Zchar, tube)/(Zload + Zchar, tube).
Pressure and flow transfer from end to entrance of the segment are calculated from the
wave propagation coefficient g and the reflection coefficient G.
(2A) Pproximal = Pdistal(1 + Gdistal·e-2gz) ·egz/(1 + Gdistal)
(2B) Fproximal = Fdistal(1 – Gdistal·e-2gz) ·egz/(1 – Gdistal)
The impedance transfer is:
(3A) Zin, proximal/Zin, distal = (Pproximal / Fproximal)/(Pdistal / Fdistal)
(3B) = (1 – Gdistal)(1 + Gdistal·e-2gz) / (1 + Gdistal)(1 – Gdistal·e
-2gz)
Thus the impedance at the entrance of the last segment can now be calculated.
32
These calculations are repeated for all segments from distal to proximal end. The transfer
Pentrance /Pend is found by multiplication of the segmental transfers. Because the resistance
to mean flow in the tube system is negligible with respect to peripheral resistance (less
than 1%), the transfer function for mean pressure (zero Hz) equals 1, i.e., mean pressures
at the entrance and end are equal.
Using this model, the effects of changes in tube and in load (Windkessel) parameters on
the transfer function and blood pressure, were calculated. The tube parameters were:
(segment) length, radius, wall thickness, Young’s modulus, vessel wall viscosity, blood
density, blood viscosity and the Windkessel parameters (20). The changes in the
magnitude of the first peak and in the frequency at which the first peak of the transfer
function occurs were determined. These two variables were compared with those in the
reference condition.
With the transfer function of the entire tube system, the sensitivity of the aortic pressure
to changes in parameters was also calculated. Aortic pressure (“control” aortic pressure)
was taken from the extensive model by Stergiopulos et al. (24), and applied to the
entrance of the tube system, and the distal (brachial) pressure at the end of the last
segment is calculated using the reference parameters. This brachial pressure was then
taken as our standard brachial pressure to recalculate aortic pressure for variations in the
model parameters. The “reconstructed” aortic pressure was referenced against “control”
aortic pressure. Comparisons were done in terms of systolic, diastolic and pulse
pressures. Also the Root Mean Square Error (RMSE = ◊[S(Preconstructed – Pcontrol)2 / n],
where n is the number of data points) between “reconstructed” and “control” aortic
pressures was calculated to quantify the error in wave shape.
The magnitude and frequency of occurrence of the first peak of the transfer function and
systolic, diastolic and pulse pressures together with RMSE were called (output)
variables. The sensitivity of the variables to the parameters was calculated in terms of %
error: the percentage change in a variable for a change in a parameter. All parameters
were increased and decreased by 25%, which is a reasonable maximum of variation for
most parameters.
Uniform tube model
The next step was to investigate if a single uniform tube would be sufficient to describe
the transfer function (Figure 1B). To this end the geometrically correct system was
replaced with a uniform tube with a length of 420 mm, a radius of 3.5 mm, a wall

33
thickness of 0.65 mm and loaded with the control Windkessel, but with Zc matched to
the tube. Subsequently the Windkessel load was changed such that the reflection
coefficient was negligible and equal to one to determine the sensitivity to extreme load
changes, i.e. vasodilatation and vasoconstriction.
Figure 2
10.2 0.4 0.6 0.8
80
100
120
5 10 15 20
1
2
3
-1
-0.5
80
100
120
10.2 0.4 0.6 0.8Freq. [Hz]
Pre
ssure
[mm
Hg]
Gain
Phase
[rad]
Time [s]Time [s]
Transfer function of the tapered tube. Control brachial pressure is shown on the left. In the middle the gain
(top) and phase (bottom) of the transfer function are given as a function of frequency for control (fully drawn),
and for segment lengths increased by 25% (dashed) and decreased by 25% (dotted). Control aortic pressure is
shown on the right as a function of time for the control situation (fully drawn), and for segment length
increased and decreased (dashed and dotted).
Results
Tube model based on anatomy
The dimensions of the tube model according to anatomy are given in Table 1 and shown
in Figure 1. The control transfer function and the control aortic and brachial pressures
are shown in Figure 2. This brachial artery pressure is used to calculate the aortic
pressure when tube and load parameters are changed. Values of the vessel and the
Windkessel parameters in the control situation and the control output variables are listed
in Table 2. Parameters were increased and decreased by 25%. The changes of the
characteristic points of the transfer function, frequency and maximum value of the first
peak, and of the reconstructed aortic pressure, systolic, diastolic and pulse pressure, are
given in the Table 2 as percentages. Percentages are rounded to integer values,
percentages smaller than 0.5% are considered zero. Due to the smaller value of the pulse
pressure with respect to systolic and diastolic pressure, the percentages of variation in

34
the pulse pressure are largest. The difference between the reconstructed and control
aortic pressure in terms of wave shape is expressed as RMSE (mmHg). For similar
changes up and down of a parameter, output variables may change with unequal
magnitude. For instance, an increase in Rp has less effect than a decrease.
Table 2 Results of the sensitivity analysis
Parameter
control
value
Frequency
of peak
in TF
4.0 Hz
Magnitude
of peak
in TF
1.96
Aortic
Psystole
114 mmHg
Aortic
Pdiastole
78 mmHg
Aortic
PP
36 mmHg
RMSE
0 mmHg
incr decr incr decr incr decr incr decr incr decr incr decr
Segment
Length
(See
Table 1)
–15 30 8 –10 –3 2 1 0 –9 7 1.74 1.62
Radius (See
Table 1)
20 –25 25 –15 0 –1 0 0 0 –2 0.62 1.56
Wall
thickness
(See
Table 1)
5 –5 –5 7 1 –1 0 0 1 –3 0.40 0.63
Young’s
modulus
4 106
g cm-1s-2
5 –5 –6 9 1 –1 0 0 2 –4 0.54 0.81
Wall
Viscosity
(See text) 0 5 11 –10 –1 1 0 1 –4 3 0.59 0.73
Characteristic
Impedance
6.2 103
g cm-4 s-1
10 –5 –2 8 0 –1 0 0 1 –2 0.27 0.35
Peripheral
Compliance
7.3 10-6
cm4 s2 g-1
–5 10 –8 12 0 0 0 0 0 1 0.34 0.39
Peripheral
Resistance
56.3 103
g cm-4 s-1
0 5 0 –1 0 0 0 0 0 1 0.06 0.09
Blood
Density
1.05
g cm-3
–10 20 3 –4 –2 2 0 1 –5 4 0.96 1.06
Blood
viscosity
0.04
P
0 5 –2 2 0 0 0 0 0 0 0.12 0.13
Percent changes in the variables are given for 25% increase (incr) and decrease (decr) of the parameters.
Percentages are given as integer values, values smaller than 0.5% are considered zero. RMSEs are given in
mmHg. Control values of the parameters are given in the left column and control values of the output variables
are given in and top row.
35
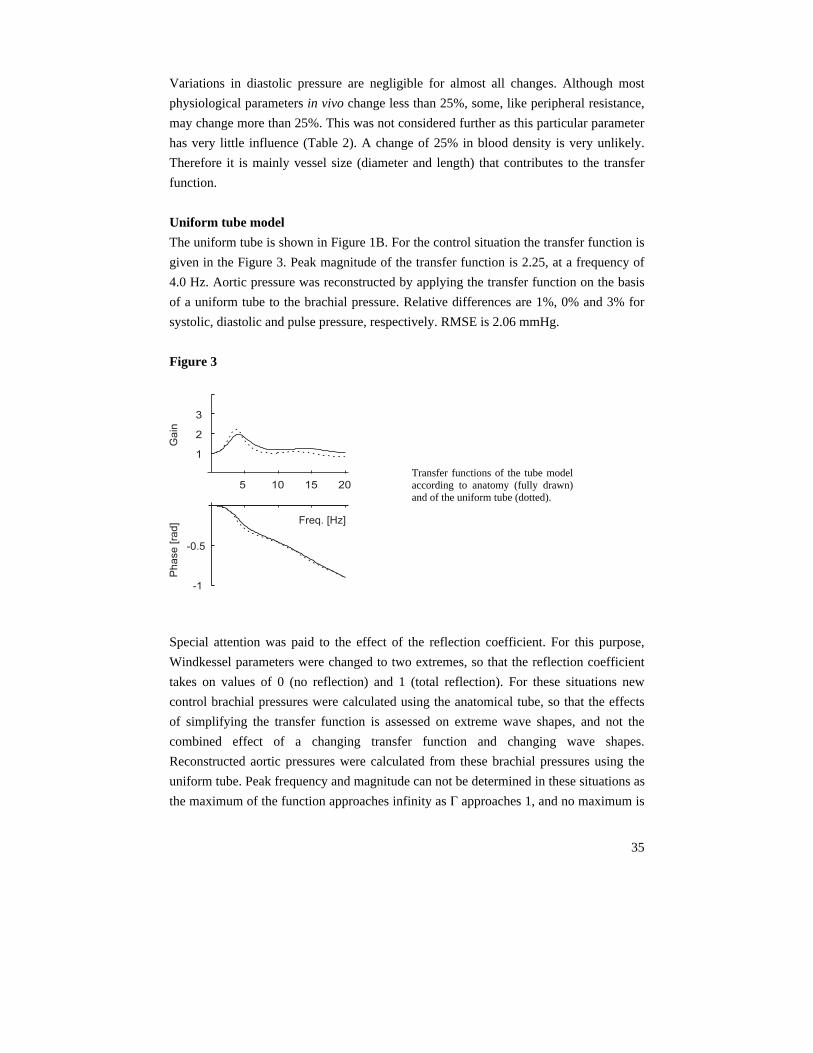
Variations in diastolic pressure are negligible for almost all changes. Although most
physiological parameters in vivo change less than 25%, some, like peripheral resistance,
may change more than 25%. This was not considered further as this particular parameter
has very little influence (Table 2). A change of 25% in blood density is very unlikely.
Therefore it is mainly vessel size (diameter and length) that contributes to the transfer
function.
Uniform tube model
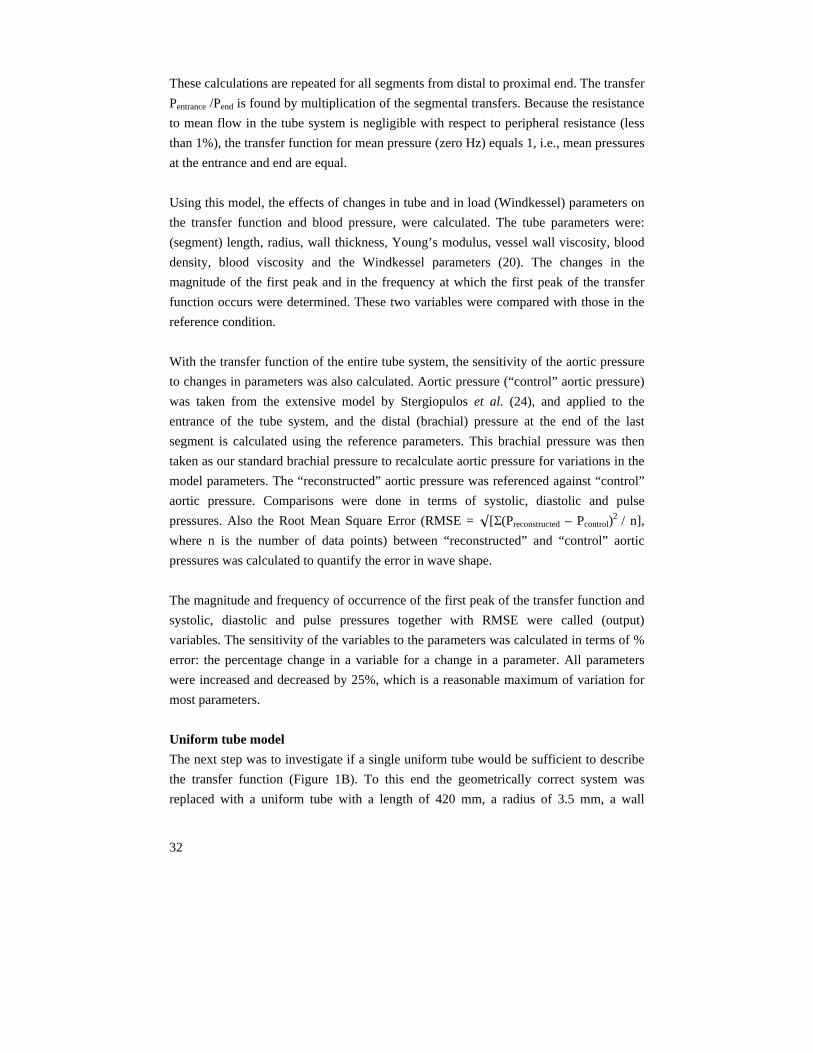
The uniform tube is shown in Figure 1B. For the control situation the transfer function is
given in the Figure 3. Peak magnitude of the transfer function is 2.25, at a frequency of
4.0 Hz. Aortic pressure was reconstructed by applying the transfer function on the basis
of a uniform tube to the brachial pressure. Relative differences are 1%, 0% and 3% for
systolic, diastolic and pulse pressure, respectively. RMSE is 2.06 mmHg.
Figure 3
5 10 15 20
1
2
3
Ga
in
-1
-0.5
Freq. [Hz]
Ph
ase
[ra
d]
Special attention was paid to the effect of the reflection coefficient. For this purpose,
Windkessel parameters were changed to two extremes, so that the reflection coefficient
takes on values of 0 (no reflection) and 1 (total reflection). For these situations new
control brachial pressures were calculated using the anatomical tube, so that the effects
of simplifying the transfer function is assessed on extreme wave shapes, and not the
combined effect of a changing transfer function and changing wave shapes.
Reconstructed aortic pressures were calculated from these brachial pressures using the
uniform tube. Peak frequency and magnitude can not be determined in these situations as
the maximum of the function approaches infinity as G approaches 1, and no maximum is
Transfer functions of the tube modelaccording to anatomy (fully drawn)and of the uniform tube (dotted).

36
present when G = 0. Nonetheless, the effect of these extreme peripheral changes is small.
For G = 0, the differences are –1%, 1% and –7% in systolic, diastolic and pulse pressure.
RMSE is 1.16 mmHg. In the case that G = 1, these differences become –1%, 0% and –
5%. RMSE is 1.98 mmHg.
Discussion This theoretical analysis shows that prediction of aortic pressure from brachial pressure
is mainly dependent on vessel size (length and diameter) and less dependent on other
parameters including wall elasticity. The uniform tube as simplification of the anatomy
also is acceptable and this outcome stresses that the tapering is only a minor factor as
well. From Figure 1 it is apparent, that the decrease in radius is quite small for this set of
arteries in which no major branches are present. Of note, in Figure 1 the radii were
multiplied by 3 to make the effect of decreasing size more appreciable. This implies that
the transfer function from brachial artery to aorta can be very simple, and can be based
on a lossless uniform tube. The tube parameters radius, wall thickness, segment length,
Young's modulus, blood density, blood viscosity, and wall viscosity, all contribute to the
time delay, an important overall property. The use of a uniform lossless tube allows for
analytical formulation of the transfer function and underpins the time shift method
(Stergiopulos et al., 23). The length, radius and elasticity are the main factors
contributing to the time delay and the importance of the time delay is in agreement with
what was reported before by Stergiopulos et al. (23). From those data we calculated that
for a 25% increase and 25% decrease in delay time the percentage changes for systolic
pressure (140 mmHg): 3% and 2%, diastolic pressure (67 mmHg): 1% and 0%, and
pulse pressure (73 mmHg) –7% and –5%. The advantage of using delay time is that it
can be determined, from for instance the ECG and non-invasively determined brachial
pressure. If the errors resulting from the introduction of a single uniform tube with
known delay time are regarded as acceptable this model can make it possible to
individualize a transfer function from delay information only.
The segment lengths used have been shown to be sufficiently short for the physiologic
frequency range; shorter lengths or more detailed tapering is not required (Westerhof
26).
37
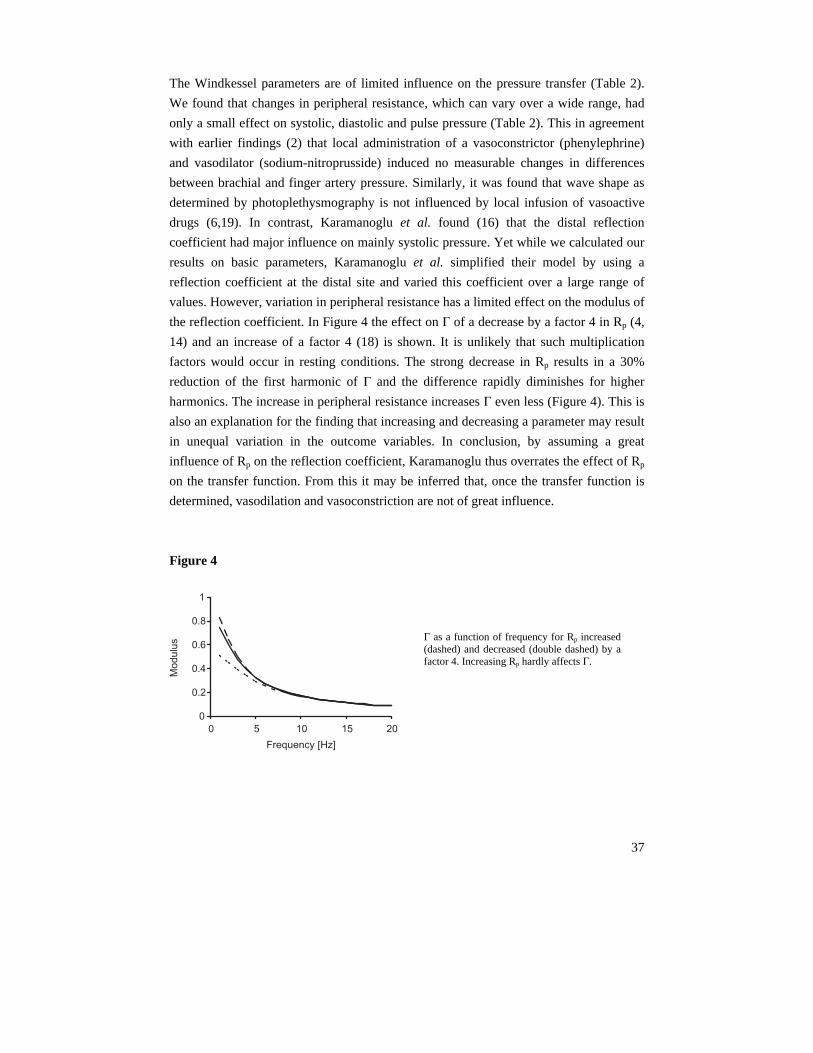
The Windkessel parameters are of limited influence on the pressure transfer (Table 2).
We found that changes in peripheral resistance, which can vary over a wide range, had
only a small effect on systolic, diastolic and pulse pressure (Table 2). This in agreement
with earlier findings (2) that local administration of a vasoconstrictor (phenylephrine)
and vasodilator (sodium-nitroprusside) induced no measurable changes in differences
between brachial and finger artery pressure. Similarly, it was found that wave shape as
determined by photoplethysmography is not influenced by local infusion of vasoactive
drugs (6,19). In contrast, Karamanoglu et al. found (16) that the distal reflection
coefficient had major influence on mainly systolic pressure. Yet while we calculated our
results on basic parameters, Karamanoglu et al. simplified their model by using a
reflection coefficient at the distal site and varied this coefficient over a large range of
values. However, variation in peripheral resistance has a limited effect on the modulus of
the reflection coefficient. In Figure 4 the effect on G of a decrease by a factor 4 in Rp (4,
14) and an increase of a factor 4 (18) is shown. It is unlikely that such multiplication
factors would occur in resting conditions. The strong decrease in Rp results in a 30%
reduction of the first harmonic of G and the difference rapidly diminishes for higher
harmonics. The increase in peripheral resistance increases G even less (Figure 4). This is
also an explanation for the finding that increasing and decreasing a parameter may result
in unequal variation in the outcome variables. In conclusion, by assuming a great
influence of Rp on the reflection coefficient, Karamanoglu thus overrates the effect of Rp
on the transfer function. From this it may be inferred that, once the transfer function is
determined, vasodilation and vasoconstriction are not of great influence.
Figure 4
0
0.2
0.4
0.6
0.8
1
0 5 10 15 20
Mo
du
lus
Frequency [Hz]
G as a function of frequency for Rp increased(dashed) and decreased (double dashed) by afactor 4. Increasing Rp hardly affects G.

38
Segers et al. investigated the possibility to individualize a transfer function based on
three segments. They found that model parameters were not related to heart rate, blood
pressure or age (22). Optimal reflection coefficients and characteristic impedances of the
segments of the model were determined. For convenience, segment lengths were kept
constant. Similar results could be obtained by adjusting segment length, but Segers et al.
consider it unlikely that this would have a major influence. However, from our study it
follows that path length is an important parameter.
It is interesting to note that the rather large changes in frequency and magnitude of the
peak in the TF that occur with changing radius, have little effect on the reconstruction of
pressure. From Table 2 it may be observed that the peak moves to a higher frequency
and a greater magnitude with increasing radius, and to a lower frequency and a smaller
magnitude with decreasing radius. The result of this combined change is that the first
three harmonics remain at their positions with changing radius, thus leaving the most
important part of the TF for pressure reconstruction intact.
The reflection coefficient G can be calculated from measured pressure and flow at the
distal site. When the uniform lossless tube is assumed, then the shift theorem (23) can be
applied and a transfer function for individual patients can be obtained. Then, since load
changes have little effect, this same transfer function can be used during interventions
such as vasodilation.
Most transfer functions described in the literature were obtained by averaging measured
transfers in groups of patients, or based on filters fitted to averaged transfers. Our
analysis shows that transfer functions can be beneficially obtained on the basis of actual
vascular parameters. A single uniform tube with a distal reflection coefficient is a good
approximation. This implies that the basic mathematical description of the transfer from
distal to proximal pressures is:
(4) Pproximal / Pdistal = (1 + Gdistal ·e-2jwDt) ·e jwDt /(1 + Gdistal),
as given by Stergiopulos et al. (23). This formula has two parameters and by determining
these parameters the transfer function can be personalized. Since the effect of the
reflection coefficient is small with respect to the effect of Dt, Gdistal can be set to a fixed
value. If Gdistal is set to 1, errors are somewhat larger but the formula further simplifies to:
(5) Pproximal / Pdistal = cos (wDt)
39
The main concern of this study was the investigation of the influence of arterial
parameters; therefore we did not evaluate the influence of heart rate or other cardiac
factors. Thus, we investigated the importance of physiological anatomical parameters on
a model describing the arteries between the brachiocephalic artery and the brachial
artery. This was done so that potential effects of major bifurcations would not obscure
our results. It is interesting to note however, that the transfer function from
brachiocephalic artery to brachial artery gives results similar to findings in the literature
for transfer functions from aorta to brachial, from aorta to radial, and even from carotid
to radial artery (8). Apparently, all these transfer functions are mainly determined by the
part between the branching from the aorta to the brachial artery. Using the data of
Lasance et al. (17) we calculated transfer functions from ascending aorta, aortic arch and
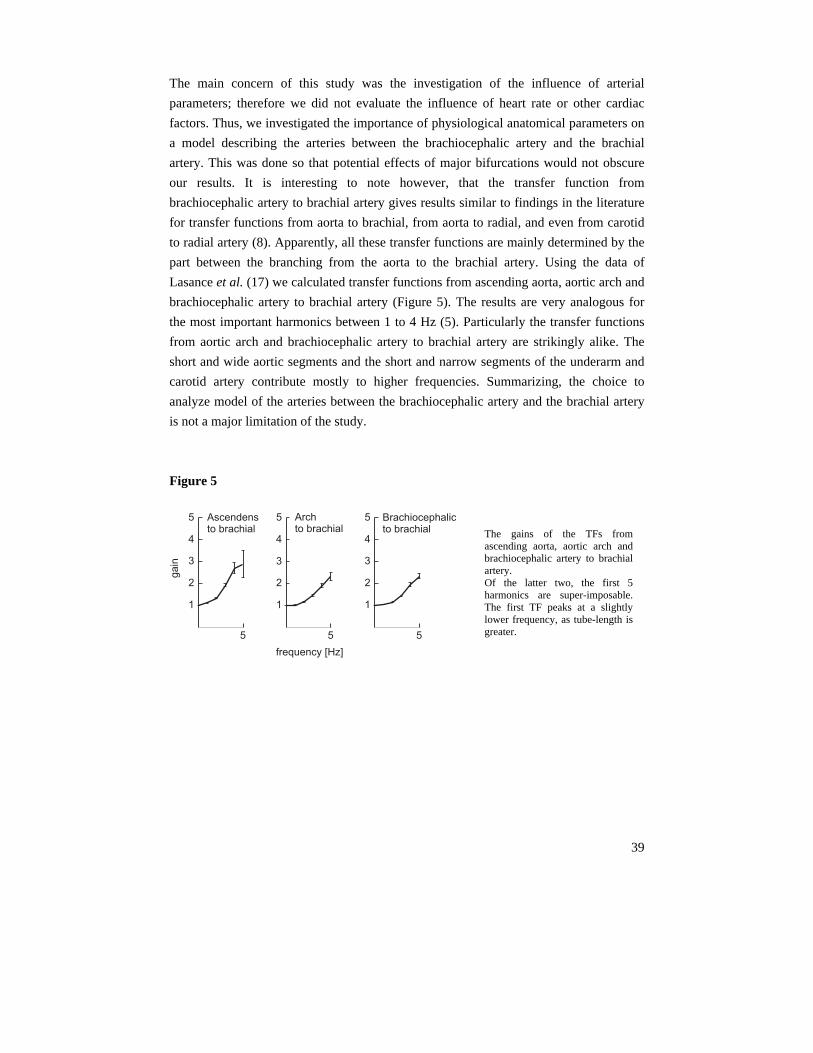
brachiocephalic artery to brachial artery (Figure 5). The results are very analogous for
the most important harmonics between 1 to 4 Hz (5). Particularly the transfer functions
from aortic arch and brachiocephalic artery to brachial artery are strikingly alike. The
short and wide aortic segments and the short and narrow segments of the underarm and
carotid artery contribute mostly to higher frequencies. Summarizing, the choice to
analyze model of the arteries between the brachiocephalic artery and the brachial artery
is not a major limitation of the study.
Figure 5
5
1
2
3
4
5 Archto brachial
frequency [Hz]
5
1
2
3
4
5
ga
in
Ascendensto brachial
5
1
2
3
4
5 Brachiocephalicto brachial
The gains of the TFs fromascending aorta, aortic arch andbrachiocephalic artery to brachialartery. Of the latter two, the first 5harmonics are super-imposable.The first TF peaks at a slightlylower frequency, as tube-length isgreater.

40
In conclusion, a simple uniform tube with known delay time, possibly measured, and an
estimate of the distal reflection coefficient are sufficient to obtain an accurate description
of pressure transfer from brachial artery to aorta.
Acknowledgments
We cordially thank Jan Paul Barends of the Lab for Physiology, ICaR-VU, VU University medical center, Amsterdam, The Netherlands for his inspiring help with the mathematics of in this study.

41
References
1. Van Bortel LM, Balkestein EJ, van der Heijden-Spek JJ, Vanmolkot FH, Staessen JA,
Kragten JA, Vredeveld JW, Safar ME, Struijker Boudier HA, Hoeks AP. Non-invasive
assessment of local arterial pulse pressure: comparison of applanation tonometry and echo-
tracking. J Hypertens. 2001;19:1037-44.
2. Bos WJ, van den Meiracker AH, Wesseling KH, Schalekamp MA. Effect of regional and
systemic changes in vasomotor tone on finger pressure amplification. Hypertension.
1995;26:315-20.
3. Bos WJ, van Goudoever J, van Montfrans GA, van den Meiracker AH, Wesseling KH.
Reconstruction of brachial artery pressure from noninvasive finger pressure measurements.
Circulation. 1996;94:1870-5.
4. Bottcher M, Madsen MM, Refsgaard J, Buus NH, Dorup I, Nielsen TT, Sorensen K.
Peripheral flow response to transient arterial forearm occlusion does not reflect myocardial
perfusion reserve. Circulation. 2001;27:103:1109-14.
5. Chen C-H, Nevo E, Fetics B, Pak PH, Yin FCP, Maughan WL, Kass DA: Estimation of
central aortic pressure waveform by mathematical transformation of radial tonometry
pressure: validation of generalised transfer function. Circulation 1997;95:1827–1836.
6. Chowienczyk PJ, Kelly RP, MacCallum H, Millasseau SC, Andersson TL, Gosling RG,
Ritter JM, Anggard EE. Photoplethysmographic assessment of pulse wave reflection:
blunted response to endothelium-dependent beta2-adrenergic vasodilation in type II diabetes
mellitus. J Am Coll Cardiol. 1999;34:2007-14.
7. Fetics B, Nevo E, Chen CH, Kass DA. Parametric model derivation of transfer function for
noninvasive estimation of aortic pressure by radial tonometry. IEEE Trans Biomed Eng.
1999;46:698-706.
8. Gallagher D, Adji A, O'Rourke MF. Validation of the transfer function technique for
generating central from peripheral upper limb pressure waveform. Am J Hypertens.
2004;17:1059-67. Review.
9. Gizdulich P, Imholz BP, van den Meiracker AH, Parati G, Wesseling KH. Finapres tracking
of systolic pressure and baroreflex sensitivity improved by waveform filtering. J Hypertens.
1996;14:243-50.
10. Gizdulich P, Prentza A, Wesseling KH. Models of brachial to finger pulse wave distortion
and pressure decrement. Cardiovasc Res 33: 698-705, 1997
11. Guelen I, Westerhof BE, Van Der Sar GL, Van Montfrans GA, Kiemeneij F, Wesseling KH,
Bos WJ. Finometer, finger pressure measurements with the possibility to reconstruct
brachial pressure. Blood Press Monit. 2003;8:27-30.
12. Guelen I, Westerhof BE, Van Der Sar GL, Van Montfrans GA, Kiemeneij F, Wesseling KH,
Bos WJ. Validation of the brachial pressure reconstruction of the Finometer. In preparation.
13. Hope SA, Tay DB, Meredith IT, Cameron JD: Use of arterial transfer functions for the
derivation of aortic waveform characteristics. J Hypertens 2003;21:1299 –1305.

42
14. Jansen JR, Schreuder JJ, Mulier JP, Smith NT, Settels JJ, Wesseling KH. A comparison of
cardiac output derived from the arterial pressure wave against thermodilution in cardiac
surgery patients. Br J Anaesth. 2001;87:212-22.
15. Karamanoglu M, O’Rourke MF, Avolio AP, Kelly RP: An analysis of the relationship
between central aortic and peripheral upper limb pressure waves in man. Eur Heart J
1993;14:160–167.
16. Karamanoglu M, Gallagher DE, Avolio AP, O’Rourke MF: Pressure wave propagation in a
multi-branched model of the human upper limb. Am J Physiol 1995;269:H1363–H1369.
17. Lasance HAJ, Wesseling KH, Ascoop CA: Peripheral pulse contour analysis in determining
stroke volume. Progress Report 5, Institute of Medical Physics, Utrecht, 1976.
18. Lundvall J, Edfeldt H. Very large range of baroreflex sympathetic control of vascular
resistance in human skeletal muscle and skin. J Appl Physiol. 1994;76:204-11.
19. Millasseau SC, Kelly RP, Ritter JM, Chowienczyk PJ. Determination of age-related
increases in large artery stiffness by digital pulse contour analysis. Clin Sci (Lond).
2002;103:371-7.
20. Nichols WW, O’Rourke MF. McDonald’s Blood Flow in Arteries,.4th ed. Edward Arnold,
London, 1998.
21. O’Rourke MF, Nichols WW. Use of arterial transfer function for the derivation of aortic
waveform characteristics (letter). J Hypertens 2003;21:2195–2199.
22. Segers P, Carlier S, Pasquet A, Rabben SI, Hellevik LR, Remme E, De Backer T, De Sutter
J, Thomas JD, Verdonck P. Individualizing the aorto-radial pressure transfer function:
feasibility of a model-based approach. Am J Physiol Heart Circ Physiol. 2000;279:H542-9.
23. Stergiopulos N, Westerhof BE, Westerhof N. Physical basis of pressure transfer from
periphery to aorta: a model-based study. Am J Physiol. 1998;274:H1386-92.
24. Stergiopulos N, Young DF, Rogge TR. Computer simulation of arterial flow with
applications to arterial and aortic stenoses. J Biomech. 1992;25:1477-88.
25. Westerhof BE, Guelen I, Parati G, Groppelli A, van Montfrans GA, Wieling W, Wesseling
KH, Bos WJ. Variable day/night bias in 24-h non-invasive finger pressure against
intrabrachial artery pressure is removed by waveform filtering and level correction. J
Hypertens. 2002;20:1981-6.
26. Westerhof N. Analog studies of human systemic arterial hemodynamics. PhD thesis,
University of Pennsylvania, Philadelphia PA, 1968.
27. Westerhof, N., Bosman, F., de Vries, C.J., Noordergraaf, A. Analog studies of the human
systemic arterial tree. J. Biomech. 2:121-143, 1969
28. Westerhof N, Noordergraaf A. Arterial viscoelasticity: a generalized model. Effect on input
impedance and wave travel in the systematic tree. J Biomech. 1970;3:357-79.
29. Womersley JR: The mathematical analysis of the arterial circulation in a state of oscillatory
motion. Technical Report Wade-TR. 56-614. Wright Air Development Center. Dayton, OH,
1957.

43
Chapter 3
Parameter adaptation to individualize
pressure reconstruction
Berend E Westerhof1, Ilja Guelen1, Wim J Stok2, Karel H Wesseling1,
Nico Westerhof3, Willem Jan W Bos4, Nikos Stergiopulos5,
Jos AE Spaan6
The use of transfer functions (TFs) to reconstruct central pressure from, preferably, non-
invasively obtained peripheral pressure, has received a great deal of attention in the
literature (see below). TFs allow the acquisition of aortic pressure and thereby give more
accurate information about the load on the heart and therefore should have better
prognostic value in the field of cardiovascular disease. Generalized functions, averaged
over groups of subjects, have been shown to provide sufficient improvement to
determine mean and diastolic aortic pressure within limits of accuracy as set by the
AAMI (1). Systolic pressure, being the most variable value, is somewhat more difficult
to derive correctly. Systolic and diastolic pressures are evidently of importance, but the
knowledge of the wave shape of aortic pressure allows for waveform analysis, i.e. the
calculation of the augmentation index (15), reflection index (19,20,28), and indexes of
cardiac oxygen supply and demand (30).
1 BMEYE, Amsterdam, The Netherlands
2 Dept of Physiology, Academic Medical Center, University of Amsterdam, The Netherlands
3 Lab for Physiology, ICaR-VU, VU University medical center, Amsterdam, The Netherlands
4 Dept of Internal Medicine, St Antonius Ziekenhuis, Nieuwegein, The Netherlands
5 Biomedical Engineering Laboratory, Swiss Federal Institute of Technology, Lausanne, Switzerland
6 Dept of Medical Physics, Academic Medical Center, University of Amsterdam, The Netherlands

44
Several approaches have been taken to acquire usable transfer functions, starting as early
as 1970 (3,5,7,9,13,14,16,21-25,27) including methods for calibration (2,3,10-12,29).
Recently, an extensive review of the literature was published (8). Compared to a
generalized TF, more exact results may be expected when a TF is individualized, i.e.
optimized for a particular subject. For instance, a TF can be made more accurate by
accounting for age (9) or sex (13). If extra measurements are performed details of an
individual TF might be obtained (14,25,26).
Earlier we found that the time delay between central and peripheral pressure is an
important parameter in the description of pressure transfer (25,26,31). As this time delay
can be non-invasively obtained, we set out to investigate whether this parameter could be
used to individualize the TF. We tested a simple mathematical TF in which time delay is
incorporated. We used a set of invasively determined brachial and aortic pressures to
explore the usefulness of the approach. We calculated remaining errors for the case in
which the parameters of the TF are optimized for each individual and for the case in
which the parameters are averaged values.
Methods
Measurements
Patients and methods have been described in the report by Lasance et al. (16). Pull-back
pressure recordings were made with a fluid filled catheter in ascending aorta, aortic arch,
descending aorta, brachiocephalic, subclavian, axillary and brachial artery. The data
were sampled at 100 Hz. For our main study we use ascending aortic pressure and
brachial pressure. Aortic and brachial pressure beats were selected so that mean pressure
and heart period were optimally matched. If no pair could be attained with a mean
pressure difference smaller than 9 mmHg and with a difference in heart period less than
90 ms, the beats were not used. With these restrictions, 50 pairs of beats remained of the
74 patients.

45
Pressure transformation analysis
Transfer function
The simple mathematical TF (25) that we use to test our hypothesis, based on a single
uniform tube, is:
(1) Pdistal / Pproximal = (1 + G) ·e -jwDt/ (1 + G ·e-2jwDt)
with G the reflection coefficient at the distal site, taken to be real (24), Dt the time delay
between the distal and proximal site, j the imaginary unit and w angular frequency. The
Fourier transformation of the brachial pressure wave divided by the TF gave the
“reconstructed pressure”. After inverse Fourier transformation the reconstructed pressure
was compared to the measured aortic pressure.
Calculations
First, systolic and diastolic pressures were determined of the aortic and brachial beats.
The Root Mean Square Error (RMSE), calculated with the measured aortic and
measured brachial beat shifted in time with respect to each other so that minimal errors
were obtained, described the difference in wave shape. Next, for each pair of pressures,
the optimal TF (equation 1) was found by iterative procedures. Optimal in this respect is
defined as giving minimal RMSE between aortic and reconstructed pressure. For each
pair of beats, optimal G and Dt were recorded together with the errors in systolic and
diastolic pressures and the RMSE. Subsequently four models were defined. In model 1,
optimal Dt and G for each individual were used. A simplified model requiring only
individualization of Dt while G was set at the group average was called model 2. Model 3
was a generalized TF with both Dt and G set at the group average. Finally, in model 4,
we set Dt to the average value and G to 1, representing total reflection. Augmentation
Index, AI, (15) was calculated from the results of the individualized TF (model 1) and
for the generalized TF (model 3) and compared to the AIs of the ascending aortic
pressure waves as another indication of the truthfulness of the reconstructed wave shape
Statistics
The RMSE and systolic, diastolic and pulse pressure after reconstruction with each of
the TFs were compared to measured aortic pressure, using a paired t-test. Differences
were assumed to be significant for P < 0.05.
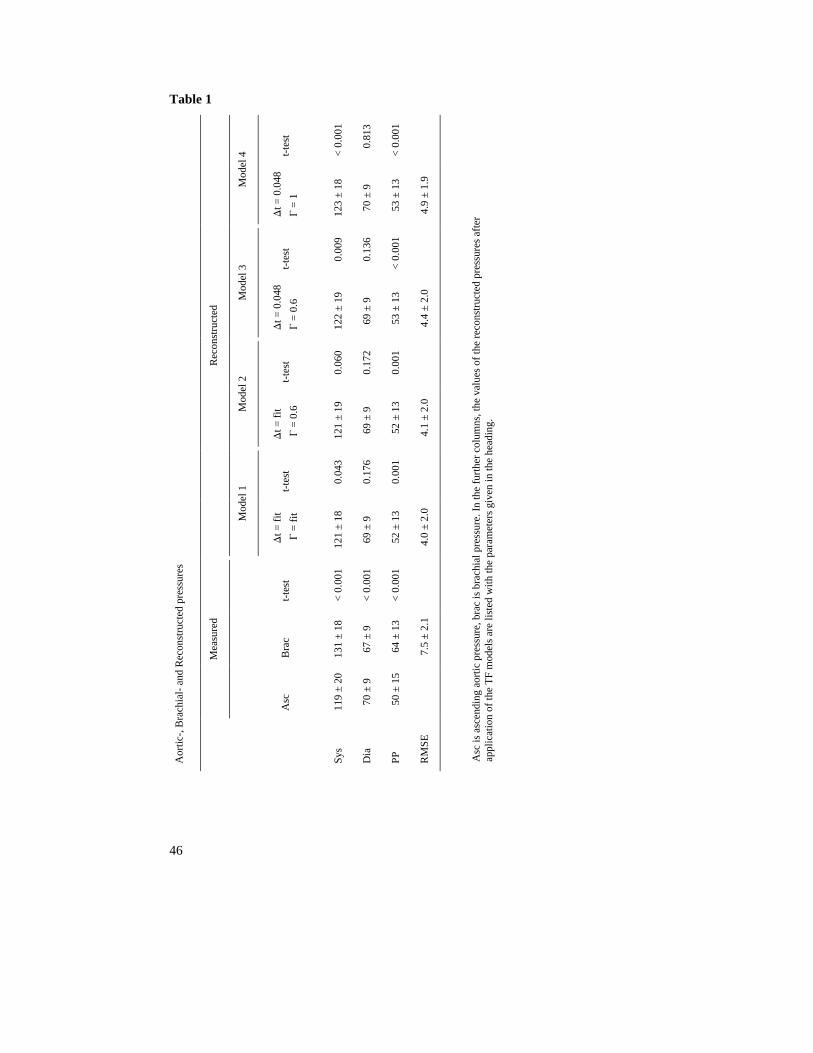
46
Table 1
t-te
st
< 0
.001
0.
813
< 0
.001
Mod
el 4
Dt =
0.0
48
G =
1
123
± 18
70
± 9
53
± 13
4.9
± 1
.9
t-te
st
0.
009
0.
136
< 0
.001
Mod
el 3
Dt =
0.0
48
G =
0.6
122
± 19
69
± 9
53
± 13
4.4
± 2
.0
t-te
st
0.
060
0.
172
0.
001
Mod
el 2
Dt =
fit
G =
0.6
121
± 19
69
± 9
52
± 13
4.1
± 2
.0
t-te
st
0.
043
0.
176
0.
001
Rec
onst
ruct
ed
Mod
el 1
Dt =
fit
G =
fit
121
± 18
69
± 9
52
± 13
4.0
± 2
.0
t-te
st
< 0
.001
< 0
.001
< 0
.001
Bra
c
131
± 18
67
± 9
64
± 13
7.5
± 2
.1
Mea
sure
d
Asc
119
± 20
70
± 9
50
± 15
Aor
tic-,
Bra
chia
l- a
nd R
econ
stru
cted
pre
ssur
es
Sys
Dia
PP
RM
SE
Asc
is a
scen
ding
aor
tic p
ress
ure,
bra
c is
bra
chia
l pre
ssur
e. I
n th
e fu
rthe
r co
lum
ns, t
he v
alue
s of
the
reco
nstr
ucte
d pr
essu
res
afte
r
appl
icat
ion
of th
e T
F m
odel
s ar
e lis
ted
with
the
para
met
ers
give
n in
the
head
ing.

47
Results
For the 50 selected beat pairs the difference in mean pressure between brachial artery
and ascending aortic pressure measurements was – 0.4 ± 3.4 mmHg (range – 9 to 9
mmHg). Difference in interbeat interval (IBI) for these beats was – 3.4 ± 27 ms (range –
80 to 50 ms). In Figure 1 the averaged TF calculated form these beats is shown. For each
pair of beats the TF was determined using Fourier analysis, harmonics of each TF were
interpolated and resampled at 1 Hz before averaging. In Table 1, measured ascending
aortic pressure and brachial pressure are listed together with reconstructed pressure using
the four different TF models. Brachial pressure and each of the reconstructed pressures
are tested against aortic pressure. Best results are obtained using the TF with both Dt and
G individualized. Each step of generalization involves an increase in RMSE, which is
small, but statistically significant. Figure 2 shows the mathematical TFs for the
generalized case with and the Dt = 0.048 and G = 0.6 and 1, respectively.
Figure 1
- 2
- 4
- 6
- 8
- 10
5 10 15 20
1
2
3
4
5
frequency [Hz]
ga
inp
ha
se
[ra
dia
ns]
Transfer Function of ascendingaorta to brachial artery, obtainedin 50 patients. Top panel: amplitude of the gain,bottom panel: phase in radians.Errors are SEM.

48
Because RMSE data only give global information of the fits but no details on the wave
shape of the reconstructed aortic pressure wave, four examples are given in Figure 3. In
each case the generalized TF gives distinctly less accurate results compared to the
individualized TF. In the top panel, reconstructed pressure using the generalized TF has
no secondary rise in pressure, called pressure augmentation, while the pressure from the
individualized TF has. The second panel from the top, both reconstructed pressure show
an augmentation but the pressure reconstructed with the individualized TF has a closer
fit. In the third panel, the generalized TF does not damp but augments the oscillations
found in the brachial artery pressure. In the bottom panel, the pressure augmentation is
exaggerated by the generalized TF.
Figure 2
- 2
- 4
- 6
- 8
- 10
5 10 15 20
1
2
3
4
5
frequency [Hz]
ga
inp
ha
se
[ra
dia
ns]
For the AI we found average values of AIasc = 27 ± 15 for ascending aortic pressure;
AIRecInd = 30 ± 14 (NS) for the individualized model 1; AIRecGen = 25 ± 12 (P < 0.05) for
the generalized model 3. In the ascending aortic pressures, no AI was found in 2 cases;
using the individualized model no AI was found in 4 cases, while with the generalized
model this number was 7. Linear regression analysis gave the following descriptions:
Mathematical Transfer Functions. Top panel: amplitude of the gain,bottom panel: phase in radians. On thehorizontal axis: frequency in Hz. Thefully drawn line represents the TransferFunction with optimal parameters forthe group (t = 0.048 s, G = 0.6). Thedashed line is a Transfer Function withcomplete reflection (t = 0.048 s, G = 1).Phase of this Transfer Function isundetermined (“standing wave”).

49
AIRecInd = 0.88·AIasc + 5.4, R2 = 0.77
AIRecGen = 0.72·AIasc + 4.5, R2 = 0.52.
Figure 3
50
100
150
50
100
150
50
100
150
50
100
150
0.5 1.00 0.5 1.00 0.5 1.00
Time [s]
Pre
ssure
[mm
Hg]
Generalizedreconstruction
Individualizedreconstruction
Brachial
Four examples in which the individualized Transfer Functions gives better results than the generalized Transfer
Function. Left, brachial pressures, middle, ascending aortic pressure (drawn) with reconstructed pressure
(dashed) using the generalized Transfer Function. Right, again ascending aortic pressure (drawn) with
reconstructed pressure (dotted) using the individualized Transfer Functions.
50
Discussion We investigated whether individualization of a simple mathematical TF would result in
better estimation of central pressure values and in a better-predicted wave shape. We
found that the wave shape with the individualized TF is better than with the generalized
one; this improvement is significant, but limited. The parameters of the simple TF, Dt
and G, travel time of the pressure wave and reflection coefficient at the end of the
transmission line, respectively, can be measured. Travel time could be measured
performing simultaneous pressure measurements at the sites between which the TF is
defined, and G by measuring pressure and flow at the peripheral site. In the present study
we did not perform these extra measurements but analyzed a set of aortic and brachial
pressures to investigate if the approach would be fruitful. Therefore, we calculated
individual Dt and G from the actual measurements. We then analyzed the results from
each of four different TFs. As expected, the smallest RMSE was found when individual
TFs were used, i.e. with individual Dt and G. When G was fixed to an average value,
RMSE showed a statistically significant increase. Also fixing Dt to an average value
again resulted in a larger RMSE. We found travel time to be the most important
parameter; G was less influential on the results. Comparing the generalized TF with Dt =
0.048 and G = 0.6 (Figure 2) to the measured data of Figure 1, it can be seen that the first
4 harmonics are closely approximated by the TF generated by procedure which
minimizes RMSE, at the cost of higher frequencies. The harmonic at 5 Hz is amply
overestimated by the mathematical TF. Thus, the first four harmonics are the most
important for accurate pressure reconstruction. This explains why the TF with G = 1
gives acceptable results; Figure 2 demonstrates that for the first four harmonics the
difference between both mathematical TFs is negligible.
The AI of the reconstructed pressure using the individualized TF was not significantly
different from the AI of measured ascending aortic pressure, while the AI of the
generalized pressure was. The coefficient of determination was higher in the
individualized model. This is corroborates the findings in RMSE reported above.

51
Figure 4 gives a further underpinning of the importance of delay as a model parameter.
As our set of measurements included brachiocephalic, subclavian, axillary artery, we
calculated TFs between those sites and brachial artery as well. From the Figure it is
apparent that with shorter length of the intermediate arteries, the peak in the TF moves to
higher frequencies. When the mathematical TF was fitted to the first four harmonics,
delays of 0.043s, 0.037s and 0.025s were found, respectively.
Figure 4
5 10 15 20
1
2
3
4
5
gain
Brachiocephalic to brachial
5 10 15 20
1
2
3
4
5
gain
Subclavian to brachial
5 10 15 20
1
2
3
4
5
frequency [Hz]
gain
Axillary to brachial
Transfer functions from brachiocephalic, subclavian andaxillary artery to brachial artery.With shortening of travel time, thepeak moves to a higher frequency.Mathematical Transfer Functions(no error bars) were fitted to thefirst 4 harmonics.

52
Sugimachi et al. (26) took our earlier work (25) as a basis for further research as well.
They used the distal Windkessel load of their model to determine flow and use wave
separation and the shift theorem (25) with individualized time delay to reconstruct
central pressure. They also concluded this delay is the key parameter to individualize the
TF and that Windkessel parameters are of limited importance. However, they were not
able to improve reconstruction with individualization, which was probably due to the
rather small study group and the relative uniformity of the subjects.
Obviously, for the method to be useful in practice, the extra measurements should be
non-invasive and convenient. As G was found to be of less importance than Dt, the latter
should preferably be measured. One option is to simultaneous measurement of brachial
and axillary artery pressure by applanation tonometry and determining the delay. Echo-
or impedance cardiography could also be considered for the required central information.
Another possibility is to use the delay between the R-top in the ECG and the upstroke in
peripheral pressure, although the preejection period remains an uncertain factor.
Sugimachi et al. (26) further suggest the use of carotid and radial pulse recordings or the
use of the second heart sound and the dicrotic notch of the distal pulse.
The finding that a generalized TF can be used to accurately reconstruct central pressures
corresponds to findings in literature (5,8,14), which, however, have been questioned as
well (13,17). One could summarize that in individual cases a generalized TF might not
be adequate, for group averages however the results can be very good. Thus, inter-
individual differences may be a problem, but intra-individual differences have been
shown to be smaller (5). This could imply that one individualization procedure may be
sufficient, allowing following a subject over a longer period of time (11,29).
It has also been noticed that the peripheral pressure (4) or photoplethysmographic wave
shape (6,18) changes little during local infusion of vasoactive drugs, thus confirming the
conclusion that the TF is quite insensitive to changes in G (31). On the other hand,
systemic infusion of these vasoactive substances has much greater effect on difference
between central and peripheral wave shape (4,6,18). This may result from to the change
in mean systemic pressure: for instance, an increase in mean pressure will decrease
arterial compliance and thus increase wave speed. This will decrease Dt and thus modify
one of the most sensitive parameters describing the TF. Therefore, although
individualization of TF may have only a minor effect in the present study, the method
may prove useful in protocols involving systemic infusion of vasoactive drugs.
53
For higher frequencies, our generalized TF in Figure 1 differs somewhat from the
original TF as given by Lasance et al. (16). One reason is that, in the original study, pairs
of 2 successive aortic as well as 2 successive brachial beats were selected for analysis,
while we used single beats, so that a meaningful RMSE could be calculated. Another
obvious reason is that the study populations differ in size. We discarded pairs of beats
with too large differences in mean pressure and heart period. Mean pressure will fall due
to resistance in the arteries. However, resistance of the larger arteries like the brachial
artery is usually quite small and a pressure drop of 10 mmHg in mean pressure not likely
to occur. Since the measurements were not recorded simultaneously, we wanted to
exclude beats in which mean pressure did not remain stable between measurements. A
similar reasoning holds for IBI. Nonetheless, the first few harmonics of both TFs are
remarkably close.
Limitations
In this study we determined the optimal time delay from the actual measurements of
ascending aortic and brachial pressure. In a practical application, the time delay should
be determined from other measurements as the central pressure will not be available.
However, here we wanted to investigate the feasibility of the procedure before further
effort was put into developing a method to establish a time delay.
Another limitation of the study is that the generalized TF is based on the measurements
of central and distal pressure, in other words, the learning population and the study
population are the same. Therefore the results are optimal for this group and the same TF
would perform less well in a random population.

54
Future developments
A time delay might be conveniently obtained from a time difference between ECG and
distal pressure. A formula would have to be developed to predict travel time from this
delay by correcting for the time between R-top and ejection. Whether this method would
give delays of sufficient accuracy remains to be determined.
Acknowledgments
We cordially thank Jan Paul Barends of the Lab for Physiology, ICaR-VU, VU University medical center,
Amsterdam, The Netherlands for his inspiring help with the mathematics of in this study.

55
References
1. American national standard for electronic or automated sphygmomanometers. AAMI SP 10-
1987. Arlington VA: Association for the Advancement of Medical Instrumentation; 1987. pp.
1–25.
2. Van Bortel LM, Balkestein EJ, van der Heijden-Spek JJ, Vanmolkot FH, Staessen JA,
Kragten JA, Vredeveld JW, Safar ME, Struijker Boudier HA, Hoeks AP. Non-invasive
assessment of local arterial pulse pressure: comparison of applanation tonometry and echo-
tracking. J Hypertens. 2001;19:1037-44.
3. Bos WJ, van Goudoever J, van Montfrans GA, van den Meiracker AH, Wesseling KH.
Reconstruction of brachial artery pressure from noninvasive finger pressure measurements.
Circulation. 1996;94:1870-5.
4. Bos WJ, van den Meiracker AH, Wesseling KH, Schalekamp MA. Effect of regional and
systemic changes in vasomotor tone on finger pressure amplification. Hypertension.
1995;26:315-20.
5. Chen C-H, Nevo E, Fetics B, Pak PH, Yin FCP, Maughan WL, Kass DA: Estimation of
central aortic pressure waveform by mathematical transformation of radial tonometry
pressure: validation of generalized transfer function. Circulation 1997;95:1827-1836.
6. Chowienczyk PJ, Kelly RP, MacCallum H, Millasseau SC, Andersson TL, Gosling RG,
Ritter JM, Anggard EE. Photoplethysmographic assessment of pulse wave reflection: blunted
response to endothelium-dependent beta2-adrenergic vasodilation in type II diabetes mellitus.
J Am Coll Cardiol. 1999;34:2007-14.
7. Fetics B, Nevo E, Chen CH, Kass DA. Parametric model derivation of transfer function for
noninvasive estimation of aortic pressure by radial tonometry. IEEE Trans Biomed Eng.
1999;46:698-706
8. Gallagher D, Adji A, O'Rourke MF. Validation of the transfer function technique for
generating central from peripheral upper limb pressure waveform. Am J Hypertens.
2004;17:1059-67. Review.
9. Gizdulich P, Imholz BP, van den Meiracker AH, Parati G, Wesseling KH. Finapres tracking
of systolic pressure and baroreflex sensitivity improved by waveform filtering. J Hypertens.
1996;14:243-50.
10. Gizdulich P, Prentza A, Wesseling KH. Models of brachial to finger pulse wave distortion
and pressure decrement. Cardiovasc Res 33: 698-705, 1997
11. Guelen I, Westerhof BE, Van Der Sar GL, Van Montfrans GA, Kiemeneij F, Wesseling KH,
Bos WJ. Finometer, finger pressure measurements with the possibility to reconstruct brachial
pressure. Blood Press Monit. 2003;8:27-30.
12. Guelen I, Westerhof BE, Van Der Sar GL, Van Montfrans GA, Kiemeneij F, Wesseling KH,
Bos WJ. Validation of the brachial pressure reconstruction of the Finometer. In preparation.

56
13. Hope SA, Tay DB, Meredith IT, Cameron JD: Use of arterial transfer functions for the
derivation of aortic waveform characteristics. J Hypertens 2003;21:1299 –1305.
14. Karamanoglu M, Gallagher DE, Avolio AP, O’Rourke MF: Pressure wave propagation in a
multi-branched model of the human upper limb. Am J Physiol 1995;269:H1363–H1369.
15. Kelly R, Hayward C, Avolio A, O'Rourke M. Noninvasive determination of age-related
changes in the human arterial pulse. Circulation. 1989;80:1652-9.
16. Lasance HAJ, Wesseling KH, Ascoop CA: Peripheral pulse contour analysis in determining
stroke volume. Progress Report 5, Institute of Medical Physics, Utrecht, 1976.
17. Lehmann ED. Estimation of central aortic pressure waveform by mathematical transformation
of radial tonometry pressure data. Letter. Circulation. 1998;98:186-7.
18. Millasseau SC, Kelly RP, Ritter JM, Chowienczyk PJ. Determination of age-related increases
in large artery stiffness by digital pulse contour analysis. Clin Sci (Lond). 2002;103:371-7.
19. Murgo JP. Westerhof N. Giolma JP. Altobelli SA. Aortic input impedance in normal man:
relationship to pressure wave forms. Circulation. 1980;62:105-16.
20. Nichols WW, O’Rourke MF: McDonald’s Blood Flow in Arteries,.4th ed. Edward Arnold,
London, 1998.
21. O’Rourke MF: Influence of ventricular ejection on the relationship between central aortic and
brachial pressure pulse in man. Cardiovasc Res 1970;4:291–300.
22. O’Rourke MF, Nichols WW: Use of arterial transfer function for the derivation of aortic
waveform characteristics (letter). J Hypertens 2003;21:2195–2199.
23. Pauca AL, O’Rourke MF, Kon ND: Prospective evaluation of a method for estimating
ascending aortic pressure from the radial artery pressure waveform. Hypertension
2001;38:932–937.
24. Segers P, Carlier S, Pasquet A, Rabben SI, Hellevik LR, Remme E, De Backer T, De Sutter J,
Thomas JD, Verdonck P. Individualizing the aorto-radial pressure transfer function:
feasibility of a model-based approach. Am J Physiol Heart Circ Physiol. 2000
Aug;279(2):H542-9.
25. Stergiopulos N, Westerhof BE, Westerhof N. Physical basis of pressure transfer from
periphery to aorta: a model-based study. Am J Physiol. 1998;274:H1386-92.
26. Sugimachi M, Shishido T, Miyatake K, Sunagawa K. A new model-based method of
reconstructing central aortic pressure from peripheral arterial pressure. Jpn J Physiol.
2001;51:217-22.
27. Stok WJ, Westerhof BE, Blum V, Karemaker JM. Changes in finger-aortic pressure transfer
function during and after incremental bicycle exercise. Submitted.
28. Westerhof BE, Guelen I, Westerhof N, Karemaker JM, Avolio A. Quantification of wave
reflection in the human aorta from pressure alone. This Thesis. Submitted.
29. Westerhof BE, Guelen I, Parati G, Groppelli A, van Montfrans GA, Wieling W, Wesseling
KH, Bos WJ. Variable day/night bias in 24-h non-invasive finger pressure against
intrabrachial artery pressure is removed by waveform filtering and level correction. J
Hypertens. 2002;20:1981-6.

57
30. Westerhof BE, van Montfrans GA, Guelen I, Wesseling KH, Spaan JA, Parati G, Westerhof
N, Karemaker JM, van Lieshout JJ, Bos WJ. Variations in cardiac oxygen supply and demand
in hypertensive subjects after rising. This Thesis.
31. Westerhof BE, Guelen I, Stok WJ, Wesseling KH, Spaan JA, Westerhof N, Bos WJ,
Stergiopulos N. Sensitivity of pressure transfer to arterial parameters. This Thesis.

58

59
Chapter 4
Quantification of wave reflection in the
human aorta from pressure alone
Berend E. Westerhof1, Ilja Guelen1, Nico Westerhof2,
John M. Karemaker3, Alberto Avolio4
Wave reflections affect the pressure and flow wave in the proximal aorta (1) and their
contribution depends on their magnitude and time of return. When the reflected wave
arrives in systole it augments pressure. This augmentation is greater when the heart is
hypertrophied. In heart failure wave reflections affect the flow wave negatively, thereby
reducing stroke volume and cardiac output (2–4).
One way to estimate the amount of reflection is by waveform analysis in which aortic
pressure is separated into its forward and backward components (1,5,6). The magnitudes
of the backward (reflected) wave and the forward wave allow for the estimation of the
amount of reflection. This waveform analysis requires measurement of both pressure and
flow waves and derivation of characteristic impedance. A method that requires the
measurement of pressure only is computation of the Augmentation Index, AI (7,8). AI
gives reproducible results (9,10) and is in use in clinical settings (11–14). However, AI
is determined by both the magnitude and timing of the reflected wave. This is evident
from Figure 1, panel A. In this figure the original pressure wave is separated into its
forward and backward components and then reassembled for different delays of the same
backward wave. AI is clearly influenced by the time of return of the reflected wave.
1 BMEYE, Amsterdam, The Netherlands 2 Physiology, ICaR-VU, VU University medical center, Amsterdam, The Netherlands 3 Physiology, Academic Medical Center, University of Amsterdam, The Netherlands 4 Graduate School of Biomedical Engineering, University of New South Wales, Sydney Australia

60
Panel B gives two examples in which AI suggests no wave reflection (left) or a reflected
wave that is larger than the forward wave (right). Thus the magnitude of wave reflection
cannot be quantified from AI. This may explain why the AI may not be a good measure
of central pulsatile load in patients with congestive heart failure (15).
Figure 1
50
mm
Hg
50
0m
l/s
Pmeasured
Pforward
Pbackward
P-41 ms
Pmeasured
P+41 ms
P+123 ms
PP�P
A
B
1 s
1 s 1 s
50
mm
Hg
In this study we investigate a new method to calculate pressure wave reflection in the
human proximal aorta based on measured pressure alone and derive an index to quantify
reflection independent of the time of return of the reflected wave. We assume a
triangular shape of the flow wave based on the timing features of the aortic pressure.
This is a reasonable assumption in view of the ascending aortic flow patterns obtained by
a variety of flow measurement techniques (6). Subsequently, separation of the pressure
wave into its forward and backward components is carried out using the measured
The Augmentation Index depends not only
on the magnitude but also on the time of
return of the reflected wave. In panel A, on
the left, the measured pressure, flow, and the
derived forward and backward pressure
waves are shown. On the right the pressure
waves obtained by summation of the
forward and backward waves are shown
when the backward wave is shifted in time.
Thus, with the same magnitude of the
reflected wave, but different times of return,
the wave shape, the Pulse Pressure, PP, and,
consequently, the Augmentation Index (AI),
∆P/PP, are different. AIs from top to bottom
were 0.20, 0.21, 0.13 and undefined,
respectively, while Reflection Index (RI, see
text) was 0.35. Panel B gives two examples
in which AI gives erring results. On the left,
the backward wave returns when the
forward wave is already falling. AI was
found to be 0.03 while the RI was 0.33. On
the right, the forward wave is still rising
when the backward wave returns, resulting
in an AI of 0.59, suggesting that the
backward wave is larger than the forward
wave. RI in this case was 0.44.
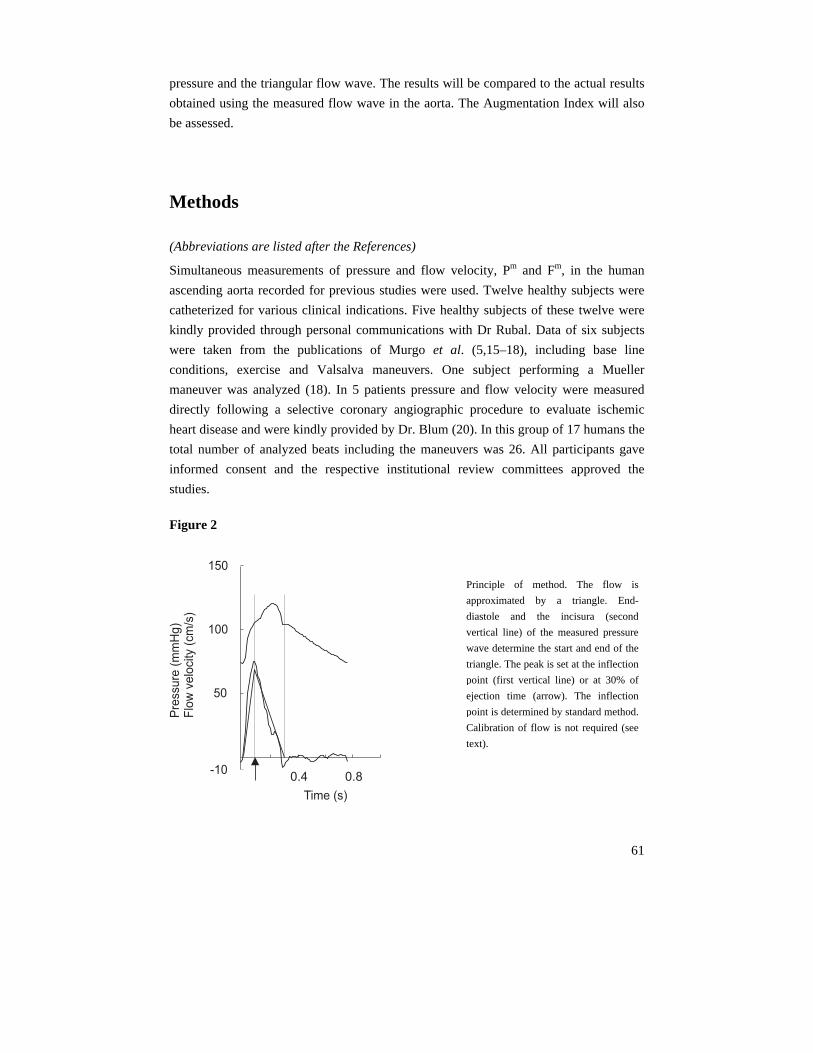
61
pressure and the triangular flow wave. The results will be compared to the actual results
obtained using the measured flow wave in the aorta. The Augmentation Index will also
be assessed.
Methods
(Abbreviations are listed after the References)
Simultaneous measurements of pressure and flow velocity, Pm and Fm, in the human
ascending aorta recorded for previous studies were used. Twelve healthy subjects were
catheterized for various clinical indications. Five healthy subjects of these twelve were
kindly provided through personal communications with Dr Rubal. Data of six subjects
were taken from the publications of Murgo et al. (5,15–18), including base line
conditions, exercise and Valsalva maneuvers. One subject performing a Mueller
maneuver was analyzed (18). In 5 patients pressure and flow velocity were measured
directly following a selective coronary angiographic procedure to evaluate ischemic
heart disease and were kindly provided by Dr. Blum (20). In this group of 17 humans the
total number of analyzed beats including the maneuvers was 26. All participants gave
informed consent and the respective institutional review committees approved the
studies.
Figure 2
-10
50
100
150
0.4 0.8
Pre
ssu
re(m
mH
g)
Flo
wve
locity
(cm
/s)
Time (s)
Principle of method. The flow is
approximated by a triangle. End-
diastole and the incisura (second
vertical line) of the measured pressure
wave determine the start and end of the
triangle. The peak is set at the inflection
point (first vertical line) or at 30% of
ejection time (arrow). The inflection
point is determined by standard method.
Calibration of flow is not required (see
text).
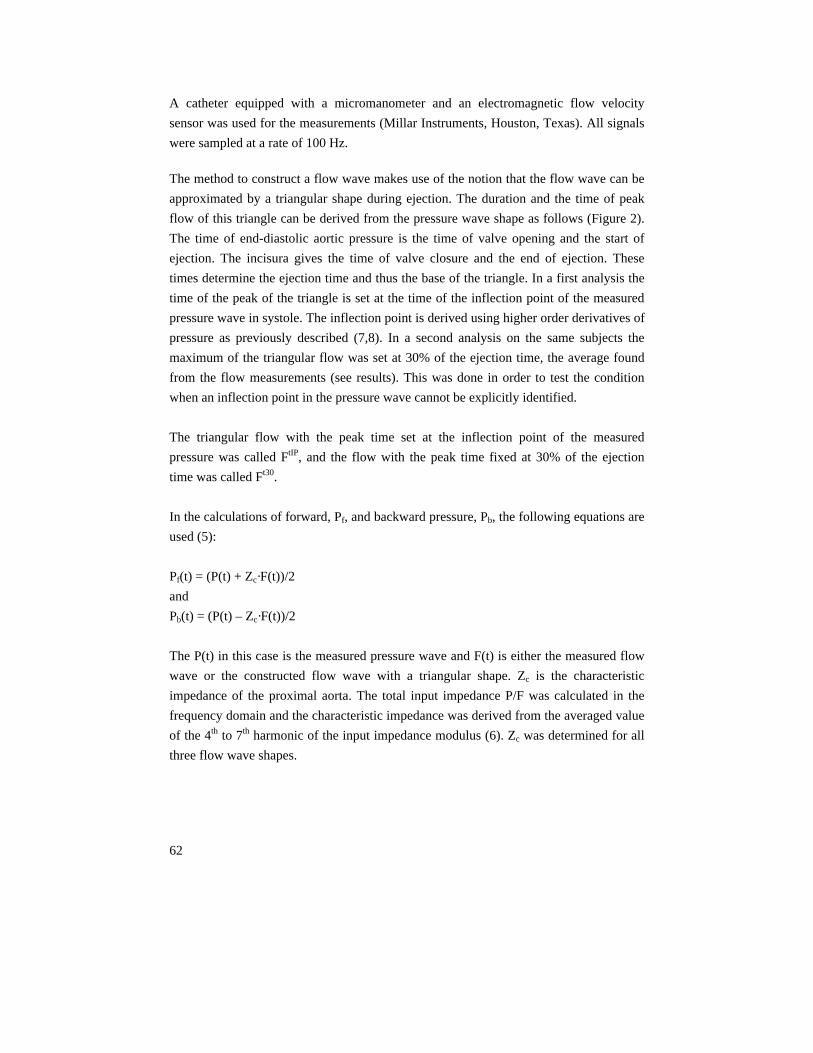
62
A catheter equipped with a micromanometer and an electromagnetic flow velocity
sensor was used for the measurements (Millar Instruments, Houston, Texas). All signals
were sampled at a rate of 100 Hz.
The method to construct a flow wave makes use of the notion that the flow wave can be
approximated by a triangular shape during ejection. The duration and the time of peak
flow of this triangle can be derived from the pressure wave shape as follows (Figure 2).
The time of end-diastolic aortic pressure is the time of valve opening and the start of
ejection. The incisura gives the time of valve closure and the end of ejection. These
times determine the ejection time and thus the base of the triangle. In a first analysis the
time of the peak of the triangle is set at the time of the inflection point of the measured
pressure wave in systole. The inflection point is derived using higher order derivatives of
pressure as previously described (7,8). In a second analysis on the same subjects the
maximum of the triangular flow was set at 30% of the ejection time, the average found
from the flow measurements (see results). This was done in order to test the condition
when an inflection point in the pressure wave cannot be explicitly identified.
The triangular flow with the peak time set at the inflection point of the measured
pressure was called FtIP, and the flow with the peak time fixed at 30% of the ejection
time was called Ft30.
In the calculations of forward, Pf, and backward pressure, Pb, the following equations are
used (5):
Pf(t) = (P(t) + Zc·F(t))/2
and
Pb(t) = (P(t) – Zc·F(t))/2
The P(t) in this case is the measured pressure wave and F(t) is either the measured flow
wave or the constructed flow wave with a triangular shape. Zc is the characteristic
impedance of the proximal aorta. The total input impedance P/F was calculated in the
frequency domain and the characteristic impedance was derived from the averaged value
of the 4th to 7th harmonic of the input impedance modulus (6). Zc was determined for all
three flow wave shapes.

63
From the above equations it can be seen that the product Zc·F appears in the calculation
of the forward and backward waves. Zc is a ratio of pressure and flow, P/F (explicitly, Zc
= Pf/Ff = – Pb/Fb). Thus by multiplication of Zc and F the amplitude of flow is eliminated
and Zc·F is independent of the flow calibration. When flow is twice as large, Zc is twice
as small but the product remains the same. A similar reasoning holds whether flow
velocity or volume flow is used in the calculations. Thus calibration of the flow wave is
not required, the shape is of importance only, and so stroke volume does not have to be
determined. In the remaining text flow velocity will simply be called flow.
Using the above equations we calculated forward and backward pressure waves on the
basis of the measured pressure, Pm, in combination with the measured flow, Fm, and each
of the two triangular flows, FtIP and Ft30. The amplitudes of the forward waves obtained
by the triangular flows, |PftIP| and |Pf
t30|, were compared with the amplitude of the
forward pressure wave derived from the measured flow |Pfmf|. Similarly the backward
waves |PbtIP| and |Pb
t30| were compared to |Pbmf|.
The accuracy of the shapes of the forward and backward pressure waves were
determined by calculating the Root Mean Square Error (RMSE) between the waves
derived from triangular and measured flow waves.
The Reflection Index, RI, was defined as:
RI = |Pb|/(|Pf|+|Pb|).
The RIs derived from the measured flow, and from the two triangular flows, are called
RImf, RItIP and RIt30, respectively. Because the reflection index is a ratio of two pressures
calibration of pressure is not required.
The RI was calculated instead of the Reflection Magnitude defined as RM= |Pb|/|Pf|, to
facilitate comparison with the augmentation index. We calculated the Augmentation
Index, AI, as the augmentation of the pressure, ∆P, divided by pulse pressure, PP. See
Figure 1.
All derivations were carried out in a set of 26 simultaneous aortic pressure and flow
pairs recorded in the group of 17 subjects. Data are presented as mean ± standard
deviation. Repeated Measures Analysis of Variance was used to investigate differences
between derivations based on measured flow, both triangular flows and augmentation
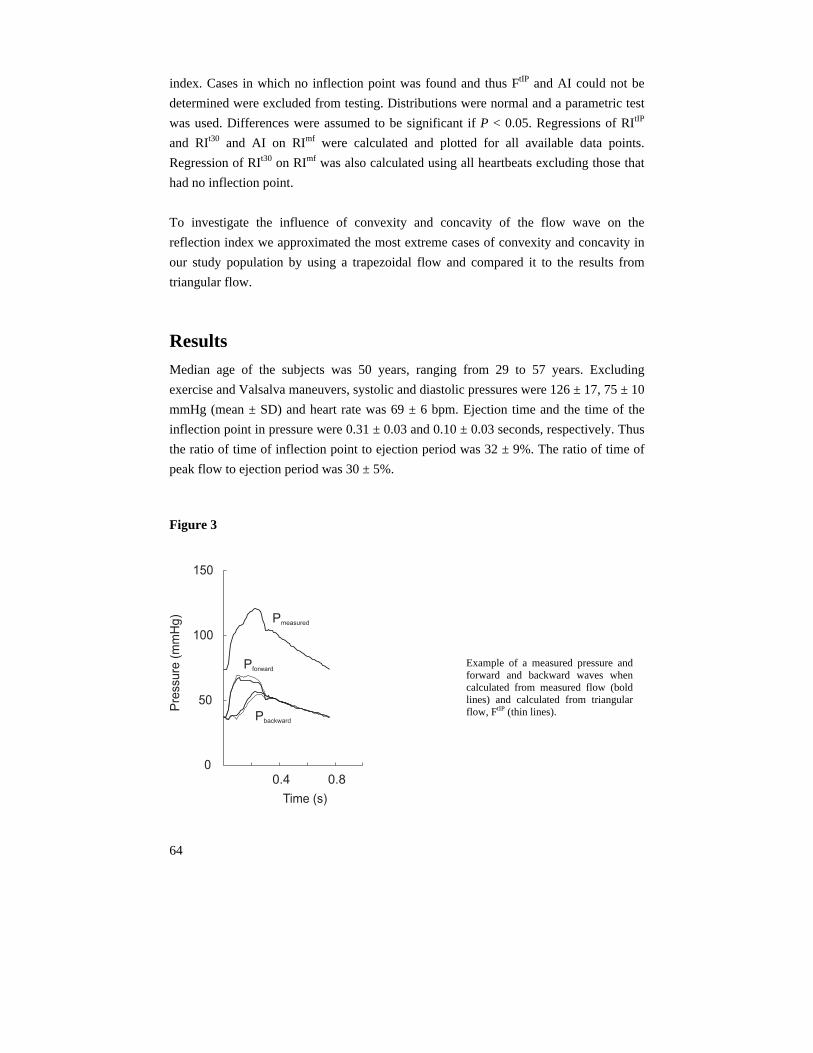
64
index. Cases in which no inflection point was found and thus FtIP and AI could not be
determined were excluded from testing. Distributions were normal and a parametric test
was used. Differences were assumed to be significant if P < 0.05. Regressions of RItIP
and RIt30 and AI on RImf were calculated and plotted for all available data points.
Regression of RIt30 on RImf was also calculated using all heartbeats excluding those that
had no inflection point.
To investigate the influence of convexity and concavity of the flow wave on the
reflection index we approximated the most extreme cases of convexity and concavity in
our study population by using a trapezoidal flow and compared it to the results from
triangular flow.
Results
Median age of the subjects was 50 years, ranging from 29 to 57 years. Excluding
exercise and Valsalva maneuvers, systolic and diastolic pressures were 126 ± 17, 75 ± 10
mmHg (mean ± SD) and heart rate was 69 ± 6 bpm. Ejection time and the time of the
inflection point in pressure were 0.31 ± 0.03 and 0.10 ± 0.03 seconds, respectively. Thus
the ratio of time of inflection point to ejection period was 32 ± 9%. The ratio of time of
peak flow to ejection period was 30 ± 5%.
Figure 3
0.4 0.80
50
100
150
Pre
ssure
(mm
Hg)
Time (s)
Pmeasured
Pforward
Pbackward
Example of a measured pressure andforward and backward waves whencalculated from measured flow (boldlines) and calculated from triangularflow, FtIP (thin lines).

65
Figure 3 shows an example of the measured pressure wave and the calculated forward
and backward pressure waves using measured flow, bold lines, and triangular flow based
on the inflection point in the pressure wave, thin lines.
Table 1 shows the averaged amplitudes of the forward and backward waves based on al
three methods.
Table 1
Amplitudes of the forward and backward waves and the values of the Reflection Index and
Augmentation Index over 21 determinations in 17 humans.
Mean ± SD ANOVA Range of differences
min max
|Pfmf| 33.2 ± 7.3
|PftIP| 35.0 ± 6.4 NS -6.4 8.0
|Pft30| 33.4 ± 7.0 NS -10.8 4.5
|Pbmf| 23.4 ± 7.2
|PbtIP| 22.5 ± 6.4 P < 0.05 -3.3 2.7
|Pbt30| 21.7 ± 6.9 P < 0.001 -4.5 1.2
RImf 0.41 ± 0.04
RItIP 0.39 ± 0.05 NS -0.06 0.02
RIt30 0.39 ± 0.04 NS -0.07 0.03
AI 0.34 ± 0.16 P < 0.01 (range: 0.02 to 0.59)
The |P| are the amplitudes of the pressure waves in mmHg, RI is Reflection Index, and AI Augmentation Index.
The subscripts f and b indicate forward and backward waves. The superscripts mf, tIP, t30 give results that are
based on the wave analysis using measured pressure, together with measured flow, triangular flow with peak
time at inflection point of pressure and triangular flow where peak time is set at 30% of ejection time,
respectively. Parametric ANOVA testing was used. The range of differences gives smallest and largest
deviation from reference, but in the case of AI it gives the range of all AI determinations.
The average amplitudes of the forward waves PftIP and Pf
t30 are not different from the
reference. The average amplitudes of the backward waves PbtIP and Pb
t30 are different
from the reference. This difference, however, is quite small, namely 0.9 mmHg for PbtIP
and 1.8 mmHg for Pbt30. The average Reflection Index and Augmentation Index are also

66
presented in Table 1. Only AI differs from RImf. AI also has a larger variance, while RItIP
and RIt30 do not (F-test).
Table 2 gives the RMSErrors of the forward and backward waves when using a
triangular flow compared with the actual forward and backward waves.
Table 2
RMSErrors of the forward and backward waves over 21 determinations in 17
humans.
RMSError Mean ± SD Range
min max
PftIP 1.83 ± 0.68 0.90 3.69
Pft30 1.79 ± 0.99 0.63 5.07
PbtIP 1.83 ± 0.68 0.90 3.69
Pbt30 1.79 ± 0.99 0.63 5.07
Errors in mmHg. For identification of the parameters see table 1.
Figure 4 shows the relations between the RI derived from the measured pressure and
flow and the RI calculated from the measured pressure and triangular flows (A and B).
The relation for the triangular flow based on the inflection point in pressure can be
described by: RItIP = 0.86 RImf + 0.03 (R2 = 0.73, n = 21). For the relation between the
triangular flow with its maximum set at 30% of ejection time, we found RIt30 = 0.84 RImf
+ 0.04 (R2 = 0.88, n = 26). In Figure 4C the relation between the Augmentation Index
and the Reflection Index based on measured pressure and flow is shown, described by
AI = 2.62 RImf – 0.74 (R2 = 0.57, n = 21). Both intercept and slope contribute to the
model, whereas in the regressions of RItIP and RIt30 on RImf the intercepts do not
contribute. The range of the AI is much larger than that of the RI. In 5 cases no inflection
point was found in the pressure and thus panels A and C of Figure 4 show 21 data points
while panel B shows all 26 points. When the 5 points in which no inflection point could
be determined are excluded, the relation between RIt30 and RImf becomes RIt30 = 0.77
RImf + 0.06 (R2 = 0.67, n=21). The data is also presented as a Bland-Altman plot in
Figure 5. Note that the AI is too low for small RI and too high for large RI.

67
Figure 4
RItIP
0.2
0.4
0.6
RIm
f
RIt30
0.6
0.4
0.2 0
00
.20
.40
.6
RIm
f
AI0.6
0.4
0.2 0
00
.20
.40
.6
RIm
f
AB
C
RI
=0
.86
xR
I+
0.0
3tIP
mf
R=
0.7
32
0.6
0.4
0.2 0
0
RI
=0
.84
xR
I+
0.0
4t3
0m
f
R=
0.8
82
AI
=2
.62
xR
I-
0.7
4m
f
R=
0.5
72
Rel
atio
n be
twee
n R
efle
ctio
n In
dex
calc
ulat
ed f
rom
mea
sure
d pr
essu
re a
nd m
easu
red
flow
on
the
hori
zont
al a
xes,
RIm
f and
, on
the
vert
ical
axe
s, c
alcu
late
d fr
om p
ress
ure
and
tria
ngul
ar f
low
s, R
ItIP (
A, n
= 2
1) a
nd R
It30 (B
, n =
26)
,
and
also
the
Aug
men
tatio
n In
dex
(C, n
= 2
1).

68
Figure 5
AB
C
00
.20
.40
.6
-0
.2
-0
.4
0.2
0.4
0.0
-0
.2
0.2
-0
.4
0.4
0.0
-0
.2
0.2
-0
.4
0.4
0.0
00
.20
.40
.60
0.2
0.4
0.6
RIRItIPmf
-
(RItI
P+
RI
)/2
mf
(RIt3
0+
RI
)/2
mf
(AI
+R
I)/
2m
f
RIRIt30mf
-
AIRI -mf
Bla
nd-A
ltman
plo
t of
Ref
lect
ion
Indi
ces
(A, n
= 2
1 an
d B
, n =
26)
and
Aug
men
tatio
n In
dex
(C, n
= 2
1). D
ashe
d lin
es
are
aver
ages
; dot
ted
lines
are
95
% c
onfi
denc
e in
terv
als.
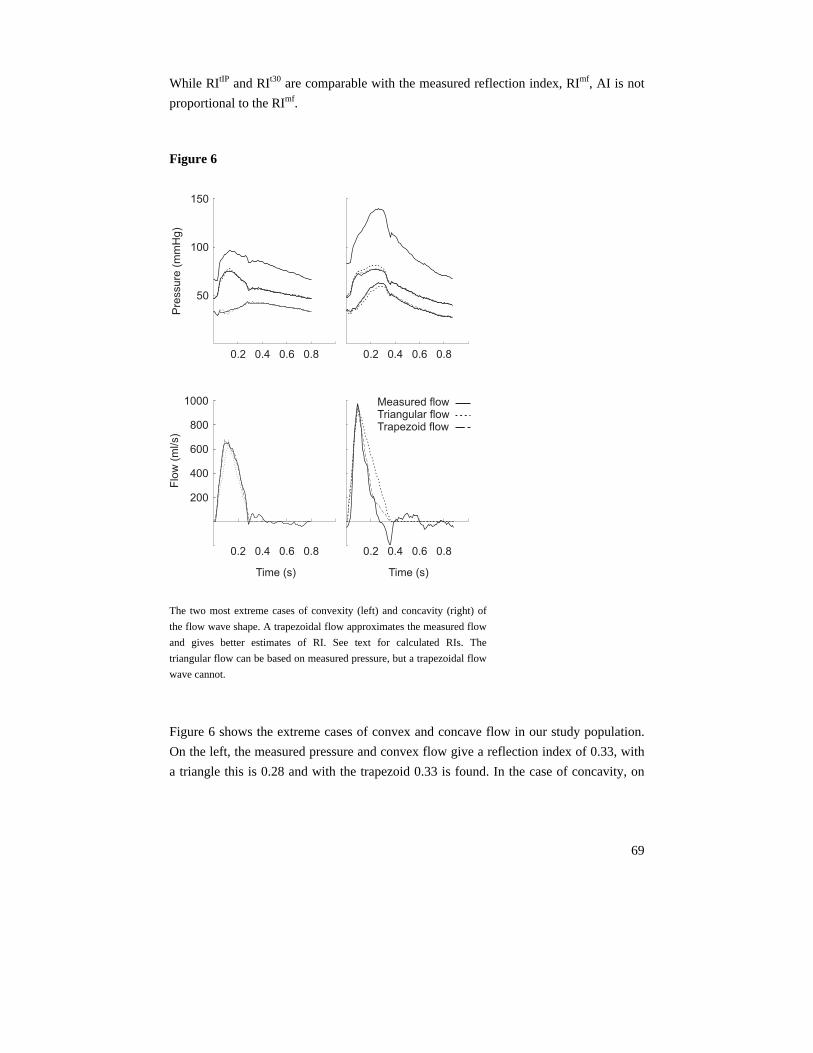
69
While RItIP and RIt30 are comparable with the measured reflection index, RImf, AI is not
proportional to the RImf.
Figure 6
0.2 0.4 0.6 0.80.2 0.4 0.6 0.8
150
100
50
0.2 0.4 0.6 0.8
Measured flowTriangular flowTrapezoid flow
0.2 0.4 0.6 0.8
200
400
600
800
1000
Flo
w(m
l/s)
Pre
ssu
re(m
mH
g)
Time (s)Time (s) The two most extreme cases of convexity (left) and concavity (right) of
the flow wave shape. A trapezoidal flow approximates the measured flow
and gives better estimates of RI. See text for calculated RIs. The
triangular flow can be based on measured pressure, but a trapezoidal flow
wave cannot.
Figure 6 shows the extreme cases of convex and concave flow in our study population.
On the left, the measured pressure and convex flow give a reflection index of 0.33, with
a triangle this is 0.28 and with the trapezoid 0.33 is found. In the case of concavity, on

70
the right in Figure 6, measured pressure and flow give 0.49, with a triangle this is 0.44,
with the trapezoid 0.48 is found.
Discussion We found that from aortic pressure measurement alone and an assumed triangular flow
wave derived from the timing features of the pressure wave, an accurate estimate of the
Reflection Index can be obtained. The amplitudes of the forward waves calculated from
the triangular flows are not significantly different from those calculated from measured
pressure and flow, but the amplitudes of the backward waves derived from triangular
flows are different. The comparison of |PbtIP| and |Pb
t30| with |Pbmf|, however, shows that
the differences are small, particularly the difference between |PbtIP| and |Pb
mf|.
The Reflection Index derived from the triangular flow Ft30, with maximal flow at 30% of
ejection, shows the strongest correlation, panel B in Figure 4. This correlation, however,
is based on more data, including very low values occurring during Valsalva maneuvers
and during one of the exercise recordings. In these data no inflection point was found
and therefore RItIP and AI could not be determined. When these five points are also
excluded from the analysis of RIt30, the correlation between RIt30 and RImf becomes
weaker than the correlation between RItIP and RImf. Thus the use of the inflection point in
the pressure wave is preferred to determine the flow wave shape but in case an inflection
point cannot be found in the pressure wave, the 30% value of ejection time for the peak
time still gives useful results. In all situations in which an Augmentation Index can be
determined, the Reflection Index using the flow wave based on the inflection point can
be calculated as well.
We defined Reflection Index as the ratio |Pb|/(|Pf|+|Pb|). Wave reflection is usually
quantified as the ratio |Pb|/|Pf|, which we here call RM for reflection magnitude. The RI is
conceptually comparable with the Augmentation Index because both give a similar ratio.
For the RI the backward wave, |Pb|, with respect to the summed waves, |Pb| + |Pf|, is
derived. For the AI the secondary pressure increase, related to the backward wave, with
respect to total wave (pulse pressure) is calculated. The summation of the amplitudes |Pb|
+ |Pf| is well defined because timing is excluded from the calculation. In AI the pulse
pressure is the summation of the wave shapes, i.e., Pb(t) + Pf(t) and this sum depends on
timing as discussed above (Figure 1). The RM and RI as used in the present study can be
converted into each other without loss of information:
71
RM = RI / (1 – RI), and RI = RM / (1 + RM).
When the Reflection Magnitude, RM, is calculated as RM = |Pb| / |Pf|, average values are
0.70 ± 0.13, 0.64 ± 0.12 and 0.64 ± 0.11 for RMmf, RMtIP and RMt30, respectively. Both
RMtIP and RMt30 are significantly different from RMmf .The regressions are RMtIP = 0.79
RMmf + 0.08 (R2 = 0.72, n = 21) and RMt30 = 0.73 RMmf + 0.13 (R2 = 0.65, n = 21).
These regressions are comparable to those found earlier for the regressions of RItIP and
RIt30 on RImf with exclusion of the data without an inflection point.
We found that the AI varies over a much larger range than the Reflection Index (Figure
4C). From the Bland-Altman plot (Figure 5), we see that both RItIP and RIt30 give results
comparable to the measured reflection index, RImf. However, AI is not proportional to
the RImf as can also be seen from Figure 4C in which the regression line has an intercept
different from zero. This results from the contribution to wave shapes of incident and
reflected waves and on the timing of the reflected wave as can be seen from Figure 1.
Even when a reflected wave of similar amplitude returns, the time of reflection has a
strong effect on the AI. When the reflected wave returns in diastole (right bottom curve
in panel A of Figure 1) the AI does not give a good estimate of the amount of reflection.
By using the information contained in the flow wave, even in the simplified form of a
triangle, wave analysis can be carried out and the forward and backward pressure waves
can be obtained. From the amplitudes of these waves Reflection Index and Reflection
Magnitude can be calculated, without the confounding effects of timing.
The triangular flow, using the assumption that its time of maximum is 30% of the
ejection time, is based on average data. To obtain some insight into the errors, we
calculated the Reflection Index as a function of peak time, while the ejection period and
heart rate were kept constant. We found that the percentage error in RI was about half
the percentage error in peak time. Thus, a 10% error in time of peak flow results in a 5%
error in RI.
The wave shape of pressure and flow depend on the pump function of the heart and the
arterial load. In a strong heart, which approximates a flow source, the flow wave will be
convex. In a weak heart, which approaches a pressure source, the flow wave will be
scalloped or concave (2). We found that convexity of the flow wave shape leads to
overestimation and concavity leads to underestimation of the reflection index. We have
calculated the reflection index for the most extreme cases of convexity and concavity
using a triangular flow and a trapezoidal flow. The trapezoidal flow can accurately

72
mimic convexity or concavity (Figure 6). This better approximation of the flow wave
results in better estimations of the reflection index with errors of 2% and 0%
respectively. Using a triangular flow these errors were 15% and 10%. However, these
examples are chosen at the extreme of the range of aortic flows. In practice we do not
have the information to construct a trapezoidal flow wave shape.
The characteristic impedance derived from triangular flow wave is close to that one
derived from measured pressure and flow. The relations between characteristic
impedance calculated from measured pressure and flow, and from the triangular flows,
FtIP and Ft30, are given by the following correlation coefficients: R2 = 0.86 for FtIP and R2
= 0.89 for Ft30. Thus there is good relation between the characteristic impedances. We
also found that a factor 2 change is Zc results in about 16% error in RI. This is a
substantial change and any real changes in Zc would be much smaller than that.
The use of the 30% of ejection time allows the calculation of the Reflection Index even
if an inflection point in the systolic pressure wave is not apparent. Thus, our method
allows comparison of the Reflection Index in young and old subjects. However, by using
an average value of 30% of ejection time, individual differences are not accounted for.
The use of the inflection point of pressure allows for the estimation a peak time for an
individual patient. The calculations to find peak flow from the timing features of the
pressure waves, the separation of the waves, and the subsequent calculation of the
Reflection Index are straightforward and can be automated, allowing for Reflection
Index to be routinely obtained.
As shown in the methods section flow calibration is not required. Moreover, when the
Reflection Index is calculated, calibration of the pressure is not required either. This
implies that derivation of the Reflection Index has the same advantage as the derivation
of the AI, namely that calibration is not necessary.
Limitations
The triangular wave shape that is assumed for the flow is an approximation that may
differ from the actual flow wave shape. In the present study however, this approximation
gave results close to those obtained with high fidelity measured flows even during the
Valsalva maneuver and exercise. We therefore believe that the approximation of flow
with a triangular shape to calculate RI is a useful one and we showed that the results can
give potentially more detailed information on wave reflection than AI.

73
Perspectives
We suggest that the calculations to quantify wave reflection can also be performed using
the carotid pressure wave as a surrogate for the aortic pressure. In this study we have
shown that the RI does not depend on the calibration of pressure. Therefore the pressure
can be obtained non-invasively, as, for instance, by applanation tonometry. The entire
derivation then may be based on the noninvasive measurement of the pressure wave
shape only. For instance, the effects of pharmacological interventions on the timing of
the reflected wave (21) could be studied without measurement of aortic flow. Also,
accurate estimation of the amount of reflection as a function of age in large
epidemiological studies is considerably more practical when flow measurement is not
required (22). When the calculations are automated, the derivation of the Reflection
Index would be as easy as the derivation of the Augmentation Index with improved
quantitative information on the magnitude of wave reflection.
Acknowledgements
We cordially thank Dr Viktor Blum, and the Cardiology Service, Brooke Army Medical Center, Fort Sam Houston, TX 78234 (Dr Bernard J. Rubal), for allowing us to use their data.

74
References
1. Westerhof N, Sipkema P, van den Bos GC, Elzinga G. Forward and backward waves in the
arterial system. Cardiovasc Res. 1972;6:648-56.
2. Westerhof N, O'Rourke MF. Haemodynamic basis for the development of left ventricular
failure in systolic hypertension and for its logical therapy. J Hypertens. 1995;13:943-52.
3. O’Rourke, MF. Mechanism of a hypertensive response to exercise. J Am Coll Cardiol. 2004;
44:1527 (Letter).
4. WK Laskey and WG Kussmaul. Arterial wave reflection in heart failure. Circulation.
1987;75:711-722.
5. Murgo JP, Westerhof N, Giolma JP, Altobelli SA. Manipulation of ascending aortic pressure
and flow with the Valsalva maneuver: relationship to input impedance. Circulation. 1981;63:
122-132.
6. Nichols WW, O’Rourke MF. Vascular impedance. In: McDonald’s Blood Flow in Arteries.
4th ed. London, UK: Arnold; 1998
7. Kelly R, Hayward C, Avolio A, O'Rourke M. Noninvasive determination of age-related
changes in the human arterial pulse. Circulation. 1989;80:1652-9.
8. Takazawa K, Tanaka N, Takeda K, Kurosu F, Ibukiyama C. Underestimation of vasodilator
effects of nitroglycerin by upper limb blood pressure. Hypertension. 1995;26:520-3.
9. Wilkinson IB, Fuchs SA, Jansen IM, Spratt JC, Murray GD, Cockcroft JR, Webb DJ.
Reproducibility of pulse wave velocity and augmentation index measured by pulse wave
analysis. J Hypertens. 1998;16:2079-84.
10. Papaioannou TG, Stamatelopoulos KS, Gialafos E, Vlachopoulos C, Karatzis E, Nanas J,
Lekakis J. Monitoring of arterial stiffness indices by applanation tonometry and pulse wave
analysis: reproducibility at low blood pressures. J Clin Monit Comput. 2004;18:137-44.
11. London GM, Pannier B, Guerin AP, Marchais SJ, Safar ME, Cuche JL. Cardiac hypertrophy,
aortic compliance, peripheral resistance, and wave reflection in end-stage renal disease.
Comparative effects of ACE inhibition and calcium channel blockade. Circulation.
1994;90:2786-96.
12. Asmar RG, London GM, O'Rourke ME, Safar ME; REASON Project Coordinators and
Investigators. Improvement in blood pressure, arterial stiffness and wave reflections with a
very-low-dose perindopril/indapamide combination in hypertensive patient: a comparison
with atenolol. Hypertension. 2001;38:922-6.
13. Kelly RP, Millasseau SC, Ritter JM, Chowienczyk PJ. Vasoactive drugs influence aortic
augmentation index independently of pulse-wave velocity in healthy men. Hypertension.
2001;37:1429-33.
14. Hayashi T, Nakayama Y, Tsumura K, Yoshimaru K, Ueda H. Reflection in the arterial system
and the risk of coronary heart disease. Am J Hypertens. 2002;15:405-9.

75
15. Mitchell GF, Tardif JC, Arnold JM, Marchiori G, O'Brien TX, Dunlap ME, Pfeffer MA.
Pulsatile hemodynamics in congestive heart failure. Hypertension. 2001;38:1433-9.
16. Murgo JP. Westerhof N. Giolma JP. Altobelli SA. Aortic input impedance in normal man:
relationship to pressure wave forms. Circulation. 1980;62:105-16.
17. Murgo JP. Westerhof N. Input impedance of the pulmonary arterial system in normal man.
Effects of respiration and comparison to systemic impedance. Circulation Research.
1984;54:666-73.
18. Murgo JP. Westerhof N. Giolma JP. Altobelli SA. Effects of exercise on aortic input
impedance and pressure wave forms in normal humans. Circulation Research. 1981;48:334-
43.
19. Latham RD, Sipkema P, Westerhof N, Rubal BJ. Aortic input impedance during Mueller
maneuver: an evaluation of "effective length". J Appl Physiol. 1988;65:1604-10.
20. Blum V, Carriere EG, Kolsters W, Mosterd WL, Schiereck P, Wesseling KH. Aortic and
peripheral blood pressure during isometric and dynamic exercise. Int J Sports Med.
1997;18:30-4.
21. Mitchell GF, Izzo JL Jr, Lacourciere Y, Ouellet JP, Neutel J, Qian C, Kerwin LJ, Block AJ,
Pfeffer MA. Omapatrilat reduces pulse pressure and proximal aortic stiffness in patients with
systolic hypertension: results of the conduit hemodynamics of omapatrilat international
research study. Circulation. 2002;105:2955-61.
22. Mitchell GF, Parise H, Benjamin EJ, Larson MG, Keyes MJ, Vita JA, Vasan RS, Levy D.
Changes in arterial stiffness and wave reflection with advancing age in healthy men and
women: the Framingham Heart Study. Hypertension. 2004;43:1239-45.

76
List of abbreviations
AI Augmentation Index calculated as pressure augmentation divided by
pulse pressure, ∆P/PP
Fm measured flow wave
FtIP triangular flow wave with maximum flow at the time of the inflection
point in the pressure wave
Ft30 triangular flow wave with maximum flow at the time of 30% of
ejection time determined from the pressure wave
∆P pressure augmentation, the extra rise in pressure after an inflection
point
PP pulse pressure
Pm measured pressure wave
Pf(t) forward or incident pressure wave as a function of time
Pb(t) backward or reflected pressure wave as a function of time
Pfmf, Pb
mf forward, backward pressure wave determined using measured flow
PftIP, Pb
tIP forward, backward pressure wave determined using FtIP
Pft30, Pb
t30 forward, backward pressure wave determined using Ft30
|Pf| amplitude of Pf
|Pb| amplitude of Pb
RI Reflection Index calculated as |Pb|/(|Pf|+|Pb|)
RM Reflection Magnitude calculated as |Pb|/|Pf|
RImf, RMmf RI and RM calculated from measured pressure and measured flow
RItIP, RMtIP RI and RM calculated from measured pressure and FtIP
RIt30, RMt30 RI and RM calculated from measured pressure and Ft30
Zc characteristic impedance

77
Chapter 5
Variations in cardiac oxygen supply and
demand in hypertensive subjects after rising
Berend E Westerhof1, Gert A van Montfrans2, Ilja Guelen1;
Karel H Wesseling1, Jos AE Spaan3, Gianfranco Parati4, Nico Westerhof5,
John M Karemaker6, Johannes J van Lieshout2,
Willem Jan W Bos7
The increased risk of sudden cardiac death soon after awakening suggests mechanisms
that are particularly likely to occur during this time. Specifically, the increase in heart
rate and blood pressure early in the morning increases cardiac oxygen demand and has
been associated with morning excess of acute myocardial infarction (1–3). We
hypothesized that in hypertensive subjects this early morning increase in heart rate and
blood pressure also affects the oxygen supply potential, further compromising the
relationship between cardiac oxygen supply and demand. To test our hypothesis we
analyzed a group of hypertensive patients; a group of normotensive volunteers served as
reference.
1 BMEYE, Amsterdam, The Netherlands 2 Dept of Internal Medicine, Academic Medical Center, University of Amsterdam, The Netherlands 3 Dept of Medical Physics, Academic Medical Center, University of Amsterdam, The Netherlands 4 II Cardiology Unit, S. Luca Hospital, University of Milano-Bicocca and Istituto Auxologico, Milano Italy 5 Lab for Physiology, ICaR-VU, VU University medical center, Amsterdam, The Netherlands 6 Dept of Physiology, Academic Medical Center, University of Amsterdam, The Netherlands 7 Dept of Internal Medicine, St Antonius Ziekenhuis, Nieuwegein, The Netherlands

78
Pulse wave analysis was performed to determine parameters which were shown to
correlate to cardiac oxygen supply potential, cardiac oxygen demand, and the supply -
demand ratio. The effects of diurnal variations in blood pressure and heart rate on
indices estimating cardiac oxygen supply potential and cardiac oxygen demand were
studied. We used previously recorded 24-hour continuous intra-arterial and finger
arterial blood pressure measurements in 14 hypertensive patients and 8 healthy
normotensive volunteers (4). Reconstructed aortic pressure was used for all calculations.
Methods Subjects
For a detailed description we refer to our original report (4). In short, 14 hypertensive
patients, aged 20–60 years, and 8 normotensive volunteers, aged 19–32 years, were
studied. In the hypertensive group 11 patients were male, in the normotensives group all
participants were male. The hypertensives had discontinued their medication two weeks
prior to the measurements. All subjects gave written informed consent and the respective
review committees approved the protocol (4).
Measurements
Brachial Artery Pressure (BAP) was measured intra-arterially at the non-dominant arm
with the Oxford Medilog Mark II system and ambulatory finger arterial pressure was
obtained from the dominant arm using the Portapres device (4). Measurements were
performed from 1 PM until 1 PM the next day. Apart from free in-hospital activities, all
subjects performed the following activities at preset times: siesta (2:00 – 3:30 PM),
cycling at 50 W (4:45 – 5:15 PM), sleep (10 PM – 6 AM), and two walks outside the
hospital (10:00 – 10:30 AM, 11:00 – 11:30 AM).
Data analysis
Blood pressure was A/D converted with a sampling rate of 100 Hz. Beat to beat values
of systolic, mean and diastolic BAP (corrected for zero drift) and Heart Rate (HR) were
calculated. Episodes with artifacts were rejected. Aortic pressure waves were
reconstructed from invasive brachial and noninvasive finger artery pressures using a
generalized transfer function (5–14). The transfer function compensates for the
physiological wave transformation of pressure waves traveling towards the periphery.

79
Diastolic Time Fraction (DTF, the ratio of duration of diastole and heart period) was
calculated to assess the oxygen supply potential, since a decrease in DTF is directly
related to coronary blood flow if the vasodilatory reserve is exhausted (15,16). Rate-
Pressure Product (RPP, systolic pressure times heart rate), was calculated to assess
cardiac oxygen demand (17,18). The supply - demand ratio (19–22) was assessed by the
ratio of the diastolic area (Adia, in mmHg·s) and systolic area (Asys, in mmHg·s) under the
pressure curve.
Statistics
Thirty-minute averages were calculated for all parameters. The effect of rising was
evaluated by comparing equal periods before (01:00 – 06:00, night) and after rising
(08:00 – 13:00, morning). Results were expressed as mean ± SD in tables and as mean ±
SEM in figures. Night vs. morning values and hypertensives vs. normotensives were
compared by paired t-tests. Linear regression analysis was performed over the 48 half-
hour averages to analyze the relationship between parameters and HR.
Figure 1
75
100
150
75
100
150
Pre
ssure
(mm
Hg)
time (hours) time (hours)
HR
(BP
M)
50
100100
50
Normotensives Hypertensives
18 24 6 12 18 24 6 12
Nig
ht
Morn
ing
Nig
ht
Morn
ing
Left, Normotensives, right, Hypertensives. Systolic, mean and diastolic aortic pressure in top panel, Heart Rate
(HR) in second panel. Dotted vertical lines demarcate Night and Morning periods; bars over the time scale
indicate the activities listed in the Methods section (siesta, cycling, sleeping and two walks). The change in
blood pressure and heart in the morning is slower in the hypertensives.
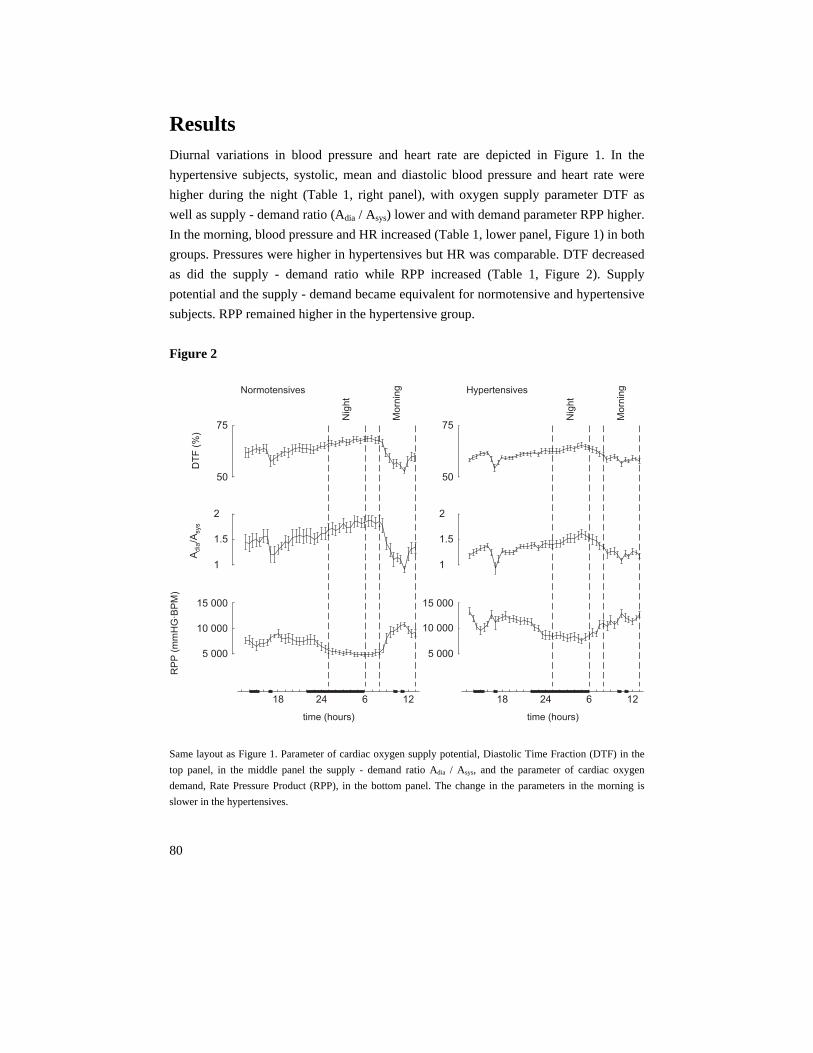
80
Results Diurnal variations in blood pressure and heart rate are depicted in Figure 1. In the
hypertensive subjects, systolic, mean and diastolic blood pressure and heart rate were
higher during the night (Table 1, right panel), with oxygen supply parameter DTF as
well as supply - demand ratio (Adia / Asys) lower and with demand parameter RPP higher.
In the morning, blood pressure and HR increased (Table 1, lower panel, Figure 1) in both
groups. Pressures were higher in hypertensives but HR was comparable. DTF decreased
as did the supply - demand ratio while RPP increased (Table 1, Figure 2). Supply
potential and the supply - demand became equivalent for normotensive and hypertensive
subjects. RPP remained higher in the hypertensive group.
Figure 2
1
1.5
2
A/A
dia
sys
1
1.5
2
RP
P(m
mH
G·B
PM
)
5 000
10 000
15 000
5 000
10 000
15 000
DT
F(%
)
50
75
Normotensives Hypertensives
50
75
18 24 6 12 18 24 6 12
Nig
ht
Mo
rnin
g
Nig
ht
Mo
rnin
g
time (hours) time (hours) Same layout as Figure 1. Parameter of cardiac oxygen supply potential, Diastolic Time Fraction (DTF) in the
top panel, in the middle panel the supply - demand ratio Adia / Asys, and the parameter of cardiac oxygen
demand, Rate Pressure Product (RPP), in the bottom panel. The change in the parameters in the morning is
slower in the hypertensives.

81
DTF and Adia / Asys decreased with HR, RPP increased (Table 2). The early morning
increase in HR (BPM) in the hypertensive subjects (from 67 ± 3 to 89 ± 5 BPM; 33%)
was smaller than in the normotensives (from 53 ± 2 to 82 ± 11 BPM; 55%). The smaller
HR increase limited the untoward changes in cardiac oxygen parameters.
The results based on non-invasive finger arterial pressure and those of brachial intra-
arterial pressure, both reconstructed to aortic pressure, lead to the same outcomes of the
tests given in Table 1.
Table 1 Hemodynamic parameters and cardiac oxygen indices.
Normotensives Hypertensives
Night Mean SD Mean SD P,
HT vs. NT
Psys 96 2 124 3 <0.001
Pdia 61 2 79 2 <0.001
Pmean 77 2 99 2 <0.001
HR 53 2 67 3 <0.001
DTF 67.5 0.9 64.0 0.9 <0.001
Adia/Asys 1.79 0.07 1.52 0.06 <0.001
RPP 5100 260 8400 410 <0.001
Morning Mean SD
P,
morning
vs. night
Mean SD
P,
morning
vs. night
P,
HT vs. NT
Psys 115 4 <0.001 136 3 <0.001 <0.001
Pdia 76 4 <0.001 92 3 <0.001 <0.001
Pmean 94 4 <0.001 112 2 <0.001 <0.001
HR 82 11 <0.001 89 5 <0.001 0.054
DTF 58.9 3.6 <0.001 58.3 1.1 <0.001 0.613
Adia/Asys 1.27 0.22 <0.001 1.20 0.06 <0.001 0.303
RPP 9200 1300 <0.001 11900 930 <0.001 <0.001
Night averages (top) and morning averages (bottom) for normotensives (left) and hypertensives (right). In the
right column, Hypertensives (HT) are tested versus Normotensives (NT). In the lower half of the Table the
morning averages are tested versus night. Psys, Pdia and Pmean are systolic, diastolic and mean aortic pressure
(mmHg), HR is heart rate in beats per minute (BPM), DTF is diastolic time fraction (%), RPP is Rate Pressure
Product (mmHg·BPM), Adia / Asys is de ratio of diastolic and systolic areas (mmHg·s), respectively, under the
aortic pressure curve.

82
Discussion We studied diurnal variations in blood pressure, heart rate, and of parameters estimating
cardiac oxygen supply potential and oxygen demand, in both hypertensive and
normotensive subjects. The new findings of this study are that in hypertensive subjects
the diurnal variation in cardiac oxygen supply parameters and in the supply - demand
ratio is smaller, and that soon after awakening an increase in cardiac oxygen demand is
accompanied by a concomitant reduction in supply potential.
Table 2 Linear regressions on Heart Rate
Normotensives Hypertensives
Regression R2 Regression R2
DTF – 0.30 x HR + 84 0.97 – 0.23 x HR + 79 0.94
Adia/Asys – 0.018 x HR + 2.77 0.96 – 0.013 x HR + 2.38 0.91
RPP 130 x HR – 1730 0.97 150 x HR – 1300 0.85
Regressions of parameters for cardiac oxygen supply potential and cardiac oxygen demand on Heart Rate
(HR). For explanation of the quantities refer to Table 1.
Methodological considerations
Oxygen supply - demand parameters were calculated from aortic pressure waves
reconstructed from invasive brachial artery pressure and non-invasive finger arterial
pressure recordings, using transfer functions (11–14). Transfer functions compensate for
the physiological wave transformation of pressure waves traveling towards the
periphery. The transfer functions mainly correct for the amplification of the systolic
pressure (11–14). The use of a transfer function therefore mainly affects calculation of
RPP. Generalized waveform filters in the upper limb show little inter-individual
variation at low frequencies (7–11), which are of importance for the calculation of mean
and diastolic pressure, and thus for calculation of DTF. Therefore, the inaccuracies
introduced by the use of a transfer function have no major effect on the estimates of
cardiac oxygen supply potential.
83
The measurements of cardiac oxygen supply potential and oxygen demand in groups of
normotensives and hypertensives were indirect. Continuous ambulatory coronary flow
measurement to validate the suggested reduction in coronary perfusion in patients with
coronary heart disease is as yet not feasible. Simultaneous oxygen supply - demand
parameters from continuous blood pressure together with ST-segment depression in
patients known with coronary heart disease, might, in part, answer the question whether
ischemia correlates best with changes in oxygen supply vs. demand parameters.
Diurnal hemodynamic variations
Major changes in parameters occurred after rising, i.e. at the time that the peak in
ischaemic events is usually observed (23,24). In healthy subjects subendocardial
perfusion is hampered if the Adia / Asys ratio falls below 0.4 to 0.6 (22,25). The ratios
observed in this study, in which no strenuous exercise was performed, remained well
above this limit in all subjects. However, this limit is not fixed but may increase under
circumstances where the vasodilatory reserve is exhausted, e.g. in case of coronary
artery stenosis. Thus the magnitude of the observed changes in Adia / Asys ratio per se
does not reflect early morning myocardial ischemia in healthy subjects, but may explain
occurrence of coronary ischemia in those subjects who suffer from coronary artery
disease. In hypertensives (26) as well as in myocardial hypertrophy (27), coronary flow
reserve is less. Therefore, oxygen supply parameters are better indicators of
subendocardial ischemia in hypertensives than in normotensives. The diurnal variation in
the cardiac oxygen supply potential parameters and in the Adia / Asys ratio in the
hypertensive subjects was smaller, a phenomenon not described before. Of interest, the
finding that oxygen supply - demand parameters as derived from invasive pressure was
tracked by a non-invasive arterial pressure determination allows to study these supply
and demand parameters in a non-invasive manner.
Cardiac Oxygen Supply Potential
As soon as coronary vasodilatory reserve is exhausted, e.g. related to the presence of a
stenosis, subendocardial and mid-myocardial perfusion become dependent directly on
diastolic pressure and time (15,16,20–22). Usually, reduced supply is associated with
coronary vasospasm or atherosclerosis (1). The present study demonstrates that
hemodynamic changes may equally affect DTF as parameter of cardiac oxygen supply
potential in the morning.

84
A reduction in DTF can be attributed to an increase in HR primarily by shortening of
diastole. In healthy subjects a decrease in perfusion pressure or time is compensated for
by coronary vasodilation (22) rendering the decrease in the oxygen supply potential
parameter of importance mainly in patients with coronary stenosis. To the best of our
knowledge the supply parameter, in contrast to the demand parameters has never been
associated with cardiac ischemic events in the morning (24). Pepine (28) mentions the
beneficial effects of beta-blockers on cardiac oxygen supply because of the prolongation
of diastolic time, but not in relation to circadian rhythms and cardiac oxygen supply.
Cardiac Oxygen Demand
Diurnal variations in the balance between cardiac oxygen supply and demand have
traditionally been attributed to changes in oxygen demand due to physical activity
(1,2,29,30). The close correlation between an increase in HR and subsequent
development of coronary ischemia is considered to reflect this increase in oxygen
demand (31,32). The observed increase in RPP after rising, which results from an
increase in both systolic blood pressure and heart rate, is in agreement with the
hypothesis that the morning increase in ischemic events may be caused by an increase in
cardiac oxygen demand.
Hypertensives versus normotensives
Hypertensive subjects appear to be at risk for ischemic events due to larger oxygen
demand (33,34) during night as well as in the morning. During the morning period, the
oxygen supply potential of the hypertensives vs. normotensives did not differ, possibly
related to a damped HR response to rising. In contrast, during the night oxygen supply
potential was lower in hypertensives. This may play a role hitherto overlooked in
nocturnal ischemia (35–37)

85
Conclusion
We observed a decrease in cardiac oxygen supply potential parameters and the ratio Adia
/ Asys after rising in healthy subjects and in hypertensive patients. Traditionally an
increased cardiac oxygen demand has been considered as the factor reducing the oxygen
supply - demand balance. However, we observed that the supply - demand balance may
change detrimentally by a reduction of the oxygen supply potential as well. The smaller
increase in HR in our hypertensive group limits a further deterioration of oxygen
parameters.

86
References
1. Deedwania PC. Increased demand versus reduced supply and the circadian variations in
ambulatory myocardial ischemia; therapeutic implications. Circulation. 1993;88:328-331.
2. Parker JD, Testa MA, Jimenez AH, Tofler GH, Muller JE, Parker JO, Stone PH. Morning
increase in ambulatory ischemia in patients with stable coronary artery disease; importance of
physical activity and increased cardiac demand. Circulation. 1994;89:604-614.
3. Li JJ. Circadian variation in myocardial ischemia: the possible mechanisms involving in this
phenomenon. Med Hypotheses. 2003;61:240-3. Review.
4. Imholz BPM, Langewouters GJ, van Montfrans GA, Parati G, van Goudoever J, Wesseling
KH, Wieling W, Mancia G. Feasibility of ambulatory, continuous, 24-hour finger pressure
recording. Hypertension. 1993;21:65-73.
5. Lasance HAJ, Wesseling KH, Ascoop CA: Peripheral pulse contour analysis in determining
stroke volume. Progress Report 5, Institute of Medical Physics, Utrecht, 1976.
6. Karamanoglu M, O’Rourke MF, Avolio AP, Kelly RP. An analysis of the relationship
between central aortic and peripheral upper limb pressure waves in man. Eur Heart J.
1993;14:160-167.
7. Chen CH, Nevo E, Fetics B, Pak PH, Yin FCP, Maugham WL, Kass DA. Estimation of
central aortic pressure waveform by mathematical transformation of radial tonometry
pressure; validation of generalized transfer function. Circulation. 1997;95:1827-1836.
8. Karamanoglu M, Feneley MP. On-line synthesis of the human ascending aortic pressure pulse
from the finger pulse. Hypertension. 1997;30:1416-1424.
9. Bos WJW, Zietse R, Wesseling KH, Westerhof N. Effect of arteriovenous fistulas on cardiac
oxygen supply and demand. Kidney Int. 1999;55, 2049-2053.
10. Bos WJ, Bruin S, van Olden RW, Keur I, Wesseling KH, Westerhof N, Krediet RT, Arisz
LA. Cardiac and hemodynamic effects of hemodialysis and ultrafiltration. Am J Kidney Dis.
2000;35:819-26.
11. Gallagher D, Adji A, O'Rourke MF. Validation of the transfer function technique for
generating central from peripheral upper limb pressure waveform. Am J Hypertens. 2004
Nov;17(11 Pt 1):1059-67.
12. Westerhof BE, Guelen I, Parati G, Groppelli A, van Montfrans GA, Wieling W, Wesseling
KH, Bos WJ. Variable day/night bias in 24-h non-invasive finger pressure against
intrabrachial artery pressure is removed by waveform filtering and level correction. J
Hypertens. 2002;20:1981-6.
13. Gizdulich P, Prentza A, Wesseling KH. Models of brachial to finger pulse wave distortion
and pressure decrement. Cardiovasc Res.1997;33: 698-705.
14. Bos WJW, van Goudoever J, van Montfrans GA, van den Meiracker AH, Wesseling KH.
Reconstruction of brachial artery pressure from noninvasive finger pressure measurements.
Circulation. 1996;94:1870-1875.

87
15. Merkus D, Kajiya F, Vink H, Vergroesen I, Dankelman J, Goto M, Spaan JAE. Prolonged
diastolic time fraction protects myocardial perfusion when coronary blood flow is reduced,
Circulation. 1999;100:75-81.
16. Fokkema DS, Vanteeffelen JW, Dekker S, Vergroesen I, Reitsma JB, Spaan JA. Diastolic
time fraction as determinant of subendocardial perfusion. Am J Physiol Heart Circ Physiol.
2005;288:H2450-6.
17. Westerhof N, Stergiopulos N, Noble MIM. Snapshots of Hemodynamics. An aid for clinical
research and graduate education. New York, NY, USA: Springer; 2005:72-73
18. Rooke GA, Feigl EO. Work as a correlate of canine left ventricular oxygen consumption, and
the problem of catecholamine oxygen wasting. Circ Res. 1982;50:273-86.
19. Sarnoff SJ, Braunwald E, Welch GH Jr, Case RB, Stainsby WN, Macruz R. Hemodynamic
determinants of oxygen consumption of the heart with special reference to the tension-time
index. Am J Physiol. 1958;192:148-56.
20. Buckberg GD, Fixler DE, Archie JP, Hoffman JIE. Experimental subendocardial ischemia in
dogs with normal coronary arteries. Circulation Res. 1972;30:67-81.
21. Buckberg GD, Fixler DE, Archie JP, Henney RP, Hoffman JIE. Variable effects of heart rate
on physic and regional left ventricular muscle blood flow in anaesthetized dogs. Cardiovasc
Res. 1975;9:1-11.
22. Hoffman JIE, Buckberg GD. The myocardial supply:demand ratio - a critical review. Am J
Card. 1978;41:327-332.
23. Willich SN, Levy D, Rocco MB, Tofler GH, Stone PH, Muller JE. Circadian variation in the
incidence of sudden cardiac death in the Framingham Heart Study population. Am J Cardiol.
1987;60:801-6.
24. Cohen MC, Rohtla KM, Lavery CE, Muller JE, Mittleman MA. Meta-analysis of the morning
excess of acute myocardial infarction and sudden cardiac death. Am J Cardiol. 1997;79:1512-
1516.
25. Barnard RJ, MacAlpin R, Kattus A, Buckberg GD. Ischemic response to sudden strenuous
exercise in healthy man. Circulation. 1973;48:936-942.
26. Marcus ML, Mueller TM, Eastham CL. Effects of short- and long-term left ventricular
hypertrophy on coronary circulation. Am J Physiol. 1981;241:H358-62.
27. Galderisi M, de Simone G, Cicala S, De Simone L, D'Errico A, Caso P, de Divitiis O.
Coronary flow reserve in hypertensive patients with appropriate or inappropriate left
ventricular mass. J Hypertens. 2003;21:2183-8.
28. Pepine CJ. Circadian variations in myocardial ischemia. Implications for management.
JAMA. 1991;265:386-90. Review.
29. Pepine CJ. Therapeutic implications of circadian variations in myocardial ischemia and
related physiologic functions. Am J Hypertens. 1991;4;442S-448S.
30. Krantz DS, Kop WJ, Gabbay FH, Rozanski A, Barnard M, Klein J, Pardo Y, Gottdiener JS.
Circadian variation of ambulatory myocardial ischemia; triggering by daily activities and
evidence for an endogenous circadian component. Circulation. 1996;93:1364-1371.

88
31. Deedwania PC, Nelson JR. Pathophysiology of silent myocardial ischemia; hemodynamic
evaluation by simultaneous electrocardiographic and blood pressure monitoring. Circulation.
1990;82:1296-1304.
32. Andrews TC, Fenton T, Toyosaki N, Glasser SP, Young PM, MacCallum G, Gibson RS,
Shook TL, Stone PH. Subsets of ambulatory myocardial ischemia based on heart rate activity.
Circadian distribution and response to anti-ischemic medication. The Angina and Silent
Ischemia Study Group (ASIS). Circulation. 1993;88:92-100.
33. Gillman MW, Kannel WB, Belanger A, D'Agostino RB. Influence of heart rate on mortality
among persons with hypertension: the Framingham Study. Am Heart J. 1993;125:1148-54.
34. Kozakova M, Galetta F, Gregorini L, Bigalli G, Franzoni F, Giusti C, Palombo C. Coronary
vasodilator capacity and epicardial vessel remodeling in physiological and hypertensive
hypertrophy. Hypertension. 2000;36:343-9.
35. Quyyumi AA, Wright CA, Mockus LJ, Fox KM. Mechanisms of nocturnal angina pectoris:
importance of increased myocardial oxygen demand in patients with severe coronary artery
disease. Lancet. 1984;1:1207-9.
36. Bonsignore MR, Smirne S, Marrone O, Insalaco G, Salvaggio A, Bonsignore G. Myocardial
ischemia during sleep. Sleep Med Rev. 1999;3:241-55.
37. Peters RW, Zoble RG, Brooks MM. Onset of acute myocardial infarction during sleep. Clin
Cardiol. 2002;25:237-41.
89
Chapter 6
Time-domain cross-correlation baroreflex
sensitivity:
performance on the Eurobavar data set
Berend E. Westerhof1, Janneke Gisolf2, Wim J. Stok2,
Karel H. Wesseling1, John M. Karemaker2
See editorial commentary in Appendix
Baroreflex sensitivity (BRS) is now a prognostic factor in cardiology (1–3). It is the
amount of response in heart beat interval to a change in blood pressure, expressed in
ms/mmHg. A blood pressure increment must lead to an increment in interval within 3 or
4 s, and similarly a blood pressure decrement must lead to an interval decrement within 3
or 4 s, for the changes to be considered to be baroreflex action.
Since the concept was proposed in 1969 (4), a number of methods has been developed
for the assessment of BRS, some using a circulatory challenge such as injections of
vasoconstrictor or vasodilator agents (4), neck suction (5) or a change from supine to
standing (6,7), and some using spontaneous blood pressure and interval variability,
studied in the time domain (8–10) or in the frequency domain (9,11). These various
methods produce somewhat different numerical values (12), although results obtained on
the same data set show acceptable correlation (3).
1 TNO TPD Biomedical Instrumentation, Amsterdam, The Netherlands 2 Dept of Physiology, Academic Medical Center, University of Amsterdam, The Netherlands
90
Before the cross-correlation method described below, we developed a sequential method
(sBRS) based on and comparable to the well-known method of Di Rienzo et al. (8).
During the development of that technique, when spontaneous fluctuations in pressure
and interval were plotted against each other, we often noticed open Lissajous loops,
which indicated that allowance should be made for a delay between pressure and
interval, as was suggested at an early stage by Karemaker (13). As the amount of delay
for each patient and patient state is not known in advance, we decided to compute BRS
as a cross-correlation function of blood pressure and pulse interval and call this method
cross-correlation baroreflex sensitivity, or xBRS.
Recently, the European Society of Hypertension working group on baroreflex and
cardiovascular variability, in which 11 centres participate, has produced a
comprehensive database which is available for the testing and comparison of methods
(3). We tested the xBRS method on that data set, comparing the results obtained by
xBRS using our local Amsterdam sequence and spectral algorithms with the 21 results
obtained with various methods returned by the 11 centres participating in EUROBAVAR
(3).
Methods The xBRS, sBRS and spectral methods described below we will refer to as Amsterdam
‘local’ methods and results, to distinguish them from those in the EUROBAVAR study.
The EUROBAVAR data set
The EUROBAVAR data set consists of 10–12 min recordings obtained in 21 patients (four
men and 17 women) who were monitored non-invasively with a Finapres 2300
(Ohmeda, Louisville, Colorado, USA) and a Cardiocap II (Datex Engstrom, Helsinki,
Finland) in both the supine (henceforth referred to as ‘lying’) and the standing positions.
Their ages ranged from 20 to 68 years. One patient had diabetes with evident cardiac
autonomic neuropathy, one was a recent recipient of a heart transplant, one had diabetes
without cardiac neuropathy, eight were normotensive patients, one had hypertension,
two had hypertension that was treated, two had hypercholesterolaemia that was treated,
one woman was pregnant in her first term, and four were healthy volunteers. (For further
details see Laude et al. (3).)

91
The EUROBAVAR data set is available from the internet as beat-to-beat systolic and
interval values. A set (a) consists of 16 files from eight patients, identified as a001l for
lying and a001s for standing, and so on. A set (b) consists of 30 files identified as b001l
and b001s and so on; these were from 13 new patients and two copied from the previous
(a) set to test repeatability.
Cross-correlation baroreflex sensitivity
The xBRS method differs from the original (8) time-domain sequential method in that it
observes blood pressure and heart interval variability over a fixed time period rather than
over a variable number of beats. Cross-correlation and regression between systolic blood
pressure and interbeat interval (IBI) are computed over 10 s sliding windows, a time-
span sufficient to accommodate fully a 10 s variability in rhythm, or several cycles at
ventilatory frequencies. The method thus may observe two or more slopes
simultaneously. Often, the interval variability is delayed with respect to systolic pressure
variability. Steptoe and Vögele (14) found a 0-, 1- or 2-beat delay to be adequate in
young men. Delays in the baroreflex, however, are measured in seconds of time, not
beats (15). We therefore programmed delays in the pulse interval series to compensate
for physiological delays by applying time shifts of 0–5 s to interval, thereby correlating
current pressure with later interval values. A 5 s delay should suffice for sympathetically
mediated reflexes on pulse interval.
Systolic pressure and heart interval series were taken from the EUROBAVAR files. Beat
events were spaced on the time axis by distances equal to heart interval. Cubic splines
were fitted to the blood pressure and interval event series and the splines were resampled
at 1 Hz. For each window, the correlation coefficient was computed six times. The first
computation was for zero delay and was executed between the first 10 pressure and
interval value pairs (t = 1–10 s). The next computation was for a delay of 1 s and was
carried out between the same 10 pressures, but with interval values at t = 2–11 s.
Computations continued until the 10 pressure values (t = 1–10 s) were correlated with
interval values at t = 6–15 s. The cross-correlation with the greatest value was selected,
and the corresponding regression slope was taken as a determination of BRS, provided it
was positive and its probability of being a random regression was less than 1% (P <
0.01). When these conditions were not met, there was no result for this time segment.
The accepted regression slope was divided by the correlation coefficient to obtain a
slope fitting pressure and interval variability simultaneously (16); this was done because

92
the pressure and the interval values are both disturbed by random variability in excess of
that explained by baroreflex variability. The corresponding delay was recorded as best
delay τ. There were no thresholds for pressure or interval changes within a segment.
The timing point of a valid xBRS was the middle position of the pressure and possibly
time-shifted interval windows. A simulated spike of short duration demonstrates timing
in Figure 1. Such short events cause clusters of BRS detection, 1 s apart. In the software,
such clusters are detected as contiguous values not more than 1.5 s apart; the BRS values
in a cluster are averaged and timed at the cluster mid-position, thus indicating the joint
event. Spiked events are rare, however, and approximately sinusoidal events of limited
duration are more probable. These may also cause clusters. Values within clusters were
usually not as stable as in the simulation example, but were seen to vary over a 2 : 1
range in amplitude. The results presented are based on individual determinations, not on
clusters. With each new determination, the window was advanced 1 s, cumulative means
and ranges were updated, and histograms were formed of xBRS and best delay τ, for
inspection.
Figure 1
Simulated pressure and interval plots to demonstrate timing. The upper line is systolic blood pressure (SYS,
mmHg).; the lower line is interval (IBI, ms). x, Time of a cross-correlation determination of baroreflex
sensitivity (BRS, ms/mmHg); .tniopdim retsulc ,

93
Sequential baroreflex sensitivity
For comparison, we include results obtained with the sBRS method, programmed
previously in consultation with Di Rienzo and colleagues (8). This method detects
sequences of beats with simultaneously increasing or decreasing pressure and interval. A
minimum of three sequential beats (three intervals, four R-waves) is required, and a
pulse interval delay of 0 is taken – that is, systolic pressure falls within the R–R interval
considered. The method requires a systolic pressure variation of at least 2.5 mmHg over
the beats in the sequence, but has no threshold for interval. The estimate is accepted
when correlation is significant at P = 0.05.
At the occurrence of the next beat, the direction of the changes in interval and pressure
are compared with those of the previous beats. If directions are the same, then
correlation and regression are again computed over the longer sequence and evaluated
for significance. This leads to clusters of sBRS values similar to the clusters that the
xBRS method produces. Our results are based on the individual values.
Spectral method
Our spectral method computes baroreflex sensitivity as the transfer gain of the cross-
spectra between pressure and interval. Their coherence is usually high in the 10 s rhythm
band taken from 0.06 to 0.15 Hz and at ventilatory frequencies in the spectra between
0.15 and 0.5 Hz. Spectral estimates of the entire recording were computed with in-house
developed software (Graphical User Interface For Fourier Transform), providing an
easy-to-use interface on top of proven Matlab signal analysis procedures. Signals were
detrended and a von Hann window (17) applied. A discrete Fourier transform was used
that needed no interpolation or zero padding. Triangular spectral smoothing was set at a
width of 10 for this study, in view of the 10 min duration of the records. Spectral density,
coherence, pressure–interval transfer gain and phase plots are shown on a computer
screen and in addition a cursor allows manual selection of bands in which coherence and
spectral power are high. An output program lists the resultant data and all the choices
made for later analysis.
Statistics
Histograms of xBRS values per patient file most often conformed to a log-normal
distribution. For log-normally distributed variables, the geometric average is a better
estimate of central tendency than the arithmetic average. To obtain the geometric
94
average, we took the logarithm of the numbers, computed their arithmetic average, and
exponentiated the resultant mean. The numbers were required to be positive or the
logarithm could not be taken. BRS values were positive. Values of xBRS best delay τ
were averaged arithmetically per patient file, as were values for sBRS. In addition, the
distributions of best delay τ per patient file were pooled separately for the lying and
standing positions and compared using the χ2 test (16). Multiple regression was used in
an attempt to correlate xBRS to patient parameters, to explain variability between
patients.
When grouped data were compared, non-parametric statistics were used. To maintain
comparability with the results of the EUROBAVAR study, we present the pooled
arithmetic mean, SD and range. For goodness of fit to a distribution, we used the
Kolmogorov–Smirnov one-sample test. For correlation, we used Spearman rank
correlation. For significance of differences we used the Mann–Whitney U-test or the
Wilcoxon matched pair signed ranks test where appropriate.
Results
Duplicates
The duplicate files were b014 and b015. They gave results identical to their twins (a003
and a008) with our local methods. Identical results were expected, because no manual
selection of data was made and the same algorithms were applied to the same data files.
In the case of the overall statistics, we removed these duplicates, 21 patients and 42
records thus remaining (3).
Distribution types
The Kolmogorov–Smirnov test on xBRS rejected 25 (12 lying and 13 standing) files as
normally distributed (P = 0.05). The same test rejected no lying and one standing
distribution as log-normal. The xBRS distribution for patient a002s was not accepted as
either normal or log-normal. The assumption of log-normal distributions, therefore, was
acceptable in 41 of the 42 cases, and the assumption of normal xBRS distributions per
file must be rejected. For sBRS, similarly, normality was rejected 12 times, accepted 23

95
times and undecided seven times because of a very small number of values. Log-
normality was rejected in no case and undecided eight times. The assumption of log-
normal sBRS distributions per file was the safer one, but the picture was less clear.
For grouped data, neither the normal nor the log-normal distribution hypothesis was
rejected for any method (xBRS, sequential or spectral), and arithmetic averages were
taken.
Table 1
Number of estimates and variance for sequential (sBRS) and cross-correlation (xBRS) baroreflex
sensitivity
Number of estimations Variance
sBRS xBRS sBRSa xBRS
Lying (n = 20) (n = 21) (n = 18) (n = 18)
mean 50 185 83 39
SD 63 84 129 53
range 2–174 18–418 0–545 4–179
Standing (n = 21) (n = 21) (n = 18) (n = 18)
mean 76 214 23 12
SD 78 106 34 17
range 1–279 11–423 1–139 0–71
a Data from patients for whom there was no value for sBRS variance have been removed.
Ability to provide baroreflex sensitivity estimates
The xBRS method provided BRS values for all patient files of both sets (Table 1). The
smallest number of determinations was 11 on patient b010 in the standing position. The
sBRS method did not provide a result for patient a003 in the lying position (note that the
number in the sample for sBRS was 20, not 21); for patients b005 and b010 in the
standing position, only a single sBRS value was obtained; on both records for patient
b004, and for patients b005l and b013l, only two sBRS values were obtained over the
entire 11 min patient record. sBRS produced fewer than 22 determinations for 22 of the
42 patient records, or fewer than two per minute. The number of xBRS estimates was
three times greater on average than for sBRS. The average period of time between xBRS
estimates was 3.0 s; between sBRS estimates it was 7.7 s. A total of 0.2% of xBRS
values were obtained at intervals longer than 60 s, compared with 1.8% of sBRS values,
not including the three patients in whom no or only single estimates were obtained.

96
Excluding both patients with impaired baroreflexes, xBRS provided 20 values per
minute, sBRS just six. With the spectral methods, occasionally, we had to accept bands
without significant coherence.
Table 2
Baroreflex sensitivity assessed by various methods
EUROBAVAR Local
sequential
spectral-
LF
spectral-
HF sBRS TG-LF TG-HF xBRS
Lying (n = 6a) (n = 6a) (n = 4a) (n = 20) (n = 21) (n = 21) (n = 21)
mean 16.2 11.2 16.9 13.4 9.5 14.6 12.4
SD 9.8 10.7 12.3 12.1
range 2.1-46 0.2-51 1.5-54 2.0-60
Standing (n = 20a) (n = 21) (n = 21) (n = 21) (n = 21)
mean 6.7 6.8 5.2 5.9 6.2
SD 3.9 3.8 4.3 3.9
range 1.2–15.7 0.1–14.7 0.4–16.6 0.8–16.3
Ratio L/S (n = 6a) (n = 6a) (n = 4a) (n = 20) (n = 21) (n = 21) (n = 21)
mean 2.10 1.70 2.63 2.01 1.87 2.68 1.96
SD 0.97 1.02 1.43 0.92
range 0.80–4.54 0.70–3.82 0.85–6.31 0.85–4.20
LF, HF, Low- and high-frequency; sBRS, sequential baroreflex sensitivity; TG, spectral transfer gain; xBRS,
cross-correlation baroreflex sensitivity. n, Number of patients having at least one BRS estimate, or a number of
procedures of that type returned by participating centres. EUROBAVAR pools the estimates obtained with the
various techniques for the standing position because they differed little. Values for SD and range are between
patients.
Lying and standing baroreflex sensitivity values
Table 2 provides a comparison between the EUROBAVAR results averaged over the
various centres and techniques, results from our local sequential and spectral techniques,
and those from the new xBRS method. Values for the lying and standing positions and
their ratio (which is also considered an important statistic) are listed separately. Note that
the number in the sample is 20 for sBRS in the lying position, because no value was
obtained for patient record a003l. There was a clear difference between results for lying
and standing, with lying values for baroreflex sensitivity approximately two times
greater than standing values for all techniques. The SD and range for the local
techniques are for the group of 21 patients. The greater value for xBRS SD in the lying

97
position is accounted for by patient b013l, treated separately below (Outlier patient). The
differences between the xBRS and sBRS methods were small and not significant (U-
test), and rank correlation at 0.95 (Spearman) was highly significant (P < 0.0001).
Within-patient variance in baroreflex sensitivity
The within-patient stability of BRS values was analysed by computing the variance (SD
squared) for each method. In three cases, no sBRS variance was available because no, or
only a single, BRS value was obtained; the results from these patients were removed
from the averages of both methods. Table 1 gives the variances. For xBRS, the average
variance per patient file and position was approximately 50% of that for sBRS. The
variance ratio became 2.2 when the lying and standing data for each method were
combined. All differences were significant (Wilcoxon at P = 0.0001).
The coefficient of variation (SD in % of the mean per patient record) was on average
41% for xBRS (range 19–62%) and 52% for sBRS (range 3–96%); in both cases it was
nearly proportional to the BRS – that is, large and small values of sensitivity had
approximately the same percentage scatter.
Ability to detect baroreflex impairment
The smallest BRS values were obtained for patients b005 and b010 in both positions,
with lying values greater than those for standing (Table 3). The value was also small in
the case of patient a005, but only for the standing position. In these patients, xBRS
yielded values similar to those from sBRS, but the xBRS method gave more values per
patient file.
Table 3
Sequential (sBRS) and cross-correlation (xBRS) baroreflex sensitivity in patients with impaired
baroreflex
sBRS xBRS
File Value n Value n
b005s 1.2 1 0.8 ± 0.3 46
b005l 2.1 ± 0.6 2 2.3 ± 0.8 82
b010s 2.5 1 1.3 ± 0.4 11
b010l 2.2 ± 0.7 3 2.0 ± 1.8 18
Values are mean ± SD. n, Number of values obtained per record. Note that the number of sBRS estimates was
so small that it was not always possible to establish a value for SD.

98
Figure 2 shows a plot of systolic pressure and interbeat interval of the patient who had
recently received a heart transplant. There was a gradual down-drift of the interval,
possibly as a result of increases in circulating (nor)adrenaline after standing up. The
interval oscillations looked like noise; enlarged, they were almost sinusoidal in the
rhythm of ventilation at one oscillation per 3 or 4 s, and the enlarged systolic oscillations
seemed to be synchronous. Thus the xBRS algorithm produced an occasional value, and
so did sBRS, even though fluctuations probably had a non-baroreflex origin (18).
Figure 2
Recording in the heart transplant patient in the standing position. Upper trace: systolic blood pressure (SYS,
mmHg); lower trace: interbeat interval (IBI, ms). Sequential baroreflex sensitivity (∆, ms/mmHg), cross-
correlation baroreflex sensitivity (x, ms/mmHg), and xBRS cluster (s 066 si elacs emit lluf ehT .dekram era (
(11 min). An sBRS value occurs near t = 40 s reading 2.5 ms/mmHg; xBRS is 1.31 ms/mmHg (SD 0.4
ms/mmHg) averaged over 11 estimates. To show details of variability, the period marked by a thick bar on the
time axis between 450 and 490 s is also shown enlarged: x 4.4 with respect to the time, x 4 with respect to the
IBI and x 2 with respect to the pressure.
Outlier patient
In the (b) set files there was one patient (b013) with a very high value for xBRS in the
lying position: 59.7 ms/mmHg (SD 13.3 ms/mmHg). The sBRS value was 45.5
ms/mmHg, the spectral low-frequency transfer gain value 51.2 ms/mmHg and the
spectral high-frequency transfer gain value 54.0 ms/mmHg. For the standing position,
values were more normal. Figure 3 shows 20 s (two windows wide) sections of the
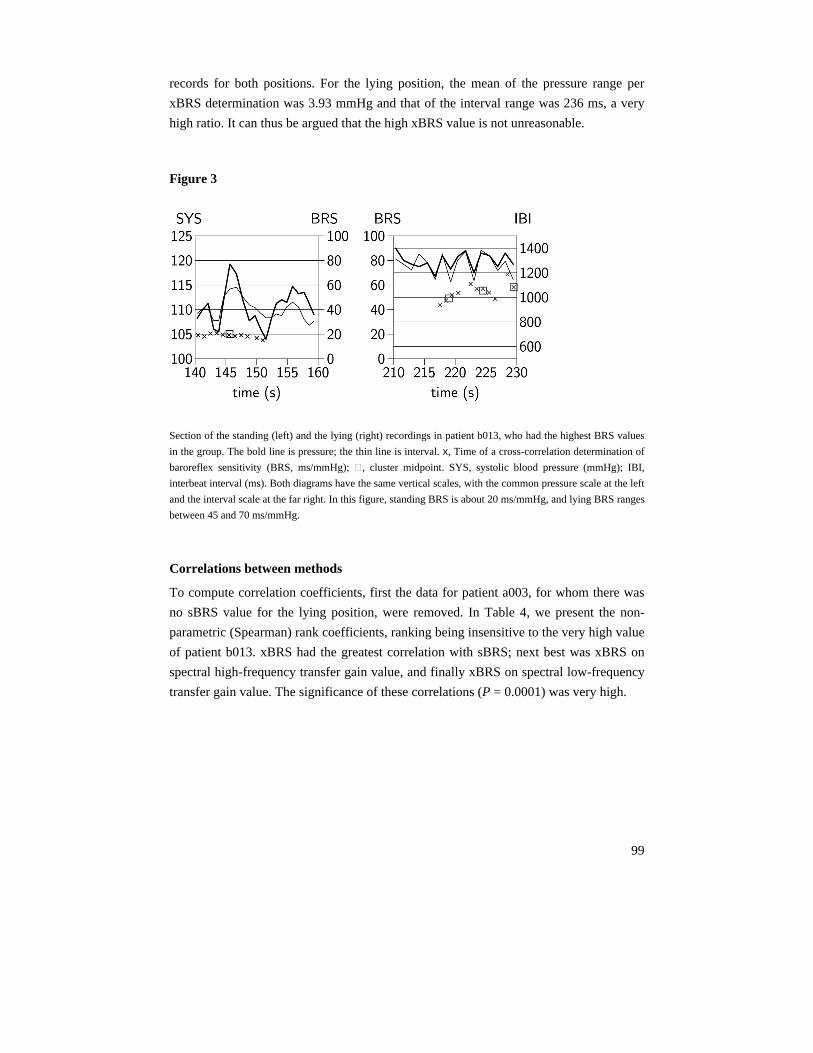
99
records for both positions. For the lying position, the mean of the pressure range per
xBRS determination was 3.93 mmHg and that of the interval range was 236 ms, a very
high ratio. It can thus be argued that the high xBRS value is not unreasonable.
Figure 3
Section of the standing (left) and the lying (right) recordings in patient b013, who had the highest BRS values
in the group. The bold line is pressure; the thin line is interval. x, Time of a cross-correlation determination of
baroreflex sensitivity (BRS, ms/mmHg); ,IBI ;(gHmm) erusserp doolb cilotsys ,SYS .tniopdim retsulc ,
interbeat interval (ms). Both diagrams have the same vertical scales, with the common pressure scale at the left
and the interval scale at the far right. In this figure, standing BRS is about 20 ms/mmHg, and lying BRS ranges
between 45 and 70 ms/mmHg.
Correlations between methods
To compute correlation coefficients, first the data for patient a003, for whom there was
no sBRS value for the lying position, were removed. In Table 4, we present the non-
parametric (Spearman) rank coefficients, ranking being insensitive to the very high value
of patient b013. xBRS had the greatest correlation with sBRS; next best was xBRS on
spectral high-frequency transfer gain value, and finally xBRS on spectral low-frequency
transfer gain value. The significance of these correlations (P = 0.0001) was very high.

100
Table 4
Spearman rank correlation between local methods of estimating baroreflex sensitivity
Lying sBRS TG-LF TG-HF
TG-LF 0.783***
TG-HF 0.912*** 0.689
xBRS 0.931*** 0.808*** 0.901***
Standing
TG-LF 0.442
TG-HF 0.916*** 0.442
xBRS 0.884*** 0.697 0.853***
Combined
TG-LF 0.711***
TG-HF 0.938*** 0.598***
xBRS 0.943*** 0.764*** 0.903***
sBRS, sequential and baroreflex sensitivity; TG-LF, TG-HF, low- and high-frequency spectral transfer gains;
xBRS, cross-correlation baroreflex sensitivity. All correlations are significant at P < 0.05; ***significant at P <
0.0001.
Correlations and differences between lying and standing results
The coefficient of determination R2 (Table 5) was the same for both positions, implying
that lying and standing xBRS were determined with the same precision, even though the
pressure and interval ranges differed according to position. xBRS values (Table 2) were
correlated at P = 0.0004, meaning that a patient with a high or low sensitivity in the
standing position has a high or low sensitivity when lying down. Best delay τ was
similarly correlated at P = 0.0002, meaning that a patient with a short or long delay in
the standing position had a short or long delay when lying down. The paired difference
for xBRS (lying – standing) was 6.14 ms/mmHg (SD 9.3 ms/mmHg) and was significant
(P = 0.0001). The paired difference for τ (lying – standing) was –102 ms and was not
significant.
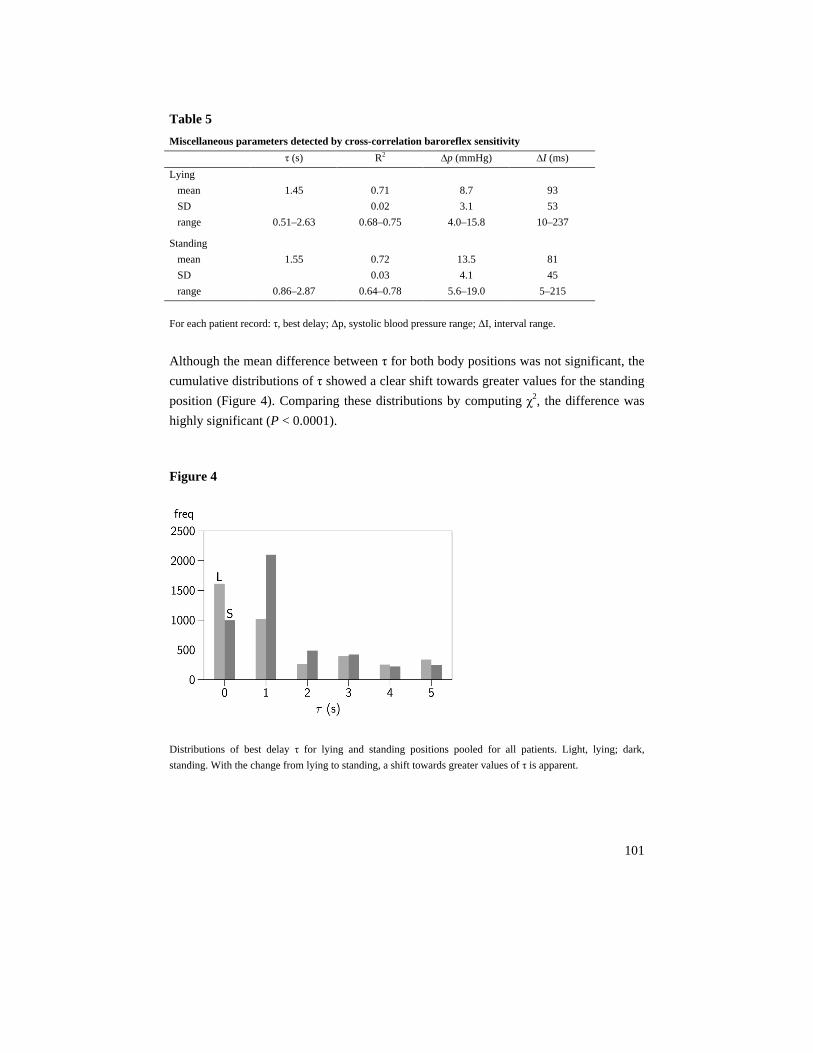
101
Table 5
Miscellaneous parameters detected by cross-correlation baroreflex sensitivity
τ (s) R2 ∆p (mmHg) ∆I (ms)
Lying
mean 1.45 0.71 8.7 93
SD 0.02 3.1 53
range 0.51–2.63 0.68–0.75 4.0–15.8 10–237
Standing
mean 1.55 0.72 13.5 81
SD 0.03 4.1 45
range 0.86–2.87 0.64–0.78 5.6–19.0 5–215
For each patient record: τ, best delay; ∆p, systolic blood pressure range; ∆I, interval range.
Although the mean difference between τ for both body positions was not significant, the
cumulative distributions of τ showed a clear shift towards greater values for the standing
position (Figure 4). Comparing these distributions by computing χ2, the difference was
highly significant (P < 0.0001).
Figure 4
Distributions of best delay τ for lying and standing positions pooled for all patients. Light, lying; dark,
standing. With the change from lying to standing, a shift towards greater values of τ is apparent.

102
Regression of cross-correlation baroreflex sensitivity upon interval, delay and age
The between-patient SD for xBRS in the lying position was almost as great as the mean;
for the standing position it was about two-thirds of the mean (Table 2). Was this just
estimation error or was it patient specific? It appeared that 73% of the scatter in xBRS
values between patients and positions could be explained for by variations in interval,
delay and patient age. The multiple regressions of xBRS on these parameters were:
x = –18.2 + 0 0616I – 4.82τ + 0.431A (lying)
x = –7.8 + 0 0299I – 1.56τ + 0.158A (standing)
x = –14.1 + 0 0509I – 3.77τ + 0.323A (combined)
where x is the xBRS geometric mean value per patient, I is the mean interval, τ is best
delay and A is patient age. Regressions on pressure were not significant. The regression
on τ and the strong lying–standing correlation (see paragraph above) suggest that best
delay τ with the xBRS method was more than simply a methodological parameter with
which to obtain greatest correlation, but also had physiological significance. Clearly and
significantly, xBRS decreased with shorter interbeat interval (greater heart rate), with
longer delay and with greater patient age.
Figure 5
Scatter plot of cross-correlation baroreflex sensitivity (xBRS, ms/mmHg) against the three local BRS
estimates. x, Lying position; refsnart lartceps ycneuqerf-hgih dna -wol ,FH-GT ,FL-GT ;seulav gnidnats ,
gains (ms/mmHg). The line of identity is drawn in each plot.

103
Scatter plots
With xBRS plotted against the three other local results (Figure 5) the scattergrams
appeared to be similar, but they differed in detail. For the lying position, xBRS tended
towards lower values than sBRS and spectral high-frequency transfer gain. The plot of
xBRS against low-frequency transfer gain had a wider scatter in the lower range of
values than that of xBRS against the other methods.
Discussion This study has shown that the xBRS method produced results comparable to those
achieved with pre-existing time-domain and spectral methods (3). On average, xBRS
determinations of baroreflex sensitivity were approximately equally close to those
obtained with sBRS and with local spectral low-frequency and high-frequency transfer
gain. The number of determinations per minute of time was high for all patients except
the one who had a recent heart transplant. xBRS was sensitive to fluctuations in the low-
frequency and high-frequency bands. This is shown clearly in Figure 3, which shows
values for 10 s rhythm (left panel) and ventilatory frequency fluctuations (right panel)
corresponding roughly to their low-frequency transfer gain and high-frequency transfer
gain values. xBRS values were highly significantly correlated between the lying and
standing positions within patients, and more than 70% of the variance between patients
was explained by interbeat interval, best delay τ and patient age.
With clinical interest in baroreflex sensitivity mounting, it is important to have reliable,
simple to use, well researched methods for BRS computation. The time-honoured
sequential method (8) is such a method giving accurate results (19). The cross-
correlation method proposed in this study gave smaller within-patient scatter and a
greater number of values per minute than the sBRS method. It removed uncertainty as to
the number of beats of interval delay that should be implemented in common sequential
methods by computing regression for all reasonable delays. Thresholds were avoided, to
improve frequency of detection in patients with impaired baroreflexes. Nevertheless, the
method provided results comparable to and correlated with those obtained with
sequential BRS in the EUROBAVAR data set. The effects of algorithmic differences
between the sBRS and xBRS methods are that:

104
(1) within-patient variance is reduced using a fixed 10 s wide window, which allows
computation of complete oscillations, not just their slopes;
(2) improved correlation and increased number of detections follow from a search for
greatest cross-correlation by varying the time delay between pressure and interval;
(3) application to young and old patients, in the supine, standing or head-up tilted
position, or under any other influence that may alter the delay between pressure and
interval, is possible by the automatic selection of best delay τ;
(4) a better estimator of central tendency on the within-patient log-normally distributed
values is provided by geometric averaging, which is traditionally not used with the
common sequential techniques;
(5) detection reliability is increased by a low P value (P = 0.01, compared with P =
0.05 for most sequential implementations);
(6) determination of BRS in patients with low baroreflex sensitivity is facilitated by the
absence of thresholds for pressure and interval variation (range).
Time-domain sequential BRS methods can pinpoint the instant of activity of the
baroreflex better than frequency domain methods, but only when a large number of
determinations is available. The xBRS method, on average, produced three times as
many values as our implementation of the sequential method, sBRS, and the
determinations were more uniformly distributed over time. The advantage of a high
number of determinations per minute is evident when a statistically reliable BRS
estimate is to be obtained in a stationary patient in the smallest possible period of time. It
is also obvious when tracking changes in BRS in non-stationary patients, for example
during tilt and mental or physical exercise procedures. When patients are monitored in
the supine position, the low number of sBRS determinations (fewer than two per minute
in 12 of the 21 patients) in the EUROBAVAR data set seems problematic. xBRS had such
a low frequency of determination only in the heart transplant patient.
As was shown by Laude et al. (3) in their Figure 1, common sequential determinations
seemed to have greater difficulty than spectral techniques in providing (the low) values
in the two autonomically impaired patients. The six centres that returned sequential data
had estimates for only 14 of the 24 patients. xBRS produced the low values reliably in
both cases and both body positions. One could argue that the failure to provide data in
these cases of low to zero BRS is actually correct, as we know that a baroreflex is absent
or ineffective. Leaving an observer with no data, however, could have other
implications. For example, in patients under atropine, the vagal reflex is suppressed but a

105
sympathetic reflex may still be present. This reflex has a longer delay and for that reason
may be overlooked by the common fixed-delay sequential technique, whereas an
algorithm that searches for best delay might provide useful data values, as do spectral
methods that compute rather than assume the phase shift between pressure and interval
and therefore are also successful in such difficult cases.
The scatter in the values of individual BRS determinations with both time-domain
methods was substantial and is puzzling. Within-patient variance for xBRS is 50% that
of sBRS, a statistically significant improvement. Is it likely that, with improved
methodology, the scatter would be reduced to zero? Probably not. The present scatter
was proportional to baroreflex sensitivity and proportionality was closer for xBRS,
which had lower within-patient variance. This suggests a physiological cause for part of
the within-patient scatter. Blood pressure and R–R interval variability are known to
show ‘one-over-f ’ behaviour – that is, spectral intensity increases with decreasing
frequency (20). It is thus not surprising that BRS was not constant even in stationary
patients, and it is questionable whether averaging over progressively longer periods
would provide a true value of BRS. A certain amount of scatter observed in BRS values,
in addition to variability caused by mental and physical exercise, day–night difference,
and body position change, should be regarded as an essential aspect of baroreflex blood
pressure control.
Best delay τ varies per determination within a patient record and its mean value per
patient differs between patients. For the lying position, delays of 0 s occur most
frequently, whereas for the standing position a 1 s delay occurs most often (Figure 4).
This finding casts doubt on any fixed delay of 0 or 1 beat in common sequential BRS
methods, and supports the findings of Steptoe and Vögele (14). The automatic selection
of a best delay removes an uncertainty of those sequential methods that have a fixed 0 or
1 beat delay that may be less suitable in certain patient conditions.
Frequency-domain methods distinguish between low-frequency (partly sympathetic) and
high-frequency (vagal) baroreflex activity, whereas time-domain methods would require
a filter stage preceding the BRS computation to achieve the same distinction. A
limitation of the xBRS method in its present form is that it does not discriminate
between oscillations in ventilatory and 10 s rhythm bands. In a recent review (21),
Eckberg concluded that ventilatory pressure and interval variability had little to do with
baroreflex action, because there is a common cause: the human respiratory gate. This
limitation might not be too serious in practice if it is argued that respiratory gating

106
suppresses the baroreflex to a degree depending on ventilatory rate, and is therefore
responsible for the lower BRS values found in exercise. BRS determinations on
spontaneous fluctuations are, indeed, highly correlated between both spectral bands and
between spectral and time-domain estimates, and produce similar values. However, there
is no guarantee that such correlation and similarity would be maintained under all
circumstances met clinically.
In conclusion, the proposed time-domain, cross-correlation computation of BRS (xBRS)
yielded values for BRS to spontaneous systolic pressure and interval variability that were
close to those achieved with earlier methods, including those for the lying to standing
ratio. The values tended to show less scatter within patients compared with those
obtained from the sequential method. xBRS is able to deal with situations in which
changes in interval lag behind pressure changes – in the elderly, at high heart rates, or
when the baroreflex tends towards sympathetic – because it searches for best delay.
Statistically unbiased estimates of central tendency on the log-normal distributions of
xBRS values result from geometric averaging. Time resolution is good, with 20 xBRS
determinations per minute on average. In autonomically impaired patients with low
interval variability and thus baroreflex sensitivity, the absence of thresholds for pressure
and interval changes is probably responsible for the ability of the method to provide
acceptable results.
Disclosures
BE Westerhof was in part supported by a research grant of FMS The Netherlands for this investigation.
J Gisolf was supported by a grant from Space Research Organization Netherlands (SRON), Project MG-052.

107
References
1. Katsube Y, Saro H, Naka M, Kim BH, Kinoshita N, Hori M. Decreased baroreflex sensitivity
in patients with stable coronary artery disease is correlated with the severity of coronary
narrowing. Am J Cardiol 1996;78:1007–1010.
2. La Rovere MT, Specchia G, Mortara A, Schwartz PJ. Baroreflex sensitivity, clinical
correlates, and cardiovascular mortality among patients with a first myocardial infarction. A
prospective study. Circulation 1988; 78:816–824.
3. Laude D, Elghozi JL, Girard A, Bellard E, Bouhaddi M, Castiglioni P, Cerutti C, Cividjian A,
Di Rienzo M, Fortrat JO, Janssen B, Karemaker JM, Leftheriotis G, Parati G, Persson PB,
Porta A, Quintin L, Regnard J, Rudiger H, Stauss HM. Comparison of various techniques
used to estimate spontaneous baroreflex sensitivity (the EUROBAVAR study). Am J Physiol
Regul Integr Comp Physiol 2004; 286:R226–R231.
4. Smyth HS, Sleight P, Pickering GW. Reflex regulation of arterial pressure during sleep in
man. A quantitative method of assessing baroreflex sensitivity. Circ Res 1969; 24:109–121.
5. Eckberg DL, Abboud FM, Mark AL. Modulation of carotid baroreflex responsiveness in
man: effects of posture and propranolol. J Appl Physiol 1976; 41:383–387.
6. Goedhard WJA, Wesseling KH, Settels JJ. Baroreflex pressure control responding to
orthostasis changes with age. In: Orlebeke JF, Mulder G, van Doornen LJP (editors):
Psychophysiology of cardiovascular control. New York: Plenum; 1985, pp. 191–202.
7. Youde J, Panerai RB, Gillies C, Potter JF. Continuous baroreceptor measurement during tilt
in healthy elderly subjects. Clin Auton Res 2002;12:379–384.
8. Di Rienzo M, Bertinieri G, Mancia G, Pedotti A. A new method for evaluating the baroreflex
role by a joint pattern analysis of pulse interval and systolic blood pressure series. Med Biol
Eng Comput 1985; 23 (Suppl 1): 313–314.
9. De Boer RW, Karemaker JM, Strackee J. Hemodynamic fluctuations and baroreflex
sensitivity in humans: a beat-to-beat model. Am J Physiol Heart Circ Physiol 1987;
253:H680–H689.
10. Bertinieri G, Di Rienzo M, Cavallazzi A, Ferrari AU, Pedotti A, Mancia G. Evaluation of
baroreceptor reflex by blood pressure monitoring in unanesthetized cats. Am J Physiol Heart
Circ Physiol 1988; 254:H377–H383.
11. Robbe HW, Mulder LJ, Ruddel H, Langewitz WA, Veldman JB, Mulder G. Assessment of
baroreceptor reflex sensitivity by means of spectral analysis. Hypertension 1987; 10:538–543.
12. Gerritsen J, Ten Voorde BJ, Dekker JM, Kostense PJ, Bouter LM, Heethaar RM. Baroreflex
sensitivity in the elderly: influence of age, breathing and spectral methods. Clin Sci 2000;
99:371–381.
13. Karemaker JM. Vagal effects of the baroreflex on heart rate [PhD thesis]. Amsterdam:
University of Amsterdam; 1980.

108
14. Steptoe A, Vögele C. Cardiac baroreflex function during postural change assessed using non-
invasive spontaneous sequence analysis in young men. Cardiovasc Res 1990; 24:627–632.
15. Borst C, Karemaker JM. Time delays in the human baroreceptor reflex. J Autonom Nerv Syst
1983; 9:399–409.
16. Snedecor GW, Cochran WG. Statistical methods. 6th ed. Ames, Iowa: The Iowa State
University Press; 1967.
17. Hamming RW. Digital filters. New York: Prentice-Hall; 1977.
18. Bernardi L, Valenti C, Wdowczyck-Szulc J, Frey AW, Rinaldi M, Spadacini G, Passino C,
Martinelli L, Vigano M, Finardi G. Influence of type of surgery on the occurrence of
parasympathetic reinnervation after cardiac transplantation. Circulation 1998;97:1368–1374.
19. Parlow J, Viale J-P, Annat G, Hughson R, Quintin L. Spontaneous cardiac baroreflex in
humans; comparison with drug-induced responses. Hypertension 1995;25:1058–1068.
20. Castiglioni P, Parati G, Omboni S, Mancia G, Imholz BPM, Wesseling KH, Di Rienzo M.
Broad-band spectral analysis of 24 h continuous finger blood pressure: comparison with
intraarterial recordings. Clin Sci 1999;97:129–139.
21. Eckberg DL. The human respiratory gate. J Physiol 2003; 548:339–352.

109
Chapter 7
Dynamics of baroreflex sensitivity during
postural stress
BE Westerhof1, J Gisolf2, JM Karemaker2, KH Wesseling1,
NH Secher3, JJ van Lieshout4
Information on human cardiovascular function can be obtained from oscillations in
arterial pressure and R–R intervals. These oscillations and their relationships can be
studied by a physiological perturbation like postural stress that profoundly affects
autonomic neural outflow (9). Postural circulatory stress elicits baroreflex unloading
leading to reduced parasympathetic and increased sympathetic outflow to the sinus node
and an increase in sympathetic vasomotor outflow and total peripheral resistance to
maintain blood pressure. The cardiac baroreflex (BRS) can be quantified by time domain
sequential methods (1,7) and frequency domain analysis (5,29). Algorithms based on
spectral analysis generally require steady state and an observation window of preferably
several minutes unless sophisticated methodologies are applied (19). Time domain
sequential algorithms require not more than a few heartbeats to obtain BRS. A possible
disadvantage is that only a small number of values becomes available per minute and
with such methods a transient within that time frame might not be well described.
1 BMEYE, Amsterdam, The Netherlands
2 Dept of Physiology, Academic Medical Center, University of Amsterdam The Netherlands
3 Dept of Anesthesia, Rigshospitalet, University of Copenhagen, Denmark.
4 Dept of Internal Medicine, Academic Medical Center, University of Amsterdam The Netherlands

110
Recently (35) the response to head up tilt was investigated with a time domain method.
The method, however, gave sparse results, requiring fitting of Legendre functions to
outline the response. A new sequential BRS method (34,13,14) requires only a 10 sec
window and generates values at a much higher rate than earlier methods, close to one
value per two seconds. Additionally, the method provides information about the delay
between changes in systolic blood pressure (SBP) and interbeat interval (IBI), called τ.
Earlier we found that BRS decreases from the supine to the standing position and that τ
increases (34).
Figure 1
30° 70° 90°0°–20°
360 360 720 360 720 360 720 360
Time (s)
720
50
100
150
50
100
1
2
10
20
30
Pre
ssu
re(m
mH
g)
HR
(BP
M)
TP
R(M
U)
xB
RS
(ms/m
mH
g)
0
Hemodynamic data: systolic, mean and diastolic blood pressure, heart rate (HR), total peripheral resistance
(TPR) and xBRS. Moving averages with 12 s window.

111
Considering that during passive head-up tilt muscle sympathetic nerve activity increases
linearly with the sine of the tilt angle, reflecting the body axis component of gravity
(9,16), we determined time- and frequency domain BRS function during graded
progressive orthostatic stress. Orthostatic stress was expressed as sin(α), in which α
corresponds to the angle of body position, representing the vertical component of the
fluid column on which the gravitational forces are exerted. α was increased stepwise
from –20º to 90º. We traced the alterations in BRS and analyzed the dynamic changes in
distribution of the time-domain determined IBI to SBP delay τ. The hypothesis tested
was that with increasing postural stress, BRS becomes attenuated by a reduction in its
vagal component with a shift in τ towards higher values, corresponding with a shift to
increased sympathetic efferent stimulation.
Methods
We studied ten healthy volunteers (22-39 yr, 9 males). They were non-smokers, had
normal physical fitness without sports training, had no history of orthostatic fainting and
used no medication. Informed consent had been obtained from all participants and the
study was approved by the ethics committee of Copenhagen (KF01-120/96) and
performed in accordance with the guidelines laid down in the Declaration of Helsinki.
After instrumentation the subjects rested in the 0º position for 30 min. Participants were
subjected to a standing (90º) and tilt protocol including 20 degrees head-down tilt (–20º)
and 30 and 70 degrees head-up tilt (30º and 70º) preceded and followed by a period of
supine rest (0º). The –20º, 30º and 90º lasted 10 min, 70º lasted 60 min but was
interrupted earlier when presyncopal symptoms and signs occurred, or at the request of
the test subject. A period of at least 6 min 70º was recorded in all cases.

112
Figure 2
360 720
10
20
30
40
50
360 720
10
20
30
40
50
360 720
10
20
30
40
50
360 720
10
20
30
40
50
360 720
10
20
30
40
50
360 720
10
20
30
40
50
360 720
10
20
30
40
50
xB
RS
(ms/m
mH
g)
time (s) time (s)
xB
RS
(ms/m
mH
g)
xB
RS
(ms/m
mH
g)
xB
RS
(ms/m
mH
g)
0°
0°
0°
0°
0°
0°
0°
30° 30°
–20°
70° 70°
90° 90°
xBRS baroreflex sensitivity results of one participant. Each dot represents a BRS result. Drawn horizontal lines
represent period averages. Geometric running averages trace the transients. Note the overshoot in BRS after
tilt-back from 70º and in 0º position after 90º.

113
Instrumentation and data processing
Noninvasive finger pressure was recorded with a TNO Finapres Model 5 and sampled at
100 Hz. The TNO Beatfast software was used to reconstruct brachial pressure form
finger pressure (3,15,33) and to determine beat-to-beat parameters. Interbeat interval,
systolic, diastolic and mean arterial pressure were analyzed as well as parameters
determined from arterial pressure using a model (17,32) which calculates stroke volume,
cardiac output and total peripheral resistance (Figure 1). Systolic blood pressure (SBP)
and interbeat interval (IBI) were used for subsequent analysis with baroreflex sensitivity
software (34,13,14).
Period selection
Sections of 6 min before and 6 min after each change in α were selected for analysis.
Starting from –20º, this resulted in 7 transients (Figure 2). Periods before and after tilt
were compared to determine the difference in BRS and τ distribution. To quantify the
dynamic BRS response to a change in tilt angle, the 6 min periods following a transient
were subdivided in 120 s sections for statistical evaluation. Running averages were
calculated using a 120 s window for plotting.
BRS was related to –20º and 0º (Figure 2, top right panel) and to 30º, 70º and 90º using
periods following an increase in α (Figure 2, left panels). Periods immediately following
an increase in α were used as opposed to the periods just prior to a decrease, to exclude
the effects of fainting.
Fainters and non-fainters
Three of the ten participants experienced presyncopal symptoms or requested to be tilted
back during the 70º period as well as during the 90º period. BRS, τ distribution and
hemodynamic parameters of these three fainters were compared to the non-fainters.

114
Figure 3
360 720
10
20
30
40
50
360 720
10
20
30
40
50
360 720
10
20
30
40
50
360 720
10
20
30
40
50
360 720
10
20
30
40
50
360 720
10
20
30
40
50
360 720
10
20
30
40
50
xB
RS
(ms/m
mH
g)
time (s) time (s)
xB
RS
(ms/m
mH
g)
xB
RS
(ms/m
mH
g)
xB
RS
(ms/m
mH
g)
0°
0°
0°
0°
0°
0°
0°
30° 30°
–20°
70° 70°
90° 90°
Running averages of xBRS baroreflex sensitivity results of all participants and group average (heavy line).
115
Baroreflex sensitivity
For time-domain analysis of BRS the cross-correlation method was used (34,13,14).
Beat-to-beat SBP and IBI data are fitted with cubic spline functions and resampled at 1 s
intervals. The cross-correlation between ten-second series of SBP and IBI samples are
computed for delays τ in IBI of 0 to 5 s. The combination with the τ giving the highest
cross-correlation is selected if significant at P = 0.05. The regression slope is recorded as
one xBRS value together with the τ. Subsequently, the process is repeated for series of
SBP and IBI samples 1 s later. Theoretically, one xBRS value can be obtained each
second. This technique produces approximately three times as many BRS values as
existing sequential techniques and with a reduced scatter between subsequent values
(34).
For frequency analysis, beat-to-beat SBP and IBI time series were detrended and
Hanning windowed. Power spectral density and transfer gain of the cross-spectra of SBP
and IBI (5,29) were computed using discrete Fourier transform (6). The ten-second-
rhythm band from 0.06 to 0.15 Hz, called “s10”, and the respiratory band from 0.15 to
0.5 Hz, called “Resp” were selected; transfer gain and phase were computed for
coherence > 0.5.
Statistics
Distributions of xBRS values are best described as log-normal (34); therefore, geometric
averages were used. Within-subject differences were tested with the Mann Whitney u-
test. Differences in BRS and hemodynamic parameters were evaluated for the group by
parametric repeated measures ANOVA. BRS values before and after a change in α were
compared and BRS values representing each α were compared separately to investigate
BRS values as a function of sin(α). Histograms of the distributions of τ were plotted and
compared by the chi2 test after normalizing of data. The number of estimations in the
chi2 test was set to the group average number of estimations for each period.

116
Results
With increasing α, diastolic (76 to 89 mmHg) and mean pressure (96 to 106 mmHg) and
systemic vascular resistance (1.2 to 1.4 mmHg·s/ml) increased (Figure 1), while IBI (1.1
to 0.75 s) and stroke volume (95 to 61 ml) decreased.
Table 1
Effects of axis of body angle αααα on time domain and frequency domain baroreflex sensitivity.
Angle of body axis
–20º 0º 30º 70º 90º
xBRS, ms/mmHg 22.3 ± 5.1 ‡ 18.6 ± 5.0 13.6 ± 5.7 * 8.7 ± 3.7 †‡ 9.2 ± 4.3 †‡
N 168 ± 73 189 ± 52 212 ± 67 269 ± 45 †‡ 272 ± 64 †‡
Gs10, ms/mmHg 18.6 ± 9.7 (5) 17.1 ± 8.6 (8) 10.9 ± 4.5 (8) 7.5 ± 3.1 (10) * 7.6 ± 2.9 (9) *
Gresp, ms/mmHg 28.1 ± 10.9 (6) 24.3 ± 14.3 (10) 18.6 ± 9.6 (8) 7.8 ± 6.2 (6) * 9.6 ± 6.0 (6)
Ps10, degrees – 60 ± 38 (5) – 42 ± 16 (8) – 49 ± 15 (8) – 51 ± 11 (10) – 47 ± 11 (9)
Presp, degrees – 22 ± 22 (6) – 6 ± 35 (10) – 31 ± 26 (8) – 46 ± 36 (6) – 47 ± 35 (6)
Values are means ± SD; xBRS, cross-correlation baroreflex sensitivity; N, number of xBRS results; Gs10,
transfer gain in the 10s band; Gresp, transfer gain in the respiratory band; Ps10, transfer phase in the 10s band;
Presp, transfer phase in the respiratory band. Between brackets (n) the number of results available from spectral
analysis. * P < 0.05 vs. 0º; † P < 0.001 vs. 0º; ‡ P < 0.05 vs. 30º
Time domain
xBRS during transients in α is given in Figures 2 and 3. In one case tilt back from 70º
was not available in the data, in another case the transient from 90º to 0º was not
available. For the total of 68 tilt transients, in 63 cases (93%) BRS had altered in the 6
min following a change in α and this difference was present in 78% after 1 min and in
85% after 2 min. BRS was significantly different between the 30º, 70º and 90º in all but
one subjects. BRS at –20º was not significantly different from 0º, and at 70º not different
from 90º. The averaged values of BRS for each α are given in Table 1. Averaged BRS
related to α (xBRS = –10.1·sin(α) + 18.7; r2 = 0.99, Figure 4).
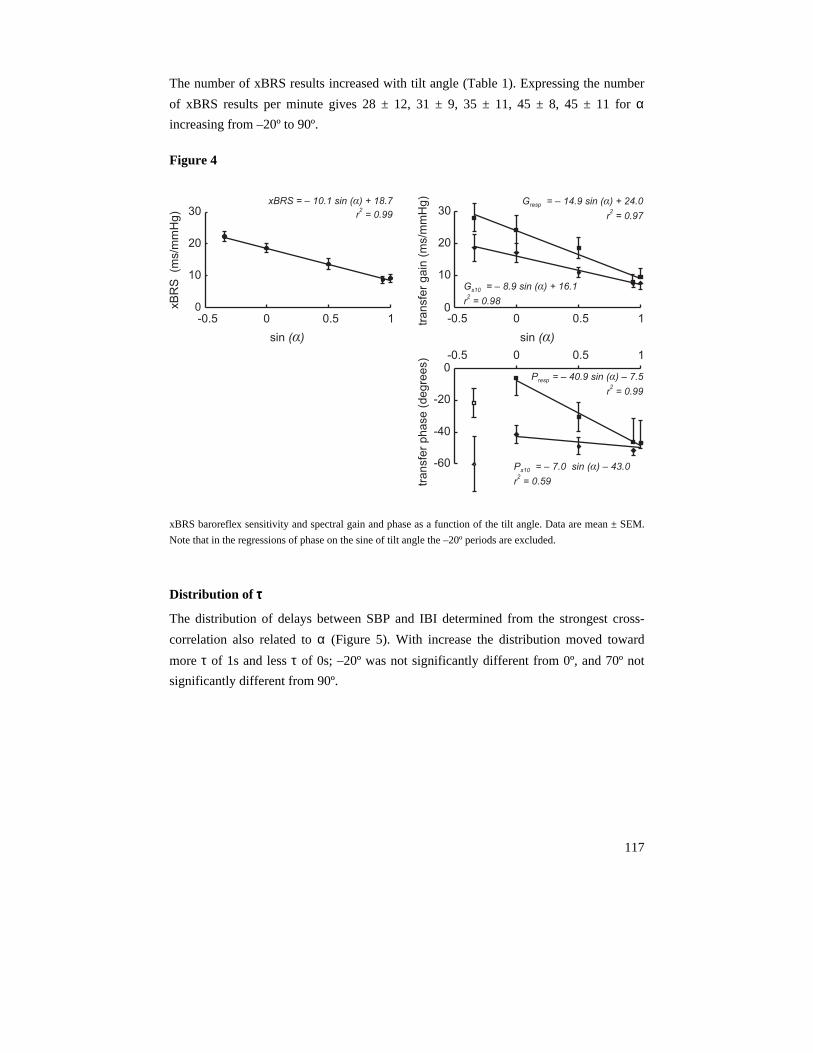
117
The number of xBRS results increased with tilt angle (Table 1). Expressing the number
of xBRS results per minute gives 28 ± 12, 31 ± 9, 35 ± 11, 45 ± 8, 45 ± 11 for α
increasing from –20º to 90º.
Figure 4
0
10
20
30
-0.5 0 0.5 1
xB
RS
(ms/m
mH
g)
xBRS = 10.1 sin ( ) + 18.7
r = 0.99
–2
α
sin ( )α
0
10
20
30
-0.5 0tra
nsfe
rg
ain
(ms/m
mH
g) G = 14.9 sin + 24.0
r = 0.97
resp – ( )α
2
– ( )
r = 0.98
α
2
G = 8.9 sin + 16.1s10
sin ( )α
0.5 1
-60
-40
-20
0
tra
nsfe
rp
ha
se
(de
gre
es)
P = 40.9 sin 7.5
r = 0.99
resp – ( ) –α
2
P = 7.0 sin 43.0
r = 0.59
s10 – –( )α
2
-0.5 0 0.5 1
xBRS baroreflex sensitivity and spectral gain and phase as a function of the tilt angle. Data are mean ± SEM.
Note that in the regressions of phase on the sine of tilt angle the –20º periods are excluded.
Distribution of ττττ
The distribution of delays between SBP and IBI determined from the strongest cross-
correlation also related to α (Figure 5). With increase the distribution moved toward
more τ of 1s and less τ of 0s; –20º was not significantly different from 0º, and 70º not
significantly different from 90º.

118
Figure 5
20
40
1 2 3 4 5
60
0
τ (s)
dis
trib
utio
n(%
)
30°
70°
90°
0°
–20°
Distributions of delays (cubic spline fit). X-axis: delay τ (s) corresponding to the best cross correlation between
blood pressure and interbeat interval variations. Y-axis: the percentage of incidence. In 0º and –20º the 0s τ
dominates while in 30º the 1s τ is more frequent. In 70º and 90º the 1s τ dominates even more.
Frequency domain
Spectral gain and phase for 10 s band and respiratory band are given in Table 1 and in
Figure 4. xBRS and spectral gain were tightly correlated for both the 10s band (Gs10 =
0.88 xBRS – 0.40; r2 = 0.98) and respiratory band (Gresp = 1.48 xBRS – 3.65; r2 = 0.97).
The phase in the respiratory band tended to lower values (P = 0.07) for higher αs,
corresponding to the xBRS determined shift in τ (Figure 5)
Transients
The rate of change in BRS depended on the change in α and was asymmetrical for an
increase vs. a decrease (Figure 3). From 70º to tilt back and from 90º to 0º there was a
BRS overshoot (P < 0.05).
Figure 6 shows the changes in τ distributions vs. response time to an increase in α. At
30º the τ distribution shifted towards a modest dominance of 1s τ. At 70º, 1s τ
progressively increased, while in 90º the 1s τ immediately dominated.

119
Figure 6
40
Dis
trib
utio
n(%
)
20
00
2
4
1
3
5
4 - 6 min
2 - 4 min
0 - 2 min
40
20
00
2
4
1
3
5
4 - 6 min
2 - 4 min
0 - 2 min
Dis
trib
utio
n(%
)
40
20
00
2
4
1
3
5
4 - 6 min
2 - 4 min
0 - 2 min
τ (s)
Dis
trib
utio
n(%
)
τ (s)
τ (s)
30°
70°
90°
Distribution of delay τ over time after the change from 0º to 30º, to 70º and to 90º. In 30º τ of 0s and 1s are
equally distributed, then there is a slight increase of 1s τs. In 70º 1s τ progressively increase. In 90º the
distribution immediately shifts to mainly 1s τ and this situation is maintained throughout the analyzed period.

120
Fainters versus non-fainters
In the frequency domain, gain for fainters versus non-fainters tended to be lower in 70º
(5 ± 4 vs. 9 ± 2, P = 0.08 and 4 ± 1 vs. 12 ± 6, P = 0.08 for Gs10 and Gresp, respectively)
and was comparable for other αs (P > 0.1). In the fainters, during 70º the phase Ps10 was
lower (–62 ± 6 vs. –46 ± 9, P = 0.03) and the phase Presp tended to be lower (–70 ± 29 vs.
–21 ± 24, P = 0.09). xBRS in fainters tended towards lower values (70º: 6 ± 4 vs. 10 ± 3,
P = 0.09, 90º: 6 ± 1 vs. 11 ± 5, P = 0.1). At 70º and 90º the τ distribution in fainters vs.
non-fainters had shifted more to 1s τ (P < 0.05, Figure 7) within 2 min.
Figure 7
1 2 3 4 5
20
40
60
80Fainters
01 2 3 4 5
20
40
60
80Non fainters
0
τ (s)
dis
trib
ution
(%)
30°
70°
90°
0°
–20°
30°
70°
90°
0°
–20°
τ (s) Distribution of delay τ in fainters (right panel) vs. non-fainters (left panel), same axes as in Figure 4, after the
change from 0º to 30º, 0º to 70º and 0º to 90. The fainters have more delays of 1s. Note that the distributions of
–20º and 0º of the fainters is similar to the distribution at 30º of the non-fainters.
Discussion
The main findings of this study were that 1) during gravitational stress the sensitivity of
the cardiac baroreflex obtained from time domain decreases linearly with the sine of the
angle of the vertical body axis, and 2) the dynamic baroreflex adaptation to a
physiological perturbation like postural stress occurs rapidly, i.e. within one minute in
the majority of subjects.

121
The autonomic regulatory systems controlling blood pressure responses to postural stress
include the cardiopulmonary, aortic, and carotid baroreflexes and vestibular inputs. The
posture induced carotid baroreceptor unloading evokes an increase in efferent
sympathetic vasoconstrictor activity as well as parasympathetic withdrawal that leads to
a reduction in interbeat interval. A drop in carotid distending pressure and a change in
pulsatile receptor stretching by the reduced stroke volume are among the proposed
stimuli that together constitute the changing carotid baroreceptor input during a change
in body position (10).
Figure 8
0.2
0.4
0.6
0.8
1.0
5
10
15
20
25
50 100 150 200
pressure (mmHg)
Affere
ntactivity
(a.u
.)
xB
RS
(ms/m
mH
g)
Normalized baroreceptor afferent activity is shown as a function of mean pressure (triangles). An arc tan
function is fitted to the data. The derivative, peaking at 100 mmHg, is a measure of baroreflex sensitivity. The
baroreflex sensitivity curve is fitted to the measured xBRS data (boxes) of Table 1 by assuming that the
distance between baroreceptors and heart level is 25 cm, resulting in a pressure drop of 19 mmHg between 0º
and 90º position.
The derivative of normalized baroreceptor afferent activity (31) represents a measure of
BRS as a function of pressure (Figure 8). As an example, the derivative of baroreceptor
afferent activity provides a satisfactory description the xBRS data (Table 1) with the
xBRS value for –20º set equal to 100 mmHg arterial pressure at the carotid sinus and the
vertical distance to the heart level at 25 cm. Then, in the 0º position, carotid sinus
pressure is 94 mmHg, to reduce to 75 mmHg in the 90º position, assuming mean arterial
pressure at heart level constant and neglecting an influence of the aortic baroreceptors.
This suggestion of graded baroreceptor unloading with an increasing angle of body axis
is not at variance with data presented by Pawelczyk and Raven (27). They found that a
reduction in central venous pressure by lower body negative pressure augmented BRS

122
and concluded that the inhibitory influence of pressure or volume sensitive
cardiopulmonary receptors was removed by central hypovolemia. Of note, in that study
the subjects remained supine and gravitational unloading of the carotid baroreceptors did
not play a role. However, in tilt studies using pulsed neck suction and pressure (11,12)
protocols to determine BRS, no decrease (4) or an increase in the cardiac baroreflex is
found (23), while in studies using sequential BRS methods, a decline in sensitivity in
reaction to tilt is established (18,20,25,30). The discrepancy between the findings with
sequential (1,7) methods, using spontaneous variations in blood pressure and heart rate
on the one hand, and the neck cuff stimulation on the other, has received little attention.
Data from experiments gauging the separate arterial and cardiopulmonary baroreflex
gains suggest that the arterial component remains equivalent during tilt while the
cardiopulmonary contribution decreases (21). Neck suction obviously assesses only the
arterial component and thus would remain equal with tilt, corroborating this finding.
However, these observations challenge the suggestion that the unloading of the carotid
baroreceptors is involved, in which case BRS is expected to be reduced as shown in this
report. During dynamic exercise with increasing workload, BRS as determined statically
by pulsed neck suction and pressure, and dynamically by transfer function gain and time
domain sequence analysis was demonstrated to provide similar information (24). This is
compatible with a movement along the right leg of the baroreflex sensitivity curve
(Figure 8) with increasing mean arterial pressure (24).
The finding that cardiac baroreflex sensitivity decreased linearly with the sine of the
angle of the vertical body axis complements the observation by Iwase et al. (16) that
muscle sympathetic nerve activity increases linearly with the sine of the angle during
passive head-up tilt. The shift towards longer delays between systolic blood pressure and
interbeat interval supports the suggestion that the decrease of BRS is a result of the vagal
withdrawal associated with larger postural stress. The linear relationship between angle
of body axis and cardiac baroreflex as found in this study does not reveal direct
information on its vagal vs. sympathetic constituents.
The distribution of the delay between variations in blood pressure and interbeat interval
may provide additional insight in the performance of the sequential methods for
baroreflex sensitivity assessment. We found that the distribution of delays shifted
towards longer delays with increasing tilt angle. The observed reduction in BP to IBI
delays of 0s suggests acute withdrawal of the fast efferent parasympathetic branch to the
sinus node. Using a different approach to assess cardiac vagal tone in humans, Julu et al.
(18) found a decrease as well.
123
As an opposing view the shift in τ distribution may be interpreted as an effect of
increasing HR. For low HRs the effect of efferent vagal activity on heart rate becomes
apparent within the same beat (2). It was shown that the vagal effect on HR can be
described by 0s delay when IBI is greater than 775 ms (28), or HR lower than 77 BPM.
For higher heart rates the effect of efferent vagal activity becomes apparent only in the
next beat expressed as 1s delay. Thus, at higher heart rates the decrease of 0s delay in
itself is therefore no proof reduced vagal activation. However, with the body axis at 30º
the average interval was 969 ms, corresponding to 62 BPM, allowing to attribute the
shift in the delay distribution to a decrease in vagal tone.
An increase in peripheral resistance during graded tilt up conforms to increased
sympathetic vasomotor tone. Similarly, forearm vascular resistance (4) and muscle
sympathetic nerve activity (25) as indication of sympathetic efferents are found to
increase with tilt. Postural stress is a complex physiological intervention with
baroreceptor unloading that may provoke both parallel and reciprocal changes of vagal
and sympathetic nerve activity (9). Evidently the issue whether sympathetic and vagal
nerve activities change reciprocally remains unsettled as long as knowledge on changing
cardiac vagal neural traffic is lacking. We do consider that tracking of dynamic changes
in BRS together with changes in the distribution of heart rate to blood pressure delays as
obtained from time domain analysis has the potential to reveal information on the vagal
contribution.
In the subjects who presented with presyncopal signs during 70º and 90º the faster and
more pronounced shift towards longer delays with increasing tilt angle was already
apparent in the first two minutes of 70º and 90º, compatible with early sympathetic
activation.
The increasing number of xBRS data with tilt can be explained in several ways. It could
be interpreted as the effect of increased baroreflex effectiveness (8), proposed as a
complimentary measure of baroreflex function, or as less effective suppression of
oscillations due to decreased baroreflex sensitivity with mathematically a larger number
of correlations. The finding that the number of baroreflex results decreased substantially
with the prescribed significance level of the SBP-IBI regression slope of the xBRS
method, but values for baroreflex sensitivity remained unaffected (Table 2), indicates
that the number of results is method-dependent, but baroreflex sensitivity level is not.

124
Table 2
Baroreflex sensitivity and number of results as a function of P value required for the xBRS result to be
accepted.
P – level of the xBRS method
P0.05 P0.01 P0.005 P0.001
xBRS (ms/mmHg) 14.5 ± 4.7 14.9 ± 4.9 15.2 ± 5.2 15.9 ± 7.2
N 222 ± 60 153 ± 65 * 127 ± 64 *† 79 ± 56 *†‡
N/min 37 ± 10 26 ± 11 * 21 ± 11 *† 13 ± 9 *†‡
Values are means ± SD over all tilt angles; xBRS, cross-correlation baroreflex sensitivity; N, number of xBRS
results. * P < 0.001 vs. P0.05; † P < 0.001 vs. P0.01; ‡ P < 0.001 vs. P0.005
In summary, in healthy subjects the sensitivity of the cardiac baroreflex obtained from
time domain decreases linearly with the sine of the angle of the vertical body axis and
the dynamic baroreflex adaptation to a physiological perturbation like postural stress
occurs rapidly. The shift towards longer delays between blood pressure and interbeat
interval variations with increasing body axis angle suggests that the decrease of BRS
with tilt results from reduced vagal activity and increased sympathetic cardiac tone.
Disclosures
BE Westerhof was in part supported by a research grant of FMS The Netherlands for this investigation.
J Gisolf was supported by a grant from Space Research Organization Netherlands (SRON), Project MG-052.

125
References
1. Bertinieri G, Di Rienzo M, Cavallazzi A, Ferrari AU, Pedotti A, and Mancia G. Evaluation of
baroreceptor reflex by blood pressure monitoring in unanesthetized cats. Am J Physiol Heart
Circ Physiol 254: H377–383, 1988.
2. Borst C and Karemaker JM. Time delays in the human baroreceptor reflex. J Autonom Nerv
Sys 9: 399–409, 1983.
3. Bos WJ, van Goudoever J, van Montfrans GA, van den Meiracker AH, and Wesseling KH.
Reconstruction of brachial artery pressure from noninvasive finger pressure measurements.
Circulation 94: 1870–1875, 1996.
4. Cooper VL and Hainsworth R. Effects of head-up tilting on baroreceptor control in subjects
with different tolerances to orthostatic stress. Clin Sci (Lond)103: 221–226, 2002.
5. De Boer RW, Karemaker JM, and Strackee J. On the spectral analysis of blood pressure
variability. Am J Physiol Heart Circ Physiol. 251: H685–H687, 1986.
6. deBoer RW, Karemaker JM, and Strackee J. Hemodynamic fluctuations and baroreflex
sensitivity in humans: a beat-to-beat model. Am J Physiol Heart Circ Physiol. 253: H680–
H689, 1987.
7. Di Rienzo M, Bertinieri G, Mancia G, and Pedotti A. A new method for evaluating the
baroreflex role by a joint pattern analysis of pulse interval and systolic blood pressure series.
Med Biol Eng Comput 23 (Suppl 1): 313–314, 1985.
8. Di Rienzo M, Parati G, Castiglioni P, Tordi R, Mancia G, and Pedotti A. Baroreflex
effectiveness index: an additional measure of baroreflex control of heart rate in daily life. Am
J Physiol Regul Integr Comp Physiol. 280: R744–R751, 2001.
9. Eckberg DL. Sympathovagal balance: a critical appraisal. Circulation 96, 3224–3232, 1997.
10. Eckberg DL and Sleight P. 1992. Human Baroreflexes in Health and Disease. Oxford
University Press, Oxford.
11. Eckberg DL, Cavanaugh MS, Mark AL, and Abboud FM. A simplified neck suction device
for activation of carotid baroreceptors. J Lab Clin Med. 85: 167–173, 1975.
12. Eckberg DL, Abboud FM, and Mark AL. Modulation of carotid baroreflex responsiveness in
man: effects of posture and propranolol. J Appl Physiol. 41: 383–387, 1976.
13. Gisolf J, Westerhof BE, van Dijk N, Wesseling KH, Wieling W, and Karemaker JM.
Sublingual nitroglycerin used in routine tilt testing provokes a cardiac output-mediated
vasovagal response. J Am Coll Cardiol. 44: 588–93, 2004.
14. Gisolf J, Immink RV, van Lieshout JJ, Stok WJ, and Karemaker JM. Orthostatic blood
pressure control before and after spaceflight, determined by time-domain baroreflex method.
J Appl Physiol. 98: 1682–1690, 2005.
15. Gizdulich P, Prentza A, and Wesseling KH. Models of brachial to finger pulse wave
distortion and pressure decrement. Cardiovasc Res 33: 698–705, 1997.

126
16. Iwase S, Mano T, and Saito M. Effects of graded head-up tilt on muscle sympathetic
activities in man. Physiologist 30, S62–63, 1987.
17. Jansen JR, Schreuder JJ, Mulier JP, Smith NT, Settels JJ, and Wesseling KH. A comparison
of cardiac output derived from the arterial pressure wave against thermodilution in cardiac
surgery patients. Br J Anaesth. 87: 212–22, 2001.
18. Julu PO, Cooper VL, Hansen S, and Hainsworth R. Cardiovascular regulation in the period
preceding vasovagal syncope in conscious humans. J Physiol 549: 299–311, 2003.
19. Keselbrener L and Akselrod S. Selective discrete Fourier transform algorithm for time-
frequency analysis: method and application on simulated and cardiovascular signals. IEEE
Trans Biomed Eng 43: 789–802, 1996.
20. Laude D, Elghozi JL, Girard A, Bellard E, Bouhaddi M, Castiglioni P, Cerutti C, Cividjian A,
Di Rienzo M, Fortrat JO, Janssen B, Karemaker JM, Leftheriotis G, Parati G, Persson PB,
Porta A, Quintin L, Regnard J, Rudiger H, and Stauss HM. Comparison of various techniques
used to estimate spontaneous baroreflex sensitivity (the EuroBaVar study). Am J Physiol
Regul Integr Comp 286: R226–R231, 2004.
21. Lucini D, Porta A, Milani O, Baselli G, and Pagani M. Assessment of arterial and
cardiopulmonary baroreflex gains from simultaneous recordings of spontaneous
cardiovascular and respiratory variability. J Hypertens 18: 281–286, 2000.
22. Mallat Z, Vicaut E, Sangare A, Verschueren J, Fontaine G, and Frank R. Prediction of head-
up tilt test result by analysis of early heart rate variations. Circulation 96: 581–584, 1997.
23. Ogoh S, Volianitis S, Nissen P, Wray DW, Secher NH, and Raven PB. Carotid baroreflex
responsiveness to head-up tilt-induced central hypovolaemia: effect of aerobic fitness. J
Physiol 551: 601–608, 2003.
24. Ogoh S, Fisher JP, Dawson EA, White MJ, Secher NH, and Raven PB. Autonomic nervous
system influence on arterial baroreflex control of heart rate during exercise in humans. J
Physiol. 566: 599–611, 2005.
25. O'Leary DD, Kimmerly DS, Cechetto AD, and Shoemaker JK. Differential effect of head-up
tilt on cardiovagal and sympathetic baroreflex sensitivity in humans. Exp Physiol 88: 769–
774, 2003.
26. Parati G, Saul JP, and Castiglioni P. Assessing arterial baroreflex control of heart rate: new
perspectives. J Hypertens. 22: 1259–1263, 2004.
27. Pawelczyk JA and Raven PB. Reductions in central venous pressure improve carotid
baroreflex responses in conscious men. Am J Physiol 257: H1389–H1395, 1989.
28. Pickering TG and Davies J. Estimation of the conduction time of the baroreceptor-cardiac
reflex in man. Cardiovasc Res 7: 213–219, 1973.
29. Robbe HW, Mulder L J, Ruddel H, Langewitz WA, Veldman JB, and Mulder G. Assessment
of baroreceptor reflex sensitivity by means of spectral analysis. Hypertension 10: 538–543,
1987.
30. Steptoe A and Vögele C. Cardiac baroreflex function during postural change assessed using
non-invasive spontaneous sequence analysis in young men. Cardiovasc Res 24: 627-632,
1990.

127
31. Wesseling KH, Settels JJ, Walstra HG, van Esch HJ, and Donders JJ. Baromodulation as the
cause of short term blood pressure variability? In: Applications of Physics to Medicine and
Biology. Singapore: World Scientific, 1983.
32. Wesseling KH, Jansen JR, Settels JJ, and Schreuder JJ. Computation of aortic flow from
pressure in humans using a nonlinear, three-element model. J Appl Physiol. 74: 2566–2573,
1993.
33. Westerhof BE, Guelen I, Parati G, Groppelli A, van Montfrans GA, Wieling W, Wesseling
KH, and Bos WJ. Variable day/night bias in 24-h non-invasive finger pressure against
intrabrachial artery pressure is removed by waveform filtering and level correction. J
Hypertens 20: 1981–1986, 2002.
34. Westerhof BE, Gisolf J, Stok WJ, Wesseling KH, and Karemaker JM. Time-domain cross-
correlation baroreflex sensitivity: performance on the EUROBAVAR data set. J Hypertens
22: 1371–1380, 2004.
35. Youde J, Panerai R, Gillies C, and Potter J. Reproducibility of circulatory changes to head-up
tilt in healthy elderly subjects. Age Ageing 32: 375–381, 2003.

128

129
Chapter 8
Variable day/night bias in 24-h non-invasive
finger pressure against intrabrachial artery
pressure is removed by waveform filtering
and level correction
Berend E. Westerhof1, Ilja Guelen1, Gianfranco Parati2,
Antonella Groppelli2, Gert A. van Montfrans3, Wouter Wieling3,
Karel H. Wesseling1, Willem Jan W. Bos4
In previous studies we showed (1,2) that non-invasive arterial finger pressure (FAP) and
intrabrachial pressures (BAP) differ systematically. The frequency transfer function from
brachial to finger arteries has a resonance near 8 Hz. In addition, the finger diastolic and
mean pressures may be some 8–10 mmHg less than brachial values. By application of a
generalized waveform filter, the 8 Hz resonance can be compensated by an 8 Hz anti-
resonance, and near-brachial waveforms can be derived from FAP waveforms (3). The
subsequent application of a generalized regression-type equation with the filtered finger
systolic and diastolic pressures as independent variables restores the BAP values, on
average (1,2). This brachial reconstruction technique was developed on a database of
short, steady-state sections of individual waveforms available from previous studies, and
the results were correct for the population concerned.
1 TNO TPD Biomedical Instrumentation, Amsterdam, The Netherlands 2 Ospedale SanLuca, Milano, Italy 3 Academic Medical Center, Amsterdam, The Netherlands 4 St Antonius Hospital, Nieuwegein, The Netherlands

130
Later, we demonstrated that waveform filtering also improved the tracking of changes in
(systolic) pressure and baroreflex sensitivity during states of vasodilatation from bicycle
ergometer exercise and vasoconstriction from graded phenylephrine infusion (3),
situations for which tracking of BAP by FAP was considered inadequate (4,5). This was
the first result showing that waveform filtering not only improves resting blood
pressures, but is also effective in correcting the response of an individual person’s FAP
to changes in circulatory state.
In a previous study (6) we demonstrated the ability of non-invasive continuous
ambulatory FAP recording with Portapres to track BAP with limited bias and acceptable
precision, but that the important day-to-night blood pressure dip (7) was overestimated
in the finger. We therefore decided to evaluate the effectiveness of the combined
waveform filtering and level correction techniques on 24-h recordings of FAP and BAP,
with particular interest in the changes in bias between day and night.
Methods
Participants
We recorded non-invasive FAP and BAP continuously during 24 h in eight
normotensive volunteers and 16 patients with hypertension. Details of the patients and
measurements have been published previously (6). Briefly, the volunteers were aged 19–
32 years and the patients were aged 20–60 years. The patients had discontinued their
antihypertensive medication 2 weeks before they were studied. FAP was measured on
the dominant (right) arm using a TNO Model 1 Portapres device. BAP was recorded in
the brachial artery of the non-dominant arm with the Oxford Medilog Mark II, but the
pressure signal was recorded on a separate channel of the Portapres, guaranteeing
synchronous recording. Because we measured BAP and FAP on contralateral arms, we
required that the average of six simultaneous left- and right-arm auscultatory systolic and
diastolic pressures should agree to within 5 mmHg. Hydrostatic height differences
between the finger and the Oxford pressure transducer were also recorded and
continuously subtracted from the FAP waveform. Measurements were started at 1300 h
and lasted until 1300 h on the following day. A standardized activities procedure was
strictly adhered to, as follows. Siesta: 1400–1530 h; cycling at 50 W: 1645–1715 h;
sleep: 2200–0600 h; outside walk: 1000–1030 h and 1100–1130 h. In the remaining

131
periods, the participants were free to move in the hospital. The study procedure was
approved by the ethics committees of both hospitals and informed consent was obtained
from each participant.
Analysis
In the case of some participants, not all periods of interest were successfully recorded,
because of various instrumental failures (6). Two patients of whom we had no
sufficiently complete recordings were excluded from the present study, thus eight
volunteers and 14 patients remained. In the results, the number of included participants
is given for each period. A generalized waveform filter was applied to the FAP records
to remove the near 8 Hz resonance (3) and level correction was applied to the waveform
filtered FAPs as previously described (1,2). In addition to the continuous FAP and BAP
signals, we thus had a third signal channel named ‘reconstructed BAP’ (reBAP).
Original FAP, reBAP and original BAP waves were analyzed for beats. Those beats that
were simultaneously present were compared after artifacts had been rejected, in exactly
the same way (using the original files) as in the previous study (6). In the 22 participants,
90% of the beats were simultaneously available. Finally, level differences were obtained
per beat for systolic, diastolic and mean pressures, as the difference between original
FAP and BAP values and between reBAP and BAP values.
Statistics
Mean values and standard deviations (SD) were calculated for each individual for the
entire 24-h period, for each 30 min and for the following specific periods: daytime,
siesta, sleep, cycling and walking. Next, the mean values were pooled for the group of
the eight volunteers, for the 14 patients, and for all 22 participants. This was permissible,
in view of the strict scheduling of the specific activities and rest periods during the 24-h
period. Averages for specific periods were not always available for each individual,
because of artifacts, so for each period we specify the number of participants involved.
When the mean values and SD of the pressure differences are calculated in this way, bias
and precision statistics are obtained. The principal differences were original FAP minus
BAP (FAP – BAP) and reBAP minus BAP (reBAP – BAP), which were tested for the
significance of their bias from zero using the t-test. Significance was assumed at P <
0.05.

132
Figure 1
40
mm
Hg
sie
sta
160
120
80
18 24 6 12
FAP and BAP Syst. Dias. Mean
nig
ht
wa
lk2
wa
lk1
cyclin
g
–20
0
20
40
18 24 6 12
ReBAP BAP Syst.–
18 24 6 12
Time (h)
ReBAP BAP Dias.–
–20
0
20
40
18 24 6 12
FAP – BAP Dias.
–20
0
20
40
18 24 6 12
–20
0
20
40 FAP BAP Syst.–
sie
sta
ReBAP and BAP Syst. Dias. Mean
18 24 6 12
40
80
120
160
nig
ht
cyclin
g
wa
lk2
wa
lk1
mm
Hg
mm
Hg
Time (h)
Continuous systolic (Syst.), diastolic (Dias.) and mean blood pressures averaged per 30 min and pooled for the
group of 22 participants in the study for whom the full 24-h signal data were available. Measurements started
at 1300 h and continued until 1300 h on the following day. Periods of scheduled and exactly timed activities
are indicated on the time axis. Continuous lines, intrabrachial artery pressures (BAP); dashed lines, non-
invasive finger artery pressures (FAP); dotted lines, reconstructed brachial artery pressures (reBAP). The lower
panels show the individual pressure differences before (left) and after (right) brachial reconstruction. To show
tracking ability, the individual mean bias has been removed.
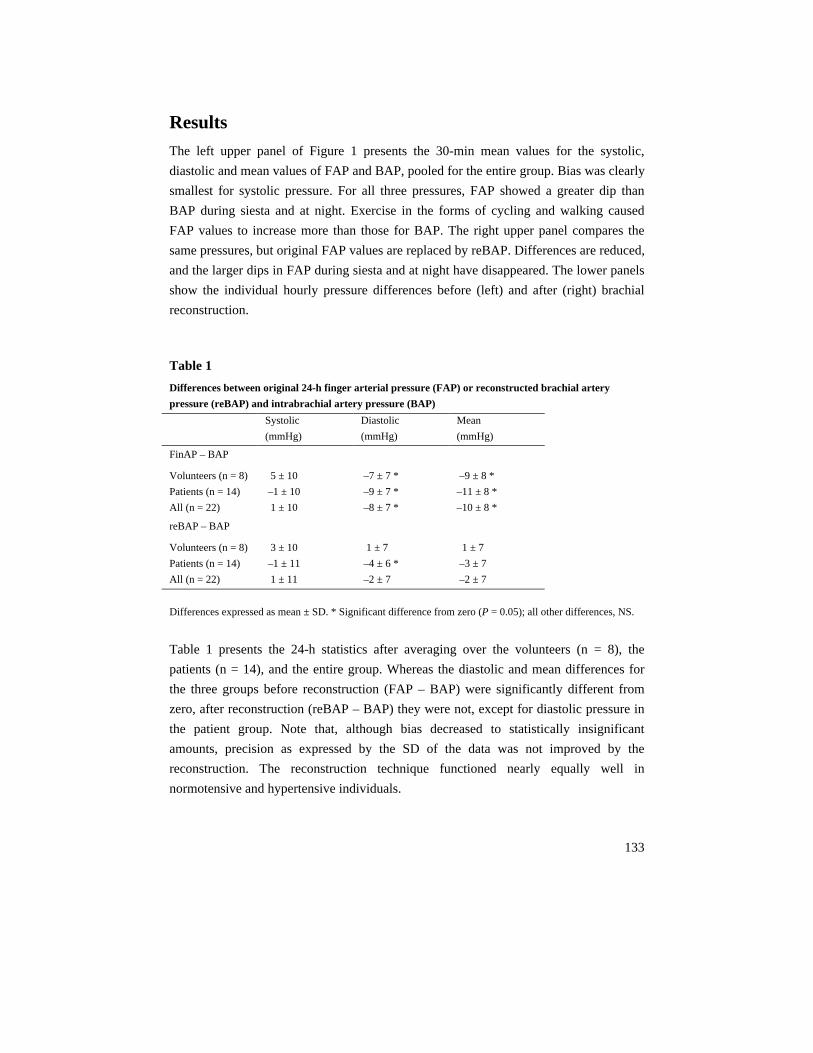
133
Results
The left upper panel of Figure 1 presents the 30-min mean values for the systolic,
diastolic and mean values of FAP and BAP, pooled for the entire group. Bias was clearly
smallest for systolic pressure. For all three pressures, FAP showed a greater dip than
BAP during siesta and at night. Exercise in the forms of cycling and walking caused
FAP values to increase more than those for BAP. The right upper panel compares the
same pressures, but original FAP values are replaced by reBAP. Differences are reduced,
and the larger dips in FAP during siesta and at night have disappeared. The lower panels
show the individual hourly pressure differences before (left) and after (right) brachial
reconstruction.
Table 1
Differences between original 24-h finger arterial pressure (FAP) or reconstructed brachial artery
pressure (reBAP) and intrabrachial artery pressure (BAP)
Systolic
(mmHg)
Diastolic
(mmHg)
Mean
(mmHg)
FinAP – BAP
Volunteers (n = 8)
Patients (n = 14)
All (n = 22)
5 ± 10
–1 ± 10
1 ± 10
–7 ± 7 *
–9 ± 7 *
–8 ± 7 *
–9 ± 8 *
–11 ± 8 *
–10 ± 8 *
reBAP – BAP
Volunteers (n = 8)
Patients (n = 14)
All (n = 22)
3 ± 10
–1 ± 11
1 ± 11
1 ± 7
–4 ± 6 *
–2 ± 7
1 ± 7
–3 ± 7
–2 ± 7
Differences expressed as mean ± SD. * Significant difference from zero (P = 0.05); all other differences, NS.
Table 1 presents the 24-h statistics after averaging over the volunteers (n = 8), the
patients (n = 14), and the entire group. Whereas the diastolic and mean differences for
the three groups before reconstruction (FAP – BAP) were significantly different from
zero, after reconstruction (reBAP – BAP) they were not, except for diastolic pressure in
the patient group. Note that, although bias decreased to statistically insignificant
amounts, precision as expressed by the SD of the data was not improved by the
reconstruction. The reconstruction technique functioned nearly equally well in
normotensive and hypertensive individuals.

134
Table 2
Nocturnal pressure dip (night - day) differences in intrabrachial (BAP), finger (FinAP) and
reconstructed brachial (reBAP) artery pressures
Systolic
(mmHg)
Diastolic
(mmHg)
Mean
(mmHg)
BAP
Volunteers (n = 8)
Patients (n = 13)
All (n = 21)
–20 ± 6
–20 ± 9
–20 ± 8
–10 ± 4
–15 ± 7
–13 ± 6
–13 ± 4
–16 ± 7
–15 ± 5
FinAP
Volunteers (n = 8)
Patients (n = 13)
All (n = 21)
–27 ± 9 *
–28 ± 12 *
–28 ± 11 *
–14 ± 8
–19 ± 10
–17 ± 10 *
–17 ± 7
–20 ± 11 *
–19 ± 10 *
reBAP
Volunteers (n = 8)
Patients (n = 13)
All (n = 21)
–20 ± 7
–18 ± 10
–19 ± 9
–12 ± 5
–15 ± 8
–14 ± 7
–15 ± 6
–16 ± 9
–15 ± 7
Differences expressed as mean ± SD. * Significant difference from BAP (P = 0.05); all other differences, NS.
Table 2 shows that nocturnal arterial pressure dipping is significantly enhanced in the
FAP values: by 8, 4 and 4 mmHg for systolic, diastolic and mean values, respectively,
all participants taken together. These differences reduced to less than 1 mmHg after
reconstruction, or by a clear factor of 4, disregarding the sign of the bias. Variability
estimates also improved.
Figure 2 illustrates the reduction in FAP/BAP bias after reconstruction, displayed for the
24-h period and per scheduled activity. During the day, the night, the siesta and during
cycling, bias reduced to negligible values after reconstruction. Only during walking was
diastolic bias significantly positive.

135
Figure 2
-20
0
20 *
*****
Fin - BAP reBAP - BAP
-20
0
20
*
24 hn = 22
dayn = 22
nightn = 21
siesn = 21
cycln = 20
walkn = 17
-30
0
10
******
-20
20
-20
0
20
-30
0
10
0
SB
P(m
mH
g)
DB
P(m
mH
g)
MB
P(m
mH
g)
24 hn = 22
dayn = 22
nightn = 21
siesn = 21
cycln = 20
walkn = 17
Bias and precision of original finger artery pressure (FAP: left panel) and reconstructed brachial artery pressure
(reBAP: right panel) against intrabrachial artery pressure (BAP) pooled for the group and averaged over the
24-h period (24h), the day period (day), the night period (night), the siesta (sies), 50 W bicycle exercise (cycl),
and two 30-min periods of outside walk (walk). n, number of participants with sufficient recording time
available for a realistic average. *Significant difference from zero (P < 0.05).

136
Discussion
The present results show clear benefits of generalized waveform reconstruction on bias,
and slighter benefits on precision, against BAPs. Remarkably, the greater biases during
siesta and night automatically received the required greater correction. This finding was
not necessarily to be expected, as the reconstruction algorithms were developed for a
population cross-section on short (30 s) sections of waveform data for individuals in
almost identical, resting circulatory states. The findings of the present study suggest that
the same reconstruction algorithms can be applied in individuals, over time, to improve
the tracking of BAP changes by non-invasive FAP measurement over a period of 24 h.
Causes of waveform distortion and pressure gradient
FAP pulse waveform distortion and reductions in FAP values are caused by the pulse
wave transmission effects present in the arm arteries between brachial and finger
measurement sites, and by a pressure gradient that develops as a result of flow in the
rather narrow peripheral arteries of the forearm and hand. As shown in the left panel of
Figure 1, the pressure gradient appeared to increase when the participant was inactive
during siesta and night, and to decrease during the scheduled moderate activities of 50 W
cycling and walking. This seems, at first sight, unexpected. It is, however, well known
that peripheral vasoconstriction occurs in the arteries of the arm during non-arm exercise
(8), which might have caused a decrease in forearm flow and thus a decrease in flow-
related pressure gradient. The level correction formula largely accounts for this effect on
the basis of the relative values of systolic and diastolic FAP, but not completely so, as
the residual differences in Figures 1 and 2 suggest.
Bias and precision
The bias was almost completely removed by waveform reconstruction. After
reconstruction, it was well within the limit of 5 mmHg, as required by the Association
for the Advancement of Medical Instrumentation (AAMI) protocol (9). The precision
was only marginally improved. After reconstruction, the precision for mean and diastolic
pressure, but not for systolic pressure, was within the 8 mmHg required by the AAMI
protocol. Systolic values are more affected by motion artifacts, shifts in finger height
with respect to heart level, and systolic overshoot, damping and limited bandwidth of the

137
catheter–manometer systems used to obtain the reference pressure (10). Furthermore, the
generalized waveform filter used in the brachial waveform reconstruction is based on a
population average, and is possibly suboptimal in individual cases. Although the effects
of suboptimal behavior are reportedly small (11), they are expected to affect systolic
values when blood pressure and heart rate are quite variable, such as during a 24-h
recording. However, we did not observe such deviant behavior of systolic pressure
values.
Night–day differences
The nocturnal decline in blood pressure (7), or its absence, has become the subject of
many studies (12). FAPs measured with Portapres tend to exaggerate the nocturnal blood
pressure dip but, for this group of patients, the reconstruction technique restored the
correct BAP changes, to within 2 mmHg for all pressures (Table 2). The suggested cause
for changes in blood pressure gradient has been changes in forearm flow. It should be
realized, however, that changes in flow can only cause changes in the pressure gradient
if arterial diameter and thus small artery resistance remain constant. It has been shown
(13) that localized intra-arm arterial application of sodium nitroprusside, which probably
relaxes both arterial and arteriolar vasomotor tone, does not affect the BAP-to-FAP
gradient. However, during the night, when arteriolar peripheral tone relaxes and arterial
diameter decreases subsequent to reductions in arterial distending pressure, an increased
pressure gradient can be expected, and was indeed observed (Figure 1, left panel).
Application of the methodology
We have developed three ways to improve the relationship between FAP and BAP. Two
methods, generalized waveform filtering and generalized level correction, were applied
in the present study; the third is an individual level calibration (2). The first method,
waveform filtering, reshapes the non-invasive FAP waveform to near-brachial contours,
with pulse pressure amplitude reduced to brachial values. The second, level correction,
reduces bias between FAP and BAP recordings in a manner correct for a population, and
even reduces bias variability in individuals during a 24-h period. However, precision
does not improve after generalized level correction. The third way to improve the
FAP/BAP relationship – level correction with a return-to-flow brachial systolic pressure
estimate – improves both bias and precision, but requires an additional measurement
with extra hardware. It is important to note that the first two methods, waveform filtering
and level correction, can be applied retrospectively, by means of computer software, to

138
previously recorded FAPs, without further effort. That these generalized methods also
reduce bias variability during the day suggests that an individual calibration needs to be
performed only once during the day. The observation that waveform filtering and level
correction are less perfect during the activity of walking outside the hospital should be
taken as cautionary in this context.
Conclusion
We conclude that reconstruction of BAP from non-invasive FAP strongly reduces the
FAP/BAP bias over a period of 24 h, and improves tracking of nocturnal blood pressure
changes for all three blood pressure levels.

139
References
1. Gizdulich P, Prentza A, Wesseling KH. Models of brachial to finger pulse wave distortion
and pressure decrement. Cardiovasc Res 1997; 33:698–705.
2. Bos WJW, van Goudoever J, van Montfrans GA, van den Meiracker AH, Wesseling KH.
Reconstruction of brachial artery pressure from noninvasive finger pressure measurements.
Circulation 1996; 94:1870–1875.
3. Gizdulich P, Imholz BPM, van den Meiracker AH, Parati G, Wesseling KH. Finapres
tracking of systolic pressure and baroreflex sensitivity improved by waveform filtering. J
Hypertens 1996; 14:243–250.
4. Imholz BPM, Parati G, Mancia G, Wesseling KH. Effects of graded vasoconstriction upon
the measurement of finger arterial pressure. J Hypertens 1992; 10:979–984.
5. Idema RN, van den Meiracker AH, Imholz BPM, Man in ’t Veld AJ, Ritsema van Eck AP,
Schalekamp MADH. Comparison of Finapres noninvasive beat-to-beat finger blood pressure
with intrabrachial artery pressure during and after bicycle ergometry. J Hypertens 1989;
7:S58–S59.
6. Imholz BP, Langewouters GJ, van Montfrans GA, Parati G, van Goudoever J, Wesseling KH,
Wieling W, Mancia G. Feasibility of ambulatory, continuous 24-hour finger arterial pressure
recording. Hypertension 1993; 21:65–73.
7. O’Brien E, Sheridan J, O’Malley K. Dippers and non-dippers. Lancet 1988; 2:397.
8. Rowel LB, Brengelmann GL, Blackmon JR, Bruce RA, Murray JA. Disparities between
aortic and peripheral pulse pressures induced by upright exercise and vasomotor changes in
man. Circulation 1968;37:954–964.
9. American national standard for electronic or automated sphygmomanometers. AAMI SP 10-
1987. Arlington VA: Association for the Advancement of Medical Instrumentation; 1987. pp.
1–25.
10. Gardner RM. Direct blood pressure measurement – dynamic response requirements.
Anesthesiology 1981; 54:227–236.
11. Chen CH, Nevo E, Fetics B, Pak PH, Yin FCP, Maugham WL, Kass DA. Estimation of
central aortic pressure waveform by mathematical transformation of radial tonometry
pressure; validation of generalized transfer function. Circulation 1997; 95:1827–1836.
12. Staessen JA, Thijs L, Fagard R, O’Brien ET, Clement D, de Leeuw PW, Mancia G, for the
Systolic Hypertension in Europe Trial Investigators. Predicting cardiovascular risk using
conventional vs ambulatory blood pressure in older patients with systolic hypertension. JAMA
1999;282:539–546.
13. Bos WJW, van den Meiracker AH, Wesseling KH, Schalekamp MADH. Effect of regional
and systemic changes in vasomotor tone on finger pressure amplification. Hypertension 1995;
26:315–320.

140

141
Chapter 9
Non-invasive blood pressure measurement in
relation to a variety of basic and clinical
applications
In the past years while the studies described in this Dissertation were in progress, I
contributed to a series of other investigations in which my role was to develop methods
or apply techniques for a variety of research projects. These were mostly based on
clinical questions, a few of which could be answered by application of the theories and
techniques developed in this thesis, others by different methods not mentioned in the
preceding Chapters. The present Chapter gives an overview of these studies, providing
additional demonstrations of usefulness of non-invasive blood pressure measurements.
Pressure transfer analyses
Physical basis of pressure transfer from periphery to aorta (1)
We proposed a new method to derive aortic pressure from peripheral pressure and
velocity by using a time domain approach. Peripheral pressure was separated into its
forward and backward components by waveform analysis, and these components were
then shifted with a delay time, which was the ratio of distance and wave speed, and
added again to reconstruct aortic pressure. We tested the method on a distributed model
of the human systemic arterial tree. From carotid and brachial artery pressure and
velocity, aortic systolic and diastolic pressure could be predicted within 0.3 and 0.1
mmHg and 0.4 and 1.0 mmHg, respectively. The central aortic pressure wave shape was
also predicted accurately from carotid and brachial pressure and velocity (root mean

142
square error: 1.07 and 1.56 mmHg, respectively). The pressure transfer function depends
on the reflection coefficient at the site of peripheral measurement and the delay time. A
50% decrease in arterial compliance had a considerable effect on reconstructed pressure
when the control transfer function was used. A 70% decrease in arm resistance did not
affect the reconstructed pressure. The transfer function thus depends on wave speed but
has little dependence on vasoactive state. We conclude that central aortic pressure and
the transfer function can be derived from peripheral pressure and velocity.
The findings of this study gave the impetus for the research described in Chapters 2 & 3.
Finger pressure measurements with the possibility to reconstruct brachial pressure (2)
In this study, the objective was to evaluate three methods developed for the
reconstruction of brachial pressure from non-invasive finger arterial.
Finger arterial pressure (FinAP) may differ from intra-brachial pressure (BAP). First,
pulse shape differences can be removed by applying a generalized waveform filter. Next,
pressure level differences can be corrected by a generalized level correction equation
using filtered systolic and diastolic levels. Finally, a level calibration, which uses an
additional return-to-flow (RTF) systolic pressure measurement on the ipsilateral upper
arm, can be used for an individual calibration of the reconstructed brachial pressure.
These methods were validated in 37 subjects, aged 41 to 83 years after a cardiac
catheterization procedure. Intra-brachial and FinAP pressures were recorded
simultaneously. FinAP pressures were compared after application of waveform filtering
and level correction (flcAP), and after an additional RTF calibration (reBAP). FinAP
systolic, diastolic and mean pressures for the group differed from BAP by –9.7 ± 13.0, –
11.6 ± 8.0 and –16.3 ± 7.9 mmHg (mean ± SD) respectively. After waveform filtering
and level correction, flcAP differed by –1.1 ± 10.7, –0.2 ± 6.8 and –1.5 ± 6.6 mmHg.
After individual calibration, reBAP differed by 3.1 ± 7.6, 4.0 ± 5.6 and 2.7 ± 4.7 mmHg.
We conclude that reconstruction of BAP from FinAP with waveform filtering and level
correction reduces the pressure differences, with an individual RTF calibration to well
within AAMI requirements.
Changes in finger-aortic pressure transfer function with incremental bicycle exercise (3)
Non-invasive finger blood pressure recording has become a surrogate for central blood
pressure under widely varying circumstances. We calculated finger-aorta transfer
functions using the AutoRegressive-eXogenous (ARX) model method in 7 cardiac
patients during rest, incremental bicycle exercise and post-exercise. Finger pressure was

143
measured non-invasively using Finapres and aortic pressure using a catheter-tip
manometer. When using the individual transfer functions, developed during rest, for
reconstruction of aortic pressure (rAortic) during all workloads, systolic pressure was
increasingly underestimated, with a large variation between subjects: +4.0 to –18.1
mmHg. In most subjects diastolic pressure (DBP) was overestimated: –3.9 to +5.5
mmHg. In all cases wave distortion was present. Post-exercise, the error in systolic
rAortic only slowly declined and diastolic pressure was overestimated in all subjects.
During rest, the transfer function gain had a minimum between 3.65 and 4.85 Hz (Fmin).
During exercise this minimum shifted to frequencies between 4.95 and 7.15 Hz at the
maximum workload, with no change in gain. Post-exercise, gain in most subjects shifted
to values closer to unity, while Fmin did not return to resting values. Within each subject
aorta-Finapres delay was linearly related to mean pressure (MAP). During exercise, both
delay and heart rate (HR) were linearly related to Fmin. During rest and exercise, Fmin
could be predicted by the linear model:
Fmin = 0.07*(MAP–DBP)+0.019*HR–0.013*delay+2.71 with R2 = 0.89.
We conclude that during exercise a general transfer function gives an unreliable
reconstruction of aortic pressure. Prediction of transfer functions parameters may be
possible, which could improve both reconstructed systolic and diastolic pressure as well
as wave shape.
Hemodynamic analyses
Total arterial inertance as the fourth element of the Windkessel model (4)
In earlier studies it was found that the three-element Windkessel, although an almost
perfect load for isolated heart studies, does not lead to accurate estimates of total arterial
compliance. To overcome this problem, we introduce an inertial term in parallel with the
characteristic impedance. In seven dogs we found that ascending aortic pressure could be
predicted better from aortic flow by using the four-element Windkessel than by using the
three-element Windkessel: the root-mean-square errors and the Akaike information
criterion and Schwarz criterion were smaller for the four-element Windkessel. The three-
element Windkessel overestimated total arterial compliance compared with the values
derived from the area method and the pulse pressure method (P = 0.0047, paired t-test),
whereas the four-element Windkessel compliance estimates were not different (P =
0.81). The characteristic impedance was underestimated using the three-element
Windkessel, whereas the four-element Windkessel estimation differed marginally from
144
the averaged impedance modulus at high frequencies (P = 0.0017 and 0.031,
respectively). When applied to the human, the four-element Windkessel also was more
accurate in these same aspects. Using a distributed model of the systemic arterial tree,
we found that the inertial term results from the proper summation of all local inertial
terms, and we call it total arterial inertance. We conclude that the four-element
Windkessel, with all its elements having a hemodynamic meaning, is superior to the
three-element Windkessel as a lumped-parameter model of the entire systemic tree or as
a model for parameter estimation of vascular properties.
Left ventricular wall stress normalization in chronic pressure-overloaded heart (5)
It is generally accepted that the left ventricle (LV) hypertrophies (LVH) to normalize
systolic wall stress (σs) in chronic pressure overload. However, LV filling pressure (Pv)
may be elevated as well, supporting the alternative hypothesis of end-diastolic wall
stress (σd) normalization in LVH. We used an LV time-varying elastance model coupled
to an arterial four-element lumped-parameter model to study ventricular-arterial
interaction in hypertension-induced LVH. We assessed model parameters for
normotensive controls and applied arterial changes as observed in hypertensive patients
with LVH (resistance +40%, compliance –25%) and assumed 1) no cardiac adaptation,
2) normalization of σs by LVH, and 3) normalization of σs by LVH and increase in Pv,
such that σd is normalized as well. In patients, systolic and diastolic blood pressures
increase by ~40%, cardiac output (CO) is constant, and wall thickness increases by 30–
55%. In scenarios 1 and 2, blood pressure increased by only 10% while CO dropped by
20%. In scenario 2, LV wall thickness increased by only 10%. The predictions of
scenario 3 were in qualitative and quantitative agreement with in vivo human data. LVH
thus contributes to the elevated blood pressure in hypertension, and cardiac adaptations
include an increase in Pv, normalization of σs, and preservation of CO in the presence of
an impaired diastolic function.

145
Pulse wave analyses
Beta-blocking therapy in patients with the Marfan syndrome and entire aortic
replacement (6)
In non-operated patients with Marfan’s syndrome, use of β-adrenergic blocking therapy
has been shown to reduce the rate of aortic dilation and the development of aortic
dissection. However, its efficacy after entire aortic replacement is unknown. The aim of
this study was to describe the influence of (nearly) entire aortic replacement and β-
blocking therapy on blood pressure and wave reflections in Marfan patients.
Four Marfan patients (mean age 316 ± 3 years) and 8 age matched control subjects were
studied. Blood pressure and wave reflections (reflection coefficient and augmentation
index) were studied by means of magnetic resonance imaging, continuous non-invasive
blood pressure measurements and applanation tonometry. Patients were studied with
atenolol, labetalol and without β-blocking therapy.
In Marfan patients, aortic systolic pressure (129 ± 13 vs. 114 ± 10 mmHg), pulse
pressure (58 ± 13 vs. 40 ± 5 mmHg), wave speed (11 ± 3 vs. 4 ± 0.4 m s-1) and reflection
coefficient (65 ± 22 vs. 41 ± 5%) were significantly increased compared to controls.
There was no difference in aortic pressure between various medications in Marfan
patients (atenolol 129/76 mmHg, labetalol 121/75 mmHg and without β-blocking
therapy 129/71 mmHg). Higher reflection coefficients were seen in patients with
atenolol compared to discontinued medication (73 ± 18 vs. 65 ± 22%), and also the
augmentation index was higher with atenolol compared to labetalol and discontinued
medication (24 ± 22 vs. 17 ± 17 vs. 22 ± 22%, respectively).
Our results describe increased pulse pressure, systolic pressure, wave speed and wave
reflections in four Marfan patients after entire aortic replacement. The use of atenolol or
labetalol did not decrease aortic pressure and with atenolol increased wave reflections
were observed. Therefore, the beneficial effect of atenolol in these patients is doubtful.
Aortic pressure-area relation in Marfan patients with and without β blocking agents (7)
Our objective was to investigate the heterogeneous response to β blockade in patients
with Marfan syndrome by non-invasive assessment of the aortic pressure–area curve.
Twenty-five patients with the Marfan syndrome who used β-blocking agents (aged 29 ±
10 years; 20 men, five women), seven without β blockade (34 ± 14 years; five men, two
women), and 10 controls (29 ± 5 years; seven men, three women) underwent magnetic

146
resonance imaging and non-invasive continuous blood pressure measurement. Pressure–
area curves were constructed at the level of the descending thoracic aorta. A transition
point was defined as the pressure at which the pressure–area relation deviated from its
elastic (linear) to the collagen (exponential) course.
In six patients (five with and one without β blockade), a transition point in the pressure–
area curve was observed, indicating that the load bearing component was not only elastin
but also collagen. In the remaining 26 Marfan patients and in the control subjects a linear
pressure–area relation was observed.
This new non-invasive method to derive aortic pressure–area curves showed that most
patients with Marfan syndrome have a similar pressure–area curve to controls with
similar blood pressures. Five patients on β blockade showed a transition point in the
pressure–area curve which could play a crucial role in the heterogeneous response to β
blocker treatment in Marfan patients. Patients with a transition point at low blood
pressures may not benefit from β blocking agents.
The mean pressure is not calculated adequately by adding 1/3 of the pulse pressure to
the diastolic pressure (8)
The mean arterial pressure at the upper arm is traditionally calculated by adding 1/3 of
the pulse pressure to the diastolic pressure. We tested the validity of this formula in
previously recorded intra-brachial pressure and Riva-Rocci / Korotkoff blood pressure
measurements in 57 subjects (study A) and 24-hour intra-arterial recordings in 22
subjects (study B). In study A the intra-arterially measured mean pressure was found at
39.5 ± 2.5 % of the pulse-pressure above the diastolic pressure. Mean pressure was
higher than at the expected 33.3 % of the pulse-pressure in all individuals. Mean
pressure calculated with the traditional 1/3 rule underestimated the actual mean pressure
by 4.9 ± 5.3 mmHg (P < 0.01). The error was similar for calculations based on Riva-
Rocci-Korotkoff-measurements. In study B we showed activity related variations in the
relative level of the mean pressure; this level increased by 1.8 ± 1.4 % (P < 0.01) during
sleep, and decreased by 0.5 ± 0.9 % during walking (P < 0.05) and by 0.8 ± 1.3 % during
cycling (P < 0.01). Results were not related to age, blood pressure, pulse-pressure or
heart rate. We propose an improved formula to calculate the mean pressure at the upper
arm. Adding 0.4 times the pulse-pressure to the diastolic pressure reduces the error in
calculating the mean pressure from –4.9 ± 5.3 mmHg (P < 0.01) to 0.4 ± 5.1 mmHg
(n.s.).

147
In conclusion, the mean pressure at the upper arm is underestimated when calculated
with the traditional formula of adding 1/3 of the pulse pressure to the diastolic pressure.
This underestimation can be overcome by adding 0.4 times the pulse pressure to the
diastolic pressure.
Baroreflex sensitivity analysis
Sublingual nitroglycerin used in routine tilt testing provokes a cardiac output-mediated
vasovagal response (9)
We set out to determine the effect of sublingual nitroglycerin (NTG), as used during
routine tilt testing in patients with unexplained syncope, on hemodynamic characteristics
and baroreflex control of heart rate (HR) and systemic vascular resistance (SVR).
Nitroglycerin is used in tilt testing to elicit a vasovagal response. It is known to induce
venous dilation and enhance pooling. Also, NTG is lipophilic and readily passes cell
membranes, and animal studies suggest a sympatho-inhibitory effect of NTG on
circulatory control.
Routine tilt testing was conducted in 39 patients with suspected vasovagal syncope (age
36 ± 16 years, 18 females). Patients were otherwise healthy and free of medication.
Before a loss of consciousness set in, oncoming syncope was cut short by tilt-back or
counter-maneuvers. Finger arterial pressure was monitored continuously (Finapres). Left
ventricular stroke volume (SV) was computed from the pressure pulsations using a
model. Spontaneous baroreflex control of HR was estimated in the time and frequency
domains.
During tilt testing, 22 patients developed presyncope. After NTG administration but
before presyncope, SV and cardiac output (CO) decreased (P < 0.001), whereas SVR
and HR increased (P < 0.001) in all patients. Arterial pressure was initially maintained.
Baroreflex sensitivity decreased after NTG. On Cox regression analysis, the occurrence
of a vasovagal response was related to a drop in SV after NTG (hazard ratio 0.86, P =
0.005).
The cardiovascular response to NTG is similar in vasovagal and non-vasovagal patients,
but more pronounced in those with tilt-positive results. The NTG-facilitated presyncope
appears to be CO-mediated, and there is no evidence of NTG-induced sympathetic
inhibition.

148
References
1. Stergiopulos N, Westerhof BE, Westerhof N. Physical basis of pressure transfer from
periphery to aorta: a model-based study. Am J Physiol. 1998;274:H1386-92.
2. Guelen I, Westerhof BE, Van Der Sar GL, Van Montfrans GA, Kiemeneij F, Wesseling KH,
Bos WJ. Finometer, finger pressure measurements with the possibility to reconstruct brachial
pressure. Blood Press Monit. 2003;8:27-30.
3. Stok WJ, Westerhof BE, Blum V, Karemaker JM. Changes in finger-aortic pressure transfer
function during and after incremental bicycle exercise. Submitted.
4. Stergiopulos N, Westerhof BE, Westerhof N. Total arterial inertance as the fourth element of
the Windkessel model. Am J Physiol. 1999;276:H81-8.
5. Segers P, Stergiopulos N, Schreuder JJ, Westerhof BE, Westerhof N. Left ventricular wall
stress normalization in chronic pressure-overloaded heart: a mathematical model study. Am J
Physiol Heart Circ Physiol. 2000;279:H1120-7.
6. Meijboom LJ, Westerhof BE, Nollen GJ, Spaan JA, de Mol BA, Jacobs MJ, Mulder BJ. Beta-
blocking therapy in patients with the Marfan syndrome and entire aortic replacement. Eur J
Cardiothorac Surg. 2004;26:901-6.
7. Nollen GJ, Westerhof BE, Groenink M, Osnabrugge A, van der Wall EE, Mulder BJ. Aortic
pressure-area relation in Marfan patients with and without beta blocking agents: a new non-
invasive approach. Heart. 2004;90:314-8.
8. Bos WJW, Vincent HH, Westerhof BE, van Montfrans GA. The mean pressure is not
calculated adequately by adding 1/3 of the pulse pressure to the diastolic pressure. Submitted.
9. Gisolf J, Westerhof BE, van Dijk N, Wesseling KH, Wieling W, Karemaker JM. Sublingual
nitroglycerin used in routine tilt testing provokes a cardiac output-mediated vasovagal
response. J Am Coll Cardiol. 2004;44:588-93.

149
Chapter 10
Summary and Conclusions
The binding theme of the preceding chapters can be summarized as a pursuit of better
diagnostics and earlier recognition of warning signs in cardiovascular disease. Early
recognition demands accurate non-invasive measurements and reliable methods of
analysis. As shown in this Dissertation, continuous recording of the full pressure wave
shape is indispensable for any detailed analysis going beyond determination of systolic
and diastolic pressure. Non-invasive finger arterial pressure has all the required features.
Some small steps have been taken, testing techniques and proposing approaches, but still
there is a long way to go. Studies in large populations of patients are to prove the clinical
value of these models and methods.
The purpose of this summary chapter is to give an overview of studies that contributed to
obtaining information from the non-invasive measurement of finger arterial pressure,
and emphasize the understanding derived from them.
Pressure transfer analyses
Transfer functions, allowing the derivation of aortic pressures from peripheral pressures,
are frequently used to obtain better insight into processes involving the interaction
between arterial load and the heart. Generalized transfer functions give useful results,
especially in larger study populations. However, more detailed information might be
obtained by individualization of the transfer function, i.e. made optimal for an
individual.
150
Sensitivity of pressure transfer to arterial parameters
Applying transfer functions to pressure measurements requires insight into the variability
within and between individuals. We therefore investigated the quantitative contribution
of all local arterial, blood and distal load properties to the pressure transfer function from
aorta to brachial artery (Chapter 2). This theoretical analysis of the pressure transfer
started out with anatomical data on vessel dimensions, including relative geometric
taper, Young’s modulus, wall viscosity, blood viscosity and blood density. A three-
element Windkessel represented the load to the model of the vessel. The sensitivity
analysis was performed in terms of frequency and magnitude of the peak in the transfer
function and in terms of systolic and diastolic aortic pressure. The percent change of
these variables for a 25% alteration of each of the model parameters was calculated. The
Root Mean Square Error (RMSE) described the inaccuracy in wave shape. Sensitivity
was less than 3% for systolic and diastolic pressure and RMSE less than 1.8mmHg.
Vessel length and diameter had the greatest influence. From these data we concluded
that the intra-individual variability was small.
To investigate to which extent the tapering of the vessel influences the transfer function,
a single uniform tube was modeled. This simplification introduced only small errors in
systolic and diastolic pressures (1% and 0%). Wave shape was less well described
(RMSE 2.06 mmHg). When the reflection coefficient G was changed to zero or to unity
still reasonable results were obtained, showing that vasodilation and vasoconstriction
have little effect on the transfer function.
We conclude that vessel length and diameter are the most important parameters
determining pressure transfer. Because of this we may conclude that delay time is the
main determinant. Vasodilation and constriction have little effect. Thus, a simple
uniform tube with known delay time, possibly measured, and an estimate of the distal
reflection coefficient are sufficient to obtain an accurate description of pressure transfer.
Parameter adaptation to individualize pressure reconstruction
Based on the parameter analysis presented above, we hypothesized that the transfer
function could be individualized by a representative time delay. Chapter 3 describes a
study in a group of 50 patients: measured ascending aortic pressure was 119 ± 20 / 70 ±
9 mmHg, (mean ± SD, systolic / diastolic) and intra-arterially measured brachial
pressure was 131 ± 18 / 67 ± 9 mmHg. The Root Mean Square Error, RMSE, as measure
of difference in wave shape was 7.5 ± 2.1 mmHg. When individual transfer functions
were used with optimized delay, reconstructed pressure was 121 ± 19 / 69 ± 9 mmHg
and RMSE reduced to 4.1 ± 2.0 mmHg. Using a generalized transfer function with a

151
population-averaged delay, reconstructed pressure was 122 ± 19 / 69 ± 9 mmHg and
RMSE was 4.4 ± 2.0 mmHg. Details of the wave shape that were reproduced by the
individualized transfer function were lost with the generalized transfer function. Thus,
with the extra information of time delay, we were able to obtain a transfer function that
was optimal for the individual, giving better results than a generalized transfer function.
Hemodynamic analyses
Hemodynamic analysis is a broad denominator. In this thesis we investigated two
phenomena, both related to central blood pressure and both determinants of cardiac
performance. The first is the reflection index in Chapter 4, the second is the cardiac
oxygen supply and demand ratio in Chapter 5.
Quantification of wave reflection in the human aorta from pressure alone
Wave reflections are apparent from the proximal aortic pressure signal when a secondary
systolic rise in pressure is found. Since reflection may increase systolic pressure it is an
important factor to consider when studying systolic hypertension.
A frequently used measure of wave reflection is the Augmentation Index (AI), the ratio
of the secondary rise in pressure and pulse pressure. However, this index has the
weakness that it only can discern a reflection when the secondary rise in pressure is
detectable. The timing of the reflected wave may be such that the secondary rise in
pressure is not quantifiable.
A more accurate measure is the reflection index (RI), obtainable after separation of
pressure in its forward and reflected components, so-called waveform analysis.
However, this requires measurement of aortic flow, often not readily available. We
therefore explored the possibility of replacing the unknown flow by an artificial
triangular wave. Flow duration was set to ejection time; peak flow at the inflection point
of pressure, FtIP and, for a second analysis, at 30% of ejection time, Ft30. Wave separation
then gave forward, Pf, and backward, Pb, pressure waves. RI was defined as:
RI = |Pb| / (|Pf| + |Pb|).
Twelve healthy subjects, including interventions such as exercise and Valsalva
maneuvers, and 5 patients with ischemic heart disease were analyzed. RIs using FtIP and
Ft30 were compared with RImf using measured flow, Fm, recorded with a Millar catheter
with high fidelity pressure and velocity sensors at the tip. RImf = 0.41 ± 0.05, (mean ±

152
SD, n = 21), RItIP, RIt30 and AI are 0.39 ± 0.05, 0.39 ± 0.04, 0.34 ± 0.16, respectively, AI
significantly different with a larger scatter.
Relations are: RItIP = 0.86 RImf + 0.03 (R2 = 0.73, n = 21), RIt30 = 0.84 RImf + 0.04 (R2 =
0.88, n = 26) and AI = 2.62 RImf – 0.74 (R2 = 0.57, n = 21).
We conclude that RI can be determined from aortic pressure alone, even when AI cannot
be obtained.
Variations in cardiac oxygen supply and demand in hypertensive subjects after rising
The increase in heart rate and blood pressure soon after awakening increases cardiac
oxygen demand, which has been associated with morning excess of acute myocardial
infarction. Oxygen demand is elevated in hypertensive subjects and we tested the
hypothesis that in hypertensive subjects this early morning increase in heart rate and
blood pressure also affects the oxygen supply potential. Since it is the ratio between
supply and demand that determines whether subendocardial ischemia may occur, we
considered this an important question.
Aortic pressure was reconstructed from 24-hour intra-brachial and finger pressure
recordings in 14 hypertensive patients and in 8 normotensive subjects as reference.
Supply was assessed by Diastolic Time Fraction (DTF), demand by Rate-Pressure
Product (RPP) and supply/demand ratio by Adia/Asys with Adia and Asys diastolic and
systolic area under the aortic pressure curve. In the morning, blood pressure and heart
rate (HR) increased in both groups. HR increased 33% in hypertensives and 55% in
normotensives to become similar in the morning. DTF and Adia/Asys ratio decreased in
both groups (P < 0.001), while demand increased in both groups (P < 0.001). Parameters
correlated closely with HR (R2 ~ 0.9). Compared to normotensives, hypertensive subjects
had lower supply as well as lower supply/demand ratio, and a higher demand (P < 0.001)
during the night that persisted (P < 0.001) during the morning.
The data suggest that in hypertensive vs. normotensive subjects the cardiac oxygen
demand around awakening becomes elevated. The morning imbalance in supply and
demand is related not only to increased demand but to decreased supply as well. The
deterioration of the balance between supply and demand appears limited by a smaller
morning rise in HR in hypertensives.

153
Baroreflex sensitivity analyses
Baroreflex sensitivity analysis is widely used to obtain insight in the functioning of the
autonomic system in health and disease. A method rapidly giving reliable information on
baroreflex sensitivity is a sought after tool.
Time-domain cross-correlation baroreflex sensitivity: Performance on the EUROBAVAR
data set
To test a new method (xBRS) for time domain baroreflex sensitivity (BRS) computation
on spontaneous blood pressure and heart interval variability we used the EUROBAVAR
data set which is available from the internet1. This set is especially compiled for
evaluation and comparison of methods determining baroreflex sensitivity (see
Appendix).
In Chapter 6, the xBRS method was put to use on the 42 records in the EUROBAVAR data
set, obtained on 21 patients in lying and standing position. One patient had a recent heart
transplant and one was diabetic with evident cardiac autonomic neuropathy. xBRS
computes correlation between beat to beat pressure and interval, resampled at 1 Hz, in a
sliding 10 s window, with delays of 0 to 5 s for interval. The delay with the highest
positive correlation is selected and, when significant at P = 0.01, slope (ms/mmHg) and
delay (s) are recorded as one xBRS value. Each second of the recording is the start of a
new computation. Non-parametric tests are used.
Lying, xBRS yields 12.4 versus EUROBAVAR sequential 16.2 ms/mmHg, standing 6.2
versus 6.7 ms/mmHg, lying to stand ratio 1.96 versus 2.10. xBRS gave results on all
files, 20 values per minute on average at a lower within patient variance. Best xBRS
delays were 0, 1, and 2 s, and delay increased 100 ms in stand position. xBRS gave
results on the diabetic and the heart transplant patient, while other methods were unable
to do so.
The xBRS method should be considered for experimental and clinical use since xBRS
yields values strongly correlated with and close to EUROBAVAR averages, yields more
values per minute, has lower within patient variance, and measures baroreflex delay.
1 http://www.cbi.dongnocchi.it/glossary/eurobavar.html

154
Dynamics of baroreflex sensitivity during postural stress
Postural stress requires immediate autonomic nervous action to maintain blood pressure.
This can be explored by determining continuous time domain baroreflex sensitivity
(BRS) during stepwise changes in angles of body axis (α). Our hypothesis was that with
increasing postural stress, BRS becomes reduced by a reduction in its vagal component
(Chapter 7).
In 10 healthy young volunteers α included 20 degrees head-down tilt (–20º), supine (0º),
30 and 70 degrees head-up tilt (30º, 70º) and free standing (90º). Non-invasive blood
pressure recordings were analyzed over 6 min periods before and after each change in α.
BRS was determined by frequency-domain analysis and with xBRS, a high-resolution
time-domain method additionally providing the time delay τ between systolic blood
pressure and interbeat interval variations.
On average, between 28 (–20º) to 45 (90º) xBRS estimates per minute became available
for analysis. Following a change in α, xBRS altered in the first minute in 78% of the
cases and in 93% within 6 minutes. With increasing tilt angle, decrease in BRS was
described as
BRS = –10.1·sin(α) + 18.7; R2 = 0.99,
with good correlation between xBRS and cross-spectral gain (R2 = 0.98 for the low-
frequency band and R2 = 0.97 for the high-frequency band. The time delay τ shifted
towards higher values and correspondingly the phase in the spectral analysis tended to
become more negative.
In conclusion, with progressive orthostatic stress, time- and frequency-domain
baroreflex sensitivity declined linearly with the sine of α. The increase in delay τ at
higher levels of orthostatic stress appears to correspond with decreased vagal and
increased sympathetic cardiac tone.
Diurnal blood pressure analyses
The circadian blood pressure pattern and the day-night differences in blood pressure give
more accurate prognostic values than office blood pressure measurements and better
insight in blood pressure regulation.
155
Variable day/night bias in 24-hour non-invasive finger pressure against intra-brachial
artery pressure is removed by waveform filtering and level correction
The nocturnal blood pressure dip is overestimated by finger blood pressure, since it
shows a negative bias against intra-brachial artery pressure and the bias is greater during
the night. We have available a methodology to reconstruct brachial from finger artery
blood pressure by waveform filtering (transfer function) and generalized level (bias)
correction that reduces the bias for short term blood pressure records. We wanted to
investigate (Chapter 8) if this methodology also decreases the extra bias during the night
thereby yielding a better estimate of the nocturnal dip.
Twenty-four-hour finger (FinAP) and intra-brachial (BAP) blood pressure recordings
were simultaneously obtained in 8 healthy normotensive volunteers and 14 hypertensive
patients (aged 19 to 60 y), during standardized scheduled activities. The data were
analyzed off-line, applying the brachial reconstruction technique (reBAP) consisting of a
waveform filter and level correction. Simultaneous beats yielded systolic, diastolic and
mean pressures, which were averaged per half hour, per day, per night, per activity, over
the 24-hour period, and for volunteers and patients, separately.
Over the full 24 hours FinAP systolic, diastolic and mean pressures for the total group
differed +1 ± 10, –8 ± 7, and –10 ± 8 mmHg (mean ± SD), respectively, from BAP.
Similarly, reBAP differed +1 ± 11, –2 ± 7, and –2 ± 7 mmHg. BAP dipped 20 ± 8, 13 ±
6, and 15 ± 6 mmHg during the night. These dips were overestimated +8, +4, and +4
mmHg by FinAP but not by reBAP: –1, +1, and +1 mmHg. The volunteer and the
patient groups showed slight differences in results, which were not statistically
significant.
The generalized reconstruction technique to obtain near-brachial pressure from
noninvasive finger pressure almost completely removes bias over the full 24-hour day-
night period and allows accurate tracking of diurnal changes for systolic, diastolic and
mean pressures.

156
Concluding remarks
Starting on a time scale of milliseconds, we investigated a physiological model of
pressure transfer, concluding that the time delay between proximal and distal pressure is
an important measurable parameter for individualization of a pressure transfer function.
Next, we tested this finding on a set of measurements, demonstrating that a simple
transfer function could be improved by incorporating the time delay, thus facilitating
more accurate assessment of central pressures, the pressure that matters to the heart and
hence important for diagnostics. Also on a small time scale, we proposed a method to
calculate the reflection index from pressure alone, improving on the established method
of augmentation index calculation. Augmentation index is widely used as a simple
measure of arterial stiffness, which is in its turn an important marker for cardiovascular
morbidity and mortality.
Moving to a time scale of seconds, we analyzed parameters for cardiac oxygen supply
potential and cardiac oxygen demand. Not only oxygen demand increases after rising,
which is an accepted concept, but supply potential decreases, providing new insight in
the balance between supply and demand, perhaps giving an indication for use of
medication. A new method to calculate baroreflex sensitivity was established to give
values comparable to findings with other methods, but at a higher rate, allowing
assessment of baroreflex sensitivity in a shorter time span. The higher time resolution
also facilitates detailed analysis of changes in baroreflex sensitivity. We consecutively
analyzed the baroreflex sensitivity during orthostatic stress, discovering a tight relation
between baroreflex sensitivity and the tilt angle. We also showed that the new method
gives an indication of the sympatho-vagal balance. Finally, on a time scale of 24 hours,
we demonstrated a method to improve brachial artery pressure tracking by finger arterial
pressure measurements, so that dipper and non-dippers can be reliably distinguished
from non-invasive pressures.
We demonstrated in these studies that the non-invasive assessment of blood pressure can
be performed reliably and that it can help in increasing our understanding of blood
pressure control as well as in early detection of disease and effect of treatment.
157
Appendix
Assessing arterial baroreflex control of heart
rate: new perspectives
Gianfranco Parati1,2, J. Philip Saul3 and Paolo Castiglioni4
Editorial commentary to Chapter 6
The arterial baroreflex is a key mechanism involved in blood pressure homeostasis (1)
and its impairment is a characteristic feature of a number of cardiovascular diseases (1–
6). There is evidence that a deranged baroreflex control of heart rate may carry an
adverse prognosis in cardiac patients (7,8), while interventions that improve the
sensitivity of the heart rate baroreflex (BRS), such as physical training (9–11) or β-
adrenergic receptor blockade (12), may reduce the risk of cardiovascular events.
For several years, the conventional approach to BRS assessment has been based on the
application of laboratory tests only (1,13). However, in the 1980s, innovative methods
for the assessment of this parameter were described, based on the time or frequency
domain analysis of spontaneous blood pressure fluctuations coupled with reflex changes
in R–R interval (also termed heart interval) (13–19). Because all these newer techniques
evaluate arterial baroreflex function by considering the reflex heart rate effects of blood
pressure changes in the absence of external stimulations on the cardiovascular system,
the estimates of BRS yielded were defined as ‘spontaneous’ (13,20).
1 Department of Clinical Medicine, Prevention and Applied Biotechnologies, University of Milano-Bicocca, Milan, Italy 2 Cardiology II, S. Luca Hospital, IRCCS, Istituto Auxologico Italiano, Milan, Italy 3 South Carolina Children’s Heart Center, Medical University of South Carolina, Charleston, South Carolina, USA 4 Centro di Bioingegneria FDG, IRCCS Fondazione Don C. Gnocchi ONLUS, Milano, Italy

158
In this issue of the journal, a further contribution to this field is provided by Westerhof et
al. (21), who propose a new approach to the assessment of spontaneous baroreflex
function.
Why assess spontaneous baroreflex function?
The available methods for the assessment of spontaneous BRS all share a number of
common features. First, these techniques do not require any external intervention on the
cardiovascular system, thus preventing undesirable interferences with the autonomic
function patterns explored. Second, they can be used not only to assess BRS in
standardized laboratory conditions, but also to investigate the dynamic features of
baroreflex modulation of heart rate over time in daily life (17,19,22–25). Third, arterial
baroreflex control of heart rate is explored around the baroreflex ‘set point’, excluding
the portions of the sigmoidal baroreceptor stimulus–response curve approaching
threshold and saturation (14,20). The information on arterial baroreflex function
obtained appears to be complementary to that provided by the application of
conventional laboratory tests, based on either the injection of vasoactive drugs (26) or on
the manipulation of carotid baroreceptors through a neck chamber device (27–30), which
may explore arterial baroreflex function through a full-range, although artificial,
stimulation of arterial baroreceptors. Following the first introduction of methods for
spontaneous BRS assessment almost 20 years ago, a number of studies have supported
the pathophysiological and clinical relevance of the information on baroreflex function
that they provide (13,19,22,31–35), although the ability of ‘spontaneous’ BRS
assessment to offer new insights into neural cardiovascular regulation over and above the
solid evidence provided by classic laboratory tests has stimulated a lively debate (36–
38).
Available methods to explore spontaneous baroreflex function
Each of the several methods proposed to estimate BRS from the spontaneous variability
of blood pressure and heart rate is based on a specific physiological hypothesis and
makes use of different techniques of signal analysis (Table 1). These differences may
sometimes provide quantitatively different BRS estimates. The sequence method
(15,18,19) can be seen as the natural extension of the traditional drug-injection technique
applied to the analysis of spontaneous variability. It can be classified as a time-domain
method because it is based on the identification of specific patterns in the time series of
systolic pressure and heart interval. The technique scans the beat-to-beat series of

159
systolic pressure to identify a ‘sequence’ (i.e. a series of heart beats) in which a
monotonic increase (or decrease) of systolic pressure is followed, after a delay of zero,
one or two beats, by a monotonic increase (or decrease) of heart interval. The technique
assumes that the progressive changes of heart interval following the monotonic changes
of systolic pressure reflect the buffering action of the baroreflex. The slope of the
regression line between heart interval and systolic pressure values within the sequence is
taken as an estimate of BRS. The new xBRS estimator presented in this issue of the
journal by Westerhof et al. (21) may be classified into the family of time-domain
methods too. Similarly to the sequence method, BRS is obtained as the slope of the
regression line between values of systolic pressure and heart interval. However, these
values do not belong to a sequence, but to a 10-s window of data where the heart-interval
values are delayed by applying a time-shift that maximizes the cross-correlation.
Table 1. Methods for spontaneous baroreflex sensitivity (BRS) assessment
Short Name Type References
Sequence technique Time domain (13, 18, 19)
xBRS Time domain (21)
αLF, αHF Frequency domain (17)
HLF and HHF Frequency domain (16)
ak Mathematical models (14)
Hts Mathematical models (40)
ARMA Mathematical models (41)
XAR Mathematical models (42)
ARXAR Mathematical models (43)
Z-coefficient Statistical methods (48)
BRS, baroreflex sensitivity; xBRS, cross-correlation BRS; αHF, alpha coefficient in the high frequency band
(0.15–0.50 Hz); αLF, alpha coefficient in the low frequency band (0.04–0.14 Hz); HHF, HLF, modulus of the
transfer function between changes in systolic blood pressure and changes in heart interval; ak, BRS gain for
mathematical models; Hts, gain of SBP-heart interval transfer function; ARMA, AutoRegressing Moving
Average (model); XAR, eXogenous (model) with AutoRegressive input; ARXAR, bivariate AutoRegressive
(model) with eXogenous input.
A completely different approach is followed by the frequency domain methods. Spectral
analysis shows that spontaneous fluctuations of systolic pressure and heart interval tend
to be linearly correlated at the respiratory frequency (high frequency, HF, band) and
around 0.1 Hz (low frequency, LF, band). The alpha method (17) assumes that this

160
correlation is due to baroreflex cardiovascular control. Estimates of BRS are obtained by
computing the root-squared ratio between heart-interval and systolic pressure powers
calculated in the LF band (αLF) or in the HF band (αHF), provided that the coherence
between systolic pressure and heart interval (an index of their linear correlation) is
sufficiently high. The transfer function method (16) assumes that the heart interval is the
noisy output of a linear system in which systolic pressure is the input. BRS is then
estimated as the modulus of the transfer function, H, of this system. This is achieved by
computing the modulus of the cross-spectrum between systolic pressure and heart
interval, divided by the systolic pressure spectrum. The transfer function is usually
evaluated separately in the LF and HF frequency bands, obtaining two distinct estimates
of BRS: HLF and HHF. Also the recently proposed trigonometric method (39) belongs to
the class of frequency domain methods, because it estimates BRS by means of a
decomposition of blood pressure and heart-rate variabilities in periodic components.
Another approach for estimating BRS is based on the description of spontaneous blood
pressure and heart rate variability by means of a mathematical model of circulation. The
model coefficients are tuned to fit the experimental data (13). The proposed models
differ in terms of their complexity and modelling strategies, including, as possible
examples, dynamic adjustment models (40), autoregressive-moving average (ARMA)
models (41), exogenous models with autoregressive input, XAR (42), and bivariate
autoregressive models with two exogenous inputs ARXAR (43). Once the model has
been identified, BRS is derived from the model parameters.
Mathematical models for BRS assessment have been proposed to take into account the
complex relationship between blood pressure and heart interval. An increase or decrease
in blood pressure may result in an increase or decrease in heart interval. This process,
known as negative feedback, is an attempt to return blood pressure to its original value.
The other arm of this negative feedback control system, which closes the loop, is the
transmission of the heart interval change into a change in blood pressure, which can be
thought of as feedforward. For the baroreflex, the feedback gain which is the estimated
BRS, has been generally termed α-gain, while the feedforward has been termed β-gain
by some investigators (44). However, most baroreflex quantification techniques are
based on the assumption that the feedforward response is inconsequential, quantifying
only the feedback relation between blood pressure and heart interval. Models that
account for only the effect of blood pressure on heart interval are bivariate open loop and
unidirectional, while those that also consider the effect of heart interval on blood
pressure are bivariate closed loop and bidirectional. Finally, closed loop models that

161
account for other variables in addition to blood pressure and heart interval can be
considered multivariate. The inclusion of respiration in the baroreflex model is the most
common application of a multivariate model.
A multivariate closed-loop bidirectional model that includes as many parameters as
possible will clearly be the most accurate, because it is able to reduce the variance of the
BRS estimates due to factors other than blood pressure and heart interval. However, such
models are also limited by their complexity and the necessity of measuring multiple
parameters during spontaneous operation. Thus, most models focus on the use of only
blood pressure and heart interval. Finally, the issue of causality in computing the BRS
must be addressed. Causal models take into account the physiological timing
relationships between the parameters in the model, assuming that current values of a
parameter are dependent on past values of both itself and of the other parameters that
influence it. Non-causal models do not impose such timing relationships, effectively
assuming causality does not exist or is unimportant. Most spectral methods do not
include causality, but a variety of methods do include feedback causality, including the
sequence method, the xBRS proposed by Westerhof et al. (21) and most bivariate
autoregressive techniques (44–47).
Finally, an alternative way to quantify BRS is to statistically assess the probability to
find an association between values of systolic blood pressure and heart interval. The
statistical level of coupling is quantified by the Z-index, which is a function of two
variables: systolic pressure and heart interval. Z may range between –1 and +1: negative
values indicate exclusion, positive values indicate a link between the two variables. BRS
is derived from the shape of the Z-surface on the systolic pressure–heart interval plane
(48) (Table 1).
How to select the proper method for spontaneous BRS assessment
Given such a wide variety of different BRS estimators, there is a need to define the
criteria for the selection of the most appropriate method in a given experimental or
clinical setting. Indeed, the choice of the most appropriate technique depends on the
nature of the experiment, and it is often determined by stationarity level and length of the
signals, by the experimental protocol and by the characteristics of the subjects under
evaluation.

162
Stationarity
Most frequency domain methods and methods based on black-box modelling require the
stationarity of blood pressure and heart rate time series (i.e. they require the probability
distributions of the time series values to be independent of time translations). By
contrast, this is not a prerequisite for the Z-analysis or for the sequence technique, the
latter estimating BRS at the time of a clear non-stationarity of the recorded signals, such
as a blood pressure ramp.
Length of the signals
Theoretically, the method that requires the shortest segment of data to provide a single
BRS estimation is the sequence technique. An estimate can be obtained by only four
heart beats if they are characterized by a sequence-like progressive change in blood
pressure and heart interval. However, in practice, baroreflex sequences occur randomly
in blood-pressure and heart-rate time series, and signal lengths of the order of minutes
are therefore required to obtain reliable BRS estimates. The xBRS method described in
this issue of the journal (21) is characterized by very good performances in terms of the
minimal signal length required to obtain BRS estimates. Compared to the sequence
technique, the shortest segment of data needed to compute a BRS estimate is slightly
longer (15 s). However, the probability to obtain a BRS quantification from this short
segment is much higher compared to the sequence technique, and reliable BRS estimates
can be derived from shorter recordings. Frequency domain methods and black-box
models require longer segments of data to compute power spectra with the required
frequency resolution, or to reliably identify the model parameters. Z-analysis, which
implies the need to calculate conditional probabilities of events, also requires much
longer recordings.
Differentiation of BRS estimates
If there is an interest in assessing the BRS separately during a rise and a fall in blood
pressure, then the obvious method is the sequence technique, which can provide separate
estimates for increasing and decreasing blood pressure ramps, corresponding to arterial
baroreceptor stimulation and deactivation, respectively. By contrast, if a separate
estimation of the ‘vagal’ and ‘sympathetic’ contribution to BRS values is desired,
frequency-domain methods appear to be preferable.

163
Estimation of very low BRS
Generally, the various techniques make use of thresholds to limit the interference of
noise, and to ensure sufficiently reliable estimates. For example, with the sequence
technique, estimates of BRS can be obtained only from sequences of beats in which the
absolute changes between consecutive systolic pressure values or heart-interval values
are greater than a given threshold. Similarly, α and transfer function techniques estimate
BRS only if the squared coherence modulus between systolic pressure and heart interval
is greater than a pre-defined threshold. However, this means that, because of these
thresholds, a given technique may be unable to provide estimates in subjects with very
low BRS (e.g. in patients with autonomic failure). In this regard, the xBRS technique
presented by Westerhof et al. (21) appears to score sufficiently well because it is able to
provide reliable BRS estimates even in subjects with very low BRS values.
Improving the assessment of BRS: the contribution of the method by Westerhof et
al.
When quantifying the short-term relationship between arterial pressure and inter-beat
interval, it is important to consider that this relationship may not invariably represent the
physiology of the heart rate baroreflex because there are many systems other than the
baroreflex (e.g. respiration) that influence both blood pressure and heart interval on a
beat-to-beat basis. Theoretically, unless all of these systems are accounted for, or
controlled, the quantified baroreflex relationship is likely to be biased, and to have
reduced accuracy, regardless of the technique used for its quantification. Other
limitations of the available methods for spontaneous BRS assessment include within
subject variance of the BRS values, restriction to a fixed time delay from blood pressure
to heart interval changes, inability to detect low BRS values due to threshold issues, and
the availability of only a small number of BRS values in many instances. The xBRS
model described by Westerhof et al. (21) is aimed at addressing some of the above
problems. Conceptually, the xBRS model is simply a more complicated version of a
sequence model, using a variety of computation rules to address some of the limitations
of previous sequence and spectral methods. The authors do demonstrate that their model
addresses these limitations by reducing BRS estimate variance, providing more BRS
values and more accurately including timing effects. However, even this bivariate
method of blood pressure and heart interval interaction cannot be regarded as using a
complete model that is closed loop and causal, such as the autoregressive techniques that
have been previously described (39–47).

164
Finally, it has to be acknowledged that the new method proposed by Westerhof et al.
(21) has not yet been validated in studies making use of experimentally-induced
baroreflex dysfunction (e.g. through surgical baroreceptor denervation or
pharmacological blockade). However, it has been tested on the systolic blood pressure
and heart interval time series of a European dataset collected in the frame of the
activities of the Working Group on Blood Pressure and Heart Rate Variability of the
European Society of Hypertension. This dataset represents the first step of a
‘EuroBAVAR’ (European BAroreflex VARiability) Project that originally focused on
the technical comparison between different methods for assessing spontaneous BRS
(49), and which is now also used to tune and validate new approaches proposed for this
analysis, as in the case of the xBRS model by Westerhof et al. (21).
However, besides its technical validation, the actual clinical relevance of this new index,
with respect to the other available BRS estimates, now needs to be assessed in
longitudinal outcome studies.

165
References
1. Mancia G, Mark AL. Arterial baroreflexes in humans. In: Shepherd JT, Abboud FM (editors):
Handbook of physiology, section 2. The cardiovascular system IV, vol. 3, part 2. Bethesda,
MD: American Physiologic Society; 1983, pp. 755–793.
2. Mancia G, Grassi G, Ferrari AU. Reflex control of the circulation in experimental and human
hypertension. In: Zanchetti A, Mancia G (editors): Handbook of hypertension, vol. 17:
Pathophysiology of hypertension. Amsterdam: Elsevier Science BV; 1997, pp. 568–601.
3. Bristow JD, Honour AJ, Pickering GW, Sleight P, Smyth HS. Diminished baroreflex
sensitivity in high blood pressure. Circulation 1969; 39:48– 54.
4. Osculati G, Giannattasio C, Seravalle G, Valagussa F, Zanchetti A, Mancia G. Early
alterations of the baroreceptors control of heart rate in patients with acute myocardial
infarction. Circulation 1990; 81:939–948.
5. Eckberg D, Drabinski M, Braunwald E. Defective cardiac parasympathetic control in patients
with heart disease. N Engl J Med 1971; 285:877– 883.
6. Grassi G, Seravalle G, Cattaneo BM, Lanfranchi A, Vailati S, Giannattasio C, Del Bo A, Sala
C, Bolla GB, Pozzi M. Sympathetic activation and loss of reflex sympathetic control in mild
congestive heart failure. Circulation 1995; 92:3206–3211.
7. Osterziel KJ, Hanlein D, Willenbroock R, Eichhorn C, Luft F, Dietz R. Baroreflex sensitivity
and cardiovascular mortality in patients with mild to moderate heart failure. Br Heart J 1995;
73:517–422.
8. La Rovere MT, Bigger TJ, Marcus FI, Mortara A, Schwartz PJ, for the ATRAMI (Autonomic
Tone and Reflexes After Myocardial Infarction) investigators: Baroreflex sensitivity and heart
rate variability in prediction of total cardiac mortality after myocardial infarction. Lancet
1998; 351:478–484.
9. Hull SS, Vanoli E, Adamson PB, Verrier RL, Foreman RD, Schwartz PJ. Exercise training
confers anticipatory protection from sudden death during acute myocardial ischemia.
Circulation 1994; 89:548–552.
10. Hohnloser SH, Klingenheben T, Van de Loo A, Hablawetz E, Just H, Schwartz PJ. Reflex
versus tonic vagal activity as a prognostic parameter in patients with sustained ventricular
tachycardia and ventricular fibrillation. Circulation 1994; 89:1068–1073.
11. Billman GE, Schwartz PJ, Stone HL. The effects of daily exercise on susceptibility to sudden
cardiac death. Circulation 1984; 69: 1182–1189.
12. Parati, E.Mutti, M. Di Rienzo P. Castiglioni G. Mancia. Beta-adrenergic blocking treatment
and 24-hour baroreflex sensitivity in essential hypertensive patients. Hypertension 1994;
23:992–996.
13. Parati G, Di Rienzo M, Mancia G. How to measure baroreflex sensitivity: from the
cardiovascular laboratory to daily life. J Hypertens 2000; 18: 7–19.
14. De Boer RW, Karemaker JM, Strackee J. Haemodynamic fluctuations and baroreflex
sensitivity in humans: a beat-to-beat model. Am J Physiol 1987; 253:H680–H689.

166
15. Di Rienzo M, Bertinieri G, Mancia G, Pedotti A. A new method for evaluating the baroreflex
role by a joint pattern analysis of pulse interval and systolic blood pressure series. Med Biol
Eng Comput 1985; 23 (suppl I):313–314.
16. Robbe HWJ, Mulder LJM, Ru¨ ddel H, Langewitz WA, Veldman JBP, Mulder G.
Assessment of baroreceptor reflex sensitivity by means of spectral analysis. Hypertension
1987; 10:538–543.
17. Pagani M, Somers V, Furlan R, Dell'Orto S, Conway J, Baselli G, Cerutti S, Sleight P,
Malliani A. Changes in autonomic regulation induced by physical training in mild
hypertension. Hypertension 1988; 12:600–610.
18. Bertinieri G, Di Rienzo M, Cavallazzi A, Ferrari AU, Pedotti A, Mancia G. Evaluation of
baroreceptors reflex by blood pressure monitoring in unanesthetized cats. Am J Physiol 1988;
254:H377–H383.
19. Parati G, Di Rienzo M, Bertinieri G, Pomidossi G, Casadei R, Groppelli A, Pedotti A,
Zanchetti A, Mancia G. Evaluation of the baroreceptor-heart rate reflex by 24-hour intra-
arterial blood pressure monitoring in humans. Hypertension 1988; 12:214–222.
20. Parlow J, Viale JP, Annat G, Hughson R, Quintin L. Spontaneous cardiac baroreflex in
humans: comparison with drugs-induced responses. Hypertension 1995; 25:1058–1068.
21. Westerhof BE, Gisolf J, Stok WJ, Wesseling KH, Karemaker JM. Time-domain cross-
correlation baroreflex sensitivity: performance on the Eurobavar data set. J Hypertens 2004;
22:1371–1380.
22. Parati G, Frattola A, Di Rienzo M, Castiglioni P, Pedotti A, Mancia G. Effects of aging on 24
hour dynamic baroreceptor control of heart rate in ambulant subjects. Am J Physiol 1995;
268:H1606–H1612.
23. Parati G, Omboni S, Frattola A, Di Rienzo M, Zanchetti A, Mancia G. Dynamic evaluation of
the baroreflex in ambulant subjects. In: Di Rienzo M, Mancia G, Parati G, Pedotti A,
Zanchetti A (editors): Blood pressure and heart rate variability. Amsterdam: IOS Press;
1992, pp. 123–137.
24. Parati G, Di Rienzo M, Castiglioni P, Frattola A, Omboni S, Pedotti A, Mancia G. Daily life
baroreflex modulation: new perspectives from computer analysis of blood pressure and heart
rate variability. In: Di Rienzo M, Mancia G, Parati G, Pedotti A, Zanchetti A (editors):
Computer analysis of cardiovascular signals. Amsterdam: IOS Press; 1995, pp. 209–218.
25. Parati G, Di Rienzo M, Mancia G. Neural cardiovascular regulation and 24-hour blood
pressure and heart rate variability. Time-dependent structure and control of arterial blood
pressure. Ann NY Acad Sci 1996; 783:47–63.
26. Smyth HS, Sleight P, Pickering GW. Reflex regulation of arterial pressure during sleep in
man: a quantitative method of assessing baroreflex sensitivity. Circ Res 1969; 24:109–121.
27. Eckberg DL, Cavanaugh MS, Mark AL, Abboud FM. A simplified neck suction device for
activation of carotid baroreceptors. J Lab Clin Med 1975; 85:167–173.
28. Ludbrook J, Mancia G, Ferrari A, Zanchetti A. The variable neck-chamber method for
studying the carotid baroreflex in man. Clin Sci Mol Med 1977; 53:165–171.
29. Parati G, Mancia G. The neck chamber technique. Giornale Ita Cardiol 1992; 22:511–516.

167
30. Keyl C, Dambacher M, Schneider A, Passino C, Wegenhorst U, Bernardi L.
Cardiocirculatory coupling during sinusoidal baroreceptor stimulation and fixed-frequency
breathing. Clin Sci (Lond) 2000; 99:113–124.
31. Iellamo F, Hughson RL, Castrucci F, Legramante JM, Raimondi G, Peruzzi G, Tallarida G.
Evaluation of spontaneous baroreflex modulation of sinus node during isometric exercise in
healthy humans. Am J Physiol 1994; 267:H994——H1001.
32. Parati G, Di Rienzo M, Bonsignore MR, Insalaco G, Marrone O, Castiglioni P, Bonsignore G,
Mancia G. Autonomic cardiac regulation in obstructive sleep apnea syndrome: evidence from
spontaneous baroreflex analysis during sleep. J Hypertens 1997; 15:1621–1626.
33. Parati G, Di Rienzo M, Castiglioni P, Villani A, Tortorici E, Mancia G. Spontaneous
baroreflex sensitivity: from the cardiovascular laboratory to patient’s bedside. In: Di Rienzo
M, Mancia G, Parati G, Pedotti A, Zanchetti A (editors): Frontiers of blood pressure and
heart rate analysis. Amsterdam: IOS Press; 1997, pp. 219–240.
34. Frattola A, Parati G, Gamba P, Paleari F, Mauri G, Di Rienzo M, Castiglioni P, Mancia G.
Time and frequency domain estimates of spontaneous baroreflex sensitivity provide early
detection of autonomic dysfunction in diabetes mellitus. Diabetologia 1997; 40:1470–1475.
35. Robinson TG, Dawson SL, Eames PJ, Panerai RB, Potter JF. Cardiac baroreceptor sensitivity
predicts long-term outcome after acute ischemic stroke. Stroke 2003; 34:705–712.
36. Lipman RD, Salisbury JK, Taylor JA. Spontaneous indices are inconsistent with arterial
baroreflex gain. Hypertension 2003; 42:481–487.
37. Malliani A, Montano N. Gold standard in assessing baroreceptive function. Hypertension
2004; 43:E24.
38. Parati G, Di Rienzo M, Castiglioni P, Bouhaddi M, Cerutti C, Cividjian A, Elghozi JL,
Fortrat JO, Girard A, Janssen BJ, Julien C, Karemaker JM, Iellamo F, Laude D, Lukoshkova
E, Pagani M, Persson PB, Quintin L, Regnard J, Ruediger JH, Saul PJ, Vettorello M,
Wesseling KH, Mancia G; European Society of Hypertension Working Group on Blood
Pressure and Heart Rate Variability. Assessing the sensitivity of spontaneous baroreflex
control of the heart: deeper insight into complex physiology. Hypertension 2004; 43:E32–
E34.
39. Rüdiger H, Klinghammer L, Scheuch K. The trigonometric regressive spectral analysis – a
method for mapping of beat-to-beat recorded cardiovascular parameters on to frequency
domain compared with Fourier transformation. Comput Meth Prog Biomed 1999; 58:1–15.
40. Baselli G, Cerutti S, Civardi S, Malliani A, Pagani M. Cardiovascular variability signals:
towards the identification of a closed-loop model of the neural control mechanisms. IEEE
Trans Biomed Eng 1988; 35: 1033–1046.
41. Patton DJ, Triedman JK, Perrott MH, Vidian AA, Saul JP Baroreflex gain: characterization
using autoregressive moving average analysis. AmJ Physiol Heart Circ Physiol 1996;
270:H1240–H1249.
42. Porta A, Baselli G, Rimoldi O, Malliani A, Pagani M. Assessing baroreflex gain from
spontaneous variability in conscious dogs: role of causality and respiration. Am J Physiol
Heart Circ Physiol 2000; 279:H2558–H2567.

168
43. Nollo G, Porta A, Faes L, Del Greco M, Disertori M, Ravelli F. Causal linear parametric
model for baroreflex gain assessment in patients with recent myocardial infarction. Am J
Physiol Heart Circ Physiol 2001; 280:H1830–H1839.
44. Barbieri R, Parati G, Saul JP. Closed- versus open-loop assessment of heart rate baroreflex.
IEEE Eng Med Biol Mag 2001; 20:33–42.
45. Patton DJ, Triedman JK, Perrott MH, Vidian AA, Saul JP. Baroreflex gain: characterization
using autoregressive moving average analysis. Am J Physiol 1996; 39:H1240–H1249.
46. Appel ML, Saul JP, Berger RD, Cohen RJ. Closed-loop identification of blood pressure
variability mechanisms. In: Di Rienzo M, Mancia G, Parati G, Pedotti A, Zanchetti A
(editors): Blood pressure and heart rate variability: computer analysis, methodology and
clinical applications. Amsterdam: IOS Press; 1993, pp. 68–74.
47. Mullen TJ, Appel ML, Mukkamala R, Mathias JM, Cohen RJ. System identification of
closed-loop cardiovascular control: effects of posture and autonomic blockade. Am J Physiol
1997; 272:H448–H461.
48. Ducher M, Fauvel JP, Gustin MP, Cerutti C, Najem R, Cuisinaud G, Laville M, Pozet N,
Paultre CZ. A new non-invasive statistical method to assess the spontaneous cardiac
baroreflex in humans. Clin Sci (Colch) 1995; 88:651–655.
49. Laude D, Elghozi JL, Girard A, Bellard E, Bouhaddi M, Castiglioni P, Cerutti C, Cividjian A,
Di Rienzo M, Fortrat JO, Janssen B, Karemaker JM, Leftheriotis G, Parati G, Persson PB,
Porta A, Quintin L, Regnard J, Rudiger H, Stauss HM. Comparison of various techniques
used to estimate spontaneous baroreflex sensitivity (the EuroBaVar study). Am J Physiol
Regul Integr Comp Physiol 2004; 286:R226–R231.

169
Background
The company BMEYE located in the AMC in Amsterdam (formerly the TNO
Biomedical Instrumentation research unit) has a long tradition of research in the area of
non-invasive hemodynamic measurements. The BMEYE core technology includes
continuous, non-invasive finger arterial pressure measurement, which has found its way
to the market in several medical devices, best known the Finapres (1-47), the Portapres
(48-55) and the Finometer (42,43). Continuous blood pressure measurement in space
research depends solely on the specially developed BMEYE finger arterial pressure
measurement devices (40,46).
BMEYE has worked on continuous model-based cardiac output calculation from
pressure, resulting in the Wesseling pulse contour method (56,57) and the Modelflow
method (58-66), using an elegant three-element Windkessel model.
Another long-standing interest is in blood pressure control and baroreflex, resulting in
elaborate models of the circulation (57,67,69,72). A recently developed method to
determine baroreflex sensitivity (73) is currently resulting in several publications (74-76)
offering new insights in this field.
Cooperation with clinical partners has always been very important. Newly developed
methods require new research for validation; new research may require new methods.
New applications of the BMEYE methodology also result in interesting new research.
To mention but a few: the analysis of non-invasive pressure wave shape to detect pre-
symptomatic signs of orthostatic intolerance during head-up tilt (82), plethysmography
of the finger pulse as a non-invasive method for predicting drug-induced changes in left
ventricular preload (77) and continuous non-invasive hemodynamic monitoring to
optimize atrioventricular delay settings of pacemakers in cardiac resynchronization
therapy (86).

170
Algorithms that can be applied to non-invasive pressure recordings to determine cardiac
preload on basis of systolic pressure variation (78) or pulse pressure variation (84) are
also interesting. Ventricular filling pressures has also been associated to heart rate
recovery after exercise in patients with suspected coronary artery disease (85). Several
studies suggest a relation between pulse pressure and endothelial dysfunction (80), pulse
pressure and coronary vasomotor dysfunction (83) or pulsatility and coronary artery
disease (79). Reactive hyperemia in the finger has been suggested to non-invasively
identify coronary atherosclerosis (81).
With the trend towards continuous non-invasive patient monitoring we feel that finger
blood pressure measurement will become the basis for many new systems for diagnostic
purposes, assessment of key risk factors and monitoring of acute vital signs in daily
clinical patient care.

171
References
Finapres
1. Peñáz J. Photoelectric measurement of blood pressure, volume and flow in the finger. Digest
10th Int Conf Med Biol Engng, Dresden. 1973;104
2. Wesseling KH, de Wit B, Settels JJ, Klawer WH, Arntzenius AC. On the indirect registration
of finger blood pressure after Peñáz. Funktionelle Biologie und Medizin. 1982;1:245-250
3. Molhoek GP, Wesseling KH, Arntzenius AC, Settels JJ, van Vollenhoven E, Weeda HW, de
Wit B. Initial results of non-invasive measurement of finger blood pressure according to
Peñáz. Automedica. 1983;4:241-246
4. Molhoek GP, Wesseling KH, Settels JJ, van Vollenhoven E, Weeda HW, de Wit B,
Arntzenius AC. Evaluation of the Peñáz servo-plethysmo-manometer for the continuous, non-
invasive measurement of finger blood pressure. Basic Res Cardiol. 1984;79(5):598-609
5. Gravenstein JS, Paulus DA, Feldman J, McLaughlin G. Tissue hypoxia distal to a Peñáz
finger blood pressure cuff. J Clin Monit. 1985;1:120-125
6. Wesseling KH, Settels JJ, van der Hoeven GMA, Nijboer JA, Butijn MWT, Dorlas JC.
Effects of peripheral vasoconstriction on the measurement of blood pressure in a finger.
Cardiovasc Res. 1985;19:139-145
7. Dorlas JC, Nijboer JA, Butijn WT, van der Hoeven GM, Settels JJ, Wesseling KH. Effects of
peripheral vasoconstriction on the blood pressure in the finger, measured continuously by a
new noninvasive method (the Finapres). Anesthesiology. 1985;62(3):342-5
8. Imholz BP, van Montfrans GA, Settels JJ, van der Hoeven GM, Karemaker JM, Wieling W.
Continuous non-invasive blood pressure monitoring: reliability of Finapres device during the
Valsalva manoeuvre. Cardiovasc Res. 1988;22(6):390-7
9. Nijboer JA, Dorlas JC, Lubbers J. The difference in blood pressure between upper arm and
finger during physical exercise. Clin Physiol. 1988;8(5):501-10
10. Idema RN, van den Meiracker AH, Imholz BP, Man in 't Veld AJ, Settels JJ, Ritsema van
Eck HJ, Schalekamp MA. Comparison of Finapres non-invasive beat-to-beat finger blood
pressure with intrabrachial artery pressure during and after bicycle ergometry. J Hypertens.
1989;7(6):S58-9
11. Imholz BP, Wieling W, Langewouters GJ, van Montfrans GA. Continuous finger arterial
pressure: utility in the cardiovascular laboratory. Clin Auton Res. 1991;1(1):43-53
12. Epstein RH, Bartkowski RR, Huffnagle S. Continuous noninvasive finger blood pressure
during controlled hypotension, A comparison with intraarterial pressure. Anesthesiology.
1991;75(5):796-803
13. Porter KB, O'Brien WF, Kiefert V, Knuppel RA. Finapres: a noninvasive device to monitor
blood pressure. Obstet Gynecol. 1991;78(3 Pt 1):430-3,

172
14. Imholz BP, Parati G, Mancia G, Wesseling KH. Effects of graded vasoconstriction upon the
measurement of finger arterial pressure. J Hypertens. 1992;10(9):979-84
15. Penzel T, Mayer J, Peter JH, Podszus T, Voigt KH, von Wichert P. Continuous non-invasive
blood pressure monitoring in patients with sleep disorders. Physiol Res. 1992;41(1):11-7
16. Bos WJ, Imholz BP, van Goudoever J, Wesseling KH, van Montfrans GA. The reliability of
noninvasive continuous finger blood pressure measurement in patients with both hypertension
and vascular disease. Am J Hypertens. 1992;5(8):529-35
17. Bardoczky GI, Levarlet M, Engelman E, d'Hollander A, Schmartz D. Continuous noninvasive
blood pressure monitoring during thoracic surgery. J Cardiothorac Vasc Anesth.
1992;6(1):51-4
18. Tanaka H, Thulesius O. Effect of temperature on finger artery pressure evaluated by volume
clamp technique. Clin Physiol. 1993;13(5):535-45
19. Veerman DP, Imholz BP, Wieling W, Karemaker JM, van Montfrans GA. Effects of aging on
blood pressure variability in resting conditions. Hypertension. 1994;24(1):120-30
20. Tanaka H, Thulesius O, Yamaguchi H, Mino M, Konishi K. Continuous non-invasive finger
blood pressure monitoring in children. Acta Paediatr. 1994;83(6):646-52
21. Tanaka H, Thulesius O, Yamaguchi H, Mino M. Circulatory responses in children with
unexplained syncope evaluated by continuous non-invasive finger blood pressure monitoring.
Acta Paediatr. 1994;83(7):754-61
22. Petersen ME, Williams TR, Sutton R. A comparison of non-invasive continuous finger blood
pressure measurement (Finapres) with intra-arterial pressure during prolonged head-up tilt.
Eur Heart J. 1995;16(11):1641-54
23. Bos WJ, van den Meiracker AH, Wesseling KH, Schalekamp MA. Effect of regional and
systemic changes in vasomotor tone on finger pressure amplification. Hypertension.
1995;26(2):315-20
24. Wesseling KH. A century of noninvasive arterial pressure measurement: from Marey to
Peñáz and Finapres. Homeostasis. 1995;36:50-66
25. Wesseling KH, de Wit B, van der Hoeven GMA, van Goudoever J, Settels J. Physiocal,
calibrating finger vascular physiology for Finapres. Homeostasis. 1995;36:67-82
26. Rongen GA, Bos WJ, Lenders JW, van Montfrans GA, van Lier HJ, van Goudoever J,
Wesseling KH, Thien T. Comparison of intrabrachial and finger blood pressure in healthy
elderly volunteers. Am J Hypertens. 1995;8(3):237-48
27. Gizdulich P, Imholz BP, van den Meiracker AH, Parati G, Wesseling KH. Finapres tracking
of systolic pressure and baroreflex sensitivity improved by waveform filtering. J Hypertens.
1996;14(2):243-50
28. Jagomagi K, Talts J, Raamat R, Lansimies E. Continuous non-invasive measurement of mean
blood pressure in fingers by volume-clamp and differential oscillometric method. Clin
Physiol. 1996;16(5):551-60
29. Hirschl MM, Binder M, Herkner H, Bur A, Brunner M, Seidler D, Stuhlinger HG, Laggner
AN. Accuracy and reliability of noninvasive continuous finger blood pressure measurement
in critically ill patients. Crit Care Med. 1996;24:1684-9

173
30. Wesseling KH. Finger arterial pressure measurement with Finapres. Z Kardiol. 1996;85
Suppl 3:38-44
31. Imholz BP. Automated blood pressure measurement during ergometric stress testing:
possibilities of Finapres. Z Kardiol. 1996;85 Suppl 3:76-80
32. Jellema WT, Imholz BP, van Goudoever J, Wesseling KH, van Lieshout JJ. Finger arterial
versus intrabrachial pressure and continuous cardiac output during head-up tilt testing in
healthy subjects. Clin Sci (Lond). 1996;91(2):193-200
33. Bos WJ, van Goudoever J, van Montfrans GA, van den Meiracker, AH, Wesseling KH.
Reconstruction of brachial artery pressure from noninvasive finger pressure measurements.
Circulation. 1996;94(8):1870-5
34. Blum V, Carriere EG, Kolsters W, Mosterd WL, Schiereck P, Wesseling KH. Aortic and
peripheral blood pressure during isometric and dynamic exercise. Int J Sports Med.
1997;18(1):30-4
35. Gizdulich P, Prentza A, Wesseling KH. Models of brachial to finger pulse wave distortion
and pressure decrement. Cardiovasc Res. 1997;33(3):698-705
36. Drouin E, Gournay V, Calamel J, Mouzard A, Roze JC. Feasibility of using finger arterial
pressure in neonates. Arch Dis Child Fetal Neonatal Ed. 1997;77(2):F139-40
37. De Jong-de Vos van Steenwijk CC, Wieling W, Harms MP, Wesseling KH. Variability of
near-fainting responses in healthy 6-16-year-old subjects. Clin Sci (Lond). 1997;93(3):205-11
38. Imholz BP, Wieling W, van Montfrans GA, Wesseling KH. Fifteen years experience with
finger arterial pressure monitoring: assessment of the technology. Cardiovasc Res.
1998;38(3):605-16
39. Westerhof BE, Guelen I, Parati G, Groppelli A, van Montfrans GA, Wieling W, Wesseling
KH, Bos WJ. Variable day/night bias in 24-h non-invasive finger pressure against
intrabrachial artery pressure is removed by waveform filtering and level correction. J
Hypertens. 2002;20:1981-6
40. Wieling W, Halliwill JR, Karemaker JM. Orthostatic intolerance after space flight. J Physiol.
2002;538(Pt 1):1.
41. Gisolf J, Stok WJ, Oei SI, Immink RV, vanLieshout JJ, Karemaker JM. Dynamic cerebral
autoregulation under sinusoidal gravitational loading. J Gravit Physiol. 2002;9(1):P85-6
42. Guelen I, Westerhof BE, Van Der Sar GL, Van Montfrans GA, Kiemeneij F, Wesseling KH,
Bos WJ. Finometer, finger pressure measurements with the possibility to reconstruct brachial
pressure. Blood Press Monit. 2003;8:27-30
43. Leonetti P, Audat F, Girard A, Laude D, Lefrere F, Elghozi JL. Stroke volume monitored by
modeling flow from finger arterial pressure waves mirrors blood volume withdrawn by
phlebotomy. Clin Auton Res. 2004;14(3):176-81
44. Meijboom LJ, Westerhof BE, Nollen GJ, Spaan JA, de Mol BA, Jacobs MJ, Mulder BJ. Beta-
blocking therapy in patients with the Marfan syndrome and entire aortic replacement. Eur J
Cardiothorac Surg. 2004;26:901-6

174
45. Nollen GJ, Westerhof BE, Groenink M, Osnabrugge A, van der Wall EE, Mulder BJ. Aortic
pressure-area relation in Marfan patients with and without beta blocking agents: a new non-
invasive approach. Heart. 2004;90:314-8
46. Gisolf J, Immink RV, van Lieshout JJ, Stok WJ, Karemaker JM. Orthostatic blood pressure
control before and after spaceflight, determined by time-domain baroreflex method. J Appl
Physiol. 2005 May;98(5):1682-90.
47. Whinnet ZI, Davies JER, Wilson K, Chow AW Faole RA, Davies DW, Hughes AD, Francis
DP, Mayet, J. Continuous non-invasive hemodynamic monitoring to optimize atrioventricular
delay in cardiac resynchronization therapy. Abstract.
Portapres
48. Schmidt TF, Wittenhaus J, Steinmetz TF, Piccolo P, Lupsen H. Twenty-four-hour ambulatory
noninvasive continuous finger blood pressure measurement with PORTAPRES: a new tool in
cardiovascular research. J Cardiovasc Pharmacol. 1992;19 Suppl 6:S117-45
49. Imholz BP, Langewouters GJ, van Montfrans GA, Parati G, van Goudoever J, Wesseling KH,
Wieling W, Mancia G. Feasibility of ambulatory, continuous 24-hour finger arterial pressure
recording. Hypertension. 1993;21(1):65-73
50. Omboni S, Smit AA, Wieling W. Twenty four hour continuous non-invasive finger blood
pressure monitoring: a novel approach to the evaluation of treatment in patients with
autonomic failure. Br Heart J. 1995;73(3):290-2
51. Voogel AJ, van Montfrans GA. Reproducibility of twenty-four-hour finger arterial blood
pressure, variability and systemic hemodynamics. J Hypertens. 1997;15:1761-5
52. Voogel AJ, Stok WJ, Pretorius PJ, Van Montfrans GA, Langewouters GJ, Karemaker JM.
Circadian blood pressure and systemic hemodynamics during 42 days of 6 degrees head-
down tilt. Acta Physiol Scand. 1997;161(1):71-80
53. Omboni S, Parati G, Castiglioni P, Di Rienzo M, Imholz BP, Langewouters, GJ, Wesseling
KH, Mancia G. Estimation of blood pressure variability from 24-hour ambulatory finger
blood pressure. Hypertension. 1998;32(1):52-8
54. Imholz BP, Wieling W, van Montfrans GA, Wesseling KH. Fifteen years experience with
finger arterial pressure monitoring: assessment of the technology. Cardiovascular Research.
1998;38(3):605-16
55. Voogel AJ, van Steenwijk RP, Karemaker JM, van Montfrans GA. Effects of treatment of
obstructive sleep apnea on circadian hemodynamics. J Auton Nerv Syst. 1999;77:177-183

175
Pulse Contour and Modelflow
56. Smith NT, Wesseling KH. Cardiac output beat-to-beat: Evaluation of a new apparatus and
method. IRCS. 1974. 2:1153
57. Wesseling KH, De Wit B, Weber JAP, Smith NT. A simple device for the continuous
measurement of cardiac output. Adv Cardiovasc Phys. 1983;5-II:16-52
58. Wesseling KH, Jansen JR, Settels JJ, Schreuder JJ. Computation of aortic flow from pressure
in humans using a nonlinear, three-element model. J Appl Physiol. 1993;74:2566-2573
59. Voogel AJ, van Montfrans GA. Reproducibility of twenty-four-hour finger arterial blood
pressure, variability and systemic hemodynamics. J Hypertens. 1997;15:1761-5
60. Voogel AJ, Stok WJ, Pretorius PJ, Van Montfrans GA, Langewouters GJ, Karemaker JM.
Circadian blood pressure and systemic hemodynamics during 42 days of 6 degrees head-
down tilt. Acta Physiol Scand. 1997;161(1):71-80
61. Voogel AJ, Bos WJW, van Goudoever J, van Montfrans GA, Wesseling KH. Finger-to-
brachial comparability of 'Modelflow' stroke volume improves after pulsewave
reconstruction. Clin Physiol. 1997;17:327-337
62. Voogel AJ, van Steenwijk RP, Karemaker JM, van Montfrans GA. Effects of treatment of
obstructive sleep apnea on circadian hemodynamics. J Auton Nerv Syst. 1999;77:177-183
63. Jellema WT, Wesseling KH, Groeneveld AB, Stoutenbeek CP, Thijs LG, van Lieshout JJ.
Continuous cardiac output in septic shock by simulating a model of the aortic input
impedance: a comparison with bolus injection thermodilution. Anesthesiology.
1999;90(5):1317-28
64. Harms MP, Wesseling KH, Pott F, Jenstrup M, van Goudoever J, Secher NH, van Lieshout
JJ. Continuous stroke volume monitoring by modeling flow from non-invasive measurement
of arterial pressure in humans under orthostatic stress. Clin Sci (Lond). 1999;97:291—301
65. Jansen JR, Schreuder JJ, Mulier JP, Smith NT, Settels JJ, Wesseling KH. A comparison of
cardiac output derived from the arterial pressure wave against thermodilution in cardiac
surgery patients. Br J Anaesth. 2001;87(2):212-22
66. Leonetti P, Audat F, Girard A, Laude D, Lefrere F, Elghozi JL. Stroke volume monitored by
modeling flow from finger arterial pressure waves mirrors blood volume withdrawn by
phlebotomy. Clin Auton Res. 2004;14(3):176-81

176
Baroreflex
67. Wesseling KH, Settels JJ, Walstra HG, van Esch HJ, Donders JJ. Baromodulation as the
cause of short-term blood pressure variability? In: Aplications of Physics to medicine and
Biology. 1983; (Alberi G et al, eds), World Scientific, Singapore: 247-276.
68. Magrini A, Guerrisi M, Franconi C, Settels JJ, de Wit B, Wesseling KH. Simulation of heart
rate and arterial pressure fluctuations due to respiration. In: Proc. Fifth Int Conf on
Mechanics in Medicine and Biology. Bologna: 1985
69. Wesseling KH, Settels JJ. Baromodulation explains short-term blood pressure variability. In:
Psychophysiology of cardiovascular control. Models, Methods and Data. 1985; (Orlebeke JF
et al, eds), Plenum, New York: 69-97
70. Goedhard WJA, Wesseling KH, Settels JJ. Baroreflex pressure control responding to
orthostatic changes with age. In: Psychophysiology of cardiovascular control. Models,
Methods and Data. 1985; (Orlebeke JF et al, eds), Plenum, New York: 191-202
71. Guerrisi M, Magrini A, Franconi C, Settels JJ, de Wit B, Wesseling KH. Pulsatile model of
the cardiovascular system with neural reflexes. In: Physics in Environmental and Biomedical
Research.1985.
72. Wesseling KH, Settels JJ, Wieling W, van Montfrans GA, Karemaker JM. The
baromodulation hypothesis, baroreflex resetting and one-over-f blood pressure spectra. In:
Computer analysis of cardiovascular signals DiRiezo M et al, eds; IOS Press 1995: 105--118.
73. Westerhof BE, Gisolf J, Stok WJ, Wesseling KH, Karemaker JM. Time-domain cross-
correlation baroreflex sensitivity: performance on the EUROBAVAR data set. J Hypertens.
2004;22:1371-80.
74. Parati G, Saul JP, Castiglioni P. Assessing arterial baroreflex control of heart rate: new
perspectives (Editorial). J Hypertens. 2004;22:1259-1263.
75. Gisolf J, Westerhof BE, van Dijk N, Wesseling KH, Wieling W, Karemaker JM. Sublingual
nitroglycerin used in routine tilt testing provokes a cardiac output-mediated vasovagal
response. J Am Coll Cardiol. 2004;44:588-93.
76. Gisolf J, Immink RV, van Lieshout JJ, Stok WJ, Karemaker JM. Orthostatic blood pressure
control before and after spaceflight, determined by time-domain baroreflex method. J Appl
Physiol. 2005;98(5):1682-90.

177
Other research
77. Stengele E, Winkler F, Trenk D, Jahnchen E, Petersen J, Roskamm H. Digital pulse
plethysmography as a non-invasive method for predicting drug-induced changes in left
ventricular preload. Eur J Clin Pharmacol. 1996;50(4):279-82
78. Preisman S, Pfeiffer U, Lieberman N, Perel A. New monitors of intravascular volume: a
comparison of arterial pressure waveform analysis and the intrathoracic blood volume.
Intensive Care Med. 1997;23(6):651-7
79. Yamashita N, Nakayama Y, Tsumura K, Nishijima T, Ueda H, Yoshimaru K, Hayashi T,
Yoshikawa J. Pulsatility of brachial artery pressure is associated with an increased risk of
coronary artery disease in men. J Hypertens. 2001;19(9):1589-93
80. Ceravolo R, Maio R, Pujia A, Sciacqua A, Ventura G, Costa MC, Sesti G, Perticone F. Pulse
pressure and endothelial dysfunction in never-treated hypertensive patients. J Am Coll
Cardiol. 2003;41(10):1753-8
81. Bonetti PO, Pumper GM, Higano ST, Holmes DR Jr, Kuvin JT, Lerman A. Noninvasive
identification of patients with early coronary atherosclerosis by assessment of digital reactive
hyperemia. J Am Coll Cardiol. 2004;44(11):2137-41
82. Romano SM, Lazzeri C, Chiostri M, Gensini GF, Franchi F. Beat-to-beat analysis of pressure
wave morphology for pre-symptomatic detection of orthostatic intolerance during head-up
tilt. J Am Coll Cardiol. 2004;44:1891-7
83. Ichigi Y, Takano H, Umetani K, Kawabata K, Obata JE, Kitta Y, Kodama Y, Mende A,
Nakamura T, Fujioka D, Saito Y, Kugiyama K. Increased ambulatory pulse pressure is a
strong risk factor for coronary endothelial vasomotor dysfunction. J Am Coll Cardiol.
2005;45(9):1461-6
84. Berkenstadt H, Friedman Z, Preisman S, Keidan I, Livingstone D, Perel A. Pulse pressure and
stroke volume variations during severe haemorrhage in ventilated dogs. Br J Anaesth.
2005;94(6):721-6
85. Skaluba SJ, Litwin SE. Doppler-derived left ventricular filling pressures and the regulation of
heart rate recovery after exercise in patients with suspected coronary artery disease. Am J
Cardiol. 2005;95(7):832-7
86. Whinnett ZI, Davies JER, Wilson K, Chow AW, Faole RA, Davies DW, Hughes AD, Francis
DP, Mayet J. Continuous non-invasive hemodynamic monitoring to optimize atrioventricular
delay in cardiac resynchronization therapy. Abstract.

178

179
Samenvatting
Het gemeenschappelijke thema van voorafgaande Hoofdstukken kan omschreven
worden als een zoektocht naar betere diagnostiek en vroegere detectie van
waarschuwingstekens bij cardiovasculaire ziektes. Vroege herkenning van zulke tekens
vereist nauwkeurige niet-bloedige metingen en betrouwbare analyse methoden. Zoals
aangetoond in deze dissertatie, is de continue registratie van de gehele drukcurve
onmisbaar voor onderzoek dat verder gaat dan het bepalen van systolische en
diastolische bloeddruk. Niet-invasieve vingerbloeddruk meting heeft al de benodigde
eigenschappen. Enkele kleine stappen zijn gezet op het aangegeven pad, enkele nieuwe
technieken zijn getest en aanpakken voorgesteld, maar er is nog een lange weg te gaan.
Studies in grote groepen patiënten zijn nodig om de klinische relevantie aan te tonen van
de modellen en methodes.
Het doel van deze Samenvatting is om een overzicht te geven van de studies die
bijdragen aan het verkrijgen van informatie uit niet-invasieve arteriële vingerbloeddruk
en om het verkregen begrip te benadrukken.
Analyse van drukoverdracht
Overdrachtsfuncties maken het mogelijk om aortadrukken te reconstrueren vanuit
perifeer gemeten drukken en worden regelmatig gebruikt om beter inzicht te krijgen in
processen die de interactie tussen het hart en de vaten betreffen. Gegeneraliseerde
overdrachtsfuncties geven bruikbare resultaten, vooral bij onderzoek in grotere
studiepopulaties. Echter, meer gedetailleerde informatie zou verkregen kunnen worden
wanneer de overdrachtsfunctie geïndividualiseerd zou worden.
180
Gevoeligheidsanalyse van overdrachtsfuncties voor arteriële parameters
Het toepassen van overdrachtsfuncties op drukmetingen vereist kennis van de
variabiliteit in- en tussen individuen. Om die variabiliteit te onderzoeken (Hoofdstuk 2)
hebben we de kwantitatieve bijdrage van alle locale arteriële-, bloed- en distale
belastingsparameters aan de overdrachtsfunctie van de arteria brachialis naar de aorta
bestudeerd (Hoofdstuk 2). Deze theoretische analyse van de overdrachtsfunctie ging uit
van anatomische gegevens van vaatafmetingen, inclusief taps toelopen, Young’s
modulus, wand viscositeit en bloed viscositeit en dichtheid. Een drie-elementen
Windketel representeerde de belasting van de buis. De gevoeligheidsanalyse werd
beschreven in termen van frequentie en hoogte van de piek in de overdrachtsfunctie en in
termen van systolische en diastolische druk. De percentuele verandering van deze
variabelen voor een verandering van 25% in elk van parameters werd uitgerekend en de
Root Mean Square Error (RMSE) werd gebruikt om de onnauwkeurigheid in de
golfvorm te beschrijven.
De gevoeligheid was minder dan 3% voor systolische en diastolische druk en de RMSE
was kleiner dan 1.8 mmHg. Hieruit concluderen we dat de verschillen binnen een
individu weinig zullen variëren. Vaatlengte en diameter zijn de parameters met de
grootste invloed op de overdrachtsfunctie. Daar deze parameters belangrijk bijdragen
aan de looptijd van de drukgolf, kan geconcludeerd worden dat de vertraging tussen
perifere en central druk bepalend is voor de overdrachtsfunctie. Veranderingen in de
drie-elementen Windketel belasting bleken weinig effect te hebben, dus vasodilatie and
vasoconstrictie zijn van weinig invloed. Een simpele mathematische beschrijving van de
overdrachtsfunctie die is te optimaliseren voor een individuele patiënt door looptijd te
bepalen zou dus een goede beschrijving van de overdrachtsfunctie kunnen geven.
Aanpassing van parameters om de drukoverdrachtsfunctie te individualiseren
Uitgaande van de bovenstaande bevindingen hebben we onderzocht (Hoofdstuk 3) of de
druk- overdrachtsfunctie geïndividualiseerd zou kunnen worden door middel van een
representatieve looptijd van de drukgolf. Hoofdstuk 3 beschrijft een studie in een groep
van 50 patiënten: gemeten druk in de aorta ascendens was 119 ± 20 / 70 ± 9 mmHg,
(gemiddeld ± SD, systolisch / diastolisch) en intra-arterieel gemeten brachialisdruk was
131 ± 18 / 67 ± 9 mmHg. De Root Mean Square Error, RMSE, als maat voor verschil in
golfvorm was 7.5 ± 2.1 mmHg. Wanneer de overdrachtsfuncties met de beste schatting
voor de looptijd werden gebruikt, werd voor de gereconstrueerde aortadruk 121 ± 19 / 69
± 9 mmHg gevonden en de RMSE nam af tot 4.1 ± 2.0 mmHg. Een gegeneraliseerde
overdrachtsfunctie met de groepsgemiddelde looptijd gaf 122 ± 19 / 69 ± 9 mmHg en
181
een RMSE van 4.4 ± 2.0 mmHg. Details van de golfvorm werden beter weergegeven
door de geïndividualiseerde overdrachtsfunctie Dus, door de extra informatie verkregen
uit de looptijd kunnen we een overdrachtsfunctie bepalen die optimaal is voor een
individuele patiënt en die betere resultaten geeft dan de gegeneraliseerde
overdrachtsfunctie.
Hemodynamische analyses
Hemodynamische analyse is een wijd begrip. In dit proefschrift hebben we een aantal
verschijnselen onderzocht gerelateerd aan centrale bloeddruk en bepalend voor
hartfunctie. Een eerste, de reflectie-index, is beschreven in Hoofdstuk 4; een volgende,
zuurstof vraag en aanbod, is beschreven in Hoofdstuk 5.
Kwantificering van golfreflectie in de menselijke aorta op basis van alleen druk
Polsgolf reflecties zijn herkenbaar in de druk in de proximale aorta wanneer een
secundaire toename in de druk zichtbaar is. Reflecties kunnen de systolische druk
verhogen en worden beschouwd als een factor van belang in de studies van systolische
hypertensie. Een veel gebruikte maat van polsgolf reflectie is de Augmentatie Index
(AI), de verhouding van de secundaire stijging ten opzichte van de polsdruk. Een
tekortkoming van deze methode is dat alleen een schatting polsgolf reflectie verkregen
word wanneer een tweede stijging waarneembaar is. Het tijdstip waarop de
gereflecteerde golf terugkomt kan zo zijn dat de secundaire stijging niet te kwantificeren
is.
Een nauwkeuriger maat van polsgolf reflectie is de Reflectie Index (RI), die te berekenen
is na splitsing van de druk in zijn voorwaartse en gereflecteerde golf, zogenaamde
polsgolf analyse. Deze methode heeft echter ook de gemeten bloedstroom of
stroomsnelheid in de aorta nodig, die vaak niet beschikbaar is. We hebben daarom de
mogelijkheid onderzocht (Hoofdstuk 4) om de onbekende stroom te vervangen door een
kunstmatige, driehoekvormige stroom. Voor de tijdsduur van de stroom werd de
ejectietijd genomen, maximale stroom werd gelegd op het tijdstip van het optreden van
de secundaire drukstijging, beide bepaald uit de aortadruk. Deze stroom noemden we
FtIP. Voor een tweede analyses werd de maximale stroom op 30% ejectietijd gelegd, deze
stroom noemden we Ft30. Splitsing gaf dan voorwaartse (P forward, Pf), en
teruggekaatste (of terugwaartse, P backward, Pb), druk golven. RI werd gedefinieerd als:
RI = |Pb| / (|Pf| + |Pb|).
182
Twaalf gezonde proefpersonen werden geanalyseerd, aantal ingrepen werd uitgevoerd
waaronder inspanning en Valsalva manoever. Ook werden 5 patiënten met ischeamische
hartziekte onderzocht. RI’s bepaald met FtIP en Ft30 werden vergeleken met RImf, bepaald
met gemeten stroom, Fm, opgenomen met een Millar katheter met high fidelity druk- en
stroomopnemers aan de tip. RImf = 0.41 ± 0.05, (gemiddelde ± SD, n = 21), RItIP, RIt30 en
AI waren 0.39 ± 0.05, 0.39 ± 0.04, 0.34 ± 0.16, respectievelijk. AI was verschillend met
een grotere spreiding. De verbanden konden beschreven worden als: RItIP = 0.86 RImf +
0.03 (R2 = 0.73, n = 21), RIt30 = 0.84 RImf + 0.04 (R2 = 0.88, n = 26) en AI = 2.62 RImf –
0.74 (R2 = 0.57, n = 21). We concluderen hieruit dat de RI bepaald kan worden uit
aortadruk alleen, zelfs wanneer de AI niet vastgesteld kan worden.
Variaties in cardiale zuurstof vraag en aanbod in hypertensieve patiënten na opstaan
De toename in hartfrequentie en bloeddruk vlak na het wakker worden doet de vraag
naar zuurstof van het hart toenemen. Dit is in verband gebracht met de overmaat aan
acute hartinfarcten in de ochtend. De zuurstofvraag in hypertensieve patiënten is
verhoogd, en we onderzochten de hypothese dat toename in hartfrequentie en bloeddruk
in de ochtend ook het zuurstof aanbod aan het hart beïnvloedt (Hoofdstuk 5). We achtten
dit een belangrijke vraag omdat de verhouding tussen aanbod en vraag bepaalt of
ischaemie optreedt.
Aortadruk werd gereconstrueerd uit 24-uursmetingen van intra-arteriële brachialis- en uit
vingerbloeddrukregistraties in 14 hypertensieve patiënten en 8 gezonde vrijwilligers als
referentie. Zuurstof aanbod werd geschat met de diastolische tijdsfractie (Diastolic Time
Fraction, DTF), vraag werd geschat met vermenigvuldiging van hartfrequentie en druk
(Rate-Pressure Product, RPP) en aanbod/vraag ratio met Adia/Asys waarin Adia en Asys het
diastolische and systolische oppervlak onder de aortadrukcurve zijn.
In de ochtend namen hartfrequentie (heart rate, HR) en bloeddruk toe in beide groepen.
HR nam 33% toe in de hypertensieven and 55% in de normotensieven om op hetzelfde
niveau uit te komen in de morgen. DTF en de Adia/Asys ratio namen in beide groepen af
(P < 0.001), terwijl RPP toenam in beide groepen (P < 0.001). De parameters
vertoonden een sterk verband met HR (R2 ~ 0.9). Vergeleken met de normotensieven
hadden de hypertensieven een lager aanbod en een lagere aanbod/vraag ratio gedurende
de nacht. Ook hadden de hypertensieven een hogere vraag (P < 0.001), die in de ochtend
doorzette (P < 0.001).
Deze gegevens suggereren dat, vergeleken met de normotensieven, de zuurstofvraag van
het hart toeneemt. De onbalans tussen aanbod en vraag wordt niet alleen veroorzaakt
door toegenomen vraag maar ook door afgenomen aanbod. De verslechtering in de
183
aanbod / vraag ratio lijkt beperkt te worden door de kleinere toename van HR in de
ochtend bij de hypertensieven.
Baroreflex gevoeligheidsanalyses
Baroreflex gevoeligheidsanalyse wordt algemeen toegepast om inzicht te krijgen in het
functioneren van het autonome systeem in ziekte en gezondheid. Een methode die snel
betrouwbare informatie geeft over baroreflex gevoeligheid is een gezocht stuk
gereedschap.
Tijddomein kruiscorrelatie baroreflex gevoeligheidsanalyse: uitkomsten op de
EUROBAVAR data set
Om een nieuwe methode (xBRS) voor de bepaling van baroreflex gevoeligheid (BRS)
op basis van spontane variatie in bloeddruk en hartperiode te testen, gebruikten we de
EUROBAVAR data set die op het internet1 te vinden is. Deze set is speciaal samengesteld
voor het evalueren en vergelijken van methodes voor het bepalen van baroreflex
gevoeligheid.
In Hoofdstuk 6 werd de xBRS methode ingezet op de 42 registraties van de the
EUROBAVAR data set, verkregen van 21 patiënten in liggende en staande positie. Een
patiënt had recent een transplantatiehart ontvangen, een was diabetisch met cardiale
autonome neuropathie. xBRS berekent de correlatie tussen slag-op-slag druk en
hartperiode gegevens, herbemonsterd op 1 Hz, in een schuivend raam, met een
vertraging van 0 tot 5 s in hartperiode. De vertraging met de grootste positieve correlatie
wordt geselecteerd en, indien significant met at P = 0.01, worden de helling (ms/mmHg)
en de vertraging (s) opgeslagen als een BRS bepaling.
Voor onderzoek van de resultaten werden niet-parametrische tests gebruikt.
Voor de liggende positie gaf xBRS 12.4 tegen EUROBAVAR sequential 16.2 ms/mmHg,
voor staan 6.2 tegen 6.7 ms/mmHg, liggen/staan ratio 1.96 tegen 2.10. xBRS gaf
uitkomsten op alle files, 20 waardes per minuut gemiddeld en met een lagere intra-
individuele variantie. Beste xBRS vertragingen waren 0, 1, en 2 s, en de vertraging nam
100 ms toe in staande positie. xBRS gaf ook uitkomsten bij de diabeticus en
harttransplantatie-patiënt terwijl de andere methoden dat niet deden.
De xBRS methode zou in overweging kunnen worden genomen voor experimentele en
klinische toepassing, omdat de xBRS methode uitkomsten geeft die strek correleren met
1 http://www.cbi.dongnocchi.it/glossary/eurobavar.html
184
en dicht uitkomen bij uitkomsten van de EUROBAVAR gemiddelden, meer waardes per
minuut geeft, kleinere lagere intra-individuele variantie heeft en bovendien een maat
voor de baroreflex vertraging geeft.
Dynamica van de baroreflex gevoeligheid gedurende houdingsafhankelijke belasting
Houdingsafhankelijke belasting vereist onmiddellijk autonome neurale activiteit om de
bloeddruk op peil te houden. Een en ander kan onderzocht worden door continue
baroreflex gevoeligheidsanalyse (BRS) in het tijddomein bij stapsgewijze veranderingen
in de hoek van de lichaamsas (α). De hypothese was dat met toegenomen
houdingsafhankelijke belasting de BRS afneemt door een afname in zijn vagale
component (Hoofdstuk 7).
In 10 gezonde jonge vrijwilligers werd α gevarieerd tussen 20 graden head-down tilt (–
20º), supine (0º), 30 and 70 graden head-up tilt (30º, 70º) and vrij staan (90º). Niet-
invasieve bloeddrukken werden geanalyseerd gedurende periodes van 6 min voor- en na
een verandering in α. BRS werd bepaald spectraalanalyse en met xBRS, een tijdsdomein
methode met hoge resolutie en die bovendien de tijdsvertraging τ tussen systolische
bloeddruk- en hartperiodevariaties geeft.
Gemiddeld kwamen tussen de 28 (–20º) en 45 (90º) xBRS bepalingen per minuut
beschikbaar voor analyse. Na een verandering in α veranderde xBRS in de eerste minuut
in 78% van de gevallen en in 93% van de gevallen binnen 6 minuten. Met toenemende
tilhoek, kon de verandering in BRS als volgt beschreven worden:
BRS = –10.1·sin(α) + 18.7; R2 = 0.99,
met een goede correlatie tussen xBRS en cross-spectral gain (R2 = 0.98 en R2 = 0.97
voor de geanalyseerde lage- en de hoge frequentieband.
De tijdsvertraging τ verschoof naar langere waardes, de fase vertoonde een neiging om
negatiever te worden.
Concluderend, met toenemende houdingsafhankelijke belasting namen de tijd- en
frequentie domein bepaalde baroreflex gevoeligheid lineair af met sin(α). De toename in
τ bij grotere houdingsafhankelijke belasting lijkt verband te houden met afgenomen
vagale en toegenomen sympathische cardiale toon.

185
24-uurs bloeddrukanalyse
Het circadiane bloeddrukpatroon en de dag-nacht verschillen hebben betere
voorspellende waarde dan spreekkamer bloeddrukmetingen en geven beter inzicht in de
bloeddrukregeling.
Variabele dag/nacht afwijking in 24-uurs niet-invasieve vingerbloeddruk tegen intra-
arteriële brachialis bloeddruk wordt verkleind door golfvorm filteren en niveau-
correctie
De nachtelijke bloeddruk afname wordt overschat door de vingerbloeddruk, daar deze
een negatieve afwijking heeft ten opzichte van intra-arteriële brachialisbloeddruk die
groter wordt gedurende de nacht. We hebben een methode om brachialis bloeddruk te
reconstrueren vanuit arteriële vingerbloeddruk door middel van golfvorm-filteren
(overdrachtsfunctie) en een gegeneraliseerde niveau-correctie die de afwijking verkleint
voor korte bloeddrukregistraties. We wilden onderzoeken (Hoofdstuk 8) of deze
methodologie ook de extra afwijking in de nacht vermindert en zo een betere schatting
mogelijk maakt van de nachtelijke bloeddrukafname (dip). Vierentwintig-uurs
registraties van vinger (Finger Arterial Pressre, FinAP) en van intra-arteriële
brachialisbloeddruk (Brachial Artery Pressure, BAP) werden simultaan opgenomen 8
gezonde, normotensieve vrijwilligers en in 14 hypertensieve patiënten (leeftijd 19 tot 60
jaar), onder gestandaardiseerde activiteiten. Deze data werden off-line geanalyseerd, met
gebruikmaking van de reconstructietechniek (reconstructed Brachial Artery Pressure,
reBAP) bestaande uit golfvorm-filteren en niveau-correctie. Gelijktijdige slagen gaven
systolische, diastolische en gemiddelde drukken, die gemiddeld werden per half uur, per
dag, per nacht, per activiteit en over de gehele 24 uur, en voor vrijwilligers en patiënten
apart.
Over de gehele 24 uur verschilde de FinAP systolische, diastolische en gemiddelde druk
voor de gehele groep +1 ± 10, –8 ± 7, and –10 ± 8 mmHg (gemiddelde ± SD),
respectievelijk, van BAP. reBAP verschilde +1 ± 11, –2 ± 7, en –2 ± 7 mmHg. BAP nam
20 ± 8, 13 ± 6, and 15 ± 6 mmHg af gedurende de nacht. Deze afnamen werden
overschat door FinAP: +8, +4, and +4 mmHg maar niet door reBAP: –1, +1, and +1
mmHg. De resultaten van de vrijwilliger en de patiënten vertoonden kleine verschillen,
die niet statistisch significant waren.
De gegeneraliseerde reconstructietechniek voor het verkrijgen van brachialis bloeddruk
uit niet-invasieve vingerbloeddruk verwijdert de afwijking over de 24 uur bijna volledig
en laat nauwkeurig volgen van dag-nacht veranderingen toe voor systolische,
diastolische en gemiddelde bloeddrukken.

186
Conclusies
Beginnend op en tijdsschaal van milliseconden, onderzochten we een fysiologisch
correct model van drukoverdracht en kwamen tot de conclusie dat de tijdsvertraging
tussen de proximale en distale druk een belangrijke meetbare grootheid is waarmee de
drukoverdrachtsfunctie geïndividualiseerd kan worden.
Vervolgens toetsten we deze bevinding op een set meetgegevens waarmee we
aantoonden dat een simpele beschrijving van de drukoverdracht verbeterd kon worden
door de looptijd in te voeren, zodoende een meer nauwkeurige bepaling van de aorta
bloeddruk mogelijk makend. De centrale aorta bloeddruk is de bloeddruk die het hart als
belasting ervaart en dus van belang in diagnose.
Evenzeer op een kleine tijdsschaal, stelden we een methode voor om de reflectie index te
berekenen uit alleen de bloeddruk, dus zonder gebruik te maken van de bloedstroom.
Deze methode betekent een verbetering ten opzichte van de gevestigde Augmentatie
Index berekening. De Augmentatie Index wordt veelvuldig gebruikt als een simpele
maat van vaatwandstijfheid, die op zijn beurt weer een indicator is voor cardiovasculaire
morbiditeit en mortaliteit.
Naar een tijdsschaal van seconden gaand, analyseerden we parameters van cardiale
zuurstof vraag en aanbod. Niet alleen neemt de cardiale zuurstof vraag toe in de ochtend
na het wakker worden, wat een geaccepteerd concept is, maar ook neemt het cardiale
zuurstof aanbod af, wat vernieuwde inzichten geeft in de veranderingen in de balans
tussen vraag en aanbod en mogelijk een aanwijzingen inhoudt voor de toepassing van
medicatie.
Ook werd een nieuwe methode voor de bepaling van baroreflex gevoeligheid
ontwikkeld, die uitkomsten geeft die goed vergelijkbaar zijn met die van bestaande
methode maar met hogere frequentie, zodat veranderingen in de baroreflex gevoeligheid
in een kortere tijd vastgesteld kunnen worden.
Vervolgens analyseerden we met deze methode de baroreflex gevoeligheid tijdens
houdingsafhankelijke belasting en vonden een nauwe correlatie tussen baroreflex
gevoeligheid en hoek in de lichaamsas. Ook lieten we zien dat de nieuwe methode een
indicatie geeft van de sympatho-vagale balans.
Ten slotte, op een tijdsschaal van 24 uur, toonden we een methode om het volgen van de
brachialisdruk vanuit de vingerbloeddruk te verbeteren, zodat dippers en non-dippers

187
(zie Introductie, sectie Blood pressure measurements in hypertension) betrouwbaar
onderscheiden kunnen worden met niet-invasieve drukmetingen.
We hebben aangetoond in deze studies dat niet-invasieve bepaling van bloeddruk
betrouwbaar toegepast kan worden en dat het kan helpen om in ons begrip van
bloeddrukregeling als ook in vroege opsporing van ziekte en bij effecten van medicatie.

188

189
Dankwoord
Het dankwoord is het laatste, maar ook het belangrijkste hoofdstuk van een proefschrift. Niet alleen omdat een proefschrift met de medewerking van velen tot stand komt, maar vooral omdat het dankwoord vaak het enige hoofdstuk is dat wordt gelezen. Allereerst wil ik mijn promotores Karel Wesseling en Jos Spaan noemen. Karel, met jou is het allemaal begonnen. Ik wil je bedanken voor jouw uitnodiging om bij je te komen promoveren en voor de leuke tijd die we hebben gehad met het samen werken aan interessant onderzoek. Ik denk met veel plezier terug aan de bezoekjes aan Den Haag. Jos, met jou is alles nu afgerond. Ik wil je bedanken voor de steun bij de laatste loodjes. Jouw heldere blik is mij veel waard geweest. Mijn copromotor John Karemaker wil ik bedanken voor zijn bijdrage op allerlei vlak over de jaren heen. John, hoewel je pas sinds kort officieel mijn copromotor bent, ben je het eigenlijk altijd geweest. Ik ben blij dat ik van je enorme kennis heb kunnen leren, zelfs in een uitgebreide cursus, en ik ben dankbaar voor al de tijd die je voor me hebt vrijgemaakt. Beste collega’s van bmeye, ik wil jullie bedanken dat jullie me de gelegenheid hebben gegeven om te promoveren, ook in de veranderende omstandigheden. Beste Ilja, we hebben straks heel wat artikelen samen. Nog een paar erbij? Beste Gertrude, dank je wel voor jouw geweldige inbreng in dit proefschrift. Jos, ik heb er veel vertrouwen in dat we Het Gaan Maken. Jeroen, dank je wel voor alle hulp en steun. Hans, dank je wel voor de goede sfeer die je binnenbrengt. Olaf, nu jij! Dank je voor de leerzame discussies. Ben en Bob: leuk dat jullie weer terug zijn! Beste Peter en Gijs, dank jullie wel voor de steun in de TNO-tijd. De leden van de commissie ben ik erg erkentelijk voor de tijd en aandacht die zij hebben besteed aan de beoordeling van dit proefschrift. Beste Willem Jan, dank je wel voor jouw intensieve mentorschap de eerste jaren. Ik heb dat wel gemist na je vertrek. Jouw betrokkenheid en inzet is ongeëvenaard.

190
Dear Nikos, it was in Lausanne that I got my introduction in the field of hemodynamics and where I learned how much fun research is. It was through the work on the 4-element Windkessel that I got into contact with Karel. Thank you. Beste Wouter, ik heb me altijd welkom gevoeld in jouw onderzoeksgroep: dank je wel. Beste Han, jij hebt, met je onstuitbare enthousiasme, een geweldige bijdrage geleverd aan dit proefschrift, dank je wel. Beste Gert, dank je wel voor jouw kennis en geestige verhalen. Beste Janneke, dank je wel voor de leuke samenwerking. Jammer dat je zo snel klaar was met je promotie. Had een voorbeeld aan mij genomen. Beste Wim, we hebben een paar goede papers en ik hoop dat we nog meer kunnen doen samen. Beste Gijs, Lilian, Maarten en Barbara, de onderzoeken die we samen hebben uitgevoerd gingen niet van een leien dakje, maar we hebben wel veel plezier gehad en alles is uiteindelijk goed gekomen. Op naar de volgende onderzoeken! Dear Alberto, it was fun working around the clock on our paper, writing you at night and reading your reaction from Australia the next morning. Dear Gianfranco, thank you for the nice cooperation; let’s keep up the good work! Beste Jeroen (van Goudoever) en Jeroen (van den Wijngaard), dank jullie wel voor het kritisch lezen van mijn proefschrift. Dear Gabriela, thank you for being my soul mate and (para)nymph. Beste Claas, dank je wel voor je broederschap en voor het zijn van mijn paranymph. Lieve Pa en Ma, dank voor uw interesse door de jaren heen en uw vertrouwen. Lieve Opperoma, dank u wel voor uw optimisme en vrolijkheid. Lieve paps en mams, zonder jullie was het niet gelukt: jullie steun, zowel wetenschappelijk als organisatorisch, heeft erg veel voor me betekend. Als de hoeveelheid dank in verhouding zou staan tot het aantal regels in het dankwoord dan zouden er een paar pagina’s toegevoegd moeten worden. Lieve Marleen, Marten en Rosa, jullie hebben veel geduld gehad en ik ben erg dankbaar dat jullie me de gelegenheid hebben gegeven om dit proefschrift af te maken. Woorden en ook weer pagina’s schieten tekort.

191
Overview of studies
1. Bos WJ, Vincent HH, Westerhof BE, van Montfrans GA. The mean pressure is not calculated
adequately by adding 1/3 of the pulse pressure to the diastolic pressure. Submitted.
2. Gisolf J, Westerhof BE, van Dijk N, Wesseling KH, Wieling W, Karemaker JM. Sublingual
nitroglycerin used in routine tilt testing provokes a cardiac output-mediated vasovagal
response. J Am Coll Cardiol. 2004;44:588-93.
3. Guelen I, Westerhof BE, Van Der Sar GL, Van Montfrans GA, Kiemeneij F, Wesseling KH,
Bos WJ. Finometer, finger pressure measurements with the possibility to reconstruct brachial
pressure. Blood Press Monit. 2003;8:27-30.
4. Guelen I, Westerhof BE, Van Der Sar GL, Van Montfrans GA, Kiemeneij F, Wesseling KH,
Bos WJ. Validation of the brachial pressure reconstruction of the Finometer. In preparation.
5. Meijboom LJ, Westerhof BE, Nollen GJ, Spaan JA, de Mol BA, Jacobs MJ, Mulder BJ. Beta-
blocking therapy in patients with the Marfan syndrome and entire aortic replacement. Eur J
Cardiothorac Surg. 2004;26:901-6.
6. Nollen GJ, Westerhof BE, Groenink M, Osnabrugge A, van der Wall EE, Mulder BJ. Aortic
pressure-area relation in Marfan patients with and without beta blocking agents: a new non-
invasive approach. Heart. 2004;90:314-8.
7. Segers P, Stergiopulos N, Schreuder JJ, Westerhof BE, Westerhof N. Left ventricular wall
stress normalization in chronic pressure-overloaded heart: a mathematical model study. Am J
Physiol Heart Circ Physiol. 2000;279:H1120-7.
8. Stergiopulos N, Westerhof BE, Westerhof N. Physical basis of pressure transfer from
periphery to aorta: a model-based study. Am J Physiol. 1998;274:H1386-92.
9. Stergiopulos N, Westerhof BE, Westerhof N. Total arterial inertance as the fourth element of
the windkessel model. Am J Physiol. 1999;276:H81-8.
10. Stok WJ, Westerhof BE, Blum V, Karemaker JM. Changes in finger-aortic pressure transfer
function during and after incremental bicycle exercise. Provisionally accepted.
11. Van Os-Bossagh P, Kosterman LM, Hop WC, Westerhof BE, de Bakker JV, Drogendijk AC,
Van Duyl WA. Micromotions of bladder wall in chronic pelvic pain (CPP): a pilot study. Int
Urogynecol J Pelvic Floor Dysfunct. 2001;12:89-96.
12. Westerhof BE, Gisolf J, Karemaker JM, Wesseling KH, Secher NH, van Lieshout JJ.
Dynamics of baroreflex sensitivity during postural stress. Provisionally accepted.

192
13. Westerhof BE, Gisolf J, Stok WJ, Wesseling KH, and Karemaker JM. Time-domain cross-
correlation baroreflex sensitivity: performance on the EUROBAVAR data set. J Hypertens.
22: 1371-1380, 2004.
14. Westerhof BE, Guelen I, Parati G, Groppelli A, van Montfrans GA, Wieling W, Wesseling
KH, Bos WJ. Variable day/night bias in 24-h non-invasive finger pressure against
intrabrachial artery pressure is removed by waveform filtering and level correction. J
Hypertens. 2002;20:1981-6.
15. Westerhof BE, Guelen I, Stok WJ, Wesseling KH, Spaan JA, Westerhof N, Bos WJ,
Stergiopulos N. Sensitivity of pressure transfer to arterial parameters. Ready for submission.
16. Westerhof BE, Guelen I, Stok WJ, Wesseling KH, Westerhof N, Bos WJ, Stergiopulos N,
Spaan JA. Parameter adaptation to individualize pressure transfer. Ready for submission.
17. Westerhof BE, Guelen I, Westerhof N, Karemaker JM, Avolio A. Quantification of wave
reflection in the human aorta from pressure alone. Under review.
18. Westerhof BE, van Montfrans GA, Guelen I, Wesseling KH, Spaan JA, Parati G, Westerhof
N, Karemaker JM, van Lieshout JJ, Bos WJ. Variations in cardiac oxygen supply and demand
in hypertensive subjects after rising. Ready for submission.
19. van den Wijngaard JP, Westerhof BE, Faber DJ, Westerhof N, van Gemert MJ. Transmission
line model for abnormal umbilical artery doppler flow velocity in twin-twin transfusion
syndrome. In preparation.

Berend E. Westerhof
Blood pressure analysis on tim
e scales from seconds to days B
erend E. Westerhof
Blood pressure analysison time scales from seconds to days
UitnodigingVoor het bijwonen van de openbare
verdediging van het proefschrift:
Blood pressure analysis on time scales
from seconds to days
van
Berend E. Westerhof
Op dinsdag 13 December 2005
om 12.00 uur
In de Aula van de Universiteit van Amsterdam, Oude Lutherse Kerk,
Singel 411 (hoek Spui)te Amsterdam
Receptie ter plaatsena afloop van de promotie
Berend E. WesterhofM. van Borsselenlaan 361181 DA Amstelveen
Tel: 020 6432746
Paranimfen:
Gabriela Montorzi-ThorellTel: +41 22 7430384
Claas WesterhofTel: 010 4258645