Thesis (complete) - UvA-DARE (Digital Academic Repository ...
193
UvA-DARE is a service provided by the library of the University of Amsterdam (https://dare.uva.nl) UvA-DARE (Digital Academic Repository) The role of macrophages in human erythropoiesis Heideveld, E. Publication date 2018 Document Version Final published version License Other Link to publication Citation for published version (APA): Heideveld, E. (2018). The role of macrophages in human erythropoiesis. General rights It is not permitted to download or to forward/distribute the text or part of it without the consent of the author(s) and/or copyright holder(s), other than for strictly personal, individual use, unless the work is under an open content license (like Creative Commons). Disclaimer/Complaints regulations If you believe that digital publication of certain material infringes any of your rights or (privacy) interests, please let the Library know, stating your reasons. In case of a legitimate complaint, the Library will make the material inaccessible and/or remove it from the website. Please Ask the Library: https://uba.uva.nl/en/contact, or a letter to: Library of the University of Amsterdam, Secretariat, Singel 425, 1012 WP Amsterdam, The Netherlands. You will be contacted as soon as possible. Download date:17 Apr 2022
-
Upload
khangminh22 -
Category
Documents
-
view
1 -
download
0
Transcript of Thesis (complete) - UvA-DARE (Digital Academic Repository ...

UvA-DARE is a service provided by the library of the University of Amsterdam (https://dare.uva.nl)
UvA-DARE (Digital Academic Repository)
The role of macrophages in human erythropoiesis
Heideveld, E.
Publication date2018Document VersionFinal published versionLicenseOther
Link to publication
Citation for published version (APA):Heideveld, E. (2018). The role of macrophages in human erythropoiesis.
General rightsIt is not permitted to download or to forward/distribute the text or part of it without the consent of the author(s)and/or copyright holder(s), other than for strictly personal, individual use, unless the work is under an opencontent license (like Creative Commons).
Disclaimer/Complaints regulationsIf you believe that digital publication of certain material infringes any of your rights or (privacy) interests, pleaselet the Library know, stating your reasons. In case of a legitimate complaint, the Library will make the materialinaccessible and/or remove it from the website. Please Ask the Library: https://uba.uva.nl/en/contact, or a letterto: Library of the University of Amsterdam, Secretariat, Singel 425, 1012 WP Amsterdam, The Netherlands. Youwill be contacted as soon as possible.
Download date:17 Apr 2022
Esther Heideveld
The role of macrophages in human erythropoiesis Esther HeideveldAll roads lead to red
cells

The role of macrophages inhuman erythropoiesis
Esther Heideveld

The role of macrophages in human erythropoiesis
PhD thesis, University of Amsterdam, the Netherlands
Copyright © 2018 by Esther Heideveld
All rights reserved. No part of this thesis may be reproduced, stored or transmitted in any form or
by any means without prior permission from the author.
A digital version of this thesis can be found at www.dare.uva.nl
Cover design and layout: evelienjagtman.com
Printed by: Gildeprint
ISBN: 978-94-6233-944-6
Printing of this thesis was financially supported by Sanquin Research.
The role of macrophages inhuman erythropoiesis
ACADEMISCH PROEFSCHRIFT
ter verkrijging van de graad van doctor
aan de Universiteit van Amsterdam
op gezag van de Rector Magnificus
prof. dr. ir. K.I.J. Maex
ten overstaan van een door het College voor Promoties ingestelde commissie,
in het openbaar te verdedigen in de Agnietenkapel
op vrijdag 25 mei 2018, te 12.00 uur
door
Esther Heideveld
geboren te Purmerend

Promotiecommissie
Promotor: prof. dr. C.E. van der Schoot AMC-Universiteit van Amsterdam
Copromotores: dr. E. van den Akker Sanquin Research
dr. M.M. von Lindern Sanquin Research
Overige leden: prof. dr. S.M. van Ham AMC-Universiteit van Amsterdam
prof. dr. M.P.J. de Winther AMC-Universiteit van Amsterdam
prof. dr. M. van Egmond Vrije Universiteit
prof. dr. J.N.J. Philipsen Erasmus MC
dr. A.M. Toye University of Bristol
dr. R. van Bruggen Sanquin Research
Faculteit der Geneeskunde

"We adore chaos because we love to produce order."
M.C. Escher


Contents
Chapter 1 General introduction 9
Chapter 2 CD14+ cells from peripheral blood positively regulate hematopoietic stem
and progenitor cell survival resulting in increased erythroid yield
39
Chapter 3 Large-scale in vitro production of red blood cells from human peripheral
blood mononuclear cells
67
Chapter 4 Glucocorticoids induce differentiation of monocytes towards macrophages
that share functional and phenotypical aspects with erythroblastic island
macrophages
91
Chapter 5 The proteomic landscape of erythroblastic island macrophages from
human fetal liver, bone marrow and in vitro cultures
123
Chapter 6 General discussion 145
Appendix Summary
Samenvatting
List of publications
PhD portfolio
Dankwoord
Curriculum Vitae
167
171
177
179
185
191

1

General introduction
CHAPTER 1

Introduction
11
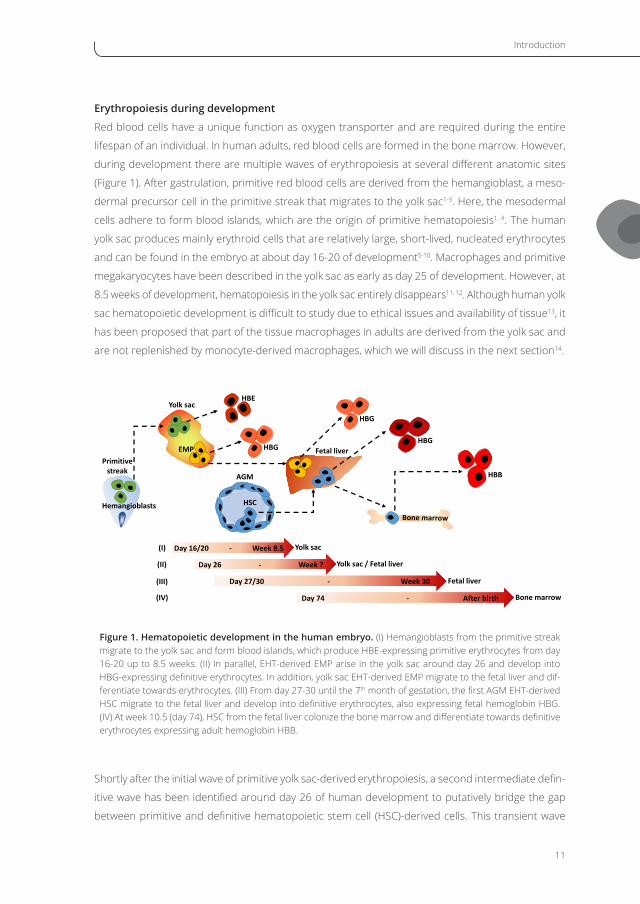
Erythropoiesis during development
Red blood cells have a unique function as oxygen transporter and are required during the entire
lifespan of an individual. In human adults, red blood cells are formed in the bone marrow. However,
during development there are multiple waves of erythropoiesis at several different anatomic sites
(Figure 1). After gastrulation, primitive red blood cells are derived from the hemangioblast, a meso-
dermal precursor cell in the primitive streak that migrates to the yolk sac1-3. Here, the mesodermal
cells adhere to form blood islands, which are the origin of primitive hematopoiesis1, 4. The human
yolk sac produces mainly erythroid cells that are relatively large, short-lived, nucleated erythrocytes
and can be found in the embryo at about day 16-20 of development5-10. Macrophages and primitive
megakaryocytes have been described in the yolk sac as early as day 25 of development. However, at
8.5 weeks of development, hematopoiesis in the yolk sac entirely disappears11, 12. Although human yolk
sac hematopoietic development is difficult to study due to ethical issues and availability of tissue13, it
has been proposed that part of the tissue macrophages in adults are derived from the yolk sac and
are not replenished by monocyte-derived macrophages, which we will discuss in the next section14.
Primitivestreak
Hemangioblasts
Yolk sac
Fetal liver
AGM
Day 16/20 - Week 8.5(I)
Day 27/30 - Week 30(III)
Day 74 - After birth(IV)
HBB
HBGEMP HBG
HBE
HSC
Day 26 - Week ?(II)
HBG
Yolk sac
Yolk sac / Fetal liver
Fetal liver
Bone marrow
Figure 1. Hematopoietic development in the human embryo. (I) Hemangioblasts from the primitive streak migrate to the yolk sac and form blood islands, which produce HBE-expressing primitive erythrocytes from day 16-20 up to 8.5 weeks. (II) In parallel, EHT-derived EMP arise in the yolk sac around day 26 and develop into HBG-expressing definitive erythrocytes. In addition, yolk sac EHT-derived EMP migrate to the fetal liver and dif-ferentiate towards erythrocytes. (III) From day 27-30 until the 7th month of gestation, the first AGM EHT-derived HSC migrate to the fetal liver and develop into definitive erythrocytes, also expressing fetal hemoglobin HBG. (IV) At week 10.5 (day 74), HSC from the fetal liver colonize the bone marrow and differentiate towards definitive erythrocytes expressing adult hemoglobin HBB.
Shortly after the initial wave of primitive yolk sac-derived erythropoiesis, a second intermediate defin-
itive wave has been identified around day 26 of human development to putatively bridge the gap
between primitive and definitive hematopoietic stem cell (HSC)-derived cells. This transient wave
Chapter 1
12
in the yolk sac derives from transient multipotent erythromyeloid progenitors (EMP) that are gen-
erated from hemogenic endothelium in a process called endothelial-to-hematopoietic transition
(EHT). EMP are the first cells to colonize the fetal liver15, 16. Interestingly, this wave produces definitive
erythroblasts with a remarkable in vitro expansion potential in mice (>1 year)17. The first CD34+ HSC
are formed from endothelial cells in the aorta-gonad-mesophrenos (AGM) region through EHT and
start to colonize the liver at day 27 to 30 of development8, 18-24. During this high flux of definitive fetal
liver erythropoiesis from the 9th to the 24th week of gestation25, 26, HSC localize to the bone marrow
at 10.5 weeks of development, which is at time of birth the main organ for erythropoiesis. Erythroid
cells from the different developmental waves can be readily identified due to switching of hemoglobin
subunit expression27. The hemoglobin molecule is a tetramer and consists of two α-like globin peptide
chains and two subunits of the β-like globin peptides. During primitive erythropoiesis in the yolk sac
of the early embryo, abundant expression of the β-like globin epsilon (HBE) and α-like globin zeta
(HBZ) is found in erythroid cells. Thereafter, during production of definitive erythroid cells in the fetal
liver the β-like globin gamma (HBG) is expressed28. However, it must be noted that both EMP-derived
erythroid cells from yolk sac and fetal liver express HBG and thus this cannot be used to discriminate
between the second and third definitive wave. Markers that discriminate between these two definitive
waves or their progeny are in need. After birth, the gamma chain is exchanged for beta-globin (HBB
>97%) or delta-globin (HBD ~3%) and pairs with the alpha-globin (HBA) to form adult hemoglobin29,
30. During aging, the red marrow gets replaced by yellow marrow, and hematopoiesis shifts from the
long bones, to the pelvis, sternum, cranium, and vertebrae.
Within the human bone marrow, the differentiation from stem cell to erythrocyte follows several
stages based on cell morphology, colony forming capacity or marker expression by flow cytometry
(Figure 2). CD34+ HSC first differentiate to multipotent progenitors (MPP), which give rise to either
common lymphoid progenitors (CLP) or common myeloid progenitors (CMP). CLP can generate all
lymphoid cells including T-cell, B-cell and NK-cells31, while CMP can generate all myeloid cells but not
lymphoid cells32, 33. CMP develop into granulocyte-macrophage progenitors (GMP) or differentiate
to megakaryocyte-erythroid progenitors (MEP). All three populations express CD34, however, we
can discriminate between the populations using CD45RA and CD123 in the Lin-CD34+CD38+ cells:
CD123lowCD45RA- CMP, CD123lowCD45RA+ GMP and CD123-CD45RA- MEP32. Another report has been
published using BAH1.1 and CD45RA and described BAH1.1-CD45RA- CMP, BAH1.1-CD45RA+ GMP and
BAH1.1+CD45RA- MEP34. Colony assays also allow to follow commitment of cells to the hematopoietic
lineages. CMP can generate colony forming unit granulocyte, erythrocyte, monocyte (CFU-GEMM)
including all types of myeloid colonies, whereas GMP give granulocyte and macrophage colonies
(CFU-GM) and MEP give rise to the earliest erythroid colonies identified as erythroid burst forming
units or BFU-E. MEP will further develop into CD34-CD71highCD235alow pro-erythroblasts while grad-
ually losing CD34 expression and acquiring high expression of CD7132, 33, 35. Cells between the MEP
and pro-erythroblast stage give rise to colonies of the late-stage erythroid lineage (CFU-E). In addition,
variations to the general hematopoietic differentiation scheme have been emerging lately with the

Introduction
13
availability of single cell RNA-sequencing techniques. In these novel hematopoietic trees, the MEP
population plays a less prominent role, because HSC may directly differentiate into megakaryoid
cells without any precursors in vivo36. Pro-erythroblasts subsequently differentiate into basophilic,
polychromatophilic, and orthochromatic erythroblasts and gradually acquire expression of CD235a
(GPA)6, 37-39. During this process cells become smaller, the nucleus condensates and will be expelled
resulting in an enucleated reticulocyte that loses CD71 and enters the blood stream to mature into
an erythrocyte6. The enucleation process can be followed using the DNA-associated cell permeable
DRAQ5 as a marker for nucleated cells.
HSC MPP CMP MEP Pro Baso Poly Ortho Retic Ery
Bone marrow Circulation
CD235aCD34
DRAQ5
BFU-E
GMP Mono Macro
Neutro
Flow
Cytometry
ColonyAssay
Cellmorphology
CFU-E
CFU-GEMM
CD71
Figure 2. Differentiation of HSC to erythrocytes based on cell morphology, colony assay and flow cytometry. CD34+ HSC develop into CFU-GEMM in the adult bone marrow. Here, the decision is made if cells follow an erythroid differentiation program and differentiate to MEP, or a myeloid program and differentiate to GMP. GMP will further develop into monocytes (Mono) and macrophages (Macro) or neutrophils (Neutro), while MEP further develop into CD71+ pro-erythroblasts (Pro) and differentiate towards basophilic (Baso), polychromatophilic (Poly), and orthochromatic (Ortho) erythroblasts. During erythroid differentiation cells loose CD71 expression, while acquiring expression of CD235a. Orthochromatic erythroblasts enucleate and thereby loose the expression of DRAQ5 and reticulocytes (Retic) enter the blood stream to develop into an erythrocyte (Ery).
After the release of reticulocytes from the bone marrow, the spleen acts as a quality control during the
entire lifespan of the red cell. A small amount of the circulating human reticulocytes have large auto-
phagic vacuoles40. The amount of vacuoles was increased in splenectomized individuals and patients
Chapter 1
14
with sickle cell disease, however, these specific reticulocytes were cleared in a healthy recipient41-43.
This suggests that final remodeling of reticulocytes by removal of the autophagic vacuoles most likely
occurs in the spleen. Extrusion of the autophagic vesicles allows reticulocytes to reduce the surface
area and volume of the cell. It is believed that the autophagic vesicles are phagocytosed by red pulp
macrophages, as clodronate depletion of macrophages inhibits reticulocyte maturation in the circu-
lation44-46. However, Griffiths et al. observed the presence of mature erythrocytes in splenectomized
indivuals, which suggests that the final maturation of reticulocytes could occur independent of splenic
macrophages47. Besides this ill-defined role of splenic macrophages in the removal of autophagic
vesicles from early reticulocytes, splenic macrophages are also known for the clearance of intracellular
inclusions from the red cell membrane and removal of aged red blood cells from the circulation48-53.
In addition, clearance of old erythrocytes and iron recycling has also been observed in the liver54, 55.
During steady-state erythropoiesis, red blood cells are produced at a constant rate of two million
erythrocytes per second and this is restricted to the adult bone marrow in both human and mouse.
However, erythropoiesis in human and mouse is differently regulated during stress erythropoiesis.
Stress-induced erythropoiesis is distinct from basal steady-state erythropoiesis as various types of
stress like hypoxia, hemorrhage or (chronic) anemia induce a rapid production of new erythrocytes,
resulting in restored oxygenation. In humans, both steady-state and stress-induced erythropoiesis
are restricted to the bone marrow. Although some papers suggest that human stress erythropoiesis
also occurs in the spleen56, this has never been confirmed. Splenomegaly that has been observed
during hypoxia is not the result of de novo erythropoiesis, but the release of stored erythrocytes in
the spleen, which has been observed during normobaric hypoxia in humans that showed increased
spleen volume, spleen contraction and erythrocyte release into the bloodstream57. In contrast,
stress-induced erythropoiesis in mice is localized to the extramedullary sites and occurs outside the
medulla of the bone, mainly in the spleen but also the liver is involved58, 59.
Signaling during erythropoiesis
The mechanisms defining the “decision” to differentiate into either one or the other hematopoietic
lineages are not completely known. Currently, it is generally accepted that lineage specific growth
factors allow the survival of specific lineages through concomitant receptor expression. This “permits”
lineage commitment and hence is termed the permissive model. Erythropoietin (EPO) is produced by
the fetal liver and shifts to the kidney after birth and although the kidney produces most EPO (80%)
in adults, the liver retains its ability to produce 10-15% of total EPO production in human, which can
be even further increased to 30% upon stress due to low oxygen levels60, 61. EPO binds and activates
the EPO-receptor (EPOR) on immature erythroid cells and functions as a survival factor during eryth-
roid differentiation62, 63. The importance of EPO has also been shown by Epo-/- or EpoR-/- mice, which
are both embryonically lethal due to lack of mature erythrocytes64, 65. Another key regulator during
erythropoiesis is stem cell factor (SCF), which signals via the mast/stem cell growth factor receptor
KIT (CD117) to enhance growth and survival of erythroid progenitors. Interestingly, SCF in combina-

Introduction
15
tion with EPO has a synergistic effect on erythroid cell proliferation, which relies on synergistic signal
transduction activation64, 66-68. SCF is provided by the stromal niche cells in the bone marrow as a
membrane bound protein. Mutations that allow only soluble SCF display a severe erythroid deficiency
and Kit knockout mice are non-viable at embryonic day 14 due to reduced numbers of erythroid cells
in the fetal liver69. Furthermore, it has been shown that KIT plays a role in EPOR maintenance, which
results in erythroid progenitor survival upon EPO stimulation63. During stress-induced erythropoiesis,
the glucocorticoid receptor (GR) cooperates with KIT and EPOR and induces long-term proliferation
of immature erythroid cells without differentiation68, 70-78. Glucocorticoids, which are the ligands of
the GR, are produced in the adrenal gland. In absence of ligands, the GR is bound to HSP90 and its
co-chaperones and localizes outside the nucleus in the cytoplasm79. HSP90-independent modes of
GR extranuclear localization have been reported and involve direct interaction of the GR with EPOR80.
Binding of glucocorticoids release the GR from HSP90 and enable nuclear translocation. Binding of full
agonists such as hydrocortisone or dexamethasone also enable binding of transcriptional activators
to the C-terminal transactivation domain, while partial (ant)agonists do not81. These latter still enable
nuclear localization and transcriptional activation via the hormone independent N-terminal transac-
tivation domain and enable the repressive function of the GR. The GR requires homodimerization
to be active as a transcription factor that binds the glucocorticoid transactivation element. However,
the GR can also heterodimerise with transcription factors such as STAT5 to bind a compound site
consisting of a half-mer GR site and half-mer STAT5 site81. Although STAT5 plays a prominent role in
erythropoiesis, there is currently no evidence that the GR acts as a GR-STAT5 dimer as it does in the
mammary gland68. Transcriptional repressive and active roles of STAT5 are important in macrophage
functionality, but also here it is unknown if GR-STAT5 oligomers are formed or involved. In addition,
DNA-binding domain independent monomeric GR association with chromatin was found in com-
plex with AP1 or NFκB81. This interaction represses the activity of AP1 and NFκB and is important in
repression of the immune function of macrophages. Stress erythropoiesis requires the activity of the
dimerized GR, because Gr knockout mice or mice expressing a mutant incapable of dimerization (Grdim/
dim) lack any form of stress erythropoiesis and display severely decreased fetal liver erythropoiesis74, 75.
Direction to specific lineages is generally believed to occur via stochastic variations in the concen-
tration of specific transcription factors. A well-known example is the “decision” of CMP to become
GMP or MEP, which depends on the relative levels of PU.1 (GMP direction) and GATA1 (MEP direc-
tion). The transcription factor GATA1 plays a critical role in erythroid development, both in primitive
and definitive erythropoiesis, as disruption of Gata1 in mice results in embryonic lethality due to a
defect in primitive erythropoiesis, while GATA1-/-embryonic stem cell-derived pro-erythroblasts in vitro
develop a block in differentiation82-86. Furthermore, during maturation, it has been shown that both
EPOR and GATA1 levels are increased, especially when cells differentiate from pro-erythroblast into
basophilic erythroblasts. During terminal differentiation from basophilic erythroblasts to erythrocytes,
both GATA1 and EPOR are reduced87-90. Failure to reduce GATA1 impairs erythroid maturation91. In
contrast, PU.1 is a positive regulator of lymphoid and myeloid differentiation and prevents differen-

Chapter 1
16
tiation into the erythroid lineage. PU.1 is still expressed in early erythroid cells, but downregulated
when cells mature92. Ectopic overexpression of PU.1 in erythroblasts inhibits the differentiation and
can result in immortalized erythroblasts93, 94. Another example is the transition of a MEP towards the
erythroid or megakaryoid lineage, which depends on the relative abundance of KLF1 (erythroid) and
FLI1 (megakaryoid). KLF1, the erythroid Krüppel-like factor (or EKLF), is crucial for erythropoiesis as
Klf1-/- mice show defects in hemoglobin metabolism and die around embryonic day 1495, 96. In addi-
tion, FLI1 suppresses erythroid differentiation and direct cells towards the megakaryoid lineage97-100.
Interestingly, recently this transcription factor driven directive model was challenged, as single cell
HSC tracking through differentiation revealed that PU.1 and GATA1 are never expressed at the same
time points during HSC differentiation101.
Erythropoiesis is not only regulated by intrinsic and soluble extrinsic factors, but also by cell-cell inter-
actions. During the development from HSC to erythrocyte, the microenvironment plays a crucial role
as macrophages in the stroma, which are located near the HSC in the bone marrow, affect HSC and
erythroid cells through ill-defined mechanisms. It is important to know the underlying mechanisms
of erythroid-macrophage interactions, as this could help optimizing red blood cell cultures. In the
next sections, we focus on these supporting macrophages and give an overview of their origin, char-
acterization in mice and human and their role in the HSC and erythroid niche in the bone marrow.
Tissue resident macrophages and their origin
The bone marrow is a complex organ devoted to the generation of all blood cells. It is divided in var-
ious compartments or niches, presumably dependent on the presence of different cell populations,
secreted cytokines and chemokines. Within the bone marrow, hematopoietic stem and progenitor
cell (HSPC) homeostasis and erythropoiesis are co-regulated by macrophages. Macrophages are key
regulators of both innate and adaptive immunity, however, they are also known for their role in tissue
homeostasis, development and malignancy. Dependent on cues in the microenvironment, monocytic
cells differentiate into macrophages with various phenotypes and functions, and migrate to different
tissues. In 2000, Mills et al. described a model for macrophage activation in which two major opposing
macrophage activities were classified into subtypes: classical M1 or alternative M2 macrophages102.
M1 macrophages inhibit cell proliferation and induce a pro-inflammatory response, while M2 mac-
rophages are anti-inflammatory, promote cell proliferation and are known to be involved in tissue
repair and wound healing103-107. The M1/M2 model has been used predominantly as it is a simple way
to distinguish between the two functional properties of macrophages. However, it depicts M1 and
M2 activation as clearly distinct processes, while macrophage polarization is more complex108. For
instance, the M2 population has been further divided into M2a-d macrophages based on inducing
agents, marker expression and functionality irrespective of tissue residence109-111. This sub-classifi-
cation becomes even more complex upon describing resident macrophages in different tissues as
marker expression and functionality can be influenced by the specific niche in which these macro-
phages reside. This results in an array of different notifications and classifications for tissue resident

Introduction
17
macrophages making generalizations like the M2 sub-classification rather limited and oversimplified.
In the following sections, we will describe the different macrophages based on marker expression
and functionality and will refrain from classical definitions like M1 and M2.
Based on their origin, tissue resident macrophages can be divided into two subsets. One derives from
the yolk sac and is maintained by self-renewal and proliferation. Another population originates from
bone marrow myelopoiesis and from resulting circulating monocytes112. These monocytes are a het-
erogeneous group consisting of three subsets, the classical CD14++CD16-, intermediate CD14++CD16+
and non-classical CD14+CD16+ monocytes113, 114. The non-classical monocytes are known for their
patrolling function in the tissues and are therefore suggested to differentiate into resident macro-
phage populations that function in wound healing and tissue repair115. Until recently, it was believed
that all macrophages including tissue resident macrophages derived from monocytes. However,
the complexity and heterogeneity of macrophages have been underestimated. In the last decade,
interest has been grown to understand the development, relationship, function and origin of the
different macrophage subsets within the different tissues. The dogma, which came into existence
during the 1960s and 1970s, is increasingly challenged. This dogma dictates that tissue resident
macrophages derive from de novo monocytes produced during myelopoiesis from definitive HSC in
the bone marrow116, although the same researchers already in 1984 showed that macrophages in
the spleen had dual origins, some were derived from monocytes while others were dependent on
self-renewal117. The general 20th century simplistic view of HSC differentiating to a CMP which further
matures to a GMP and subsequently monocytes that exit the bone marrow has gained in resolution
with the discovery of a clonogenic progenitor118. This progenitor gives rise to monocytes, macro-
phages, and dendritic cells119, and more recently to a monocyte-restricted bone marrow precursor
termed common monocyte progenitor (cMOP)120. In any case, de novo monocytes may then home to
their respective tissues and further differentiate into tissue resident macrophages or pro-inflamma-
tory macrophages depending on the systemic need116, 121, 122. Nevertheless, several lacunae concerning
the presumed bone marrow origin of tissue resident macrophages within this dogma remained.
Hashimoto et al. reported that recovery of specific tissue resident macrophages (e.g., microglia or
Langerhans cells) after tissue damage did not involve donor cells but appeared to be of host origin112.
Interestingly, monocytopenic mice present with normal macrophage distributions in the tissues123.
Several other authors showed persistent and maintained macrophage populations independent of
monocyte production112, 124-134. These results suggested that certain macrophage populations did not
arise from de novo generated bone marrow monocytes. Further investigation using i) parabiotic mice,
ii) selective ablation using specific macrophage markers, iii) gene expression analysis, and iv) single
population tracing led to the notion that a selection of tissue macrophages are derived independently
from bone marrow myelopoiesis112. Surprisingly, these cells are able to undergo renewal divisions
in order to repopulate the tissue after injury or insult to the tissue. Phenotypically these cells are
completely different from the inflammatory macrophage108. Interestingly, host-derived recovery of
macrophages in specific tissues after whole body irradiation prior to bone marrow transplantations
Chapter 1
18
of mice can arise independently which suggests the presence of bone marrow myeolopoiesis-inde-
pendent macrophages. The origin of these specific macrophages, their renewal capacity, signaling
cues that maintain these cells and whether the tissue resident effector cell and renewal population
are different entities are currently vividly pursuited within the field. Recently, it has been shown that
minor populations of macrophages in specific tissues are originating from yolk sac myelopoiesis and
derive prior to the establishment of definitive HSC-dependent hematopoiesis14, 112. It suggests that a
subset of macrophages finds their origin in early embryogenesis and maintains their tissue presence,
functionality and renewal capacity throughout adulthood. Indeed, fate-mapping studies now show
that macrophages are present in skin, brain and other tissues before the onset of monocytes in the
bone marrow112, 129, 131, 135. Arterial macrophages are mainly generated from early and late EMP derived
from the yolk sac126, while intestinal macrophages are maintained by constant replenishment of
monocytes136. In addition, the first Langerhans cells are thought to derive from yolk sac EMP-derived
macrophages that migrate to the skin and are exchanged by fetal liver monocytes after the second
wave of hematopoiesis124, 137. This suggests that there could be even three sources of macrophages:
yolk sac-derived macrophages, and fetal liver or adult bone marrow-derived monocytes that differ-
entiate into macrophages in the tissue138, 139. The contribution of these embryo-derived macrophages
to tissue functionality and regeneration in particularly must be resolved in order to understand their
role in tissue homeostasis as well as in pathological conditions. Indeed, the importance of host-tissue
resident macrophages persistence can be clinically important140. One of these studies indicated that
host Langerhans cells in the skin may remain after bone marrow transplantation in patients, the
persistence of these cells is highly correlated with severity of graft-versus-host disease140, 141. In addi-
tion, the bone marrow-independent origin of these macrophages places serious constraints on the
ability of in vitro differentiation model systems to generate and study tissue resident macrophages.
To establish if other tissues are equally affected, the different macrophage populations in human
tissues must be characterized phenotypically, functionally and upon tissue insult. In addition, it is
unknown if these specific macrophages are able to transmigrate to different tissues. This is difficult
to assess as macrophage identity depends on the tissue niche and markers may differ from tissue
to tissue but also during transit from one tissue to the other. However, Hashimoto et al. showed that
exchange of macrophages between tissue is limited in parabiotic mice112. In conclusion, the monocyte/
macrophage system needs to be overhauled and hierarchically reclassified to include the novel class
of bone marrow hematopoietic-independent tissue resident (embryonic) macrophage populations.
Hematopoiesis and specifically erythropoiesis is inseparably connected with nursing macrophages
and the total erythroid flux may thus also dependent on the availability and regulation of these specific
macrophages. Next, we will review two important niches in which macrophages have been observed.
Macrophages within the stem cell niche
HSC reside in specific distinct microenvironments in the bone marrow, however these niches are
poorly understood as characterization of the specific locations within the bone marrow is difficult
to visualize and study in vivo as well as ex vivo. Although the markers that define HSC have been
Introduction
19
relatively well characterized in mice142, the markers that define human long-term repopulating HSC
have not been properly identified and these cells are currently mostly defined as lineage-negative
CD34+CD38- cells with inclusion of several other markers like CD49d, CD117, CD133 and the ability to
expel Hoechst through multi-drug resistance receptors143, 144. Some HSC have been found as single
cells in the trabecular cavities of the long bones. Others have been found in a highly vascularized
area towards the center of the bone marrow145-147. The bone marrow contains a set of bone marrow
resident macrophages of which some reside within the main HSC niches: the endosteal and peri-
vascular niche. Within these niches stroma provide the optimal environment for the bone marrow
and support the maintenance of HSC. These stromal cells contain osteoblasts, CXCL12-abundant
reticular cells (CAR cells), endothelial cells and macrophages. 60% of the long-term repopulating HSC
are localized near the vasculature, close to the endothelium lining the sinusoids148. The sinusoids
can be found close to the endosteal niche, but are more likely to be located at greater distances
and contain CAR cells that secrete factors to promote self-renewal of HSC. This perivascular niche
includes the sinusoids in the bone marrow and contains a specific subset of macrophages that sup-
port maintenance and proliferation of mesenchymal stem cells (MSC). In addition, they instruct HSC
to reside in the bone marrow149.
The endosteal niche contains quiescent HSC and is located in the proximity of the bone surface,
where osteoblasts line the membrane. This niche contains a specific subset of tissue resident mac-
rophages referred to as osteal macrophages or osteomacs which play diverse roles in bone biology.
Osteomacs can be found immediately adjacent to osteoblasts and regulate bone formation and
homeostasis. Furthermore, they regulate maintenance and proliferation of Nestin+ MSC. These
MSC express a variety of HSC retention factors and it is thought that macrophages ‘talk’ to MSC via
unknown secreted factors, excluding IL1, IL10, TNFα, and insulin-like growth factor 1 (IGF1), result-
ing in HSC retention in the bone marrow150-152. Indeed, macrophage Fas-induced apoptosis (MAFIA)
mice lack osteomacs and as a consequence have increased mobilized HSC151, 153. Ablation of CD169+
macrophages leads to HSC mobilization and defects in erythropoiesis154, 155. In mice, osteomacs have
been characterized by the expression of a variety of markers and it has been suggested to have a
counterpart in humans. Osteomacs are positive for F4/80, CD169, vascular cell adhesion molecule 1
(VCAM1), CD11b, CD68, CD115, macrophage-3 antigen (MAC3) and are negative for tartarate-resistant
acid phosphatase (TRAP)151, 154, 156. The commonly used marker F4/80 for murine macrophages has
a human ortholog, an EGF-like module containing mucin-like hormone receptor 1 (EMR1). However,
expression of EMR1 is absent on mononuclear phagocytic cells and is only restricted to eosinophilic
granulocytes157. EMR1 can therefore not be used to define human macrophages. In human bone
marrow, Chow et al. describes a macrophage population that shares characteristics with murine
bone marrow macrophages. The human ortholog for CD169+VCAM1+ murine macrophages was
identified as CD15-CD163+VCAM1+CD169+ human bone marrow macrophages155. It was believed
that the murine macrophages described by Winkler et al.151 were different from the murine CD169+
macrophages by Chow et al.158, however, as both macrophages have a similar function, share a sim-

Chapter 1
20
ilar marker expression profile, and are both located close to the bone and osteoblasts, we suggest
CD169+VCAM1+ macrophages described by Chow et al. could in fact be osteomacs. Haldar et al.
described a bone marrow macrophage population in mice with a similar molecular expression profile
compared to osteomacs (expression of F4/80+VCAM1+CD68+CD169+CD11blow) of which the devel-
opment is dependent on SPI-C transcription factor159. SPI-C was highly expressed in these specific
macrophages as well as red pulp macrophages in the spleen and mice deficient for Spi-c lack both
bone marrow and spleen macrophages159, 160.
Table 1. The different bone marrow macrophage populations present in human and mice based on key cell surface markers and functionality.
Mouse bone marrow macrophages
Name Phenotype Function
Bone marrow macrophages
Gr1+ CD115int F4/80+ CD169+ MHCIIint CD11cint CD68int CD11blow CX3CR1-
Maintenance and retention of HSC in bone marrow154
Tissue resident macrophages
CD169+ VCAM1+ F4/80+ TRAP- Support erythropoiesis155
Osteomacs F4/80+ CD115+ MAC3+ CD68+
F4/80+ CD11b+ Ly6G+
G-CSFR+ CD68+
Lining endosteal/periosteal bone surfaces, regulate osteoblast function150, 152
Maintenance of HSC niches and HSC retention151, 153
Support growth/survival of osteoblasts and inhibit HSPC mobilization156
Tissue resident SPI-C expressing macrophages
F4/80+ VCAM1+ CD68+ CD169+ CD11blow MHCIIint TREML4+ Zbtb46-
Heme degradation and iron recycling159
Bone marrow resident macrophages and monocytes
CD11b+ CX3CR1+ COX2+ a-SMA+ Ly6Cint/low CD115+ CD150+
Adjacent to HSPC and support maintenance and protection of HSPC from exhaustion during stress161
Central macrophages F4/80+ VCAM1+ CD169+ CD163+ Promote pro-erythroblast proliferation in erythroblastic islands155, 162-164
Human bone marrow macrophages
Name Phenotype Function
Osteomacs CD68+ Support osteoblast-mediated bone formation150
Tissue resident macrophages
CD45+ CD169+ VCAM1+ CD163+ CD15-
Unknown, might play a similar role as tissue resident macrophages in mice155
Central macrophages FcRI-III+ CD4+ CD31+ CD11a+ CD11c+ CD18+ HLA-DR+
Support pro-erythroblast proliferation in erythroblastic islands163
In monocytes, Spi-c is repressed by BACH1, however, when heme levels increase BACH1 protein in
monocytes is degraded. Spi-c is no longer repressed and monocytes differentiate to either bone
marrow or red pulp macrophages. When these macrophage numbers increase, heme will be removed
and Spi-c will be repressed by BACH1 which will stop monocyte differentiation159, 160. Whether this
mechanism is similar in all SPI-C expressing monocytes or whether it is restricted to a particular

Introduction
21
monocyte subset is still unclear. Ludin et al. identified a rare activated bone marrow monocyte and
macrophage subset in mice expressing the α-smooth muscle actin and cyclooxyrgenase 2 (COX2)161.
These cells were adjacent to HSC and have been shown to promote the expression of CXCL12 in
perivascular Nestin-positive cells and possibly the maintenance and protection of HSC from exhaus-
tion during stress. The different bone marrow macrophages identified in human and mice have been
summarized in Table 1 and show the complexity and lack of uniform descriptions. There is a need
for an in depth characterization of (bone marrow) macrophages with the use of cell surface markers,
flow cytometry and/or proteomics to allow further research into the roles of these putative different
macrophage population within the tissues and specifically the hematopoietic tissues as studied in
this thesis.
Macrophages within erythroblastic islands
The erythroblast island is a specific structure in the bone marrow comprising of a central macro-
phage surrounded by erythroid precursors at different stages of terminal differentiation. Bessis et al.
first described erythroblastic islands as the specialized microenvironmental compartments in which
mammalian erythroblasts proliferate and differentiate during their second stage of maturation165.
These islands consist of a central macrophage that extends cytoplasmic protrusions to a ring of
surrounding erythroblasts166. Erythroblastic islands have been demonstrated in vivo at all sites of
human definitive erythropoiesis (e.g., in the fetal liver and bone marrow). In addition, erythroblastic
islands may be reconstituted ex vivo upon culturing bone marrow or peripheral blood mononuclear
cells (PBMC) resulting in simultaneous differentiation of HSC into erythroblasts and monocytes into
specific macrophages162, 167. This latter process is dependent on glucocorticoid directed differentiation
of CD34+ cells. Bone marrow central macrophages support erythropoiesis by regulating erythroid
proliferation, differentiation, and enucleation and are believed to clear the expelled erythroid nuclei
surrounded by plasma membrane (or pyrenocytes) resulting from the enucleation process168, 169.
These islands, although one would expect them to reside near the sinusoidal capillary lumen as
reticulocytes will be released into the blood stream, are actually evenly distributed across the bone
marrow170. Quantitative light and electron microscopy of rat bone marrow indeed showed a differ-
ence in the composition of islands adjacent and nonadjacent to the sinusoids. Nonadjacent islands
contain more pro-erythroblasts, adjacent islands are rich in orthochromatophilic erythroblasts, while
the numbers of basophilic and polychromatophilic erythroblasts are comparable in both171. This
remarkable finding suggests dynamic islands which are able to migrate to the sinusoids when cells
within the island maturate. Islands harvested from human bone marrow contain 5-30 erythroblasts
per island. Morphologically, central macrophages are relatively large with many extrusion to facilitate
15-25 erythroid cells172. Phenotypically, these macrophages are relatively well-described in humans
and seem to express a set of M2 macrophage markers like CD163, CD169 and CD206112, 173-175. Fur-
thermore, they have been described to express Fc-receptor I-III, CD4, CD11a,bdim,c, CD18, CD31, CD36,
and HLA-DR (Table 1), however, there is no respiratory burst activity reminiscent of pro-inflammatory
macrophages and they do not express C2b or CD35163, 172.
Chapter 1
22
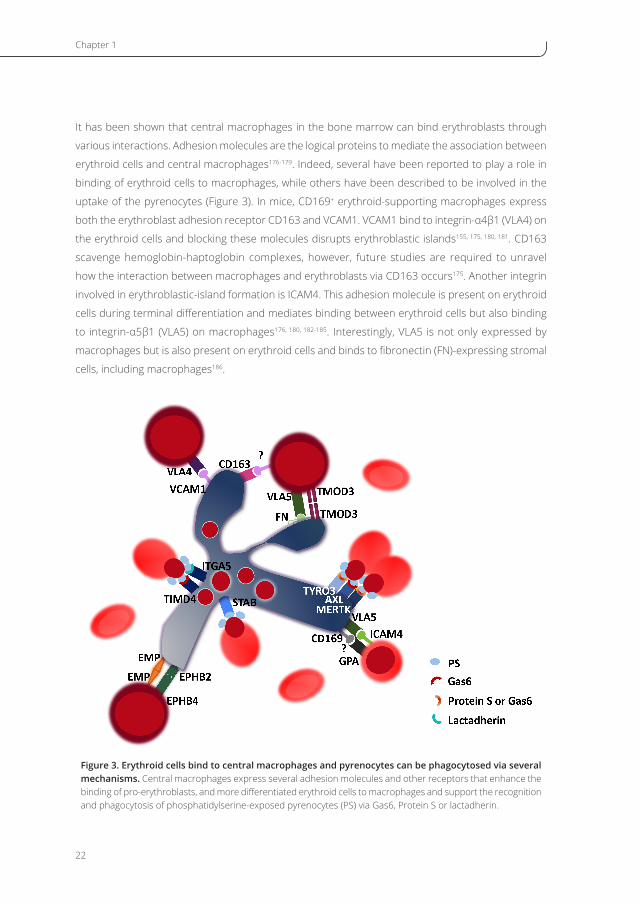
It has been shown that central macrophages in the bone marrow can bind erythroblasts through
various interactions. Adhesion molecules are the logical proteins to mediate the association between
erythroid cells and central macrophages176-179. Indeed, several have been reported to play a role in
binding of erythroid cells to macrophages, while others have been described to be involved in the
uptake of the pyrenocytes (Figure 3). In mice, CD169+ erythroid-supporting macrophages express
both the erythroblast adhesion receptor CD163 and VCAM1. VCAM1 bind to integrin-α4β1 (VLA4) on
the erythroid cells and blocking these molecules disrupts erythroblastic islands155, 175, 180, 181. CD163
scavenge hemoglobin-haptoglobin complexes, however, future studies are required to unravel
how the interaction between macrophages and erythroblasts via CD163 occurs175. Another integrin
involved in erythroblastic-island formation is ICAM4. This adhesion molecule is present on erythroid
cells during terminal differentiation and mediates binding between erythroid cells but also binding
to integrin-α5β1 (VLA5) on macrophages176, 180, 182-185. Interestingly, VLA5 is not only expressed by
macrophages but is also present on erythroid cells and binds to fibronectin (FN)-expressing stromal
cells, including macrophages186.
Figure 3. Erythroid cells bind to central macrophages and pyrenocytes can be phagocytosed via several mechanisms. Central macrophages express several adhesion molecules and other receptors that enhance the binding of pro-erythroblasts, and more differentiated erythroid cells to macrophages and support the recognition and phagocytosis of phosphatidylserine-exposed pyrenocytes (PS) via Gas6, Protein S or lactadherin.

Introduction
23
Other interactions are facilitated by the macrophage erythroblast attacher (MAEA), also known as
erythroblast macrophage protein (EMP), which is present on both macrophages and erythroid cells.
EMP-EMP interactions are involved in the tight binding of erythroid cells to macrophages and Emp-de-
ficient mice die perinatally due to a reduction in erythroblastic islands176, 187, 188. Recently, Sui et al.
reported that tropomodulin 3 (TMOD3) is present on both macrophages and erythroid cells in the
fetal liver and plays an important role in erythroblastic island formation. Tmod3-/- mice have defec-
tive adhesive interactions in erythroblastic islands in the fetal liver, resulting in impaired terminal
erythroid differentiation, survival, cell-cycle progression and reduced enucleation in erythroblasts189.
It is also thought that ephrins play a role in erythroblastic islands. Ephrin type-B receptor 4 (EPHB4)
is expressed on the early CD34+CD117+ HSPC cells from cord blood and bind to EPHB2 ligand-ex-
pressing macrophages. This results in a fast differentiation towards mature erythroid cells, while the
cells immediately downregulate EPHB4 and detach from the EPHB2 expressing cells190. Interestingly,
EPHB4-positive erythroid cells can also bind EPHB2-negative stromal cells, however, the erythroid cells
remained positive for EPHB4. Another study showed that the EPHB4-EPHB2 interaction is required
for bone marrow HSPC mobilization to the blood191. In addition, EPHB4 has been described as an
alternative candidate for EPOR, which stimulated by EPO increase human ovarian and breast tumor
growth192.
As described in the first section, erythroid cells gain expression of CD235a during terminal matura-
tion. It has been shown that CD235a+ erythroid cells engage via SIGLEC9 on neutrophils. A similar
mechanism may be involved in the binding of GPA-expressing erythroid cells to CD169 (SIGLEC1)
on macrophages193. Furthermore, in this late stage of erythropoiesis VLA4 and VLA5 expression on
erythroid cells is downregulated, presumably to facilitate reticulocyte release from the islands and
stroma to enter the blood stream where reticulocytes further mature into biconcave erythrocytes194,
195. Late in human erythroid differentiation Lutheran (BCAM) is expressed, which can bind laminin
10/11 localized at the bone marrow sinusoids to facilitate entrance into the peripheral circulation196,
197. Besides regulating erythroid output, another function of the central macrophage is pyrenocyte
phagocytosis during enucleation. In mice, clearance of pyrenocytes occurs via the TAM-receptor family
of tyrosine kinases TYRO3, AXL, and MERTK on central macrophages. Pyrenocytes expose phosphati-
dylserine (PS) and will be recognized via MERTK or TYRO3 in a protein S or GAS6-dependent manner,
whereas AXL only recognizes GAS6168, 169. The TAM-receptors play an important role in the phagocytic
ability of macrophages, however, MerTK-deficient mice do not show a defect in pyrenocyte clearance
suggesting that TAM-receptor family members AXL and TYRO3 may cause redundancy or other
compensatory in vivo mechanisms are present that have not been elucidated yet198. Indeed, mice
with a triple knock-out of all TAM-receptors fail to clear apoptotic cells in multiple tissues. These mice
develop normally, but eventually develop autoimmunity like systemic lupus erythematosus (SLE)199.
This is in line with studies that showed that SLE has been associated with failure of macrophages to
phagocytose apoptotic cells and pyrenocytes in both human and mice200-203. In addition, anemia is
found in about 50% of SLE patients and Toda et al. showed that embryos suffer from severe anemia

Chapter 1
24
caused by failure of macrophages to phagocytose pyrenocytes204. Besides the TAM-receptors, other
receptors have been shown to play a role in clearance of apoptotic bodies, such as TIMD4 which
binds phosphatidylserine-exposed pyrenocytes via GAS6 and stabilin (STAB), which directly binds to
phosphatidylserine205-207. In addition, integrin-α5 (ITGA5) expressed on macrophages can also recog-
nize PS-exposed pyrenocytes via lactadherin208.
Although the origin of erythroblastic island macrophages is unknown, they already appear in the
fetal liver prior to HSC homing. This suggests that these fetal liver macrophages may originate from
the first wave of HSC-independent hematopoiesis in the yolk sac14 209. However, studies with adult
Mcsf-deficientop/op mice showed a reduction in the amount of bone marrow resident macrophages
suggesting an HSC-dependent origin of tissue resident macrophages in adults210. The cues that
drive central macrophage differentiation from the HSC are still unknown. Ramos et al. described the
necessity of retinoblastoma (RB) mediated downregulation of PU.1 target gene inhibition through
inhibitor-of-differentiation 2 (ID2) for terminal differentiation of central macrophages211. However,
the origin of central macrophages, cues that regulate differentiation towards central macrophages
and the regulation of central macrophage numbers in the bone marrow remain ill-defined, and is in
need of more directed research. In fact, a general characterization of human fetal and bone marrow
erythroid island macrophages has not been performed and would be an excellent starting point for
further studies.
Do central macrophages primarily regulate erythropoiesis in response to anemia?
Interestingly, specific diphtheria toxin (DTX) mediated ablation of CD169+ macrophages, thus also
ablating central macrophages, results in perturbed erythropoiesis albeit without anemia. Lack of
anemia may be partly attributed to decreased clearance of aged erythrocytes in the spleen as splenic
macrophages responsible for clearance and reticulocyte quality control will also be ablated112, 212, 213.
Although macrophages are implicated in the process of erythropoiesis, the absence of anemia after
CD169+ macrophage ablation clearly shows that erythropoiesis can exist without a central macro-
phage. Indeed, in vitro erythropoiesis can be performed from CD34+ cells from HS(P)C isolated from
PBMC resulting in enucleated reticulocytes that can be used for transfusion purposes75, 77, 214, 215. In
addition, not all erythroid cells in the bone marrow interact with a macrophage216. In agreement
with this, Choi et al. showed that physical interactions between erythroid cells mediated through
the association of ICAM4 with Rho GTPase activating protein DLC1 during high density cultures
increased the enucleation and survival rate and thus ensures autonomous erythroid differentiation217.
These data indicate that central macrophages are largely dispensable for steady-state erythroblast
differentiation towards reticulocytes which includes the process of enucleation. However, induction
of anemia through e.g., phenylhydrazide treatments shows impaired erythroid recovery upon mac-
rophage ablation, indicating that fast responses to alter bone marrow erythroid output is regulated
by and dependent on the presence of the central macrophages112, 211. Interestingly, Rb-deficient mice
die perinatally due to defective erythropoiesis218 caused by a perturbed differentiation of fetal liver

Introduction
25
central macrophages leading to absence of erythroid islands. Deficiency in Id2, directing the inhibi-
tory function of PU.1 on specific target genes, rescued the defect observed in Rb-deficient fetal liver
macrophages. In addition, in Emp-deficient mice the interaction between macrophages and erythroid
cells is also perturbed. These mice also die perinatally, however, this is also partly attributed to an
intrinsic defect in enucleation176. These studies show that erythroid macrophage interactions are cru-
cial during ontogeny. At first glance these results look contradictory to adult erythropoiesis in which
the contribution of central macrophages to erythropoiesis is limited during steady-state. However,
as indicated the necessity of the central macrophage is clearly shown during stress erythropoiesis,
a time of severely increased erythroid output. Parallels to the enormous erythroid flux in fetal liver
necessary to produce sufficient erythrocytes demanded by the developing fetus and stress eryth-
ropoiesis in adults can be made and suggests that central macrophages are crucially important for
erythroid regenerative capacity. Indeed, recently it was shown that the erythrocytosis phenotype in
Polycythemia Vera (PV) can be reversed upon clodronate-containing liposomes mediated ablation of
macrophages carrying the Jak2V617F mutation, clearly indicating a role for macrophages in the patho-
physiology of PV211. Furthermore, the data showed that the proliferation of cells from patients with
this JAK2V617F mutation was increased upon co-culturing with macrophages. This notion is strengthened
by the observation that mice with these aberrant central macrophages have a PV-like phenotype211.
Sufficient macrophage-independent erythropoiesis
Stress erythropoiesisSteady state erythropoiesis
Anemia
+
Macrophage ablation
Poor and severely delayed recovery from anemia
--
Macrophage ablation-
CA
B D
Figure 4. Normal steady-state erythropoiesis consists of macrophage-dependent and independent eryth-ropoiesis. (A) Upon ablation of macrophages (B), macrophage-independent erythroid flux produces sufficient erythrocytes. However, upon anemia or stress, macrophage-dependent erythropoiesis is needed to adequately respond to produce enough erythrocytes to alleviate the shortage (C). Myeloablation, but also bone marrow transplantations that eliminate central macrophages which leads to the inability to respond to anemia and results in (severe) delay in recovery from anemia (D). Of note, we hypothesize the increase in macrophages in panel C.

Chapter 1
26
In addition, macrophage depletion in β-thalassemia mice lead to reduced erythroid proliferation
and reduced reticulocytosis, while erythroid differentiation was increased resulting in increased red
blood cells because of increased red blood cell survival and lifespan. Combined, these studies sug-
gest that central macrophage numbers and functionality regulates the response to anemia and puts
the central macrophage in the center spot of stress-induced erythropoiesis (Figure 4). However, it
remains unclear if erythroid cells dictate the number of central macrophages or if the number of
central macrophages dictate the erythroid flux. In addition, what regulates the number of central
macrophages in the bone marrow and can their number be pharmacologically influenced? These are
important but unaddressed questions to which the answers may have implications in disease treat-
ments. Models to facilitate investigating erythroid-macrophage interactions are not readily available
as to date, central, particularly human, macrophages are ill-defined. This results in a lack of studies
on culturing central macrophage-like cells in order to unravel the underlying mechanisms involved
in the erythroid-supportive function of central macrophages.
Macrophages after bone marrow transplantation
Macrophages have a prominent role during hematopoietic homeostasis within the bone marrow, which
also suggests that they control hematopoietic regeneration after bone marrow transplantation. Mac-
rophages may play a decisive role in hematopoietic recovery as conditioning before bone marrow
transplantation almost always involves myeloablative treatments. The different origins of tissue macro-
phages may also define specific macrophage populations within the adult bone marrow. It is expected
that myeloablation leads to the destruction of bone marrow resident macrophages, however, limited
data is present on the survival of the specific subsets or the recovery of macrophages within the bone
marrow after transplantation. In addition, it is unknown if specific subsets are derived from host or
donor. Langerhans cells were shown to resist high doses of irradiation and repopulate from the host
after congenic bone marrow transplantation, whereas monocytes were all of donor origin219. Similar
results have been observed for microglia220, 221, suggesting that both populations maintain themselves
independently of the contribution of bone marrow-derived circulating precursors, even after exposure
to lethal doses of irradiation. However, microglia can repopulate from bone marrow-derived myelopoi-
esis as donor microglia were found in the brain of transplanted mice indicating that at least a portion
of the microglia in the brain can be repopulated from bone marrow-derived hematopoiesis222. Interest-
ingly, treatment with EPO in the first weeks after transplantation does not result in faster recovery from
anemia223, 224. Indeed, in the first weeks after transplantation, high endogenous EPO levels in plasma
do not induce fast recovery indicating that erythropoiesis is severely perturbed in the first month after
transplantation. On the other hand, EPO treatment after this first month does lead to increased eryth-
roid recovery compared to non-treated patients225 which suggests that the erythroid system is only
able to respond to EPO after an initial period of regeneration. One study suggested that the number
of CD68+ macrophages after bone marrow transplantation correlates with erythroid flux in the bone
marrow226. Taken into account that the crucial role of the central macrophage in the regulation of stress
erythropoiesis facilitates rapid responses to anemia, it would be interesting to evaluate the number

Introduction
27
of central macrophages within the bone marrow after transplantation as the regeneration of central
macrophages and the response to EPO may be connected. Besides this tentative connection, these data
also suggest that central macrophages are lost during bone marrow ablation therapies and may be de
novo generated226. This makes the prospect of differentiating these cells from CD34+ HSC a possibility,
if the cues that dictate differentiation to these macrophage subsets are known, which is presently not
the case. In addition, increasing evidence suggests that besides central macrophages also osteomacs
within the HSC niche are ablated after chemotherapy resulting in a decreased functionality of the niche.
Therefore, it would be reasonable to conclude that homing of HSC to the bone marrow is affected due
to the absence of specific macrophages and thus selective protection or co-transplantation of these
macrophages may increase the transplantation efficiency and hematopoietic recovery. Of note, granu-
locyte colony stimulating factor (G-CSF) also efficiently mobilizes the macrophages that are responsible
for HSC retention in mice. These macrophages have been characterized by the expression of CX3CR1
(the fractalkine receptor), CSF-1R, or CD11b156, 227. This enables purification and isolation of these specific
macrophages from peripheral blood112, 151, 156 which can be used to understand the interaction between
macrophages and HSC. In addition, inhibitory measures can be developed that disrupt the interaction,
thereby only mobilize HSC and keep part of the HSC niche intact to receive the transplanted HSC.
Scope of this thesis
Annually, nearly 400.000 volunteer blood donations are made in the Netherlands228, however, in
future shortage of blood products may develop due to an increased need or decline in donor num-
bers in an aging population229-232. In addition, safe products for transfusion-dependent alloimmunized
patients, for which compatible donor blood is missing, are needed. In particular for patients with sickle
cell disease, that have been alloimmunized against different alloantigens by previous blood transfu-
sions, it can be difficult to find compatible blood. Therefore, research to in vitro generated, specific
matched blood group units of erythrocytes is essential to obtain a degree of donor independency
and to minimize donor-patient blood type variation. However, it is technically challenging to reach
red cell quantities that make up a unit of red blood cells given for transfusion.
Erythroid development in vivo requires support from surrounding cells, such as macrophages. How-
ever, the stage during which support cells influence erythropoiesis is not clearly defined and molecular
events that underlie these support functions are ill-defined. We have previously shown that the
erythroid yield from total PBMC is 10-15 fold increased compared to CD34+ cells isolated from a
similar amount of PBMC77. PBMC consist of several effector cells of which mainly CD3+ T cells, CD14+
monocytes/macrophages and CD19+ B cells. It has been shown that macrophages play an important
role during erythropoiesis, as central macrophages in erythroblastic islands support the erythroid
proliferation, differentiation and enucleation. In order to further optimize erythroid cultures, we aim
to examine if CD14+ monocytes/macrophages from PBMC could increase the erythroid yield and if so,
how these cells inflict their effect. As the erythroid cultures start from PBMC, CD34+ HSC in PBMC will
differentiate towards CD71+CD235a+ erythroblasts after 8 days of culture. This indicates that effector

Chapter 1
28
cells could affect the early HSC and/or more differentiated cells. We therefore aim to provide a new
flow cytometry panel in order to track the differentiation from HSC to erythroblast and investigate in
which stage effector cells inflect their effect (chapter 2).
In order to obtain massive amounts of red blood cells for routine red blood cell production, we aim
to further optimize erythroid culture systems to increase erythroid expansion, differentiation and
enucleation. We therefore divided the culture system in three phases: i) from HSPC to erythroblasts, ii)
expansion of erythroblasts and iii) differentiation of erythroblasts to erythrocytes. Within these stages
we examined when and which supplements had to be added to the culture for optimal erythroid
outgrowth. Furthermore, we explored alternative culture systems (bioreactors) as culturing large
numbers of red cells from culture dishes is infeasible (chapter 3).
Although the importance of central macrophages during erythropoiesis has been reported since the
80s, to date, these macrophages are still ill-defined in humans. In addition, there is no convenient human
model to study the interaction between macrophages and erythroid cells in erythroblastic islands. As
ex vivo central macrophages are difficult to obtain and culture conditions could affect the macrophage
phenotype, we investigated if human CD14+ monocytes could be differentiated towards erythroid-sup-
porting macrophages that function as erythroblastic island macrophages. Erythroid intrinsic effects of
glucocorticoids have been well documented, but it is also known that glucocorticoids affect monocyte
differentiation and macrophage function. As a dual role for glucocorticoids on the process of eryth-
ropoiesis may be present, we investigated the role of glucocorticoids on monocyte differentiation to
macrophages in comparison to cells that have been cultured in the absence of glucocorticoids. In order
to relate these cells to their in vivo counterparts, these macrophages were phenotypically characterized
and compared to fetal liver and adult bone marrow macrophages (chapter 4).
Most studies on erythroblastic island macrophages in the bone marrow or fetal liver have only been
described in mice. As a result, the human counterparts are still ill-characterized. In addition, it is
important to make a comparison between erythroblastic island macrophages from the fetal liver
(week 17-22), adult bone marrow and in vitro cultures, as these macrophages all share an eryth-
roid-support function. This data will give new insights which are relevant for both the erythroid and
the macrophage field. Therefore, we aimed to start an unbiased analysis of the proteome of human
macrophage populations from fetal liver and bone marrow and compare this to in vitro cultured
erythroid-supporting macrophages. This will give clues about the possible underlying mechanisms
and processes by which macrophages interact with erythroid cells and facilitate erythropoiesis. In
addition, novel markers may be identified to discriminate between macrophages from different ori-
gins, as there is a lack of uniform descriptions in the macrophage field (chapter 5).
Finally, we summarize the work described in this thesis and discuss our findings in the light of current
knowledge (chapter 6).

Introduction
29
References
1. Sabin FR. Studies on the origin of blood vessels and of red blood corpuscles as seen in the living blastoderm of chicks during
the second day of incubation. Carnegie Inst Wash Pub n°272, Contrib Embryol. 1920;9:214-262.
2. Murray PDF. The development in vitro of the blood of the early chick embryo. Proc Roy Soc London Serie B. 1932; 111:497–521.
3. Choi K, Kennedy M, Kazarov A, Papadimitriou JC, Keller G. A common precursor for hematopoietic and endothelial cells. Devel-
opment. 1998;125(4):725-732.
4. Maximov AA. Unterschungen über blut und bindegewebe. I. Die frühesten entwicklungsstadien der bluyt and bindegewebzellen
beim säugetier-embryo, bis zum anfang der blutbildung in der leber. Arch Mikr Anat 1909;73:444-450.
5. Luckett WP. Origin and differentiation of the yolk sac and extraembryonic mesoderm in presomite human and rhesus monkey
embryos. Am J Anat. 1978;152(1):59-97.
6. Fraser ST, Isern J, Baron MH. Maturation and enucleation of primitive erythroblasts during mouse embryogenesis is accompanied
by changes in cell-surface antigen expression. Blood. 2007;109(1):343-352.
7. Bloom W, Bartelmez GW. Hematopoiesis in young human embryos. Am J Anat. 1940;67:21-53.
8. Tavian M, Hallais MF, Peault B. Emergence of intraembryonic hematopoietic precursors in the pre-liver human embryo. Devel-
opment. 1999;126(4):793-803.
9. Palis J, Robertson S, Kennedy M, Wall C, Keller G. Development of erythroid and myeloid progenitors in the yolk sac and embryo
proper of the mouse. Development. 1999;126(22):5073-5084.
10. Palis J, Yoder MC. Yolk-sac hematopoiesis: the first blood cells of mouse and man. Exp Hematol. 2001;29(8):927-936.
11. Dommergues M, Aubeny E, Dumez Y, Durandy A, Coulombel L. Hematopoiesis in the human yolk sac: quantitation of erythroid
and granulopoietic progenitors between 3.5 and 8 weeks of development. Bone Marrow Transplant. 1992;9 Suppl 1:23-27.
12. Huyhn A, Dommergues M, Izac B, et al. Characterization of hematopoietic progenitors from human yolk sacs and embryos.
Blood. 1995;86(12):4474-4485.
13. Fukuda T. Fetal hemopoiesis. I. Electron microscopic studies on human yolk sac hemopoiesis. Virchows Arch B Cell Pathol.
1973;14(3):197-213.
14. Perdiguero EG, Klapproth K, Schulz C, et al. The Origin of Tissue-Resident Macrophages: When an Erythro-myeloid Progenitor
Is an Erythro-myeloid Progenitor. Immunity. 2015;43(6):1023-1024.
15. McGrath KE, Frame JM, Fromm GJ, et al. A transient definitive erythroid lineage with unique regulation of the beta-globin locus
in the mammalian embryo. Blood. 2011;117(17):4600-4608.
16. Frame JM, Fegan KH, Conway SJ, McGrath KE, Palis J. Definitive Hematopoiesis in the Yolk Sac Emerges from Wnt-Responsive
Hemogenic Endothelium Independently of Circulation and Arterial Identity. Stem Cells. 2016;34(2):431-444.
17. England SJ, McGrath KE, Frame JM, Palis J. Immature erythroblasts with extensive ex vivo self-renewal capacity emerge from the
early mammalian fetus. Blood. 2011;117(9):2708-2717.
18. Boisset JC, van Cappellen W, Andrieu-Soler C, Galjart N, Dzierzak E, Robin C. In vivo imaging of haematopoietic cells emerging
from the mouse aortic endothelium. Nature. 2010;464(7285):116-120.
19. Ivanovs A, Rybtsov S, Welch L, Anderson RA, Turner ML, Medvinsky A. Highly potent human hematopoietic stem cells first emerge
in the intraembryonic aorta-gonad-mesonephros region. J Exp Med. 2011;208(12):2417-2427.
20. Tavian M, Coulombel L, Luton D, Clemente HS, Dieterlen-Lievre F, Peault B. Aorta-associated CD34+ hematopoietic cells in the
early human embryo. Blood. 1996;87(1):67-72.
21. Medvinsky A, Dzierzak E. Definitive hematopoiesis is autonomously initiated by the AGM region. Cell. 1996;86(6):897-906.
22. North TE, de Bruijn MF, Stacy T, et al. Runx1 expression marks long-term repopulating hematopoietic stem cells in the midges-
tation mouse embryo. Immunity. 2002;16(5):661-672.
23. de Bruijn MF, Ma X, Robin C, Ottersbach K, Sanchez MJ, Dzierzak E. Hematopoietic stem cells localize to the endothelial cell layer
in the midgestation mouse aorta. Immunity. 2002;16(5):673-683.
24. Chen MJ, Yokomizo T, Zeigler BM, Dzierzak E, Speck NA. Runx1 is required for the endothelial to haematopoietic cell transition
but not thereafter. Nature. 2009;457(7231):887-891.
25. Palis J. Primitive and definitive erythropoiesis in mammals. Front Physiol. 2014;5:3.
26. Palis J, Malik J, McGrath KE, Kingsley PD. Primitive erythropoiesis in the mammalian embryo. Int J Dev Biol. 2010;54(6-7):1011-
1018.
27. Cantu I, Philipsen S. Flicking the switch: adult hemoglobin expression in erythroid cells derived from cord blood and human
induced pluripotent stem cells. Haematologica. 2014;99(11):1647-1649.
28. Peschle C, Mavilio F, Care A, et al. Haemoglobin switching in human embryos: asynchrony of zeta----alpha and epsilon----gamma-
globin switches in primitive and definite erythropoietic lineage. Nature. 1985;313(5999):235-238.
Chapter 1
30
29. Dover GJ, Boyer SH. Quantitation of hemoglobins within individual red cells: asynchronous biosynthesis of fetal and adult
hemoglobin during erythroid maturation in normal subjects. Blood. 1980;56(6):1082-1091.
30. Kunkel HG, Wallenius G. New hemoglobin in normal adult blood. Science. 1955;122(3163):288.
31. Kondo M, Weissman IL, Akashi K. Identification of clonogenic common lymphoid progenitors in mouse bone marrow. Cell.
1997;91(5):661-672.
32. Manz MG, Miyamoto T, Akashi K, Weissman IL. Prospective isolation of human clonogenic common myeloid progenitors. Proc
Natl Acad Sci U S A. 2002;99(18):11872-11877.
33. Akashi K, Traver D, Miyamoto T, Weissman IL. A clonogenic common myeloid progenitor that gives rise to all myeloid lineages.
Nature. 2000;404(6774):193-197.
34. Sanada C, Xavier-Ferrucio J, Lu YC, et al. Adult human megakaryocyte-erythroid progenitors are in the CD34+CD38mid fraction.
Blood. 2016;128(7):923-933.
35. Reya T, Morrison SJ, Clarke MF, Weissman IL. Stem cells, cancer, and cancer stem cells. Nature. 2001;414(6859):105-111.
36. Psaila B, Barkas N, Iskander D, et al. Single-cell profiling of human megakaryocyte-erythroid progenitors identifies distinct
megakaryocyte and erythroid differentiation pathways. Genome Biol. 2016;17:83.
37. Socolovsky M, Nam H, Fleming MD, Haase VH, Brugnara C, Lodish HF. Ineffective erythropoiesis in Stat5a(-/-)5b(-/-) mice due to
decreased survival of early erythroblasts. Blood. 2001;98(12):3261-3273.
38. Koulnis M, Pop R, Porpiglia E, Shearstone JR, Hidalgo D, Socolovsky M. Identification and analysis of mouse erythroid progenitors
using the CD71/TER119 flow-cytometric assay. J Vis Exp. 2011(54).
39. Bell AJ, Satchwell TJ, Heesom KJ, et al. Protein distribution during human erythroblast enucleation in vitro. PLoS One.
2013;8(4):e60300.
40. Kent G, Minick OT, Volini FI, Orfei E. Autophagic vacuoles in human red cells. Am J Pathol. 1966;48(5):831-857.
41. Holroyde CP, Gardner FH. Acquisition of autophagic vacuoles by human erythrocytes. Physiological role of the spleen. Blood.
1970;36(5):566-575.
42. Mankelow TJ, Griffiths RE, Trompeter S, et al. Autophagic vesicles on mature human reticulocytes explain phosphatidylserine-pos-
itive red cells in sickle cell disease. Blood. 2015;126(15):1831-1834.
43. Mankelow TJ, Griffiths RE, Trompeter S, et al. The ins and outs of reticulocyte maturation revisited: The role of autophagy in sickle
cell disease. Autophagy. 2016;12(3):590-591.
44. Song SH, Groom AC. Sequestration and possible maturation of reticulocytes in the normal spleen. Can J Physiol Pharmacol.
1972;50(5):400-406.
45. Song SH, Groom AC. Scanning electron microscope study of the splenic red pulp in relation to the sequestration of immature
and abnormal red cells. J Morphol. 1974;144(4):439-451.
46. Rhodes MM, Koury ST, Kopsombut P, Alford CE, Price JO, Koury MJ. Stress reticulocytes lose transferrin receptors by an extrinsic
process involving spleen and macrophages. Am J Hematol. 2016;91(9):875-882.
47. Griffiths RE, Kupzig S, Cogan N, et al. Maturing reticulocytes internalize plasma membrane in glycophorin A-containing vesicles
that fuse with autophagosomes before exocytosis. Blood. 2012;119(26):6296-6306.
48. Crosby WH. Siderocytes and the spleen. Blood. 1957;12(2):165-170.
49. Schnitzer B, Sodeman T, Mead ML, Contacos PG. Pitting function of the spleen in malaria: ultrastructural observations. Science.
1972;177(4044):175-177.
50. Gottlieb Y, Topaz O, Cohen LA, et al. Physiologically aged red blood cells undergo erythrophagocytosis in vivo but not in vitro.
Haematologica. 2012;97(7):994-1002.
51. Mebius RE, Kraal G. Structure and function of the spleen. Nat Rev Immunol. 2005;5(8):606-616.
52. Kostova EB, Beuger BM, Klei TR, et al. Identification of signalling cascades involved in red blood cell shrinkage and vesiculation.
Biosci Rep. 2015;35(2).
53. van Zwieten R, Bochem AE, Hilarius PM, et al. The cholesterol content of the erythrocyte membrane is an important determinant
of phosphatidylserine exposure. Biochim Biophys Acta. 2012;1821(12):1493-1500.
54. Stijlemans B, Cnops J, Naniima P, et al. Development of a pHrodo-based assay for the assessment of in vitro and in vivo eryth-
rophagocytosis during experimental trypanosomosis. PLoS Negl Trop Dis. 2015;9(3):e0003561.
55. Theurl I, Hilgendorf I, Nairz M, et al. On-demand erythrocyte disposal and iron recycling requires transient macrophages in the
liver. Nat Med. 2016;22(8):945-951.
56. Kim TS, Hanak M, Trampont PC, Braciale TJ. Stress-associated erythropoiesis initiation is regulated by type 1 conventional
dendritic cells. J Clin Invest. 2015;125(10):3965-3980.
57. Richardson MX, Lodin A, Reimers J, Schagatay E. Short-term effects of normobaric hypoxia on the human spleen. Eur J Appl
Physiol. 2008;104(2):395-399.
58. Bozzini CE, Barrio Rendo ME, Devoto FC, Epper CE. Studies on medullary and extramedullary erythropoiesis in the adult mouse.
Am J Physiol. 1970;219(3):724-728.

Introduction
31
59. Lenox LE, Shi L, Hegde S, Paulson RF. Extramedullary erythropoiesis in the adult liver requires BMP-4/Smad5-dependent sig-
naling. Exp Hematol. 2009;37(5):549-558.
60. Jacobson LO, Goldwasser E, Fried W, Plzak L. Role of the kidney in erythropoiesis. Nature. 1957;179(4560):633-634.
61. Jelkmann W. Physiology and pharmacology of erythropoietin. Transfus Med Hemother. 2013;40(5):302-309.
62. Haase VH. Regulation of erythropoiesis by hypoxia-inducible factors. Blood Rev. 2013;27(1):41-53.
63. Kapur R, Zhang L. A novel mechanism of cooperation between c-Kit and erythropoietin receptor. Stem cell factor induces the
expression of Stat5 and erythropoietin receptor, resulting in efficient proliferation and survival by erythropoietin. J Biol Chem.
2001;276(2):1099-1106.
64. Wu H, Liu X, Jaenisch R, Lodish HF. Generation of committed erythroid BFU-E and CFU-E progenitors does not require erythro-
poietin or the erythropoietin receptor. Cell. 1995;83(1):59-67.
65. Suzuki N, Ohneda O, Takahashi S, et al. Erythroid-specific expression of the erythropoietin receptor rescued its null mutant mice
from lethality. Blood. 2002;100(7):2279-2288.
66. Wang W, Horner DN, Chen WL, Zandstra PW, Audet J. Synergy between erythropoietin and stem cell factor during erythropoiesis
can be quantitatively described without co-signaling effects. Biotechnol Bioeng. 2008;99(5):1261-1272.
67. Tan BL, Hong L, Munugalavadla V, Kapur R. Functional and biochemical consequences of abrogating the activation of multiple
diverse early signaling pathways in Kit. Role for Src kinase pathway in Kit-induced cooperation with erythropoietin receptor. J
Biol Chem. 2003;278(13):11686-11695.
68. Kolbus A, Blazquez-Domingo M, Carotta S, et al. Cooperative signaling between cytokine receptors and the glucocorticoid
receptor in the expansion of erythroid progenitors: molecular analysis by expression profiling. Blood. 2003;102(9):3136-3146.
69. Kapur R, Everett ET, Uffman J, et al. Overexpression of human stem cell factor impairs melanocyte, mast cell, and thymocyte
development: a role for receptor tyrosine kinase-mediated mitogen activated protein kinase activation in cell differentiation.
Blood. 1997;90(8):3018-3026.
70. Wessely O, Deiner EM, Beug H, von Lindern M. The glucocorticoid receptor is a key regulator of the decision between self-renewal
and differentiation in erythroid progenitors. EMBO J. 1997;16(2):267-280.
71. Wessely O, Bauer A, Quang CT, et al. A novel way to induce erythroid progenitor self renewal: cooperation of c-Kit with the
erythropoietin receptor. Biol Chem. 1999;380(2):187-202.
72. Reichardt HM, Kaestner KH, Tuckermann J, et al. DNA binding of the glucocorticoid receptor is not essential for survival. Cell.
1998;93(4):531-541.
73. von Lindern M, Zauner W, Mellitzer G, et al. The glucocorticoid receptor cooperates with the erythropoietin receptor and c-Kit
to enhance and sustain proliferation of erythroid progenitors in vitro. Blood. 1999;94(2):550-559.
74. Bauer A, Tronche F, Wessely O, et al. The glucocorticoid receptor is required for stress erythropoiesis. Genes Dev.
1999;13(22):2996-3002.
75. Leberbauer C, Boulme F, Unfried G, Huber J, Beug H, Mullner EW. Different steroids co-regulate long-term expansion versus
terminal differentiation in primary human erythroid progenitors. Blood. 2005;105(1):85-94.
76. Migliaccio G, Sanchez M, Masiello F, et al. Humanized culture medium for clinical expansion of human erythroblasts. Cell Trans-
plant. 2010;19(4):453-469.
77. van den Akker E, Satchwell TJ, Pellegrin S, Daniels G, Toye AM. The majority of the in vitro erythroid expansion potential resides
in CD34(-) cells, outweighing the contribution of CD34(+) cells and significantly increasing the erythroblast yield from peripheral
blood samples. Haematologica. 2010;95(9):1594-1598.
78. Migliaccio G, Di Pietro R, di Giacomo V, et al. In vitro mass production of human erythroid cells from the blood of normal donors
and of thalassemic patients. Blood Cells Mol Dis. 2002;28(2):169-180.
79. Sanchez ER. Chaperoning steroidal physiology: lessons from mouse genetic models of Hsp90 and its cochaperones. Biochim
Biophys Acta. 2012;1823(3):722-729.
80. Stellacci E, Di Noia A, Di Baldassarre A, Migliaccio G, Battistini A, Migliaccio AR. Interaction between the glucocorticoid and
erythropoietin receptors in human erythroid cells. Exp Hematol. 2009;37(5):559-572.
81. Vandevyver S, Dejager L, Tuckermann J, Libert C. New insights into the anti-inflammatory mechanisms of glucocorticoids: an
emerging role for glucocorticoid-receptor-mediated transactivation. Endocrinology. 2013;154(3):993-1007.
82. Pevny L, Lin CS, D’Agati V, Simon MC, Orkin SH, Costantini F. Development of hematopoietic cells lacking transcription factor
GATA-1. Development. 1995;121(1):163-172.
83. Fujiwara Y, Browne CP, Cunniff K, Goff SC, Orkin SH. Arrested development of embryonic red cell precursors in mouse embryos
lacking transcription factor GATA-1. Proc Natl Acad Sci U S A. 1996;93(22):12355-12358.
84. Weiss MJ, Keller G, Orkin SH. Novel insights into erythroid development revealed through in vitro differentiation of GATA-1
embryonic stem cells. Genes Dev. 1994;8(10):1184-1197.
85. Dzierzak E, Philipsen S. Erythropoiesis: development and differentiation. Cold Spring Harb Perspect Med. 2013;3(4):a011601.

Chapter 1
32
86. Ferreira R, Ohneda K, Yamamoto M, Philipsen S. GATA1 function, a paradigm for transcription factors in hematopoiesis. Mol Cell
Biol. 2005;25(4):1215-1227.
87. Wickrema A, Krantz SB, Winkelmann JC, Bondurant MC. Differentiation and erythropoietin receptor gene expression in human
erythroid progenitor cells. Blood. 1992;80(8):1940-1949.
88. Broudy VC, Lin N, Brice M, Nakamoto B, Papayannopoulou T. Erythropoietin receptor characteristics on primary human erythroid
cells. Blood. 1991;77(12):2583-2590.
89. Dalyot N, Fibach E, Ronchi A, Rachmilewitz EA, Ottolenghi S, Oppenheim A. Erythropoietin triggers a burst of GATA-1 in normal
human erythroid cells differentiating in tissue culture. Nucleic Acids Res. 1993;21(17):4031-4037.
90. Ribeil JA, Zermati Y, Vandekerckhove J, et al. Hsp70 regulates erythropoiesis by preventing caspase-3-mediated cleavage of
GATA-1. Nature. 2007;445(7123):102-105.
91. Whyatt D, Lindeboom F, Karis A, et al. An intrinsic but cell-nonautonomous defect in GATA-1-overexpressing mouse erythroid
cells. Nature. 2000;406(6795):519-524.
92. Back J, Dierich A, Bronn C, Kastner P, Chan S. PU.1 determines the self-renewal capacity of erythroid progenitor cells. Blood.
2004;103(10):3615-3623.
93. Quang CT, Wessely O, Pironin M, Beug H, Ghysdael J. Cooperation of Spi-1/PU.1 with an activated erythropoietin receptor inhibits
apoptosis and Epo-dependent differentiation in primary erythroblasts and induces their Kit ligand-dependent proliferation.
EMBO J. 1997;16(18):5639-5653.
94. Schuetze S, Stenberg PE, Kabat D. The Ets-related transcription factor PU.1 immortalizes erythroblasts. Mol Cell Biol.
1993;13(9):5670-5678.
95. Drissen R, von Lindern M, Kolbus A, et al. The erythroid phenotype of EKLF-null mice: defects in hemoglobin metabolism and
membrane stability. Mol Cell Biol. 2005;25(12):5205-5214.
96. Borg J, Patrinos GP, Felice AE, Philipsen S. Erythroid phenotypes associated with KLF1 mutations. Haematologica. 2011;96(5):635-
638.
97. Athanasiou M, Mavrothalassitis G, Sun-Hoffman L, Blair DG. FLI-1 is a suppressor of erythroid differentiation in human hema-
topoietic cells. Leukemia. 2000;14(3):439-445.
98. Ano S, Pereira R, Pironin M, et al. Erythroblast transformation by FLI-1 depends upon its specific DNA binding and transcriptional
activation properties. J Biol Chem. 2004;279(4):2993-3002.
99. Pereira R, Quang CT, Lesault I, Dolznig H, Beug H, Ghysdael J. FLI-1 inhibits differentiation and induces proliferation of primary
erythroblasts. Oncogene. 1999;18(8):1597-1608.
100. Siripin D, Kheolamai P, Y UP, et al. Transdifferentiation of erythroblasts to megakaryocytes using FLI1 and ERG transcription
factors. Thromb Haemost. 2015;114(3):593-602.
101. Hoppe PS, Schwarzfischer M, Loeffler D, et al. Early myeloid lineage choice is not initiated by random PU.1 to GATA1 protein
ratios. Nature. 2016;535(7611):299-302.
102. Mills CD, Kincaid K, Alt JM, Heilman MJ, Hill AM. M-1/M-2 macrophages and the Th1/Th2 paradigm. J Immunol. 2000;164(12):6166-
6173.
103. Gordon S. Alternative activation of macrophages. Nat Rev Immunol. 2003;3(1):23-35.
104. Goerdt S, Politz O, Schledzewski K, et al. Alternative versus classical activation of macrophages. Pathobiology. 1999;67(5-6):222-
226.
105. Ferrante CJ, Leibovich SJ. Regulation of Macrophage Polarization and Wound Healing. Adv Wound Care (New Rochelle).
2012;1(1):10-16.
106. Martinez FO, Sica A, Mantovani A, Locati M. Macrophage activation and polarization. Front Biosci. 2008;13:453-461.
107. Jetten N, Verbruggen S, Gijbels MJ, Post MJ, De Winther MP, Donners MM. Anti-inflammatory M2, but not pro-inflammatory M1
macrophages promote angiogenesis in vivo. Angiogenesis. 2014;17(1):109-118.
108. Martinez FO, Gordon S. The M1 and M2 paradigm of macrophage activation: time for reassessment. F1000Prime Rep. 2014;6:13.
109. Martinez FO, Helming L, Gordon S. Alternative activation of macrophages: an immunologic functional perspective. Annu Rev
Immunol. 2009;27:451-483.
110. Sironi M, Martinez FO, D’Ambrosio D, et al. Differential regulation of chemokine production by Fcgamma receptor engage-
ment in human monocytes: association of CCL1 with a distinct form of M2 monocyte activation (M2b, Type 2). J Leukoc Biol.
2006;80(2):342-349.
111. Roszer T. Understanding the Mysterious M2 Macrophage through Activation Markers and Effector Mechanisms. Mediators
Inflamm. 2015;2015:816460.
112. Hashimoto D, Chow A, Noizat C, et al. Tissue-resident macrophages self-maintain locally throughout adult life with minimal
contribution from circulating monocytes. Immunity. 2013;38(4):792-804.
113. Zawada AM, Rogacev KS, Rotter B, et al. SuperSAGE evidence for CD14++CD16+ monocytes as a third monocyte subset. Blood.
2011;118(12):e50-61.

Introduction
33
114. Wong KL, Tai JJ, Wong WC, et al. Gene expression profiling reveals the defining features of the classical, intermediate, and non-
classical human monocyte subsets. Blood. 2011;118(5):e16-31.
115. Auffray C, Fogg D, Garfa M, et al. Monitoring of blood vessels and tissues by a population of monocytes with patrolling behavior.
Science. 2007;317(5838):666-670.
116. van Furth R, Cohn ZA. The origin and kinetics of mononuclear phagocytes. J Exp Med. 1968;128(3):415-435.
117. van Furth R, Diesselhoff-den Dulk MM. Dual origin of mouse spleen macrophages. J Exp Med. 1984;160(5):1273-1283.
118. Lavin Y, Mortha A, Rahman A, Merad M. Regulation of macrophage development and function in peripheral tissues. Nat Rev
Immunol. 2015;15(12):731-744.
119. Fogg DK, Sibon C, Miled C, et al. A clonogenic bone marrow progenitor specific for macrophages and dendritic cells. Science.
2006;311(5757):83-87.
120. Hettinger J, Richards DM, Hansson J, et al. Origin of monocytes and macrophages in a committed progenitor. Nat Immunol.
2013;14(8):821-830.
121. Virolainen M. Hematopoietic origin of macrophages as studied by chromosome markers in mice. J Exp Med. 1968;127(5):943-
952.
122. Morrison SJ, Weissman IL. The long-term repopulating subset of hematopoietic stem cells is deterministic and isolatable by
phenotype. Immunity. 1994;1(8):661-673.
123. Kuziel WA, Morgan SJ, Dawson TC, et al. Severe reduction in leukocyte adhesion and monocyte extravasation in mice deficient
in CC chemokine receptor 2. Proc Natl Acad Sci U S A. 1997;94(22):12053-12058.
124. Hoeffel G, Chen J, Lavin Y, et al. C-Myb(+) erythro-myeloid progenitor-derived fetal monocytes give rise to adult tissue-resident
macrophages. Immunity. 2015;42(4):665-678.
125. Lavin Y, Winter D, Blecher-Gonen R, et al. Tissue-resident macrophage enhancer landscapes are shaped by the local microen-
vironment. Cell. 2014;159(6):1312-1326.
126. Ensan S, Li A, Besla R, et al. Self-renewing resident arterial macrophages arise from embryonic CX3CR1(+) precursors and
circulating monocytes immediately after birth. Nat Immunol. 2016;17(2):159-168.
127. Wang J, Kubes P. A Reservoir of Mature Cavity Macrophages that Can Rapidly Invade Visceral Organs to Affect Tissue Repair.
Cell. 2016;165(3):668-678.
128. Perdiguero EG, Geissmann F. The development and maintenance of resident macrophages. Nat Immunol. 2016;17(1):2-8.
129. Ginhoux F, Greter M, Leboeuf M, et al. Fate mapping analysis reveals that adult microglia derive from primitive macrophages.
Science. 2010;330(6005):841-845.
130. Schulz C, Gomez Perdiguero E, Chorro L, et al. A lineage of myeloid cells independent of Myb and hematopoietic stem cells.
Science. 2012;336(6077):86-90.
131. Yona S, Kim KW, Wolf Y, et al. Fate mapping reveals origins and dynamics of monocytes and tissue macrophages under homeo-
stasis. Immunity. 2013;38(1):79-91.
132. Epelman S, Lavine KJ, Beaudin AE, et al. Embryonic and adult-derived resident cardiac macrophages are maintained through
distinct mechanisms at steady state and during inflammation. Immunity. 2014;40(1):91-104.
133. Guilliams M, De Kleer I, Henri S, et al. Alveolar macrophages develop from fetal monocytes that differentiate into long-lived cells
in the first week of life via GM-CSF. J Exp Med. 2013;210(10):1977-1992.
134. Jakubzick C, Gautier EL, Gibbings SL, et al. Minimal differentiation of classical monocytes as they survey steady-state tissues and
transport antigen to lymph nodes. Immunity. 2013;39(3):599-610.
135. Chorro L, Sarde A, Li M, et al. Langerhans cell (LC) proliferation mediates neonatal development, homeostasis, and inflamma-
tion-associated expansion of the epidermal LC network. J Exp Med. 2009;206(13):3089-3100.
136. Bain CC, Bravo-Blas A, Scott CL, et al. Constant replenishment from circulating monocytes maintains the macrophage pool in
the intestine of adult mice. Nat Immunol. 2014;15(10):929-937.
137. Hoeffel G, Wang Y, Greter M, et al. Adult Langerhans cells derive predominantly from embryonic fetal liver monocytes with a
minor contribution of yolk sac-derived macrophages. J Exp Med. 2012;209(6):1167-1181.
138. Swirski FK, Robbins CS, Nahrendorf M. Development and Function of Arterial and Cardiac Macrophages. Trends Immunol.
2016;37(1):32-40.
139. van de Laar L, Saelens W, De Prijck S, et al. Yolk Sac Macrophages, Fetal Liver, and Adult Monocytes Can Colonize an Empty Niche
and Develop into Functional Tissue-Resident Macrophages. Immunity. 2016;44(4):755-768.
140. Merad M, Hoffmann P, Ranheim E, et al. Depletion of host Langerhans cells before transplantation of donor alloreactive T cells
prevents skin graft-versus-host disease. Nat Med. 2004;10(5):510-517.
141. Collin M, Jardine L. A question of persistence: Langerhans cells and graft-versus-host disease. Exp Dermatol. 2014;23(4):234-235.
142. Oguro H, Ding L, Morrison SJ. SLAM family markers resolve functionally distinct subpopulations of hematopoietic stem cells and
multipotent progenitors. Cell Stem Cell. 2013;13(1):102-116.

Chapter 1
34
143. Schwarzenberger P, Spence S, Lohrey N, et al. Gene transfer of multidrug resistance into a factor-dependent human hemato-
poietic progenitor cell line: in vivo model for genetically transferred chemoprotection. Blood. 1996;87(7):2723-2731.
144. Zhong Q, Oliver P, Huang W, et al. Efficient c-kit receptor-targeted gene transfer to primary human CD34-selected hematopoietic
stem cells. J Virol. 2001;75(21):10393-10400.
145. Nilsson SK, Johnston HM, Coverdale JA. Spatial localization of transplanted hemopoietic stem cells: inferences for the localization
of stem cell niches. Blood. 2001;97(8):2293-2299.
146. Lo Celso C, Fleming HE, Wu JW, et al. Live-animal tracking of individual haematopoietic stem/progenitor cells in their niche.
Nature. 2009;457(7225):92-96.
147. Xie Y, Yin T, Wiegraebe W, et al. Detection of functional haematopoietic stem cell niche using real-time imaging. Nature.
2009;457(7225):97-101.
148. Kiel MJ, Yilmaz OH, Iwashita T, Yilmaz OH, Terhorst C, Morrison SJ. SLAM family receptors distinguish hematopoietic stem and
progenitor cells and reveal endothelial niches for stem cells. Cell. 2005;121(7):1109-1121.
149. Ehninger A, Trumpp A. The bone marrow stem cell niche grows up: mesenchymal stem cells and macrophages move in. J Exp
Med. 2011;208(3):421-428.
150. Chang MK, Raggatt LJ, Alexander KA, et al. Osteal tissue macrophages are intercalated throughout human and mouse bone
lining tissues and regulate osteoblast function in vitro and in vivo. J Immunol. 2008;181(2):1232-1244.
151. Winkler IG, Sims NA, Pettit AR, et al. Bone marrow macrophages maintain hematopoietic stem cell (HSC) niches and their deple-
tion mobilizes HSCs. Blood. 2010;116(23):4815-4828.
152. Cho SW. Role of osteal macrophages in bone metabolism. J Pathol Transl Med. 2015;49(2):102-104.
153. Burnett SH, Kershen EJ, Zhang J, et al. Conditional macrophage ablation in transgenic mice expressing a Fas-based suicide gene.
J Leukoc Biol. 2004;75(4):612-623.
154. Chow A, Lucas D, Hidalgo A, et al. Bone marrow CD169+ macrophages promote the retention of hematopoietic stem and
progenitor cells in the mesenchymal stem cell niche. J Exp Med. 2011;208(2):261-271.
155. Chow A, Huggins M, Ahmed J, et al. CD169(+) macrophages provide a niche promoting erythropoiesis under homeostasis and
stress. Nat Med. 2013;19(4):429-436.
156. Christopher MJ, Rao M, Liu F, Woloszynek JR, Link DC. Expression of the G-CSF receptor in monocytic cells is sufficient to mediate
hematopoietic progenitor mobilization by G-CSF in mice. J Exp Med. 2011;208(2):251-260.
157. Hamann J, Koning N, Pouwels W, et al. EMR1, the human homolog of F4/80, is an eosinophil-specific receptor. Eur J Immunol.
2007;37(10):2797-2802.
158. Westerterp M, Gourion-Arsiquaud S, Murphy AJ, et al. Regulation of hematopoietic stem and progenitor cell mobilization by
cholesterol efflux pathways. Cell Stem Cell. 2012;11(2):195-206.
159. Haldar M, Kohyama M, So AY, et al. Heme-mediated SPI-C induction promotes monocyte differentiation into iron-recycling
macrophages. Cell. 2014;156(6):1223-1234.
160. Kohyama M, Ise W, Edelson BT, et al. Role for Spi-C in the development of red pulp macrophages and splenic iron homeostasis.
Nature. 2009;457(7227):318-321.
161. Ludin A, Itkin T, Gur-Cohen S, et al. Monocytes-macrophages that express alpha-smooth muscle actin preserve primitive hema-
topoietic cells in the bone marrow. Nat Immunol. 2012;13(11):1072-1082.
162. Falchi M, Varricchio L, Martelli F, et al. Dexamethasone targeted directly to macrophages induces macrophage niches that
promote erythroid expansion. Haematologica. 2015;100(2):178-187.
163. Manwani D, Bieker JJ. The erythroblastic island. Curr Top Dev Biol. 2008;82:23-53.
164. Seu KG, Papoin J, Fessler R, et al. Unraveling Macrophage Heterogeneity in Erythroblastic Islands. Front Immunol. 2017;8:1140.
165. Bessis M. [Erythroblastic island, functional unity of bone marrow]. Rev Hematol. 1958;13(1):8-11.
166. Gifford SC, Derganc J, Shevkoplyas SS, Yoshida T, Bitensky MW. A detailed study of time-dependent changes in human red blood
cells: from reticulocyte maturation to erythrocyte senescence. Br J Haematol. 2006;135(3):395-404.
167. Allen TD, Dexter TM. Ultrastructural aspects of erythropoietic differentiation in long-term bone marrow culture. Differentiation.
1982;21(2):86-94.
168. Toda S, Segawa K, Nagata S. MerTK-mediated engulfment of pyrenocytes by central macrophages in erythroblastic islands.
Blood. 2014;123(25):3963-3971.
169. Yoshida H, Kawane K, Koike M, Mori Y, Uchiyama Y, Nagata S. Phosphatidylserine-dependent engulfment by macrophages of
nuclei from erythroid precursor cells. Nature. 2005;437(7059):754-758.
170. Mohandas N, Prenant M. Three-dimensional model of bone marrow. Blood. 1978;51(4):633-643.
171. Yokoyama T, Etoh T, Kitagawa H, Tsukahara S, Kannan Y. Migration of erythroblastic islands toward the sinusoid as erythroid
maturation proceeds in rat bone marrow. J Vet Med Sci. 2003;65(4):449-452.
172. Lee SH, Crocker PR, Westaby S, et al. Isolation and immunocytochemical characterization of human bone marrow stromal
macrophages in hemopoietic clusters. J Exp Med. 1988;168(3):1193-1198.

Introduction
35
173. Crocker PR, Werb Z, Gordon S, Bainton DF. Ultrastructural localization of a macrophage-restricted sialic acid binding hemagglu-
tinin, SER, in macrophage-hematopoietic cell clusters. Blood. 1990;76(6):1131-1138.
174. Takahashi K, Donovan MJ, Rogers RA, Ezekowitz RA. Distribution of murine mannose receptor expression from early embryo-
genesis through to adulthood. Cell Tissue Res. 1998;292(2):311-323.
175. Fabriek BO, Polfliet MM, Vloet RP, et al. The macrophage CD163 surface glycoprotein is an erythroblast adhesion receptor.
Blood. 2007;109(12):5223-5229.
176. Soni S, Bala S, Gwynn B, Sahr KE, Peters LL, Hanspal M. Absence of erythroblast macrophage protein (Emp) leads to failure of
erythroblast nuclear extrusion. J Biol Chem. 2006;281(29):20181-20189.
177. Lee G, Spring FA, Parsons SF, et al. Novel secreted isoform of adhesion molecule ICAM-4: potential regulator of membrane-as-
sociated ICAM-4 interactions. Blood. 2003;101(5):1790-1797.
178. Wang Z, Vogel O, Kuhn G, Gassmann M, Vogel J. Decreased stability of erythroblastic islands in integrin beta3-deficient mice.
Physiol Rep. 2013;1(2):e00018.
179. Spring FA, Griffiths RE, Mankelow TJ, et al. Tetraspanins CD81 and CD82 facilitate alpha4beta1-mediated adhesion of human
erythroblasts to vascular cell adhesion molecule-1. PLoS One. 2013;8(5):e62654.
180. Sadahira Y, Yoshino T, Monobe Y. Very late activation antigen 4-vascular cell adhesion molecule 1 interaction is involved in the
formation of erythroblastic islands. J Exp Med. 1995;181(1):411-415.
181. Ulyanova T, Scott LM, Priestley GV, et al. VCAM-1 expression in adult hematopoietic and nonhematopoietic cells is controlled
by tissue-inductive signals and reflects their developmental origin. Blood. 2005;106(1):86-94.
182. Lee G, Lo A, Short SA, et al. Targeted gene deletion demonstrates that the cell adhesion molecule ICAM-4 is critical for erythro-
blastic island formation. Blood. 2006;108(6):2064-2071.
183. Ulyanova T, Jiang Y, Padilla S, Nakamoto B, Papayannopoulou T. Combinatorial and distinct roles of alpha(5) and alpha(4) integrins
in stress erythropoiesis in mice. Blood. 2011;117(3):975-985.
184. Hanspal M, Smockova Y, Uong Q. Molecular identification and functional characterization of a novel protein that mediates the
attachment of erythroblasts to macrophages. Blood. 1998;92(8):2940-2950.
185. McGrath KE, Kingsley PD, Koniski AD, Porter RL, Bushnell TP, Palis J. Enucleation of primitive erythroid cells generates a transient
population of “pyrenocytes” in the mammalian fetus. Blood. 2008;111(4):2409-2417.
186. Tanaka R, Owaki T, Kamiya S, et al. VLA-5-mediated adhesion to fibronectin accelerates hemin-stimulated erythroid differentiation
of K562 cells through induction of VLA-4 expression. J Biol Chem. 2009;284(30):19817-19825.
187. Soni S, Bala S, Hanspal M. Requirement for erythroblast-macrophage protein (Emp) in definitive erythropoiesis. Blood Cells Mol
Dis. 2008;41(2):141-147.
188. Soni S, Bala S, Kumar A, Hanspal M. Changing pattern of the subcellular distribution of erythroblast macrophage protein (Emp)
during macrophage differentiation. Blood Cells Mol Dis. 2007;38(1):25-31.
189. Sui Z, Nowak RB, Bacconi A, et al. Tropomodulin3-null mice are embryonic lethal with anemia due to impaired erythroid terminal
differentiation in the fetal liver. Blood. 2014;123(5):758-767.
190. Suenobu S, Takakura N, Inada T, et al. A role of EphB4 receptor and its ligand, ephrin-B2, in erythropoiesis. Biochem Biophys
Res Commun. 2002;293(3):1124-1131.
191. Kwak H, Salvucci O, Weigert R, et al. Sinusoidal ephrin receptor EPHB4 controls hematopoietic progenitor cell mobilization from
bone marrow. J Clin Invest. 2016;126(12):4554-4568.
192. Pradeep S, Huang J, Mora EM, et al. Erythropoietin Stimulates Tumor Growth via EphB4. Cancer Cell. 2015;28(5):610-622.
193. Lizcano A, Secundino I, Dohrmann S, et al. Erythrocyte sialoglycoproteins engage Siglec-9 on neutrophils to suppress activation.
Blood. 2017;129(23):3100-3110.
194. Kossiva L, Paterakis G, Tassiopoulos S, et al. Decreased expression of membrane alpha4beta1, alpha5beta1 integrins and
transferrin receptor on erythroblasts in splenectomized patients with beta-thalassemia intermedia. Parallel assessment of
serum soluble transferrin receptors levels. Ann Hematol. 2003;82(9):579-584.
195. Eshghi S, Vogelezang MG, Hynes RO, Griffith LG, Lodish HF. Alpha4beta1 integrin and erythropoietin mediate temporally distinct
steps in erythropoiesis: integrins in red cell development. J Cell Biol. 2007;177(5):871-880.
196. Gu Y, Sorokin L, Durbeej M, Hjalt T, Jonsson JI, Ekblom M. Characterization of bone marrow laminins and identification of
alpha5-containing laminins as adhesive proteins for multipotent hematopoietic FDCP-Mix cells. Blood. 1999;93(8):2533-2542.
197. Parsons SF, Lee G, Spring FA, et al. Lutheran blood group glycoprotein and its newly characterized mouse homologue specifically
bind alpha5 chain-containing human laminin with high affinity. Blood. 2001;97(1):312-320.
198. Lu Q, Gore M, Zhang Q, et al. Tyro-3 family receptors are essential regulators of mammalian spermatogenesis. Nature.
1999;398(6729):723-728.
199. Lu Q, Lemke G. Homeostatic regulation of the immune system by receptor tyrosine kinases of the Tyro 3 family. Science.
2001;293(5528):306-311.

Chapter 1
36
200. Gaipl US, Voll RE, Sheriff A, Franz S, Kalden JR, Herrmann M. Impaired clearance of dying cells in systemic lupus erythematosus.
Autoimmun Rev. 2005;4(4):189-194.
201. Munoz LE, Janko C, Schulze C, et al. Autoimmunity and chronic inflammation - two clearance-related steps in the etiopathogenesis
of SLE. Autoimmun Rev. 2010;10(1):38-42.
202. Nagata S. Apoptosis and autoimmune diseases. Ann N Y Acad Sci. 2010;1209:10-16.
203. Rothlin CV, Lemke G. TAM receptor signaling and autoimmune disease. Curr Opin Immunol. 2010;22(6):740-746.
204. Toda S, Nishi C, Yanagihashi Y, Segawa K, Nagata S. Clearance of Apoptotic Cells and Pyrenocytes. Curr Top Dev Biol. 2015;114:267-
295.
205. Meyer AS, Zweemer AJ, Lauffenburger DA. The AXL Receptor is a Sensor of Ligand Spatial Heterogeneity. Cell Syst. 2015;1(1):25-
36.
206. Nishi C, Toda S, Segawa K, Nagata S. Tim4- and MerTK-mediated engulfment of apoptotic cells by mouse resident peritoneal
macrophages. Mol Cell Biol. 2014;34(8):1512-1520.
207. D’Souza S, Park SY, Kim IS. Stabilin-2 acts as an engulfment receptor for the phosphatidylserine-dependent clearance of primary
necrotic cells. Biochem Biophys Res Commun. 2013;432(3):412-417.
208. Dasgupta SK, Abdel-Monem H, Guchhait P, Nagata S, Thiagarajan P. Role of lactadherin in the clearance of phosphatidylser-
ine-expressing red blood cells. Transfusion. 2008;48(11):2370-2376.
209. Palis J. Hematopoietic stem cell-independent hematopoiesis: emergence of erythroid, megakaryocyte, and myeloid potential in
the mammalian embryo. FEBS Lett. 2016;590(22):3965-3974.
210. Felix R, Cecchini MG, Hofstetter W, Elford PR, Stutzer A, Fleisch H. Impairment of macrophage colony-stimulating factor produc-
tion and lack of resident bone marrow macrophages in the osteopetrotic op/op mouse. J Bone Miner Res. 1990;5(7):781-789.
211. Ramos P, Casu C, Gardenghi S, et al. Macrophages support pathological erythropoiesis in polycythemia vera and beta-thalas-
semia. Nat Med. 2013;19(4):437-445.
212. de Back DZ, Kostova EB, van Kraaij M, van den Berg TK, van Bruggen R. Of macrophages and red blood cells; a complex love
story. Front Physiol. 2014;5:9.
213. Bratosin D, Mazurier J, Tissier JP, et al. Cellular and molecular mechanisms of senescent erythrocyte phagocytosis by macro-
phages. A review. Biochimie. 1998;80(2):173-195.
214. Giarratana MC, Rouard H, Dumont A, et al. Proof of principle for transfusion of in vitro-generated red blood cells. Blood.
2011;118(19):5071-5079.
215. Anstee DJ, Gampel A, Toye AM. Ex-vivo generation of human red cells for transfusion. Curr Opin Hematol. 2012;19(3):163-169.
216. Rhodes MM, Kopsombut P, Bondurant MC, Price JO, Koury MJ. Adherence to macrophages in erythroblastic islands enhances
erythroblast proliferation and increases erythrocyte production by a different mechanism than erythropoietin. Blood.
2008;111(3):1700-1708.
217. Choi HS, Lee EM, Kim HO, Park MI, Baek EJ. Autonomous control of terminal erythropoiesis via physical interactions among
erythroid cells. Stem Cell Res. 2013;10(3):442-453.
218. Iavarone A, King ER, Dai XM, Leone G, Stanley ER, Lasorella A. Retinoblastoma promotes definitive erythropoiesis by repressing
Id2 in fetal liver macrophages. Nature. 2004;432(7020):1040-1045.
219. Merad M, Sugie T, Engleman EG, Fong L. In vivo manipulation of dendritic cells to induce therapeutic immunity. Blood.
2002;99(5):1676-1682.
220. Ajami B, Bennett JL, Krieger C, Tetzlaff W, Rossi FM. Local self-renewal can sustain CNS microglia maintenance and function
throughout adult life. Nat Neurosci. 2007;10(12):1538-1543.
221. Garcia MR, Ledgerwood L, Yang Y, et al. Monocytic suppressive cells mediate cardiovascular transplantation tolerance in mice.
J Clin Invest. 2010;120(7):2486-2896.
222. Sergijenko A, Langford-Smith A, Liao AY, et al. Myeloid/Microglial driven autologous hematopoietic stem cell gene therapy corrects
a neuronopathic lysosomal disease. Mol Ther. 2013;21(10):1938-1949.
223. Link H, Brune T, Hubner G, et al. Effect of recombinant human erythropoietin after allogenic bone marrow transplantation. Ann
Hematol. 1993;67(4):169-173.
224. Biggs JC, Atkinson KA, Booker V, et al. Prospective randomised double-blind trial of the in vivo use of recombinant human
erythropoietin in bone marrow transplantation from HLA-identical sibling donors. The Australian Bone Marrow Transplant Study
Group. Bone Marrow Transplant. 1995;15(1):129-134.
225. Jaspers A, Baron F, Willems E, et al. Erythropoietin therapy after allogeneic hematopoietic cell transplantation: a prospective,
randomized trial. Blood. 2014;124(1):33-41.
226. Thiele J, Kvasnicka HM, Beelen DW, et al. Erythropoietic reconstitution, macrophages and reticulin fibrosis in bone marrow
specimens of CML patients following allogeneic transplantation. Leukemia. 2000;14(8):1378-1385.
227. Capoccia BJ, Shepherd RM, Link DC. G-CSF and AMD3100 mobilize monocytes into the blood that stimulate angiogenesis in vivo
through a paracrine mechanism. Blood. 2006;108(7):2438-2445.

Introduction
37
228. Wiersum-Osselton JC, Marijt-van der Kreek T, de Kort WL. Donor vigilance: what are we doing about it? Biologicals. 2012;40(3):176-
179.
229. Katalinic A, Peters E, Beske F, Pritzkuleit R. Projection of Morbidity 2030 and 2050: Impact for the National Health System and
Blood Supply. Transfus Med Hemother. 2010;37(3):155-159.
230. An MW, Reich NG, Crawford SO, Brookmeyer R, Louis TA, Nelson KE. A stochastic simulator of a blood product donation envi-
ronment with demand spikes and supply shocks. PLoS One. 2011;6(7):e21752.
231. Goodnough LT, Shander A, Brecher ME. Transfusion medicine: looking to the future. Lancet. 2003;361(9352):161-169.
232. Greinacher A, Weitmann K, Lebsa A, et al. A population-based longitudinal study on the implications of demographics on future
blood supply. Transfusion. 2016;56(12):2986-2994.

ErythroblastsMonocytes HSCPBMC
Survival Differentiation
2
CD14+ cells from peripheral blood positively regulate hematopoietic
stem and progenitor cell survival resulting in
increased erythroid yield
CHAPTER 2
Esther Heideveld, Francesca Masiello, Manuela Marra, Fatemehsadat Esteghamat, Nurcan Yağcı, Marieke von Lindern, Anna Rita F. Migliaccio, and Emile van den Akker
Haematologica 2015 Nov;100(11):1396-1406

Chapter 2
40
Abstract
Expansion of erythroblasts from human peripheral blood mononuclear cells is 4- to 15-fold more effi-
cient than that of CD34+ cells purified from peripheral blood mononuclear cells. In addition, purified
CD34+ and CD34- populations from blood do not reconstitute this erythroid yield, suggesting a role for
feeder cells present in blood mononuclear cells that increase hematopoietic output. Immunodeplet-
ing peripheral blood mononuclear cells for CD14+ cells reduced hematopoietic stem and progenitor
cell expansion. Conversely, this yield was increased upon co-culture of CD34+ cells with CD14+ cells
(full contact or transwell assays) or CD34+ cells re-constituted in conditioned medium from CD14+ cells.
In particular, CD14++CD16+ intermediate monocytes/macrophages enhanced erythroblast outgrowth
from CD34+ cells. No effect of CD14+ cells on erythroblasts themselves was observed. However, 2 days
of co-culturing CD34+ and CD14+ cells increased CD34+ cell numbers and colony-forming units 5-fold.
Proliferation assays suggested that CD14+ cells sustain CD34+ cell survival but not proliferation. These
data identify previously unrecognized erythroid and non-erythroid CD34- and CD34+ populations in
blood that contribute to the erythroid yield. A flow cytometry panel containing CD34/CD36 can be
used to follow specific stages during CD34+ differentiation to erythroblasts. We have shown modu-
lation of hematopoietic stem and progenitor cell survival by CD14+ cells present in peripheral blood
mononuclear cells which can also be found near specific hematopoietic niches in the bone marrow.

Human CD14+ cells enhance ex vivo HSPC survival
41
Introduction
Hematopoiesis occurs in niches that ensure specific interactions and cross-talk of hematopoietic cells
with the surrounding stromal cells and among different hematopoietic cells themselves. These niches
dictate processes such as lineage specification, cell survival and mobilization. Hematopoietic stem and
progenitor cells (HSPC) reside in perivascular niches and within the non-endosteal parenchyma1-4.
This hematopoietic niche consists of mesenchymal stem cells, osteoblasts, and hematopoietic effec-
tor cells, such as T regulatory cells and tissue-resident macrophages. The niche is important for
hematopoietic stem cell (HSC) homeostasis as well as hematopoietic lineage development including
erythropoiesis5. In mice, tissue-resident macrophages are important regulators of HSC retention
within the bone marrow6,7, and ablation of CD163+CD169+ macrophages leads to mobilization of
HSPC, committed progenitors and erythrocyte precursors8. These myelodepleted mice experience
compensated anemia with increased splenic erythroblasts. Increased erythrocyte survival in these
mice is likely due to reduced phagocytosis of aging red cells by red pulp macrophages.
Central tissue-resident macrophages also contribute to the erythroid islands in the bone marrow (the
erythron) that regulate erythroblast differentiation, the final stages of enucleation, and reticulocyte
maturation9-12. However, macrophage colony-stimulating factor (M-CSF)-deficient op/op mice and
CSFR-/- mice, which display reduced F4/80 tissue-resident macrophages, are characterized by hypo-
cellularity of the bone marrow and reduced erythroid burst-forming units (BFU-E)13, which indicates
a major effect of macrophages on HSPC. In addition, erythroblast proliferation in bone marrow was
unchanged in myeloablated mice and the ratios between the different stages during erythroblast
maturation were comparable8. Together, these observations suggest a major role for (tissue-resi-
dent) macrophages in the control of proliferation and/or differentiation of HSPC, which needs to be
investigated.
We have previously shown that erythroblast expansion from unsorted peripheral blood mononuclear
cells (PBMC) is 4- to 15-fold increased compared to CD34+ cells purified from a similar number of
PBMC14. This increased erythroid yield may partly be explained by the presence and differentiation
of CD34- cells in peripheral blood14. However, erythroid differentiation from CD34- PBMC does not
fully account for the increased erythroid yield from unselected PBMC. This suggests that additional
processes underlie the increased erythroid yield from total PBMC compared to CD34+ cells isolated
from PBMC. We hypothesize that PBMC with feeder/stromal cell-like properties can positively influ-
ence HSPC proliferation, differentiation, and/or survival to yield more erythroblasts. A role for these
effector cells during ex vivo culture may also reveal clues to their function in the bone marrow niche. In
this study we showed that human PBMC-derived CD14+ cells, in particular CD14++CD16+ intermediate
monocytes/macrophages, increased the erythroid yield from CD34+ HSPC in co-culture experiments.
Macrophages sustained HSPC that precede the erythroblast stage, which resulted in increased eryth-
roid expansion from CD34+ cells in ex vivo cultures.
Chapter 2
42
Methods
Cell sorting
CD3, CD19, CD14 and CD34 MicroBeads (Miltenyi Biotec, Bergisch Gladbach, Germany) were used
for magnetic-activated cell sorting (MACS) from PBMC (manufacturer’s protocol). Prior to sorting,
monocytes/macrophages were purified from PBMC by counterflow centrifugal elutriation (JE-6B Beck-
man-coulter centrifuge, Beckman Instruments Inc., Palo Alto, CA). Monocyte/macrophage subsets and
hematopoietic precursors were sorted on a FACS-Aria II/III (BD Biosciences, Oxford, UK).
Cell culture
Human cells were cultured in StemSpan (Stem Cell Technologies, Grenoble, France) supplemented
with stem cell factor (SCF, supernatant equivalent to 100ng/ml), erythropoietin (2U/ml, ProSpec, East
Brunswick, NJ, USA), dexamethasone (1mM; Sigma, St. Louis, MO, USA) and cholesterol-rich lipids
(40mg/ml; Sigma) as described elsewhere14,15. Informed consent was given in accordance with the
Declaration of Helsinki and Dutch national and Sanquin internal ethic boards. Conditioned media
were collected from CD14+ cells cultured for 2 days at 5-10x106 cells/8ml, filtered (0.22µm) and stored
at 4°C. Isolated CD34+ cells were cultured with conditioned media diluted 1:2 with fresh culture
medium. Media was replenished every 2 days.
Co-culture experiments
CD34+ cells were co-cultured with purified hematopoietic effector cells using ratios as found in
PBMC (1:100 CD14+ cells; 1:430 CD3+ cells or 1:25 CD19+ cells). CD34+ cells were co-cultured with
CD14++CD16-, CD14++CD16+ or CD14+CD16+ cells (at a ratio of 1:100).
Transwell assays
CD14+ and CD34+ cells were seeded into transwells (0.4µm polyester membrane; Corning, NY, USA)
with CD34+ cells inside the transwell and CD14+ cells in the well (at a ratio of 1:100). Cells were analyzed
after 2-8 days on the flow cytometer.
Colony assays
Colony assays were started with freshly purified, sorted, or cultured cells mixed with methacult
(Medium ColonyGel™ Cell Systems, Troisdorf, Germany). After 14 days, total colony numbers and
colony forming units were manually scored twice using a wide-field microscope (Axiovert 200M; Carl
Zeiss Inc., Thornwood, NY, USA).
Proliferation assays
CD34+ cells were washed in phosphate-buffered saline (PBS) supplemented with 0.1% bovine serum
albumin (BSA, Sigma; PSA). Cells were labeled with 0.5µM carboxyfluoroscein succinimidyl ester (CFSE;
Molecular Probes, Leiden, The Netherlands) for 8 min with gentle shaking at 37°C. Cells were washed

Human CD14+ cells enhance ex vivo HSPC survival
43
in 1% PSA and cultured with or without CD14+ cells (at a ratio of 1:100) for 2 days. CFSE dilution was
measured by flow cytometry.
Flow cytometry
Cells were washed in PBS and re-suspended in 1% PSA. Cells were incubated with primary antibodies
for 30 min at 4°C, washed in PBS and measured on a FACS Canto II or LSR Fortessa (both BD Biosci-
ences) and analyzed using FlowJo software (FlowJo v7.6.4/v10, Ashland, OR, USA). The antibodies are
detailed in the Supplementary Methods. For apoptosis experiments, cells were stained in 100µl 1x
binding buffer with Annexin V-APC (BD Biosciences; 1:200) at 4°C. After 30 min, 100µl binding buffer
and propidium iodide (50mg/ml; Sigma) were added.
Cytospins
Cells (5×10⁵) were cytospun onto glass slides, fixed in methanol, and stained with May-Grünwald-Gi-
emsa stain (manufacturer’s protocol). Images were processed using Adobe Photoshop 9.0 (Adobe
Systems Inc., CA, USA).
Statistical analysis
The Student t-test was used for the statistical analysis. P-values ≤0.05 are considered statistically
significant.
Results
Hematopoietic cell fractions in peripheral blood mononuclear cells
The erythroid yield is significantly higher from total PBMC than from CD34+ cells purified from PBMC14.
To investigate which cells contribute to this phenomenon we first examined the presence, frequency
and erythroid potential of CD34+ and CD34- HSPC and their downstream precursor cells in PBMC.
PBMC contained low numbers of CD34+ cells (0.16±0.08%; Figure 1A) which could be subdivided into
69% HSC/common myeloid progenitors (CMP), 29% granulocyte-monocyte progenitors (GMP) and
1% megakaryocyte-erythroid progenitors (MEP; Figure 1B and Figure S1). Around 22% of the CD34+
cells consisted of CD34+CD38-CD36- long-term HSC (Figure S2A). The erythroblasts expanded and
differentiated from PBMC may potentially also originate from erythroblasts present in PBMC. We,
therefore, evaluated the frequency of erythroblasts in PBMC. T-cells (CD3) and monocytes/macro-
phages (CD14), further denoted as Lineage (Lin), were excluded from the analysis. Lin-CD34+CD36- (A;
HSPC morphology), Lin-CD34+CD36+ (B; blast morphology), Lin-CD34-CD36+ and Lin-CD34-CD36dim (C,D;
blast, basophilic, orthochromatic, polychromatic, reticulocytes) cells were identified in PBMC (Figure
1C,D and Table 1). The Lin-CD34-CD36- population E consisted primarily of the remaining assorted
cells (e.g., B cells, natural killer cells, CD34- HSC and other CD3-CD14-CD34-CD36- cells).

Chapter 2
44
A B C D E1 2
3 1
1
1
1
3
E Lin- Lin-CD117-
Lin-CD38- Lin-CD38-CD117-
i ii
iii iv
CD
34
CD36
vi
Lin- Lin-BAH1.1-
v
A
Cel
l fre
quen
cy (%
)
C D 3 4 +
0 .0
0 .1
0 .2
0 .3
0 .4
B
CD
34
BAH
1.1
BAH
1.1
Day 0 Day 3
SSC
FSC-A FSC-A CD45RA CD45RA
D
CCD36
A B
E D C
SSC
FSC
-H
Lin
CD
34
FSC-A FSC-A FSC-A CD36
i iii ivLiving cells 63.4%
Single cells 97.6%
ii
Lin-19.8%
Figure 1. Defining hematopoietic progenitor cells and frequencies in PBMC. (A) The percentage of CD34+ cells in PBMC measured using flow cytometry (n=8). (B) Representative dot plots of CD34+ cells from panel A stained for CD45RA and BAH1.1 to discriminate between MEP (CD34+BAH1.1+CD45RA-), GMP (CD34+BAH1.1-CD45RA+) and CMP (CD34+BAH1.1-CD45RA-) at day 0 and at day 3 of ex vivo culture. The low abundant MEP population was quantified using a specific MEP marker BAH1.1 (characterization in Figure S1). (C) Gating strategy to show hematopoietic pre-cursors according to CD34/CD36 expression. Living cells were gated (FSC/SSC; i), followed by gating of single cells (FSC-A/FSC-H; ii). A dump-channel containing CD14+ and CD3+ cells, henceforth denoted as Lin, was setup to exclude specific populations (iii). Lin-negative cells are depicted in a CD34/CD36 dot plot (iv) and five distinct populations are indicated (A-E; frequencies in Table 1). (D) May-Grünwald-Giemsa stained cytospins of FACS-sorted populations as indicated in C (iv). (E) Representative CD34/CD36 dot plot as indicated in C (i), supplementing the Lin-negative cells with anti-CD117 (ii), anti-CD38 (iii) or both anti-CD38/anti-CD117 (iv) or BAH1.1 (vi; control in v). FSC(-A/H): forward-scatter(-area/height); SSC: side-scatter; MEP: megakaryocyte-erythroid progenitor; CMP: common myeloid progenitor; GMP: granulocyte-monocyte progenitor; PBMC: peripheral blood mononuclear cells; Lin: lineage.

Human CD14+ cells enhance ex vivo HSPC survival
45
Supplementing lineage depletion with CD117 (c-kit) antibodies resulted in severe reductions of pop-
ulations A and B indicating that the majority of these cells are CD117+ (Figure 1E). Supplementing
lineage depletion with CD38 resulted in loss of population D and reductions in populations A, B, C
and E. Combining CD117 and CD38 in the lineage depletion resulted in complete loss of populations
A, B and D and reductions in C and E (Figure 1E). These results suggest that the CD34+CD36+C-
D38+CD117+ population B is enriched for MEP. This was further confirmed through supplementing
lineage depletion with BAH1.1 which resulted in complete loss of population B and only a modest
loss in population A (Figure 1E). Populations A-E were seeded in colony assays. Populations A and B
contained the majority of the colony formation capacity, whereas populations C, D and E displayed
low to no colony-forming capability (Table 1). This is in line with our previously published data show-
ing that the CD34- population has severely limited colony-stimulating capacity14. Population A can be
discriminated from B by its greater ability to generate granulocyte-monocyte colony-forming units
(CFU-GM), indicating that population A is composed of more immature hematopoietic progenitors
(e.g., HSC, CMP, GMP), whereas population B contains MEP committed to the megakaryocyte-eryth-
roid lineage. In conclusion, the cells in population A are early HSPC, population B is composed of
MEP and cells in transition to become erythroblasts. Populations C and D are mixed pools of cells
that also contain erythroid cells at different stages.
Table 1. Frequency of the five populations identified in Figure 1C on the basis of CD34/CD36 staining in PBMC and respective colony formation capacity. Colonies shown per 500 cells. Results are presented as mean ± SD of three to five separate experiments.
Population Phenotype Frequency CFU-E BFU-E CFU-GM CFU-GEMM Total CFU
PBMC N/A N/A 0.75±0.03 0.5±0.3 0.2±0.1 0.006±0.005 0.8±0.7
A CD34+CD36
-0.14±0.05 320±32 112±91 67±46 4±6 263±281
B CD34+CD36
+0.04±0.05 272±16 152±130 11±14 4±5 303±306
C CD34-CD36
+0.96±0.52 0.1±0.01 0.1±0.01 0.1±0.002 0.1±0.05 0.35±0.05
D CD34-CD36
dim2.04±0.76 0 0 0 0 0
E CD34-CD36
-83.5±20 0 0.1±0.1 0.02±0.03 0.001±0.002 0.1±0.1
PBMC: peripheral blood mononuclear cells; CFU: colony-forming units; BFU-E: erythroid burst-forming units; E: erythroid; GM: granulocyte-monocyte; GEMM: granulocyte-erythrocyte-monocyte-megakaryocyte.
Tracking hematopoietic stem and progenitor cell differentiation to erythroblasts
The Lin-CD34/CD36 flow cytometer readout provides a novel tool to follow the differentiation of HSPC
through the MEP stage to erythroblasts. CD34+ cells were isolated from peripheral blood and cultured
ex vivo for 8 days. Differentiation of CD34+ cells was monitored daily by assessing Lin-/CD34/CD36/
CD71/CD235a membrane expression and GATA1 and erythropoietin receptor (EPOR) mRNA expres-
sion during culture (Figure 2 and Figure S2B,C). CD71 (transferrin receptor) and CD235a (glycophorin
A; GPA) are more classical markers for erythroblasts and subsequent stages of differentiation towards
erythrocytes16, but fail to identify the upstream progenitor progression of HSC towards erythroblasts.
At day 0, cells are primarily CD34+CD36- HSPC (P1) but progress towards CD34+CD36+ MEP (P2,3)

Chapter 2
46
AC
D34
CD34+
PBMC
Day 1 Day 2 Day 3 Day 4 Day 5 Day 6 Day 7Day 0
CD36
P1 P2 P3
P4
P1 P2 P3
P4
P1 P2 P3
P4
P1 P2 P3
P4
P1 P2 P3
P4
P1 P2 P3
P4
P1 P2 P3
P4
P1 P2 P3
P4
P1 P2 P3
P4
P1 P2 P3
P4
P1 P2 P3
P4
P1 P2 P3
P4
P1 P2 P3
P4
P1 P2 P3
P4
P1 P2 P3
P4
P1 P2 P3
P4
B
CD235a
CD
71
Day 1 Day 2 Day 3 Day 4 Day 5 Day 6 Day 7Day 011.1% 1.78% 5.39% 20.2% 49.2% 79.5% 85.4% 83.9%
0.30% 0.07%0.07% 0.22% 0.93% 57% 65.4% 76.6%
CD34+
PBMC
0
20
40
60
80
100
120
0
20
40
60
80
100
120CD34+ culture
Time (days)
0 1 2 3 4 5 6 7
CD
71high/C
D235a
dim(line; %
)Popu
latio
ns 1
-4 (%
of t
otal
)
P1P2P3P4
C D
0
20
40
60
80
100
120
0
20
40
60
80
100
120PBMC culture C
D71
high/CD
235adim
(line; %)
Time (days)
Popu
latio
ns 1
-4 (%
of t
otal
)
P1P2P3P4
0 1 2 3 4 5 6 7
Figure 2. Tracking HSPC differentiation to erythroblasts. CD34+ cells purified from PBMC and total PBMC (n=3) were cultured for 7 days. (A) Dot plots depicting delineated CD34/CD36 populations from a representative donor over time (CD34+ culture: top; total PBMC culture: bottom). The specific stages, hematopoietic stem and progenitor cells (HSPC; P1), megakaryocyte-erythroid progenitors (MEP; P2-P3) and erythroblasts (P4) are indi-cated within the dot plots. Note the progression from stage 1 to 4 during culture. (B) Dot plots depicting CD71/CD235a expression from CD34+ cell (top panels) and total PBMC (bottom panels) cultures over 7 days. Note that CD71highCD235adim cells appear gradually during culture. Histograms showing the percentage of cells in stage P1-4 of panel A for (C) CD34+ cell cultures and (D) total PBMC cultures. The sum of the percentages within P1-4 is set to 100% to better visualize the relative changes during culture. The line depicts the percentage of CD71high-
CD235adim erythroid cells in the total culture. Note that erythroid cells appear faster in the CD34+ cell culture than in total PBMC cultures. This is because CD34+ cell cultures do not contain any other cells than CD34+ cells at the onset of culture in contrast to total PBMC, which contain large numbers of T cells, B cells and CD14+ monocytes/macrophages during the first days of culture. However, these cells are outcompeted by the proliferating erythroid cells after 6-7 days (see also Figure 2B). PBMC: peripheral blood mononuclear cells.
during day 1-5, mirrored by an increase in GATA1 mRNA levels. From day 5 to day 7, the cells finally
become CD34-CD36+ erythroid cells (P4), accompanied by a 100-fold increase in GATA1 and EPOR
mRNA levels compared to levels in CD34+ cells at day 0. CD71highCD235adim erythroid cells start to
appear after 4 days (Figure 2B,C) and are the predominant population by day 7. This coincides with
the up-regulation of GATA1 and EPOR mRNA and markedly increased protein levels of gata1 and the

Human CD14+ cells enhance ex vivo HSPC survival
47
erythroid specific markers α/β-spectrin and band3 (SLC4A1; Figure S2B-D). This pattern of marker
expression is similar in cultures initiated from total PBMC, although the erythroid compartment is
enhanced compared to that from CD34+ cultures (Figure 2C,D). In conclusion, the Lin-CD34/CD36
scheme allows sorting for specific populations of HSPC, MEP and erythroblasts but also for cells
between these specific stages.
Expansion of erythroblasts from sorted peripheral blood mononuclear cell populations
Next, we investigated the contribution of each specific population in Figure 1C to the outgrowth of
erythroid cells from total PBMC (Figure 3A,B). Population A and B have the majority of the proliferative
potential. Eight days after initiation of the cultures, the cells stained negative for CD34, CD38 and
CD41, and positive for CD117, CD71 and CD235a (Figure S2E), indicating a pure erythroblast popu-
lation. To assess the relative contribution of each population to the erythroid expansion capacity of
total PBMC, the absolute number of cells in each fraction was corrected for the frequency with which
the initiating cells were present in PBMC (Table 1). The number of CD71highCD235adim erythroblasts
produced by each population at day 17 of culture was compared to the number of erythroblasts
obtained from total PBMC (Figure 3B). The CD34+ populations A and B accounted maximally for 43.6%
of the total erythroid yield from PBMC, and the CD34- fraction accounted for 5.6% of the erythroid
yield. A relatively small proportion (<3%) of this yield could be attributed to the Lin-CD34-CD36dim
population D in PBMC. Importantly, the total number of erythroblasts from populations A-E did not
recapitulate the erythroid yield from total PBMC.
B
Eryt
hrob
last
s (f
old
chan
ge)
A
Time (days)
Cel
l num
ber (
*106 )
0 5 1 0 1 5 2 0
0 .0 0 1
0 .0 1
0 .1
1
1 0
1 0 0
1 0 0 0
1 0 0 0 0
1 0 0 0 0 0 PBMC
C D 34 + C D 36-
C D 34+ C D 36+
C D 34- C D 36+
C D 34- C D 36d im
C D 3 4- C D 3 6-
0
0,2
0,4
0,6
0,8
1
1,2
Figure 3. Cumulative yield of erythroblasts from sorted precursor populations present in PBMC is inferior to total PBMC erythroid yield. (A) One million cells of each population as defined in Figure 1C were cultured for 17 days. The growth curve depicts the cell number in millions as a function of time in days (n=5). (B) To normalize the yield observed in A to the frequencies of the individual populations observed in PBMC, the cell number at day 17 was multiplied by the frequencies presented in Table 1. The data are shown as a fold change with respect to the erythroblast yield of PBMC (n=5). PBMC: peripheral blood mononuclear cells.

Chapter 2
48
CD14+ monocytes/macrophages enhance erythroblast expansion from CD34+ cells
As we observed an increased yield of erythroblasts from total PBMC compared to CD34+ cells, we
hypothesized that PBMC contain a cell fraction that functions as ´helper/feeder cells´. PBMC mainly
contained CD3+ T cells, CD19+ B cells and CD14+ monocytes (Figure 4A). Depletion of CD14+ cells, but
not CD3+ or CD19+ cells, from PBMC consistently reduced expansion of CD71highCD235adim erythroid
cells by 35-40% (Figure 4B and Figure S3 for isolation/depletion efficiencies). The CD14+ fraction
did not contain cells with expansion capacity, which indicates that hematopoietic progenitors are
not co-depleted with CD14+ cells. Conversely, the addition of CD14+ cells to CD34+ cells increased
the number of erythroid cells (Figure 4C). In addition, co-culture of PBMC-derived CD14+ cells with
CD34+ cells isolated from cord blood or bone marrow also increased the erythroblast yield (Figure
S4A,B). PBMC-derived CD14+ cells expressed CD16, CD4, CD38 and CD163, but not CD117, CD34,
CD3 or CD19 (Figure S4C). The addition of CD3+ and CD19+ cells only marginally effected outgrowth
of erythroblasts from CD34+ cells. Together, the data indicate that CD14+ cells isolated from PBMC
positively influence hematopoiesis/erythropoiesis.
CD14+ monocytes/macrophages do not exert their effect on erythroblasts but increase the
numbers of CD34+ hematopoietic stem and progenitor cells during co-culture
CD14+ cells persisted in culture until day 7 (Figure S4D), at which time erythroblasts are emerging.
CD14+ cells could, therefore, elicit their effect on all stages from HSC to erythroblasts. To test this,
CD14+ cells were added to day 8 cultures existing of erythroblasts only; the expansion of erythro-
blasts was similar in the presence or absence of CD14+ cells (Figure 5A). To examine whether CD14+
cells exert their effect on HSPC prior to the erythroblast stage, PBMC-derived CD14+ and CD34+ cells
were co-cultured for 2 days. This resulted in a 5-fold increase in CD34+ cell numbers compared to
when CD34+ cells were cultured alone (Figure 5B). In addition, CD34+ cell numbers from cord blood
or bone marrow were 1.5-fold increased in the presence of PBMC-derived CD14+ cells (Figure S4E,F).
The CD14+ cell fraction did not contribute to erythroid outgrowth nor did these cells become CD34+
(Figure 5B,E). Population A (Lin-CD34+CD36-) was sorted and cultured in presence or absence of CD14+
cells for 2 days. Cell numbers increased 3-fold in population A and 5-fold in population B (Figure 5C).
However, the ratio between A and B did not increase upon co-culture (Figure S5A,B). These data
suggest that proliferation and/or survival of the HSPC and MEP populations is affected by CD14+ cells.
They predict that depletion of CD14+ cells from PBMC should decrease the total number of CD34+
cells during culture. Indeed, PBMC depleted for CD14+ cells resulted in decreases in populations A
and B within 2 days (Figure 5D and Figure S5C).

Human CD14+ cells enhance ex vivo HSPC survival
49
BAC
ell f
requ
ency
(%)
C D 3 + C D 1 4 + C D 1 9 +
2
4
8
1 6
3 2
6 4
1 2 8
C
02468
1012141618
CD34+ CD34+CD3+
CD34+CD14+
CD34+CD19+
Eryt
hrob
last
s (f
old
chan
ge)
P<0.05
0
0,2
0,4
0,6
0,8
1
1,2
1,4
Eryt
hrob
last
s (f
old
chan
ge) P<0.05 NS
Figure 4. CD14+ cells positively affect erythroblast yield. (A) The percentage of lymphocytes (anti-CD3), mono-cytes/macrophages (anti-CD14) and B cells (anti-CD19) was assessed in PBMC using flow cytometry (n=10). (B) PBMC were depleted for CD14+, CD3+ or CD19+ cells using magnetic beads coupled to specific antibodies (for efficiencies see Figure S3). Erythroid yield was assessed after 8 days of culture and depicted as fold changes with respect to the erythroid yield from total PBMC (n=3). (C) CD34+ cells were isolated from PBMC and co-cultured with isolated CD3+, CD14+ or CD19+ cells. The erythroid yield was assessed after 8 days and depicted as fold changes normalized to the yield from CD34+ cells alone (n=3-6). PBMC: peripheral blood mononuclear cells.
To determine whether co-culture is required or whether the effect is exerted immediately, we seeded
CD34+ cells in colony assays in the presence or absence of CD14+ cells, and with or without 2 days
of co-culture. Without co-culture, the presence or absence of CD14+ cells did not increase colony
numbers. However, co-culture of CD34+ with CD14+ cells resulted in a 5-fold increase in hematopoietic
colony formation compared to CD34+ cell cultures or cells seeded in colony assays at the initiation of
culture (Figure 5E). Note that CD14+ cells do not form any colonies and that co-cultures of CD34+ with
CD14+ cells yielded the same number of colonies as 2-day cultures of total PBMC. CD14+ cells may
increase CD34+ cell numbers in the erythroid biased culture conditions through: (i) enhanced lineage
specification; (ii) induction of cell survival; or (iii) promotion of proliferation. To examine an effect on
lineage specification the number of CFU-GM (myeloid), granulocyte-erythrocyte-monocyte-mega-
karyocyte colony-forming units (CFU-GEMM; mixed) and BFU-E (erythroid) colony-forming cells was
determined. The overall distribution of CFU-GM, CFU-GEMM and BFU-E after 2 days of co-culture
with CD14+ cells was not biased towards erythropoiesis (Figure 5F). This suggests that CD14+ cells do
not push CD34+ cells towards a lineage, but affect the overall yield of HSPC.

Chapter 2
50
B
D
CD
34+
cells
(fol
d ch
ange
)
01234567
CD34+ CD34+CD14+
CD14+
P<0.01
C
AEr
ythr
obla
sts
(x10
6 )
Time (days)0 1 2 3 4 5
0
2
4
6
8
1 0 EBL
EBL C D14+
Cel
l cou
nt (a
bsol
ute
num
bers
)
P<0.01
P<0.01
0
5000
10000
15000
20000
25000
30000
35000
WithoutCD14+
WithCD14+
A
B
0
0,2
0,4
0,6
0,8
1
1,2
PBMC
CD14-PBMC
E
Col
ony
num
ber c
hang
e (r
atio
)
0
0,4
0,8
1,2
1,6
2Day 0 Day2
F
00,20,40,60,8
11,21,4 CFU-GEMM
CFU-GM
BFU-E
Col
ony
form
ing
units
(ra
tio) Day 0 Day2
Cel
l cou
nt (f
old
chan
ge)
Figure 5. CD14+ cells do not affect erythroblasts, however they positively influence HSPC. (A) Erythroblasts were expanded from PBMC and were cultured with or without CD14+ cells for 4 additional days (n=6). (B) CD34+ cells were cultured in the presence or absence of CD14+ cells for 2 days. CD34+ cell numbers were assessed by multiplying the percentage of CD34+ cells by total cell counts. The data are depicted as fold changes normalized to CD34+ cell numbers of CD34+ cell cultures (n=4). Note the absence of CD34+ cells in the CD14+-only condition. (C) Population A, as defined in Figure 1C, was FACS-sorted from CD34+ cells and cultured for 2 days with or without CD14+ cells. Population A and B were quantified and absolute counts are displayed (n=3). (D) PBMC depleted for CD14+ cells were cultured for 2 days. CD34/CD36 populations were delineated and normalized to total PBMC. Note the reduction in population A and B when CD14+ cells were absent (n=3). (E-F) Total PBMC, CD34+ cells and CD34+ with CD14+ cells were subjected to colony assays at initiation (day 0) and after 2 days of culture (day 2). Total colony numbers were normalized to colony numbers from total PBMC (n=4) (E). Quantification of colony-forming units. Total colony number is set to 1 to visualize any bias towards a specific hematopoietic lineage (n=4) (F). EBL: erythroblasts; PBMC: peripheral blood mononuclear cells; CFU: colony-forming units; GEMM: granulocyte-eryth-rocyte-monocyte-megakaryocyte; GM: granulocyte-monocyte; BFU-E: erythroid burst-forming units.

Human CD14+ cells enhance ex vivo HSPC survival
51
The effect of CD14+ cells is independent of cell contact, in particular CD14++CD16+ intermediate
monocytes/macrophages enhance erythroblast expansion
To investigate whether CD14+ cells increase proliferation of CD34+ cells, the CD34+ cells were loaded
with CFSE and CFSE dilution was measured during 2 days of culture. Both in the presence and absence
of CD14+ cells, the CFSE signal in CD34+ cells was reduced to similar levels, indicating comparable
numbers of cell divisions (Figure 6A). When lineage specification and proliferation are similar, CD14+
cells most likely enhance survival of CD34+ cells. Indeed, the presence of CD14+ cells decreased
apoptosis of CD34+ cells (Figure 6B). However, this was not regulated via B-cell CLL/lymphoma2 (BCL2)
or BCL2-like 1 (BCL2L1) anti-apoptotic signaling pathways as mRNA levels of these proteins were
unchanged in co-culture conditions compared to the levels in CD34+ cultures alone (Figure S5D,E).
Monocytes/macrophages express various integrins, membrane-bound ligands of integrins, and other
sequestering membrane proteins. These molecules facilitate macrophage functions in innate immune
responses, and regulate cell-cell contact-mediated signal transduction in CD14+ and associated cells.
We hypothesized that cell contact may be important for CD14+ cells to exert their effect on CD34+
cells. However, a dose-dependent effect of the number of CD14+ cells in a transwell assay supported
the involvement of secreted factors rather than cell-cell contact (Figure 6C). These experiments did
not discriminate between an exclusive effect of CD14+ cells or an interplay between secreted factors
by CD34+ cells that regulate the factor secretion profile of CD14+ cells. To investigate this, condi-
tioned media from cultured CD14+ cells were added to cultures of isolated CD34+ cells. Similar to
CD14+ cells, supernatant increased expansion of erythroid cells, suggesting that the spectrum of
factors secreted by CD14+ cells is not influenced by CD34+ cell-induced signaling. Of note, the reduced
erythroid yield of the conditioned media (Figure 6D) compared to the transwell assays (Figure 6C) is
probably explained by: (i) the half-life of the secreted factors in the conditioned media, rather than
continuously replenished factors in the transwell setting; and (ii) the dilution of the supernatant 1:2
with fresh culture medium. Together, these results show that CD14+ cells exert their effect on HSPC
primarily through secreted factors.
CD14+ monocytes/macrophages from PBMC can be subdivided into three populations based on
CD14 and CD16 expression: classical (CD14++CD16-), intermediate (CD14++CD16+) and non-classical
(CD14+CD16+) monocytes/macrophages (Figure 7A)17. Each subpopulation has its own functional and
molecular characteristics18-20. To investigate whether a specific subset is responsible for the increased
erythroid yield, CD14++CD16- (P1), CD14++CD16+ (P2) or CD14+CD16+ (P3) subpopulations were sorted
and co-cultured with CD34+ cells (Figure 7B). Of note, the percentages of the specific subsets in PBMC
reflect literature values (Figure 7A). Co-culture of CD14++CD16+ cells (P2) or CD14++CD16- cells (P1)
with CD34+ cells resulted in 5-fold and 3-fold increases in erythroblast yield, respectively, compared
to culture of CD34+ cells alone (Figure 7B). Co-culturing CD34+ cells with CD14+CD16+ cells (P3) led to
only a modest increase in erythroid yield, indicating that this population is not involved. Additional
analysis showed that CD14++CD16+ intermediate cells (P2) can be further discriminated from classical
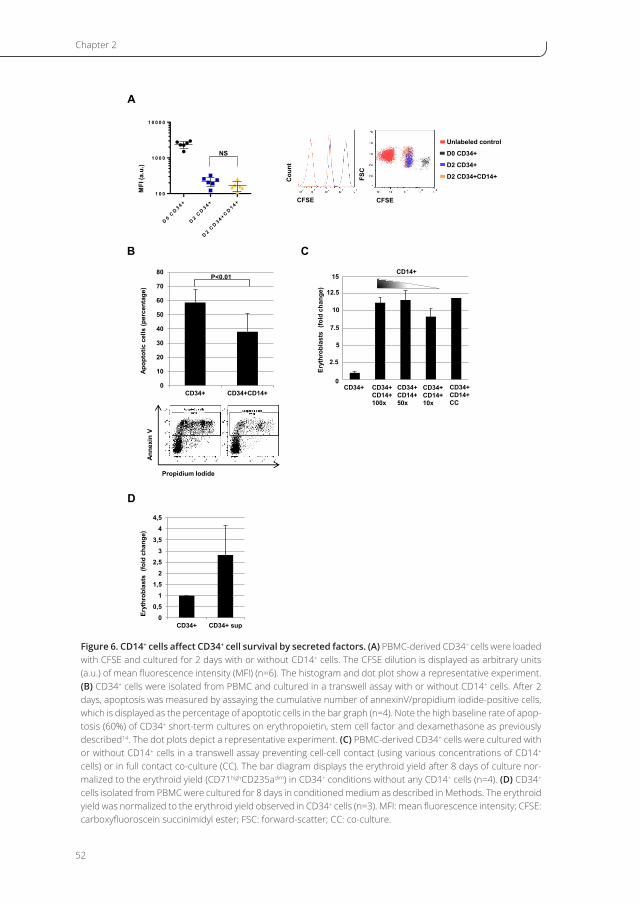
Chapter 2
52
A
CFSE
Cou
nt
FSC
CFSE
Unlabeled control
D0 CD34+
D2 CD34+
D2 CD34+CD14+
MFI
(a.u
.)
D 0C D 3 4 +
D 2C D 3 4 +
D 2C D 3 4 + C D 1 4 +
1 0 0
1 0 0 0
1 0 0 0 0
NS
D
00,5
11,5
22,5
33,5
44,5
CD34+ CD34+ sup
Eryt
hrob
last
s (f
old
chan
ge)
C
Eryt
hrob
last
s (f
old
chan
ge)
0
2.5
5
7.5
10
12.5
15
CD34+ CD34+CD14+ 100x
CD34+CD14+ 50x
CD34+CD14+ 10x
CD34+CD14+ CC
CD14+
B
0
10
20
30
40
50
60
70
80
CD34+ CD34+CD14+
P<0.01
Apop
totic
cel
ls (p
erce
ntag
e)An
nexi
n V
Propidium Iodide
Figure 6. CD14+ cells affect CD34+ cell survival by secreted factors. (A) PBMC-derived CD34+ cells were loaded with CFSE and cultured for 2 days with or without CD14+ cells. The CFSE dilution is displayed as arbitrary units (a.u.) of mean fluorescence intensity (MFI) (n=6). The histogram and dot plot show a representative experiment. (B) CD34+ cells were isolated from PBMC and cultured in a transwell assay with or without CD14+ cells. After 2 days, apoptosis was measured by assaying the cumulative number of annexinV/propidium iodide-positive cells, which is displayed as the percentage of apoptotic cells in the bar graph (n=4). Note the high baseline rate of apop-tosis (60%) of CD34+ short-term cultures on erythropoietin, stem cell factor and dexamethasone as previously described14. The dot plots depict a representative experiment. (C) PBMC-derived CD34+ cells were cultured with or without CD14+ cells in a transwell assay preventing cell-cell contact (using various concentrations of CD14+ cells) or in full contact co-culture (CC). The bar diagram displays the erythroid yield after 8 days of culture nor-malized to the erythroid yield (CD71highCD235adim) in CD34+ conditions without any CD14+ cells (n=4). (D) CD34+ cells isolated from PBMC were cultured for 8 days in conditioned medium as described in Methods. The erythroid yield was normalized to the erythroid yield observed in CD34+ cells (n=3). MFI: mean fluorescence intensity; CFSE: carboxyfluoroscein succinimidyl ester; FSC: forward-scatter; CC: co-culture.

Human CD14+ cells enhance ex vivo HSPC survival
53
and non-classical cells by the combination of CXCR4, CD163, CD169 (Figure 7C) and HLA-DR (data
not shown). All peripheral CD14+ cells are negative for the M2 macrophage marker CD206 (mannose
receptor). CD14+ cells cultured for 2 days showed differentiation towards a CD14++CD16+CD206+
macrophage population that also upregulate tissue residency markers like CXCR4, CD163 and CD169
(Figure 7C and Table S1). Note that CD16 expression is similar to intermediate monocytes freshly
isolated from peripheral blood. Low to no expression of CD209 was observed thereby excluding the
presence of dendritic cells (data not shown).
Discussion
Survival and proliferation of HSPC is crucial to prevent bone marrow failure in vivo, and to enable
expansion of HSPC for cellular therapy in vitro. For future transfusion medicine, the in vitro produc-
tion of erythrocytes is the Holy Grail to provide anemic patients with fully matched erythrocytes,
which requires a maximum expansion capacity during all stages of erythropoiesis. We previously
found that total PBMC cultures display a better expansion of erythroblasts compared to CD34+ cells
isolated from a similar amount of PBMC14. Unraveling the mechanisms that drive this process is
important to optimize in vitro erythroid expansion protocols and potentially unlocks clues of CD34+
cell homeostasis. Here, we show that CD14+ monocytes/macrophages in PBMC secrete factors that
enhance the expansion of CD34+ HSPC. In particular, it is the CD14++CD16+ subset of intermediate
monocytes/macrophages17 that is involved. Interestingly, they affect early CD34+CD36- HSPC and
CD34+CD36+ MEP but not erythroblasts. Besides erythroid expansion from CD34+ cells, also myeloid
colony forming potential increased following co-culture of CD34+ cells with CD14+ monocytes/macro-
phages. Analysis of cell divisions using CFSE labelling showed similar proliferation capacity of CD34+
cells in culture with or without CD14+ cells, indicating that the increased erythroid yield is through
activation of survival pathways.
Tissue-resident macrophages have been found in hematopoietic niches near the HSC where they
provide retention signals to HSPC6. Depletion of macrophages in mice reduces erythropoiesis not
because of impaired erythroblast proliferation per se, but rather as a result of HSPC and erythroblast
mobilization8. This is in agreement with our data showing that CD14+ cells enhance the number of
CD34+ HSPC but not the proliferation rate of human erythroblasts. We showed that CD14+ cells do not
alter lineage commitment or proliferation. Instead, we show that CD14+ cells support CD34+ cell sur-
vival, although this remains to be proven in vivo. Reduced BFU-E formation and hypocellularity of the
bone marrow was observed in M-CSF deficient op/op mice and CSFR-/- mice which are characterized
by reduced F4/80 tissue-resident macrophages13. The combination of retention signals and survival
signals could explain the hematopoietic phenotypes observed in op/op mice and underscores that
macrophages play a role in hematopoietic/erythropoietic homeostasis. Thus, besides being involved
in the retention of HSPC in the bone marrow, we discovered a potential additional role for

Chapter 2
54
A B
0
1
2
3
4
5
6
7
CD34+ CD34+P1
CD34+P2
CD34+P3
Eryt
hrob
last
s (fo
ld c
hang
e)
P<0.05
SSC
CD
16
FSC-A
CD14
P3
P2
P1
Monocytes90.1%
C
C las s ic
a l
Inte
rme d ia
te
N o n c las s ic
a l
D a y2
0 .1
1
1 0
1 0 0
1 0 0 0
1 0 0 0 0
C D 1 6
C las s ic
a l
Inte
rme d ia
te
N o n c las s ic
a l
D a y2
1 0 0
1 0 0 0
1 0 0 0 0
1 0 0 0 0 0
C X C R 4
C las s ic
a l
Inte
rme d ia
te
N o n c las s ic
a l
D a y2
1 0 0 0
1 0 0 0 0
1 0 0 0 0 0
C D 1 6 3
C las s ic
a l
Inte
rme d ia
te
N o n c las s ic
a l
D a y2
0 .1
1
1 0
1 0 0
1 0 0 0
1 0 0 0 0
C D 1 6 9
C las s ic
a l
Inte
rme d ia
te
N o n c las s ic
a l
D a y2
- 1 0 0
0
1 0 0
2 0 0
3 0 0
4 0 0
5 0 0
C D 2 0 6
MFI
(CD1
6)
MFI
(CXC
R4)
MFI
(CD2
06)
MFI
(CD1
69)
MFI
(CD1
63)
Figure 7. In particular CD14++CD16+ monocytes/macrophages positively influence the erythroblast yield. (A) Dot plots representing enrichment of monocytes after elutriation (left). Sorting strategy of the monocyte subsets on the basis of the expression of CD14 and CD16 (right): CD14++CD16- (P1), CD14++CD16+ (P2), and CD14+CD16+ (P3). (B) Sorted subpopulations P1, P2, and P3 were co-cultured with CD34+ cells. After 8 days CD14-CD71highCD235adim cell numbers were counted on the flow cytometer and depicted as fold changes with respect to the erythroid yield from CD34+ cells alone (n=5). (C) Distribution graphs displaying the geometric mean fluorescent intensity of CD16, CXCR4, CD163, CD169 and CD206 on freshly isolated monocyte populations in PBMC and after 2 days of culture (n=3-8). Table S1 shows the statistical significance between each population and marker. FSC(-A): forward-scatter(-area); SSC: side-scatter; MFI: mean fluorescence intensity.

Human CD14+ cells enhance ex vivo HSPC survival
55
macrophages in the survival of CD34+ HSPC during differentiation. An important remaining question is
whether survival and retention of CD34+ cells by the CD14+ monocytes/macrophages are the same, or
originate from independent signal transduction pathways. We observed that the increased survival of
CD34+ cells and subsequent yield of erythroblasts is caused by a secreted factor, whilst the retention
of CD34+ HSPC in the bone marrow was dependent on cell contact through VCAM-1 (CD106)6. This
favors a model in which these two macrophage functions can be separated.
CD14+ cells in peripheral blood are a mixed population of cells that includes phenotypes resem-
bling bone marrow tissue-resident macrophages (CD14+CD163+CD169+)6,8. We find that these cells
are present in the intermediate monocyte population in PBMC. This population also displays the
best HSPC support during co-culture experiments. During (co-)culture these monocytes differen-
tiate towards CD206+ macrophages that further upregulate tissue resident markers like CXCR4,
CD163, CD169 resembling tissue-resident M2 macrophages21,22. It is important to compare this
specific subset and their similarity to bone marrow isolated resident macrophages. The observed
effects are caused by secreted factors and hence the identity of these growth factors is of para-
mount importance to optimize in vitro erythropoiesis and to better understand HSPC survival in
the hematopoietic niches. At present, hematopoietic stem cell transplantation is performed with
total mobilized PBMC rather than purified CD34+ HSPC from PBMC or bone marrow. However, the
effect of different hematopoietic effector cells on HSPC engraftment is unclear. As we found that
CD14+ cells promote survival of CD34+ HSPC, a putative beneficial effect of CD14+ cells in HSPC
survival after engraftment is possible.
Analysis of total peripheral blood and PBMC-derived CD34+ cell cultures on the basis of lineage
depletion (CD3/CD14) and CD34/CD36 during time, revealed a gradual disappearance of CD34 and
appearance of CD36 during HSPC differentiation as recently observed for cord blood CD34+ cells23.
Colony assays confirmed that CD34+CD36- cells were HSPC, CD34+CD36+ cells were highly enriched
for MEP and CD34-CD36+ cells were erythroblasts. This Lin-CD34/CD36 staining provides a novel tool
to follow HSPC differentiation towards the erythroblasts and enables sorting of specific differentia-
tion intermediates. Subsequently, the erythroblasts can be further analyzed during differentiation to
enucleated reticulocytes using previously described protocols16,24. Here, we found that CD14+ cells
provide support to HSPC cells leading to increased survival of CD34+ cells. The observations explain
the increased erythroid expansion from total PBMC compared to CD34+ cells isolated from a similar
amount of PBMC and unravel a novel role for CD14+ cells in survival of hematopoietic progenitors.
Furthermore, we designed a novel tool to follow specific stages during CD34+ differentiation to eryth-
roblasts in adult erythropoiesis using a Lin-CD34/CD36 flow cytometry panel.

Chapter 2
56
Author contributions
EH, EA, FM and MM performed the experiments. FE performed the erythroblast/CD14+ co-culture
experiments. NY performed conditioned medium experiments. AM and EA designed the experiments,
supervised the study and analyzed the data. EA and EH wrote the manuscript. ML and AM co-super-
vised and helped writing the manuscript. The manuscript was critically revised by all authors. The
authors report no potential conflicts of interest.
Acknowledgements
We would like to thank Erik Mul (Sanquin Central Facility) and Gijs van Schijndel (Immunopathol-
ogy; Sanquin research) for technical assistance regarding the isolation of monocytes/macrophages
from PBMC by elutriation and FACS sorting and Thamar van Dijk (Erasmus Medical Center, Rotter-
dam, the Netherlands) for providing GATA1 antibodies. This study was supported by funding from
the Landsteiner Foundation for Blood Transfusion Research Landsteiner (LSBR1141; EA, EH, FE),
Sanquin (PPOC: 12-025; NY, ML, EA), NHLBI (HL116329-01; AM) and the National Cancer Institute
(P01-CA108671; AM), Centro Nazionale Sangue and Associazione Italiana Ricerca sul Cancro (AIRC;
FM, MM).

Human CD14+ cells enhance ex vivo HSPC survival
57
References
1. Kiel MJ, Iwashita T, Yilmaz OH, Morrison SJ. Spatial differences in hematopoiesis but not in stem cells indicate a lack of regional
patterning in definitive hematopoietic stem cells. Dev Biol. 2005;283(1):29-39.
2. Sugiyama T, Kohara H, Noda M, Nagasawa T. Maintenance of the hematopoietic stem cell pool by CXCL12-CXCR4 chemokine
signaling in bone marrow stromal cell niches. Immunity. 2006;25(6):977-988.
3. Lo Celso C, Wu JW, Lin CP. In vivo imaging of hematopoietic stem cells and their microenvironment. J Biophotonics. 2009;2(11):619-
631.
4. Mendez-Ferrer S, Michurina TV, Ferraro F, et al. Mesenchymal and haematopoietic stem cells form a unique bone marrow niche.
Nature. 2010;466(7308):829-834.
5. Nwajei F, Konopleva M. The bone marrow microenvironment as niche retreats for hematopoietic and leukemic stem cells. Adv
Hematol. 2013;2013:953982.
6. Chow A, Lucas D, Hidalgo A, et al. Bone marrow CD169+ macrophages promote the retention of hematopoietic stem and
progenitor cells in the mesenchymal stem cell niche. J Exp Med. 2011;208(2):261-271.
7. Winkler IG, Sims NA, Pettit AR, et al. Bone marrow macrophages maintain hematopoietic stem cell (HSC) niches and their deple-
tion mobilizes HSCs. Blood. 2010;116(23):4815-4828.
8. Chow A, Huggins M, Ahmed J, et al. CD169(+) macrophages provide a niche promoting erythropoiesis under homeostasis and
stress. Nat Med. 2013;19(4):429-436.
9. Mohandas N, Prenant M. Three-dimensional model of bone marrow. Blood. 1978;51(4):633-643.
10. Lee G, Lo A, Short SA, et al. Targeted gene deletion demonstrates that the cell adhesion molecule ICAM-4 is critical for erythro-
blastic island formation. Blood. 2006;108(6):2064-2071.
11. Rhodes MM, Kopsombut P, Bondurant MC, Price JO, Koury MJ. Adherence to macrophages in erythroblastic islands enhances
erythroblast proliferation and increases erythrocyte production by a different mechanism than erythropoietin. Blood.
2008;111(3):1700-1708.
12. Hanspal M, Golan DE, Smockova Y, et al. Temporal synthesis of band 3 oligomers during terminal maturation of mouse eryth-
roblasts. Dimers and tetramers exist in the membrane as preformed stable species. Blood. 1998;92(1):329-338.
13. Dai XM, Ryan GR, Hapel AJ, et al. Targeted disruption of the mouse colony-stimulating factor 1 receptor gene results in osteo-
petrosis, mononuclear phagocyte deficiency, increased primitive progenitor cell frequencies, and reproductive defects. Blood.
2002;99(1):111-120.
14. van den Akker E, Satchwell TJ, Pellegrin S, Daniels G, Toye AM. The majority of the in vitro erythroid expansion potential resides
in CD34- cells, outweighing the contribution of CD34+ cells and significantly increasing the erythroblast yield from peripheral
blood samples. Haematologica. 2010;95(9):1594-1598.
15. Migliaccio G, Sanchez M, Masiello F, et al. Humanized culture medium for clinical expansion of human erythroblasts. Cell Trans-
plant. 2010;19(4):453-469.
16. Socolovsky M, Nam H, Fleming MD, Haase VH, Brugnara C, Lodish HF. Ineffective erythropoiesis in Stat5a(-/-)5b(-/-) mice due to
decreased survival of early erythroblasts. Blood. 2001;98(12):3261-3273.
17. Ziegler-Heitbrock L, Ancuta P, Crowe S, et al. Nomenclature of monocytes and dendritic cells in blood. Blood. 2010;116(16):e74-
80.
18. Zawada AM, Rogacev KS, Rotter B, et al. SuperSAGE evidence for CD14++CD16+ monocytes as a third monocyte subset. Blood.
2011;118(12):e50-61.
19. Schmidl C, Renner K, Peter K, et al. Transcription and enhancer profiling in human monocyte subsets. Blood. 2014;123(17):e90-
99.
20. Wong KL, Tai JJ, Wong WC, et al. Gene expression profiling reveals the defining features of the classical, intermediate, and non-
classical human monocyte subsets. Blood. 2011;118(5):e16-31.
21. Moestrup SK, Moller HJ. CD163: a regulated hemoglobin scavenger receptor with a role in the anti-inflammatory response. Ann
Med. 2004;36(5):347-354.
22. Martinez FO, Gordon S, Locati M, Mantovani A. Transcriptional profiling of the human monocyte-to-macrophage differentiation
and polarization: new molecules and patterns of gene expression. J Immunol. 2006;177(10):7303-7311.
23. Li J, Hale J, Bhagia P, et al. Isolation and transcriptome analyses of human erythroid progenitors: BFU-E and CFU-E. Blood.
2014;124(24):3636-3645.
24. Chen K, Liu J, Heck S, Chasis JA, An X, Mohandas N. Resolving the distinct stages in erythroid differentiation based on dynamic
changes in membrane protein expression during erythropoiesis. Proc Natl Acad Sci U S A. 2009;106(41):17413-17418.

Chapter 2
58
Supplementary methods
Mobilized peripheral blood, cord blood and bone marrow cultures
Mononuclear cells were isolated from bone marrow and cord blood. CD34+ cells from both cord
blood and mobilized peripheral blood were isolated by MACS sorting. CD34+ cells from bone marrow
were FACS sorted. CD34+ cells were co-cultured with PBMC-derived CD14+ cells at a ratio of 1:100.
Media was replenished every two days. Informed consent from donors was given in accordance with
the Declaration of Helsinki.
Quantitative PCR analysis
To assess the relative GATA1 and EPOR mRNA levels during differentiation of CD34+ cells, aliquots
were taken at day 0, 2, 4 and 8 of culture. To assess the relative mRNA levels of BCL2 and BCL2L1
after co-culturing CD34+ cells with CD14+ cells, CD34+ cells were cultured in a transwell with or
without CD14+ cells for 2 days. RNA was extracted with TRIzol reagent (Invitrogen Technologies,
Carlsbad, CA) and complementary DNA was synthesized with random hexamers as described in
the product protocol (Invitrogen). RT-PCR was performed in duplicate with Express SYBR GreenER
reagents (Invitrogen) on the StepOnePlus RT PCR system (Applied Biosystems, Foster City, CA). Values
were normalized using S18 as a reference gene and calibrated relative to expression in CD34+ cells
at day 0 (for GATA1 and EPOR) and CD34+ cells cultured in the absence of CD14+ cells (for BCL2
and BCL2L1). The following primer sets were used: S18 (forward: 5’-GGACAACAAGCTCCGTGAAGA-3’,
reverse: 5’-CAGAAGTGACGCAGCCCTCTA-3’), GATA1 (forward: 5’-ATCACACTGAGCTTGCCACA-3’,
reverse: 5’-ACCAGAGCAGGATCCACAAA-3’), EPOR (forward: 5’-CTCATCCTCGTGGTCATCCT-3’, reverse:
5’-GCTGGAAGTTACCCTTGTGG-3’), BCL2 (forward: 5’-ATGTGTGTGGAGAGCGTCAA-3’, reverse:
5’-CGTACAGTTCCACAAAGGCA-3’) and BCL2L1 (forward: 5’-GCGTGGAAAGCGTAGACAAG-3’, reverse:
5’-TGCTGCATTGTTCCCATAGA-3’).
Western blotting
During CD34+ cell differentiation, aliquots were taken at day 0, 2, 4 and 8 of culture. Cells were pel-
leted, washed once with PBS and lysed (20mM Tris-HCl pH8.0, 138mM NaCl, 10mM EDTA, 100mM
NaF, 1% Nonidet P-40, 10% glycerol; Protease inhibitor cocktail V (Calbiochem, Darmstadt, Germany),
100μM PMSF (Sigma Aldrich; St. Louis, MO; 1:1000) and 1mM sodium orthovanadate (New England
Biolabs, Leusden, the Netherlands)). Protein concentrations were determined by Bradford assay
according to the manufacturer’s protocol (Bio-Rad, Hercules, CA, USA). Lysates were mixed with
Laemmli loading dye (Invitrogen Life Technologies, Breda, the Netherlands) and incubated for 5min
at 95°C. Proteins were separated on a 7.5% SDS-PAGE gel loading equal protein concentrations or
equal cell numbers and subsequently transferred to nitrocellulose membranes (Invitrogen). A 250-
kda precision marker was used as size standards (Invitrogen). Membranes were blocked with 5%
bovine serum albumin (BSA; Sigma) and subsequently incubated for 1hr with primary antibodies;
anti-RhoGDI (Abnova, Taipei, Taiwan; 1:1000), anti-gata1 (a kind gift from Thamar van Dijk, Erasmus
Human CD14+ cells enhance ex vivo HSPC survival
59
Medical Center, the Netherlands; 1:1000), anti-band3 (BRIC170; IBGRL; Bristol, UK; 1:1000) and anti-
α/β-spectrin (Sigma; 1:1000)) in Tris-buffered saline and 0.1% Tween 20 (pH8.0) containing 5% BSA.
Membranes were washed, followed by incubation with IRDye 800-conjugated secondary antibodies
(LI-COR Biosciences, Lincoln, NE, USA; 1:2500-10000). Fluorescence was detected on an Odyssey
Infrared Imaging system using Odyssey V3.0 software (both LI-COR Biosciences).
Flow cytometry
Antibodies used: BD Biosciences: anti-CD3 (PE 1:50; Pacific Blue 1:80), anti-CD14 (PE 1:50; Pacific
Blue 1:150), anti-CD16 (Pacific Blue 1:80), anti-CD19 (PE 1:50; PE-Cy7 1:20), anti-CD34 (FITC 1:10),
anti-CD38 (PE 1:50), anti-CD41 (APC 1:20), anti-CD42 (PE 1:20), anti-45RA (PE 1:10), anti-CD56 (PE 1:20),
anti-CD117 (PE 1:50), anti-CD169 (APC 1:100), anti-CD206 (APC 1:100) and anti-BAH1.1 (PE 1:100; APC
1:10); Miltenyi Biotec: anti-CD14 (APC 1:50; PE 1:50), anti-CD71 (APC 1:150) and anti-CD163 (PE 1:100);
Pelicluster (Amsterdam, The Netherlands): anti-CD4 (PE 1:50), anti-CD16 (FITC 1:100) and anti-CD36
(FITC 1:100); Dako (Glostrup, Denmark): anti-CD41 (PE 1:20) and anti-CD235a (PE 1:100); eBioscience
(Vienna, Austria): CD184 (PE 1:100); IQ Products (Groningen, The Netherlands): anti-CD34 (APC 1:10).

Chapter 2
60
Supplementary data
Table S1. Statistical analysis of marker expression between the different CD14+ populations in PBMC before and after two days of culture (Figure 7C).
P-values t-test CD16 CXCR4 CD163 CD169 CD206
Classical vs. Intermediate 0.00005 0.00317 0.00416 0.17957 N/A
Classical vs. Non-classical 0.00109 0.16771 0.03652 0.23951 N/A
Intermediate vs. Non-classical 0.00225 0.00812 0.01267 0.07984 N/A
Classical vs. Day 2 0.00152 0.03255 0.00460 0.05191 0.01646
Intermediate vs. Day 2 0.03347 0.03387 0.00492 0.05456 0.01714
Non-classical vs. Day 2 0.00378 0.03247 0.00315 0.03645 0.01727

Human CD14+ cells enhance ex vivo HSPC survival
61
A
C
Col
onie
s (3
00 c
ells
inpu
t)
3242
5
29
0
10
20
30
40
50
60
70
80
90non BFU-E
BFU-E
MEP CMP
B
Isot
ype
Isot
ype
CD
41C
D71
Isotype CD235a
Isotype CD42
iv
ii
iii
i
MEP
CMP GMPBAH
1.1
SSC
CD
34
FSC-A FSC-A CD45RA
Figure S1. Characterization of BAH1.1 as a MEP marker. (A) Gating strategy to define CMP, GMP and MEP populations. CD34+ cells were isolated from peripheral blood mononuclear cells (PBMC) and cultured for 4 days in StemSpan supplemented with IL6 (10ng/ml), IL3 (1ng/ml), SCF (100ng/ml) and N-PLATE (50ng/ml; thrombopoi-etin agonist). Cells were analyzed by flow cytometry. Living cells were gated on FSC/SSC, followed by a positive gate for CD34. The CD34+ cells were further separated on the basis of BAH1.1 and CD45RA. CD34+BAH1.1+C-D45RA- cells were FACS-sorted and subjected to colony assays (B) or cultured in specific media (C). (B) Colony assays indicating that CD34+BAH1.1+CD45RA- cells primarily display BFU-E colony forming ability. Note that CD34+BAH1.1-CD45RA-CMP produce both BFU-E and non BFU-E colonies. (C) CD34+BAH1.1+CD45RA- cells were cultured in megakaryopoiesis specific media containing StemSpan supplemented with SCF (100ng/ml), IL1β (1ng/ml), IL6 (10ng/ml) and N-PLATE (50ng/ml) for 4 days followed by 4 days with IL1β (1ng/ml) and N-PLATE (50ng/ml) only (i-ii) or erythropoiesis specific media containing StemSpan supplemented with erythropoietin (2U/ml), stem cell factor (100ng/ml) and dexamethasone (1μM) for 8 days (iii-iv). Cells were analyzed by flow cytometry. Both CD41a+CD42b- megakaryoblasts and CD41a+CD42b+ megakaryocytes were found in megakaryopoiesis specific media (ii; isotype in i) and CD71highCD235adim erythroblasts were found in erythropoiesis specific media (iv; isotype in iii). Together the colony assays and liquid cultures show that BAH1.1 can be used to delineate MEP from other hematopoietic lineages. FSC(-H): forward scatter; SSC: side scatter; MEP: megakaryocyte-eryth-roid progenitor; CMP: common myeloid progenitor; GMP: granulocyte-monocyte progenitor; BFU-E: erythroid burst-forming units.

Chapter 2
62
CD34 CD38 CD117 CD41 CD71 CD235a
AC
D34
Isot
ype
CD
117
CD
38
FSC-A Isotype CD36 CD36
i ii iii iv
Cou
nt
FSC FSC Isotype CD235a
CD
71
II III IVSSC
CD
71
ii iii iv
FSC
-H
i
Isot
ype
FSC-A Isotype CD235aFSC-A
E
C
0,1
1
10
100
1000
0 2 4 80,1
1
10
100
1000
0 2 4 8
Rel
ativ
e ex
pres
sion
(EPO
R)
Rel
ativ
e ex
pres
sion
(GAT
A1)
Time (days)Time (days)
B
D0 2 4 8 M 0 2 4 8
Anti-spectrin
Anti-band3
Anti-gata1
Anti-RhoGDI
Figure S2. Population definitions and marker expression on erythroblasts. (A) CD34+ cells isolated from PBMC were separated using CD36/CD38 and CD36/CD117 antibodies. The dot plot (iii) shows a representative experiment indicating that CD34+ cells (i) can be further separated into 72% CD38+ (short term hematopoietic stem cells; HSC), 22% CD38- (long term HSC) and 4% CD38+CD36+ (megakaryocyte-erythroid progenitors; MEP). CD117 positivity mirrors CD38 expression patterns (iv). The isotype control is displayed in ii. (B-C) RT-PCR analysis of GATA1 (B) and EPOR (C) mRNA levels in CD34+ cells during culture at day 0, 2, 4 or 8 normalized to S18 and relative to CD34+ cells at day 0 (n=3). (D) CD34+ cells from mobilized peripheral blood were cultured for 0, 2, 4, or 8 days and western blot analysis demonstrated increasing spectrin (250kda), band3 (100kda) and gata1 (50kda) protein expression during CD34+ cell differentiation, lanes were loaded according to equal protein concentrations (left) or to equal cell numbers (right). Western blot images show a representative result (n=3). Note that the strictly erythroid marker band3 (SCLa41) is only expressed on day 8. (E) Gating strategy to show erythroblasts according to CD71/CD235a expression. PBMC were cultured for 8 days and erythroblasts were gated based on size (FSC/SSC), single cells (FSC-H/FSC-A) and CD71/CD235a positivity. Representative histograms showing PBMC-derived erythroblasts which do not express CD34, CD38 or CD41 but are CD117+, CD71high and CD235adim. FSC(-H): forward scatter(-height); SSC: side scatter; M: precision marker.

Human CD14+ cells enhance ex vivo HSPC survival
63
A B C
0
20
40
60
80
PBMC CD3-PBMC
CD
3+ c
ells
(%)
CD
3
FSC-A
0
5
10
15
20
25
PBMC CD14-PBMC
CD14
+ ce
lls (%
)CD
14
FSC-A
0
2
4
6
8
10
PBMC CD19-PBMC
CD
19+
cel
ls (%
)C
D19
FSC-A
Isot
ype
CD
34
FSC-A FSC-A
D E
F G
Isot
ype
CD
3
FSC-A FSC-A
FSC-A FSC-A
Isot
ype
CD
14
FSC-A FSC-A
Isot
ype
CD
19
Figure S3. Depletion and isolation efficiencies of CD3+, CD14+ and CD19+ cells. Graphs display the percent-age of (A) CD3+, (B) CD14+ and (C) CD19+ cells before and after depletion by magnetic-activated cell sorting (n=3). Dot plots showing the MACS isolation efficiencies of (D) CD34+, (E) CD3+, (F) CD14+ and (G) CD19+ cells. The dot plots depict representative depletion and isolation experiments. PBMC: peripheral blood mononuclear cells; FSC: forward scatter.
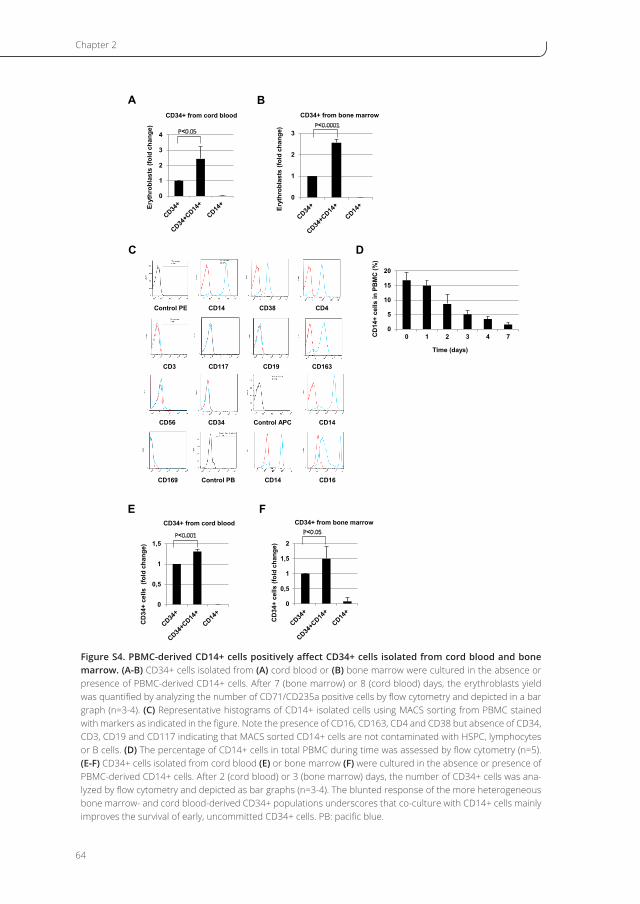
Chapter 2
64
A
0
1
2
3
4
0
1
2
3
BCD34+ from cord blood CD34+ from bone marrow
Eryt
hrob
last
s (fo
ld c
hang
e)
Eryt
hrob
last
s (fo
ld c
hang
e)
0
0,5
1
1,5
0
0,5
1
1,5
2
FE
CD
34+
cells
(fo
ld c
hang
e)
CD
34+
cells
(fol
d ch
ange
)
CD34+ from cord blood CD34+ from bone marrow
P<0.05P<0.0001
P<0.001 P<0.05
C
CD56 CD34 Control APC CD14
CD169 Control PB CD14 CD16
Control PE CD14 CD38 CD4
CD3 CD117 CD19 CD163C
D14
+ ce
lls in
PB
MC
(%)
0
5
10
15
20
0 1 2 3 4 7
Time (days)
D
Figure S4. PBMC-derived CD14+ cells positively affect CD34+ cells isolated from cord blood and bone marrow. (A-B) CD34+ cells isolated from (A) cord blood or (B) bone marrow were cultured in the absence or presence of PBMC-derived CD14+ cells. After 7 (bone marrow) or 8 (cord blood) days, the erythroblasts yield was quantified by analyzing the number of CD71/CD235a positive cells by flow cytometry and depicted in a bar graph (n=3-4). (C) Representative histograms of CD14+ isolated cells using MACS sorting from PBMC stained with markers as indicated in the figure. Note the presence of CD16, CD163, CD4 and CD38 but absence of CD34, CD3, CD19 and CD117 indicating that MACS sorted CD14+ cells are not contaminated with HSPC, lymphocytes or B cells. (D) The percentage of CD14+ cells in total PBMC during time was assessed by flow cytometry (n=5). (E-F) CD34+ cells isolated from cord blood (E) or bone marrow (F) were cultured in the absence or presence of PBMC-derived CD14+ cells. After 2 (cord blood) or 3 (bone marrow) days, the number of CD34+ cells was ana-lyzed by flow cytometry and depicted as bar graphs (n=3-4). The blunted response of the more heterogeneous bone marrow- and cord blood-derived CD34+ populations underscores that co-culture with CD14+ cells mainly improves the survival of early, uncommitted CD34+ cells. PB: pacific blue.

Human CD14+ cells enhance ex vivo HSPC survival
65
CD36
CD
34
CD34+ CD34+CD14+
A
Popu
latio
n B
/A (
ratio
)
0
0,05
0,1
0,15
0,2
0,25
WithoutCD14+
WithCD14+
NSB
C
CD36
PBMCLin-
CD14-PBMCLin-
CD14+Lin-
CD
34
i ii iii
0
0,5
1
1,5
CD34+ CD34+CD14+0
0,5
1
1,5
CD34+ CD34+CD14+
Rel
ativ
e ex
pres
sion
(BC
L2)
Rel
ativ
e ex
pres
sion
(BC
L2L1
)
D ENS NS
Figure S5. CD14+ cells control the survival of HSPC. (A) Representative dot plots belonging to Figure 5C showing CD34/CD36 expression (populations defined in Figure 1C of sorted population A (Lin-CD34+CD36) in the presence or absence of CD14+ cells after 2 days of culture. (B) Ratio depicting the absolute cell numbers in population B (megakaryocyte-erythroid progenitors; MEP) divided by population A (HSPC) from the experiment in Figure 1C (n=3). (C) Representative CD34/CD36 dot plots from total PBMC (i), PBMC depleted for CD14+ cells (ii) and CD14+ cells (iii) belonging to the bar diagraphs of Figure 5D. RT-PCR analysis of (D) BCL2 and (E) BCL2L1 mRNA levels in CD34+ cells during a 2-day culture in transwell assays in the presence or absence of CD14+ cells. The bar graph depicts the relative mRNA levels normalized to the S18 reference gene with the level of mRNA in CD34+ cells without co-culture set to 1 (n=4). PBMC: peripheral blood mononuclear cells; Lin-: lineage-negative cells.

Stage 1
PBMC
Stage 2 Stage 3
Erythroblasts Cultured RBC
3

Large-scale in vitro production of red blood cells from
human peripheral blood mononuclear cells
CHAPTER 3
Esther Heideveld*, Patrick Burger*, Marijke Thiel-Valkhof, Erica Sellink, Steven Heshusius, Anna Visser, Marieke von Lindern, and Emile van den Akker
* These authors contributed equally to this work

Chapter 3
68
Abstract
Transfusion of donor-derived red blood cells is the most common form of cellular therapy. How-
ever, the source depends on donor availability and carries a potential risk of alloimmunization and
blood borne diseases, especially in chronically transfused patients. In vitro cultured, customizable red
blood cells would negate these concerns and introduce precision medicine. Large-scale, cost effective
production depends on reducing cost-drivers and optimizing culture conditions. We adapted our
protocols to GMP culture requirements, which reproducibly provided pure erythroid cultures within
25 days with a 3.4x10⁷ times expansion from peripheral blood mononuclear cells without prior CD34+
isolation. Expanded erythroblasts could be differentiated to CD71dimCD235a+CD44+CD117-DRAQ5-
cultured red blood cells. More than 90% of the cells enucleated and expressed adult hemoglobin
as well as the correct blood group antigens. Deformability and oxygen binding capacity of cultured
red blood cells was comparable to in vivo reticulocytes. This process was compatible with upscaling
using a G-Rex bioreactor with a capacity of 5L per reactor, allowing transition towards clinical studies
and application.

Large-scale in vitro production of red blood cells
69
Introduction
Blood transfusion is the most applied cellular therapy, with more than 80 million transfusion units
administered worldwide each year1. However, it is increasingly more difficult to find suitable donors
because of the antigen variation in modern multi-cultural societies and the risk for novel blood-born
infections, because of global traffic of individuals, including endemic areas. In the past decades,
oxygen-carrier substitutes have shown to be applicable in case of immediate emergency, but they
are less reliable to replace blood transfusions2. Better availability of erythrocytes with rare blood
groups will decrease the risk of alloimmunization in patients with chronic anemia that are in need of
recurrent transfusions, e.g., patients with hemoglobinopathies or with cancer. Cost-effective, large-
scale production of blood group matched erythrocytes may become essential to obtain a degree of
donor independency and to minimize donor-patient blood type variation. In addition, in vitro cultured
erythrocytes can be used as therapeutic delivery systems by releasing carried cargo at specific parts
of the body3. Several groups already cultured enucleated cultured red blood cells (cRBC) in vitro from
cord blood4-7. However, these cells produce fetal hemoglobin with a higher tendency to denature
and to cause membrane damage compared to adult hemoglobin8. A fetal phenotype shortens the
life span of erythrocytes from 120 to 40-90 days9. Moreover, cord blood as a source is limited, and
it is therefore imperative to investigate alternative sources to culture red blood cells expressing
adult hemoglobin. We have previously shown that enucleated cRBC can be generated starting from
peripheral blood mononuclear cells (PBMC) isolated from buffy coats10, 11. Not only are PBMC a better
accessible source than CD34+ cells isolated from cord blood, we have also shown that the erythroid
yield from PBMC is 10-15 fold increased compared to CD34+ cells isolated from a similar amount of
PBMC, because CD14+ cells present in PBMC increase the survival of CD34+ hematopoietic stem and
progenitor cells (HSPC)10, 11. Furthermore, using PBMC and thus dispensing the need to purify CD34+
cells simplifies the protocol and avoids expensive isolation procedures.
One transfusion unit contains about 2x10¹² erythrocytes, reflecting the high requirement for eryth-
roblast expansion to obtain sufficient numbers of cRBC. Previous attempts to culture the required
number of enucleated cRBC from CD34+ cells isolated from PBMC were hampered by low expansion
or poor enucleation12, 13. Expansion of CD71highCD235adim erythroblasts can be prolonged by exploiting
the cooperative action of erythropoietin (EPO), stem cell factor (SCF) and glucocorticoids in a serum/
plasma-free environment10, 11, 14, while differentiation is induced by increasing concentrations of EPO
and dispensing SCF and glucocorticoids. Here, we describe a three stage GMP-grade culture protocol
using culture dishes or G-Rex bioreactors, both with high expansion and enucleation to generate
PBMC-derived cRBC. This three-stage culture protocol can be used for large-scale GMP-grade pro-
duction, yielding >90% enucleated reticulocytes with adult hemoglobinization.

Chapter 3
70
Methods
Cell culture
Human peripheral blood mononuclear cells (PBMC) were purified by density separation using Ficoll-
Paque (manufacturer protocol). Informed consent was given in accordance with the Declaration of
Helsinki and Dutch National and Sanquin Internal Ethic Boards. PBMC were cultured at 5-10x106
cells/ml (CASY® Model TCC; Schärfe System GmbH, Reutlingen, Germany) in HEMA-Def medium10,
15 supplemented with erythropoietin (2U/ml; ProSpec, East Brunswick, NJ), human recombinant
stem cell factor (100ng/ml; ITK Diagnostics BV, Uithoorn, The Netherlands), dexamethasone (1μM;
Sigma, St. Louis, MO) and 0.1% ultra-clean human serum albumin (cHSA; kindly provided by San-
quin Plasma Products, Amsterdam, The Netherlands), referred to as expanding medium (EM). Only
during the first two days of culture IL3 was added (1ng/ml; Miltenyi Biotec, Bergisch Gladbach,
Germany). Media was replenished every two days. Around day 6, when the first erythroblasts arose,
the cells were expanded in EM by maintaining cells at 1-2x10⁶ cells/ml. EM cultures were compared
to alternative cell systems by replacing cHSA for 2.5% Albuman® (Sanquin, Amsterdam, The Neth-
erlands), 0.1% detoxified HSA16, recombinant HSA (Akron Biotech, Boca Raton, FL, USA), AB+ pool
plasma (Sanquin) or erythroblast cultures in StemSpan as previously described11. Differentiation
of erythroblasts was induced in differentiation medium (DM) containing HEMA-Def supplemented
with erythropoietin (10U/ml), 5% Omniplasma (Omnipharma S.A.L., Beirut, Lebanon), holotrans-
ferrin (700µg/ml; Sanquin) and heparin (5U/ml; LEO Pharma BV, Breda, The Netherlands). At day
two half a medium change was performed. At day 5, storage components were added and media
was refreshed (half) every two days until fully differentiated at day 10-12 of differentiation. Of note,
after obtaining a pure erythroblast populations, cells were either maintained in culture dishes as
described above, or transferred to a G-Rex system (WilsonWolf, stPaul, MN, USA). For reticulocyte
filtration see Supplementary Methods.
Flow cytometry
Cells were washed and resuspended in HEPES buffer supplemented with 1% HSA. Cells were incu-
bated with primary antibodies for 30min at 4C, measured on FACS Canto II or LSRFortessa (both BD
Biosciences, Oxford, UK) and analyzed using FlowJo software (FlowJo v10, Ashland, OR, USA). Thiazole
orange (TO; Sigma) was used to stain RNA as described previously17 and DRAQ5 (1:2500; Abcam,
Cambridge, UK) was used to stain nuclei. Antibodies are listed in Supplementary Methods.
RBC deformability
RBC deformability was measured by the Automated Rheoscope and Cell Analyzer (ARCA), in which
cells were elongated by shear flow in a viscous medium between parallel glass plates as described
previously18. Advanced imaging algorithms were used to locate cells and to calculate cellular deforma-
bility. All experiments were performed at a shear stress of 10 Pa, and for each experiment more than
3000 cells were judged and grouped in 30 bins according to increasing elongation or cell projection

Large-scale in vitro production of red blood cells
71
area (as a measure of membrane surface area). Both the extent of elongation (major cell radius
divided by minor cell radius) and the area (in mm2) was plotted against the normalized frequency of
occurrence.
HPLC
Culture lysates were prepared and stored at -80°C prior to analysis as described previously19. In short,
hemoglobin separation was performed within 5 days after drawing the blood by high performance
cation exchange liquid chromatography (HPLC) on Waters Alliance 2690 equipment (Waters, Milford,
MA, USA). The protocol consisted of a 30min elution over a combined 20-200mM NaCl and pH7.0-
6.6 gradient in 20mM BisTris/HCl and 2mM KCN. A PolyCAT A 100/4.6mm, 3mm, 1500Å column was
purchased (PolyLC, Columbia, MD, USA).
Coomassie
Ghosts (erythroid membranes) were generated as described before10, subjected to SDS-PAGE gels
(Bio-Rad, Hercules, CA, USA) and total proteins stained with Coomassie. In short, proteins were fixed in
30% ethanol, 2% (v/v) phosphoric acid ON. Wash 2 times 10min in 2% phosphoric acid and equilibrate
for 30min in 2% phosphoric acid containing 18% ethanol and 15% (w/v) ammonium sulphate. Stain by
diluting Coomassie Blue G-250 slowly in water from 0.2% to a final concentration of 0.02% (0.2mg/ml).
Cytospins
Cells were cytospun using Shandon Cytospin II (Thermo Scientific), dried and fixed in methanol.
Cells were stained with benzidin in combination with the Differential Quik Stain Kit (PolySciences,
Warrington, PA) (manufacturers protocol). Slides were dried, subsequently embedded in Entellan
(Merck-Millipore) and covered with a coverslip. Images were taken (Leica DM-2500; Germany).
Results
Large-scale erythroblast expansion from PBMC using a G-Rex bioreactor and GMP-grade
medium
We previously showed that a pure erythroblast population can be expanded from the progenitor pool
present in total PBMC without a CD34+ isolation step10, 11. Differentiation of these progenitor pools
in total PBMC to erythroblasts (stage I) and expansion of the erythroblast pool itself (stage II) both
depend on EPO, SCF and glucocorticoid agonist dexamethasone. The combination of these factors are
driving differentiation towards and expansion of erythroid cells, here termed expansion medium (or
EM), in which dexamethasone functions to delay onset of terminal differentiation of erythroblasts to
erythrocytes10, 14, 20, 21. However, this expansion potential was not properly assessed nor adjusted to a
completely defined serum/plasma-free GMP-grade culture system. We first tested distinct sources of
albumin. EM contains ultra-clean human serum albumin obtained after plasma fractionation (cHSA),

Chapter 3
72
which resulted in a significantly increased erythroid expansion potential compared to cultures in
which cHSA was replaced by plasma or Albuman®(Figure 1A and Figure S1A). The addition of plasma
or Albuman® resulted in a low erythroblast yield and premature differentiation of erythroblasts, indi-
cated by a loss of CD71 expression in conjunction with increased CD235a expression (Figure S1A)22,
23. On the contrary, erythroblasts cultured in the presence of cHSA or detoxified HSA (dHSA) showed
a significantly increased expansion potential with limited spontaneous differentiation (Figure 1A and
FigureS1A). In addition, the erythroid expansion in EM supplemented with cHSA, dHSA or xeno-free
recombinant HSA is comparable (Figure S1B). Of note, PBMC contain primarily T-cells, myeloid effector
cells and B-cells and only ca. 0.16% CD34+ HSPC that are capable of differentiating into erythroid
cells10, 24. Therefore, expansion curves using PBMC as a starting material show a drop in expansion
between day 0 and day 5, caused by a loss of these non-proliferating immune cells11.
Because upscaling cRBC for routine cRBC production in culture dishes is practically impossible and
expensive, a G-Rex bioreactor was used allowing high density cultures25, 26. We previously showed that
adherent CD14+ cells present in PBMC increase the erythroid yield by increasing CD34+ cell survival11,
however, the G-Rex bioreactor does not support adherent cells and thus compromises stage I yield
(data not shown). Therefore, cultures started from PBMC in stage I were performed in culture dishes
until a pure erythroblast population was obtained around day 7-10 of culture in EM supplemented
with cHSA. Subsequently, cultured erythroblasts were either transferred to the G-Rex system or
retained in culture dishes and could be maintained for at least 26 days of culture (Figure 1B). Transfer
to a G-Rex bioreactor briefly delayed expansion of erythroblast cultures, which caught up to a similar
expansion rate between day 15 and 25 of culture. Although the G-Rex bioreactor yielded slightly
less cells (3.2x10⁶ vs. 3.3x10⁷), less donor variation was observed. Erythropoiesis can be staged from
CD71highCD235dim erythroblasts (P1) to enucleated CD71-CD235+ reticulocytes (P4), with intermediate
stages in which cells first increased CD235a expression, then reduced CD71 expression (Figure 1C)23.
During erythroblast expansion in stage II, erythroblasts gained expression of CD235a from day 7 to
21 resulting in a pure population of CD71highCD235+ pro-erythroblasts after 10-14 days of expansion,
which could be expanded for at least 26 days (Figure 1C-E). Note that at day 7 of culture, erythroblasts
highly expressed CD71 and were CD235adim validating that this GMP-grade medium yield similar
cells as previously reported using commercial StemSpan media (Figure S1C)10, 11. Interestingly, cells
expanded in the G-Rex system maintained a less differentiated state for a prolonged culture period,
as shown by delayed CD235a upregulation and decreasing CD71 expression during expansion in
Figure 1E. In conclusion, a defined GMP-grade medium enabled erythroblast cultures culture from
a mixed PBMC cell pool with significantly delayed onset of spontaneous differentiation, resulting in
a large expansion potential. In addition, this system allowed erythroblast expansion in both culture
dishes and a G-Rex bioreactor.

Large-scale in vitro production of red blood cells
73
A B
C
D
Day 9 Day12 Day14 Day16
E
7 9 1 2 1 4 1 6 2 0 2 3 2 60
2 0
4 0
6 0
8 0
1 0 0
C u ltu re d is h
D a y s in E M c u ltu r e
Ce
lls
ing
ate
(%)
P 1
P 2
P 3
P 4
7 9 1 2 1 4 1 6 2 0 2 3 2 60
2 0
4 0
6 0
8 0
1 0 0
G -R e x
D a y s in E M c u ltu r e
Ce
lls
ing
ate
(%)
P 1
P 2
P 3
P 4
Day20 Day23 Day26
Culture dish
G-Rex
Day 7
0 1 0 2 0 3 01 0 -11 0 01 0 11 0 21 0 31 0 41 0 51 0 61 0 71 0 81 0 9
D a y s in E M c u ltu r e
Ex
pa
ns
ion
(fc
)
C u ltu re d is hG -R e x
*
0 1 0 2 0 3 01 0 -2
1 0 -1
1 0 0
1 0 1
1 0 2
1 0 3
1 0 4
1 0 5
1 0 6
D a y s in E M c u ltu r e
Ex
pa
ns
ion
(fc
)
c H S A
A lb u m and H S A
P la s m a
*
Culture dish
G-Rex
Figure 1. Efficient expansion of erythroblasts in plasma/serum-free GMP-grade medium. (A) PBMC were cultured towards erythroblasts in GMP-grade medium (EM) for 26 days. Graph showing the erythroblast expan-sion curve upon culture in the presence of ultra-clean HSA (cHSA or EM) or upon replacing cHSA with detoxified HSA (dHSA), Albuman® or plasma. Cell counts at day 0 were normalized to 1 PBMC at the start of culture. Mean ± SD (unpaired t-test, *P<0.05; n=4). (B) PBMC were cultured in culture dishes until a pure erythroblast population was obtained (at day 7). Erythroblasts were further expanded in a G-Rex bioreactor and compared to erythroblast expansion in culture dishes. Mean ± SD (two-way ANOVA, * P<0.05; n=4). (C-E) Representative dot plots (C) and quantification of multiple cultures (D-E) showing CD71 and CD235 progression during erythroblast expansion in culture dishes or the G-Rex bioreactor (P1, CD71highCD235a-; P2, CD71highCD235a+; P3, CD71dimCD235a+; P4, CD71-CD235a+).

Chapter 3
74
cRBC cultured in a G-Rex culture system fully enucleate in the absence of SCF
Erythroblast differentiation is induced by removing SCF and dexamethasone and increasing the EPO
concentration 5-fold. In addition, the holotransferrin concentration was increased and the differ-
entiation medium (DM) was supplemented with 5% Omniplasma and heparin to prevent medium
from clotting. Erythroblast differentiation is characterized by i) a transient proliferation burst with
decreased cell-cycle time resulting in a reduced cell volume22, 23, ii) hemoglobinization, iii) erythroid
specific protein expression of e.g., blood group antigens, and iv) enucleation. During the first days of
differentiation, in particular in culture dishes, proliferation was observed followed by cell growth arrest
(Figure 2A). Note that the number of cells after the initial short proliferation burst did not decrease,
suggesting no negative effect on culture viability. In contrast, cells differentiated in a G-Rex bioreactor
did not show increased expansion. During erythroblast differentiation, both erythroid cells cultured
in dishes and the G-Rex system gained expression of CD235a+ and lost expression of CD71, although
erythroblasts differentiated faster in culture dishes (Figure 2B-D). Note that CD71 expression was
upregulated for two days coinciding with the hemoglobinization stages after which it was downreg-
ulated and cells became negative (Figure S2A,B). In addition, differentiation was accompanied with a
decrease in cell size (FSC-A), an initial increase of KIT expression at day 1 followed by a sharp down
regulation. Furthermore, CD44 was progressively reduced in expression as reported before10. The
data indicates that the first 24-72 hours in erythroblast differentiation mark an important transition
stage.
At blood banks, erythrocytes are stored in media that contain specific components that protect
the viability, which were not present in the defined media. Therefore, a specific storage component
solution was added at day 5 of differentiation, when the first reticulocytes arose in culture. This
increased the number and frequency of enucleated cRBC, particularly in the G-Rex bioreactor (data
not shown). Nonetheless, initial differentiation experiments in the G-Rex system yielded low numbers
of enucleated cells compared to culture dishes (Figure S3A). We noticed that residual expansion
medium during the first days of differentiation negatively affected enucleation. In the G-Rex system,
upon initiating differentiation, approximately 90% EM could be replaced with DM in the G-Rex system
compared to 100% in culture dishes. Replacing 90% of the culture medium resulted in 56% enucle-
ation after 12 days of differentiation, while 84,6% enucleation was observed upon complete medium
replacement (Figure S3B). To further investigate whether this was caused by residual SCF or dexa-
methasone, SCF was removed from the culture medium two days prior to differentiation in culture
dishes, which resulted in a 1.5-fold increase in enucleation (56% vs. 85%) after 12 days of differen-
tiation (Figure S3C). A further reduction of the concentration dexamethasone (from 1µM to 10nM)
two days prior differentiation and a complete medium replacement at the start of differentiation
did not affect enucleation (Figure S3D). This indicates that residual SCF at the start of differentiation
negatively affect enucleation at the end of differentiation. Enucleation was observed from day 5
onwards, resulting in >90% enucleation after 12 days of differentiation in culture dishes and almost
85% enucleation in the G-Rex system (Figure 2E and Figure S3E).

Large-scale in vitro production of red blood cells
75
A
0 5 1 0 1 51 0 -1
1 0 0
1 0 1
D a y s in D M c u ltu r e
Ex
pa
ns
ion
(fc
)C u ltu re d is hG -R e x
*****
***********
*
BDay 1 Day 2 Day 5 Day 6
Day 7 Day 8 Day 9 Day 12
Culture dish
G-Rex
Culture dish
G-Rex
Figure 2. Differentiation of erythroblasts in culture dishes or a G-Rex bioreactor. (A) A pure population of erythroblasts was obtained from culture dishes. Erythroblast expansion and differentiation was either continued in culture dishes or G-Rex. Erythroblasts were differentiated (day 0 of differentiation) in DM for 12 days. Graph showing the expansion curve of erythroblasts in culture dishes or G-Rex in DM upon differentiation initiation. Mean ± SD (Two-way ANOVA, *P<0.05, ***P<0.001, ****P<0.0001; n=4). (B-D) Representative dot plots (B) and quantification of multiple cultures (C-D) showing expression of CD71 and CD235a (P1, CD71highCD235a-; P2, CD71highCD235a+; P3, CD71dimCD235a+; P4, CD71-CD235a+) during differentiation in culture dishes or the G-Rex bioreactor. (E) Enucleation of erythroid cells during differentiation in culture dishes and a G-Rex system. Mean ± SD (unpaired t-test, n=4). (F) Ratio of nuclei versus cRBC during differentiation in culture dishes or G-Rex (<1 means more cRBC than nuclei). Mean ± SD (unpaired t-test, *P<0.05, **P<0.01; n=3-4). (G) Enucleation of differ-entiating erythroblasts at day 10 of differentiation shown by flow cytometry using DRAQ5 and cytospin images stained with benzidine before and after leucoreduction filter.
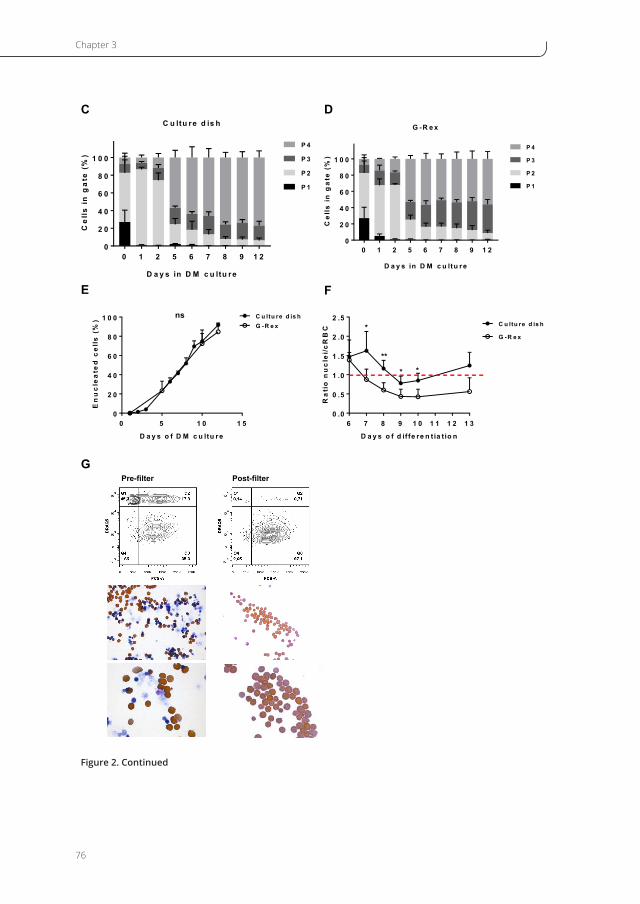
Chapter 3
76
E F
GPre-filter Post-filter
6 7 8 9 1 0 1 1 1 2 1 30 .0
0 .5
1 .0
1 .5
2 .0
2 .5
D a y s o f d if fe re n t ia t io n
Ra
tio
nu
cle
i/c
RB
C C u ltu re d is h
G -R e x*
**
* *
0 1 2 5 6 7 8 9 1 20
2 0
4 0
6 0
8 0
1 0 0
C u ltu re d is h
D a y s in D M c u ltu r e
Ce
lls
ing
ate
(%)
P 1
P 2
P 3
P 4
0 1 2 5 6 7 8 9 1 20
2 0
4 0
6 0
8 0
1 0 0
G -R e x
D a y s in D M c u ltu r e
Ce
lls
ing
ate
(%)
P 1
P 2
P 3
P 4
C D
0 5 1 0 1 50
2 0
4 0
6 0
8 0
1 0 0
D a y s o f D M c u ltu r e
En
uc
lea
ted
ce
lls
(%) C u ltu re d is h
G -R e xns
Figure 2. Continued

Large-scale in vitro production of red blood cells
77
Figure 2F showed slight differences in the ratio nuclei/cRBC between culture dishes and a G-Rex bio-
reactor due to the stability of the cultured reticulocytes. The flow cytometry data and cytospin images
revealed that cRBC still contained pyrenocytes and some enucleated cells at the end of differentiation
(Figure 2G and Figure S3E). To purify reticulocytes, remaining nuclei and nucleated cells were filtered
using neonatal leucoreduction filters. This resulted in 99% removal of nuclei and 99% removal of
remaining nucleated cells resulting in a virtually pure population of enucleated cRBC (Figure 2G).
Of note, only G-Rex derived cRBC were further purified using a filter. These data indicate that in the
absence of SCF and dexamethasone erythroblasts can be differentiated to fully enucleated cRBC in
both the G-Rex system and culture dishes.
cRBC resemble mature reticulocytes that maintain blood group antigen expression
Figure 2G revealed a spheroid morphology of filtered cRBC, indicative of a reticulocyte population.
This indicates that cRBC were not fully mature erythrocytes. Nevertheless, expression of the major
membrane proteins α/β-spectrin, Band 3, protein 4.1, protein 4.2 and GAPDH were comparable
between cRBC from culture dishes and peripheral blood RBC (Figure 3A). Reticulocytes released
from the bone marrow have a low deformability, which increases during maturation towards eryth-
rocytes27. Both cRBC cultured in culture dishes and the G-Rex system showed a deformability index
recapitulating late peripheral blood reticulocytes (Figure 3B). Furthermore, cell pellets from cRBC
turned dark red and HPLC data showed that cRBC both derived from G-Rex and culture dishes
mainly express adult hemoglobin (HbA1 73.4% G-Rex vs. 46.4% dish; HbA2 2.1% G-Rex vs. 0.5% dish),
low levels of HbF (8.8% G-Rex vs. 4.1% dish) and some HbH (2.4% G-Rex vs. 4.3% dish) (Figure 3C,D).
Note that only G-Rex cRBC were purified using a filter before performing deformability assays and
HPLC analysis. In addition, hemoglobin oxygen association and dissociation rates at various oxygen
tension in cRBC derived from G-Rex were similar to peripheral blood RBC (Figure 3E). Blood group
antigen expression should be similar between RBC and cRBC that originate from the same donor28,
29. Blood group expression of the cRBC was assessed by flow cytometry and compared to the original
donor RBC. Donors negative for specific blood groups on erythrocytes remained negative after cul-
ture and blood group expression was in complete agreement with the original donors (Table 1). The
functional similarities between cRBC and peripheral blood RBC indicate that the three-stage culture
model using culture dishes or a G-Rex bioreactor that we described here (Figure 4) could be used
for large-scale cRBC cultures.
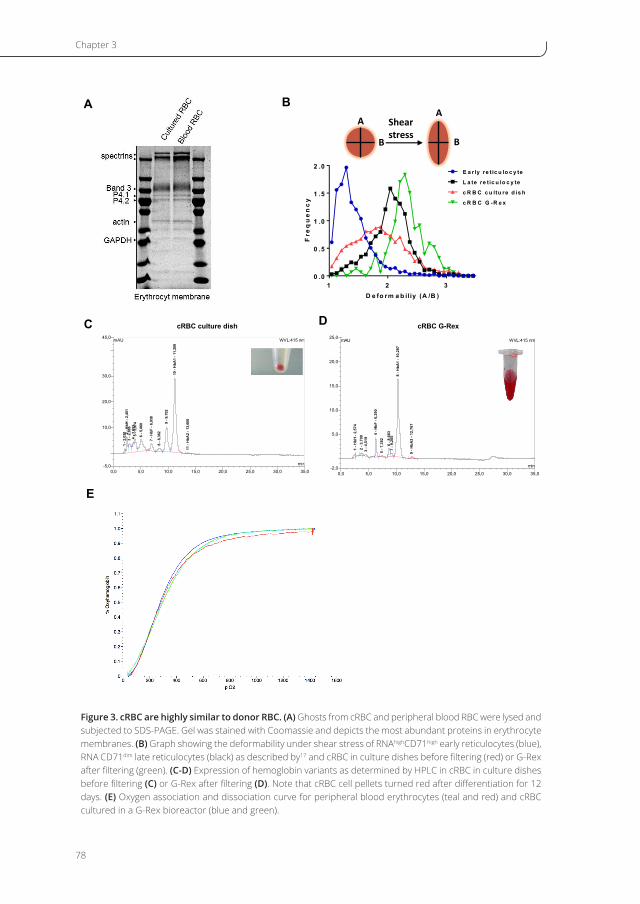
Chapter 3
78
A B
C D
E
B
AA
B
Shearstress
1 2 30 .0
0 .5
1 .0
1 .5
2 .0
D e fo rm a b iliy (A /B )F
req
ue
nc
y
E a r ly re t ic u lo c y te
L a te re tic u lo c y te
c R B C c u ltu re d is h
c R B C G -R e x
0,0 5,0 10,0 15,0 20,0 25,0 30,0 35,0-2,0
5,0
10,0
15,0
20,0
25,0 kweek 28-april UV_VIS_1mAU
min
1 - H
bH -
2,57
42
- 3,7
003
- 4,5
19
4 - H
bF -
6,29
05
- 7,3
82
6 - 8
,683
7 - 9
,205
8 - H
bA1
- 10,
287
9 - H
bA2
- 12,
767
WVL:415 nm
cRBC G-Rex
0,0 5,0 10,0 15,0 20,0 25,0 30,0 35,0-5,0
10,0
20,0
30,0
45,0 39 Dish UV_VIS_1mAU
min
1 - 2
,030 2
- HbH
- 2,
451
3 - 2
,886
4 - 3
,653
5 - 3
,974
6 - 5
,060
7 - H
bF -
6,93
8
8 - 8
,362
9 - 9
,702
10 -
HbA
1 - 1
1,20
9
11 -
HbA
2 - 1
3,60
0
WVL:415 nm
cRBC culture dish
Figure 3. cRBC are highly similar to donor RBC. (A) Ghosts from cRBC and peripheral blood RBC were lysed and subjected to SDS-PAGE. Gel was stained with Coomassie and depicts the most abundant proteins in erythrocyte membranes. (B) Graph showing the deformability under shear stress of RNAhighCD71high early reticulocytes (blue), RNA-CD71dim late reticulocytes (black) as described by17 and cRBC in culture dishes before filtering (red) or G-Rex after filtering (green). (C-D) Expression of hemoglobin variants as determined by HPLC in cRBC in culture dishes before filtering (C) or G-Rex after filtering (D). Note that cRBC cell pellets turned red after differentiation for 12 days. (E) Oxygen association and dissociation curve for peripheral blood erythrocytes (teal and red) and cRBC cultured in a G-Rex bioreactor (blue and green).

Large-scale in vitro production of red blood cells
79
Table 1. Blood group analysis of peripheral blood RBC (RBC) and cultured RBC (cRBC) using flow cytometry.
Blood group RBC1
RBC2
RBC3
cRBC1
cRBC2
cRBC3
A - - + - - +
B - - - - - -
RhD + + - + + -
RhE - + - - + -
RhC + - - + - -
Rhe + + + + + +
Rhc + + + + + +
K - - - - - -
k + + + + + +
Kp-a - - - - - -
Kp-b + + + + + +
Lu-a - - - - - -
Lu-b + + + + + +
P1 + - + + - +
S + - - + - -
s + + + + + +
Fya + - + + - +
Fyb - + + - + +
Jka - + - - + -
Jkb + - + + - +
M + - + + - +
N + + + + + +
Discussion
The potential to culture red blood cells for transfusion purposes has been recognized for a long time,
however, current attempts were still hampered by a low yield and incomplete differentiation to fully
biconcave erythrocytes30-38. We previously described a culture method to obtain pure erythroblasts
from PBMC10. Here, we optimized our culture protocol for GMP conditions, and describe a three-
stage culture system that allowed 107-fold expansion of erythroblasts derived from PBMC after 26
days of culture. The majority of the existing large-scale red blood cell cultures starts from purified
CD34+ cells derived from PBMC, cord blood or bone marrow39. Here, we initiate cultures from total
PBMC and dispense with expensive CD34+ cell isolation procedures. Thereby we take advantage
of not only all CD34+ progenitors, but also CD34- hematopoietic progenitors present in blood that

Chapter 3
80
- IL3- EPO- SCF- Dex
- EPO- SCF- Dex
Phase I Phase II Phase IIIStart of culture Expansion Differentiation
- EPO- SCF- Dex
- EPO- 5% plasma- Holotransferrin
Day 0 Day 2 Day 7-10 Day 0 Day12
Culture dish
G-Rex
cRBC
PBMC
Figure 4. Progression of erythroid cells during culture. Overview of the three-phase erythroid culture system using culture dishes or a G-Rex bioreactor.
have the capacity to differentiate towards erythroid cells10, 11. In addition, we recently showed that
CD14+ cells in PBMC increase CD34+ cell survival and thereby increase the erythroid yield compared
to CD34+ cells isolated from a similar amount of PBMC, showing another advantage to start cRBC
cultures from total PBMC11. The expansion curves shown here have been normalized to the input of
1 PBMC. However, only 0.16% of the total PBMC pool is a CD34+ HSPC11. Normalization to the actual
amount of CD34+ cells allows to compare our results to previously published cRBC culture protocols
starting from CD34+ cells and revealed an erythroblast fold expansion of 2x10¹⁰ per CD34+ cell within
26 days. In addition, we showed that these erythroblasts can be further differentiated to cRBC with
>90% enucleation, express adult hemoglobin and display a blood group expression and deformability
similar to donor RBC. This process was compatible with upscaling for clinical studies and applications
using a G-Rex bioreactor. The G-Rex bioreactor allowed for 3.2x10⁶ expansion per PBMC, or 2x10⁹ per
CD34+ cell. Moreover, less donor variation was observed compared to culture dishes and remaining
nuclei and enucleated cells after differentiation could be filtered to obtain a pure cRBC population.
This GMP-grade culture protocol uses glucocorticoids to induce erythroblasts proliferation whilst
inhibiting differentiation, as has been reported before10, 15, 20, 21, 40, 41. The addition of glucocorticoids
also supports erythropoiesis by differentiating peripheral blood monocytes or CD34+ cells to eryth-
roid supporting macrophages during culture from PBMC24, 42. In contrast to our plasma/serum-free
expansion, most large-scale red cell culture protocols use glucocorticoid agonists in combination
with serum and/or plasma during expansion. Here, we showed that the addition of plasma causes
premature differentiation of erythroblasts and negates the differentiation inhibiting effect of gluco-
corticoids4, 6, 43-45. Increased spontaneous differentiation upon addition of plasma during erythroblast

Large-scale in vitro production of red blood cells
81
expansion may be due to additional growth factors or other plasma components. Thus to ensure a
good expansion of erythroblasts using the combination of EPO, SCF and dexamethasone, neither
plasma nor serum should be added. This may proof to be important to reach the amount of cRBC
required for transfusion, but also to expand a workable number of pure erythroid cells from small
aliquots of blood from specific anemic patients. We have recently shown that 3ml of blood is sufficient
to culture enough cells to reprogram erythroblasts to induced pluripotent stem cells46. Dispensing
the necessity to first isolate CD34+ cells, which is less efficient from small amounts of blood, helps to
facilitate easy implementation in other laboratories and to study erythropoiesis in patients of which
limited sample volumes are available.
Here, we found that the isolation and manufacturing process of human albumin used as a media
supplement critically influences the erythroid expansion potential. Using ultra-clean, detoxified or
recombinant additive-free HSA deprived of bound substances (e.g., lipids, protein and steroids) sig-
nificantly increased the erythroid expansion potential. Albumin binds a multitude of substances
including proteins, metabolites and fatty acids, including toxins, drugs and other therapeutics. These
components that bind albumin potentially quench the albumin-binding-capacity47-49. Interestingly, the
process to manufacture Albuman®, which is clinically used to regulate blood circulation, includes a
step to saturate and thus restrain the binding potential of albumin, rendering it mostly inert. Replacing
cHSA in EM by Albuman® reduced erythroblast expansion potential, which could be reverted by char-
coal and ion exchanger treatment. This suggests that the binding and/or transport function of albumin
is important to ensure continued erythroblast expansion. The identification of albumin-binding factors
during erythroid cultures may be of interest, as it might help understanding culture inhibiting factors
that are intrinsically produced by erythroid cells and that are sequestered by albumin. Interestingly,
adding 5% Omniplasma during terminal differentiation in stage III, increases enucleation from 20-25%
to more than 90% (data not shown). Therefore, future research should focus on identifying the
components in plasma that are key to this increased enucleation potential. Once identified, these
components could be added at optimal concentrations during terminal erythroblast differentiation.
In 2011, Timmins et al. demonstrated an ultra-high yield of cultured red blood cells with >90% enucle-
ation from cord blood-derived CD34+ cells in the absence of plasma7. This reported erythroid yield was
similar to our serum/plasma-free PBMC-derived erythroid expansion. However, >90% enucleation
during terminal differentiation using our differentiation protocol was only recapitulated in presence
of plasma. Whether this reflects a difference in cord blood versus adult erythroid cultures remains
unknown but important to investigate.
Previously, we reported that cultures starting from frozen PBMC are similar with respect to erythroid
yield compared to fresh PBMC50. In addition, erythroblasts that are expanded at stage II can also
be readily frozen and defrosted (data not shown). This introduces a degree of flexibility concerning
the actual production and storage of eventual products that arise from erythroid cultures. The use
of adult PBMC also facilitates the availability of starting material and introduces the possibility to

Chapter 3
82
culture cRBC from the patient’s own cells. This is important considering alloimmunization caused by
blood group mismatches and matching from cord blood derived erythrocytes may be complicated. In
addition, with the advances of using therapeutic amounts of erythrocytes loaded with specific cargo,
using the patient’s own cells is also less complicated compared to unmatched blood, cord blood or
immortalized cell lines like hIPSC or immortalized erythroblasts51. Using adult peripheral blood as
starting material for cRBC cultures is an important step towards precision medicine. The synchro-
nized cultures contain young reticulocytes that have a theoretical lifespan of about 120 days. Chronic
anemia patients that receive blood transfusions every two months may benefit from transfusions
with in vitro cultured long-lived erythrocytes, potentially increasing the time between transfusions
and thereby reducing the costs. Currently we are working towards a clinical trial that will allow to test
the in vivo lifespan of transfused PBMC-derived cRBC.
Author Contributions
PB, MT-V, ES, EH, SH and AV performed the experiments. EA, EH, and PB designed the experiments,
analyzed the data and wrote the manuscript. ML contributed to the experiment design and writing
of the manuscript. The manuscript was critically revised by all authors. The authors declare no com-
peting financial interests.
Acknowledgements
We are grateful to Wilson Wolf Manufacturing (Saint Paul, MN, USA) for providing the G-Rex biore-
actors. In addition, we would like to thank Rob van Zwieten, Martijn Veldthuis and Jeffrey Berghuis
(Sanquin, dept. Blood Cell Research) for the technical assistance and data acquisition regarding the
HPLC data and deformability assays and we would also like to thank the Central Facility of Sanquin
for their assistance regarding FACS analysis. This work was supported by grants from the Landsteiner
Foundation (LSBR:1141; EA, EH), ZONMW (40-41400-98-1327; PB, MT-V, ES); ZONMW-TOP (40-00812-
98-12128; SH) and Sanquin (PPOR:15-30; AV).

Large-scale in vitro production of red blood cells
83
References
1. Carson JL, Grossman BJ, Kleinman S, et al. Red blood cell transfusion: a clinical practice guideline from the AABB*. Ann Intern
Med. 2012;157(1):49-58.
2. Palmer AF, Intaglietta M. Blood substitutes. Annu Rev Biomed Eng. 2014;16:77-101.
3. Yoo JW, Irvine DJ, Discher DE, Mitragotri S. Bio-inspired, bioengineered and biomimetic drug delivery carriers. Nat Rev Drug
Discov. 2011;10(7):521-535.
4. Giarratana MC, Kobari L, Lapillonne H, et al. Ex vivo generation of fully mature human red blood cells from hematopoietic stem
cells. Nat Biotechnol. 2005;23(1):69-74.
5. Miharada K, Hiroyama T, Sudo K, Nagasawa T, Nakamura Y. Efficient enucleation of erythroblasts differentiated in vitro from
hematopoietic stem and progenitor cells. Nat Biotechnol. 2006;24(10):1255-1256.
6. Giarratana MC, Rouard H, Dumont A, et al. Proof of principle for transfusion of in vitro-generated red blood cells. Blood.
2011;118(19):5071-5079.
7. Timmins NE, Athanasas S, Gunther M, Buntine P, Nielsen LK. Ultra-high-yield manufacture of red blood cells from hematopoietic
stem cells. Tissue Eng Part C Methods. 2011;17(11):1131-1137.
8. Kleihauer E, Braun H, Betke K. [Demonstration of fetal hemoglobin in erythrocytes of a blood smear]. Klin Wochenschr.
1957;35(12):637-638.
9. Pearson HA. Life-span of the fetal red blood cell. J Pediatr. 1967;70(2):166-171.
10. van den Akker E, Satchwell TJ, Pellegrin S, Daniels G, Toye AM. The majority of the in vitro erythroid expansion potential resides
in CD34(-) cells, outweighing the contribution of CD34(+) cells and significantly increasing the erythroblast yield from peripheral
blood samples. Haematologica. 2010;95(9):1594-1598.
11. Heideveld E, Masiello F, Marra M, et al. CD14+ cells from peripheral blood positively regulate hematopoietic stem and progenitor
cell survival resulting in increased erythroid yield. Haematologica. 2015;100(11):1396-1406.
12. Boehm D, Murphy WG, Al-Rubeai M. The potential of human peripheral blood derived CD34+ cells for ex vivo red blood cell
production. J Biotechnol. 2009;144(2):127-134.
13. Griffiths RE, Kupzig S, Cogan N, et al. Maturing reticulocytes internalize plasma membrane in glycophorin A-containing vesicles
that fuse with autophagosomes before exocytosis. Blood. 2012;119(26):6296-6306.
14. von Lindern M, Zauner W, Mellitzer G, et al. The glucocorticoid receptor cooperates with the erythropoietin receptor and c-Kit
to enhance and sustain proliferation of erythroid progenitors in vitro. Blood. 1999;94(2):550-559.
15. Migliaccio G, Sanchez M, Masiello F, et al. Humanized culture medium for clinical expansion of human erythroblasts. Cell Trans-
plant. 2010;19(4):453-469.
16. Beug H, Steinlein P, Bartunek P, Hayman MJ. Avian hematopoietic cell culture: in vitro model systems to study oncogenic trans-
formation of hematopoietic cells. Methods Enzymol. 1995;254:41-76.
17. Ovchynnikova E, Aglialoro F, Bentlage AEH, et al. DARC extracellular domain remodeling in maturating reticulocytes explains
Plasmodium vivax tropism. Blood. 2017;130(12):1441-1444.
18. van Zwieten R, van Oirschot BA, Veldthuis M, et al. Partial pyruvate kinase deficiency aggravates the phenotypic expression of
band 3 deficiency in a family with hereditary spherocytosis. Am J Hematol. 2015;90(3):E35-39.
19. van Zwieten R, Veldthuis M, Delzenne B, et al. Hemoglobin analyses in the Netherlands reveal more than 80 different variants
including six novel ones. Hemoglobin. 2014;38(1):1-7.
20. Leberbauer C, Boulme F, Unfried G, Huber J, Beug H, Mullner EW. Different steroids co-regulate long-term expansion versus
terminal differentiation in primary human erythroid progenitors. Blood. 2005;105(1):85-94.
21. von Lindern M, Deiner EM, Dolznig H, et al. Leukemic transformation of normal murine erythroid progenitors: v- and c-ErbB act
through signaling pathways activated by the EpoR and c-Kit in stress erythropoiesis. Oncogene. 2001;20(28):3651-3664.
22. Socolovsky M, Nam H, Fleming MD, Haase VH, Brugnara C, Lodish HF. Ineffective erythropoiesis in Stat5a(-/-)5b(-/-) mice due to
decreased survival of early erythroblasts. Blood. 2001;98(12):3261-3273.
23. Koulnis M, Pop R, Porpiglia E, Shearstone JR, Hidalgo D, Socolovsky M. Identification and analysis of mouse erythroid progenitors
using the CD71/TER119 flow-cytometric assay. J Vis Exp. 2011(54).
24. Heideveld E, Hampton-O’Neil LA, Cross SJ, et al. Glucocorticoids induce differentiation of monocytes towards macrophages that
share functional and phenotypical aspects with erythroblastic island macrophages. Haematologica. 2018;103(3):395-405.
25. Vera JF, Brenner LJ, Gerdemann U, et al. Accelerated production of antigen-specific T cells for preclinical and clinical applications
using gas-permeable rapid expansion cultureware (G-Rex). J Immunother. 2010;33(3):305-315.
26. Bajgain P, Mucharla R, Wilson J, et al. Optimizing the production of suspension cells using the G-Rex “M” series. Mol Ther Methods
Clin Dev. 2014;1:14015.
Chapter 3
84
27. Waugh RE, Mantalaris A, Bauserman RG, Hwang WC, Wu JH. Membrane instability in late-stage erythropoiesis. Blood.
2001;97(6):1869-1875.
28. Bony V, Gane P, Bailly P, Cartron JP. Time-course expression of polypeptides carrying blood group antigens during human
erythroid differentiation. Br J Haematol. 1999;107(2):263-274.
29. Southcott MJ, Tanner MJ, Anstee DJ. The expression of human blood group antigens during erythropoiesis in a cell culture system.
Blood. 1999;93(12):4425-4435.
30. Migliaccio AR, Whitsett C, Migliaccio G. Erythroid cells in vitro: from developmental biology to blood transfusion products. Curr
Opin Hematol. 2009;16(4):259-268.
31. Migliaccio AR, Masselli E, Varricchio L, Whitsett C. Ex-vivo expansion of red blood cells: how real for transfusion in humans? Blood
Rev. 2012;26(2):81-95.
32. Migliaccio AR, Grazzini G, Hillyer CD. Ex vivo generated red cells as transfusion products. Stem Cells Int. 2012;2012:615412.
33. Migliaccio AR, Palis J. Blood in a dish: In vitro synthesis of red blood cells. Drug Discov Today Dis Mech. 2011;8(1-2):e3-e8.
34. Shah S, Huang X, Cheng L. Concise review: stem cell-based approaches to red blood cell production for transfusion. Stem Cells
Transl Med. 2014;3(3):346-355.
35. Kim HO. In-vitro stem cell derived red blood cells for transfusion: are we there yet? Yonsei Med J. 2014;55(2):304-309.
36. Larochelle A. Generation of red blood cells in vitro: monitoring the process for improved efficiency. Cytotherapy. 2013;15(9):1043-
1045.
37. Migliaccio AR, Whitsett C, Papayannopoulou T, Sadelain M. The potential of stem cells as an in vitro source of red blood cells for
transfusion. Cell Stem Cell. 2012;10(2):115-119.
38. Singh VK, Saini A, Tsuji K, Sharma PB, Chandra R. Manufacturing blood ex vivo: a futuristic approach to deal with the supply and
safety concerns. Front Cell Dev Biol. 2014;2:26.
39. Stella CC, Cazzola M, De Fabritiis P, et al. CD34-positive cells: biology and clinical relevance. Haematologica. 1995;80(4):367-387.
40. Carotta S, Pilat S, Mairhofer A, et al. Directed differentiation and mass cultivation of pure erythroid progenitors from mouse
embryonic stem cells. Blood. 2004;104(6):1873-1880.
41. Migliaccio G, Di Pietro R, di Giacomo V, et al. In vitro mass production of human erythroid cells from the blood of normal donors
and of thalassemic patients. Blood Cells Mol Dis. 2002;28(2):169-180.
42. Falchi M, Varricchio L, Martelli F, et al. Dexamethasone targeted directly to macrophages induces macrophage niches that
promote erythroid expansion. Haematologica. 2015;100(2):178-187.
43. Neildez-Nguyen TM, Wajcman H, Marden MC, et al. Human erythroid cells produced ex vivo at large scale differentiate into red
blood cells in vivo. Nat Biotechnol. 2002;20(5):467-472.
44. Kupzig S, Parsons SF, Curnow E, Anstee DJ, Blair A. Superior survival of ex vivo cultured human reticulocytes following transfusion
into mice. Haematologica. 2017;102(3):476-483.
45. Zhang Y, Wang C, Wang L, et al. Large-Scale Ex Vivo Generation of Human Red Blood Cells from Cord Blood CD34(+) Cells. Stem
Cells Transl Med. 2017;6(8):1698-1709.
46. Varga E, Hansen M, Wust T, von Lindern M, van den Akker E. Generation of human erythroblast-derived iPSC line using episomal
reprogramming system. Stem Cell Res. 2017;25:30-33.
47. Klammt S, Brinkmann B, Mitzner S, et al. Albumin binding capacity (ABiC) is reduced in commercially available human serum
albumin preparations with stabilizers. Z Gastroenterol. 2001;39 Suppl 2:24-27.
48. Klammt S, Mitzner SR, Stange J, et al. Improvement of impaired albumin binding capacity in acute-on-chronic liver failure by
albumin dialysis. Liver Transpl. 2008;14(9):1333-1339.
49. Kragh-Hansen U, Chuang VT, Otagiri M. Practical aspects of the ligand-binding and enzymatic properties of human serum
albumin. Biol Pharm Bull. 2002;25(6):695-704.
50. Masiello F, Tirelli V, Sanchez M, et al. Mononuclear cells from a rare blood donor, after freezing under good manufacturing
practice conditions, generate red blood cells that recapitulate the rare blood phenotype. Transfusion. 2014;54(4):1059-1070.
51. Shi J, Kundrat L, Pishesha N, et al. Engineered red blood cells as carriers for systemic delivery of a wide array of functional probes.
Proc Natl Acad Sci U S A. 2014;111(28):10131-10136.

Large-scale in vitro production of red blood cells
85
Supplementary methods
Reticulocyte filtration
Cultured red blood cells were purified using a 60ml neonatal leukoreduction filter (Haemonetic BV,
Breda, The Netherlands). The filter was primed with IMDM containing 4% Omniplasma. Cultured cells
were filtered followed by a 2 times wash with 25ml priming medium. Cultured red blood cells were
resuspended in IMDM containing 4% Omniplasma. Cells were centrifuged at 1600rpm for 5 min in
order to obtain packed red blood cells.
Flow cytometry
Antibodies used: Acris (Herford, Germany): anti-CD235a (FITC 1:400; PE 1:400); BD Biosciences:
anti-CD117 (PE 1:50), anti-CD235a (PE 1:150); eBioscience (Vienna, Austria): anti-CD44 (APC 1:150);
Miltenyi Biotec: anti-CD71 (APC 1:100; VioBlue 1:200), anti-CD235a (VioBlue 1:200); and Life technolo-
gies (Carlsbad, CA, USA): anti-CD117 (FITC 1:100). The following antibodies were used for blood group
analysis: IBGRL research products (Bristol, UK): anti-A (Bric145; 1:1000), anti-B (BGRL2; 1:500), anti-M
(clone 6A7; 1:5000), anti-N (clone BRIC157; 1:1000); Sanquin Products (Amsterdam, The Netherlands):
anti-RhC (clone MS24; RBC 1:1000, cRBC undiluted), anti-Rhc (clone MS35; 1:200), anti-RhE (clone
MS260; RBC 1:80, cRBC undiluted), anti-Rhe (clone MS21/63; RBC 1:100, cRBC undiluted), P1 (clone
P3NIL100; 1:500), Kp-a (undiluted), kp-b (undiluted), Jk-a (MS15; undiluted), Jk-b (MS8; undiluted), Fy-a
(P3TIM; undiluted), Fy-b (undiluted), Lu-a (undiluted), Lu-b (undiluted); Merck-Millipore (Darmstadt,
Germany): anti-K (MS59; 1:50), anti-k (P3A118OL67; 1:100), anti-s (P3Y326Bn5; 1:400). Ortho Clinical
Diagnostics (Buckinghamshire, UK): anti-S (MNS3; undiluted). Anti-A, B, N, M were detected with an
anti-mouse IgG FITC-labeled antibody (Life Technologies; 1:200) was used and anti-C, c, E, e, Jk-a,
Jk-b, and P1 with an anti-human IgM PE-labeled antibody (Southern Biotech, Birmingham, AL; 1:500).
The remaining blood groups were detected with an anti-human IgG PE-labeled antibody (Southern
Biotech; 1:200).

Chapter 3
86
Supplementary data
A
BDay 7 Day 19
C
Plasma Albuman dHSA cHSA
0 5 1 0 1 5 2 01 0 -1
1 0 0
1 0 1
1 0 2
1 0 3
1 0 4
1 0 5
D a y s in E M c u ltu r e
Ex
pa
ns
ion
(fc
)
c H S A
rH S Ad H S A
ns
Figure S1. The presence of plasma/serum affects erythroblast expansion. (A) Representative dot plots of erythroblasts at day 12 of culture in EM in the presence of ultra-clean HSA (cHSA) or EM in which cHSA was replaced by plasma, Albuman® or detoxified HSA (dHSA) corresponding to Figure 1A (n=3-4). Note that the percentage of immature erythroblasts (P1) is 3-4 times higher in cHSA and dHSA compared to plasma and Albu-man®. This suggests that cHSA and dHSA prolong the immature state of erythroid cultures. (B) Erythroblasts cultured in EM for 18 days in the presence of cHSA, dHSA or recombinant HSA (rHSA) showed a similar expansion potential. Mean ± SD (two-way ANOVA; n=2). (C) Erythroblasts at day 7 and 19 of expansion in StemSpan, as described previously11.

Large-scale in vitro production of red blood cells
87
A
B
0 1 2 3 4 5 6 7 8 9 1 0 1 1 1 20
2 0 0 0 0
4 0 0 0 0
6 0 0 0 0
8 0 0 0 0
1 0 0 0 0 0
1 2 0 0 0 0
C D 4 4
D a y s in d iffe re n t ia t io n
MF
I(n
orm
ali
zed
toIg
G)
0 1 2 3 4 5 6 7 8 9 1 0 1 1 1 20
1 0 0 0 0
2 0 0 0 0
3 0 0 0 0
4 0 0 0 0
C D 7 1
D a y s a fte r d if fe re n tia t io n
MF
I(n
orm
ali
zed
toIg
G)
0 1 2 3 4 5 6 7 8 9 1 0 1 1 1 20
2 0 0 0 0
4 0 0 0 0
6 0 0 0 0
8 0 0 0 0
1 0 0 0 0 0
C D 2 3 5 a
D a y s a fte r d if fe re n tia t io n
MF
I(n
orm
ali
zed
toIg
G)
0 1 2 3 4 5 6 7 8 9 1 0 1 1 1 20
2 0 0 0
4 0 0 0
6 0 0 0
8 0 0 0
C D 1 1 7
D a y s a fte r d if fe re n tia t io n
MF
I(n
orm
ali
zed
toIg
G)
0 1 2 3 4 5 6 7 8 9 1 0 1 1 1 20
5 0 0 0 0
1 0 0 0 0 0
1 5 0 0 0 0
F S C -A
D a y s a fte r d if fe re n tia t io n
MF
I(n
orm
ali
zed
toIg
G)
Differentiation
Figure S2. Marker expression during erythroblast differentiation in culture dishes. (A) Erythroblasts were cultured in EM for 8 days and subsequently differentiated for 12 days in DM. Representative overlaying histograms showing the FSC-A during differentiation and the expression levels of CD71, CD235a, CD117 and CD44 analyzed by flow cytometry. (B) Graphs corresponding to panel A showing the mean fluorescence intensity (MFI; n=4).

Chapter 3
88
A B
C D
U n wa s h e d
Wa s h e d
0
2 0
4 0
6 0
8 0
1 0 0
En
uc
lea
ted
ce
lls
(%)
**
+ S C F-S
C F0
2 0
4 0
6 0
8 0
1 0 0
En
uc
lea
ted
ce
lls
(%)
****
0 5 1 0 1 50
2 0
4 0
6 0
8 0
1 0 0
D a y s o f D M c u ltu r e
En
uc
lea
ted
ce
lls
(%) C u ltu re d is h
G -R e x*
****
*****
1 0 0 0 n MD e x
1 0 n MD e x
0
2 0
4 0
6 0
8 0
1 0 0
En
uc
lea
ted
ce
lls
(%)
ns
EDay 0 Day 5 Day 10 Day 12
Culture dish
G-Rex
Figure S3. Enucleation of cRBC derived from culture dishes or a G-Rex bioreactor. (A) Graph showing the enucleation of erythroid cells during differentiation after supplementation into DM to initiate differentiation in a G-Rex bioreactor, compared to culture dishes corresponding to Figure 2E. Mean ± SD (paired t-test, *P<0.05, **P<0.01, ***P<0.001; n=4). (B) Erythroblasts expanded and differentiated in culture dishes with 90% (unwashed) or 100% (washed) replacement of expansion medium before differentiation medium. Mean ± SEM (paired t-test, **P<0.01; n=4). (C) Two days prior to differentiation in DM, SCF was either removed from or maintained in EM and enucleation was analyzed after 12 days of differentiation. Mean ± SEM (paired t-test, ****P<0.0001; n=4). (D) Two days prior to differentiation 1000nM or 10nM dexamethasone was added to the expansion medium. Expansion medium was replaced with differentiation medium and cells were analyzed for enucleation after 12 days. Mean ± SEM (paired t-test; n=4). (E) Representative dot plots of erythroblasts during differentiation in DM in culture dishes or G-Rex based on the expression of DRAQ5.

4

Glucocorticoids induce differentiation of monocytes
towards macrophages that share functional and phenotypical aspects with erythroblastic
island macrophages
CHAPTER 4
Esther Heideveld, Lea A. Hampton-O’Neil, Stephen J. Cross, Floris P.J. van Alphen, Maartje van den Biggelaar, Ashley M. Toye, and Emile van den Akker
Haematologica 2018 Mar;103(3):395-405

Chapter 4
92
Abstract
The classical central macrophage found in erythroblastic islands plays an important role in erythroblast
differentiation, proliferation and enucleation in the bone marrow. Convenient human in vitro models
to facilitate the study of erythroid-macrophage interactions are desired. Recently, we demonstrated
that cultured monocytes/macrophages enhance in vitro erythropoiesis by supporting hematopoietic
stem and progenitor cell survival. Herein, we describe that these specific macrophages also support
erythropoiesis. Human monocytes cultured in serum-free media supplemented with stem cell factor,
erythropoietin, lipids and dexamethasone differentiate towards macrophages expressing CD16,
CD163, CD169, CD206, CXCR4 and the phagocytic TAM-receptor family. Phenotypically, they resemble
both human bone marrow and fetal liver resident macrophages. This differentiation is dependent on
glucocorticoid receptor activation. Proteomic studies confirm that glucocorticoid receptor activation
differentiates monocytes to anti-inflammatory tissue macrophages with a M2 phenotype, termed
GC-macrophages. Proteins involved in migration, tissue residence and signal transduction/receptor
activity are upregulated whilst lysosome and hydrolase activity GO-categories are downregulated.
Functionally, we demonstrate that GC-macrophages are highly mobile and can interact to form clus-
ters with erythroid cells of all differentiation stages and phagocytose the expelled nuclei, recapitulating
aspects of erythroblastic islands. In conclusion, glucocorticoid-directed monocyte differentiation to
macrophages represents a convenient model system to study erythroid-macrophage interactions.

Modeling human erythroid-macrophage interactions
93
Introduction
In human bone marrow (BM) and fetal liver (FL), the production of erythrocytes through erythropoi-
esis occurs on erythroblastic islands1,2. These erythroblastic islands consist of a central macrophage
surrounded by erythroid cells at different stages of terminal differentiation and support proliferation,
differentiation and phagocytose the extruded nuclei (or pyrenocytes) of erythroid cells2-6. Chow et
al. described that mouse CD169+ (SIGLEC1) BM resident macrophages display a dual role promoting
erythropoiesis and retention of hematopoietic stem and progenitor cells (HSPC)7,8. Their absence
leads to mobilization of HSPC, reduced BM erythropoiesis and the inability to properly respond to
anemia7-10. It is, however, unclear whether CD169 identifies different macrophage populations or
indicates an intrinsic dual role for the same tissue macrophage. FL macrophages that are unable to
interact with erythroblasts due to disruption of the retinoblastoma tumor suppressor gene in mice
lead to embryonic death as erythroblasts fail to enucleate11. These data show that in vivo, macro-
phages are important in regulating erythropoiesis in adults and during development.
Previously, we found that blood-derived monocytes induced to differentiate using stem cell factor
(SCF), erythropoietin (EPO) and glucocorticoids enhance in vitro erythropoiesis by supporting HSPC
survival12. These macrophages display a tissue-resident profile expressing CD14 (lipopolysaccharide
[LPS]-receptor), CD16 (FcgRIII), scavenger receptor CD163, CD169, CD206 (mannose receptor), CXCR4
and minimal expression of dendritic cell-specific intercellular adhesion molecule 3-grabbing non-in-
tegrin (DC-SIGN)12. We hypothesized that these cultured monocyte-derived macrophages may have
a similar role as mouse CD169+ macrophages in both hematopoiesis and erythropoiesis. This would
provide an easy-to-use in vitro human model system to mimic erythroblastic islands allowing for the
study of functional interactions between macrophages and erythroid cells, which is currently limited
to harvesting BM or involves genetic modification13. A better understanding of the mechanism(s)
through which human macrophages interact and regulate erythroblast maturation and enucleation is
important in order to understand the pathology of erythropoietic disorders, such as erythrocytosis in
polycythemia vera or erythrophagocytosis in several types of hemolytic anemia, as well as to improve
in vitro erythroid differentiation protocols for erythrocyte production14,15.
In mice BM, erythroblasts are bound to macrophages via interactions between integrin-α4β1 on
erythroblasts and VCAM1 on macrophages, and blocking these molecules disrupts erythroblastic
islands16. Chow et al. described human BM macrophages as also express VCAM1. However, Ulyanova
et al. has shown that Vcam-/- mice do not display an erythroid phenotype during homeostasis or
phenylhydrazide-induced stress17. During terminal differentiation, erythroblasts enucleate resulting
in reticulocytes and pyrenocytes. The latter are also still encapsulated by plasma membrane. In mice,
clearance of pyrenocytes occurs via TAM-receptors on the central macrophages that recognize and
bind phosphatidylserine (PS) exposed on pyrenocytes resulting in phagocytosis in a protein S-de-
pendent manner18,19. The TAM-receptor family of tyrosine kinases (TYRO3, AXL, and MERTK) play an
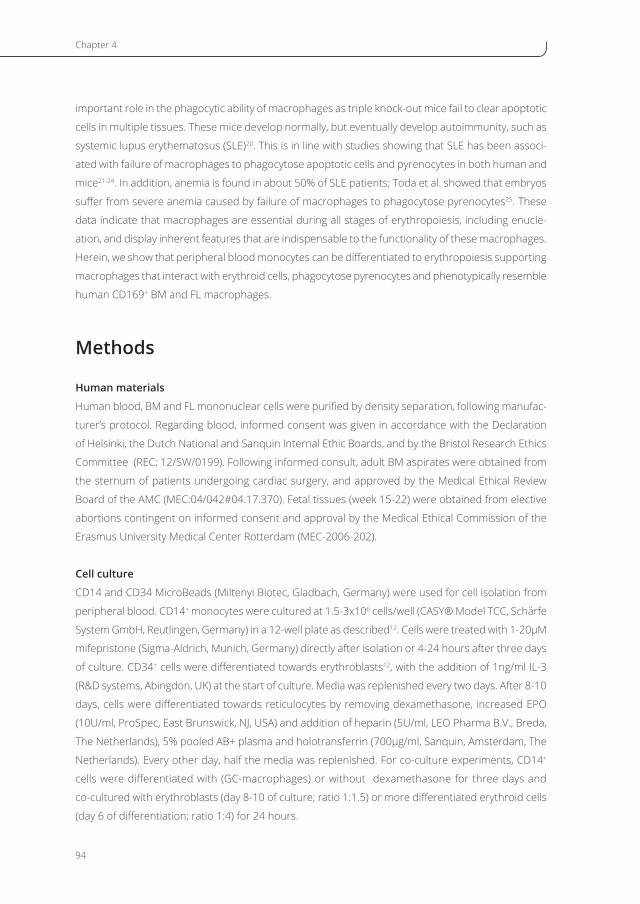
Chapter 4
94
important role in the phagocytic ability of macrophages as triple knock-out mice fail to clear apoptotic
cells in multiple tissues. These mice develop normally, but eventually develop autoimmunity, such as
systemic lupus erythematosus (SLE)20. This is in line with studies showing that SLE has been associ-
ated with failure of macrophages to phagocytose apoptotic cells and pyrenocytes in both human and
mice21-24. In addition, anemia is found in about 50% of SLE patients; Toda et al. showed that embryos
suffer from severe anemia caused by failure of macrophages to phagocytose pyrenocytes25. These
data indicate that macrophages are essential during all stages of erythropoiesis, including enucle-
ation, and display inherent features that are indispensable to the functionality of these macrophages.
Herein, we show that peripheral blood monocytes can be differentiated to erythropoiesis supporting
macrophages that interact with erythroid cells, phagocytose pyrenocytes and phenotypically resemble
human CD169+ BM and FL macrophages.
Methods
Human materials
Human blood, BM and FL mononuclear cells were purified by density separation, following manufac-
turer’s protocol. Regarding blood, informed consent was given in accordance with the Declaration
of Helsinki, the Dutch National and Sanquin Internal Ethic Boards, and by the Bristol Research Ethics
Committee (REC; 12/SW/0199). Following informed consult, adult BM aspirates were obtained from
the sternum of patients undergoing cardiac surgery, and approved by the Medical Ethical Review
Board of the AMC (MEC:04/042#04.17.370). Fetal tissues (week 15-22) were obtained from elective
abortions contingent on informed consent and approval by the Medical Ethical Commission of the
Erasmus University Medical Center Rotterdam (MEC-2006-202).
Cell culture
CD14 and CD34 MicroBeads (Miltenyi Biotec, Gladbach, Germany) were used for cell isolation from
peripheral blood. CD14+ monocytes were cultured at 1.5-3x10⁶ cells/well (CASY® Model TCC, Schärfe
System GmbH, Reutlingen, Germany) in a 12-well plate as described12. Cells were treated with 1-20μM
mifepristone (Sigma-Aldrich, Munich, Germany) directly after isolation or 4-24 hours after three days
of culture. CD34+ cells were differentiated towards erythroblasts12, with the addition of 1ng/ml IL-3
(R&D systems, Abingdon, UK) at the start of culture. Media was replenished every two days. After 8-10
days, cells were differentiated towards reticulocytes by removing dexamethasone, increased EPO
(10U/ml, ProSpec, East Brunswick, NJ, USA) and addition of heparin (5U/ml, LEO Pharma B.V., Breda,
The Netherlands), 5% pooled AB+ plasma and holotransferrin (700µg/ml, Sanquin, Amsterdam, The
Netherlands). Every other day, half the media was replenished. For co-culture experiments, CD14+
cells were differentiated with (GC-macrophages) or without dexamethasone for three days and
co-cultured with erythroblasts (day 8-10 of culture; ratio 1:1.5) or more differentiated erythroid cells
(day 6 of differentiation; ratio 1:4) for 24 hours.
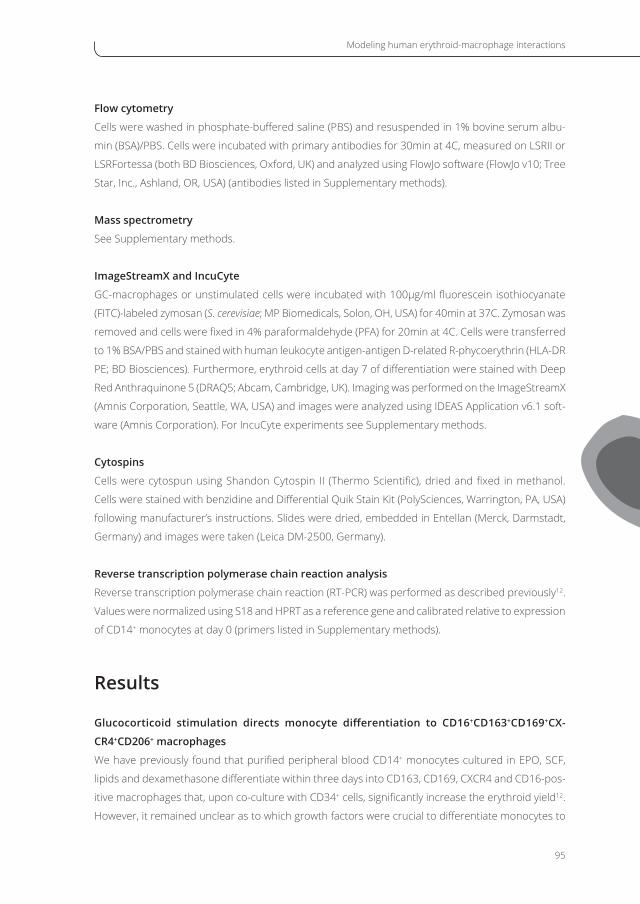
Modeling human erythroid-macrophage interactions
95
Flow cytometry
Cells were washed in phosphate-buffered saline (PBS) and resuspended in 1% bovine serum albu-
min (BSA)/PBS. Cells were incubated with primary antibodies for 30min at 4C, measured on LSRII or
LSRFortessa (both BD Biosciences, Oxford, UK) and analyzed using FlowJo software (FlowJo v10; Tree
Star, Inc., Ashland, OR, USA) (antibodies listed in Supplementary methods).
Mass spectrometry
See Supplementary methods.
ImageStreamX and IncuCyte
GC-macrophages or unstimulated cells were incubated with 100µg/ml fluorescein isothiocyanate
(FITC)-labeled zymosan (S. cerevisiae; MP Biomedicals, Solon, OH, USA) for 40min at 37C. Zymosan was
removed and cells were fixed in 4% paraformaldehyde (PFA) for 20min at 4C. Cells were transferred
to 1% BSA/PBS and stained with human leukocyte antigen-antigen D-related R-phycoerythrin (HLA-DR
PE; BD Biosciences). Furthermore, erythroid cells at day 7 of differentiation were stained with Deep
Red Anthraquinone 5 (DRAQ5; Abcam, Cambridge, UK). Imaging was performed on the ImageStreamX
(Amnis Corporation, Seattle, WA, USA) and images were analyzed using IDEAS Application v6.1 soft-
ware (Amnis Corporation). For IncuCyte experiments see Supplementary methods.
Cytospins
Cells were cytospun using Shandon Cytospin II (Thermo Scientific), dried and fixed in methanol.
Cells were stained with benzidine and Differential Quik Stain Kit (PolySciences, Warrington, PA, USA)
following manufacturer’s instructions. Slides were dried, embedded in Entellan (Merck, Darmstadt,
Germany) and images were taken (Leica DM-2500, Germany).
Reverse transcription polymerase chain reaction analysis
Reverse transcription polymerase chain reaction (RT-PCR) was performed as described previously12.
Values were normalized using S18 and HPRT as a reference gene and calibrated relative to expression
of CD14+ monocytes at day 0 (primers listed in Supplementary methods).
Results
Glucocorticoid stimulation directs monocyte differentiation to CD16+CD163+CD169+CX-
CR4+CD206+ macrophages
We have previously found that purified peripheral blood CD14+ monocytes cultured in EPO, SCF,
lipids and dexamethasone differentiate within three days into CD163, CD169, CXCR4 and CD16-pos-
itive macrophages that, upon co-culture with CD34+ cells, significantly increase the erythroid yield12.
However, it remained unclear as to which growth factors were crucial to differentiate monocytes to

Chapter 4
96
macrophages supporting erythropoiesis. Therefore, we examined which growth factors or supple-
ments determined this differentiation cue. Flow cytometry analysis showed that dexamethasone,
exclusively, induces high expression of CD16 and CD163 in macrophages. The addition of EPO, SCF
or lipids does not contribute to this high expression (Figure 1A,B). CXCR4 expression was already
upregulated in the absence of dexamethasone but was further increased upon stimulation with dexa-
methasone and lipids, whilst the expression of tissue residency marker CD169 was also upregulated
but occurred in a dexamethasone-independent manner (Figure 1C,D). Figure S1A depicts distinct
morphological changes upon dexamethasone-induced differentiation between freshly isolated CD14+
monocytes and cultured CD14+ cells. Monocytes were incubated with mifepristone, which blocks
glucocorticoid receptor activation. Membrane and messenger ribonucleic acid (mRNA) expression of
CD16, CD163, and CD206 was significantly reduced by mifepristone treatment, and thus dependent
on glucocorticoid receptor transcriptional control (Figure 1E and Figure S1B,C). Although neither
Figure 1C nor Figure 1E show an effect of dexamethasone on the fluorescence intensity of CD169,
mRNA levels of CD169 were clearly increased upon stimulation of the glucocorticoid receptor and
reduced when cells were treated with mifepristone. In contrast, CXCR4 mRNA levels did not change
upon mifepristone treatment, but membrane expression was increased (Figure S1B). Monocyte dif-
ferentiation increases expression of DC-SIGN independent of dexamethasone, albeit to expression
levels that are significantly lower compared to dendritic cells (Figure 1E and Figure S1C)26. Note that
cultured monocytes in all conditions are a homogeneous population, as single peaks observed in
histograms and multi-color flow cytometry data revealed that monocytes stimulated with glucocorti-
coids are CD16+CD163+CD169+CXCR4+CD206+ cells (Figure S1C,D). Interestingly, flow cytometry data
revealed that monocytes that have been differentiated for three days in the presence of dexameth-
asone were unable to change their phenotype after 4 or 24 hours of mifepristone treatment. Only
CD163 expression was slightly reduced after 24 hours mifepristone treatment (Figure S1E). The data
indicates that glucocorticoid stimulation initiates an irreversible differentiation program of monocytes
towards CD16+CD163+CD169+CXCR4+CD206+ macrophages which is maintained for at least 17 days
of culture (Figure S2A,B).
Proteomics data revealed GC-macrophages display a distinct anti-inflammatory profile
To gain further insights into the dexamethasone-induced monocyte differentiation process, we
performed mass spectrometry-based quantitative proteomics on these cells after three days of
differentiation and compared this to non-glucocorticoid stimulated monocytes. A total of 3210 pro-
teins were quantified, and principal component analysis clearly separated glucocorticoid-stimulated
from non-stimulated cells (Figure 2A and Online Supplementary Table S1). Glucocorticoid stimula-
tion induced a distinct expression pattern compared to non-glucocorticoid stimulated monocytes,
as visualized in the volcano plot and corresponding heatmap of the 169 differentially expressed
proteins for individual donors (Figure 2B,C). Note that the expression of CD163 and CD206 (MRC1)
was highly induced after glucocorticoid receptor activation, corroborating the flow cytometry exper-
iments. The most differentially expressed proteins (n=169) were mapped to evaluate specific up- or

Modeling human erythroid-macrophage interactions
97
0
1
2
3
C X C R 4
MF
In
orm
ali
zed
(fc
)
*
E P O
L ip id s
S C F
D e x
0
1 0
2 0
3 0
C D 1 6 3
MF
In
orm
ali
zed
(fc
) *** **** **** *** **** **
E P O
L ip id s
S C F
D e x
0 .0
0 .5
1 .0
1 .5
2 .0
C D 1 6 9
MF
In
orm
ali
zed
(fc
)
ns
E P O
L ip id s
S C F
D e x
0
5
1 0
1 5
C D 1 6
MF
In
orm
ali
zed
(fc
)
** ** *** *** ** ***
E P O
L ip id s
S C F
D e x
D
B
C
A
E**
**
D 0 D 3
M if (2 0 M )M if (1 M )
0
5
1 0
1 5
2 0
2 5
C D 1 6
MF
In
orm
ali
zed
(fc
)
D e x (1 M )
* 0.0675**
0
5
1 0
1 5
2 0
2 5
C D 1 6 3
MF
In
orm
ali
zed
(fc
)
D 0 D 3
M if (2 0 M )M if (1 M )
D e x (1 M )
***
0
5
1 0
1 5
2 0
2 5
C X C R 4
MF
In
orm
ali
zed
(fc
)
D 0 D 3
M if (2 0 M )M if (1 M )
D e x (1 M )
*
0
1 0 0
2 0 0
3 0 0
4 0 0
5 0 0
C D 2 0 6
MF
In
orm
ali
zed
(fc
)
D 0 D 3
M if (2 0 M )M if (1 M )
D e x (1 M )
0.0737
N D
ns
0
2
4
6
D C -S IG N
MF
In
orm
ali
zed
(fc
)
D 0 D 3
M if (2 0 M )M if (1 M )
D e x (1 M )
0
1 0 0
2 0 0
3 0 0
4 0 0
C D 1 6 9
MF
In
orm
ali
zed
(fc
) ns
D 0 D 3
M if (2 0 M )M if (1 M )
D e x (1 M )
Figure 1. Glucocorticoid receptor activation directs CD14+ monocytes towards a tissue resident mac-rophage phenotype. (A-D) Distribution graphs displaying the relative geometric mean fluorescence intensity (MFI) of CD16, CD163, CD169 and CXCR4 on human monocytes (n=3-6) cultured for three days under various conditions (EPO, SCF, lipids or dexamethasone). MFI was normalized to isotype control and presented as fold change (fc). Mean ± SEM (two-way ANOVA, *P<0.05, **P<0.01, ***P<0.001, ****P<0.0001). (E) Relative expression of CD16, CD163, CD169, CXCR4, CD206 and DC-SIGN on CD14+ monocytes (n=3) directly after isolation from mononuclear cells (D0) and after culture in the presence or absence of dexamethasone (Dex) and/or mifepri-stone (Mif). MFI was normalized to isotype control and displayed as a fold change to day 0. Mean ± SEM (ratio paired t-test, *P<0.05, **P<0.01). EPO: erythropoietin; SCF: stem cell factor; ND: not detected; ns: not significant.

Chapter 4
98
downregulation of functionality-linked protein networks, based on Search Tool for the Retrieval of
Interacting Genes/Proteins (STRING) analysis (Figure 2D). CD163 and CD206 are part of an interac-
tome protein node that is specifically upregulated in dexamethasone-induced macrophages, and
includes M2 macrophage markers CSF1R, stabilin-1 (STAB1) and complement proteins C3AR1, C1QC,
and FcgRIIa (CD32) which has been associated with high phagocytic capacity of the cells. Moreover,
VSIG4 was upregulated in dexamethasone-induced macrophages, which is restricted to resting tissue
macrophages27, while ABCA1 was also upregulated, which has been highly associated with hemo-
globin-associated macrophages28. In addition, proteins with a positive regulation of cell migration
and motility, including DAB2, ADAM9, Serpine1 (PAI1) and CD81, are upregulated in dexametha-
sone-induced macrophages. Furthermore, a whole range of signaling receptors were upregulated,
amongst which are TGF and IFNg-receptors (TGFBR1 and IFNGR1) and IL13RA1. These proteins belong
to processes that are enriched as GO-term, e.g., membrane part, signal transducer activity, trans-
membrane receptor activity and molecular transduced activity. In addition, many immune regulatory
processes are also enriched (Figure 2E and Online Supplementary Table S2). Interestingly, members
of the cathepsin family involved in antigen presentation (e.g., CTSC, CTSL1, CTSD and CTSS) were
downregulated. A range of pro-inflammatory proteins, clustered within an interactome node, were
downregulated; these include lysosomal enzymes HEXA and HEXB, MANBA, saponin PSAP and GLB1,
in addition to other lysosome/hydrolase activity-related GO-categories (Figure 2D,E). In addition,
GO-categories associated with lipid metabolic processes were also downregulated in GC-macro-
phages. Furthermore, CHI3L1 and CD44 are highly upregulated in non-glucocorticoid stimulated cells
(Figure 2B). CHI3L1 is described as a pro-inflammatory factor29,30, while CD44 has been expressed on
pro-inflammatory tissue macrophages31. In conclusion, CD14+ monocytes that have been differenti-
ated in the presence of dexamethasone display a distinct anti-inflammatory proteomic profile and
are further denoted as GC-macrophages, while unstimulated cells have a more inflammatory profile.
GC-macrophages are motile and bind erythroblasts
GC-macrophages may, besides supporting the erythroid yield, also regulate terminal differentiation
of erythroblasts, recapitulating aspects of erythroblastic islands. In mice, it has been shown that BM
central macrophages can bind erythroblasts through various interactions: VCAM1-integrin-α4β116,32,
integrin-α5β1-ICAM433,34, erythroblast macrophage protein (EMP)-EMP4,35, or EphrinB2-EphrinB436.
Flow cytometry data revealed that GC-macrophages express common cell adhesion molecules (CAM),
such as integrins (α4 [ITGA4], β1,2 [ITGB1, ITGB2/CD18] and αL,M,X [ITGAL/CD11a, ITGAM/CD11b,
ITGAX/CD11c]), the immunoglobin (Ig) superfamily (ICAM1, PECAM, VCAM1) and E- and L-selectin
(Figure 3A and Figure S3A). Most of these CAM could be identified in the proteomics data, including
ICAM3, integrin-β5 and α5, however, VCAM1, selectins and EMP were not detected (Online Supple-
mentary Table S1). With the exception of integrin-β5, these CAM were not differentially expressed
between GC-macrophages and non-glucocorticoid stimulated cells. Erythroblasts expressed similar
ITGA4 levels compared to GC-macrophages, but exhibit a 10-fold reduction in ITGB1 expression and
low expression of ICAM1 and PECAM, whereas VCAM1 was not detected (Figure 3A). When differ

Modeling human erythroid-macrophage interactions
99
Figure 2. Proteome analysis of CD14+ monocytes cultured in the presence or absence of dexamethasone revealed two distinct macrophage populations. (A) Principal component analysis of GC-macrophages (red) versus non-glucocorticoid stimulated cells (blue) of four donors (indicated A-D). (B) Volcano plot (false discov-ery rate 0.05 S0 0.4) showing P-values (-log) versus difference of cells cultured for three days in the presence or absence of dexamethasone. (C) Heatmap of differentially expressed proteins based on Z-scored label-free quantification values. (D) Interaction analysis based on STRING (all interactions) of upregulated (red) and down-regulated (blue) proteins. (E) Enrichment analysis using BiNGO and enrichment mapper in GC-macrophages with upregulated (red) and downregulated (blue) processes.

Chapter 4
100
entiating erythroblasts towards reticulocytes (Figure S3B,C), the expression of CAM was reduced, as
expected, which potentially indicates a lower binding affinity of erythroid cells to macrophages during
erythroid differentiation. Next, we investigated whether GC-macrophages interact in vitro with eryth-
roid cells compared to non-glucocorticoid stimulated monocytes. Indeed, live imaging cells for 2.5
days showed that GC-macrophages are highly motile and non-stimulated macrophages are non-mo-
tile (Figure 3B), a finding which corroborates the increased expression of cell migration and motility
proteins (Figure 2D) whilst engaging twice as many erythroblasts (0.5 vs. 0.3, P<0.0001) at every time
point measured (Figure 3C,D). In addition, cytospins of macrophages co-cultured for 24 hours with
erythroblasts showed that the number of macrophages binding erythroblasts as well as the number
of erythroblasts bound was increased in GC-macrophages compared to non-GC macrophages (Figure
3E and Figure S3D). Nonetheless, no difference in interaction duration between erythroblasts and
macrophages from both conditions was observed (Figure S3E), suggesting that the unstimulated cells
possess some machinery to interact with erythroblasts. In conclusion, GC-macrophages are motile,
express a variety of CAM and form erythroblast interactions with increased frequency and numbers
per macrophage compared to cells cultured in the absence of dexamethasone.
A
GC -M
E B Ld 1
E B Ld 7
0
1 0
2 0
3 0
4 0
V C A M 1
MF
I(n
orm
ali
zed
)
N D N D
GC -M
E B Ld 1
E B Ld 7
01 02 03 04 05 0
5 0 0 06 0 0 07 0 0 0
**** ****
P E C A M
MF
I(n
orm
ali
zed
)
GC -M
E B Ld 1
E B Ld 7
01 02 03 04 05 0
5 0 0 01 0 0 0 01 5 0 0 0 **
***IC A M 1
MF
I(n
orm
ali
zed
)
GC -M
E B Ld 1
E B Ld 7
0
1 0 0
2 0 0
3 0 0
4 0 0
IT G A 4
MF
I(n
orm
ali
zed
) *
GC -M
E B Ld 1
E B Ld 7
0
1 0 0 0
2 0 0 0
3 0 0 06 0 0 09 0 0 0
1 2 0 0 0 *********
IT G B 1
MF
I(n
orm
ali
zed
)
B
E -Dex
+Dex
i ii iii iv
i ii iii iv
v
v
C
- D e x + D e x0
1
2
3
4
5
Av
era
ge
nu
mb
er
of
lin
ks
/M ****
- D e x + D e x0
2
4
6
8
Ma
xim
um
nu
mb
er
of
lin
ks
/M
**
D
+ D e x
0 .4 7 m m
0.4
7m
m
-D e x
0 .4 7 m m
0.4
7m
m
-D e x + D e x0 .0
0 .1
0 .2
0 .3
0 .4
Le
ng
thtr
av
ell
ed
by
M
(in
mm
)
**

Modeling human erythroid-macrophage interactions
101
A
GC -M
E B Ld 1
E B Ld 7
0
1 0
2 0
3 0
4 0
V C A M 1
MF
I(n
orm
ali
zed
)
N D N D
GC -M
E B Ld 1
E B Ld 7
01 02 03 04 05 0
5 0 0 06 0 0 07 0 0 0
**** ****
P E C A M
MF
I(n
orm
ali
zed
)
GC -M
E B Ld 1
E B Ld 7
01 02 03 04 05 0
5 0 0 01 0 0 0 01 5 0 0 0 **
***IC A M 1
MF
I(n
orm
ali
zed
)
GC -M
E B Ld 1
E B Ld 7
0
1 0 0
2 0 0
3 0 0
4 0 0
IT G A 4
MF
I(n
orm
ali
zed
) *
GC -M
E B Ld 1
E B Ld 7
0
1 0 0 0
2 0 0 0
3 0 0 06 0 0 09 0 0 0
1 2 0 0 0 *********
IT G B 1
MF
I(n
orm
ali
zed
)
B
E -Dex
+Dex
i ii iii iv
i ii iii iv
v
v
C
- D e x + D e x0
1
2
3
4
5
Av
era
ge
nu
mb
er
of
lin
ks
/M ****
- D e x + D e x0
2
4
6
8
Ma
xim
um
nu
mb
er
of
lin
ks
/M
**
D
+ D e x
0 .4 7 m m
0.4
7m
m
-D e x
0 .4 7 m m
0.4
7m
m
-D e x + D e x0 .0
0 .1
0 .2
0 .3
0 .4
Le
ng
thtr
av
ell
ed
by
M
(in
mm
)
**
Figure 3. GC-macrophages form erythroblast clusters with increased frequency and erythroblast com-position. (A) Expression of integrins ITGA4 and ITGB1 and adhesion molecules ICAM1, PECAM, and VCAM1 on GC-macrophages (Mφ) (n=6) and erythroblasts (EBL) at day 1 and 7 of differentiation (n=3-4). Mean fluorescence intensity (MFI) has been normalized to the isotype control. Mean ± SEM (unpaired t-test, *P<0.05, **P<0.01, ***P<0.001, ****P<0.0001). (B) Scaled cell-displacement vector diagram (left; 20 representative macrophages in both conditions) and box-and-whisker plot (right; 68 representative macrophages in -Dex and 21 in +Dex) after three days of culture in the absence or presence of dexamethasone (Welch’s unpaired t-test, **P<0.01, n=5). (C-D) Co-culture of GC-macrophages or unstimulated cells with erythroblasts (unpaired t-test of 1153 macrophages (-Dex) and 749 (+Dex), **P<0.01, ****P<0.0001, n=5). Images were taken every hour during 64 hours of analysis. (C) Plot showing the average erythroblast-macrophage links for each macrophage. Mean ± SD. (D) 5-95% box plot showing the maximum number of links per macrophage. Mean is indicated by crosses. (E) Representative images of cytospins of GC-macrophages (+Dex) or unstimulated cells (-Dex) co-cultured with erythroblasts for 24 hours (in 50x magnification, panels i-ii or 100x magnification, panels iii-v; n=4). Dex: dexamethasone; ND: not detected.
GC-macrophages express TAM-receptor family members and phagocytose pyrenocytes
As CD169+CD163+ macrophages promote erythropoiesis8, we decided to examine whether GC-macro-
phages can provide a similar functional role in vitro. In mice, pyrenocytes are phagocytosed by central
macrophages in a Mer tyrosine kinase (MERTK)-dependent manner18. RT-PCR showed that GC-macro-
phages upregulate both MERTK and AXL mRNA compared to freshly isolated and non-glucocorticoid
stimulated monocytes (Figure 4A). MERTK expression was inhibited by mifepristone treatment during
the first three days of culture, whereas AXL was not, suggesting that AXL expression is induced via a
trans-regulated process while MERTK needs the transcriptional activity of the glucocorticoid receptor.
Note that TYRO3 levels are dexamethasone-independently increased. Besides TAM-receptors, other
PS-receptors on macrophages have been reported to be involved in clearing apoptotic bodies, such
as TIM337 (T-cell immunoglobulin and mucin-domain containing-3), STAB38 and CD300A39 (CMRF35-
like molecule 8). TIM3 mRNA levels were increased, albeit independently of dexamethasone (Figure
S4A). This was confirmed by mass spectrometry, as peptides corresponding to TIM3 were identified
in GC-macrophages (HAVCR2 in Online Supplementary Table S1). CD300A and STAB1 were also iden-

Chapter 4
102
tified, of which STAB1 was significantly increased in GC-macrophages compared to unstimulated cells.
Interestingly, proteomics data showed that lactadherin, a PS-binding glycoprotein which stimulates
phagocytosis of red blood cells by macrophages40, was significantly induced in GC-macrophages
compared to unstimulated cells. RT-PCR confirmed increased lactadherin mRNA levels but this was
dexamethasone-independent (Figure S4B). Moreover, both GC-macrophages and unstimulated cells
express DNASE2, a crucial protein required to degrade DNA within phagocytosed apoptotic bodies
or pyrenocytes in macrophages41.
Expression of TAM-receptors and other PS-receptors on GC-macrophages may be a pre-requisite
to phagocytose particles, cells or pyrenocytes in case of erythropoiesis. Figure 4B showed that the
number of GC-macrophages that phagocytose particles, in addition to the amount of zymosan par-
ticles per macrophage is higher (73% vs. 45%, 2.3 vs. 1.7, respectively) compared to unstimulated
cells. Subsequently, both unstimulated cells and GC-macrophages were co-cultured with a mixture
of differentiating erythroblasts, reticulocytes and pyrenocytes (Figure S3B,C) for 24 hours. Cytospin
analysis showed that both GC-macrophages and unstimulated cells bind erythroid cells (Figure 4C),
however, increased numbers of nucleated cells, reticulocytes and pyrenocytes bind to GC-macro-
phages compared to unstimulated cells (Figure 4D-F and Figure S4C). Note that all nucleated erythroid
cells are specifically aligned with their nucleus towards the macrophage as observed in vivo (Figure 4C).
Pyrenocytes, however, were almost solely phagocytosed by GC-macrophages (Figure 4F and Figure
S4D). Importantly, GC-macrophages and unstimulated cells did not overtly phagocytose nucleated
cells or reticulocytes (Figure S4E,F). Flow cytometry data showed that indeed both GC-macrophages
and unstimulated cells can bind erythroid cells, however, increased cluster formation was found
for GC-macrophages compared to unstimulated cells (Figure 4G). These results demonstrate that
GC-macrophages functionally resemble specific aspects of macrophages within the erythroblastic
island by binding erythroblasts and reticulocytes and phagocytosing pyrenocytes.
GC-macrophages share characteristics with CD163+ macrophages found in human BM and FL
To investigate whether GC-macrophages share phenotypical characteristics with macrophages found
in the two major erythropoietic organs during human development and adulthood (FL and BM,
respectively), mononuclear cells of both organs were analyzed. Between week 15 and 22 of human
development, the FL is primarily undertaking erythropoiesis, representing a median of 85% of the total
number of mononuclear cells compared to 29% in BM, with increased frequencies of CD71+CD235-
pro-erythroblasts in FL (Figure 5A,B). To prevent the presence of free immunogenic pyrenocytes and
to support erythroid cell requirements in the developing embryo, it is anticipated that the FL contains
significant amounts of erythroblastic islands and, thus, supporting macrophages. Indeed, Figure
5C shows a 6.5-fold increase in CD163+ FL macrophages compared to BM (3.3% vs. 0.5%). Further
characterization shows only subtle differences in expression of macrophage markers (Figure 5D and
Figure S5A,B), as both macrophage populations express high levels of CD163 and CD14 and have
intermediate levels of CD169, CD206 and VCAM1. CD163+ BM macrophages tend to express more

Modeling human erythroid-macrophage interactions
103
A
0 .0 0 1
0 .0 1
0 .1
1
1 0
1 0 0
1 0 0 0
A X L
Re
lati
ve
ex
pre
ss
ion
(fc
)
4 h rs
D e xM if
D 0 D 3
**** *
0 .0 1
0 .1
1
1 0
1 0 0
T Y R O 3
Re
lati
ve
ex
pre
ss
ion
(fc
)
4 h rs
D e xM if
D 0 D 3
ns
B
387 out of 530 Mϕ (73%)
588 out of 1285 Mϕ (45%)
-D e x + D e x
2
4
6
8
1 0
1 2P
ha
go
cy
tos
ed
pa
rtic
les
****
BF HLA-DR Zymosan Merge
+ De
x-D
ex
BF HLA-DR Zymosan Merge
4 h rs0 .0 0 0 1
0 .0 0 1
0 .0 1
0 .1
1
1 0
1 0 0
1 0 0 0
M E R T K
Re
lati
ve
ex
pre
ss
ion
(fc
)
D e xM if
D 0 D 3
* * 0.0747
D
G
-D e x + D e x0
1 0
2 0
3 0
4 0
5 0
CD
14
+C
D2
35
a+
ce
lls
(%)
**MFI
+Dex 17888
- Dex 9873
Isotype 10284
CD14+ cells
-D e x + D e x0
1
2
3
4
Py
ren
oc
yte
sli
nk
ed
toM ****
-D e x + D e x0
2
4
6
Re
tic
ulo
cy
tes
bo
un
dto
M
****
-D e x + D e x0
2
4
6
8
1 0
1 2
1 4
Nu
cle
ate
dc
ell
sb
ou
nd
toM
****
C
+Dex
-Dex
i ii iii iv v
vii iii ivi
*
*
E FFigure 4. GC-macrophages can bind erythroid cells and phagocytose pyrenocytes. (A) Relative mRNA expres-sion of TAM-receptor family members MERTK, AXL and TYRO3 on CD14+ cells (D0) cultured for three days (D3) in the presence or absence of dexamethasone (Dex). 20µM mifepristone (Mif) was added for three days or after three days for 4 hours (n=4). Mean ± SEM (ratio paired t-test, *P<0.05, ****P<0.0001). (B) Representative ImageStreamX images of zymosan (green) phagocytosed by HLA-DR (red) positive unstimulated macrophages (-Dex) and GC-macrophages (+Dex) (left), and corresponding 10-90% box plot showing the number of zymosan particles phagocytosed (right) (unpaired t-test of 1285 macrophages (-Dex) and 530 (+Dex), ****P<0.0001, n=3). (C-F) GC-macrophages and unstim-ulated cells were co-cultured for 24 hours with day 6 differentiated erythroid cells (unpaired t-test of 370 -Dex and 313 +Dex macrophages, ****P<0.0001, n=3). (C) Representative images of cytospins (in 50x magnification, panels i-ii or 100x magnification, panels iii-v). Macrophages bind nucleated erythroid cells (large arrow), reticulocytes (arrowhead) and phagocytose pyrenocytes (small arrow) and some erythroid cells during differentiation (asterisk). 10-90% box plots showing the number of nucleated cells (D) or reticulocytes (E) bound to macrophages (Mφ). (F) Scatter plot showing the number of pyrenocytes bound to or phagocytosed by macrophages. Mean ± SD. (G) Graph showing the binding of CD235a+ differentiated erythroid cells to GC-macrophages versus unstimulated cells. Corresponding histogram showing geometric mean of CD235a in FITC (n=4). Mean ± SEM (paired t-test, **P<0.01). HLA-DR: human leukocyte antigen-antigen D-related; MFI: mean fluorescence intensity; ns: not significant; BF: bright-field.

Chapter 4
104
D
G
-D e x + D e x0
1 0
2 0
3 0
4 0
5 0
CD
14
+C
D2
35
a+
ce
lls
(%)
**MFI
+Dex 17888
- Dex 9873
Isotype 10284
CD14+ cells
-D e x + D e x0
1
2
3
4
Py
ren
oc
yte
sli
nk
ed
toM ****
-D e x + D e x0
2
4
6
Re
tic
ulo
cy
tes
bo
un
dto
M
****
-D e x + D e x0
2
4
6
8
1 0
1 2
1 4
Nu
cle
ate
dc
ell
sb
ou
nd
toM
****
C
+Dex
-Dex
i ii iii iv v
vii iii ivi
*
*
E F
Figure 4. Continued
CXCR4, whereas CD163+ FL macrophages have higher expression of CD16. Table S3 displays the
comparison between the mean fluorescence intensity (MFI) of BM, FL, non-stimulated and GC-mac-
rophages and reveals that GC-macrophages phenotypically recapitulate macrophages found in the
FL and BM. GC-macrophages are more similar to BM macrophages (CD16 and CXCR4 expression),
however, they also share features of FL macrophages (CD206 expression). Unstimulated cells do not
express VCAM1, and have low expression of CD206, CD163, CD14 and CD16. Figure 5E,F shows that
both BM and FL CD163+ macrophages bind erythroid cells (46% in BM vs. 83% in FL), indicating that
CD163 purifies erythroid-supporting macrophages. Interestingly, FL macrophages have increased
interactions with CD71+CD235a+ cells compared to BM. The similarity of marker expression levels of
BM, FL and GC-macrophages and the fact that all three populations form erythroid clusters suggests
that GC-macrophages share phenotypic and functional characteristics with in vivo erythroid-support-
ing macrophages. GC-macrophages could thus be used as a substitute in vitro model to study the
supportive effects of macrophages on erythropoiesis.
Discussion
We have previously shown that monocyte-derived macrophages can support erythropoiesis by
increased survival of HSPC12. Herein, we show that these macrophages derived from CD14+ mono-
cytes, are differentiated in a glucocorticoid-dependent manner (termed GC-macrophages), interact
with erythroid cells of all stages and phagocytose the extruded pyrenocytes. Besides these functional
aspects, GC-macrophages also share phenotypic characteristics with resident macrophages from both
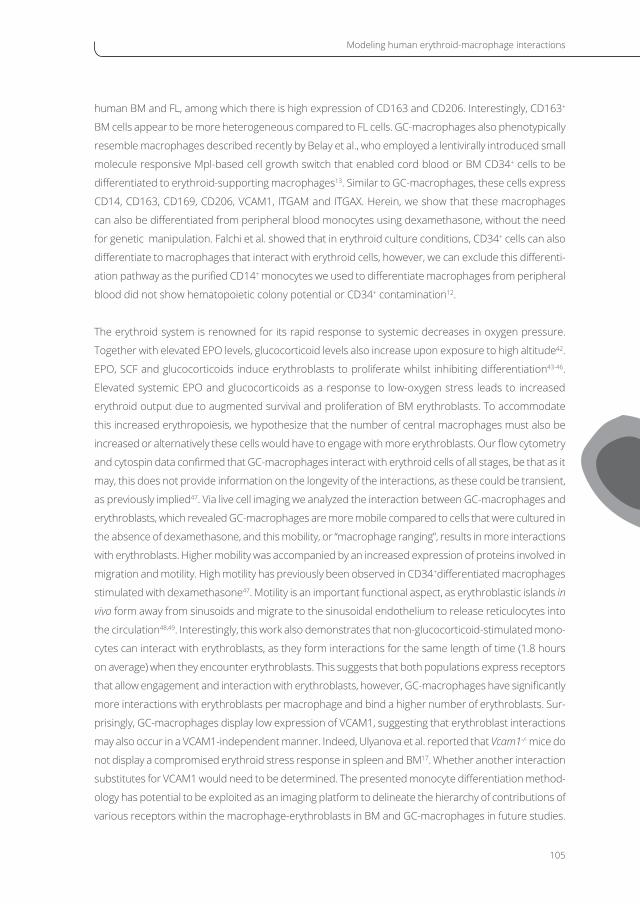
Modeling human erythroid-macrophage interactions
105
human BM and FL, among which there is high expression of CD163 and CD206. Interestingly, CD163+
BM cells appear to be more heterogeneous compared to FL cells. GC-macrophages also phenotypically
resemble macrophages described recently by Belay et al., who employed a lentivirally introduced small
molecule responsive Mpl-based cell growth switch that enabled cord blood or BM CD34+ cells to be
differentiated to erythroid-supporting macrophages13. Similar to GC-macrophages, these cells express
CD14, CD163, CD169, CD206, VCAM1, ITGAM and ITGAX. Herein, we show that these macrophages
can also be differentiated from peripheral blood monocytes using dexamethasone, without the need
for genetic manipulation. Falchi et al. showed that in erythroid culture conditions, CD34+ cells can also
differentiate to macrophages that interact with erythroid cells, however, we can exclude this differenti-
ation pathway as the purified CD14+ monocytes we used to differentiate macrophages from peripheral
blood did not show hematopoietic colony potential or CD34+ contamination12.
The erythroid system is renowned for its rapid response to systemic decreases in oxygen pressure.
Together with elevated EPO levels, glucocorticoid levels also increase upon exposure to high altitude42.
EPO, SCF and glucocorticoids induce erythroblasts to proliferate whilst inhibiting differentiation43-46.
Elevated systemic EPO and glucocorticoids as a response to low-oxygen stress leads to increased
erythroid output due to augmented survival and proliferation of BM erythroblasts. To accommodate
this increased erythropoiesis, we hypothesize that the number of central macrophages must also be
increased or alternatively these cells would have to engage with more erythroblasts. Our flow cytometry
and cytospin data confirmed that GC-macrophages interact with erythroid cells of all stages, be that as it
may, this does not provide information on the longevity of the interactions, as these could be transient,
as previously implied47. Via live cell imaging we analyzed the interaction between GC-macrophages and
erythroblasts, which revealed GC-macrophages are more mobile compared to cells that were cultured in
the absence of dexamethasone, and this mobility, or “macrophage ranging”, results in more interactions
with erythroblasts. Higher mobility was accompanied by an increased expression of proteins involved in
migration and motility. High motility has previously been observed in CD34+differentiated macrophages
stimulated with dexamethasone47. Motility is an important functional aspect, as erythroblastic islands in
vivo form away from sinusoids and migrate to the sinusoidal endothelium to release reticulocytes into
the circulation48,49. Interestingly, this work also demonstrates that non-glucocorticoid-stimulated mono-
cytes can interact with erythroblasts, as they form interactions for the same length of time (1.8 hours
on average) when they encounter erythroblasts. This suggests that both populations express receptors
that allow engagement and interaction with erythroblasts, however, GC-macrophages have significantly
more interactions with erythroblasts per macrophage and bind a higher number of erythroblasts. Sur-
prisingly, GC-macrophages display low expression of VCAM1, suggesting that erythroblast interactions
may also occur in a VCAM1-independent manner. Indeed, Ulyanova et al. reported that Vcam1-/- mice do
not display a compromised erythroid stress response in spleen and BM17. Whether another interaction
substitutes for VCAM1 would need to be determined. The presented monocyte differentiation method-
ology has potential to be exploited as an imaging platform to delineate the hierarchy of contributions of
various receptors within the macrophage-erythroblasts in BM and GC-macrophages in future studies.

Chapter 4
106
B M F L0
5 0 0 0
1 0 0 0 0
1 5 0 0 0
C D 1 4
MF
I(n
orm
ali
zed
)
B M F L0
5 0 0 0
1 0 0 0 0
1 5 0 0 0
C D 1 6
MF
I(n
orm
ali
zed
) **
B M F L0
2 0 0 0 0
4 0 0 0 0
6 0 0 0 0
8 0 0 0 0
1 0 0 0 0 0
C D 1 6 3
MF
I(n
orm
ali
zed
)
B M F L0
5 0 0 0
1 0 0 0 0
1 5 0 0 0
2 0 0 0 0
C X C R 4
MF
I(n
orm
ali
zed
) 0.0723
B M F L0
5 0 0 0
1 0 0 0 0
1 5 0 0 0
2 0 0 0 0
C D 2 0 6
MF
I(n
orm
ali
zed
)
B M F L0
5 0 0 0
1 0 0 0 0
1 5 0 0 0
V C A M 1
MF
I(n
orm
ali
zed
)
B M F L0
2 0 0 0
4 0 0 0
6 0 0 0
8 0 0 0
C D 1 6 9
MF
I(n
orm
ali
zed
)
D
C
B
B M F L0
5 0
1 0 0
To
tal
ce
llfr
ac
tio
n(%
)
C D 7 1 + C D 2 3 5 a -
C D 7 1 + C D 2 3 5 a +
C D 7 1 -C D 2 3 5 a +
*
***
F
B M F L0
5 0
1 0 0
CD
16
3+
ce
llfr
ac
tio
n(%
)
C D 7 1 + C D 2 3 5 a -
C D 7 1 + C D 2 3 5 a +
C D 7 1 -C D 2 3 5 a +*
ATotal BM Total FL
ECD163+ BM CD163+ FL
B M F L0
1
2
3
4
5
6
CD
16
3+
ce
lls
(%)
**
Figure 5. CD163+ macrophage populations in human BM and FL. (A) Representative dot plots of erythroid cells characterized by the expression of CD71high and CD235a in total human BM (n=4) and FL mononuclear cells (n=4). (B) Graph belonging to panel A. Mean ± SD (unpaired t-test, ***P<0.001). (C) Graph showing the percentage of CD163+ cells present in the total cell population in BM (n=7) and FL (n=5). Mean ± SEM (unpaired t-test, **P<0.01). (D) Characterization of CD163+ macrophages in human BM (n=3-7) and FL (n=3-5) based on the expression of CD14, CD16, CD163, CD169, CXCR4, CD206 and VCAM1. Mean fluorescence intensity (MFI) has been normalized to the isotype control. Mean ± SEM (unpaired t-test, **P<0.01). (E) Representative dot plots of erythroid-macro-phage cluster formation of erythroid cells (CD71highCD235a+) with CD163+ BM (n=4) and FL (n=4) macrophages. (F) Graph belonging to panel E. Mean ± SD (unpaired t-test, *P<0.05). BM: bone marrow; FL: fetal liver.

Modeling human erythroid-macrophage interactions
107
We have also demonstrated, using proteomics and imaging, that GC-macrophages actively phagocytose
pyrenocytes and express the correct putative machinery to recognize pyrenocytes. The mechanism(s)
through which macrophages recognize reticulocytes but phagocytose pyrenocytes are ill-defined in
human erythropoiesis. Our proteomic study and RT-PCR data demonstrate that GC-macrophages
express all TAM-receptors, including MERTK and other PS-receptors, which may be used by GC-mac-
rophages to take up pyrenocytes. This work, alongside our ability to manipulate erythroblast protein
expression, now provides an excellent accessible model system to mechanistically understand how
macrophages promote erythropoiesis and eventually target pyrenocytes for phagocytosis and destruc-
tion. Furthermore, it is interesting to note that GC-macrophages interact preferably to the polarized
nuclear side of erythroid cells as observed in BM erythroblastic islands. In general, proteomic analysis
revealed an array of processes and proteins that are differentially regulated between GC-macrophages
and unstimulated cells. The data will allow further studies to delineate essential pathways that are key to
glucocorticoid stimulated differentiation of monocytes towards erythroid-supporting GC-macrophages.
This is probably the concerted action of multiple pathways.
Finally, our observations have important implications for our understanding of the dynamics of the mac-
rophage populations in human BM. We characterized both human BM and FL macrophages and found
that CD163+ FL macrophages define a homogeneous population. In contrast, CD163+ BM macrophages
show a more heterogeneous population, reflecting that CD163+ cells represent a mixed population
of myeloid cells. Both human BM and FL CD163+ macrophages are capable of binding erythroid cells,
however, this percentage is lower in BM (46%) compared to FL (83%). The FL is primarily performing
erythropoiesis at week 15-22 of embryonic development, which suggests that CD163 purifies mainly
central macrophages. The reduced erythroid-macrophage clusters in BM may reflect a more hetero-
geneous CD163+ population with possibly different functions. Changes observed in marker expression
of macrophages in both organs could thus be due to this heterogeneity in the BM population. CD163
isolation in combination with single cell RNA-sequencing may discriminate these different populations
and identify specific discriminatory cell surface markers to allow for functional experiments.
Albeit for decades it was believed that all macrophages originate from monocytes50, recent parabiosis
and fate-mapping studies showed that most resident macrophages are maintained independently of
monocytes51. However, Theurl et al. showed that resident Kupffer cells in the liver contain a mixture of
de novo hematopoiesis-derived and embryonic-derived macrophages. They identified an on-demand
mechanism to facilitate quick and transient increases in cells that can function as Kupffer cells but
originate from classical monocytes52. Taken together with our work, we hypothesize a new scenario
in which specific macrophages originate from different sources depending on the need of a specific
tissue or process. These processes may also occurs in other tissues in response to stress, like the BM.
The origin and homeostasis of human BM resident macrophages is presently ill-defined, if described
at all. Elevated glucocorticoid levels may lead to direct differentiation of monocytes and elevated
numbers of nursing central macrophages to facilitate the increased erythroid output in analogy to
Chapter 4
108
Kupffer cells. Active research aimed at unraveling the origin of tissue resident macrophages, which is
important to understand not only homeostatic but also pathogenic erythropoiesis in which a driving
role of macrophages has been implicated, such as polycythemia vera and β-thalassemia. Herein,
we provide evidence that monocytes can indeed differentiate in vitro to macrophages that support
erythropoiesis, providing a model to study such erythroid-macrophage interactions.
Author contributions
EH performed the experiments. LAH-O and EH performed the IncuCyte experiments and SJC and
LAH-O did IncuCyte data analysis. FPJA and MB performed the mass spectrometry data acquisition
and analysis. EH and EA designed the experiments and analyzed the data. EH and EA wrote the
manuscript. AMT contributed to experiment design, analysis and writing of the manuscript. The
manuscript was critically revised by all authors. The authors declare no competing financial interests.
Acknowledgements
The authors would like to thank the staff of the CASA clinic in Leiden for collecting human fetal tis-
sues and Dr. Tom Cupedo, Natalie Papazian and Martijn Bogaerts from the Erasmus Medical Center,
Rotterdam, for providing human fetal liver material. We also thank the Central Facility of Sanquin for
technical assistance regarding ImageStreamX. This work was supported by grants from the Land-
steiner Foundation (LSBR1141; EA, EH and LSBR1517; MB), a NHS Blood and Transplant (NHSBT) R&D
grant (WP15-05; AMT), National Institute for Health Research (NIHR) for a Blood and Transplant
Research Unit in Red Blood Cell Products at the University of Bristol in partnership with NHSBT
(AMT, LAH-O) and the and Wellcome Trust (105385/Z/14/Z; LAH-O and ISSF; SJC). This article presents
independent research partly funded by the NIHR. The views expressed are those of the authors
and not necessarily the NHS, the NIHR or the Department of Health.

Modeling human erythroid-macrophage interactions
109
References
1. Lee SH, Crocker PR, Westaby S, et al. Isolation and immunocytochemical characterization of human bone marrow stromal
macrophages in hemopoietic clusters. J Exp Med. 1988 Sep 01;168(3):1193-1198.
2. Mohandas N, Prenant M. Three-dimensional model of bone marrow. Blood. 1978 Apr;51(4):633-643.
3. Hanspal M, Smockova Y, Uong Q. Molecular identification and functional characterization of a novel protein that mediates the
attachment of erythroblasts to macrophages. Blood. 1998 Oct 15;92(8):2940-2950.
4. Soni S, Bala S, Gwynn B, Sahr KE, Peters LL, Hanspal M. Absence of erythroblast macrophage protein (Emp) leads to failure of
erythroblast nuclear extrusion. J Biol Chem. 2006 Jul 21;281(29):20181-20189.
5. Hanspal M, Golan DE, Smockova Y, et al. Temporal synthesis of band 3 oligomers during terminal maturation of mouse eryth-
roblasts. Dimers and tetramers exist in the membrane as preformed stable species. Blood. 1998 Jul 1;92(1):329-338.
6. Sawada K, Krantz SB, Dessypris EN, Koury ST, Sawyer ST. Human colony-forming units-erythroid do not require accessory cells,
but do require direct interaction with insulin-like growth factor I and/or insulin for erythroid development. J Clin Invest. 1989
May;83(5):1701-1709.
7. Chow A, Lucas D, Hidalgo A, et al. Bone marrow CD169+ macrophages promote the retention of hematopoietic stem and
progenitor cells in the mesenchymal stem cell niche. J Exp Med. 2011 Feb 14;208(2):261-271.
8. Chow A, Huggins M, Ahmed J, et al. CD169(+) macrophages provide a niche promoting erythropoiesis under homeostasis and
stress. Nat Med. Apr;19(4):429-436.
9. Winkler IG, Sims NA, Pettit AR, et al. Bone marrow macrophages maintain hematopoietic stem cell (HSC) niches and their deple-
tion mobilizes HSCs. Blood. 2010 Dec 2;116(23):4815-4828.
10. Heideveld E, van den Akker E. Digesting the role of bone marrow macrophages on hematopoiesis. Immunobiology. 2017
Jun;222(6):814-822.
11. Iavarone A, King ER, Dai XM, Leone G, Stanley ER, Lasorella A. Retinoblastoma promotes definitive erythropoiesis by repressing
Id2 in fetal liver macrophages. Nature. 2004 Dec 23;432(7020):1040-1045.
12. Heideveld E, Masiello F, Marra M, et al. CD14+ cells from peripheral blood positively regulate hematopoietic stem and progenitor
cell survival resulting in increased erythroid yield. Haematologica. 2015 Nov;100(11):1396-1406.
13. Belay E, Hayes BJ, Blau CA, Torok-Storb B. Human Cord Blood and Bone Marrow CD34+ Cells Generate Macrophages That
Support Erythroid Islands. PLoS One. 2017;12(1):e0171096.
14. Ramos P, Casu C, Gardenghi S, et al. Macrophages support pathological erythropoiesis in polycythemia vera and beta-thalas-
semia. Nat Med. 2013 Apr;19(4):437-445.
15. Jacobsen RN, Perkins AC, Levesque JP. Macrophages and regulation of erythropoiesis. Curr Opin Hematol. 2015 May;22(3):212-
219.
16. Sadahira Y, Yoshino T, Monobe Y. Very late activation antigen 4-vascular cell adhesion molecule 1 interaction is involved in the
formation of erythroblastic islands. J Exp Med. 1995 Jan 01;181(1):411-415.
17. Ulyanova T, Phelps SR, Papayannopoulou T. The macrophage contribution to stress erythropoiesis: when less is enough. Blood.
2016 Sep 29;128(13):1756-1765.
18. Toda S, Segawa K, Nagata S. MerTK-mediated engulfment of pyrenocytes by central macrophages in erythroblastic islands.
Blood. 2014 Jun 19;123(25):3963-3971.
19. Yoshida H, Kawane K, Koike M, Mori Y, Uchiyama Y, Nagata S. Phosphatidylserine-dependent engulfment by macrophages of
nuclei from erythroid precursor cells. Nature. 2005 Sep 29;437(7059):754-758.
20. Lu Q, Lemke G. Homeostatic regulation of the immune system by receptor tyrosine kinases of the Tyro 3 family. Science. 2001
Jul 13;293(5528):306-311.
21. Gaipl US, Voll RE, Sheriff A, Franz S, Kalden JR, Herrmann M. Impaired clearance of dying cells in systemic lupus erythematosus.
Autoimmun Rev. 2005 Apr;4(4):189-194.
22. Munoz LE, Janko C, Schulze C, et al. Autoimmunity and chronic inflammation - two clearance-related steps in the etiopathogenesis
of SLE. Autoimmun Rev. 2010 Nov;10(1):38-42.
23. Nagata S. Apoptosis and autoimmune diseases. Ann N Y Acad Sci. 2010 Oct;1209:10-16.
24. Rothlin CV, Lemke G. TAM receptor signaling and autoimmune disease. Curr Opin Immunol. 2010 Dec;22(6):740-746.
25. Toda S, Nishi C, Yanagihashi Y, Segawa K, Nagata S. Clearance of Apoptotic Cells and Pyrenocytes. Curr Top Dev Biol. 2015;114:267-
295.
26. Ciudad MT, Sorvillo N, van Alphen FP, et al. Analysis of the HLA-DR peptidome from human dendritic cells reveals high affinity
repertoires and nonconventional pathways of peptide generation. J Leukoc Biol. 2017 Jan;101(1):15-27.
27. Vogt L, Schmitz N, Kurrer MO, et al. VSIG4, a B7 family-related protein, is a negative regulator of T cell activation. J Clin Invest.
2006 Oct;116(10):2817-2826.

Chapter 4
110
28. Finn AV, Nakano M, Polavarapu R, et al. Hemoglobin directs macrophage differentiation and prevents foam cell formation in
human atherosclerotic plaques. J Am Coll Cardiol. 2012 Jan 10;59(2):166-177.
29. Krause SW, Rehli M, Kreutz M, Schwarzfischer L, Paulauskis JD, Andreesen R. Differential screening identifies genetic markers of
monocyte to macrophage maturation. J Leukoc Biol. 1996 Oct;60(4):540-545.
30. Libreros S, Garcia-Areas R, Keating P, Carrio R, Iragavarapu-Charyulu VL. Exploring the role of CHI3L1 in “pre-metastatic” lungs
of mammary tumor-bearing mice. Front Physiol. 2013;4:392.
31. Hoban MD, Cost GJ, Mendel MC, et al. Correction of the sickle cell disease mutation in human hematopoietic stem/progenitor
cells. Blood. 2015 Apr 23;125(17):2597-2604.
32. Ulyanova T, Scott LM, Priestley GV, et al. VCAM-1 expression in adult hematopoietic and nonhematopoietic cells is controlled
by tissue-inductive signals and reflects their developmental origin. Blood. 2005 Jul 01;106(1):86-94.
33. Lee G, Lo A, Short SA, et al. Targeted gene deletion demonstrates that the cell adhesion molecule ICAM-4 is critical for erythro-
blastic island formation. Blood. 2006 Sep 15;108(6):2064-2071.
34. Ulyanova T, Jiang Y, Padilla S, Nakamoto B, Papayannopoulou T. Combinatorial and distinct roles of alpha(5) and alpha(4) integrins
in stress erythropoiesis in mice. Blood. 2011 Jan 20;117(3):975-985.
35. Soni S, Bala S, Hanspal M. Requirement for erythroblast-macrophage protein (Emp) in definitive erythropoiesis. Blood Cells Mol
Dis. 2008 Sep-Oct;41(2):141-147.
36. Suenobu S, Takakura N, Inada T, et al. A role of EphB4 receptor and its ligand, ephrin-B2, in erythropoiesis. Biochem Biophys
Res Commun. 2002 May 10;293(3):1124-1131.
37. Ocana-Guzman R, Torre-Bouscoulet L, Sada-Ovalle I. TIM-3 Regulates Distinct Functions in Macrophages. Front Immunol.
2016;7:229.
38. D’Souza S, Park SY, Kim IS. Stabilin-2 acts as an engulfment receptor for the phosphatidylserine-dependent clearance of primary
necrotic cells. Biochem Biophys Res Commun. 2013 Mar 15;432(3):412-417.
39. Simhadri VR, Andersen JF, Calvo E, Choi SC, Coligan JE, Borrego F. Human CD300a binds to phosphatidylethanolamine and
phosphatidylserine, and modulates the phagocytosis of dead cells. Blood. 2012 Mar 22;119(12):2799-2809.
40. Dasgupta SK, Abdel-Monem H, Guchhait P, Nagata S, Thiagarajan P. Role of lactadherin in the clearance of phosphatidylser-
ine-expressing red blood cells. Transfusion. 2008 Nov;48(11):2370-2376.
41. Kawane K, Fukuyama H, Kondoh G, et al. Requirement of DNase II for definitive erythropoiesis in the mouse fetal liver. Science.
2001 May 25;292(5521):1546-1549.
42. Humpeler E, Skrabal F, Bartsch G. Influence of exposure to moderate altitude on the plasma concentraton of cortisol, aldoste-
rone, renin, testosterone, and gonadotropins. Eur J Appl Physiol Occup Physiol. 1980;45(2-3):167-176.
43. van den Akker E, Satchwell TJ, Pellegrin S, Daniels G, Toye AM. The majority of the in vitro erythroid expansion potential resides
in CD34- cells, outweighing the contribution of CD34+ cells and significantly increasing the erythroblast yield from peripheral
blood samples. Haematologica. 2010 Sep;95(9):1594-1598.
44. Leberbauer C, Boulme F, Unfried G, Huber J, Beug H, Mullner EW. Different steroids co-regulate long-term expansion versus
terminal differentiation in primary human erythroid progenitors. Blood. 2005 Jan 01;105(1):85-94.
45. von Lindern M, Deiner EM, Dolznig H, et al. Leukemic transformation of normal murine erythroid progenitors: v- and c-ErbB act
through signaling pathways activated by the EpoR and c-Kit in stress erythropoiesis. Oncogene. 2001 Jun 21;20(28):3651-3664.
46. Bauer A, Tronche F, Wessely O, et al. The glucocorticoid receptor is required for stress erythropoiesis. Genes Dev. 1999 Nov
15;13(22):2996-3002.
47. Falchi M, Varricchio L, Martelli F, et al. Dexamethasone targeted directly to macrophages induces macrophage niches that
promote erythroid expansion. Haematologica. 2015 Feb;100(2):178-187.
48. Yokoyama T, Kitagawa H, Takeuchi T, Tsukahara S, Kannan Y. No apoptotic cell death of erythroid cells of erythroblastic islands
in bone marrow of healthy rats. J Vet Med Sci. 2002 Oct;64(10):913-919.
49. Yokoyama T, Etoh T, Kitagawa H, Tsukahara S, Kannan Y. Migration of erythroblastic islands toward the sinusoid as erythroid
maturation proceeds in rat bone marrow. J Vet Med Sci. 2003 Apr;65(4):449-452.
50. van Furth R, Cohn ZA. The origin and kinetics of mononuclear phagocytes. J Exp Med. 1968 Sep 01;128(3):415-435.
51. Hashimoto D, Chow A, Noizat C, et al. Tissue-resident macrophages self-maintain locally throughout adult life with minimal
contribution from circulating monocytes. Immunity. 2013 Apr 18;38(4):792-804.
52. Theurl I, Hilgendorf I, Nairz M, et al. On-demand erythrocyte disposal and iron recycling requires transient macrophages in the
liver. Nat Med. 2016 Aug;22(8):945-951.

Modeling human erythroid-macrophage interactions
111
Supplementary methods
Flow cytometry
Antibodies used: AbD Serotec (Bio-Rad, Veenendaal, The Netherlands): anti-CD54, ICAM1 (AF647
1:400), anti-CD209, DC-SIGN (PE 1:100); Acris (Herford, Germany): anti-CD235a (FITC 1:450; PE 1:450);
BD Biosciences: anti-CD11c, ITGAX (PE 1:10), anti-CD14 (Pacific Blue 1:150), anti-CD18, ITGB2 (FITC
1:20), anti-CD49d, ITGA4 (APC-H7 1:80), anti-CD62L, L-selectin (V450 1:300), anti-CD106, VCAM1 (APC
1:10), anti-CD169 (APC 1:100), anti-CD206 (APC 1:100); Beckman-Coulter (Fullerton, CA): anti-CD29,
ITGB1 (FITC 1:70); Bender MedSystems (Vienna, Austria): anti-CD62E, E-selectin (FITC 1:10); Biolegend
(ITK Diagnostics, The Netherlands): anti-CD11a, ITGAL (APC 1:50), anti-CD11b, ITGAM (BV421 1:50);
eBioscience (Vienna, Austria): anti-CD184, CXCR4 (PE 1:100); Miltenyi Biotec: anti-CD71 (VioBlue 1:200),
anti-CD163 (PE 1:100), anti-CD235a (VioBlue 1:200), propidium iodide (PI; 1:100); Pelicluster (Amster-
dam, The Netherlands): anti-CD16 (FITC 1:100), anti-CD31, PECAM (FITC 1:10).
Mass spectrometry data acquisition and analysis
Cells were lysed in 100μl 4% SDS, 100mM DTT, 100mM Tris.HCl pH7.5 and processed into tryptic peptides
using Filter Aided Sample Preparation1. Peptides were desalted and concentrated using Empore-C18
StageTips2 and eluted with 0.5%(v/v) acetic acid, 80%(v/v) acetonitrile. Sample volume was reduced by
SpeedVac and supplemented with 2% acetonitrile, 0.1% TFA to a final volume of 12μl. 3μl was injected
for mass spectrometry analysis. Tryptic peptides were separated by nanoscale C18 reverse phase chro-
matography coupled on line to an Orbitrap Fusion Tribrid mass spectrometer (Thermo Scientific) via a
nanoelectrospray ion source (Nanospray Flex Ion Source, Thermo Scientific). Peptides were loaded on a
20cm 75–360µm inner-outer diameter fused silica emitter (New Objective) packed in-house with Repro-
Sil-Pur C18-AQ, 1.9μm resin (Dr Maisch GmbH). The column was installed on a Dionex Ultimate3000
RSLC nanoSystem (Thermo Scientific) using a MicroTee union formatted for 360μm outer diameter
columns (IDEX) and a liquid junction. The spray voltage was set to 2.15kV. Buffer A was composed of
0.5% acetic acid and buffer B of 0.5% acetic acid, 80% acetonitrile. Peptides were loaded for 17min at
300nl/min at 5% buffer B, equilibrated for 5min at 5% buffer B (17-22min) and eluted by increasing
buffer B from 5-15% (22-87min) and 15-38% (87-147min), followed by a 10min wash to 90% and a 5min
regeneration to 5%. Survey scans of peptide precursors from 400-1500m/z were performed at 120K
resolution (at 200m/z) with a 1.5x10⁵ ion count target. Tandem mass spectrometry was performed by
isolation with the quadrupole with isolation window 1.6, HCD fragmentation with normalized collision
energy of 30, and rapid scan mass spectrometry analysis in the ion trap. The MS2 ion count target was
set to 1.5x10⁴ and the max injection time was 35ms. Only those precursors with charge state 2-7 were
sampled for MS2. The dynamic exclusion duration was set to 60s with a 10ppm tolerance around the
selected precursor and its isotopes. Monoisotopic precursor selection was turned on. The instrument
was run in top speed mode with 3s cycles. All data were acquired with Xcalibur software. The RAW
mass spectrometry files were processed with the MaxQuant3 computational platform, version 1.5.2.8.
Proteins and peptides were identified using the Andromeda search engine by querying the human

Chapter 4
112
Uniprot database (release 2015-02, 89796 entries). Standard settings with the additional options match
between runs, Label Free Quantification (LFQ), and only unique and razor peptides for quantification
were selected. The generated ‘proteingroups.txt’ table was filtered for potential contaminants, reverse
hits and ‘only identified by site’ using Perseus4, version 1.5.1.6. The LFQ values were transformed in log2
scale and proteins were filtered for four valid values in at least one of the experimental groups. Missing
values were imputed by normal distribution (width=0.3, shift=1.8), assuming these proteins were close
to the detection limit. Quantitative significance (Principal Component Analysis and Volcano plot using
an FDR of 5% and S0 of 0.4) was performed by Perseus software. Interaction network analysis of the
most differentially expressed proteins was performed using STRING (version 10) using all parameters
and Score: 0.4005. The identified network was uploaded into Cytoscape6, version 3.5.1. Enrichment
analysis of the most differentially expressed proteins was performed using the Cytoscape (version
3.5.1) plug-in BiNGO7 (version 3.0.3) with an FDR threshold of 0.05 and enrichment mapper8 (version
2.1.0) with a P-value cut-off of 0.005, an FDR Q-value cut-off of 0.005, an overlap coefficient of 0.5 and
a combined constant of 0.5.
IncuCyte data acquisition and analysis
1.5x10⁶ monocytes/well were seeded in a 12-well plate and cultured in the presence or absence of
dexamethasone. After three days, cells were gently washed with PBS and incubated for 45min with
CellTracker (ThermoFisher Scientific, Waltham, USA) Green CMFDA (5-chloromethylfluorescein diace-
tate) to monitor cell movement and location. Cells were co-cultured with 3x10⁶ erythroblasts for 6hrs.
The wells were gently washed to remove excess erythroblasts. For imaging, medium was changed into
Iscove’s modified Dulbecco’s medium (IMDM without phenol red) supplemented with erythropoietin
(4U/ml), holotransferrin (700µg/ml) and 30% human serum. Plates were mounted on the IncuCyte
Zoom (Essen Biosciences) and once per hour real-time images at 25 spots per well were taken for a
68-hour time period. The spatial relationship between erythroblasts and macrophages was charac-
terised using Fiji9,10. Initially, lateral drift in the phase-contrast and fluorescence images over time was
corrected using the StackReg plugin11. A difference of Gaussian filter (approximating the equivalent
Laplacian of Gaussian12) was then applied to the phase-contrast channel to enhance features with
diameters matching those expected for erythroblasts. Erythroblasts were subsequently identified
with the TrackMate plugin using the Laplacian of Gaussian feature detector13. Fluorescence channel
images were processed with rolling-ball and Gaussian filters to remove inhomogeneity of illumination
and high frequency noise, respectively. The images were then thresholded using the Otsu method14
with a user-defined fixed multiplier offset and passed through the ImageJ particle analyser to identify
macrophages. Macrophages were tracked between frames using the Apache HBase (v1.3.1; Apache
Software Foundation, https://hbase.apache.org) implementation of the Munkres algorithm with costs
assigned based on object centroid separation15. Instances where objects in the phase-contrast channel
coincided with macrophages identified in the fluorescence channel were removed, as these likely cor-
responded to accidental detection of macrophages. Finally, spatial relationships between erythroblasts
and macrophages were determined based on the maximum separation of object perimeters. Multiple
erythroblasts could be assigned to a single macrophage.

Modeling human erythroid-macrophage interactions
113
RT-PCR analysis
The following primer sets were used: S18 (forward: 5’-GGACAACAAGCTCCGTGAAGA-3’, reverse:
5’-CAGAAGTGACGCAGCCCTCTA-3’), HPRT (forward: 5’-ATGGGAGGCCATCACATTGT-3’, reverse:
5’-ATGTAATCCAGCCAGGTCAGCAA-3’), MERTK (forward: 5’-ACCTCTGTCGAATCAAAGCCC-3’, reverse:
5’-GCACACTGGTTATGCTGA-AGGA-3’), AXL (forward: 5’-GTGGGCAACCCAGGGAATATC-3’, reverse:
5’-GTACTGTCCCGTGTCGGAAAG-3’), TYRO3 (forward: 5’-CAGCCGGTGAAGCTCAACT-3’, reverse:
5’-TGGCACACCTTCTACCGTGA-3’), TIM3 (forward: 5’-GACTTCACTGCAGCCTTTCC-3’, reverse:
5’-GATCCCTGCTCCGATGTAGA3’), Lactadherin (forward: 5’-GACAAGCAGGGCAACTTCAAC-3’, reverse:
5’-CAGGATGGGCGTCTCAAACAA3’), CD16 (forward: 5’-ACAGGTGCCAGACAAACCTC-3’, reverse:
5’-TTCCAGCTGTGACACCTCAG-3’), CD163 (forward: 5’-AATGGAAAAGGAGGCCATTC-3’, reverse:
5’-TGCTCCATTCAATAGTCCAGG-3’), CD169 (forward: 5’-GGGAGTACAAGTGCTCAGCC-3’, reverse:
5’-GCTTCTGCAGCTCAGTGTCA-3’), CXCR4 (forward: 5’-AGCAGGTAGCAAAGTGACGC-3’, reverse:
5’-ATAGTCCCCTGAGCCCATTT-3’), and CD206 (forward: 5’-TCCTGGTTTTTGCCTCTGTC-3’, reverse:
5’-GCACTGGGACTCACTGCAT-3’).
Supplementary references
1. Wisniewski JR, Zougman A, Nagaraj N, Mann M. Universal sample preparation method for proteome analysis. Nat Methods.
2009;6(5):359-362.
2. Rappsilber J, Ishihama Y, Mann M. Stop and go extraction tips for matrix-assisted laser desorption/ionization, nanoelectrospray,
and LC/MS sample pretreatment in proteomics. Anal Chem. 2003;75(3):663-670.
3. Cox J, Mann M. MaxQuant enables high peptide identification rates, individualized p.p.b.-range mass accuracies and pro-
teome-wide protein quantification. Nat Biotechnol. 2008;26(12):1367-1372.
4 .Tyanova S, Temu T, Sinitcyn P, et al. The Perseus computational platform for comprehensive analysis of (prote)omics data. Nat
Methods. 2016;13(9):731-740.
5. Szklarczyk D, Franceschini A, Wyder S, et al. STRING v10: protein-protein interaction networks, integrated over the tree of life.
Nucleic Acids Res. 2015;43(Database issue):D447-452.
6. Lopes CT, Franz M, Kazi F, Donaldson SL, Morris Q, Bader GD. Cytoscape Web: an interactive web-based network browser.
Bioinformatics. 2010;26(18):2347-2348.
7. Maere S, Heymans K, Kuiper M. BiNGO: a Cytoscape plugin to assess overrepresentation of gene ontology categories in biological
networks. Bioinformatics. 2005;21(16):3448-3449.
8. Merico D, Isserlin R, Stueker O, Emili A, Bader GD. Enrichment map: a network-based method for gene-set enrichment visual-
ization and interpretation. PLoS One. 2010;5(11):e13984.
9. Schneider CA, Rasband WS, Eliceiri KW. NIH Image to ImageJ: 25 years of image analysis. Nat Methods. 2012;9(7):671-675.
10. Schindelin J, Arganda-Carreras I, Frise E, et al. Fiji: an open-source platform for biological-image analysis. Nat Methods.
2012;9(7):676-682.
11. Thevenaz P, Ruttimann UE, Unser M. A pyramid approach to subpixel registration based on intensity. IEEE Trans Image Process.
1998;7(1):27-41.
12. Marr D, Hildreth E. Theory of edge detection. Proc R Soc Lond B Biol Sci. 1980;207(1167):187-217.
13. Tinevez JY, Perry N, Schindelin J, et al. TrackMate: An open and extensible platform for single-particle tracking. Methods.
2017;115:80-90.
14. Otsu N. A Threshold Selection Method from Gray-Level Histograms. IEEE Transactions on Systems, Man, and Cybernetics.
1979;9(1):62-66.
15. Munkres J. Algorithms for the Assignment and Transportation Problems. Journal of the Society for Industrial and Applied Math-
ematics. 1957;5(1):32-38.
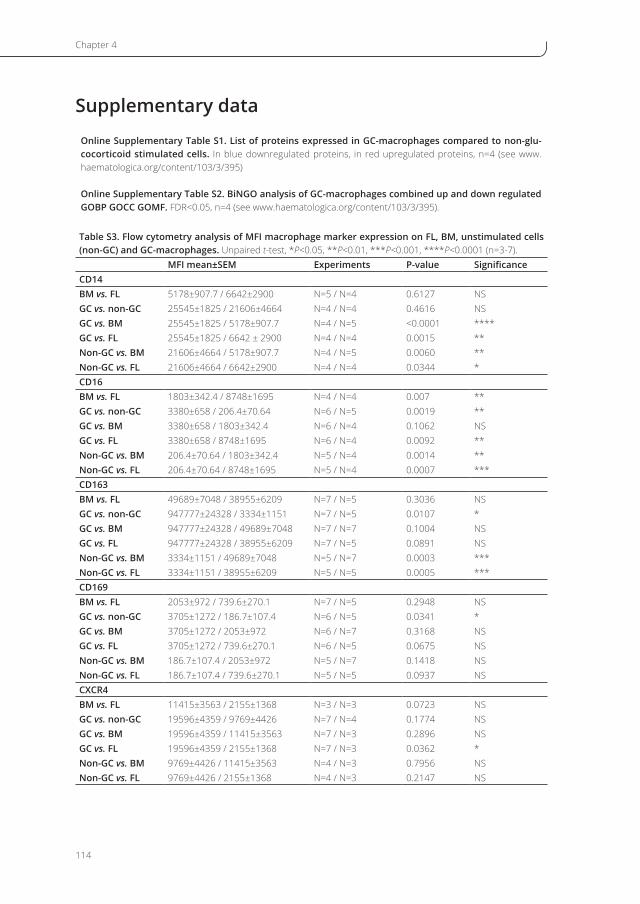
Chapter 4
114
Supplementary data
Online Supplementary Table S1. List of proteins expressed in GC-macrophages compared to non-glu-cocorticoid stimulated cells. In blue downregulated proteins, in red upregulated proteins, n=4 (see www.haematologica.org/content/103/3/395)
Online Supplementary Table S2. BiNGO analysis of GC-macrophages combined up and down regulated GOBP GOCC GOMF. FDR<0.05, n=4 (see www.haematologica.org/content/103/3/395).
Table S3. Flow cytometry analysis of MFI macrophage marker expression on FL, BM, unstimulated cells (non-GC) and GC-macrophages. Unpaired t-test, *P<0.05, **P<0.01, ***P<0.001, ****P<0.0001 (n=3-7).
MFI mean±SEM Experiments P-value SignificanceCD14BM vs. FL 5178±907.7 / 6642±2900 N=5 / N=4 0.6127 NSGC vs. non-GC 25545±1825 / 21606±4664 N=4 / N=4 0.4616 NSGC vs. BM 25545±1825 / 5178±907.7 N=4 / N=5 <0.0001 ****GC vs. FL 25545±1825 / 6642 ± 2900 N=4 / N=4 0.0015 **Non-GC vs. BM 21606±4664 / 5178±907.7 N=4 / N=5 0.0060 **Non-GC vs. FL 21606±4664 / 6642±2900 N=4 / N=4 0.0344 *CD16BM vs. FL 1803±342.4 / 8748±1695 N=4 / N=4 0.007 **GC vs. non-GC 3380±658 / 206.4±70.64 N=6 / N=5 0.0019 **GC vs. BM 3380±658 / 1803±342.4 N=6 / N=4 0.1062 NSGC vs. FL 3380±658 / 8748±1695 N=6 / N=4 0.0092 **Non-GC vs. BM 206.4±70.64 / 1803±342.4 N=5 / N=4 0.0014 **Non-GC vs. FL 206.4±70.64 / 8748±1695 N=5 / N=4 0.0007 ***CD163BM vs. FL 49689±7048 / 38955±6209 N=7 / N=5 0.3036 NSGC vs. non-GC 947777±24328 / 3334±1151 N=7 / N=5 0.0107 *GC vs. BM 947777±24328 / 49689±7048 N=7 / N=7 0.1004 NSGC vs. FL 947777±24328 / 38955±6209 N=7 / N=5 0.0891 NSNon-GC vs. BM 3334±1151 / 49689±7048 N=5 / N=7 0.0003 ***Non-GC vs. FL 3334±1151 / 38955±6209 N=5 / N=5 0.0005 ***CD169BM vs. FL 2053±972 / 739.6±270.1 N=7 / N=5 0.2948 NSGC vs. non-GC 3705±1272 / 186.7±107.4 N=6 / N=5 0.0341 *GC vs. BM 3705±1272 / 2053±972 N=6 / N=7 0.3168 NSGC vs. FL 3705±1272 / 739.6±270.1 N=6 / N=5 0.0675 NSNon-GC vs. BM 186.7±107.4 / 2053±972 N=5 / N=7 0.1418 NSNon-GC vs. FL 186.7±107.4 / 739.6±270.1 N=5 / N=5 0.0937 NSCXCR4BM vs. FL 11415±3563 / 2155±1368 N=3 / N=3 0.0723 NSGC vs. non-GC 19596±4359 / 9769±4426 N=7 / N=4 0.1774 NSGC vs. BM 19596±4359 / 11415±3563 N=7 / N=3 0.2896 NSGC vs. FL 19596±4359 / 2155±1368 N=7 / N=3 0.0362 *Non-GC vs. BM 9769±4426 / 11415±3563 N=4 / N=3 0.7956 NSNon-GC vs. FL 9769±4426 / 2155±1368 N=4 / N=3 0.2147 NS

Modeling human erythroid-macrophage interactions
115
Table S3. ContinuedCD206BM vs. FL 2618±1672 / 7569±3026 N=4 / N=5 0.2263 NSGC vs. non-GC 15144±1103 / 55±30.74 N=4 / N=4 <0.0001 ****GC vs. BM 15144±1103 / 2618±1672 N=4 / N=4 0.0008 ***GC vs. FL 15144±1103 / 7569±3026 N=4 / N=5 0.0713 NSNon-GC vs. BM 55±30.74 / 2618±1672 N=4 / N=4 0.1764 NSNon-GC vs. FL 55±30.74 / 7569±3026 N=4 / N=5 0.0647 NSVCAM1BM vs. FL 4524±2338 / 898±439.1 N=4 / N=4 0.1783 NSGC vs. non-GC 30.33±11.22 / 0±0 N=3 / N=3 0.0538 NSGC vs. BM 30.33±11.22 / 4524±2338 N=3 / N=4 0.1652 NSGC vs. FL 30.33±11.22 / 898±439.1 N=3 / N=4 0.1558 NSNon-GC vs. BM 0±0 / 4524±2338 N=3 / N=4 0.1629 NSNon-GC vs. FL 0±0 / 898±439.1 N=3 / N=4 0.1445 NS

Chapter 4
116
+Dex+Mif20
C
+Dex+Mif1+Dex-DexDay 0Isotype
Cells
(rel
ativ
e)Ce
lls(r
elat
ive)
B
0 .0 0 1
0 .0 1
0 .1
1
1 0
C D 1 6
Re
lati
ve
ex
pre
ss
ion
(fc
)
D e xM if
D 0 D 3
* *
0 .0 1
0 .1
1
1 0
1 0 0
C D 1 6 3
Re
lati
ve
ex
pre
ss
ion
(fc
)
D e xM if
D 0 D 3
** *
0 .1
1
1 0
1 0 0
C D 1 6 9
Re
lati
ve
ex
pre
ss
ion
(fc
)
D e xM if
D 0 D 3
* ***
0 .1
1
1 0
C X C R 4
Re
lati
ve
ex
pre
ss
ion
(fc
)
D e xM if
D 0 D 3
ns
0 .1
1
1 0
1 0 0
1 0 0 0
1 0 0 0 0
C D 2 0 6
Re
lati
ve
ex
pre
ss
ion
(fc
)
D e xM if
D 0 D 3
* ***
+Dex+Mif20+Dex+Mif1+Dex-DexDay 0Isotype
CD14+ -Dex +Dex
A

Modeling human erythroid-macrophage interactions
117
D
E
0
1 0
2 0
3 0
4 0
C D 1 6
MF
In
orm
ali
ze
d(f
c)
D e x (1 M )
M if (2 0 M )
M if (1 M )
4 h rs 2 4 h rs
ns
0
5
1 0
1 5
2 0
C D 1 6 3M
FI
no
rma
liz
ed
(fc
)
**
D e x (1 M )
M if (2 0 M )
M if (1 M )
4 h rs 2 4 h rs
0.0909
0
1 0
2 0
3 0 ns
C D 1 6 9
MF
In
orm
ali
ze
d(f
c)
D e x (1 M )
M if (2 0 M )
M if (1 M )
4 h rs 2 4 h rs
0
2 0
4 0
6 0
8 0
C X C R 4
MF
In
orm
ali
ze
d(f
c)
D e x (1 M )
M if (2 0 M )
M if (1 M )
4 h rs 2 4 h rs
ns
0
1 0 0 0
2 0 0 0
3 0 0 0
C D 2 0 6
MF
In
orm
ali
ze
d(f
c)
D e x (1 M )
M if (2 0 M )
M if (1 M )
4 h rs 2 4 h rs
ns
0.0579
0
5
1 0
1 5
D C -S IG N
MF
In
orm
ali
ze
d(f
c)
D e x (1 M )
M if (2 0 M )
M if (1 M )
4 h rs 2 4 h rs
ns
Figure S1. Macrophage population characteristics. (A) Representative images of cytospins (in 100x magnifica-tion) of CD14+ monocytes directly after isolation, cultured CD14+ cells in the absence (-Dex) or presence (+Dex) of dexamethasone. Note that monocytes are smaller compared to macrophages. (B) Relative mRNA expression of CD16, CD163, CD169, CXCR4, and CD206 on CD14+ cells (D0) cultured for three days (D3) in the presence or absence of dexamethasone (Dex) and/or 20µM mifepristone (Mif) as indicated. Mean ± SEM (ratio paired t-test, *P<0.05, **P<0.01, ***P<0.001). (C) Representative histograms belonging to Figure 1E showing CD16, CD163, CD169, CXCR4, CD206 and DC-SIGN expression on monocytes (n=3) directly after isolation (Day 0) and after culture in the presence or absence of dexamethasone (Dex) and/or mifepristone (Mif1, 1µM; Mif20, 20µM) compared to isotype control. (D) Gating strategy of multi-color flow cytometry experiments showing cells, single cells, and expression of CD16, CD163, CD169, CXCR4 and CD206. (E) CD14+ monocytes were cultured for three days in the presence of dexamethasone and subsequently treated with 1-20µM mifepristone for 4 or 24 hours. Graphs displaying the geometric mean fluorescence intensity (MFI) of CD16, CD163, CD169, CXCR4, CD206 and DC-SIGN (n=2-4). Mean ± SEM (ratio paired t-test, **P<0.01), values normalized to day 0 in Figure 1E.

Chapter 4
118
B
ACe
lls(r
elat
ive)
Cells
(rel
ativ
e)
Day 8
Day 7
Day 3
Isotype
Day 8
Day 7
Day 3
Isotype
Figure S2. Long-term macrophage cultures with dexamethasone. (A) Representative histograms of CD16, CD163, CD169, CXCR4, CD206 expression on differentiated CD14+ monocytes at day 3, 7 and 8 of culture in the presence of dexamethasone (n=4). (B) Representative dot plots show that CD14+ monocytes cultured for 17 days in the presence of dexamethasone maintain CD163, CD169, and CD206 expression (n=3).

Modeling human erythroid-macrophage interactions
119
B
Reticulocytes
Nuclei + Nucleatedcells
Dif D7Dif D1Dif D0
D
-D e x + D e x0
5 0
1 0 0
E r y th ro b la s ts
Bin
din
gc
ap
ac
ity
of
M
(%)
U n b o u n d
1 E B L
2 E B L
3 E B L
4 E B L
5 E B L
6 E B L
**
******
CBF DRAQ5 DRAQ5
Differentiation
E
- D e x + D e x0
2 0
4 0
6 0ns
Av
era
ge
co
nta
ct
m
-EB
L(h
rs)
A
ITG
B 2
ITG
A L
ITG
A M
ITG
A X
E -se le
c t in
L -se le
c t in1 0 0
1 0 0 0
1 0 0 0 0
1 0 0 0 0 0
1 0 0 0 0 0 0M
FI
(no
rma
lize
d)
Figure S3. Integrin expression on GC-macrophages and erythroid differentiation in co-culture with GC-macrophages. (A) Expression of ITGB2, ITGAL, ITGAM, ITGAX, E-selectin and L-selectin on GC-macrophages belonging to Figure 3A-B (n=6). Mean fluorescence intensity (MFI) has been normalized to the isotype control. Mean ± SEM. (B) Representative dot plots of erythroblasts at day 0, 1, and 7 of differentiation (Dif). Upon differ-entiation CD71 expression is reduced and CD235a expression is increased (left panel) while cells also start to enucleate as DRAQ5 stains DNA (right panel) (n=4). (C) Representative ImageStreamX images of the maturation process of erythroblasts at day 7 of differentiation where the nuclei (red, DRAQ5 staining) is expelled from the erythroid cell (n=3). (D) Co-culture of GC-macrophages (+Dex) or unstimulated cells (-Dex) with erythroblasts for 24 hours (n=4). Bars present the percentage of unbound macrophages or macrophages (Mφ) bound to 1 to 6 erythroblasts. Mean ± SD (paired t-test, *P<0.05, **P<0.01, ***P<0.001). (E) Co-culture of GC-macrophages or unstimulated cells with erythroblasts (unpaired t-test of 1153 macrophages (-Dex) and 749 (+Dex), n=5). Images were taken every hour during 64 hours of analysis. Plot showing the mean duration of contact between macro-phages and erythroblasts.

Chapter 4
120
A
0 .0 1
0 .1
1
1 0
1 0 0
T IM 3R
ela
tiv
ee
xp
res
sio
n(f
c)
4 h rs
D e xM if
D 0 D 3
ns
0 .1
1
1 0
1 0 0
L a c ta d h e r in
Re
lati
ve
ex
pre
ss
ion
(fc
)
4 h rs
D e xM if
D 0 D 3
ns
B
C
-Dex
+D e x0
5 0
1 0 0
M
pe
rto
tal
M
(%)
U n b o u n d
N u c le a te d c e lls
R e tic u lo c y te s
P y re n o c y te s
C o m b in e d c e lls
*
D
-D e x + D e x0
5
1 0
1 5
2 0
P y re n o c y te s
M
lin
ke
dto
py
ren
oc
yte
s(%
)
B o u n d
P h a g o c y to s e d
0.0629
0.0785
E
-D e x + D e x0
2 0
4 0
6 0
8 0
1 0 0
N u c le a te d c e lls
Ph
ag
oc
yto
sin
gM
(%)
ns
F
-D e x + D e x0
2 0
4 0
6 0
8 0
1 0 0
R e tic u lo c y te s
Ph
ag
oc
yto
sin
gM
(%)
ns
Figure S4. Binding and phagocytosing capacity of GC-macrophages and unstimulated cells in co-culture with differentiated erythroid cells. Relative mRNA expression of TIM3 (A) and lactadherin (B) in cells from Figure 4A (n=4). Mean ± SEM (ratio paired t-test). (C-F) GC-macrophages or unstimulated cells were co-cultured for 24 hours with erythroid cells at day 6 of differentiation. Cytospins were analysed of 370 macrophages (-Dex) and 313 (+Dex) macrophages. (C) Percentage of macrophages (Mφ) that are unbound, or bound to nucleated cells, reticulocytes or pyrenocytes or a combination of erythroid cells. Mean ± SD (unpaired t-test, *P<0.05, n=3). (D) Percentage of macrophages that bind or phagocytose pyrenocytes. Mean ± SD (unpaired t-test, n=3). (E) Percentage of macrophages phagocytosing nucleated cells. Mean ± SD (paired t-test, n=3). (F) Percentage of macrophages phagocytosing reticulocytes. Mean ± SD (paired t-test, n=3).
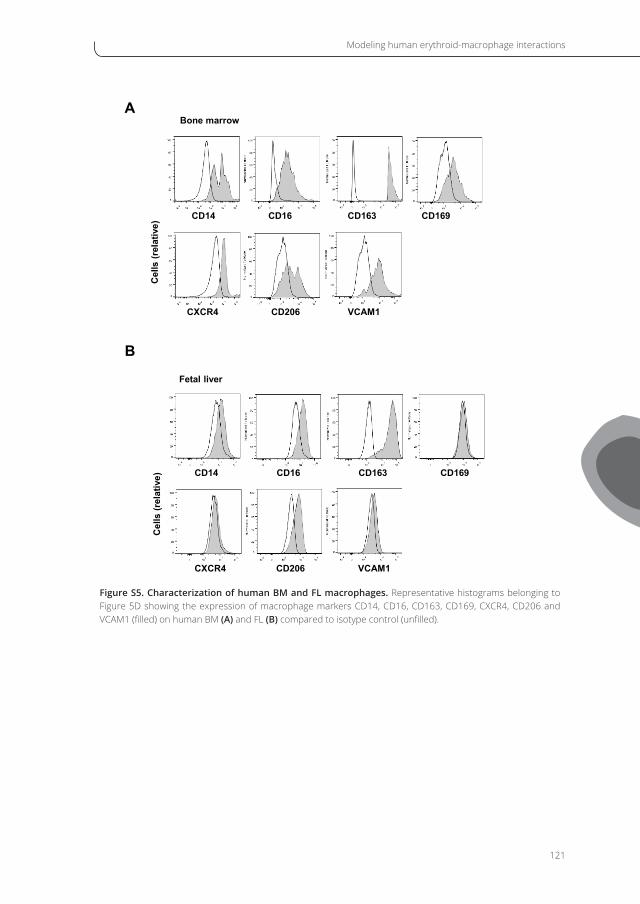
Modeling human erythroid-macrophage interactions
121
Bone marrowA
CD14 CD16 CD163 CD169
CXCR4 CD206 VCAM1
Cel
ls(r
elat
ive)
B
Fetal liver
CD14 CD16 CD163 CD169
CXCR4 CD206 VCAM1
Cel
ls(r
elat
ive)
Figure S5. Characterization of human BM and FL macrophages. Representative histograms belonging to Figure 5D showing the expression of macrophage markers CD14, CD16, CD163, CD169, CXCR4, CD206 and VCAM1 (filled) on human BM (A) and FL (B) compared to isotype control (unfilled).

5

The proteomic landscape of erythroblastic island
macrophages from human fetal liver, bone marrow and
in vitro cultures
CHAPTER 5
Esther Heideveld, Floris P.J. van Alphen, Maartje van den Biggelaar, and Emile van den Akker
Submitted

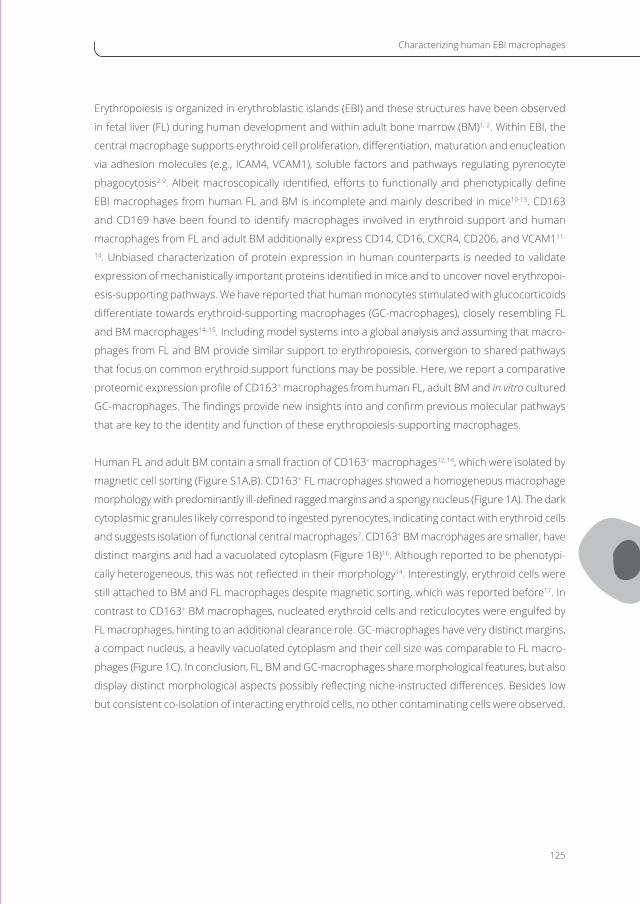
Characterizing human EBI macrophages
125
Erythropoiesis is organized in erythroblastic islands (EBI) and these structures have been observed
in fetal liver (FL) during human development and within adult bone marrow (BM)1, 2. Within EBI, the
central macrophage supports erythroid cell proliferation, differentiation, maturation and enucleation
via adhesion molecules (e.g., ICAM4, VCAM1), soluble factors and pathways regulating pyrenocyte
phagocytosis2-9. Albeit macroscopically identified, efforts to functionally and phenotypically define
EBI macrophages from human FL and BM is incomplete and mainly described in mice10-13. CD163
and CD169 have been found to identify macrophages involved in erythroid support and human
macrophages from FL and adult BM additionally express CD14, CD16, CXCR4, CD206, and VCAM111-
14. Unbiased characterization of protein expression in human counterparts is needed to validate
expression of mechanistically important proteins identified in mice and to uncover novel erythropoi-
esis-supporting pathways. We have reported that human monocytes stimulated with glucocorticoids
differentiate towards erythroid-supporting macrophages (GC-macrophages), closely resembling FL
and BM macrophages14, 15. Including model systems into a global analysis and assuming that macro-
phages from FL and BM provide similar support to erythropoiesis, convergion to shared pathways
that focus on common erythroid support functions may be possible. Here, we report a comparative
proteomic expression profile of CD163+ macrophages from human FL, adult BM and in vitro cultured
GC-macrophages. The findings provide new insights into and confirm previous molecular pathways
that are key to the identity and function of these erythropoiesis-supporting macrophages.
Human FL and adult BM contain a small fraction of CD163+ macrophages12, 14, which were isolated by
magnetic cell sorting (Figure S1A,B). CD163+ FL macrophages showed a homogeneous macrophage
morphology with predominantly ill-defined ragged margins and a spongy nucleus (Figure 1A). The dark
cytoplasmic granules likely correspond to ingested pyrenocytes, indicating contact with erythroid cells
and suggests isolation of functional central macrophages7. CD163+ BM macrophages are smaller, have
distinct margins and had a vacuolated cytoplasm (Figure 1B)16. Although reported to be phenotypi-
cally heterogeneous, this was not reflected in their morphology14. Interestingly, erythroid cells were
still attached to BM and FL macrophages despite magnetic sorting, which was reported before17. In
contrast to CD163+ BM macrophages, nucleated erythroid cells and reticulocytes were engulfed by
FL macrophages, hinting to an additional clearance role. GC-macrophages have very distinct margins,
a compact nucleus, a heavily vacuolated cytoplasm and their cell size was comparable to FL macro-
phages (Figure 1C). In conclusion, FL, BM and GC-macrophages share morphological features, but also
display distinct morphological aspects possibly reflecting niche-instructed differences. Besides low
but consistent co-isolation of interacting erythroid cells, no other contaminating cells were observed.

Chapter 5
126
A
B
C
CD163+ FL macrophages
CD163+ BM macrophages
CD163+ GC-macrophages
i ii iii iv
i ii iii iv
i ii iii iv
* **
*
Figure 1. Morphological analysis of purified human CD163+ FL and BM macrophages and in vitro culture GC macrophages. Representative giemsa/benzidine stained cytospin images of CD163+ FL (A), BM (B) and GC (C) macrophages with 50x (upper) and 100x (lower) magnification. CD163+ in vivo macrophages bind and/or phagocytose erythroblasts (arrowhead), terminally differentiated erythroid cells (big arrow), reticulocytes (asterix) and pyrenocytes (small arrow).
To gain further insight in the molecular pathways involved in EBI structures, we compared the pro-
teome of CD163+ FL (n=3), BM (n=5) and GC-macrophages (n=4). 3536 proteins were identified in
all replicates of at least one of the three populations (Online Supplementary Table S1). Hierarchical
clustering of the Pearson regression correlation matrix in Figure 2A showed high correlation between
replicates within groups ( >0.97 for GC; >0,87 for FL and BM), confirming the uniform cellular mor-
phology. Correlation between samples was on average 0.84, indicating high similarity between CD163+
macrophages and in vitro cultured GC-macrophages. Out of 3536 proteins, 234 were differentially
expressed that cluster in 8 blocks (Figure 2B). Proteins specifically associated with in vitro or in vivo
CD163+ macrophages in clusters 3 and 5 did not enrich into specific processes (data not shown).
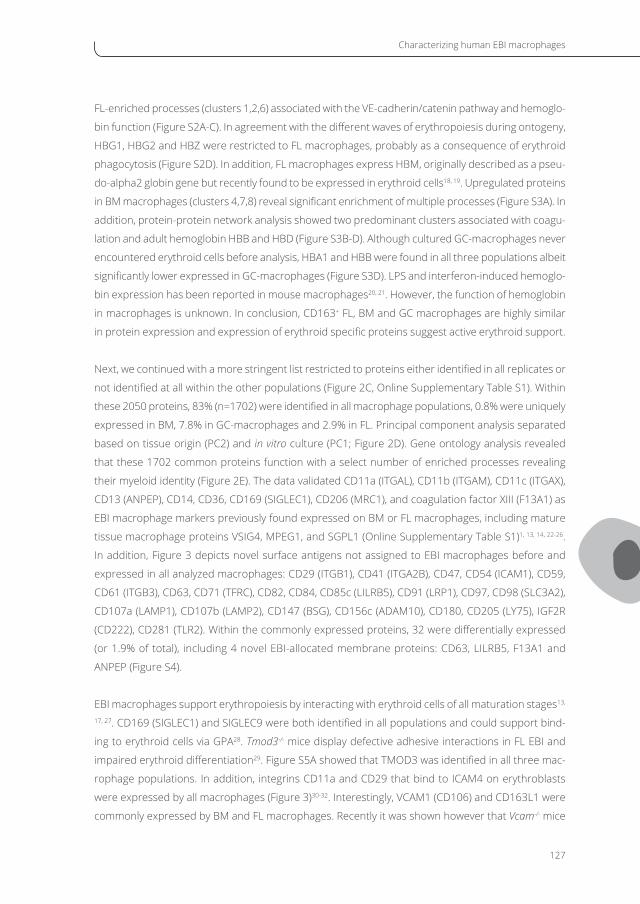
Characterizing human EBI macrophages
127
FL-enriched processes (clusters 1,2,6) associated with the VE-cadherin/catenin pathway and hemoglo-
bin function (Figure S2A-C). In agreement with the different waves of erythropoiesis during ontogeny,
HBG1, HBG2 and HBZ were restricted to FL macrophages, probably as a consequence of erythroid
phagocytosis (Figure S2D). In addition, FL macrophages express HBM, originally described as a pseu-
do-alpha2 globin gene but recently found to be expressed in erythroid cells18, 19. Upregulated proteins
in BM macrophages (clusters 4,7,8) reveal significant enrichment of multiple processes (Figure S3A). In
addition, protein-protein network analysis showed two predominant clusters associated with coagu-
lation and adult hemoglobin HBB and HBD (Figure S3B-D). Although cultured GC-macrophages never
encountered erythroid cells before analysis, HBA1 and HBB were found in all three populations albeit
significantly lower expressed in GC-macrophages (Figure S3D). LPS and interferon-induced hemoglo-
bin expression has been reported in mouse macrophages20, 21. However, the function of hemoglobin
in macrophages is unknown. In conclusion, CD163+ FL, BM and GC macrophages are highly similar
in protein expression and expression of erythroid specific proteins suggest active erythroid support.
Next, we continued with a more stringent list restricted to proteins either identified in all replicates or
not identified at all within the other populations (Figure 2C, Online Supplementary Table S1). Within
these 2050 proteins, 83% (n=1702) were identified in all macrophage populations, 0.8% were uniquely
expressed in BM, 7.8% in GC-macrophages and 2.9% in FL. Principal component analysis separated
based on tissue origin (PC2) and in vitro culture (PC1; Figure 2D). Gene ontology analysis revealed
that these 1702 common proteins function with a select number of enriched processes revealing
their myeloid identity (Figure 2E). The data validated CD11a (ITGAL), CD11b (ITGAM), CD11c (ITGAX),
CD13 (ANPEP), CD14, CD36, CD169 (SIGLEC1), CD206 (MRC1), and coagulation factor XIII (F13A1) as
EBI macrophage markers previously found expressed on BM or FL macrophages, including mature
tissue macrophage proteins VSIG4, MPEG1, and SGPL1 (Online Supplementary Table S1)1, 13, 14, 22-26.
In addition, Figure 3 depicts novel surface antigens not assigned to EBI macrophages before and
expressed in all analyzed macrophages: CD29 (ITGB1), CD41 (ITGA2B), CD47, CD54 (ICAM1), CD59,
CD61 (ITGB3), CD63, CD71 (TFRC), CD82, CD84, CD85c (LILRB5), CD91 (LRP1), CD97, CD98 (SLC3A2),
CD107a (LAMP1), CD107b (LAMP2), CD147 (BSG), CD156c (ADAM10), CD180, CD205 (LY75), IGF2R
(CD222), CD281 (TLR2). Within the commonly expressed proteins, 32 were differentially expressed
(or 1.9% of total), including 4 novel EBI-allocated membrane proteins: CD63, LILRB5, F13A1 and
ANPEP (Figure S4).
EBI macrophages support erythropoiesis by interacting with erythroid cells of all maturation stages13,
17, 27. CD169 (SIGLEC1) and SIGLEC9 were both identified in all populations and could support bind-
ing to erythroid cells via GPA28. Tmod3-/- mice display defective adhesive interactions in FL EBI and
impaired erythroid differentiation29. Figure S5A showed that TMOD3 was identified in all three mac-
rophage populations. In addition, integrins CD11a and CD29 that bind to ICAM4 on erythroblasts
were expressed by all macrophages (Figure 3)30-32. Interestingly, VCAM1 (CD106) and CD163L1 were
commonly expressed by BM and FL macrophages. Recently it was shown however that Vcam-/- mice

Chapter 5
128
A
-25-20-15-10
-505
1015202530
-30 -20 -10 0 10 20 30
Com
pene
nt 2
(27.
6%)
Component 1 (41.4%)
FL
BM
GC
C
E
D
B
12
3
4
5
6
7
8
GC FL BM
Figure 2. Proteomic comparison of human CD163+ FL, BM and GC macrophages. (A) Correlation plots (lower left half) and heatmap of Pearson correlation coefficients (top right half) of FL (n=3), BM (n=5) and GC-macrophages (n=4) of the 3536 proteins that were identified in at least all replicates of at least one of the three populations in all donors in Online Supplementary Online Supplementary Table S1. Note that the scale runs from 0.75 to 1. P-val-ues are depicted in Table S2. (B) Heatmap and hierarchical clustering (based on average Euclidean distance and pre-processed with K-means) using Z-scored LFQ-values of the regulated proteins (n=234) (ANOVA FDR 0.05 S0 0.4). (C) Venn diagram depicting the qualitative distribution of the 2050 proteins that were either quantified in all replicates in human FL, BM and GC-macrophages or not identified at all within one or two populations. (D) Principal component analysis of FL, BM and GC-macrophages on the 1702 proteins that were quantified in all populations. (E) Similarity matrix of the significantly enriched gene ontology terms (row and columns) found within the 1702 proteins identified in all populations (R Package Gogadget) using 3536 proteins identified as reference. The overlap index indi-cates the distances calculated using Gogadget. Dark blue clusters show GO-terms that share similarity (Figure S2).

Characterizing human EBI macrophages
129
display normal erythropoiesis27. Another key regulator of EBI is EMP (MAEA), which was only detected
in GC-macrophages (Figure S5A). Emp-deficient mice die perinatally due to reduced EBI4, 33, 34. The
heme-catalyzing proteins HMOX1 and HMOX2 were identified in all macrophages, although HMOX1
is significantly lower expressed in GC-macrophages (Figure S5A). HMOX1-null patients have anemia,
microcytosis an abnormal iron metabolism, and Hmox1-deficient mice have reduced EBI BM macro-
phages, severely depleted splenic macrophages and altered adhesion molecule expression on both
erythroblasts and EBI macrophages resulting in the inability to form BM EBI35.
Another characteristic of EBI macrophages is phagocytosis of pyrenocytes. Mouse BM EBI mac-
rophages phagocytose phosphatidylserine-exposed pyrenocytes via MERTK in a GAS6 or Protein
S dependent manner7. Figure S5B showed that TAM-receptor family members are expressed by
all groups. FL and BM macrophages expressed AXL and TIMD4 and GC-macrophages expressed
MERTK, which all have similar function6, 36. Stabilin (STAB) binds phosphatidylserine to aid phagocy-
tosis37. STAB1 was identified in all FL and GC-macrophages and some BM macrophages (3 out of 5),
while downstream proteins essential for STAB function RAC1, ELMO1 and ROCK1 were detected in
all macrophages (Figure S5B, Online Supplementary Table S1). Interestingly, STAB2 was restricted
to FL macrophages. Macrophage-capping protein (CAPG) which is important for the phagocytic
capacity of macrophages in mice38, 39 was identified in all macrophages (Figure S5B). Furthermore,
several caspases, cathepsin-associated proteins, and cytokines, such as TGF-β1 (TGFB1), IL16 and
IL18 were identified in all populations, suggesting a paracrine function (Online Supplementary Table
S1). DNASE2, which plays an important role during DNA degradation after phagocytosis, was iden-
tified in all FL and GC-macrophages, and some BM macrophages (3 out of 5) (Figure S5B). Besides
commonly expressed proteins, the proteomics data revealed some uniquely expressed proteins in
EBI macrophages. CD163+ macrophages from BM can be discriminated from FL macrophages using
BM-restrictive CD72 and CD66c (CEACAM6) and FL-restrictive CD26 (DPP4), CD144 (CDH5), CD49d
(ITGA1), and ‘ITGA9’. GC-macrophages exclusively express CD49d (ITGA4), CD85h (LILRA2), CD166
(ALCAM), CD232 (PLXNC1), CD184 (CXCR4), CD305 (LAIR1), and CD328 (SIGLEC7) (Online Supple-
mentary Table S1).
In conclusion, a unique resource is provided with the unbiased proteomic analyses of human CD163+
BM and FL EBI macrophages. Several markers display similar expression and from this a common
novel erythroid supporting macrophage phenotype could be deduced. Restricting the analysis to in
vivo purified CD163+ cells, VCAM1, CD317 (BST2), CD163L1 and ITGB5 may be additionally used as
markers. The proteome comparison of GC-macrophages with FL and BM showed that 83% of the pro-
teome was shared between these three macrophage populations. High similarity to in vitro cultured
macrophages suggests that specific monocyte differentiation cues may lead to erythroid-supporting
macrophages. The identification of co-expressed proteins within the studied populations now allows
for functional studies in vitro and in vivo.

Chapter 5
130
F LB M G
C
2 5
3 0
3 5
C D 2 9 ( IT G B 1 )
LF
Q-v
alu
e
F LB M G
C
2 5
3 0
3 5
C D 1 4
LF
Q-v
alu
e
F LB M G
C
2 5
3 0
3 5
C D 6 1 ( IT G B 3 )
LF
Q-v
alu
e
F LB M G
C
2 5
3 0
3 5
C D 8 4
LF
Q-v
alu
e
F LB M G
C
2 5
3 0
3 5
C D 5 9
LF
Q-v
alu
e
F LB M G
C
2 5
3 0
3 5
C D 5 4 (IC A M 1 )
LF
Q-v
alu
e
F LB M G
C
2 5
3 0
3 5
C D 4 7
LF
Q-v
alu
e
F LB M G
C
2 5
3 0
3 5
C D 1 3 (A N P E P )
LF
Q-v
alu
e
*
F LB M G
C
2 5
3 0
3 5
C D 8 2
LF
Q-v
alu
e
F LB M G
C
2 5
3 0
3 5
C D 7 1 (T F R C )
LF
Q-v
alu
e
F LB M G
C
2 5
3 0
3 5
C D 4 1 ( IT G A 2 B )
LF
Q-v
alu
e
F LB M G
C
2 5
3 0
3 5
C D 1 1 c ( IT G A X )
LF
Q-v
alu
e
F LB M G
C
2 5
3 0
3 5
C D 1 1 b ( IT G A M )
LF
Q-v
alu
e
F LB M G
C
2 5
3 0
3 5
C D 1 1 a ( IT G A L )
LF
Q-v
alu
e
F LB M G
C
2 5
3 0
3 5
C D 3 6
LF
Q-v
alu
e
F LB M G
C
2 5
3 0
3 5
C D 6 3
LF
Q-v
alu
e
F LB M G
C
2 5
3 0
3 5
C D 9 1 (L R P 1 )
LF
Q-v
alu
e
F LB M G
C
2 5
3 0
3 5
C D 8 5 c (L IL R B 5 )
LF
Q-v
alu
e
F LB M G
C
2 5
3 0
3 5
C D 9 8 (S L C 3 A 2 )
LF
Q-v
alu
e
F LB M G
C
2 5
3 0
3 5
C D 9 7
LF
Q-v
alu
e

Characterizing human EBI macrophages
131
F LB M G
C
2 5
3 0
3 5
C D 2 8 1 (T L R 2 )
LF
Q-v
alu
e
F LB M G
C
2 5
3 0
3 5
C D 2 2 2 (IG F 2 R )
LF
Q-v
alu
e
F LB M G
C
2 5
3 0
3 5
C D 2 0 6 (M R C 1 )
LF
Q-v
alu
e
F LB M G
C
2 5
3 0
3 5
C D 2 0 5 (L Y 7 5 )
LF
Q-v
alu
e
F LB M G
C
2 5
3 0
3 5
C D 1 8 0
LF
Q-v
alu
e
F LB M G
C
2 5
3 0
3 5
C D 1 5 6 c (A D A M 1 0 )
LF
Q-v
alu
e
F LB M G
C
2 5
3 0
3 5
C D 1 4 7 (B S G )
LF
Q-v
alu
e
F LB M G
C
2 5
3 0
3 5
C D 1 0 7 b (L A M P 2 )
LF
Q-v
alu
e
F LB M G
C
2 5
3 0
3 5
C D 1 0 7 a (L A M P 1 )L
FQ
-va
lue
F LB M G
C
2 5
3 0
3 5
C D 1 6 9 (S IG L E C 1 )
LF
Q-v
alu
e
Figure 3. Common protein expression of macrophages from different origin. Graphs presenting the LFQ values of previously described and novel EBI-associated proteins for CD163+ macrophages from FL, BM and in vitro culture.
Author contributions
EH performed the experiments. FPJA and MB performed the mass spectrometry data acquisition
and analysis. EH and EA designed the experiments, analyzed the data and wrote the manuscript. The
manuscript was critically revised by all authors. The authors declare no competing financial interests.
Acknowledgements
We are grateful to the staff of the CASA clinic in Leiden for collecting human fetal tissues and Dr.
Tom Cupedo, Natalie Papazian and Martijn Bogaerts from the Erasmus Medical Center Rotterdam for
providing human fetal liver material. We also would like to thank Marten Hansen (Sanquin Research,
Department of Hematopoiesis, Amsterdam) for his technical support concerning R-package for
GO-gadgets. This work was supported by grants from the Landsteiner Foundation (LSBR1141; EA,
EH and LSBR1517; MB).
Chapter 5
132
References
1. Lee SH, Crocker PR, Westaby S, et al. Isolation and immunocytochemical characterization of human bone marrow stromal
macrophages in hemopoietic clusters. J Exp Med. 1988;168(3):1193-1198.
2. Mohandas N, Prenant M. Three-dimensional model of bone marrow. Blood. 1978;51(4):633-643.
3. Hanspal M, Smockova Y, Uong Q. Molecular identification and functional characterization of a novel protein that mediates the
attachment of erythroblasts to macrophages. Blood. 1998;92(8):2940-2950.
4. Soni S, Bala S, Gwynn B, Sahr KE, Peters LL, Hanspal M. Absence of erythroblast macrophage protein (Emp) leads to failure of
erythroblast nuclear extrusion. J Biol Chem. 2006;281(29):20181-20189.
5. Sawada K, Krantz SB, Dessypris EN, Koury ST, Sawyer ST. Human colony-forming units-erythroid do not require accessory
cells, but do require direct interaction with insulin-like growth factor I and/or insulin for erythroid development. J Clin Invest.
1989;83(5):1701-1709.
6. Nishi C, Toda S, Segawa K, Nagata S. Tim4- and MerTK-mediated engulfment of apoptotic cells by mouse resident peritoneal
macrophages. Mol Cell Biol. 2014;34(8):1512-1520.
7. Toda S, Segawa K, Nagata S. MerTK-mediated engulfment of pyrenocytes by central macrophages in erythroblastic islands.
Blood. 2014;123(25):3963-3971.
8. Toda S, Nishi C, Yanagihashi Y, Segawa K, Nagata S. Clearance of Apoptotic Cells and Pyrenocytes. Curr Top Dev Biol. 2015;114:267-
295.
9. Yoshida H, Kawane K, Koike M, Mori Y, Uchiyama Y, Nagata S. Phosphatidylserine-dependent engulfment by macrophages of
nuclei from erythroid precursor cells. Nature. 2005;437(7059):754-758.
10. Heideveld E, van den Akker E. Digesting the role of bone marrow macrophages on hematopoiesis. Immunobiology.
2017;222(6):814-22.
11. Fabriek BO, Polfliet MM, Vloet RP, van der Schors RC, Ligtenberg AJ, Weaver LK, et al. The macrophage CD163 surface glycoprotein
is an erythroblast adhesion receptor. Blood. 2007;109(12):5223-5229.
12. Chow A, Lucas D, Hidalgo A, et al. Bone marrow CD169+ macrophages promote the retention of hematopoietic stem and
progenitor cells in the mesenchymal stem cell niche. J Exp Med. 2011;208(2):261-271.
13. Chow A, Huggins M, Ahmed J, et al. CD169(+) macrophages provide a niche promoting erythropoiesis under homeostasis and
stress. Nat Med. 2013;19(4):429-436.
14. Heideveld E, Hampton-O’Neil LA, Cross SJ, et al. Glucocorticoids induce differentiation of monocytes towards macrophages that
share functional and phenotypical aspects with erythroblastic island macrophages. Haematologica. 2018;103(3):395-405.
15. Heideveld E, Masiello F, Marra M, et al. CD14+ cells from peripheral blood positively regulate hematopoietic stem and progenitor
cell survival resulting in increased erythroid yield. Haematologica. 2015;100(11):1396-1406.
16. Fauser AA, Messner HA. Identification of megakaryocytes, macrophages, and eosinophils in colonies of human bone marrow
containing neurtophilic granulocytes and erythroblasts. Blood. 1979;53(5):1023-1027.
17. Sadahira Y, Yoshino T, Monobe Y. Very late activation antigen 4-vascular cell adhesion molecule 1 interaction is involved in the
formation of erythroblastic islands. J Exp Med. 1995;181(1):411-415.
18. Kim MS, Pinto SM, Getnet D, et al. A draft map of the human proteome. Nature. 2014;509(7502):575-581.
19. Goh SH, Lee YT, Bhanu NV, et al. A newly discovered human alpha-globin gene. Blood. 2005;106(4):1466-1472.
20. Saha D, Patgaonkar M, Shroff A, Ayyar K, Bashir T, Reddy KV. Hemoglobin expression in nonerythroid cells: novel or ubiquitous?
Int J Inflam. 2014;2014:803237.
21. Liu L, Zeng M, Stamler JS. Hemoglobin induction in mouse macrophages. Proc Natl Acad Sci U S A. 1999;96(12):6643-6647.
22. Slayton WB, Juul SE, Calhoun DA, Li Y, Braylan RC, Christensen RD. Hematopoiesis in the liver and marrow of human fetuses at 5
to 16 weeks postconception: quantitative assessment of macrophage and neutrophil populations. Pediatr Res. 1998;43(6):774-
782.
23. Bhoopat L, Taylor CR, Hofman FM. The differentiation antigens of macrophages in human fetal liver. Clin Immunol Immunopathol.
1986;41(2):184-192.
24. Kappelmayer J, Bacsko G, Birinyi L, Zakany R, Kelemen E, Adany R. Consecutive appearance of coagulation factor XIII subunit A
in macrophages, megakaryocytes, and liver cells during early human development. Blood. 1995;86(6):2191-2197.
25. Edwards JA, Jones DB, Evans PR, Smith JL. Differential expression of HLA class II antigens on human fetal and adult lymphocytes
and macrophages. Immunology. 1985;55(3):489-500.
26. Thiele J, Braeckel C, Wagner S, et al. Macrophages in normal human bone marrow and in chronic myeloproliferative disorders:
an immunohistochemical and morphometric study by a new monoclonal antibody (PG-M1) on trephine biopsies. Virchows Arch
A Pathol Anat Histopathol. 1992;421(1):33-39.

Characterizing human EBI macrophages
133
27. Ulyanova T, Scott LM, Priestley GV, et al. VCAM-1 expression in adult hematopoietic and nonhematopoietic cells is controlled
by tissue-inductive signals and reflects their developmental origin. Blood. 2005;106(1):86-94.
28. Lizcano A, Secundino I, Dohrmann S, et al. Erythrocyte sialoglycoproteins engage Siglec-9 on neutrophils to suppress activation.
Blood. 2017;129(23):3100-3110.
29. Sui Z, Nowak RB, Bacconi A, et al. Tropomodulin3-null mice are embryonic lethal with anemia due to impaired erythroid terminal
differentiation in the fetal liver. Blood. 2014;123(5):758-767.
30. Lee G, Lo A, Short SA, et al. Targeted gene deletion demonstrates that the cell adhesion molecule ICAM-4 is critical for erythro-
blastic island formation. Blood. 2006;108(6):2064-2071.
31. Ulyanova T, Jiang Y, Padilla S, Nakamoto B, Papayannopoulou T. Combinatorial and distinct roles of alpha(5) and alpha(4) integrins
in stress erythropoiesis in mice. Blood. 2011;117(3):975-985.
32. Spring FA, Parsons SF, Ortlepp S, et al. Intercellular adhesion molecule-4 binds alpha(4)beta(1) and alpha(V)-family integrins
through novel integrin-binding mechanisms. Blood. 2001;98(2):458-466.
33. Soni S, Bala S, Kumar A, Hanspal M. Changing pattern of the subcellular distribution of erythroblast macrophage protein (Emp)
during macrophage differentiation. Blood Cells Mol Dis. 2007;38(1):25-31.
34. Soni S, Bala S, Hanspal M. Requirement for erythroblast-macrophage protein (Emp) in definitive erythropoiesis. Blood Cells Mol
Dis. 2008;41(2):141-147.
35. Fraser ST, Midwinter RG, Coupland LA, et al. Heme oxygenase-1 deficiency alters erythroblastic island formation, steady-state
erythropoiesis and red blood cell lifespan in mice. Haematologica. 2015;100(5):601-610.
36. Meyer AS, Zweemer AJ, Lauffenburger DA. The AXL Receptor is a Sensor of Ligand Spatial Heterogeneity. Cell Syst. 2015;1(1):25-
36.
37. D’Souza S, Park SY, Kim IS. Stabilin-2 acts as an engulfment receptor for the phosphatidylserine-dependent clearance of primary
necrotic cells. Biochem Biophys Res Commun. 2013;432(3):412-417.
38. Parikh SS, Litherland SA, Clare-Salzler MJ, Li W, Gulig PA, Southwick FS. CapG(-/-) mice have specific host defense defects that
render them more susceptible than CapG(+/+) mice to Listeria monocytogenes infection but not to Salmonella enterica serovar
Typhimurium infection. Infect Immun. 2003;71(11):6582-6590.
39. Witke W, Li W, Kwiatkowski DJ, Southwick FS. Comparisons of CapG and gelsolin-null macrophages: demonstration of a unique
role for CapG in receptor-mediated ruffling, phagocytosis, and vesicle rocketing. J Cell Biol. 2001;154(4):775-784.

Chapter 5
134
Supplementary methods
Human materials
Human blood (n=4), BM (n=5) and FL (n=3) mononuclear cells were purified by density separa-
tion using Ficoll-Paque (manufacturer protocol). For human blood, informed consent was given
in accordance with the Declaration of Helsinki and the Dutch National and Sanquin Internal Ethic
Boards. Human adult BM aspirates were obtained after informed consent from the sternum of
patients undergoing cardiac surgery, and approved by the Medical Ethical Review Board of the AMC
(MEC:04/042#04.17.370). Human fetal tissues were obtained from elective abortions contingent on
informed consent and approval by the Medical Ethical Commission of the Erasmus University Medical
Center Rotterdam (MEC-2006-202). Gestational age was determined by ultrasonic measurement of
the skull or femur diameter and ranged from 17-21 weeks.
Cell culture and isolation
GC-macrophages were generated by culturing CD14+ cells isolated from PBMC for three days as
described previously1. CD163+ macrophages were isolated from both FL and BM by a two-step
purification protocol. First, cells were stained with 20μl/70x106 cells anti-CD163 PE (Miltenyi Biotec,
Bergisch Gladbach, Germany) for 30min at 4C. Thereafter, cells were incubated for 30min at 4C with
50μl/70x106 cells anti-mouse IgG MicroBeads (Miltenyi Biotec). Magnetic-activated cell sorting was
started with an LS column and succeeded by a MS column. After purification, cells were measured
on the LSRFortessa (BD Biosciences, Oxford, UK) and analyzed using FlowJo software (FlowJo v10;
Tree Star, Inc., Ashland, OR, USA).
Cytospins
Cells were cytospun using Shandon Cytospin II (Thermo Scientific), dried and fixed in methanol. Cells
were stained with benzidine in combination with the Differential Quik Stain Kit (PolySciences, War-
rington, PA) (manufacturer’s protocol). Slides were dried, subsequently embedded in Entellan (Merck,
Darmstadt, Germany), covered with a coverslip and images were acquired on a Leica microscope
(Leica DM-2500, Germany).
Mass spectrometry data acquisition and analysis
Purified CD163+ FL macrophages, BM macrophages and cultured GC-macrophages samples were pre-
pared for mass spectrometry and data acquisition analysis was performed as previously described1.
Peptides were prepared from whole-cell lysates using the filter-aided sample preparation (FASP)
method2, and peptides were desalted and concentrated using C18 StageTips3. MS analyses were per-
formed on a Dionex U3000 RSLC coupled to an Orbitrap Fusion Tribrid mass spectrometer (Thermo
Fisher Scientific). Peptides were separated on a ReproSil-Pur C18-AQ, 1.9 μm resin (Dr Maisch; 75–360
μm inner-outer diameter fused silica emitter [New Objective] and 20-cm length) with a 162-min gra-
dient. The instrument was run in top speed mode with 3-s cycles. The RAW MS files were processed

Characterizing human EBI macrophages
135
with the MaxQuant computational platform4 (v1.5.2.8) using human sequences from the Uniprot-
Swiss-prot database (Uniprot; release 2015-02; 89,796 entries) with a false discovery rate below 1%
for both peptides and proteins. Standard settings with the additional options match between runs,
LFQ, and unique peptides for quantification were selected. The generated “proteingroups.txt” table
was filtered for potential contaminants, reverse hits, and “only identified by site”. The LFQ values were
transformed in log2 scale, the biological replicates per experimental condition grouped, and proteins
were filtered to contain at least all valid values in one of the experimental groups (n=3536). Missing
values were imputed by normal distribution (width = 0.3; shift = 1.8), assuming these proteins were
close to the detection limit. Quantitative significance (Pearson correlation coefficient, principal-com-
ponent analysis, ANOVA and hierarchical clustering) was performed by Perseus software5 (v1.5.1.6).
To identify the proteins with the most prominent differences in expression profiles within the different
macrophage subsets, we used the built-in ANOVA functions in PERSEUS using an FDR of 5% and
S0 of 0.4. This identified a total of 234 differentially expressed proteins which were clustered using
hierarchical clustering based on k-means. For the individual or combined clusters, interaction network
analysis was performed using STRING (v10.5, settings: molecular action, all parameters except text-
mining and gene fusion, medium confidence of 0.400). Further enrichment analysis of the individual
or combined clusters was performed using R Package Gogadget, using the 3536 proteins quantified
by the mass spectrometer as a background, using a cut-off value of 0.056.
Supplementary references
1. Heideveld E, Hampton-O’Neil LA, Cross SJ, et al. Glucocorticoids induce differentiation of monocytes towards macrophages that
share functional and phenotypical aspects with erythroblastic island macrophages. Haematologica. 2018;103(3):395-405.
2. Wisniewski JR, Zougman A, Nagaraj N, Mann M. Universal sample preparation method for proteome analysis. Nat Methods.
2009;6(5):359-362.
3. Rappsilber J, Ishihama Y, Mann M. Stop and go extraction tips for matrix-assisted laser desorption/ionization, nanoelectrospray,
and LC/MS sample pretreatment in proteomics. Anal Chem. 2003;75(3):663-670.
4. Cox J, Mann M. MaxQuant enables high peptide identification rates, individualized p.p.b.-range mass accuracies and pro-
teome-wide protein quantification. Nat Biotechnol. 2008;26(12):1367-1372.
5. Tyanova S, Temu T, Sinitcyn P, et al. The Perseus computational platform for comprehensive analysis of (prote)omics data. Nat
Methods. 2016;13(9):731-740.
6. Nota B. Gogadget: An R Package for Interpretation and Visualization of GO Enrichment Results. Mol Inform. 2017;36(5-6).
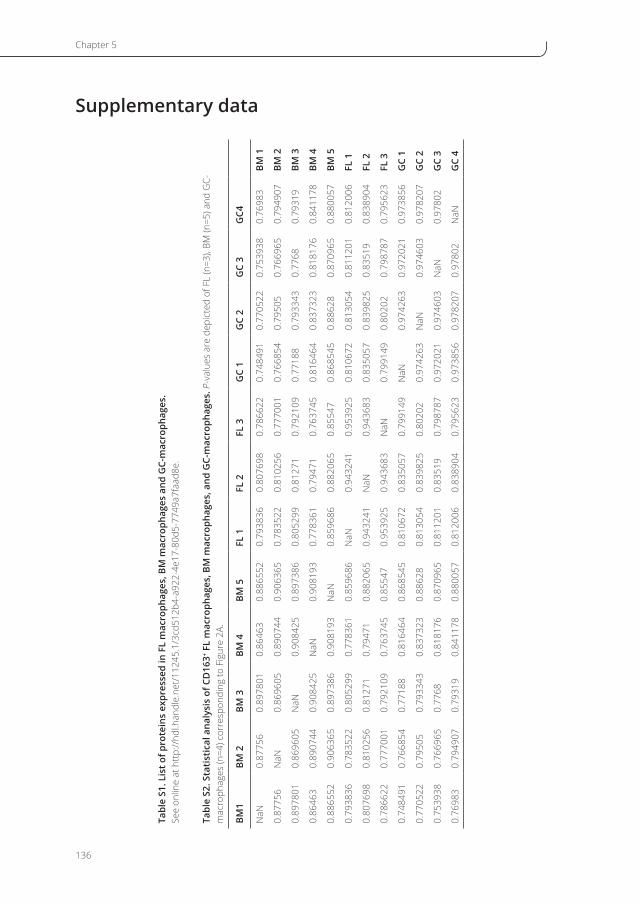
Chapter 5
136
Supplementary data
Tabl
e S1
. Lis
t of p
rote
ins
expr
esse
d in
FL
mac
roph
ages
, BM
mac
roph
ages
and
GC-
mac
roph
ages
. Se
e on
line
at h
ttp:
//hd
l.han
dle.
net/
1124
5.1/
3cd5
12b4
-a92
2-4e
17-8
0d5-
7749
a7fa
ad8e
.
Tabl
e S2
. Sta
tist
ical
ana
lysi
s of
CD
163+ F
L m
acro
phag
es, B
M m
acro
phag
es, a
nd G
C-m
acro
phag
es. P
-val
ues
are
depi
cted
of F
L (n
=3),
BM (n
=5) a
nd G
C-m
acro
phag
es (n
=4) c
orre
spon
ding
to F
igur
e 2A
.
BM1
BM 2
BM 3
BM 4
BM 5
FL 1
FL 2
FL 3
GC
1G
C 2
GC
3G
C4
NaN
0.87
756
0.89
7801
0.86
463
0.88
6552
0.79
3836
0.80
7698
0.78
6622
0.74
8491
0.77
0522
0.75
3938
0.76
983
BM 1
0.87
756
NaN
0.86
9605
0.89
0744
0.90
6365
0.78
3522
0.81
0256
0.77
7001
0.76
6854
0.79
505
0.76
6965
0.79
4907
BM 2
0.89
7801
0.86
9605
NaN
0.90
8425
0.89
7386
0.80
5299
0.81
271
0.79
2109
0.77
188
0.79
3343
0.77
680.
7931
9BM
3
0.86
463
0.89
0744
0.90
8425
NaN
0.90
8193
0.77
8361
0.79
471
0.76
3745
0.81
6464
0.83
7323
0.81
8176
0.84
1178
BM 4
0.88
6552
0.90
6365
0.89
7386
0.90
8193
NaN
0.85
9686
0.88
2065
0.85
547
0.86
8545
0.88
628
0.87
0965
0.88
0057
BM 5
0.79
3836
0.78
3522
0.80
5299
0.77
8361
0.85
9686
NaN
0.94
3241
0.95
3925
0.81
0672
0.81
3054
0.81
1201
0.81
2006
FL 1
0.80
7698
0.81
0256
0.81
271
0.79
471
0.88
2065
0.94
3241
NaN
0.94
3683
0.83
5057
0.83
9825
0.83
519
0.83
8904
FL 2
0.78
6622
0.77
7001
0.79
2109
0.76
3745
0.85
547
0.95
3925
0.94
3683
NaN
0.79
9149
0.80
202
0.79
8787
0.79
5623
FL 3
0.74
8491
0.76
6854
0.77
188
0.81
6464
0.86
8545
0.81
0672
0.83
5057
0.79
9149
NaN
0.97
4263
0.97
2021
0.97
3856
GC
1
0.77
0522
0.79
505
0.79
3343
0.83
7323
0.88
628
0.81
3054
0.83
9825
0.80
202
0.97
4263
NaN
0.97
4603
0.97
8207
GC
2
0.75
3938
0.76
6965
0.77
680.
8181
760.
8709
650.
8112
010.
8351
90.
7987
870.
9720
210.
9746
03N
aN0.
9780
2G
C 3
0.76
983
0.79
4907
0.79
319
0.84
1178
0.88
0057
0.81
2006
0.83
8904
0.79
5623
0.97
3856
0.97
8207
0.97
802
NaN
GC
4

Characterizing human EBI macrophages
137
A
B
Total FL
FSC-A
SSC
-A
Total FL CD163+ FL
Total BM Total BM CD163+ BM
FSC-A
SSC
-A
CD
163
CD
163
CD
163
i ii iii
i iiiii CD
163
Figure S1. Purification of CD163+ macrophages from fetal liver and adult bone marrow. Representative dot plots showing the total cell population (i), the percentage of CD163+ macrophages before MACS isolation (ii), and the CD163+ macrophage population after MACS isolation (iii) in both FL (A) and BM (B).

Chapter 5
138
A
C
D
B
F LB M G
C
2 5
3 0
3 5
H B Z
LF
Q-v
alu
e
F LB M G
C
2 5
3 0
3 5
H B G 1
LF
Q-v
alu
e
N D N D
F LB M G
C
2 5
3 0
3 5
H B G 2
LF
Q-v
alu
e
N D N D
GO-terms upregulated in FL
Hemoglobin complex
Molecular carrier activity
Oxygen carrier activity
Oxygen binding
Oxygen transport
Gas transport
F LB M G
C
2 5
3 0
3 5
R H O C
LF
Q-v
alu
eN D N D
F LB M G
C
2 5
3 0
3 5
C T N N D 1L
FQ
-va
lue
F LB M G
C
2 5
3 0
3 5
C T N N A 1
LF
Q-v
alu
e
F LB M G
C
2 5
3 0
3 5
C T N N B 1
LF
Q-v
alu
e
N D N D
F LB M G
C
2 5
3 0
3 5
C D H 5
LF
Q-v
alu
e
N D N D
F LB M G
C
2 5
3 0
3 5
H B M
LF
Q-v
alu
e
N D
Figure S2. Specific processes upregulated in CD163+ FL macrophages. (A) Table showing the GO-terms that were upregulated in FL compared to BM (clusters 1,2,6 of the heatmap in Figure 2B) using R Package Gogadget. (B) Protein-protein network analysis using STRING-analysis on proteins upregulated in FL compared to BM (clusters 1,2,6 of the heatmap in Figure 2B) depicts few molecular pathways associated. (C,D) Graphs presenting the LFQ values of hemoglobins (C) and the VE-cadherin (CDH5) and catenin pathway (D) upregulated in panel A for all CD163+ macrophages and in vitro cultured GC-macrophages.

Characterizing human EBI macrophages
139
A B
A B
Figure S3. Specific processes upregulated in CD163+ BM macrophages. (A) GO-terms associated with proteins that were upregulated in BM compared to FL (clusters 4,7,8 of the heatmap in Figure 2B), a similarity matrix of the significantly enriched gene ontology terms (row and columns) is shown using R Package Gogadget. The overlap index indicates the distances calculated using Gogadget. Dark blue clusters show GO-terms that share similarity. (B) STRING-analysis on proteins from panel C depicts an elaborate network of processes specifically involved in CD163+ BM macrophages (cluster 4,7,8). (C-E) Graphs presenting the LFQ values of the Serpin protease pathway (C) and hemoglobins (D) upregulated in panel B for all CD163+ macrophages and in vitro cultured GC macrophages. (E) Graphs presenting the LFQ values of the remaining hemoglobins identified in Online Supplementary Table S1.
A B
A B
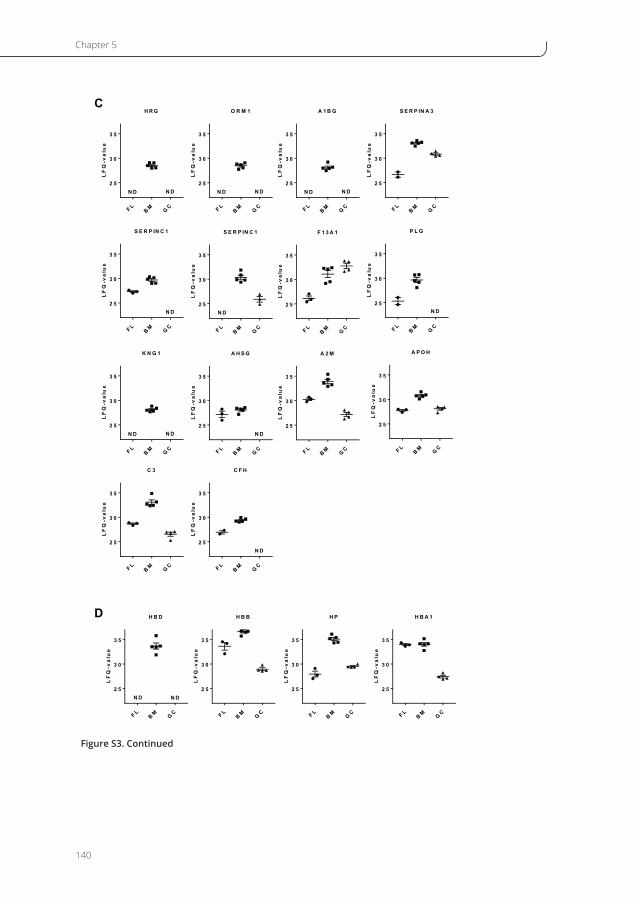
Chapter 5
140
C
F LB M G
C
2 5
3 0
3 5
K N G 1
LF
Q-v
alu
e
N D N D
F LB M G
C
2 5
3 0
3 5
A P O H
LF
Q-v
alu
e
F LB M G
C
2 5
3 0
3 5
A 2 M
LF
Q-v
alu
e
F LB M G
C
2 5
3 0
3 5
S E R P IN C 1
LF
Q-v
alu
e
N D
F LB M G
C
2 5
3 0
3 5
P L G
LF
Q-v
alu
e
N D
F LB M G
C
2 5
3 0
3 5
S E R P IN C 1
LF
Q-v
alu
e
N D
F LB M G
C
2 5
3 0
3 5
S E R P IN A 3
LF
Q-v
alu
e
F LB M G
C
2 5
3 0
3 5
C F H
LF
Q-v
alu
e
N D
F LB M G
C
2 5
3 0
3 5
A 1 B G
LF
Q-v
alu
e
N D N D
F LB M G
C
2 5
3 0
3 5
O R M 1
LF
Q-v
alu
eN D N D
F LB M G
C
2 5
3 0
3 5
H B A 1
LF
Q-v
alu
e
F LB M G
C
2 5
3 0
3 5
H B B
LF
Q-v
alu
e
F LB M G
C
2 5
3 0
3 5
H P
LF
Q-v
alu
e
F LB M G
C
2 5
3 0
3 5
H B D
LF
Q-v
alu
e
N D N D
D
F LB M G
C
2 5
3 0
3 5
H R GL
FQ
-va
lue
N D N D
F LB M G
C
2 5
3 0
3 5
F 1 3 A 1
LF
Q-v
alu
e
F LB M G
C
2 5
3 0
3 5
C 3
LF
Q-v
alu
e
F LB M G
C
2 5
3 0
3 5
A H S G
LF
Q-v
alu
e
N D
Figure S3. Continued
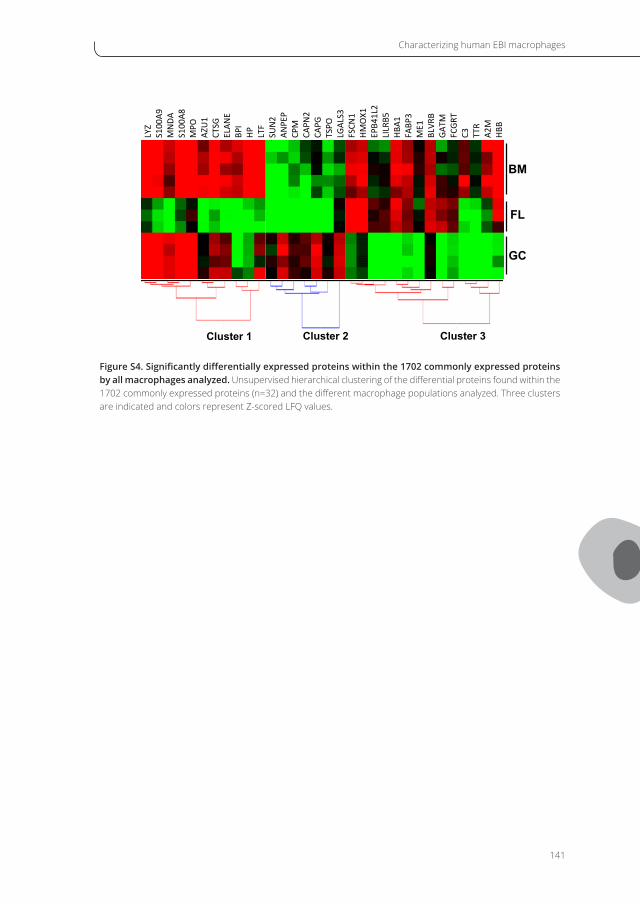
Characterizing human EBI macrophages
141
Cluster 1 Cluster 2 Cluster 3
BM
FL
GC
LYZ
S100
A9MNDA
S100
A8MPO
AZU1
CTSG
ELAN
EBP
IHP LTF
SUN2
ANPEP
CPM
CAPN
2CA
PGTSPO
LGALS3
FSCN
1HM
OX1
EPB4
1L2
LILRB5
HBA1
FABP
3ME1
BLVR
BGA
TMFCGR
TC3 TTR
A2M
HBB
Figure S4. Significantly differentially expressed proteins within the 1702 commonly expressed proteins by all macrophages analyzed. Unsupervised hierarchical clustering of the differential proteins found within the 1702 commonly expressed proteins (n=32) and the different macrophage populations analyzed. Three clusters are indicated and colors represent Z-scored LFQ values.

Chapter 5
142
F LB M G
C
2 5
3 0
3 5
H M O X 2
LF
Q-v
alu
eF L
B M GC
2 5
3 0
3 5
H M O X 1L
FQ
-va
lue
F LB M G
C
2 5
3 0
3 5
V C A M 1
LF
Q-v
alu
e
N D
F LB M G
C
2 5
3 0
3 5
T M O D 3
LF
Q-v
alu
e
F LB M G
C
2 5
3 0
3 5
S IG L E C 9
LF
Q-v
alu
e
A
F LB M G
C
2 5
3 0
3 5
C D 1 6 9 (S IG L E C 1 )
LF
Q-v
alu
e
F LB M G
C
2 5
3 0
3 5
E M P (M A E A )
LF
Q-v
alu
e
N D N D
F LB M G
C
2 5
3 0
3 5
D N A S E 2
LF
Q-v
alu
e
F LB M G
C
2 5
3 0
3 5
S T A B 2
LF
Q-v
alu
e
N D N D
F LB M G
C
2 5
3 0
3 5
A X L
LF
Q-v
alu
e
N D
B
F LB M G
C
2 5
3 0
3 5
M E R T K
LF
Q-v
alu
e
N D
F LB M G
C
2 5
3 0
3 5
T IM D 4
LF
Q-v
alu
e
N D
F LB M G
C
2 5
3 0
3 5
S T A B 1
LF
Q-v
alu
e
F LB M G
C
2 5
3 0
3 5
C A P G
LF
Q-v
alu
e
Figure S5. Protein expression associated with EBI functionality. Graphs presenting the LFQ values of EBI-as-sociated proteins for CD163+ macrophages from FL, BM and in vitro cultured GC macrophages, corresponding to (A) erythroid-macrophage binding and (B) phagocytosis and DNA degradation.


6

General discussion
CHAPTER 6


General discussion
147
The research presented in this thesis concerns the identification, phenotypic analysis and role of
human tissue resident macrophages as support cells during erythropoiesis. Unraveling the mech-
anisms through which macrophages drive erythroid expansion and differentiation is important not
only to understand the normal processes involved in erythropoiesis, but also to start understand-
ing specific erythroid pathologies in which support cells play an important but ill-defined role (e.g.,
myelodysplastic syndrome, polycythemia vera and beta-thalassemia). In addition, this data could
be used to design and optimize new model systems to study interactions between erythroid cells
and macrophages and to optimize current in vitro erythropoiesis protocols with the aim to produce
transfusion-ready red cells, the Holy Grail of transfusion medicine.
Support of hematopoietic stem and progenitor cells
In this thesis, we demonstrated in chapter 2 that during the expansion phase of erythroblast cultures
from peripheral blood mononuclear cells (PBMC) containing StemSpan supplemented with erythro-
poietin (EPO), SCF, and dexamethasone, CD14+ cells present in PBMC increase the erythroblast yield.
This research was initiated by our previous finding that the erythroid yield from total PBMC is 10-15
fold higher compared to CD34+ cells isolated from the same amount of PBMC1. The data of chapter 2
and chapter 4 showed that CD14+ cells have a supportive function during in vitro erythropoiesis. Our
novel flow cytometry tool based on lineage depletion (CD3/CD14/CD19; Lin-) and the expression of
CD34 and CD36 described in chapter 2 allows for easy tracking of erythroid commitment from CD34+
hematopoietic stem and progenitor cells (HSPC) and sorting/isolating of specific stages during differ-
entiation from HSPC to erythroblasts. The data suggests that CD14+ cells do not promote erythroid
expansion, but increase both CD34+CD36- HSPC and CD34+CD36+ megakaryocyte-erythroid progen-
itor (MEP) cell numbers through cell survival and thereby increase the erythroid yield. CD14+ cells are
a heterogeneous population consisting of classical, intermediate and non-classical monocytes based
on the expression of CD14 and CD162. In chapter 2 we showed that in particular the intermediate
monocytes (CD14++CD16+) increase the erythroid yield. Not only the erythroid yield from PBMC was
increased, but CD14+ cells also positively affect CD34+ cells from human bone marrow and cord blood,
although to a lower extent, which might be caused by inter-donor variabilities. CD169+ macrophages
are in close proximity to HSPC and retain HSPC within that specific niche3. Besides this function and
given the data in chapter 2, CD14+ cells in the bone marrow could also affect HSPC survival in vivo.
In addition, both HSPC and MEP were increased upon co-culturing with CD14+ cells, which suggests
that other lineages, in particular megakaryocyte cultures, but also stem cell expansion protocols could
benefit from co-cultures with CD14+ cells during the first days of culture. Because CD34+ cell survival
does not rely on cell-cell contact but on factors that are secreted by CD14+ cells, we have tested the
effect of IL10 as a usual tissue resident macrophage secreted interleukin suspect on HSPC expansion
and survival by adding IL10 to CD34+ cells. However, no positive or negative effect was observed.
Because it was unknown what other survival factors are secreted by CD14+ cells, proteomic analyses
were performed on CD14+ monocytes supernatant of two donors cultured for 24 hours. From this
data we identified two interesting candidates: a ligand for IL33R, IL33, which modulates migration

Chapter 6
148
of hematopoietic stem cells (HSC)4, 5 and IL31, which has been shown to enhance HSPC survival in
mouse bone marrow6. In future, these mass spectrometry experiments should be repeated, using
supernatant of CD14+ cells cultured for two to three days.
Alternatively, CD34+ cells could be cultured in fractionated conditioned medium and tested on CD34+
cell survival, which limits the potential candidates from mass spectrometry. The effect of potential can-
didates identified in this screen should then be tested by adding these factors to CD34+ cell cultures
and/or using neutralizing antibodies while co-culturing CD34+ cells with CD14+ cells. Identification of
these factors allows for proper use in culture protocols for various lineages and could give hints to
underlying mechanisms of CD14+ cells on HSPC to better understand HSPC survival in the hemato-
poietic niche. Several potential candidates for HSPC survival have been reported, such as IL3, IL6, IL7,
IL11, FLT3L, TPO7-9. However, it is unknown if these candidates are secreted by our cultured cells, as
we did not identify these proteins in our preliminary proteomic analysis of CD14+ cell supernatant.
Interestingly, recently published data on monocyte subsets report that the intermediate subtype
may be transitional monocytes that display the phagocytic features of the classical monocytes and
the inflammatory characteristics of the non-classical monocytes10. These cells give the support to
hematopoietic cells as observed in this thesis and secrete TNF-a, IL-1B, IL6, IL8, and IL10 according
to others11-13. Although identification of unique specific growth factors, interleukins and chemokines
is important, the mode of action on hematopoietic cells will probably be a combination of several
agents and may be dependent on the differentiation stage of HSPC, making assignments of specific
growth factors to the observed biological effects a complex matter.
Interestingly, we also showed in chapter 2 that there is residual erythroid potential in CD34- cells from
PBMC (population E, which is also Lin-), probably because PBMC contain CD34- HSC, as has previously
been shown in cord blood14. Within the CD34- population, particular cells have the capacity to develop
into CD34+ cells within two days of culture and will further develop into erythroblasts1. Bhatia et al.
already showed in 1998 that Lin-CD34- cells are capable of long-term repopulation in severe combined
immunodeficiency (SCID) mice to multiple lineages and are therefore thought to be the most imma-
ture HSC in humans, also called SCID-repopulating cells (SRC)15. It is believed that these CD34- HSC
that are negative for HLA-DR, FLT3 and KIT, but positive for CD133 and GPI-80 can be mobilized by
G-CSF treatment in a similar fashion to G-CSF mobilized CD34+ cells15-19, which is in agreement with our
unpublished data that showed the presence of CD34-CD133+ cells in PBMC. In order to further opti-
mize the erythroid cultures, it would be interesting to examine the role of CD14+ cells on CD34- HSC
and investigate if CD14+ cells could also affect CD34- cell survival or support differentiation towards
CD34+ HSC. Although CD34+ cell cultures are stroma-independent, human Lin-CD34- cord blood or
bone marrow-derived cells could only been maintained in bone marrow stroma-dependent cultures
(i.e. HESS-5 cell lines) in which the cells gained the ability to form colonies while expression of CD34
was acquired. This indicates that the microenvironment including macrophages may give cues that
affect CD34- HSC20-23. Preliminary data was obtained on erythroid cultures from PBMC, PBMC depleted

General discussion
149
for CD34 (CD34-) or PBMC depleted for both CD34 and CD14 (CD34-CD14-). Erythroblast outgrowth
after 13 days of culture from CD34- cells was extremely low compared to total PBMC (4.5 to 16-fold
reduction in erythroblasts from CD34- cells). In addition, after 13 days of culture, CD34-CD14- cells do
hardly form erythroblasts compared to CD34- cells of the same donor (4-fold reduction). This suggests
that CD14+ cells also positively influence the erythroid yield from CD34- cells or indirectly affect CD34+
cells that develop from the CD34- cell population, which should be further investigated by short-term
cultures of two days. In conclusion, the data in chapter 2 showed that CD14+ cells increase CD34+ cell
survival and thereby increase the erythroid yield, however, it is unclear if the erythroid yield could be
further increased by a supportive role of CD14+ cells on CD34- cells that are also present in PBMC.
Upon culturing, we noticed that purified monocytes cultured in erythroblast expansion medium differ-
entiate towards tissue resident cells expressing CD14, CD16, CD163, CD169, CD206, and CXCR4 within
two to three days. Although we recently exchanged StemSpan for a serum/plasma-free GMP-grade
medium for erythroid cultures in chapter 3, this did not affect the phenotype and function of these
macrophages. Co-expression of CD169 on cultured CD14+ cells suggests that these cells might have
a dual role within the hematopoietic stem cell niche, as the CD169+ macrophages described by Chow
et al. are important for HSPC retention in the bone marrow3. However, this paper was focused on HSC
migration, and therefore no data on HSC survival rates in the bone marrow after CD169+ macrophage
ablation was obtained and remains to be investigated. Together, these data suggest that after trans-
plantation, CD14+ cells may be beneficial for the survival and retention of CD34+ HSPC in the bone
marrow. Interfering with macrophage functionality in the bone marrow to increase HSC mobilization
may produce a negative side effect on the survival of progenitors in the hematopoietic niche. If HSPC
survival is regulated by macrophages in vivo, this adds additional functionality to the already known
retention signals from CD169+ macrophages in the bone marrow, which are dependent on cell-cell
contact through VCAM13. Recently, it has been shown that HSC retention in the spleen of mice with
stress-induced erythropoiesis also occurs via VCAM1 on macrophages24. In chapter 4 and chapter
5 we showed that bone marrow macrophages consists of a heterogeneous pool, while macrophages
in the fetal liver are homogeneous. Isolating these two macrophage populations to assay their surviv-
al-inducing potential on CD34+ cells will be instrumental to examine if these functions are performed
by the same or different macrophages. In addition, more research is needed to investigate if these
two effects (survival and maintenance) can be functionally separated, maybe through understanding
the transcriptional regulation of the secreted factors and the adhesion molecules that have been
shown to be important in erythroblastic island formation.
Ex vivo and in vitro erythroblastic island macrophages
In our culture system the synthetic glucocorticoid dexamethasone is present to inhibit erythroblast
differentiation. During systemic decreases in oxygen pressure due to stress or high altitudes, the
erythroid system has a fast response in order to increase erythroid output by increasing EPO and
glucocorticoid levels25-28. In chapter 4 we have shown that glucocorticoids have a clear effect on

Chapter 6
150
monocyte differentiation. Whether the addition of dexamethasone is also involved in the survival
of HSPC mediated by the soluble factor(s) secreted from the monocytes during the first days of
the culture still needs to be investigated. Phenotypically, these cells remain CD14+CD16+CD163+C-
D169+CD206+CXCR4+ macrophages suggesting that dexamethasone is primarily involved in the first
steps of monocyte differentiation towards these specific supportive macrophages (GC-macrophages).
Proteomic analysis showed that GC-macrophages have an anti-inflammatory phenotype and are
distinct from the cells that were cultured in the absence of dexamethasone, which showed a more
pro-inflammatory profile. Furthermore, GC-macrophages shared the majority of their proteome
with human bone marrow and fetal liver macrophages as shown in chapter 5. We hypothesized
that elevated glucocorticoid levels may increase the number of erythroblastic island macrophages
during stress-induced erythropoiesis as a result of directed differentiation of monocyte populations
to regulate the increased erythroid output. Indeed, we show in chapter 4 that GC-macrophages bind
cultured erythroblasts and reticulocytes, and phagocytose the expelled erythroid nuclei and thereby
share phenotypical and functional characteristics with central macrophages in erythroblastic islands.
Falchi et al. already reported in 2015 that human CD34-derived erythroid cultures containing gluco-
corticoids contained a very small population (1-3%) of macrophages29. These CD163+ macrophages
were highly motile and showed interactions with erythroblasts as we also observed in CD14-derived
macrophages in chapter 4. In addition, these CD34-derived macrophages shared morphological
features with GC-macrophages. Interestingly, although we culture a homogeneous population of
CD169+ macrophages, Falchi et al. identified a CD169- macrophage population that established tight
interactions with erythroid cells, while the CD169+ macrophages have multiple rapid loose interactions
and promote erythroblast proliferation. Because this study used CD34+ cells as starting material
instead of CD14+ cells and they cultured the cells with an additional supplement (IL-3), it is unclear if
these CD169+ macrophage populations are similar to GC-macrophages30, 31.
In mice, it has been shown that in steady-state hematopoiesis erythroid-macrophage support is
occurring via VCAM1, whereas Ulyanova et al. observed that Vcam1-/- mice do not display a compro-
mised erythroid stress response in the spleen and bone marrow, despite significantly lower absolute
levels of macrophages in the spleen32. This fits the notion that macrophages themselves may not
be necessary for the proliferation and differentiation during erythropoiesis upon optimal growth
factors (increased EPO and glucocorticoid levels during anemic situations), which we also observe in
our cultures. In addition, another group reported that Spi-c-/- mice had decreased VCAM1 expressing
macrophages, however, erythropoiesis was normal at steady-state conditions32. Interestingly, our data
in chapter 5 showed that VCAM1 was only identified in fetal liver and bone marrow macrophages
and not in GC-macrophages, although we showed in chapter 4 that very low levels of VCAM1 were
detected by flow cytometry on GC-macrophages. This suggests that erythroblast interactions may
also occur VCAM1-independent. Whether another interaction like EMP, which was only identified in
GC-macrophages, substitutes for VCAM1 would need to be determined. Although GC-macrophages
have increased erythroid binding capacity, bind more erythroblasts per macrophage, have more
General discussion
151
interaction with different stages of erythroblasts in particular reticulocytes, and bind and phagocytose
pyrenocytes compared to cells that were not cultured in the presence of dexamethasone, future
studies should include cultures in suboptimal conditions with reduced growth factors levels. Because
of non-limiting growth factors in vitro, erythroid expansion occurs efficiently and independently of
macrophages, as showed in this thesis and previous work1, 33, 34. In vivo erythropoiesis is suboptimal
and hence niche cells, together with systemic increases in growth factor concentrations (e.g., EPO and
glucocorticoids), can provide a regulatory axis to quickly increase the erythroid output in response
to stress. This may explain why co-cultures of erythroblasts with CD14+ cells in EPO, SCF and dexa-
methasone had no additional effect on erythroid expansion compared to erythroblast cultures in
the absence of CD14+ cells (chapter 2). We hypothesize that reducing EPO levels in the cultures may
positively affect erythroblast proliferation upon co-culture with GC-macrophages. However, GC-mac-
rophages may also produce EPO. Fetal liver macrophages in preterm infants are the primary source
of EPO35 and as we show in chapter 5, GC-macrophages share many characteristics with fetal liver
macrophages. Indeed, preliminary data showed that EPO was identified in CD14+ monocyte super-
natant after 24 hours of culture, however, no additional proteomics was performed on supernatant
from GC-macrophages. In addition, removing all supplements from the medium could change the
phenotype and function of GC-macrophages and results would thus be difficult to interpret. Mac-
rophages may still provide ill-defined nuances to erythropoiesis that are currently not implemented
during in vitro cultures.
In chapter 4 we showed that both macrophages and erythroblasts express several adhesion mole-
cules that are described to be involved in erythroblast-macrophage binding. Further research into the
last stage of erythroid maturation could identify which interactions are essential for erythroid support
and which molecular mechanisms are involved, by using neutralizing antibodies against the adhesion
molecules on GC-macrophages or their ligands on erythroid cells. Knowledge about erythroid-mac-
rophage interactions could then be used to further optimize erythrocyte cultures, e.g., by coating
culture dishes with specific integrins that support erythroid maturation or enucleation. Besides a role
for macrophages in erythroid binding, erythroblastic island macrophages are also known to bind and
phagocytose the expelled erythroid nuclei, the pyrenocyte. Enucleation normally takes place in the
adult bone marrow where central macrophages immediately phagocytose pyrenocytes via MERTK in
mice36. In the same chapter, we showed that GC-macrophages not only express the TAM-family recep-
tors, but also other phagocytosing-associated receptors, which suggests that GC-macrophages have
the correct machinery to recognize and actively phagocytose pyrenocytes. Interestingly, the data in
chapter 5 showed that MERTK was present in all GC-macrophages, but was not identified in erythro-
blastic island macrophages in the bone marrow and only found in some fetal liver macrophages (1 out
of 3 donors). In addition, TIMD4 and another TAM-family member AXL were restricted to erythroblastic
island macrophages in the fetal liver and bone marrow. Taken together, the exact mechanism(s)
through which macrophages recognize erythroid cells but phagocytose pyrenocytes are ill-defined in
human erythropoiesis and should be further studied in detail. We showed in chapter 4 that especially

Chapter 6
152
MERTK expression is reduced by glucocorticoid receptor inhibition through mifepristone treatment.
In order to investigate the role of TAM-receptors (in particular MERTK) in phagocytosis of pyrenocytes
by macrophages, co-cultures of erythroid cells and GC-macrophages could be supplemented with
mifepristone. Preliminary data already revealed that erythroid-macrophages clusters are reduced
upon mifepristone treatment. Mifepristone has also been used in the clinic for various purposes,
e.g., abortion pill or treatment for uterine myoma37, 38. It would be interesting to see if this treatment
affects the amount or phenotype of bone marrow macrophages and specifically within erythroblastic
islands. In addition, patients with MERTK mutations have been associated with phagocytic-dependent
diseases, such as retinitis pigmentosa and autoimmune disorders like systemic lupus erythematosus
(SLE)39-41. Patients with SLE had reduced MERTK expressing CD14+CD16+ cells and because CD163
expression is positively correlated with MERTK expression, these cells have reduced expression of
CD163. Furthermore, several groups reported increased serum levels of soluble MERTK and AXL in
lupus patients, which suggests that increased soluble TAM-receptors reflect decreased expression
of these receptors on the cell membrane41-43. Interestingly, pyrenocytes have never been found in
peripheral blood or bone marrow in human individuals. This strengthens the hypothesis that macro-
phages have multiple mechanisms to phagocytose these highly immunogenic pyrenocytes, as defects
in clearance of pyrenocytes in both mouse (by triple TAM-receptor KO) and human is supposedly
detrimental to the body.
In chapter 3 we discussed the possibility of using human induced pluripotent stem cells (hIPSC) or
immortalized cell lines like HUDEP, HIDEP and BEL-A, as starting material to produce in vitro eryth-
rocytes for transfusion. However, erythroid cells derived from this material display low enucleation
rates44-46. In contrast, erythroid cells derived from CD34+ cells or PBMC have >90% enucleation,
independently of macrophages. Nevertheless, the addition of bone marrow macrophages or GC-mac-
rophages to these cultures may still be beneficial for reticulocyte stability. Merryweather-Clarke et
al. reported that erythroid cells from hIPSC follow an embryonic or primitive program (e.g., high
expression of HBA, HBZ, ARID3A and low expression of SOX6, MYB, BCL11A), and thus macrophages
could indeed play a supporting role in enucleation47. Studies by Douays group showed that nucle-
ated hIPSC-derived erythroid cells undergo enucleation upon injection into mice48-50. However, these
experiments have never been reproduced and it is unknown where enucleation takes place after
transfusion. It is therefore crucial to know what drives erythroid cell enucleation and via which mech-
anisms pyrenocytes are cleared from the system. Interestingly, we noticed in chapter 4 that the
nuclei within erythroid cells all polarize towards the GC-macrophages. Understanding this polarity
may also be important to increase the enucleation rate of erythroid cultures from immortalized cell
lines. Erythroblast enucleation requires PI3K-dependent cell polarization, resulting in highly localized
phospholipids PtdIns(3,4)P2 and PtdIns(3,4,5)P3 at the cytoplasmic side of the plasma membrane.
However, this process occurs independent of macrophages51. Whether a polarized lipid composi-
tion contributes to the specific alignment of erythroid cells and whether this is further regulated by
macrophages remains to be determined. Moreover, nuclei polarization has been reported to be

General discussion
153
TRIM58 dependent52. TRIM58 is a E3 ubiquitin ligase superfamily member transcriptionally activated
by GATA1 prior to enucleation in mice. It has been linked to human erythrocyte traits53-55 and regulates
polarization and extrusion of mouse erythroblast nuclei in vitro via dynein and kinesins. However,
Thom et al. showed that TRIM58 does not affect erythroblast proliferation, survival, hemoglobiniza-
tion and expression of erythroid markers52. In addition, this group proposed that purification of CC1
protein could disengage aberrantly retained dynein from the nucleus of TRIM58 KO erythroblasts
and thereby may rescue enucleation (unpublished data by Thom et al.). More research is required
to investigate if TRIM58 or KIF5B also plays a role in human terminal differentiation and if the use
of GC-macrophages could support terminal differentiation. The work in this chapter provides an
excellent accessible human model system to understand how macrophages promote erythroid cells
during all stages of erythropoiesis.
In vivo, macrophages are important in regulating erythropoiesis both in adults and during develop-
ment, however, molecular markers that discriminate the different macrophage populations from
fetal liver and bone marrow are ill-defined, making isolation and further study difficult. In chapter 4
we performed a phenotypical comparison between GC-macrophages and CD163+ macrophages iso-
lated from bone marrow and fetal liver and in chapter 5 we compared the proteome of these three
erythroblastic island macrophage populations. For the first time, we show that erythroblastic island
macrophages from human fetal liver and bone marrow share a highly similar proteomic profile with
cultured monocyte-derived GC-macrophages. This raises the question if glucocorticoid treatment
not only increases erythroblast expansion in the bone marrow, but also increases the number of
erythroblastic island macrophages and thereby affect the erythroid yield. Indeed, Ulyanova et al.
showed that upon stress erythropoiesis in mice the number of splenic macrophages were increased.
However, there was no effect on macrophage numbers in the bone marrow32. In addition, it should
be investigated if glucocorticoids are required for central macrophage differentiation using gluco-
corticoid receptor (GR) knockout or Grdim/dim mice. For decades it was believed that all macrophages
originate from monocytes56. However, recent studies showed that most resident macrophages are
maintained independently of monocytes as lung, splenic red pulp, peritoneum, and bone marrow
tissue resident macrophages rely on self-renewal in steady-state conditions57. Contradictory results
have been shown by Landsman et al. who showed that in lungs adoptively transferred monocytes
contribute to and replace lung macrophages after depletion58, 59. In addition, Theurl et al. showed
an on-demand mechanism that allows for a fast but transient increase of Kupffer-like cells that are
derived from classical monocytes60. This opens up a whole new scenario through which specific
macrophages originate from different sources depending on the need of a specific tissue or process.
It also raises many questions about the role of fetal liver macrophages after birth, will they differen-
tiate towards Kupffer cells, do they undergo apoptosis, or do they migrate to the bone marrow and
maintain their function as central macrophages in erythroblastic islands? In addition, the transient
monocyte differentiation to supplement existing tissue resident pools of macrophages may also be
present in other tissues in response to stress, which could explain why GC-macrophages derived

Chapter 6
154
from monocytes could phenotypically and functionally resemble resident macrophages from the
bone marrow or fetal liver when mimicking stress erythropoiesis by the presence of glucocorticoids.
Glucocorticoid treatment of patients with autoimmune uveitis is associated with an enrichment of
CD14++CD16+ intermediate monocytes, however, endogenous glucocorticoid production may also
affect the treatment itself61. Specific red cell diseases have been described to be associated with
glucocorticoid signaling. Cushing’s syndrome is characterized by increased glucocorticoid levels and
erythrocytosis62, while Diamond-Blackfan anemia patients are treated with glucocorticoids to alleviate
their anemia63, 64. In addition, it has been shown that erythroblasts from polycythemia vera patients
that are characterized by erythrocytosis have a specific isoform of the glucocorticoid receptor (GR-β),
which is less responsive to glucocorticoids65. This suggests that glucocorticoids may also increase
erythrocyte numbers by increased erythroblastic islands and not only by erythroblast expansion.
In chapter 4 and chapter 5 we showed that CD163+ bone marrow macrophages are a heteroge-
neous population containing CD163dim and CD163high cells. Although purification by MACS isolation
enriched for CD163high macrophages, proteomic analysis data in chapter 5 showed that the correla-
tion between all bone marrow donors was lower compared to macrophages from the fetal liver or
cultured GC-macrophages. On the other hand, a single CD163+ macrophage population was observed
in fetal liver, and this population shared 83% of the identified proteins with CD163high macrophages
from the bone marrow. Previous studies reported heterogeneity in bone marrow macrophages66, 67
and our preliminary data indicate that CD163dim macrophages are more immature and do not express
tissue resident markers like VCAM1. Differences in marker expression of macrophages derived from
both organs observed in chapter 4 could thus be due to the heterogeneity in the bone marrow
population. Although the fetal liver is primarily performing erythropoiesis at week 9-24 of embryonic
development, it would be interesting to analyze fetal liver material <9 weeks in order to see when
CD163+ macrophages first arise during development and how this relates to erythroid development.
A study by Slayton et al. showed that already after 5 to 6 weeks after conception, human CD68+
macrophages are found in the fetal liver parenchyma and hepatic sinusoids68, while the first HSC
arise in the aorta-gonad-mesophrenos (AGM) region around week 4 post conception. This indicates
that fetal liver macrophages could be derived from HSC and/or from the yolk sac, even though flow
cytometry data in chapter 4 clearly showed a homogeneous macrophage population in the fetal liver
between week 15 and 22 of development. An important question that remains is how we should
characterize and discriminate between macrophages. The discrimination of M1 and M2 macrophages
is outdated as many studies showed that there are many macrophage subsets. Indeed, a proteomic
study by Brown et al. showed that the majority of the proteome between LPS- or IFNγ-induced M1
macrophages is similar, although the specific macrophage function is clearly different69. The majority
of proteins that were restricted to LPS- or IFNγ-induced M1 macrophages in this study were even
identified in our proteomics data of erythroblastic island macrophages in chapter 5, while CD163+
bone marrow, fetal liver and GC-macrophages all have a M2 profile. This makes the identification and
discrimination of macrophage subsets even more complex. It is therefore difficult to say what defines
General discussion
155
a macrophage subset. Macrophage polarization may be a gradual process, because macrophages
easily adapt to their microenvironment and change their functionality based on the need. Single cell
RNA-sequencing might discriminate between different origin of macrophages and may give new cues
on how to discriminate between the different subsets.
From in vitro red cell generation to a transfusion product
Protocols to culture red blood cells for transfusion purposes have been existing for a long time,
however, current attempts were still hampered by a low yield and incomplete differentiation to fully
biconcave erythrocytes70-78. The majority of the existing large-scale red blood cell cultures uses CD34+
cells derived from PBMC, cord blood or bone marrow79, while a minority uses PBMC as starting mate-
rial. It has been shown that the erythroid yield from PBMC is 10-15 increased compared to CD34+
cells1. Furthermore, some culture systems use glucocorticoids to induce erythroblasts to proliferate
whilst inhibiting differentiation, which has been shown over the last years in the group of Beug, von
Lindern, van den Akker and Migliaccio and others1, 33, 34, 80-82. In 2010, Migliaccio et al. showed massive
expansion of PBMC-derived erythroblasts using SCF, EPO, IL3 and dexamethasone or estradiol in
serum-free culture conditions81. However, only few large-scale cell studies use glucocorticoids with-
out the addition of serum and/or plasma, which directly differentiates erythroblasts and negates the
effect of glucocorticoids as shown in chapter 3. In 2002, the group of Douay reported the use of
cord blood-derived CD34+ for erythroid cultures using serum-free medium with BSA, ferric nitrate,
transferrin, insulin, lipids, hydrocortisone and additional supplements during culture (e.g., day 0-7:
FLT3, TPO, SCF; day 8-14: SCF, EPO, IGF1; day 15-22: EPO, IGF1). However, only 4% of these cells
enucleated after 17 days and they mainly expressed fetal hemoglobin48. The same group optimized
their protocol for CD34+ cells in 2005, by adding EPO and plasma during the entire culture, and IL3
during the first days of culture and removing FLT3 and TPO from the culture system. In addition, only
during the expansion phase hydrocortisone was used. Subsequently, cells were co-cultured with
stromal cells (e.g., mouse MS5 or human MSC) towards 90-100% enucleated reticulocytes without
the addition of additional cytokines, whereas only 2% enucleation was observed in the absence of
stromal cells83. Other studies also used stromal cell lines to culture red blood cells ex vivo84-86, however,
these methods are not feasible for routine red blood cell production. In 2011, the group of Douay
adapted their previously published protocol and reported that they could generate 68% enucleated
reticulocytes without stromal support. Interestingly, they were the first to report in-human blood
transfusion of around 14mL of cultured red blood cells (theoretically their cultures yield 3.6-27mL
of packed red cells per 10.000 CD34+ cells)87. However, the culture system described by this group is
also not feasible for large-scale red cell production, as it contains plasma and uses CD34+ cells after
G-CSF mobilization as starting material. A study by Griffiths et al. showed that 5mL of packed enucle-
ated red blood cells could be generated from PBMC-derived CD34+ cells albeit serum and/or plasma
was needed during these cultures88. Recently, the same group showed that under GMP conditions
but still including serum, CD34+ cells derived from both PBMC and cord blood could be cultured and
differentiated (>105 amplification) towards 60-63% enucleated reticulocytes, yielding around 10mL
Chapter 6
156
of packed red cells after filtering89. Another recent study by Zhang et al. optimized culture conditions
and developed a bottle turning device culture system for cord blood-derived CD34+ cell cultures to
generate red blood cells with a 50% enucleation rate90. In addition, these cultures also contain fetal
bovine serum. In contrast, Timmins et al. demonstrated in 2011 an ultra-high-yield of red blood cells
with >90% enucleation rate from cord blood-derived CD34+ cells in the absence of plasma and glu-
cocorticoids91. This group also used a 1L bioreactor to increase the erythroid yield.
In chapter 3 we described a three-stage culture system to generate around 25mL of packed red
cells from PBMC. We optimized existing erythroid cultures, by exchanging the commercial, propri-
ety-non-defined and expensive StemSpan for inexpensive completely characterized GMP-grade
medium. PBMC were used as starting material, because we showed in chapter 2 that CD14+ cells in
PBMC increase the erythroid yield by supporting CD34+ cell survival. In addition, starting from PBMC
dispenses the extremely expensive CD34 isolation scheme. Replacing plasma and serum for stripped
human serum albumin during the expansion phase maintained erythroblasts for a prolonged period
(>26 days), whilst inhibiting terminal differentiation. Removal of SCF and dexamethasone, increasing
the concentration of EPO and holotransferrin, and the addition of omniplasma and heparin differ-
entiates erythroblasts towards >90% fully enucleated cultured red blood cells that express adult
hemoglobin and maintain blood group expression. We are currently investigating if we can exchange
the addition of omniplasma during the last stage of erythroid differentiation for plasma-free supple-
ments by aiming to identify the components in plasma that allows efficient differentiation (e.g., using
PEG precipitation and plasma fractionation). As plasma not only contains proteins, but also lipids
and steroids, heat inactivation will determine if proteins in plasma are important for enucleation.
In addition, lipidomics on cultured red blood cells and freshly isolated red blood cells will give clues
to the differences in plasma membrane composition, which may need to be amended to further
resemble in vivo erythrocytes. Besides, routine red blood cell production in culture dishes will be
infeasible. Therefore, erythroblasts were expanded and differentiated in G-Rex bioreactors in order
to meet the required amount of red cells for one unit of packed red blood cells. A draw-back of the
currently used bioreactor remains in scalability, as these bioreactors are not provided with a capacity
over 5L due to physical constraints and are very costly if multiple G-Rex culture systems were to be
employed. Therefore, we currently focus on the design of a novel bioreactor.
Another disadvantage of our culture method described in chapter 3 is that people still have to donate
blood in order to start red cell cultures, which is in particularly invasive when anemic patient-specific
blood has to be used. Therefore, it would be more convenient to start with an immortal source, such
as hIPSC or immortalized cell lines. Recently, a human immortalized adult erythroid cell line (Bristol
Erythroid Line Adult, or BEL-A) was generated by transducing CD34+ cells from adult bone marrow
with a Tet-inducible HPV16-E6/E7 construct46. These cells have similar progression to the erythroid
pathway and erythroblast expansion compared to CD34+ cells from peripheral blood. However, the
enucleation rates are still around 30%. Using BEL-A cell lines for large-scale erythroid cultures requires

General discussion
157
further optimization of the enucleation and reticulocyte stability. Data from others and unpublished
data from our group showed that hIPSC can be generated from human cultured erythroblasts using
the Yamanaka lentiviral factor set Oct4, Sox2, c-Myc, and Klf4 or episomal reprogramming92, 93. By
generating embryoid bodies or using the more efficient single cell cultures, pluripotent cells can be
further directed towards erythroid cells94, 95 (and unpublished data by Varga et al.). However, these hIP-
SC-derived erythroid cells still express fetal hemoglobin. Transfusions with erythroid cells expressing
fetal hemoglobin would not immediately be detrimental, as patients with persistent fetal hemoglobin
do not show any phenotype96. Interestingly, patients with sickle cell disease and thalassemia could
even benefit from transfusions with high fetal hemoglobin expression in the erythroid cells, as this
could immediately reduce the symptoms caused by mutated adult hemoglobin. Recently, the group
of Maryeux performed proteomic analysis on cultured human erythroid cells97. Additional RNA-se-
quencing of erythroid cell cultures during differentiation will further add as a control to flow cytometry
and functional assays, but was not ready for analysis upon writing this thesis. However as indicated,
hIPSC-derived erythroid cells have poor enucleation rates, which will be the focus of future research.
Knowledge of erythroid-macrophage interactions may provide an approach to study this, e.g., by
co-cultures of hIPSC with GC-macrophages. In addition, reticulocytes that enter the bloodstream
will further differentiate towards erythrocytes in vivo, therefore, we possibly do not need biconcave
erythrocytes as a transfusion product. However, this can only be properly tested in a clinical trial and
therefore still allows research to focus on the differentiation of reticulocytes towards erythrocytes.
It is still very expensive to produce an in vitro transfusion product and the costs to produce 25mL
of cRBC, though difficult to assess at the moment, would be approximately 100.000 euro per prod-
uct. Major cost drivers are holotransferrin, SCF and EPO. However, these costs may be significantly
decreased if in-house developed recombinant versions are produced, which might reduce the costs
to approximately 5.500 euro per product. This is in the range of a unit rare blood from the frozen
blood bank of 3.676 euro. The synchronized cultures all contain young reticulocytes that have a the-
oretical lifespan of about 120 days. Chronic anemia patients that receive blood transfusions every
two months may benefit from transfusion with in vitro cultured long-lived erythrocytes, potentially
increasing the time between transfusions and thereby reducing the costs. A clinical trial will allow to
test the in vivo lifespan of transfused PBMC-derived reticulocytes and investigate the optimal period
of repeated transfusions, because transfused patients could experience a rapid drop in hemoglobin
when erythrocytes die around the same period.
The data in this thesis provide evidence that macrophages are crucial during human erythropoiesis
and positively influence erythroid cell cultures. We have provided new tools to study the role of mac-
rophages during erythropoiesis in depth, by tracking hematopoietic stem cell differentiation towards
erythropoiesis showing that macrophages support the survival of HSPC. Furthermore, these macro-
phages functionally and phenotypically resemble erythroblastic island macrophages from fetal liver
and bone marrow and can be used as a human model to study erythroid-macrophage interactions.

Chapter 6
158
Altogether, we have unraveled important mechanisms of erythroid-supporting macrophages, which
can be applied to current protocols to optimize in vitro production of red blood cells. We are currently
ready to start phase I clinical trials with 25mL of autologous blood from healthy individuals using
PBMC as starting material. However, in future, we expect to generate universal donor red blood cells
derived from hIPSC or other immortalized cell lines. CRISPR/Cas9 may be used to remove immuno-
genic features like blood groups that are not necessary for the functionality of the cells, such as Kel,
Kidd and Duffy. Both patients in need of regular blood transfusions as well as patients that need a
single blood transfusion after blood loss may then be transfused with in vitro cultured red blood cells.

General discussion
159
References
1. van den Akker E, Satchwell TJ, Pellegrin S, Daniels G, Toye AM. The majority of the in vitro erythroid expansion potential resides
in CD34(-) cells, outweighing the contribution of CD34(+) cells and significantly increasing the erythroblast yield from peripheral
blood samples. Haematologica. 2010;95(9):1594-1598.
2. Ziegler-Heitbrock L, Ancuta P, Crowe S, et al. Nomenclature of monocytes and dendritic cells in blood. Blood. 2010;116(16):e74-
80.
3. Chow A, Lucas D, Hidalgo A, et al. Bone marrow CD169+ macrophages promote the retention of hematopoietic stem and
progenitor cells in the mesenchymal stem cell niche. J Exp Med. 2011;208(2):261-271.
4. Yagami A, Orihara K, Morita H, et al. IL-33 mediates inflammatory responses in human lung tissue cells. J Immunol.
2010;185(10):5743-5750.
5. Kim J, Kim W, Le HT, et al. IL-33-induced hematopoietic stem and progenitor cell mobilization depends upon CCR2. J Immunol.
2014;193(7):3792-3802.
6. Broxmeyer HE, Li J, Hangoc G, et al. Regulation of myeloid progenitor cell proliferation/survival by IL-31 receptor and IL-31. Exp
Hematol. 2007;35(4 Suppl 1):78-86.
7. Buza-Vidas N, Antonchuk J, Qian H, et al. Cytokines regulate postnatal hematopoietic stem cell expansion: opposing roles of
thrombopoietin and LNK. Genes Dev. 2006;20(15):2018-2023.
8. Nandurkar HH, Robb L, Tarlinton D, Barnett L, Kontgen F, Begley CG. Adult mice with targeted mutation of the interleukin-11
receptor (IL11Ra) display normal hematopoiesis. Blood. 1997;90(6):2148-2159.
9. Testa U, Fossati C, Samoggia P, et al. Expression of growth factor receptors in unilineage differentiation culture of purified
hematopoietic progenitors. Blood. 1996;88(9):3391-3406.
10. Mukherjee R, Kanti Barman P, Kumar Thatoi P, Tripathy R, Kumar Das B, Ravindran B. Non-Classical monocytes display inflam-
matory features: Validation in Sepsis and Systemic Lupus Erythematous. Sci Rep. 2015;5:13886.
11. Cros J, Cagnard N, Woollard K, et al. Human CD14dim monocytes patrol and sense nucleic acids and viruses via TLR7 and TLR8
receptors. Immunity. 2010;33(3):375-386.
12. Ward JR, West PW, Ariaans MP, et al. Temporal interleukin-1beta secretion from primary human peripheral blood monocytes
by P2X7-independent and P2X7-dependent mechanisms. J Biol Chem. 2010;285(30):23147-23158.
13. Wong KL, Tai JJ, Wong WC, et al. Gene expression profiling reveals the defining features of the classical, intermediate, and non-
classical human monocyte subsets. Blood. 2011;118(5):e16-31.
14. Matsuoka Y, Sumide K, Kawamura H, et al. Human cord blood-derived primitive CD34-negative hematopoietic stem cells (HSCs)
are myeloid-biased long-term repopulating HSCs. Blood Cancer J. 2015;5:e290.
15. Bhatia M, Bonnet D, Murdoch B, Gan OI, Dick JE. A newly discovered class of human hematopoietic cells with SCID-repopulating
activity. Nat Med. 1998;4(9):1038-1045.
16. Sonoda Y. Immunophenotype and functional characteristics of human primitive CD34-negative hematopoietic stem cells: the
significance of the intra-bone marrow injection. J Autoimmun. 2008;30(3):136-144.
17. Takahashi M, Matsuoka Y, Sumide K, et al. CD133 is a positive marker for a distinct class of primitive human cord blood-derived
CD34-negative hematopoietic stem cells. Leukemia. 2014;28(6):1308-1315.
18. Matsuoka Y, Sumide K, Kawamura H, Nakatsuka R, Fujioka T, Sonoda Y. GPI-80 expression highly purifies human cord blood-de-
rived primitive CD34-negative hematopoietic stem cells. Blood. 2016;128(18):2258-2560.
19. Matsuoka Y, Takahashi M, Sumide K, et al. CD34 Antigen and the MPL Receptor Expression Defines a Novel Class of Human
Cord Blood-Derived Primitive Hematopoietic Stem Cells. Cell Transplant. 2017;26(6):1043-1058.
20. Goodell MA, Brose K, Paradis G, Conner AS, Mulligan RC. Isolation and functional properties of murine hematopoietic stem cells
that are replicating in vivo. J Exp Med. 1996;183(4):1797-1806.
21. Fujisaki T, Berger MG, Rose-John S, Eaves CJ. Rapid differentiation of a rare subset of adult human lin(-)CD34(-)CD38(-) cells
stimulated by multiple growth factors in vitro. Blood. 1999;94(6):1926-1932.
22. Nakamura Y, Ando K, Chargui J, et al. Ex vivo generation of CD34(+) cells from CD34(-) hematopoietic cells. Blood. 1999;94(12):4053-
4059.
23. Nakamura Y, Yahata T, Muguruma Y, et al. Angiopoietin-1 supports induction of hematopoietic activity in human CD34- bone
marrow cells. Exp Hematol. 2007;35(12):1872-1883.
24. Dutta P, Hoyer FF, Grigoryeva LS, et al. Macrophages retain hematopoietic stem cells in the spleen via VCAM-1. J Exp Med.
2015;212(4):497-512.
25. Humpeler E, Skrabal F, Bartsch G. Influence of exposure to moderate altitude on the plasma concentraton of cortisol, aldoste-
rone, renin, testosterone, and gonadotropins. Eur J Appl Physiol Occup Physiol. 1980;45(2-3):167-176.

Chapter 6
160
26. Bauer A, Tronche F, Wessely O, et al. The glucocorticoid receptor is required for stress erythropoiesis. Genes Dev.
1999;13(22):2996-3002.
27. Kodama T, Shimizu N, Yoshikawa N, et al. Role of the glucocorticoid receptor for regulation of hypoxia-dependent gene expres-
sion. J Biol Chem. 2003;278(35):33384-33391.
28. Jelkmann W. Physiology and pharmacology of erythropoietin. Transfus Med Hemother. 2013;40(5):302-309.
29. Falchi M, Varricchio L, Martelli F, et al. Dexamethasone targeted directly to macrophages induces macrophage niches that
promote erythroid expansion. Haematologica. 2015;100(2):178-187.
30. Ebner S, Hofer S, Nguyen VA, et al. A novel role for IL-3: human monocytes cultured in the presence of IL-3 and IL-4 differ-
entiate into dendritic cells that produce less IL-12 and shift Th cell responses toward a Th2 cytokine pattern. J Immunol.
2002;168(12):6199-6207.
31. Suzuki H, Katayama N, Ikuta Y, et al. Activities of granulocyte-macrophage colony-stimulating factor and interleukin-3 on mono-
cytes. Am J Hematol. 2004;75(4):179-189.
32. Ulyanova T, Phelps SR, Papayannopoulou T. The macrophage contribution to stress erythropoiesis: when less is enough. Blood.
2016;128(13):1756-1765.
33. Leberbauer C, Boulme F, Unfried G, Huber J, Beug H, Mullner EW. Different steroids co-regulate long-term expansion versus
terminal differentiation in primary human erythroid progenitors. Blood. 2005;105(1):85-94.
34. von Lindern M, Deiner EM, Dolznig H, et al. Leukemic transformation of normal murine erythroid progenitors: v- and c-ErbB act
through signaling pathways activated by the EpoR and c-Kit in stress erythropoiesis. Oncogene. 2001;20(28):3651-3664.
35. Ohls RK, Li Y, Trautman MS, Christensen RD. Erythropoietin production by macrophages from preterm infants: implications
regarding the cause of the anemia of prematurity. Pediatr Res. 1994;35(2):169-170.
36. Toda S, Segawa K, Nagata S. MerTK-mediated engulfment of pyrenocytes by central macrophages in erythroblastic islands.
Blood. 2014;123(25):3963-3971.
37. Creinin M, Blumenthal P, Shulman L. Mortality associated with mifepristone-misoprostol medical abortion. MedGenMed.
2006;8(2):26.
38. Seth S, Goel N, Singh E, Mathur AS, Gupta G. Effect of mifepristone (25 mg) in treatment of uterine myoma in perimenopausal
woman. J Midlife Health. 2013;4(1):22-26.
39. Al-Khersan H, Shah KP, Jung SC, Rodriguez A, Madduri RK, Grassi MA. A novel MERTK mutation causing retinitis pigmentosa.
Graefes Arch Clin Exp Ophthalmol. 2017;255(8):1613-1619.
40. Cheong HS, Lee SO, Choi CB, Sung YK, Shin HD, Bae SC. MERTK polymorphisms associated with risk of haematological disorders
among Korean SLE patients. Rheumatology (Oxford). 2007;46(2):209-214.
41. Zhu H, Sun X, Zhu L, et al. The expression and clinical significance of different forms of Mer receptor tyrosine kinase in systemic
lupus erythematosus. J Immunol Res. 2014;2014:431896.
42. Zizzo G, Guerrieri J, Dittman LM, Merrill JT, Cohen PL. Circulating levels of soluble MER in lupus reflect M2c activation of mono-
cytes/macrophages, autoantibody specificities and disease activity. Arthritis Res Ther. 2013;15(6):R212.
43. Ballantine L, Midgley A, Harris D, Richards E, Burgess S, Beresford MW. Increased soluble phagocytic receptors sMer, sTyro3
and sAxl and reduced phagocytosis in juvenile-onset systemic lupus erythematosus. Pediatr Rheumatol Online J. 2015;13:10.
44. Lapillonne H, Kobari L, Mazurier C, et al. Red blood cell generation from human induced pluripotent stem cells: perspectives
for transfusion medicine. Haematologica. 2010;95(10):1651-1659.
45. Kurita R, Suda N, Sudo K, et al. Establishment of immortalized human erythroid progenitor cell lines able to produce enucleated
red blood cells. PLoS One. 2013;8(3):e59890.
46. Trakarnsanga K, Griffiths RE, Wilson MC, et al. An immortalized adult human erythroid line facilitates sustainable and scalable
generation of functional red cells. Nat Commun. 2017;8:14750.
47. Merryweather-Clarke AT, Tipping AJ, Lamikanra AA, et al. Distinct gene expression program dynamics during erythropoiesis from
human induced pluripotent stem cells compared with adult and cord blood progenitors. BMC Genomics. 2016;17(1):817.
48. Neildez-Nguyen TM, Wajcman H, Marden MC, et al. Human erythroid cells produced ex vivo at large scale differentiate into red
blood cells in vivo. Nat Biotechnol. 2002;20(5):467-472.
49. Mazurier C, Douay L, Lapillonne H. Red blood cells from induced pluripotent stem cells: hurdles and developments. Curr Opin
Hematol. 2011;18(4):249-253.
50. Kobari L, Yates F, Oudrhiri N, et al. Human induced pluripotent stem cells can reach complete terminal maturation: in vivo and
in vitro evidence in the erythropoietic differentiation model. Haematologica. 2012;97(12):1795-1803.
51. Wang J, Ramirez T, Ji P, Jayapal SR, Lodish HF, Murata-Hori M. Mammalian erythroblast enucleation requires PI3K-dependent
cell polarization. J Cell Sci. 2012;125(Pt 2):340-349.
52. Thom CS, Traxler EA, Khandros E, et al. Trim58 degrades Dynein and regulates terminal erythropoiesis. Dev Cell. 2014;30(6):688-
700.

General discussion
161
53. van der Harst P, Zhang W, Mateo Leach I, et al. Seventy-five genetic loci influencing the human red blood cell. Nature.
2012;492(7429):369-375.
54. Kamatani Y, Matsuda K, Okada Y, et al. Genome-wide association study of hematological and biochemical traits in a Japanese
population. Nat Genet. 2010;42(3):210-215.
55. Gieger C, Radhakrishnan A, Cvejic A, et al. New gene functions in megakaryopoiesis and platelet formation. Nature.
2011;480(7376):201-208.
56. van Furth R, Cohn ZA. The origin and kinetics of mononuclear phagocytes. J Exp Med. 1968;128(3):415-435.
57. Hashimoto D, Chow A, Noizat C, et al. Tissue-resident macrophages self-maintain locally throughout adult life with minimal
contribution from circulating monocytes. Immunity. 2013;38(4):792-804.
58. Landsman L, Varol C, Jung S. Distinct differentiation potential of blood monocyte subsets in the lung. J Immunol. 2007;178(4):2000-
2007.
59. Landsman L, Jung S. Lung macrophages serve as obligatory intermediate between blood monocytes and alveolar macrophages.
J Immunol. 2007;179(6):3488-3494.
60. Theurl I, Hilgendorf I, Nairz M, et al. On-demand erythrocyte disposal and iron recycling requires transient macrophages in the
liver. Nat Med. 2016;22(8):945-951.
61. Liu B, Dhanda A, Hirani S, et al. CD14++CD16+ Monocytes Are Enriched by Glucocorticoid Treatment and Are Functionally
Attenuated in Driving Effector T Cell Responses. J Immunol. 2015;194(11):5150-5160.
62. Miljic P, Miljic D, Cain JW, Korbonits M, Popovic V. Pathogenesis of vascular complications in Cushing’s syndrome. Hormones
(Athens). 2012;11(1):21-30.
63. Gasser C. [Aplastic anemia (chronic erythroblastophthisis) and cortisone]. Schweiz Med Wochenschr. 1951;81(50):1241-1242.
64. Vlachos A, Ball S, Dahl N, et al. Diagnosing and treating Diamond Blackfan anaemia: results of an international clinical consensus
conference. Br J Haematol. 2008;142(6):859-876.
65. Varricchio L, Masselli E, Alfani E, et al. The dominant negative beta isoform of the glucocorticoid receptor is uniquely expressed
in erythroid cells expanded from polycythemia vera patients. Blood. 2011;118(2):425-436.
66. Chow A, Huggins M, Ahmed J, et al. CD169(+) macrophages provide a niche promoting erythropoiesis under homeostasis and
stress. Nat Med. 2013;19(4):429-436.
67. Gordon S, Pluddemann A, Martinez Estrada F. Macrophage heterogeneity in tissues: phenotypic diversity and functions. Immunol
Rev. 2014;262(1):36-55.
68. Slayton WB, Juul SE, Calhoun DA, Li Y, Braylan RC, Christensen RD. Hematopoiesis in the liver and marrow of human fetuses at 5
to 16 weeks postconception: quantitative assessment of macrophage and neutrophil populations. Pediatr Res. 1998;43(6):774-
782.
69. Brown J, Wallet MA, Krastins B, Sarracino D, Goodenow MM. Proteome bioprofiles distinguish between M1 priming and activation
states in human macrophages. J Leukoc Biol. 2010;87(4):655-662.
70. Migliaccio AR, Whitsett C, Migliaccio G. Erythroid cells in vitro: from developmental biology to blood transfusion products. Curr
Opin Hematol. 2009;16(4):259-268.
71. Migliaccio AR, Masselli E, Varricchio L, Whitsett C. Ex-vivo expansion of red blood cells: how real for transfusion in humans? Blood
Rev. 2012;26(2):81-95.
72. Migliaccio AR, Grazzini G, Hillyer CD. Ex vivo generated red cells as transfusion products. Stem Cells Int. 2012;2012:615412.
73. Migliaccio AR, Palis J. Blood in a dish: In vitro synthesis of red blood cells. Drug Discov Today Dis Mech. 2011;8(1-2):e3-e8.
74. Shah S, Huang X, Cheng L. Concise review: stem cell-based approaches to red blood cell production for transfusion. Stem Cells
Transl Med. 2014;3(3):346-355.
75. Kim HO. In-vitro stem cell derived red blood cells for transfusion: are we there yet? Yonsei Med J. 2014;55(2):304-309.
76. Larochelle A. Generation of red blood cells in vitro: monitoring the process for improved efficiency. Cytotherapy. 2013;15(9):1043-
1045.
77. Migliaccio AR, Whitsett C, Papayannopoulou T, Sadelain M. The potential of stem cells as an in vitro source of red blood cells for
transfusion. Cell Stem Cell. 2012;10(2):115-119.
78. Singh VK, Saini A, Tsuji K, Sharma PB, Chandra R. Manufacturing blood ex vivo: a futuristic approach to deal with the supply and
safety concerns. Front Cell Dev Biol. 2014;2:26.
79. Stella CC, Cazzola M, De Fabritiis P, et al. CD34-positive cells: biology and clinical relevance. Haematologica. 1995;80(4):367-387.
80. Carotta S, Pilat S, Mairhofer A, et al. Directed differentiation and mass cultivation of pure erythroid progenitors from mouse
embryonic stem cells. Blood. 2004;104(6):1873-1880.
81. Migliaccio G, Sanchez M, Masiello F, et al. Humanized culture medium for clinical expansion of human erythroblasts. Cell Trans-
plant. 2010;19(4):453-469.
82. Migliaccio G, Di Pietro R, di Giacomo V, et al. In vitro mass production of human erythroid cells from the blood of normal donors
and of thalassemic patients. Blood Cells Mol Dis. 2002;28(2):169-180.

Chapter 6
162
83. Giarratana MC, Kobari L, Lapillonne H, et al. Ex vivo generation of fully mature human red blood cells from hematopoietic stem
cells. Nat Biotechnol. 2005;23(1):69-74.
84. Baek EJ, Kim HS, Kim S, Jin H, Choi TY, Kim HO. In vitro clinical-grade generation of red blood cells from human umbilical cord
blood CD34+ cells. Transfusion. 2008;48(10):2235-2245.
85. Fujimi A, Matsunaga T, Kobune M, et al. Ex vivo large-scale generation of human red blood cells from cord blood CD34+ cells by
co-culturing with macrophages. Int J Hematol. 2008;87(4):339-350.
86. Xi J, Li Y, Wang R, et al. In vitro large scale production of human mature red blood cells from hematopoietic stem cells by cocul-
turing with human fetal liver stromal cells. Biomed Res Int. 2013;2013:807863.
87. Giarratana MC, Rouard H, Dumont A, et al. Proof of principle for transfusion of in vitro-generated red blood cells. Blood.
2011;118(19):5071-5079.
88. Griffiths RE, Kupzig S, Cogan N, et al. Maturing reticulocytes internalize plasma membrane in glycophorin A-containing vesicles
that fuse with autophagosomes before exocytosis. Blood. 2012;119(26):6296-6306.
89. Kupzig S, Parsons SF, Curnow E, Anstee DJ, Blair A. Superior survival of ex vivo cultured human reticulocytes following transfusion
into mice. Haematologica. 2017;102(3):476-483.
90. Zhang Y, Wang C, Wang L, et al. Large-Scale Ex Vivo Generation of Human Red Blood Cells from Cord Blood CD34(+) Cells. Stem
Cells Transl Med. 2017;6(8):1698-1709.
91. Timmins NE, Athanasas S, Gunther M, Buntine P, Nielsen LK. Ultra-high-yield manufacture of red blood cells from hematopoietic
stem cells. Tissue Eng Part C Methods. 2011;17(11):1131-1137.
92. Takahashi K, Yamanaka S. Induction of pluripotent stem cells from mouse embryonic and adult fibroblast cultures by defined
factors. Cell. 2006;126(4):663-676.
93. Varga E, Hansen M, Wust T, von Lindern M, van den Akker E. Generation of human erythroblast-derived iPSC line using episomal
reprogramming system. Stem Cell Res. 2017;25:30-33.
94. Yang CT, French A, Goh PA, et al. Human induced pluripotent stem cell derived erythroblasts can undergo definitive erythropoi-
esis and co-express gamma and beta globins. Br J Haematol. 2014;166(3):435-448.
95. Mao B, Huang S, Lu X, et al. Early Development of Definitive Erythroblasts from Human Pluripotent Stem Cells Defined by
Expression of Glycophorin A/CD235a, CD34, and CD36. Stem Cell Reports. 2016;7(5):869-883.
96. Borg J, Papadopoulos P, Georgitsi M, et al. Haploinsufficiency for the erythroid transcription factor KLF1 causes hereditary
persistence of fetal hemoglobin. Nat Genet. 2010;42(9):801-805.
97. Gautier EF, Ducamp S, Leduc M, et al. Comprehensive Proteomic Analysis of Human Erythropoiesis. Cell Rep. 2016;16(5):1470-
1484.


A

SummarySamenvatting
List of publicationsPhD portfolio
DankwoordCurriculum Vitae
APPENDIX


Summary
167
Summary
Despite the many donors who donate blood, there are patients for which it is difficult, if not impossible, to find compatible (interchangeable) blood. This mostly applies to patients with sickle cell disease that have been immunized against different non-self antigens (so-called alloantigens) by previous blood transfusions. The option to culture red blood cells to provide matched blood for these patients has been recognized for decades. Due to technical advances, research concerning the optimization of red blood cell cultures to reach quantities that resemble a unit of red blood cells given for transfusion have gained momentum over the last few years. These studies primarily investigate the intrinsic maturation program of red blood cells. However, red blood cell development is occurring on specialized support cells, the macrophages. Within this thesis, we aimed to optimize cell cultures from stem cell to red blood cell by focusing on the supporting macrophages that are known to have an essential but ill-defined role in the production of red blood cells.
Red blood cells or erythrocytes originate from the bone marrow. Within the bone marrow, a small fraction of blood stem cells (hematopoietic stem cells) is present which, in the right environment with a proper balance of growth factors, can develop into all blood cells in the body. The environment plays an important role as the cells located near the hematopoietic stem cells in the bone marrow support the stem cells to further maturate into one of the many blood cell lineages, a process called hematopoiesis. The development of a hematopoietic stem cell to a red blood cell is termed erythropoiesis. One of the cells located near the stem cells in the bone marrow is the macrophage (Greek makros = large, phagein = to eat), a certain type of white blood cell classically functioning to engulf old, dead or damaged cells and to clear pathogens. Multiple variants of macrophages have been found in the body and within a tissue fulfilling specific functions. In the bone marrow, macrophages have a supportive function in addition to their traditional clearing function and support precursor red blood cells, the erythroblasts. Such a macrophage is surrounded by erythroid cells and forms an islet structure, an erythroblastic island. These macrophages support erythroblast expansion (proliferation) and develop (differentiate) towards a red blood cell through mostly unknown or ill-defined mechanisms. There are several differentiation stages between erythroblasts and red blood cells. In the final stage, erythroid cells expel their nucleus (enucleation) resulting in enucleated reticulocytes and the individual nuclei surrounded by a plasma membrane, the pyrenocytes. The reticulocyte develops further into a red blood cell the moment it enters the blood stream. Macrophages also play an important role during this last stage, as they engulf and clear the expelled erythroid nuclei.
As we need hematopoietic stem cells for red blood cell production, and bone marrow material is difficult to obtain, peripheral blood has been used as starting material. Blood contains a very small fraction (on average 0.16%) of hematopoietic stem cells that have been mobilized from the bone marrow. This fraction can be isolated by density separation, which separates blood in three layers: 1) red blood cells and granulocytes, 2) white blood cells, and 3) plasma and platelets. The second layer, termed peripheral blood mononuclear cells, or PBMC, also contains the hematopoietic stem cells. Previously, it has been shown that the erythroblast yield from PBMC is 10-15 fold increased

Appendix
168
compared to purified hematopoietic stem cells isolated from the same amount of PBMC. A possible explanation would be that particular cells present in PBMC support the stem cells and thereby indirectly affect the amount of erythroblasts. We investigated this in chapter 2 and showed that several white blood cells are present in PBMC, in particular T-cells (58%), B-cells (6%), and monocytes and macrophages (18%). All blood cells can be distinguished by antigens (so-called CD antigens) present at the surface of the cells. First, we developed a novel way to characterize the stages between hematopoietic stem cells (CD34+CD36-) and erythroblasts (CD34-CD36+) in order to easily track cells during differentiation. Thereafter, T-cells (CD3), B-cells (CD19) and monocytes (CD14) were removed from PBMC one by one and the remaining cells were further cultured towards erythroblasts. The amount of erythroblasts was significantly reduced in PBMC depleted for monocytes/macrophages. In addition, we showed that co-cultures of purified hematopoietic stem cells with monocytes/macrophages result in a similar erythroblast yield compared to total PBMC. The results show that monocytes/macrophages do not have an effect on the erythroblasts themselves, but increase hematopoietic stem cell survival by the secretion of specific factors early during culture. This eventually results in an increased erythroblast yield.
Chapter 3 shows a culture method to efficiently culture red blood cells from PBMC. This culture system consists of three stages: i) the culture of PBMC towards erythroblasts, ii) expanding erythroblasts, and iii) erythroblast to reticulocyte differentiation. To mimic the correct environment, a specific cocktail of growth factors was added to the medium at each stage of culture. With the addition of growth factors cells survive, proliferate, and differentiate. In the first stage, stem cell factor (SCF) stimulates the proliferation of hematopoietic stem cells. The addition of erythropoietin (better known as EPO), which is normally produced by the kidney, supports the formation of red blood cells. In order to prevent cells already from differentiating to red blood cells, dexamethasone was added. This is a glucocorticosteroid, an adrenal gland hormone with an anti-inflammatory function, which is increased in the body during stress erythropoiesis when many erythroid cells have to be produced in the bone marrow. In the second stage, this specific cocktail is also used to increase the number of erythroblasts without differentiation. When a sufficient amount of erythroblasts is obtained, both SCF and dexamethasone are removed from the culture medium to allow the cells to further differentiate and to expel their nuclei. Furthermore, the EPO concentration is increased, and extra holotransferrin, an iron-binding and -transporting protein, is added. Iron-ion bound hemoglobin is an essential part of red blood cells, because it supports oxygen transport to different body parts. Finally, plasma is added to stimulate cell differentiation together with an anti-coagulant heparin to prevent the medium from clotting. In order to meet the required numbers of red blood cells for one transfusion, an infeasible amount of culture dishes is needed. We therefore examined alternative culture systems. Stage one was performed in culture dishes, however, in the second stage the culture dishes were exchanged for a bioreactor with optimal gas exchange due to a gas permeable bottom (G-Rex system). With this system, we can increase the cell culture density, in addition, larger culture volumes can be used and replenishing the medium is more efficient. This method allows to produce a yield of erythroid cells that is sufficient to start a clinical trial to test the lifespan of transfused cultured red blood cells and investigate the optimal period of repeated transfusions with cultured blood.

Summary
169
Macrophages play an important role in erythropoiesis. However, the underlying mechanism is not yet known, because there is no convenient human model to study this. Therefore, in chapter 4, we investigated whether we can differentiate PBMC-derived monocytes towards macrophages that we can use as a model to study the interaction between macrophages and different stages of red cells. As we used dexamethasone in the first and second stage of our culture system, we first examined the effect of this synthetic hormone on monocyte differentiation. In chapter 2, we showed that monocytes cultured in the presence of EPO, SCF, and dexamethasone differentiate towards tissue resident macrophages. Here, we show that glucocorticosteroids specifically direct all monocytes towards macrophages that phenotypically resemble bone marrow macrophages present in erythroblastic islands, expressing CD14, CD16, CD163, CD169, CD206 and CXCR4. Since these macrophages have been cultured with glucocorticosteroids, we refer to these cells as GC-macrophages. We actually show that these macrophages are a different type of macrophage compared to cells cultured without dexamethasone. Furthermore, GC-macrophages share functional characteristics with macrophages from erythroblastic islands: i) they bind erythroblasts and other stages of erythroid cells, and ii) they take up the erythroid nuclei when they are expelled by the erythroblasts, and iii) they are highly motile. Based on these results, we propose that GC-macrophages can be used as a model to study erythroblastic islands. The chapter concludes with antigen characterization of bone marrow macrophages, as well as macrophages from the fetal liver, because red cells are produced in the liver until the 7th month of fetal development instead of the bone marrow.
As a follow-up on this chapter, in chapter 5 we extensively compared CD163 fetal liver macrophages, CD163 bone marrow macrophages, and cultured CD163 GC-macrophages. The cell morphology between the three populations has a lot in common, also because they all bind erythroblasts and reticulocytes and take up erythroid nuclei. Based on protein expression, the results show that there is few variation between macrophages from various donors. Although the macrophages have a different origin and were derived from various tissues (liver or bone marrow) or never been in a tissue (GC-macrophages), the most important proteins associated with erythroblastic islands were identified in all three populations. This further strengthens the hypothesis that GC-macrophages can be used to study the interaction between red cells and macrophages. The method developed in this thesis to study erythroblastic-islands is important for further research in red blood cell cultures for transfusion purposes.
Finally, chapter 6 summarizes all chapters enclosed in this thesis and the results are discussed in a general discussion.


Samenvatting
171
Samenvatting
Ondanks de vele donoren die jaarlijks bloed doneren, is het voor sommige patiënten moeilijk, zo niet onmogelijk, om compatibel (uitwisselbaar) bloed te vinden. Dit geldt voornamelijk voor patiënten met sikkelcelziekte die zijn geïmmuniseerd met verschillende lichaamsvreemde antigenen (zogenaamde allo-antigenen) door eerdere bloedtransfusies. De mogelijkheid van het kweken van rode bloedcellen om deze patiënten gematcht bloed te bieden wordt al decennialang onderkend. Door technische vooruitgang is onderzoek naar het efficiënt kweken van rode bloedcellen om hoeveelheden te kunnen bereiken die overeenkomen met een zak bloed voor transfusie de laatste paar jaar in een stroomversnelling geraakt. In deze studies wordt voornamelijk gekeken naar het intrinsieke rijpingsprogramma van rode bloedcellen. Echter, rode bloedcellen ontwikkelen zich in een omgeving met gespecialiseerde verzorgende cellen, de macrofagen. In deze thesis is onderzoek gedaan naar het optimaliseren van celkweken van stamcel tot rode bloedcel. Daarbij is gekeken naar de rol van verzorgende macrofagen die een belangrijke maar veelal onbekende rol vervullen in de aanmaak van rode bloedcellen.
Rode bloedcellen oftewel erytrocyten, worden in het beenmerg gemaakt. In het beenmerg is een kleine fractie bloed stamcellen (hematopoëtische stamcellen) aanwezig die in de juiste omgeving, met de juiste balans in groeifactoren kunnen uitrijpen naar alle bloedcellen in het lichaam. De omgeving speelt hierbij een belangrijke rol, omdat de cellen die naast de hematopoëtische stamcellen liggen in het beenmerg de stamcellen stimuleren om uit te rijpen naar een van de vele bloedcellen, een proces dat hematopoëse heet. Het uitrijpen van een hematopoëtische stamcel naar een rode bloedcel wordt erytropoëse genoemd. Een van de cellen die in het beenmerg naast de stamcellen ligt is de macrofaag (uit het Grieks makros = groot, phagein = eten), een bepaald type witte bloedcel dat bekend staat om het opruimen van oude, dode of beschadigde cellen en ziekteverwekkers. Er zijn verschillende soorten macrofagen in het lichaam welke in verschillende type weefsels specifieke functies uitoefenen. In het beenmerg hebben de macrofagen naast de klassieke opruimfunctie ook een verzorgende functie en zorgen ze voor de voorlopers van rode bloedcellen, de erytroblasten. Deze macrofaag wordt omringt door erytroïde cellen en vormt een soort eilandje, een erytroblast-eiland. Deze macrofaag zorgt ervoor dat de erytroblasten vermeerderen (prolifereren) en uitrijpen (differentiëren) tot een rode bloedcel door veelal onbekende of niet goed beschreven mechanismen. Tussen erytroblast en rode bloedcel zitten meerdere uitrijpingsstadia. In het laatste stadium stoten de erytroïde cellen hun celkern uit (enucleatie) en ontstaan de geënucleeerde reticulocyten en de afzonderlijke celkernen omgeven door een plasmamembraan, de pyrenocyten. De reticulocyt rijpt vervolgens verder tot een rode bloedcel op het moment dat het de bloedbaan binnen komt. Ook in dit laatste stadium spelen macrofagen een belangrijke rol, omdat ze de celkern opruimen die wordt uitgestoten.
Omdat hematopoëtische stamcellen nodig zijn voor het kweken van rode bloedcellen, en beenmerg moeilijk te verkrijgen is, wordt perifeer bloed als startmateriaal gebruikt. Bloed bevat namelijk een zeer kleine fractie (gemiddeld 0.16%) hematopoëtische stamcellen die uit het beenmerg zijn gemigreerd. Om deze fractie te isoleren wordt het bloed op dichtheid gescheiden in drie lagen: 1)

Appendix
172
rode bloedcellen en granulocyten, 2) witte bloedcellen, en 3) plasma en bloedplaatjes. De tweede laag noemen we ook wel perifere bloed mononucleaire cellen, oftewel PBMC, en in deze laag bevinden zich ook de hematopoëtische stamcellen. Eerder onderzoek heeft aangetoond dat er 10-15 keer meer erytroblasten kunnen worden gekweekt van PBMC dan van gezuiverde hematopoëtische stamcellen geïsoleerd van eenzelfde hoeveelheid PBMC. De reden hiervoor is mogelijk dat bepaalde cellen in PBMC een goede ondersteuning bieden aan de stamcellen en daarmee de hoeveelheid erytroblasten indirect beïnvloeden. Dit hebben we onderzocht in hoofdstuk 2 waar we laten we zien dat er in PBMC verschillende witte bloedcellen zitten, waaronder voornamelijk T-cellen (58%), B-cellen (6%) en monocyten en macrofagen (18%). Alle cellen in het bloed zijn te onderscheiden aan de hand van antigenen (zogenaamde CD-antigenen) die zich aan de oppervlakte van de cel bevinden. Allereerst hebben we een nieuwe manier ontwikkeld om de stadia tussen hematopoëtische stamcellen (CD34+CD36-) en erytroblasten (CD34-CD36+) te karakteriseren, zodat de differentiatie gemakkelijker kan worden gevolgd. Daarna zijn de T-cellen (CD3), B-cellen (CD19) en monocyten (CD14) één voor één uit de PBMC verwijderd en de overige cellen verder gekweekt tot erytroblasten. De hoeveelheid erytroblasten was aanzienlijk minder wanneer de monocyten/macrofagen uit de PBMC waren verwijderd. Bovendien hebben we laten zien dat de hoeveelheid erytroblasten vergelijkbaar was met de opbrengst uit PBMC als de gezuiverde hematopoëtische stamcellen samen werden gekweekt met monocyten/macrofagen. De resultaten laten zien dat monocyten/macrofagen geen effect hebben op de erytroblasten zelf, maar vroeg in kweek zorgen dat er meer stamcellen overleven door het uitscheiden van specifieke factoren. Dit leidt uiteindelijk tot een toename van het aantal erytroblasten.
In hoofdstuk 3 laten we een kweekmethode zien om efficiënt rode bloedcellen te kweken vanuit PBMC. Dit kweeksysteem is in drie fasen op te delen: i) het kweken van PBMC naar erytroblast, ii) het expanderen van de erytroblasten en iii) het differentiëren van erytroblast naar reticulocyt. Om de juiste omgeving na te bootsen, voegen we in elke fase een specifieke cocktail aan groeifactoren toe aan het kweekmedium. De toevoeging van groeifactoren zorgt dat de cellen overleven, prolifereren en differentiëren. In de eerste fase zorgt stamcelfactor (SCF) voor de proliferatie van de hematopoëtische stamcellen. De toevoeging van erytropoëtine (beter bekend als EPO) dat normaal gesproken in de nieren wordt aangemaakt, stimuleert de vorming van rode bloedcellen. Om te voorkomen dat de cellen alvast gaan differentiëren naar rode bloedcellen, wordt dexamethason toegevoegd. Dit is een glucocorticosteroïde, een bijnierschorshormoon met een ontstekingsremmende functie, welke is verhoogd in het lichaam tijdens stress-erytropoëse als er opeens veel erytroïde cellen moeten worden geproduceerd in het beenmerg. In de tweede fase wordt dezelfde cocktail ook gebruikt om de hoeveelheid erytroblasten te vermeerderen zonder differentiatie. Als er voldoende erytroblasten zijn verkregen, wordt zowel SCF als dexamethason weggelaten uit het kweekmedium om te zorgen dat de cellen verder kunnen differentiëren en erytroblasten hun celkern kunnen uitstoten. Ook wordt de concentratie aan EPO verhoogd en wordt extra holotransferrine, een ijzerbindend en -transporterend eiwit dat standaard in het medium zit, toegevoegd. IJzer ionen in het hemoglobine zijn namelijk een essentieel onderdeel van rode bloedcellen, omdat deze zuurstof naar de verschillende lichaamsdelen helpt te transporteren. Tot slot zorgt de toevoeging van plasma ervoor dat de cellen beter differentiëren, waarbij het antistollingsmedicijn heparine voorkomt dat het medium gaat samenklonteren. Om de hoeveelheid rode bloedcellen die nodig is voor één transfusie

Samenvatting
173
te produceren, zijn er zoveel kweekschalen nodig dat dit inefficiënt wordt. Daarom hebben we gekeken naar een andere manier van kweken. We hebben fase één uitgevoerd in kweekschalen en zijn vervolgens vanaf de tweede fase overgestapt op een bioreactor met optimale gasuitwisseling door een gasdoorlaatbare bodem (G-Rex systeem). Hierin kunnen per oppervlakte veel meer cellen gekweekt worden, daarnaast past er een groter volume kweekmedium in dat efficiënter kan worden vervangen. Met deze methode kan een hoeveelheid rode cellen worden geproduceerd die voldoende is om een klinische trial te starten om de levensduur van gekweekte rode bloedcellen na transfusie te testen en te onderzoeken wat de optimale periode is van herhaalde transfusie met gekweekt bloed.
Dat macrofagen een belangrijke rol spelen in de erytropoëse was al bekend. Echter, de wijze waarop ze hun functie uitoefenen is nog niet helemaal duidelijk, omdat er geen goed humaan model beschikbaar is om dit te bestuderen. In hoofdstuk 4 is daarom onderzocht of we monocyten uit PBMC kunnen uitgroeien tot macrofagen die we kunnen gebruiken als model om de interactie tussen macrofagen en verschillende rode cel stadia te bestuderen. Omdat we in ons kweeksysteem in zowel de eerste als tweede fase dexamethason gebruiken, hebben we eerst gekeken wat het effect van dit synthetische hormoon is op monocyt differentiatie. We hebben in hoofdstuk 2 laten zien dat monocyten gekweekt met EPO, SCF en dexamethason differentiëren naar weefsel residente (blijvende) macrofagen. Hier laten we zien dat glucocorticosteroïden heel specifiek alle monocyten aanstuurt om te differentiëren naar macrofagen die qua fenotype lijken op beenmerg macrofagen die aanwezig zijn in erytroblast-eilandjes, omdat ze CD14, CD16, CD163, CD169, CD206 en CXCR4 tot expressie brengen. Omdat deze macrofagen gekweekt zijn met een glucocorticosteroïde, noemen we ze GC-macrofagen. We laten namelijk zien dat deze macrofagen een ander type macrofaag zijn dan de cellen die zonder dexamethason zijn gekweekt. Daarnaast hebben GC-macrofagen ook functionele karaktereigenschappen gemeenschappelijk met macrofagen uit erytroblast-eilandjes: i) ze binden aan erytroblasten en alle andere stadia rode cellen en ii) ze nemen de celkern op van erytroblasten die net hun celkern hebben uitgestoten en iii) ze zijn heel beweeglijk. Met deze resultaten stellen we voor dat de GC-macrofagen kunnen worden gebruikt als model voor het bestuderen van erytroblast-eilandjes. Het hoofdstuk sluit af met een antigeen karakterisatie van beenmerg macrofagen, maar ook van macrofagen uit de foetale lever, omdat de productie van rode bloedcellen tot de 7e maand van de foetale ontwikkeling plaatsvindt in de lever in plaats van het beenmerg.
Als vervolg op dit hoofdstuk, wordt in hoofdstuk 5 een uitgebreide vergelijking gemaakt tussen CD163 foetale lever macrofagen, CD163 beenmerg macrofagen en gekweekte CD163 GC-macrofagen. De morfologie van de drie cel populaties vertoont veel overeenkomsten, ook omdat ze allemaal erytroblasten en reticulocyten binden en erytroïde celkernen opnemen. Op basis van de eiwitten die ze tot expressie brengen laten de resultaten zien dat er weinig verschil zit in de macrofagen tussen de verschillende donoren. Ondanks dat de macrofagen een andere oorsprong hebben en zich in een ander type weefsel bevonden (lever of beenmerg) of nooit in een weefsel zijn geweest (GC-macrofagen), zijn de belangrijkste eiwitten die geassocieerd zijn met erytroblast-eilandjes in alle drie de populaties geïdentificeerd. Dit versterkt de hypothese dat GC-macrofagen kunnen worden gebruikt om de interactie tussen rode bloedcellen en macrofagen te bestuderen. De

Appendix
174
in dit proefschrift ontwikkelde methode om erytroblast-eilandjes te kunnen bestuderen is belangrijk voor verder onderzoek naar het kweken van rode bloedcellen voor transfusie doeleinden.
Tot slot beslaat hoofdstuk 6 een korte samenvatting van alle hoofdstukken die in deze thesis zijn bijgesloten en worden de bevindingen besproken in een algemene discussie.


List of publications
177
List of publications
Heideveld E, Masiello F, Marra M, Esteghamat F, Yağcı N, von Lindern M, Migliaccio AR, van den Akker E.CD14+ cells from peripheral blood positively regulate hematopoietic stem and progenitor cell survival resulting in increased erythroid yield. Haematologica 2015 Nov;100(11):1396-1406.
Heideveld E, van den Akker E.Digesting the role of bone marrow macrophages on hematopoiesis. Immunobiology 2017 Jun;222(6):814-822.
Heideveld E, Hampton-O’Neil L, Cross SJ, van Alphen FPJ, van den Biggelaar M, Toye AM, van den Akker E. Glucocorticoids induce differentiation of monocytes towards macrophages that share functional and phenotypical aspects with erythroblastic island macrophages. Haematologica 2018 Mar;103(3):395-405.
Heideveld E, van Alphen FPJ, van den Biggelaar M, van den Akker E.The proteomic landscape of erythroblastic island macrophages from human fetal liver, bone marrow and in vitro cultures. Submitted.


PhD portfolio
179
PhD portfolio
PhD training
Courses and workshops Year ECTS*
Sanquin Science Course 2014 0.7
Laboratory Animals 2014 4.2
Advanced Immunology 2014 2.9
Oral Presentation 2014 0.3
Eductional Skills Training 2014 0.2
Synthesis of Evidence 2014 0.5
Browsing Genomes with Ensembl 2014 0.3
New Developments in Flow cytometry 2014 0.3
APROVE Pimp My Sollicitatie 2017 0.2
Grant Writing 2017 0.3
APROVE Career Event 2017 0.5
Pitch Like a CHAMP 2017 0.5
Work Your Talent 2017 0.5
Seminars and masterclasses Year ECTS
Department Meetings 2013-2017 8.0
Journal Club 2013-2017 3.0
Landsteiner Lectures and Guest Speakers 2013-2017 2.0
Landsteiner Masterclasses 2013-2017 1.5
Sanquin Science Day 2014 2014 0.5
Sanquin Science Day 2016 2016 0.5
Sanquin Science Day 2017 2017 0.5
National conferences Year ECTS
Dutch Society for Cell Biology (DSCB)
- From Stem Cells to Aging, Amsterdam 2013 0.3
- Vesicles on the Move, Amsterdam 2014 0.3
- Building & Repairing Tissues, Amsterdam 2015 0.3
Dutch Society of Stem Cell Research (DSSCR)
- 7th Annual Meeting, Groningen 2014 0.3
- 8th Annual Meeting, Utrecht 2015 0.3
- 9th, Annual Meeting, Utrecht 2016 0.3
- 10th Annual Meeting, Utrecht 2017 0.3

Appendix
180
Dutch Hematology Congress (DHC)
- 8th DHC, Arnhem 2014 0.6
- 9th DHC, Arnhem 2015 0.6
- 10th DHC, Arnhem 2016 0.6
- 11th DHC, Arnhem 2017 0.6
Molecular Aspects of Hematopoietic Disorders (MAHD)
- Hematology Lectures, Rotterdam 2014 0.7
- Hematology Lectures, Rotterdam 2017 0.7
Tumour Infiltrating Myeloid Cell Compartment (TIMCC)
- The Complexity of Tumour-Host Immune 2016 0.3
Interactions, Leiden
Dutch Society for Immunology (DSI)
- Networking in Immunity, Lunteren 2017 0.6
Sanquin Spring Seminars
- Iron Metabolism and Anemia, Amsterdam 2017 0.6
International conferences Year ECTS
American Society of Hematology (ASH)
- 55th, New Orleans, LA, USA 2013 1.4
- 58th, San Diego, CA, USA 2016 1.4
International Stem Cell Forum (ISCF)
- Regenerative Medicin & Stem Cells, Amsterdam 2014 0.3
European Macrophage Dendritic Society (EMDS)
- Krakow, Poland 2015 0.9
- Amsterdam, the Netherlands 2016 0.9
- Madrid, Spain 2017 0.9
Red Cells Gordon Research (GRS/GRC)
- 2017 seminar, Newport, RI, USA 2017 0.6
- 2017 conference, Newport, RI, USA 2017 1.4
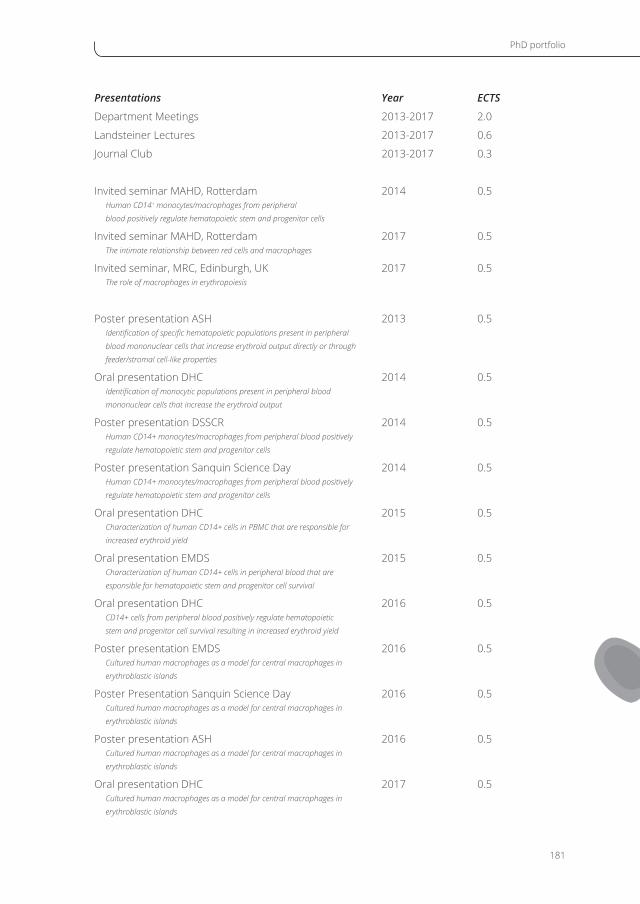
PhD portfolio
181
Presentations Year ECTS
Department Meetings 2013-2017 2.0
Landsteiner Lectures 2013-2017 0.6
Journal Club 2013-2017 0.3
Invited seminar MAHD, Rotterdam 2014 0.5Human CD14+ monocytes/macrophages from peripheral
blood positively regulate hematopoietic stem and progenitor cells
Invited seminar MAHD, Rotterdam 2017 0.5The intimate relationship between red cells and macrophages
Invited seminar, MRC, Edinburgh, UK 2017 0.5The role of macrophages in erythropoiesis
Poster presentation ASH 2013 0.5Identification of specific hematopoietic populations present in peripheral
blood mononuclear cells that increase erythroid output directly or through
feeder/stromal cell-like properties
Oral presentation DHC 2014 0.5Identification of monocytic populations present in peripheral blood
mononuclear cells that increase the erythroid output
Poster presentation DSSCR 2014 0.5Human CD14+ monocytes/macrophages from peripheral blood positively
regulate hematopoietic stem and progenitor cells
Poster presentation Sanquin Science Day 2014 0.5Human CD14+ monocytes/macrophages from peripheral blood positively
regulate hematopoietic stem and progenitor cells
Oral presentation DHC 2015 0.5Characterization of human CD14+ cells in PBMC that are responsible for
increased erythroid yield
Oral presentation EMDS 2015 0.5Characterization of human CD14+ cells in peripheral blood that are
esponsible for hematopoietic stem and progenitor cell survival
Oral presentation DHC 2016 0.5CD14+ cells from peripheral blood positively regulate hematopoietic
stem and progenitor cell survival resulting in increased erythroid yield
Poster presentation EMDS 2016 0.5Cultured human macrophages as a model for central macrophages in
erythroblastic islands
Poster Presentation Sanquin Science Day 2016 0.5Cultured human macrophages as a model for central macrophages in
erythroblastic islands
Poster presentation ASH 2016 0.5Cultured human macrophages as a model for central macrophages in
erythroblastic islands
Oral presentation DHC 2017 0.5Cultured human macrophages as a model for central macrophages in
erythroblastic islands

Appendix
182
Poster presentation Sanquin Spring Seminar 2017 0.5Modeling human erythroblastic islands
Poster presentation GRS 2017 1.0Modeling human erythroblastic islands
Poster presentation GRC 2017 1.0Modeling human erythroblastic islands
Poster presentation EMDS 2017 0.5Proteomic comparison of CD163+ macrophages in human fetal liver,
bone marrow and cultured central macrophage-like cells
Poster presentation Sanquin Science Day 2017 0.5Proteomic comparison of CD163+ macrophages in human fetal liver,
bone marrow and cultured central macrophage-like cells
Additional tasks Year ECTS
DJOB committee member 2014-2016 1.5
FBCS committee member 2016-2017 0.8
Teaching Year ECTS
Bachelor student 2014 0.3
Bachelor Student 2014 0.3
HLO Student 2016 1.5
Awards and Prizes Year
Dutch TOP Publications, DHC 2015
Best Poster Presentation Award, Sanquin Spring Seminar 2017
Poster Prize, Gordon Red Cell Seminar 2017
*1 ECTS credit equals 28 hours workload


185
Dankwoord
Dankwoord
Misschien zou het dankwoord beter tot zijn recht komen aan het begin van dit boekje. Velen van jullie
staan namelijk niet op mijn artikelen, maar zonder jullie was het nooit zo mooi uit de verf gekomen.
Ieder heeft mij op zijn eigen manier geholpen: directe betrokkenheid bij mijn project of indirect om even
te ontspannen buiten het lab. Sommigen kennen mij al jaren, voor anderen lijkt het alsof we elkaar al
jaren kennen, en soms zijn we uiteindelijk onze eigen weg gegaan. Ik wil jullie allemaal bedanken en
ik kijk dan ook heel gelukkig terug op de afgelopen jaren en de vriendschappen die zijn opgebouwd!
Emile, ik vind het een eer dat ik de eerste PhD student ben die bij jou promoveert. Die allereerste dag
dat je mij als masterstudent hielp met het isoleren van PBMCs weet ik nog als de dag van gisteren.
Pas om 3 uur ’s middags waren we klaar en was er tijd voor lunch. Ik zag er al tegenop om elke
dag zo laat te lunchen, waarna jij zei ‘als ik het zelf doe, ben ik om 11 uur al klaar!’. Inmiddels heb ik
zoveel PBMC en MACS isolaties gedaan, dat ik durf te wedden (voor een fles rode wijn) dat het mij
vóór 11en ook wel lukt. Door mijn leuke tijd tijdens mijn stage ben ik bij je teruggekomen als PhD
student, en dat was een hele goede zet! Emile, ik heb bewondering voor de hoeveelheid kennis die
je hebt, de orde die verstopt zit in de chaos waardoor (alleen) jij je data feilloos weet terug te vinden.
Ik heb meegemaakt hoe onze groep en daarmee ook jij bent gegroeid, van gezellig samen in het
lab cellen kweken, naar een echte groepsleider: een gepassioneerde en enthousiaste onderzoeker,
altijd druk, nooit op zijn plek aanwezig, en in de vrije uurtjes nog wat stiekeme experimentjes doen.
Die vrijheid om secret experiments te doen heb ik zeer gewaardeerd. ‘Een goed idee moet je altijd
uitproberen, als het werkt, laat het me weten, en anders..wat niet weet, wat niet deert.’. Je hebt mijn
ogen geopend om meer van de wereld te willen zien en ik heb gemerkt dat ik het ontzettend leuk
vind om te netwerken. Bedankt dat je mij de mogelijkheid bood om naar de ASH (New Orleans en
San Diego), de Gordon Red Cell (Newport), de EMDS (Krakau en Madrid) en alle congressen binnen
Nederland te gaan. Daarnaast mocht ik ook nog geheel onverwachts een maand naar Bristol om een
mooi figuur te maken voor ons artikel. En dan te bedenken dat ik voor 2013 nog nooit in een vliegtuig
had gezeten! Naarmate de 4 jaar verstreken (en helaas de gaatjes in je shirts toenamen) ben je ook
steeds persoonlijker geworden en was het leuk om meer van jouw leven te weten te komen. Ik denk
dat we een goed team zijn samen, jij kijkt naar het geheel en ik let op de details (al heb ik je misschien
wel tot gekheid gedreven met mijn geordendheid, planningen en deadlines). Zo, en nu ben ik wel
benieuwd wat er allemaal over mij in jouw excel file staat!
Marieke, met jouw altijd vrolijke en opgewekte humeur en passie voor de wetenschap vind jij zelfs
in alle drukte nog tijd om even wat te bespreken of gewoon gezellig te babbelen over muziek, PhD
studenten uit de tijd dat je zelf nog promoveerde of over andere Vrinden. Bedankt voor alle input
tijdens de werkbesprekingen, maar ook tijdens het schrijven van de artikelen en dit boekje. Samen
met Emile vormen jullie een sterk (maar soms ook wel wat chaotisch) team! Ik weet nu dat het niet
erg is als je op de eerste rij zit te knikkebollen tijdens mijn presentatie, dit doe je immers alleen als
Appendix
186
je het vertrouwen hebt dat het toch wel goed komt. En dat vind ik een mooie gedachte om aan vast
te houden. Mocht je nog eens zin hebben om naar een concert te komen luisteren, dan ben je altijd
van harte uitgenodigd.
Ash, you could have been my third copromotor. Thank you for the opportunity to (ad hoc) visit your
lab to finish the last figure of the paper and celebrate the publication some months later while writing
my thesis. I really felt like being part of your group. It is treasured memories like Christmas dinner,
your birthday party (best cocktails I ever had), having lunch at St. Nicholas Market and (Wii) dancing
in the living room, that make me realize I will definitely return to Bristol again (and again, and again).
Ellen, eigenlijk was jij in de laatste maanden pas echt betrokken bij mijn project. Ik heb bewondering
voor de hoeveelheid kennis die je hebt en hoe je altijd verrassend interessante vragen weet te
stellen tijdens werkbesprekingen en tijdens het nalezen van dit proefschrift, zelfs als je niet echt in
het onderwerp thuis bent. Mijn ketting uit New Orleans bewaar ik als aandenken aan de leuke tijd op
Sanquin, want hoe konden wij weten dat we die niet zomaar mochten oprapen!
Alle PI’s, zowel van U2 als Y3 en Y4, bedankt voor alle input tijdens de werkbesprekingen, de leuke
discussies bij de koffieautomaat of het doorsturen van interessante artikelen.
Ik wil graag iedereen uit Emile’s en Marieke’s groep bedanken voor de fijne werkbesprekingen op de
donderdagen en de leuke gesprekken tijdens het kweken op het ML1, stainings maken voor de FACS
of cytospins kleuren. In het bijzonder Nurcan, jij bent voor mij nog steeds de moeder van de groep,
bedankt voor al jouw hulp tijdens mijn PhD, maar ook zeker al daarvoor tijdens mijn stage. Het is
jammer dat je nooit meer teruggekomen bent op mijn project, want ik weet zeker dat we een goed
team zijn! Patrick, hèhè, eindelijk iemand in de groep die iets weet van macrofagen! Dankjewel voor
het delen van jouw kennis en ook voor de mooie samenwerking met Erica en Marijke die resulteerde
in hoofdstuk 3. Franca, fijn dat er meer mensen zijn die houden van orde en regels! Elina, thanks for
the fun times in the lab, the NvvH and during lunch breaks at Wonders.
A100, it was a real pleasure meeting you, everyone has been so friendly and kind! In particular Lea,
you are the perfect guide, both in the lab as well as outside. I enjoyed working with you, drinking tea
at Bluebird, discovering secret bars in Bristol and staying at your comfortable sleeping bed. Good
luck with your final months and hope to see you soon!
Erik, Mark en Simon, bedankt voor jullie hulp en geduld bij de FACS, ImageStream, elutra en sort.
Jullie vrolijke humeur zorgde er altijd voor dat mijn lange experimenten wat korter leken. Floris
en Maartje, ik wil jullie bedanken voor alle hulp bij de mass spectrometry experimenten van de
macrofagen. Zonder de kennis en hulp van jullie allemaal als Research Facility waren de hoofdstukken
nooit zo mooi geworden (of had ik ze überhaupt nooit kunnen schrijven).

Dankwoord
187
Mariette, niets is zo lekker als een koffie met melkschuim! Bedankt dat je altijd klaar stond om bloed
(van mij of voor mij) te prikken. Sinds maart heb je er een IJsland-fan bij!
Mo, Anita, Kaoutar en Fatima, maar ook John, wat fijn dat er mensen zijn die orde en overzicht
weten te scheppen bij al die chaotische onderzoekers. Bedankt voor jullie hulp, regelwerk en geduld!
Bedankt (oud)-IHEP’ers! In het bijzonder, Carlijn, jij bent altijd in voor een goede borrel en een hoop
vrolijkheid! Ik moet nog even oefenen denk ik, want ik weet anders niet of ik onze weddenschap wel
haal ;) Tamara, bedankt voor jouw gezelligheid, ook tijdens de spelletjesavonden, al hebben we meer
tijd besteed aan lekker eten en kletsen dan aan spelletjes! Ik wacht nog steeds op het moment dat
je een ritje op mijn fiets komt maken (geloof me, mijn zadel is echt niet zo erg). Giso, als ik jou zie
begin ik spontaan te MACSen, zelfs als je even langs komt terwijl je niet meer op de afdeling werkt.
Wanneer gaan we weer de Dam-tot-Dam fietsen? Felix and Fiamma, you were always there, late at
night, when everyone left and I really wanted to talk. Thank you for being there (and for the cookies
Felix!). Benoit, Mister Green, were would Sanquin be without you? Plastic containers, department
pictures, classical music in the lab..thank you! Marion, zonder jouw gekleurde lijstjes op het ML1
was het nooit zo schoon en opgeruimd geweest op het lab! Jalenka, Ilse en Corina, bedankt voor
jullie vrolijkheid, gezelligheid en leuke gesprekken! Pleun, het is alweer veel te lang geleden dat wij
tijd hadden voor bier en een goed gesprek! Christina, hoe meer hobo’s, hoe beter. Ammarina, fijn
om te weten dat sommigen het nog kouder hebben dan ik. Florentine, het kookboek is er, nu nog
wachten tot sinterklaas, want ik hoop dat onze bakavonden een vervolg krijgen. Felipe, Sabrina (rood!
ze zijn ROOD!), and Sulima, thank you for all the fun times at P1.
Fietsmaatjes: Sem, bedankt voor de gezellige fietstochtjes van en naar werk op de maandagen,
al kwam ik altijd wel iets te laat. Gelukkig kon ik compenseren door bij de maandagpraatjes de
afkortingen van Research uit te leggen. Julian, mijn Purmerendse vouwfietsmaatje, super leuk om
een jaar lang met de trein te reizen en samen te fietsen! Nahuel, met de grootst mogelijke moeite
probeerde ik jou te overtuigen van mijn groenere fietsroute…300 meter extra? Echt niet. Max and
Marea, luckily you were always there if I didn’t want to cycle home.
De G-unit, bedankt voor jullie vrolijkheid, gezelligheid en gekkigheid, vooral in de laatste maanden
dat ik aan het schrijven was. Waarschijnlijk is het nu een stuk rustiger in het hoekje bij de trap.
Arthur, ik heb respect voor je doorzettingsvermogen en snelheid met hardlopen (en bier drinken)
en blijf vooral zo doorgaan (vooral met dat eerste)! Zoltan, Max and Erik, never try to disturb anyone
counting cells ;) Robin, tot onze verassing hebben wij onze hele jeugd maar een paar meter van elkaar
doorgebracht, wie had dat gedacht. Bedankt voor je vrolijkheid en humor!
Gillian, pepernoten bakken, boulderen, koken uit Ottolenghi, dat zijn toch wel de eerste dingen die
in mij opkomen als ik aan jou denk. Bedankt voor de leuke gesprekken, het zweten op de klimmuur

Appendix
188
en de wandelingetjes in de pauze. We moeten denk ik wel even ons best doen om deze tradities in
ere te houden, maar ik weet zeker dat het ons lukt!
Francesca, jij bent denk ik de enige Italiaanse die het hier in Nederland al te warm vindt om
in de zon te zitten. Bedankt voor je gezelligheid, zowel op werk, als na werk, als tijdens onze
spelletjesavonden. Dobbiamo ancora fare la nostra prova, quindi non so se riesco a questo, perché,
nonostante il nostro buon inizio con un libro di lingua esercizio. Conosco solo una frase in italiano:
sono caduto dalla bici.
Roos, wat ben jij toch gezellig en vol energie, altijd in voor een goed gesprek of lekker wat kletsen
tijdens een koffietje. Ik ben blij dat ik je in de laatste maanden van mijn PhD heb leren kennen, al had
dat véél eerder mogen zijn wat mij betreft!
Anne, ik heb leuke herinneringen aan onze gezellige avondjes in Utrecht. Als het aan mij ligt, worden
dat er nog veel meer! Ik ben blij dat je nieuwe plek echt is wat je zocht, en ik wens je heel veel succes
met het afronden van je PhD (je bent er echt bijna!!). De uilenbeker uit New Orleans staat nog steeds
op je te wachten, dus laten we snel een keer afspreken!
Nahuel, de man van de labello en raak-nooit-zijn-haar-en-schoenen-aan. Al waren we zowat gelijk
begonnen, ik heb je pas in de laatste jaren beter leren kennen. Samen naar San Diego was een leuk
avontuur, al kon je mijn gekletst maar net aan. Ik kom graag al jouw dulce de leche toetjes proeven,
maar dan wacht ik denk ik eerst tot je klaar bent in de keuken. Ik bewonder je dat je ogenschijnlijk
relaxed je PhD hebt afgerond en wens je heel veel succes met je nieuwe baan!
Marieke, door jou is een stukje van mijn steen afgebrokkeld. Dankjewel voor alle leuke Star Wars &
Pizza-avonden en je gezelligheid tijdens de NvvH, NvvI en de ASH in San Diego, ook al heb ik je de oren
van je hoofd gepraat en kwamen onze verschillende karakters soms boven. Ik hoop dat we blijven
afspreken buiten werk (ook nu met je lieve gezinnetje) en wens je veel succes met het afronden van
je PhD, je bent er bijna!
Max, the guy that never forgets to moisturize his hands. You are a great addition to the group, both
at work and at borrels after work. Although I wanted to finish within 4 years, I am glad I needed some
extra months as I found a very enjoyable and talkative friend in you. But what to do with all the cookies
now I can’t share them with you?
Steven, de man met de leuke t-shirt prints, koekiemonster en mede-Italië-fietser. Zelfs na een
superkorte nacht in alle gezelligheid foetale levers opwerken met mij naast je in de flow hood, dat
kunnen maar weinig mensen opbrengen. En daarna durfde je ook nog samen op congres naar
Newport, inclusief stedentrip naar Boston en New York onder het continue gekletst van mij. Ik
Dankwoord
189
waardeer je luisterend oor, de ontzettend goede gesprekken en discussies en wil je bedanken voor
je vertrouwen en gezelligheid. Ik ben blij dat jij mijn paranimf bent!
Marea, de nuchtere, retro, mango-lover die nooit (?) haar principes overboord zal zetten. Aan jou heb
ik een ongelooflijk leuke, grappige en oprechte vriendin overgehouden! Samen antibodies ordenen,
inkopen doen voor de borrels, koffie drinken bij het NKI, gezellige spelletjesavonden (volgende keer
knip ik mijn nagels extra kort) en oude Sanquin pennen verzamelen. Er is denk ik maar één ding dat
tussen ons in staat, en dat is jouw personal space ;) Ik ben blij dat jij mijn paranimf bent!
Ik bedank ook graag alle muzikanten met wie ik de afgelopen jaren heb samen gespeeld of heb
leren kennen na afloop van een concert. In het bijzonder Nieuwe Maten, bedankt voor de gezellige
repetities, mooie concerten en alle energie die ik van jullie heb gekregen door samen muziek te
maken!
Anh, jij bent zo mogelijk nog geordender dan ik! Na 16 jaar elkaar uit het oog te zijn verloren, waren
we alweer snel up-to-date. Vietnamees eten, wijn drinken op je balkon, lijstjes doornemen, (te)veel
kussens kopen of opeens de woonkamer verven, met jou weet je nooit wat de dag zal brengen!
Bedankt voor je positiviteit en gezelligheid.
Dewi, jij kent me echt als geen ander. Ik denk met plezier terug aan al onze Harry Potter en Austen
avonden, Avatar, Sex and the City, koekjes bakken en samen ontbijten met Kerst of Pasen. Ik voel
me altijd enorm welkom en thuis bij jou, en daar hoort Arjan natuurlijk ook bij. Bedankt voor je
vriendschap al die jaren!
Lieve Michel, kurs op de vlaai, enigszins onverwacht sta je hier dan in mijn dankwoord. Ik ben heel
erg blij dat ik jou heb leren kennen en ik wil je bedanken voor je vertrouwen, fijne gesprekken en alle
gezelligheid die jij met je mee brengt. Ik kijk al uit naar de vele avonturen die gaan komen!
Lieve papa, mama en zus. Ik wil jullie bedanken voor alle leuke en mooie momenten die we samen
hebben gedeeld. Saskia, een gezamenlijk potje starten was een heel goed idee! Ik heb genoten
van de zussenvakanties, de gezellige weekendjes weg of gewoon eventjes bijkletsen met een latte
macchiato caramel. Ik ben ontzettend blij met jou als zus! Papa en mama, wie had ooit gedacht dat
ik hier nu zou staan. Van stil en verlegen naar een aanwezige spraakwaterval (niet ongewoon in de
familie). Bedankt voor alle steun die ik van jullie heb gehad, de gezellige telefoontjes als ik op de fiets
zat naar werk, maar bovenal heb ik van jullie meegekregen dat als je iets wilt, je nooit op moet geven,
door moet zetten en er helemaal voor moet gaan.
Liefs,
Esther

Curriculum Vitae
191
Curriculum Vitae
Esther Heideveld was born on the 17th of August 1988 in Purmerend, The Netherlands. She attended high school at ‘Het Da Vinci College’ in Purmerend and graduated in 2005 (HAVO). She continued with pre-university education (VWO) and additionally started the preparatory program oboe at the Amsterdam Conservatory in 2005. Because of her interest in both music and medical biology, she started her study oboe at the Amsterdam Conservatory with Jan Kouwenhoven (former oboist at the Royal Concertgebouw Orchestra) as well as Biomedical Sciences at the Free University in Amsterdam in 2007, however, in 2009 she decided to focus on Biomedical Sciences. After performing an internship on the toxicity of non-dioxin-like PCBs in zebrafish embryos at the Laboratory of Health Protection Research and Ecological Risk Assessment at the RIVM, Bilthoven, Esther obtained her Bachelor of Science degree in 2011. She then decided to choose the Biomedical Sciences master program with a specialization in Immunology and Oncology. For her master, she performed a 6-month internship at the department of Hematopoiesis at Sanquin, Amsterdam. Here, she investigated the effect of different human hematopoietic lineages on hematopoietic stem cells and erythroid outgrowth and the reprogramming capacity of erythroblasts. Additionally, she performed a second internship in the group of Dr. J de Rooij at the Hubrecht Institute, Utrecht, on designing FRET probes for αE-catenin in order to study the cadherin complex in cell-cell adhesion. In 2013, she obtained her Master of Science degree in Biomedical Sciences and decided to continue her work at Sanquin, starting a PhD project in the department of Hematopoiesis under supervision of Dr. E van den Akker. This project focused on in vitro culture of red blood cells and the role of macrophages during erythropoiesis. During her PhD she has visited the laboratory of Dr. Ashley M. Toye at the University of Bristol (UK). The results of her research are described in this thesis.