Mulugeta Final Thesis - CGSpace
131
DETERMINANTS OF INTENSITY OF ADOPTION OF OLD COFFEE STUMPING TECHNOLOGY IN DALE WEREDA, SNNPRS, ETHIOPIA A Thesis Submitted to the Department of Rural Development and Agricultural Extension, School of Graduate Studies HARAMAYA UNIVERSITY In Partial Fulfillment of the Requirements for the Degree of MASTER OF SCIENCE IN AGRICULTURE (RURAL DEVELOPMENT AND AGRICULTURAL EXTENSION) By Mulugeta Arega January, 2009 Haramaya University
-
Upload
khangminh22 -
Category
Documents
-
view
1 -
download
0
Transcript of Mulugeta Final Thesis - CGSpace

DETERMINANTS OF INTENSITY OF ADOPTION OF OLD COFFEE
STUMPING TECHNOLOGY IN DALE WEREDA, SNNPRS, ETHIOPI A
A Thesis Submitted to the Department of Rural Development and
Agricultural Extension, School of Graduate Studies
HARAMAYA UNIVERSITY
In Partial Fulfillment of the Requirements for the Degree of MASTER OF
SCIENCE IN AGRICULTURE (RURAL DEVELOPMENT AND
AGRICULTURAL EXTENSION)
By
Mulugeta Arega
January, 2009
Haramaya University

iii
School of Graduate Studies
Haramaya University
As Thesis Research advisor, we here by certify that we have read and evaluated this thesis
prepared, under our guidance, by Mulugeta Arega, entitled Determinants of Intensity of
Adoption of Old Coffee Stumping Technology in Dale Wereda, SNPPRS, Ethiopia. We
recommend that it can be submitted as fulfillment of the Thesis requirement.
______________________ _________________ _______________ Major Advisor Signature Date
______________________ _________________ _______________ Co-advisor Signature Date
As member of the Board of Examiners of the MSc Thesis Open Defense Examination, We
certify that we have read, evaluated the Thesis prepared by Mulugeta Arega and examined the
candidate. We recommended that the Thesis is accepted as fulfilling the Thesis requirement
for the Degree of Master of Science in Agriculture (Rural Development and Agricultural
Extension).
______________________ _________________ _______________ Chairperson Signature Date
______________________ _________________ _______________ Internal Examiner Signature Date
______________________ _________________ _______________ External Examiner Signature Date

iv
DEDICATION
I dedicated to my wife, Woinshet Berhanu, my son and daughter, Amanuel, and Tsega
Mulugeta for their Love and dedicated partnership effort especially for their prayer in my
academic success and life.

v
STATEMENT OF AUTHOR
First, I declare that this thesis is the result of my own work and that all sources or materials
used for this thesis have been duly acknowledged. This thesis is submitted in partial
fulfillment of the requirements for an advanced M.Sc. degree at Haramaya University and to
be made available at the University’s Library under the rules of the Library. I confidently
declare that this thesis has not been submitted to any other institutions anywhere for the award
of any academic degree, diploma, or certificate.
Brief quotations from this thesis are allowable without special permission, provided that
accurate acknowledgement of source is made. Requests for permission for extended quotation
from or reproduction of this manuscript in whole or in part may be granted by Dean of the
School of Graduate Studies when in his or her judgment the proposed use of the material is in
the interests of scholarship. In all other instances, however, permission must be obtained from
the author.
Name: Mulugeta Arega Signature: ……………………
Place: Haramaya University
Date of Submission: December, 2008
vi
BIOGRAPHY Mulugeta Arega Lidetie was born in Dessie town, in South Wollo zone of the Amhara region
on March, in 1961. He attended his elementary and junior education in Dessie and
Wogeltenna Junior schools. He also attended his high school education in Dessie at Woizero
Sihen Comprehensive secondary school. After completion of his high school education, he
joined Debrezeit Junior Agricultural college (under Addis Abeba university) to attend a two
years Diploma program in crop production and protection technology (CPPT) and graduated
in July 1981. After graduation he was employed in ministry of Coffee and Tea Development,
Coffee Improvement Project (CIP) and Ministry of Agriculture in different Administrative
Regions and districts and served for more than 16 years. After this much time service he got
an opportunity to join Debub University, now Hawassa University, and graduated in Plant
Protection and Dry land Farming (PPDF) with B.Sc. in 2004. Then after, he joined Haramaya
University in July 2005 to pursue graduate studies for the M.sc. in Rural Development and
Agricultural Extension. The author is married and has three children.

vii
ACKNOWLEDGEMENTS
First and foremost, I would like to praise and extend my unshared thanks to Almighty God,
Lord Jesus Christ for providing me the opportunity, smoothening of all aspects regarding my
study and being with me in all aspects during my stay at Haramaya University and throughout
my life. « All things were made by him and without him was not any thing made that was
made. » John 1÷3
I would like to extend my heartfelt thanks to my major advisor Dr. Getachew Kassaye for his
valuable advice, insight and guidance starting from proposal development to the completion
of the research work and his provision of reference material. I am again thankful to my co-
advisor, Dr. Daniel Temesgen, for his willingness to advise me as well as his valuable
guidance and support throughout my research work. Both have worked hard to keep me on
the right track and accomplishment of the study.
I would also like to express my sincere appreciation to IPMS (ILRI) Project for funding my
research and other study expenses and Dale woreda Agriculture and Rural Development for
giving me chance to pursue my post graduate study and paying my salary during my study
program. I would like also to thank all management and staff members of Dale woreda
agriculture and rural development office for their hospitality and kind cooperation in all
aspects. Though not to exclude others, my special thanks go to Ato Belayenehi Baramo, head
of Dale Woreda agricultural office for encouraging me morally and facilitating every
arrangement required for my study.
I also remain thankful to all the staff of IPMS project from wereda to head office that
facilitated and assisted me in running any expenses of my study. I would like also to thank
Ato Tesfa Mulugeta for his provision of personal Laptop computer during my thesis writing
up with patience.

viii
I am grateful to all brothers and sisters in Jesus Christ who prayed and encouraged me
morally for my study. I would like also to thank Bati Full Gospel Belivers Church, Haramaya
for providing me with all the necessary spiritual support.
Last but not least my special thank go to my wife w/ro Woinshet Berhanu for being with me
all the time providing me a moral support, encouragement and prayer while shouldering all
my families burden with patience and endurance. Finally, I express my heartfelt gratitude to
the whole family and my children for their prayer and all inconvenience they have during my
absence for academic and research work.

ix
ABBREVIATIONS
AI Adoption Index
CADU Chilalo Agricultural Development Unit
CBD Coffee Berry Disease
CIP Coffee Improvement Project
Cms Centimeters
CSA Central Statistical Authority
df Degree of freedom
EPID Extension and Project Implementation Development
GDP Gross Domestic Product
ha. hectare
HHs House Holds
IATP International Agricultural Training Program
IPMS Improving Productivity and Market Successes
Km Kilometers
LIMDEP Limited Dependent Variable
LPM Linear Probability Model
Masl Meter above sea level
MEDAC Ministry of Economic Development and Cooperation
Mm Millimeter
MOA Ministry Of Agriculture

x
PAS
ABBREVIATIONS (Continued)
Peasant Association
PPS Proportional to Size
RAO Regional Agricultural Office
SNNPRS Southern Nation, Nationalities and Peoples Regional
State
SPSS Statistical Package for Social Science
TLU Tropical Livestock Unit
VIF Variance Inflation Factor
WAO Woreda Agricultural office
WOAD Woreda Organization of Agriculture & Development

xi
TABLE OF CONTENTS
STATEMENT OF AUTHOR ............................................................................. v
BIOGRAPHY ..................................................................................................... vi
ACKNOWLEDGEMENTS ............................................................................. vii
ABBREVIATIONS ............................................................................................ ix
TABLE OF CONTENTS .................................................................................. xi
LIST OF TABLES ........................................................................................... xiii
LIST OF FIGURES ......................................................................................... xiv
LIST OF APPENDICES ................................................................................... xv
Abstract .............................................................................................................. xvi
1. INTRODUCTION ........................................................................................... 1
1.1. Background and Justification ...................................................................................... 1
1.2. Statement of Problem ................................................................................................... 2
1.3. Objectives of the Study ................................................................................................. 4
1.4. Research Questions ....................................................................................................... 4
1. 5. Significance of the Study ............................................................................................. 4
1.6. Scope and Limitation .................................................................................................... 5
2. REVIEW OF LITERATURE ......................................................................... 6
2.1. Rehabilitation of Old Coffee Plants ............................................................................. 6
2.1.1. Rehabilitation by stumping ................................................................................... 6 2.2. Theoretical Perspective of Adoption ........................................................................... 7
2.2.1. Definition of Concepts ........................................................................................... 7 2.2.2. Adoption pattern and factors affecting adoption of technologies...................... 9
2.3. Empirical Studies on the Adoption and Diffusion of Agricultural Technologies . 10
2.3.1 Household’s personal and demographic variables ............................................ 12
2.3.2. Farm characteristics ............................................................................................ 14 2.3.3. Household’s economic variables ......................................................................... 14 2.3.4. Institutional factors .............................................................................................. 16 2.3.5. Psychological related variables ........................................................................... 17
2.4. Conceptual Framework of the Study ........................................................................ 18

xii
TABLE OF CONTENTS (Continued)
3. RESEARCH METHODOLOGY ................................................................. 21
3.1. Description of the Study Area .................................................................................... 21
3.2 Survey Design and Data Collection Method .............................................................. 25
3.2.1. Data collection methods ....................................................................................... 25 3.2.2. Sample size and sampling techniques................................................................. 25
3.3. Analytical Techniques................................................................................................. 29
3.3.1. Determination of intensity ................................................................................... 29 3.3.2. The Tobit Model and specification ..................................................................... 30 3.3.3. Definition of Variables and Working Hypothesis ............................................. 34
4. RESULTS AND DISCUSSION .................................................................... 42
4.1. Analysis through Descriptive Statistics ..................................................................... 42
4.2. Influence of Independent Variables on Adoption of Old coffee Stumping
Technology .......................................................................................................................... 42
4.2.1 Household personal and demographic variables ............................................... 42
4.2.2. Farm characteristics ............................................................................................ 46 4.2.3 Household economic variables ............................................................................. 49 4.2.4 Institutional factors ............................................................................................... 51 4.2.5 Psychological Factors ............................................................................................ 56
4.3. Summary of Result of Descriptive Analysis ............................................................. 62
4.4. Results of the Econometric Model ............................................................................. 63
4.4.1. Determinants of adoption and intensity of adoption of old coffee stumping technology ....................................................................................................................... 68
4.4.2. Effects of changes in the significant explanatory variables on probability of adoption and intensity of adoption of old coffee stumping technology ..................... 72
5. SUMMARY, CONCLUSION AND RECOMMENDATIONS ........ ......... 75
5.1 Summary ....................................................................................................................... 75
5.2. Conclusion and Recommendations............................................................................ 77
REFERENCES ................................................................................................... 80
7. APPENDIX ..................................................................................................... 89
Appendix 1: The Interview Schedule ............................................................................... 89
Appendix 2: Conversion factors used to compute tropical livestock units ................. 111
Appendix 3: Conversion factors used to compute man-equivalent ............................. 111
Appendix 4: List of Tables in Appendix ........................................................................ 112
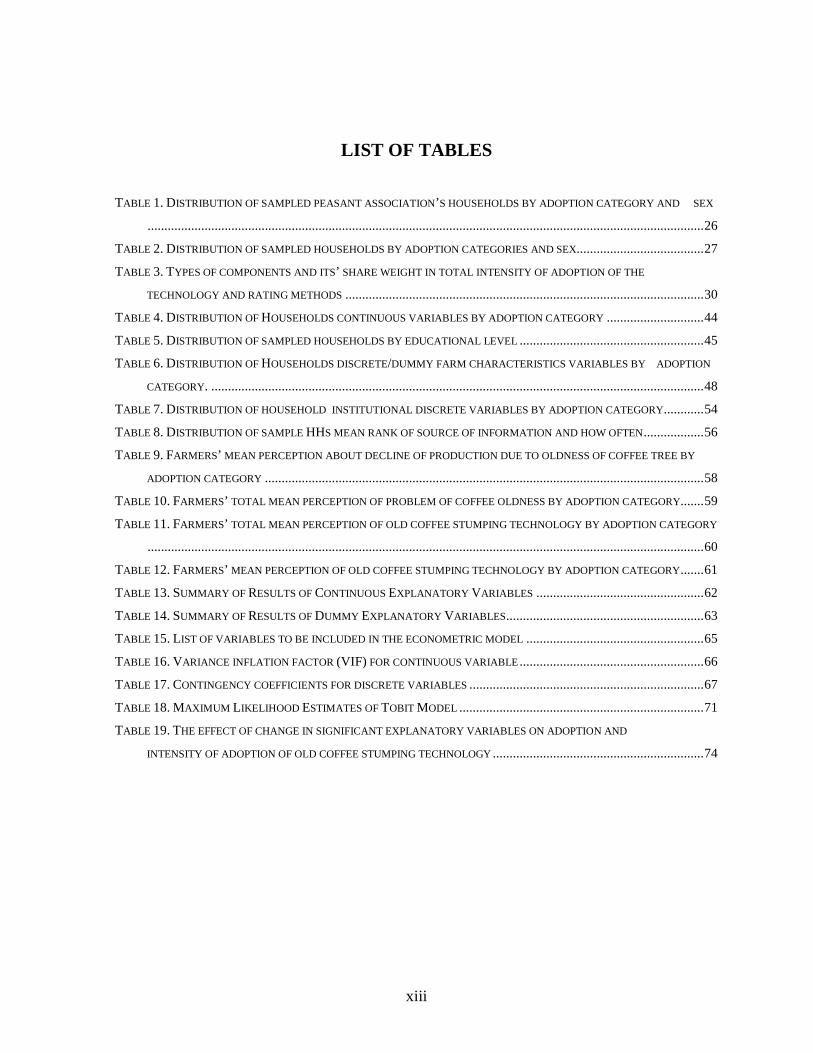
xiii
LIST OF TABLES TABLE 1. DISTRIBUTION OF SAMPLED PEASANT ASSOCIATION’S HOUSEHOLDS BY ADOPTION CATEGORY AND SEX
...................................................................................................................................................................... 26
TABLE 2. DISTRIBUTION OF SAMPLED HOUSEHOLDS BY ADOPTION CATEGORIES AND SEX...................................... 27
TABLE 3. TYPES OF COMPONENTS AND ITS’ SHARE WEIGHT IN TOTAL INTENSITY OF ADOPTION OF THE
TECHNOLOGY AND RATING METHODS ........................................................................................................... 30
TABLE 4. DISTRIBUTION OF HOUSEHOLDS CONTINUOUS VARIABLES BY ADOPTION CATEGORY ............................. 44
TABLE 5. DISTRIBUTION OF SAMPLED HOUSEHOLDS BY EDUCATIONAL LEVEL ....................................................... 45
TABLE 6. DISTRIBUTION OF HOUSEHOLDS DISCRETE/DUMMY FARM CHARACTERISTICS VARIABLES BY ADOPTION
CATEGORY. ................................................................................................................................................... 48
TABLE 7. DISTRIBUTION OF HOUSEHOLD INSTITUTIONAL DISCRETE VARIABLES BY ADOPTION CATEGORY............ 54
TABLE 8. DISTRIBUTION OF SAMPLE HHS MEAN RANK OF SOURCE OF INFORMATION AND HOW OFTEN .................. 56
TABLE 9. FARMERS’ MEAN PERCEPTION ABOUT DECLINE OF PRODUCTION DUE TO OLDNESS OF COFFEE TREE BY
ADOPTION CATEGORY ................................................................................................................................... 58
TABLE 10. FARMERS’ TOTAL MEAN PERCEPTION OF PROBLEM OF COFFEE OLDNESS BY ADOPTION CATEGORY....... 59
TABLE 11. FARMERS’ TOTAL MEAN PERCEPTION OF OLD COFFEE STUMPING TECHNOLOGY BY ADOPTION CATEGORY
...................................................................................................................................................................... 60
TABLE 12. FARMERS’ MEAN PERCEPTION OF OLD COFFEE STUMPING TECHNOLOGY BY ADOPTION CATEGORY ....... 61
TABLE 13. SUMMARY OF RESULTS OF CONTINUOUS EXPLANATORY VARIABLES .................................................. 62
TABLE 14. SUMMARY OF RESULTS OF DUMMY EXPLANATORY VARIABLES ........................................................... 63
TABLE 15. LIST OF VARIABLES TO BE INCLUDED IN THE ECONOMETRIC MODEL ..................................................... 65
TABLE 16. VARIANCE INFLATION FACTOR (VIF) FOR CONTINUOUS VARIABLE ....................................................... 66
TABLE 17. CONTINGENCY COEFFICIENTS FOR DISCRETE VARIABLES ...................................................................... 67
TABLE 18. MAXIMUM LIKELIHOOD ESTIMATES OF TOBIT MODEL ......................................................................... 71
TABLE 19. THE EFFECT OF CHANGE IN SIGNIFICANT EXPLANATORY VARIABLES ON ADOPTION AND
INTENSITY OF ADOPTION OF OLD COFFEE STUMPING TECHNOLOGY ............................................................... 74

xiv
LIST OF FIGURES
FIGURE 1. CONCEPTUAL FRAME-WORK OF FACTORS AFFECTING INTENSITY & ADOPTION OF OLD
COFFEE STUMPING TECHNOLOGY ...................................................................................... 20
FIGURE 2. LOCATION OF THE STUDY AREA ................................................................................ 24
FIGURE 3. SKETCH OF SAMPLING PROCEDURE ........................................................................... 28

xv
LIST OF APPENDICES
Appendix 1: The interview Schedule ………………………………………………......92 Appendix 2: Conversion factors used to compute tropical livestock units…………….114 Appendix 3: Conversion factors used to compute man-equivalent……………............ 114 Appendix 4: List of tables in the Appendix.....................................................................115

xvi
DETERMINANTS OF INTENSITY OF ADOPTION OF OLD COFFEE STUMPING
TECHNOLOGY IN DALE WEREDA, SNNPRS, ETHIOPIA
Abstract Coffee is the main cash and export crop in Southern Ethiopia as well as in the whole Ethiopia. The country’s export earnings from this crop exceeds all other agricultural products. Low production and productivity, which are mainly associated with poor adoption of improved technology, oldness of coffee trees and poor pruning and recycling system, especially stumping, were among the major problems. Adoption of improved technologies is one of the most promising ways to increase productivity and production in Ethiopia. However, the adoption and dissemination of these technologies is constrained by various factors. To this end, the aim of this study was to empirically examine factors affecting adoption and intensity of adoption of old coffee stumping technology in the study area. Four-stage sampling procedure was followed to select rural kebeles and households for the study. First, 59 coffee grower PAs were selected purposively from 79 PAs. Second, the 59 PAs were stratified based on their coffee production potential as specialized coffee PAs and diversified PAs, 42 and 17 PAs accordingly. Thirdly, proportional to size four PAs were selected, 3 from specialized and one from diversified. Finally 160 coffee grower household heads were selected randomly using probability proportional to size sampling. Structured interview schedule was developed, pre-tested and used for collecting the essential quantitative data for the study from the sampled households. Focus group discussion was used to generate qualitative data. In addition, secondary data were collected from relevant sources such as wereda office of Agriculture and others. The result of the study indicated that majority of farmers in the study area did not prefer stumping to solve problems of low productivity due to old age of coffee trees. Instead of stumping, they preferred to wait with this limited production, because they are feared that even may loss the whole production. Moreover, farmers’ practice was found largely to deviate from research and extension recommendation specially the management which is done after stumping. Results of the econometric model indicated that households perception about the problem of coffee oldness and decline of production, participation in extension events like field day visit and frequency of visit, education, types of social participation, having of old coffee which could be stumped, producing coffee seedlings (participation in other extension activity) and getting coffee plants from common holdings were important variables which had positively and significantly influenced adoption and intensity. The overall findings of the study underline the importance of institutional support in the area of extension especially creating awareness on the problem of coffee oldness and decline of production; and the research should show tangibly the production increment of stumping. Therefore, policy and development interventions should give emphasis to improvement of such institutional support system so as to achieve wider adoption of old coffee stumping technology.

1
1. INTRODUCTION 1.1. Background and Justification
Agriculture is the basis of the Ethiopian economy. It accounts about 50 percent of the GDP
and 90 percent of the total export revenue and employs 85 percent of the country’s labor
force. It also provides 70 percent of raw materials requirement of the country’s industries
(MEDAC, 1999). From the Agricultural sector coffee is now the most important export
commodity crop originated in the high land forest areas of south- west Ethiopia. It is the
nucleus of the Ethiopia economy accounting 60% of the country’s export. About 1.2 million
coffee farmers with their 15 million house holds directly or indirectly depend on coffee for
their livelihoods (Oxfam International, 2002). At a national level, coffee production system is
classified into three: forest coffee, cottage coffee and plantation coffee (Meseret, 1998). On
the other hand, Demel (1999) divided the system into four: forest coffee, semi forest coffee
garden coffee (which had previously been called cottage coffee) and plantation coffee. Forest
coffee, in contrast to home garden coffee, is collected from natural forests where chemical
inputs like herbicide, pesticide, fungicide and inorganic fertilizes are not used as agricultural
inputs. Much of the coffee produced in Ethiopia is from forest coffee. According to Demel
(1999) the total area under coffee production is 0.4 million hectares; 95% of the total
production comes from subsistence farmers who have neither the capacity nor the access to
use agricultural inputs. Technology can play an important role in increasing production and
incomes in the economic development of a country. It is, therefore, crucial to introduce
suitable farm technologies and facilitate adoption of technologies.
New agricultural technologies are put to use on the basis of their potential to increase income.
Often new technologies are not taken by farmers, either because they do not meet the intended
objectives or simply unforeseen constraints prevent their adoption. The questions of
technology adoption are vital concerns to researchers, extension specialists, planners, and
rural development policy makers. In Developing Countries such as Ethiopia, it is necessary to
find out the reasons why new technologies have not been adopted widely by farmers as
2
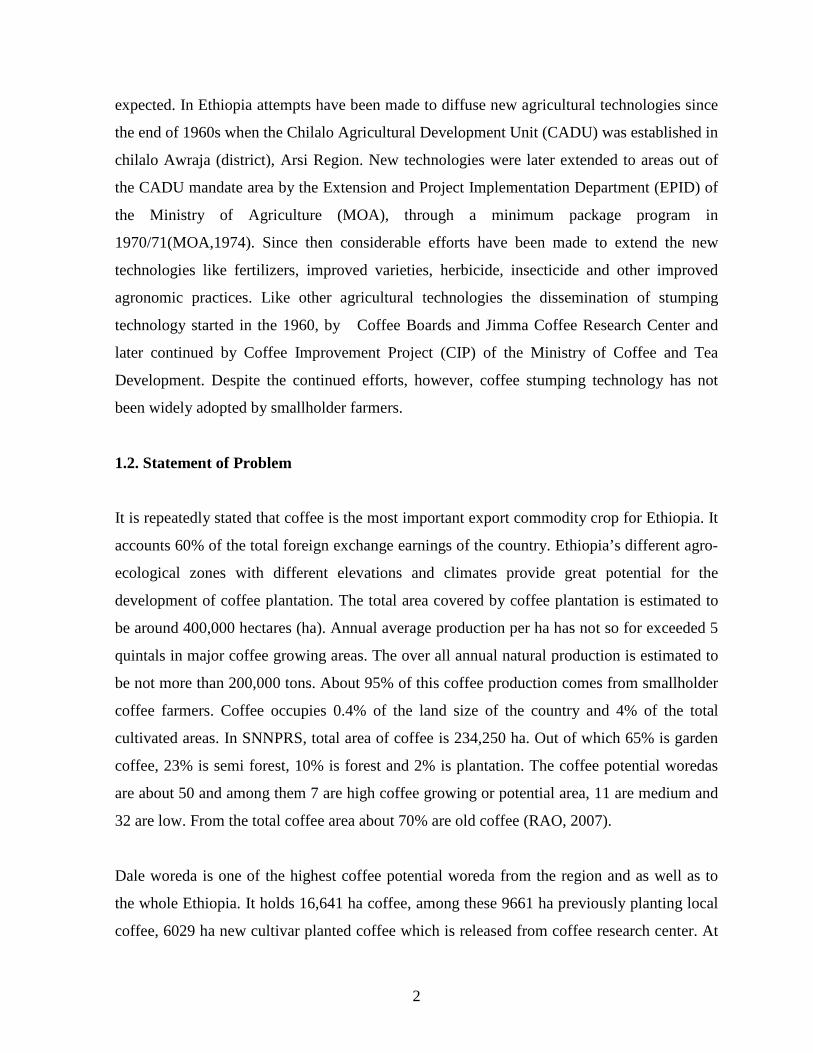
expected. In Ethiopia attempts have been made to diffuse new agricultural technologies since
the end of 1960s when the Chilalo Agricultural Development Unit (CADU) was established in
chilalo Awraja (district), Arsi Region. New technologies were later extended to areas out of
the CADU mandate area by the Extension and Project Implementation Department (EPID) of
the Ministry of Agriculture (MOA), through a minimum package program in
1970/71(MOA,1974). Since then considerable efforts have been made to extend the new
technologies like fertilizers, improved varieties, herbicide, insecticide and other improved
agronomic practices. Like other agricultural technologies the dissemination of stumping
technology started in the 1960, by Coffee Boards and Jimma Coffee Research Center and
later continued by Coffee Improvement Project (CIP) of the Ministry of Coffee and Tea
Development. Despite the continued efforts, however, coffee stumping technology has not
been widely adopted by smallholder farmers.
1.2. Statement of Problem
It is repeatedly stated that coffee is the most important export commodity crop for Ethiopia. It
accounts 60% of the total foreign exchange earnings of the country. Ethiopia’s different agro-
ecological zones with different elevations and climates provide great potential for the
development of coffee plantation. The total area covered by coffee plantation is estimated to
be around 400,000 hectares (ha). Annual average production per ha has not so for exceeded 5
quintals in major coffee growing areas. The over all annual natural production is estimated to
be not more than 200,000 tons. About 95% of this coffee production comes from smallholder
coffee farmers. Coffee occupies 0.4% of the land size of the country and 4% of the total
cultivated areas. In SNNPRS, total area of coffee is 234,250 ha. Out of which 65% is garden
coffee, 23% is semi forest, 10% is forest and 2% is plantation. The coffee potential woredas
are about 50 and among them 7 are high coffee growing or potential area, 11 are medium and
32 are low. From the total coffee area about 70% are old coffee (RAO, 2007).
Dale woreda is one of the highest coffee potential woreda from the region and as well as to
the whole Ethiopia. It holds 16,641 ha coffee, among these 9661 ha previously planting local
coffee, 6029 ha new cultivar planted coffee which is released from coffee research center. At

3
the same time 951 ha is newly stumped coffee which is done from 2003 to 2007, which is low
to compare with the existing old coffee area, estimated about 70% from the total area. Also,
the average coffee production of the woreda sent to central market is 4984 tons clean coffee
annually (WAO, 2007). But the farmers and the country have not got the expected benefit as
of having such amount of coffee area and potential, because of market related and different
production problems. Some of the problems related to the production are: inefficient
extension services; traditional cultural practices; old age of coffee trees; lack of credit
facilities; pest and disease; lack of skilled man power; transportation and financial problems
(I ATP, 1995).
Therefore, to improve the production and productivity of coffee and as the result to increase
foreign exchange earnings and benefit farmers from the revenue generated by coffee
production, the Agricultural Extension Offices has introduced many new technologies.
Among the introduced technologies, coffee stumping technology is the one to alleviate or
solve problem of decline of production due to age of coffee trees. And because of this, at this
time stumping is a very great issue of government, and agricultural and rural development
offices. But the factors that influence adoption of technologies are not studied and well under
stood. Also the rate and intensity of the technology adoption is not well known at this time.
This is especially true for Dale woreda where adoption studies have not been done on old
coffee stumping technologies up to present. The adoption of agricultural technologies in
developing countries attracts considerable attention because it can provide the basis for
increasing production and income. Small-scale farmers’ decisions to adapt or reject
agricultural technologies depend on their objectives and constraints as well as cost and benefit
accruing to it (Million and Belay, 2004). The problem is, therefore, to determine factors that
positively or negatively affect the adoption and intensity of adoption of new technologies in
the study area.
4
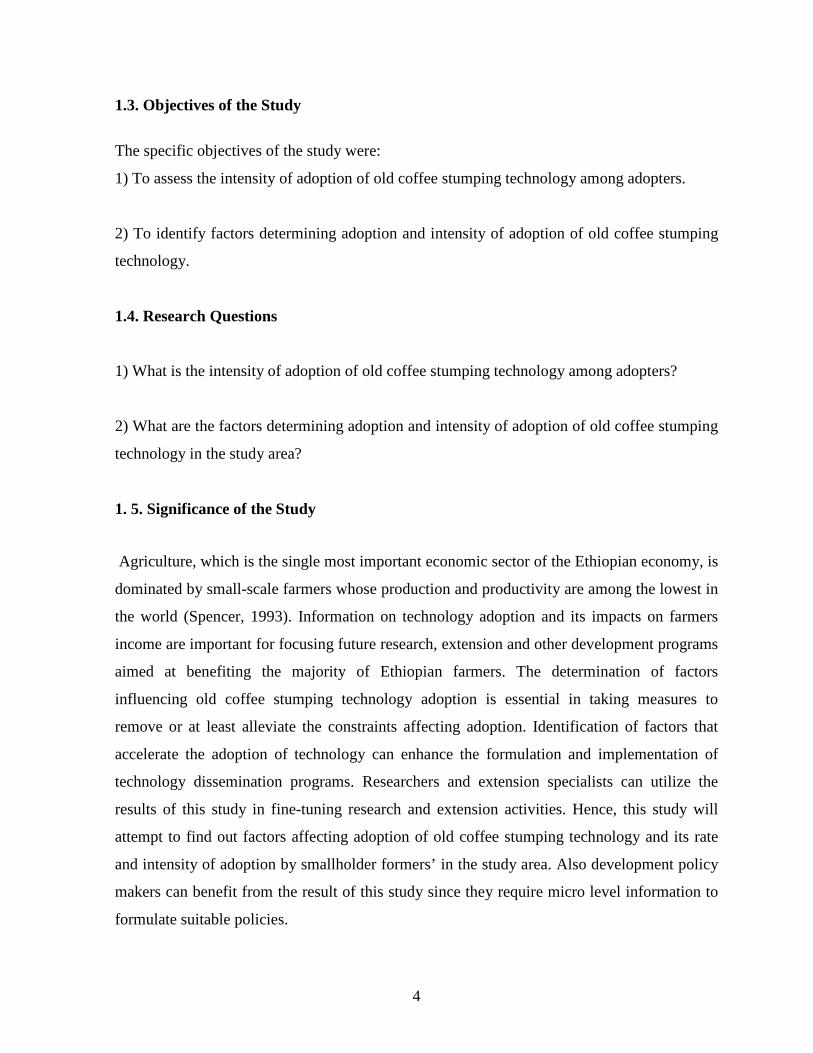
1.3. Objectives of the Study
The specific objectives of the study were:
1) To assess the intensity of adoption of old coffee stumping technology among adopters.
2) To identify factors determining adoption and intensity of adoption of old coffee stumping
technology.
1.4. Research Questions
1) What is the intensity of adoption of old coffee stumping technology among adopters?
2) What are the factors determining adoption and intensity of adoption of old coffee stumping
technology in the study area?
1. 5. Significance of the Study
Agriculture, which is the single most important economic sector of the Ethiopian economy, is
dominated by small-scale farmers whose production and productivity are among the lowest in
the world (Spencer, 1993). Information on technology adoption and its impacts on farmers
income are important for focusing future research, extension and other development programs
aimed at benefiting the majority of Ethiopian farmers. The determination of factors
influencing old coffee stumping technology adoption is essential in taking measures to
remove or at least alleviate the constraints affecting adoption. Identification of factors that
accelerate the adoption of technology can enhance the formulation and implementation of
technology dissemination programs. Researchers and extension specialists can utilize the
results of this study in fine-tuning research and extension activities. Hence, this study will
attempt to find out factors affecting adoption of old coffee stumping technology and its rate
and intensity of adoption by smallholder formers’ in the study area. Also development policy
makers can benefit from the result of this study since they require micro level information to
formulate suitable policies.

5
1.6. Scope and Limitation
This study was undertaken in Dale woreda which is one of the major coffee growing areas in
SNNPR state. As any other technology adoption, old coffee stumping technology is
influenced by many factors. A factor which is found to enhance adoption of a particular
technology in one locality at one time might be found to hinder it or to be irrelevant for
adoption of the same technology in another locality at the same or different time for the same
or different technology or the other way round. From these conflict results that it is difficult to
identify universally defined factors either impeding or enhancing adoption of technology.
Therefore, this study which was undertaken in this woreda is important due to the above
reasons. On the other hand, since this study was limited by time, financial constraints and
human resources it is restricted to the above mentioned woreda and therefore, we couldn’t
conclude from the result gained to the whole coffee growing area of Ethiopia, except having
practical validity mainly to areas having similar feature with the selected woreda.

6
2. REVIEW OF LITERATURE
The literature review encompasses rehabilitation of old coffee by stumping, definition of
concepts, theories of behavioral change and selected behavioral change models, conceptual
framework, and empirical adoption studies.
2.1. Rehabilitation of Old Coffee Plants
After the establishment of a coffee farm, the trees generally remain productive for eight crops
before they reach the stage of exhaustion. The rehabilitation of coffee trees at this age is very
important as the yield starts to become uneconomic. To make the trees economically
productive again, they need to be pruned to cut out old, unproductive wood and stimulate the
growth of new wood that will bear fruit. There are various methods of old coffee tree
rehabilitation. The major rehabilitation methods are stumping, side pruning and in some cases
topping (Ren’e Coste, 1992).
2.1.1. Rehabilitation by stumping
Stumping is the systematic renewal of old coffee plants and can take a number of forms, but
the most known and largely applied in our country is clean stumping. Clean stumping should
be carried out as soon as after the harvesting of the previous crop has been completed. This
will counter the temptation to leave the old stem which might have flowered or budded and
shown some crop potential. The cutting of the coffee tree should be done with a saw at an
angel of 450 and a height of about 40 cms. Any rough edge on the cut should be pared off with
a sharp knife (Ren’e Coste, 1992).
2.1.1.1. De-suckering
After stumping, the coffee stump will start producing a mass of new suckers at about 10cm
long; there should be a first selection of the most vigorous growth of four suckers being

7
chosen from the ones on the out side of the stump system. These four suckers should be
reduced further to the two strongest and most vigorous, preferably on opposite sides of the
stump, when they attain a length of about 20 cms, and also there should be subsequent sucker
control (Ren’e Coste, 1992).
2.1.1.2. Inter planting
It is customary in some areas, like south and west regions of Ethiopia to inter plant food crops
between rows of coffee. In these cases only dwarf varieties of beans and peas should be
planted. In no circumstances should tall crops such as maize, Horse Beans, or runner Beans be
used, as these restrict the light requirements of the coffee plant or sucker, making the growth
weak and spindly. The inter planted crop should be planted in rows down the center of the
strip of land between the coffee tree rows, so that there is a space of at least 50 cms between
the coffee and food crops.
2.2. Theoretical Perspective of Adoption
2.2.1. Definition of Concepts
Adoption of technological innovations in agriculture has attracted considerable attention
among development economists because the majority of the population of less developed
countries derives their livelihood from agricultural production and a new technology, which
apparently offers opportunities to increase production and productivity (Feder et al., 1985). It
is also believed that the use of new technologies in farming is a crucial means to lift up
production and productivity of the resources used in the subsistence agriculture. New
technologies enable the farmer to produce more by using available farm resources. More
effectively, innovations in agriculture and their adoption are important in improving food
security at the family, village and national levels (Ashri, 1996).
The adoption of an innovation within a social system takes place through its adoption by
individuals or groups. According to Feder et al. (1985), adoption may be defined as the

8
integration of an innovation into farmers’ normal farming activities over an extended period
of time. Dasgupta (1989) also noted that adoption, however, is not a permanent behavior. This
implies that an individual may decide to discontinue the use of an innovation for a variety of
personal, institutional, and social reasons one of which might be the availability of another
practice that is better in satisfying farmers’ needs.
Rogers (1983) defines the adoption process as the mental process through which an individual
passes from first hearing about an innovation or technology to final adoption. This indicates
that adoption is not a sudden event but a process. Farmers may not accept innovations
immediately; they need time to think over things before reaching a decision.
Colman and Young (1989) define adoption as it relates to the use or non-use of a particular
innovation by individuals (Say farmers) at a point in time or during an extended period of
time. Adoption, therefore, presupposes that the innovation (technological change) exists and
studies of the adoption process analyze the reasons or determinants of whether and when
adoption takes place. In the words of Yapa and Mayfield (1978) the adoption of an
entrepreneurial innovation by an individual requires the satisfaction of at least three
conditions. These are (i) the availability of sufficient information (ii) the existence of a
favorable attitude towards the innovation, and (iii) the physical availability of the innovation.
In the context of aggregate adoption as opposed to the final adoption at the individual farmer
level, diffusion is defined as the process of spread of a new technology within a region
(Rogers, 1983). In other words, diffusion is a cumulative process of adoption measured in
successive time periods (Colman and Young, 1989). The introduction of agricultural
innovation into a given geographical area in a given period of time may be through both
private and public initiatives and the rate of diffusion depends on, among other things,
extension communication, the extent to which farmers discuss agricultural issues among them
selves on a day to day basis and consistency of performance with the message (Fliegel, 1984).
Following a lucid and extended description of an innovation Presser (1969) concluded that an
innovation is something new and novel in human knowledge and experience. Van den Ban

9
and Hawkins (1988) define innovation as an idea, method, or object which is regarded as new
by an individual, but which is not necessarily the result of recent research. An innovation has
a point of origin in place and time. At its point of origin, it must be an innovation, but it is
more commonly called an innovation, a research result, or a new development of some older
idea (s). In time, as knowledge and use of the innovation diffuse to other people in the
surrounding area, the idea ceases to be an innovation in that area.
The rate of adoption is defined as the percentage of farmers who have adopted a given
technology. The intensity of adoption is defined as the level of adoption of a given
technology. The number of hectares planted with improved seed (also tested as the percentage
of each farm planted to improved seed) or the amount of input applied per hectare will be
referred to as the intensity of adoption of the respective technologies (Nkonya et al., 1997).
The importance of agricultural innovations in the transformation process of economies of
developing countries has become, with out doubt, the major concern of governments, citizens
and development agencies alike. Agricultural economists in the development field have made
a particular study of the adoption and diffusion of technical innovation because of the
opportunities for increased output and higher levels of income which technological change
can offer (Colman and Young, 1989).
2.2.2. Adoption pattern and factors affecting adoption of technologies
Leathers and Smale (1991) have identified the following adoption patterns from the large
body of empirical evidence: for the most part, farmers choose to adopt inputs sequentially,
adopting initially only one component of the package and subsequently adding components
overtime, one at a time; in some instances, farmers adopt a component and subsequently
revert to traditional practices; adoption patterns vary by agro ecological zones, between
farmers facing different markets and institutions.
Adoption is not the final event of change but rather a decision-making process. Individuals
pass through various learning and experimenting stages from becoming aware of a problem
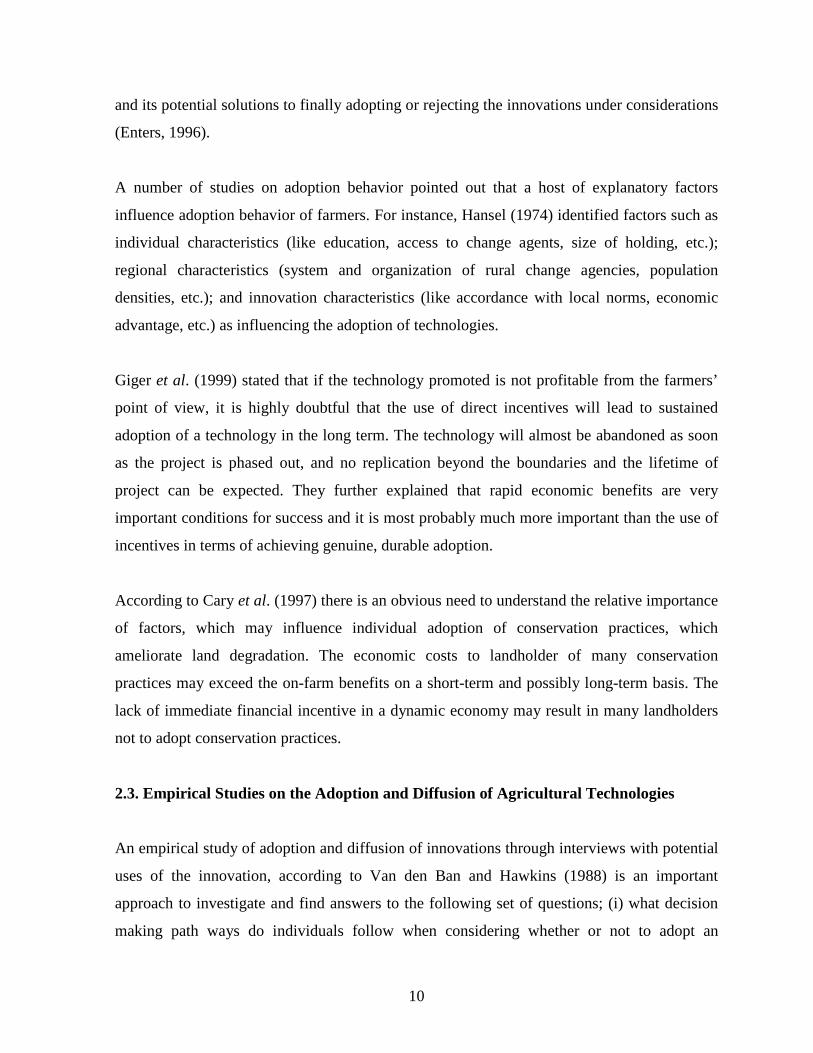
10
and its potential solutions to finally adopting or rejecting the innovations under considerations
(Enters, 1996).
A number of studies on adoption behavior pointed out that a host of explanatory factors
influence adoption behavior of farmers. For instance, Hansel (1974) identified factors such as
individual characteristics (like education, access to change agents, size of holding, etc.);
regional characteristics (system and organization of rural change agencies, population
densities, etc.); and innovation characteristics (like accordance with local norms, economic
advantage, etc.) as influencing the adoption of technologies.
Giger et al. (1999) stated that if the technology promoted is not profitable from the farmers’
point of view, it is highly doubtful that the use of direct incentives will lead to sustained
adoption of a technology in the long term. The technology will almost be abandoned as soon
as the project is phased out, and no replication beyond the boundaries and the lifetime of
project can be expected. They further explained that rapid economic benefits are very
important conditions for success and it is most probably much more important than the use of
incentives in terms of achieving genuine, durable adoption.
According to Cary et al. (1997) there is an obvious need to understand the relative importance
of factors, which may influence individual adoption of conservation practices, which
ameliorate land degradation. The economic costs to landholder of many conservation
practices may exceed the on-farm benefits on a short-term and possibly long-term basis. The
lack of immediate financial incentive in a dynamic economy may result in many landholders
not to adopt conservation practices.
2.3. Empirical Studies on the Adoption and Diffusion of Agricultural Technologies
An empirical study of adoption and diffusion of innovations through interviews with potential
uses of the innovation, according to Van den Ban and Hawkins (1988) is an important
approach to investigate and find answers to the following set of questions; (i) what decision
making path ways do individuals follow when considering whether or not to adopt an

11
innovation? Which sources of information are important? (ii) What are the differences among
people who adopt innovations quickly or slowly? (iii) How do the characteristics of
innovations affect the rate of adoption? (iv) How do potential users communicate among
themselves about these innovations? Who plays the important role of opinion leader in this
communication process? And (v) how does an innovation diffuse through a society over time?
Because of these a number of empirical studies have been conducted by different peoples.
Until 1980 more than 3000 publications have appeared, of which over 2000 represent results
of empirical research on adoption of innovations and detailed analyses of differences between
adopter categories with respect to a host of personal, social and cultural characteristics
(Rogers, 1983). Views and findings are not, however, consistent with respect to the role of
these factors on adoption behavior of farmers and the subject is of considerable controversy
around the globe. No single conclusion has been drawn with respect to the key factors which
favor or impede adoption decision at a given time and place becomes lest impotent or even
induce an impediment on the adoption behaviors of farmers at another time and /or place.
Hence review of empirical works is important for various reasons. First, it helps to assess the
present state of knowledge of the adoption process. Second, it helps to enhance the
interpretation of empirical models and their results and its implications as against the
conceptual or theoretical models (Feder et al., 1985).
However, the study are mainly conducted around major cereals and due to this study
conducted in the area of coffee, perennial crop is scanty. As a result of this, the review mainly
included the studies conducted mainly on cereals, particularly maize and wheat with very few
related horticultural crops. For ease of grouping, the variables so far identified as having
relationship with adoption are categorized as household personal and demographic variables,
socio-economic factors, technology related factors, intervening (psychological) variables and
institutional factors.

12
2.3.1. Household’s personal and demographic variables
Household’s personal and demographic variables are among the most common household
characteristics which are mostly associated with farmers' adoption behavior. From this
category of variables age, sex, education, family size and farming experience were reviewed
in this study.
Age of the household is usually considered with the assumption that older farmers will have
more knowledge and skill with farming which enables them to easily understand the benefits
of the technology better than others. However, with regard to age different studies report
different results. For example a study conducted by Gockowski and Ndoumbe (2004) on the
adoption of intensive mono-crop, horticulture in southern Cameroon indicated that younger
farmers were more likely to adopt and the effect of age on the probability of adoption was
elastic.
Similarly, Mulugeta (1994), on his study on smallholder wheat technology adoption in South
Eastern highlands of Ethiopia reported that age had a negative effect on the adoption of wheat
technologies. In addition, Kidane (2001) on the study he conducted on factors influencing
adoption of improved wheat and maize varieties in Hawzien wereda of Tigray found that age
is negatively related with farmers’ adoption of improved wheat variety. How ever, there are
also others who reported positive relation ship of age with adoption. For instance, Asante-
Mensah and Seepersad (1992), on the study they conducted on factors affecting adoption of
recommended practices by cocoa farmers in Ghana reported positive relationship of age with
adoption.
Gender differentials are one of the most important factors influencing adoption of improved
agricultural technologies. Due to long lasted cultural and social grounds in many societies of
developing countries, women have less access to household resources and also have less
access to institutional services. Regarding the relationship of household’s sex with adoption of
agricultural technologies, many previous studies reported that household’s gender has positive
effect on adoption in favor of males. For example, Techane (2002), in his study on
determinants of fertilizer adoption in Ethiopia found that male headed households are more

13
likely to adopt fertilizer than female headed households. Similarly, Mulugeta et al. (2001),
reported that gender differentials among the farm households was positively influenced
adoption and intensity of adoption of fertilizer use.
With regard to education, there is a general agreement that education is associated with
adoption because education is believed to increase farmers’ ability to obtain, and analyze
information that helps him to make appropriate decision. studies conducted by Itana (1985);
Chilot et al. (1996); Kansana et al. (1996); Asfaw et al. (1997); Mwanga et al. (1998) and
Tesfaye et al. (2001) have reported that education had positive relationship with adoption.
Similarly, Nkonya et al. (1997) reported positive relationship of education with adoption and
intensity of adoption improved maize seed. On the other hand, study conducted by Tesfaye
(2003), on soil and water conservation practices in Wello, Wolaita and Konso areas of
Ethiopia revealed that there is no variation between literacy and illiteracy rates in terms of soil
and water conservation practices.
Family size is one of the other important household demographic variables which have
influence on farmers’ adoption behavior. Large family size usually implies availability of
labor provided that majority or all of the family members are within the age range of active
labor force (15-64 years). In most studies family size had positive relationship with adoption
of improved agricultural technologies. For instance, Kidane (2001) on the study he conducted
on factors influencing adoption of new wheat and maize varieties in Tigray reported positive
and significant relationship of family size with adoption. Similarly, Haji (2003), reported
positive effect of family size on adoption of cross-bred dairy cows. Others, for instance,
Asante-Mensah and Seepersad (1992); Degnet et al. (2001) have also reported similar results.
Contrary to this, Million and Belay (2004) reported that family size negatively affected
adoption of physical soil conservation measures.
Farming experience is another important household related variable that has relationship with
adoption. Longer farming experience implies accumulated farming knowledge and skill which
has contribution for adoption. Many studies supported this argument. Endrias (2003) reported
positive relationship of farming experience in sweet potato production with adoption of sweet

14
potato varieties. Similarly, result of study in Ghana on factors influencing adoption of
recommended cocoa production practices by Asante-Mensah and Seepersad (1992) indicated
positive relationship of experience in cocoa farming with adoption of recommended cocoa
production practices. On the same line, Legesse (1992); Kidane (2001); Melaku (2005) and
Yishak (2005) have reported similar result. Contrary to this, Gockowski and Ndoumbe
(2004) reported negative relationship of farming experience with adoption of intensive mono-
crop, horticulture in southern Cameroon.
2.3.2. Farm characteristics
Farm related variables such as farm size and other farm characteristics influence farmers’
adoption behavior as farm is an important unit where agricultural activities take place.
Concerning farm size, different studies reported its effect differently. For example, a study by
Itana (1985); Mulugeta (2000); Million and Belay (2004) and Yishak (2005) indicated
positive relationship between farm size and adoption. Contrary to this, a study conducted by
Gockowski and Ndoumbe (2004) on the adoption of intensive mono-crop horticulture in
southern Cameroon reported the negative relation of farm size with adoption. Similarly,
Legesse (1992) and Degnet et al. (2001) reported negative relationship between farm size and
adoption.
2.3.3. Household’s economic variables
Economic factors influence household’s adoption decision of agricultural technologies.
According to Semgalawe (1998), economic factors such as household’s resource ownership
and economic objectives play a great role in determining the willingness and ability to invest
in the adoption of agricultural technologies.
In rural context, livestock holding is an important indicator of household's wealth position.
Livestock are also an important income sources which enables farmers to invest on the
adoption of improved agricultural technologies. No doubt that in most cases, livestock

15
holding has positive contribution to household’s adoption of agricultural technologies. This is
evident from many of the past adoption studies which have reported positive effect of
livestock holding on adoption. To mention some of them, for instance, Chilot (1994); Degnet
et al. (2001); Kidane (2001); Birhanu (2002); Techane (2002) and Endrias (2003) have found
that livestock holding has positive influence on adoption of improved agricultural
technologies.
Households’ income position is one of the important factors determining adoption of
improved technologies. In the context of rural households, annual farm income obtained from
sale of crop and/or livestock, off-farm and non-farm income are important income sources.
Regarding annual farm income, almost all empirical studies reviewed shows the effect of farm
income on household’s adoption decision is positive (Degnet et al., 2001; Kidane, 2001;
Getahun, 2004 and Gockowski and Ndoumbe, 2004).
Off-farm and non-farm activities are the other important activities through which rural
households get additional income. The income obtained from such activities helps farmers to
purchase farm outputs. Review of some of the past empirical studies shows that the findings
regarding the influence of off-farm/ non-farm income on adoption vary from one study to the
other. However, majority of the studies reported positive contribution of off-farm and non-
farm income to household’s adoption of improved agricultural technologies. For instance, a
study conducted by Kidane (2001); Mulugeta et al. (2001); Birhanu (2002) and Mesfin (2005)
indicated positive relationship between off-farm / non-farm income and adoption. Contrary to
this, Techane (2002) in his study on determinants of fertilizer adoption in Ethiopia reported
the negative influence of participation in off-farm income on farmers’ adoption of chemical
fertilizer.
Availability of household labor is the other important variable which in most cases has an
effect on household’s decision to adopt new technologies. Several studies reported the
positive effect of household labor availability on adoption of improved agricultural
technologies. For instance, Million and Belay (2004) in their study on factors influencing

16
adoption of soil conservation measures in southern Ethiopia found positive effect of
household’s labor availability on adoption of soil conservation measures.
2.3.4. Institutional factors
Farmers make decisions within a broader environment or context. Institutional factors are
part of such broader environment which affects farmers’ adoption decision of agricultural
technologies. Institutional factors in the context of this study include support provided by
various institutions and organizations to enhance the use of improved technologies such as
extension and credit services and other inputs. Extension provides farmers with information
related to agricultural technologies. In collaboration with other organizations or alone, it can
also channel credits and other incentives to the farming community to enable them improve
production and productivity.
The relationship between farmers’ access to extension services and adoption has been
repeatedly reported as positive by many authors. For example, study conducted by Kansana et
al. (1996) indicated that participation in training, access to communication sources and
number of information sources had positive association with level of knowledge and adoption
of improved wheat varieties. Similarly, Nkonya et al. (1997) reported that visit by extension
agents had positive influence on improved maize and fertilizer in Northern Tanzania. Many
other authors such as Aregay (1980); Chilot et al.(1996); Degnet (1999); Kidane (2001);
Tesfaye et al. (2001); Birhanu (2002); Techane (2002); Endrias (2003) and Haji (2003) also
reported positive relationship of access to extension and adoption of agricultural technologies.
Other sources of information such as mass media and neighboring farmers in the area are also
important in diffusion of agricultural innovations. Particularly, interpersonal communication
networks among farmers are important and reported in many studies to have positive
influence on farmers’ adoption decision. Mass media also plays the greatest role in provision
of information in the shortest possible time over large area of coverage. Many studies reported
positive relationship of mass media with adoption of agricultural technologies (Yishak, 2005).

17
The other institutional support that farmers need to get to improve production and
productivity is, credit service and other inputs. Capital and risk constraints are key factors that
limit the adoption of high value crops by small scale farmers because these crops generally
are much more costly to produce per hectare than traditional crops and most growers require
credit to finance their production. In line with this, study conducted by Gockowski and
Ndoumbe (2004) on the adoption of intensive mono-crop horticulture in Southern Cameroon
indicated that cash requirements for intensive horticulture production combined with the
failure of formal rural credit institutions significantly affected adoption of especially resource
poor households.
Similarly, other authors who conducted studies on adoption of cereals (wheat and maize) such
as Legesse (1992); Mulugeta (1994); Chilot et al. (1996); Kansana et al. (1996); Asfaw et al.
(1997); Bekele et al. (1998); Mwannga et al. (1998); Wolday (1999) and Tesfaye et al. (2001)
have also reported positive relationship of credit with adoption of improved technologies by
farmers. Timely availability of inputs, input and output prices are also another important
issues which is expected to have influence on household’s adoption behavior. Particularly the
production of horticultural crops is highly linked with market conditions (price & market
access) for inputs and outputs. Study conducted by Wolday (1999) indicated that price is
significantly related to use of improved seeds. Similarly, Itana (1985) reported positive
relationship of output price with adoption of improved varieties.
2.3.5. Psychological related variables
Behavioral change process involves decision-making, which implies cognitive engagement in
deciding whether to adopt or reject a given innovation (Koch, 1986). According to Duvel
(1991), psychological related factors which he distinguished as needs, perception and
knowledge are the most important determinants of farmers’ adoption behavior. Many of the
studies which have considered these variables reported their significant relationship with
adoption behavior. To mention some, a study conducted in Sera-Leone by Adesina and
Zinnah (1993) showed that farmers’ perception of specific characteristics of technology
18
significantly condition adoption decision. They further indicated that the omission of such
variables in adoption model might bias the results of factors determining adoption decision of
farmers by ignoring their possible and important influence on adoption behavior. Similarly,
Chilot et al. (1996) found that perceived relative profitability of improved wheat variety over
the traditional one has significantly affected adoption.
Different studies have been conducted in South Africa to see the effect of intervening
variables particularly need and perception on adoption behavior. For example, studies
conducted by Botha (1986); Louw & Duvel (1993) and Duvel & Botha (1999) confirm the
positive and significant relationship of perception with adoption behavior. Similarly, Botha
(1986) indicated that farmers’ technical know-how of the innovation is important in adoption.
On the other hand, a study conducted by Abd-Ella et al. (1981) on adoption behavior in
family farm systems in Iowa indicated that knowledge about the recommended farming
practices is positively related with adoption.
Mulugeta (1994) in his analysis of smallholder wheat production and technology adoption in
south eastern highlands of Ethiopia also indicated that farmers’ knowledge of recommended
fertilizer application rates was the critical variable influencing the decision to use higher rates
of fertilizer per hectare. A study by Degnet (1999) also reported that adopters were found to
have better knowledge on fertilizer application than non-adopters did.
2.4. Conceptual Framework of the Study
Adoption decisions of different technologies across space and time are influenced by
different factors and their associations. Factors such as personal, socioeconomic, institutional
and psychological factors determine the probability of adoption and use intensity of
technologies such as old coffee stumping technology. It is obvious that different studies have
been conducted to look into the direction and magnitude of the influence of different factors
on farmers’ adoption decision of agricultural technologies. A factor, which is found to
enhance adoption of a particular technology in one locality at one time, was found to hinder it
or to be irrelevant to adoption of the same technology in another locality. Although some
known determinants tend to have general applicability; it is difficult to develop a universal
19
model of the process of technology adoption with defined determinants and hypotheses that
hold to everywhere. The dynamic nature of the determinants and the distinctive nature of the
areas make it difficult to generalize what factors influence which technology adoption.
The framework emphasized mainly on the relationship of the explanatory variables with the
dependent variable. The relationship between explanatory variables was not shown in the
diagram. This does not mean that there is no relationship between explanatory variables, but
simply to concentrate on their relationship with the dependent variable rather than relationship
among themselves. Hence, the following conceptual framework depicted the most important
variables expected to influence the adoption of old coffee stumping technology considering
the study area specifically.

20
Figure 1. Conceptual frame-work of factors affecting intensity & adoption of old coffee stumping technology
Source: Based on Düvel; cited in Habtemariam (2004), modified.
Asset endowment and other
income source
Institution al variables
Household, personal & demographic factors
Farm characteristics
Adoption and intensity of adoption of old coffee stumping technology
Psychological related variable

21
3. RESEARCH METHODOLOGY
3.1. Description of the Study Area
Dale Woreda is one of the10 Woredas in Sidama Zone covering a total area of 1,411 km2, at
about 320 km south of Addis Ababa. The Woreda is subdivided into 76 PAs. According to
CSA (2003), the population of the Woreda is estimated at 369,548 of which female account
for 57.6% of the population. The altitude of the Woreda ranges from 1170 masl around Lake
Abaya to the west, reaching about 3200 masl in the eastern part of the Woreda. The altitude at
Yirgalem, which is the Woreda headquarter, is 1765 masl.
The mean annual rainfall recorded at Awada Research sub-centre in Yirgalem is 1314 mm.
Rainfall declines as one move from the highlands in the east to the lowlands in the west.
There are two cropping seasons in the area, Belg (short rainy season) from March to April and
Meher (main rainy season) from June to September. Belg rains are mainly used for land
preparation and planting long cycle crops such as maize and seedbed preparation for Meher
crops. The Meher rains are used for planting of cereal crops like barley, teff, wheat and
vegetable crops. Meher rains are also responsible for the growth and development of
perennial crops such as enset, coffee and chat. Livestock also play a major role in crop
production in areas of the mid highlands and lowlands for cereal production (draught power)
in addition to meat and milk; it also denotes prestige and asset to the households.
Farming systems
According to IPMS (2005), two main farming systems can be found in Dale Woreda. The
garden coffee, enset, and livestock (hereafter referred to as coffee/livestock system) system is
found east of the main road transecting Dale from north to south. The terrain is hilly and soils
are red (Nitosols). Rainfall is higher and more reliable than in the dry midlands haricot
bean/livestock system. The farming system is composed of garden coffee, enset, and cattle,
which are tethered and kept for manure and production of dairy products. Other crops in the
system are haricot beans (as an intercrop), yam, cereals, fruits, mainly avocado and bananas.

22
Because of the perennial nature of the crop and the small holding size (between 0.25-0.5 ha
per family), hand hoeing is the predominant method of cultivation.
The Cereals, enset, haricot beans, garden coffee, and livestock (here after referred to as
haricot bean/livestock system) system is the other main farming system in Dale Woreda. This
system is found west of the road transecting Dale from North to South. The terrain varies
from relatively flat to hilly. Black soils (Pellic Vertisols) are commonly found on the flat
areas and red soils on the slopes (IPMS, 2005). Rainfall is lower and more erratic than in the
coffee system. This system is dominated by cereals (maize, teff) rotated with haricot beans.
Enset is cultivated near the homesteads. Garden coffee is grown in small patches, on the red
soils. Extensive grazing areas are found, which are used for herding the oxen, cattle and goats.
Average farm size is estimated at 1.5 ha. The farmers use oxen for their cultivation. Besides
these two major systems, two smaller systems can be found, one in the extreme east at the
high altitude where farmers grow horticultural crops (shallots) and the other one in the
extreme west, near Lake Abaya where a pastoralist system is found (IPMS, 2005).
Crop Production
The government is clear in its strategy for a market led development in that it has chosen two
crops for this woreda. That are, Coffee and Haricot bean (white variety-Awash 1). According
to the available statistics, the area under coffee is 16,641 ha and a total of 9.3 million kg of
red cherry was sold in 2002/03 and 5.7 million in 2003/04. Garden coffee improvement is
being promoted predominantly in the coffee/livestock system. A total of 42 PAs have been
targeted for this specialization, while, there are 59 PAs where coffee is grown. The
commercialization of the haricot beans is targeted for the haricot bean/livestock farming
system. The area under beans at the moment is still small i.e, 2,300 ha and the estimated
production is 670 tons. A total of 22 PAs are targeted for specialization. The government
intends to commercialize haricot bean for export purposes, using the Awash 1 variety (small
white seeds). This is a new introduction to the area which can either be added to and/or
replace the area already sown with the local red Wollayta variety (IPMS, 2005).

23
Livestock
The main livestock species in the Woreda are cattle, goats and sheep. The livestock resources
are cattle 225,698 (82,666 local cows and 1584 crossbred dairy animals, 80% are in urban and
peri-urban areas); sheep 30,152; Goats 31,443; Poultry 218,923; Horses 2,498; Mules 431;
Donkeys 16,321; and Beehives 10,949. Production systems range from extensive system in
the lowlands (haricot bean/livestock system) to intensive tethered system in the major
coffee/livestock system. Sheep production is important in the Dega (highlands) areas. Cattle,
sheep and goat production is major in the mid-altitudes and goat, cattle, and sheep production
are important in the lowland or Kolla areas. Land preparation is mainly done by oxen power
in the coffee/livestock system or human power using hoe in the coffee/livestock, depending
on land size and availability of oxen. Oxen ownership is very low and farmers share their
oxen for ploughing. In the Woreda, only 16% of the farmers have a pair of oxen, 26% have
one ox and 58% have no oxen. There is a large resource of production of skins and hides in
the Woreda. However, only 37% of the marketable skins and hides were officially marketed
in 2004. There is a plan to increase the proportion of marketable skins and hides to 70% in
three years. Production of fattened cattle, goat and sheep has great potential and there is a plan
to enhance meat production in the Woreda. The poultry production system is traditional using
local birds. The market-led priority livestock commodities incorporated in the Woreda
development plan are: (1) Dairy Production; (2) Meat production from fattened ruminants
(mainly cattle and goats); (3) Skins and Hides; (4) Poultry production, and (5) Apiculture is
identified as a potential commodity for development (IPMS, 2005).

24
Figure 2. Location of the study area
25
3.2 Survey Design and Data Collection Method
3.2.1. Data collection methods
Both primary and secondary data were used for this study. Primary data related to personal,
socioeconomic, institutional variables and other relevant data were collected. Secondary
information from published and unpublished documents and reports from relevant
organizations were gathered to supplement primary data. Primary data were collected using
quantitative approach by means of household survey. The household survey was carried out
from November to February, 2008. The qualitative method of data collection was also
employed. It consisted of in-depth open-ended interviews, direct observations and written
documents. The interview method was mainly emphasized. Group discussion and individual
interviews were held to have reactions of the farmers concerning their detail experiences and
their perceptions of the technology and their priority problem. Discussions with woreda
experts of the agricultural office and key informants were also conducted.
Before the administration of the structured and semi-structured interview schedules,
exploratory farm surveys were conducted and the respondents were informed about the
objectives of the survey. The interview schedules were pre-tested before actual data collection
and amendments were made to modify some of the questions to make them fit to the context.
Eight enumerators and one supervisor were recruited. They were trained on the objective and
contents of the interview schedule. The eight enumerators conducted the interview in the local
language, Sidamgna with the supervisor and researcher follow-up.
3.2.2. Sample size and sampling techniques This study was conducted in Dale woreda, because of it is one of the sponsor, IPMS project
woreda as well as the working place of the researcher and also the highest coffee growing
woreda in SNNPR and Ethiopia. In this study sample size was determined by taking different
factors such as research cost, time, human resource, accessibility and availability of transport
facility. By taking these factors into account, it was fixed to cover four Peasant Associations

26
out of 59 PAs and 160 household head respondents from the total 3752 household heads of
four sampled PAs. The four stage sampling techniques were applied in sample selection
processes. In the first stage from the total 76 PAs of the woreda 59 coffee grower Peasant
Associations (PAs) were selected based on woreda category purposively. In the second stage
the 59 PAs were stratified into 42 specialized coffee grower PAs and 17 diversified coffee
grower PAs according to Agricultural office of the woreda categorization. In the third stage 3
PAs from specialized coffee grower PAs 1 PA from diversified coffee grower PAs were
selected according to proportional to size (PPS) using simple random selection. In the fourth
stage 160 HHs were selected based on proportional to size and sex from adopters and non-
adopters accordingly from each four PAs of total households who have coffee farms (Table
1&2).
Table 1. Distribution of sampled peasant association’s households by adoption category and sex
PAs Type of
coffee
potential
HHs number by level of adoption and sex in each PAs.
Adopters Non-adopters Total
M F Total M F Total M F Total
Ajewa specialized 248 6 254 624 104 728 872 110 982
Dagia specialized 321 7 328 820 43 863 1141 50 1191
Birachale specialized 286 9 295 475 33 508 761 42 803
Bokasso diversified 113 5 118 637 21 658 750 26 776
Total 968 27 995 2556 201 2757 3524 228 3752
(Source: Woreda Agricultural Office. 2008)

27
Table 2. Distribution of sampled households by adoption categories and sex
Peasant
association
House holds
Adopters Non-adopters Total
M F Total M F Total M F Total
Ajewa 11 0 11 26 5 31 37 5 42
Dagia 14 0 14 35 2 37 49 2 51
Birachale 13 0 13 19 2 21 32 2 34
Bokasso 5 0 5 27 1 28 32 1 33
Total 43 0 43 107 10 117 150 10 160
(Source: Computed from own survey data. 2008)

28
Key: Adp= Adopters; NAdp=Non-adopters; PPS=Proportional to size
Figure 3. Sketch of sampling procedure
Dale woreda 76 PAs
59 Coffee-grower PAs
17PAs (Diversified)
42PAs (Specialized)
1 PAs 3 PAs
PA 4 -Adp. 5 -NAdp.28
PA 3 -Adp. 13 -NAdp.21
PA 2 -Adp. 14 -NAdp.37
PA 1 -Adp. 11 -NAdp.31
160 sampled respondents 117 non-adopters (73%)
43 adopters (27%)
1st Stage
2nd Stage
3rd Stage
4th stage
Purposively
Stratified
PPS
PPS

29
3.3. Analytical Techniques
The data were analyzed using software SPSS version 15.0 and software Limdep version 7.0.
Appropriate techniques and procedures were used in the analysis to identify the influence of
personal, socioeconomic, technical and institutional variables on the adoption decision
process of the technology. Descriptive statistics were used to provide a summary statistics
related to variables of interest. Chi-square test and an independent sample t-test were used to
identify variables that vary significantly between adopters and non-adopter. The chi-square
test was conducted to compare some qualitative characteristics of the adopters and non-
adopters. The t-test was run to see if there is any statistically significant difference between
the mean of the respective adopter and non adopter categories with respect to continuous
variables. The Tobit model was employed to identify the determinants of the technology
package adoption and analyze farmers' probability of technology adoption and the intensity of
adoption. VIF (Variance inflation factor) for association among the metric explanatory
variables and contingency coefficients for categorical variables were used as tests of multi-co
linearity.
3.3.1. Determination of intensity
For multiple practices (package), there are two options of measuring adoption; (i) adoption
index: measures the extent of adoption at the time of the survey or (ii) adoption quotient:
measures the degree or extent of use with reference to the optimum possible without taking
time into consideration. In this study, the first option was employed. Accordingly, adoption
index which shows to what extent the respondent farmer has adopted the whole set of package
was calculated using the following weights.
In order to know the intensity of adoption of old coffee stumping technology, first we had
listed the main component of the technology or package with experts and model farmers and
because of the package components have not equal weights in intensity of adoption
measurement they gave weights for each components as follow(Table.3). And based on this
weight all the adopter respondents’ intensity of adoption is calculated.

30
Table 3. Types of components and its’ share weight in total intensity of adoption of the technology and rating methods
Sr.no Types of components Weights Methods of rating
1 Total area of stumped coffee 0.4 Ratio of stumped coffee to total area of old
coffee
2 Use of sucker control 0.2 Round of sucker control in stumping year,
1 times = 0.025; 2 = 0.05; 3 = 0.075; 4 = 0.1;
>4 = 0.2
3 Final remaining stem 0.1 Final no. of sucker/stem remains,1stem=0.1;
2 = 0.1; 3 = 0.05; ≥4 = 0;
4 Used & type of intercropping
crops
0.1 Leguminous = 0.1; cereals = 0.025; root crops
= 0.025; mixed = 0.05; no = 0
5 Used & amount of fertilizers
(compost)
0.1 Recommended = 0.1; as I got = 0.05; No = 0
6 Height of stumping 0.05 <40cm = 0.025; >40cm = 0.025; at 40 cm =
0.05
7 Direction and shape of stumping 0.05 Slant & opposite to sun rise & set = 0.05;
slant to any direction = 0.025; flat = 0
Total intensity of adoption 1.0
(Source: Computed with woreda experts and model farmers. 2008)
3.3.2. The Tobit Model and specification
The Tobit Model
Adoption studies based upon dichotomous regression models have attempted to explain only
the probability of adoption versus non-adoption rather than the extent and intensity of
adoption. Knowledge that a farmer is using high yielding variety may not provide much
information about farmer behavior because he/she may be using 1 percent or 100 percent of
his/her farm for the new technology. Similarly, with respect to adoption of fertilizers, a farmer

31
may be using a small amount or a large amount per unit area. Hence, a strictly dichotomous
variable often is not sufficient for examining the extent and intensity of adoption for some
problems such as fertilizers (Feder et al., 1985).
There is also a broad class of models that have both discrete and continuous parts. One
important model in this category is the Tobit. It is an extension of the Probit model and it is
really one approach to dealing with the problem of censored data (Johnston and Dinardo,
1997). Some authors call such models limited dependent variable models, because of the
restriction put on the values taken by the regressed (Gujarati, 1995).
Examining the empirical studies in the literature, many researchers have employed the Tobit
model to identify factors influencing the adoption and intensity of technology use. For
example, Nkonya et al. (1997); Lelissa (1998) ; Bezabih (2000) and Croppenstedt et al.
(1999) used the Tobit model to estimate the probability and the intensity of fertilizer use.
According to Adesina and Zinnah (1993), as cited by Shiyani et al. (2000), the advantage of
the Tobit model is that, it does not only measure the probability of adoption of technology but
also takes care of the intensity of its adoption.
Specification of the Tobit Model
The Tobit model applied for analyzing factors influencing adoption and intensity of old coffee
stumping technology is the Tobit model shown in equation (1).
Y i* = βX i+ iu i = 1, 2 ….n
Y i = Yi* if Y i* > 0 -------------------------------------------------- (1)
= 0 if 0* ≤iY
Where,
Y i = the observed dependent variable, in our case index of adoption of old coffee stumping
Technology
Y i* = the latent variable which is not observable.
Xi = vector of factors affecting adoption and intensity of old coffee stumping technology
iβ = vector of unknown parameters

32
iu = residuals that are independently and normally distributed with mean zero and a
common variance (2σ ).
Note that the threshold value in the above model is zero. This is not a very restrictive
assumption, because the threshold value can be set to zero or assumed to be any known or
unknown value (Amemiya, 1985). The Tobit model shown above is also called a censored
regression model because it is possible to view the problem as one where observations of Y*
at or below zero are censored (Johnston and Dinardo, 1997).
The model parameters are estimated by maximizing the Tobit likelihood function of the
following form (Maddala, 1997; Amemiya, 1985).
L =0*>
Πyi σ
1 ƒ
−σβ iii XY
0*≤
ΠYi
F
−σβ ii X ----------------------------- (2)
Where ƒ and F are respectively, the density function and cumulative distribution function of
Y i*.
0* ≤
ΠiY
means the product over those i for which Yi* ≤ 0, and
0* >ΠiY
means the product over
those i for which Yi*>0.
An econometric software known as “Limdep” was employed to run the Tobit model. It may
not be sensible to interpret the coefficients of a Tobit in the same way as one interprets
coefficients in an uncensored linear model (Johnston and Dinardo, 1997). Hence, one has to
compute the derivatives of the estimated Tobit model to predict the effects of changes in the
exogenous variables.
As cited in Maddala (1997), Johnston and Dinardo (1997) and Nkonya et al., (1997),
McDonald and Moffit proposed the following techniques to decompose the effects of
explanatory variables into adoption and intensity effects. Thus, a change in Xi (explanatory
variables) has two effects. It affects the conditional mean of Yi* in the positive part of the
distribution, and it affects the probability that the observation will fall in that part of the
distribution. Similar approach is used in this study.

33
The marginal effect of an explanatory variable on the expected value of the dependent
variable is:
izFX
Y
i
i β)()( =
∂Ε∂
--------------------------------------------------------------- (3)
Where, σ
β ii X is denoted by z, following Maddala, (1997)
The Change in the probability of adopting a technology as independent variable Xi changes
is:
=∂
∂
iX
ZF )( ƒ (z)σβ i -------------------------------------------------------------------- (4)
The change in intensity of adoption with respect to a change in an explanatory variable among
adopters is:
i
ii
X
YYE
∂>∂ )0/( *
=
−−
2
)(
)(
)(
)(1
zF
zf
zF
zfZiβ -------------------------------------- (5)
Where, F(z) is the cumulative normal distribution of Z, ƒ(z) is the value of the derivative of
the normal curve at a given point (i.e., unit normal density), Z is the z-score for the area under
normal curve, β is a vector of Tobit maximum likelihood estimates and σ is the standard
error of the error term.
Before running the Tobit model all the hypothesized explanatory variables were checked for
the existence of multi-collinearity problem. Two measures namely, variance inflation factor
(VIF) and contingency coefficients were used to test multicollinearity problem for continuous
and dummy variables, respectively.
According to Maddala (1992), VIF can be defined as: VIF (X i ) = 21
1
iR− ,Where 2
iR is the
squared multiple correlation coefficient between Xi and the other explanatory variables. The
larger the value of VIF is the more troublesome. As a rule of thumb, if the VIF of a variable
exceeds 10 (this will happen if Ri2 exceeds 0.95), that variable is said to be highly collinear
(Gujarati, 1995).

34
Similarly, contingency coefficients were computed for dummy variables using the following
formula.
2
2
χn
χC
+=
Where, C is contingency coefficient, χ2 is chi-square value and n = total sample size.
For dummy variables if the value of contingency coefficient is greater than 0.75, the variable
is said to be collinear (Healy, 1984 as cited in Mesfin, 2005).
3.3.3. Definition of Variables and Working Hypothesis
3.3.3.1. Dependent variable
The dependent variable in this study is adoption index (AI) which indicates respondent
farmers' adoption and intensity of adoption of old coffee stumping technology. Adoption
index is one of the technique that is used in the case of adoption study of multiple practices
(package) and measures adoption and intensity of adoption of old coffee stumping
technology. Adoption index in this case is a continuous dependent variable.
3.3.3.2. Independent or explanatory variables The explanatory variables of importance in this study are those variables, which are thought to
have influence on adoption and intensity of adoption of old coffee stumping technology.
These include household’s personal and demographic variables, farm characteristics,
household economic variables, institutional variables and psychological factors.
Household’s personal and demographic variables
Age (AGE): This refers to the age of the household in years. Old coffee stumping technology
is a knowledge demanding activities; which requires knowledge of pruning and sucker
control. Moreover, it entails risks, but older people are usually risk averters. Because of this,
they tend to be reluctant in adoption of old coffee stumping technology. Therefore, age was
35
hypothesized to negatively influence adoption and intensity of adoption of old coffee
stumping technology.
Sex (SEXHH): It is a dummy variable which takes a value of 1 if the respondent is male and
0, otherwise. In most cases male headed households have better access to information on
improved technologies and are more likely to adopt new technologies than female. Sex is
therefore expected to positively influence adoption and intensity of adoption of old coffee
stumping technology.
Family size (TFAMS): Total family size in this study refers to the number of members who
are currently living within the family. Large family size is an indicator for availability of labor
provided that the majority of the family members are within the age range of active labor
force. Availability of labor in the household is again one of the important resources in coffee
production in general and stumping activities in particular. Based on this assumption, this
variable was hypothesized to have positive relationship with adoption and intensity of
adoption of old coffee stumping technology.
Education level of the household (EDUHH): It represents the level of formal schooling
completed by the household head at the time of the survey. Education enhances farmers’
ability to perceive, interpret and respond to the new events. Therefore, in this study education
was expected to positively influence adoption and intensity of adoption of old coffee
stumping technology.
Experience in coffee farming (EXPCOF): is to be measured in number of years since a
respondent started coffee farming on his own. Experience of the farmer is likely to have a
range of influences on adoption. Experience will improve the farmer’s skill on the production
of coffee. Higher skill increases the opportunity cost of not growing the traditional enterprise.
A more experienced grower may have a lower level of uncertainty about the innovation’s
performance (Abadi et al, 1999; Chilot et al, 1996). Farmers with higher experience appear to
have often full information and better knowledge and were able to evaluate the advantage of
the technology in question. Hence, experience of the head of the household in farming was
hypothesized to affect adoption positively.

36
Farm characteristics
Land holding (LANDHOLD): Refers to the amount of land the household owned measured
in timad (4 timad is one ha). Land is perhaps the single most important resource as it is a base
for any economic activity especially in agrarian society. Farm size influences households'
decision to adopt or reject new technologies. It also influences scale of technology use.
Hence, landholding was hypothesized to have positive relationship with adoption and
intensity of adoption of old coffee stumping technology.
Size of coffee land (SIZCLAND): It refers to the size of the coffee land measured in timad.
In the study area, coffee production is mainly carried out. A farmer who has relatively larger
plot of coffee land can stump his old coffee, because he can have remaining coffee plants
which are not stumped and can get production until the stumped coffee reach to production
stage. Therefore, the size of the coffee land was expected to positively affect adoption and
intensity of adoption of old coffee stumping technology.
Having of old aged coffee (HAVOLCF): the farmers who have aged coffee trees and gained
low production tend to rejuvenate the coffee by stumping but farmers who have relatively
younger coffee and gained better production tend not to stump their coffee and therefore, it is
hypothesized that a farmer having aged coffee have more probability of adopting old coffee
stumping technologies. It was measured in having of old coffee or not and the number of
coffee trees they have.
Using of improved new coffee cultivar (USINCC): In the area there was a project, Coffee
Improvement Project (CIP) under the earlier Ministry of Coffee and Tea Development now
under Ministry of Agriculture and Rural Development. It had worked a lot of extension
activity especially in improving coffee production by producing improved CBD (coffee berry
disease) resistant coffee seedlings and provided to the farmers and teaching modern planting
and management system through extension system. Through this project most of the farmers
had planted this improved CBD resistant cultivar and the plantation of this coffee was raw
planting and the number coffee trees per hectare is up to 3500, where as the local coffee
population is not more than 1800, due to this reason the modern plantation yields per hectare

37
is high when it is compared to the local one for limited consecutive years, up to 15 years and
above these years the production decline and needs re-cycling of the production system.
Therefore, those who had more of this coffee face a decline of production and inclined to
stump their coffee when it became compacted and exhausts as compared to those having old
local cultivar. Due to this reason this variable was hypothesized to have positive relationship
to old coffee stumping technology and measured by using of this new variety or not and the
number of coffee trees they have.
Getting coffee plants from distribution of common holdings (GCPFCH): In the regime of
“Derg” i.e. when Ethiopia was under the military government, there was farmer producer
cooperative and peasant association common holding coffee plantation in the area which were
planted and managed by the community commonly. Because of the productivity of these
common holdings decline time to time the state changed the command economy policy to
mixed economy policy; also these common holdings were distributed to individual farmers by
setting some criteria. As these coffee plants were planted in row and compacted, at certain
years the production declined and need re-cycling comparing to the local coffee plantation.
Hence, because of this reason these coffee plantations need rejuvenation than the local one.
Due to this fact those who had got this common holding plantation tends to stump their coffee
than others. Therefore, this factor was hypothesized that to had positive relation to adoption of
old coffee stumping technology and measured by getting or not and the number of coffee trees
they got.
Producing or preparing coffee seedlings (PROCOFSD): In the area also one of the
extension innovation introduced by the CIP and extended by the agricultural and rural
development was modern coffee seedling production. This helps many farmers to involve in
producing coffee seedlings for their own planting and commercial purpose and benefited a lot.
In other way producing coffee seedlings used as a source of finance and getting intensive
extension support, that is the farmers would have opportunity to hear about other technology
and also could have chance to participate in field days and training. Therefore, this variable
was hypothesized that to had positive relationship to old coffee stumping technology and has
measured whether they produce or not and the number of produced seedlings.

38
Transmission conditions of coffee wilt disease (TRCCWD): The prevalence of coffee wilt
disease is now becomes a series problem in the area and can transmit with stumping tools
through wounds. Due to this reason protectionists advice the farmer to take care when
stumping is done and hence the farmer may tend not to stump the coffee. Therefore, this
variable was hypothesized that if there is high prevalence of a disease it can affect adoption of
old coffee stumping technology negatively and measured by severity of the incidence.
Household economic variables Labor availability (LABAVAIL): Old coffee stumping technology is a labor-intensive
activity. Moreover, large working labor force in a family means, the household may have
more additional labor to all old coffee stumping technology activities. Therefore, it was
hypothesized to have positive relationship with adoption and intensity of adoption of old
coffee stumping technology. It is measured in terms of man equivalent and it refers to the
active labor force the household owns.
Livestock ownership (LIVOWN): In rural context, livestock holding is an important
indicator of household's wealth position. Livestock serves as an important source of cash. In
the study area, farmers in addition to other farming practices they rear livestock. Old coffee
stumping activity has risks that for more than 2 years it couldn’t give yield and the farmer also
may fear that after stumping new suckers may not grow. There fore livestock could be used as
insurance for such kind of fearing. Based on this assumption this variable was hypothesized to
have positive relation with adoption and intensity of adoption of old coffee stumping
technology.
Participation in Off-farm activities (POFFARM): Participation in off-farm activities is
believed to have a bearing on the income of households. Additional income earned through
participation in these activities improves farmers' financial capacity and increases the ability
to adopt new technology. Hence, participation in off-farm activities was hypothesized to
positively influence adoption and intensity of adoption of old coffee stumping technology. It
is a dummy variable that takes a value of 1 if the farm household members participate in off-
farm activities and 0 otherwise and the amount of money gained.

39
Total farm income (FARMINC): Households’ income position is one of the important
factors determining adoption of improved technologies. The amount of household total
income obtained from different types of farm income as it is cash crop area can be used for
different requirements including household consumption. Therefore, a household with
relatively higher farm income was expected to better adopt old coffee stumping technology
and farm income expected to positively influence adoption and intensity of adoption of old
coffee stumping technology.
Institutional Factors Getting extension service (GETEXSR): Agricultural extension services provided to the
farmers are the major sources of agricultural information in the study area. Extension visits or
availability of extension services is perhaps the single most important variable (predictor) that
emerged significantly in most of the research work on technology transfer and adoption
(Chilot et al, 1996; Freeman et al, 1996; Van Den Ban and Hawkins, 1996; Asfaw et al, 1997;
Kedir, 1998). Total contact with extension information sources was measured whether they
got extension service or not and frequency of contact and was expected to positively influence
adoption and intensity of adoption of old coffee stumping technology.
Participation in extension events (PAEXEVSC): The other means through which farmers
get agricultural information is through participating in different extension events arranged by
different institutions. These include training, field day/visit, demonstration and others. A
farmer who had chance to participate in these extension events will have enough information
about the new technology and as a result would be more likely to adopt new innovation than
others do. Therefore participation in extension events was hypothesized to positively
influence adoption and intensity of adoption of old coffee stumping technology.
Mass media exposure (MASMEXP): The adoption process of agricultural technologies
depends primarily on access to information and on the willing ness and ability of farmers to
use information channels available to them. The role of information in decision-making
process is to reduce risks and uncertainties to enable farm households to make right decision
on adoption of improved agricultural technologies. Mass media plays the greatest role in

40
provision of information in shortest possible time over large area of coverage. However, as
compared to other communication channels, its effect on behavioral change is weak as it is
limited to awareness creation than skill development. But, as far as awareness is pre-requisite
for behavioral change, still its role cannot be underestimated. Hence, mass media exposure
was expected to positively influence adoption and intensity of adoption of old coffee
stumping technology and measured on having of radio or not and ranking of different media
on its’ access and frequency.
Types of social participation (TYSPART): membership and leadership in community
organization assumes that farmers who have some position in PA and different cooperatives
are more likely to be aware of new practices as they are easily exposed to information (Chilot
et al, 1996; Freeman et al, 1996; van Den Ban and Hawkins, 1996; Asfew et al, 1997 and
Habtemariam, 2004). It was, therefore, hypothesized that those farmers who participated in
some social organizational as member or leader are more likely to adopt stumping technology
and measured whether they participate or not and number of organization participated as well
as types of participation (member or leader).
Distance from market center (DISFMC): Was measured in kilometers to the nearest market
and was hypothesized to had negative relation to adoption of old coffee stumping technology.
The closer they are to the nearest market, the more likely it is that the farmer will receive
valuable information (Abadi, 1999; Roy, 1999).
Psychological factors
Farmers’ perception of the problem of coffee oldness (PERPCON): This explanatory
variable measures farmers’ perception of the coffee oldness and as a result yield reduction
problem. Farmers who have already perceived the problem of decline of production due to
oldness of the coffee tree are more likely to adopt old coffee stumping technology. Thus, this
perception variable was expected to be positively associated with adoption decision. It is clear
that perception would also be a function of some variables like institutional and economic
variables but in this study the researcher emphasized only the relationship of the explanatory

41
variable with the dependent variable. To check whether there is endoginicity or
multicollinearity problem, simply used multicollinearity test and had not this problem.
perception of old coffee stumping technology (PEROCST): (Düvel, 1991) associates
perceptions with the way the attributes of innovations are perceived and he distinguish
between (a) awareness of relative advantages, (b) awareness or concern of disadvantages, (c)
the overall prominence or relative advantage of innovation (practice), and (d) the
compatibility with situational circumstances. In this study, it is measured by the knowledge of
the farmers for the yield increase as compared to the yield without old coffee stumping
technology practice. It assumes a value of 1 if respondents believe that the technologies help
to increase yield and 0 if not. Therefore, perception of old coffee stumping technology was
expected to be positively associated with adoption decision.

42
4. RESULTS AND DISCUSSION 4.1. Analysis through Descriptive Statistics
This study was intended to examine the farmers’ perception on the problem of low
productivity due to old age of the coffee plant and old coffee stumping technology, and to
identify factors affecting adoption and intensity of adoption of old coffee stumping
technology in the study area Dale as well as to know the effect of hypothesized independent
variables on the dependent variables. In this section of analyses descriptive statistics such as
mean standard deviation, percentage, frequency tabulation, t-test and chi-square test was
employed using SPSS- computer soft ware program.
In this study, adoption of a technology refers to use of old coffee stumping technology for one
and/or more than one year, on the other hand non adoption of technology refers to not to use
of old coffee stumping technology even for one year.
4.2. Influence of Independent Variables on Adoption of Old coffee Stumping Technology
In this study, the independent variables thought to have relationship with adoption of old
coffee stumping technology are grouped as household’s personal and demographic variables,
farm related variables, household’s economic variables, household’s psychological related
factors and institutional variables. The relationship of these variables with adoption and
intensity of adoption of old coffee stumping technology is discussed under the following sub
topics.
4.2.1 Household personal and demographic variables
Age of the household head
Age is one of the demographic factors that is useful to describe households and provide clue
about the age structure of the sample and the population. Age is usually considered in
adoption studies with the assumption that older people have more farming experience which
enables them to easily adopt new technologies. However, on the other side, age is related to

43
the risk management nature of an individual farmer. In old coffee stumping technology, the
high intensive labor demand, losing of yields minimum for two years and the opportunity of
losing of rejuvenation of new sucker, because of the older people risk averting nature, they are
usually reluctant to adopt new technologies such as old coffee stumping technology. Based on
this fact, age was hypothesized to have negative relationship with adoption and intensity of
adoption of old coffee stumping technology.
As indicated in Table 4, an independent-sample t-test was conducted to test if there was
significant difference in the mean age of adopters and non- adopters. The t-value (t=1.642)
showed statistically not significant in the mean age of adopters and non-adopters. This result
indicated that there was no relation- ship between adoption of old coffee stumping technology
and age of the household which is different to the negatively hypothesized relationship with
adoption.
Family size
In this study, the average family size of the sample households was 6.78 persons. The
maximum family size was 12 while the minimum is 2 persons. The average family size of the
study area is relatively higher as compared to that of the nation which is 6 persons implying
the need for strengthening family planning programs to strike the balance of population
growth with the level of economic development.
Household’s family size had significant relationship with adoption and intensity of adoption
of old coffee stumping technology. This is evident from the significant mean difference in
average family size among adopter categories (Table 4). This may be due to the fact that this
technology need high labor from stumping to final management activity like sucker control,
weeding and fertilizing etc.
Coffee farming experience of household head
In the case of Dale wereda most of the farmers started their own farming during their early
20s and had an average farming experience of 22.02 years. The average years of farming

44
experience of the household head for adopters was 24.37 and the average years of experience
for the non-adopters was 21.15. This shows direct relationship between adoption and farming
experience of the head of the household in the research area. An independent-sample t-test
was conducted to test if there is significant difference in the mean experience years of
adopters and non- adopters. The result showed that there is statistically significant difference
at 10% significant level between them (Table 4).
Table 4. Distribution of Households continuous variables by adoption category
Variables
Adopters (43) Non-Adopters (117)
T-test
Significance Level (2-tailed)
Mean SD Mean SD
Age 44.7 11.18 41.34 11.56 1.642(NS) 0.103
Family size 7.44 1.53 3.20 2.20 2.942** 0.040
Coffee farming experience
24.37 8.96 21.15 10.45 1.791* 0.075
Total land holding in Timad
5.97 2.96 3.89 2.22 4.792*** 0.000
Coffee land holding in Timad
2.83 1.73 1.78 1.40 3.893*** 0.000
No.of coffee tree which could be stumped
542.02 462.15 241.43 260.17 3.931*** 0.000
Average market distance in km.
2.64 1.75 2.22 1.61 1.49(NS) 0.158
Labor in man equivalent
3.7 1.41 3.11 1.33 2.846*** 0.005
Off-farm income in Birr.
2143.00 2755.33 1169.00 806.95 1.210(NS) 0.250
Total farm income in Birr
8608.66 4851.76 4490.48 3418.56 3.439*** 0.001
Livestock ownership (TLU)
3.84 2.264 2.85 1.694 2.835*** 0.000
*, ** and *** Significant at 10%, 5% and 1% significant level and NS= Non-significant (Source: Computed from own survey data. 2008)
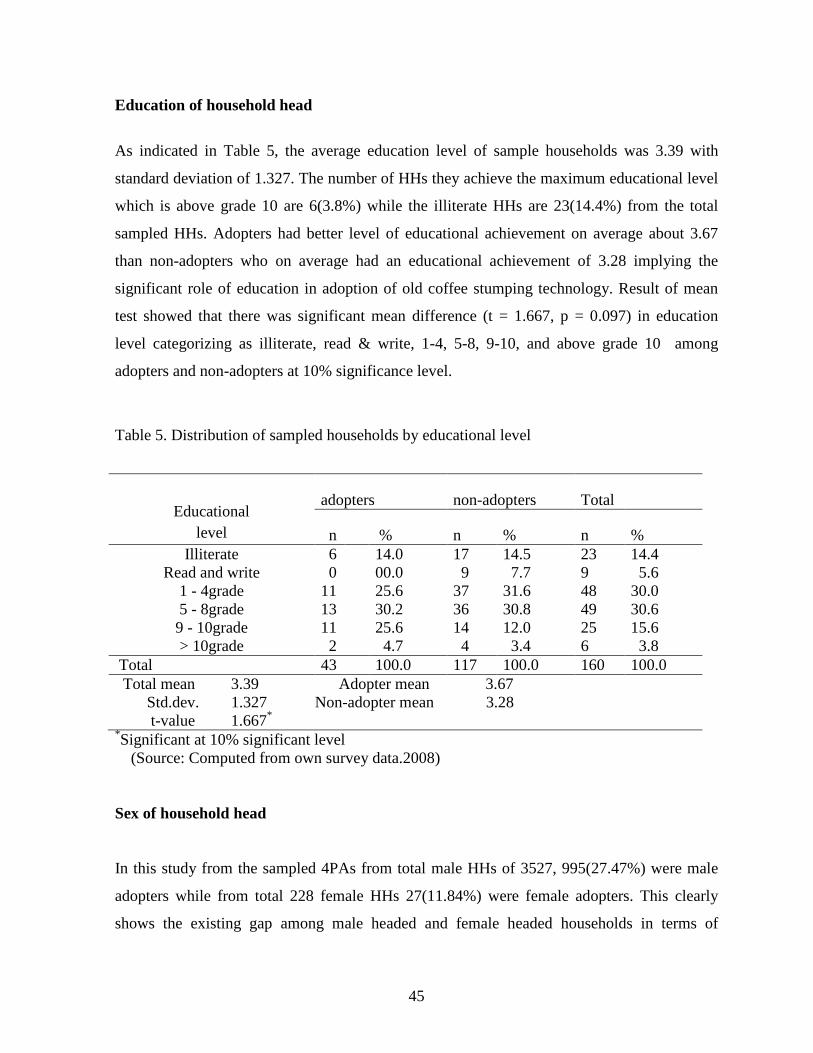
45
Education of household head
As indicated in Table 5, the average education level of sample households was 3.39 with
standard deviation of 1.327. The number of HHs they achieve the maximum educational level
which is above grade 10 are 6(3.8%) while the illiterate HHs are 23(14.4%) from the total
sampled HHs. Adopters had better level of educational achievement on average about 3.67
than non-adopters who on average had an educational achievement of 3.28 implying the
significant role of education in adoption of old coffee stumping technology. Result of mean
test showed that there was significant mean difference (t = 1.667, p = 0.097) in education
level categorizing as illiterate, read & write, 1-4, 5-8, 9-10, and above grade 10 among
adopters and non-adopters at 10% significance level.
Table 5. Distribution of sampled households by educational level
*Significant at 10% significant level (Source: Computed from own survey data.2008) Sex of household head In this study from the sampled 4PAs from total male HHs of 3527, 995(27.47%) were male
adopters while from total 228 female HHs 27(11.84%) were female adopters. This clearly
shows the existing gap among male headed and female headed households in terms of
Educational level
adopters non-adopters Total
n % n % n % Illiterate
Read and write 1 - 4grade 5 - 8grade 9 - 10grade > 10grade
6 14.0 17 14.5 23 14.4 0 00.0 9 7.7 9 5.6 11 25.6 37 31.6 48 30.0 13 30.2 36 30.8 49 30.6 11 25.6 14 12.0 25 15.6 2 4.7 4 3.4 6 3.8
Total 43 100.0 117 100.0 160 100.0 Total mean 3.39 Adopter mean 3.67 Std.dev. 1.327 Non-adopter mean 3.28 t-value 1.667*

46
participation in old coffee stumping technology. Regarding its relationship with adoption of
old coffee stumping technology, correlation test using Pearson chi-square indicated that sex of
the household head had significant relationship (χ2=3.920, df=1, p=.048) with adoption of old
coffee stumping technology at 5% significance level (Table 6). The low participation of
female-headed households in old coffee stumping technology may be related to their access to
information and other resources. Therefore, development interventions should address
women’s constraints to achieve wider adoption of old coffee stumping technology by female
farmers.
4.2.2. Farm characteristics Total land holding
In this study, the average land holding of sample population was found to be 4.45 timad with
standard deviation of 2.60 timad. This figure is a bit smaller than the national figure, which is
1.5 ha(6 timad) implying relatively less holding in the area. The maximum land size owned by
sample households was 15 timad while the minimum is 1 timad. The average land holding for
adopter group was 5.97 timad while that of non-adopter group is 3.89 timad. There was
significant mean difference (t=4.792, p=.000) among adopters and non-adopters at 1%
significance level (Table 4). Regarding the direction of relationship, result of bivariate
correlation analysis revealed the presence of positive and significant relationship (r=0.356, p=
0.000) between land holding and household's adoption of old coffee stumping technology at
1% significance level.
Coffee land holding
Old coffee stumping is carried out mainly to those who have coffee lands. Those who have
more coffee lands have more likely to stump their old coffee plants. Based on this assumption,
coffee land holding was hypothesized to have positive and significant relationship with
adoption and intensity of adoption of old coffee stumping technology. In this study, the
average coffee land holding for the sample population was 2.10 timad. The minimum was
0.25 timad while the maximum is 8.00 timad. The average coffee land holding for the adopter
group was 2.83 timad while that of non-adopter group was 1.78 timad. As indicated in Table

47
4, the mean difference between adopters and non-adopters was also significant at 1%
significant level. This implies that coffee landholding was critical factor in adoption of old
coffee stumping technology.
Old coffee trees holding
Old coffee stumping technology is carried out only to those who have old coffee trees. Those
who have larger number of old coffee trees are likely to stump their old coffee trees. As was
expected, having of old coffee trees had positive and significant relationship with adoption of
old coffee stumping technology (Table 6). This implies that old coffee landholding is critical
factor in adoption of old coffee stumping technology. But in most cases a mere having of old
coffee trees which could be stumping is not sufficient to conclude in farmers’ capacity to
adopt old coffee stumping technology also having the number of old coffee trees which could
be stumped matters a lot. In this study, the average number of old coffee trees which could be
stumped of sample households was 349.14. On average, adopters had significantly higher old
coffee trees about 542.02 than non-adopters who had only 241.43(Table 4). This also
indicated that this factor had relation to adoption of old coffee stumping technology.
Using improved coffee cultivar
In this study as the result of chi-square test revealed this variable had positive relationship at
5% significant level to the adoption of old coffee stumping technology(Table 6).

48
Table 6. Distribution of Households discrete/dummy farm characteristics variables by adoption category.
Variables
Response AD NAD X2 Phi value/
Cramer’s
Total
Sex of the respondent
Male
43(100) 107(91.45) 150 Female 0(0) 10(8.55) 10
Total 43(100) 117(100) 3.920 0.157** 160
Having of old coffee trees?
No 2(4.65) 40(34.19) 21
Yes 41(95.35) 77(65.81) 139 Total 43(100) 117(100) 14.170 0.298*** 160
Using of improved coffee cultivar?
No 6(13.95) 35(29.91) 41
Yes 37(86.05) 82(70.09) 119
Total 43(100) 117(100) 4.203 0.162** 160
Getting coffee plants from common holding?
No
25(58.14) 106(90.6) 131
Yes 18(41.86) 11(9.4) 29 Total 43(100) 117(100) 2.960 0.309* 160
Producing or preparing coffee seedlings?
No
19(44.2) 83(70.94) 98 Yes 24(55.8) 34(29.06) 62
Total 43(100) 117(100) 9.739 0.247*** 160
'transmission of coffee-wilt dise ase
Very-low 4(9.3) 11(9.6) 15
low 19(44.2) 48(41.7) 67
medium 6(14) 12(10.4) 18
high 12(27.9) 28(24.3) 40
very high 2(4.7) 16(13.9) 18
Total 43(100) 117(100) 2.900 0.575(NS))
160
*, **, *** and NS = significant at 10, 5, 1% level of significance and non-significant respectively. AD= Adopter, NAD= Non-adopter and Numbers in brackets are in percentage. (Source: Computed from own survey data. 2008)
Getting coffee plants from distribution of common holdings
The survey result in chi-square test revealed that this variable had significant relation at 10%
significant level to the adoption of old coffee stumping technology (Table 6).

49
Producing or preparing coffee seedlings
In this study as the chi-square test revealed this variables had positive relation to the adoption
of old coffee stumping technology at 1% significant level (Table 6).
Transmission conditions of coffee wilt disease
When we assessed the transmission conditions of coffee wilt disease as the survey result
indicated from the non adopters 16(13.9%) replied that there were very high transmission
where as from the adopters 2(4.7%) replied that there were very high transmission, but the
chi-square test revealed that it was not significant (Table 6).
4.2.3 Household economic variables Labor availability
In this study, household labor availability had significant relationship with adoption of old
coffee stumping technology. This is evident from significant mean difference among adopter
and non-adopter groups in availability of household labor. The average labor available for
sample households in man-equivalent was 3.29 with standard deviation of 1.385. As indicated
in Table (4), there was significant mean difference in labor availability between the adoption
categories implying presence of significant relationship of the variable with adoption. In the
area, with regard to old coffee stumping technology, even if they were used safety-net paid
labor and common campaign work program for stumping activity labor availability had
significant and positive relationship to adoption of old coffee stumping technology.
Respondents were also interviewed about presence of labor shortage and the result showed
that most of the adopters had more labor shortage than non-adopters and this is statistically
significant at 1% significant level (χ2 = 9.656; df = 1; phi value = 0.246; p = 0.002) (Table7).
As we see this study result those who had more labors were the adopters and also those who
had labor shortage were the adopters, this was may be due to that most of the adopters have
better economic status and investment also they demand other labor, also due to old coffee

50
stumping technology needs more labor for stumping and management still they were more in
need of labor than non-adopters. Respondents who had labor shortage were also interviewed
about their labor sources other than their family labor, and the result showed that about 10.7%
were reported that they used hire or employed labor, about 28.9% they used by asking for
cooperation (Debo), about 60.3% by both hired labor and asking for cooperation (Table 7).
Participation in off-farm activities
As expected, participation in off-farm activities had positive and significant relationship with
adoption of old coffee stumping technology, but in most cases a mere participation in off-farm
activities is not sufficient to conclude in farmers’ capacity to adopt improved technologies as
the amount of income obtained from participation in the activity matters a lot. In this study,
the average off-farm income of sample households was about 1374.18 ET Birr. On average
adopters had higher off-farm income about 2143.00 ET Birr than non-adopters who had only
1169.00 ET Birr (but the mean difference was not significant because of not having the same
variance) (Table 4). In the study area, employment for daily labor activities, petty trading,
hand crafts and support from relatives were found to be some of the off-farm activities income
source in which sample households were getting.
Farm income
Table 4 indicates that, the average annual farm income of the sample households was 6585.22
ET birr. The maximum annual farm income was 24436.50 ET. birr while the minimum was
704.50. On average, adopters had higher annual farm income of 8608.66 ET. Birr as
compared, to non-adopters who on average had only 4490.48 birr. Analysis of mean variance
annual farm income using an independent sample t-test had indicated that there was
significant mean difference among the adopter categories at 1% significance level.
Bivariate correlation analysis was also conducted to see the strength and direction of
relationship between farm income and adoption of improved old coffee stumping technology.
Accordingly, the result indicated that farm income was positively and significantly related
(r=0.305, p=0.000) with adoption of old coffee stumping technology. From the findings, we

51
can conclude that lower income group of the society face difficulty to adopt old coffee
stumping technology. This implies the need to support lower income groups through different
mechanisms such as, petty trading, hand crafts through strengthening credit schemes in the
study area.
Livestock holding
As result of this study indicates, the livestock holding of sample population ranges from 0 to
11.5 TLU implying the existence of variation among the households in livestock ownership.
The average livestock holding of the sample population was 3.13 TLU with standard
deviation of 1.911. On average adopters of old coffee stumping technology had more number
of livestock population (about 3.84 TLU) as compared to the non adopters who owned only
about 2.85 TLU. Independent sample t-test showed that there was significant mean difference
(t=2.835, p=.000) among adoption categories at 1% significance level (Table 4). This clearly
shows the significant role of livestock holding in adoption and intensity of adoption of old
coffee stumping technology. Moreover, result of bivariate correlation also confirmed the
positive and significant relationship (r=.267, p=.001) of livestock holding with adoption of
old coffee stumping technology at 1% significance level.
4.2.4 Institutional factors Contact with extension information sources
In this study, total contact score with extension information sources was calculated for each
respondent to know their access to extension information. In the area, besides to extension
agents of ministry of agriculture, others such as research and NGO also provide extension
information to coffee grower farmers (in the area there is coffee research station and NGO).
As the respondents’ response indicated from the total sampled households 139 (86.9%) had
got advisory service from the extension agents. When adopters and non-adopters were
compared, from the total sampled adopter and non-adopter households, 42 which are 97.7%
and 97 which are 82.9% had got extension service respectively. The chi-square test revealed
that it was statistically significant (Table 7).
52
Also in case of frequency of contact the respondents were asked and as the result indicated
that there was no significant difference between adopters and non adopters (χ2=2.157; df=3;
Cramer’s value=.125; p=.540) Table 7.
When we assessed other sources of information other than extension agent, the farmers
mentioned the sources and ranked according to availability. These sources were contact
farmer, fellow farmers (friends), PA leader, NGO, cooperatives, researchers, input dealers,
and agricultural professionals. When the respondents response results computed in non-
parametric statistics, Friedman test, showed other sources of information mean rank as
follows: 1st Fellow farmers/friends; 2nd Contact farmers; 3rd PA leaders; 4th cooperative; 5th
Agricultural professionals; 6th Input dealers; 7th Researchers; 8th NGO.
Participation in extension events
a) Receiving of training: In the area rarely with different organization, training program had
arranged and offered to the farmers in different disciplines at different level such that
Regional, Zonal, District, Cooperative and PA level. Due to this fact it was tried to assess the
condition of training on the subject of coffee production. Then, as the survey results indicated
from the total respondents 34 (21.25%) got training in one way or other round, and when
compared adopters to non-adopters, adopters got 13(30.23%), where as non-adopters got
21(17.94%), which was statistically significant (χ2=2.835; df=1; phi value=0.133; p=0.092)
Table 7. When assessed the owner (sponsors) of the training who arranged and facilitated, as
the respondents responses were; 1st RDAO 82.4%, 2nd Research 5.9%, 3rd jointly 11.8%.
b) Hosting of demonstration: In the area one of the agricultural extension dissemination
method is farmers’ field demonstration or as the name gave farmers’ field school. Hence, in
the case of hosting demonstration the survey result revealed that from the total respondents 13
(8.13%) hosted demonstration and when we compared adopters and non-adopters, adopters
hosted 8(18.6%) where as non-adopters hosted 5(4.3%), which was statistically significant (χ2
= 8.651; df = 1; phi value = 0.233; p = 0.003) Table 7.

53
c) Participation in field day: When we assessed condition of participation of field day in the
last five years, in the study area, about 62(38.75%) of the sampled HHs had participated in
field days, where as 23(53.49%) were adopters and 39(33.33%) were non-adopters. When
statistically tested, the chi-square test indicated statistically significant (χ2 = 5.382; df = 1; phi
value = 0.183; p = 0.020) Table 7. When compared the mean frequency of participation
between adopters and non-adopters; adopters mean frequency of participation in field day was
2.09, and non-adopters was 1.36. An independent sample t-test indicated that statistically
significant at 1% significant level (Table 4).
In general in this study, all types of extension contact showed that significant relation to
adoption of old coffee stumping technology, this was the probable reason for highest contact
of adopters with the extension could be due to less attention given to other non-adopter house
holds. In other way most probably extension agent would focused only to adopters for the
reason of achieving their plan (cotta) package or other extension activity.
Mass media exposure
In this study, respondent farmers’ exposure to mass media was measured on having of Radio
or not and by ranking of their access and frequency of different media. As the result indicated
from the total 43 adopter respondents 23(53.5%) and from the total 117 non-adopter
respondents 59(50.4%) had radio, but statistically not significant (χ2 = 0.118; df = 1; phi value
= 0.02) Table 7. In addition the respondents ranked access and frequency of using the
following media as follows; Radio 1st, TV 2nd, Leaflet 3rd, Pamphlet 4th, Manuals 5th, by using
non-parametric statistic, Friedman test.
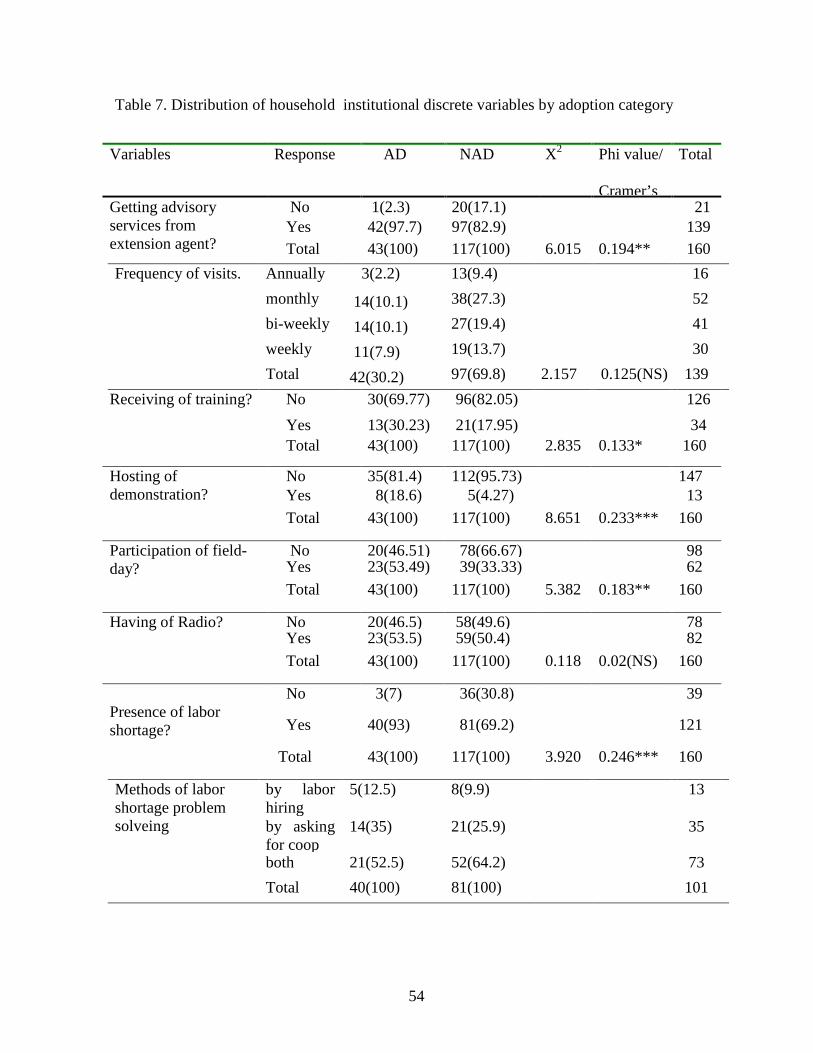
54
Table 7. Distribution of household institutional discrete variables by adoption category
Variables
Response AD NAD X2 Phi value/
Cramer’s
Total
Getting advisory services from extension agent?
No 1(2.3) 20(17.1) 21 Yes 42(97.7) 97(82.9) 139 Total 43(100) 117(100) 6.015 0.194** 160
Frequency of visits. Annually 3(2.2) 13(9.4) 16
monthly 14(10.1) 38(27.3) 52
bi-weekly 14(10.1) 27(19.4) 41
weekly 11(7.9) 19(13.7) 30
Total 42(30.2) 97(69.8) 2.157 0.125(NS) 139
Receiving of training? No 30(69.77) 96(82.05) 126
Yes 13(30.23) 21(17.95) 34 Total 43(100) 117(100) 2.835 0.133* 160
Hosting of demonstration?
No
35(81.4) 112(95.73) 147 Yes
8(18.6) 5(4.27) 13
Total 43(100) 117(100) 8.651 0.233*** 160
Participation of field- day?
No 20(46.51) 78(66.67) 98 Yes 23(53.49) 39(33.33) 62
Total 43(100) 117(100) 5.382 0.183** 160
Having of Radio? No 20(46.5) 58(49.6) 78 Yes 23(53.5) 59(50.4) 82
Total 43(100) 117(100) 0.118 0.02(NS) 160
Presence of labor shortage?
No
3(7) 36(30.8) 39
Yes
40(93) 81(69.2) 121
Total 43(100) 117(100) 3.920 0.246*** 160
Methods of labor shortage problem solveing
by labor hiring
5(12.5) 8(9.9) 13
by asking for coop
14(35) 21(25.9) 35
both 21(52.5) 52(64.2) 73
Total 40(100) 81(100) 101

55
Table 7. (Continued) Variables
to
Response AD NAD X2 Phi value Total
*, **, *** and NS = significant at 10, 5, 1% level of significance and non-significant respectively. AD= Adopter, NAD= Non-adopter and Numbers in brackets are in percentage. (Source: Computed from own survey data. 2008) Social participation
In the realm of rural and agricultural development, the importance of social capital is
perceived as a willingness and ability to work together. The very likely assumption on which
the relationship between social capital and adoption is anchored is that neighboring
agricultural households are, de facto, members of a social structure who exchange information
about improved agricultural practices. Rogers (1995) concludes that: “The heart of the
diffusion process consists of interpersonal network exchanges … between those individuals
who have already adopted an innovation and those who are then influenced to do so”.
In this study the analysis of field data showed that adoption and number of organization
participated had positive relationship at 5% significant level. (χ2 = 8.602, df = 3, p = 0.035)
Table 7.
In how many organization participated ?
No 0(0) 1(0.6) 1
1 7(4.4) 45(28.1) 52
2_3 20(12.5) 46(28.8) 66
>4 16(10) 25(15.6) 41
Total 43(26.9) 117(73.1) 8.602 0.232** 160
Types of participation
Member only
18(11.3)
78(48.8)
96
Committee or leader
25(15.6)
39(24.4)
64
Total 43(26.9) 117(73.1) 8.062 0.224*** 160

56
Also type of social participation (being leader or committee, and member) in different social
organization had positive relationship to adoption at 1% significant level (Table 7).
Access to market
Access to road in general and distance from a near market and input suppliers in particular
influence farmers’ adoption of new technologies. In this study the sample farmers on average
travel about 2.33kms to sell their coffee production. When comparing average travel distance
of adopters and non-adopters, adopters traveled average of about 2.64kms and non- adopters
traveled average distance of 2.22 kms. But the independent sample t-test revealed that it was
not statistically significant (Table 4).
In relation to market information also the respondents were interviewed their sources of
market information and ranked its’ often-ness. All were responded that they got information
from different sources even if not satisfactory and reliable, and ranked the source of
information as follows; 1st neighbors farmer, 2nd traders, 3rd radio, 4th cooperative, and the last
and 5th extension agent as the mean rank indicated in non-parametric statistic, Friedman test
(Table 8).
Table 8. Distribution of sample HHs mean rank of source of information and how often
Source of information and how often
Measurement DA Traders Neighbor farmers
Cooperative Radio
Mean Rank 1.34 3.73 4.15 2.88 2.90 (Source: Computed from own survey data. 2008) 4.2.5 Psychological Factors
Farmers’ perception of low productivity of coffee due to oldness of coffee trees
Farmers’ perception towards low productivity of coffee due to oldness of the coffee tree was
assessed in terms of their evaluative perceptions on coffee oldness, using a scale developed

57
for the purpose of this study. The value of the scale for the positive statements of evaluative
perception on the decline of coffee production due to oldness of coffee plants were assigned
5, 4, 3, 2 and 1 for strongly agree, agree, neutral/undecided, disagree and strongly disagree;
respectively, where as the negative statements were assigned to the reverse value. Finally as
the independent sample t-test revealed that almost in all coffee oldness problem perception
statements the adopters perceived the problem of low productivity positively than non
adopters (Table 9).

58
Table 9. Farmers’ mean perception about decline of production due to oldness of coffee tree by adoption category
statements sample farmer N Mean Std.
Deviation t-value p-value
Coffee production is declined year to year.
adopters 43 4.35 .482
4.901
.000
non-adopters 117 3.75 1.050
Before 5 years the production status of the coffee was higher than at this time.
adopters 43 4.26 .441
2.766
.006
non-adopters 117 3.91 1.119
I believe that coffee could be old and unproductive as its age increases
adopters 43 4.37 .489
3.891
.000
non-adopters 117 4.01 .609
Coffee oldness and unproductiveness vary from cultivar to cultivar.
adopters 43 4.28 .454
3.587
.000
non-adopters 117 3.89 .908
New coffee cultivar is more early become old and unproductive comparing to local variety.
adopters 43 4.33 .474
7.723
.000
non-adopters 117 3.43 .985
Coffee oldness and unproductiveness vary from place to place.
adopters 43 4.26 .441
0.349
.728 non-adopters
117 4.22 .744
Coffee also could be old and unproductive because of less management.
adopters 43 4.56 .629
1.969
.051
non-adopters 117 4.27 .867
Coffee oldness and low productivity reaches to a serious problem and need solution.
adopters 43 4.81 .394
6.758
.000
non-adopters 117 4.12 .902
(Source: Computed from own survey data. 2008)

59
Mean of total perception statements rate of adopters were 4.14 where as the non-adopters
were 3.76 which was positively significant at 1% significant level (Table 10).
Table 10. Farmers’ total mean perception of problem of coffee oldness by adoption category
Variable sample farmer N Mean
Std. Deviation t-value
p-value
Mean total perception of problem of coffee oldness
adopters
43
4.1421
.19746
non-adopters 117 3.7654 .38178 8.119
0.000
Total mean=3.867 (Source: Computed from own survey data. 2008)
Farmers’ perception of old coffee stumping technology
Farmers’ perception of certain technology is the interwoven result of technical and
socioeconomic factors. Farmers’ knowledge and beliefs about the technology can originate
from different sources of information and experiences. They consider the consequence of
using the technology from different angles. Technical, economic and social factors influence
and/or determine the possibility and /or the extent of use of the new ideas and practices.
Similarly, in this study, there is a need to consider the perceived nature of the old coffee
stumping technology. Therefore, farmers’ perception towards old coffee stumping technology
was assessed in terms of their evaluative perceptions on technology, using a scale developed
for the purpose of this study. The value of the scale for the positive statements of evaluative
perception on old coffee stumping technology were assigned 5,4,3,2,1 for strongly agree,
agree, neutral/undecided, disagree, and strongly disagree; respectively, where as the negative
statements were assigned to the reverse value. Finally the result showed that there was
statistically significant mean difference on each statement developed to measure perception
about old coffee stumping technology among adopters category (Table 12). Mean of total
perception statements rate of adopters was 3.91, where as non-adopters was 3.61 which were
significant at 1% significant level. As was expected, total mean of old coffee stumping
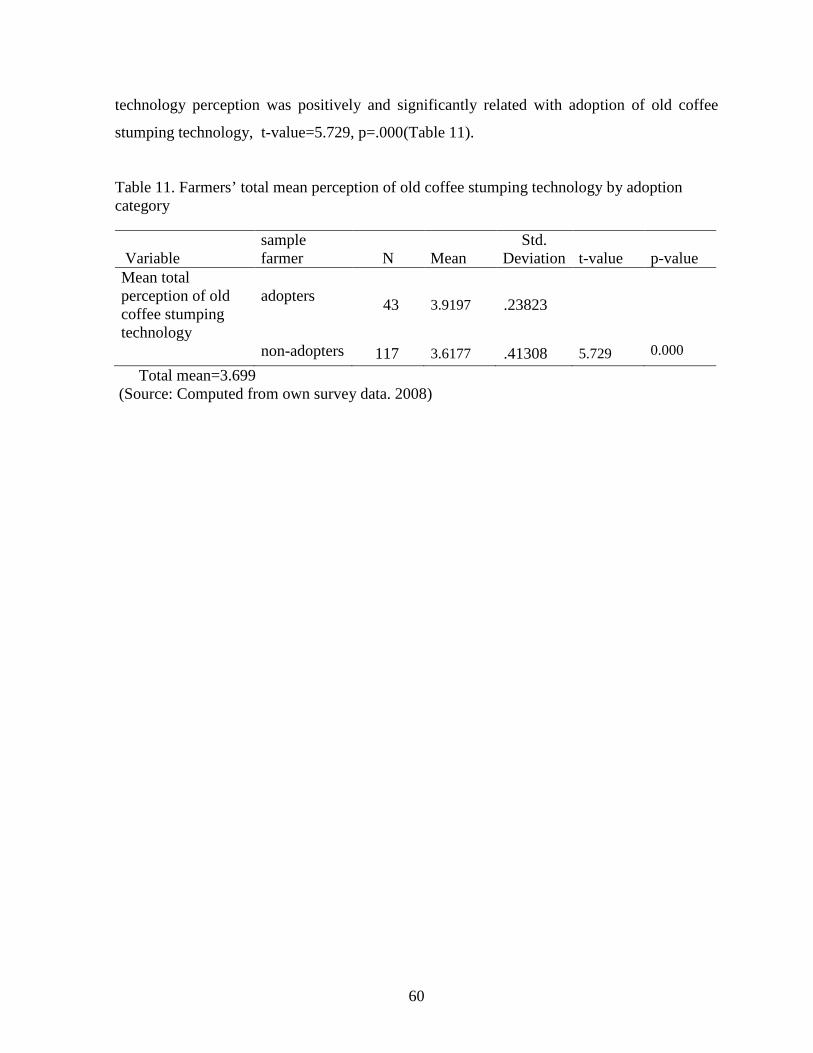
60
technology perception was positively and significantly related with adoption of old coffee
stumping technology, t-value=5.729, p=.000(Table 11).
Table 11. Farmers’ total mean perception of old coffee stumping technology by adoption category
Variable sample farmer N Mean
Std. Deviation t-value
p-value
Mean total perception of old coffee stumping technology
adopters
43 3.9197 .23823
non-adopters 117 3.6177 .41308 5.729 0.000
Total mean=3.699 (Source: Computed from own survey data. 2008)
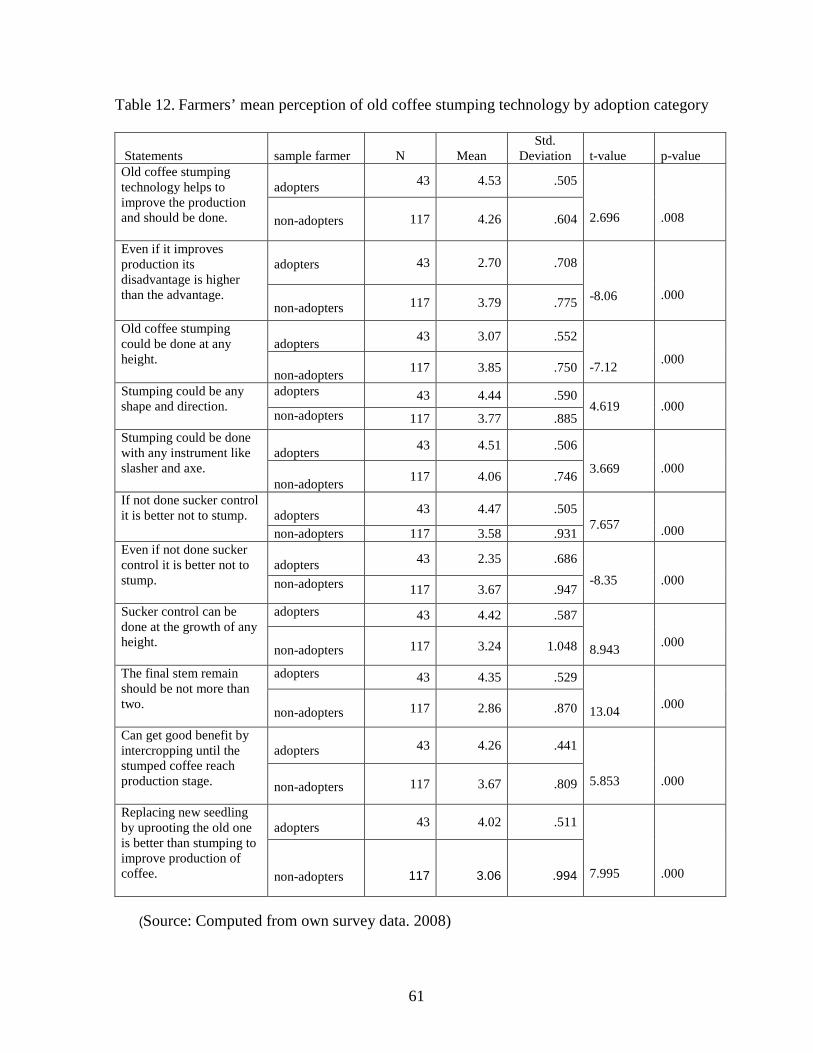
61
Table 12. Farmers’ mean perception of old coffee stumping technology by adoption category
Statements sample farmer N Mean Std.
Deviation t-value p-value
Old coffee stumping technology helps to improve the production and should be done.
adopters 43 4.53 .505
2.696
.008 non-adopters 117 4.26 .604
Even if it improves production its disadvantage is higher than the advantage.
adopters 43 2.70 .708
-8.06
.000 non-adopters 117 3.79 .775
Old coffee stumping could be done at any height.
adopters
43 3.07 .552
-7.12
.000 non-adopters
117 3.85 .750
Stumping could be any shape and direction.
adopters 43 4.44 .590 4.619
.000
non-adopters 117 3.77 .885
Stumping could be done with any instrument like slasher and axe.
adopters
43 4.51 .506
3.669
.000 non-adopters
117 4.06 .746
If not done sucker control it is better not to stump.
adopters 43 4.47 .505
7.657
.000 non-adopters 117 3.58 .931 Even if not done sucker control it is better not to stump.
adopters 43 2.35 .686
-8.35
.000 non-adopters 117 3.67 .947
Sucker control can be done at the growth of any height.
adopters 43 4.42 .587
8.943
.000 non-adopters 117 3.24 1.048
The final stem remain should be not more than two.
adopters 43 4.35 .529 13.04
.000 non-adopters 117 2.86 .870
Can get good benefit by intercropping until the stumped coffee reach production stage.
adopters 43 4.26 .441
5.853
.000 non-adopters 117 3.67 .809
Replacing new seedling by uprooting the old one is better than stumping to improve production of coffee.
adopters 43 4.02 .511
7.995
.000
non-adopters
117
3.06
.994
(Source: Computed from own survey data. 2008)

62
4.3. Summary of Result of Descriptive Analysis
Before passing to the econometric part of the analysis it is probably important to summarize
the results of the descriptive statistics. In general about 30 explanatory variables were
considered out of which 25 of them had shown significant association with adoption of old
coffee stumping technology. Summary of the overall findings is presented in the tables below
(Table 13 and 14).
Table 13. Summary of Results of Continuous Explanatory Variables
Variable
Mean across adoption categories
Adopter Non-adopters T-value
Age of households 44.7 41.34 1.642(NS)
Total family size 7.44 6.53 2.942**
Coffee farming experience 24.37 21.15 1.791*
Education of households 3.67 3.28 1.667*
Total land holding in timad 5.97 3.89 4.792***
Coffee land holding in timad 2.83 1.78 3.893***
Labor availability 3.79 3.1 2.846***
Income from off-farm 2143.00 1169.00 1.210(NS)
Total farm income 8608.66 4490.48 3.439***
Livestock holding 3.54 2.85 2.835***
No. of field day participation 2.09 1.36 3.536***
Market distance Problem perception Stumping technology perception
2.64 4.14 3.92
2.22 3.76 3.62
1.419(NS) 8.119***
5.729***
*, ** and *** = significant at 10, 5 and 1% level of significance respectively.
NS= Not significant
(Source: Computed from own survey data. 2008)
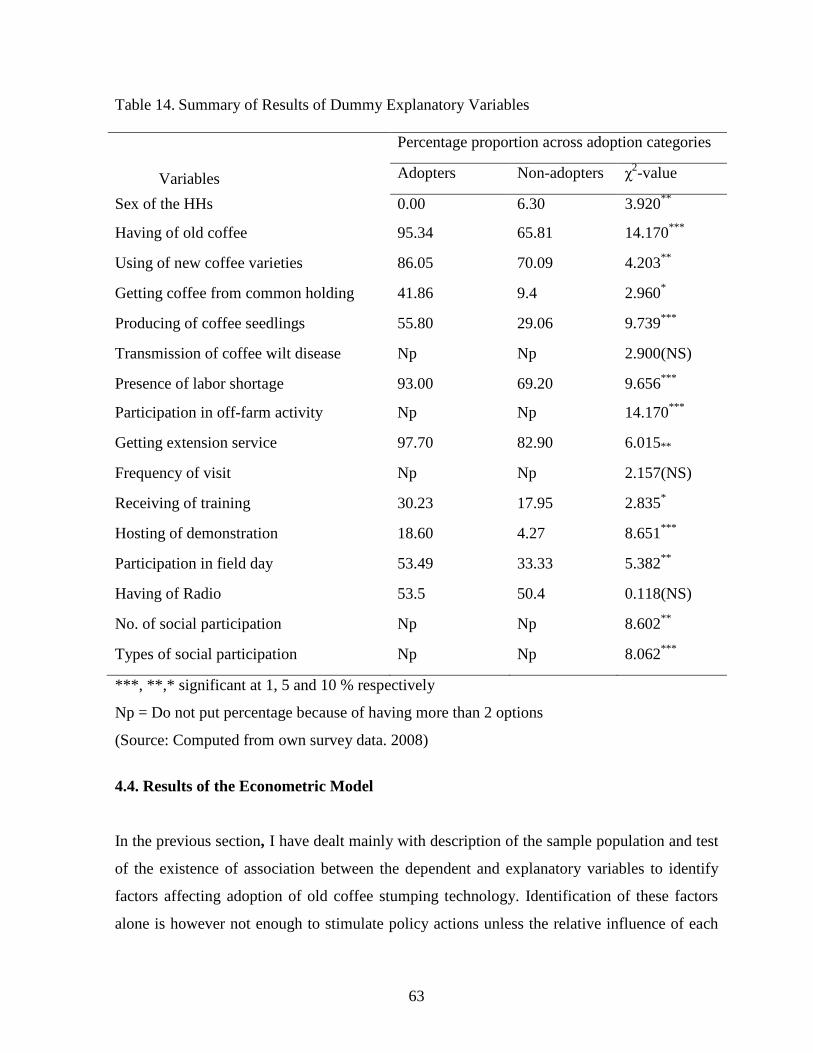
63
Table 14. Summary of Results of Dummy Explanatory Variables Variables
Percentage proportion across adoption categories
Adopters Non-adopters χ2-value
Sex of the HHs 0.00 6.30 3.920**
Having of old coffee 95.34 65.81 14.170***
Using of new coffee varieties 86.05 70.09 4.203**
Getting coffee from common holding 41.86 9.4 2.960*
Producing of coffee seedlings 55.80 29.06 9.739***
Transmission of coffee wilt disease Np Np 2.900(NS)
Presence of labor shortage 93.00 69.20 9.656***
Participation in off-farm activity Np Np 14.170***
Getting extension service 97.70 82.90 6.015**
Frequency of visit Np Np 2.157(NS)
Receiving of training 30.23 17.95 2.835*
Hosting of demonstration 18.60 4.27 8.651***
Participation in field day 53.49 33.33 5.382**
Having of Radio 53.5 50.4 0.118(NS)
No. of social participation Np Np 8.602**
Types of social participation Np Np 8.062***
***, **,* significant at 1, 5 and 10 % respectively
Np = Do not put percentage because of having more than 2 options
(Source: Computed from own survey data. 2008)
4.4. Results of the Econometric Model
In the previous section, I have dealt mainly with description of the sample population and test
of the existence of association between the dependent and explanatory variables to identify
factors affecting adoption of old coffee stumping technology. Identification of these factors
alone is however not enough to stimulate policy actions unless the relative influence of each

64
factor is known for priority based intervention. In this section, the results of the Tobit model
is presented and discussed to see the relative influence of different personal, demographic,
socio-economic, institutional and psychological variables on adoption and intensity of
adoption of old coffee stumping technology.
Several variables which had shown significant relationship with the dependent variable were
tried to be included into the model. But, regardless of their importance and their significant
relationship, some of them were excluded due to the instability they created in the model.
Finally a batch of twenty three variables that fit to the model was used for running the model.
Table 15 below presents list of these variables with their operationalization.

65
Table 15. List of variables to be included in the econometric model Variable Description Variable type Value
EDUHH Education of HHs Continuous Measured in grade of schooling
TFAMS Total family size Continuous Measured in man equivalent
LABAVAIL Labor availability Continuous Measured in labor man equivalent
NSOPART No. of social participation Continuous Measured in no. of social participation
EXPCOF Experience in coffee farming Continuous Measured in years
LANDHOLD Total land holding Continuous Measured in timads
LIVOWN Livestock ownership Continuous Measured in tropical livestock units
FARMINC Total farm income Continuous Measured in birr.
SIZCLAND Size of coffee land Continuous Measured in no. of coffee plants
MTPOPCO Mean farmers’ perception on problem of coffee oldness
Continuous Mean perception measured in likert scale
MTPOCST Mean perception of old coffee stumping technology
Continuous Mean perception measured in likert scale
NPARTIFD No. of participation in field day Continuous Measured in no.
SEXHH Sex of HHs Dummy 1=male, 2=female PRSOLAS Presence of labor shortage Dummy 0=no, 1=yes TYSPART Types of social participation Dummy Nominal
USINCC Using of new coffee cultivar Dummy 0=no, 1=yes
GCPFCH Getting coffee plants from common holding
Dummy 0=no, 1=yes
GETEXSR Getting advisory service Dummy 0=no, 1=yes PARTIFD Participation in field day Dummy 0=no, 1=yes RECTR Receiving training Dummy 0=no, 1=yes
HOSTDEM Hosting of demonstration Dummy 0=no, 1=yes
PROCOFSD Producing coffee seedlings Dummy 0=no, 1=yes
HAVOLCF Having of old coffee plants Dummy 0=no, 1=yes
(Source: Own survey data. 2008)
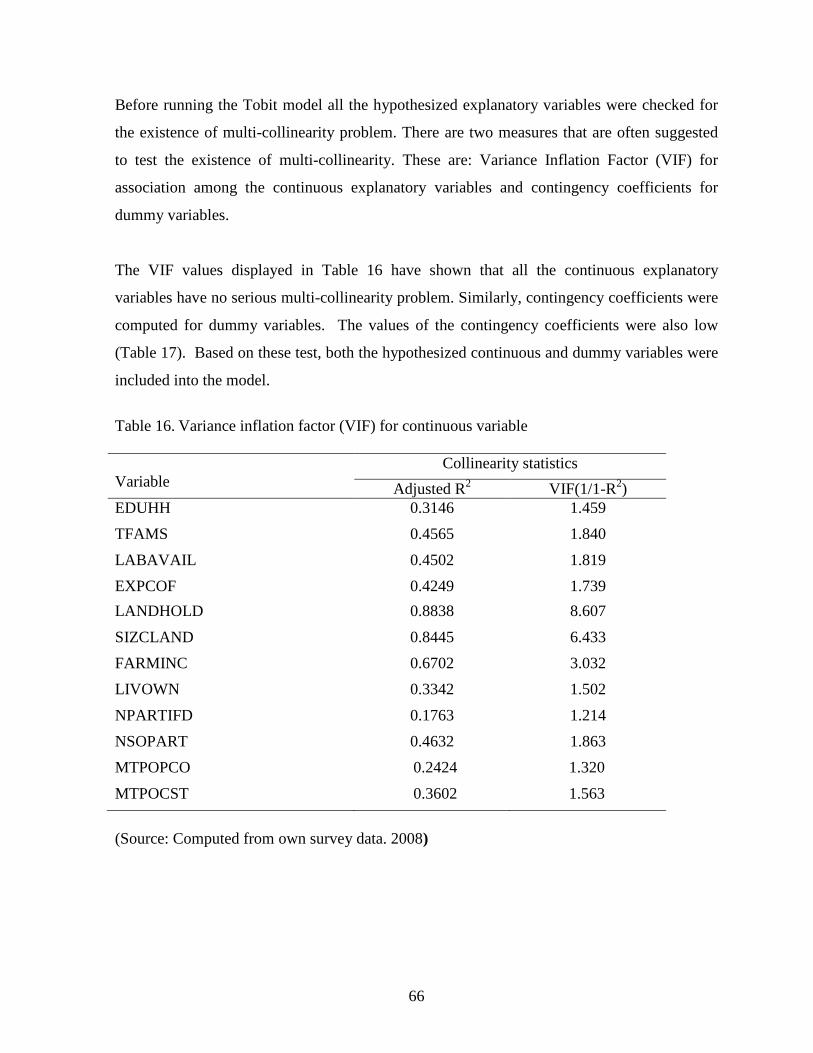
66
Before running the Tobit model all the hypothesized explanatory variables were checked for
the existence of multi-collinearity problem. There are two measures that are often suggested
to test the existence of multi-collinearity. These are: Variance Inflation Factor (VIF) for
association among the continuous explanatory variables and contingency coefficients for
dummy variables.
The VIF values displayed in Table 16 have shown that all the continuous explanatory
variables have no serious multi-collinearity problem. Similarly, contingency coefficients were
computed for dummy variables. The values of the contingency coefficients were also low
(Table 17). Based on these test, both the hypothesized continuous and dummy variables were
included into the model.
Table 16. Variance inflation factor (VIF) for continuous variable Variable
Collinearity statistics
Adjusted R2 VIF(1/1-R2) EDUHH 0.3146 1.459
TFAMS 0.4565 1.840
LABAVAIL 0.4502 1.819
EXPCOF 0.4249 1.739
LANDHOLD 0.8838 8.607
SIZCLAND 0.8445 6.433
FARMINC 0.6702 3.032
LIVOWN 0.3342 1.502
NPARTIFD 0.1763 1.214
NSOPART 0.4632 1.863
MTPOPCO 0.2424 1.320
MTPOCST 0.3602 1.563
(Source: Computed from own survey data. 2008)
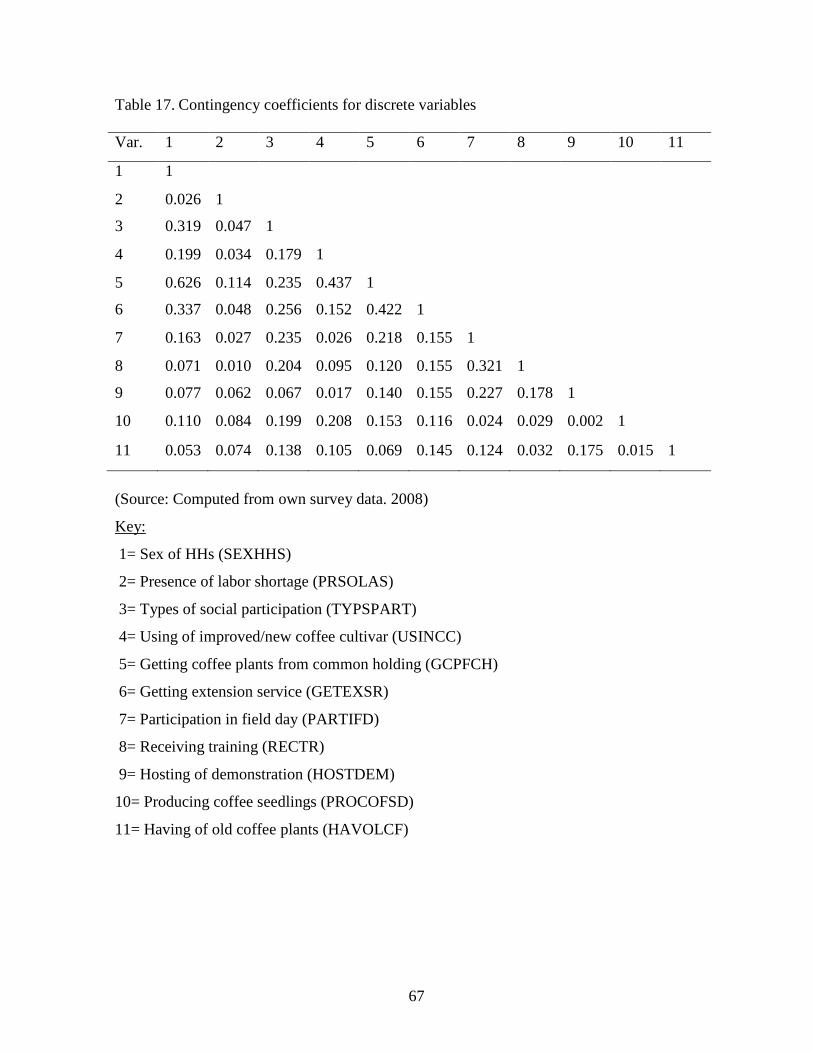
67
Table 17. Contingency coefficients for discrete variables Var. 1 2 3 4 5 6 7 8 9 10 11
1 1
2 0.026 1
3 0.319 0.047 1
4 0.199 0.034 0.179 1
5 0.626 0.114 0.235 0.437 1
6 0.337 0.048 0.256 0.152 0.422 1
7 0.163 0.027 0.235 0.026 0.218 0.155 1
8 0.071 0.010 0.204 0.095 0.120 0.155 0.321 1
9 0.077 0.062 0.067 0.017 0.140 0.155 0.227 0.178 1
10 0.110 0.084 0.199 0.208 0.153 0.116 0.024 0.029 0.002 1
11 0.053 0.074 0.138 0.105 0.069 0.145 0.124 0.032 0.175 0.015 1
(Source: Computed from own survey data. 2008)
Key:
1= Sex of HHs (SEXHHS)
2= Presence of labor shortage (PRSOLAS)
3= Types of social participation (TYPSPART)
4= Using of improved/new coffee cultivar (USINCC)
5= Getting coffee plants from common holding (GCPFCH)
6= Getting extension service (GETEXSR)
7= Participation in field day (PARTIFD)
8= Receiving training (RECTR)
9= Hosting of demonstration (HOSTDEM)
10= Producing coffee seedlings (PROCOFSD)
11= Having of old coffee plants (HAVOLCF)

68
4.4.1. Determinants of adoption and intensity of adoption of old coffee stumping technology Estimates of the parameters of the variables expected to determine the adoption and intensity
of adoption of old coffee stumping technology are given in Table 18. A total of 23
explanatory variables were considered to be included in the econometric model, of which nine
variables were found to significantly influence adoption and intensity of adoption of old
coffee stumping technology. These include, education of household head, labor availability,
having of old coffee, producing of coffee seedlings, getting coffee plants from common
holding, participation in field day and frequency (number) of participation in field day, types
of social participation, and coffee oldness problem perception.
Education of households (EDUHH): Education has a positive and significant relationship
with the adoption and intensity of adoption of old coffee stumping technology. In this regard,
the adoption and intensity of adoption of old coffee stumping technology by farmers who
were literate is likely to be greater than farmers who were illiterate. This suggests that being
literate would improve access to information, capable to interpret the information, easily
understand and analyze the situation better than illiterate farmers. So, farmer who are literate
were likely to stump and manage their old coffee than those illiterate farmers. This result has
supported by other previous studies such as Lelissa (1998), Techane (2002), Lelissa and
Mulate (2002), Yitayal (2004).
Presence of labor shortage (PRSOLAS): Household’s presence of labor shortage was also
positively related with adoption of old coffee stumping technology. As seen in descriptive
parts the adopters had more labor than non-adopters, but also labor shortage was higher for
adopters than non-adopters. This may be implies that due to most of adopters had better
economic status and investment also they demand other labor. And old coffee stumping
technology needs more labor for stumping and management, still they are more in need of
labor than non-adopters.
Having of old coffee plants (HAVOLCF): The Econometric Tobit model analysis showed
that old coffee stumping technology adoption and intensity of adoption were significantly
influenced by the area of old coffee plants. Having of more old coffee trees or hectare of land

69
increases the probability of adoption of old coffee stumping technology. The implication is
that, adoption of old coffee stumping technology had related to area of old coffee plants.
Producing coffee seedlings (PROCOFSD): In the area the farmers have produced coffee
seedlings for their own planting and commercial purpose, as the result they got additional
income and intensive extension support. The econometric Tobit model result showed that it
has positive relation with adoption and intensity of adoption of old coffee stumping
technology). The variable has positive contribution in the adoption and intensity of adoption
of old coffee stumping technology. The implication is that emphasis has to be given to
farmers’ participation in other coffee extension activity as like of this coffee seedlings
production activity.
Getting coffee plants from common holding (GCPFCH): As the Econometric Tobit model
result showed getting coffee plants from common holding has positive and significant relation
to the adoption and intensity of adoption of old coffee stumping technology. This implies that
coffee which has planted in modern plantation system gives higher yield for limited
consecutive years and need recycling at earlier time than old plantation system. The farmers
who had this modern plantation tend to stump their coffee than others who had not. This
means that who have this common holding coffee farms had the probability of adoption of old
coffee stumping technology, and this implies that increase or extend the modern plantation
system is important.
Participation in field day (PARTIFD): Participation in extension events is the other means
through which farmers get information about improved technologies. Such events include
extension arrangements such as training, demonstration, and field days or visits. In this study,
participation of farmers in field day program was considered as one variable. Result of the
finding indicated participation in field day program was positively and significantly related to
adoption of old coffee stumping technology at 5% significance level. The implication is that
emphasis has to be given to farmers’ training, participation in demonstration, and field days to
enhance adoption of old coffee stumping technology.

70
Number or frequency of participation in field day (NPARTIFD): In participation of
extension events like field day the mere participation is not enough to see the impact in
adoption, also the number or frequency of participation should be considered. In this case as
the Econometric Tobit model result showed the number or frequency of participation in field
day visit has positive and significant relation to adoption and intensity of adoption of old
coffee stumping technology. As the farmers’ number of times of participation/frequency in
field day visits increases the probability of adoption of old coffee stumping increases. The
implication is that emphasis has to be given to farmers’ participation in extension events
repeatedly like field day visit to enhance adoption of old coffee stumping technology.
Types of social participation (TYPSPART): Membership and leadership in community
organization assumes that farmers who have some position in PAS and other different social
organization are more likely to be aware of new practices as they are easily exposed to
information. Therefore, as the Econometric Tobit model analysis result showed the types of
social participation has significant and positive relationship with the adoption of old coffee
stumping technology. This implies that from less and only member ship participation in
organization, being leader and committee were more likely to adopt old coffee stumping
technology, there fore strengthening the types of participation in organization enhance
adoption of old coffee stumping technology.
Mean farmers’ perception on problem of coffee oldness (MTPOPCO): Farmers’
perception about the problem of coffee oldness was included in the model because it was
found important to test the perception of the farmers about decline of coffee production due to
oldness of coffee plants which has contribution to search solution for the problem and tends to
stump their old coffee. Then the result from the Tobit model revealed that this variable
influenced adoption and use intensities positively. This shows that those farmers who
perceived the problem serious are more likely to adopt the technology and hence to overcome
the problem. Therefore this implies that emphasis should be given to problem awareness and
show the problem with tangible facts.

71
Table 18. Maximum Likelihood Estimates of Tobit Model Variable Coeff. Std.Err. t-ratio P-value CONSTANT -4.52667 27.308 -0.165764 0.868343 SEXHH -1.48857 27.2936 -0.0545392 0.956506 EDUHH 0.0782856 0.0298318 2.62423*** 0.00868443 TFAMS 0.00717146 0.02268 0.316202 0.751849 LABAVAIL 0.0444655 0.0366118 1.21451 0.224552 PRSOLAS 0.38098 0.107017 3.55998*** 0.000370882 EXPCOF 0.000936794 0.00495736 0.18897 0.850116 LANDHOLD 0.0223028 0.0290949 0.766554 0.443347 SIZCLAND -0.00443899 0.0420569 -0.105547 0.915942 FARMINC -1.0117e-005 1.23535e-005 -0.818957 0.412811 LIVOWN 0.00170013 0.0014374 1.18279 0.236894 HAVOLCF 0.348547 0.139061 2.50643** 0.0121956 USINCC -0.0412422 0.115361 -0.357506 0.720713 PROCOFSD 0.154249 0.0830112 1.85817* 0.0631452 GCPFCH 0.273417 0.0806258 3.39119*** 0.000695906 GETEXSR -0.0548285 0.173713 -0.315627 0.752285 PARTIFD 0.878241 0.424963 2.06663** 0.038769 NPARTIFD 0.117505 0.0575994 2.04005** 0.0413455 RECTR 0.0503918 0.0839652 0.600151 0.548405 HOSTDEM -0.141078 0.119751 -1.1781 0.238757 NSOPART 0.0353353 0.0522366 0.676446 0.498758 TYPSPART 0.153317 0.0818241 1.87374* 0.0609662 MTPOPCO 0.67114 0.149042 4.50302*** 6.69934e-006 MTPOCST 0.18784 0.120745 1.55567 0.119786 Sigma 0.272927 0.0331476 8.23368 2.88658e-015
***, ** and * represents 1%, 5% and 10% significance level respectively.
Source: Model output

72
4.4.2. Effects of changes in the significant explanatory variables on probability of adoption and intensity of adoption of old coffee stumping technology
Using a decomposition procedure suggested by McDonald and Mofffitt (1980), the results of
Tobit model can be used to assess the effects of changes in the explanatory variables into
adoption and intensity of use of improved technologies (Adensina and Zinnah, 1993; Bezabih,
2000 as cited in Endarias, 2003). Based on this fact, in this study too, the effect of changes in
the explanatory variables on the probability of adoption and intensity of adoption of old
coffee stumping technology was computed and the results are summarized in Table 19.
The results computed indicate that a unit increase in education of the household head would
increase the probability of adoption and intensity of adoption of old coffee stumping
technology by 0.09% and 6.7% respectively. This indicates that, as there is an improvement in
educational level would improve access to information so that the farmer can easily
understand the benefit of old coffee stumping technology and increases the probability of
adoption and intensity of adoption.
Household’s presence of labor shortage was one of the variables found in this study to
positively influence adoption of old coffee stumping technology. Analysis of its marginal
effect indicated that the household’s came from non-labor shortage to labor shortage increase
in the probability and intensity of adoption of old coffee stumping technology by 3.6 % and
71 % respectively. This indicated that the technology especially management of stumped
coffee like pruning and sucker control needs extra labor, therefore it implies that there is a
need of introducing minimum labor demand technology specially pruning operation tools, as
there is shortage and less quality of existing tools.
A higher marginal effect was accounted to participation in field day and perception about
decline of production due to oldness of coffee plants. Participation in field day increases
probability of adoption and intensity of use of old coffee stumping technology by1% and 74%
respectively. Similarly, Positive perception about the problem of coffee oldness increases by
one level of measurement increases the probability of adoption and intensity by 0.78% and
57% respectively.

73
A marginal change in having of old coffee plants increases the probability of adoption and
intensity of adoption of old coffee stumping technology by 0.04% and 29.7% respectively.
A marginal effect producing coffee seedlings increases the probability of adoption and
intensity of adoption by 0.18% and 13% respectively. This implies that strengthening other
area of coffee production extension activity has significant contribution on the adoption of old
coffee stumping technology.
A positive marginal effect was accounted; one comes from not getting coffee plants from
common holding distribution to getting coffee plants from common holding as previously
hypothesized, increases the probability of adoption and intensity of adoption by 0.32% and
23% respectively. This could be because that the common holdings were modern plantation
and planted with rows and minimum spacing, and needs earlier recycling or stumping than
local planted coffee. Therefore, expanding modern plantation can increase stumping activity.
A marginal change in number of participation in field day visits increases probability of
adoption and intensity of adoption of old coffee stumping technology by 0.14 % and 10 %
respectively. Similarly, a change in participation of social organization from less participation
to committee and leader type participation increases probability of adoption and intensity of
adoption by 0.18% and 13% respectively. This implies the need to give emphasis to increase
number of field day participation or visiting and strengthening types of social participation to
enhance adoption of old coffee stumping technology. When we said increasing types of social
participation, increase their involvement in any activity of social organization by encouraging
members with different means of incentives like moral and material incentives, also by
strengthening the organization itself to fulfill its’ establishment objectives.

74
Table 19. The effect of change in significant explanatory variables on adoption and intensity of adoption of old coffee stumping technology
Variable Change in the Change in the Change among
Probability intensity of adoption * the whole *
of adoption *
iX
ZF
∂∂ )(
i
ii
X
YYE
∂>∂ 0/( *
i
i
x
YE
∂∂ )(
CONSTANT -0.0524 -3.8574 -0.3797
EDUHH 0.0009 0.0667 0.0066
PRSOLAS 0.0044 0.3246 0.0320
HAVOLCF 0.0040 0.2970 0.0292
PROCOFSD 0.0018 0.1314 0.0129
GCPFCH 0.0032 0.2330 0.0229
PARTIFD 0.0102 0.7484 0.0737
NPARTIFD 0.0014 0.1001 0.0099
TYPSPART 0.0018 0.1306 0.0129
MTPOPCO 0.0078 0.5719 0.0563
* Computed using mean values
Source: Model output
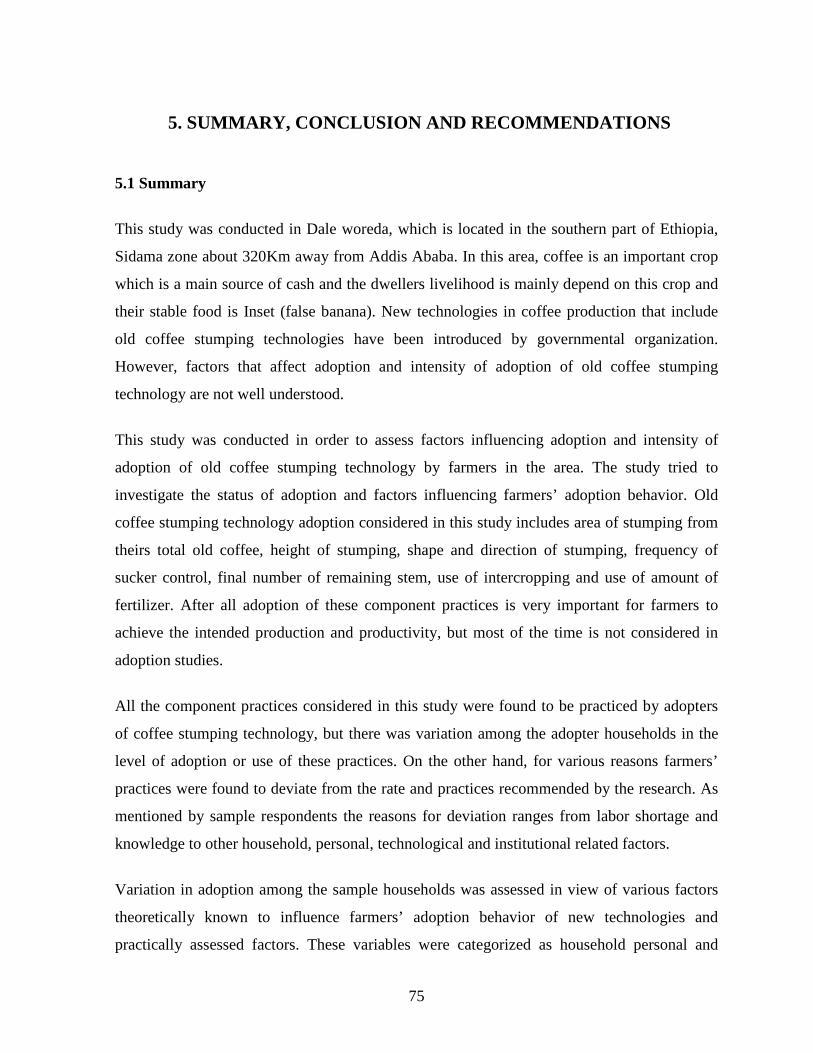
75
5. SUMMARY, CONCLUSION AND RECOMMENDATIONS 5.1 Summary
This study was conducted in Dale woreda, which is located in the southern part of Ethiopia,
Sidama zone about 320Km away from Addis Ababa. In this area, coffee is an important crop
which is a main source of cash and the dwellers livelihood is mainly depend on this crop and
their stable food is Inset (false banana). New technologies in coffee production that include
old coffee stumping technologies have been introduced by governmental organization.
However, factors that affect adoption and intensity of adoption of old coffee stumping
technology are not well understood.
This study was conducted in order to assess factors influencing adoption and intensity of
adoption of old coffee stumping technology by farmers in the area. The study tried to
investigate the status of adoption and factors influencing farmers’ adoption behavior. Old
coffee stumping technology adoption considered in this study includes area of stumping from
theirs total old coffee, height of stumping, shape and direction of stumping, frequency of
sucker control, final number of remaining stem, use of intercropping and use of amount of
fertilizer. After all adoption of these component practices is very important for farmers to
achieve the intended production and productivity, but most of the time is not considered in
adoption studies.
All the component practices considered in this study were found to be practiced by adopters
of coffee stumping technology, but there was variation among the adopter households in the
level of adoption or use of these practices. On the other hand, for various reasons farmers’
practices were found to deviate from the rate and practices recommended by the research. As
mentioned by sample respondents the reasons for deviation ranges from labor shortage and
knowledge to other household, personal, technological and institutional related factors.
Variation in adoption among the sample households was assessed in view of various factors
theoretically known to influence farmers’ adoption behavior of new technologies and
practically assessed factors. These variables were categorized as household personal and
76
demographic, socio-economic, institutional and psychological factors. Result of descriptive
statistics using independent sample t-test, chi-square and bivariate correlation tests indicated
that most of the variables hypothesized to influence farmers’ adoption behavior were
significantly related with adoption of old coffee stumping technology.
From household’s personal and demographic factors, sex of the household head, family size
and education were positively and significantly related to adoption of old coffee stumping
technology.
Households’ farm characteristics are also other important factors which influence adoption of
old coffee stumping technology. In this study, total land holding, coffee land holding, old
coffee plants holding, using of improved new coffee cultivar, getting coffee plants from
distribution of common holdings and participating in coffee seedling preparation (producing)
were found to have positive and significant relationship with adoption.
Concerning economic and wealth related variables which were hypothesized to influences
adoption of old coffee stumping technology and have related positively and significantly with
adoption are total farm income, livestock holding and labor availability.
From institutional variables, contact with extension information sources, participation in
extension events (training, field day participation and hosting demonstration) and social
participation (types of social participation and number of social participation) were found to
have positive and significant relationship with adoption of old coffee stumping technology.
Moreover the psychological factors, perception about the problem of coffee oldness and
decline of production, and perception about old coffee stumping technology were found to be
positively and significantly related to adoption of coffee stumping technology.
Old coffee stumping technology is relatively labor intensive activity and has risks that they
loss more than two years production until the new suckers emerge, growth and reached
production stage. And also the farmers fear that after stumping the sucker may not shoot. On
the other hand as they indicated in group discussion, they do not know the right reaching time

77
of stumping either in the case of yield or in the case of age of coffee trees and even mostly
they assumes the old coffee is not reached to stumping. Therefore farmers need to get deep
and detail information (knowledge), close advices on technical use of recommended activities.
Other additional institutional support like demonstration, field day visit and training are also
crucial important to convince the farmer practically in tangible facts.
On the other hand, results of the econometric model indicated the relative influence the
different variables have on adoption and intensity of adoption of old coffee stumping
technology. A total of twenty three explanatory variables were included into the model of
which nine variables had shown significant relationship with adoption of old coffee stumping
technology. Accordingly, education level of HHs, presence of labor shortage, having of old
coffee, participation in producing coffee seedlings, getting coffee plants from common
holding, participation of field day, number of participation of field day, types of social
participation and mean total perception about problem of coffee oldness & decline of
production were found to have positive and significant influence on adoption and intensity of
adoption of old coffee stumping technology. Contrary to the hypothesized idea, presence of
labor shortage in the household head had shown positive relationship with adoption and
intensity of adoption of old coffee stumping technology.
5.2. Conclusion and Recommendations
As repeatedly stated coffee production is a highly cash crop business and foreign exchange
commodity. Its contribution to households’ income and food security is very high. It also
provides job opportunities for other peoples other than farmers. Regardless of its contribution,
however, the emphasis given nationally to the sector is relatively low compared to the benefit
gained from this crop. As a result of this, institutional support provided to this sector, such as
credit service, research and extension was not to the expected level. These factors together
with several household personal, demographic and socio-economic factors greatly affected the
adoption of old coffee stumping technologies and consequently production and productivity
of the sector. Based on the research findings of this study, the following points are

78
recommended to improve farmers’ adoption of old coffee stumping technology so as to
enhance production and productivity.
Non-adoption and variation in level of adoption among households was found to be
influenced among other things by households’ size of coffee farm, participation of other
coffee production extension like raising coffee seedlings, participation in extension events
(training, field visiting and hosting demonstration), education, and generally resource owner
ship and income position. As a result of this, female headed households and resource poor
farmers could not adopt old coffee stumping technology. Therefore, strengthen of financial
position of female households and resource poor male households have to be considered as a
central and core component of any development intervention in the sector.
Old coffee stumping technology involves the use of different practices which require
knowledge and skill of application and management. Education was found to have a strong
relation with adoption of old coffee stumping technology as it enhances ability to acquire and
use information required for stumping and management. Therefore, due emphasis has to be
given towards strengthening rural education at different levels for youth and adults.
Farmers’ deviation from estimated of old coffee holdings which could be stumped and
recommended package was found partly due to poor extension service and lack of relevance
of the recommended type of old coffee which could be stumped. Therefore, revisiting of the
previous estimated total area of old coffee which could be stumped is highly important. And
increasing of the farmers’ knowledge of relative advantage of stumping and the type of coffee
which could be stumping is crucial. To this end promotion of participatory research and
participatory assessing and estimating of old coffee which could be stumping should be given
due attention. Similarly, extension service provision especially with farmers’ field school has
to be strengthened so as to improve farmers’ access to information and extension advices.
As discussed in focus group discussion one of the major bottle necks to the development of
old coffee stumping technology is poor supply and access of stumping and pruning tools.
Especially pruning shears, since after stumping the next critical operation is sucker control
management and done with this pruning shear. And almost all of adopter respondents have

79
not these tools; therefore it is highly affected intensity of adoption of old coffee stumping
technology. In addition to this scarcity the existing limited stumping sow and pruning shears
are poor in quality, it loss its’ sharpness with one round working. This implies that a need of
provision of enough quantity of this tools with the standard quality with reasonable and
affordable price. Especially at this time since there is a prevalence of coffee wilt disease, to
control or minimize dissemination of this disease it is better every coffee grower households
have their own personal tools.
The other point which was discussed in focus group discussion was that some of the farmers
criticize stumped coffee production had not give better yield than un stumped old coffee
plants specially to some farmers field. And as the researcher observed and not few some
farmers said that their stumped coffee gave better yield, the problem of this criticism is due to
soil fertility status of those specific stumped plots. Therefore soil fertility management and
stumping should be done simultaneously; otherwise with out improving soil fertility stumping
alone is not enough to improve coffee production. This implies that great attention should be
taking for soil fertility equally to stumping to get the desired increment of production by
stumping.
Result of this study also indicated that there was significant difference in adoption and level
of adoption among farmers who perceived the problem of coffee oldness and production
declined positively and not perceived positively. Hence, emphasis has to be given to create
awareness and show the problem with tangible evidence is important and due attention for
adoption and intensity of adoption of old coffee stumping technology.

80
REFERENCES Abadi, A. K. and D.J., Pnnel, 1999. A Conceptual Frame Work of Adoption of an Agricultural Innovation. Agricultural Economics, University of Western Australia, Perth, 2(9): 145-154. Abd-Ella,M.M., E.O.,Hoiberg, and R.D.,Warren, 1981. Adoption Behavior of Family Farm Systems: An Iowa Study. Rural Sociology. Iowa State University: Ames, Iowa, 46(1): 42-61. Adesina, A.A.and Zinnah, M.M..1993. Technology characteristics, farmers' perceptions and adoption decisions: A Tobit model application in Sierra Leon, Agricultural Economics, 9(1993) 297-311.Elsevier Science Publishers B.V., Amsterdam Amemiya, T. 1985. Advanced Econometrics. T.J press, Padstow Ltd. Great Britain Arega Waktola, 1980. Assessment of the Diffusion and Adoption of Agricultural Technologies in Chilal. Ethiopian Journal of Agricultural Systems, 2 (1): 51-68. Asante-Mensah, S. and Seepersad, J.,1992. Factors influencing the Adoption of Recommended Practices by Cocoa farmers in Ghana. Journal of Extension Systems, 8 (1). Asfaw Negassa, Gungal, K., Mwangi, W. and Beyene Seboka, 1997. Factors Affecting Adoption of Maize Production Technologies in Ethiopia. Ethiopian Journal of Agricultural economics. 2: 52-69 Ashri, A., 1996. Impact of innovations: Technologies and production considerations in assessing the impact of agricultural research in developing countries. Food security and innovations: Successes and lessons learned. International Symposium, University of Hohenheim. Bekele Hundie Kotu, H. Verkuijl, W. Mwangi, and D. Tanner. 2000. Adoption of Improved Wheat Technologies in Adaba and Dodola Woredas of the Bale Highlands, Ethiopia. Mexico, D.F.: International Maize and Wheat Improvement Center (CIMMYT) and Ethiopian Agricultural Research Organization (EARO).
81
Berhanu Bedassa. 2002. Analysis of Factors Affecting the Adoption of Crossbred Dairy Cows in the Central Highland of Ethiopia: The Case of Two Districts in North Shoa Zone. MSc Thesis. Alemaya University. Ethiopia. Bezabih Emana. 2000. The Role of New Varieties and Chemical Fertilizer Under Risk: The Case of Small Holders in Eastern Oromia, Ethiopia. PhD Dissertation, University of Hannover, Shaker Verlung. Germany. Botha, C.A.J., 1986. The Influence of Different Perception on the Adoption of Practices Relating to Drought Resistance. South African Journal of Agricultural Extension, 15, 25-31. Cary, W.J. and I.R.Wilkinson, 1997. Perceived profitability and farmers’ conservation behavior. Journal of Agricultural Economics, (48) 1-3: 13-21. Chilot Yirga., 1994 .Factors Influencing Adoption of New Wheat Technologies in the Wolemera and Addis Alem Areas of Ethiopia, M. Sc. Thesis, Alemaya University. Chilot Yirga, Shampiro, B.I, and Mulat Demeke, 1996. Factors Influencing doption of new weate technologies in Wolmera and Addis Alem Areas of Ethiopia. Ethiopian Journal of Agricultural economics. 1:63-83 CIMMYT.1993.The Adoption of Agricultural Technologies: A Guide to Survey Design, Mexico, D.F.: CIMMYT.
Colman, D.and T.Young, 1989. Principles of Agricultural Economics: Markets and prices in Less Developing Countries. Cambridge University press Great Britain. Croppenstedt, A., Mulat Demeke and Meshi, M. 1999. "An Empirical Analysis of Demand for Fertilizer in Ethiopia" Ethiopia Journal of Agricultural Economics. 3:1-27. CSA. 2003. Statistical Report on Area and Production of crops part III. Results for Tigray Region. Addis Ababa. Ethiopia. Dasgupta, S., 1989. Diffusion of Agricultural Innovations in Village India, Department of Sociology and Anthropology, University of Prince Edward Island, Canada

82
Degnet Abebaw. 1999. Determinants of Adoption of HYVs of Maize in Jimma Zone: The case of Mana and Kersa Woredas. MSc Thesis. Alemaya University. Ethiopia. Degnet Abebaw, Belay Kassa, Aregay Waktola, 2001. Adoption of high-yielding maize varieties in Jimma Zone: Evidence from farmers’ level data. Ethiopia. J. of Agri. Economics. 5 (1&2): 41-62, Feb.2001. Demel Teketay. 1999. History, Botany and Ecological Requirement of Coffee. The Ethiopian Wildlife and Natural History. No. 20: 28-50. Düvel , G.H.. 1991. Towards a model for the promotion of complex innovations through programmed extension. S. Afr. J. Agric. Extension. 20: Pp 70-86. Duvel, G.H. and Botha, A.J., 1999. Human Constraints to Sustainable Agriculture in the Arid Regions of South Africa. The journal of Agricultural Education and Extension, 6(1): 47-60. Endrias Geta.2003. Adoption of improved sweet potato varieties in Boloso Sore woreda, southern Ethiopia, M.Sc. Thesis, Alemaya University, Ethiopia. Enters, T., 1996. Adoption: Section review. In Soil Conservation Extension from concepts to Adoption. Soil and Water Conservation Society of Thailand. 399 – 403. Feder, L., R.E., Just and O., Zilberman, 1985. Adoption of Agricultural Innovation, in Developing Countries: A Survey, Economic Development and Cultural Change, 32(2): 255-298. Fliegel, F.C., 1984. Extension Communication and the Adoption Process. In: FAO. A reference manual, 2nd ed. Rome. Freeman, H.A., Ehui, S.K, and N. G/silassie, 1996. The Role of Credit in the Uptake of Improved Dairy Technologies. Ethiopian Journal of Agricultural economics. 1: 11-17 Getahun, Degu, 2004. Assessment of Factors Affecting Adoption of Wheat Technologies and Its Impact: The Case of Hula Woreda, Ethiopia. MSc. Thesis (Unpublished) Presented To School of Graduate Studies of Alemaya University.

83
Giger, M.linger, H.P.Critchley, W.1999. Use of direct incentives and profitability of Soil and Water conservation in Eastern and Southern Africa. Preliminary analysis of WOCAT data, New Delhi. Gockowski, J. and Ndoumbe, M., 2004. The Adoption of Intensive Mono-Crop Horticulture in Southern Cameroon. Elsevier B.V: Younde, Cameroon. Http://Www.Worldcocoafoundation.Org. Gujarati, D.N. 1995. Basic Econometrics. Third Edition. International Editors. Habtemariam Abate, 2004. The comparative Influence of Intervening variable in the adoption of Maize and Dairy Farmers in Shashemene and Debrezieit, Ethiopia. PhD Thesis, University of Pretoria Haji Biru, 2003. Adoption of crossbred dairy cows in Aris Zone, The case of Tiyo and Lemu Bilbilo Woreds. M.Sc Thesis AU. Hansel, H., 1974.Input Innovation, Producer Credit and Social Differentiation. East Africa Journal of Rural Development. 7(1): 109-121, IATP, 1995. "Coffee Hand Book" Manual prepared by International Agricultural Training Program and Coffee Improvement project, Addis Abeba IPMS, 2005 Dale Woreda Pilot Learning Site Diagnosis Survey Report. Itana Ayana, 1985. An analysis of factors affecting the adoptions of packages of agricultural technologies in subsistence agriculture. A case study in two Extension Districts of Ethiopia. MSc. Thesis. Alemaya University. Ethiopia. Johnston, J. And Dinardo, J. 1997. Econometrics Methods. Fourth Edition. The McGraw-Hill Companies, Inc, New York. Kansana, H.S., Sharma, R.P., and Sharma, S.K., 1996. Knowledge and Adoption of Wheat Technologies among Contact and Non-Contact Farmers. Agricultural Science, Digest Karnal, 16:154-156.

84
Kedir Bati, 1998. The Role of SG2000 Project Credit System in The Adoption of Wheat Technologies By Smallholder Farmers in Ethiopia. The case of Hetosa Disrict. M. Sc. Thesis, Sokoine Agricultural University, Morongono, Tanzania. Kidane Gebremariam. 2001. Factors influencing the adoption of new maize varieties in Tigray, Ethiopia. The case of Hawzien Woreda. MSc Thesis. Alemaya University. Ethiopia. Koch, B.H., 1986. The Role of knowledge in Adoption of Agricultural Development Practices. South African Journal of Agricultural Extension, 14: 11-16. Leathers, H.D., and M.Smale, 1991. Abyssinian approach to explaining sequential adoption of components of a technological package. American Journal of Agricultural Economics, 73(3): 734 – 742. Legesse Dadi. 1992. Analysis of factors influencing adoption and the impact of wheat and maize technologies in Arsi Negelle Area, Ethiopia. MSc Thesis. Alemaya Agricultural University. Ethiopia. Legesse Daddi. 1998. Adoption and Diffusion of Agricultural Technologies: The case of East and West Shoa Zones, Ethiopia, A Thesis Submitted to the University of Manchester for the degree of Doctor of Philosophy in the Faculty of Economics and Social Studies, School of Economic Studies. Legesse Dadi. 2004. Agricultural Research and Technology Development in Ethiopia. Proceedings of the workshop held to discuss the socio-economic research results of 1998-2002. August 6-8, 2002, Addis Ababa, Ethiopia. EARO, 2004. Lelissa Chalichissa. 1998. The Determinants of Adoption, Intensity and profitability of fertilizer Use. The Case of Ejere district, West Shoa Zone. M.Sc. Thesis. Addis Ababa University. Ethiopia.
Lelissa Chalchissa and Mulat Demeke. 2002. The Determinants of Adoption and Intensity of fertilizer use in Ejera District, West Shoa Zone, Ethiopia, Institute of Development Research (IDR), Addis Ababa.

85
Louw, G. and Duvel, G.H., 1993. The Adoption of Old man Saltbush (Atriplex Nummularia) as Influenced by an Extension Programme. South African Journal of Agricultural Extension, 29-37. Maddala, G.S. 1992. Introduction to Econometrics. Second Edition. Macmillan Publishing Company, New York. Maddala, G.S. 1997. Limited Dependent and Qualitative Variables in Econometrics. Cambridge University press. Mcdonald, J.F., and R.A. Moffit,1980. “The uses of Tobit Analysis.” Review of Economics and Statistics 62(2):318-321. Melaku Gorfu, 2005. Adoption and Profitability of Kenyan Top Bar Hive Beekeeping Technology. Study in Ambasal Woreda of Ethiopia. Msc. Thesis (Unpublished) Presented to School of Graduate Studies of Alemaya University. MEDAC, 1999. Survey of the Ethiopian Economy. Review of the post reform development (1992/93 – 1997/98). Addis Ababa, Ethiopia. Meseret Wondimu. 1998. The Genetic Diversity of Ethiopian Coffee. Kaffa Coffee: 25-30. Addis Ababa, Ethiopia. Mesfin Astatkie, 2005. Analysis of factors Influencing Adoption of Triticale and its Impact.The Case Farta Wereda. Msc. Thesis (Unpublished) Presented to School of Graduate Studies of Alemaya University. Million Tadesse and Belay Kassa, 2004. Determinants of Fertilizer Use in Gununo Area, Ethiopia. Proceedings of the workshop held to discuss the socio-economic research results of 1998-2002. August 6-8, 2002, Addis Ababa, Ethiopia. Pp 30. EARO, 2004. MOA, 1974 changed by Belay, 1999 cited in Trends and Determinants of Fertilizer Use in Gozamin Woreda, Amhara Region MSc. Thesis in Agricultural Economics By Teferi Wondale, April 2003.

86
Mulugeta Mekuria, 1994. An Economic Analysis of Smallholder Wheat Production and Technology Adoption in the South Eastern Highlands of Ethiopia. PhD. Thesis, Michigan State University. Mulugeta Enki, 2000. Determinants of Adoption of Soil Conservation Practices in Central Highlands of Ethiopia.The Case of three Districts of Selale. M.Sc. Thesis (unpublished).School of Graduate Studies of Alemaya University: Alemaya. Mulugeta Enki, Belay Kassa and Legesse Dadi, 2001. Determinants of Adoption of Soil Conservation Measures in Central Highlands of Ethiopia. The Case of Three Districts of North Shoa. Agrekon,40( 3). Mwanga, J., A. Mussie, W., Mwangi, and H. Verkuijl, 1998.Adoption of Improved Wheat Technologies by Small-Scale Farmers in Mbeya District of Southern Highlands, Tanzania. In the Tenth Regional Wheat Workshop for Eastern, Central and Southern Africa. University of Stellenbosch, Southern Africa, 14-18 September 1998. Nkonya, E. T Schroeder and D. Norman. 1997. Factors Affecting Adoption of Improved maize Seed and Fertilizer In Northern Tanzania. Journal of Agricultural Economics. 4: 1- 12. Oxfam International. 2002. Crisis in the Birthplace of Coffee. Oxfam International Research Paper. September 2002. Addis Ababa. Presser, H. A., 1969.Measuring Innovativeness rather than Adoption. Rural Sociology, 34 (4): 510-527. RAO,2007 ( Regional Agricultural Office ) Report 2006/2007 Awassa ,Ethiopia Ren’e Coste,1992.Coffee The Plant and The Product . The Macmillan press Ltd, London and Basingstoke. Rogers, E.M.1983. Diffusion of innovations: New York: The Free Press. Pp 1-5. Rogers, E.M., 1995. Diffusion of Innovations, New York: Free Press.

87
Roy,T.S. Bhogal and L.R. Singh, 1999. Tenancy and Adoption of New Farm Technology: A study in West Bengal, India; Bangladesh Journal of Economics, xxii (1999):39-49. Semgalawe, L.M..1998. Household Adoption Behavior and Agricultural Sustainability in the North Eastern Mountains of Tanzania: The Case of Soil Conservation in The North Pare and West Usambara Mountains: Wageningen Agricultural University. Netherlands. Shiyani, R.L., Joshi, P.K, Aokan, M. and Bantilan,M.C.S.. 2000. “Adoption of Improved Chickpea Varieties: Evidences from Tribal Region of Gujarat.” Indian Journal of Agricultural Economics. 55:179-170. Spencer, D.S.C., 1993 Social Science Research for Agricultural Technology Development: Spatial and Temporal Dimensions. CAB international. Techane Adugna Wakjira 2002 Determinants of Fertilizer Adoption in Ethiopia: The Case of Major Cereal Producing Areas. MSc Thesis. Alemaya University. Ethiopia. Tesfaye Zegeye, Girma Taye, D.Tanner, H.Verkuijl, Aklilu Agidie, W. Mwangi. 2001. Adoption of Improved Bread Wheat Varieties and Inorganic Fertilizer by Small-scale Farmers in Yelmana Densa and Farta Diatricts of Northwestern Ethiopia. Mexico, D.F.: Ethiopian Agricultural Research Organization (EARO) and International Maize and Wheat Improvement Center (CIMMYT). Tesfaye Beshah .2003.Understanding Farmers: Explain soil and water conservation in Konso, Wollaita, and Wello, Ethiopia, Ph.D. Thesis, Wagneningen University and Research Center. Van den Ban, A.W. and H.S. Hawkins, 1988. Agricultural Extension. John Wiley & Sons, inc., Newyork. Van den Ban and Hawkins, H.S, 1996. Agricultural Extension. Second edition. Blackwell Sciences Ltd. Carlton, Victoria, Australia
WAO,2007 (Woreda Agricultural Office) Report 2006/2007 Yirgalem,Ethiopia Wolday Amha, 1999. Improve Seed Marketing and Adoption in Ethiopia. Ethiopian Journal of Agricultural economics. 3:41-80.

88
Yapa, Lakshman and Robert, C.M., 1978.Non-adoption of innovations: Evidence from discriminator analysis. Economic Geography, (54) 2: 145-156. Yishak Gecho. 2005. Determinants of Adoption of Improved Maize Technology in Damot Gale Woreda, Wolaita , Ethiopia. MSc Thesis. Alemaya University Yitayal Anley. 2004. Determinants of Use of Soil Conservation Measures by Smallholder Farmers in Jimma Zone. The Case of Dedo District. Ethiopia. MSc Thesis. Alemaya University

89
7. APPENDIX
Appendix 1: The Interview Schedule
SCHOOL OF GRADUATE STUDIES HARAMAYA UNIVERSITY
ADOPTION AND INTENSITY SURVEY QUESTIONAIRE
Title: Determinant Factors and Intensity of Adoption of Old Coffee Stumping
Technologies on Coffee Farmers in Dale Woreda, SNNPR State.
Instruction � Introduce your self and get introduced with the respondent
� Tell to the respondent about the purpose of the study
� Check that all questions are asked and responses are filled accordingly
General information Date of interview………………
Name of the respondent: --------------------------------------------
Adopters ____________ Non adopters _________________
PA: ----------------------------------------------------------------------
Village: -----------------------------------------------------------------
Name of the Interviewer: -------------------------------Sign. ----------------------------
I. Household personal characteristics
1) Marital status __________ 1) single 2) married 3) divorced
4) Widow 5) widowers
2) Religion ______________ 1) protestant 2) orthodox 3) Muslim 4) catholic

90
5) Others (specify) __________________
3) Ethnicity ____________________
4. Household demographic characteristics and labor availability
*** Family relationship 1) Husband 2) Wife 3) Son 4) Daughter 5) Relative
** Education of HH head 1) Illiterate2) Read and write 3) 1-4grades 4) 5-8 grades 5)9-10
*Coffee production activities include:
1) Weeding (Slashing, Hoeing) 2) Stumping (including sucker control)
3) Compost preparation and composting 4) Inter cropping (Land preparation,
Sowing, harvesting) 5) Harvesting (picking) 6) Transportation
7) Drying 8) Marketing 9) others (specify)_______________
5. Do you face labor shortage problem in coffee production/stumping? 1) Yes __0) No_
6. If yes, how do you solve labor shortage problem?
Sr.
no.
Name of the HH members **
*Rel
atio
nshi
p
Sex
Age
**E
duca
tion
*Act
iviti
es p
artic
ipat
ed in
Nat
ure
of
part
icip
atio
n
Oth
er jo
b fo
r p
art-
time
part
icip
ants
Ful
l tim
e
Par
t-tim
e

91
1) By hiring 2) Asking for cooperation (Debo) 3) All 4) Others (Specify) -------
7. Household head experience in Coffee farming in years -----------------------
8. Household head experience in coffee stumping activities in years ---------------------
II. Social participation
9) In which of the following organization are you member and leader? Organization Non-
participant (0)
Member (Tick) (1)
Committee member (Tick) (2)
Leader (Tick) (3)
Frequency of participation in activities Never (0) Sometimes
(1) Always (2)
Idir Iqub Religious club Youth association
Marketing cooperative
Union PA leader School council PA council Saving and credit group
III. Household resources ownership, production and farm income
10) Land ownership, crop production and annual farm income from sales of crops in 1999E.c Land allocation & crop
grown
Land
siz
e
(in ti
mad
.)
Ave
rag
e
yiel
d/ha
.
Tot
al
annu
al
harv
est
cons
umed
sold
unit
pric
e
tota
l pric
e
*pur
pose
of s
old
Coffee
Inset
Maize
Teff
Haricot bean

92
Sweet potato
Yam
Fruits
Chat
Grazing land & forest land
Homestead + others
Others (Specify)
Total
11) Livestock ownership and income from sales of livestock in1999 E.C.
Category Total TLU No.
sold
Unit
price
Total price *purpose of sold
Local Cows
Crossbred cows
Oxen
Local Heifers
Crossbred
heifers
Calves
Bulls
Goats
Sheep
Poultry
Donkey
Horse
Others
Grand total

93
12) Income from sale of livestock products/1999E.C/
Product type Amount collected
per year
Consumed Sold Unit price Total
revenue
*Purpose
sold
Milk
cheese
Butter
Egg
*Purpose of 1) for purchasing farm inputs2) for settling debts3) for buying clothes for family
4) to buy food grains 5) others (Specify) ---------------------
13) Household’s participation in off-farm activities in 1999E.C.
1) Yes _________ 0) No ____________
14) If yes in question 5.6, Types of off-farm activities and income earned
Types of off-farm income/ activities
Income earned
Petty trading
Daily laborer
Support from relative(sun,doughter)
Others, specify

94
15) Housing, Implements and Machineries No House / implement type Yes No Number 1 Grass roof 2 Corrugated Iron roof without
partition
3 Corrugated iron roof with partition 4 Radio 5 T V 6 Tape Recorder 7 Donkey Cart 8 Horse Cart 9 Water pump 10 Pruning shear 11 Bow sow 12 Others, mention
IV. Use of new technologies on coffee production IMPROVED COFFEE SEEDLINGS 16. What is the length of time since you first heard about improved coffee varieties?
________ Years (in__________ E.C.)
17. From whom/where did you first heard about the improved coffee varieties?
1. Development agent _____________
2. Neighbors ______________
3. Farmers’ organizations______________
4. Radio____________
5. Others, specify______________
18. Have you ever used improved coffee seedlings /new varieties?
1) Yes _______________ 0) No_____________
19. If yes, when did you start planting? ________________
What is the area________ ha. , in no.___________.

95
20. How many times have you purchased improved coffee seedlings since you started using
it? _____________ times.
• Total no. of seedlings ____________ in ha. __________ in no.
21. How many times have you prepared improved coffee seedlings by your own nursery since
you started using it? ___________ Times.
_ Total no of seedlings in no. ____________
For your planting ______________ in no.
For selling ________________ in no.
22. From where do you usually get improved seedlings?
1. RDAO_______________
2. Own ________________
3. Market ______________
4. Neighbors ____________
5. Others, specify_________
23. Is improved seedlings are available on time?
1) Yes___________ 0) No _________
24. Can/do you purchase or prepared the amount you need every year?
1) Yes ___________ 0) No_____________
25. If no, why?
For purchasing
1. Not available _____________
2. Too expensive____________
3. Cash shortage ____________
4. was not sure of benefit ______________
5. Not available on time _______________
6. Not better than local ________________
For preparing
1. No irrigation water __________________
2. No selected seeds _______________

96
3. Labor shortage__________________
4. was not sure of benefit ____________
5. Not better than local_______________
26. Did you get from common holding distribution? 1) yes _______0) No ______
27. If yes what is the area? in no. __________ in ha. ___________
28. What is the total area of new varieties of coffee planting in ha.____________ in
no.__________?
Use of coffee stumping technologies and management to measure intensity 29. Have you ever heard about old coffee stumping technologies?
1) Yes __________ 0) No _________
30. From whom/where did you first heard about old coffee stumping technologies?
1. Development agent ________________
2. Neighbors ______________
3. Farmers’ organization (SC, PA, Other,) other, specify ___________
4. Radio ________________
5. Other specify _________________
31. What is the length of time since you first heard about old coffee stumping
technologies? _____________________ Years or in _____________ E.C.
32. Do you have coffee which could be stumped? 1) Yes _____ 0) No _________
33. If yes, how many ha./no. of old coffee do you have which could be stumped?
ha._________ no. ____________
34. Have you ever used coffee stumping technologies? 1) Yes ________ 0) No ______
35. If yes, when did you start using it? ________________

97
36. What is the no. of coffee trees stumped every year since you start?
No. Year No. of coffee trees
stumped Age of coffee in
year Type of coffee
Improved Local 1 2
3 4
37. Do you have planned to stump in the future? 1) Yes _______ 0) No _______
38. If yes, how much you planned to stump in the future?
In ha. ________ In no._____________
39. Why you stump/what are the reasons for stumping?/
1. Due to old age of coffee trees ______________
2. Due to production decline b/se of mgt .problem_______________
3. Due to production decline b/se of soil fertility ________________
4. Due to production decline b/se of narrow space_______________
5. Others, specify_______________________________________________
40. From where did you get stumping tools like bow sow?
1. RDAO_____________ 3. Neighbor ________________
4. Own _______________ 5.PA or other organization ___________
41. Does it have better yield than un stumped?
1) Yes____________ 0) No____________
42. If yes by how much it is better?
By half times ______ By 1 times ______ By 2times _____ Slightly exceed _____
Also you can compare by your own ________________
43. After stumping did you use sucker control?
1) Yes _______________ 0) No ____________
44. If yes, how many times did you use sucker control? ____________
45. If yes at what stage did you use first sucker control?
1. 10 cm. _____________ 2. 15cm. _______________ 3. 20 cm. ____________
4. 50 cm______________5. Above 50cm.________
46. Do you know the ht. of your stumping? 1) Yes _______ 0) No _______

98
47. If, yes at what height do you normally stump?
1) Less than 40cm.________
2) Above 40cm. _________
3) At40cm. _________
48. Why you used _______ cm. stage?
1. The DA told that ____________________
2. by my own judgment_______________
3. When I got time and labor____________
4. Others, specify ___________________
49. What is the shape and direction of stumping?
1) Slant and opposite to Sun rise & set ________
2) Slant to any direction _________
3) Flat ____________
50. What is the time of stumping?
1) After harvesting from November to February _________
2) From March to June _____________
3) At any time when I get time & labor ____________
51. Did you use the second and third stage of sucker control?
1) Yes __________ 0) No ___________
52. If yes at what stage?
Second stage ____________cm. long.
Third stage _____________cm. long.
53. Finally what is the number of stem remains?
1. One________2. Two_________3. Three _______
4. Four and more than four ______________.
54. Why you select only ______number of stems?
1.______________________________________________
2. _____________________________________________
3. _____________________________________________
4. ______________________________________________

99
55. By what tools you used sucker control?
1. by pruning shear____________. 2. by sickles _______________
3. by Slasher _____________. 4. Others, specify___________
56. Which one is the appropriate or recommended tools?________________________.
57. Who told you?/From whom you first heard/
1. Development agent __________________
2. Neighbors _________________________
3. Farmers organization (SC,PA,)___________
4. Radio _______________
5. Others, specify _______________
58. From where did you get appropriate sucker control tools?
1. MOA__________ 2. Own ___________
3. Neighbors __________ 3.PA______________ 4. Others, specify________.
59. Why you used with un appropriate sucker control tools if not used with appropriate tools?
1. Appropriate tools is too expensive __________________
2. Cash shortage _________________
3. was not sure of benefit _____________
4. Not available on time _____________
5. Not better than local _____________
6. Others, specify_________________
60. Did you use weed control? 1) Yes_______0) No _______
61. If yes, how many times did you control weed per year?
1. Slashing _____________ times.
2. Cultivation __________ times.
62. Did you use shade regulation? 1) Yes _________ 2) ___________
63. If yes, 1) Planting ___________ 2) Thinning ________ 3) Both ________
64. Did you use inter cropping 1) Yes ________ 0) No __________
65. If yes with which crop you used? _____________________
66. Did you use fertilizing/composting? 1) Yes ________ 0) No ______
67. If yes, what kind? 1) Compost ________ 2) Artificial _________

100
68. What is the amount? 1) Recommended _________ 2) As I get _______
Recommended: Compost 2.5-5kgs, artificial 75grs-100grs DAP/tree
69. Did you regulate population of plant per ha? 1) Yes ______ 2) No _________
70. If yes, 1) Thinning/uprooting _______ 2) Inter planting _____ 3) Both ______
71. Did you encounter problem of coffee wilt disease?
72. If yes, what kind of measure did you take?
1) Not stumping _____2) Uprooting & burning _______3) Both ____ 4)No _______
V. Access to and utilization of farm tools for stumping activities
73. Can you purchase the required Bow sow and pruning shear as you need? (Availability)
1) Yes__________ 0) No __________
74. Are you willing to purchase? 1) Yes ___________ 0) No _________
If no, what is the reason? 1) It is too expensive __________
2) Cash shortage ___________ 3) Not sure of benefit ________ 4) Not better than local
________ 5) Others, specify _________
75. Can you get the required tools on time? 1) Yes ________ 0) No________
76. If No, please rate the timely availability of the tools on the following five point scale
Type of tools Rating of timely availability
Never on
time(1)
Rarely on
time(2)
Some times
on time(3)
Mostly on
time(4)
Always on
time(5)
Bow sow
Pruning shear
chemicals
Others (specify)
77. Do you get the tools to the required quality? 1) Yes ______0) No ______
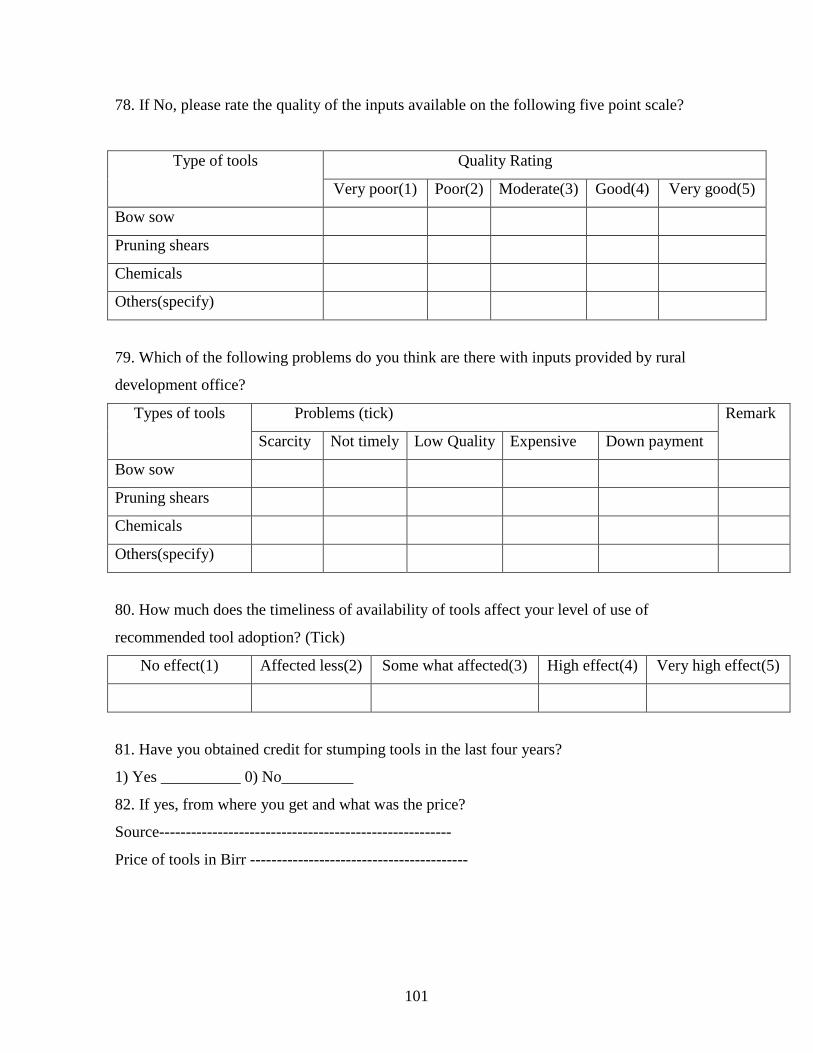
101
78. If No, please rate the quality of the inputs available on the following five point scale?
Type of tools Quality Rating
Very poor(1) Poor(2) Moderate(3) Good(4) Very good(5)
Bow sow
Pruning shears
Chemicals
Others(specify)
79. Which of the following problems do you think are there with inputs provided by rural
development office?
Types of tools Problems (tick) Remark
Scarcity Not timely Low Quality Expensive Down payment
Bow sow
Pruning shears
Chemicals
Others(specify)
80. How much does the timeliness of availability of tools affect your level of use of
recommended tool adoption? (Tick)
No effect(1) Affected less(2) Some what affected(3) High effect(4) Very high effect(5)
81. Have you obtained credit for stumping tools in the last four years?
1) Yes __________ 0) No_________
82. If yes, from where you get and what was the price?
Source-------------------------------------------------------
Price of tools in Birr -----------------------------------------

102
VI. Sources of agricultural information on coffee production/stumping for farmers and
frequency of contact/ use
83. Do you get advisory services from extension agents? 1) Yes ______2) No ______
84. How frequently do the extension agents visit you?___________
0) never 1) Annually 2) Monthly 3) bi-weekly 4) Weekly
85. When does extension agent visit you? a) Weed control b) During input provision c)
During planting d) whenever disease/ pest occur e) During stumping and sucker control
f) During credit collection g) others (Specify)________________
86. Do you visit/invite extension agent? 1) Yes_______ 2) No _______
87. If yes, when do you visit/invite?
1) During stumping 2) During input/tools provision to obtain inputs/tools
3) It depends (any time when there is technical problem) 4) others, specify ______
88. What are your other sources of information and how often you use/ have contact with
them?
Other sources How often you contact/use them *Means of
information
exchange
Never
(0)
Once in a
year (1)
Monthly
(2)
Weekly
(3)
Daily (4)
Researchers
Contact farmers
Fellow farmers
PA leaders
NGO
Cooperative
Neighbors/
Friends
Input dealers
Agricultural
professionals
*Means of information exchange: 1) Demonstration 2) Field day/visit 3) Training
4) Written materials (leaflets, manuals, and so on) 5) Others (Specify) ------------------

103
89. Have you participated in field day/ visit in the last five years? 1) Yes____ 0) No___
90. If yes, how many times and who arranged for you?
No of times------------------------------------------
Who arranged for you? 1) RDAO 2) Research 3) NGO 4) Others (Specify) -----------
91. Have you ever received training in coffee production/stumping in the last three years?
1) Yes______ 0) No _______
92. If yes, how many times and who arranged for you?
No of times------------------------------------------
Who arranged for you? 1) RDAO 2) Research 3) NGO 4) Others (Specify) -----------
93. Have you hosted demonstration in the last five years?
1) Yes __________0) No ___________
94. If yes, for how long and with whom you conducted demonstration?
For how long from__________________ to ___________________
With whom you conducted demonstration? 1) RDAO 2) Research 3) NGO 4) Others
(Specify) ___________________________________________________________
95. Indicate your access to and frequency of use of the following media materials?
Mass media
How often you use them
Never(0) Rarely(1) Occasionally(2) Often(3) Very often(4)
Radio
Television
Leaflets
Pamphlets
Manuals
Others

104
96. Rank your sources of information based on Accessibility, timeliness, reliability of their
information
Sources of information Rank accessibility Rank timeliness Rank reliability Remark
Extension agent
Researcher
NGO
Contact farmers
Mass media
Neighbors/friends
Cooperative
Follower farmers
Agricultural professionals
Others (specify)
VII. Market related variables
97. Market centers accessible to you
Name of the market Distance Mode of
transport
Transport
cost
Commodities sold at the
market place
98. What was the average market price of coffee production last year?
Type of coffee
Price at *To whom you
sell at farm gate
*To whom you
sell at Market Farm gate Market
Red wet
Mixed wet
Dry mixed (Jenfel)
Merbush
*To whom 1) to cooperative 2) to individual investors 3) to retailers 4) direct consumers

105
99. Have you changed to whom you sell in the last 2-3 years? 1) yes_______0) No_____
100. If yes, is there change? 1) Yes _________ 0)No.________
101. What was the change? _______________________________
102. What is the trend in price in the last 3-4 years?
1) Decreasing_______ 2) stagnant_______ 3) increasing ________
103. In that light, how does it compare with alternative crops that you can grow?
1) It is better _________ 2) It is not better ________ 3) No difference ________
104. In your view how do you see the selling price of coffee?
coffee type Price condition Remarks
Very Poor(1) Poor(2) Moderate Good(4) Very good(5)
Red wet
Mixed wet
Dry mixed
(Jenfel)
Merbush
105. Do you get market price information on coffee?
1) Yes ____________0) No________________
106. If yes, what are your sources of information and how often do you get access to it?
Sources of
information
How often? Which source you
prefer and why? Never Once in a
year
Twice in a
year
quarterly weekly
DA
Traders
Neighbor farmers
Cooperative
Others(Specify)
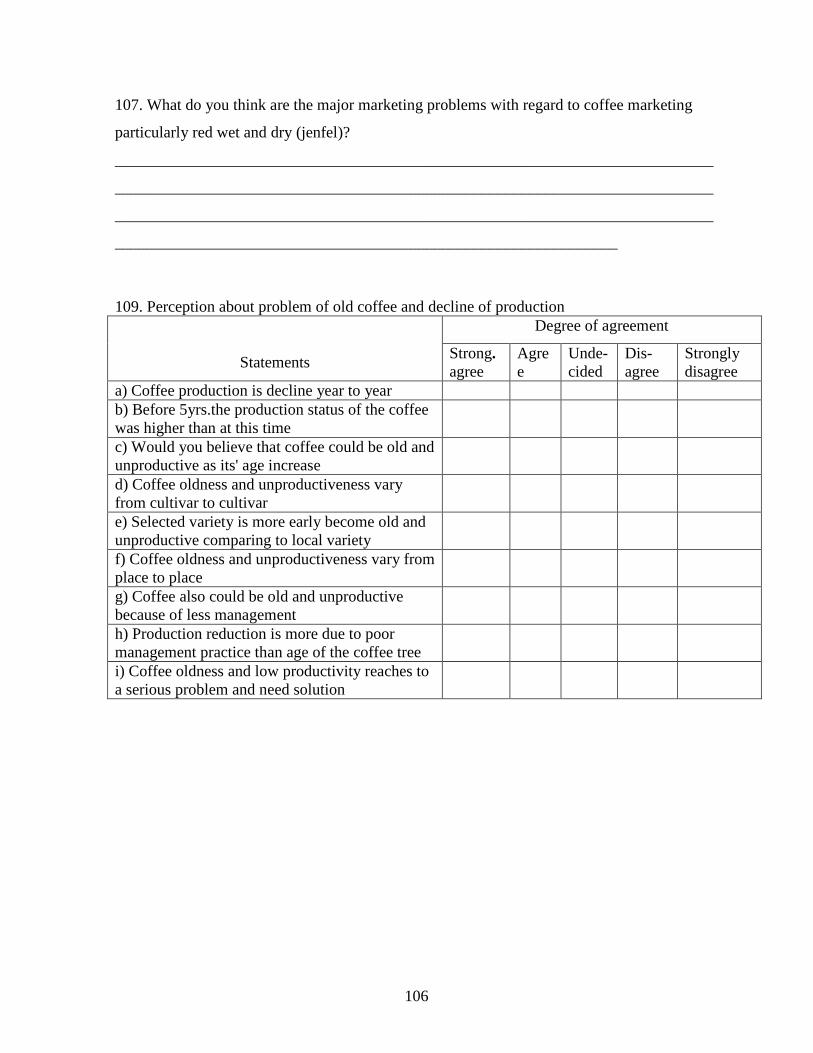
106
107. What do you think are the major marketing problems with regard to coffee marketing
particularly red wet and dry (jenfel)?
___________________________________________________________________________
___________________________________________________________________________
___________________________________________________________________________
_______________________________________________________________
109. Perception about problem of old coffee and decline of production
Statements
Degree of agreement
Strong. agree
Agree
Unde-cided
Dis- agree
Strongly disagree
a) Coffee production is decline year to year b) Before 5yrs.the production status of the coffee was higher than at this time
c) Would you believe that coffee could be old and unproductive as its' age increase
d) Coffee oldness and unproductiveness vary from cultivar to cultivar
e) Selected variety is more early become old and unproductive comparing to local variety
f) Coffee oldness and unproductiveness vary from place to place
g) Coffee also could be old and unproductive because of less management
h) Production reduction is more due to poor management practice than age of the coffee tree
i) Coffee oldness and low productivity reaches to a serious problem and need solution

107
110. Perception about stumping technology
Statements Degree of agreement Strong. agree
Agree Undecided Dis- agree
Strongly disagree
a) Old coffee stumping technology helps to improve the production and should be done
b) Even if it improves production it is disadvantage is higher than advantage
c) Old coffee stumping could be done at any height.
d) Stumping could be any shape and direction
e) Stumping could be done with any instrument like slasher and axe
f) If not done sucker control it is better not to stump
g) Even if not done sucker control it is better to stump
h) Sucker control can be done at the growth of any height
i)The final stem remain should be not more than two
j) Could get good benefit by inter cropping until the stumped coffee reach production stage
k) Replacing new seedling by uprooting the old one is better than stumping to improve production of coffee

108
111. What is the advantage of the recommended practices over the traditional?
Reason for highly inferior- 1) Not much yield difference 2) Consumes more time 3)Requires
more labor 4) Others specify _____________________
112. Is there production risk in stumping technology? 1) Yes _______ 2) No _______
113. If yes what is the risk of stumping technology, indicate 5 points and rank them in order
of importance.
1st ---------------------------------------------------------------------------
2nd ---------------------------------------------------------------------------
3rd ---------------------------------------------------------------------------
4th ----------------------------------------------------------------------------
5th ----------------------------------------------------------------------------
114. How do you perceive the investment cost (production cost) of stumping technology
compared to the return or compared to un stumped coffee?
Production
cost
Very
low(1)
Low(2) Undecided(3) High(4) Very high(5)
Sr.no. Recommended practices Advantage over the traditional
Highly
inferior(1)
Slightly
inferior(2)
Equal(3) Superior(4) Highly
superior(5)
1 Stump at 40-45cm.
2 Stump at slant in direction
of opposite to sunrise &set
3 First sucker control at the
ht. of 20 cm.
4 Finally left only 2stems

109
115. Rate the following if they are advantage of stumping Sr.no.
List of advantage Ratings
Very low(1)
Low(2) Medium(3)
High(4) Very low(5)
1 High productivity or yield advantage
2
Inter cropping advantage
3 Ease to harvest or pick
4 Ease to weed control
5 Ease to control any disease and pastes
6
Have even cropping or low alternate crop/bearing
116. Rate the following if they are disadvantages of stumping technology Sr.no. List of disadvantages Ratings
Very low(1)
Low(2) Medium(3) High(4) V.high(5)
1
All stumped stems are not sprout out suckers
2 It need high labor
3
Stumping tools are not available
4 Weed problem
5
Production gap for some years
6 Need high technical skill
7 Low productivity
8
Coffee wilt disease
110
117. What do you think are the most important constraints for the development of coffee stumping technology? ______________________________________________________________________________________________________________________________________________________________________________________________________________________________________________________________________________________________________________________________________________________________________________________________________________________________ 118. What do you suggest the most important solutions for the constraints? _____________________________________________________________________________________________________________________________________________________________________________________________________________________________________________________________________________________________________________________________________________________________________________________________________________

111
Appendix 2: Conversion factors used to compute tropical livestock units
Animal category LU
Calf 0.25
Weaned calf 0.34
Heifer 0.75
Cow and ox 1.00
Horse 1.10
Donkey (adult) 0.70
Donkey (young) 0.35
Camel 1.25
Sheep and goat (adult) 0.13
Sheep and goat (young) 0.06
Chicken 0.013
Source: Storck et al. (1991).
Appendix 3: Conversion factors used to compute man-equivalent
Age group Male Female
<10 years 0 0
10-14 years 0.35 0.35
15-50 years 1.00 0.80
>50 years 0.55 0.50
Source: Storck et al. (1991).
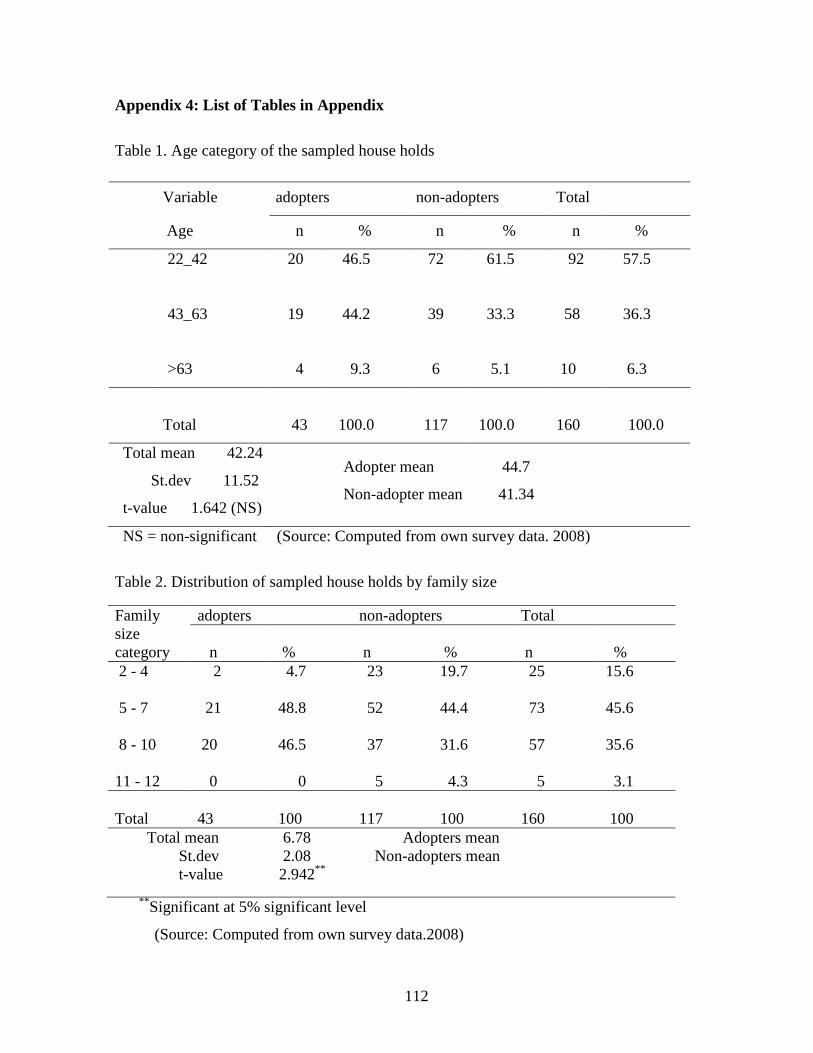
112
Appendix 4: List of Tables in Appendix
Table 1. Age category of the sampled house holds
NS = non-significant (Source: Computed from own survey data. 2008)
Table 2. Distribution of sampled house holds by family size Family size category
adopters non-adopters Total
n % n % n % 2 - 4 2 4.7 23 19.7 25 15.6 5 - 7
21
48.8
52
44.4
73
45.6
8 - 10
20
46.5
37
31.6
57
35.6
11 - 12
0
0
5
4.3
5
3.1
Total
43
100
117
100
160
100
Total mean 6.78 Adopters mean St.dev 2.08 Non-adopters mean t-value 2.942**
** Significant at 5% significant level
(Source: Computed from own survey data.2008)
Variable adopters non-adopters Total
Age n % n % n %
22_42 20 46.5 72 61.5 92 57.5
43_63
19
44.2
39
33.3
58
36.3
>63
4
9.3
6
5.1
10
6.3
Total
43
100.0
117
100.0
160 100.0
Total mean 42.24
St.dev 11.52
t-value 1.642 (NS)
Adopter mean 44.7
Non-adopter mean 41.34

113
Table 3. Distribution of sampled households by coffee farming experience
Coffee farming Experience in year
adopters non-adopters Total
n % n % n %
4 - 14 15 - 25 26 - 36 37 - 47 48 - 60
2
4.7
34
29.1
36
22.5
26
60.5
50
42.7
76
47.5
12
27.9
21
17.9
33
20.6
2
7.7
9
7.7
11
6.9
1
2.6
3
2.6
4
2.5
Total
43 100 117 100 160 100
Total mean 22.02 Adopters mean 24.37 St. dev 10.146 Non-adopters mean 21.15 t-value 1.791**
** Significant at 5% significant level
(Source: Computed from own survey data. 2008) Table 4. Distribution of sampled house holds by total farm size
Total area of land holding in ‘timad’
adopters non-adopters Total
n % n % n % 1 - 4.1 4.2 - 7.3
7.4 - 10.5 10.6 - 15
17 39.5 77 65.8 94 58.8 16 37.2 29 24.8 45 28.1 9 20.9 11 9.4 20 12.5 1 2.3 0 0.0 1 0.6
Total
43 100.0 117 100.0 160 100.0
Mean 4.45 St.dev 2.600 t-value 4.792***
*** Significant at 1% significant level
(Source: Computed from own survey data. 2008)
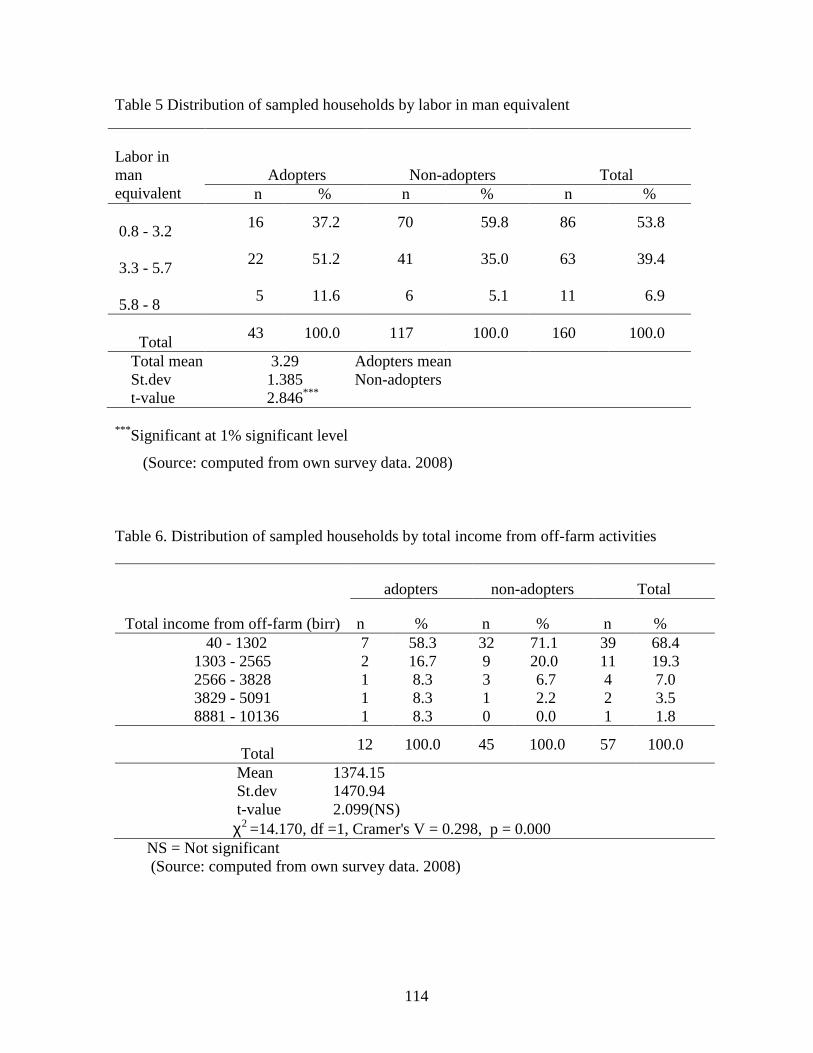
114
Table 5 Distribution of sampled households by labor in man equivalent Labor in man equivalent
Adopters
Non-adopters
Total
n % n % n % 0.8 - 3.2
16 37.2 70 59.8 86 53.8
3.3 - 5.7
22 51.2 41 35.0 63 39.4
5.8 - 8
5 11.6 6 5.1 11 6.9
Total
43 100.0 117 100.0 160 100.0
Total mean 3.29 Adopters mean St.dev 1.385 Non-adopters t-value 2.846***
*** Significant at 1% significant level
(Source: computed from own survey data. 2008) Table 6. Distribution of sampled households by total income from off-farm activities
Total income from off-farm (birr)
adopters non-adopters Total
n % n % n % 40 - 1302 1303 - 2565 2566 - 3828 3829 - 5091
8881 - 10136
7 58.3 32 71.1 39 68.4 2 16.7 9 20.0 11 19.3 1 8.3 3 6.7 4 7.0 1 8.3 1 2.2 2 3.5 1 8.3 0 0.0 1 1.8
Total
12 100.0 45 100.0 57 100.0
Mean 1374.15 St.dev 1470.94 t-value 2.099(NS) χ2 =14.170, df =1, Cramer's V = 0.298, p = 0.000
NS = Not significant (Source: computed from own survey data. 2008)

115
Table 7. The distribution of sampled households’ total annual income during the year 1999
Income earned (birr)
Sample farmer
Adopters non-adopters Total n % n % n %
704.50 - 3671 3671.50 - 6638
6638.50 - 9605 9605.50 - 12572 12572.50 - 15539 15539.50 - 18506 18506.50 - 21473 21473.50 - 24437
5 11.6 31 26.5 36 22.5 12 27.9 53 45.3 65 40.6 11 25.6 20 17.1 31 19.4 9 20.9 7 6.0 16 10.0 2 4.7 4 3.4 6 3.8 2 4.7 1 0.9 3 1.9 1 2.3 1 0.9 2 1.3 1 2.3 0 0.0 1 0.6
Total
43 100.0 117 100.0 160 100.0
Total mean 6585.22 Adopters mean 8608.66 St.dev 4032.59 Non-adopters mean 4490.48 t-value 3.439***
*** Significant at 1% significant level
(Source: Computed from own survey data. 2008) Table 8. Distribution of sampled households by ownership of livestock in TLU
Livestock owner ship in TLU
adopters non-adopters Total
n % n % n % 0.013 - 2.313
2.314 - 4.614
4.615 - 6.915
6.916 - 9.216
9.217 - 11.5
10 25.0 45 42.9 55 37.9
17 42.5 45 42.9 62 42.8
11
27.5 13 12.4 24 16.6
0
0.0 2 1.9 2 1.4
2 5.0 0 .0 2 1.4
Total 40 100.0 105 100.0 145 100.0
Total mean 3.13 Adopters mean 3.84 St.dev 1.911 Non-adopters mean 2.85 t-value 2.835***
*** Significant at 1% significant level
(Source: Computed from own survey data. 2008)

Filename: mcorected Directory: D: Template: C:\Documents and Settings\Administrator\Application
Data\Microsoft\Templates\Normal.dotm Title: 2 Subject: Author: Tesfa Keywords: Comments: Creation Date: 2/15/2009 6:31:00 PM Change Number: 34 Last Saved On: 2/24/2002 10:53:00 PM Last Saved By: user Total Editing Time: 897 Minutes Last Printed On: 2/25/2001 9:04:00 PM As of Last Complete Printing Number of Pages: 130 Number of Words: 31,972 (approx.) Number of Characters: 182,241 (approx.)