FINAL THESIS - MARY MARCEL.pdf - RUFORUM Institutional ...
106
i MAKERERE UNIVERSITY COLLEGE OF AGRICULTURAL AND ENVIRONMENTAL SCIENCES SCHOOL OF FOOD TECHNOLOGY NUTRITION & BIO-ENGINEERING DEPARTMENT OF FOOD TECHNOLOGY AND NUTRITION NAME: MARY RAPHAEL MARCEL REG: 2014/HD02/629T MSc. APPLIED HUMAN NUTRITION RESEARCH TITLE: DEVELOPMENT OF A NUTRIENT DENSE COMPLEMENTARY PORRIDGE FLOUR FROM LOCALLY AVAILABLE FOODS SUPERVISORS: Dr. FLORENCE TURYASHEMERERWA. Dr. IVAN MUZIRA MUKISA Dr. RICHARD JOHN MONGI JULY, 2017.
-
Upload
khangminh22 -
Category
Documents
-
view
1 -
download
0
Transcript of FINAL THESIS - MARY MARCEL.pdf - RUFORUM Institutional ...

i
MAKERERE UNIVERSITY
COLLEGE OF AGRICULTURAL AND ENVIRONMENTAL SCIENCES
SCHOOL OF FOOD TECHNOLOGY NUTRITION & BIO-ENGINEERING
DEPARTMENT OF FOOD TECHNOLOGY AND NUTRITION
NAME: MARY RAPHAEL MARCEL
REG: 2014/HD02/629T
MSc. APPLIED HUMAN NUTRITION
RESEARCH TITLE:
DEVELOPMENT OF A NUTRIENT DENSE COMPLEMENTARY PORRIDGE FLOUR
FROM LOCALLY AVAILABLE FOODS
SUPERVISORS: Dr. FLORENCE TURYASHEMERERWA.
Dr. IVAN MUZIRA MUKISA
Dr. RICHARD JOHN MONGI
JULY, 2017.

ii
DECLARATION
I Mary R. Marcel, declare that this thesis is my original piece of work and has not been published
or submitted to any university or institution for the award of a degree.
Student Signed………………………
MARY R. MARCEL
Date…………………………
This thesis has been submitted for examination with approval of the following supervisors;
Supervisors Signed…………………….
Dr. Florence Turyashemererwa
Date……………………….
Signed…………………….
Dr. Ivan M. Mukisa
Date……………………….
Signed…………………….
Dr. Richard J. Mongi
Date……………………….

iii
DEDICATION
This work is dedicated to my mother and relatives for their love and prayers.

iv
ACKNOWLEDGEMENT
Before all, my greatest appreciation goes to God Almighty who created me, gave me
opportunity to realize this dream, because it is not by my own power or might that I have been
able to do this work, but it is by His Spirit and grace.
I totally appreciate my mother, Mrs. Senorina R. Marcel for the prayers and moral support.
Thank you for always encouraging me and comforting me when things seemed impossible you
really gave me strength to handle them.
Many thanks go to my brothers and sisters for the prayers, courage and motivation in achieving
this goal. I believe I have made you proudly for this achievement.
My supervisors, Dr. Ivan M. Mukisa, Dr. Richard Mongi and Dr. Florence Turyashemererwa
thank you for the guidance and constant encouragement. You challenged and taught me to be a
critical thinker. Thank you for the attention, suggestions and selfless contributions to this work.
I also appreciate Mr. Emmanuel Odame Adjei, Miss Catherine Ndagire for their contribution. I
really appreciate your help
I also thank my friend and colleagues for all shared moments, suggestions, and contributions.
Thank you so much Ugandans for being my hosts for the whole year of my course work. I really
enjoyed my stay in Uganda
Special thanks also go to iAGRI and RUFORUM for funding my master’s degree.
Mary R. Marcel
August, 2016

v
TABLE OF CONTENTS
DECLARATION .......................................................................................................................................... ii
ACKNOWLEDGEMENT ........................................................................................................................... iv
TABLE OF CONTENTS .............................................................................................................................. v
LIST OF ABBREVIATIONS .............................................................................................................................. ix
List of figures ................................................................................................................................................ x
1.0. INTRODUCTION ................................................................................................................................. 1
1.1. Background ............................................................................................................................................ 1
1.2 Problem statement ................................................................................................................................... 4
1.3 Research objectives ................................................................................................................................ 5
CHAPTER TWO .......................................................................................................................................... 7
2.0 LITERATURE REVIEW ............................................................................................................. 7
2.1 Childhood malnutrition ........................................................................................................................... 7
2.1.2 Causes of childhood malnutrition ........................................................................................................ 8
2.1.3 Effects of childhood malnutrition ........................................................................................................ 8
2.1.4 Interventions to reduce childhood malnutrition ................................................................................... 8
2.2 Complementary foods ............................................................................................................................. 9
2.2.1Complementary foods in Tanzania ....................................................................................................... 9
2.2.2 Guidelines for complementary feeding .............................................................................................. 10
2.2.3 Portion size and feeding frequency .................................................................................................... 11
2.3 Selection of raw materials for infant porridge formulation .................................................................. 11
2.3.1 Pumpkin seeds ................................................................................................................................... 12
Figure 1: Pumpkin seeds ............................................................................................................................. 13
2.3.2 Soy beans ........................................................................................................................................... 13
Figure 2: Soybeans ...................................................................................................................................... 14
2.3.3. Orange Fleshed Sweet Potato (OFSP) .............................................................................................. 14
2.3.4 Amaranth grains ................................................................................................................................. 16
2.4.1 Guidelines for infant feeding ............................................................................................................. 19
2.4.2 Nutritional requirements for children aged 6-24 months ................................................................... 20
2.5 Sensory evaluation ................................................................................................................................ 20

vi
2.5.1 Acceptability and descriptive tests ..................................................................................................... 21
2.5.2 Effect of ingredients on sensory characteristics ................................................................................. 21
2.6 Extrusion Cooking Technology ............................................................................................................ 23
2.6.1 Types of extruders .............................................................................................................................. 24
2.6.2 Single-screw extruders ....................................................................................................................... 24
2.6.3 Twin screw extruders ......................................................................................................................... 25
CHAPTER THREE .................................................................................................................................... 29
3.0 RESEARCH MANUSCRIPT ............................................................................................................... 29
3.1 Development and nutritional evaluation of a nutrient dense complementary porridge flour from locally
available foods in Tanzania ........................................................................................................................ 29
Abstract ....................................................................................................................................................... 29
3.1.1 Introduction ........................................................................................................................................ 30
3.1.2 Material and methods ......................................................................................................................... 31
3.1.2.1 Material ........................................................................................................................................... 31
3.1.2.2 Methods........................................................................................................................................... 31
3.1.2.3 Preparation of orange fleshed sweet potato flour ............................................................................ 32
3.1.2.4 Preparation of pumpkin seeds flour ................................................................................................ 32
3.1.2.6 Preparation of amaranth grain flour ................................................................................................ 32
3.1.3 Extrusion processing of raw materials ............................................................................................... 33
3. 1.3.1 Preparation of composite flour ....................................................................................................... 33
3.1.3.2 Formulations ................................................................................................................................... 33
3.1.3.3 Porridge preparation ........................................................................................................................ 35
3.1.4 Chemical analyses .............................................................................................................................. 35
3.1.4.1 Determination of Protein ................................................................................................................. 35
3.1.4.2 Determination of Fat ....................................................................................................................... 36
3.1.4.3 Determination of Crude fiber .......................................................................................................... 37
3.1.4.4 Dry Matter and moisture content determination ............................................................................. 38
3.1.4.5 Determination of total carbohydrates content ................................................................................. 38
3.1.5 Vitamins determination ...................................................................................................................... 39
3.1.5.1 Vitamin C (Ascorbic acid) determination ....................................................................................... 39
3.1.5.2 Beta carotene determination ............................................................................................................ 39
3.1.6 Nutrient density determination........................................................................................................... 40

vii
3.1.7 In vitro protein digestibility ............................................................................................................... 41
3.1.9 DISCUSSION .................................................................................................................................... 52
3.1.9.2 Beta carotene and Vitamin C .......................................................................................................... 53
3.1.9.3 Iron and Zinc solubility ................................................................................................................... 54
3.1.9.4 Flour rate and viscosity of porridge ................................................................................................ 55
3.1.9.5 Contribution of the nutrients composition of the formulated porridge to the nutrient requirement of
children 6-24 months .................................................................................................................................. 56
3.1.10 In vitro protein digestibility ............................................................................................................. 57
3.1.11 Conclusion ....................................................................................................................................... 57
3.2 Sensory properties, consumer acceptability and shelf life stability of nutrient dense porridge made
from locally available foods for infants in Tanzania .................................................................................. 59
Abstract ....................................................................................................................................................... 59
3.2.1 Introduction ........................................................................................................................................ 60
3.2.1.2 Objectives ............................................................................................................................... 61
3.2.1.3 Specific objectives .................................................................................................................. 61
3.2.2 Materials and method ......................................................................................................................... 61
3.2.2.1 Study area........................................................................................................................................ 61
3.2.2.2 Materials ......................................................................................................................................... 62
3.2.2.3 Research designs ............................................................................................................................. 62
3.2.2.4 Formulations development .............................................................................................................. 62
3.2.2.5 Porridge preparation ........................................................................................................................ 62
3.2.3 Sensory evaluation ............................................................................................................................. 63
3.2.3.1 Quantitative descriptive analysis (QDA) ........................................................................................ 63
3.2.3.2 Consumer acceptability of the porridge ...................................................................................... 65
3.2.4 Storage stability studies ..................................................................................................................... 65
3.2.4.1 Determination of Peroxide Value (PV) ........................................................................................... 66
3.2.4.2 Acid value (AV) as free fatty acids (FFA) ...................................................................................... 66
3.2.5 Statistical data analysis ...................................................................................................................... 67
3.2.6 Results ................................................................................................................................................ 67
3.2.6.1 Quantitative Descriptive Analysis .................................................................................................. 67
3.2.6.2 Consumer acceptability ................................................................................................................... 68
3.2.8 Discussion .......................................................................................................................................... 73

viii
3.4 General conclusion ................................................................................................................................ 77
3.5 General recommendation ...................................................................................................................... 77
Reference .................................................................................................................................................... 79
APPENDICES ............................................................................................................................................ 90
Appendix 1: Sensory evaluation tool for product screening of soybeans, amaranth grains, pumpkin seeds
and OFSP based porridge. ........................................................................................................................... 90

ix
LIST OF ABBREVIATIONS
SAPO: Soybeans, Amaranth grains, Pumpkin seeds and Orange fleshed sweet potato
SAPOF: Flour samples
SAPOP: Porridge samples
SOS: Soybeans, Orange fleshed sweet potato and Sorghum
SMGM: Soybeans, Maize, Groundnuts, and Millet
TFNC: Tanzania Food and Nutrition Centre
UNICEF United Nations Children Fund
TDHS: Tanzania Demographic and Health Survey
RAC: Reaching Agent of Change
NRC: National Research Council
IPC: International Potato Centre
TAHEA: Tanzania Home Economic Association
OFSP: Orange fleshed sweet potato
ICDS: Integrated Child Development Scheme
HKI: Hellen Keller International
IVPD: In vitro Protein Digestibility
QDA: Quantitative Descriptive Analysis
PC: Principal Component

x
List of figures
Figure 1: Pumpkin seeds ............................................................................................................... 13
Figure 2: Soybeans ........................................................................................................................ 14
Figure 3: Orange fleshed sweet potato.......................................................................................... 15
Figure 4: Amaranth grains ............................................................................................................ 17
Figure 5: A cross-section of a single-screw extrusion-cooker: 1 - engine, 2 - feeder, 3 - cooling
jacket, 4 - thermocouple, 5 – screw, 6 - barrel, 7 - heating jacket, 8 - head, 9 - net, 10 -cutter, I -
transport section, II – compression section, III –melting and plasticization section (Mościcki et
al., 2013). ...................................................................................................................................... 26
Figure 6: A and B: Iron and Zinc solubility (mg/100g) ................................................................ 47
Figure 7: Bi-plot of PCA showing association between samples and attributes ......................... 68
Figure 8: Mean hedonic score for porridge samples by mothers and students ............................. 69
Figure 9: shows the direction of liking of the product by consumers. .......................................... 70
Figure 10: (a-e) Changes of sensory attributes of the formulated flours during storage period ... 71
Figure 11: Free fatty acids of the stored flour samples (4 weeks) ................................................ 73

xi
List of Tables
Table 1: Composition of the targeted nutrients in the selected foods 18
Table 2: Nutrient requirements for children aged 6-24 months 20
Table 3. 1: Formulations by Nutrisurvey software 34
Table 3. 2: formulations used in the study 35
Table 3.3. 1: Proximate composition of flours samples 43
Table 3.3. 2: Proximate composition of porridges g/100g 43
Table 3.4. 1: Beta- carotene and Vitamin C of flour samples ............................................................... 44
Table 3.4. 2: Beta-carotene and Vitamin C of porridge samples .......................................................... 44
Abstract
Prevalence of childhood malnutrition in Tanzania is still high despite the numerous interventions
that have been carried out to solve this problem. This has also been contributed by poor
complementary feeding practices. This study developed a nutrient dense complementary
porridge from soybeans, amaranth grains, pumpkin seeds and orange fleshed sweet for use in
complimentary feeding among children 6-24 months of age. Specifically the study assessed the
porridges' nutritional composition, its contribution to nutrients requirements its sensory
properties and consumer acceptability as well as its shelf life stability. Five porridge samples
were prepared from a composite flour of soybeans, amaranth grains, pumpkin seeds and orange
fleshed sweet potato (SAPO 1-5) and compared to two references (commercial samples) from a
composite flour of soybeans, orange fleshed sweet potato and sorghum (SOS) and soybeans,
maize, groundnuts, and millet (SMGM). The samples were analyzed and compared for
proximate composition, minerals, and vitamin A and C. The nutrient densities in 100ml of the
targeted nutrients of interest in this study; energy, protein, vitamin A, iron and zinc were
assessed. In 100 ml, SAPO1 had highest energy 117.61 Kcal and protein 3.19g, SAPO2 had
highest zinc of 14.47 mg/100 g SAPO4 had highest Vitamin A of 56.11 µg/100 mg while
SAPO5 had the highest 20.81mg iron. Zinc and iron extractability was higher in SAPO2 and

xii
SAPO4. In vitro protein digestibility ranged (90-99%) in all samples. Sensory evaluation
revealed that all porridge samples were accepted by panelists’ although SAPO5 was the most
accepted by both groups. Attributes like color hue, aroma, sweetness and oiliness were the
drivers to consumer liking of the formulated porridge. All attributes tested; appearance, taste,
texture and acceptability remained within acceptable limits during four weeks of storage at 450C.
Attribute aroma especially for SAPO3 decreased slightly after storage period. SAPO1 predicted
to have shortest shelf life of 23 days while SAPO5 had a longest shelf life of 85 days based on
Arrhenius equations. Therefore, the utilization of soybeans, amaranth grains, pumpkin seeds and
orange fleshed sweet potato can provide products with high nutritional values, high bio-available
protein, acceptable attributes and which can stay for a long time. It is therefore recommended
from this study that, the awareness on the nutritional benefits, higher bio- available protein and
shelf life stability of these foods in complementary feeding should be created to all communities
so as to increase their utilization which will also increase its production. This will help in
reducing childhood malnutrition in Tanzania which is contributed by the use of low nutrient
dense complementary foods.
Key words: complementary food, nutrient dense, soy beans, amaranth grains, pumpkin seeds,
orange fleshed sweet potato
1
CHAPTER ONE
1.0. INTRODUCTION
1.1. Background
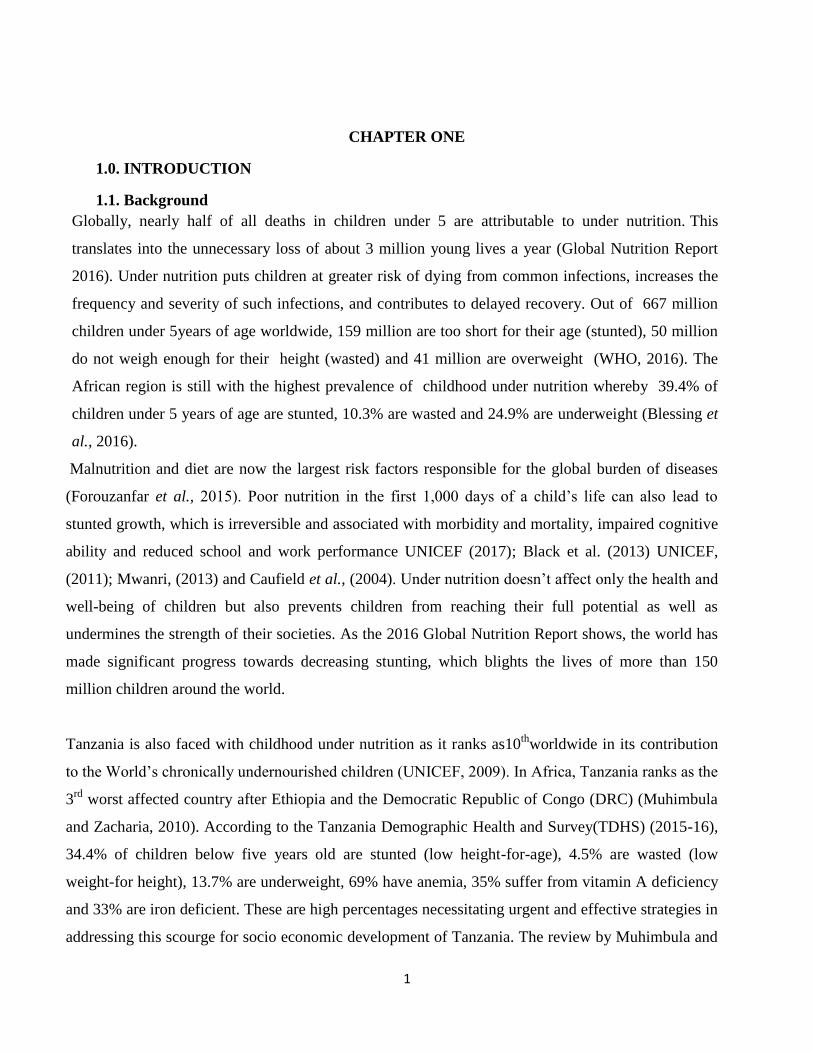
Globally, nearly half of all deaths in children under 5 are attributable to under nutrition. This
translates into the unnecessary loss of about 3 million young lives a year (Global Nutrition Report
2016). Under nutrition puts children at greater risk of dying from common infections, increases the
frequency and severity of such infections, and contributes to delayed recovery. Out of 667 million
children under 5years of age worldwide, 159 million are too short for their age (stunted), 50 million
do not weigh enough for their height (wasted) and 41 million are overweight (WHO, 2016). The
African region is still with the highest prevalence of childhood under nutrition whereby 39.4% of
children under 5 years of age are stunted, 10.3% are wasted and 24.9% are underweight (Blessing et
al., 2016).
Malnutrition and diet are now the largest risk factors responsible for the global burden of diseases
(Forouzanfar et al., 2015). Poor nutrition in the first 1,000 days of a child’s life can also lead to
stunted growth, which is irreversible and associated with morbidity and mortality, impaired cognitive
ability and reduced school and work performance UNICEF (2017); Black et al. (2013) UNICEF,
(2011); Mwanri, (2013) and Caufield et al., (2004). Under nutrition doesn’t affect only the health and
well-being of children but also prevents children from reaching their full potential as well as
undermines the strength of their societies. As the 2016 Global Nutrition Report shows, the world has
made significant progress towards decreasing stunting, which blights the lives of more than 150
million children around the world.
Tanzania is also faced with childhood under nutrition as it ranks as10th
worldwide in its contribution
to the World’s chronically undernourished children (UNICEF, 2009). In Africa, Tanzania ranks as the
3rd
worst affected country after Ethiopia and the Democratic Republic of Congo (DRC) (Muhimbula
and Zacharia, 2010). According to the Tanzania Demographic Health and Survey(TDHS) (2015-16),
34.4% of children below five years old are stunted (low height-for-age), 4.5% are wasted (low
weight-for height), 13.7% are underweight, 69% have anemia, 35% suffer from vitamin A deficiency
and 33% are iron deficient. These are high percentages necessitating urgent and effective strategies in
addressing this scourge for socio economic development of Tanzania. The review by Muhimbula and

2
Zacharia, (2010) shows that the main causes of childhood malnutrition are: poor breast feeding
practices, timing of introducing complementary food, low –nutrients dense complementary foods as
well as high level of microbial contamination in complementary foods. Malnutrition starts in many
infants during the complementary feeding period, contributing significantly to the high prevalence of
malnutrition in children less than 5 years of age worldwide. Poor feeding practices as well as lack of
suitable complementary foods are responsible for under nutrition with poverty worsening the whole
issue (Muhimbula, et al., 2011). According to the World Health Organization's (WHO)
recommendations, the transition from exclusive breastfeeding and/or infant formula feeding to
complementary food, referred to as complementary feeding, typically covers the period from 6 to 24
months of age, and is a very vulnerable period. This is because, after 6 months of age, the
contribution from human milk becomes progressively insufficient as a unique nutrient source in
relation to the optimal requirements for growth and thus, a greater demand is placed on the
complementary food part of the diet (Victor et al.,2013).
Tanzania has been at the front position internationally in promoting a conceptual framework for
nutrition through its national institution, the Tanzania Food and Nutrition Centre (TFNC).Good
nutrition is both a desired outcome for ensuring optimal human health, as well as a key determinant
of development, for the individual and for society in general (Leach and Kilama, 2009). Several
studies have shown that majority of children in Tanzania are born with the recommended weight of
2.5 kg and start their life in sound health (Mosha et al., 1998). Their growth however, starts to decline
during and/or after introduction of complementary foods. Protein, energy and micronutrient
deficiencies mostly iron and zinc also become a serious problem as most of these complementary
foods consumed do not supply adequate amounts of these nutrients. The Tanzanians widely used
weaning foods are based on cereal and non-cereal foods like maize, sorghum, millet, rice, cassava,
potatoes, yams and plantains (Kavishe, 2003). Fortified nutritious commercial complementary foods
are unavailable especially in the rural areas and where available, they are often too expensive and
beyond the reach of most of families in Tanzania (Muhimbula et al., 2011). Therefore consumption
of micronutrient dense foods such as animal products is low and subsequently micronutrient
deficiencies are widespread (UNICEF 2009). Studies done by Muhimbula and Zacharia (2010) and
Mamiro et al. (2005) show that Tanzania is dependent on cereal and non-cereal based traditional
weaning foods from maize, sorghum, millet, rice, cassava, potatoes, yams and plantains. There is a

3
high rate of childhood under nutrition associated with the use of these starch staples in weaning foods
as reported by Mosha et al. (2000). In addition such foods are bulky and high in phytate, which limits
the bioavailability of nutrients such as iron, calcium, zinc, and in some cases proteins, and energy
which are crucial to the development of infants (Gibson et al., 2010).
This study aimed at utilizing locally available nutrient- dense foods like orange fleshed sweet
potatoes, soy beans, pumpkin seeds and grain amaranths to produce acceptable and nutrient dense
porridge that can be used as complementary food in Tanzania. These ingredients were mainly
selected due to their availability and nutrient content.
Tanzania is the second largest producer of sweet potato (Ipomoea batatas Lam.) in East Africa with
an annual production of more than 333,660 tons per year (FAOSTAT, 2010). Sweet potato currently
ranks as the worlds’ seventh most important food crop and the fifth most important food crop on fresh
weight basis in developing countries, after rice, wheat, maize and sorghum (FAO, 2004). The
Tanzania Home Economics Association (TAHEA) has been promoting Orange Fleshed Sweet Potato
(OFSP) production for income generation and household food security since the year 2001as a
response to the international project "Vitamin A for Africa" (VITAA) (Waized, et al., 2015). Despite
this effort, the use of OFSP in complementary foods is not well recognized in Tanzania due to little
investment in raising awareness of its nutritional benefits to mothers and caregivers (RAC, 2012).
The inclusion of OFSP in complementary foods is important since it provides vitamin A in form of
beta carotene, antioxidants, vitamin C, vitamin B6 and minerals (George Foundation, 2015). The
sweetness of sweet potato also contributes in improving the flavor of the porridge without the need
for using sugar.
Soy beans can potentially contribute to the addition of energy, protein, lipids, carbohydrates, minerals
and vitamins (Burks, et al., 1991). Although it is being used as a complementary food in Tanzania,
one of the challenges of using soy bean is the presence of phytates and trypsin inhibitors which need
to be removed so as to improve its nutritional contribution to the diet. This anti- nutritional content
inhibits the bioavailability of nutrients including iron, zinc, calcium and some cases protein which are
crucial for the development of infants (Gibson et al.. 2010).

4
Pumpkins are used as food and their seeds are mainly consumed as snacks. Pumpkin seeds are a very
good source of minerals such as zinc, iron copper, phosphorus, magnesium and manganese (Revathy
and Sabitha, 2013). In addition, pumpkin seeds are also good source of protein and vitamin K
(Pongjanta et al., 2006). The inclusion of pumpkin seeds in complementary foods is not well known
in Tanzania due to little knowledge about its nutritional benefits. The inclusion of pumpkin seeds in
the complementary food will help increase the content of minerals especially iron and zinc which are
mostly provided in small amounts in complementary foods used in Tanzania.
Amaranth grain was selected because it contains protein of high quality, calcium, zinc, iron, vitamin
A and E, folic acid (Muyonga et al., 2014) which are essential for rapid growth of children. Grain
amaranth grown in Tanzania has been used mainly as vegetable (the leaves) but the nutritional
benefits of their grains especially in complementary foods has not been evaluated or tapped.
Therefore, the use of these nutrient dense foods mutually with improvement of processing methods
will raise their production and consumption and hence improve the health status of children as well as
generating income to small holder farmers
1.2 Problem statement
Poor quality complementary foods with low nutrient density and poor complementary feeding
practices have been identified as the major causes of malnutrition in young children (Victor et al.,
2008). Notwithstanding numerous nutritional interventions that have taken place in Tanzania, the
country still experiences a high rate of childhood under nutrition (UNICEF, 2011). Millions of
children suffer from one or more forms of malnutrition resulting in stunting, underweight, wasting
and anemia (UNICEF 2009). The Tanzania Demographic Health and Survey (TDHS) (2015), shows
34% of children below five years old are stunted (low height-for-age), 5% are wasted (low weight-for
height),69% have anemia, 33% suffer from vitamin A deficiency and 33% are iron deficient. These
are high percentages necessitating urgent and effective strategies in addressing this scourge for socio
economic development of Tanzania. The use of nutritionally inadequate complementary foods could
be one of the factors contributing to malnutrition in Tanzania. The Tanzanians widely used weaning
foods are based on cereal and non-cereal foods like maize, sorghum, millet, rice, cassava, potatoes,
yams and plantains (Muhimbula and Zacharia, 2010; Mamiro et al 2005; and Mosha et al 2000). One
of the drawbacks of using cereals and tubers for infant feeding is their high bulk, fiber and inhibitors

5
which contribute towards reducing the potential nutritional benefits to children. This bulkiness is
associated with starch gelatinization which requires addition of large amounts of water during
cooking thus reducing the energy density of these foods (Hurrell, 2003; Mbithi et al., 2002). The
consumption of low nutrient dense foods contributes to decline in the growth of children around the
age of 6 – 24 months and has greater implications for health during adulthood (Muhimbula, and
Zacharia, 2010).
The threats of childhood malnutrition to the economic growth of Tanzania are considerable. UNICEF
(2010) reported that, vitamin and mineral deficiencies alone cost Tanzania TZS 650 billion (about
USD 390 million) in lost revenue each year, which is equivalent to 2.65 percent of GDP. Many
studies have been carried out on complementary foods but locally available nutrient dense foods were
not involved. There is therefore a need to develop affordable and acceptable nutrient dense
complementary porridge flour through utilizing the locally available raw materials. These foods can
be easily acceptable and utilized for infant feeding. Orange fleshed sweet potatoes, grain amaranth;
pumpkin seeds and soy bean were selected as the ingredients of the porridge flour to be developed.
Some of the key issues addressed in this study were the formulation of the ingredients that would
provide the required nutrient needs, assessment of its nutrition composition, determination of the
contribution of the porridge made from the formulation to the nutrient requirements of children aged
6-24 months and to assess the sensory properties of the porridge as well as the consumer acceptability
of the porridge made from the formulated flour.
1.3 Research objectives
The overall objective of this study was to develop a nutrient dense complementary porridge from
locally available foods for children aged 6-24 months.
1.4 Specific objectives
The specific objectives of this study were;
i. To develop a nutrient dense complementary porridge for children aged 6-24 months
ii. To determine the nutrient composition of the orange fleshed sweet potato- based
complementary porridge and its contribution to the nutrient requirements of children 6-24
months

6
iii. To assess the sensory properties and consumer acceptability of the formulated porridge and
shelf life stability of the flour.
1.5 Significance of the study
As one of the strategies for addressing childhood under nutrition which is contributed by the use
of nutritionally poor quality cereal based complementary foods in Tanzania, the information
obtained from this study will serve as basis for increasing the utilization of amaranth grains,
pumpkin seeds and orange fleshed sweet potato in complementary feeding. Through increased
utilization in turn will lead to increased production of these foods and hence increase income for
farmers, traders and processors. All these will lead to reduced childhood under nutrition, poverty
and food insecurity within families in our communities and in the country.
1.6 Hypotheses
1. Composite flour made from Orange Fleshed Sweet Potato, Soy bean, pumpkin seeds, and
amaranth grains has more nutrients suitable for growth of children (6-24) months than
commonly used composite flour in Tanzania.
2. The use of OFSP, pumpkin seeds, amaranth grains and soybean in complementary foods
can contribute in meeting at least 50% of nutrients required by children of (6-24) months.
3. Porridge made from formulated flour will be more acceptable than that made from the
commonly used composite flour

7
CHAPTER TWO
2.0 LITERATURE REVIEW
2.1 Childhood malnutrition
Childhood malnutrition accounts for almost one-fifth of global disease burden among children
under five years old (Ezzati et al., 2002). It is one of the major and serious public health
challenges in developing countries and it accounts for over 50% of childhood mortality
worldwide with the most affected group being the children below five years of age (UNICEF,
2011). Globally around 165 million children under the age of five suffer from stunting,
101 million are underweight and 52 million children are wasted and approximately 90 % of these
live in just 36 countries with the highest prevalence in Southeast Asia and sub-Saharan Africa
(UNICEF, 2013). Risk factors for under nutrition range from distal broad national scale
determinants to proximal individual specific and factors which effect at various ages and periods
of life (UNICEF, 2013).
Africa is going through a rapid socio-demographic transition, with an alarming increase in
childhood under nutrition. Notwithstanding the millennium development goals which targeted
reducing hunger by half by 2015, major failures have been recorded mainly in Africa whereby a
large number of children is undernourished (Bain et al., 2013). This situation is getting worse in
Africa as it is estimated that nearly 30% of infants and children under 5 years old are suffering
from one or more of the multiple forms of malnutrition, and about half of 10 million deaths
among children under 5 years old in the developing world are associated with malnutrition
(UNICEF, 2013 and UNICEF, 2009).
Tanzania is also faced with childhood under nutrition as it ranks as the 3rd
worst affected Country
in Africa after Ethiopia and the Democratic Republic of Congo (DRC) (Muhimbula and
Zachariah, 2010). Worldwide, it ranks as the 10th in its contribution to the World’s chronically
undernourished children (UNICEF 2009). The Tanzania Demographic Health and Survey
(TDHS) (2010), shows that, 42% of children below five years old are stunted (low height-for-
age), 5% are wasted (low weight-for height), 69% have anemia, 35% suffer from vitamin A
deficiency and 33% are iron deficient. The curent report by Tanzania Food and Nutrition Centre
(2014) shows that, the stunting among children under 5 years of age has decreased to 34% and

8
under weight is at 13.4%. These are still high percentages necessitating urgent and effective
strategies in addressing this scourge for socio economic development of Tanzania.
2.1.2 Causes of childhood malnutrition
Causes of childhood growth faltering are associated by many factors, while the window of period
during pregnancy and the first 2 years of life (1000 days) hold a supreme importance (UNICEF,
2013). According to Muhimbula and Zacharia (2010), the main causes of childhood malnutrition
in developing countries are poor breast feeding practices, timing of introducing complementary
food, low–nutrients dense complementary foods as well as high level of microbial
contamination.
2.1.3 Effects of childhood malnutrition
Childhood under nutrition during the first two years of life has been associated with irreversible
harm and is linked to higher rates of morbidity and mortality, impaired cognitive ability and poor
school performance in children (Mwanri, 2013). It also has severe short- and long-term health
consequences. Evidence demonstrates that stunting in early life is associated with adverse
functional consequences including poor cognition and educational performance, low adult
wages, lost productivity and, when accompanied by excessive weight gain later in childhood,
increased risk of nutrition-related chronic diseases (Victora et al.,2008). Furthermore, another
study done by Caulfield et al. (2004) shows that, half of all child deaths are attributable to
malnutrition.
2.1.4 Interventions to reduce childhood malnutrition
Many programs have been conducted worldwide to reduce childhood malnutrition particularly
during the critical period from conception to 24 months of age. The first target addresses the
scourge of stunting and aims to reduce by 40% the number of stunted children under 5 years of
age in 2025 (WHO, 2012). Other interventions that have been carried out to reduce childhood
malnutrition include the early start and prolonged duration of breast-feeding, timely introduction
of proper and improved complementary feeding practices, and regular growth monitoring. Many
nutrition programs with focus on complementary feeding and micronutrient deficiencies have
been implemented in different countries including Tanzania to prevent and address micronutrient

9
deficiencies through supplementation or fortification (Mwanri, 2013). Despite all these
interventions, there is still a problem in complementary feeding in Tanzania whereby most of
homemade complementary foods are less nutrient dense because of traditional culture of feeding
children with only commonly used foods which do not fulfill the nutrients requirement of
children (Mamiro et al., 2005 and Mosha et al., 2000).There are existing interventions which if
implemented can reduce this burden significantly. But there is a need for greater priority for
national nutrition programs, stronger integration, enhanced inter-sectoral coordination, and more
focus and coordination in the global nutrition system of international agencies, donors, academia,
civil society, and the private sector in achieving better nutrition for children under 5 years of age
(WHO, 2012).
2.2 Complementary foods
According to World Health Organization's (WHO) recommendations, the transition from
exclusive breastfeeding and/or infant formula feeding to complementary food, referred to as
complementary feeding, typically covers the period from 6 to 24 months of age, and is a very
vulnerable period. This is because, after 6 months of age, the contribution from human milk
becomes progressively insufficient as a unique nutrient source in relation to the optimal
requirements for growth and thus, a greater demand is placed on the complementary food part of
the diet (WHO, 2010). It is the time when malnutrition starts in many infants, contributing
significantly to the high prevalence of malnutrition in children less than five years of age
worldwide and affecting subsequent optimal development (Victor et al., 2013 and Mosha et al.,
2000). In developing countries like Tanzania, malnutrition diring complementary feeding are
mainly attributed by low- nutrient dense foods which are given to children as weaning foods.
2.2.1Complementary foods in Tanzania
Studies done by Mamiro et al., (2005), and Muhimbula, (2010) show that Tanzania is dependent
on cereal and non -cereal based traditional weaning foods from maize, sorghum, millet, rice,
cassava, potatoes, yams and plantains. It also depends on starchy roots with high fiber content
and pulses in both rural and urban areas. These starchy foods provide almost three quarters of the
total energy supply, despite the wide variety of food produced in Tanzania (Leach and Kilama,
2009). There is a higher rate of childhood under nutrition associated with the use of these starch
staples in weaning foods (Mosha et al., 2000). In addition such foods are bulky and high in

10
phytate, which limits the bioavailability of nutrients, including iron, calcium, zinc, and in some
cases proteins, and energy which are crucial to the development of infants (Gibson et al, 2010).
Even though commercial foods which are of high nutritional quality are available in the market,
they are often expensive and thus unaffordable by low income people (Muhimbula et al,. 2011).
Consumption of micronutrient dense foods such as animal products are low due to
unaffordability and subsequently micronutrient deficiencies are wide spread (UNICEF, 2009).
There are plenty of nutrient dense plant foods in Tanzania which can be incorporated in
complementary feeding so as to provide children with required amount of nutrients needed for
their growth. Despite this opportunity most of Tanzanians are not aware of the nutritional
benefits of these foods in complementary feeding. This therefore necessitates an urgent need of
creating this awareness to people in Tanzania through utilizing different nutrient dense plant
foods in complementary feeding.
2.2.2 Guidelines for complementary feeding
According to WHO, (2010) and FAO, (2011), complementary feeding should be started when
the baby can no longer get enough energy and nutrients from breast milk alone. For most
children this is between 4 and 6 months of age. This is the suitable age because, during this age
the baby`s muscles in the mouth have developed sufficiently to let the baby munch, bite and
chew which makes it easier to feed thick porridges, puree and mashed foods.
Giving complementary foods too soon is associated with some dangers. Among the dangers for
early complementary feeding are; the food may displace breast milk, the child may take less
milk, the mother produces less milk and hence in later time it may be more difficult to meet
child`s nutritional needs (FAO, 2011). Other dangers are low proactive factors from breast milk,
increased risk of diarrhea because complementary food may not be as clean as breast milk
(Safari et al., 2013). Moreover, these foods fill the stomach but provide fewer nutrients than the
breast milk, and so the child`s needs are not met. Starting complementary feeding too late is also
dangerous. This is because a child does not get the extra food needed to fill the energy and
nutrient gaps, a child may stop growing or grows slowly as well as the increased rate of
malnutrition and micronutrient deficiencies (Brown and Dewey, 2003; Dewey, 2001).

11
2.2.3 Portion size and feeding frequency
In early infancy (0 to < 6 months), exclusive breastfeeding with adequate frequency of feeding
times is the optimal feeding pattern (Brown and Dewey, 2003). From 6 to 8 months, children are
in transition to complementary feeding, as they are given solid foods to supplement breastmilk
intake. Although the concentration of a number of nutrients naturally decreases during this
period, breast milk from a well-nourished mother remains the primary source of protein (up to 80
percent), vitamin A, folate, and vitamin C (UNICEF, 2011). The main problem at this stage is
inadequate energy and nutrient density of complementary foods. Complementary foods during
this stage are vital for provision of the primary source of calcium, iron, and zinc; they also
contribute to thiamin, riboflavin, and niacin intake (Lwelamira et al., 2013). Nutrient intake,
food volume and feeding frequencies increase as children grow older. Studies done by Lutter
(2013); and Dewey, (2001) show that children of 9 to 11 months need increasing amounts and
varieties of solid foods in addition to breast milk. Since children’s stomach capacity is still
small, 3 to 4 feeds of 720mls a day is needed to accommodate their increasing energy needs. For
children in their second year of life (12 to 23 months), increased total food intake, frequent feeds
of 900mls a day of varied nutrient-dense foods is needed.
2.3 Selection of raw materials for infant porridge formulation
Weaning of a child is a gradual process by which an infant is introduced to adult diet. Weaning
food is a special formulation, which is a supplement to the breast milk. several strategies have
been used to formulate baby food (Parvin et al., 2014 and Lalude and Fashakin, 2006)through a
combination of locally available foods that complement each other in such a way that provide the
recommended daily allowance for infants. According to the (FAO/WHO, 1989), an ideal
formulated baby food must be nutrient dense, easily digestible, of suitable consistency and
affordable to the target market. Therefore, development of complementary foods based on
locally available foods has been suggested by the Integrated Child Development Scheme (ICDS)
and Food and Agriculture Organization (FAO) to combat malnutrition among mothers and
children of low socio-economic groups.
Despite all these efforts, it is evident that the commercial formulated complementary foods
currently available are not affordable to many low income families (Parvin et al., 2014 and
Muhimbula et al., 2011). Even though there are homemade complementary foods in Tanzania,

12
studies by Muhimbula and Zachariah, (2010) and Mamiro et al. (2005) show that most of these
foods are based on only commonly used foods such as maize, plantains, millet, sorghum, rice,
cassava and potatoes. These foods produce bulky complementary foods that need too much
dilution and hence reduce the nutrient content of the porridge. This study aimed at utilizing
locally available nutrient- dense foods like orange fleshed sweet potatoes, soy beans, pumpkin
seeds and grain amaranths to produce acceptable and nutrient dense porridge that can be used as
complementary food in Tanzania. These ingredients were mainly selected due to their
availability and nutrient content
2.3.1 Pumpkin seeds
Pumpkin fruit (Cucurbita pepo) is a squash-like gourd in the Cucurbitaceae family of vegetables
native to Mexico (Atuonwu and Akobundu, 2010). Pumpkin seeds (pepita) are edible kernels of
fruit pumpkin. Pumpkin seeds are flat, dark green seeds, with some encased in a yellow-white
husk. They have a malleable, chewy texture, and have a subtly sweet, pleasantly nutty flavor
(Campbell and Gold, 2009).The seeds, in-fact, are concentrated sources of many health-
benefiting vitamins, minerals, anti-oxidants, as well as important essential amino-acids such as
tryptophan, and glutamate. Pumpkin seed are rich in zinc, iron and copper, phosphorus,
magnesium and manganese (Cascio, 2010). Pumpkin seeds are also good sources of protein and
vitamin K (Hamed et al., 2008).
Furthermore, another study by Revathy, and Sabitha (2013) found that the pumpkin seeds also
contain beta carotene and thus the beta carotene present in pumpkin seeds and flesh has
antioxidant and anti-inflammatory properties. They are also a rich source of essential fatty acids,
which have numerous health benefits like providing protection against serious health diseases
such as high blood pressure, arthritis, cancer, promoting healthy skin and improving brain power
(Pongjanta et al., 2006). The unique nutritional and health benefits of pumpkin seeds has
contributed to increasing their popularity in recent years. Since all minerals and other nutrients
present in pumpkin seeds are essential for growth and development of children, inclusion of
pumpkin seeds in complementary foods will help children to get those benefits which will
facilitate proper growth and development.

13
Figure 1: Pumpkin seeds
2.3.2 Soy beans
Soybean (Glycine max) is one of the most important food plants of the world, and seems to be
growing in importance. It is an annual crop, fairly easy to grow, that produces more protein and
oil per unit of land than almost any other crop. It is a versatile food plant that, used in its various
forms, is capable of supplying most nutrients. Soybean is popular in infant foods because it is
largely produced in the world, low cost and desirable nutritional and functional properties that
make it a substantial contribution to the world`s food protein requirement (Tanzania Food and
Nutrition Centre, TFNC, 2003). It can substitute for meat and to some extent for milk (Artin,
1998). It is a crop capable of reducing protein malnutrition (Ishaq and Ehirim, 2014). Soy bean
is an abundant and economical source of protein which is apparently cheaper than animal source
protein and contains all essential amino acids (Laswai and Kulwa, 2010).Large world
production, low cost and desirable nutritional and functional properties of soybean make it a
substantial contribution to the world’s food protein requirements. Soy protein is normally used as
a supplement in different forms of food for the purpose of improving protein quality (Malema et
al., 2005). Additionally, soybean can be used for many purposes like for soymilk, soy sauce, tofu
(soybean curd), yoghurt, flour for porridge and in some beverages. Since soybean is also a good
source of some micronutrients, it can be used to reduce the prevalence of malnutrition in
Tanzania (Kavishe, 2003).

14
Despite its nutritional benefits, soybean requires careful home processing to bring out its best
qualities, and if not well prepared, it has an off-flavor and anti- nutritional factors that are
infrequently appreciated (Artin, 1998). Soybeans can be processed through roasting,
fermentation and germination. Ramaman, et al. (1996) emphasized the importance of processing
soybeans as they contain undesirable flavor, bitterness, toxic proteins, haemagglutinins and anti-
trypsin. These substances must be destroyed or deactivated to make the beans palatable and
digestible both for human and animal consumption. The soybean acceptance can be improved
through modification of processing methods like; application of heat, soaking of soybean in
ethanol or alkali and blanching the beans in hot water. The present study is utilizing soy beans
for the addition of the energy, protein, lipids, carbohydrates, minerals and vitamins (Burks et al.,
1991).
Figure 2: Soybeans
2.3.3. Orange Fleshed Sweet Potato (OFSP)
Orange-fleshed sweet potato (OFSP) refers to varieties of sweet potato (Ipomoea batatas) that
are rich in beta-carotene, a vitamin A precursor. OFSP is extremely rich in bioavailable beta-
carotene, which the body converts into vitamin A (retinol) at a ratio of 12 to 1(Reaching Agent
for Change (RAC), 2012).This beta-carotene content gives the tubers their orange color.
According to Waized et al. (2015), about 125g of most OFSP varieties can supply the
recommended daily allowance of vitamin A for children of 300µg and 700µg non-lactating

15
mothers.On top of beta carotene, OFSP also contains other vitamins like C, E, K and
B(International Potato Centre (IPC), 2010). The study added that OFSP contains antioxidants
and some minerals and their leaves also have good micronutrient contents and adequate protein
(4%) for use as food and animal feed. In Tanzania, the vast majority of sweet potato production
is of white-fleshed varieties (WFSP). WFSP, although a good source of calories, is not a good
source of vitamin A or other micronutrients (Somuah et al, 2013). Improved OFSP varieties first
arrived in Tanzania in the Lake zone apparently brought from neighboring regions in Rwanda
and Uganda where agricultural initiatives had introduced them. Common varieties include
Simama, Mataya, Kiegea, Kabode, Jewel, Carrot Dar and Carrot C(Waized et al., 2015). The
crop is grown almost in all agro-ecological zones (Lake Zone, Western Zone, Southern
Highlands Zone, Eastern Zone and Northern Zone) because of its hardy nature and broad
adaptability, hence providing a sustainable food supply when other crops fail (Ndunguru and
Rajabu, 2000 Kapinga et al., 1995; and Jana, 1982). After its introduction in the Lake Zone,
OFSP gradually spread to other regions of the country. Nonetheless, uptake has been limited,
with only a small number of farmers cultivating OFSP due to unfamiliarity to the people as well
as unawareness of its nutritional benefits. Unlike WFSP, OFSP tubers are available in markets
only in the areas of production and only during the production seasons (Sindi and Wambugu,
2012). Its popularity can be improved through; nutrition education, distribution of subsidized
vines, marketing campaign for orange brand as well as other activities that encourage diffusion
of OFSP
Figure 3: Orange fleshed sweet potato

16
The Tanzanian National Sweet potato Research Program has already incorporated Orange
Fleshed Sweet Potato (OFSP) into its conventional breeding efforts because it values bio
fortified crops and staple foods with very high levels of at least one essential micronutrient.
OFSP has the potential for reducing vitamin A deficiencies in Tanzania, particularly in young
children. It is estimated to be the most affordable source of this micronutrient, and can be
incorporated into a number of popular foods like complementary foods, snacks and as a staple
food (Helen Keller International (HKI), 2012). In most parts of Tanzania, sweet potato has
gained importance due to its adaptability to marginal conditions such as drought, wet conditions,
low soil fertility, and is ranked high as food security crop when local staple crops like maize and
rice are scarce or fail (RAC, 2012). Therefore its inclusion in complementary feeding will
facilitate its production and utilization in different places in the country.
2.3.4 Amaranth grains
Amaranth (Amaranthusspp) is an herbaceous annual plant with upright growth habit, cultivated
for both its seeds, which are used as a grain, and its leaves which are used as vegetables. Both
leaves and seeds contain protein of unusually high quality due to its high portion of lysine, an
essential amino acid (Muyonga et al., 2014). Amaranth is often called a pseudo cereal because it
is used much like cereal grains although it is not in the grass family. Grain amaranth belongs to
the cosmopolitan Amaranthus genus of some 60 species (National Research Council (NRC),
1984).Compared to common starchy staples, grain amaranth also contains higher levels calcium,
zinc, iron as well as vitamins A, E and folic acid (Muyonga et al., 2014).The leaves are a good
source of vitamin A, C, K and folate. Amaranth may also provide unique health benefits with
some studies showing that regular consumption may reduce blood pressure and cholesterol
levels, while improving antioxidant status and some immune parameters (Chauhan and Singh,
2013).
It is well known that grain amaranths and many other amaranth species show incredible potential
for human consumption and other uses, and are particularly promising as a remedy for hunger
and malnutrition in developing countries (Teutonico, 1985).Grain amaranth can also be used in
numerous recipes, ranging from popped amaranth snack, porridge, chapattis creamy soup,

17
snacks, and pancakes. Grain amaranth has a relatively high proportion of lysine, an essential
amino acid, compared to other foods. A crop indigenous to Africa, amaranth is highly versatile
and grows easily and prolifically in the humid tropics, survives in high altitudes and it is known
as “drought crop” that thrives in hot and dry weather (Tenywa, 2012). The physicochemical
properties and nutritional composition of grain amaranth make it a good choice to blend it with
other flours, for preparation of nutrient dense porridge which can be used to improve nutrition
status of vulnerable groups like pregnant women and infants (Emire and Arega, 2012). Studies
by Okoth et al. (2016); Oladimeji (2015) and Muyonga et al. (2014) have shown how amaranth
grains were incorporated in different foods whereby it resulted to increased nutrients especially
proteins as well as improved sensory attributes with high acceptability.
Figure 4: Amaranth grains
18
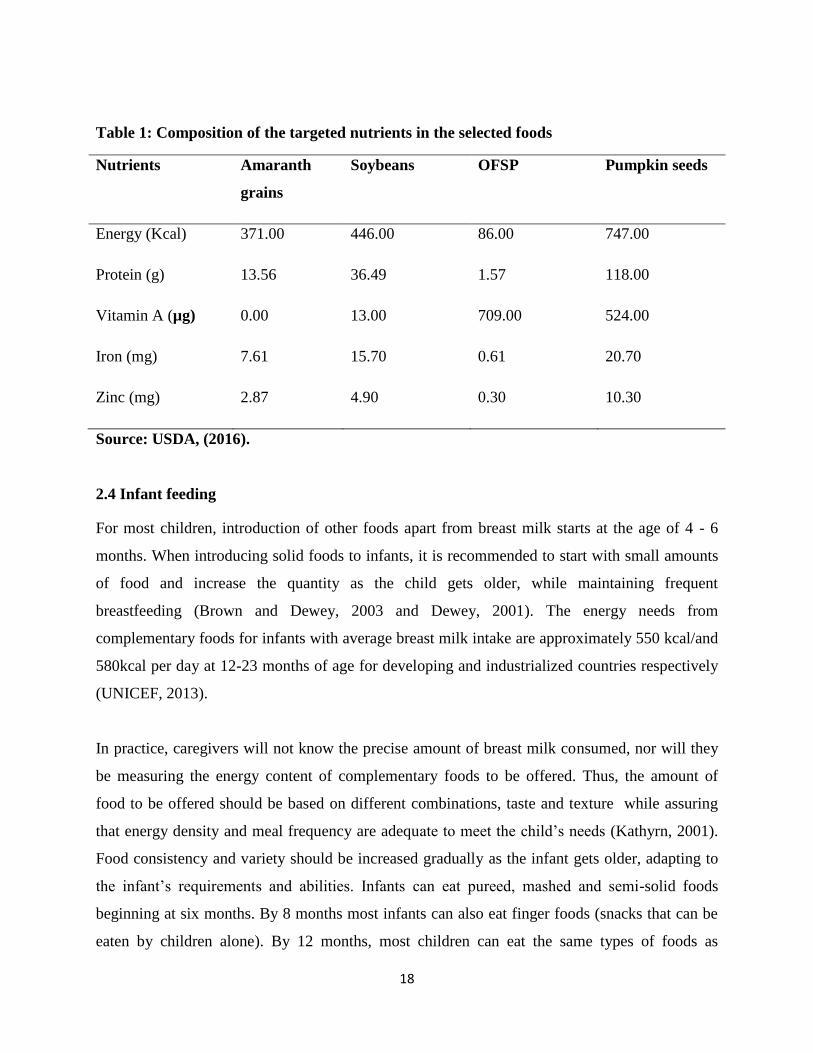
Table 1: Composition of the targeted nutrients in the selected foods
Nutrients Amaranth
grains
Soybeans OFSP Pumpkin seeds
Energy (Kcal) 371.00 446.00 86.00 747.00
Protein (g) 13.56 36.49 1.57 118.00
Vitamin A (µg) 0.00 13.00 709.00 524.00
Iron (mg) 7.61 15.70 0.61 20.70
Zinc (mg) 2.87 4.90 0.30 10.30
Source: USDA, (2016).
2.4 Infant feeding
For most children, introduction of other foods apart from breast milk starts at the age of 4 - 6
months. When introducing solid foods to infants, it is recommended to start with small amounts
of food and increase the quantity as the child gets older, while maintaining frequent
breastfeeding (Brown and Dewey, 2003 and Dewey, 2001). The energy needs from
complementary foods for infants with average breast milk intake are approximately 550 kcal/and
580kcal per day at 12-23 months of age for developing and industrialized countries respectively
(UNICEF, 2013).
In practice, caregivers will not know the precise amount of breast milk consumed, nor will they
be measuring the energy content of complementary foods to be offered. Thus, the amount of
food to be offered should be based on different combinations, taste and texture while assuring
that energy density and meal frequency are adequate to meet the child’s needs (Kathyrn, 2001).
Food consistency and variety should be increased gradually as the infant gets older, adapting to
the infant’s requirements and abilities. Infants can eat pureed, mashed and semi-solid foods
beginning at six months. By 8 months most infants can also eat finger foods (snacks that can be
eaten by children alone). By 12 months, most children can eat the same types of foods as

19
consumed by the rest of the family. Avoid foods that may cause choking or consistency that may
cause them to become lodged in the trachea, such as nuts, grapes, raw carrots (UNICEF, 2013).
2.4.1 Guidelines for infant feeding
As guidelines for infant feeding, start at six months of age by giving small amount of food and
increase the quantity as the child gets older, while maintaining frequent breast feeding (Ministry
of health and social welfare, 2013). When giving complementary foods, ensure that the energy
needs from complementary foods for infants are met. Infant feeding should be practiced by
applying principles of psycho-social care These principles hold different practices like; feed
infants directly and assisting older children when they feed themselves, being sensitive to their
hunger and satiety cues, feeding slowly and patiently, encouraging children to eat but do not
force them if children refuse many foods, trying out different food combinations, tastes, textures
and methods of encouragement, minimizing distractions during meals if the child loses interest
easily and remembering that feeding times are periods of learning and love (Pelto et al., 2002
and Engle et al., 2000). Also, talking to children during feeding with eye to eye contact is
advised. All these practices facilitate a friendly environment and encourage children to eat
(Dewey, 2001).
There is increasing recognition that optimal complementary feeding depends not only on what is
fed, but also on how, when, where, and by whom the child is fed (Pelto et al., 2002). Behavioral
studies done by Bentley et al. (1991) and Engle (2000) reveal that, a tolerant style of feeding
dominates in some populations with encouragement to eat is not always practiced unless when
children refuse to eat or when they are sick. However, the evidence to date on the impact of
feeding behaviors on dietary intake and child health is sparse. Another study done by Ruel et al.
(2009) in an urban population in Ghana, found that a care practices scale which included
breastfeeding patterns, timing of complementary feeding, food quality, and two active feeding
behaviors was positively associated with child anthropometric status among mothers with little
or no schooling. Moreover, other intervention studies (Creed de Kanashiro et al., 2002 and
Sternin et al., 1997) that included feeding behaviors as part of the recommended practices have
reported positive correlation on feeding behaviors and child growth.

20
2.4.2 Nutritional requirements for children aged 6-24 months
Proper nutrition by good feeding of infants and young children are among the most important
determinants for their health, growth and development.The nutritional requirements of infants
and children differ according to age and gender (Michaelsen et al., 2000).Energy and protein are
essential for children because they are important macronutrients required for adequate growth
and development. Together with these, micronutrients such as iron, vitamin A and zinc are of
concern for children (UNICEF, 2009). Foods such as fruits, vegetables, animal products as well
as fortified foods which are rich in micronutrients should be adequately given to children so as to
prevent micronutrient deficiency (WFP, 2012; WHO 2005; and UNICEF, 2006). The
Recommended Daily Intake (RDI) of children aged 6-23 month is shown in Table 2.
Table 2: Nutrient requirements for children aged 6-24 months
Nutrients Children 6-8 months Children9-11months Children12-24
months
Energy 682 Kcal 830 Kcal 1,092Kcal
Protein 9.1 g 11 g 13g
Vitamin A 400 µg 300 µg 300 µg
Iron 0.27mg 11 mg 7mg
Zinc 2 mg 3 mg 3mg
Sources: WHO, (2005), WHO/UNICEF, (1998).
2.5 Sensory evaluation
Sensory evaluation is a scientific method that suggests, measures, analyses and interprets
responses to products as perceived through the sense of sight, smell, touch, taste and sound. In
determining how food product affects consumers, senses are one of the most important goals not
only for food industry but also for nutritionists and dieticians who develop healthier recipes. For
the reason that our senses act as gatekeeper of our bodies, the healthy foods will be picked only
if our senses accept it. Therefore, consumer reactions as perceived by our five senses are
considered as vital measures of food development. Since no apparatus can substitute for senses

21
in testing foods, humans are used as test subjects. These studies are becoming more prevalent
despite the potential biases of humans and the costs involved (Learning and Choi, 2014).
The environment in which sensory test is conducted should be carefully controlled and samples
must be prepared in a uniform fashion so as not to influence panelists` perception of the foods`
quality (Lawless and Heyman, 2010). Panelists` who are well suited to the purpose of the
sensory test should be selected and trained appropriately.
2.5.1 Acceptability and descriptive tests
Types of sensory tests used in evaluating food quality are analytical and effective tests.
Analytical tests are based on noticeable differences whereas effective tests are based on
individual acceptability or preferences. This shows how consumer perceives food product. The
advantage of this type of sensory evaluation is to show whether consumers accepted the products
or not, and the consumer ranked the food attributes based on hedonic scale (Lawless and
Heyman, 2010). Analytical test is divided into difference test (discriminative test) and
descriptive test (Murray et al., 2001).
The descriptive type of sensory evaluation deals with quantifying the intensities of the sensory
attributes of the food product. The advantage of this type of sensory evaluation is to show the
magnitude of differences and intensities of food attributes (Adins et al., 2014). When conducting
this type of sensory evaluation; you should train judges so as to have common understandings in
rating food attributes. This will help improves an individual`s sensitivity and memory to provide
precise, consistent and standardized sensory measurements (Meenakshi et al., 2010). Depending
on the main task of the test effective tests are either acceptance or preference tests. The primary
task of acceptance tests is to rate the degree of liking while with preference test the goal is to
identify the item that is more liked (Learning and Choi, 2014).
2.5.2 Effect of ingredients on sensory characteristics
The characteristics of foods and their ingredients are perceived differently by our five senses;
sight, smell, touch, taste and sound.

22
2.5.3 Sight
The eyes perceive the initial quality of the foods as color shape, size, texture, consistence and
opacity. Color may accurately indicate ripeness, strength of dilution and the degree to which the
food has been heated, to evaluate desirability and acceptability of the food. Food`s color sends
visual signals that triggers certain expectations in mind that can change person`s choice though
the food color may be deceiving sometimes. Even small visual details such as adjacent or
background color and the relative sizes of area of contrasting color can affect consumer`s
perception (Lawless and Heyman, 2010).
2.5.4 Smell
Smell or olfactory sense also contributes to our evaluation of food quality. The volatility of odors
is related to temperature because only volatile molecules in terms of gas carry odor since it is
easier to smell hot foods than cold ones. Human subjects have varying sensitivities to odor
depending on hunger, satiety, mood, concentration, presence or absence of respiratory infections
and gender. Because different people perceive a given odorant differently, identifying new odor
from a food a food product requires as large a person as possible to get valid results.
2.5.5 Taste
Taste or the perception of gustatory input is the most influential factor in person`s selection of a
particular food. For the product to be tasted, it has to be dissolved in water, oil or saliva. Taste is
perceived by taste buds which are primarily on the surface of the tongue by the mucosa of the
palate and in areas of the throat. The sense of taste varies by gender and race. Beyond the
genetic variation in taste perception also depends on how perceptible sweet, fatty and bitter
compounds are in foods and beverages. It also depends on the value a consumer places on other
factors such as health and convenience (Duffy and Bartoshuk, 2000).
2.5.6 Sound
This is another sense which is used to evaluate food quality such as sizzling, crunching,
popping, bubbling, squeaking, dripping, exploding and crackling can communicate much about a
food. Most of these sounds are affected by water content thus their characteristics indicates a

23
food`s freshness and ripeness (Brown, 2008). Sound is detected as vibration in the local medium,
usually air. The vibrations are transmitted via the small bones in the middle ear to create
hydraulic motion in the fluid of the inner ear, the cochlea. For an individual to give the sound/
texture of the food, he/she has to feel it from the mouth.
2.5.7 Touch
This is a sense that brings impression of a food texture to us through oral sensation or the skin.
Texture is the sensory manifestation of the structure or inner makeup of the products interms of
their reactions to stress which are measured as mechanical properties such us hardness, firmness,
adhesiveness, cohesiveness, gummines and viscosity by the kinesthetic sense in the muscle of
thee hands, fingers tongue, jaw or lips. Texture also includes tactile feel properties which are
measure as geometric properties or moisture properties by the tactile nerves in the surface of the
skin, hands, lips or tongue. The greater surface sensitivity of the lips, tongue, face, and hands
makes easy detection of small differences in particle size, thermo and chemical properties
possible among food products (Meilgaard et al., 2007).
2.6 Extrusion Cooking Technology
Extrusion cooking is a high-temperature, short-time process in which moistened, expansive,
starchy and protenacious raw material is used. Food materials are plasticised and cooked in a
minute by a combination of moisture, pressure, temperature and mechanical shear, resulting in
molecular transformation and chemical reactions (Moscicki et al., 2011). Extrusion reduces the
microbial count and inactivates enzymes (Navale et al., 2015). This process combines several
unit operations including mixing, cooking, kneading, shearing, shaping and forming. Extrusion
technologies have an important role in the food industry as efficient manufacturing processes.
Extrusion cooking has gained in popularity over the last two decades for a number of reasons
like versatility, low cost, productivity, provision of ready-to use product, retention of product
nutrient quality as well as environmentally-friendly (Sundarrajan, 2014).As a low-moisture
process, extrusion cooking does not produce significant process effluents, reducing water
treatment costs and levels of environmental pollution (Moscicki et al., 2013). Based on ability of
extrusion cooking technology of combining several unit operations like mixing, cooking,
kneading, shearing, shaping and forming so it is a highly versatile unit operation that can be

24
applied to a variety of food processes. Extrusion has for years provided the means of producing
new and creative foods. One major advantage of extrusion cooking is the capability to produce a
wide range of finished products with minimum processing times and by using inexpensive raw
material (Riaz, et al., 2007).
Food extruders belong to the family of high temperature short time (HTST) equipment, capable
of performing cooking tasks under high temperature, high pressure and for short time
(Fellows,2000). This technology serves as an advantage for vulnerable foods and feeds as
exposure to high temperature but for only short time will prevent destruction of nutrients. The
results of extrusion are gelatinization of starch, denaturation of protein, partial dextrinization of
starch, inactivation of many native enzymes, reduction of microbial count and improvement of
digestibility of the product. Moreover, extrusion cooking improves the protein value of the
product by breaking down the native protein structure including enzyme inhibitors and lectins as
well as breaking down phytic acid in the seeds which then leads to increased protein content in
the food (Shimelis and Rakshit 2007 and Prakrati et al. 1999) as well as reducing the activity of
some anti- nutritional factors in the product such as trypsin inhibitors, and undesirable enzymes,
such as lipases, lipoxidases and microorganisms (Pathania et al., 2013). Extrusion cooking may
even reduce pasting property of flours and hence extruded flours will require minimum
temperature to cook (Kaur et al., 2007).
2.6.1 Types of extruders
There are two types of extruders used for food production: single-screw extruders and twin screw
extruders. Single-screw extruders are the most common extruders used in the food industry.
Twin-screw extruders are used for high-moisture extrusion, products that include higher
quantities of components such as fibres, fats, etc. and more sophisticated products (Steel et al.,
2012).
2.6.2 Single-screw extruders
Single screw extruders contain a single rotating screw in a metal barrel, and come in varying
patterns. They are the most common extruders applied in the food industry. The classification of
single-screw extruders can be defined based on process or equipment parameters such as:
conditioning moisture content (dry or wet), solid or segmented screw, desired degree of shear

25
and heat source. However, practically, the main classification used considers the degree of shear
and the heat source (Steel et al., 2012). In single –screw extruders the raw materials are fed in a
granular form at the hopper located in the feed section. The rotating action of the screw conveys
the material to the transition section. In the transition section, the screw channel becomes
shallower and the material is compacted. The barrels of single-screw extruders usually have
helical or axial grooves on inner surfaces. This helps to convey and mix the material more
effectively (Ramachandra and Thejaswini, 2015).
2.6.3 Twin screw extruders
These are types of extruders which are composed of two axes that rotate inside a single barrel.
Generally the internal surface of the barrel of twin-screw extruders is smooth. Depending on the
position of the screws and their direction of rotation, four different types of configurations are
possible: co-rotating intermeshing screws; co-rotating non-intermeshing screws; counter-rotating
intermeshing screws; and counter-rotating non-intermeshing screws. (Steel et al., 2012).The
advantage of using twin screw extruders is versatility to process a wide range of products like
tortillas, cereal snacks, extruded corn snacks, and multigrain snacks. However, this type of
extruder is little used in the food industry, even though they present more efficient displacement
properties (Ramachandra and Thejaswini, 2015).
The principle of the extrusion process involves the loading of raw materials in the feeding
hopper from where the screw conveys them through a barrel under pressure. The materials are
compressed into a semi-solid, plasticized mass as they pass down the barrel. The selection of
right extruder for the production of ready to eat (RTE) or cereal snacks depends on the nature of
raw materials used, bulk density and type of product to be produced (Fellows, 2009).The effects
of extrusion cooking on nutritional quality are ambiguous. Benefits include destruction of anti-
nutritional factors, gelatinization of starch, increased soluble dietary fibre and reduction of lipid
oxidation. Starch digestibility is largely dependent on complete gelatinization. High starch
digestibility is essential for specialized nutritional foods such as infant and weaning foods.
Creation of resistant starch by extrusion may have value in reduced calorie products
(Ramachandra and Thejaswini, 2015).

26
Figure 5: A cross-section of a single-screw extrusion-cooker: 1 - engine, 2 - feeder, 3 -
cooling jacket, 4 - thermocouple, 5 – screw, 6 - barrel, 7 - heating jacket, 8 - head, 9 - net, 10
-cutter, I - transport section, II – compression section, III –melting and plasticization
section (Mościcki et al., 2013).
2.7 Shelf life study
Shelf life is a time during which the food product will remain safe, be certain to retain
organoleptic qualities, chemical, physical and microbiological characteristics as well as
complying with any label declaration of nutritional data when stored under recommended
conditions (Kilcast and Persis 2003). The shelf life of different food products start from the day
the product is manufactured and its length varies based on ingredients used, manufacturing
processes, storage conditions as well as packaging materials (Jaya and Das, 2005).There are
many factors which can influence shelf life and can be grouped into intrinsic and extrinsic
factors (IFST, 1993). Intrinsic factors include the properties of the final product such as water
activity (water available), pH value and total acid, redox potential, available oxygen, nutrients,

27
natural micro flora and surviving microbiological counts, natural biochemistry of the product
formulation (enzymes, chemical reactants) as well as use of preservatives in product
formulations. Extrinsic factors are those factors the final product meets as it moves through food
chain. Those factors include time- temperature profile during processing, temperature control
during storage, relative humidity during processing, storage and distribution, exposure to light,
composition of atmosphere within packaging, subsequent heat treatment as well as consumer
handling(Kilcast and Persis 2003; IFST 1993 and Mcginn, 1982).
There are two ways which can be used to determine shelf life of the product, one being direct
method which is mostly used and another is accelerated shelf life study. In determining the shelf
life of the product using a direct method requires a considerable amount of experimentations,
consequent costs and time. Therefore, in order to shorten this process, accelerated shelf life
testing (ASLT) by storing the product in an elevated temperature can be used (Mizrahi, 2000).
Accelerated shelf life refers to a method that is capable of evaluating product stability using
significantly shorter period than actual shelf life of the product (Kebene et al., 2015 and Kilcast
and Persis 2003). This technique shortens the storage time and increases the deterioration of the
product through increasing the storage temperature (Yang et al., 2013 and Martin and Silva,
2004). Based on techniques in ASL study, it can significantly help in shortening the shelf life
duration to half or quarter of the direct method (Corradini and peleg, 2007).
The results obtained from this technique can be used to estimate the shelf life of a product under
normal storage conditions through the use of linear or Arrhenius equations (Gulla and Waghray,
2012). The principle factor which affects the kinetics of reactions in processed and dried food is
temperature. The increased temperature is known for accelerating the deteriorative reaction in
foods which then reduces their shelf life period (Labuza, 1982). Temperature in accelerated shelf
life is assumed to follow the Arrhenius equation.
Arrhenius equation; K= koexp(Ea/RT)
Where: K= rate constant Ko= Pre exponential constant Ea= Activation energy R= Gas constant
T= Absolute temperature.
Arrhenius equation serves as the best approach in modeling temperature dependence. Unlike
other models of temperature dependence, Arrhenius model has a thermodynamic basis (Labuza

28
and Kamman, 1983 and Saguy and Karel, 1980). The activation energy in this equation is
derived from the slope of a plot of natural logarithim of rate of constant (k) versus the inverse of
absolute temperature which depends on compositional factors like water activity, moisture
content and solid concentration. Predicting shelf life using calculations of the temperature
dependence reactions is associated with large statistical errors. Therefore, study by Cohen and
Saguy (1985) suggests the use of Arrhenius plots in predicting shelf life based on a known end
point quality deterioration value. Labuza and Riboh,(1982) added reported that there could be
many other limitations besides statistical errors in using Arrhenius plot to predict shelf life at
lower temperature because some reactions which predominate at higher temperature do not pre
dominate at lower temperature.

29
CHAPTER THREE
3.0 RESEARCH MANUSCRIPT
3.1 Development and nutritional evaluation of a nutrient dense complementary porridge
flour from locally available foods in Tanzania
Abstract Poor growth and development in many infants starts during or after introduction to
complementary feeding period, contributing significantly to higher prevalence of malnutrition in
children less than 5 years of age. This has been contributed by nutritionally poor quality
complementary foods which are mostly cereal based. The cereal based foods are low in nutrient
content and also associated with high bulkiness which requires too much dilution which tends to
reduce energy content. It is from this point that this study was carried out to utilize the locally
available foods; soybeans, amaranth grains, pumpkin seeds and orange fleshed sweet potato to
develop a nutrient dense complementary porridge flour and determine its nutritional composition
and amount of targeted nutrients in this study which were energy, protein, vitamin A, iron and
zinc. Five composites flours (SAPO1-SAPO5) were developed. Two commercial formulations
SOS and SMGM were used as control samples. About 350 g of each flour was used to make
porridge and assessed for their proximate compositions, vitamin A and C, minerals, in vitro
protein digestibility and nutrient densities. Nutrient density of the targeted nutrients in 100 ml
showed that SAPO1 had highest energy (117.61Kcal) and protein 3.19g/100 g, SAPO2 had
highest zinc content of 14.47mg/100 g; SAPO4 had highest Vitamin A content of 56.11µg/100g
while SAPO5 had the highest iron content of 20.81mg/100 g. Zinc and iron extractability was
higher in SAPO2 and SAPO4. In vitro protein digestibility of all formulations was high (90-
99%). Based on the targeted nutrients in this study, it can be concluded that, utilization of
soybeans, amaranth grains, pumpkin seeds and orange fleshed sweet potato can help in
improving energy, protein, vitamin A, iron and zinc contents of complementary porridges used
in Tanzania. Therefore, it is recommended from this study that, the awareness of the nutritional
benefits of these foods in complementary feeding should be created to communities so as to
increase the utilization of these foods which will also increase the nutrient contents of
complementary foods.
Key words: Energy, protein, vitamin A, zinc, iron zinc and iron extractability in vitro protein
digestibility.

30
3.1.1 Introduction
The problem of childhood under nutrition among children of below 5 years of age remains
intolerable throughout the world with large numbers of the affected children being in developing
countries (UNICEF, 2009). The problem of malnutrition in many infants starts during or after
introduction of complementary foods, contributing significantly to the high prevalence of
malnutrition in children less than 5 years of age (Muhimbula and Zacharia 2010 and Mosha et
al., 2000). These studies added that majority of the infants are introduced to cereal-based
complementary foods well before the recommended 6 months of age or in rare cases do not
receive these until their second year of age.
Malnutrition can also be contributed by nutritionally poor quality complementary foods and
insufficient amount. There are also cases in developing countries when complementary foods are
of low nutritional quality and are given in insufficient amounts (Pelto and Thairu, 2003). These
foods are locally produced and based on local staple foods, usually cereals that are processed into
porridges (Villapando, 2000). Apart from their bulkiness reported as a probable factor in the
etiology of malnutrition, cereal-based gruels are generally low in protein and are limiting in
some essential amino acids, particularly lysine and tryptophan (Dewey and Brown 2003 WHO,
2001;). Tanzania as one of the developing countries is dependent on cereal and non-cereal based
traditional weaning foods from maize, sorghum, millet, rice, cassava, potatoes, yams and
plantains (Muhimbula and Zacharia 2010 and Mamiro et al., 2005). There is a higher rate of
childhood under nutrition associated with the use of these starch staples in weaning foods as
reported by Mosha et al. (2000). In addition such foods are bulky and high in phytate, which
limits the bioavailability of nutrients, including iron, calcium, zinc, and in some cases proteins,
and energy which are crucial to the growth and development of infants (Gibson et al., 2010).
Fortified nutritious commercial complementary foods areunavailable especially in the rural areas
and whereavailable, they are often too expensive and beyond thereach of most of families in
developing country like Tanzania (Dewey and brown, 2003). Given that there are many locally
available nutrient dense foods which can supply enough energy, protein, vitamins and minerals

31
in Tanzania; there is a need to effectively utilize them so as to produce acceptable and nutrient
dense porridge that can be used as complementary food in Tanzania. Therefore, this study,
following the FAO/WHO/UNICEF (1971) emphasize on the use of local foods formulated in the
home and guided by the following principles: (i) high nutritional value to supplement
breastfeeding, (ii) acceptability, (iii) low price, and (iv) use of local food items, utilized Orange
fleshed sweet potato, amaranth grains, pumpkin seeds and soybeans the locally available nutrient
dense foods to develop a nutrient dense porridge flour for children (6-24) months of age and
analyzed for its proximate, vitamin A and C and mineral compositions. The developed flour is
expected to contribute in improving the nutritional quality of the complementary porridges in
terms of energy, protein and micronutrients.
3.1.2 Material and methods
3.1.2.1 Material
Orange Fleshed Sweet potato, Pumpkin seeds, Soy bean and Amaranth grains were selected
because of their prosperity in the targeted nutrients (vitamin A in form of beta carotene, Zinc,
Iron, Energy and Protein). Beside the richness of these nutrients, they are locally available and
affordable since they can be adopted and produced in different places in Tanzania.Pumpkin
seeds, Soy bean and Amaranth grains were purchased from Morogoro market while Orange
Fleshed Sweet Potato were purchased from a farmer in Arusha region, Tanzania. Food grade
chemicals and reagents for chemical analysis were obtained from the Department of Food
Technology, Nutrition and Consumer science laboratory at SUA.
3.1.2.2 Methods
Research design
Complete randomized design (CRD) was used in this study and the principal factor was
formulation type. The effect of different formulations on proximate composition, mineral
contents, Vitamin A and C, zinc and iron extractability, in vivo protein digestibility and viscosity
of the flour and porridge samples were assessed and compared. The mathematical expression is
shown in Equation 1.

32
yij= μi+ τi +εij………………………………………………………….……(i)
i=1, 2,..., t, j=1,2,.............................................................................................ii
Where μ is the overall mean, τi is the ith treatment effect and εij is the random effect due to jth
replication receiving ith treatment.
3.1.2.3 Preparation of orange fleshed sweet potato flour
Orange fleshed sweet potatoes were sorted, washed, hand peeled, sliced into small chips (about
1 cm), dipped in water, then drained, spread on trays and dried for one day a in a solar drier at a
temperature range of 60-650C. The dried sweet potato chips were extruded and milled into fine
flour, packaged into polythene bags, sealed and stored at room temperature waiting for porridge
preparation and analysis.
3.1.2.4 Preparation of pumpkin seeds flour
Pumpkin seeds were sorted, washed, soaked in water for one day so as to reduce amount of
phytate content on the outer cover, then drained, spread on trays and dried for one day in a solar
drier. The dried seeds were roasted at 100 0C
for 25 minutes, extruded, and milled into fine flour,
packed into polythene bags and stored at room temperature.
3.1.2.5 Preparation of soy bean flour
Soybeans were sorted, washed boiled for 25 minutes, drained, cooled, and decupled manually,
washed, spread on trays and dried for one day under solar drier. The dried soy beans were
roasted, extruded, milled into fine flour, packed into a polythene bags and stored at room
temperature.
3.1.2.6 Preparation of amaranth grain flour
Amaranth grains were collected, sorted, winnowed, washed, sprouted by soaking in water for
overnight at a room temperature so as to increase digestibility and bioavailability of nutrients,
cleaned, put on a tray for two days to germinate, dried by a solar drier, rubbed to remove shoots,
extruded then milled into flour.

33
3.1.3 Extrusion processing of raw materials
Raw material used in making complementary food in this study were extruded co-rotating twin
screw extruder with L/D ratio of 16:1 and screw diameter of 60mm, model Js-60D,China. The
extrusion process was done under the following conditions: screw speed of 30rmp, feeding rate
of 10.15kg/hr and barrel temperature was set at 100°C and 130°C in the first and second zones
respectively. The extruded materials were collected, cooled to room temperature under natural
convection conditions, milled into fine flour using milling machine (Model CH, Intermech
Engineering with mesh screen of 0.8 mm), cooled, packed in polythene bags and stored at room
temperature prior to porridge preparation and analysis.
3. 1.3.1 Preparation of composite flour
3.1.3.2 Formulations Compositions of the formulated complementary porridge flours are shown in Table 3.1
Nutrisurvey (2007) software was used to design 12 formulations (Table 1.1) which were
expected to provide at least from a half of the recommended daily allowance of the targeted
nutrients which are energy (900Kcal), protein (13g), vitamin A (300µg), iron (7mg) and zinc
(3mg) for children of 6-24months. From the 12 formulations, 5 formulations which provided at
least from half of the recommended daily allowance of the targeted nutrients of interest in this
study were taken and used in porridge making. Single flour was mixed in different proportions as
shown in (Table 3.1).

34
Table 3. 1: Formulations by Nutrisurvey software
Formula
tions
Soybeans
(%)
Amaranh
grain (%)
Pumpkn
seeds
(%)
OFSP
(%)
Energy
(Kcal)
Protei
n (g)
Vitamin
A (µg)
Iron
(mg)
Zinc
(mg)
1
2
3
4
5
6
7
8
9
10
11
12
100
0
0
0
50
40
30
25
20
15
10
5
0
100
0
0
20
20
35
25
40
25
30
20
0
0
100
0
25
30
20
20
15
30
30
40
0
0
0
100
5
10
15
30
25
20
15
10
112.6
86.0
460.0
82.0
370.2
393.8
408.1
426.0
349.4
316.7
286.2
149.3
32.0
13.4
24.0
6.6
20.7
27.2
26.1
24.2
28.8
22.2
19.6
15.0
100.0
0.0
38.0
12812.
476.7
869.6
1206.4
2502.2
2120.5
1705.2
88.0
869.6
3.9
7.6
12.5
1.1
8.6
8.0
7.6
7.9
7.0
7.1
7.2
8.0
3.1
3.2
7.0
2.4
2.8
4.0
2.8
3.4
2.5
3.3
3.4
4.0

35
Table 3. 2: formulations used in the study
Sample
code
Soy
bean
(%)
Amaranth
grains
(%)
Pumpkin
seeds (%)
OFSP
(%)
Energy
(Kcal)
Protein
(g)
Vitamin
A (µg)
Iron
(mg)
Zinc
(mg)
SAPO1 50 20 25 5 370.2 20.7 476.7 8.6 2.8
SAPO2 40 20 30 10 393.8 22.7 869.6 8.0 4.0
SAPO3 30 35 20 15 408.1 26.7 1206.4 7.6 2.8
SAPO4 25 25 20 30 426.0 24.2 2502.2 7.9 3.4
SAPO5 20 40 15 25 349.4 28.8 2120.5 7.0 2.5
Reference groups: SOS: soybean, orange fleshed sweet potato and sorghum SMGM: soy bean, millet,
groundnuts and maize
3.1.3.3 Porridge preparation
Seven different porridges (5 from formulated flour and 2 reference groups) were prepared by
mixing 350g of flour in 1500ml of boiling water. The mixture was constantly stirred for about 15
minutes, and then 30g of sugar was added to the cooked porridge.
3.1.3.4 Flour rate and viscosity determination
To determine flour rate which could provide porridge with the required viscosity (2500cP –
3000cP) as given by Thaoge et al. (2003) and Mosha and Svanberg, (1983). Different flour rates
of formulated and control groups were tried as shown in Table 6. Flour rate of 350g was selected
to be mixed with 1500ml water to prepare porridge since it provided the viscosity which was
within the recommended viscosity for infant feeding.
3.1.4 Chemical analyses
3.1.4.1 Determination of Protein
Protein was determined by Kjeldahl method using standard AOAC Method (2000). About 2g of
dried samples were taken in digestion flask then 10-15 ml of concentrated H2SO4 and 8g of

36
digestion mixture i.e. K2SO4: CuSO4 (8:1) was added. The flask were swirled in order to mix
the contents thoroughly then placed on the heater for about 2 hours to start digestion till the
mixture became (blue green color). The digest was cooled and transferred to 100 ml volumetric
flask and volume made up to mark by the addition of distilled water. 10 ml of the digest was
introduced in the distillation tube then 10 ml of 0.5 N NaOH was gradually added.
Distillation was continue for at least 10 minutes and NH3 produced was collected as NH4 OH in
a conical flask containing 20 ml of 4% boric acid solution with few drops of modified methyl red
indicator. During distillation yellowish color appeared due to NH4 OH. The distillate was then
titrated against standard 0.1 N HCL solutions till the pink color appeared.
The percentage of protein was calculated using the following formula
………………………………..eqn i
…………………………….....eqn. ii
Where. S is Sample titration reading, B is blank titration reading, N is =normality of HCL, D
is=dilution of sample after digestion, V=Volume taken for distillation and 0.014=Mill equivalent
weight of Nitrogen
3.1.4.2 Determination of Fat
Fat determination was carried out according to AOAC (1999) method 945.87 Soxhlet ether
extraction using the Soxhlet extractor. During the process the Soxhlet extractor was fitted up
with 150ml of Petroleum spirit (40 – 60oC). Then a 5g of a sample potion was accurately
weighed into an extraction thimble that previously dried in an oven. The thimble was then pluged
lightly with cotton wool and placed in the extractor. The condenser of the Soxhlet extractor was
replaced with the heating mantle while making sure that the joints are tight. The source of heat
was then adjusted such that the solvent boiled gently and be able to siphon over for about three
hours. Then the condenser was detached and the thimble removed. In addition to that the round
bottomed flask containing the solvent and the extracted fat was detached. Solvent and fat are
separated by using the rotary vacuum or water bath (Wagtech, Laborota 4001, Uk) in a fume

37
hood, the flask was placed in the oven at 100oC and dried to constant weight. The flask was then
cooled in the desiccator and weighed after cooling. Then the extracted fat was determined using
the formula;
Percentage fat (%Fat) =
x 100
Where: EE =Ether extract / fat content
3.1.4.3 Determination of Crude fiber
Crude fibre was determined according to AOAC (1990) Method No. 14:020 through hot
digestion with acid and alkali solutions. A bottle with reagents (sulphuric acid) was placed on a
hot plate and heated to a temperature of 95 to 100oC. The samples were loaded on the weighed
crucibles, locked in position with a handle and placed in front of the radiator in the hot extraction
unit while ensuring the safety latch engaged. Then the reflectors were placed in front of the
crucibles and valves turned off. The cold water tape for the reflux system was opened and the
main button pressed to start the extractor. Hot extraction was then carried out by pouring
reagents into the columns from the top using a funnel to the mark (100mls/150mls/200mls). The
heater was switched on and then three drops of anti-foaming agent (n-octanol) were added in
each column. The boiling speed was moderated by using the heater control. While extraction
going on distilled water and sodium hydroxide solution were heated in beaker and bottle
respectively. By the end of extraction the heater was turned off, the water suction pump was
started and the valves pressed to vacuum position. The sample containing crucibles were then
washed three times with hot water using special water sprayer followed by drying them. The
operation was then repeated from step one for the second extraction with sodium hydroxide
solution. The crucibles were then released from the extractor using a safety hook. Using crucible
holder, the crucibles were transferred to the cold extraction unit. Then the crucibles washed three
times with acetone contained in the wash bottle. Crucibles contained samples were dried in an
oven at 100oC and then taken to the desiccators. After cooling the crucible in the desiccators,
crucibles and sample were reweighed and final weights recorded. The percentage fibre content
on both dry and wet basis was then calculated following the formula;

38
Crude fibre (on wet basis) =
x
100
Crude fibre (on dry basis) =
x 100
3.1.4.4 Dry Matter and moisture content determination
Moisture content was determined according to Tomohiro (1990), whereby 5g of samples
(porridge and flour) were taken and placed on a dry Petri dish of known weight and weighed.
Thereafter, the sample on the petri dish was taken to the oven preset at 110oC for drying for
about 5 hours. The sample was then cooled in the desiccator and weighed again.
After every four hours of oven drying, the sample was taken out of oven, cooled in the
desiccators and weighed. The process repeated till a constant weight was attained. Percentage
moisture content was then calculated using the following formula.
% MC =
x 100
3.1.4.5 Determination of total carbohydrates content
The carbohydrate content was determined by difference on dry weight basis.The total
percentages of the fat, crude protein, ash, dietary fibre were deducted from 100%, the remainder
accounts for carbohydrate content.
On dry weight basis

39
3.1.5 Vitamins determination
3.1.5.1 Vitamin C (Ascorbic acid) determination
A weight of 2g of porridge and flour was measured using weighing scale; 10ml of 10%
Trichloroacetic acid (TCA) solution was added. The mixture was shaken for few minutes and left
to extract the contents, the extracted solution was then diluted to 50ml with excess 10% TCA
solution and filtered using No. 1 Whatman filter papers. 10ml of the filtrate was taken into 250ml
conical flask and titrated with standard solution of 2,6-Dichlorophenolindophenol, Sodium salt
until faint pink colour obtained which persist for10 seconds. (Tomohiro, 1990). The Vitamin C
content was then calculated using the formula below:
Vitamin C content in mg/100g of the sample = (A – B) * C * V * 100
D * S
Where, A is volume in ml of the Indophenols solution used for sample, B is volume in ml of the
indophenols solution used for blank, C is mass in mg of ascorbic acid equivalent to 1.0ml
indophenols solution, S is mass of sample in (g) taken for analysis and V = total volume of
extract in milliliters
3.1.5.2 Beta carotene determination
Beta carotene determination was done according to Delia and Mieko (2004) whereby 0.2- 0.3g of
a flour and 5g of porridge were measured and homogenized 4 times using 50mls proportions of
cold acetone before extracted. The extract was transferred into the separating funnel contained
petroleum ether (40-60oC Bp), followed by a thorough washing with about 300mls of distilled
water until the extracts were acetone free. During the washing process, the distilled water was
put along the walls of the glass separating funnel to avoid formation of emulations (water stones)
in the carotenoid extracts. The washed samples were then passed through anhydrous sodium
sulphate to make it free from any trace of water. The dried carotene extracts was then collected
into a clean and dry volumetric flask. Beta carotene stock standard solution with the
concentration of 100µg/ml was prepared. This stock solution diluted serially to obtain 0, 0.25,
0.5, 1.0, 2.0, 4.0, 6.0, 8.0, 10.0 and 12.0 µg/ml concentrations. The extract and diluted standards
was then read under UV-Visible Spectrophotometer Wagtech, CECIL 2021 at 450nm to obtain
40
its optical density (OD) which was able to estimate the Beta carotenes in the sample. Linear
regression equation obtained from the standard plot and the beta carotene content of the
unknowns calculated as described by (Rasaki et al., 2009).
3.1.5.3 Determination of mineral content
The analysis of minerals was done according to the AOAC (1999) procedures by the use of
UNICAM, 919 Atomic Absorption Spectrophotometer (AAS). Samples were dried and then
ashed at 450 0C under a gradual increase of 50
0 C temperature per hour.
3.1.5.4 Iron and zinc solubility
Iron and zinc solubility were determined using a method by Duhan et al. (2002). The minerals in
the samples (1.0 g) were extracted with 10 ml of 0.03 N HCl by shaking at 37 °C for 3 h. The
mixture was filtered with Whatman # 42 filter paper and was oven dried at 100 °C and wet acid
digested. The amounts of the HCl-extractable zinc and iron in the digested samples were
determined following procedures for mineral determination.
3.1.6 Nutrient density determination
Porridges were prepared at different flour ratio (200g, 250g, 300g, 350g and 400g) in 1500ml hot
water. The viscosities of these porridges were measured using HAAKE viscometer 2 plus
version 1.5. Flour rates of the porridges were determined to know which the flour rate could give
the porridge with acceptable viscosity (2500-3000Cp) (Thaoge et al., 2003). After obtaining the
flour rate with acceptable viscosity, the energy, protein, iron, zinc and vitamin A densities of all
porridge samples were calculated based on the flour rate obtained. The nutrient densities of the
porridge samples were calculated using the formulae;
⁄

41
3.1.7 In vitro protein digestibility
In vitro protein digestibility was determined according to the method explained by Tilley and
Brit (1961). About 5g g of porridge and flour samples were dried and digested anaerobically
with rumen microorganism at 38oC for 48hr. The samples were dried in the oven for 6 hours at
1000C and grounded to pass 0.8mm sieve. The buffer solution was made up according to the
formula for synthetic saliva of Dougall (1948) adding the CaCl2 last the solution is thoroughly
saturated with CO2 at 380C until it became clear. The samples were put in the test tubes, mixed
with rumen liquor and buffer solution, stirred and gassed with carbon dioxide. The tubes were
incubated at 38oC in the dark for 48 hours, being shaken 3 to 4 times a day by hand. The tubes
were centrifuged immediately for 15mins, and then the supernatant was discarded. After
discarding the supernatant, 50 ml of freshly-made pepsin solution was added to the residues. The
tubes were then incubated at 38oC for 48hours with occasional shaking. After incubation,
supernatants were discarded and insoluble residue was washed with water. The tubes with
residues were dried at 1000C so as to get the dry weight of the samples. Digestibility is weight of
digestible material in 100g of herbage dry matter. After all these procedures the in vitro dry
matter digestibility (%) was calculated by formula below;
IVDMD=100*(Sample dry matter) – (residual dry matter-residue . Incubated reagent blank)
Sample dry matter
3.1.8 Statistical data analysis
The data were analysed by using R statistical package (R Development Core Team, Version
3.0.0, Vienna, Austria) for one-way analysis of variances to determine the significant differences
between the factor means at (p<0.05). Means were separated by Turkey’s Honest Significant
Difference at p <0.05. Results were presented in tabular form as mean ±SD

42
3.1.9 Results
3.1.9.1 Proximate composition
Proximate composition of the formulated flour and porridges together with two references (SOS
and SMGM) are given in Tables 3.3.1 and 3.3.2. There were significant differences (p<0.05) in
proximate parameters between the samples with reference sample SMGM having higher values
of 8.4 and 83.8 g/100 g of moisture content in both flour and porridge respectively, while
SAPO1 had significantly lower respective values of 4.9 and 77.0 g/100 g. SAPOF1 and SAPO1
had significantly higher protein contents of 4.4 and 5.3) in both flour and porridge. SAPOF1had
higher fat content of 24.8 g than the reference group SOSF with value of 2.6 g/100g, while in
porridges SMGM had a higher fat content of 2.1 g/100 g than other samples. Furthermore,
reference SOSF and formulation SAPO1 had significantly higher carbohydrate contents than the
other samples.

43
Table 3.3. 1: Proximate composition of flours samples
Means in each column with different superscripts are significantly different (P<0.05 (SAPOF1-5, SOSF and SMGMF) = Flours
Table 3.3. 2: Proximate composition of porridges g/100g
Sample Moisture
(%)
Protein
(%)
Fat (%) Fibre (%) Ash (%) CHO (%)
SOSP 83.6±0.311a 1.4±0.007
f 1.6±0.07
b 0.1±0.001
d 2.3±0.046
d 11.0±0.349
d
SMGMP 83.8±.003a 1.6±0.006
e 2.1±0.004
a 6.3±0.071
a 1.9±0.201
e 4.2±0.260
e
SAPOP1 77.0±1.382d 4.4±0.021
a 0.7±0.007
e 0.2±0.007
bc 2.7±0.135
bc 15.0±1.497
a
SAPOP2 80.5±0.131bc
4.3±0.007a 0.6±0.007
f 0.2±0.014
c 3.1±0.069
ab 11.2±0.482
d
SAPOP3 78.9±0.198cd
3.8±0.007b 0.9±0.007
d 0.2±0.007
bc 3.5±0.402
a 12.8±0.437
c
SAPOP4 79.1±0.485c 2.7±0.014
d 0.9±0.007
d 0.3±0.007
b 3.2±0.344
b 13.4±0.069
b
SAPOP5 81.4±0.307b 3.1±0.007
c 1.2±0.042
c 0.2±0.011
bc 2.8±0.223
c 11.9±0.104
cd
Means in each column with different superscripts are significantly different (P<0.05 (SAPOP1-5, SOSP and SMGMP) = Porridges
Proximate composition g/100 g DM
Sample Moisture (%) Protein (%) Fat (%) Fibre (%) Ash (%) CHO (%)
SOSF 7.7±0.172b 1.3±0.006
e 2.6±0.014
g 0.1±0.001
c 0.1±0.001
c 88.1±0.211
a
SMGMF 8.4±0.212a 1.4±0.007
e 6.1±0.043
f 0.1±0.006
c 0.1±0.001
c 77.7±0.260
b
SAPOF1 4.9±0.429e 5.3±0.007
a 24.8±0.006
a 0.2±0.007
b 0.2±0.001
b 64.9±0.436
e
SAPOF2 4.9±0.369e 4.9±0.007
b 23.8±0.007
b 0.2±0.014
b 0.3±0.004
a 65.8±0.352
e
SAPOF3 5.6±0.417d 3.7±0.014
c 18.6±0.064
c 0.2±0.007
b 0.2±0.007
b 71.7±0.509
d
SAPOF4 6.1±0.311c 3.0±0.063
d 15.9±0.028
d 0.3±0.007
a 0.2±0.007
b 77.7±0.049
b
SAPOF5 6.1±0.025c 3.2±0.001
d 12.8±0.011
e 0.2±0.011
b 0.2±0.007
b 74.4±0.402
c

44
Tables 3.4.1 and 3.4.2 show Beta-carotene and vitamin C contents of flour and porridge samples
in both references and formulated samples. SAPOF5 and SMGMP had a significantly (P<0.05)
higher vitamin C contents of 7.8 and 4.6 mg/100 g respectively. SAPOF4 had significantly
higher beta carotene content of 232.2 µg/100g in flour samples while in porridges was 96.4
µg/100g.
Table 3.4. 1: Beta- carotene and Vitamin C of flour samples
Vitamins
Sample Vitamin C (mg/100g) Beta carotene (µg/100g)
SOSF 1.6±0.007e 215.5±0.39
c
SMGMF 2.2±0.007d 148.5±0.06
g
SAPOF1 1.6±0.007e 180.5±0.56
f
SAPOF2 2.1±0.007d 186.4±0.85
e
SAPOF3 4.4±0.007c 197.1±0.16
d
SAPOF4 7.8±0.007a 232.2±0.00
a
SAPOF5 7.5±0.007b 224.5±0.66
b
Means in each column with different superscripts are significantly different (P<0.05) (SAPOF1-5, SOSF and
SMGMF) = Flours.
Table 3.4. 2: Beta-carotene and Vitamin C of porridge samples
Sample Vitamin C (mg/100g) Beta carotene (µg/100g)
SOSP 2.9±0.007c 49.6±0.28
e
SMGMP 4.6±0.007a 37.5±0.32
g
SAPOP1 1.5±0.007f 41.2±0.17
f
SAPOP2 2.1±0.007e 66.2±0.16
d
SAPOP3 2.5±0.007d 70.5±0.15
c
SAPOP4 3.9±0.007b 96.4±0.25
a
SAPOP5 0.9±0.007g 78.6±0.15
b
Means in each column with different superscripts are significantly different (P<0.05 (SAPOP1-5, SOSP and
SMGMP) = Porridges
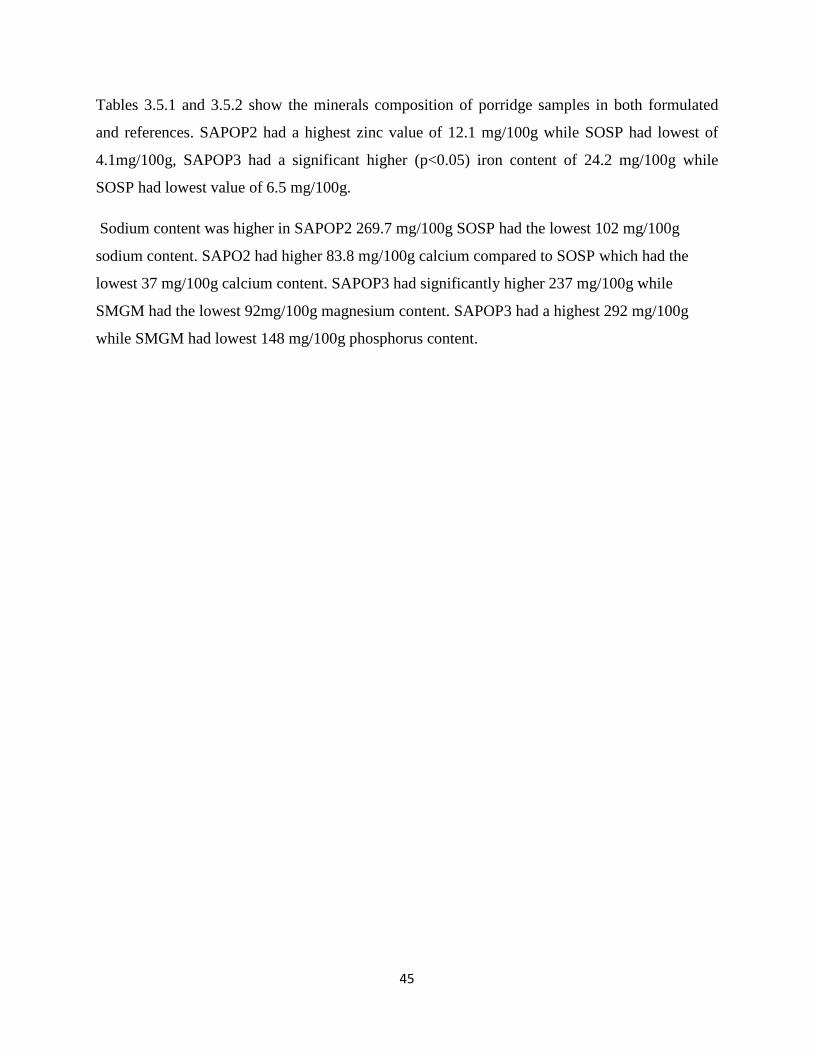
45
Tables 3.5.1 and 3.5.2 show the minerals composition of porridge samples in both formulated
and references. SAPOP2 had a highest zinc value of 12.1 mg/100g while SOSP had lowest of
4.1mg/100g, SAPOP3 had a significant higher (p<0.05) iron content of 24.2 mg/100g while
SOSP had lowest value of 6.5 mg/100g.
Sodium content was higher in SAPOP2 269.7 mg/100g SOSP had the lowest 102 mg/100g
sodium content. SAPO2 had higher 83.8 mg/100g calcium compared to SOSP which had the
lowest 37 mg/100g calcium content. SAPOP3 had significantly higher 237 mg/100g while
SMGM had the lowest 92mg/100g magnesium content. SAPOP3 had a highest 292 mg/100g
while SMGM had lowest 148 mg/100g phosphorus content.

46
Table 3.5 1: Mineral composition of the porridge samples
Mineral composition g/100 g DM
Sample Zn Fe Na Ca Mg P
SAPOP1 9.5 ±2.74b 18.4±5.46
b 153.5±7.91
d 70.5±3.86
b 186.6±3.86
c 301.6±4.07
a
SAPOP2 11.3 ±1.86a 24.2 ±2.78
a 269.7±4.82
a 83.8±2.93
a 218.7±3.32
b 259.3±2.88
c
SAPOP3 12.1±1.17a 18.4 ±2.99
b 253.7.±2.93
b 63.5±4.64
c 231.0± 3.46
a 292.4 ±4.30
b
SAPOP4 7.3 ±1.58c 15.2 ±2.03
c 193.2±3.36
c 46.4±2.62
f 176.7±2.18
d 157.9 ±2.60
e
SAPOP5 7.1 ±0.32c 13.4 ±6.37
cd 147.2±4.45
e 49.6±3.08
e 168. 2±5.37
e 165.7±3.13
d
SOSP 4.1±1.06e 6.5 ±6.204
e 102.7±2.66
g 37.5±2.37
g 100.2 ±2.06
f 157.1±3.00
e
SMGMP 5.3±1.71d 10.9 ±2.44
d 116.9±2.35
f 58.2±1.19
d 92.9 ±2.58
g 148.6±5.85
f

47
3.1.9.2 Iron and zinc solubility of the porridge samples
As for zinc and iron solubility, there were a significant (p < 0.05) differences between samples
(Figures 6 A and B). SAPOP2 had significantly (p<0.05) higher mean scores of 14.5 mg/100g
and 4.7 mg/100g for both Iron and Zinc solubility while SAPOP5 had lower scores of 6.4 and
0.6 mg/100g respectively.
Figure 6: A and B: Iron and Zinc solubility (mg/100g)
(A) Iron solubility of porridge samples
(B) Zinc solubility of porridge samples
3.1.9.3 Flour rate and viscosity
bcd
a
ab abc
cd
d cd
0
4
8
12
16
20
SAPOP1 SAPOP2 SAPOP3 SAPOP4 SAPOP5 SOSP SMGMP
Iro
n S
olu
bil
ity
(m
g/
10
0 g
)
Sample
Iron solubility
b
a
bc
bcd
d
d
cd
0
1
2
3
4
5
6
SAPOP1 SAPOP2 SAPOP3 SAPOP4 SAPOP5 SOSP SMGMP
Zin
c so
lub
ilit
y (
mg
/ 1
00
g)
Sample
Zinc solubility

48
Different flour rates used are shown in (Table 3.6) whereby five flour rates were tried to
determine the flour rate which could produce porridge with acceptable viscosity (2500-3000cP).
Among the flour rates tried 300 g and 350 g produced acceptable viscosity for child feeding.
Therefore, 350 g was selected to be used as the flour rate in this study.
Table 3.6 1: Flour rates and viscosities of porridge samples
Sample Flour rate (g) Viscosity (cP)
Formulated flour 200 1950
250 2179
300 2786
Control groups
1
2
*350
400
350
350
3043
4500
4658
6598
Viscosity measurements were carried out at 50°C.
3.1.9.4 Energy contents
Table 3.7 shows the contribution of carbohydrate, protein and fat to the energy content of the
porridge. The energy content was calculated by using the Atwater general factor system which is
based on the heats of combustion of protein, fat and carbohydrate. The energy values used are
4.0 Kcal/g for protein, 9.0 Kcal/g for fat and 4.0 Kcal/g for carbohydrate.

49
Table 3.7 1: Energy contribution from protein, fat and carbohydrate
SAPOP1-5= Formulations SOSP and SMGMP= References
Sample Protein
(g)
Fat
(g)
Carbohydrate
(g)
Energy
(kcal/100g
% E from
protein
% E from
fat
% E from
CHO
Total
energy
SOSP 1.4 1.6 11 64 8.75 22.5 68.75 100
SMGMP 1.6 2.1 4.2 42.1 15.20190024 44.8931116 39.90498812 100
SAPOP1 4.4 0.7 15 83.9 20.97735399 7.50893921 71.51370679 100
SAPOP2 4.3 0.6 11.2 67.4 25.51928783 8.01186944 66.46884273 100
SAPOP3 3.8 0.9 12.8 74.5 20.40268456 10.8724832 68.72483221 100
SAPOP4 2.7 0.9 13.4 72.5 14.89655172 11.1724138 73.93103448 100
SAPOP5 3.1 1.2 11.9 70.8 17.51412429 15.2542373 67.23163842 100

50
Table 3.8 shows the expected amount of the nutrients that will be available in the porridge when
100 ml of each of the porridge will be consumed. SAPO1 had higher 117.61 Kcal and 3.19 g of
energy and protein densities, SAPO4 had highest beta-carotene density of 56.11µg while SAPO2
had highest densities of 14.5 and 4.7 mg for both iron and Zinc respectively.
Table 3.8 1: Nutrient density of 100ml of the formulated porridge
Sample Energy
density(Kcal)
Protein
density(g)
Vitamin A
density(µg)
Iron
density(mg)
Zinc
density(mg)
SAPO1 117.61 3.19 45.99 7.5 2.5
SAPO2 115.97 3.17 43.16 14.5 4.7
SAPO3 109.43 2.13 47.94 11.2 2.7
SAPO4 108.71 1.11 56.11 9.9 1.5
SAPO5 109.31 3.11 53.51 6.0 0.6
3.1.9.5 In vitro protein digestibility
The in vitro protein digestibility for flour and porridge samples which represent the available
protein for body`s nourishment when this porridge is consumed is shown in Table 14.
Formulated products had higher in vitro protein digestibility than control groups.
Table 3.9. 1: In vitro protein digestibility of flour samples
Sample % In vitro protein digestibility
SAPOF1 99.8±0.007a
SAPOF2 99.8±0.021ab
SAPOF3 99.8±0.064a
SAPOF4 99.9±0.010a
SAPOF5 99.8±0.035ab
SMGMF 93.9±0.007c
SOSF 90.9±0.014d
Means in each column with different superscripts are significantly different (P<0.05). SAPOF1-SOSF= flours

51
Table 3.9. 2: In vitro protein digestibility of porridge samples
Sample % In vitro protein digestibility
SAPOP1 99.8±0.000ab
SAPOP2 99.8±0.014b
SAPOP3 99.8±0.173a
SAPOP4 99.8±0.007ab
SAPOP5 99.8±0.014b
SMGMP 92.9±0.007c
SOSP 90.9±0.014d
Means in each column with different superscripts are significantly different (P<0.05) SAPOP1-
SOSP=Porridges

52
3.1.9 DISCUSSION
3.1.9.1 Proximate composition
The significant (P<0.05) difference observed in moisture content between samples could be
associated with differences in ingredient rations among formulations. The observed difference in
moisture contents between formulations and references predicts the shelf life of this flour. This
means that, formulations with lower 4.9% moisture content will be having longer shelf life than
that with 8.4% since high moisture content encourages microbial growth. Even though the
moisture content in reference flours was high, it is still within the recommended limit (below the
maximum limit of 15%) as reported by Victor et al., (2013) and WFP, (2012).
The significant higher (P<0.05) protein content reported in formulations compared to control
groups was associated with addition of amaranth grains and pumpkin seeds. The observed
variation in protein within formulations could be due to differences in soybean ratio, as the
protein content decreased with decreased soybean ratio. The highest 5.3% protein content in
SAPOF1 could be due to its higher amount of soybean compared to other formulations. This
observation correlates with other studies by Dixit etal.,(2011) and Laswai et al., (2010) that
showed the contribution of soybean of up to 38% of protein in foods. The reported variation in
protein within formulations was also attributed by amaranth grains. The increase ratio of
amaranth grain in SAPOP5 led to increased 3.1% of protein contents than in SAPOP4 with 2.7%.
This observation is similar to the results found by Olamide, (2015); Muyonga et al. (2014) that
showed the amaranth based instant porridge satisfied the protein of up to15g/100 g. The studies
added that consideration of the amaranth grains to the complementary foods at a reconstitution of
only 20% amaranth grain would meet 87.46% protein requirement of children under five years
old. The observed slight decrease in protein content in porridge samples compared to flour could
be associated to partial removal of some amino acids and other indigenous compound as a result
of cooking effect (Hassan et al., 2005; and Rehmanand 2005).
The reported differences in fat content between control groups and formulations as well as within
formulations were associated to soybean ratio, inclusion of amaranth grains and pumpkin seeds.
The significant (p<0.05) higher fat content (24.8%) observed in SAPOF1 could be attributed
higher amount of soybean compared to other formulations. This observation is in line with

53
others studies by Ngozi, et al., (2014) and Ojinnaka et al., (2013) that showed soybean as oil
seed contains a lot of fat (21.7%), and explained that the higher the inclusion of soybean flour
the higher the fat content of the products. They added that protein and fat levels in formulations
are increased with the increased ratio of soybean flour. The observed results also agreed with the
study done by Solomon (2005) who explained that when vegetable oils were included in infant
and children foods they not only increased energy density, but also fat which is a transport
vehicle for fat soluble vitamins. The reported range of 12.8%-24.8% fat content in the
formulations was less than the recommended values of 30% - 45% fat which should be supplied
by complementary foods for its contribution to total energy requirement for children aged 6-24
months (Brown and Dewey, 2003). The results also revealed the decreased fat content within
formulations was associated with the decrease of soybean ratio.
The higher ash content for formulations of 3.1, 3.5 and 3.2 for SAPOP2, SAPOP3 and SAPOP4
respectively were above the recommended level of 3% (WPF, 2012). The observed high ash
content could be associated with the increased ratio of pumpkin seeds in those formulations and
implies the availability of higher minerals contents in those formulations since ash content
reflects mineral content of the products These findings are similar to a study by Hamed et al,
(2008) which showed the higher ash content of 9.04 and 8.78 for both unroasted and roasted
pumpkin seeds respectively.
The carbohydrate contents observed in formulations and control groups could be associated with
the differences in ingredients and ingredient ratio used. Carbohydrate content was increasing as
the ratio for amaranth grains, pumpkin seeds and orange fleshed sweet potato were increasing.
This observation correlated with other studies by Waized et al. (2015) Muyonga et al. (2014 and
Revathy and Sabitha (2013) on amaranth grains, pumpkin seeds and orange fleshed sweet potato
that reported the contribution of these foods to the carbohydrate content.
3.1.9.2 Beta carotene and Vitamin C
The significant variation in Vitamin A (beta carotene) between formulation and control groups
and specifically higher value of 232.5 µg/100g in SAPO4 could be ascribed to its highest ratio of
orange fleshed sweet potato compared to other formulations. This effect was expected because
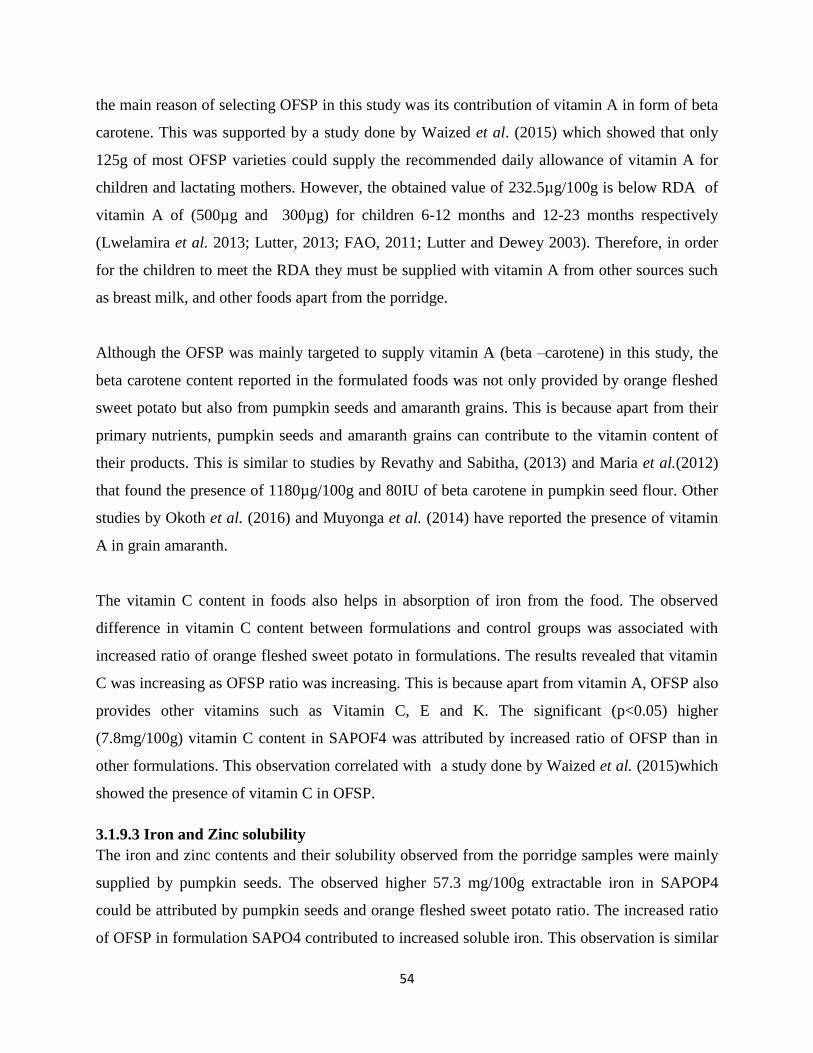
54
the main reason of selecting OFSP in this study was its contribution of vitamin A in form of beta
carotene. This was supported by a study done by Waized et al. (2015) which showed that only
125g of most OFSP varieties could supply the recommended daily allowance of vitamin A for
children and lactating mothers. However, the obtained value of 232.5µg/100g is below RDA of
vitamin A of (500µg and 300µg) for children 6-12 months and 12-23 months respectively
(Lwelamira et al. 2013; Lutter, 2013; FAO, 2011; Lutter and Dewey 2003). Therefore, in order
for the children to meet the RDA they must be supplied with vitamin A from other sources such
as breast milk, and other foods apart from the porridge.
Although the OFSP was mainly targeted to supply vitamin A (beta –carotene) in this study, the
beta carotene content reported in the formulated foods was not only provided by orange fleshed
sweet potato but also from pumpkin seeds and amaranth grains. This is because apart from their
primary nutrients, pumpkin seeds and amaranth grains can contribute to the vitamin content of
their products. This is similar to studies by Revathy and Sabitha, (2013) and Maria et al.(2012)
that found the presence of 1180µg/100g and 80IU of beta carotene in pumpkin seed flour. Other
studies by Okoth et al. (2016) and Muyonga et al. (2014) have reported the presence of vitamin
A in grain amaranth.
The vitamin C content in foods also helps in absorption of iron from the food. The observed
difference in vitamin C content between formulations and control groups was associated with
increased ratio of orange fleshed sweet potato in formulations. The results revealed that vitamin
C was increasing as OFSP ratio was increasing. This is because apart from vitamin A, OFSP also
provides other vitamins such as Vitamin C, E and K. The significant (p<0.05) higher
(7.8mg/100g) vitamin C content in SAPOF4 was attributed by increased ratio of OFSP than in
other formulations. This observation correlated with a study done by Waized et al. (2015)which
showed the presence of vitamin C in OFSP.
3.1.9.3 Iron and Zinc solubility
The iron and zinc contents and their solubility observed from the porridge samples were mainly
supplied by pumpkin seeds. The observed higher 57.3 mg/100g extractable iron in SAPOP4
could be attributed by pumpkin seeds and orange fleshed sweet potato ratio. The increased ratio
of OFSP in formulation SAPO4 contributed to increased soluble iron. This observation is similar

55
to the study done by Christide et al.(2015) which found that Orange fleshed sweet potato based
complementary foods had more bio- available iron. The observed range (27.9 to 57.3 mg/100g)
of iron solubility in porridge samples were higher than the amount of iron (7 mg) which is
required for daily supply to children aged 6-24 months. This range is also higher than
17.3mg/100g found in a pumpkin seed flour, reported by Hassan et al., (2008). The range also
differed from 4.5mg/100g reported by Glaml et al. (2005); and 10.9 mg/100g reported by El-
Adawy and Taha (2001). This variation is attributable to ingredients used, varieties of foods used
as well as processing methods used.
The reported high (4.7 mg/100g) zinc solubility in SAPOP2 compared to (0.6 mg/100g) in
SAPOP5 is contributed by the increase of pumpkin seed ratio. This is because SAPO2 had a
higher pumpkin seed ratio compared to other formulations. The decreased zinc extractability in
SAPOP5 was related to the decrease ratio of pumpkin seeds. The observed high mean score of
zinc extractability in this study was 4.7 which is higher than the recommended daily allowance
of 3 mg of zinc needed for children of 6-24 months. The observed score was also higher
compared to 3.7 mg/100g reported by Echessa et al. (2013).
The observed differences in mineral extractability in this study and that of other studied might
be contributed by ingredients used, plant varieties, processing methods as well as total mineral
content after processing (Hassan et al., 2008). Also it is similar to studies by Singh et al. (2007)
and Alonso et al. (2001) that extrusion cooking process improved mineral bioavailability in the
products by reducing other factors that inhibit absorption of minerals. Therefore the observed
higher ranges of iron and zinc extractability in this study can also be associated with an effect of
extrusion cooking method involved.
3.1.9.4 Flour rate and viscosity of porridge
Viscosity is an important aspect to be considered in infant feeding since it determines the
nutrient intake of the food and even affect taste intensity of the food (Mburu et al., 2011).
Although the same amount of water was used for control group and formulated flour, the control
group porridge samples attained higher 4658cP and 6598cP than recommended viscosity for
infant feeding. This could be attributed to the use of cereals as main or part of ingredients in
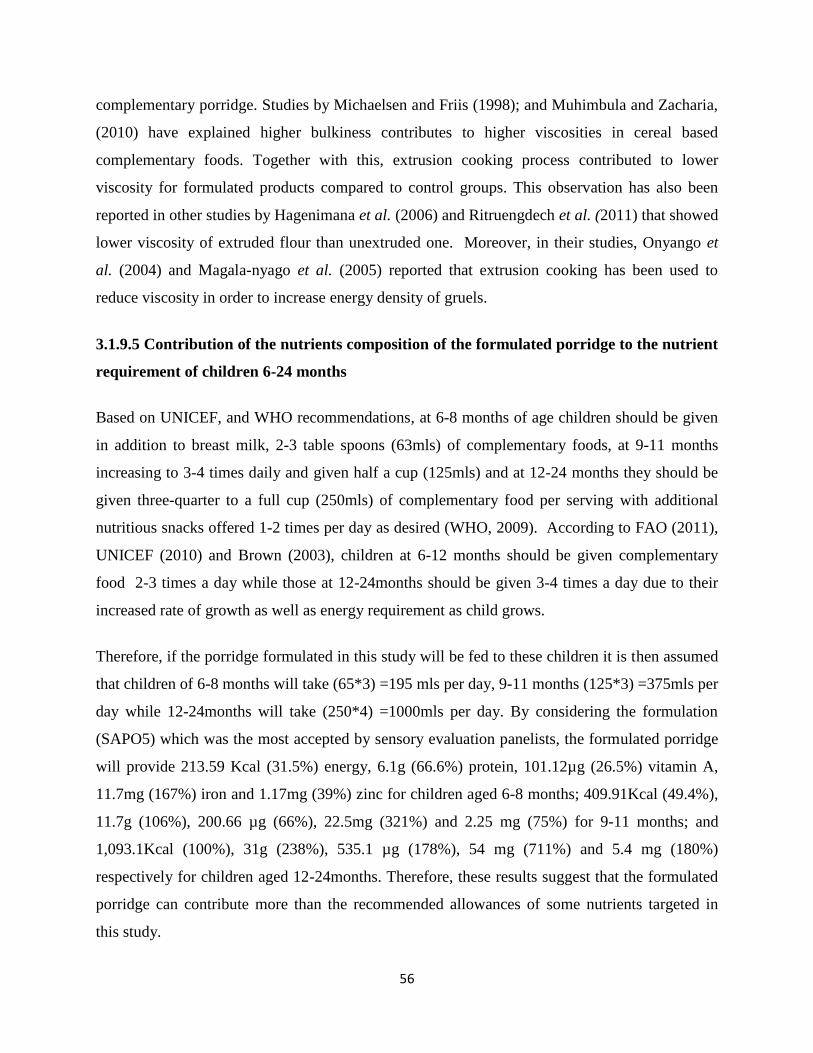
56
complementary porridge. Studies by Michaelsen and Friis (1998); and Muhimbula and Zacharia,
(2010) have explained higher bulkiness contributes to higher viscosities in cereal based
complementary foods. Together with this, extrusion cooking process contributed to lower
viscosity for formulated products compared to control groups. This observation has also been
reported in other studies by Hagenimana et al. (2006) and Ritruengdech et al. (2011) that showed
lower viscosity of extruded flour than unextruded one. Moreover, in their studies, Onyango et
al. (2004) and Magala-nyago et al. (2005) reported that extrusion cooking has been used to
reduce viscosity in order to increase energy density of gruels.
3.1.9.5 Contribution of the nutrients composition of the formulated porridge to the nutrient
requirement of children 6-24 months
Based on UNICEF, and WHO recommendations, at 6-8 months of age children should be given
in addition to breast milk, 2-3 table spoons (63mls) of complementary foods, at 9-11 months
increasing to 3-4 times daily and given half a cup (125mls) and at 12-24 months they should be
given three-quarter to a full cup (250mls) of complementary food per serving with additional
nutritious snacks offered 1-2 times per day as desired (WHO, 2009). According to FAO (2011),
UNICEF (2010) and Brown (2003), children at 6-12 months should be given complementary
food 2-3 times a day while those at 12-24months should be given 3-4 times a day due to their
increased rate of growth as well as energy requirement as child grows.
Therefore, if the porridge formulated in this study will be fed to these children it is then assumed
that children of 6-8 months will take (65*3) =195 mls per day, 9-11 months (125*3) =375mls per
day while 12-24months will take (250*4) =1000mls per day. By considering the formulation
(SAPO5) which was the most accepted by sensory evaluation panelists, the formulated porridge
will provide 213.59 Kcal (31.5%) energy, 6.1g (66.6%) protein, 101.12µg (26.5%) vitamin A,
11.7mg (167%) iron and 1.17mg (39%) zinc for children aged 6-8 months; 409.91Kcal (49.4%),
11.7g (106%), 200.66 µg (66%), 22.5mg (321%) and 2.25 mg (75%) for 9-11 months; and
1,093.1Kcal (100%), 31g (238%), 535.1 µg (178%), 54 mg (711%) and 5.4 mg (180%)
respectively for children aged 12-24months. Therefore, these results suggest that the formulated
porridge can contribute more than the recommended allowances of some nutrients targeted in
this study.

57
3.1.10 In vitro protein digestibility
In vitro protein digestibility (IVPD) has been reported to be nearer to true digestibility as it is
usually used as a quicker and convenient alternative to know in vivo protein digestibility (Adam
et al., 2015). Despite the results revealing insignificant difference of in vitro protein digestibility
between flour and porridge, flour had higher values than porridge. The slight decrease of in vitro
protein digestibility observed in porridge samples could be attributed with cooking effect. The
reduction of in vitro protein digestibility resulted from heat processing might be attributed to
amino acid degradation, formation of intramolecular disulfide bonds and maillard reaction as
changes associated with heat processing (Muyonga et al., 2014). This observation is different
from a study by Shimelis and Rakshit, (2007) who reported increased in vitro protein
digestibility after cooking.
On the other hand, the observed values of in vitro protein digestibility in the current study were
higher than those reported by Nkundabombi, et al. (2015); Anigo et al. (2010) and Ali et al.
(2009). This indicates that when this product will be consumed, there will be more available
protein for nourishing the body.The increased in vitro protein digestibility reported in this study
could be attributed to processing methods like germination, roasting, sprouting and extrusion
cooking involved which may be not only due to removal or reduction of anti-nutrients, but also
may be attributed to breakdown of the native protein structure, including enzyme inhibitors and
lectins; differential solubility of oligosaccharides and their diffusion rates; and phytase activity to
break down phytic acid in the seeds which then leads to an increased in vitro protein digestibility
Shimelis and Rakshit 2007) and (Prakrati et al.,(1999).
3.1.11 Conclusion
Based on the targeted nutrients of interest in this study results showed that, Soybeans and
amaranth grains contributed to high energy and protein densities, OFSP contributed to high beta-
carotene density, while pumpkin seeds contributed to zinc and iron density. In vitro protein
digestibility was higher in all formulations than in reference samples. This proves that,
formulated flour had higher amount of targeted nutrients compared to the reference flours.
Therefore, it can be concluded that, utilization of soybeans, amaranth grains, pumpkin seeds and
orange fleshed sweet potato can help in improving energy, protein, vitamin A, iron and zinc

58
contents of the complementary porridges used in Tanzania. In adopting these ingredients in
complementary feeding, a great care should be taken on the implications of excess intake of
proteins, vitamin A, iron and Zinc.

59
3.2 Sensory properties, consumer acceptability and shelf life stability of nutrient dense
porridge made from locally available foods for infants in Tanzania
Abstract
Complementary foods in most of developing countries including Tanzania are based on cereals,
tubers and traditional foods like plantains, yams and cassava. Other nutrient dense foods that can
be incorporated in complementary feeding are locally available but are underutilized due to un
awareness among people on their nutritional contribution in complementary foods. Different
approaches of utilizing the locally available nutrient dense foods are needed so as to offer
communities’ opportunities to feed their children nutrient dense foods based on locally available,
low costs, easily adopted as well as of highly acceptable attributes foods. This study utilized
soybeans, amaranth grains, pumpkin seeds and orange fleshed sweet potato to formulate nutrient
dense porridge, assess its sensory properties, consumer acceptability and shelf stability. Seven
porridge samples, five formulations (SAPO1-5) and two control groups (SOSP and SMGMP)
were evaluated for their acceptability using seven point and nine point hedonic scales as well as
for quantitative descriptive analysis using 1-10 scale. Although all porridge samples were found
acceptable, SAPO5 was the most accepted. Attributes color hue, aroma, sweetness and oiliness
were the key drivers to consumer liking of the product. All attributes scores for all formulations
decreased with increased storage time. SAPO1 had shortest ( 22 and 23days) shelf life compared
to SAPO5 ( 63 and 85days) for linear and Arrhenius equations respectively. It was concluded
that SAPO5 could be recommended for the adoption of this product since its ingredients
proportions provided the most accepted product and of the longer shelf life.
Key words: shelf life, consumer acceptability, quantitative descriptive analysis
60
3.2.1 Introduction
Soybean, amaranth grains, pumpkin seeds and orange fleshed sweet potato are foods which are
locally produced in Tanzania for their different uses. These foods have been produced and
utilized in different food products in the world due to their substantial contribution to the nutrient
requirements (Okothet al, 2016; Waized et al., 2015; Revathy and Sabitha 2013 and Laswai and
Kulwa, 2010). These foods can be utilized in complementary feeding and provide a nutrient
dense food with acceptable attributes. Notwithstanding their richness in different nutrients, these
foods are not being well utilized in different recipes so as to contribute in combating the problem
of malnutrition in children.
Soybean can supply protein as well as some micronutrient which has made it to be used in
complementary feeding as it was reported in findings by Ojinnak et al., (2013) Laswai and
Kulwa, (2010); Anigo et al., 2010 and Mosha et al.(2000). Most of homemade complementary
foods in Tanzania lack adequate nutrients like energy, protein, vitamin A, zinc and iron which
are essential for child growth and development. There are plenty of locally available nutrient
dense foods such as pumpkin soybeans, orange fleshed sweet potato, pumpkin seeds and
amaranth grains which can be incorporated in complementary foods and supply the food with
acceptable sensory attributes as well as the required nutrients to children.
The utilization of orange fleshed sweet potato as a source of vitamin A and energy has been of
great significance in Tanzania and other African countries (Waized et al., 2015). Its inclusion in
complementary foods in Tanzania will help in improving energy content of homemade
complementary foods as well as fighting against vitamin A deficiency. Pumpkin seeds are known
for its medicinal and nutritive components as they contribute in minerals protein and fat in foods
( Revathy and Sabitha, 2013 and Hamed et al., 2008). The addition of pumpkin seeds in
complementary feeding will help in supplying minerals in complementary foods as well as
improving the protein, energy and vitamin status of foods. Together with these, amaranth grains
will supply protein of high quality as well as vitamins and energy when incorporated in
complementary foods (Okoth et al., 2016 and Muyonga et al.,2014).
Sensory evaluation is a scientific method that suggests measures and interprets responses to food
products through sight, touch, smell and taste (Learning and Choi, 2014). In this study, sensory
properties of the formulated porridge will be affected by both ingredients and processing

61
methods involved. Attribute aroma is mostly contributed by extrusion cooking and roasting
method, sweetness is improved by inclusion of ingredients like orange fleshed sweet potato,
oiliness by inclusion of soybeans, amaranth grains and pumpkin seeds while color/ hue is
contributed by both roasting method and orange fleshed sweet potato as an ingredient. When all
these attributes are improved, they will contribute in driving consumers towards liking and
accepting the product. In order to know the consumer liking of the product in relation to its
sensory attributes, the quantitative descriptive analysis the type of sensory evaluation should be
conducted so as to know which attributes drove consumers in liking a particular product.
Based on their nutrients contribution in growth and development of children, this study aimed at
utilizing these foods to develop a nutrient dense complementary porridge and assess its sensory
properties through quantitative descriptive analysis and consumer acceptability through hedonic
scale as well as studying its shelf life stability.
3.2.1.2 Objectives
3.2.1.3 Specific objectives
1. To assess sensory properties and consumer acceptability of the orange fleshed sweet
potato-based complementary porridge.
2. To assess the shelf life stability of the formulated flours.
3.2.2 Materials and method
3.2.2.1 Study area
This study was conducted at Sokoine University of Agriculture in Morogoro, Tanzania. Solar
drying of crops and product development were carried out at Solar Tunda Project premises while
sensory analyses activities were carried out at Department of Food Technology, Nutrition and
Consumer sciences laboratory.

62
3.2.2.2 Materials
Fresh orange fleshed sweet potatoes were purchased from farmers in Arusha, pumpkin seeds,
Soy beans, amaranth grains, ingredients and materials were purchased from Morogoro market,
Tanzania.
3.2.2.3 Research designs
A complete Randomized Design (CRD) was carried out whereby different formulations were
considered as the principal factor. The effect of principal factor on sensory properties and
consumer’s acceptability was determined.
3.2.2.4 Formulations development
Fourteen formulations were developed using Nutrisurvey (2007) software. However, only five
formulations with at least half of the targeted amount of the nutrients of interest in the study were
taken (Table 1).
Table 3.10 1: Various formulations used in the study
Soy
bean
(%)
Amaranth
Grain
(%)
Pumpkin
seeds
(%)
OFSP
(%)
Energy
(Kcal)
Protein
(g)
Vitamin
A (µg)
Iron
(mg)
Zinc
(mg)
SAPO1 50 20 25 5 370.2 26.7 476.7 8.6 2.8
SAPO2 40 20 30 10 393.8 27.2 478.6 8.9 3.0
SAPO3 30 35 20 15 408.1 26.1 472.4 9.4 3.6
SAPO4 25 25 20 30 426.0 29.4 488.6 8.9 2.8
SAPO5 20 40 15 25 292.8 25.3 2120.5 6.6 3.0
SAPO1= 50%soybean, 20% amaranth grain, 25% pumpkin seeds 5% Orange Fleshed Sweet Potato SAPO2= 40%soybean, 20%
amaranth grain, 30% pumpkin seeds 10% Orange Fleshed Sweet Potato SAPO3=30%soybean, 35% amaranth grain, 20%
pumpkin seeds 15% Orange Fleshed Sweet Potato SAPO4=25%soybean, 25% amaranth grain, 20% pumpkin seeds 30% Orange
Fleshed Sweet Potato SAPO5=20%soybean, 40% amaranth grain, 15% pumpkin seeds 25% Orange Fleshed Sweet Potato
3.2.2.5 Porridge preparation
Seven different porridge samples, five from developed formulations and two control groups were
prepared by mixing 300g of flour in 1500ml of boiling water. The mixtures were constantly
stirred for about 15 minutes, and then 30g of sugar was added to the ready porridges.

63
3.2.3 Sensory evaluation
3.2.3.1 Quantitative descriptive analysis (QDA)
Quantitative Descriptive Analysis is one of the useful and informative types of sensory
evaluation test. It gives quantitative description of products based on sensory properties. QDA
helps in providing the answers of what is the nature and magnitude of differences between tested
samples. Together with consumer test data, QDA shows which attributes of the tested samples
drove consumers towards liking of the particular sample. In this study, QDA test was conducted
at Food technology laboratory using 20 trained judges. Judges were selected and trained
according to ISO standard (1993) for four days, whereby they developed and agreed on six
descriptors which were hue, aroma, sweetness, thickness, grittiness and oiliness (Table 2). They
also developed and agreed on a ten point line scale (1= no or low intensity while 10 for high
intensity) to quantify the magnitude of the sensory attributes. The samples to be tested were
coded with 3-digits random number and served to each judge in small containers and were asked
to rate the samples based on references agreed and by using the scale developed during training.
All principles of good sensory practices such as coding, randomization and rinsing of the mouth
were observed.
After four days of training, a pre- test study was carried out so as to test the effectiveness of the
training before the actual test. The actual test was carried into two sessions whereby after one
session judges were given a break of 30 minutes before the second session. The aim of these two
sessions was to test the reproducibility of the judges as it is required in QDA study. For judges 6
out of 20 deviated very much from their first answers of the first session and were removed from
the list while 14 who were able to reproduce high percent of their answers, their data were
considered for analysis.

64
Table 3.11 1: Attributes, references and anchors developed in quantitative descriptive
analysis panel training
Attribute Definition Reference Anchors
Color Color hue
Color intensity
Brownish; anything associated
With brownish
Clear, strong color
Low to high
Low to high
Aroma
Aromatic
Cooked aroma
Porridge aroma
Sweetness Sweetness intensity
The sweetness associated with
sucrose solution
Not sweet to
very sweet
Thickness
Porridge viscosity
The thickness associated with
Honey viscosity
Not viscous to
very viscous
Grittiness
Oiliness
Mouth feel of the
porridge
Particles present in
the porridge
Presence of visible
oil in the porridge
Presence of chewable particles in
The porridge
Oily feel in the mouth
Low to high
Not oily to very
oily

65
3.2.3.2 Consumer acceptability of the porridge
In this study we used mothers (with children of 6-23 months) and students in assessing the
acceptability of the formulated porridge from both groups. According to studies by Ruwaida et
al., (2016); Guilermo et al., (2005) and Chamber and Wolf, (1996), a number of consumer size
can vary depending on experimental design as well as economic situation. The accepted
consumer size for acceptance / preference test is 50 and above. From this study, a panel of 76
people including mothers, and students were involved. Students were involved so as to provide
more details about the sensory properties of the porridge while mothers and non- teaching staff
were involved to simply say if their children could like the porridge. With mothers seven points
hedonic scale where 1= dislike extremely through 4= neither like nor dislike and 7= like
extremely was used according to their level of understanding, while with students a nine points
hedonic scale with 1= dislike extremely through 5= neither like nor dislike to 9= like extremely
was used because they could tell the differences even when wide scale was used. The samples
were coded with 3 digits random number and served to each panelist. Water was given to every
panelist so as to rinse their mouth so as to avoid taste interference
3.2.4 Storage stability studies
Shelf life of the formulated flours was assessed by analyzing the moisture content, free fatty
acid, peroxide value and sensory properties at different storage conditions and times. The flour
was packed in polythene bags and stored at room temperature and others in the oven at 45˚C and
35˚C as recommended for acceleration condition to be at least above ( > 15 ˚C) from room
temperature so as to speed up the deterioration reaction. Two temperatures of 45˚C and 35˚C
were used in case of weather condition fluctuation whereby the constant temperature was
considered in deciding the acceleration condition. For these results 45˚C was selected. Samples
were removed at intervals of one week during storage and analyzed for the mentioned
parameters. For every week of storage, porridge was made from the stored flour and subjected to
sensory analysis by another consumer panel consisting of 16 male and female university students
(semi-trained) pursuing Bachelor of Science degree in Food science and technology. A nine
points hedonic scale with values ranged from 1 (dislike extremely) through 5 (neither like nor
dislike) to 9 (like extremely) was used. Samples were served to consumers at 70 0C (for them to
be able to tell the real thickness of the porridge) at around 10: 00am hour and panelists were

66
asked to express their degree for liking sensory attributes which were appearance, viscosity,
aroma, taste and general acceptability. All principles of good sensory practices were observed.
3.2.4.1 Determination of Peroxide Value (PV)
In determining peroxide value, 5g of the sample was warmed in water bath at 400C for 45
minutes. The sample was then mixed with 25ml of solvent mixture (Acetic acid: chloroform) and
1g of solid potassium iodide in a boiling test, and heated in a boiling water bath for 30 seconds.
The heated content was then poured into 100ml conical flask and against standardized 0.002M
sodium thiosulphate using starch solution as an indicator until blue black color disappeared. The
Peroxide value was calculated using Equation (i)
Peroxide value (meq/Kg) = (A-B) ×N ×1000 Equation (i)
Weight of sample taken (g)
Where; A= Volume of Na2S2O3 used for sample, B= Volume of Na2S2O3 used for blank C=
Normality of Na2S2O3.
3.2.4.2 Acid value (AV) as free fatty acids (FFA)
Free fatty acid in the sample was determined by dissolving 5g of the water bath warmed sample
at 400C for 45 minutes in 20ml of 5% diethyl ether in alcohol. The mixture was titrated against
0.1M sodium hydroxide using phenolphthalein indicator until pink color appeared. Equation (ii)
was used for calculating the acid value.
Acid value in mg NaOH/g = (V1-V2) ×0.004g/ml × Extraction vol. (ml) ×1000 Equation (ii)
Sample weight (g)
3.2.4.3. Predictive models
The 10 Mill equivalent/kg (mEq/kg) was used as a limit for extruded products to solve equations
(y=0.363x+0.02; y= 10mEq, x= days) that were given from peroxide value (at 45 0C) against
storage time graphs. Another graph was created (log ts versus 1/T (K)) (y=2276x-5.9506)
whereby the “X” value from the equation was (28 + (273)) which was a room temperature in
Kelvin and y was estimated days. These were the equations used to estimate shelf life (days) of
the formulated four samples.

67
3.2.5 Statistical data analysis
Data were analyzed by using R software (R Core Team) for two way analysis of variance to
determine the significant differences between samples at p<0.05. Means were separated by
Tukeys Honest significant difference at p<0.05. Principal component analysis (PCA) was done
by Panel Check software to assess systematic variations between variables.
3.2.6 Results
3.2.6.1 Quantitative Descriptive Analysis
The mean intensity scores of samples differed significantly (p<0.05) with the developed
formulations having higher values for aroma (5.4 to 5.6), Hue (5.1 to 7.0), sweetness (5.3 to 5.6)
and oiliness (4.2 to 4.6) than references with respective values of (3.9 to 4.4 ), (4.4 to 4.6), (4.8 to
5.3) and (2.3 to 2.6). The variation between formulations was also significant. On the other hand,
the references had significantly higher thickness score of (8.1) and grittiness of (6.2) than
formulated samples (SAPOs) with lower values of (4.5 to 5.3) and (3.1 to 4.4) respectively as
shown in Table 3.12.
Table 3.12 1: Mean intensity scores of porridge samples by sensory panel
Sample Aroma Hue
(brownish)
Thickness Grittiness Sweetness Oiliness
SAPO1 5.4± 1.67a 5.6 ±1.45
b 4.8±1.41
bc 4.4±1.31
c 5.3±1.75
ab 4.2±1.98
a
SAPO2 5.6 ± 1.47a 5.1 ±1.46
bc 4.5±1.35
b 3.3±0.90
d 5.5±1.75
ab 4.6±1.98
a
SAPO3 5.6±1.67a 7.0 ±1.44
a 5.3±1.44
b 3.5±1.23
d 5.6±1.63
a 4.3±1.92
a
SAPO4 5.5 ±1.20a 6.9±1.76
a 5.0±1.55
bc 3.1±1.33
d 5.6±1.52
a 4.2±1.89
a
SAPO5 5.6±1.23a 6.9±1.086
a 5.3±1.46
b 3.7±1.46
cd 5.5±1.29
ab 4.2±1.85
a
SOS 4.4 ± 1.49b 4.4 ±0.95
c 8.4±0.83
a 6.9±1.33
a 5.3±1.68
ab 2.6±1.25
b
SMGM 3.9±1.53b 4.6±1.6
c 8.2±0.83
a 5.6±1.23
b 4.8±1.92
b 2.3±1.25
b
Means bearing different superscript on the same column are significant different (P<0.05). Samples SAPOP1-SAPOP5
are complementary porridges made from formulated flours while SOSP and SMGMP are references (N=14).

68
The bi-plot of principal component analysis shows that, PC 1 accounts for 87.2% of the variation
and it was a distinction between SAPOs and control samples (SOS and SMGM) while PC 2
accounts for 10% of the variations and it was a contrast between SAPO 1 an 2 on one side and
the rest of the samples. SAPO 1 and 2 were closely associated with aroma and oiliness attributes
while SAPO 3, 4 and 5 were closely associated with hue and sweetness. Reference samples were
associated with thickness and grittiness (Figure 7).
Figure 7: Bi-plot of PCA showing association between samples and attributes
3.2.6.2 Consumer acceptability
There was a significant (p<0.05) difference in acceptability of the porridge. Acceptability scores
of the porridge for mothers ranged from 4.5 to 6.0 while with students ranged between 5.3 to 7.4
as shown in (figure 7). Mothers showed a significant (p<0.05) difference in acceptability
between SAPO 1, 2 and 3 on one side and the rest of the samples on the other sides with the
latter having higher values of 5.1, 6.0, 5.9, and 5.7 than the former with values of 4.5, 4.5,and
4.5. Contrary, the students showed a variation between samples with all SAPOs having higher
hedonic values of 7.1, 6.9, 7.2, 7.0, and 7.4 than reference samples with value of 6.3 and 5.3 as
shown in figure 8.

69
Figure 8: Mean hedonic score for porridge samples by mothers and students
Consumer acceptability of the porridge
7.1 6.9 7.2 7 7.46.3
5.3
0
2
4
6
8
10
SAPO1 SAPO2 SAPO3 SAPO4 SAPO5 SOS SMGM
Mea
n he
doni
c sc
ore
Sample
ab ab ab ab c
STUDENTS
ab
4.5 4.5 4.5 5.16 5.9 5.7
0
2
4
6
8
SAPO1 SAPO2 SAPO3 SAPO4 SAPO5 SOS SMGM
Mea
n he
doni
c sc
ore
Sample
Hedonic score
aba
a a
MOTHERS
b b b
Samples SAPOP1-SAPOP5 are complementary porridges made from formulated flour while SOS and SMGM are
references. SOS=Sorghum, Orange fleshed sweet potato and soybean. SMGM= Soybean, maize, groundnuts and
millet. 1= like extremely, 2=like very much, 3 =like moderately, 4=like slightly 5= neither like nor dislike, 6=
dislike slightly, 7= dislike moderately, 8= dislike very much 9= dislike extremely
3.2.6.3 Relationship between descriptive data and hedonic liking by PLSR (Preference
mapping)
Figure 9 shows the results from a PLSR using descriptive data as X-variables and liking rated by
the consumers as Y-variables. It shows that majority of consumers fell to the left of the vertical
Y-axis which showed the direction of liking with all formulated samples implying that that they
were all liked by consumers. Furthermore, the formulated samples were positively correlated
with hue, aroma, sweetness and oiliness attributes.

70
Figure 9: shows the direction of liking of the product by consumers.
Figure 9: Correlation loading from partial least squares regression of formulated porridge
samples with descriptive data as X- variables and hedonic rating as Y- variables
3.2.7 Shelf life stability study
3.2.7.1 Predictive models
Table 3.13 shows the predicted shelf life of the formulated flour using Arrhenius equations. The
model showed that shelf life of the formulated flour ranged from 23 to 85 days. The findings
suggest that the storage stability decreased with increase in soybean and pumpkin seeds ratio.

71
Table 3.13 1: Arrhenius shelf life equation, R2 and the estimated shelf life days at 25
0C
Sample Arrhenius equation R2 Estimated shelf life (days)
SAPOF1 Y= -357.84x +2.5646 1 23
SAPOF2 Y= -325.79x +2.544 1 28
SAPOF3 Y= 1704.8x - 4.0955 1 42
SAPOF4 Y= 2863.6x – 7.7878 1 66
SAPOF5 Y= 3752x – 10.66 1 85
3.2.7.2 Sensory properties
Figures 9 (a-e) shows the changes in sensory attributes of the flour which was stores for four
weeks at a temperature of 450C. All sensory properties in all samples tested decreased with
increased in storage time implying that storage time had respective higher reduction in aroma,
texture, taste and acceptability
Figure 10: (a-e) Changes of sensory attributes of the formulated flours during storage
period
(a) (b)
0
3
6
9
1 2 3 4
Mea
n h
edo
nic
sco
re
Time (Week)
Appearance
SAPO1 SAPO2 SAPO3SAPO4 SAPO5
0
2
4
6
8
10
1 2 3 4
Mea
n h
edo
nic
sco
re
Time (Week )
Taste
SAPO1 SAPO2 SAPO3
SAPO4 SAPO5

72
(c) (d)
(e)
3.2.7.3. Free fatty acids
Changes of free fatty acid values of the flour before and after the four weeks of the storage are
shown in figure 10. These results revealed that there was a significant difference in free fatty
acids in the samples before storage and after storage. Free fatty acid values significantly
increased in all samples during storage.
0
2
4
6
8
10
1 2 3 4
Mea
n H
edo
nic
sco
re
Time (Week)
Aroma
SAPO1 SAPO2 SAPO3SAPO4 SAPO5
0
2
4
6
8
10
1 2 3 4
Mea
n H
edo
cnic
Sco
re
Time (Week)
Texture
SAPO1 SAPO2 SAPO3
SAPO4 SAPO5
0
2
4
6
8
10
1 2 3 4
Time (Week)
Acceptability
SAPO1 SAPO2 SAPO3
SAPO4 SAPO5

73
Figure 11: Free fatty acids of the stored flour samples (4 weeks)
3.2.8 Discussion
3.2.8.1. Sensory properties
The results revealed that SAPO5 was the most accepted by all panelists. The findings showed
that acceptability increased with decrease in soybean. This observation could be associated to the
effect of beany flavor which has been reported to cause low acceptance of soybean based food
products (Laswai et al., 2010). Acceptability was on the other hand affected positively by
amaranth grains ratio as it is shown in (Table 3). The increased ratio of amaranth grains
increased the acceptability as it was observed in SAPO5 which had the highest amaranth grains
ratio and it was the most accepted by both groups. This observation is in line with the findings by
Oladimeji (2015); Muyonga et al. (2014) and Chauhan and Singh (2013) which showed the
higher acceptability of the amaranth grain based food.
3.2.8.2. Aroma
Aroma is an integral part of taste and general acceptability of the food before it is put in the
mouth. It is an important parameter when tasting the sensory attributes of the formulated foods.
The variation observed in aroma could be associated by effect of extrusion cooking and roasting
of soybean and pumpkin seeds. As one of its advantages, extrusion cooking method improves the
aroma of the product (Navale et al., 2015). Therefore the higher mean scores for aroma in
formulated samples compared to references were contributed by extrusion cooking involved.
0.9 0.07 0.04 0.03 0.02
2.04
1.98 1.59 1.53
0.97
0
1
2
3
SAPOF1 SAPOF2 SAPOF3 SAPOF4 SAPOF5
FFA
(%
)
Before
After
* * * *
*

74
This observation is similar to the findings reported by Leszek Moscicki (2011) and
Ramachandra and Thejaswini (2015) that showed the effect of extrusion cooking on improving
the aroma of the extruded product.
3.2.8.3. Color hue
Color hue is an important attribute in food choice as well as acceptability. The variation
observed in hue between formulations and reference samples could be associated with the
ingredients used as well as the effect of roasting and extrusion cooking. Inclusion of orange
fleshed sweet potato in the formulated samples together with extrusion and roasting of the
ingredients used increased the brownish of the formulations. The effect of roasting and extrusion
in this study corresponded with the findings by Navale et al. (2015); Riaz et al. (2007) and Guy
(2001) that showed the impact on color of the roasted and extruded products.
3.2.8.4. Thickness
Thickness is a very important to be considered in complementary porridge because it helps to
determine amount of energy taken. The observed variation in thickness between formulations
and control groups could be attributed to the ingredients used. The higher values observed in
control groups is associated with the use of cereals. This is because the use of sorghum, maize,
millet and other cereals is associated with bulkiness which leads to high thickness as it is also
observed by Muhimbula and Zacharia (2010).
3.2.8.5. Sweetness
No significant (p>0.05) difference in sweetness observed between samples. Nevertheless,
formulations had higher mean scores of sweetness than control groups which could be due to the
inclusion of orange fleshed sweet potato. Moreover, significant (P<0.05) difference in oiliness
between formulations and control groups were connected to the inclusion of soybean, amaranth
grains and pumpkin seeds. This observation is similar to findings by Ngozi et al., (2014);
Muyonga et al., (2014) and Hassan et al. (2008) that show the contribution of fats from soybean,
amaranth grains and pumpkin seeds when included in complementary foods.

75
3.2.9. Relationship between descriptive data and hedonic liking by partial least square
regression
3.2.9.1. Principle component of descriptive analysis of sensory data
The observed positions of samples in Bi- plot of principle component analysis were determined
by a relationship between samples and attributes. The observed similarity of all formulations in
hue, sweetness, aroma and oiliness compared to reference samples as shown by bi-plot of
principal component analysis may be attributed to ingredients used as well as extrusion cooking
effect. Furthermore, the high association of SAPO1 and SAPO2 and aroma and oiliness
attributes could be due to higher ratio of soybean compared to other formulations while the
positive correlation between SAPO3,4 and 5 and sweetness and color hue attributes could be
due to the increased ratio of orange fleshed sweet potato as it is characterized by sweetness and
orange color Table 3.2.
From the preference mapping, color hue, aroma, sweetness and oiliness observed to be the key
attributes that drove the preference of consumers towards the tested samples. Color and
appearance are the preliminary attributes that attract consumers to a food product and hence
considered as guide for a good quality of foods associated with acceptability (Singh, 2014).
3.2.10. Shelf life stability study
This observed decrease of shelf life in SAPO1 and SAPO2 can be related to the high amount of
fats in soybean and pumpkin seeds which then undergoes lipid oxidation in the short period of
storage. The observed results are similar to the one reported by Revathy and Sabitha, (2013)
and Granato et al.(2010) who reported shorter shelf life stability of pumpkin seeds and soybean
flour. Therefore, this suggests that the longer shelf life in SAPOF5 than SAPOF1 could be due to
due to the decreased amount of soybean and pumpkin seeds ratio Table 3.2
Results from figure 9 (a-e) revealed that, all attributes tested, which were appearance, taste,
aroma, texture and acceptability scored lower with increased time of storage. In order to be
considered acceptable, the food product must attain scores above or equal to 5.0 (liked slightly)
when a seven – point hedonic scale is used and 6.0 (liked slightly) when a nine–point hedonic
scale is used. Therefore despite the reduction in sensory attribute scores after four weeks of

76
storage, as presented in Figures 9 (a-e) all attributes tested were within the acceptable ranges as
they scored 6.0 and above with exception of aroma only. The aroma attribute scored slightly
lower compared to the other attributes. This could be associated to effect of oxidation of lipids
which frequently affects aroma and flavor of the product.
The observed increased in free fatty acid values was associated with indicative hydrolysis of
lipids during storage. Free fatty acids (FFA) are the products resulting from the hydrolysis of free
fatty esters. Their presence is associated with hydrolytic rancidity in food products which may
affect the flavor of the product (Evelyn, 2014 and O `Brien, 2008). The observed increase in
FFA in (Figure 10) revealed that higher storage temperature (450C) catalyzed the hydrolysis
reaction which resulted to higher amount of free fatty acids. This observation was similar to that
reported by Akusu and Kibari, (2013) on the effect of storage period on the chemical stability
and sensory properties of the food product. Egan et al. (1981) reported that acidity and rancid
taste often begins to be noticeable in foods when free fatty acid content is about 1.5%. Since the
free fatty acid content increased from 0.03 at week 0 to 2.04% at the fourth week, indicates that
the values of free fatty acid were above the unacceptable limits. Therefore this suggested that the
formulation attained the free fatty acid value of 2.04% could not be safe for use beyond the four
weeks of storage
3.3. Conclusion
Based on the findings, there was a variation in sensory attributes between formulations and
references and within formulations. Roasting method contributed to higher scores in aroma and
hue than other formulated porridges, Orange fleshed sweet potato contributed to sweetness while
soybeans contributed to higher scores of oiliness in all formulations compared to reference
samples.
A formulation with lower ration of soybean but with higher ration of amaranth grains was the
most accepted, and hence it can be recommended for adoption consumption of this product.
Shelf life estimation of the stored flours based on sensory analysis revealed that all sensory
attributes tested except aroma for SAPO3 remained within the acceptable limits (above 6 points)
during four weeks of storage. The regression equations using linear and Arrhenius equations
predicted that, formulation with higher soybean ration had shortest shelf life of 22 and 23 days

77
respectively while the one with lower ration was predicted to have a longest shelf life of 63 and
85 days respectively.
3.4 General conclusion
It can be concluded that, we can formulate a nutrient dense product from locally available foods
which can meet half/ more of the nutrient requirements of children aged 6-24 months. Based on
the nutrients of interest in this study, all ingredients used had a cooperative contribution in
improving the nutritional quality and sensory properties of the formulated product. Soybeans and
amaranth grains contributed to energy and protein densities of the formulations, pumpkin seed
had a great contribution on the iron, Zinc and some protein and vitamins in formulations while
orange fleshed sweet potato contributed to vitamin A (beta carotene). The formulation which was
the most accepted and with a longest shelf life was able to contribute up to recommended
amounts of nutrients and even more than recommended daily allowances for some nutrients to
the requirements of children 6-24 months. Therefore its adoption for complementary feeding is
of great importance since it seems to be good enough to help in reducing malnutrition
contributed by nutritionally poor quality complementary foods. In adopting this formulation, a
great care should be taken on the implications of excess intake of proteins, vitamin A, iron and
Zinc which are associated with health dangers to infants like chances of diabetes, obesity, kidney
failure injury to internal organs and even death. Despite the contribution of energy and protein
from soybeans, it also decreased the acceptability of the product due to its beany- flavor.
3.5 General recommendation
Since results from this study have revealed the significant contribution of the developed product
to the nutrient requirements of children aged 6-24 month, it is therefore recommended that
utilization of soybeans, amaranth grains, pumpkin seeds and orange fleshed sweet potato in
complementary feeding should be promoted to our communities. Also, as one of the strategies of
improving the energy, protein, vitamin A, iron and zinc in complementary foods used in
Tanzania education on the nutrition benefits of these foods in complementary feeding should be
provided to all caregivers.
In vivo mineral bioavailability study should carried out based on the formulation so as to know
the percentage of the available minerals and other nutrients that will be absorbed directly to

78
child`s Gastrointestinal. This will decide whether the formulation needs re- adjustment on
ingredients ratio before it is recommended for infants and young children.

79
Reference
Adinsi, L., Akisso, H., Vieira G., Anihouvi, B., Fliedel, G., and Hounhouigan, J. (2014). Sensory
evaluation and consumer acceptability of a beverage made from malted and fermented
cereal; c se of gowe from benin. Food Science and Nutrition, 3(1): 1-9.
Akusu, M., and Kiin-Kabari DB.(2013). Effect of storage period on selected functional, chemical
stability and sensory properties of bush mango (irvingia Gabonensis) seed flour. Africa
Journal of Food Science and Technology. 4(6): 136-140
Ali, H., Haque, M. M., Chowdhury, M. M. R., & Shariful, M. I. (2009). In vitro protein
digestibility of different feed ingredients in Thai koi ( Anabas testudineus ), 7(1): 205–210.
Anigo, K. M., Ameh, D. A., Ibrahim, S., & Danbauchi, S. S. (2010). Nutrient composition of
complementary food gruels formulated from malted cereals , soybeans and groundnut for
use in North-western Nigeria, 4: 65–72.
AOAC (1990). Official Methods of Analysis, 15th
edition, Washington DC: Association of
Official Analytical Chemists.
Atuonwu, a. C., & Akobundu, E. N. T. (2010). Nutritional and sensory quality of cookies
supplemented with defatted pumpkin (Cucurbita pepo) seed flour. Pakistan Journal of
Nutrition, 9(7): 672–677. http://doi.org/10.3923/pjn.2010.672.677
Bentley M, Stallings R, Fukumoto M, Elder J. (1991).Maternal feeding behavior and child
acceptanceof food during diarrhea episodes, convalescence,and health in the Central
Northern Sierra of Peru. AM J. Pub Health, 83: 1-5.
Black, R. E., C. G. Victora, S. P. Walker, Z. A. Bhutta, P. Christian, M. de Onis, M. Ezzati, S.
Grantham-McGregor, J. Katz, R. Martorell, and R. Uauy. (2013). “Maternal and Child
Undernutrition and Overweight in Low-Income and Middle-Income Countries.” Lancet
382 (9890): 427–451.
Blessing J. Akombi , Kingsley E. Agho, Dafna Merom, Andre M. Renzaho, John J. Hall. (2016).
Child malnutrition in sub-Saharan Africa: A meta-analysis of demographic and health
surveys (2006-2016) https://doi.org/10.1371/journal.pone.0177338. Published: May 11,
2017

80
Brown, A. (2008). Understanding food: Principles and preparation, 3rd
edition. Belmont, CA:
Thompson-Wadsworth.
Brown, K. G. D. and K. (2003). Update on technical issues concerning complementary feeding
of young children in developing countries and implications for intervention programs. Food
and Nutrition Bulletin, 24(1): 5.
C, N. O. I., N, N. N., Ngozi, I., and N, M. A. (2014). Development and nutritional evaluation of
infant complementary food from maize ( Zea mays ), soybean ( Glycine max ) and Moringa
oleifera leaves, 3(4): 290–299. http://doi.org/10.11648/j.ijnfs.20140304.19
Campbell M., Gold. (2009).The amazing pumpkin seed Compiled by CMG Archives
http://campbellmgold.com accessed May 2016.
Cascio J. (2010). Pumpkin seeds. University of Alaska Fairbanks Cooperative Extension
Services in Cooperation with the United States Department of Agriculture.
www.uaf.edu/ces
Caulfield, L. E., Onis, M. De, Blössner, M., & Black, R. E. (2004). Undernutrition as an
underlying cause of child deaths associated with diarrhea , pneumonia , malaria , and
measles 1 – 3, 193–198.
Chauhan, A , and Singh, S. (2013). Influence of Germination on Physico – chemical Properties
of Amaranth (Amaranthus Spp.) Flour. International Journal of Agriculture and Food
Science Technology, 4(3): 215-220.
Christides, T., Amagloh, F., & Coad, J. (2015). Iron Bioavailability and Provitamin A from
Sweet Potato- and Cereal-Based Complementary Foods. Foods, 4(3), 463–476.
http://doi.org/10.3390/foods4030463
Cohen, E. and Saguy, I. (1985).Statistical evaluation of Arrhenius model and its applicability in
prediction in food quality losses.Journal of Food Processing and Preservation, 9: 270-273
Corradin, G. and Peleg, M. (2007).Shelf life estimation from accelerated storage data.Trends in
Food Science and Technology, 18: 37-49.
Creed de Kanashiro H, Penny M, Robert R, Narro R, Caulfield L, Black R.(2001). Improving
infant nutrition through an educational intervention in the health services and the
community. Presentation at the WHO Global Consultation on Complementary Feeding,
Geneva.
81
Dewey KG, Brown K. (2003). Update on Technical Issues Concerning Complementary Feeding
of Young Children in Developing Countries and Implications for Intervention Programs.
Food Nutr. Bull., 24: 5-28.
Dewey, K. (2001). Nutrition, Growth and complementary feeding of the breastfed infant.
Pediatr. Clin. North America, 48: 87-104
Dixit, A. K., Antony, J. I. X., Sharma, N. K., & Tiwari, R. K. (2011). 12 . Soybean constituents
and their functional benefits, 661(2): 367–383.
Duffy V, Bartoshuk L. (2000). Food acceptance and genetic variation in taste .J.Am
Dietassoc.100: 647-655.
Echessa, A. C. P., Nyambaka, H., Ondigi, N., Omuterema, S., and Toili, W. (2013). Variation
of Micronutrients in Pumpkin Fruit Varieties Grown Within the Lake Victoria Basin. Food
Science and Quality Management, 17(10): 71–81.
Egan, H., Kirk, S., Sawyer, R. (1981). Pearson`s Chemical Analysis of Foods, 8th
edn London:
Churchill living stone
El Hassan, N. M., Hamed, S. Y., Hassan, A. B., Eltayeb, M. M., & Babiker, E. E. (2008).
Nutritional evaluation and physiochemical properties of boiled and fried tree locust.
Pakistan Journal of Nutrition, 7(2): 325–329. http://doi.org/10.3923/pjn.2008.325.329
El-Adawy, T.A. and K.M. Taha. (2001). Characteristics and composition of different seed oils
and flour Food Chem 74: 275-284
Emire, S.A, & Arega, M. (2012). Value added product development and quality characterization
Evelyn, O. (2014). Final report on accelerated shelf life eveluation of instant noodles made with
fortfied flour. Food Innovation and Resource Centre, 58 (5): 10-34
Ezzati M. Lopez D. Rodgers A,.(2002). Selected major risk factors and global and regional
burden of disease.Comparative Risk Assessment Collaborating Group.Lancet ;360:1347-
60. [PubMed]
Fao. (2011). Complementary Feeding for Children Aged 6-23 months, 1–41. Retrieved from
http://www.fao.org/docrep/014/am866e/am866e00.PDF
Fellows P. (2000).Food processing Technology. Principles and practices. Woodhead Publishing
Limited. Pg 295-306.

82
Food and Agriculture Organization of the United Nations (FAO). (2004). FAO Statistics.
Retrieved from http://www.apps.fao.org
Forouzanfar, M. H., L. Alexander, H. R. Anderson, V. F. Bachman, S. Biryukov, M. Brauer, R.
Burnett, D. Casey, M. M. Coates, A. Cohen, and K. Delwiche. (2015). “Global, Regional,
and National Comparative Risk Assessment of 79 Behavioural, Environmental and
Occupational and Metabolic Risks or Clusters of Risks in 188 Countries, 1990–2013: A
Systematic Analysis for the Global Burden of Disease Study. Lancet 386 (10010): 2287–
2323.
GibsonS,Ferguson E, Lehrfeld J (2010). Complementary foods for infant feeding in developing
countries: their nutrient adequacy and improvement. Eur. J. Clin. Nutr., 52: 764–770.
Glaml, S.Y., Achlnewhu and Ibaakee C. (2005). The quality and sensory attributes of cookies
supplemented with fluted pumpkin seed flour. Journal of Food Science Tecnology., 40:
613-620
Global Nutrition Cluster. 2016. Who We Are. Accessed, July,2017
http://nutritioncluster.net/gnc/partners/.
Granato, D., Masson, M. L., João, R., & Freitas, S. De. (2010). Stability studies and shelf life
estimation of a soy-based dessert, 2009(003893), 797–807.
Gulla, S. and Waghray, K. (2012).Blending of oils: A case study on storage stability and sensory
characteristics of a ready to eat extruded snack. Journal of Nutrition, Dietetics and Food
Science, 2(1): 1-14
Guillermo Hough, Ian Wakeling, Andrew Mucci, Edger Chamber, Ivan Mendez and Leonardo
Rangel Alves. (2005). Number of consumers necessary for sensory acceptability test. Food
Quality and Preference, 17 (2006): 522-26.
Guy, R. (2001). Extrusion cooking. Technologies and applications. International Journal of
Innovative, Science, Engineering and Technology, 2(4): 1- 12.
Hagenimana, A., Ding, X., and Fang T. (2006). Evaluation of rice flour modified by extrusion
cooking. Journal of cereal Science, 43: 38-46.
Hamed, S. Y., Hassan, N. M. El, Hassan, A. B., Eltayeb, M. M., & Babiker, E. E. (2008).
Nutritional Evaluation and Physiochemical Properties of Processed Pumpkin ( Telfairia
occidentalis Hook ) Seed Flour, 7(2): 330–334.

83
Hellen Keller International. (2012). Orange fleshed sweet potato: Situation Analysis and Needs
Assessment. Tanzania report, Hellen Keller International: Dar Es salaam.
Hurrell R. (2003). Influence of Vegetable Protein Sources on Trace Element and Mineral
Bioavailability. J. Nutr., 133: 2973S-2977S
Institute of Food Science and Technology. (1993). Shelf life of foods- Guidelines for its
determination and prediction, London, Institute of Food Science and Technology
International Potato Centre (CIP). (2010). Orange-fleshed Sweet Potato for Africa Catalogue
Lima, Peru: International Potato Centre. Retrieved from
http://cipotato.org/publications/pdf/005374.pdf
Ishaq, N. and Ehirim, B. (2014) Improving soybean productivity using biotechnology approach
in Nigeria. World Journal of Agricultural Sciences 2 (2): 013-018
Jana, R. A. (1982). Status of Sweet Potato Cultivation in East Africa and Its Future.In R.L.
Villarreal & Griggs, T.D. (Eds.).Proceedings of International symposium on Sweet Potato
(63-76). Taiwan, China: Asian Vegetable Research and Development Center.
Jaya S. and Das, H. (2005).Accelerated storage, shelf life and color of mango powder.Journal of
Food Processing and Preservation, 29: 45-62.
Kathyrn dewey. (2001). guiding principles for complementary feeding of the breastfed. Pan
american Health Organisation. Journal of Clinical Nutritionournal of Clinical Nutrition, 3:
18–25.
Kaur A., Singh N., Ezekiel R. and Guraya H.S. (2007). Physicochemical, thermal and pasting
properties of starches separated from different potato cultivars grown at different locations,
Food chemistry, 101: 643-651.
Kavishe P. (2003).Nutritio: Relevant Actions in Tanzania. Tanzania Food and Nutrition Centre,
Monograph Series No.1 pp 20; Tanzania. Tanzania Food and Nutrition Centre, Dar Es
Salaam.
Kilcast D. and Persis S. (2003). The stability and shelf life of food. Food processing technology-
Principle and practices, second edn.(ISBN: 185573 533 4).
Labuza T. and Riboh D. (1982).Theory and application of Arrhenius kinetics to the prediction of
nutrients losses in foods .Journal of Food Technology, 36: 66-74.

84
Labuza, T, and Kamman J.F. (1983). Reaction Kinetics and Accelerated test stimulation as
function of Temperature. (Eds); Saguy, I., Marcel D. Inc., New York, pp: 71-115.
Labuza, T. (1982).Scientific evaluation of shelf life. In shelf life dating of foods: food and
Nutrition press: Wastport, 41-87.
Lalude, L., Fashakin, B. (2006). Development and nutritional assessment of a weaning food from
sorghum and oilseeds. Pakistan J Nutr 5 (3): 257-260.
Laswai, H.,Martin H., Kulwa K. (2010). Nutrient content and acceptability of soybean based
complementary food. African Journal of Food Agriculture, Nutrition and Development
10(1): 2040–2049.
Lawless, T., Heyman H. (2010) Sensory evaluation of food. Principles and practice, 2nd
edition
New York: Springer : 563, 565, 566.
Learning, B. and Choi, S. E. (2014). Chapter 3 Sensory evaluation. Food Science: An Ecological
Approach, 84–111.
Lutter, C. (2013). Opinion : Resp onse to “ Adequate Nutr ient Intakes for Infancy , Part 2 :
Complementary Food fr om 6 to 24 Months .” Sight and Life, 27, 42–43. Retrieved from
http://www.sightandlife.org/fileadmin/data/Magazine/2013/27_1_2013/Adequate_nutrient_i
ntakes_for_infancy_opinion.pdf
Magala-nyago, M., Kikafunda K., Mwasaru, M., Connelly, K. (2005). Evaluation nutritional
value of malted and extruded finger millet based complementary foods. African crop
science conference proceedings 7: 677-686.
Malema.B.,Laswai H., Myaka F., and Kirenga G. (2005).S oybean production and utilization in
Tanzania. Ministry of Agriculture Food Security and Cooperatives Crop development
division, crop promotion services (CPS), Dar Es Salaam, Tanzania.
Mamiro P., Kolsteren P, Roberfroid D, Tatala S, OpsomerS., Van Camp H. (2005). Feeding
Practices and Factors Contributing to Wasting, Stunting, and Iron-deficiency Anaemia
among 3-23-months.
Maria, L., Carvalho, J. De, Barros, P., Luiz, R., Godoy, D. O., Pacheco, S., … Ramos, R. (2012).
Total carotenoid content , α -carotene and β -carotene , of landrace pumpkins ( Cucurbita
moschata Duch ): A preliminary study. FRIN, 47(2): 337–340.
Martins, R. and Silva, C. M. (2004). Computational design of accelerated life testing applied to
frozen beans. Journal of Food Engineering, 64: 455-464

85
Mcginn, C.P. (1985). Evaluation of shelf life.IFST proceedings, 15 (3) (Part 2), 153-161.
London: IFST.
Meenakshi, J., Benerji, A., Manyong, V., Tomlins, K., Hamukwala, P., Zulu R. and Mungoma C.
(2010). Consumer acceptance of pro vitamin A orange maize in rural Zambia:
HarvestPlus Working Paper No. 4.
Meilgaard, MC.,Civille, V., Carr T.(2007). Sensory evaluation techniques, 4th
edition Boca
Raton.CRC press.
Michaelsen, K. andFriis, H. (1998). Complementary Feeding: A Global Perspective. Nutr., 14:
763-766
Ministry of health and social welfare.(2013). Infant and Young Child Feeding National
Guidelines.The United Republic of Tanzania.
Mizrah S., Labuza T. and Karel M. (1978). Feasibility of accelerated tests for browning in
dehydrated cabbage. Journal of Food Science 35: 804-807.
Moscicki, L, Mitrus, M, Wojtowicz, A, Oniszczuk, T, & Rejak, A. (2013). Extrusion-Cooking of
Starch: Advances in Agrophysical Research 29: 319-346.
Moscicki, L., Mitrus, M., Wojtowicz, A., Oniszczuk, T. and Rejak, A. (2011). Extrusion-
Cooking of Starch. Journal of Food Engineering, 31: 277-296.
Mosha T., DakiyoS., Laswai H. (1998) Breastfeeding, weaning practices and anthropometric
status of children in Morogoro district, Tanzania. Ecol. Food Nutr, 37(4): 309–338.
Mosha T., LaswaiS, Tetens I (2000). Nutritional composition and micronutrient status of home
made and commercial weaning foods consumed in Tanzania. Plant Foods Hum Nutr.,
55(3): 185-205.
Muhimbula, H., Zacharia, I. and Kinabo J. (2011).Formulation and sensory evaluation of
complementary foods from local, cheap and readily available cereals and legumes in
Iringa, Tanzania African Journal of Food Science.5(1): 26 - 31,
Muhimbula, H. and Zacharia, I. (2010). Persistent child malnutrition in Tanzania: Risks
associated with traditional complementary foods (A review) African Journal of Food
Science 4 (11): 679 – 692.
Murray, J., Dulahuntry, C. and Baxter A. (2001). Descriptive sensory analysis: past, present and
future. Food research International, 34: 461-471

86
Muyonga H, Tibagonzeka J,Wambete Muyinda M, and Nakimbugwe D. (2014).Acceptability
and nutritional contribution of grain amaranth recipes in Uganda .African journal of
Food, Agriculture, Nutrition and Development.(4): 3.
Mwanri L., Masika J. and Bundara N. (2013). Addressing childhood under nutrition in Tanzania:
challenges and opportunities. African Journal of Food, Agriculture, Nutrition and
development. 13: (1).
National Research Council (1984). Amaranth Modern Prospects for Ancient Crop. Washington
DC: National Academy Press.
Navale, S. A., Swami, S. B., & Thakor, N. J. (2015). Extrusion Cooking Technology for Foods.
Journal of Ready to eat food 2 (3): 66–80 pp.
Ndunguru, J. and Rajabu C. (2000).Incidence of sweet potato virus disease under different sweet
potato cropping systems in the Lake Zone of Tanzania. African Potato Association (APS)
Conference Proceeding.5: 405- 408.
Nkundabombi, M. G., Nakimbugwe, D., & Muyonga, J. H. (2015). Effect of processing methods
on nutritional , sensory , and physicochemical characteristics of biofortified bean flour,
(Ubos 2012). http://doi.org/10.1002/fsn3.301.
O` Brien, R. (2008). Fats and oils Analysis in fats and oils formulating and processing for
applications, Third edition. CRC Press, Chapter of amaranth (Amaranthus caudatus L.)
grown in East Africa. African Journal of Food Science and Technology, 3(6): 129-141.
of amaranth (Amaranthus caudatus L.) grown in East Africa. African Journal of Food Science
and Technology, 3(6), 129-141
Ojinnaka, M., Ebinyasi, C., Ihemeje, A., and Okorie, S. (2013). Nutritional Evaluation of
Complementary Food Gruels Formulated from Blends of Soybean Flour and Ginger
Modified Cocoyam Starch, African Journal of Food Science and Technology, 5 (10):
1325–1330.
Okoth, J., Ochola, S., Gikonyo, N., and Makokha, A. (2016). Development of a nutrient- dense
complementary food using amaranth- sorghum grains, 1–8. http://doi.org/10.1002/fsn3.367
Oladimeji, O. (2015). Development and Optimization of Amaranth Based Instant Soup and
Porridge Flours, College of Agricultural and Environmental Sciences. Master`s degree
thesis. Makerere University, College of Agricultural and Environmental Sciences, School of
Food Technology Nutrition and Bio- Engineerung.

87
Parvin, R., Satter, M., Jabin, S., Abedin, N., Islam, F., and Kamruzzaman, M. (2014). Studies on
the Development and Evaluation of Cereal Based Highly Nutritive Supplementary Food for
Young Children, 9(2): 974–984.
Pelto GH, Levitt E, Thairu L (2003). Improving Feeding Practices: Current Patterns, Common
Constraints, and the design of Interventions. Food Nutrition. Bull., 24: 24-82.
Pongjanta, J, Naulbunrang, A, Kawngdang, S, Manon, T, and Thepjaikat, T. (2006). Utilization
of pumpkin powder in bakery products. Journal of Science and Technology, 28:71-79.
Prakrati, R. Ameeta K. and Kushwah S. (1999).Effect of extrusion cooking variables on anti-
nutritional components and in vitro protein digestibility of Faba Bean. Indian Journal of
Animal nutrition. 16: 301-305
Ramachandra, H. and Thejaswini, M. (2015). Extrusion Technology : A Novel Method of Food
Processing, 2(4): 358–369.
Revathy, N. and Sabitha N. (2013). Development, quality evaluation and popularization of
pumpkin seed flour incorporated bakery products. International Journal of Food and
Nutrition.12 (2): 40-43.
Riaz, M., Anjum, F., and Khan, M. (2007). Latest trends in food processing using extrusion
technology. Pakistan Journal of Food Sciences, 17(1): 53–138.
Ruel T, Levin E, Armar-Klemesu M, Maxwell, G., Morris, S. (2009).Good care practices
mitigate the negative effects of poverty and low maternal schooling on children’s
nutritional status: evidence from Accra. World Development, 27:1993-2009.
Ruwaida Amed, Kirthee Pillay, Mathulisi Siwela and Unathi Kolanisi. (2016). Accepatance of a
complementary food based on pro-vitamin A- Biofortified maize and chicken stew. J Hum
Ecol, 55(3): 152-159.
Safari, J., Kimambo, C., and Lwelamira, J. (2013). Feeding practices and nutritional status of
infants in Morogoro municipality, Tanzania. Tanzania Journal of Health Research, 15 (3):
1–10.
Saguy, I. and Karel, M. (1980).Modeling of quality deterioration during food processing and
storage.Journal of Food Technology, 37: 78.
Shimelis, E., Rakshit, K. (2007). Effect of cooking and processing on antinutrients and in vitro
protein digestibility of kidney bean ( Phaseolus vulgaris L) varieties grown in East Africa.
FoodChem.103:161-172

88
Sind, K. and Wambugu, S. (2012). Going to scale with sweet potato vines distribution in
Tanzania: Marando bora baseline study, milestone report OB3BMS2. ICI, Nairobi: CIP
Singh, D., and Maharaj, R. (2014).Sensory evaluation as a tool in determining acceptability of
innovative product development by undergraduate students in Food Science and
Technology at the University of Trinidad and Tobago.Journal of curriculum and teaching,
3(1): 10-27
Steel, C.J, Leoro, M.G.V, Schmiele, M, Ferreira, R.E, & Chang, Y.K. (2012).Thermoplastic
Extrusion in Food Processing, Thermoplastic Elastomers.In P. A. El-Sonbati (Ed.),
InTech. Croatia.
Sternin M, Sternin J, Marsh L. (1997).Rapid, sustained childhood malnutrition alleviation
through a positive- deviance approach in rural Vietnam: preliminary findings, VA:
BASICS, 49-61
Sundarrajan, L. (2014). Effect of extrusion cooking on the nutritional properties of amaranth,
quinoa, kañiwa and lupine.(MSc.), University of Helsinki, Helsinki.
Tanzania Demographic and Health Survey (TDHS) 2010 Dar Es Salaam, Tanzania: National
Bureau of Statistics and ORC Macro.
Tanzania Food and Nutrition Centre. (2014). Tanzania National Nutrition Survey, final report.
Ministry of Health and Social Welfare, The United Republic of Tanzania.
Teutonico RA and D Knorr. (1985).Amaranth: composition, properties and applications of a
rediscovered food crop. Food Tech.; 39: 49-61
Thaoge, M., Adam, M., Sibara, M., Waston, G., Taylor, N. and Goyvaerts M. (2003). Production
of improves infant porridge from pearl millet using a lactic acid fermentation step and
addition of sorghum malt to reduce viscosity of porridges with high protein, energy and
solids ( 30%) content. World Journal of microbiology and Biotechnology, 19:305-310.
UNICEF (2017). Under nutrition contributes to nearly half of all deaths in children under 5 and
is widespread in Asia and Africa. UNICEF Data: Monitoring the Situation of Children and
Women. https://data.unicef.org/wp-content/uploads/2016/06/130565-1.pdf
UNICEF United Nations Children Fund (2011) Malnutrition, the silent emergency available at
http//www.unicefusa.org/malnutrition.Accessed 23 Jan 2015.
UNICEF, (2009).Tracking Progress on Child and Maternal Nutrition. A survival and
development priority: New York, NY 10017, USA

89
UNICEF, (2013). Joint statement on improving existing reccomendations on treatment of
moderate malnutrition in children under 5. Geneva
United Nations Children Fund (UNICEF).(2010). How to feed a baby after 6 months. A brochure
developed by University research Co., LLC in Tanzania, Kenya, Malawi and Uganda.
NuLife Program: USAID Cooperative agreement 717-A-00-08-00006-00.
Victor O., Amadi B, Sinkala M, Felteu S. and Tomkins (2008) African Journal of Food
Agriculture Nutrition and Development, 8 (1): 28-47.
Victor, I. A., Oguntuase, S. O., and Vincent, O. S. (2013). Physico-Chemical Properties of
Complementary Food from Malted Quality Protein Maize ( Zea mays L . ) and Defatted
Fluted Pumpkin Flour ( Telfairia occidentalis, 3(6): 323–328.
Villapando S (2000). Feeding mode, infections, and anthropometric status in early childhood.
Pediatrics, 106: 1282-1283.
Waized, B., Ndyetabula, D., Temu, A., Rabison E. and Spencer H. (2015).Promoting biofortified
crops for Nutrition: Lesson from orange fleshed sweet potato (OFSP) in Tanzania. Sokoine
University of Agriculture and Institute of development studies, UK.
World Food Program.(2012). Food quality control.www.wfp.org accessed 14th
June 14, 2016
World Health Organization. (2009). Complementary feeding of young children in Developing
Countries: A review of current Scientific Knowledge. WHO/NUT/98.1
World Health Organization. (2010). Summary of guiding principles for complementary feeding
of the breastfed children Geneva, Switzerland
Yang, N., Hort, J., Linforth, R,.Brown K., Walsh, S. and Fisk, D. (2013). Impact of flavor
solvent (propylene glycol or triacetin) on vanillin, 5- (hydroxymethyl) furfural, 2,4-
decadienal, 2,4- heptadienal, structural parameters and sensory. Perception of shortcake
biscuits over accelerated shelf life testing. Food Chemistry, 141: 1354-1360.

90
APPENDICES
Appendix 1: Sensory evaluation tool for product screening of soybeans, amaranth grains,
pumpkin seeds and OFSP based porridge.
SENSORY EVALUATION OF PORRIDGE
SEX: MALE FEMALE AGE DATE
INTRODUCTION
You are provided with different porridge samples which you have to assess. Carefully start from
left to right, observe the sample and assess them for; (i) Appearance (ii) Taste (iii) Color (iv)
Smell (v)Texture (vi) General acceptability. Please indicate the number which best describes
your feeling. Please take a sip of water and rinse your mouth before and after testing any sample.
ATTRIBUTES RANK 802 412 334 739 281
Appearance 9. Like extremely
8.Like very much
7. Like moderately
6. Like slightly
5. Neither like Nor
dislike
4. Dislike slightly
3. Dislike moderately
2. Dislike very much
1 Dislike extremely
Taste 9. Like extremely
8.Like very much
7. Like moderately
6. Like slightly
5. Neither like Nor
dislike
4. Dislike slightly
3. Dislike moderately
2. Dislike very much
1. Dislike extremely
Aroma 9 Like extremely
8.Like very much
7. Like moderately
6. Like slightly
5. Neither like Nor
dislike

91
4. Dislike slightly
3. Dislike moderately
2. Dislike very much
1. Dislike extremely
Texture 9. Like extremely
8.Like very much
7. Like moderately
6. Like slightly
5. Neither like Nor
dislike
4. Dislike slightly
3. Dislike moderately
2. Dislike very much
1. Dislike extremely
General
acceptability
9. Like extremely
8.Like very much
7. Like moderately
6. Like slightly
5. Neither like Nor
dislike
4. Dislike slightly
3. Dislike moderately
2. Dislike very much
1. Dislike extremely
Kindly provide more comments about this product.

92
Appendices 2: Sensory evaluation for shelf life stability tasting.
SENSORY EVALUATION OF PORRIDGE
SEX: MALE FEMALE AGE DATE
INTRODUCTION
You are provided with different porridge samples which you have to assess. Carefully start from
left to right, observe the sample and assess them for; (i) Appearance (ii) Taste (iii) Color (iv)
Smell (v)Texture (vi) General acceptability. Please indicate the number which best describes
your feeling. Please take a sip of water and rinse your mouth before and after testing any sample.
ATTRIBUTES RANK 125 317 420 666 188
Appearance 9. Like extremely
8.Like very much
7. Like moderately
6. Like slightly
5. Neither like Nor
dislike
4. Dislike slightly
3. Dislike moderately
2. Dislike very much
1 Dislike extremely
Taste 9. Like extremely
8.Like very much
7. Like moderately
6. Like slightly
5. Neither like Nor
dislike
4. Dislike slightly
3. Dislike moderately
2. Dislike very much
1. Dislike extremely
Aroma 9 Like extremely
8.Like very much
7. Like moderately
6. Like slightly
5. Neither like Nor
dislike
4. Dislike slightly
3. Dislike moderately
2. Dislike very much
1. Dislike extremely

93
Texture 9. Like extremely
8.Like very much
7. Like moderately
6. Like slightly
5. Neither like Nor
dislike
4. Dislike slightly
3. Dislike moderately
2. Dislike very much
1. Dislike extremely
General
acceptability
9. Like extremely
8.Like very much
7. Like moderately
6. Like slightly
5. Neither like Nor
dislike
4. Dislike slightly
3. Dislike moderately
2. Dislike very much
1. Dislike extremely
Kindly provide more comments about this product.

94
Porridge samples made in this study
Porridge from formulation 1-5