Kaitlin Cloud Thesis final draft
44
Chemical Analysis and Ecohydrological Effects of Aerosols in a Costa Rican Tropical Forest Kaitlin Cloud Undergraduate Thesis in Chemistry and Environmental Studies May 2012
-
Upload
khangminh22 -
Category
Documents
-
view
1 -
download
0
Transcript of Kaitlin Cloud Thesis final draft

Chemical Analysis and Ecohydrological Effects of
Aerosols in a Costa Rican Tropical Forest
Kaitlin Cloud
Undergraduate Thesis in Chemistry and Environmental Studies
May 2012

2
INTRODUCTION
Tropical Montane Cloud Forests
Tropical montane cloud forests (TMCF) are tropical forests frequently blanketed in
persistent, ground level fog (Grubb, 1977; Bruijnzeel and Proctor, 1995; Brown 1919). TMCFs
are common in the rugged upper slopes of tropical mountains where cloud belts accumulate
(Grubb, 1971; Bruijnzeel and Veneklaas, 1998; Zadroga 1981). Elevation changes in the tropics
force warm, moist air upward, creating ideal conditions for TMCFs. The air cools as it rises and
condenses at ground level, immersing vegetation in mist (Lawton and Dryer, 1980). TMCFs are
particularly well-suited to areas where orographic systems or advective sea fogs persist
(Zadroga, 1981). Cloud forests are characterized by the presence of steep and unstable slopes,
cool temperatures, heavy precipitation, persistent fog, and nutrient poor soils (Daugherty 1973).
The steep and rugged topographic characteristic of regions in which TMCFs are found give rise
to high spatial variability in biophysical conditions (Mulligan and Jarvis, 2011; Roman et al
2010; Lawton and Dryer, 1980; Cavelier et al 1996; Rollenbeck et al 2011; Grubb and
Whitmore, 1966; Baynton 1969; Tanner, 1977). Epiphytes and bryophytes are more abundant in
areas of with high fog frequency and duration. They are less abundant at lower elevations where
water deficiency is a limiting factor to growth (Lugo and Scatena, 1992; Wolf, 1993; Gradstein
et al 2010; Hietz, 2010; Gradstein, 2000)
The persistent fog has important consequences for the hydrology of TMCFs. Overhead
clouds and ground level fog can reduce the amount of solar radiation reaching vegetation by 15-
50% (Baynton 1969; Muller 1982; Aylett 1985; Cavelier and Mejia 1990; Bruijnzeel et al 1993).
This compounded with the persistent leaf wetness causes a chronic reduction in photosynthesis
and a reduced rate of evapotranspiration (Ishibashi and Terashima, 1995; Zadroga, 1981).
3
TMCFs are mainly found between 1200-3500 m.a.s.l. but exist as low as 500 m.a.s.l. in
smaller mountain ranges, especially in coastal and island areas such as the Caribbean (La Bastille
and Poole, 1978; Stadmuller, 1987; Hemp, 2010; Zadroga, 1981). This altitudinal difference
between mountain range sizes is related to the fact that the cloud belt sits higher on larger
mountain ranges, known as the “mass elevation effect” (Richards, 1996). Mountain masses
absorb solar radiation and then release it as long-wave radiation, which heats the air above the
mountain. Larger mountain ranges absorb and release more radiation than smaller mountains,
and thus the air above them is warmer. The relatively cooler air above smaller mountain ranges
allows cloud forests to persist at lower elevations (Schroter, 1926). Large mountain ranges in
Latin America have TMCFs extending down to 1080 m.a.s.l., while TMCFs are found as low as
900 m.a.s.l in smaller ranges in the region, a 21% difference (Mulligan and Jarvis, 2011).
Smaller mountain ranges also tend to be nearer to the coast, and thus experience higher relative
humidity levels, another factor that contributes to a lower cloud base (Mulligan and Jarvis, 2011;
Van Steenis, 1972; Bruijnzeel et al 1993).
According to the United Nations Environment Programme World Conservation
Monitoring Centre (UNEP-WCMC), there are 477 cloud forest sites found in 62 countries.
Costa Rica contains 10 sites. Cloud forests are found near the equator and 83% are found in the
northern hemisphere, which is four times more per unit mountain area than the southern
hemisphere when the greater terrestrial area of the northern hemisphere is accounted for
(Mulligan and Jarvis, 2011). Geographical features that affect the climatic characteristics of
TMCFs are their distance from the nearest coast, the size of the mountain range on which they
are located, and the topographic exposure (Mulligan and Jarvis, 2011).
Cloud forests experience high annual precipitation rates, average humidities, and cool

4
temperatures. Cloud forests generally receive an annual rainfall of greater than 2500 mm and the
humidity is usually near the saturation point. The temperature range is 12-21˚C (Zadroga, 1981).
Compared to other tropical forests, cloud forests experience higher annual rainfall and lower
mean temperatures. There is greater temperature variability among cloud forest sites than other
tropical forests, but cloud forests display less seasonal change and diurnal variability (Mulligan
and Jarvis, 2011). The majority of the water intercepted by cloud forests is in the form of drip
and stemflow, which come from fog and mist interception, rather than from precipitation
(Zadroga, 1981). This characteristic gives cloud forests a crucial role in watershed hydrology.
The importance of TMCFs
TMCFs play an important role in regional ecology. They provide habitat for many rare
and endemic species and provide important hydrological inputs to regional watersheds.
Additionally, protected cloud forests provide valuable tourism potential (Zadroga, 1981).
TMCFs increase water inputs by intercepting water from orographic clouds, advected clouds,
and wind blown mist (Kerfoot, 1968; Bruijnzeel and Proctor, 1995; Cavelier et al 1996, Zadroga,
1981). Cloud water inputs can reach several hundred mm/yr (Bruijnzeel and Proctor, 1995). For
example, 48% of Colombia’s annual water input is from fog (Caveleir and Goldstein, 1989).
Additionally, the reduced evapotranspiration rates in cloud forests results in a net increase in
water inputs (Bruijnzeel et al 2011).
Fog precipitation refers to the process by which cloud droplets coalesce onto plant
surfaces and then drip to the forest floor. Liquid water droplets can collect on vegetation
surfaces, and water vapor can condense onto the same surfaces (Zadroga, 1981). Water collects
in the canopy until the canopy reaches its storage capacity, at which point the intercepted water

5
will begin to drip and flow down stems, providing precipitation even when no rain falls
(Kittredge, 1948; Helvey 1967; Rutter, 1967; Zadroga, 1981). Fog precipitation reaches a
maximum after a rainfall event because the canopy is already at carrying capacity (Holder,
2004). Fog interception quantities depend on a number of factors: cloud characteristics, wind
speed, the structure of the vegetation, and elevation (Bruijnzeel and Proctor, 1995). Fog
interception increases at higher elevations (Bruijnzeel and Proctor, 1995)
Fog interception represents a crucial source of freshwater for the watershed, especially in
the dry season (Bruijnzeel and Hamilton, 2000; Bubb et al, 2004; Hager and Dohrenbusch, 2011;
Holder, 2004; Ray et al 2006). During the rainy season fog interception may account for 14-18%
of the total water input, while in the dry season it can account for anywhere from 15 to 100% of
the water input. This seasonal variation is more pronounced at higher elevations (Bruijnzeel and
Proctor, 1995). Fog inputs maintain high soil moisture and provide throughflow and
groundwater, so it is an important source of water for humans living in watersheds with cloud
forest vegetation (Holder, 2004). In Costa Rica as well as many other parts of the tropics, water
has becomes an increasingly valuable resource as population has increased. Water management
in areas with high demands for hydro-electric power, irrigation, and drinking water in
increasingly important (Zadroga, 1981).
In temperate regions, reducing forest cover reduces evapotranspiration losses and
increases runoff and streamflow. In the United States watershed management regimes often
include forest cover removal as a way to increase runoff (FAO, USFS). Because
evapotranspiration is not a concern in the cloud forest and cloud water interception provides
additional inputs, deforestation actually reduces streamflow (Zadroga, 1981; Stadmuller, 1987;
Meher-Homji, 1991). Fog interception also provides a chemical input that is distinct from

6
rainfall (Unsworth and Crossley, 1987). Fog droplets are smaller than rain, so compounds in the
water are more concentrated in fog droplets than rain droplets. Fog water is more acid and
nutrient rich than rainwater, which may impact leaf physiology (Asbury et al 1994; Schier and
Jensen, 1992).
TMCFs are biodiversity hot spots. They occupy approximately only 0.4% of the
terrestrial surface on earth, but they support 20% of the plants and 16% of the vertebrates in the
world, including many endemic species (Myers et al 2000; Haber, 2000; Wheelwright, 2000).
Challenges faced by TMCFs
TMCFs face similar threats as ecosystems everywhere: deforestation for agricultural land
use, invasive species, roads and development, and global climate change, which all lead to
habitat loss and fragmentation (Scatena et al., 2010; Zadroga, 1981; Bubb et al., 2004; Mulligan
and Burke, 2005). By the1990s the TMCF was one of to most threatened ecosystems in the
world (Doumenge et al., 1995; Hamilton et al., 1995). Between 1981-1990 cloud forests
disappeared at a rate of 1.1% of its area/year, and the loss from deforestation and climate change
continue (Doumenge et al., 1995; Ray et al., 2006). Cloud forests worldwide currently contain
less than 25% of their primary vegetation (Myers et al., 2000).
There is increasing evidence that atmospheric warming had raised the level of the
orographic cloud base over the mountains of Costa Rica (Pounds et al.,1997a; Still et al., 1999).
Rising sea surface temperatures increase evaporation, and the heat released from the abundance
of water vapor leads to atmospheric warming (Graham, 1995). The cooling effect of elevation
increase has diminished, and warming is amplified in the highlands (Diaz and Graham, 1996;
Beniston et al., 1997; Diaz and Bradley, 1997). A lifting cloud base is problematic because it
7
reduces the mist-inputs that are so critical to the regional watershed (Cavalier et al., 1996; Clark
et al., 1998; Pounds et al., 1999).
Pounds et al. (1999) found that the frequency of mist-free days in Monteverde Cloud
Forest Reserve was increasing, and the mist free days increasingly occurred in runs of multiple
days. Reductions in the annual minimum stream flow for the area were correlated with the
occurrence of the mist-free days (Pounds et al., 1999).
The fauna of the area has responded to the climatic changes. Bird species such as the keel-
billed toucans which are usually cloud forest intolerant have been observed nesting upslope of
their usual breeding zones (Fogden,1993). Variations in mist frequency drive the colonization
patterns: a higher frequency of dry days in the precious dry season will increase the amount of
upslope migration (Pounds et al., 1999). Anoline lizards and anurans experienced more drastic
demographic changes as a result of more mist-free days. High frequency of mist-free days in the
dry season was associated with low abundance of anoline lizards and anurans in the wet season.
(Fogden, 1993; Pounds et al. 1999). Two anole species (the cloud forest anole and the montane
anole) and one toad species (the golden toad) endemic to Costa Rica have disappeared since the
increase of the mist-free days (Pounds et al., 1999; Pounds and Crump, 1994; Pounds, et al.,
1997b; Pounds, 2000).
Human Activities and Regional Climate
In Costa Rica the conversion of forest to pasture increases the heat flux between the land
and the atmosphere, decreasing cumulus formation (Nair et al., 2003; Ray et al 2006; Nair ,2010;
Wright et al., 1992). Satellite data shows cumulus cloud formation suppression over deforests
lowlands (Lawton et al., 2001; Nair et al., 2003). One of the large causes of deforestation is the

8
conversion to coffee plantations (Bruijnzeel and Proctor 1995). Deforestation has profound
impacts on water resources (Bruijnzeel and Proctor, 1995).
Forest to pasture conversion has other impacts on local ecology as well. Pastures have a
higher albedo than forests and they reduce turbulent mixing in the boundary layer (Bastable et
al., 1993; Wright et al., 1992). The overall volume of water available for evapotranspiration and
latent heat transfer is reduced (Longman and Jenik, 1987; Nepstad et al., 1994). Finally, pasture
soils are more compacted than forest soils, limiting infiltration and soil moisture (Uhl et al.,
1988).
Land use changes in the lowlands impact orographic cloud bank formation in the uplands
by altering the nature of the air masses that move over them (Nair et al., 2003). The reduced
evapotranspiration rates of pasture land compared to forests reduces the moisture content of the
air masses reaching the mountains, which also contributes to a lifting cloud base (Lawton et al.,
2001).
The primary forest cover has declined from 67% of the total land area of Costa Rica in
1940 to 17% of the land area in1983 (Sader and Joyce, 1983). In 1991 the deforestation rate was
4.2% of land area annually (Carlson and Sanchez-Azofeifa, 1999). Most of the remaining
forested land lies in the mountains (Ray et al., 2006).
Climate model studies show that deforestation in the lowlands lifts the cloud base height
above the upland cloud forests. Cloud base heights have risen 50-100 m since deforestation
began. Complete deforestation would raise them another 50-100 m over the current level of
deforestation. Lifting cloud base heights reduce the total area of forest immersed in cloud, and
thus reduce water inputs (Ray et al., 2006). Between the completely forested and current
conditions the area of the forest experiencing cloud immersion declined 5-13%, and complete

9
deforestation could reduce the area another 15%. Complete deforestation could leave up to 25%
of the cloud forest mist free from the completely forested conditions (Ray et al., 2006).
Conversion to pasture land increases latent heat fluxes between land and atmosphere, warming
the atmosphere and lowering the dew point (Ray et al., 2006).
Reduction in cloud immersion area reduces fogwater interception during the dry season,
and can lead to a decline in biodiversity as fauna populations crash (Ray et al., 2006).
Additionally, deforestation could lead to a reduction in precipitation and a lengthening of the dry
season (Shukla et al., 1990; Nobre et al., 1991). Just to the north, Nicaragua remains mostly
forested, and it displays more abundant dry season cumulus clouds than Costa Rica (Lawton et
al., 2001). In the long term, lifting cloud base heights will push cloud forest ecosystems upwards
(Lawton et al 2001).
The Tilarán Mountains of Costa Rica
The Tilarán Mountains extends northwest-southeast along the western side of Costa Rica,
and present a barrier to the north easterly trade winds. The continental divide runs along the
crest of the Tilarán Mountains. The Atlantic, windward slope has more rain and moisture than
the Pacific slope (Hager and Dohrenbusch, 2011). Highly variable topography causes rapid
gradients in climatic conditions and gives rise to abroad diversity of cloud forest habitats in a
small area (Lawton and Dryer, 1980; Haber, 2000).
The Monteverde Cloud Forest Reserve is the most well-known of these ecosystems, and
has been researched extensively. It is characterized by steep environmental gradients and narrow
spatial distribution of cloud forest types (Lawton and Dryer, 1980; Clark et al., 2000; Haber,
2000). Monteverde experiences high rainfall and, compared to other TMCFs, relatively warm

10
temeperatures and low seasonality (Mulligan and Jarvis, 2011). Monteverde Forest Preserve
reaches elevations of 1500-1800 m along the continental divide, and extend down to 1300 m on
the Pacific slope and 700 m on the Atlantic slope (Ray et al., 2006).
The Peñas Blancas River valley is oriented toward the trade winds, so orographic clouds
carried by the winds are a substantial part of the overall dry-season precipitation in the watershed
(Guswa et al., 2007; Lawton et al., 2010). The Peñas Blancas watershed receives up 9000 mm of
precipitation annually (ICE). When the trade winds, moisture laden from passing over the warm
Caribbean, meet the eastern slope of the Tilarán mountains a stratus-stratocumulus cloud bank
forms, and is then carried upward towards Monteverde where it cools adiabatically (Pounds and
et al., 1999; Dohrenwend, 1971). The average cloud base elevation above the Peñas Blancas
watershed is 1300-1600 m.a.s.l. (Lawton and Dryer, 1980).
The region experiences a dry season with heavy cloud cover and rare orographic
thunderstorms from January through April, a wet season with heavy advective rains from May to
October, and a transitional season with heavy mist and strong winds from November through
December (Zadroga, 1981).
The Cordillera Tilarán lies 125 km from the Caribbean coast, so the land surface of the
San Juan basin lowlands has a high potential to modify the boundary layer air via heat and
moisture exchange that will eventually form the cloud bank (Ray et al., 2006; Zadroga, 1981;
Lawton et al., 2001). The winds move 3-5 m/s in the lower atmosphere, so the boundary layer is
exposed to lowland influence for 7-12 hours prior to uplifting caused by the Tilarán (Lawton et
al., 2001).

11
In 1940 600 km2 of forest land had been cleared (Vaughan, 1983). Extensive
deforestation in the Costa Rican lowlands reduced the forest cover to 1200 km2 by 1992, 18% of
the original cover (Veldkamp et al., 1992).
Upland cloud forests are found on the exposed ridges of the Cordillera Tilarán. Below
these premontane rainforest persists above 1000 m.a.s.l. Below 1000 m.a.s.l. tropical wet forests
and their transitional forms exist. The forests below 1000 m.a.s.l. experience dry months, while
those above are constantly wet. 16.83% of the Peñas Blancas watershed consists of lower
montane rainforest (Zadroga 1981).
The study site at the Soltis Center falls within 450-700 m.a.s.l. (Soltis). The tropical wet
forest below 700 m on the Caribbean slope encompasses premontane rain forest at lower
elevations and cloud forests at the upper reaches of the limit (Haber 2000 ; Lawton and Dryer,
1980).
Studying the transitional forest at lower elevations can give clues to the future of the
cloud forest in a warming climate, using elevation as proxy for climate. The lower elevation
areas of the Tilarán receive greater rainfall and less frequent fog precipitation than the higher
elevations (Holder, 2004).
Cloud Formation
Clouds in TMCFs are formed via orographic uplift and convection. Trade winds are
forced upwards by the mountains, and as they lift and cool the reduced vapor pressure and
increased relative humidities lead to condensation, which forms orographic cloud banks.
Because the trade winds are so constant, clouds are formed at the same altitude every day.
Convection occurs when a hot surface, such as warm sea surfaces, heats the air above it and

12
causes it to lift. Air parcels that lift adiabatically experience no phase changes or energy
exchanges with the surroundings. The water vapor in the air mass condenses at the lifting
condensation level (LCL), which is the point at which the relative humidity is 100% (Foster,
2010).
Cloud droplets form when water vapor in the air condenses onto an aerosols particle,
known as a cloud condensation nuclei (CCN). A cloud consists of an assembly of droplets with
radii of 10 µm (Rogers, 1976). This is a very stable system, but if droplets begin to collide and
coalesce, the system will become unstable and rain droplets will form and grow (Roger, 1976;
Lohmann and Feichter, 2005).
The main factors that influence cloud droplet formation are the size distribution and
chemistry of aerosols, the updraft velocity, and the liquid water content of the air mass (Frosch et
al., 2011). Russell et al., 2009 found that the oxidized organic fraction of the aerosol strongly
enhanced CCN abundances, while alcohols, amines, carboxylic acids and sulfates only slightly
enhanced it. Alkane groups and hydrocarbon-like organic aerosols strongly anti-correlated with
increased CCN concentrations (Russell et al., 2009). Aerosols over tropical forests are limited, so
the number of cloud droplets is proportional to the number of aerosol particles, while in polluted
areas, with high aerosol concentrations updraft velocity is the limiting factor in cloud growth
(Pöschl et al., 2010).
The process by which vapors condense into cloud droplets is described by the Kohler
theory. It combines the Kelvin and the Raoult effects to give the critical supersaturation (the
point at which the droplet is in equilibrium with the atmosphere) for a given droplet diameter.
The Kelvin effect says that the increased curvature of a smaller droplet increases the vapor
pressure of the water. Raoult effect shows that the higher concentrations of dissolved matter

13
lower the vapor pressure. The critical supersaturation is dependent on surface tension, droplet
solution density, water activity in the droplet, and the absolute temperature (Frosch et al., 2011).
The impact of aerosols in cloud growth and global climate
The presence of aerosols have a significant impact on cloud formation, since they provide a
substrate onto which water can condense (Lohmann and Feichter, 2005). Aerosols affect the
climate system via a variety of mechanisms, both direct and indirect. Direct aerosol effects refer
to how aerosols interact with radiation. Aerosols scatter and absorb thermal and solar radiation,
and they can emit thermal radiation. An indirect effect is aerosols acting as cloud condensation
and ice nuclei for cloud droplet formation. Aerosols can also suppress convection processes,
considered a semi-direct effect. The Twomey affect refers to the negative cloud forcing, or
cooling effect, of an aerosol population with increasing number but decreasing droplet radii.
More numerous droplets means a greater droplet surface area, and more solar radiation is
reflected Smaller cloud particles also reduce the precipitation efficiency of a cloud, and thus
increase a cloud’s lifetime. The ultimate result of the cloud lifetime effect is cooling and
reduced precipitation. Soot particles can absorb solar radiation, and the subsequent emission of
thermal radiation evaporates water from adjacent cloud droplets. This semi-direct effect reduces
precipitation, but whether or not it cools or warms depends on the location of the black carbon
relative to the cloud. Aerosols can impact the surface energy budget via their interactions with
radiation. An increase in aerosols increases the optical thickness of clouds. The decrease in
solar radiation reaching the surface outweighs the increase in thermal radiation trapped at the
surface, so the overall effect is cooling and a decrease in precipitation (Lohmann and Feichter,
2005).

14
Studies in the Atlantic have shown that cloud droplets in polluted clouds are smaller than
those in clean clouds. Polluted clouds are also thinner since they originated over land and are
thus direr than marine clouds. In general, smaller droplet radii will increase the optical thickness
of clouds. Continental clouds are less susceptible to the effects of anthropogenic increases in
aerosol particles than marine clouds, since there is a higher background level of natural aerosol
over land. Urban areas and industrial facilities release plumes with reduced cloud particle size
and suppressed precipitation (Lohmann and Feichter, 2005).
Pollution can lead to more vigorous convection. Smaller cloud droplets due to higher
aerosol concentrations freeze more readily, and the latent heat produced from freezing fuels
convection. For example, and increase in aircraft fuel consumption has been correlated with
increasing cirrus cloud cover in the 1980s (Lohmann and Feichter, 2005).
Biomass combustion, such as field burning and forest fires, can have a significant impact
on regional climate. Burning reduces cloud droplet size and increases the number of droplets,
reducing precipitation and delaying the onset of precipitation to higher altitudes above the cloud
base (Lohmann and Feichter, 2005).
Aerosol Composition and Processes
Organic compounds make up 20-90% of sub-micrometer aerosols (Riipinen et al., 2011
and Frosch et al., 2011). Particle profiling in tropics determined that most particles larger than
200 nm consisted of internally mixed sulfates and organic carbons. Most sulfate-organic
mixtures and particles produced by biomass burning were smaller than 0.6 µm. About 10-20%
of detected particles were determined to be produced by biomass burning. Sea salt an mineral
dust particles ranged from 0.7-2 µm (Froyd et al., 2009). The particles measured over Costa

15
Rica below 4 km were from a mixture of marine and local Central American sources. Sea salt
accounted for up to 30% of particles, while ~10% were composed of metals associated with
industrial sources, Like Pb, V, Sn (Froyd et al., 2009). Biogenic volatile organics (BVOC) may
contribute 10 times more particles to the global aerosol load that anthropogenic VOC emissions
(Schwartz et al., 2010). Vegetation emits VOCs at rates an order of magnitude larger than
petrochemical production and use (Goldstein and Galbally, 2007). Aerosols from anthropogenic
sources tend to be composed of sulfates and carbonaceous compounds. The global aerosol
burden has significantly increased from pre-industrial times to present day, pointing to the
impact of human activities on aerosol concentrations in the atmosphere (Lohmann and Feichter,
2005). !
Fatty acids and their salts are found over oceans and urban/continental locations, with the
highest concentrations at urban sites and lowest over oceans. Marine fatty acids have a low
molecular weight and our found in higher concentration during periods of high biological
activity. The major fraction of fatty acids in marine aerosol exists as sodium salts (Prisle et al.,
2008).
The oxidation of volatile organic compounds (VOC) produces secondary organic aerosol
(SOA) vapors. These vapors can go on to form particles via nucleation, enhance CCN
abundance by condensing onto small particles, enhance CCN scavenging by condensing onto
larger aerosols (Riipinen et al., 2011). Oxidation leads to functional groups that are polar and
may undergo hydrogen bonding, which reduces the vapor pressure (Goldstein and Galbally,
2007). During Amazon wet season, pure SOA accounted for ~85% of the number concentration
of submicron particles, the size with greatest CCN potential, in air masses from pristine forest.
Mixed SOA and organic material made up ~10% (Pöschl et al., 2010). Low volatility organic

16
compounds have been hypothesized to be the products of a reaction between amines and organic
acids or polymerization in particles (Riipinen et al., 2011).!!"#$%&!'%(!'&)$*$+*!')&!,)$(-.&(!
/0!$12('32$%!)&'.32$%*!$4!5"6*!78$+(*3&2%!'%(!8'+/'++09!:;;<=>!
Some OA preferentially partition to particle surface, and this surface activity can larger
particle and CCN abundance by up to 25%, especially near the equator (Riipinen et al., 2011).
Fatty acid salts are surface active, so they affect cloud droplet formation by influencing surface
tension and water activity (Prisle et al., 2008).
Surface tension measurements can be and indication of the type of compounds present in
water samples. Inorganic salts elevate the surface tension slightly above that of pure water
(Low, 1969), while organic components significantly depress surface tension. Aqueous mixtures
of organic compounds and inorganic salts can display either a higher surface tension than just
aqueous organics because the salts replace some organic molecules at the surface, or lower
surface tension because the salts force the organic to the surface, thus enhancing the surface
tension depression (Frosch et al., 2011).
How source influences aerosol chemistry
Sources of atmospheric organic carbon include growth, maintenance, and decay of plants,
animals, and microbes, hormonal and metabolic waste products, and combustion of biomass and
fossil fuels (Goldstein and Galbally, 2007). Convective cloud processing removes large, soluble
particles, which is especially evident for sea salt (Froyd et al., 2009). 5"6*!.'%!/&!)&?$@&(!
4)$?!3A&!'3?$*,A&)&!@2'!B&3!'%(!()0!(&,$*232$%9!$12('32$%!3$!.')/$%!?$%$12(&!'%(!.')/$%!
(2$12(&9!'%(!.$%@&)*2$%!3$!C"D!@2'!$12('32$%!78$+(*3&2%!'%(!8'+/'++09!:;;<=>

17
There are a number of ways that aerosol chemistry can be related to the source of the
aerosol. MSA can be used as a tracer for marine air mass influence. Greater maritime
convective influence increases the concentration of methanesulfonic acid (MSA), and MSA
concentrations are not enhanced in continental air masses. Dimethyl sulfate (DMS) is the
predominant MSA precursor present in samples, indicating a biogenic source. Generally DMS is
associated with biogenic sources, while SO2, the other MSA precursor, is a sign of anthropogenic
sources. DMS oxidation, which produces MSA, occurs more rapidly in cloud droplets than in
the gas phase, hence why convection increases MSA concentrations. Because of this strong
condense phase partitioning, MSA yields increase with lowering temperature (Froyd et al.,
2009).
Organic rich particles found in the marine air masses were accompanied by neutralized
sulfates, and likely came from biomass burning. These particles are less efficient CCN than
sulfates are. They are long-lived aerosols, and were found to be well-mixed, indicating a far
source, such as convection over Indonesia. Two categories of sulfate-organic aerosols were
measured: those with and those without a strong acidic sulfate signature. The less acidic
mixtures had a high organic content, usually contained nitrogen, and resembled sulfate-organic
mixtures typical of continental regions. The aerosols with the acidic sulfate had little organic
component, which is highly unusual for in the troposphere. It is likely that highly concentrated
gas phase SO2 and sulfuric acid partition onto newly formed particles, increasing the acidity and
decreasing the relative organic mass fraction of the sample (Froyd et al., 2009).
The elevated organics found in by Froyd et al., 2009, must be mostly primary and
secondary biogenic material from the Amazon. Other sources were ruled out as significant: the
lack of large DMS inputs eliminated marine convection, it was the wet season, meaning minimal

18
biomass burning, and high aerosol loading along with low sulfuric acid precursor concentration
suppressed new particle formation in the region. Biogenic organic material makes up 70% of
particles under 2 µm in the Amazon during the wet season, and water soluble organics compose
half of the submicron aerosol mass (Froyd et al., 2009).
The continental air masses had elevated levels of oxygenated organic, especially
dicarboxylate molecules. The lack of phosphate and coarse mode enhancement indicated that the
ozidized organics were not due to convective injection of primary biological aerosols from the
Amazon, but were SOAs formed from VOC oxidation (Froyd et al., 2009).
A formate to acetate ratio less than 1 indicates a direct emission from vehicle emissions,
while a ratio greater than one indicates phytochemical formation from vegetation from
(Vasconcellos et al., 2010).
E'330!'.2(!*'+3*!.$%3'2%2%F!'%!&@&%!%-?/&)!$4!.')/$%*!B&)&!?-.A!?$)&!'/-%('%3!
3A'%!$((!%-?/&)!4'330!'.2(*9!BA2.A!2%(2.'3&*!.$%32%&%3'+9!/2$F&%2.!&?2**2$%*!(Prisle et al.,
2008).
Fog Collection
Fog collection generally employs a vertical impaction surface to measure wind-driven
fog and the horizontal component of wind-driven precipitation (Bruijnzeel et al., 2005; Frumau
et al., 2011). Fog, rain, and drizzle are sorted by drop size and fall velocity. Rain has the largest
drop size, greater than 500 um, and has a fall velocity of greater than 200 cm/s. Drizzle drops
are between 100 and 500 um and have a fall velocity of 25-200 cm/s (Pruppacher and Klett,
1978). Fog drops are generally smaller then 40 um, but can reach 100 um, and they are

19
suspended in the air and transported by wind. Visibility in fog is less than 1000 m (Schemenauer
and Joe, 1989; Walmsley et al., 1996; Eugster et al., 2006; Holwerda et al., 2006).
Marzol tested the efficiency of polypropylene screens as fog collection surfaces (2002).
The calculated efficiency of the screen was 66% at wind speeds of 2 m/s, but the actual
efficiency was 20% (Marzol, 2002). Higher wind speeds give droplets a greater momentum, and
impaction surfaces display higher efficiency with increasing wind speed, up to 2-4 m/s when the
efficiency levels off (Frumau et al., 2011).
Frumau et al. compared the efficiencies of a number of passive fog collector designs
(2011). Wire harp screens, a cylindrical modified-Juvik type fog gauge, and a tunnel type fog
gauge all proved to be more efficient than the polypropylene screen (Frumau et al., 2011;
Goodman 1985; Juvik and Ekern, 1978). However, because this study does not attempt to
quantify fog inputs, but just to collect it for analysis, efficiency was not the primary concern.
Raman Spectroscopy
IR and Raman spectroscopy are two complementary spectroscopic techniques that differ
in the mechanism by which they transfer photons to the sample. Vibrational frequencies are
nearly the same between the two techniques, so using standard IR peaks to interpret Raman
spectra is a valid technique. Raman spectroscopy emits monochromatic light at the sample, and
relies on inelastic scattering effects. Samples absorb monochromatic light, are excited to higher
vibrational states, and then reemit the photon. Photons emitted with equal energy as the incident
light are referred to as Rayleigh scattering. Photons emitted with a different energy than the
incident light are known as Raman scattering, and it is these photons that Raman spectroscopy is
concerned with. The difference in frequency between emitted and incident light is referred to as

20
the Raman shift. Raman scattering can be Stokes (emitted light is a lower energy than incident
light, and final state is higher then initial) or Anti-Stokes (emitted light is a higher energy than
incident light, and final state is lower then initial). Stokes generally has higher intensities
because most molecules are at the ground state v=0 at room temperature, and so will not undergo
Anti-Stokes scattering. Raman active vibrations are ones in which there is a change in
polarizability during vibration. Raman spectroscopy generates spectra that range from 200-4000
cm-1. Bonds containing more massive atoms vibrate at lower frequencies, while bonds with
lighter atoms vibrate at higher frequencies. Stretching vibrations tend to have higher frequencies
than twist, rocks, and bends because of the stronger restorative forces involved in bond stretching
(Lin-Vien et al., 1991). A number of studies have used FTIR spectroscopy to characterize
organic aerosol functional groups, and this work seeks to translate those results to Raman
spectroscopy (Russell et al., 2009; Verma and Deb, 2007; Gilardoni et al., 2009; Coury and
Dillner, 2008; Schwartz et al., 2010; Wang et al., 2004; Maria et al., 2002).
METHODS
Study Site
The Soltis Center for Research and Education is a Texas A&M owned property on the
Caribbean slope of the Cordillera Tilarán of Costa Rica. It located in the Peñas Blancas River
watershed, a 100,000 acre watershed (Fig, 1). About 56% of the watershed is covered in
rainforest, mostly in the highlands above 500 m. Land use in the lowlands of the river valley is
mainly agricultural. Pastures with scattered trees and agricultural crops such as cassava, sugar
cane, and plantain cover 33% of the watershed area, with luxury crops, subsistence farming, and
small towns making up the rest (Texas A&M, 2012).

21
Figure 1: The Soltis Center on the Caribbean coast of the Cordillera Tilarán in the Peñas
Blancas River watershed. Land use in the watershed is varied, with the highlands being mostly
rainforest (shown in dark green), and agricultural uses taking up much of the lowlands
The Soltis Center encompasses of 250 acres of primary and secondary forest ranging
from 400 to 700 m.a.s.l. The eastern part of the property was subjected to logging during the last
century, but no logging has occurred for the past 50 years (Houser, Pers. Com.). The western
edges of the property borders the Bosque Eterno de los Niños, which together with the Zona
Protectora Arenal-Monteverde and the Monteverde Cloud Forest Reserve covers >120,000
continuous acres of uninterrupted forest, extending up to the Continental Divide at 1,800 m.a.s.l.
and encompassing 6 ecozones (Monteverde Conservation League, 2012 and Texas A&M, 2012).
The forest in the Soltis Center property has been classified as a tropical premontane wet forest
(TPWF) based upon its elevation, average minimum temperatures, rainfall, and fog frequency
(Davis, Pers. Com.).
The Center was established in 2009, and thus the property has been little studied.
Research to date has focused on surveying and mapping, and identifying flora and fauna species.

22
It is estimated that the property contains >2000 species of vascular plants, 350 bird species, and
70 species of amphibians and reptiles. Average annual rainfall at the Center is 4200 mm/yr,
April being the driest month and July the wettest (Texas A&M, 2012).
Site selection
The study was conducted at 5 sites on the Soltis property at various elevations and levels
of canopy cover (Figure 2). Sites A and B were the lowest elevation sites at 470 m. Site A was
under forest canopy cover while site B was in a grassy clearing with an area of ~800 m2. Sites C
and D were located a mid elevation of 520 m. Site D was under canopy cover and site C was in
a ~400 m2 clearing caused by tree fall. Site E was the highest elevation site at 710 m. It was
Figure 2: 5 study sites were chosen at various elevations throughout the property.

23
under canopy cover and was not accompanied by another site due to dense canopy cover in the
area. All sites were located in secondary forest or on the border between secondary and primary
forest due to accessibility.
A passive fog collector was installed at each site and daily fog and precipitation samples,
as well as daily particle counts were taken at each site from June 21-July 19 2011.
Fog Collection
A passive fog collector based on Schemenauer and Cereceda’s Standard fog collector was
designed and built (Fig. 3) (1994). The fog collector used a double layer polypropylene mesh
collection surface that was 1 m2. Fog that collected onto the mesh dripped into a collection
trough and was funneled into a plastic bag. Alterations made to Schemenauer and Cereceda’s
original design include the addition of a rain awning, changes to the frame design, reduction of
the height off the ground, and exchange of a plastic bag for the collection bottle.
A rain awning was added to eliminate the collection of precipitation and wind driven rain
in addition to fog interception. Pure fog samples were required for chemical analysis. The rain
awning had a wooden frame covered by heavy clear plastic sheeting. If extended at a 45º angle
two feet down and away from the face of the fog collector, and one foot past the support posts on
either side. The awning did not block fog from accessing the mesh, according to visual
observations, and the awning did not significantly alter the air temperature near the mesh.
The mesh in Schemenauer and Cereceda’s fog collector was stretched over a 1 m2 frame
that was hung on the upright supports. The fog collector in this study eliminated the frame, and
sleeves were created in the doubled over mesh to fit over the PVC uprights. A wooden pole was

24
inserted along the top edge to ensure it hung stiffly. Silicone gel was used to delineate the
vertical edges of the 1 m2 area.
The bottom edge of the collection panel was located 2-3 ft. off the ground, instead of the
2 m of Schemenauer and Cereceda’s. Climatic conditions underneath the forest canopy are
constant within the first 3 m of the forest floor, so a 2 m height was deemed unnecessary.
Fog samples were collected in an evacuated plastic bag rather than a bottle to minimize
exposure to the atmosphere. Atmospheric exposure leads to increased fractionation, altering the
samples’ isotopic composition and reducing their usefulness for isotope analysis.
Figure 3: A Passive fog collector with rain awning.
Precipitation Collection
Precipitation was collected in a Taylor 2715N 2 in 1 plastic rain gauge and in a plastic
bucket. The rain gauge was attached to the fog collector and was used as an indicator of the
amount of precipitation that occurred onsite. The greater surface area of the bucket allowed it to

25
collect more precipitation and provided adequate sample amounts for analysis. The temperature
of the collected precipitation was taken before it was transferred to 50 mL polyethylene bottles
and transported to the lab.
On Site Analysis
In Costa Rica the surface tension and pH of each precipitation and fog sample were
taken. A SITA Messtechnik DynoTester tensiometer was used to measure surface tension via
bubble pressure technique. The bubble lifetime was set to 15 sec. and measurements of each
sample were taken in triplicate. A SympHony SB70P Benchtop pH meter with a Refillable
Electrode and Glass ATC probe was used to measure the pH of each sample. Once samples were
analyzed they were stored in 50 mL polyethylene bottles in the refrigerator. Samples were
eventually transported back to the United States in a cooler. There were no EPA regulations
governing precipitation samples and no permitting was required.
Particle Count
A TSI Handheld particle counter was used to take daily particle counts at each site. The
particle counter sorted particle into size bins of 0.1 µm, 0.5 µm, 1.0µm, 3.0 µm, 5.0µm, and
10.0µm. The particle counter was attached to the frame of the fog collector below the level of
the awning and run for 20, 1.0-minute samples at each site. The instrument averaged the counts
over the sample period, so each 1.0-minute sample generated one data point.
Several longer sampling campaigns were carried out by attaching the particle counter to a
permanent weather tower located just uphill from the Center’s facilities at 452 m. Sample
number and length and the length of time between samples varied.

26
Raman Microscopy
Samples were analyzed with a ThermoScientific DXR Raman Microscope (! = 532 nm)
and associated OMNIC software. The spherical depression of a microslide was filled with
sample, and the microscope was focused near the surface using the edge of the well as a focus
point. Each spectrum generated is an average of 50 spectra. Each sample was analyzed five
times, with the focus descending further into the sample on each run. A standard water spectrum
was generated with VWR Ultrpure RG grade water. The water spectrum was subtracted from
precipitation and fog spectra. Several spectra were generated from filtered samples, and
comparison of filtered and unfiltered spectra yielded no significant differences, indicating that
spectra of unfiltered samples are representative of the composition of suspended material.
Focusing intentionally on oil droplets or solids that appeared in a few samples generated
a number of anomalous spectra.
Isotope Analysis
The !2H and !18O values were obtained with a Picarro cavity ring down isotope analyzer.
Each sample was replicated 6-8 times, and the values were averaged to generate a single data
point per sample. Values were standardized via a one point correction with Vienna standard
mean ocean water (VSMOW), the international standard for !2H = !18O = 0.
RESULTS
There were 82 rain and fogwater samples collected in June and July 2011. The average
pH for all samples was 5.65 ± 0.75. The average surface tension was 71.50 ± 0.50 mN/m2.

27
Compared to a pH of 7.00 and surface tension of 72.8 mN/m2 for pure water, the rain and fog
water samples experienced slight acidification and surface tension depression. Neither effect
was dramatic, indicating that any surface active, ionic, or acidic compounds were very dilute in
the samples.
Table 1: Functional Groups identified in 16 Raman spectra of rain and fog
Species Frequency (cm-1) # of samples
alkane C-H stretch 3012-3067 16
alkane C-H in plan deformation 1295-1346 16
alkane chain expansion 354-427 16
sulfate 1118-1142, 657-724 15
silicate 1045-1064 15
carboxylic acid O-H 2613-2652 12
alkyne C-C triple 21272-2297 12
amine NH2 3178-3216 3
Table 1: 8 organic functional groups, inorganics, and oxidized organics were found in
various fog and water sample. N-alkanes were the most common species, followed by
sulfate and silicate, carboxylic acid and alkyne, and finally, amines.
Raman spectra were analyzed according to the standard bond vibrational frequencies for
organic molecules, sulfate, nitrates, and silicates, as reported in the literature (Russell et al.,
2009; Verma and Deb, 2007; Gilardoni et al., 2009; Coury and Dillner, 2008; Schwartz et al.,
2010; Wang et al., 2004; Maria et al., 2002, Nyquist and Kagel, 1971, Lin-Vien et al., 1991).
Table one includes all species that were found and the frequency at which they appeared in
samples.
A representative Raman spectra is shown in Chart 1. The spectra is of a fog sample from
site E, the highest elevation height, on July 11th. The spectra for pure water has been subtracted

28
off. It shows all relevant peaks, except for the amine peak above 3100 cm-1. The peaks that are
present are the three alkane peaks: C-H stretches at 3067 cm-1, C-H in plane deformation at 1322
cm-1, and carbon chain expansions at 422 cm-1; the acidic O-H stretch of carboxylic acid at 2655
cm-1; the two carbon carbon triple bond peaks at 2166 and 2322 cm-1; the two sulfate peaks at
1144 and 700 cm-1; and silicate at 1076 cm-1.
The Raman spectra generated have very low resolution, due to the fact that they are of
environmental aqueous mixtures. The wide range of frequency values for the various functional
groups amongst samples, as shown in Table 1, demonstrates this low resolution, as do the wide
peak widths in Chart 1. Small changes in local molecular conditions, like different kinds or
strengths of intermolecular forces, under which a molecule or bond exists, can alter the
frequency of emitted light measured by the spectrophotometer. Overall this results in a spreading
of the signal peak, which is why the peak widths are so great.
Additionally, the samples are unresolved mixtures that contain compounds with
overlapping signals. The peak widening effect only increases the overlap. This overlap makes it
difficult to determine with certainty whether or not a compound exists in the sample. The peaks
identified for caroboxylic acids and amines are only the secondary peaks associated with these
functional groups. Carboxylic acids and amines both show strong band at 1600 cm-1, which lies
within the wide peak associated with alkane C-H deformation. Maria et al., 2002 found that
carbonyl stretches were often below detection limit because they were indistinguishable from
water interference in the 1600-1700 cm-1 region (Maria et al., 2002). In most spectra, subtracting
the water peak at 1600 cm-1, did not result in a zero absorbance value in the sample spectra. So
even though there are no identifiable peaks at 1600, the samples still absorb in this region, and
the presence of secondary peaks indicates that carboxylic acids and amines may be present. The

29
rain sample from site B on July 13th showed a reduced alkane group signal, and peaks in
accordance with the presence of amine are observed at 1621 cm-1 and 3212 cm-1, further evidence
that the amine and carboxylic acid peaks are simply obscured by the wide alkane signal.
Chart 1: Typical Raman spectra from July 11
Chart 1: Raman spectra of fog sample from July 11, with the water signal subtracted after
sample analysis. There are nine peaks that represent seven species: 3067 cm-1 is C-H stretching,
-40
-20
0
20
40
60
80
05001000150020002500300035004000
Raman Spectra a Fog Sample from July 11
Absorb
ance
Frequency (cm-1
)
265
5
232
2
216
6
1322
1144
700
4223
06
7
1067

30
2655 cm-1 is the acid group of a carbonyl, 2166 and 2322 cm-1 is the C-C triple bond, 1322 cm-1
is C-H cm-1 in-plane deformation, 1144 and 700 cm-1 is the sulfate signal, at 1076 shows
silicates, and 422 cm-1 indicates carbon chain expansion. Amine (3178-3216 cm-1) was not
presenting this sample.
DISCUSSION
Spectroscopic interpretation of functional groups is useful technique for identifying
compounds present in complex mixtures. However, it also has some limitations. The
compounds in these samples were not precisely characterized, so not conclusions can be made
about how they will influence cloud droplet formation. Russell et al. (2009) found that the
oxidized organic fraction of the aerosol strongly enhanced CCN abundances, while alcohols,
amines, carboxylic acids and sulfates only slightly enhanced it. Alkane groups and hydrocarbon-
like organic aerosols strongly anti-correlated with increased CCN concentrations (Russell et al.,
2009). Functional groups that enhance and depress CCN concentrations are both present in the
Soltis samples. Additionally, the minimal impact of organic compounds on the surface tension
of the samples indicates a low abundance of surfactants. Further research and analysis is
necessary to be able to determine if the CCN enhancing or suppressing forces are more
prevalent. More precise characterization would make the Kohler equation available as a tool to
describe the effects of compounds present in Costa Rican aerosol on cloud droplet formation.
As this work represents the first year of a multi-year project, further research is
inevitable, and recommendations are given below to improve the methodology in order to gain a
better understanding of how aerosols interact with the tropical forest in Costa Rica.

31
The first step is to improve the resolution of the spectra. Maria et al. (2002) successfully
separated organic and water soluble aerosol components by rinsing dry aerosol samples with
increasingly polar solvents: hexane, dichloromethane, acetone, and water (Maria et al., 2002). If
employed, a similar technique for aqueous samples could yield spectra with more defined peaks
that are more readily quantifiable. Quantifiable peaks can provide information about numbers of
carbon and heteroatoms in a molecule, or at least relative mass contributions, since absorbance is
proportional to molar concentration. The addition of mass spectrometry analysis would allow
the compounds to be precisely characterized.
Even without mass spectrometry, resolved spectra can be used to learn important
information about air mass source and history. The ratio of organic mass to organic carbon
(OM/OC) provides a measure of how aged or processed an air mass is. Organic mass is the mass
of the entire molecule, while organic carbon is just the contribution from carbon atoms. Older
aerosols have higher OM/OC ratios because they have undergone more oxidation processes in
the atmosphere from (Gilardoni et al., 2009). Analysis of organic functional group composition
can provide information about source, aging, and air mass processing due to changes in the
OM/OC ratio. Urban air masses, or plumes, tend to have higher levels of oxidized organics.
Aerosols that are freshly emitted are mainly composed of aliphatic and aromatic hydrocarbons,
and the organic mass is about the same as the carbon atom mass. As the aerosols persist in the
atmosphere and undergo oxidation reactions, they gain more oxidized functional groups, and the
OM/OC ratio increases (Gilardoni et al., 2009). To calculate to OM/OC using spectroscopy, use
absorbance to find the molar concentration of the functional group, then multiply by the
molecular weight of the group. OM is calculated by adding the contribution of all groups. OC is
calculated similarly, but only calculating contribution from carbon (Gilardoni et al., 2009).
32
The organic aerosol fraction can be divided into two categories: components produced
directly by an emission source and those formed by atmospheric conditions. The presence of
trace metals is correlated to emitted organics, while processes component chemistry and
abundance depends on atmospheric conditions like sunlight, relative humidity, and oxidant
concentrations. Higher concentrations of oxygenated organics were measured in an air mass that
came from over the United States, than from over the Caribbean, as indicated by the higher
incidence of m/z=44 fragments (CO2). Several groups of heavy metals have been reported as
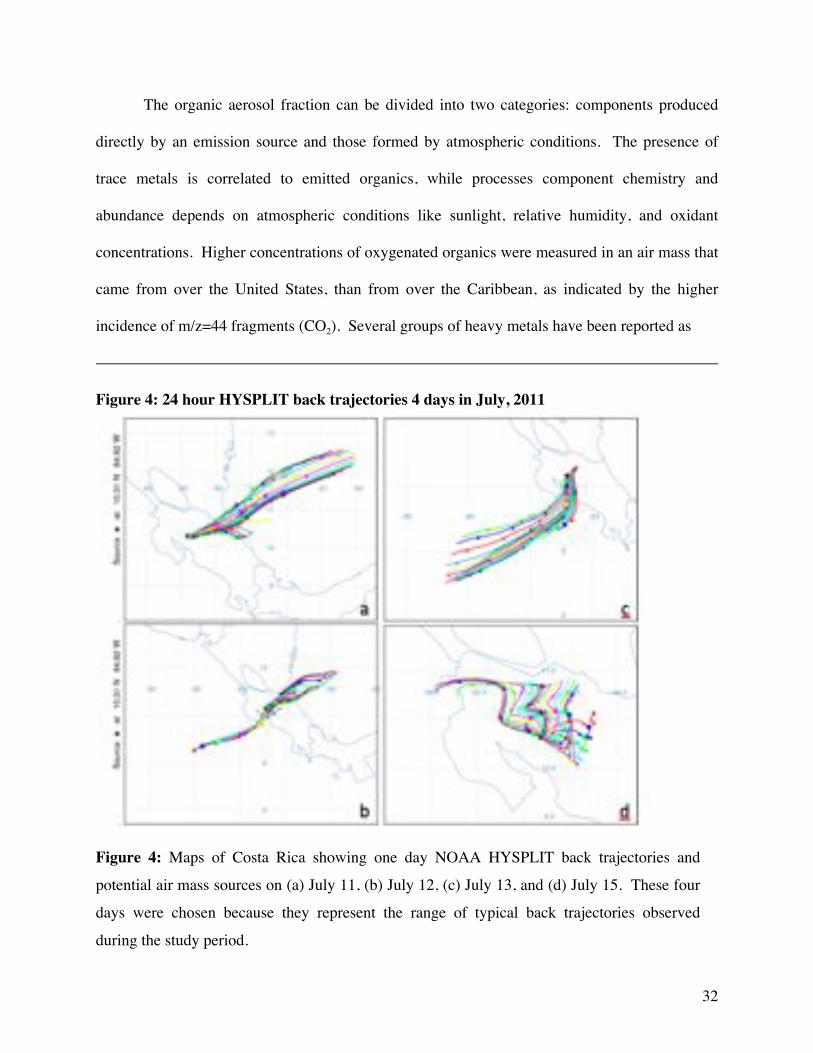
Figure 4: 24 hour HYSPLIT back trajectories 4 days in July, 2011
Figure 4: Maps of Costa Rica showing one day NOAA HYSPLIT back trajectories and
potential air mass sources on (a) July 11, (b) July 12, (c) July 13, and (d) July 15. These four
days were chosen because they represent the range of typical back trajectories observed
during the study period.

33
traces of different source types: S, K, Se, Br, Pb are combustion tracers, V, Cr, Ni, Zn, As are
associated with oil burning and refining, Cr and As indicate fossil fuel burning, and V and Ni are
related to wood smoke or coal burning. The presence of dust is indicated by Al, Si, and Ca
(Russell et al., 2009). Simultaneous analysis of organic and metallic composition can be a
powerful tool to determining the source of aerosols and the relative influence of biogenic and
anthropogenic activities.
Finally, another useful tool for determining particle and air mass source is the NOAA
Hybrid Single-Particle Lagrangian Integrated Trajectory (HYSPLIT, http://www.arl.noaa.gov/
HYSPLIT.php). Figure 4 shows HYSPLIT back trajectories for four days in July, chosen for
their representation of the different trajectories observed during the study period. Air masses
originated over the Pacific and over the Atlantic or Caribbean, and some days saw contributions
from both directions. Occasionally the predominant wind direction was from the northeast at a
low velocity, or there was no predominant direction, but many random local trajectories.
Combined with chemical composition data, as well as particle abundance data, the trajectories
could provide valuable information about air mass sources.
CONCLUSIONS
The fog and rain water samples both showed small concentrations of surface active,
ionic, and organic compounds, as indicated by an average pH of 5.65 ± 0.75 and an average
surface tension of 71.50 ± 0.50 mN/m2. Alkanes, sulfates, silicates, carboxylic acids, alkynes,
and amines were identified in the samples, but no molecules were specifically characterized.
The Raman spectra showed low resolution, as would be expected from an environmental sample,
and would greatly benefit from sample separation prior to analysis.

34
The data presented in this study are not sufficient to make strong conclusions about the
influence of aerosols on the Costa Rican hydrology. However, this work represents the first year
of a multi-year study, and the information gathered paints a picture of what would be useful to
investigate further. Primarily, it is important to improve molecule characterization by increasing
Raman spectra resolution and employing other characterization techniques. Once the aerosols
present are more precisely known, the Kohler theory can describe how they influence cloud and
fog formation in the region. Analysis with a CCN counter can support the Kohler data.
Furthermore, daily particle counts taken at the Soltis Center showed significant
fluctuation in particle abundances of all sizes measured, indicating changes in either long or
short-range particle sources. Employing techniques such as stable isotope analysis, OM/OC
comparisons, and trace metal quantification can give insight into possible aerosol sources in the
region. Coupled with the chemical composition, Kohler, and CCN data, aerosol source can tell
us how various biogenic and anthropogenic factors influence the hydrology of the tropical forest
on the Atlantic slopes of the Tilarán Mountains of Costa Rica.
Acknowledgments Research was supported by a grant from the NSF Research Experience for
Undergraduate program, and by Texas A&M University. Thank you to Drs. Chris Houser, Sarah
Brooks, and Brendan Roark for their guidance in research development and execution. I would
like to thank Josh Mallin, Sarah Berry, Samantha Wills, Anna Pfohl, Arelis Rivera, and Casey
Peirano for their help collecting field samples. Thank you Dr. Kurt Hoffman for Raman
spectroscopy guidance. Thank you to my advisors, Drs. Amy Molitor and Frank Dunnivant, for
their input on my final thesis drafts.

35
Resources
Asbury, C. E.; McDowell, W. H.; Trinidad-Pizarro, R.; Berrios, S. Solute deposition from cloud water to the canopy of a Puerto Rican montane forest. Atmospheric Environment. 1994, 28, 1773–1780. Aylett, G. P. Irradiance interception, leaf conductance and photosynthesis in Jamaican upper montane rain forest trees. Photosynthetica 1985, 19, 323–337. Bastable, H.G.; Shuttleworth, W. J.; Dallarosa, R. L. G.; Fisch, G.; Nobre, C. AInt. J. Climatol. 1993,13, 783. Baynton, H.W. The ecology of an elfin forest in Puerto Rico, 3. Hilltop and forest influences on the microclimate of Pico del Oeste. J. Arnold Arboretum. 1969, 50, 80–92. Beniston, M.; Diaz, H. F.; Bradley, R. S. Climatic change at high elevation sites: an overview. Clim.Change. 1997, 36, 233-251. Brown, W. Vegetation of Philippine Mountain: The Relation between the Environment and Physical Types at Different Altitudes. Department of Agriculture and Natural Resources, Bureau of Science, Manila, The Philippines. 1919, 869 –883. Bruijnzeel. L.A.; Eugster, W.; Burkard, R. Fog as an input to the hydrological cycle. In Encyclopaedia of Hydrological Sciences. Anderson M.G. and McDonnell, J.J., Eds; John Wiley: Chichester, 2005; 559 – 582. Bruijnzeel, L.A. and Hamilton, L.S. Decision time for cloud forests . IHP- UNESCO/IUCN-NL/WWF International: Paris, Amsterdam, 2000; 41. Bruijnzeel, L.A.; Mulligan, M.; Scatena, F.N. Hydrometeorology of tropical montane cloud forests: Emerging patterns. Hydrological Processe.s 2011, 2, 465–498. Bruijnzeel, L.A. and Proctor, J. Hydrology and biochemistry of tropical montane cloud forests: what do we really know? In Tropical Montane Cloud Forests; Hamilton, L.S.; Juvik, J.O.; Scatena, F.N., Eds; Springer Verlag: New York,1995; pp. 38 – 78. Bruijnzeel, L.A. and Veneklaas, E.J. Climatic conditions and tropical montane forest productivity: the fog has not lifted yet. Ecology. 1998, 79, 3–9. Bruijnzeel, L.A.; Waterloo, M.J.; Proctor, J.; Kuiters, A.T.; Kotterink, B. Hydrological observations in montane rain forests on Gunung Silam, Sabah, Malaysia, with special reference to the ‘Massenerhebung’ effect. Journal of Ecology. 1993, 81, 145 – 167. Bubb, P.; May, I.; Miles, L.; Sayer, J. Cloud Forest Agenda . UNEP-WCMC: Cambridge, 2004; 32.

36
Carlson, T. N. and Sanchez-Azofeifa, G.A. Satellite remote sensing of land use changes in and around San Jose, Costa Rica, Remote Sens. Environ. 1999, 70, 247–256. Cavelier, J. and Goldstein, G. Mist and fog interception in elfin cloud forests in Colombia and Venezuela. J. Trop. Ecol. 1989, 5, 309–322. Cavelier, J. and Mejia, C.A. 1990. Climatic factors and tree stature in the elfin cloud forest of Serrania de Macuira, Colombia. Agricultural and Forest Meteorology. 1990, 53,105–123. Cavelier, J.; Solis, D.; Jaramillo, M.A. Fog interception in montane forests across the Central Cordillera of Panama. Journal of Tropical Ecology 1996, 12, 357 – 369. Clark, K.L.; Nadkarni, N.M.; Schaefer, D.; Gholz, H. Atmospheric deposition and net retention of ions by the canopy in a tropical montane forest, Monteverde, Costa Rica. J. Trop. Ecol. 1998, 14, 27-45. Coury, C. and Dillner, A.M. A method to quantify organic functional groups and inorganic compounds in ambient aerosols using attenuated total reflectance FTIR spectroscopy and multivariate chemometric techniques. Atmospheric Environment. 2008, 42, 5923-5932. Daugherty, H.E., The Montecristo cloud-forest of El Salvador—a chance for protection. Biol.
Conserv. 1973, 5, 227–230. Davis, K. University of Wisconsin, Madison, WI. Personal Communication, 2011. Diaz, H. F. and Graham, N. E. Recent changes in tropical freezing heights and the role of sea-surface temperature. Nature. 1996, 383, 152-155. Diaz, H.F. and Bradley, R.S. Temperature variations during the last century at high elevation sites. Clim. Change. 1997, 36, 253-279. Dohrenwend, R. The energetic role of the Trade Wind Inversion in a tropical subalpine ecosystem. Ph.D. Thesis, Syracuse University, Syracuse, NY,1971. Doumenge, C.; Gilmour, D.; Perez, M.R.; Blochus, J. Tropical montane cloud forests: Conservation status and management issues. In Tropical Montane Cloud Forests; Hamilton, L.S.; Juvik, J.O; Scatena, F.N., Eds.; Springer-Verlag: New York., 1995; pp 24-37. Eugster, W.; Burkard, R.; Holwerda, F.; Scatena, F.N.; Bruijnzeel, L.A. Characteristics of fog and fog-water fluxes in a Puerto Rican elfin cloud forest. Agricultural and Forest Meteorology. 2006, 139 288 – 306. FAO. Conservation Guide No. 1 Guidelines for Watershed Management. 1977, p 293. Fogden, M. P. L. An Annotated Checklist of the Birds of Monteverde and Peñas Blancas. Green

37
Mountain: Monteverde, Costa Rica, 1993. Foster, P. Changes in Mist Immersion. In Tropical Montane Cloud Forests: Science for
Conservation and Management; Bruijnzeel, L.A.; Scatena, F.N.; Hamilton, L.S., Eds.; Cambridge University Press: Cambridge, 2010; p 57. Frosch, M.; Prisle, N.L.; Bilde, M.; Varga, Z.; Kiss, G. Joint effect of organic acids and inorganic salts on cloud droplet activation. Atmospheric Chemistry and Physics. 2011, 11, 3895-3911. Froyd, K.D.; Murphy, D.M.; Sanford, T.J.; Thomson, D.S.; Wilson, J.C.; Pfister, L.; Lait, L. Aerosol composition of the tropical upper troposphere. Atmospheric Chemistry and Physics. 2009, 9, 4353-4385. Frumau, K.F.A.; Burkard, R.; Schmid, S.; Bruijnzeel, L.A.S.; Tobón, C. and Calvo-Alvarado, J.C. A comparison of the performance of three types of passive fog gauges under conditions of wind-driven fog and precipitation. Hydrological Processes. 2011, 25, 374-383. Gilardoni, S.; Liu, S.; Takahama, S.; Russell, L.M.; Allan, J.D.; Steinbrecher, R.; Jimenez, J.L.; De Carlo, P.F.; Dunlea, E.J.; Baumgardner. Characterization of organic ambient aerosol during MIRAGE 2006 on three platforms. Atmospheric Chemistry and Physics. 2009, 9, 5417-5432. Gilardoni, S.; Vignati, E.; Marmer, E.; Cavalli, F.; Belis, C.; Gianelle, V.; Loureiro, A.; Artaxo, P. Sources of carbonaceous aerosol in the Amazon basin. Atmospheric Chemistry and Physics,
2011, 11, 2747-2764. Goldstein, A.H. and Galbally, I.E. Known and Unexplored organic constituents in the Earth’s atmosphere. Environmental Science and Technology, 2007, 1515-1521. Goodman J. The collection of fog drip. Water Resources Research. 1985, 21, 392–394. Gradstein, S.R. Bryophytes. In Monteverde, Ecology and Conservation of a Tropical Montane
Cloud Forest; Nadkarni, N.M., Wheelwright, N.T. Eds.; Oxford University Press: New York, 2000; 39 Gradstein, S.R.; Obregon, A.; Gehrig, C.; Bendix, J. Tropical lowland cloud forest: a neglected forest type. In Tropical Montane Cloud Forests: Science for Conservation and Management; Bruijnzeel, L.A.; Scatena, F.N.; Hamilton, L.S., Eds.; Cambridge University Press: Cambridge, 2010;130 – 133. Graham, N. E. Simulation of recent global temperature trends. Science. 1995, 267, 666-671. Grubb, P.J. Control of forest growth and distribution on wet tropical mountains with special reference to mineral nutrition. Annual Review of Ecology and Systematics 1977, 8, 38–107. Grubb, P.J. Interpretation of the ‘Massenerhebung’ effect on tropical mountains. Nature, 1971,

38
229, 44–45. Grubb, P.J. and Whitmore, T.C., A comparison of montane and lowland rain forest in Ecuador. II. The climate and its effects on the distribution and physiognamy of the forests. J. Ecol. 1966, 54, 303–333. Guswa, A.J.; Rhodes, A.L.; Newell, S.E. Importance of orographic precipitation to the water resources of Monteverde, Costa Rica. Advances in Water Resources. 2007, 30, 2098 – 2112. Haber W. Plants and Vegetation. In Monteverde: Ecology and Conservation of a Tropical Cloud
Forest. Nadkarni, N.M. and Wheelwright, N. T., Eds.; Oxford University Press, NewYork, 2000; 39 – 69. Häger, A. and Dohrenbusch, A. Hydrometeorology and structure of tropical montane cloud forests under contrasting biophysical conditions in north-western Costa Rica. Hydrological
Processes. 2011, 25, 392-401 Hamilton, L. S., Juvik, J.O.; Scatena, F.N. The Puerto Rico tropical cloud forest symposium: Introduction and workshop synthesis, In Tropical Montane Cloud Forests; Hamilton, L.S.; Juvik, J.O; Scatena, F.N., Eds.; Springer-Verlag: New York., 1995; pp. 1 – 16. Helvey, J.D. Interception by eastern white pine. Water Resour. Res. 1967, 3, 723–729. Hemp, A. 2010. Altitudinal zonation and diversity patterns in the forests of Mount Kilimanjaro, Tanzania. In Tropical Montane Cloud Forests: Science for Conservation and Management; Bruijnzeel, L.A.; Scatena, F.N.; Hamilton, L.S., Eds.; Cambridge University Press: Cambridge, 2010; 134 – 141. Hietz, P. 2010. Ecology and ecophysiology of epiphytes in tropical montane cloud forests. In Tropical Montane Cloud Forests: Science for Conservation and Management; Bruijnzeel, L.A.; Scatena, F.N.; Hamilton, L.S., Eds.; Cambridge University Press: Cambridge, 2010; 67 – 76. Holder, C.D. Rainfall interception and fog precipitation in a tropical montane cloud forest of Guatemala. Forest Ecology and Management. 2004, 190, 373-384. Holwerda, F.; Burkard, R.; Eugster, W.; Scatena, F.N.; Meesters, A.G.C.A.; Bruijnzeel, L.A. Estimating fog deposition at a Puerto Rican elfin cloud forest site: comparison of the water-budget and eddy covariance methods. Hydrological Processes 2006, 20, 2669 – 2692. Houser, C. Texas A&M Univeristy, College Station, TX. Personal Communication, 2011. Instituto Meteorologico Nacional, Costa Rica, 1977, Anuario Meteoroligico.
Ishibashi, M. and Terashima, I. Effects of continuous leaf wetness on photosynthesis: adverse aspects of rainfall. Plant Cell and Environment. 1995, 18, 431– 438.

39
Juvik, J.O. and Ekern, P.C. A Climatology of Mountain Fog on Mauna Loa, Hawai’i Island. Technical Report No. 118. Water Resources Research Center, University of Hawai‘i: Honolulu, Hawai’I, 1978. Kerfoot, O. Mist precipitation on vegetation. For. Abstr., 1968, 29, 8–20 Kittredge, J. Forest Influences. McGraw-Hill: New York, 1948. La Bastille, A. and Poole, D. On the need for a system of cloud forest parks in Middle America and the Caribbean. Environmental Conservation 1978, 5, 183 – 190. Lawton. R.O. and Dryer, V. The vegetation of the Monteverde Cloud Forest Preserve. Brenesia. 1980, 18, 101–116. Lawton, R.O.; Nair, U.S.; Pielke Sr., R.A.; Welch, R.M. Climatic Impact of Tropical Lowland Deforestation on Nearby. Montane Cloud Forests Science. 2001, 294, 584-587. Lawton, R.O.; Nair, U.S.; Rai, D.; Regmi, A.; Pounds, J.A.; Welch, R.M. 2010. Quantitative measures of immersion in cloud and the biogeography of cloud forests. In Tropical
Montane Cloud Forests: Science for Conservation and Management; Bruijnzeel, L.A.; Scatena, F.N.; Hamilton, L.S., Eds.; Cambridge University Press: Cambridge, 2010. Lin-Vien, D.; Colthup, N.B, Fateley, W.G.; Grasselli, J.G. The Handbook of Infrared and
Raman Characteristic Frequencies of Organic Molecules. Academic Press: San Diego, 1991. Lohmann, U. and Feichter, J. Global indirect aerosol effects: a review. Atmospheric Chemistry
and Physics. 2005, 5, 715-737. Longman, K.A. and Jenik, J. Tropical Forest and its Environment. Longman: Harlow, UK, 1987. Lugo, A.E. and Scatena, F.N. Epiphytes and climate change in the Caribbean: a proposal. Selbyana. 1992, 13, 123 – 130. Marzol, M.V. Fog water collection in a Rural Park in the Canary Islands (Spain). Atmospheric
Research. 2002, 64, 239 – 250. Meher-Homji, V. M. Probable impact of deforestation on hydrological processes. Clim. Change.
1991, 19, 163–173. Monteverde Conservation League. Bosque Eterno delos Niños. http://acmcr.org/ bosque_eterno_de_los_ninos.htm. (Accessed Feb. 6 2012). Muller, M. J. Selected climate data for a global set of standard stations for vegetation science. Junk, W., Pub. The Hague: The Netherlands, 1982. Mulligan M, Burke SM. Global Cloud Forests and Environmental Change in a Hydrological

40
Context. Final Report AMBIOTEK to DFID-FRP Project ZF0216; AMBIOTEK: Leigh-on-Sea, UK, 2005; www.ambiotek.com/cloudforests. Mulligan, M. and Jarvis, A. The climate of cloud forests. Hydrological Processes. 2011, 25, 327-343. Myers, N.; Mittermier, R.A.; Mittermier, C.G.; da Fonesca, G.A.B.; Kent, J. Biodiversity hotspots for conservation priorities. Nature. 2000, 403, 853–858. Nair, U.S. In Tropical Montane Cloud Forests: Science for Conservation and Management; Bruijnzeel, L.A.; Scatena, F.N.; Hamilton, L.S., Eds.; Cambridge University Press: Cambridge, 2010. Nair, U. S.; Lawton, R.O.; Welch, R. M.; Pielke Sr., R. A. Impact of land use on Costa Rican tropical montane cloud forests: Sensitivity of cumulus cloud field characteristics to lowland deforestation. J. Geophys. Res. 2003,108(D7), 4206, doi:10.1029/2001JD001135. Nepstad, D.C; Decarvalho, C.R.; Davidson, E.A.; Jipp, P.H.; Lefebrvre, P.A.; Negreiros, G.H.; Dasilva, E.D.; Stone, T.A.; Trumbore, S.E.; Vieira, S. The role of deep roots in the hydrological and carbon cycles of Amazonian forests and pastures. Nature, 1994, 372, 666. Nobre, C.A.; Sellers, P.J.; Shukla, J. Amazonian deforestation and regional climate change. J.
Clim. 1991, 4, 957. Nyquist, R.A. and Kagel, R.O. Infrared Spectra of Inorganic Compounds. Academic Press: New York, 1971. Pöschl, U.; Martin, S.T.; Sinha, B.; Chen, Q.; Gunthe, S.S.; Huffman, J.A.; Borrmann, S.; Farmer, D.K.; Garland, R.M.; Helas, G.; Jimenez, J.L.; King, S.M.; Manzi, A.; Mikhailov, E.; Pauliquevis, T.; Petters, M.D.; Prenni, A.J.; Roldin, P.; Rose, D.; Schneider, J.; Su, H.; Zorn, S.R.; Artaxo, P.; Andreae, M.O. Rainforest Aerosols as Biogenic Nuclei of Clouds and Precipitation in the Amazon. Science. 2010, 329, 1513. Pounds,J.A. In Monteverde: Ecology and Conservation of a Tropical Cloud Forest. Nadkarni, N.M. and Wheelwright, N. T., Eds.; Oxford University Press, NewYork, 2000. Pounds, J.A. and Crump, M.L. Amphibian declines and climate disturbance: the case of the golden toad and the harlequin frog. Cons. Biol. 1994, 8, 72-85. Pounds, J.A.; Fogden, M.P.L.; Campbell, J.H. Biological response to climate change on a tropical mountain. Nature. 1999, 398, 611-615. Pounds, J. A.; Fogden, M. P. L.; Campbell, J. H. in Meeting Report, Bird Life
International/WWF Workshop on the Impacts of Climate Change on Flora and Fauna. Briggs, B., Ed.; Royal Society for Protection of Birds: Bedfordshire, UK, 1997a.
41
Pounds, J. A.; Fogden, M. P. L.; Savage, J. M.; Gorman, G. C. Tests of null models for amphibian declines on a tropical mountain. Cons. Biol. 1997b, 11, 1307-1322. Prisle, N.L.; Raatikainene, T.; Sorjamaa, R.; Svenningsson, B.; Laaksonene, A.; Bilde, M. Surfactant partitioning in cloud droplet activation: a study of C8, C10, C12 and C14 normal fatty acid sodium salts. Tellus. 2008, 60B, 416-431. Pruppacher, H.R. and Klett, J.D. Microphysics of Clouds and Precipitation . D. Reidel Publishing Company: Dordrecht, The Netherlands. 1978; 714. Ray, D.K.; Nair, U.S.; Lawton, R.O.; Welch, R.M.; Pielke, R.A. Impact of land use on Costa Rican tropical montane cloud forests: sensitivity of orographic cloud formation to deforestation in the plains. Journal of Geophysical Research. 2006, 111, D02108, doi: DOI:10.1029/2005JD006096. Richards, P.W. The tropical rainforest: an ecological study. Cambridge University Press: Cambridge, 1996. Riipinen, I.; Pierce, J.R.; Yli-Juuti, T.; Nieminen, T.; Hakkinen, S.; Ehn, M.; Junninen, H.; Lehtipalo, K.; Petaja, T.; Slowik, J.; Chang, R.; Shantz, N.C.; Abbatt, J.; Leaitch, W.R.; Kerminen, V.-M.; Worsnop, D.R.; Pandis, S.N.; Donahue, N.M; Kulmala, M. Organic condensation: a vital link connecting aerosol formation to cloud condnsation nuclei (CN) concentrations. Atmospheric Chemistry and Physics. 2011, 11, 3865-3878. Rogers. R.R. A Short Course in Cloud Physics. Pergamon Press: Oxford, 1976. Rollenbeck. R.; Bendix, J.; Fabian, P. Spatial and temporal dynamics of atmospheric water inputs in tropical mountain forests of South Ecuador. Hydrological Processes 2011, 25, 344 – 352. DOI: 10.1002/hyp.7799. Roman, L.; Scatena, F.N.; Bruijnzeel, L.A. Global and local variations in tropical montane cloud forest soils. In Tropical Montane Cloud Forests: Science for Conservation and Management. Bruijnzeel, L.A.; Scatena, F.N.; Hamilton, L.S., Eds. Cambridge University Press: Cambridge, 2010; pp 77 – 89. Russell, L.M.; Takahama, S.; Liu, S.; Hawkins, L.N.; Covert, D.S.; Quinn, P.K.; Bates, T.S. Oxygenated fraction and mass of organic aerosol from direct emission and atmospheric processing measured on the R/V Ronald Brown during TEXAQS/GoMACCS 2006. Journal of
Geophysical Research. 2009, 114, D00F05, doi: 10.1029/2008JD011275 Rutter, A.J., An analysis of evaporation from a stand of Scots pine. In Proceedings of the
International Symposium on Forest Hydrology. Sopper, W.E., Lull, H.W.,Eds; Pergamon Press: Oxford, 1967; pp. 403–417. Sader, S. A. and Joyce. A.T. Deforestation rates and trends in Costa

42
Rica, 1940 to 1983, Biotropica. 1988, 20, 11–19. Scatena, F.N.; Bruijnzeel, L.A.; Bubb, P.; Das, S. Setting the Stage. In Tropical Montane Cloud Forests: Science for Conservation and Management. Bruijnzeel, L.A.; Scatena, F.N.; Hamilton, L.S., Eds. Cambridge University Press: Cambridge, 2010; p 3. Schemenauer, R. and Cereceda, P. A Proposed Standard Fog Collector for Use in High-Elevation Regions. J. Applied Meteorology. 1994, 33, 1313-1322. Schemenauer. R.S. and Joe, P.I. 1989. The collection efficiency of a large fog collector. Atmospheric Research. 24: 53 – 69. Schier, G. A. and Jensen, K.F. 1992. Atmospheric deposition effects on foliar injury and foliar leaching in red spruce. In Ecology and decline of red spruce in the eastern United States. Eagar, C. and Adams, M.B., Eds.; Ecological Studies number 96. Springer-Verlag: Berlin, 1992; pp 271–294 Schroter, C.H. The Plant Life of the Alps. Albert Raustein: Zurich, 1926. Schwartz, R.E>; Russell, L.M.; Sjostedt, S.J.; Vlasenko, A.; Slowik, J.G.; Abbatt, J.P.D.; Macdonald, A.M.; Li, S.M.; Liggio, J.; Toom-Sauntry, D.; Leaitch, W.R. Biogenic oxidized organic functional groups in aerosol particles from a mountain forest site and their similarities to laboratory chamber products. Atmospheric Chemistry and Physics. 2010, 10, 5075-5088. Shukla, J.; Nobre, C.A.; Sellers, P. Amazon deforestation and climate change. Science, 1990, 247, 1322. Slingo, J.M. The development and verification of a cloud prediction schemce for the ECMWF model. Quarterly Journal of the Royal Meteorological Society. 1987, 113, 899-927. Stadtmuller. T. 1987. Los bosques nublados en el tropico humedo. Centro Agronomico Tropical de Investigacion y Enseñanza: Turrialba, Costa Rica: 85. Still, C.J.; Foster, P.N.; Schneider, S.H. Simulating the effects of climate change on tropical montane cloud forests. Nature. 1999, 398, 608-610. Tanner, E.V.J. Four montane rain forests of Jamaica: a quantitative characterization of the floristics, the soils and the foliar mineral levels, and a discussion of the interrelations. J. Ecol.
1977, 65, 883–918. Texas A&M University. Soltis Center for Research and Education. http://soltiscentercostarica. tamu.edu/.asp (Accessed Feb. 6 2012). Uhl, C.; Buschbacher, R.; Serrao, E.A.S. J. Ecol. 1988, 76, 663. Unsworth, M. H. and Crossley, A. Capture of wind driven cloud by vegetation. In Pollutant

43
transport and fate in ecosystems. Coughtrey, P.J; Martin, M.H.; Unsworth, M.H., Eds. Blackwell: Oxford, 1987; pp 125–137. USFS (United States Forest Service), Food and Water-Effects of Forest Management on Floods,
Sedimentation, and Water Supply. Compiled by Anderson, H.W.; Hoover, M.D.; Reinhart, K.G. Pacific Southwest Forest Report, 1976, PSW-18/1976, 115 pp. Van Steenis. C.G.G.J. The Mountain Flora of Java , E.J. Brill: Leiden, The Netherlands, 1972. Vasconcellos, P.C.; Souza, D.Z.; Sanchez-Ccoyllo, O.; Bustillos, J.O.V.; Lee, H.; Santos, F.C.; Nascimento, K.H.; Araujo, M.P.; Saarnio, K.; Teinila, K.; Hillam, R. Determination of anthropogenic and biogenic compounds on atmospheric aerosol collection in urban, biomass burning and forest areas in São Paulo, Brazil. Science of the Total Environment. 2010, 408, 5836-5844. Vaughan, C. A Report on Dense Forest Habitat for Endangered Species in Costa Rica. Universidad Nacional:Heredia, Costa Rica, 1983. Veldkamp, E.; Weitz, A.M.; Staritsky, I.G.; Huising, E.J. Deforestation trends in Atlantic zone of Costa Rica: A case study. Land Degrad. Rehabil. 1992, 3, 71–84. Verma, S.K. and Deb M.K. Direct and rapid determination of sulphate in environmental samples with diffuse reflectance Fourier transform infrared spectroscopy using KBr substrate. Talanta. 2007, 71, 1546-1552. Wallace, J.M. and Hobbs, P.V. Atmospheric Science, and Introductory Survey. New York: Academic Press, 1977. Walmsley, J.L.; Schemenauer, R.S.; Bridgman, H.A. A method for estimating the hydrologic input from fog in mountainous terrain. Journal of Applied Meteorolog.y. 1996, 35, 2237 – 2249. Wang, M.C.; Liu, C.P.; Sheu, B.H. Characterization of organic matter in rainfall, throughfall, stemflow, and streamwater from three subtropical forest ecosystems. Journal of Hydrology. 2004, 289, 275-285. Wheelwright, N. In Tropical Montane Cloud Forests: Science for Conservation and
Management. Bruijnzeel, L.A.; Scatena, F.N.; Hamilton, L.S., Eds. Cambridge University Press: Cambridge, 2010; pp. 419 – 432. Wolf, J.H.D. 1993. Diversity patterns and biomass of epiphytic bryophytes and lichens along an altitudinal gradient in the northern Andes. Annals of the Missouri Botanical Garden 1993, 80, 928–960. Wright, I.R.; Gash, J.H.C.; Darocha, H.R. The Dry season micrometeorology of central Amazonian ranchland. Quarterly Journal of the Royal Meteorological Society. 1992, 118, 1083.

44
Zadroga, F. The Hydrological Importance of a Montane Cloud Forest Area of Costa Rica. In Tropical Agricultural Hydrology. Eds. Lal, R. and Russel, E.W., Eds.; John Wiley & Sons, Ltd.: New York, 1981; p 59.


![Partially reworked draft of 2007 thesis (work in progress) [in italian]](https://static.fdokumen.com/doc/165x107/6342472b91d89ffbc90554ee/partially-reworked-draft-of-2007-thesis-work-in-progress-in-italian.jpg)