A Thesis entitled Ultrasound-mediated Topical Delivery of ...
116
A Thesis entitled Ultrasound-mediated Topical Delivery of Econazole nitrate for Treating Raynaud’s Phenomenon by Saloni Daftardar Submitted to the Graduate Faculty as partial fulfillment of the requirements for the Master of Science Degree in Pharmaceutical Sciences, Industrial Pharmacy _________________________________________ Sai Hanuman Sagar Boddu, PhD., Committee Chair _________________________________________ Jerry Nesamony, PhD., Committee Member _________________________________________ Caren L.Steinmiller, PhD., Committee Member _________________________________________ Gabriella Baki, PhD., Committee Member _________________________________________ Dr. Amanda Bryant-Friedrich, Dean College of Graduate Studies The University of Toledo August 2017
-
Upload
khangminh22 -
Category
Documents
-
view
4 -
download
0
Transcript of A Thesis entitled Ultrasound-mediated Topical Delivery of ...

A Thesis
entitled
Ultrasound-mediated Topical Delivery of Econazole nitrate for Treating Raynaud’s
Phenomenon
by
Saloni Daftardar
Submitted to the Graduate Faculty as partial fulfillment of the requirements for the
Master of Science Degree in
Pharmaceutical Sciences, Industrial Pharmacy
_________________________________________
Sai Hanuman Sagar Boddu, PhD., Committee Chair
_________________________________________
Jerry Nesamony, PhD., Committee Member
_________________________________________
Caren L.Steinmiller, PhD., Committee Member
_________________________________________
Gabriella Baki, PhD., Committee Member
_________________________________________
Dr. Amanda Bryant-Friedrich, Dean
College of Graduate Studies
The University of Toledo
August 2017

Copyright 2017, Saloni Daftardar
This document is copyrighted material. Under copyright law, no parts of this document
may be reproduced without the expressed permission of the author.

iii
An Abstract of
Ultrasound-mediated Topical Delivery of Econazole nitrate for Treating Raynaud’s
Phenomenon
by
Saloni Daftardar
Submitted to the Graduate Faculty as partial fulfillment of the requirements for the
Master of Science Degree in
Pharmaceutical Sciences Industrial Pharmacy
The University of Toledo
August 2017
Objectives: The focus of this investigation was to assess the ultrasound-assisted
econazole nitrate (EN) permeation from topically applied formulations for treating
Raynaud’s phenomenon. The aims of this study were i) to identify the optimal ultrasound
parameters for the percutaneous absorption of EN, ii) to assess the in vitro percutaneous
absorption of EN and toxicity in the porcine ear skin from different topical formulations
following ultrasound application.
Methods: Optimization of ultrasound parameters such as the distance of the horn,
application time and amplitude were performed. In vitro percutaneous absorption studies
were performed using different EN formulations (F1_solution, F2_HPMC dispersion,
F3_Lipoderm®
Activemax™ Cream and F4_Versabase®
cream) across ultrasound-treated
porcine skin and were compared with the control group (skin samples without ultrasound
treatment). Histological evaluation using hematoxylin and eosin stain was carried out to
assess the dermal toxicity of formulations and ultrasound exposure. To further support
the findings of ultrasound-assisted drug permeation studies, ATR-FTIR was performed to

iv
investigate the effect of ultrasound on the conformational changes in stratum corneum
lipids characterized by the changes in spectral shifts.
Results: A constant frequency (20 kHz) ultrasound application with 40% amplitude,
0.5cm distance between ultrasound horn and skin surface for 2 minutes was optimized.
The permeation of EN was found to be higher from ultrasound- treated skin samples than
the control group. Drug permeation from F2_HPMC dispersion was found to be higher as
compared to other formulations and the marketed cream. The lag time of ultrasound-
treated skin samples were found to be significantly lower than the control. Histological
evaluation confirmed that HPMC dispersion showed no signs of toxicity. ATR-FTIR
studies revealed a slight increase in the -CH2- stretching vibrations (~ 2920 cm-1
and
2850 cm-1
) in ultrasound-treated skin samples as compared with control. This confirms
the reversible conformational changes in the stratum corneum lipids, thereby enhancing
the drug permeabilization.
Conclusions: The ultrasound-assisted topical delivery of F2_HPMC dispersion could be
explored as a new strategy for treating Raynaud’s phenomenon.

Dedicated to my Family

vi
Acknowledgements
I would like to acknowledge and express my gratitude to all those who have directly
or indirectly helped me in this research as this project is an outcome of collaboratively
shared ideas and experiences. In the words of Brad Henry, “A good teacher can
inspire hope, ignite the imagination and instill a love of learning.” I would like to
express my deepest appreciation to my advisor, Dr. Sai HS. Boddu, for his valuable
guidance and suggestions for the planning and execution of this research. His unique
research insight has been the stepping stone for the development of this research
work. His constructive criticism and brain-storming sessions have urged me to work
diligently.
I would like to thank my committee members, Dr. Jerry Nesamony and Dr. Caren
Steinmiller for their support and constant encouragement over the past two years. I
would like to express my sincere gratitude to Dr. Gabriella Baki for serving as my
graduate faculty representative for my thesis defense. I would also like to thank Allen
Schroering for helping me with histology, Dr. Andrea Kalinoski and Dr. David
Weaver for allowing me to use their facility and training me. I would like to thank Dr.
Joseph Lawrence & Dr. Lidia Rodriguez for providing the facility and expertise on
ATR FTIR spectroscopy. I would like to thank Kastel's Slaughter House & Processing
Center (Riga, MI) for providing porcine ears for my study. I am thankful to my
friends and colleagues who have given me their unconditional support. My deepest
gratitude goes to my family for their constant support throughout my life.

vii
Table of Contents
Abstract .............................................................................................................................. iii
Acknowledgements ............................................................................................................ vi
Table of Contents .............................................................................................................. vii
List of Tables .................................................................................................................. xii
List of Figures .................................................................................................................. xiii
List of Abbreviations ....................................................................................................... xvi
List of Symbols .............................................................................................................. xviii
1 Introduction ..........................................................................................................1
1.1 Raynaud’s phenomenon ..........................................................................................1
1.1.1 Classification and epidemiology...................................................................1
1.1.2 Diagnosis…...................................................................................................2
1.1.3 Treatment of Raynaud’s phenomenon ..........................................................4
1.2 Topical drug delivery ..............................................................................................5
1.2.1 Skin as a barrier: Biggest challenge to topical drug delivery .......................7
1.2.2 Structure of the skin ......................................................................................7
1.3 Enhancement of skin permeability........................................................................10
1.4 Ultrasound therapy ................................................................................................11
1.4.1 Overview of ultrasound...............................................................................11
1.4.2 Wave propagation .......................................................................................11
viii
1.4.3 Ultrasound characteristics ...........................................................................12
1.4.4 Ultrasound instrumentation .........................................................................13
1.5 Applications of ultrasound in drug delivery .........................................................14
1.5.1 Topical drug delivery ..................................................................................15
1.5.2 Ultrasound in gastrointestinal drug delivery ...............................................27
1.5.3 Ultrasound in gene drug delivery ................................................................28
1.6 Synergistic effects of ultrasound ...........................................................................29
1.6.1 Effect of ultrasound with other physical techniques ...................................29
1.6. 2 Effect of ultrasound with chemical permeation enhancers ........................30
1.7 Conclusions………. ..............................................................................................31
1.8 Percutaneous absorption using Franz diffusion study ..........................................32
1.8.1 Theoretical considerations of percutaneous absorption ..............................32
1.8.2 In vitro dermal testing .................................................................................34
1.9 Attenuated Total Reflectance Fourier Transform Infrared (ATR-FTIR)
spectroscopy and its use to characterize skin barrier ............................................37
1.10 Econazole nitrate .................................................................................................39
2 Significance of research .........................................................................................42
3 Ultrasound-mediated Topical Drug Delivery of Econazole nitrate for Treating
Raynaud’s Phenomenon ........................................................................................45
3.1 Abstract. …… .......................................................................................................45
3.2 Introduction .......................................................................................................47
3.3 Materials and Methods ..........................................................................................51
3.3.1 Materials ......................................................................................................51
3.3.2 Ultrasound application ................................................................................51

ix
3.3.3 Determination of ultrasound intensity .........................................................52
3.3.4 Optimization of ultrasound parameters .......................................................52
3.3.5 Transepithelial water loss (TEWL) measurement.......................................52
3.3.6 High Performance Liquid Chromatography analysis ..................................53
3.3.7 Preparation of porcine ear skin ...................................................................53
3.3.8 In vitro permeability study of econazole nitrate across porcine ear skin ....54
3.3.9 Mass balance recovery ................................................................................55
3.3.10 Skin toxicity assessment of the formulations ............................................56
3.3.11 Attenuated Total Reflectance Fourier Transform Infrared
spectroscopy ............................................................................................57
3.3.12 Statistical analysis .....................................................................................58
3.4 Results & Discussion ............................................................................................58
3.4.1 HPLC analysis .............................................................................................58
3.4.2 Ultrasound pre-treatment ............................................................................59
3.4.3 Optimization of ultrasound parameters .......................................................60
3.4.4 Percutaneous absorption .............................................................................63
3.4.5 Skin toxicity assessment of Econazole nitrate formulations .......................73
3.4.6 Attenuated Total Reflectance Fourier Transform Infrared spectroscopy ...77
3.5 Conclusions .......................................................................................................80
References ..........................................................................................................................82

x
List of Tables
1.1 Studies conducted using ultrasound to enhance the topical drug delivery ............25
1.2 Vibrational frequencies of the stratum corneum lipids ..........................................39
3.1 Apparent permeability (Papp), flux of econazole nitrate across excised porcine
skin and lag time. ...................................................................................................71
3.2 Total absorption and mass balance (as a percentage of the applied dose) of
econazole nitrate ....................................................................................................72
3.3 Important vibrational frequencies depicting stratum corneum layer .....................78
3.4 CH2- asymmetric and symmetric stretching vibration frequencies ........................78

xi
List of Figures
1-1 Structure of epidermis ..............................................................................................9
1-2 Ultrasound wave propagation ................................................................................12
1-3 Diagram of amplitude of ultrasound wave .............................................................13
1-4 Schematic diagram of ultrasound equipment .........................................................14
1-5 Cavitation leading to disordering of lipid bilayers ................................................18
1-6 Cavity bubble collapse and formation of microjet .................................................19
1-7 The cycle of bubble formation, growth and collapse .............................................20
1-8 Vertical Franz Diffusion cell ................................................................................35
1-9 Molecular organization of stratum corneum ..........................................................38
1-10 Econazole effects on menthol induced ET1 mRNA expression............................40
3-1 Percentage amount of econazole nitrate percutaneously absorbed into different
skin layers ..............................................................................................................50
3-2 Franz diffusion cell apparatus ................................................................................54
3-3 HPLC chromatogram of econazole nitrate ............................................................59
3-4 Effect of horn-to-skin distance on the permeation of econazole nitrate ................61
3-5 TEWL values for skin after ultrasound application at a horn-to-skin ...................62
3-6 TEWL measurements of porcine ear skin at 1 minute and 2 minute ultrasound
application time .....................................................................................................63
3-7 In vitro diffusion of econazole nitrate from F2_HPMC dispersion .......................65

xii
3-8 Percentage of econazole nitrate percutaneously absorbed into different skin
layers from F2_HPMC dispersion .........................................................................66
3-9 In vitro diffusion of econazole nitrate from F3_Lipoderm® Activemax™
Cream ...................................................................................................................66
3-10 Percentage of econazole nitrate percutaneously absorbed into different skin
layers from F3_Lipoderm® Activemax™ Cream ..................................................67
3-11 In vitro diffusion of econazole nitrate from F1_solution .......................................67
3-12 Percentage of econazole nitrate percutaneously absorbed into different skin
layers from F1_solution .........................................................................................68
3-13 In vitro diffusion of econazole nitrate from F4_Versabase®
cream .......................68
3-14 Percentage of econazole nitrate percutaneously absorbed into different skin
layers from F4_Versabase®
cream .........................................................................69
3-15 In vitro diffusion of econazole nitrate from marketed cream ................................69
3-16 Percentage of econazole nitrate percutaneously absorbed into different skin
layers from marketed cream ..................................................................................70
3-17 Hematoxylin and eosin staining of the control samples ........................................74
3-18 Hematoxylin and eosin staining of skin samples treated with F3_Lipoderm®
Activemax™ Cream ..............................................................................................75
3-19 Hematoxylin and eosin staining of skin samples treated with F2_HPMC
dispersion ...............................................................................................................76
3-20 Hematoxylin and eosin staining of skin samples treated with marketed
formulation ............................................................................................................77
xiii
3-21 ATR-FTIR spectra of porcine skin treated with marketed formulation,
F3_Lipoderm® Activemax™, F2_HPMC dispersion compared with skin as
such (control) .........................................................................................................79
3-22 ATR-FTIR spectra of porcine skin after ultrasound application and treatment
with marketed formulation, F3_Lipoderm® Activemax™, F2_HPMC
dispersion compared with skin as such (ultrasound- treated control) ...................79

xiv
List of Abbreviations
ANA ...........................Antinuclear antibodies
ATR-FTIR..................Attenuated Total Reflectance Fourier Transform Infrared
BSA ............................Bovine serum albumin
CCB............................Calcium channel blockers
cGMP .........................Cyclic guanosine monophosphate
EZ ...............................Econazole
EN ..............................Econazole nitrate
GIT .............................Gastrointestinal tract
HA ..............................Hyaluronic acid
HCC ...........................Hepatocellular carcinoma
HPMC ........................Hydroxypropyl methyl cellulose
HPLC .........................High Performance Liquid Chromatography
MT..............................Methanol
OECD .........................Organisation for Economic Co-operation and Development
PDE-5 .........................Phosphodiesterase type 5 inhibitors
PEG ............................Polyethylene glycol
PRP ............................Primary Raynaud’s Phenomenon
PZT ............................Lead zirconate titanate
RCS ............................Raynaud’s Condition score
RNA ...........................Ribonucleic acid
RP ...............................Raynaud’s Phenomenon
SC ...............................Stratum corneum
SD ..............................Standard deviation
SEM ...........................Standard error of mean
SEMA ........................Sonophoretic-enhanced micro-needle array
SLS .............................Sodium lauryl sulfate
SLES ..........................Sodium lauryl ether sulfate
TRP ............................Transient receptor potential cation channels

xv
TRPM8 .......................Transient Receptor Potential Melastatin 8
TEWL ........................Transepidermal water loss
TER ............................Transcutaneous Electrical Resistance
UV ..............................Ultraviolet
US ..............................Ultrasound
US FDA .....................United States Food and Drug Administration
VEGF .........................Vascular endothelial growth factor
W ................................Watts

xvi
List of Symbols
Hz ...............................Hertz
kHz .............................Kilohertz
MHz ..........................Megahertz
cm/min .......................Centimeter per minute
cm/hr ..........................Centimeter per hour
cm2/s ...........................Square centimeter per second
cm2/h ..........................Square centimeter per hour
μs ................................Microseconds
μ .................................Microns
μm ..............................Micrometers
μl ................................Microliter
nm ..............................Nanometer
mg/ml .........................Milligram per milliliter
μg/ml ..........................Microgram per milliliter
g/cm2 ..........................Grams per square centimeter
˚C................................Degrees Celsius
rpm .............................Revolutions per minute
V .................................Volts
W/cm2 ........................Watts per square centimeter
Da ...............................Dalton
kp ...............................Permeability coefficient
Km..............................Distribution coefficient
Papp .............................Apparent permeability
1
Chapter 1
Introduction
1.1 Raynaud’s phenomenon
Raynaud’s phenomenon (RP) was first diagnosed and described by Maurice Raynaud
in 1862 [1]. It is a clinical manifestation of recurrent, reversible vasospasm or
vasoconstriction of digital blood vessels upon exposure to cold temperatures. RP
mainly affects the arterioles, precapillary vessels and cutaneous arteriovenous shunts.
The phenomenon, a disorder of microcirculation and of an ischemic nature, is
characterized by pallor or cyanotic skin on the digits after exposure to cold or stressful
conditions, which eventually spread to the digits of both hands. There might also be
redness due to reopening of the blood vessels (reactive hyperemia) [2].
1.1.1 Classification and epidemiology
RP can be classified into two types: i) primary Raynaud’s phenomenon (PRP) and ii)
secondary Raynaud’s phenomenon (SRP). When the symptoms of RP are of an
unknown cause and there is no underlying disease to associate with it, then it is
termed as PRP [3]. PRP is characterized by cold exposure stimulated vasospasm,

2
bilateral involvement of extremities, absence of gangrene, and skin discoloration from
white to bluish to red [4]. When there is the presence of underlying disease associated
with RP, it is termed SRP. Its symptoms are almost similar to those of PRP, but are
associated with a disease condition, extremely dilated blood vessels, increased red
blood cell viscosity and aggregation, abnormal skin with sores and scars, and
sometimes results in gangrene of fingers or toes [5]. When the symptoms are visible
in the thumbs, it is generally a form of SRP [6].
PRP accounts for almost 80% of the diagnoses and its occurrence depends on the
geographic location. People living in colder regions have a higher risk of RP [7]. PRP
is more commonly observed in women than in men and affects around 11% women in
the United States. The occurrence of RP may increase in men due to occupational
hazards and hand trauma [8]. The onset of PRP has been reported at the median age of
14 years with only 27% of cases detected at the age of 40 years or later [9]. In PRP,
the symptoms are generally mild. There has been evidence of family history of RP in
about a quarter of the PRP patients [10]. SRP is diagnosed at the age of 30 years or
later with symptoms being more intense and painful, indicative of connective tissue
and microvascular disease [11].
1.1.2 Diagnosis
It’s important to distinguish RP from general common cold, which is associated with
cold hands and feet. Additionally, it is crucial to identify the form of RP, either
primary or secondary as the treatment options for these two classifications is different.
The following has been identified as the means to define the diagnosis of PRP: normal

3
results of capillaroscopy, lab tests such as antinuclear antibodies (ANA),
inflammatory parameters, absence of ulceration and underlying disease. On the other
hand, diagnosis criteria for SRP has been identified by abnormal capillaroscopy,
presence of pitting, scars, ulceration, reduced renal blood flow and positive ANA [12,
13]. As an aid to confirming the diagnosis of RP, a standard questionnaire has been
designed [14];
1. Are you more sensitive to cold than others?
2. Do you notice color changes of your skin?
3. Do your fingers look white or blue on cold exposure?
Sometimes, the clinician may use actual pictorial diagrams for the patients to identify
symptoms [15]. Criteria are proposed to describe the relative degrees of certainty in
the diagnosis of RP [14];
Definite RP – characterized by repeated occurrences of cold induced attacks
resulting in biphasic color changes of fingers or toes.
Possible RP - uniphasic color changes in addition to numbness or paresthesia
upon cold exposure.
No RP – no color changes
In SRP, non-specific abnormalities associated with scleroderma might be evident
along with other rheumatic conditions such as systemic lupus erythematous, mixed or
un-differentiated connective tissue disease or Sjögren’s syndrome [16].
4
1.1.3 Treatment of Raynaud’s phenomenon
The treatment intervention for RP should be clearly understood and the risk
assessment should be carried out by taking into account all significant symptoms.
There is no direct remedy for this condition, but treatment may certainly decrease the
severity and occurrence of attacks and would attempt to decrease the pain, numbness
and needle-like stinging sensations and prevent progression of the disease into more
complicated pathological conditions such as digital ulcers [17]. The people diagnosed
with PRP may not need drug treatment, as it can be managed using non-drug
management. These include: avoiding sudden temperature changes, keeping the body
warm and using chemical warmers for hands and feet. Drug treatment can be
recommended in patients with severe symptoms or where there is a considerable
chance of an underlying disease or evidence of ischemia–reperfusion, which can
cause significant tissue injury. The first-line treatment for PRP, or in some cases the
SRP, includes pharmacologic drug-related treatment with calcium channel blockers
(CCBs) [12, 17]. CCBs have been reported to reduce the frequency of the attacks.
Dihydropyridine calcium channel blockers such as nifedipine, nicardipine, amlodipine
and felodipine have been used. The dose of a CCB can be increased to achieve
maximum benefit in well-tolerated patients. When CCBs are ineffective or are not
well tolerated owing to their side effects (such as headaches, flushing and
hypotension), then phosphodiesterase type 5 (PDE-5) inhibitors such as Sildenafil,
Tadalafil may be used. PDE-5 inhibitors degrade cyclic GMP thereby resulting in
vasodilation. They have been reported to significantly decrease the Raynaud’s
condition score (RCS) and decrease the occurrence and duration of the vasospastic
events [18]. PDE-5 inhibitors can also be effective in combination with CCB.

5
Prostacyclin or epoprostenol is a vasodilator ideally used in the treatment of
pulmonary arterial hypertension. It inhibits thrombosis and stimulates the endothelial
cell protection. It has been reported to act against the SRP, reducing the severity of
attacks and prevents digital ulcers. Two intravenous analogs of prostacyclin, iloprost
and trepostinil, have found to be useful in SRP [17]. Some α - adrenergic blockers,
such as prazosin, have also been used for treating RP. Other antithrombotic agents,
such as dipyridamole, have been used to treat thrombosis and ulceration in RP
patients [19].
Nitrates could be a good treatment option for reducing the symptoms associated with
RP. These lead to the formation of nitric oxide giving rise to endothelium-derived
protective agent. However, owing to their side effects, oral nitrates are not used often.
Hence, a lot of emphasis has been given to topical nitrates as a potential treatment for
RP. Topical nitrates can cause fewer side effects with a tendency to cause vasodilation
of blood vessels [17]. It was reported that topical nitroglycerin improved the blood
flow in the digits [20]; glyceryl trinitrate patches in a sustained release action caused a
decrease in the frequency and severity of attacks [21]. Thus, topical nitrates could be
used in combination with a CCB to treat RP. As there is not much evidence to support
these findings, and the fact that topical drug delivery seems to be an ideal treatment to
deliver the drug into deeper layers of the skin, there is a need to further investigate the
potential of topical nitrates in treating primary RP.
1.2 Topical drug delivery
Topical drug delivery has been an efficacious and safe route of drug delivery across
the skin. It has been reported that the limitations of conventional (oral and parenteral)

6
routes of administration (oral and parenteral routes) namely the first-pass effect,
frequency of administration for drugs that have shorter biological half-life, poor
patient adherence and the fear of needles and pain associated with parenteral drug
delivery, can be overcome by using various advancements in the topical drug delivery
methodologies [22-25]. Several advantages offered by topical drug delivery are:
prevents drug degradation from hostile GI microenviroment and presystemic
metabolism [26]; reduces side-effects; unlike parenteral delivery systems there is no
pain associated with topical delivery [27]; better patient adherence; and reduced
frequency of drug administration and fluctuations in plasma drug concentrations.
The skin is the largest organ and can act as the model site of administration for locally
and systemically acting drugs [28]. Both topical and transdermal systems have been
widely used to treat local infections, motion sickness, analgesia, angina, hormonal
imbalance and hypertension [29]. Owing to the advancements in transdermal drug
delivery, in 2015, their market contribution accounted for $31.6 billion. This is
attributed to companies investing in this market following patent expirations,
reformulation of existing drugs, and enormous investments made in developing new
chemical entities. The high growth potential (over 12 %) of transdermal drug delivery
methods can be exemplified by the advent of newer applications, for example,
cardiovascular segment related to the treatment of angina pectoris, congestive heart
failure and hypertension. Similarly, the topical drug delivery market globally
accounted for $89.76 billion in 2016 and is expected to grow over 7% by 2022. Thus,
aforementioned factors are anticipated to widen the horizon for topical delivery
growth.

7
1.2.1 Skin as a barrier: Biggest challenge for topical drug delivery
The biggest challenge that remains for a formulator is the selective nature of the skin
barrier. The therapeutic efficacy of topical delivery depends largely on the potency of
a drug and its ability to permeate into the deeper layers of the skin. Topically applied
formulations can enter the skin transepidermally through the stratum corneum either
via the transcellular route or intercellular route. The drug can also enter the skin via
the transappendageal route, through hair follicles and eccrine ducts. Skin acts as a
robust barrier to the surrounding environment and protects body from UV radiation,
chemicals, loss of moisture, and helps regulates body temperature [28, 30]. The skin
barrier acts as a major constraint and limits the permeability of drug candidates from
various formulations across the skin. The skin is comprised of three layers: epidermis,
dermis and subcutaneous tissues. The skin acts as a protective layer mainly due to the
impermeable nature of epidermis [31].
1.2.2 Structure of the skin
Skin covers an area of around 1.7 square meters and accounts for about 10% of the
total body mass. The pH of the skin is around 3-6. Skin, along with its accessory
structures, forms the integumentary system of the body [32]. As it is a formidable
barrier to the permeation of many drugs, a thorough understanding of the physiology
and function of skin is fundamental for the advancements of methodologies to
develop innovative and robust transdermal dosage forms [31]. Skin is composed of
three regions: stratum corneum that is outermost layer of epidermis, viable epidermis,
dermis and subcutaneous tissues. (Figure 1.1) The barrier function is provided mainly
by the stratum corneum layer.
8
1.2.2.1 Stratum corneum layer (SC): It is the uppermost layer of epidermis with a
thickness of about 10-15 microns [33]. The corneocytes, contain 18-20 cell layers of
SC with no organelles, are loaded with protein keratin embedded in the matrix
structure. It is rich in lipids and forms the basis of obstruction to percutaneous drug
penetration [34]. The thickness and width of the corneocytes are found to be 0.2-0.4
microns and 40 microns, respectively. The SC layer is abundant in lipids (~ 14% by
weight lipid content) and low hydration. The lipids are composed of multi-lamelar
bilayers of ceramides, cholesterol and saturated fatty acids. Ceramides, which form
about 50% of SC lipids, consist of sphingosine and long chain mono-and di-
unsaturated omega hydroxy acids [35]. Cholesterol, 25% by weight of SC lipids,
comprises of cholesterol sulfate and cholesterol esters. Around 10% of SC lipids are
composed of free fatty acids, predominantly saturated long chain fatty acids, along
with minor quantities of unsaturated fatty acids such as oleic acid and linoleic acid
[35]. Cell differentiation is observed in the form of distinctive layers beneath SC
namely, stratum basale, stratum spinosum, stratum granulosum and stratum lucidum.
When the skin is in its constant state of renewal, cells (keratinocytes) transform from
the stratum basale to the outermost layer of SC (cornified squames or corneocytes)
through the intermediate stages of stratum spinosum, stratum granulosum, and stratum
lucidum [28].
1.2.2.2 Epidermis: The epidermis is a multi-layered region with varying thickness
from 0.06 to 0.8 mm, depending on the part of the body. It consists of 4-5 layers of
stratified epithelium [28]. The keratinocytes are the major cells of epidermis and their
crucial role is to undergo cell differentiation and lead to the formation of stratum
9
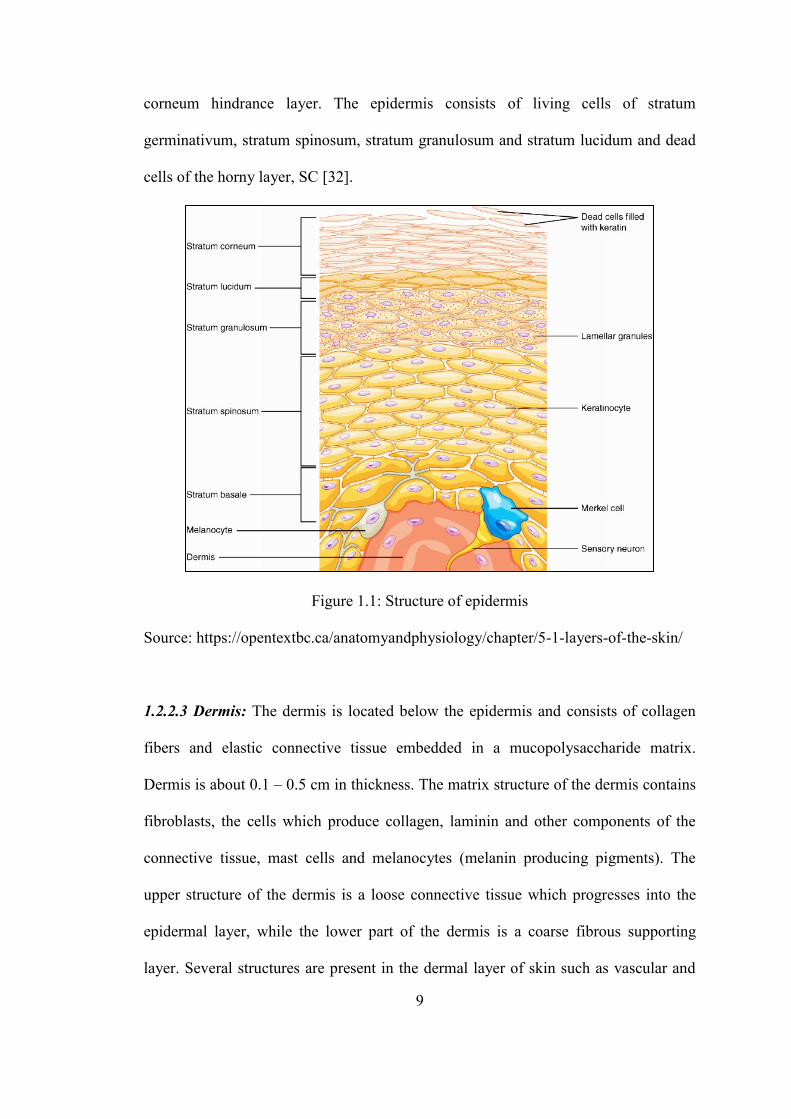
corneum hindrance layer. The epidermis consists of living cells of stratum
germinativum, stratum spinosum, stratum granulosum and stratum lucidum and dead
cells of the horny layer, SC [32].
Figure 1.1: Structure of epidermis
Source: https://opentextbc.ca/anatomyandphysiology/chapter/5-1-layers-of-the-skin/
1.2.2.3 Dermis: The dermis is located below the epidermis and consists of collagen
fibers and elastic connective tissue embedded in a mucopolysaccharide matrix.
Dermis is about 0.1 – 0.5 cm in thickness. The matrix structure of the dermis contains
fibroblasts, the cells which produce collagen, laminin and other components of the
connective tissue, mast cells and melanocytes (melanin producing pigments). The
upper structure of the dermis is a loose connective tissue which progresses into the
epidermal layer, while the lower part of the dermis is a coarse fibrous supporting
layer. Several structures are present in the dermal layer of skin such as vascular and
10
lymphatic vessels, nervous tissues, hair follicles, subcutaneous fat, sweat and
sebaceous glands [30, 36]. Dermis does not participate much in the barrier properties
of the skin in regards to the drug permeation.
1.2.2.4 Subcutaneous tissue: It is also termed hypodermis, which consists of an
internal fat layer. This layer acts as a support for all the skin layers above it and
contains blood vessels. Being a fat depository, hypodermis acts as a shock absorber
and heat padding. Subcutaneous tissue consists of loosely arranged adipose cells in
the form of lobules often interconnected with collagen and elastin fibers [30]. This
layer joins the skin with deeper muscles and tissues.
1.3 Enhancement of skin permeability
To overcome the limitation of the low permeability of the skin barrier, several
innovative techniques have been employed to reversibly alter the skin’s barrier
function and enhance the transepidermal delivery of drugs. These include chemical,
mechanical and electrical techniques. Use of permeation enhancers, ultrasound,
iontophoresis, electroporation, photomechanical waves, laser cell ablation and
microneedle arrays has demonstrated a reduction in the SC barrier properties
increasing the transepidermal transport of drugs. The use of ultrasound as a physical
method to enhance skin permeability and facilitate drug delivery has been explained
in detail.

11
1.4 Ultrasound therapy
1.4.1 Overview of ultrasound
Sound is generated by the propagation of mechanical energy through a medium. It is
defined as a source-generated wave that propagates away from the source in a
medium by the creation of alternating areas of compression and rarefaction of
molecules resulting in variable density vibrations Martini [37]. Ultrasound is a
longitudinal sound wave (acoustic wave) characterized by its frequency, wavelength
and amplitude. The frequency of sound waves determines their type. Out of the three
categories of sound waves; namely infrasonic, sonic and ultrasonic; the sound waves
with a frequency above 20 kHz are termed as ultrasonic waves. The ultrasonic waves
can be further divided into three regions namely, low-frequency (20–100 kHz),
therapeutic (0.7–3MHz) and high-frequency (>3MHz) ultrasound[38, 39].
When an ultrasound wave travels from the source through a medium there is a
specific velocity at which this occurs [37]. The equation which defines the
relationship between the velocity of ultrasound and its frequency and wavelength is
given by,
Where, c = speed of propagation or velocity
ν = frequency
λ = wavelength
1.4.2 Wave propagation
As the acoustic wave travels away from the source, there is a local displacement (no
net displacement) of particles as they oscillate around their equilibrium positions

12
resulting in the formation of regions of compression (high concentration of particles)
and rarefaction (low concentration of particles), as shown in figure 1.2.
Figure 1.2: Ultrasound wave propagation from left to right resulting in the formation
of regions of high (compression) and low (rarefaction) density, which correspond to
the acoustic wave amplitude; modified from [37]
1.4.3 Ultrasound characteristics [40][41]
1.4.3.1 Ultrasound frequency: It is defined by the number of events (oscillations)
which take place per unit time. It is constant for a particular ultrasound source. It can
be expressed in units of 1/second or Hertz (Hz).
1.4.3.2 Amplitude: It is the difference in the peak value and the average value of the
waveform, which depends on the strength of the wave. (Figure 1.3) It is expressed in
units of decibels or dB.

13
Figure 1.3: Diagram of amplitude of ultrasound wave.
Source: http://www.echopedia.org/wiki/The_principle_of_ultrasound
1.4.3.3 Wavelength: It is defined as the length of a single cycle, i.e. from one peak to
the next. It is dependent on the frequency of the wave and the medium of propagation.
It is expressed in units of nm.Wavelength is inversely related to the frequency.
1.4.3.4 Intensity: It is the measure of flow of acoustic energy. It is defined as a vector
quantity, which is the time average of the net flow of energy through a unit area or the
concentration of energy in the ultrasound beam. With the propagation of ultrasound
wave, the intensity decreases.
1.4.3.5 Power: It is defined as the rate of energy transfer and is measured in Watts.
The relationship between power and intensity can be expressed as,
1.4.4 Ultrasound instrumentation
Therapeutic ultrasound consists of a high-frequency generator connected to a
transducer (treatment head). The ultrasound transducer is the main component which
generates ultrasound waves using piezoelectric effect, a principle discovered by Pierre

14
and Jacques Curie in 1880 [42]. The transducer is comprised of quartz crystals (called
piezoelectric crystals or elements), either single or in combination. Some of the
commonly used piezoelectric crystals are lead zirconate titanate (PZT) or ceramic
[43]. A voltage is applied across these crystals. One side of the crystal is fixed to the
backing material (layer used to prevent excessive vibrations, thereby leading to short
pulsed ultrasonic waves), while the other is left free. When these crystals are
electrically stimulated, there are vibrations, these oscillations (shape changes or rapid
expansion and contraction) of the crystals lead to the generation of sound waves,
which travel across the medium. A schematic diagram of ultrasound equipment is
shown in figure 1.4.
Figure 1.4: Schematic diagram of ultrasound equipment
1.5 Applications of ultrasound in drug delivery
There are several applications of ultrasound in drug delivery; some of them are
mentioned below. However, the major focus of the following sections will be the
ultrasound-mediated topical drug delivery.
Skin
15
1.5.1 Topical drug delivery
During the last decade, one such physical method for skin permeabilization,
ultrasound or sonophoresis, has been investigated by researchers. Back in 1954,
application of ultrasound to deliver hydrocortisone for the treatment of polyarthritis of
the digits was reported. Ultrasound frequencies used for medicinal purposes can be
high, medium or low in the range of 20 kHz to 16 MHz and their effect on various
drugs have been assessed at different frequencies [44], [45, 46]. High ultrasound leads
to a typical ~ 10-fold enhancement in drug permeation, which might be sufficient for
local drug delivery. However, it might be insignificant for systemic delivery [47]. The
focus of ultrasound-assisted transdermal drug delivery shifted from high-frequency to
low-frequency in mid-1990, since then ultrasound frequencies between 20 – 100 kHz
have been explored extensively. Studies have reported that the transdermal delivery of
molecules is much more effective at low-frequency ultrasound as compared to higher
frequencies. A major reason for this has been attributed to the inverse nature of the
penetration depth of the ultrasound waved into the skin with the ultrasound frequency.
Low-frequency ultrasound was approved for transdermal drug delivery enhancement
of lidocaine by the US FDA in 2004. It was reported that ultrasound pretreatment
shortened the lag time of lidocaine thus decreasing the onset of therapeutic effect of
the drug from 60 minutes to 5 minutes [48].
1.5.1.1 Ultrasound biophysics
Ultrasound biophysics primarily involves the study of mechanisms which govern the
interaction of ultrasound on biological materials [49]. Ultrasound biophysics forms
the fundamental basis of understanding ultrasound therapeutic applications and its

16
associated risk assessment. The thermal and non-thermal effects, or mechanisms, of
ultrasound are the significant biological effects arising from ultrasound exposure.
1.5.1.1.1 Thermal mechanism
With the propagation of ultrasonic energy into a medium, a part of the ultrasound
wave is absorbed, that is, wave energy is converted to heat. Thus, there is an increase
in the temperature of the medium which can be expressed using several mathematical
expressions [49]. Ultrasound induced temperature increase of the medium is directly
proportional to the ultrasound application time and its intensity [50]. An increase in
the skin permeability due to the thermal effect of ultrasound can occur as a function of
increased diffusivity of drugs, dilation of the points of entry on the skin and
absorption of drugs [51]. The extent to which the temperature changes occur depends
upon the thermal effects exerted by the ultrasound. For a temperature rise of 1-2˚C, it
has been reported that there is no significant role of thermal effects [52], whereas for
larger temperature changes (~10˚C), the thermal mechanism seems to be predominant.
For high or intermediate frequency ultrasound, 1 MHz and 150 kHz respectively, the
increase in the flux of drugs across the skin might be attributed mainly to the
ultrasound-induced thermal effects [53]. In the case of low-frequency ultrasound, an
attempt has been made to control the rise in temperature of the medium as it can lead
to adverse effects such as necrosis, epidermis detachment and burns [54]. This is done
by periodic replacement of the coupling medium during ultrasound treatment. Thus,
in low-frequency ultrasound, the thermal effects do not exert any major impact. This
is evident by studies performed by Polat et al. in which sodium lauryl sulfate
permeation in the skin did not increase significantly with an increase in the

17
temperature of medium (solution) to 37˚C from 25˚C control after ultrasound
application time of 20 minutes [55]. On the other hand, if the temperature is allowed
to increase consistently for an extended time period, the thermal effects turn dominant
and are directly related to the increase in drug permeation.
1.5.1.1.2 Non-Thermal mechanism
Non-thermal effects of ultrasound include acoustic cavitation, shock waves and
acoustic streaming [50, 56].
1.5.1.1.2.1 Acoustic cavitation
The main contribution for non-thermal effects of ultrasound is acoustic cavitation
[57]. This is true especially in the case of low-frequency ultrasound. Cavitation is
characterized by ultrasound-induced pressure variation in the medium resulting in the
formation and oscillation of gas cavities or bubbles. Such bubbles are created from
pre-existing gas nuclei in the liquid or medium and as the pressure decreases, these
gas nuclei expand forming a microbubble [50]. Collapse of microbubbles transmit a
shock wave across the material or tissue leading to alterations in the tissue structure
[58] (Figure 1.5). The air pockets in tissues resemble gas nuclei for cavitation after
exposure to ultrasound. Cavitation is inversely related to the ultrasound frequency.
There are two types of cavitation; namely stable cavitation (non-inertial) and transient
(inertial) cavitation. Stable cavitation refers to the pulsation and slow oscillatory
movement of a bubble in an acoustic field without collapse. Inertial cavitation is
defined as the rapid growth and collapse of bubbles over many ultrasound pressure
cycles. This may result in the formation of smaller bubbles or due to the irregularity
of bubble collapse at the interface of skin; it forms a microjet [59] (Figure 1.6).

18
Figure 1.5: Cavitation leading to disordering of lipid bilayers and the formation of
microchannels; Modified from [60].
Inertial cavitation with bubble collapse at the interface resulting in microjets causes
skin permeation enhancement in low-frequency ultrasound. Several studies have
reported that the size of cavitation bubbles is inversely dependent on the ultrasound
frequency [56, 61]. Thus, there is smaller bubble radius for bubbles generated by
high-frequency ultrasound than low-frequency ultrasound. Also, the phenomenon of
inertial cavitation occurring in the coupling medium increases with decreasing
ultrasound frequency signifying the effectiveness of low-frequency ultrasound over
high-frequency ultrasound [62].

19
Figure 1.6: Cavity bubble collapse and formation of microjet; cavity appears spherical
initially followed by rapid shrinking of the bubble leading to microjet [58]
The process of growth of cavitation bubbles is called as rectified diffusion. The
rectified diffusion and collapse of cavitational bubbles under acoustic field together
result in a significant increase in the topical drug delivery [63]. In the first half of the
acoustic cycle, the negative pressure experienced by the bubble will cause it to grow
on account of gaseous expansion in the bubble. This is followed by a positive pressure
build up which causes the bubble to burst into smaller bubbles (figure 1.7). The
bubble growth is further enhanced due to two effects; namely the area effect and the
shell effect. In the expanded state, surface area of the bubble is greater than the
collapsed state. The shell effect is a result of the diffusion boundary layer (shell) at the
interface of gas or bubble and surrounding liquid phase [64]. As the bubble expands,
the thickness of the shell layer decreases; thereby increasing the diffusion
concentration gradient into the bubble. During bubble collapse, the shell layer
thickens and this causes the diffusion concentration gradient to decrease. With the
rapid progress of rectified diffusion resulting in a fast-paced bubble growth cycle, an
inertial cavitation can be expected depending on the ultrasound frequency, bubble size
and ultrasound amplitude. If rectified diffusion occurs slowly, it might lead to stable
cavitation owing to equilibrium attainment with continuous oscillation of the bubble

20
[59, 64]. Thus, the occurrence of rectified diffusion plays a crucial role in acoustic
cavitation, especially the inertial cavitation.
Figure 1.7: The cycle of bubble formation, growth and collapse [58]
1.5.1.1.2.1.1 Role of cavitation in low-frequency and high-frequency ultrasound
Cavitation, especially inertial cavitation, is the predominant mechanism of low-
frequency ultrasound. In a study performed by Tang et al, the selective suppression of
the effect of cavitation inside and outside the skin was demonstrated [57]. This was
done using castor oil as the coupling medium, thus suppressing the cavitation outside
the skin. Additionally, to suppress the cavitational effect inside the skin, a high-
pressure diffusion cell was used. Since there was no change in skin permeability as
compared to control, it was demonstrated that the primary mechanism of enhancing
the skin permeability was cavitation outside the skin. Studies performed by Tezel et
al, exhibited the critical distance between the ultrasound horn and skin surface of one
maximum bubble radius (to which the bubble expands) which is ~ 150 μm at a
constant frequency of 20 kHz [57, 63]. Due to this close critical distance from the skin
surface, it was confirmed that a microjet formation into or near the skin causing skin
21
perturbation is more likely for low-frequency ultrasound thus further confirming
inertial cavitation phenomenon. In case of high-frequency ultrasound, Mitragotri et al.
showed that skin permeation was increased due to cavitation within the stratum
corneum corneocytes [65]. This was attributed to direct contact of oscillating bubbles
leading to disorderly structure of lipids of stratum corneum [66].
1.5.1.1.2.2 Acoustic streaming
When cavitation bubbles are produced upon ultrasound application, the movement of
the ultrasound horn causes movement of the bubbles. This movement is induced by
convection. This is termed as acoustic streaming [50, 67]. This phenomenon causes
the movement of the bulk fluid towards the skin surface, that is, in the direction of the
applied acoustic field. It helps the small bubbles to move towards the skin and
prevents their buoyancy tendency. This movement of bulk fluid causes sufficient
mixing of the coupling medium, which in turn aids in enhancing the skin permeability
in regions where microjets due to cavitation do not occur.
1.5.1.2 Ultrasound process parameters affecting the skin permeability
1.5.1.2.1 Categories of ultrasound frequency
The high or low-frequency ultrasound can cause significant changes in skin
permeability. As the intensity of ultrasound is inversely related to its frequency, low-
frequency ultrasound has been more effective in skin permeabilization. Low-
frequency ultrasound can be categorized as simultaneous and pretreatment ultrasound
depending on the protocol of an experiment.

22
1.5.1.2.1.1 Simultaneous ultrasound: This involves application of ultrasound and
drug simultaneously to the skin [68-70]. The mechanisms resulting in an increase in
topical drug delivery are increased diffusion through conformational alterations in the
skin and ultrasound induced convection effects.
1.5.1.2.1.2 Pretreatment: In this method, ultrasound is applied for a short time prior
to drug delivery to permeabilize the skin for a couple of hours [71, 72]. An advantage
of this approach is that, no sophisticated ultrasonic device is required to be worn by
the patient.
1.5.1.2.2 Ultrasound intensity
Intensity of ultrasound is governed by the velocity of ultrasound waves and the
ultrasound energy. The effect of ultrasound on skin conductivity depends largely upon
the energy density of ultrasound. A threshold value of ultrasound energy is considered
to be in existence under which the skin conductivity or permeability enhancement
cannot be detected. It can be defined as the minimum energy required to generate
reversible structural changes in the SC layer of skin to produce a quantifiable change
in skin conductivity or permeability. This threshold value might depend on other
process parameters such as frequency [73].
1.5.1.2.3 Ultrasound application time and mode
As a certain threshold dose of ultrasound energy is required it is crucial to understand
the impact of actual ultrasound application time [74]. The total energy can be
expressed as,
Energy = (intensity) x (application time) x (duty cycle)

23
The higher the ultrasound application time, the higher will be the energy supplied.
Several studies have been performed to optimize the application time of ultrasound in
skin permeation experiments ranging from 1 minute to 4 h [46, 73, 75]. Other
parameters such as the intensity, frequency of ultrasound and thermal effects should
also be considered to optimize application time.
Ultrasound can be operated in a continuous mode or in a sequential (discontinuous or
pulsed) mode. Thermal effects are predominant in the case of continuous ultrasound
due to heating of the coupling medium. Such thermal effects may be avoided by
periodically changing the coupling medium. Pulsed ultrasound can be used to reduce
the heating effect. It refers to the actual time during which the ultrasound is activated
as it is followed by a period of no ultrasound. This effect of ultrasound duty cycle or
the mode can be assessed to determine its impact on skin permeability of drugs.
Studies performed by Mitragotri et al. revealed that the duty cycle did not
significantly affect the increase in skin conductivity values [74]. However, the drug
accumulation in the deeper skin layers increased with continuous ultrasound. In the
research conducted by Sachdeva et al. ketoprofen delivery via the transdermal route
by continuous and pulsed ultrasound application was fond to be equally effective [76].
1.5.1.2.4 Distance of the ultrasound transducer
The distance of ultrasound transducer or horn and the skin plays an important role in
the enhancement of skin permeability. As the ultrasound beam is emitted from the
transducer, it propagates in the medium. The intensity of the wave decreases
(attenuation) as the distance from the source increases [77]. This explains the

24
dependence of ultrasound on the distance of the horn and it should be optimized for
efficient ultrasound-enhanced drug skin permeation.
1.5.1.3 In vitro studies to gain an insight of ultrasound enhanced topical drug
delivery
The table 1.1 summarizes the some of the studies conducted to establish the
application of ultrasound to enhance topical drug permeation in vitro.

25
Table 1.1: Studies conducted using ultrasound to enhance the topical drug delivery
Drug/molecule Study
Model
Methods Results Reference
Fluorescein
isothiocyanate
conjugated to serum
albumin
Ex-vivo
rabbit eye
model
Ultrasound frequency 1 MHz
with an intensity of 0.05 W/cm2
and 30s exposure time
Sonophoresis was used to enhance intrascleral delivery
of the protein 1.6-fold without any toxic reactions to
ocular tissues.
[78]
Green fluorescent
nanoparticles and
hyaluronic acid
(HA)
Porcine skin Ultrasound frequency (643.5
kHz), 10 minute application
time and 5 minutes pretreatment
with ultrasound contrast agents.
With ultrasound exposure, skin permeation of the
markers was increased than passive diffusion controls.
Penetration of the markers increased by 4-5 folds and
drug penetration depth of over 600 µm in the presence
of ultrasound contrast agents.
[79]
Quantum dots Porcine split
thickness
skin
US conditions: frequency – 20
kHz, intensity – 7.5 W/cm2,
pulse length – 5 s on, 5 s off,
and distance between the probe
tip and the skin – 3 mm
0.01% of quantum dots penetrated the untreated skin,
whereas they fully permeate the ultrasound treated skin
[80]
Proteins – insulin,
and high molecular
weight compounds
such as
erythropoietin,
interferon gamma
Human
cadaver skin
Low-frequency ultrasound 20
kHz, pulses applied every
second for 4 h, 225 mW/cm2
Significantly increased delivery rates of the proteins
and their blood concentration was similar to that
achieved using a subcutaneous injection
[65]
Anti-inflammatory
drugs like
ibuprofen,
piroxicam and
diclofenac
Cellulose
and
rabbit skin
membranes
Modified Franz diffusion
Assembly was used for
permeation study. Ultrasound
intensity was varied between
0.5 to 3.0 W/cm2
There was a significant increase in the permeation of
model drugs upon ultrasound application and the
increase in ultrasound intensity further enhanced the
drug transport
[81]

26
sodium
Diclofenac
sodium
a 3D viable
skin
(EpiDerm)
Low-frequency ultrasound 20
kHz, PBS as coupling medium,
horn-to-skin-distance around 2
cm, variable amplitude,
application time
With increase in amplitude from 10% to 15%, increase
in application time from 3 to 5 minutes in continuous
mode, resulted in increased flux and permeability of
the drug
[82]
Ketoprofen Porcine ear
skin
Ultrasound parameters such as
application time duty cycle,
distance of horn, intensity were
optimized. Franz study was
carried out and permeability of
the drug was calculated.
Ultrasound at 20 kHz frequency, intensity of 6.9
W/cm2, application time of two minutes, 0.3 cm
distance between the probe tip and skin was optimized.
There was a significant increase in ketoprofen
permeability with these ultrasound parameters. An
increase in TEWL values was observed, suggesting
alterations in SC layer.
[76]
Ibuprofen cellulose
membrane
and rabbit
skin along
with in vivo
studies on
rabbits
Permeation studies were carried
out using Franz cells.
Ultrasound was applied at an
intensity of 1.5 W/cm2 with a
frequency of 800 kHz. Gels or
emulsions were applied to the
skin.
The transdermal transport was increased for gel
formulation over oleaginous or emulsion based
formulations with cellulose membrane resulting in
enhanced transport. This was attributed to the presence
of a greater alcohol concentration over propylene
glycol. Ultrasound enhanced the drug transport 11-
fold. This study concluded that aqueous gel
formulations can acts as better coupling agents to
enhance the drug permeation using ultrasound.
[83]
Fentanyl, caffeine Rat skin In vitro ultrasound pretreated
skin were mounted on Franz
cells. Histological evaluation
performed to assess the impact
of ultrasound exposure on skin.
Ultrasound applied in discontinuous mode 20 kHz with
intensity of 2.5 W/cm2 proved to be effective in
increasing permeation of both drugs.
[44]

27
1.5.2 Ultrasound in gastrointestinal drug delivery
The intracellular delivery of nuclei acids into gastrointestinal tissues (GIT) can be
very challenging due to their large size. Also, the pH microenvironment and enzymes
such as proteases and nucleases, make the transport of nuclei acids to GIT almost
impossible [84]. Thus, there is a need for local administration of biologics without the
need for structural modifications and extensive formulation steps to treat diseases like
inflammatory bowel disease like ulcerative colitis. To this effect, a physical method
such as ultrasound to enhance the local drug delivery of nuclei acids could bring a
paradigm shift in drug delivery [85]. Apart from its diagnostic applications for
imaging and tumor ablation and its facilitation of skin permeabilization, ultrasound
has been reported to have a potential to facilitate permeabilization of cellular
membranes, thereby enhancing intracellular drug delivery. This has been as a result of
reversible processes due to the cavitation effects temporarily altering cell membranes
to deliver biologics. In a study done by Schoellhammer et al., the effect of ultrasound
in the delivery of RNA to colonic mucosa of living mice and Yorkshire pigs (colon
tissues ex vivo) was studied [86]. It was found that on the application of 20 kHz
ultrasound, 1 minute application time increased the delivery of fluorescent permeants
7-fold compared to passive controls. An ultrasound of 40 kHz for 0.5 seconds caused
a 3-fold increase in drug delivery in living mice. In another such study, ultrasound
increased the absorption (around 2 to 10- fold) of inulin, hydrocortisone and
mesalamine in pig and mice model ex vivo [87]. The ultrasound treatment did not
show any toxic effect upon histological evaluation and no inflammatory response.
Thus, ultrasound mediated drug delivery can be a physical method to overcome
barrier-related problems in gastrointestinal drug delivery.

28
1.5.3 Ultrasound in gene drug delivery
Gene delivery into the body without the use of needles seems to be an innovative and
promising approach [88-90]. Several attempts have been made to efficiently and
selectively deliver genes to a target location in the body. Recently, ultrasound targeted
microbubble destruction has been employed as a potential strategy for the delivery of
genes by increasing the gene expression in a targeted manner in the body. The
ultrasound-induced oscillations of the cavitation nuclei, that is the microbubbles cause
an increase in cell membrane permeability via the formation of pores in the cell
membrane [91]. Thus, ultrasound promotes gene transfection efficiency and has been
found to be a potential method to treat ocular diseases. Gene therapy has been
investigated for treating cardiovascular diseases. However, low gene transfection
efficiency (cell death)is a limitation of this therapy. Ultrasound targeted microbubble
destruction serves as a non-invasive and non-viral method of targeted plasmid
delivery [92, 93]. The endothelial damage due to ultrasound induced microbubble
destruction further enhances targeted gene delivery to the myocardium. Studies have
shown that regional perfusion is improved by the transfection of VEGF gene into the
ischemic myocardium by ultrasound targeted microbubble destruction [94, 95]. In
another study, transfection of HSVtk or Timp3 gene targeting hepatocellular
carcinoma (HCC) resulted in the reduction of cancer cell viability by more than 40%.
With the co-transfection of both the genes, cell viability was decreased over 50%.
Using the combination of ultrasound and microbubble destruction, co-delivery of two
genes resulted in tumor suppression over 70%, synergistically improving their anti-
tumor activity [96].
29
1.6 Synergistic effects of ultrasound
1.6.1 Effect of ultrasound with other physical techniques
Ultrasound might increase the transport of drugs across the skin, but several studies
have exhibited that the effect of ultrasound can be synergistically enhanced using a
combination of ultrasound with other physical methods such as iontophoresis,
electroporation, laser ablation or microneedle array.
As the ultrasound exposure causes a decrease in skin resistivity, the iontophoretic
voltage to deliver a drug across the skin is also lower than that without ultrasound.
This in turn results in less skin irritation. Studies conducted by Hikima et al., stated
that a synergistic effect of combination of sonophoresis (3 MHz, 5.2W/cm2, 5.4%
duty cycle) and iontophoresis (0.32 ± 0.3 mA/cm2) was observed in hairless mice thus
enabling the delivery of macromolecules (molecular weight ~1350 Da) [97].
Recently, a combination therapy using microneedles and sonophoresis termed as
sonophoretic-enhanced micro-needle array (SEMA) has been employed to deliver
large molecules across the skin [98]. It consists of hollow microneedles, which pierce
the skin through the epidermis into the dermis. When ultrasound is applied, the flow
rate of drugs can occur and the microneedles can deliver the drugs across the skin. In
an attempt to deliver calcein and BSA, some researchers have pierced the skin with
100 μm microneedles and given ultrasound (20 kHz frequency, 0.5 W/cm2 intensity
and 20% duty cycles with 10 μsec on time) through the back of the microneedle
patch. They have reported a 9 times and 12 times increase in delivery of calcein and
BSA, respectively. [98] Solid microneedles that create holes on the skin have also
been used with cavitational effects of ultrasound. Through these holes created by
microneedles, cavitational effects can lead to enhanced permeation compared to

30
ultrasound alone since the cavitation bubbles are in contact with the deeper skin
layers.
Synergistic effects of ultrasound have also been examined in combination with laser
cell ablation. Erbium laser ablation was combined with ultrasound therapy (3 MHz)
and resulted in efficient enhancement of gold nanoparticles across rat skin in an in
vivo study [99].
Synergism of ultrasound and electroporation has been studied by Kost et al.[100]. In
that study, there was an increase in the flux of calcein and sulforhodamine upon the
combination of ultrasound (1 MHz) and electroporation (10 - 150 V) by a factor of 2
and 3 (respectively), relative to flux observed using only electroporation. Lag time
was also decreased from 15 minutes to 9 minutes for the combination therapy, which
suggested that the mechanism of this synergy was a cavitation-based effect.
1.6.2 Effect of ultrasound with chemical permeation enhancers
Chemical permeation enhancers solubilize skin lipids and cause denaturation or
corneocytes of the SC layer resulting in permeabilization of the skin. This effect
seems to be elevated using their combination with ultrasound. A study conducted by
Mitragotri et al., demonstrated that combination of ultrasound and 1% sodium lauryl
sulfate, a surfactant, synergistically enhanced the permeation of mannitol 200-fold
[101]. This might have been attributed to cavitation induced convection leading to
increased permeation. In a recent study, dendrimers were used as permeation
enhancers in a diclofenac gel formulation. Ultrasound 20 kHz was applied to the rat
skin using SLS as a coupling medium and in vitro diffusion study was performed. It
was found that an increase in the drug permeation from 4-fold to 16-fold resulted due
to a combination of ultrasound with dendrimers [102].

31
1.7 Conclusions
In addition to diagnostic applications, ultrasound has gained a lot of interest in the
field of drug delivery. Enhancement of topical drug delivery using physical methods
such as ultrasound or sonophoresis has been in use since the last decade. However, the
ultrasound process parameters and its applications to increase the skin permeation of
drugs for newer diseases are ever-evolving. This review summarizes the fundamentals
of ultrasound, its biophysics and its applications in drug delivery with a special
emphasis on the use of ultrasound for topical drug delivery. It describes the process
parameters of ultrasound, which play a significant role on skin permeabilization.
Cavitation mechanism of ultrasound is considered to be the main factor responsible
for the increase in skin permeation. It has now been established that inertial cavitation
on account of low-frequency ultrasound can deliver drugs into the deeper layers of the
skin such as epidermis and dermis through structural alterations in the barrier
properties of skin exerted by stratum corneum. In order to make continuous
improvement in topical delivery, combination treatments of ultrasound with other
physical or chemical methods to enhance drug permeation have been now employed.
Further investigation is required to prove the potential of ultrasound as an effective
strategy to enhance drug delivery by continued assessment in vivo.
1.8 Percutaneous absorption using Franz diffusion study
Percutaneous absorption or dermal penetration as per the Organization for Economic
Cooperation and Development (OECD) guideline 2004 a, is a measure to evaluate the
absorption or penetration of a drug into and across the skin [103]. A series of
partitioning steps must be performed for a chemical from a formulation to be
absorbed percutaneously into and across the skin. The dermal percutaneous

32
absorption primarily occurs by passive diffusion although metabolism of the drug
might occur in the deeper regions of skin. The properties of the formulation, vehicle
containing the chemical and the chemical itself (physicochemical properties such as
lipophilicity, concentration, molecular weight), all together govern the rate of
partitioning the chemical into the skin. In addition to these governing factors,
physiological factors such as integrity of skin, temperature, disease state, and blood
flow also affect the percutaneous absorption of a chemical. As the chemical is in
direct contact with the stratum corneum, it will first diffuse into this layer followed by
diffusion across the SC layer. Permeation can be attributed to a single route or a
combination of routes namely intercellular, intracellular and transappendageal
(through hair follicles and sweat ducts). Penetration of a drug through stratum
corneum by the transepidermal route is the major pathway [104].
1.8.1 Theoretical considerations of percutaneous absorption
Percutaneous absorption is governed by the process of diffusion. Diffusion is defined
as the process of transfer of individual particles of a substance by molecular motion
across the concentration gradient. As the diffusion coefficient of all the skin layers,
(except stratum corneum) is negligible, diffusion coefficient value for stratum
corneum layer is represented. Thus, the transport of a chemical across the stratum
corneum follows Fick’s first law of mass transport;
Eq. 1
Where J is flux i.e. amount of drug permeated through the skin per unit time measured
as (mass/area.time), C is concentration of the diffusing drug, x is the spatial
coordinate measured normal to section, therefore,
is the concentration gradient, D
is the diffusion coefficient.

33
The following equation can express the dermal permeability coefficient (kp) as,
Eq. 2
Or
Eq. 3
Equations 2 and 3 give the following expression for the dermal permeability
coefficient or permeability constant,
Eq. 4
Where, Cv is concentration of the drug under sink conditions, Jss is the steady-state
flux of the solute, D is average diffusion coefficient (cm2/s or cm
2/h), Km is
distribution coefficient between stratum corneum and the vehicle or formulation, and
h is the thickness of the skin.
The permeability constant (kp) can also be calculated from the following relationship;
[ ] Eq. 5
Where, Q is the amount of drug transported across the skin in time t, Co and Ci are
the concentrations of the drug on donor and receptor side of the skin respectively, and
A is area of the exposed skin in cm2. Kp is measured in cm/min or cm/h [105].
1.8.2 In vitro dermal testing
Since the middle of the twentieth century, the foundations of measuring the in vitro
diffusion of drugs across the skin has been established [106]. In vitro techniques of
percutaneous absorption have been popular owing to its advantages such as ease of
technique with quick results. As per the OECD guidance document for the conduct of
skin absorption studies (2004a), in vitro methods were reported to generate a broad
range of data for drug delivery systems into and across the skin and can serve as

34
predictive models for risk assessment due to percutaneous absorption in humans [25]
[107]. In this method, a piece of excised skin is placed in a diffusion chamber and
drug-containing formulation is applied to one side of the skin. The presence of drug is
analyzed on the other side in a collection vessel using a suitable analytical method
[25].
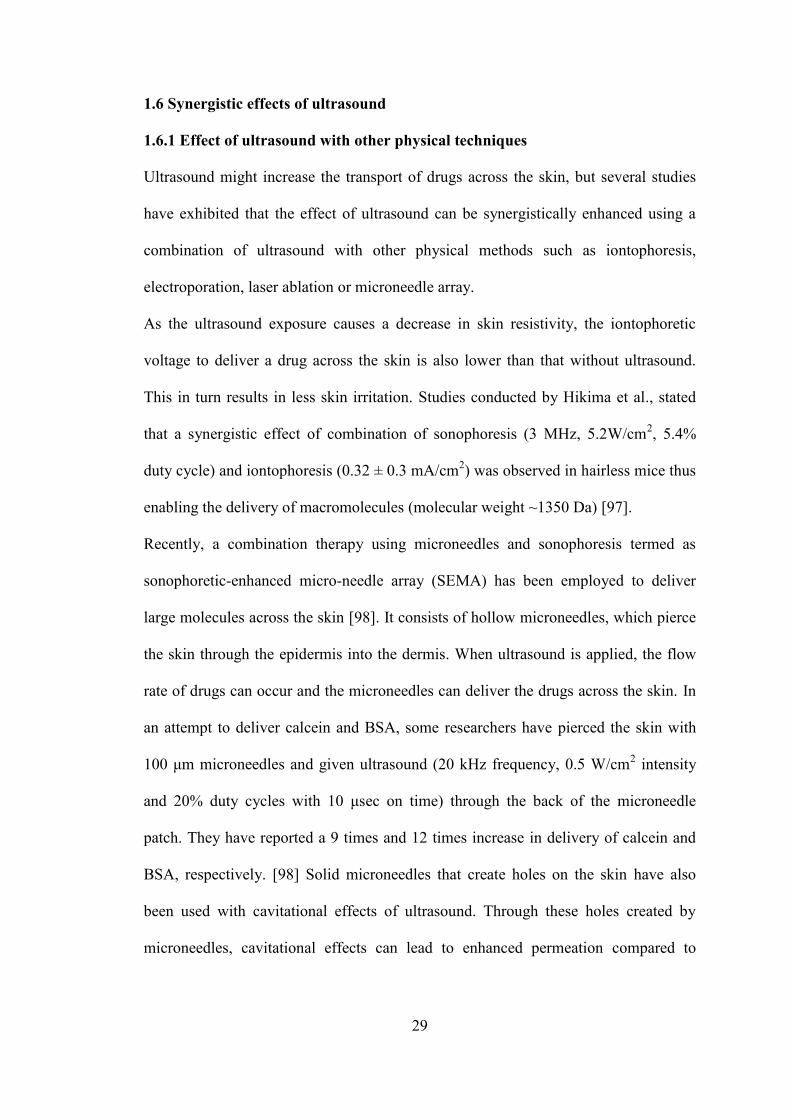
1.8.2.1 Franz diffusion cells
Franz diffusion cells consist of two chambers - donor and receptor chambers made up
of glass. A typical vertical Franz diffusion cell is shown in the Figure 1.8. In between
these two chambers, a skin sample is mounted. The chambers should provide a good
seal to the skin, facilitate proper mixing of receptor fluid and ensure easy sampling.
Temperature should be controlled to 32 ± 1˚C corresponding to normal skin
temperature. During the diffusion study, the receptor fluid is sampled at
predetermined time intervals and replaced with fresh receptor fluid. In the
percutaneous absorption studies, the amount of drug that has penetrated across the
skin in the receptor fluid per unit area is dependent on the applied concentration in
finite dose. This can be expressed as the percentage of the dose applied, which has
been percutaneously absorbed into the skin.
35
Figure 1.8: Vertical Franz diffusion cell
1.8.2.2 Receptor fluid
It is crucial to select a receptor fluid that has good solubility of the drug. Drug
stability in the receptor fluid should be examined. The receptor fluid should not affect
the skin integrity. The amount of drug present in the receptor fluid versus time should
be calculated for multiple time points (early time points, intermediate and at the end)
over a 24 h exposure period. The receptor fluid must be constantly stirred such that
there is no high concentration of the drug just below the skin, which could lead to a
falsely low diffusion rate and penetration.
1.8.2.3 Skin
Human skin or porcine ear skin, which closely resembles the human skin, is used for
in vitro permeation studies. The origin of skin, species, area (body site) from which
they are obtained and the storage conditions, for example wrapped in aluminum foil at

36
-20˚C should be taken into consideration and justified. Skin samples can be either
split-thickness (200-500 μm) or full- thickness (~1000 μm).
1.8.2.4 Skin integrity
Skin may be damaged during skin preparation in a percutaneous absorption study.
This would result in falsely increased drug concentration in the receptor chamber.
Hence, the assessment of integrity of the skin mounted in a Franz diffusion cell prior
to percutaneous absorption study is very important. The integrity measurement can be
performed using physical methods such as transepidermal water loss (TEWL), a
measure of natural water loss, or by measuring the electrical resistance of the skin,
using TER (Transcutaneous Electrical Resistance).
1.8.2.5 Application of the formulation
The application of the formulation on the skin affects lag time and flux depending on
the exposure area and its concentration in the donor chamber. For assessing the
steady-state flux, the amount of drug substance in a formulation that is applied onto
the skin should not be more than 10% of the drug absorbed during in vitro study.
1.8.2.6 Mass balance recovery
After the in vitro permeation study, a mass balance recovery of the applied dose
should be performed. Mass balance recovery is the sum of drug amount that did not
permeate through the skin (washed-off from the upper side of the skin using a
washing procedure after the exposure period), the amount of drug present in the
stratum corneum layer (measured using a sequential tape stripping method) [108], the
portion of drug present in the epidermis and dermis layers (determined using a heat

37
separation method) [107] and the drug amount permeated into the receptor fluid. The
mass balance recovery of a drug should be in the range of 100 ± 20% [103].
1.9 Attenuated Total Reflectance Fourier Transform Infrared (ATR-FTIR)
spectroscopy and its application in characterizing skin barrier
ATR-FTIR has been established as a simple and effective method of acquiring IR
spectra of several samples which cannot be analyzed using conventional transmission
techniques [109]. This is a type of internal reflectance spectroscopy in which the
sample is place in contact with an internal reflectance element made up of zinc
selenide (ZnSe) or germanium (Ge) [110]. For the internal reflectance to occur, the
ATR crystal element should be made up of a material that has a higher refractive
index than the sample. As it is used for the surface analysis of sample, the sample
should be in direct (close) contact with the ATR crystal element since the evanescent
wave only travels 0.5 – 5 μm thickness into the sample [109].
Among the several biophysical methods to study the skin and its barrier properties
exerted by stratum corneum, ATR-FTIR spectroscopy is a promising, highly sensitive
and non-invasive method to analyze samples rapidly. As the depth of penetration
ranges to about 1 to 1.5 cell layers of stratum corneum, spectra have information
about the surface of the sample [111]. Sequential tape-stripping is recommended to
obtain information about the layers beneath [112]. Elias and Friend in 1975, described
stratum corneum as a “bricks and mortar model”, where the bricks symbolize
corneocytes of stratum corneum, while the mortar signifies the intercellular lipid
matrix made up of a mixture of SC lipids namely ceramides, cholesterol and free
fatty acids [113] (Figure 1.9). This peculiar molecular organization of SC lipids is
responsible for its barrier properties and plays a crucial role in understanding skin
permeabilization [114, 115]. The domain mosaic model suggested by Forslind

38
proposes the supramolecular organization of lipids in ordered domains (gel phase),
depicted as an orthorhombic or hexagonal phase [116]. The orthorhombic phase
represents tightly packed lipids with their alkyl chains arranged in all-trans
conformations. This phase is connected by disordered domains depicted by lipids in a
liquid crystalline phase. The lipids are loosely packed in a hexagonal phase and the
degree of disorder increases towards the liquid-crystalline phase in which lipids have
greatest rotational freedom and their alkyl chains are arranged in gauche conformation
[114, 117, 118].
Figure 1.9: Molecular organization of stratum corneum showing the ordered and
disordered lipid phases of the lipid matrix of SC layer, modified from [119]
The IR spectrum of the SC layer, which depicts the lipid conformation, is invented
from hydrophobic alkyl chains [120]. The vibrational frequencies of the IR spectrum
that provide information about the skin lipids are listed in the Table 1.2. Among these,
the carbon – hydrogen stretching vibrations in the asymmetric and symmetric modes
depicted by peaks at 2850 cm-1
and 2920 cm-1
respectively, are the primary

39
characteristic vibrational peaks describing the conformational order of SC lipids [121,
122]. Thus, the peak width and its wavenumber or position in the IR spectrum defines
the molecular organization of lipids. Ideally, a shift of vibrational frequencies to a
higher wavenumber is an indication of more fluid structure formation. An
orthorhombic pattern of lipids is indicative of a stretching band at or around 2850 cm-
1 and as the degree of fluidity of the lipid alkyl chains increases, this stretching
vibrational band shifts to a higher wavenumber (~ 2852 cm-1
– 2854 cm-1
) [114]
[123].
Table 1.2: Vibrational frequencies of the stratum corneum lipids
Functional group Absorption
maximum (cm-1
)
SC physiologic
parameter
[CH3] 2960, 2870 SC lipids
[CH2] 2920; 2850 SC lipids
[C=O] amide I ~ 1645 SC proteins
[N-H] amide II ~1545 SC proteins
[O-H] 3000-3500 SC water
1.10 Econazole nitrate
Econazole nitrate (EN) is a well-established anti-fungal agent, which is an imidazole
derivative. It has been used for the treatment of yeast infections and other skin
infections like tinea, athlete’s foot and ringworm [124]. It is highly effective against
Candida albicans [125]. EN is highly lipophilic in nature (solubility in water 1.48
μg/ml) with a logP and pKa value of 5.5 and 6.6, respectively [126, 127]. Due to these
physicochemical properties of the drug, it is challenging for the drug to penetrate
deeper layers of the skin following topical application.
There is evidence that Transient Receptor Potential Melastatin 8 (TRPM8), a TRP
proteins which is a calcium permeable non-selective cation transporter protein, is
directly activated by cold temperatures (below 26˚C). TRPM8 has been convincingly

40
demonstrated to be the main molecular transducer responsible for the sensitivity to
innocuous cold [128, 129]. The role of TRPM8 in mediating attacks of RP and the
antagonizing properties of EN were studied by our collaborators (attn: Dr. Bashar
Kahaleh, Professor, Department of Medicine and Nezam Altorok, Assistant Professor,
Department of Medicine). They studied the endothelin (ET1) response in
microvascular endothelial cells (MVEC) in response to TRPM8 activation following
menthol exposure with and without EN. With an increase in menthol concentration,
the expression of ET1 increased (compared to control) and was returned to control
levels by econazole in a concentration dependent manner proving it to be an effective
TRPM-8 antagonist in treating RP [130] (figure 2.0).
Figure 1.10: Graph showing econazole effects on menthol (MT) induced ET1 mRNA
expression in normal endothelial cells.
The currently available marketed topical formulation of EN is a 1% cream used for
topical skin infections [126]. It suffers from several drawbacks. Macrogols and liquid
paraffin form major constituents of the cream formulation in which the drug is
partially suspended. Physical phase separation of the cream has been observed due to
econazole salting effect. More than 90% of the topically applied drug remains on the
skin due to its low solubility and thus resulting in poor skin permeation [126].
41
Ensuring the delivery of EN to the vasculature beneath the stratum corneum and
epidermal layers is important for achieving a topical therapy for RP [17, 130, 131]. To
this effect, new formulations containing 3% EN (F1_topical solution, F2_HPMC
dispersion, F3_VersaBase® cream and F4_Lipoderm
® Activemax™ Cream) to ensure
better penetration of the drug through the skin for treating RP were designed and
characterized in our lab. All four formulations showed better percutaneous absorption
of EN compared to the 1% marketed cream (data yet to be published).
42
Chapter 2
Significance of research
Topical drug delivery offers several advantages over oral and parenteral
administration such as: prevents drug degradation from hostile GI microenviroment
and presystemic metabolism [26]; reduces side-effects; unlike parenteral delivery
systems there is no pain associated with topical delivery [27]; better patient
adherence; reduces the frequency of drug administration; and reduces fluctuations in
plasma drug concentrations. However, the stratum corneum acts as a protective
barrier that limits the permeation of topically applied drugs across the skin. In this
regard, newer techniques have been employed to reversibly alter the barrier properties
of the stratum corneum to allow the entry of drugs across the skin.
Current treatment options for treating Raynaud’s phenomenon (RP) only alleviate
some the disease symptoms such as numbness, pain, vasospasm of digits due to cold
or emotional stress, discoloration of skin and pallor. These may not provide relief
from all the events of RP. To date, there is no FDA approved treatment for RP. The
dihydropyridine class of calcium channel blockers has been used as the first-line
therapy. In severe cases of RP, prostacyclins such as iloprost have been prescribed via
intravenous delivery. Despite these drug treatments used for the management of RP,

43
there is very little or weak evidence to support the use of these drugs, or others such
as phosphodiesterase-5-inhibitors, selective serotonin reuptake inhibitors, alpha
adrenergic receptor blockers and topical nitrates against RP. Topical delivery seems to
be a better option to treat RP than oral or intravenous routes due to the associated
disadvantages such as side-effects, hepatic first-pass and less patient adherence due to
use of needles and the associated pain. In RP, delivery of the drug beneath the barrier
layer of stratum corneum and into the epidermal skin layers (transepidermal delivery)
to the vasculature should be the focus of topical therapy.
In a recent study conducted by our collaborators, EN has been identified as a TRPM8
antagonist in treating RP and was found to normalize the imbalance in vascular tone
control associated with endothelial cells cold exposure. The marketed formulation of
EN is a 1% cream. However, it has drawbacks such as salting out of the drug due to
phase separation and low permeability of the drug. New topical formulations of 3%
EN developed in our lab showed better permeability of the drug than the marketed
formulation.
As topical drug delivery still faces the challenge of the skin itself acting as a barrier to
the entry of drugs, the skin barrier properties could be manipulated to achieve
effective therapy. This study presents the “proof-of-concept” data to show that
ultrasound therapy could be used to alter the structure of SC to facilitate EN delivery
into the deeper skin layers. We hypothesized the use of low-frequency ultrasound
therapy to enhance the skin permeability of EN from the newly developed
formulations in our lab. The purpose of this research was to optimize the ultrasound
process parameters and assess its effect on the penetration and permeation of topically

44
applied EN across the skin. This was hypothesized by investigating the cavitation
mechanism of ultrasound, which could be useful for enhancing the drug
permeabilization across skin in vitro. Attenuated Total Reflectance – Fourier
transform infra-red (ATR- FTIR) spectroscopy was used to study the influence of
formulations with and without ultrasound pretreatment on the organization of lipids in
the stratum corneum layer. Spectral shifts of C-H stretching vibrations were studied
using ATR- FTIR spectroscopy. Skin toxicity of the formulations was assessed and
the effect of ultrasound exposure on the skin was also evaluated.

45
Chapter 3
3.1 Abstract
Objectives: The focus of this investigation was to assess the ultrasound-assisted
econazole nitrate (EN) permeation from topically applied formulations for treating
Raynaud’s phenomenon. The aims of this study were i) to identify the ultrasound
parameters optimal for the percutaneous absorption of the drug, and ii) to assess the in
vitro percutaneous absorption of EN and toxicity in the porcine ear skin from different
topical formulations following ultrasound application.
Methods: Optimization of ultrasound parameters such as the distance of the horn,
application time and amplitude were performed. In vitro percutaneous absorption
studies were performed using different econazole formulations (F1_solution,
F2_HPMC dispersion, F3_Lipoderm® Activemax™ Cream and F4_Versabase
®
cream) across ultrasound-treated porcine skin and were compared with the control
group (skin samples not treated with ultrasound). Histological evaluation using
hematoxylin and eosin stain was carried out to assess the dermal toxicity of
formulations and ultrasound exposure. To further support the findings of ultrasound-
assisted drug permeation studies, ATR-FTIR was performed to investigate the effect

46
of ultrasound on the conformational changes in the stratum corneum lipids
characterized by the changes in spectral shifts.
Results: A constant frequency (20 kHz) ultrasound application with 40% amplitude,
0.5cm distance between ultrasound horn and skin surface for 2 minutes was
optimized. The permeation of EN was found to be higher from ultrasound- treated
skin samples than the control group. Drug permeation from F2_HPMC dispersion was
found to be higher as compared to other formulations and the marketed cream. The
lag time of ultrasound- treated skin samples were found to be significantly lower than
the control. Histological evaluation confirmed that F2_HPMC dispersion showed no
signs of toxicity. ATR-FTIR studies revealed a slight increase in the -CH2- stretching
vibrations (~ 2920 cm-1
and 2850 cm-1
) in ultrasound-treated skin samples as
compared with control. This confirms the reversible conformational changes in the
stratum corneum lipids, thereby enhancing the drug permeabilization.
Conclusions: The ultrasound-assisted transdermal delivery of F2_HPMC dispersion
could be explored as a new treatment option for Raynaud’s phenomenon.
47
3.2 Introduction
Topical and transdermal drug delivery possess several advantages over conventional
and parenteral administration such as prevention of drug metabolism by
gastrointestinal (GI) lumen and hepatic first- pass [132], reduction of GI side-effects
resulting from prolonged exposure to certain drugs [133], and non-invasiveness with
no pain or discomfort associated with needles and better patient adherence [27, 134,
135]. However, a drug molecule has to overcome the barrier properties of the skin in
order to enter systemic circulation. Skin protects the body from the external
environment, against microbes, UV radiation, allergens and prevents the loss of water
from the body. Skin acts as the major rate-limiting factor to topical and transdermal
drug permeation [33]. The outermost layer of the skin, stratum corneum (SC) is ~20
microns thick and is made up of hexagonal, highly ordered and compact cells called
corneocytes that are embedded in the lipid bilayer matrix. This peculiar structure of
SC acts as a diffusional barrier [136]. Thus, the actual drug concentration that
permeates the skin is reduced. Several physical and chemical methods to overcome
the barrier properties of the skin and to enhance the drug permeation have been
employed. Such methods include ablation, microneedles, iontophoresis,
electrophoresis, sonophoresis or ultrasound – assisted transdermal delivery and the
use of chemical penetration enhancers [38, 132-134, 137-139].
Ultrasound has been widely investigated as a non-invasive method to enhance the
transdermal permeation of drugs. This technique was first used to deliver
hydrocortisone across the skin for treating digital polyarthritis in 1954 [140]. In 2004,
SonoPrep® (Sontra Medical) was approved by FDA for the transdermal delivery of
local anesthesia [48, 141, 142]. Ultrasound-assisted drug delivery has been tested for

48
its ability to enhance localized permeation of drugs such as anti-inflammatory agents
such as (dexamethasone, and cortisol), local anesthetics (such as lidocaine and
prilocaine) and drugs used in orthopaedic diagnosis [143-145]. Recently, many
macromolecules such as proteins and peptides have also been successfully
administered using ultrasound-assisted transdermal delivery [146].
Ultrasound is defined as a longitudinal sound wave, i.e., mechanical energy which is
transferred by oscillating neighboring particles from one point to the other. Ultrasonic
acoustic waves have frequency above 20 kHz. There are three frequencies into which
the ultrasound is categorized: low-frequency ultrasound (20–100 kHz), therapeutic
ultrasound (0.7–3 MHz) and high-frequency ultrasound (>3MHz) [38, 66, 147-149].
Studies have reported that low-frequency ultrasound is more effective in enhancing
the transdermal drug permeation than high-frequency ultrasound [66], [149]. The
extent to which the ultrasound waves can penetrate into the skin is inversely
proportional to the ultrasound frequency [150]. The exact mechanism by which
ultrasound enhances drug permeation is still unclear, although there have been several
reports on the mechanisms of ultrasound namely, acoustic and thermal streaming and
inertial cavitation [139]. Cavitation is characterized by bubble formation due to
pressure changes induced in the coupling medium by ultrasound [57], [151]. The
formed bubbles cause disruption of the stratum corneum lipids, thereby increasing the
skin permeabilization.
Raynaud’s phenomenon (RP) is characterized by the reversible vasospasm of the
digits induced by cold exposure or emotional stress [19]. The exact cause of RP is
undetermined and the current treatment modalities are largely unsatisfactory and

49
associated with significant side effects. Transient Receptor Potential Melastatin 8
(TRPM8) is one of the TRP proteins, which is a calcium permeable non-selective
cation transporter protein that is directly activated by cold temperatures below 26˚C.
TRPM8 has been convincingly demonstrated to be the main molecular transducer
responsible for the sensitivity to innocuous cold [128], [129]. Recently, the role for
TRPM8 in mediating attacks of RP has been identified. The role of TRPM8 in
mediating attacks of RP and the antagonizing properties of econazole nitrate (EN)
were studied by our collaborators (attn: Dr. Bashar Kahaleh, Professor, Department of
Medicine and Dr. Nezam Altorok, Assistant Professor, Department of Medicine)
[130], [124]. EN has been widely used as an anti-fungal drug for the treatment of skin
infections such as tinea, athlete’s foot, ringworm and yeast infections. It is marketed
as a 1% topical cream. Physical phase separation of the cream has been observed due
to econazole salting effect. More than 90% of the topically applied drug remains on
the skin due to its low solubility and thus resulting in poor skin permeation [124].
Ensuring the delivery of EN to the vasculature beneath the stratum corneum and
epidermal layers is important for achieving a topical therapy for RP. In this regard,
our lab has developed and characterized four formulations containing 3% EN:
F1_solution; F2_HPMC dispersion; F3_VersaBase cream®; and F4_Lipoderm
®
Activemax™ Cream for ensuring the penetration of econazole through the skin to the
dermal vasculature, where cold sensing receptors are expressed by microvascular
endothelial cells. These formulations demonstrated an increase in the permeability of
the drug compared to the marketed formulation (Figure 3.1).

50
Figure 3.1: Percentage amount of econazole nitrate percutaneously absorbed into
different skin layers of prepared formulations compared to the marketed cream
In this study, the effect of low-frequency ultrasound on the skin permeability of EN
from the previously developed formulations (F1_solution, F2_HPMC dispersion,
F3_Versabase® cream and F4_Lipoderm
® Activemax™ Cream) was evaluated across
pig ear skin. For the effective treatment of RP, it is imperative that the drug permeates
and penetrates the skin rapidly providing prompt therapeutic action. We hypothesize
that the use of ultrasound would further enhance the permeation of EN across the
skin. Optimization of the critical ultrasound parameters such as the distance of the
horn, application time and ultrasound amplitude was performed. The influence of
formulations and ultrasound exposure on the stratum corneum structure of the skin
was determined depending on the spectral shifts of the C-H stretching vibrations using
attenuated total reflectance-Fourier transform infra-red (ATR- FTIR) spectroscopy.
Further, skin toxicity assessment of formulations and ultrasound exposure was
investigated.

51
3.3 Materials and methods
3.3.1 Materials
Ecoanzole nitrate was purchased from Alfa Aesar, (Ward Hill, MA). Distilled
deionized water was used for the preparation of buffers. High Performance Liquid
Chromatography (HPLC) grade solvents such as methanol (Lot 165479) and
ammonium dihydrogen phthalate (ADP) (Lot 120935) were provided from Fisher
Scientific (Pittsburgh, PA). The ingredients used for the preparation of phosphate
buffer pH 6.8 as coupling medium and receptor fluid consisted of potassium
phosphate monobasic (Lot 122120), sodium hydroxide pellets (Lot 101166) and
sodium chloride (Lot 123819) were also obtained from Fisher Scientific (Pittsburgh,
PA). Polyethylene glycol 400 was purchased from Hampton Research (Aliso Viejo,
CA). Sodium laureth sulfate (Lot 16134) was procured from Nature’s Oil, OH. D-
Squame (D-100) standard sampling discs/strips were purchased from CuDerm
Corporation, (Dallas, TX) for sequential tape stripping. Pig ears were obtained from
Kastel's Slaughter House & Processing Center (Riga, MI).
3.3.2 Ultrasound application
Low-frequency ultrasound was applied using a sonicator horn at 20 kHz frequency
(VCX 750, Sonics and Materials, Newton, CT, USA). A donor chamber of the Franz
diffusion cells was placed over the skin sample. The stratum corneum side of the skin
was facing the sonicator horn. The distance of horn and skin was adjusted to 0.5 cm.
Phosphate buffer (pH 6.8) was used as the coupling medium for sonophoresis. The
sonicator horn was then immersed in the donor chamber and ultrasound was applied
for a specific time. After the ultrasound treatment, skin was mounted in vertical Franz
diffusion cells for percutaneous absorption studies.
52
3.3.3 Determination of ultrasound intensity
Calorimetric method, as described by Mason et al., was used to measure the
ultrasound intensity. Fifty grams of water were placed in a beaker. The beaker was
then kept in a temperature controlled water bath. At specific time intervals, the
ultrasound was activated at different duty cycles. Changes in temperature after
ultrasound application were recorded. Using the following equation, ultrasound
intensity was calculated as:
Mass of water = 50 g
Specific heat capacity of water = 4.18 J/g ˚C
= rate of change of temperature of water
3.3.4 Optimization of ultrasound parameters
Optimization of various ultrasound parameters such as application time, amplitude
and horn distance was performed. To estimate the application time, ultrasound was
activated for 0.5, 1 and 2 minutes. In order to determine the effect of distance between
the horn and skin, 0.3, 0.5 and 1 cm distances from the skin were evaluated.
3.3.5 Transepithelial water loss (TEWL) measurement
Transepithelial water loss (TEWL) readings were used as an indicator to study
changes in the skin barrier properties. A sharp increase in TEWL values are observed
if the skin barrier properties are altered. TEWL was used as an important indicator to
optimize the ultrasound parameters. TEWL was measured before and after the

53
exposure of skin samples to the ultrasound in Franz diffusion cells. Skin samples were
equilibrated for 45 minutes before taking TEWL measurements.
3.3.6 High Performance Liquid Chromatography (HPLC) analysis
Waters HPLC (Alliance e2695 separation module, Milford, MA) equipped with 2998
PDA detector and C18 (Hypersil™ ODS Thermo scientific, MA) reverse phase
column (150mm X 4.6mm, 5μm particle size) was used for the analysis of econazole
nitrate. The mobile phase, containing of methanol: ammonium dihydrogen phosphate
(ADP) (85:15), was pumped into the column at a flow rate of 1 ml/minute. An
isocratic elution method was performed. The injection volume was 10 μl and the
absorbance for econazole nitrate was measured at 230 nm. A stock solution of mg/ml
econazole nitrate was prepared in methanol. Calibration standards ranging from 0.39 -
50 μg/ml were prepared in the mobile phase. Each calibration standard was analyzed
in triplicate and the average peak area was plotted against the concentration.
3.3.7 Preparation of porcine ear skin
Porcine ears of 3 month old pigs were obtained from a slaughterhouse (Kastel’s
Slaughter House Processing Center, Riga MI). The hair on skin was removed gently
with a razor. The subcutaneous fat layer was then carefully removed. Thickness of the
skin samples was measured using a digital electronic micrometer. Samples with
thickness around 0.8 mm to 1.5 mm were used for the study. The TEWL
measurements were taken and skin samples with TEWL values less than 13-15 g/m2 h
were selected for the study.

54
3.3.8 In vitro permeability study of econazole nitrate across porcine ear skin
In vitro percutaneous absorption study of EN from the formulations was performed
using Franz diffusion cells. The Franz cell apparatus is shown in figure 3.2. Porcine
ear skin with stratum corneum side-up was clamped between the donor and receptor
chamber. A 0.9% normal saline and polyethylene glycol (PEG 400) in a ratio of 70:30
was used as the receptor fluid. A magnetic bead was used to stir the medium
continuously at 300 rpm. The temperature of the receptor medium was maintained at
34 ± 0.5˚C by the circulating water jacket. The air bubbles in the receptor chamber
were carefully removed. After equilibration, the skin samples were pre-treated with
the optimized ultrasound parameters using phosphate buffer (pH 6.8) as the coupling
medium. TEWL values were measured again for ultrasound treated skin samples. The
skin sample without ultrasound pre-treatment, served as a control. Five hundred
milligrams of the marketed econazole nitrate cream or equivalent drug-loaded EN
formulations were placed in the donor chamber. The donor chamber and the opening
of the receptor sampling port were sealed with parafilm to prevent any evaporation.
Five hundred microliters of the receptor fluid sample were collected at pre-determined
time intervals for up to 16 hours. An equal volume of fresh receptor fluid was
replaced after each sampling. The samples were analyzed using a validated HPLC
method for quantifying the drug, both permeated and penetrated.
Figure 3.2: Franz diffusion cell apparatus

55
3.3.9 Mass balance recovery
The mass balance recovery was obtained by adding the amount of drug removed from
the skin surface at the end of in vitro study (washing) with the drug adsorbed into the
stratum corneum, epidermis and dermis layers and the drug permeated through the
skin (receptor fluid concentration). Our current recovery limits ranged from 80-120%.
3.3.9.1 Washing procedure
A 5% solution of sodium lauryl ether sulfate (SLES) was prepared in distilled water.
After the in vitro skin exposure, the excess formulation was removed from the skin
surface using Q-tips and transferred into a container. This was followed by the
addition of 2 ml of the SLES solution to the donor chamber, rinsing the application
site and wiping off using Q-tips. This was repeated thrice such that a volume of 6 ml
SLES solution was used to wash off one diffusion cell. All Q-tips were returned to the
original container and 6 ml of methanol was added as the extraction solvent. The drug
was extracted by shaking the vials in a Thermoshaker for 16 hours at 1400 rpm. Then
they were sonicated for 15 minutes and centrifuged at 7000 rpm. Supernatants were
filtered through Waters EDGE 0.22 μm filter and analyzed using the HPLC method.
3.3.9.2 Sequential tape stripping
After the washing procedure, the skin surface was dried using Kimwipes. An adhesive
tape (D-Squam D100 strip) was placed on the skin surface and a constant pressure or
a weight of 150 g/cm2 was applied for 10 seconds. Then the strip was removed using
tweezers. The same procedure was repeated for the next strips. A maximum of 20
strips were used for a single diffusion cell. The strips were extracted with 6 ml
methanol and agitated on Thermoshaker for 16 hours at 1400 rpm. Then they were
56
sonicated for 15 minutes and centrifuged at 7000 rpm. Supernatants were filtered
through Waters EDGE 0.22 μm filter and analyzed using the developed HPLC
method.
3.3.9.3 Heat separation of epidermis and dermis
Upon removal of the stratum corneum layer, underlying epidermis was separated
using the heat treatment technique. The skin surface was heated using a hair dryer and
the epidermis was removed using a scalpel blade and separated from the dermis. The
epidermis and dermis were extracted with methanol (1ml) and agitated in a
Thermoshaker for 16 h at 1400 rpm. Then they were sonicated for 15 minutes and
centrifuged at 7000 rpm. Supernatants were filtered through Waters EDGE 0.22 μm
filter and analyzed using the HPLC method.
3.3.10 Skin toxicity assessment of the formulations
3.3.10.1 Histological evaluation
After 10 hours of in vitro study, the skin samples were wiped off with Kim-wipes to
remove the excess formulation. Sequential tape stripping was performed on the
samples to evaluate the impact of stripping on the skin integrity. Some samples were
kept intact as controls. The skin specimens were fixed in 10% neutral buffered
formalin for 24 hours. A ratio of 20:1 formalin to tissue was used to properly fix the
skin specimens. Then they were transferred into 70% ethanol. Skin specimens were
transferred to labeled cassettes (perforated baskets). Tissue processing was done by
immersing skin samples in a sequence of increasing concentrations (70%, 90% and
100%) of ethanol solutions. A clearing agent such as xylene was then used to displace
ethanol in skin samples. The tissue was infiltrated with molten paraffin wax at 60˚C
57
and then allowed to cool to 20˚C. Thus, paraffin blocks were obtained, which allowed
consistent sectioning of specimens. Thin sections of 5 microns were cut using a rotary
microtome (Reichert-Jung 2030 microtome, Reichert Technologies). Sections were
then floated on a water bath maintained at 40 - 45˚C, to get rid of any wrinkles and
then mounted on glass slides. The cut sections were colored by haematoxylin and
eosin. Glass slides were dried in an oven overnight at 37˚C. Sections were examined
by optical microscopy using Cytation™ 5 (Cell Imaging Multi-Mode Reader, Biotek
Instruments, Inc) at 4X and 20X magnification. Any histological changes in different
skin layers after application of formulations and the impact of ultrasound on the skin
specimens was examined. Appropriate control samples were also evaluated.
3.3.11 Attenuated Total Reflectance Fourier Transform Infrared Spectroscopy
Valuable information about the molecular structure of the stratum corneum (SC), its
lipid, protein and water content, drug penetration in the SC region and its impact on
barrier function was evaluated by Fourier Transform Infrared (FTIR) spectroscopic
measurement by Attenuated Total Reflection (ATR) method. To determine the
modifications in the deeper regions of SC, ATR-FTIR is combined with the sequential
tape stripping method. After the end of the in vitro Franz study, the skin samples were
wiped off with Kim-wipe to remove the excess formulation. An adhesive tape (D-
Squam D100 strip) was placed on the skin surface and a constant pressure or a weight
of 150 g/cm2 was applied for 10 seconds. Then the strip was removed using tweezers.
The first strip was discarded due to possible surface contamination. The tape stripping
procedure was repeated while recording the spectrum of the skin sample for up to 18
strips. The skin samples, without application of formulations and without the
application of ultrasound, served as controls. All ATR-FTIR spectra were recorded

58
using Varian Excalibur Series FTIR spectrometer (Microscope mode) equipped with a
horizontal ZnSe crystal (45˚). Spectra were recorded between 4000 cm−1
and 400
cm−1
at 4 cm−1
spectral resolution and 144 scans were co-added. IR spectra of the pure
drug and the formulations were also recorded.
3.3.12 Statistical analysis
All the experiments were carried out in triplicate. The results were expressed as mean
± standard deviation (SD). The data was analyzed statistically using a Student’s t-test
and/or one way ANOVA and p values < 0.05 were considered to be statistically
significant.
3.4 Results and Discussion
3.4.1 HPLC analysis
A RP-HPLC method was developed for EN. The retention time of EN (λmax= 230 nm)
was found to be 7.4 minutes as shown in the figure 3.3.
Figure 3.3: HPLC chromatogram of econazole nitrate. Samples were analyzed using
a Waters Alliance e2695 separation module (Milford, MA) equipped with a 2998
PDA detector
2.616
2.961 3.8
51
7.471
AU
0.000
0.002
0.004
0.006
0.008
0.010
0.012
0.014
0.016
0.018
0.020
0.022
0.024
0.026
0.028
Minutes
0.00 1.00 2.00 3.00 4.00 5.00 6.00 7.00 8.00 9.00 10.00

59
3.4.2 Ultrasound pre-treatment
Ultrasound or sonophoresis is a non-invasive method to enhance the drug permeation
transdermally, though the exact mechanism is difficult to construe. This technique has
the potential to overcome the skin barrier properties, which are demonstrated as rate-
limiting for drug delivery, and facilitate drug delivery [38]. Ultrasound-assisted
transdermal delivery has been utilized to enhance the delivery of counter irritants,
anaesthetics and anti-inflammatory drugs [152]. Although, both high or therapeutic
frequency (1 MHz) and low-frequency ultrasound (20-100 kHz) are used in the
transdermal delivery of drugs, recent research has reported that low-frequency
ultrasound therapy is more effective compared to the high-frequency ultrasound [38,
50, 138]. This increased effectiveness of low-frequency ultrasound over therapeutic
frequency is due to inverse relation of ultrasound frequency to acoustic cavitation
bubbles [153]. The cavitation bubbles generated by high-frequency ultrasound are ~3
microns in size and cause some disorder in stratum corneum structure (stable
cavitation), while low-frequency ultrasound produced larger bubbles of ~150 microns
outside the skin at the liquid-solid interface and implode instantly, a phenomenon
called as inertial cavitation [58], [154]. This in turn results in the formation of
microjets, which enhance the permeability of the skin. Hence, in the present study, a
low-frequency (20 kHz) ultrasound was evaluated for the transdermal permeation of
econazole nitrate. A continuous mode, i.e. 100% duty cycle of ultrasound, was used.
Pulsed-ultrasound treatment may be effective; however, in accordance with the
studies conducted by Mitragotri et al. increase in skin permeability with respect to an
increase in skin conductivity values was independent of the duty cycle [74]. The
continuous ultrasound treatment increased accumulation of drug in skin. A possible

60
explanation for such an occurrence might be a rapid increase in thermal effects
associated with continuous ultrasound as compared to the pulsed [75].
3.4.3 Optimization of ultrasound parameters
3.4.3.1 Distance of horn
In sonophoresis, horn-to-skin distance is one of the important variables to achieve
efficient permeability. Several studies have been performed for both high-frequency
ultrasound and low-frequency ultrasound, ranging from zero tip displacement when
the ultrasound horn is in contact of skin (common with high-frequency ultrasound) to
1 cm in case of low-frequency ultrasound [55, 73, 82, 101, 155]. The distance of the
horn from skin was varied at 0.3 cm, 0.5 cm and 1.0 cm and its effect of drug
permeation was evaluated. At a distance of 0.3 cm from the skin, there was damage to
the skin evident by the complete removal of the epidermal layer. Hence, further
investigations on permeation profile were performed for distance of 0.5 cm and 1 cm.
It was found that as the horn-to-skin distance decreased from 1 cm to 0.5 cm, the EN
permeation increased as shown in Figure 3.4.

61
Figure 3.4: Effect of horn-to-skin distance on the permeation of econazole nitrate.
Ultrasound activated for 2 minutes, phosphate buffer pH 6.8 as coupling medium,
40% amplitude.
TEWL measurements were performed to evaluate the effect of distance on drug
permeation. TEWL values decreased as the horn-to-skin distance increased from 0.5
cm to 1 cm. The process of cavitation, a predominant mechanism of ultrasound, is
dependent on the distance between the ultrasound horn and skin surface. Cavitation
impact might be reduced when the distance is increased. This finding is in good
agreement with the study conducted by Terahara et al. which showed that the acoustic
pressure amplitude at the skin surface increased resulting in enhanced efficiency of
ultrasound as the distance between the horn and skin decreased. [73], [82] Therefore,
0.5 cm distance between the ultrasound horn and the skin surface was considered
optimum.
0
50
100
150
200
250
0 5 10 15 20
Aver
age
cum
ula
tive
am
ou
nt
of
dru
g
Time (hours)
1 cm
0.5 cm
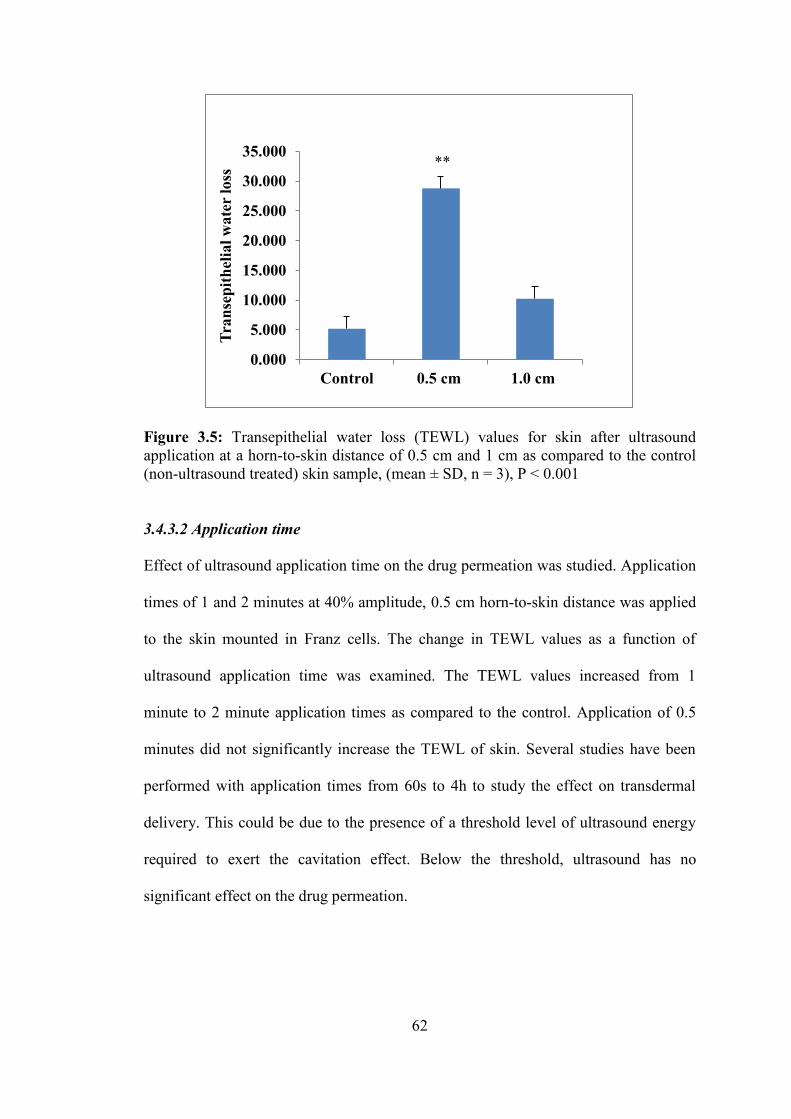
62
Figure 3.5: Transepithelial water loss (TEWL) values for skin after ultrasound
application at a horn-to-skin distance of 0.5 cm and 1 cm as compared to the control
(non-ultrasound treated) skin sample, (mean ± SD, n = 3), P < 0.001
3.4.3.2 Application time
Effect of ultrasound application time on the drug permeation was studied. Application
times of 1 and 2 minutes at 40% amplitude, 0.5 cm horn-to-skin distance was applied
to the skin mounted in Franz cells. The change in TEWL values as a function of
ultrasound application time was examined. The TEWL values increased from 1
minute to 2 minute application times as compared to the control. Application of 0.5
minutes did not significantly increase the TEWL of skin. Several studies have been
performed with application times from 60s to 4h to study the effect on transdermal
delivery. This could be due to the presence of a threshold level of ultrasound energy
required to exert the cavitation effect. Below the threshold, ultrasound has no
significant effect on the drug permeation.
0.000
5.000
10.000
15.000
20.000
25.000
30.000
35.000
Control 0.5 cm 1.0 cm
Tra
nse
pit
hel
ial
wa
ter
loss
**

63
Figure 3.6: TEWL measurements of porcine ear skin at 1 minute and 2 minute
ultrasound application time; (mean + SD), n=3 P <0.0001
Increase in ultrasound exposure time resulting in increased drug permeation has been
reported to level off. Thus, an increase in exposure time beyond a cut-off value may
not necessarily enhance drug permeation. This can be attributed to a phenomenon
called acoustic decoupling, in which the total amount transported through the skin is
much less than what is actually produced at the ultrasound horn due to the formation
of cavitation exerted gaseous bubbles. [74] [76] The thermal effects attributed by an
increase in the temperature due to longer exposure times should be accounted for and
avoided.
3.4.4 Percutaneous absorption
Porcine skin mimics the human skin in various anatomical, physiological and
immunological aspects [156-158]. The thickness of the porcine stratum corneum and
epidermis is ~20-25 μm and 30-140 μm, respectively, while the thickness of human
skin stratum corneum and epidermis is ~20-25 μm and 50-120 μm, respectively. Thus,
0
5
10
15
20
25
30
35
Control 1 minute 2 minute
Tra
nse
pit
hel
ial w
ate
r loss
***

64
porcine skin can be considered as a good substitute for human skin in ex vivo
permeation studies [159, 160]. Several studies using porcine skin have been used to
evaluate transdermal permeation [161], topical drug delivery [162], assessment of
infectious skin diseases, skin toxicity assessment and skin immunology [163-165].
Hence, in this study, porcine skin being comparable with human skin was selected as
a model to evaluate the percutaneous absorption of EN formulations. As per the
OECD Guideline 2004 [103], for the conduct of skin penetration, in vitro method for
percutaneous absorption of a drug formulation has been widely accepted. This model
has manifold advantages over in vivo methods, as skin tissue of animals and humans
can be used equivalently; sample replicates can be taken, anticipated exposure
conditions can be mimicked, and the effect of skin toxicity on percutaneous
absorption can be examined. The choice of method, either in vitro or in vivo, depends
on the regulatory authority. In the present study, an in vitro method to measure the
penetration and permeation of EN across different skin layers was employed. An open
chamber design such as Franz diffusion cell was used as it has been reported to better
mimic the in vivo performance [166].
In this study, we attempted to determine the effect of ultrasound on the penetration
and permeation of topically applied EN across pig ear skin. Using the optimized
ultrasound parameters, i.e. 20 kHz frequency, 0.5cm distance between the ultrasound
horn and the skin sample and 40% amplitude in continuous mode, it was
demonstrated that the percutaneous absorption of the drug (amount penetrated and
permeated) into different skin layers, (namely stratum corneum, epidermis and
dermis) was almost twice compared to the control samples (skin samples which did
not receive ultrasound pre-treatment). The order of percent of drug permeated for the

65
ultrasound pre-treated skin samples from highest to lowest was F2_HPMC dispersion
(7.10% ±0.16%) > F4_Lipoderm® Activemax™ (3.15% ± 0.22%) > F1_solution
(2.49% ±0.49%) > F3_Versabase® cream (1.51% ± 0.41%) > marketed formulation
(1.16% ±0.36%). The control samples showed the percent of drug permeation in the
same order of formulation such as F2_HPMC dispersion (5.79% ± 0.5%) >
F4_Lipoderm® Activemax™ (1.63% ± 0.2%) > F1_solution (1.40% ± 0.19%) >
F3_Versabase® cream (0.92% ± 0.29%) > marketed formulation (0.67% ± 0.05%).
The amount of drug penetrated into different skin layers was almost twice in
ultrasound pre-treated skin samples as compared to the control (Fig. 3.8).
Figure 3.7: In vitro diffusion of econazole nitrate from F2_HPMC dispersion across
porcine ear skin; mean ± SEM, (n=3)
0
50
100
150
200
250
0 5 10 15 20
Cu
mu
lati
ve
am
ou
nt
of
dru
g r
elea
sed
per
un
it a
rea (
μg/s
q.c
m)
Time (hours)
F2_HPMC dispersion
control Ultrasound
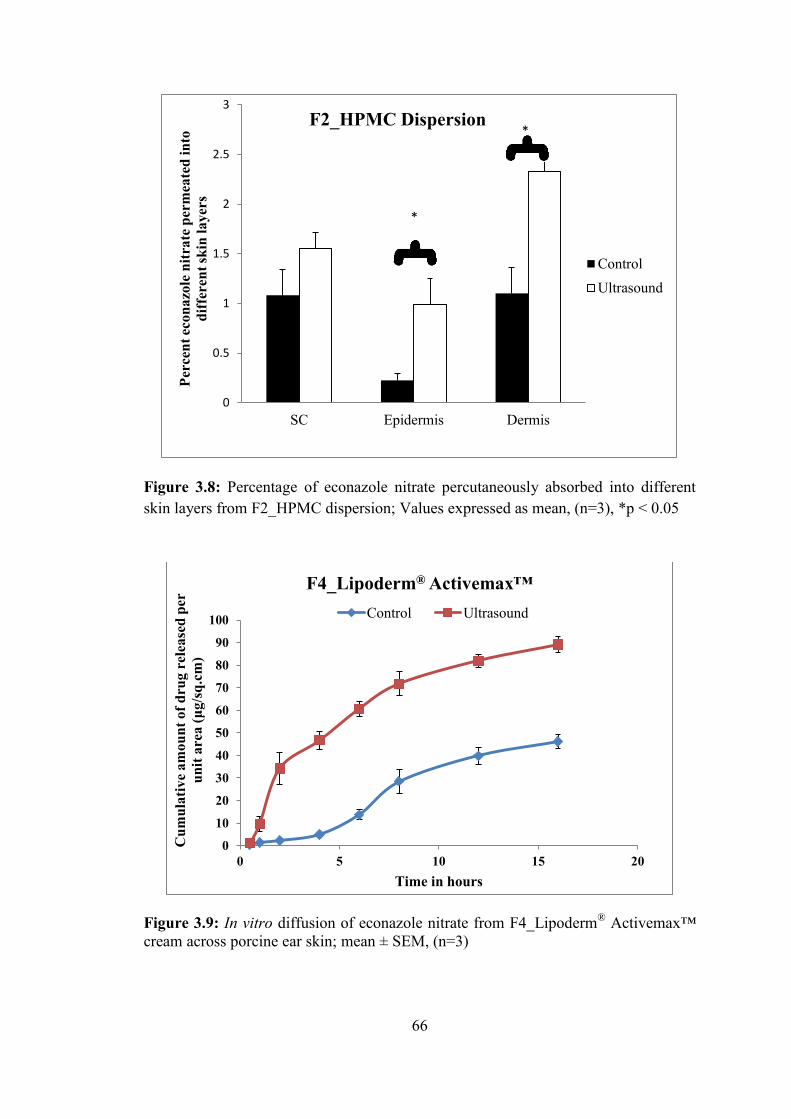
66
Figure 3.8: Percentage of econazole nitrate percutaneously absorbed into different
skin layers from F2_HPMC dispersion; Values expressed as mean, (n=3), *p < 0.05
Figure 3.9: In vitro diffusion of econazole nitrate from F4_Lipoderm® Activemax™
cream across porcine ear skin; mean ± SEM, (n=3)
0
0.5
1
1.5
2
2.5
3
SC Epidermis Dermis
Per
cen
t ec
on
azo
le n
itra
te p
erm
eate
d i
nto
dif
fere
nt
skin
la
yer
s
F2_HPMC Dispersion
Control
Ultrasound
*
*
0
10
20
30
40
50
60
70
80
90
100
0 5 10 15 20
Cu
mu
lati
ve
am
ou
nt
of
dru
g r
elea
sed
per
un
it a
rea (
μg/s
q.c
m)
Time in hours
F4_Lipoderm® Activemax™
Control Ultrasound

67
Figure 3.10: Percentage of econazole nitrate percutaneously absorbed into different
skin layers from F4_Lipoderm® Activemax™ cream; Values expressed as mean,
(n=3), *p < 0.05
Figure 3.11: In vitro diffusion of econazole nitrate from F1_Solution across porcine
ear skin; mean ± SEM, (n=3)
0
1
2
3
4
5
6
7
8
SC Epidermis Dermis
Per
cen
t ec
on
azo
le n
itra
te p
erm
eate
d w
ith
dif
fere
nt
skin
la
yer
s
F4_Lipoderm® Activemax™
Control Ultrasound
0
10
20
30
40
50
60
70
80
90
0 5 10 15 20
Cu
mu
lati
ve
am
ou
nt
of
dru
g r
elea
sed
per
un
it a
rea (
μg/s
q.c
m)
Time in hours
F1_Solution
Control Ultrasound

68
Figure 3.12: Percentage of econazole nitrate percutaneously absorbed into different
skin layers from F1_Solution; Values expressed as mean, (n=3), * p<0.05,
*** p<0.001
Figure 3.13: In vitro diffusion of econazole nitrate from F3_Versabase® cream across
porcine ear skin; mean ± SEM, (n=3)
0
1
2
3
4
5
6
SC Epidermis DermisPer
cen
t ec
on
azo
le n
itra
te p
erm
eate
d i
nto
dif
fere
nt
skin
la
yer
s
F1_Solution
Control Ultrasound
***
*
0
5
10
15
20
25
30
35
40
45
50
0 5 10 15 20
Cu
mu
lati
ve
am
ou
nt
of
dru
g r
elea
sed
per
un
it a
rea (
μg/s
q.c
m)
Time in hours
F3_Versabase® cream
Control Ultrasound
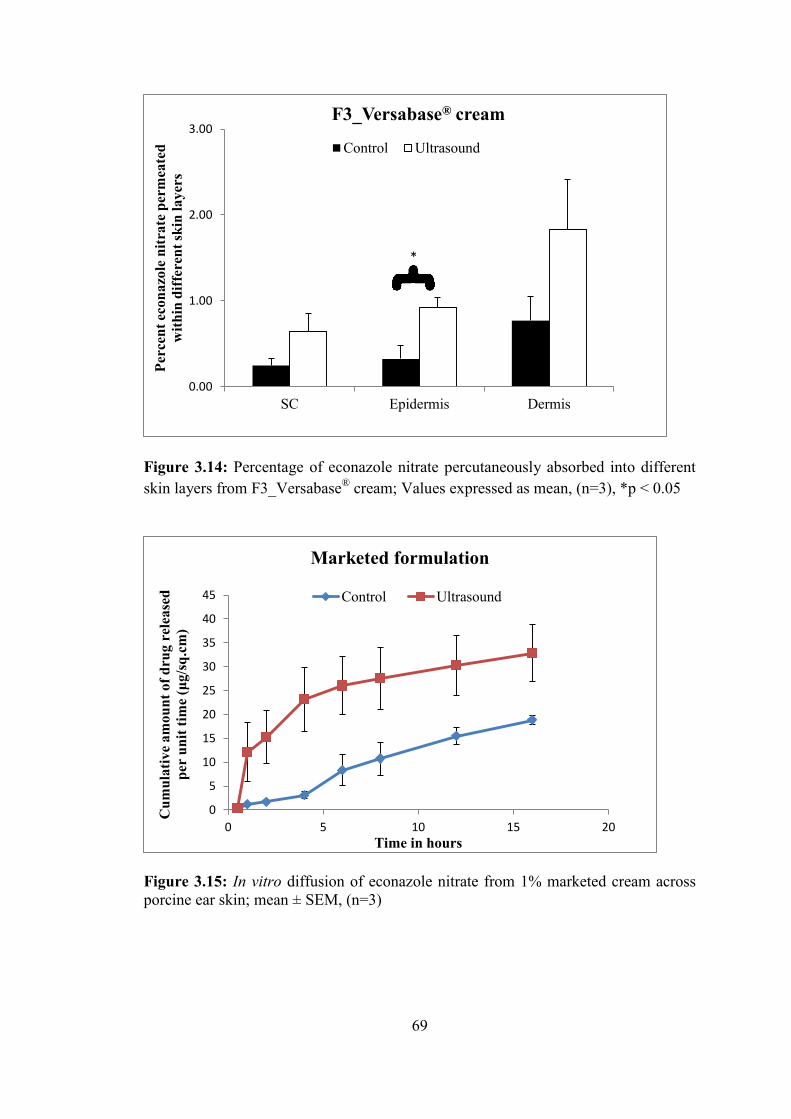
69
Figure 3.14: Percentage of econazole nitrate percutaneously absorbed into different
skin layers from F3_Versabase® cream; Values expressed as mean, (n=3), *p < 0.05
Figure 3.15: In vitro diffusion of econazole nitrate from 1% marketed cream across
porcine ear skin; mean ± SEM, (n=3)
0.00
1.00
2.00
3.00
SC Epidermis Dermis
Per
cen
t ec
on
azo
le n
itra
te p
erm
eate
d
wit
hin
dif
fere
nt
skin
la
yer
s
F3_Versabase® cream
Control Ultrasound
*
0
5
10
15
20
25
30
35
40
45
0 5 10 15 20
Cu
mu
lati
ve
am
ou
nt
of
dru
g r
elea
sed
per
un
it t
ime
(μg/s
q.c
m)
Time in hours
Marketed formulation
Control Ultrasound
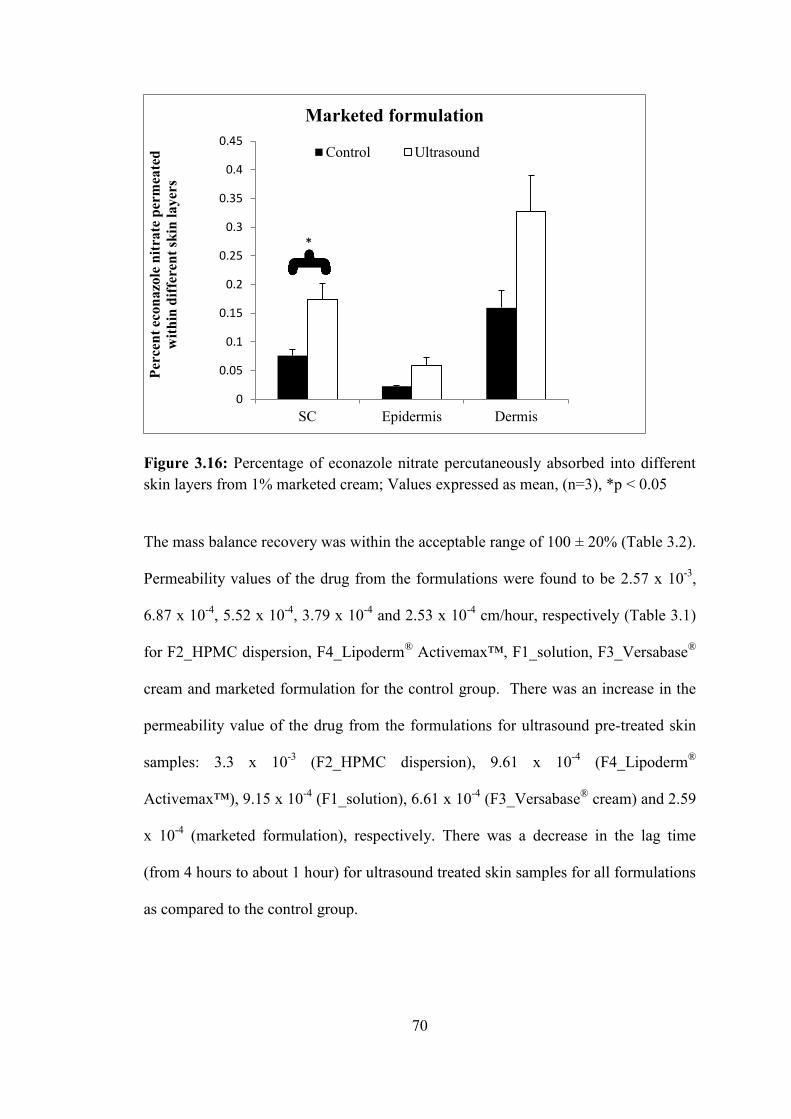
70
Figure 3.16: Percentage of econazole nitrate percutaneously absorbed into different
skin layers from 1% marketed cream; Values expressed as mean, (n=3), *p < 0.05
The mass balance recovery was within the acceptable range of 100 ± 20% (Table 3.2).
Permeability values of the drug from the formulations were found to be 2.57 x 10⁻³
,
6.87 x 10⁻⁴
, 5.52 x 10⁻⁴
, 3.79 x 10⁻⁴
and 2.53 x 10⁻⁴
cm/hour, respectively (Table 3.1)
for F2_HPMC dispersion, F4_Lipoderm® Activemax™, F1_solution, F3_Versabase
®
cream and marketed formulation for the control group. There was an increase in the
permeability value of the drug from the formulations for ultrasound pre-treated skin
samples: 3.3 x 10⁻³
(F2_HPMC dispersion), 9.61 x 10⁻⁴
(F4_Lipoderm®
Activemax™), 9.15 x 10⁻⁴
(F1_solution), 6.61 x 10⁻⁴
(F3_Versabase® cream) and 2.59
x 10-4
(marketed formulation), respectively. There was a decrease in the lag time
(from 4 hours to about 1 hour) for ultrasound treated skin samples for all formulations
as compared to the control group.
0
0.05
0.1
0.15
0.2
0.25
0.3
0.35
0.4
0.45
SC Epidermis Dermis
Per
cen
t ec
on
azo
le n
itra
te p
erm
eate
d
wit
hin
dif
fere
nt
skin
la
yer
s
Marketed formulation
Control Ultrasound
*

71
Table 3.1: Apparent permeability (Papp), flux of econazole nitrate across excised porcine skin and lag time. Values are expressed as mean ±
SEM, n=3.
Control Ultrasound
Formulation Papp (cm/h)
Flux
(µg/cm2/h)
Lag time
(hours) Papp (cm/h)
Flux
(µg/cm2/h)
Lag time
(hours)
F2_HPMC Dispersion 2.57 x 10⁻³
12.858 ± 1.01 3.7 ± 0.15 3.3 x 10⁻³
16.49 ± 1.12 1.1 ± 0.22
F3_Lipoderm 6.87 x 10⁻⁴
3.434 ± 2.44 4.0 ± 0.00 9.61 x 10⁻⁴
4.80 ± 4.14 1.0 ± 0.00
FI_solution 5.52 x 10⁻⁴
2.760 ± 2.98 4.0 ± 0.00 9.15 x 10⁻⁴
4.57 ± 4.76 0.3±0.00
F4--Versabase cream 3.79 x 10⁻⁴
1.89 ± 0.26 7.0± 2.00 6.61 X 10⁻⁴
3.30 ± 0.45 2.7 ± 1.15
Marketed formulation 2.53 x 10⁻⁴
1.262 ± 0.08 4.0 ± 0.03 2.59 x 10⁻⁴
1.29 ± 0.25 1.0 ± 0.19

72
Table 3.2: Total absorption and mass balance results (as a percentage of the applied dose) of econazole nitrate across porcine ear skin.
Percutaneous absorption and permeation values from different formulations on control group and after ultrasound treatment, into and through the
intact porcine ear skin over 16 hours from a single application. Values expressed as mean ± standard deviation
Control (without ultrasound treatment)
Percent unpermeated drug
Formulation Stratum
Corneum Epidermis Dermis Washing
Percent drug
permeated Mass balance (%)
F2_HPMC Dispersion 1.08 ± 0.45 0.22 ± 0.11 1.10 ± 0.45 89.98 ± 1.12 5.80 ± 0.50 96.19 ± 4.72
F4_Lipoderm®
0.78 ± 0.05 0.25 ± 0.09 0.95 ± 0.14 82.81 ± 3.67 1.63 ± 0.18 86.42 ± 4.02
F1_solution 0.80 ± 0.53 0.31 ± 0.02 0.91 ± 0.04 83.45 ± 0.92 1.40 ± 0.19 86.87 ± 1.51
F3_Versabase® cream 0.25 ± 0.14 0.32 ± 0.27 0.77 ± 0.50 86.31 ± 3.64 0.92 ± 0.29 88.56 ± 4.63
Marketed formulation 0.08 ± 0.02 0.02 ± 0.00 0.16 ± 0.05 87.78 ± 4.68 0.67 ± 0.06 88.70 ± 4.71
After ultrasound treatment
Percent unpermeated drug
Formulation Stratum
Corneum Epidermis Dermis Washing
Percent drug
permeated Mass balance (%)
F2_HPMC Dispersion 1.56 ± 0.27 0.99 ± 0.46 2.32 ± 0.19 89.25 ± 2.61 7.10 ± 0.16 101.2 ± 2.65
F4_Lipoderm®
0.42 ± 0.52 0.32 ± 0.05 1.91 ± 0.35 89.76 ± 1.13 3.15 ± 0.22 95.56 ± 1.55
F1_solution 1.63 ± 0.22 0.60 ± 0.10 1.76 ± 0.04 87.29 ± 6.29 2.49 ± 0.50 93.76 ± 6.74
F3_Versabase® cream 0.64 ± 0.37 0.92 ± 0.22 1.83 ± 1.00 87.00 ± 6.53 1.51 ± 0.41 91.90 ± 6.62
Marketed formulation 0.17 ± 0.05 0.06 ± 0.02 0.33± 0.11 89.87 ± 6.76 1.16 ± 0.36 91.59 ± 6.83
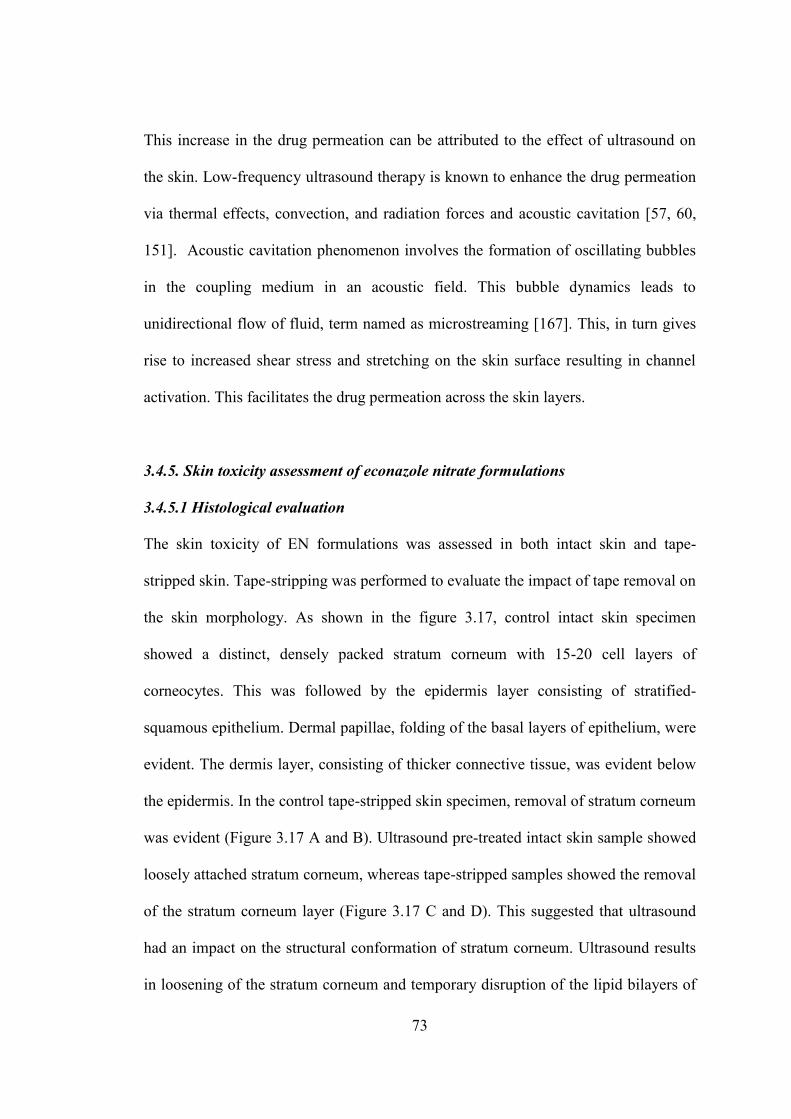
73
This increase in the drug permeation can be attributed to the effect of ultrasound on
the skin. Low-frequency ultrasound therapy is known to enhance the drug permeation
via thermal effects, convection, and radiation forces and acoustic cavitation [57, 60,
151]. Acoustic cavitation phenomenon involves the formation of oscillating bubbles
in the coupling medium in an acoustic field. This bubble dynamics leads to
unidirectional flow of fluid, term named as microstreaming [167]. This, in turn gives
rise to increased shear stress and stretching on the skin surface resulting in channel
activation. This facilitates the drug permeation across the skin layers.
3.4.5. Skin toxicity assessment of econazole nitrate formulations
3.4.5.1 Histological evaluation
The skin toxicity of EN formulations was assessed in both intact skin and tape-
stripped skin. Tape-stripping was performed to evaluate the impact of tape removal on
the skin morphology. As shown in the figure 3.17, control intact skin specimen
showed a distinct, densely packed stratum corneum with 15-20 cell layers of
corneocytes. This was followed by the epidermis layer consisting of stratified-
squamous epithelium. Dermal papillae, folding of the basal layers of epithelium, were
evident. The dermis layer, consisting of thicker connective tissue, was evident below
the epidermis. In the control tape-stripped skin specimen, removal of stratum corneum
was evident (Figure 3.17 A and B). Ultrasound pre-treated intact skin sample showed
loosely attached stratum corneum, whereas tape-stripped samples showed the removal
of the stratum corneum layer (Figure 3.17 C and D). This suggested that ultrasound
had an impact on the structural conformation of stratum corneum. Ultrasound results
in loosening of the stratum corneum and temporary disruption of the lipid bilayers of

74
the stratum corneum [63, 168, 169]. The lipid bilayers of stratum corneum are
susceptible to conformational changes such as reduction in thickness and lateral
extension [63, 170, 171]. This is demonstrated by a significant reduction in the highly
ordered structure of the lipid bilayers, leading to a loss in their structural integrity.
Figure 3.17: Hematoxylin and eosin staining of the control samples; 4X
magnification; A) untreated intact; B) untreated tape stripped; C) ultrasound-treated
intact; D) ultrasound-treated tape stripped
This phenomenon facilitates drug penetration and permeability across the skin. Thus,
there is a significant increase in the skin permeability of the drug in ultrasound-
pretreated samples as compared to the control. As shown in the figure 3.17, there was
minimal damage of the epidermis with no necrosis due to the application of
ultrasound. The skin specimens, on which F4_Lipoderm® Activemax™ cream was

75
applied (figure 3.18), showed signs of skin toxicity with the presence of infiltration of
cells and necrosis.
The histology study of the formulations suggested that the F2_HPMC dispersion
formulation did not show any signs of dermal toxicity, with and without the
application of ultrasound, indicating the absence of any skin irritation or inflammatory
reaction of the formulation on the skin (Figure 3.19). Marketed formulation showed
toxic reaction on the skin samples pre-treated with ultrasound. There was a significant
inflammation characterized by erythema and infiltration of cells, mostly neutrophils,
and necrosis.
Figure 3.18: Hematoxylin and eosin staining of skin samples treated with
F4_Lipoderm® Activemax™; 4X magnification, Inset: signs of dermal toxicity, 20X
magnification; A) untreated intact; B) untreated tape stripped; C) ultrasound-treated
intact; D) ultrasound-treated tape stripped
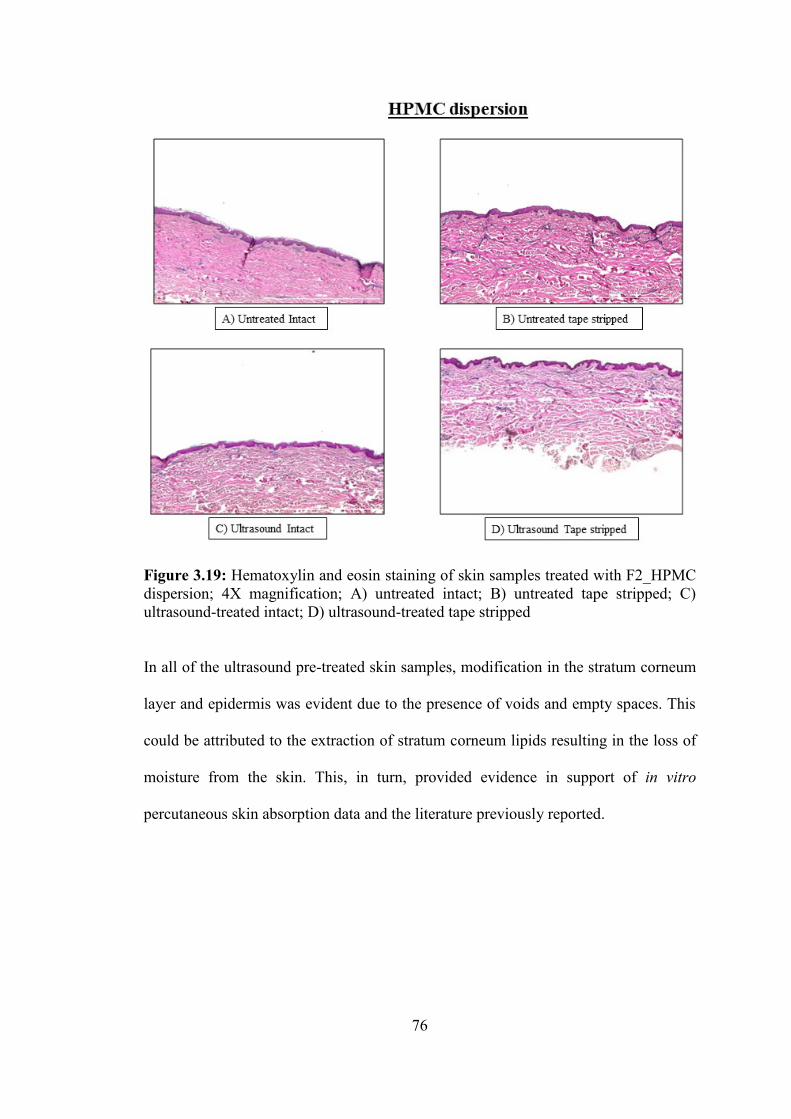
76
Figure 3.19: Hematoxylin and eosin staining of skin samples treated with F2_HPMC
dispersion; 4X magnification; A) untreated intact; B) untreated tape stripped; C)
ultrasound-treated intact; D) ultrasound-treated tape stripped
In all of the ultrasound pre-treated skin samples, modification in the stratum corneum
layer and epidermis was evident due to the presence of voids and empty spaces. This
could be attributed to the extraction of stratum corneum lipids resulting in the loss of
moisture from the skin. This, in turn, provided evidence in support of in vitro
percutaneous skin absorption data and the literature previously reported.
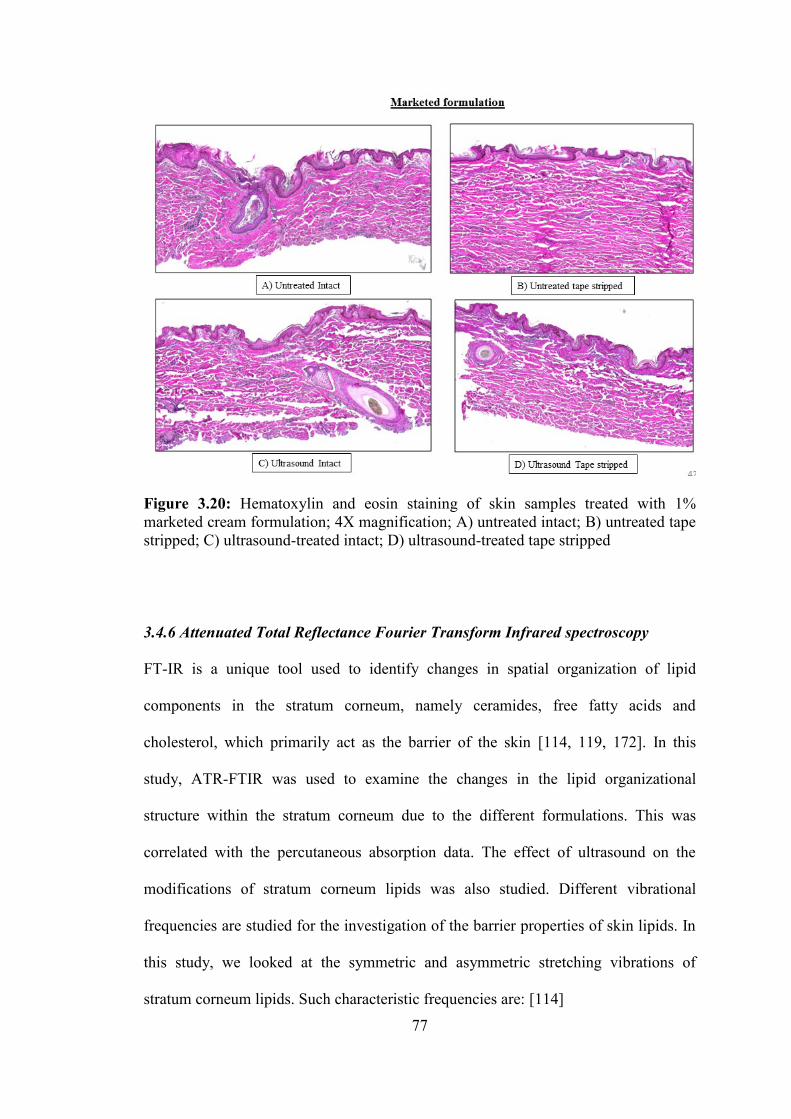
77
Figure 3.20: Hematoxylin and eosin staining of skin samples treated with 1%
marketed cream formulation; 4X magnification; A) untreated intact; B) untreated tape
stripped; C) ultrasound-treated intact; D) ultrasound-treated tape stripped
3.4.6 Attenuated Total Reflectance Fourier Transform Infrared spectroscopy
FT-IR is a unique tool used to identify changes in spatial organization of lipid
components in the stratum corneum, namely ceramides, free fatty acids and
cholesterol, which primarily act as the barrier of the skin [114, 119, 172]. In this
study, ATR-FTIR was used to examine the changes in the lipid organizational
structure within the stratum corneum due to the different formulations. This was
correlated with the percutaneous absorption data. The effect of ultrasound on the
modifications of stratum corneum lipids was also studied. Different vibrational
frequencies are studied for the investigation of the barrier properties of skin lipids. In
this study, we looked at the symmetric and asymmetric stretching vibrations of
stratum corneum lipids. Such characteristic frequencies are: [114]

78
Table 3.3: Some important vibrational frequencies depicting stratum corneum layer
Frequency Absorption maximum (cm-1
) Physiologic parameter
-CH2- symmetric stretching 2847-2855 cm-1
Stratum corneum lipids
-CH2- asymmetric stretching 2915- 2924 cm-1
Figure A and B show the IR overlay of spectra of skin samples with and without
ultrasound treatment along with their respective controls. The values for asymmetric
and symmetric CH2 vibrations are mentioned in the Table 3.3.
Table 3.4: -CH2- asymmetric and symmetric stretching vibration frequencies of both,
control and ultrasound treated skin samples
Formulation Without ultrasound With ultrasound
Asymmetric
(cm-1
) Symmetric
(cm-1
) Asymmetric
(cm-1
) Symmetric
(cm-1
)
Control 2914.43 2844.99 2916.4 2848.85
F2_HPMC Dispersion 2916.36 2848.85 2920.22 2850.78
F4_Lipoderm®
Activemax™ 2916.36 2848.85 2918.22 2850.78
Marketed formulation 2914.43 2848.85 2916.36 2850.78
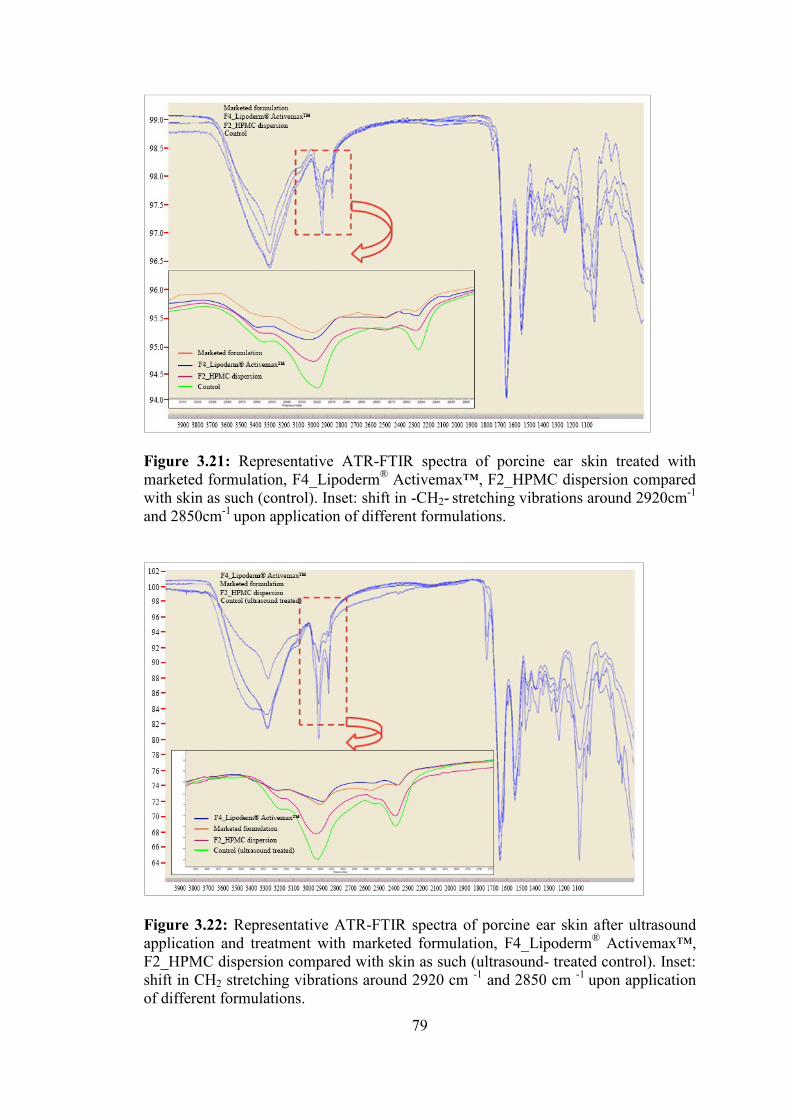
79
Figure 3.21: Representative ATR-FTIR spectra of porcine ear skin treated with
marketed formulation, F4_Lipoderm® Activemax™, F2_HPMC dispersion compared
with skin as such (control). Inset: shift in -CH2- stretching vibrations around 2920cm-1
and 2850cm-1
upon application of different formulations.
Figure 3.22: Representative ATR-FTIR spectra of porcine ear skin after ultrasound
application and treatment with marketed formulation, F4_Lipoderm® Activemax™,
F2_HPMC dispersion compared with skin as such (ultrasound- treated control). Inset:
shift in CH2 stretching vibrations around 2920 cm -1
and 2850 cm -1
upon application
of different formulations.

80
In both cases, there was a change in the asymmetric vibrations represented by changes
in wavenumbers (shift to higher wavenumbers) for formulations than the respective
control. All the formulations also showed a shift in symmetric stretching vibration
towards greater frequencies from 2848cm-1
to 2850cm-1
as compared to control. The
order of increase in the wavenumbers is F2_HPMC dispersion > F4_Lipoderm®
Activemax™ > marketed formulation > control. This slight increase in the vibrational
frequencies is attributed to penetration enhancers used in the formulations. The
penetration enhancers cause increased rotational motions along the alkyl lipid chains
of stratum corneum, thus, leading to a change in the alkyl lipid chains from a highly
ordered trans state (orthorhombic and/or hexagonal chain conformation) to a gauche
isomerized form characterized by loss of lateral chain packing and increase in fluidity
of the chains [114, 173]. There was a slightly greater shift in wavenumbers of the
ultrasound treated skin samples as compared to non-treated ones. This suggests that
exposure to ultrasound impacted the conformation of the stratum corneum lipids;
however, no major permanent changes were observed. Nanavaty et al. and Kost et al.
studied the effect of ultrasound on permeability of drug by inducing structural
changes on the lipoidal configuration of stratum corneum. They found that there are
no major changes related to morphology of stratum corneum layer caused by the
ultrasound [25]. Thus, this data is in good agreement with the literature findings and
in vitro permeation results.
3.5 Conclusions
In the present study, we evaluated the ultrasound-assisted transdermal delivery of EN
from different topical formulations. The ultrasound parameters such as amplitude,
application time and distance of the horn were optimized and used for the in vitro

81
percutaneous absorption study across the porcine ear skin. A constant frequency (20
kHz) ultrasound application with 40% amplitude, 0.5 cm distance between ultrasound
horn and skin surface for 2 minutes were considered optimum. Percutaneous
absorption study confirmed that all four formulations exhibit better EN absorption
compared to the marketed formulation upon ultrasound application. After ultrasound
treatment, the formulations showed a significant increase in the drug permeation. An
increase in drug permeation was also evident in the skin layers compared to the
control (without ultrasound application). Permeability studies indicated higher
penetration of the drug from the F2_HPMC dispersion followed by F4_Lipoderm®
Activemax™, F1_solution, F3_Versabase® cream and marketed formulation. Dermal
skin toxicity assessment using histological evaluation confirmed that the F2_HPMC
dispersion showed no signs of toxicity with or without ultrasound application. On the
other hand, F4_Lipoderm® Activemax™ formulation and marketed cream showed
some amount of dermal toxicity upon ultrasound application. ATR-FTIR studies
clearly indicated that there was a shift towards the higher wavenumbers of skin
samples treated with ultrasound than control samples, demonstrating the
conformational changes in stratum corneum lipids after ultrasound application. From
the results obtained in the drug permeation study, dermal toxicity assessment and
ATR-FTIR spectroscopy, it is clearly evident that the F2_HPMC dispersion is a better
formulation than the marketed formulation and that ultrasound-assisted topical
delivery of EN could be explored as a new treatment modality for RP. A better insight
of ultrasound and its impact on the drug permeation could be found by performing
permeation studies on excised human skin or by using a surfactant or an ultrasound
contrast agent. Impact of ultrasound application should be further assessed in vivo.

82
References
1. Raynaud, M., De l'asphyxie locale et de la gangrene symetrique des
extremites. 1862: Rignoux.
2. Guiducci, S. and M. Matucci-Cerinic, Definition, nomenclature, and
diagnostic criteria, in Raynaud’s Phenomenon. 2015, Springer. p. 13-19.
3. Herrick, A.L., Primary Raynaud’s Phenomenon, in Raynaud’s Phenomenon.
2015, Springer. p. 81-93.
4. Allen, E.V. and G.E. Brown, Raynaud's disease. The American Journal of the
Medical Sciences, 1932. 183(2): p. 187-200.
5. Wigley, F.M., A.A.L. Herrick, and N.A.A. Fl Av Ah An, Raynaud? s
Phenomenon. 2015: Springer.
6. Chikura, B., et al., Thumb involvement in Raynaud’s phenomenon as an
indicator of underlying connective tissue disease. The Journal of
rheumatology, 2010. 37(4): p. 783-786.
7. Maundrell, A. and S.M. Proudman, Epidemiology of Raynaud’s phenomenon,
in Raynaud’s Phenomenon. 2015, Springer. p. 21-35.
8. Fraenkel, L., et al., Different factors influencing the expression of Raynaud's
phenomenon in men and women. Arthritis & Rheumatism, 1999. 42(2): p.
306-310.
83
9. Planchon, B., et al., Primary Raynaud's Phenomenon Age of Onset and
Pathogenesis in a Prospective Study of 424 Patients. Angiology, 1994. 45(8):
p. 677-686.
10. Spencer-Green, G., Outcomes in primary Raynaud phenomenon: a meta-
analysis of the frequency, rates, and predictors of transition to secondary
diseases. Archives of internal medicine, 1998. 158(6): p. 595-600.
11. Kallenberg, C., Early detection of connective tissue disease in patients with
Raynaud's phenomenon. Rheumatic diseases clinics of North America, 1990.
16(1): p. 11-30.
12. Walecka, I., et al., Raynaud’s phenomenon—the clinical picture, treatment
and diagnostics. Acta Angiologica, 2017. 23(1): p. 29-33.
13. LeRoy, E. and T. Medsger Jr, Raynaud's phenomenon: a proposal for
classification. Clinical and experimental rheumatology, 1991. 10(5): p. 485-
488.
14. Brennan, P., et al., Validity and reliability of three methods used in the
diagnosis of Raynaud's phenomenon. Rheumatology, 1993. 32(5): p. 357-361.
15. Maricq, H. and M. Weinrich, Diagnosis of Raynaud's phenomenon assisted by
color charts. The Journal of rheumatology, 1988. 15(3): p. 454-459.
16. Overbury, R., et al., Primary care assessment of capillaroscopy abnormalities
in patients with Raynaud’s phenomenon. Clinical rheumatology, 2015. 34(12):
p. 2135-2140.
17. Pope, J.E., Drug Treatment of Raynaud’s Phenomenon, in Raynaud’s
Phenomenon. 2015, Springer. p. 315-337.
18. Roustit, M., et al., Phosphodiesterase-5 inhibitors for the treatment of
secondary Raynaud's phenomenon: systematic review and meta-analysis of

84
randomised trials. Annals of the rheumatic diseases, 2013: p. annrheumdis-
2012-202836.
19. Wigley, F.M., Raynaud's phenomenon. New England Journal of Medicine,
2002. 347(13): p. 1001-1008.
20. Fischer, M., et al., Topical nitroglycerin ointment in Raynaud's phenomenon.
Zeitschrift fur Kardiologie, 1985. 74(5): p. 298-302.
21. Teh, L., et al., Sustained-release transdermal glyceryl trinitrate patches as a
treatment for primary and secondary Raynaud's phenomenon. Rheumatology,
1995. 34(7): p. 636-641.
22. Prausnitz, M.R., S. Mitragotri, and R. Langer, Current status and future
potential of transdermal drug delivery. Nature reviews Drug discovery, 2004.
3(2): p. 115-124.
23. Guy, R.H., Current status and future prospects of transdermal drug delivery.
Pharmaceutical research, 1996. 13(12): p. 1765-1769.
24. Naik, A., Y.N. Kalia, and R.H. Guy, Transdermal drug delivery: overcoming
the skin’s barrier function. Pharmaceutical science & technology today, 2000.
3(9): p. 318-326.
25. Shah, V.P., H.I. Maibach, and J. Jenner, Topical drug bioavailability,
bioequivalence, and penetration. 1993: Springer.
26. Ita, K., Transdermal drug delivery: progress and challenges. Journal of Drug
Delivery Science and Technology, 2014. 24(3): p. 245-250.
27. Han, T. and D.B. Das, Potential of combined ultrasound and microneedles for
enhanced transdermal drug permeation: a review. European Journal of
Pharmaceutics and Biopharmaceutics, 2015. 89: p. 312-328.

85
28. Benson, H.A., Skin structure, function, and permeation. 2012, John Wiley &
Sons Inc., NJ, USA. p. 3-22.
29. Margetts, L. and R. Sawyer, Transdermal drug delivery: principles and opioid
therapy. Continuing education in anaesthesia, critical care & pain, 2007. 7(5):
p. 171-176.
30. Donnelly, R.F. and T.R.R. Singh, Novel delivery systems for transdermal and
intradermal drug delivery. 2015: John Wiley & Sons.
31. Holbrook, K.A. and G.F. Odland, Regional differences in the thickness (cell
layers) of the human stratum corneum: an ultrastructural analysis. Journal of
Investigative Dermatology, 1974. 62(4): p. 415-422.
32. McLafferty, E., C. Hendry, and A. Farley, The integumentary system:
anatomy, physiology and function of skin. Nursing standard, 2012. 27(3): p.
35-42.
33. Benson, H.A. and A.C. Watkinson, Topical and transdermal drug delivery:
Principles and practice. 2012: John Wiley & Sons.
34. Karadzovska, D., et al., Predicting skin permeability from complex vehicles.
Advanced drug delivery reviews, 2013. 65(2): p. 265-277.
35. Menon, G.K., G.W. Cleary, and M.E. Lane, The structure and function of the
stratum corneum. International journal of pharmaceutics, 2012. 435(1): p. 3-9.
36. Wilkes, G., I. Brown, and R. Wildnauer, The biomechanical properties of skin.
CRC critical reviews in bioengineering, 1973. 1(4): p. 453-495.
37. Martini, S., An overview of ultrasound, in Sonocrystallization of Fats. 2013,
Springer. p. 7-16.
38. Oberli, M.A., et al., Ultrasound-enhanced transdermal delivery: recent
advances and future challenges. Therapeutic delivery, 2014. 5(7): p. 843-857.

86
39. Hoogland, R., Ultrasound therapy. 1986: Enraf-Nonius.
40. Jacobsen, F. and P.M. Juhl, Fundamentals of general linear acoustics. 2013:
John Wiley & Sons.
41. Fahy, F.J. and V. Salmon, Sound intensity. The Journal of the Acoustical
Society of America, 1990. 88(4): p. 2044-2045.
42. Middleton, W., A. Kurta, and B. Hertzberg, Practical physics. Ultrasound: the
requisites. 2nd ed. St Louis: Mosby, 2004. 4: p. 18-21.
43. Lieu, D., Ultrasound physics and instrumentation for pathologists. Archives
of pathology & laboratory medicine, 2010. 134(10): p. 1541-1556.
44. Boucaud, A., et al., In vitro study of low-frequency ultrasound-enhanced
transdermal transport of fentanyl and caffeine across human and hairless rat
skin. International journal of pharmaceutics, 2001. 228(1): p. 69-77.
45. Kost, J., D. Levy, and R. Langer, Ultrasound as a transdermal enhancer.
Topical Drug Delivery Formulations, 1989. 42: p. 603-632.
46. Mutoh, M., et al., Characterization of transdermal solute transport induced by
low-frequency ultrasound in the hairless rat skin. Journal of controlled release,
2003. 92(1): p. 137-146.
47. Cagnie, B., et al., Phonophoresis versus topical application of ketoprofen:
comparison between tissue and plasma levels. Physical therapy, 2003. 83(8):
p. 707.
48. Watkinson, A.C., Transdermal and topical drug delivery today. Transdermal
and Topical Drug Delivery: Principles and Practice. John Wiley & Sons, Inc,
2012: p. 357-366.
49. O’Brien, W.D., Ultrasound–biophysics mechanisms. Progress in biophysics
and molecular biology, 2007. 93(1): p. 212-255.

87
50. Polat, B.E., et al., Ultrasound-mediated transdermal drug delivery:
mechanisms, scope, and emerging trends. Journal of controlled release, 2011.
152(3): p. 330-348.
51. Byl, N.N., The use of ultrasound as an enhancer for transcutaneous drug
delivery: phonophoresis. Physical therapy, 1995. 75(6): p. 539-553.
52. Levy, D., et al., Effect of ultrasound on transdermal drug delivery to rats and
guinea pigs. Journal of Clinical Investigation, 1989. 83(6): p. 2074.
53. Bommannan, D., et al., Sonophoresis. I. The use of high-frequency ultrasound
to enhance transdermal drug delivery. Pharmaceutical research, 1992. 9(4): p.
559-564.
54. Boucaud, A., et al., Clinical, histologic, and electron microscopy study of skin
exposed to low‐frequency ultrasound. The Anatomical Record, 2001. 264(1):
p. 114-119.
55. Polat, B.E., et al., Transport pathways and enhancement mechanisms within
localized and non‐localized transport regions in skin treated with low‐
frequency sonophoresis and sodium lauryl sulfate. Journal of pharmaceutical
sciences, 2011. 100(2): p. 512-529.
56. Simonin, J.-P., On the mechanisms of in vitro and in vivo phonophoresis.
Journal of controlled release, 1995. 33(1): p. 125-141.
57. Tang, H., et al., An investigation of the role of cavitation in low-frequency
ultrasound-mediated transdermal drug transport. Pharmaceutical research,
2002. 19(8): p. 1160-1169.
58. Suslick, K.S., The chemical effects of ultrasound. Scientific American, 1989.
260(2): p. 80-86.
88
59. Crum, L.A., et al., Sonochemistry and sonoluminescence. Vol. 524. 2013:
Springer Science & Business Media.
60. Escobar-Chavez, J.J., et al., The use of sonophoresis in the administration of
drugs throughout the skin. Journal of pharmacy & pharmaceutical sciences,
2009. 12(1): p. 88-115.
61. Gaertner, W., Frequency dependence of ultrasonic cavitation. The Journal of
the Acoustical Society of America, 1954. 26(6): p. 977-980.
62. Ueda, H., et al., Acoustic cavitation as an enhancing mechanism of low-
frequency sonophoresis for transdermal drug delivery. Biological and
Pharmaceutical Bulletin, 2009. 32(5): p. 916-920.
63. Tezel, A. and S. Mitragotri, Interactions of inertial cavitation bubbles with
stratum corneum lipid bilayers during low-frequency sonophoresis.
Biophysical journal, 2003. 85(6): p. 3502-3512.
64. Meidani, A.N. and M. Hasan, Mathematical and physical modelling of bubble
growth due to ultrasound. Applied Mathematical Modelling, 2004. 28(4): p.
333-351.
65. Mitragotri, S., D. Blankschtein, and R. Langer, Ultrasound-mediated
transdermal protein delivery. Science, 1995. 269(5225): p. 850.
66. Mitragotri, S., et al., A mechanistic study of ultrasonically‐enhanced
transdermal drug delivery. Journal of pharmaceutical sciences, 1995. 84(6): p.
697-706.
67. Clarke, L., A. Edwards, and E. Graham, Acoustic streaming: an in vitro study.
Ultrasound in medicine & biology, 2004. 30(4): p. 559-562.
68. Tachibana, K. and S. Tachibana, Transdermal delivery of insulin by ultrasonic
vibration. Journal of pharmacy and pharmacology, 1991. 43(4): p. 270-271.
89
69. Smith, N.B., et al., Ultrasound-mediated transdermal transport of insulin in
vitro through human skin using novel transducer designs. Ultrasound in
medicine & biology, 2003. 29(2): p. 311-317.
70. Tachibana, K., Transdermal delivery of insulin to alloxan-diabetic rabbits by
ultrasound exposure. Pharmaceutical research, 1992. 9(7): p. 952-954.
71. Tezel, A., et al., Frequency dependence of sonophoresis. Pharmaceutical
research, 2001. 18(12): p. 1694-1700.
72. Tezel, A., et al., Topical delivery of anti-sense oligonucleotides using low-
frequency sonophoresis. Pharmaceutical research, 2004. 21(12): p. 2219-2225.
73. Terahara, T., et al., Dependence of low-frequency sonophoresis on ultrasound
parameters; distance of the horn and intensity. International journal of
pharmaceutics, 2002. 235(1): p. 35-42.
74. Mitragotri, S., et al., Determination of threshold energy dose for ultrasound-
induced transdermal drug transport. Journal of controlled release, 2000.
63(1): p. 41-52.
75. Merino, G., et al., Frequency and thermal effects on the enhancement of
transdermal transport by sonophoresis. Journal of Controlled Release, 2003.
88(1): p. 85-94.
76. Herwadkar, A., et al., Low frequency sonophoresis mediated transdermal and
intradermal delivery of ketoprofen. International journal of pharmaceutics,
2012. 423(2): p. 289-296.
77. Laugier, P. and G. Haïat, Introduction to the physics of ultrasound, in Bone
quantitative ultrasound. 2011, Springer. p. 29-45.
78. Cheung, A.C.Y., et al., Ultrasound-enhanced intrascleral delivery of protein.
International journal of pharmaceutics, 2010. 401(1): p. 16-24.
90
79. Huan-Lei, W., et al., Ultrasound-mediated transdermal drug delivery of
fluorescent nanoparticles and hyaluronic acid into porcine skin in vitro.
80. Lopez, R.F., et al., Enhancing the transdermal delivery of rigid nanoparticles
using the simultaneous application of ultrasound and sodium lauryl sulfate.
Biomaterials, 2011. 32(3): p. 933-941.
81. Meshali, M., et al., In vitro phonophoresis: effect of ultrasound intensity and
mode at high frequency on NSAIDs transport across cellulose and rabbit skin
membranes. Die Pharmazie-An International Journal of Pharmaceutical
Sciences, 2008. 63(1): p. 49-53.
82. Aldwaikat, M. and M. Alarjah, Investigating the sonophoresis effect on the
permeation of diclofenac sodium using 3D skin equivalent. Ultrasonics
sonochemistry, 2015. 22: p. 580-587.
83. Meshali, M., et al., Effect of gel composition and phonophoresis on the
transdermal delivery of ibuprofen: in vitro and in vivo evaluation.
Pharmaceutical Development and technology, 2011. 16(2): p. 93-101.
84. Mitragotri, S., P.A. Burke, and R. Langer, Overcoming the challenges in
administering biopharmaceuticals: formulation and delivery strategies.
Nature reviews Drug discovery, 2014. 13(9): p. 655-672.
85. Schoellhammer, C.M. and G. Traverso, Low-frequency ultrasound for drug
delivery in the gastrointestinal tract. 2016, Taylor & Francis.
86. Schoellhammer, C.M., et al., Ultrasound-Mediated Delivery of RNA to
Colonic Mucosa of Live Mice. Gastroenterology, 2017. 152(5): p. 1151-1160.
87. Schoellhammer, C.M., et al., Ultrasound-mediated gastrointestinal drug
delivery. Science translational medicine, 2015. 7(310): p. 310ra168-310ra168.

91
88. Cao, T., X.-J. Wang, and D.R. Roop, Regulated cutaneous gene delivery: the
skin as a bioreactor. Human gene therapy, 2000. 11(16): p. 2297-2300.
89. Featherstone, C. and J. Uitto, Ex vivo gene therapy cures a blistering skin
disease. Trends in molecular medicine, 2007. 13(6): p. 219-222.
90. Yoon, C.S. and J.H. Park, Ultrasound-mediated gene delivery. Expert opinion
on drug delivery, 2010. 7(3): p. 321-330.
91. Sirsi, S.R. and M.A. Borden, Advances in ultrasound mediated gene therapy
using microbubble contrast agents. Theranostics, 2012. 2(12): p. 1208-1222.
92. Junxiao, Y., et al., Ultrasound-mediated targeted microbubbles: a new vehicle
for cancer therapy. Frontiers of Chemical Science and Engineering, 2013.
7(1): p. 20-28.
93. Wan, C., F. Li, and H. Li, Gene therapy for ocular diseases meditated by
ultrasound and microbubbles (Review). Molecular medicine reports, 2015.
12(4): p. 4803-4814.
94. Wu, J. and R.-K. Li, Ultrasound-targeted microbubble destruction in gene
therapy: A new tool to cure human diseases. Genes & Diseases, 2016.
95. Fujii, H., et al., Ultrasound-targeted gene delivery induces angiogenesis after
a myocardial infarction in mice. JACC: Cardiovascular Imaging, 2009. 2(7):
p. 869-879.
96. Yu, B., et al., Ultrasound-targeted HSVtk and Timp3 gene delivery for
synergistically enhanced antitumor effects in hepatoma. Cancer gene therapy,
2013. 20(5): p. 290-297.
97. Shirouzu, K., et al., Synergistic effect of sonophoresis and iontophoresis in
transdermal drug delivery. Journal of Chemical Engineering of Japan, 2008.
41(4): p. 300-305.
92
98. Chen, B., J. Wei, and C. Iliescu, Sonophoretic enhanced microneedles array
(SEMA)—Improving the efficiency of transdermal drug delivery. Sensors and
Actuators B: Chemical, 2010. 145(1): p. 54-60.
99. Terentyuk, G.S., et al., Use of fractional laser microablation and ultrasound
to facilitate the delivery of gold nanoparticles into skin in vivo. Quantum
Electronics, 2012. 42(6): p. 471.
100. Kost, J., et al., Synergistic effect of electric field and ultrasound on
transdermal transport. Pharmaceutical research, 1996. 13(4): p. 633-638.
101. Mitragotri, S., et al., Synergistic effect of low‐frequency ultrasound and
sodium lauryl sulfate on transdermal transport. Journal of pharmaceutical
sciences, 2000. 89(7): p. 892-900.
102. Huang, B., et al., Dendrimer-coupled sonophoresis-mediated transdermal
drug-delivery system for diclofenac. Drug design, development and therapy,
2015. 9: p. 3867.
103. Co-operation, O.f.E. and Development, Guidance document for the conduct of
skin absorption studies. 2004: OECD Publishing.
104. Moss, G.P., D.R. Gullick, and S.C. Wilkinson, Predictive Methods in
Percutaneous Absorption. 2015: Springer.
105. Brodin, B., B. Steffansen, and C.U. Nielsen, Passive diffusion of drug
substances: the concepts of flux and permeability. Chapter, 2010. 3: p. 135-
151.
106. Tregear, R., Molecular Movement. The Permeability of Skin. Physical
Function of Skin.
93
107. Jenner, J., OECD Test Guideline 428—A Method for In Vitro Percutaneous
Absorption Measurement?, in Topical Drug Bioavailability, Bioequivalence,
and Penetration. 2014, Springer. p. 381-387.
108. Efsa, P., Panel (EFSA Panel on Plant Protection Products and their
Residues), 2013. Guidance on dermal absorption. EFSA Journal, 2012. 10(4):
p. 2665.
109. Coleman, P.B., Practical sampling techniques for infrared analysis. 1993:
CRC Press.
110. Mossoba, M.M., Spectral methods in food analysis. 1999: Marcel Dekker.
111. Covi-Schwarz, J., V. Klang, and C. Valenta, ATR-FTIR Spectroscopy and the
Skin Barrier: Evaluation of Penetration-Enhancement Effects, in
Percutaneous Penetration Enhancers Drug Penetration Into/Through the Skin.
2017, Springer. p. 247-254.
112. Rodr guez, G., et al., Application of bicellar systems on skin: diffusion and
molecular organization effects. Langmuir, 2010. 26(13): p. 10578-10584.
113. Elias, P.M. and D.S. Friend, The permeability barrier in mammalian
epidermis. J Cell Biol, 1975. 65(1): p. 180-191.
114. Boncheva, M., F. Damien, and V. Normand, Molecular organization of the
lipid matrix in intact Stratum corneum using ATR-FTIR spectroscopy.
Biochimica et Biophysica Acta (BBA)-Biomembranes, 2008. 1778(5): p.
1344-1355.
115. de Sousa Neto, D., G. Gooris, and J. Bouwstra, Effect of the ω-acylceramides
on the lipid organization of stratum corneum model membranes evaluated by
X-ray diffraction and FTIR studies (Part I). Chemistry and physics of lipids,
2011. 164(3): p. 184-195.
94
116. Forslind, B., A domain mosaic model of the skin barrier. ACTA
DERMATOVENEREOLOGICA-STOCKHOLM-, 1994. 74: p. 1-1.
117. Bouwstra, J.A. and M. Ponec, The skin barrier in healthy and diseased state.
Biochimica et Biophysica Acta (BBA)-Biomembranes, 2006. 1758(12): p.
2080-2095.
118. Rodr guez, G., et al., Conformational changes in stratum corneum lipids by
effect of bicellar systems. Langmuir, 2009. 25(18): p. 10595-10603.
119. Mendelsohn, R., C.R. Flach, and D.J. Moore, Determination of molecular
conformation and permeation in skin via IR spectroscopy, microscopy, and
imaging. Biochimica et Biophysica Acta (BBA)-Biomembranes, 2006.
1758(7): p. 923-933.
120. Potts, R.O. and M. Francoeur, Infrared spectroscopy of stratum corneum
lipids. In vitro results and their relevance to permeability. Drugs and the
pharmaceutical sciences, 1993. 59: p. 269-291.
121. Babita, K., et al., Thermotropic and spectroscopic behavior of skin:
relationship with percutaneous permeation enhancement. Current drug
delivery, 2006. 3(1): p. 95-113.
122. Hathout, R.M., et al., Visualization, dermatopharmacokinetic analysis and
monitoring the conformational effects of a microemulsion formulation in the
skin stratum corneum. Journal of colloid and interface science, 2011. 354(1):
p. 124-130.
123. Caussin, J., et al., Lipid organization in human and porcine stratum corneum
differs widely, while lipid mixtures with porcine ceramides model human
stratum corneum lipid organization very closely. Biochimica et Biophysica
Acta (BBA)-Biomembranes, 2008. 1778(6): p. 1472-1482.
95
124. Firooz, A., S. Nafisi, and H.I. Maibach, Novel drug delivery strategies for
improving econazole antifungal action. International Journal of
Pharmaceutics, 2015. 495(1): p. 599-607.
125. Ogata, M., et al., 1-[1-[2-[(3-chlorobenzyl) oxy] phenyl] vinyl]-1H-imidazole
hydrochloride, a new potent antifungal agent. Journal of medicinal chemistry,
1983. 26(5): p. 768-770.
126. Ge, S., et al., Percutaneous delivery of econazole using microemulsion as
vehicle: formulation, evaluation and vesicle-skin interaction. International
journal of pharmaceutics, 2014. 465(1): p. 120-131.
127. Suñer‐Carbó, J., et al., Skin permeation of econazole nitrate formulated in an
enhanced hydrophilic multiple emulsion. Mycoses, 2017. 60(3): p. 166-177.
128. Bautista, D.M., et al., The menthol receptor TRPM8 is the principal detector
of environmental cold. Nature, 2007. 448(7150): p. 204-208.
129. Dhaka, A., et al., TRPM8 is required for cold sensation in mice. Neuron, 2007.
54(3): p. 371-378.
130. KAHALEH, B., et al., Treatment of raynaud's phenomenon by inhibition of
transient receptor potential melastatin-8 (trpm-8). 2017, Google Patents.
131. Frank, D.W., R. Martin, and B.B. Damaj, Methods and compositions for
treating Raynaud's disease. 2015, Google Patents.
132. Prausnitz, M.R. and R. Langer, Transdermal drug delivery. Nature
biotechnology, 2008. 26(11): p. 1261-1268.
133. Polat, B.E., D. Blankschtein, and R. Langer, Low-frequency sonophoresis:
application to the transdermal delivery of macromolecules and hydrophilic
drugs. Expert opinion on drug delivery, 2010. 7(12): p. 1415-1432.

96
134. Schoellhammer, C.M., D. Blankschtein, and R. Langer, Skin permeabilization
for transdermal drug delivery: recent advances and future prospects. Expert
opinion on drug delivery, 2014. 11(3): p. 393-407.
135. Kermode, M., Unsafe injections in low-income country health settings: need
for injection safety promotion to prevent the spread of blood-borne viruses.
Health promotion international, 2004. 19(1): p. 95-103.
136. Forslind, B. and M. Lindberg, Structure and function of the skin barrier: An
introduction. BASIC AND CLINICAL DERMATOLOGY, 2004. 26: p. 11-
24.
137. Alexander, A., et al., Approaches for breaking the barriers of drug permeation
through transdermal drug delivery. Journal of Controlled Release, 2012.
164(1): p. 26-40.
138. Park, D., et al., Sonophoresis in transdermal drug deliverys. Ultrasonics, 2014.
54(1): p. 56-65.
139. Azagury, A., et al., Ultrasound mediated transdermal drug delivery.
Advanced drug delivery reviews, 2014. 72: p. 127-143.
140. Fellinger, K. and J. Schmid, Klinik und Therapie des chronischen
Gelenkrheumatismus. 1954: Verlag für Medizinische Wissenschaften.
141. Alkilani, A.Z., M.T. McCrudden, and R.F. Donnelly, Transdermal drug
delivery: innovative pharmaceutical developments based on disruption of the
barrier properties of the stratum corneum. Pharmaceutics, 2015. 7(4): p. 438-
470.
142. Chuang, H., E. Taylor, and T.W. Davison, Clinical evaluation of a continuous
minimally invasive glucose flux sensor placed over ultrasonically permeated
skin. Diabetes technology & therapeutics, 2004. 6(1): p. 21-30.

97
143. Antich, T., Phonophoresis: the principles of the ultrasonic driving force and
efficacy in treatment of common orthopaedic diagnoses. Journal of
Orthopaedic & Sports Physical Therapy, 1982. 4(2): p. 99-102.
144. Katz, N.P., et al., Rapid onset of cutaneous anesthesia with EMLA cream after
pretreatment with a new ultrasound-emitting device. Anesthesia & Analgesia,
2004. 98(2): p. 371-376.
145. McElnay, J., et al., The effect of ultrasound on the percutaneous absorption of
lignocaine. British journal of clinical pharmacology, 1985. 20(4): p. 421-424.
146. Luis, J., et al., Rectangular cymbal arrays for improved ultrasonic
transdermal insulin delivery. The Journal of the Acoustical Society of
America, 2007. 122(4): p. 2022-2030.
147. Smith, N.B., Perspectives on transdermal ultrasound mediated drug delivery.
International journal of Nanomedicine, 2007. 2(4): p. 585.
148. Mitragotri, S., Sonophoresis: a 50-year journey. Drug discovery today, 2004.
9(17): p. 735-736.
149. Mitragotri, S., D. Blankschtein, and R. Langer, Transdermal drug delivery
using low-frequency sonophoresis. Pharmaceutical research, 1996. 13(3): p.
411-420.
150. Machet, L. and A. Boucaud, Phonophoresis: efficiency, mechanisms and skin
tolerance. International journal of pharmaceutics, 2002. 243(1): p. 1-15.
151. Tezel, A., A. Sens, and S. Mitragotri, Investigations of the role of cavitation in
low‐frequency sonophoresis using acoustic spectroscopy. Journal of
pharmaceutical sciences, 2002. 91(2): p. 444-453.

98
152. Maruani, A., et al., Low-frequency ultrasound sonophoresis to increase the
efficiency of topical steroids: a pilot randomized study of humans.
International journal of pharmaceutics, 2010. 395(1): p. 84-90.
153. Carvell, K.J. and T.A. Bigelow, Dependence of optimal seed bubble size on
pressure amplitude at therapeutic pressure levels. Ultrasonics, 2011. 51(2): p.
115-122.
154. Colussi, A., L.K. Weavers, and M.R. Hoffmann, Chemical bubble dynamics
and quantitative sonochemistry. The Journal Of Physical Chemistry A, 1998.
102(35): p. 6927-6934.
155. Seto, J.E., et al., Effects of ultrasound and sodium lauryl sulfate on the
transdermal delivery of hydrophilic permeants: Comparative in vitro studies
with full-thickness and split-thickness pig and human skin. Journal of
Controlled Release, 2010. 145(1): p. 26-32.
156. Dick, I.P. and R.C. Scott, Pig ear skin as an in‐vitro model for human skin
permeability. Journal of Pharmacy and Pharmacology, 1992. 44(8): p. 640-
645.
157. Jacobi, U., et al., Porcine ear skin: an in vitro model for human skin. Skin
Research and Technology, 2007. 13(1): p. 19-24.
158. Lademann, J., et al., Which skin model is the most appropriate for the
investigation of topically applied substances into the hair follicles? Skin
pharmacology and physiology, 2010. 23(1): p. 47-52.
159. Abd, E., et al., Skin models for the testing of transdermal drugs. Clinical
Pharmacology: Advances and Applications, 2016. 8: p. 163.

99
160. Stricker-Krongrad, A., et al., The importance of minipigs in dermal safety
assessment: an overview. Cutaneous and ocular toxicology, 2017. 36(2): p.
105-113.
161. Barbero, A.M. and H.F. Frasch, Pig and guinea pig skin as surrogates for
human in vitro penetration studies: a quantitative review. Toxicology in Vitro,
2009. 23(1): p. 1-13.
162. Yu, M., et al., Topical skin targeting effect of penetration modifiers on
hairless mouse skin, pig abdominal skin and pig ear skin. Drug delivery, 2015.
22(8): p. 1053-1058.
163. Rampton, M., et al., Antibody responses to Sarcoptes scabiei apolipoprotein in
a porcine model: relevance to immunodiagnosis of recent infection. PloS one,
2013. 8(6): p. e65354.
164. Mounsey, K., et al., A tractable experimental model for study of human and
animal scabies. PLoS Negl Trop Dis, 2010. 4(7): p. e756.
165. Summerfield, A., F. Meurens, and M.E. Ricklin, The immunology of the
porcine skin and its value as a model for human skin. Molecular immunology,
2015. 66(1): p. 14-21.
166. Kielhorn, J. and I. Mangelsdorf, Dermal absorption. 2006: World Health
Organization.
167. Collis, J., et al., Cavitation microstreaming and stress fields created by
microbubbles. Ultrasonics, 2010. 50(2): p. 273-279.
168. Lee, S., et al., Photomechanical transcutaneous delivery of macromolecules.
Journal of investigative dermatology, 1998. 111(6): p. 925-929.
169. Morimoto, Y., et al., Elucidation of the transport pathway in hairless rat skin
enhanced by low-frequency sonophoresis based on the solute–water transport
100
relationship and confocal microscopy. Journal of controlled release, 2005.
103(3): p. 587-597.
170. Baumann, M. and R. Grebe, Characteristics of the osmotically induced
membrane rupture. Molecular membrane biology, 1998. 15(4): p. 193-201.
171. Evans, E.A., R. Waugh, and L. Melnik, Elastic area compressibility modulus
of red cell membrane. Biophysical Journal, 1976. 16(6): p. 585-595.
172. Laugel, C., N. Yagoubi, and A. Baillet, ATR-FTIR spectroscopy: a
chemometric approach for studying the lipid organisation of the stratum
corneum, in Chemistry and physics of lipids. 2005. p. 55-68.
173. Bernal-Chávez, S.A., et al., Alkylglycerol Derivatives, a New Class of Skin
Penetration Modulators. Molecules, 2017. 22(1): p. 185.