
Minor Research Project Entitled Completed under the ...
141
1 Minor Research Project Entitled “A Geographical Study of Market Centers in Hingoli District” Completed under the financial assistance of & Submitted to University Grants Commission Western Regional Office, Ganeshkhind, Pune – 411007 Under the scheme of MRP (Humanities) File No. 23-2318/10 (WRO) Sanction letter no. No. 23-2318/10 (WRO) Dated: 16/03/2011 Name of the Principal Investigator Mr. Deshmukh Nitin Trimbakrao Assistant Professor, Department of Geography Mahatma Gandhi Mahaividyalaya, Ahmedpur Dist. - latur
-
Upload
khangminh22 -
Category
Documents
-
view
1 -
download
0
Transcript of Minor Research Project Entitled Completed under the ...

1
Minor Research Project Entitled
“A Geographical Study of Market Centers in
Hingoli District”
Completed under the financial assistance of & Submitted to
University Grants Commission Western Regional Office,
Ganeshkhind, Pune – 411007
Under the scheme of MRP (Humanities)
File No. 23-2318/10 (WRO)
Sanction letter no.
No. 23-2318/10 (WRO) Dated: 16/03/2011
Name of the Principal Investigator Mr. Deshmukh Nitin Trimbakrao
Assistant Professor, Department of Geography
Mahatma Gandhi Mahaividyalaya, Ahmedpur Dist. - latur

2
DECLARATION
I hereby declare that, the thesis entitled “A GEOGRAPHICAL
STUDY OF MARKET CENTRES IN HINGOLI DISTRICT” is my
own work and that, to the best of my knowledge and belief, it contains no
material preciously published or written by another person nor material
which to substantial extent has been accepted for the award of any other
degree or diploma of the university or other institute of higher learning,
except where due acknowledgment has been made in the text.
Mr. N.T. Deshmukh
Assistant professor
Department of Geography
Mahatma Gandhi
Mahavidyalaya,
Ahmedpur, Dist: Latur

3
ACKNOWLEDGEMENT
I am grateful university Grants commission and western zone
office of UGC
for providing financial assistance to undertake this minor research
project.
I would like to thank management members of VicharVikas
Mandal and principal, Dr. G.D.Bagde for allowing me to undertake this
research work
I am always indebted and fall short of words to express my
gratitude to my father late Mr.Trimbakrao. N.Deshmukh, Mother
Annapurna, my wife Archana, my son Tanmay and mydaughterTanaya
for their love and continual support in all my endeavors.
I am also thankful Dr. H. B. Rathod Vice principal,
Dr.T.N.Gaikwad, Dr.M.N.Reddy, Dr.M.M.Nivarge, Dr.D.G.Mane,
Dr.U.B.Sonule, Dr. A.A. Kalgapure, Mr.N.S.Gound, & All the staff
members of Mahatma Gandhi Mahavidyalaya, Ahmedpur for supporting
me in my academic endeavors.
A work of this kind requires various kind of co-operation and
inspiration on all accounts. I have found myself morally indebted to all
those who are directly or indirectly concerned with this research project
and thank them all from the core of heart.
Mr. N.T. Deshmukh
Assistant professor
Department of Geography
Mahatma Gandhi
Mahavidyalaya,
Ahmedpur, Dist: Latur

4
CONTENTS
2) Declaration II
2) Acknowledgement II
3) Contents III
Chapter No.
Title
I Introduction
II Physical and Socio-Economic Setting of Region
III Analysis of the Market Centers in the Study Region
IV Typology of Market Centers
V Hierarchy of Market Centers
VI Trade Area of Market Centers
VII Other Spatial Perspectives
VIII Conclusions and Suggestions

5
Chapter I
INTRODUCTION
1.1 Introduction
1.2 Objectives
1.3 Data Base
1.4 Methodology
1.5 Review of Literature
1.6 Choice of the Study Region
1.7 Limitations of the Study
1.8 Organization of the Work
1.9 Scheme of Chapters
Chapter I
INTRODUCTION
1.1 INTRODUCTION:
Indian agriculture is the backbone of economy. In India near about
74% population live in villages.Market centers playimportant role not
only in the marketing system of the country but also in the rural
development. Marketing Geography is one of the special branches of
Human Geography. So far as the marketing is concerned it is a
geographic phenomenon. The study of marketing system is a part of
geography. It is also studied specially in other disciplines like
anthropology, economics, business management, administration science,
sociology etc. Marketing Geography includes the study of the location
and spatial distribution of the market centers, their infrastructural

6
patterns, measure and extent of marketing activities, delimiting, defining
and mapping of the market areas, movement of buyers and traders,
identification of their hierarchic orders for the purpose of making a
systematic plan for regional development. Generally, marketing system is
the exchange of goods and services, The Geographers study the
marketing system in the spatial point of view. In Geographical study of
marketing, spatial organization of points is the need of time. In the
developing country like India, rural and urban development and the
integrated developments of nodes are key matters of importance. Such
study of various factors of market centers provides information to the
planners and decision makers and also useful to suggest over all
development of the study region.
Market centers furnish goods and services.They act as a central
point for transportation and serve as growth centers by providing various
services to the region. Because of these centers, there is an increase in
social interactions and other activities. Therefore, the predominance of
economic importance is to be given to the market centers in any region.
Basically the process of marketing is the process of economic
development. This development is of the complex and of dynamic nature.
According to Davies (1976) for a geographic study of marketing system,
it is the areal analysis which is offered to the sources of demand and the
supply system and its structure that furnish foundations. The phenomenon
of market system has been studied in many of other disciplines but
Geographer studies the marketing phenomena in spatial context.
Marketing Geography is a newly oriented branch of Human
Geography that studies various elements of market centers and marketing
systems. In the opinion of Dixit (1988) marketing system is a
geographical phenomenon in which the exchange of goods and services
manifest spatial elementary aspects. It provides a foundation to a

7
geographic study of marketing, and it also expands the application of
geographical principles, methods and techniques to the practical problems
and difficulties concerning the marketing phenomenon. In the view of
Applebaum (1954), “Marketing Geography is concerned with the
channels of distribution through which goods move from producer to
consumers,” According to Hodder (1964) market is “an authorized public
gathering of buyers and sellers of commodities meeting at an approved
place at regular intervals.”In this way the market centers are the units of
area and combination of various kind marketing activities including
distribution and exchange of goods that are needed by the buyers is a sole
concern of marketing geography. Mc Carty and Lindberg 1966 stated
that; ”Geographical studies deal with trading activities usually appear
under the fabric of marketing geography whose concern has been almost
exclusively with the location of retail and wholesale establishments, their
sell facilities, market territories and similar facts of trading institutions.
According to B.J. L.Berry(1967) marketing geography undertakes the
retail interests of the geographer in practice into metropolitan areas.Itis in
the service of private business enterprises. Moreover, he delineates the
sole concern of marketing geographer as description and measuring of
service area, and this type of measurement is the basis of presenting data;
evaluating market center performers in the sense of functional magnitude.
The main function of marketing in geography is retailing which has
captivated much attention. Regarding this the work of Barry (1967), Peter
Scott (1970) R.L. Davies (1976) are a worthy to mention. Davies has
righty observed that, “Marketing geographydescribes the various facts of
retailing as aspect of geography which is concerned with territory
economic activities and especially the distributive trades”.
In short Marketing geography is a branch of knowledge related
with the location and the spatial distribution of market centers. The base

8
of marketing geography is the market centre. The word ‘market’ is
derived from the Latin word ‘marketus’ which refer to a place where
buyers and sellers meet each other. In this way market centers are spatial
units, and their location, site, situation, physical extent, regional
distributional pattern, types and interactions etc. are most important for
the geographers.
While explaining the of phenomenon marketing activity,we have
toexplain intercommunications, the exchange of goods and services
among buyers, producer, sellers and consumers. Market is a location
where theseinteractions take place and their values are decided in money
point of view. It is a place where sellers and buyers meet together for
marketing with regular intervals or daily. To provide, various
commodities and wants is the important purpose of marketing system. It
is said that the basics of marketing are difference, desire and distance. If
difference is there, the increase in commercial exchanges takes place,
then desire is strong and distance is short (Garnier&Delobez, 1979).Due
to the geographical and economic differences there is a making of the
areas of demand and supply. It is here that marketing process starts.
There are number of elements and factors which determine and
influence the development and growth of market centers. Broadly
speaking transportation facilities, population, introduction of cash and
exchange medium, establishment of law and order, physical setting,
growth of agricultural and industrial products etc. are the dominating
factors in the development of marketing system. So we can say that
marketing phenomenon is found in the all types of societies where it is
urban or rural places.
In the development of marketing system the rural area and
especially the farmer’s area plays very important role. In such type of
area, the periodicity plays vital role, the market centers are rather periodic

9
than daily because of the small demand of goods and its supply per day. It
is noteworthy that supply of the goods, commodities, agricultural goods,
articles of everyday use and its requirement from nearby towns to rural
areas are gained in these periodic or weekly markets. The rural market
centers are small in these periodic or weekly markets. The rural market
centers are small in size due to the inadequacy of transportation network
and also the lack of constant demand to back up the daily or permanent
shops. The market centers in India are known by various names in
different regions as Bazar, Hats, Mandis, Weekly market etc. These are
centers of collection and distribution of goods.
According to Walter Charistallar (1933), central places provide goods
and services to central places and to the places of the surrounding region.
Market centers also perform the same but with different nature of the
system. In this way, the market centers may be the service centers and
central places in strict Christallerian view (Webmail, 1981).Market place
is a central place to surroundings which serves the lower goods and
services on fixed day in a weak.
Market centers are the main places of gathering of the famer’s
societies, the reason behind this is that the main features of internal trade
network is the existence of market nodal point to and from which, flows
of commodities are directed (Brombley 1971). In the economy, especially
rural economy market plays a vital role in the interactions and
exchanging the local products through certain norms where ‘system of
rural market serves as the nodal points for the collection and distribution
of large range of goods and services of both local and external origin’
(Good,1972). Thus market is more important and worthy to be considered
as trading institution. It is an authorized public gathering of buyers and
sellers of commodities, meeting at an approved place of regular intervals
(Hodder 1865).

10
It is also noteworthy that market centers are the places available to
agrarian society to dispose their agricultural surpluses. They are also
centers to purchase goods and services for their daily requirements and
needs. Thus market centers are the basic steps of a more complex
hierarchy of central places. These market centers are able to organize the
entire economic structure together in a functional sense. Many market
centers have central locations where the social gatherings take place.
They are outlet for various social functions. They are also centers of
communication, diffusion, innovations.They also provide ground for
governmental, private, specialized agencies to establish new shops and
small mills as well as necessary to announce the advertisements of
different ideas, notions, policies and pronouncements with their political
importance.
In the existing market system in the region, not only its study but
also identification, analysis of spatial distribution, organization and its
spatial behavior can furnish the information about the strength and
weaknesses of the system. The role played by such market centers in the
process of overall development of the region is also important. In the
study an attempt has been made to show the strengths and weaknesses of
the system with the help of the elements like spatial distribution,
typology, centrality, hierarchy, trade area and organization of market
systems existing in the region.
This information provides a base to the planning and
development purpose.On the basis of this background an attempt is
made to study the market centers of Hingoli district which are
located in upper area and basin of the Purna and Penganga rivers.

11
1.2 OBJECTIVES OF THE STUDY:
The present study aims to deal and analyze various aspects of
market centers in Hingoli district with the following objectives.
1. To study the physical setting and social aspects of Hingoli district as a
basis for the distribution of market centers.
2. To study and analyze the spatial distribution of market centers and
their relationship with physical and social factors.
3. To study the typology of market centers in the study region.
4. To study the centrality and hierarchical order of market centers.
5. To delimit and gap the trade areas of market centers and to find out
poorly served areas.
6. To study the association of market centers in regional development.
7. To prepare the plan for the proposed market centers and structuring of
market cycles in the study region.
1.3 DATA BASE:
The entire study is based on primary and secondary data pertaining
to the market centers and population. All the relevant published and
unpublished records have been considered. Primary data is collected
through intensive fieldwork. The period of investigation is of 20 years,
from, 1981 to 2001.Secondary data has been collected from the District
Census Handbook, Hingoli District Gazetteer, Municipal year books,
District Statistical Abstracts and Socio-Economic Abstracts and Records
of Villages, Tahsils, and Panchayat offices .Some recent data is also
collected from the website, Census of India and from various websites
like www.msamb.com/www.cencusindia.net.
The primary data collected through questionnaires and schedule
have been used to study from time to time in the study region. The
researcher has visited 190 market centers and data has been collected.

12
Interview technique has been also employed to collect the data and
information regarding the consumer’s behavior for making other
empirical observation.
1.4 METHODOLOGY:
Computation and re-arrangement of data in a tabular form followed
the collection and completion of data. The data analysis includes both the
empirical and theoretical approaches. To analyze the various aspects of
market centers various statistical and quantitative techniques have been
used.
Co-relation has been employed to find out the relationship between
market centers and area, population and inhabited villages etc.
Karl Pearson’s co-relation method is employed to find out the
relationship between market centers and area, population, inhabited
villages.
His co-relation formula is as follows.
To find out the spatial distributional pattern of market centers
‘nearest neighbor analysis’ has been used.
The technique developed by plant ecologist Clark and Evens
(1954) is used for the present investigation.
Following formula developed by Hammond and McCullough
(1974) has been employed
Or
The taxonomical (classification) method has been used to analyze
the typology of market centers.
22 dydxdydxr
ranDobsDRn
22 NobsDRn

13
To calculate the centrality indices ‘Location Quotient Method’ has
been used and hierarchical orders of market centers have been prepared.
Centrality is calculated using following formula
The established theoretical approaches have been used for
limitation of trade areas of the markets centers.
Three methods have been used for area influence of trade areas of
market centers. V.L.S. Prakash Rao’s modified method and Saxena’s
modified methods are used in the present study.
CentresMarketofNumber
AreaTotalAreaTradeMethodsJacksoni ')
CentresMarketofNumber
kminAreakm AreaTrade2
2
CentresMarketofNumberVillagesinhabitedofNoVillagesAreaTradeii .)
CentresMarketofNumberPopulationPopulationAreaTradeiii )
For the analysis of existing market cycles and its re-structuring in
the study region, mobile traders and consumers were consulted. Total
traders visiting each market centre have been grouped into six categories.
They are i) Grocery shop ii) Fruits and Vegetables iii) Domestic and
utensil’s iv) Cloth traders v) Food grain merchants and vi) others. For
100TtC

14
operating the interviews, 15 percent traders were selected by stratified
random sampling method from weekly markets of the region.
Different research methods used in the present work have been
discussed in appropriate chapters and it has been represented in tabular
forms. The results and analysis are represented by suitable graphs,
diagrams and maps. An elaborate list of references, bibliography,
appendices and questionnaire is given at the end.
1.5 REVIEW OF LITERATURE:
A Considerable information has been received from various social
scientists of the studies relating to the market centers and exchange
system .There has been a large publication of the study of literature on
the study of market centers and places which includes daily, weekly and
bi-weekly. In this study, references of concerned studies have been
presented in each chapter. Notwithstanding, a brief review of major
works have been given for apprehending the trend of geographical
research in marketing.
The books on marketing geography written by Cliff(1973), Berry
(1976), Davits R.L. (1976) , Saxena (1984,1988,1990),Dixit
(1984,1988), Srivastava (1987), Huger (2000) have analyzed the
various aspects of market centers and rural marketing in different regions
at various scales.
The researchers Fate (1994), Patil (1993) & (1998), Jagadale
(1990), Nayak (1994), Durgade (2000) etc, have completed their M. Phil
Dissertations on the various aspects of weekly and periodic market
centers, whereas, some important studies in this field carried out by
researcher’s for their doctoral thesis in different research centers,
Institutes and Universities. It includes the work of Singh

15
(1962),Vishwanath (1967), Kumawat (1973),Sami (1975), Parvathi
(1978),Gedam (1978), Maidmwar(1979),Srivastava (1983), Talikoti
(1991),Patil(1994), Lokhande (2001)etc.on the various aspects of market
centers in the different regions of the country.
This study includes the role of market centers, origin and
evolutions, locations and distributions, transportation and development of
market centers, typology, centrality and hierarchy of market area, market
morphology, consumers and traders behavior, synchronization of market
cycles, periodic market system, planning and perspective etc.
Some notable work in the form of research papers has been
published by some foreign geographers. Applebaum (1954) has published
papers about the various aspects of marketing geography. Hodder (1961,
1964) published papers about the rural, periodic, day markets and origin
of market in part of Yoruba-Land. Jackson (1971) has published papers
about the various aspects of periodic markets in Southern Ethiopia.
Mckim (1972) published paper about the periodic market system in
northeastern Ghana. Hill and Smith (1972) have published a paper on
spatial and temporal synchronization of periodic markets of Northern
Nigeria. Wood (1975) has published a paper on a Spatio-temporal
analysis of rural market in Kenya.
There are many well-known Indians who have published papers as
follows: Tamaskar (1966, 1978) has published papers on various aspects
of weekly markets of Sager –Damoh plateau and Chhattisgarh plain
respectively. Verma and Saxena (1968) have published a paper about a
geographical study of market centers of JhalraPatan. Ghosal (1972) has
published a paper on market places and market areas. Srivastava (1977)
has published a paper on periodic markets and rural development in
Bahraich district of U.P.Jana (1978) has published a paper on hierarchy
of market centers in Lower Silabati Basin. Wanmali (1980) has published

16
a paper on the regulated and periodic markets and rural development in
India. Dixit (1980,1981) has published papers on hierarchy of market
centers Umland of Kanpur and market cycle in the Bundelkhand. Ram
and Srivastava (1982) published a paper on nature and demarcation of
market area regions of lower Ganga-GhagaraDoab.Kumbhar&Deshmukh
(1984) have published a paperon periodic markets of Sangli district.
Hugar (1987, 1992) published papers on Spatio-temporal relationship of
periodic markets in regulated markets of Gulbarga district. Pawar and
Lokhande (1999, 2000) have polished two papers on periodicity and
distributional pattern of market centers in Kolhapur district. Paper on
hierarchical organization of market centers in Raichur district, has been
published by Mulimani (2002).
1.6 SELECTION OF THE TOPIC:
Hingoli District of Maharashtra is chosen as the study region for
the present investigation because of the following factors.
1. The heterogeneity or heterogeneous nature of the study region.
2. Inadequacy of the transportation network.
3. Agriculture is the base of economy of the region and it is socio-
economically developing.
4. The region is a part of Ajanta ranges and some parts are undulating
where market centers are important service centers functioning as the
centers of development.
5. The study region is famous for edible oil and cotton cultivation and its
marketing.
6. Hingoli district is economically backward area as a part of
Marthawada the development of market centers and study region is
necessary, consequently its study is important.

17
These are some of the reasons which inspired the researcher to
select Hingoliregion for study.
1.7 LIMITATIONS OF THE STUDY:
The present study work undertaken has certain limitation as
Follows:
1. There are new tahsils emerged in the study region. So the tahsil wise
necessary information is not available adequately.
2. The relevant maps are not available in concerning offices for the
study.
3. Enough literature is not available on market centers in HingoliDistrict.
4. Population data regarding levels of poverty is not available for urban
households, therefore only rural household data is considered for the
calculation levels of development.
All the above said and minor difficulties have put limitations on the
study of the market centers in the study region.
Notwithstanding, with available information, researcher has tried to
give justice to the problem.
1.8 ORGANIZATION OF THE WORK:
This research work includes the study of market centers which are
daily and weekly. The main focus of attention is spatial analysis of
market centers. This includes spatial distribution, the typology, centrality
and hierarchic structure of market centers, trade areas of market centers,
perspective of spatial organization of market centers and planning are the
main aspects covered in the present investigation.
The present study entitled ‘A Geographical Study of Market
Centers in Hingoli District’ is organized into eight chapters including
findings and recommendations.

18
1.9 SCHEME OF CHAPTERS:
The first chapter ‘Introduction’deals with importance of the study
of selected topic, the objectives, database, methodology, brief review of
the literature and selection of the topic and the study region.
The secondchapter deals with ‘The Study Area’: Geographical
Landscape’ of the study region This includes the location and extension
of the region, physiographic regions, Geology,climate,drainage pattern,
the soil types,natural vegetation, population, landaus pattern, agriculture,
irrigation, cropping pattern,industries, transport and
communication,settlement distribution, and demographic characters. The
study of market centers in Hingolidistrict reveals the physical, social and
economic factors play a vital role in the distribution and growth of market
centers.
The thirdchapterdeals with theDistributional characteristics of
market centerswith spatial distribution area and market centers ratio with
area inhabited villages and population. Market centers distance from
nearest town, distributional patterns, and periodicity and market cycles in
the study region.
Thefourthchapter‘Typology of Market Centers’ deals with the
classification of market centers including the study of locality
characteristics such as population size, persons engaged in tertiary
activities, estimated average attendance of people , function and exchange
orientation , major commodities, market meeting days, number of shops
,location of market place etc.
The fifth chapterIs divided into two parts namely A and B and
Parts ‘A includes the study of Centrality and B’ deals with hierarchy of
the market centers.

19
The sixth chapter analyzes the ‘Trade Area of Market Centers’ the
theoretical and empirical methods have been employed to discuss the
perspective.
The seventhchapter‘Other Perspectives of Spatial Organization of
Market Centers’ deals with the analysis and role of market centers on
levels of development, followed by the planning of proposed market
centers, synchronization market days and restructuring of existing market
cycles.
In the last eighthchapter‘Conclusion, Recommendations’ and
Suggestions have been given.
REFERENCES:
1) Applebaum, W., (1954): Market Geography in P.E. James
andJones, C.F. (Eds), American Geography: Inventory and
Prospects Syracuse University. Pp.245-251
2) Berry B. J. L., (1967) :Geography of market Centers and Retail
Distribution, Englewood Cliffs, N.J. Prentice Hall, pp. 5,74-88
3) Brombely, R.J., (1971) Markets in Developing Countrise- A
Review; Geography, Vol. 56 pp. 124-132.
4) Clark, P.J. and Evans, F.C. (1954): Distance to Nearest Neighbor
as a measure of Spatial Relationship in Populations: Ecology, 35,
pp. 445-453.
5) Christaller, W., (1993, 1966): The Central Places in Southern
Germany, Translated by from German (1933) into English C.W.
Baskin (1966) Prentice –Hall; New Jersey.
6) Cliff, E.V., (1937): Trade centers and Trade Routes, D. Appleton –
Century Co. New York.
7) Davies R...L, (1976): Marketing Geography, with Special
Reference to Relailing London Mathuen p.1.

20
8) Dixit, R.S. (1981): Market Cycles in the Bundelkhand: National
Association of Geographers, India, Congress Proceedings.
9) Dixit, R.S. (1984): Market Centers and Their Spatial Development
in the Umland of Kanpur, Kitab Mahal, Allahabad.
10) Dixit, R.S., (1988): Spatial Organization of Market Centers,
pointer publication, Jaipur, pp. 94-134.
11) Durgade, D. J. (2000): A Geographical Study of Weekly Market
Centres in Daund Taluka (Pune District), Unpublished M.phil.
Dissertation, University of pune.
12) Fate, K.A., (1989): Geographic perspective on Weekly Market
Centers in KarmalaTahsil, Unpublished M.Phil. Dissertation,
Shivaji University, Kolhapur.
13) Garnier, J.B. And Delobez,A., (1979); Geography of Marketing,
London & New York Longman, pp. xiii..
14) Gedam, D.A. (1978): The Marketing System and Network in the
Wardha Valley, Unpublished Ph.D. Thesis, Nagpur University,
Nagpur.
15) Ghosal, K., (1972) Market Place and Market Areas: National
Geographer 7, Pp.85-94.
16) Good, C.M., (1975): Periodic Markets and Travelling Traders in
Uganda; the Geographical Review, Vol. LXV, PP. 49-72.
17) Government of Maharashtra (19): Maharashtra State Gazetteers,
Nanded District
18) Hodder, B.W., (1964): Origin of Markets – The Case of Yoruba-
Land Trans.of the Institute of British Geographers, pp.149-159
19) Hodder, B., W., (1965): The Distributional of Markets in Yoruba
Land; Scottish Geographical Magazine, Vol. 81, PP. 57-97.
20) Hugar S. I. (1987): Spatio- Temporal Relationship of periodic
Markets In Dharwad District. Indian National Geographer, 2 (162)

21
21) Huger, S.I., (1992): Locational Character of Regulated Markets of
Gulbarga District, Karnataka State, Indian National Geographer,
Vol. 7, pp. 61-68.
22) Jackson, R.T.,(1971) Periodic Markets in Southern Ethiopia, Tans.
of the Institute of British Geographer, 53, pp. 31-42.
23) Jagadale, S.D., (1990): A Study of Live Stock Market in Pune
District Unpublished M.Phil.Dissertation, University of Pune.

22
Chapter II
Physical and Socio-Economic Setting of Region
Section I: Physical Setting
2.1 Introduction
2.2 Brief History
2.3 Location
2.4 Physiography
2.5 Drainage
2.6 Climate
2.7 Soils
2.8 Natural Vegetation
Section II: Socio-Economic Setting
2.9 Population
2.10 Urban-Rural Population Ratio
2.11 Settlements
2.12 Main features of Regional Economy
2.13 Landuse

23
Chapter II
Physical and Socio-Economic Setting of Region Section I: Physical Setting
2.1 Introduction: In the previous chapter, introduction of the subject, objectives,
database, methodology, review of literature, choice of the region,
limitations of the study and an outline of the present work etc. have been
discussed.
This chapter is mainly concerned with the geographical landscape
of the study region. In this chapter, physical and socio-economic factors
have been analyzed. Physical factors include location, physiography,
drainage, climate, soils, Natural Vegetation whereas socio-economic
factors include population, urban-rural population ratio, settlements, main
features of regional economy and landuse. All these physical and socio-
economic factors affect on the market centres of the study region.
2.2 Brief Hisoty: The district ‘Hingoi’ was created bifurcating the Parbhani district
and formed on 24th April, 1999. Earlier to this, it was tahsil in the district.
In the medieval period ‘Hingoli’ was known as ‘Wingully’. It is quite
likely that the present name ‘Hinoli’ is a derivative of ‘Wingully’,
Wingamulh and later Lingoli. The refined name ‘Hingoli’ came into
being in the year 1866.
Until 1853, the area of Hingoli district was an indivisible part of
the ancient Vidharbha region. During the British rule it was the border
line of the Nizam state of Hyderabad. It was a base camp of the Nizam’s
troops. Military hospital, veterinary hospital for the benefit of troops was
available in the area. Because of these, the area became a military

24
cantonment and a famous town in the erstwhile Hyderabad state. There
are still some localities like Phaltan, Risala, Tofkhana and Pensionpura,
Sadar Bazar etc., which reminds the old kingdom.
As stated earlier, Hingoli was part of the Parbhani district. Hingoli
was famous as a place where the suppression of things commenced in
1838. It also formed a cantonment till 1903. Afterwards some of the
Nizam’s troops were stationed here. Today Hingoli district is well known
as a trade centre and is linked both by road and rail. A market yard was
established at Hingoli in 1933. Though churches are comparatively less in
number, temples and mosques are plenty in the district. Among them, the
temple ‘Aundha’ (Nagnath) is famous probably, the only one structure
which reminds the old history of the district.
The temple of AundhaNagnath located at Aundha is a very famous
holy place, which is associated with the name of Nagnath i.e.
BhagwanShankaranand considered as one of the twelve ‘Joytirlingas’ in
India. The temple was constructed at the time of Yadavas of Devgiri,
probably in the 13th century and hence has considerable historical
importance. The temple of Nagnath covers an area of 669.60 m2 (7200
sq.feet). The height of the temple is about 60 feet. It is a solid work in
masonry and on its wall are engraved hundreds of images of human
beings and various types of animals like elephants, horses and bulls in
splendid design.
In historical times the entire area in Vidarbha was a part of the
empire of Ashoka, then Maurya in 184 BC. The Satavahana held sway
over Vidarbha for about 450 years from 200 BC to 250 AD. After
declining the power of Satavahans in about 250 AD., and the Hingoli
district of Maharashtra formed part of the dominion of the Vatsagulma. In
ancient period, after Vatsagulma, Kalacuris, Mahismati, Rashtrakutas,
then Chanakya, Yadavas, the medieval period begins from Ala-ud-din in

25
1316. Hingoli thus passed again with the rest of Berar into the hands of
Musalmans. After the rule of Bahamani and Imadsahi, the Nizam of
Ahmadnagar became emperor from 1565 till 1595. In the Moghal period
from 17th Century, the emperors like Akbar, Murad, Malik, Ambar and
Jahangir ruled successfully and then Aurangzeb became a powerful ruler.
After the death of Aurangzeb in 1707, the Moghal Empire at this period
was on the verge of decline and the NizamAsaf Jah became the ruler and
he established his capital at Hyderabad. After a period of about 140 years,
due to bankruptcy of the Hyderabad Government, and their disorganized
administration districts yielding gross revenue of Rs. 50 lakhs a year were
handed over to the British by a treaty. The district thus ceded constituted
a major portion of Berar heart of Osmanabad (Naldurg) and Raichur.
From the remaining portion of Berar, which was left with the Nizam,
district Parbhani was formed under reforms of Salar-Jang in the year
1853 and again Hingoli district was carved out on 1st May 1999. Being a
newly formed district, it has 710 inhabited villages and 4 towns. Hingoi
was constituted with 5 tahsils and 3 municipal councils. Today has an
area of 4827.0 km2.
2.3 Location: Hingoli district of eastern Maharashtra is selected as a study region
for the present investigation. Hingoli district lies between 190 05' North to
200 05' North latitude and 760 30' East to 770 30' East longitude. It covers
an area of 4827 sq.km. Which is 1.56 percent to the total area of the state
and a population of 1178973 (2011 census) which is 1.05 percent of the
total population of the state of Maharashtra. Among the 35 districts of the
state, the district ranks 32nd in terms of area and 33rd in terms of
population and 29th in terms of density. The region, comprising 710
inhabited villages and 03 urban centres, is administratively subdivided
into 05 tahsils namely Hingoli, Kalamnuri, Basmath, AundaNagnath and

26
Sengaon.
HINGOLI DISTRICTLOCATION MAP
0 50 100 Km0 200 400 600 Km
MAHARASHTRA
MAHARASHTRA STATEINDIA37 6'68 7'
37 6'
97 25'
N
8 4'
68 7'8 4'
97 25'
22 6'
72 36'
22 6'80 54'
15 44'80 54'
15 44'72 36'
Map. No. 2.1DISTRICT HEADQUARTERS
TAHSIL HEADQUARTERS
INDEX:
N
TAHSIL BOUNDRAY
DISTRICT BOUNDRAY4 0 4 8 12 16 20 24
KILOMETRES
N BASMATH
KALAMNURIHINGOLI
SENGAON
AUNDH NAGNATH
HINGOLI DISTRICT
76 30'
19 05'76 30'
20 05'77 30'20 05'
77 30'20 05'

27
It is bounded on the north by Washim district, on the west by
Parbhani district, on the south and east by boundary of Nanded district
and on the north-east by Yavatmal districts. The river Purna runs of the
4 0 4 8 12 16 20 24
KILOMETRES
N
HINGOLI DISTRICT
Location of Market Centres
2 3
45
6
7
8
9
10
11
1
1213
1422
23
20
19
21
1615
18
17
2425
2629
27
28
30
31
3233
34
3536
37
Sengaon
Hingoli
Kalamnuri
Aundha Nagnath
Basmath
2 Kapadsingi 10 Palshi 20 Shirad Shahpur 29 Bolda3 Sakhara 11 Pusegaon 21 Jawala Bajar 31 Hayatnagar4 Jaipur 12 Khillar 22 Bhosi 32 Aral5 Pankanhergaon 13 Adol 23 Pimpaldari 33 Hatta6 Kahakar 14 Lingpimpri 25 Goul Bajar 34 Adgaon7 KendraBK 16 Narsi Namdev 26 Akhada Balapur 35 Choundi Amba8 Goregaon 17 Kanhergaonnaka 27 Warangaphata 36 Kurunda9 Ajegaon 18 Sirsam 28 Dongarkada 37 Girgaon

28
boundaries of Hingoli and Parbhani districts and work as to attach these
two regions. The river Painganga runs on the boundaries of Washim and
Yavatmal.
It is surrounded by Buldhana and Washim district to the east,
Nanded and Parbhani districts to the south and Parbhani and Jalna
districts lying to the west .
In Hingoli district, there are 37 market centres. Out of these, 14
market centres are in Sengaontahsil, 04 market centres in Hingolitahsil,
05 market centres in AundhaNagnathtahsil, 06 market centres in
Kalamnuritahsil and 08 market centres in Basmathtahsil.
2.4 Physiography: The physical landscape is the fundamental base for economic
activities and affects the distribution of population. Economic activities
like agricultural, trade and transportation network are very limited in
North-West hilly part of the district. On the other hand in plain and fertile
areas, these activities are better developed. Hingoli district is a part of
Deccan trap. The district has been spread between Purna River in west to
Painganga in North-East.
Hingoli district is based on basaltic foundation on Deccan plateau.
The average height of the region is near about 500 m. from the sea level.
The highest (598 m) part of the region is found in Hingolitahsil near
Malhivara village. The lowest height (400 m) is found in southern part of
Hingoli district near Basmath.

29
The slope of the region is high to the Northern part whereas it
becomes less to southern part. On the basis of relief, the district may be
Above 450 meter
400 to 450 meter
Below 400 meter
INDEX
Hingoli District
Physiography
Kayadu River
Kayadu River
Asana River
Purna River
Purna River
Penganga River
Map No. 2.3
0 10 20
Km.

30
divided into three groups i.e. 1) The Painganga valley, 2) The Hingoli
plateau and 3) The Godavari plain.
The Painganga valley stretches in the extreme northeastern portion
of the district. It attains a height of about 400 meter. The Hingoli plateau
covers a major portion of the district. It includes major parts of Sengaon,
Hingoli, Aundha-Nagnath and Kalamnuritahsils. The general elevation of
this plateau is about 500 meters above mean sea level. The plateau is
badly dissected with and uneven surface and hence the land available for
agriculture is limited. The Godavari plain includes Basmathtahsil and
southern parts of Aundha-Nagnath and Kalamnuritahsils. It attains a
height of between 400 and 450 meters and slope gradually towards the
south.
The different topographical area of the study region plays a vital
role in the determination of the location of market centres. The
physiographic divisions decide the extent of economic activities of the
region and they are important and useful in the planning process.
2.5 Drainage: The drainage pattern of Hingoli district is developed and geared to
the base level. Keeping tune with southward topographical slope of the
land, all the rivers flow towards southern side. The prominent rivers of
the region are Purna, Kayadhu and Painganga.
i) Purna River:
The Purna River, a tributary of the Godavari River, drains the
western portion of the district. It arises at Ajantha hill ranges 56 km.
distance from northern Aurangabad district. It forms the district boundary

31
in the northwestern portion of the district for about 72kms. Purna,
generally flows north-south way. Running from its source through Jalana,
Buldhana, it reaches to Hingoli and then Parbhani districts. The length of
Purna in Hingoli district is 100 km. Yeldari and Sidheshwar dams have
River
INDEX
Hingoli District
Drainage Pattern
0 10 20
Km.
Lake
Kayadu River
Kayadu River
Asana River
Purna River
Purna River
Penganga River
Penganga River

32
been constructed on this river which is used for irrigation in
AundhaNagnath and Basmathtahsil.
Purna project is the first important irrigation and water energy
project in Marathwada region.
ii) Kayadhu River:
Kayadhu is main tributary of Painganga which is very important
for the Hingoli district. It arises from hilly region of Risod city/ town in
Washim district, and just enters in Hingoli district. The length of the
Kayadhu in this district is 80.50 km. It flows between Purna River and
Painganga River at Sengaon, Hingoli and Kalamnuritahsil from north-
west to south-east.
Construction of Sapali Dam is in progress on this river in
Kalamnuritahsil. Hingoli city is situated on the bank of Kayadhu River.
iii) Painganga River:
Painganga is important river which flows in Hingoli district. It
arises at Ajantha hills at west of Buldhana city. Painganga flows north-
east way. Painganga has 80.45 km. length in Hingoi district and it runs
ahead in Yavatmal district. Esapur dam is constructed on this river at the
boundary between Hingoli and Yavatmal.
iv) AsanaRiver:
Asana is a small seasonal river which originates from hilly area
near AundhaNagnath and flows in the southern region through
Basmathtahsil, enters Nanded District.
2.6 Climate: The climate is important factor in physical setting of the study
region. The climate of Hingoli district can be included in the sub-tropical
temperate category, characterized by medium rainfall and moderate

33
temperatures. Comparatively, this climate is hot and dry. The mean daily
maximum temperature is observed 41.90c in summer and the mean daily
minimum temperature is found 12.60c in winter (December). Sometimes
due to cold waves over northern India, temperatures may drop to about
60c. May and December are the hottest and coldest months of the year
respectively. On the basis of climatic conditions, the year can be divided
into four seasons:
i) Summer season from March to May with maximum temperature
ii) The rainy season from June to October
iii) North eastern monsoon from October to November
iv) Winter season from December to February with minimum
temperature.
2.7 Soils: Hingoli district is situated in Purna, Kayadhu and Painganga
River’s basin. The soil of the region is identified as ‘Black Cotton Soil’ or
Regur. The Ph value of soil of the region is 8.36 in average. The depth
and fertility of black cotton soil varies from place to place in the study
region. On the basis of fertility, soil of the region is divided in three types
i.e. Deep black soil, Medium black soil. Color of this soil is gray and
shallow black soil / light soils.
The northern upland area of the district consisting of Sengoan,
Hingoli, Northern Kalamnuri and AundhaNagnathtahsils have light soils
(shallow black soil) which are sandy loam in texture, brownish black in

34
4 0 4 8 12 16 20 24
KILOMETRES
N
INDEX
Above 950 mm
850-950 mm
Below 850 mm

35
colour and underlaid with murum derived from the basaltic rocks. These
soils are most suitable for Kharif crops like Jowar, Bajri, Groundnuts etc.
The southern portion of the district occupying Basmath, southern
part of AundhaNagnath and Kalamnuritahsils have medium to deep black
INDEX
Hingoli District
Soils
0 10 20
Km.
Coarse Grain ShallowSoils High Level
Medium Black Soil
Deep Black Soils Regur

36
soils, which vary in texture from clay to clay loams. These soils are
retentive in moisture and rich in plant materials such as lime, magnese,
iron and alkalies. These soils suit both Kharif and Rabi crops.
2.8 Natural Vegetation: It is found that there is only 2.4 percent area under forest in the
whole region. Out of 4827 sq.km. Only 114 sq.km. is forest area. Major
area lies in Hingoli and Kalamnuritahsils. This is a thin type of forest.
Thick forest is not seen in the district. There is a scope for social forestry
and re-plantation in the old forest.
The trees like Teak, Tirmar, Salani, Palas, Dhawada, Sagwan, Ain,
Khair, Mahua, Tembhurni, Babhul, Bor, Ayoni, Kona and Orange,
Mango, Custard apple fruits etc. such are found in the study region. In
grass area Pawanya, Kusal, Raj and Rosha grass are seen in the region.
The forests also have medicinal plants and large grassy area. The
collection of Tembhurni leaves, gum, mahua flowers, fruits and charoli
seeds is the major occupation in forest area.
Section II: Socio-Economic Setting
Socio-economic factors are also important for the growth,
development and distribution of market centres in specific study region.
Population, rural-urban ratio, irrigation, agricultural landuse,
transportation and industries etc. these socio-economic factors, left their
influence upon the growth, distribution and development of the market
centres directly or indirectly.

37
2.9 Population: Population as a resource is an important part of the inputs
necessary for the development of a region. Population has a direct
influence on the market centres activities of a region. Population has
various aspects like growth rate, density, the urban-rural proportion,
economic classification, occupational structure etc. which give an idea of
features, composition and availability of manpower in the region. It also
shows the extent of utilization of manpower in the region.
2.9.1 Growth of Population: The population of Hingoli district is 1.05 percent of population of
Maharashtra. It has increased from 9.87 lakh to 11.78 lakh from 2001 to
2011.
There is growth of population in the year 1901 to 1911, which
increased by 20.5 percent. But from 1911 to 1921, population decreased
by 01.8 percent in this decade. After 1921, population growth is occurring
gradually. And 19.8 percent population growth have found in 2001 and
19.4 percent population growth in 2011.
Decadal Variation in Growth of Population
(During 1901 to 2001)
Year Total Population Rural Population Urban Population
Persons % to Decadal
Variation Persons % to Decadal
Variation Persons % to Decadal
Variation
1901 226384 -- 200683 -- 25701 --
1911 272785 20.5 244679 21.9 28106 9.4
1921 267991 -01.8 247561 1.2 20430 -27.3
1931 298807 11.5 269648 8.9 29159 42.7
1941 319200 06.8 284581 5.5 34619 18.7
1951 352856 10.5 309090 8.6 43766 26.4

38
1961 430986 22.1 384459 24.4 46527 6.3
1971 533595 23.8 471024 22.5 62571 34.5
1981 655199 22.8 571868 21.4 83331 33.2
1991 823931 25.8 711372 24.4 112559 35.1
2001 987160 19.8 833130 17.1 154030 36.8
2011 1178973 19.4 1000102 20.04 178871 16.12
Source: District Census Handbook of Hingoli District, 2001 and Census of India, 2011.
The main cause of rapid growth of population is the decline in
death rate and increase in the birth rate. It is thus, clear that the regional
population is growing at a rapid rate since 1961, but there was decrease in
growth rate of population in 2001 and 2011.
-40
-30
-20
-10
0
10
20
30
40
50
1901 1911 1921 1931 1941 1951 1961 1971 1981 1991 2001 2011Dec
adal
Var
iati
on
Years
Graph No. 2.1 : Decadal Variation in Growth of Population (1901 to 2011)
Total Population Rural Population Urban Population
39
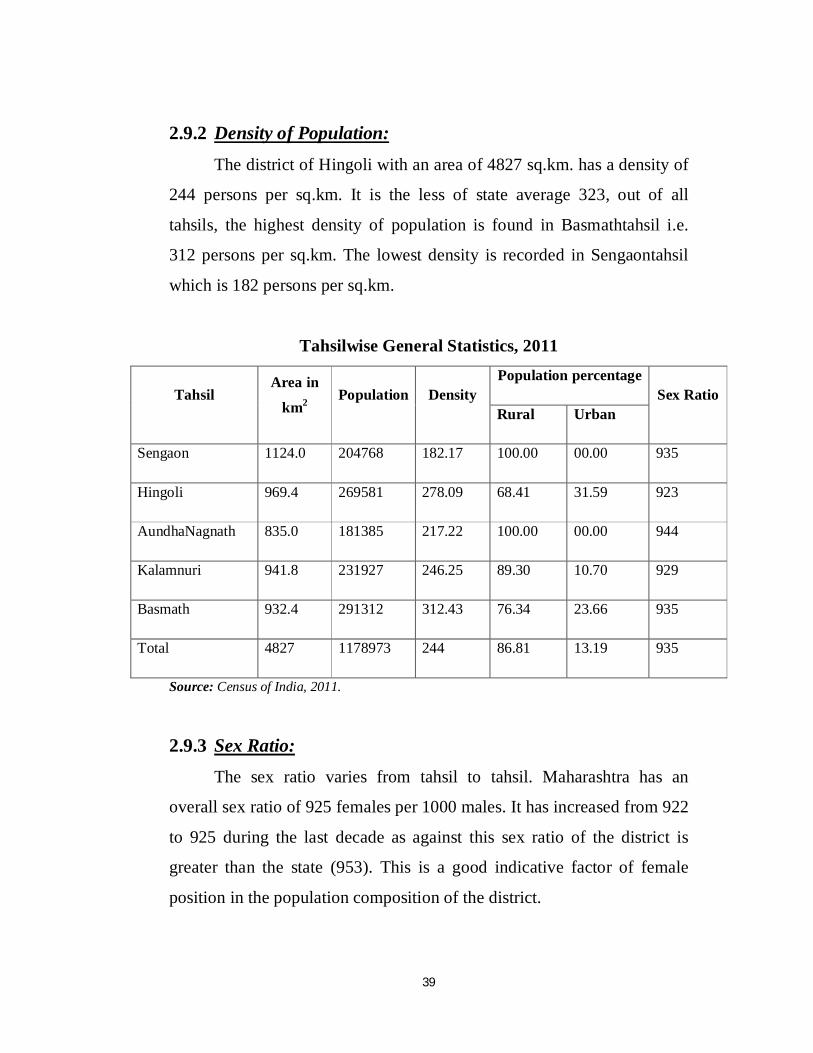
2.9.2 Density of Population: The district of Hingoli with an area of 4827 sq.km. has a density of
244 persons per sq.km. It is the less of state average 323, out of all
tahsils, the highest density of population is found in Basmathtahsil i.e.
312 persons per sq.km. The lowest density is recorded in Sengaontahsil
which is 182 persons per sq.km.
Tahsilwise General Statistics, 2011
Tahsil Area in
km2 Population Density
Population percentage Sex Ratio
Rural Urban
Sengaon 1124.0 204768 182.17 100.00 00.00 935
Hingoli 969.4 269581 278.09 68.41 31.59 923
AundhaNagnath 835.0 181385 217.22 100.00 00.00 944
Kalamnuri 941.8 231927 246.25 89.30 10.70 929
Basmath 932.4 291312 312.43 76.34 23.66 935
Total 4827 1178973 244 86.81 13.19 935
Source: Census of India, 2011.
2.9.3 Sex Ratio:
The sex ratio varies from tahsil to tahsil. Maharashtra has an
overall sex ratio of 925 females per 1000 males. It has increased from 922
to 925 during the last decade as against this sex ratio of the district is
greater than the state (953). This is a good indicative factor of female
position in the population composition of the district.

40
Within the Hingoli district, sex ratio varies between 944 in
AundhaNagnathtahsil and 923 in Hingolitahsil. Sex ratio of
Sengaontahsil is 935 of Kalamnuri is 929 and of Basmath is 935.
2.9.4 Literacy: According to census of India, any person who can both read and
write with understanding in any language is considered literate. Children
in the age group 0 to 6 are not considered literate even though they can
spell out some words or alphabets. Accordingly about 77 percent
population of the district was literate in 2011. When, the literacy rate of
the states as a whole was 82.91 percent. Hingolitahsil has the highest
percentage of literate population i.e. 80.42 percent.
Population Literacy Structure, 2011 Tahsil Total Literacy Rural Literacy Urban Literacy
Total Male Female Total Male Female Total Male Female
Sengaon 74.90 86.90 62.10 74.90 86.90 62.10 00.00 00.00 00.00
Hingoli 80.42 89.51 70.90 73.91 85.97 61.18 86.93 93.05 80.63
AundhaNagnath 72.73 84.68 60.19 72.73 84.68 60.19 00.00 00.00 00.00
Kalamnuri 79.78 87.72 71.23 76.35 86.65 65.39 83.21 88.80 77.07
Basmath 78.65 87.64 69.15 73.88 85.24 61.91 83.43 90.05 76.39
Source: Census of India, 2011.
Hingolitahsil has high proportion of literacy. Hingoli, Kalamnuri
and Basmath these three tahsils have shown high literacy and
AundhaNagnath, Sengaon have shown low literacy which was much less
than the average literacy rate of the district.

41
0
10
20
30
40
50
60
70
80
90
100
Total Male Female Total Male Female Total Male Female
Total Literacy Rural Literacy Urban Literacy
Lite
racy
Rat
e
Literacy
Graph No. 2.2 : Populatin Literacy Structure, 2011Sengaon
Hingoli
Aundha NagnathKalamnuri
Basmath

42
2.10 Urban-Rural Population Ratio: Urban population comprises 15.17 percent of the total population
in Hingoli district, which is far less than state average (45.23%). It is
observed that Hingoli has high urban-rural population than district level
and also national level.
Remaining tahsils have recorded lower urbanization i.e. Kalamnuri
10.69 percent, Basmath 23.66 percent of urban population. Sengaon and
AundhaNagnathtahsils in the district are mainly rural.
2.11 Settlements: Settlements are human dwelling of various sizes distributed in
geographic space by a set of occupational forces within the environmental
consideration related to water supply, fertile soils, and safe location
(Hugar, 2000). The distributional characters of settlements refer to their
frequency and spatial organization in a given space. An attempt has been
made to study the size of villages and urban centres and their
characteristics.
2.11.1Rural Settlements: As per the 2011 census, there were 669 inhabited villages in
Hingoli district. These villages vary in their population size. The number
of villages at tahsil level reveals that Basmathtahsil has highest number
(149), while the lowest number of villages is in AundhaNagnathtahsil
(117).
There were 13 percent villages with a population of less than 500.
The medium size villages with a population size of 500-2000 were 66.80
percent, which form a major population size. Further there were 17.80
percent villages with a population size of 2000 to 4999. However, the

43
large sized villages with more than 5000 population were only 2.40
percent.
Village Population Size Group, 2011
Sr.
No. Tahsil
Classification of Villages According to Population size
Below 500 500 to 1999 2000 to 4999 5000 & Above
1 Sengaon 87 79 29 04
2 Hingoli 19 99 17 02
3 AundhaNagnath 14 85 15 03
4 Kalamnuri 15 97 24 03
5 Basmath 24 87 34 04
Total 159 447 119 16
Percentage 13 66.80 17.80 2.40
Source: Census of India, 2011.
2.11.2Urban Settlements: There are three urban centres in the district. These three urban
centres have municipalities, namely Hingoli, Basmath and Kalamnuri.
There are three towns in Hingoli district ranging from class II and
III with total area about 39.1 sq.km. The two towns (Hingoli and
Basmath) are class II towns and Kalamnuri town is class III. The total
area of urban centre is about 39.1 sq.km. The largest area is 16.4 sq.km.
ofHingoli urban centres. The lowest area is of Kalamnuri urban centre
which is 10.8 sq.km.
According to 2011 census year, the total population of urban
centres is 178871. The highest urban population is observed in Hingoli
85137, whereas lowest urban population is found in Kalamnuri 24997.

44
Urban Area- General Statistics, 2011 Urban
Centres
Area in
km2 Population
Density of
pop. In km2 Status Class
Sex
Ratio
Rainfall
in mm.
Hingoli 16.4 85137 5191.3 M II -- 990
Basmath 11.9 68937 5793.0 M II 927 667
Kalamnuri 10.8 24797 2296.0 M III 910 585
M = Municipality
Population Size I – Above 100000, II – 50000-100000, III – 20000-50000, IV – 10000-20000, V –
5000-10000, VI – Below 5000
2.12 Main features of Regional Economy: Economic characters and economic activities i.e. primary,
secondary and tertiary in an area affect the per capita income and
purchasing power of the population which in turn affects the growth and
development of the market centres.
It has been observed that generally large number of weekly market
centres is concentrated in an area, where primary activities are dominant.
2.12.1Occupational Structure: The term ‘Occupational Structure’ is often used in a boarder sense.
The occupational structure is divided into three classes i.e. cultivators,
agricultural labourers and household industries, production services and
repairs. These sectors provide the functional characteristics to an area.
Occupational Structure, 2010 Sr. No. Population
Hingoli District
Total Male Female

45
1 Total Population 987160 505373 481787
2 Rural Population 833130 425840 407290
3 Urban Population 154030 79533 74497
Major Occupational Classes
Persons Males Females
4 Cultivators 206434 113635 92799
5 Agricultural Laborers 174847 80101 94746
6 Household industries, Production, Services and Repairs
78697 65738 12959
Source:Socio-Economic Abstract, 2010
2.13 Landuse: Agriculture is one of the oldest basic primary economic activities
of man; generally,it is understood of man both cultivation of food and
fiber crops and rising of livestock'seven today over the years in spite of
growing industrialization in organization in the world.And nearly 50% of
working population is still engaged in agriculture.The agricultural
development through which a shift takes place from the
traditionalagriculture to the modernized one result in an increase in
productivity and production perunit of various resources. The process
aims at getting maximum advantage of the availableresources on micro
and macro level, which finally result in on overall development of the
region.
Landuse is geographical concept which involves specific areas.
The study of the landuse pattern of Hingoli district covers the proportion
of area under different landuse at a point of time. It is based on the census
classification of the land and it is grouped under two major types
The crops area in Hingoli district of Kharip season it seen that the
less crops area2009-10 i.e. 73200 Hector and high crops area in the year

46
2010-11 i.e. 91900 Hector.Rabbi season it seen that the less crops area
2009-10 i.e. 12450 Hector and high cropsarea in the year 2010-11 i.e.
17700 Hector.
Geographical Landuse in Percent, 2010
Tahsil Area in
Hectors
Percentage of
Cultivable area to
Total Area
Percentage of Irrigate
area to Tribal Cultivable
area
Sengaon 110770.00 84.2 11.3
Hingoli 91538.00 86.9 3.6
AundhaNagnath 82846.00 76.0 6.4
Kalamnuri 90821.21 81.7 9.1
Basmath 90215.00 85.0 27.8
Total District 466190.21 82.9 11.8
Source: District Socio Economic Abstract, 2010 and Census of India, 2001.
Total geographical area of the district is 48026.0 hectare in 2011.
In the study region, total forest area 29080.0 hectare, land not available
for cultivation area 19100.0, other uncultivated land area 24890.0, fallow
land area 16360.0 and net sown area 390830.0 heactare.
References: 1. Census of India, (2001): Series-14, Maharashtra Part, XII A & B,
Hingoli District Census Handbook.
2. Census of India, (2001): Series-28, Maharashtra Provisional
Population Total, Paper, 3.
3. Deshpande, C. D., (1971): ‘Geography of Maharashtra’, National
Book Trust, India, New Delhi.

47
4. Government of Maharashtra, (2001): ‘Maharashtra State
Gazetters’, Hingoli District.
5. Intellectuals Sandharbh Maharashtra, (State and District a Glance)
Vol. II, pp. 791-810.
6. N.C.A.R., (1971): Indian Council for Agricultural Research.
7. Socio-Economic Review and Statistical Abstracts of Hingoli
District, 2001 to 2011.
8. The Encyclopedia District Gazetteers of India, (1998): Western
Zone Vol.7, Gyan Publication, New Delhi, pp. 515-520.

48
Chapter III
Analysis of the Market Centres in the Study Region
3.1 Introduction
3.2.1 Area and Market Centres Ratio
3.2.2 Inhabited villages and Market Centres Ratio
3.2.3 Population and Market Centres Ratio
3.3 Distributional Pattern of Market Centres
3.4 Day-wise Distribution of Market Centres
3.5 Market Cycles
3.6 Market Cycles in the Study Region
3.7 Tahsilwise Growth of Population of Market Centres
3.8 Growth Rate of Market Centres According to their Population Size
3.9 Summary

49
Chapter III
Analysis of the Market Centres in the Study Region
3.1 Introduction:
In the beginning chapter second researcher have attempted to study
the physical and socio-economic elements of the study region, location
and boundary, physiography, drainage system, climate, soils, natural
vegetation and population characteristic etc. points analyzed.
In this chapter introduction, spatial distribution characteristics of
market centres, rural market centres and their distance from nearest town,
distributional pattern of market centres, day-wise distribution of market
centres and market cycles growth Characteristics of Market Centres etc.
points discussed in detail.
3.2.1General Distribution:
The general spatial distribution of market centres in Hingoli district
is analysed for five tahsils of the district.
Sengaon has the highest number of market centres. It exceeds the
mean by more than three standard deviation 푋 + 3S.D. and is followed by
Basmath which is grouped in the class of 푋 + 1S.D. Kalamnuri and
Aundha Nagnath is very near to mean, out of five tahsils only one
Hingolitahsil have 푋 – 1S.D Class.
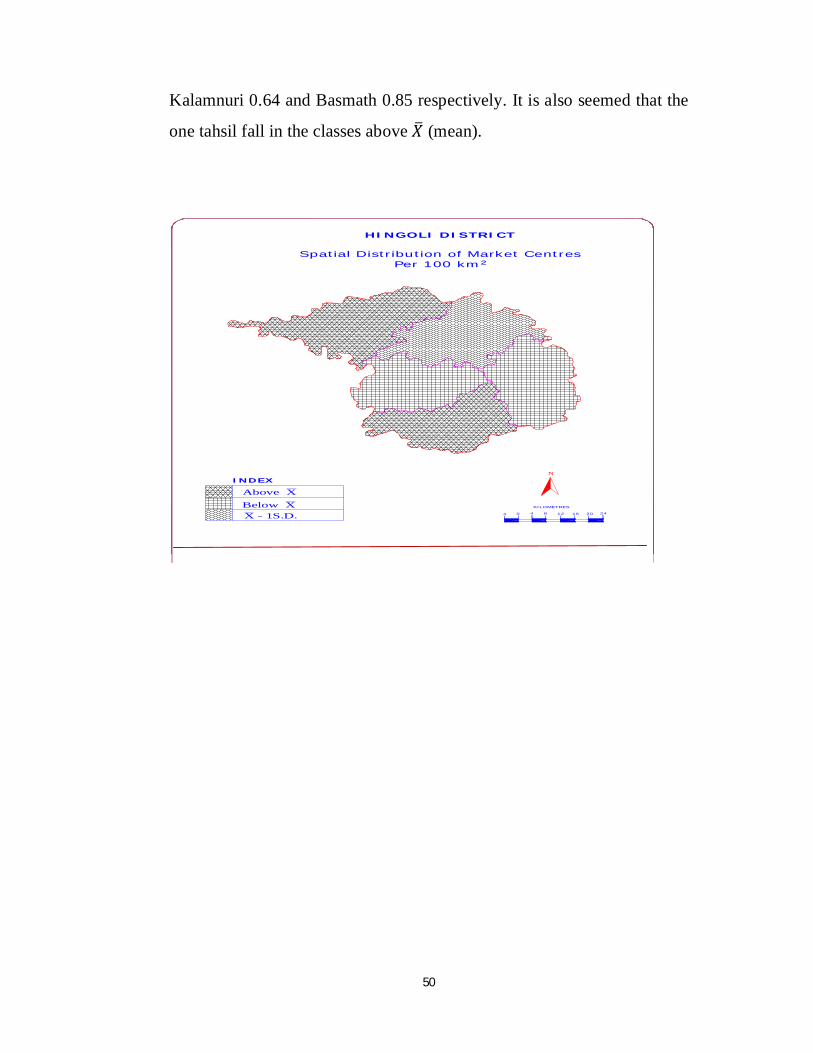
3.2.2 Area and Market Centres Ratio:
As the number of market centre per 100 km2 of area are 0.77 for the
whole study region. In Sengaontahsil the ratio is 1.25 which considerably
decreased to all tahsils for Hingolitahsil 0.41, AundhaNagnath 0.60,
50
Kalamnuri 0.64 and Basmath 0.85 respectively. It is also seemed that the
one tahsil fall in the classes above 푋 (mean).
4 0 4 8 12 16 20 24
KILOMETRES
N
INDEX
HINGOLI DISTRICT
Spatial Distribution of Market CentresPer 100 km²
Above X
Below X X - 1S.D.

51
Out of which AundhaNagnath and Kalamnuri in the class below푋. And
Hingoli fall in the class 푋 -1 S.D.
Notwithstanding, it is observed that the co-relation between these
two variables is significant (r = 0.98789). It is due to the location and
fertility of the area status is very essential to support the population as a
threshold to give base to the market centres.
3.2.3 Inhabited Villages and Market Centres Ratio:
In the study region the number of Market Centre per 100 inhabited
villages is 05.50 ratio, ranges from 10.85 in Sengaontahsil to 2.90 in
Hingolitahsil. Basmathtahsil fall in the class near to the Mean. Out of
which Sengaon fall in the class 푋 + 2S.D., Basmath fall in the class 푋.,
two tahsils are below 푋. and Hingoli fall in the 푋 - 1S.D.
The correlation (r = 0.991706) analysis between two variables
shows important relationship. It is seen that the density of settlement in
the central area is more and market centres are less. In the plain area
density of settlement and number of market centres are more. It is
INDEX
Below X4 0 4 8 12 16 20 24
KILOMETRES
N
HINGOLI DISTRICT
Spatial Distribution of Market CentresPer 100 Inhabited Villages
Map No. 3.1C
X + 2 S.D.X
X - 1S.D.

52
because the size of the settlement, which is big in plain and small in other
area in the study region.
3.3 Distributional Pattern of Market Centres:
The spatial distribution of the market centres denotes that there is a
difference from tahsil to tahsil based on cultivation, population and
unbalanced transport network. It is noteworthy to study the existing
pattern of spatial distribution market centres in Kalamnuri, Hingoli and
Basmattahsils being the most fertile tract are developed in irrigation and
transport network. These tahsils have a large number of market centres of
varying sizes.
‘Nearest Neighbour’ method has been adopted for the distribution
of the market centres. Which involves the comparison between the mean
distance in an area of a point from its nearest neighbour and the mean
distance which could be expected in a random distribution pattern in the
same area. The plant ecologist Clark and Evans (1954) was the first to
develop this technique and it has been used to measure the patterns of
incidence of different species of plants. In recent time many geographers
has been employing to the study of the spatial distribution pattern of
settlement. The following formula developed by Hamond and Mcullahgh
(1974) has been employed for the present study.
Rn =퐷표푏푠퐷푟푎푛
Where,
퐷표푏푠 = is the measured mean distance between the nearest
neighbor point observed in a given area.

53
퐷푟푎푛 = is the expected mean distance for a similar number of
points distributed in the same area.
푅푛 = is the nearest neighbor index.
퐷푟푎푛 = 1
2
Where,
N = is the number of market centres in the study region.
A = is area of study region / spatial unit below
Hence,
푅푛 = 퐷표푏푠
1 ÷ (2 )
It can be expressed in a simplified form as below:
푅푛 = 2퐷표푏푠 or푅푛 = 2푑̅
The values of the Rn will fall between 1.17 to 1.62. The Value of
0.0000 showing clustering at the point and the value of 1.62 showing a
hexagonal distribution can be shown with the help of scale also when the
value is one the pattern is completely random (Dacey 1960, 1961 King
1962).

54
Since the study area presents a visible contrast in the density
pattern and spacing of market centres, the Rn values at tahsil level are
also calculated. In such situation different Rn values for different tahsil,
are obtained in order to find out the association of the market centres with
each other Rn value for the study region has been calculated.
Nearest Neighbour Statistics of Market Centres
Tahsil 푫풐풃풔 km 푫풓풂풏
km
‘Rn’ Values
Sengaon 5.25 4.48 1.17
Hingoli 12.46 7.78 1.60
AundhaNagnath 9.94 6.46 1.54
Kalamnuri 10.15 6.26 1.62
'Rn' Value Scale of Market Centres
0.0000
0.2500
0.5000
0.7500
1.0000
1.2500
1.5000
1.7500
2.0000
2.2500
Tahsils Aundha N.
Hingoli
Kalamnuri
BasmathSengaon
Regular Pattern
Random Pattern
Clustered Pattern

55
Basmath 6.65 5.40 1.23
Total District 7.75 5.70 1.36
Source: Compiled by Researcher.
The analysis reveals that the market centres have noticed a near to
uniform distribution, where the degree of randomness is 1.36. In the study
region the comparative analysis of the values of randomness shows that
tahsils like Sengaontahsils having Rn value of 1.17 has randam pattern.
The market centresHingoli, AundhaNagnath, Kalamnuri and
Basmathtahsils having Rn value above 1.2 to 1.62 has uniform pattern.
In the study region the spacing of market centres is a uneven
because transport facilities for the movements of people and goods are
also unevenly distributed. The northern hilly part of the region has
inadequate facilities which prevent the farmers range of marketing their
production.
Sengaontahsil situated in the north and north-east part of Hingoli
district is having more hilly area where the land under cultivation is less
and productivity is not considerable. Therefore per capita income of
people residing in this area is less, as a result their creativity affected. It is
not affordable for these people to reach major market centres to make
ordinary purchase of the goods required for daily needs by spending huge
amount on transportation. As it is hilly area, there are many villages with
small population.

56
There is very low frequency of transport facility, hence market
centres are found in a large scale in Sengaontahsil. There are 14 market
centres in the tahsil. This number is greater than all.
Hingoli is a district place; therefore the frequency of transport
facility is in a large quantity. People from surrounding villages come to
the major Hingoli daily market hence the number of market centres in
Hingolitahsil is less in numbers.
3.4 Day-Wise Distribution of Market Meetings:
In the study region there are 63 market meetings held per week
4 0 4 8 12 16 20 24
KILOMETRES
N
District Average
HINGOLI DISTRICT
Nearest Neighbour of Market Centres
'Rn' Value = 1.36

57
Day-wise Distribution of Market Meetings
Tahsil Sun Mon Tue Wed Thus Fri Sat
Total No. of
Market
Meetings
Sengaon 03 05 03 01 02 03 02 19
Hingoli 01 03 01 01 02 01 01 10
AundhaNagnath 02 02 01 02 01 01 01 10
Kalamnuri 01 02 02 02 02 02 -- 11
Basmath -- 02 01 02 03 03 02 13
Total District 07 14 08 08 10 10 06 63
Source: District Census Handbook, Hingoli, 2001.
4 0 4 8 12 16 20 24
KILOMETRES
N
INDEX
Day wise Distribution of Market Centres
Daily
Sunday
Monday
Tuesday
W
F
F
F
F
F
F
S
SSa
S
Th & S
S Sa
Sa
T
Th
T
T
ThT
Th
T
Th
Th
M
M
M
M
M
M
M
M
M
W
W
W
D
D
D
S
M
T
W
Th
F
Sa
Wednesday
Thursday
Friday
Saturday
D
D
D

58
The highest number of market meetings is 19 and it is observed in
Sengaontahsil which is economically and socially backward.
Basmattahsil also have 13 market meetings. Basmat is daily market
centre. Basmattahsil is rich in agricultural and economical development.
Whereas the lowest number of marker meetings is 10 in Aundhatahsil
which is recently established tahsil and Hingolitahsil in the study region.
Remaining tahsil namely Kalamnuri have 11 market meetings.
But there is no great variation in the number of market meetings
held on various days in Hingoli district, Monday has highest number of
market meeting that is 14 market meetings followed by Thursday and
Friday each 10 market meetings, Sunday 7, Wednesday 8 and Tuesday 8
market meetings. Monday is opening day of the week. So highest number
of market meetings are held on Monday.
3.5 Market Cycles:
In geographical studies of periodic markets, the most widely
studies aspect is the ‘market cycle’. Periodic markets in a region are inter-
linked in a system which controls the movement of traders as well as
consumers in some cases. The integrated system of occurrence of
periodic markets in various parts is commonly known as ‘market cycle’
(Silverman, 1959, Hodder, 1966, Geertz, 1978, Bromley, 1980). Some
other terms have also denoted for the same concept such as, ‘ring’
(Hodder, 1961), ‘round’ (Thomas, 1924), ‘circle’ (Poleman, 1961) and
‘circuit’ (Hill, 1966). Although these terms have subtle differences, in
general they are interchangeable and denote the regularity in transactions
and movement of goods and people between producer and the consumer.
Bromley (1980) has suggested an ‘aggregate’ and ‘individualistic’
approach in the study of market cycles. The first aggregate approach is
older and has been applied by Hodder, Ukwu and Tinkler. Accordingly,
markets are interconnected with neighbouring periodic markets taking
59
place on different days of the week. In Yorubaland, Hodder (1961)
pointed out that there was ‘a complete and integrated sequence of
markets’ while Ukwu has described the Iboland marketing landscape as
‘a panoramd of honey combs in regular circuit’ (Hodder and Ukwu has
1969). Symanski and Webber (1974) have developed the individualistic
approach in the study of market cycle. They are of the opinion those
markets cycles should be studied in terms of individuals, i.e. traders,
middlemen, consumers, etc. who are the actual participants.
The study of spatio-temporal character of marker centres led us to
know the existence of market cycle or rings the concept of market cycle
is related to the time, whereas that of market rings relate to space. (Good,
1975, Tamaskar, 1983, Srivastava 1987). In the integrated system of
occurrence of sequence of market centres in which mobile traders go on
attending different markets on different days till the end of week in semi-
circular or ring–like track so that they will return to their home at the
week- end rest. The arrangement of periodic markets in sequential order
is generally known as market cycle or ring (Hodder, 1965, Skinners,
1964, Brimbley, 1971, Tamaskar, 1978, and Dixit, 1981, 1986).
Generally market centres are interconnected with neighboring
markets, which are held of different days of the week and so these tends
to be shift of market meeting from settlement to neighbouring and other
settlements on different days of the market week. For the planning and
development purpose geographers have identified complete market cycles
and in complete market cycles in different economies of developing
countries.
Today mechanized transport is available almost in all states of
India and hence traders who are urban-based tend to attend markets of
their choice every day and come back to home–base every night
(Wanmali, 1981, Dixit 1981 and Hugar 1984).

60
3.6 Market Cycle in the Study Region:
South and eastern parts of the study region are agriculturally
developed, well watered and connected by the transportation network.
This area is a part of Godavari basin (Purna tributary) it is fertile, Plain
and irrigated area. Whereas physiographic impediments in the western
and north part has restriction on the development of agricultural and
communication network. As a result the market cycles of the different
nature and characteristics are observed in the study region.
A complete cycle is that cycle where marketing activity is available
continuously 6-7 days of week for trading communities. Incomplete cycle
indicates the development of market cycle for a part of the week. In the
study region both the complete and incomplete market cycles are
observed. Many Indian geographers have deviated themselves by
including only rural markets in the study of market cycle (Hugar, 2000).
In the present study it is observed that daily market centres tend to
provide a base for mobile traders and their active participation in the trade
transactions. Further, urban markets provide maximum transactions for
all kinds of mobile traders. Hence, many of these mobile traders would
not be able to complete all transactions in one day. So, urban markets not
only provide maximum transition but also initiate the mobile trading
activity.
3.7 Tahsilwise Growth of Population of Market Centres:
(1991-2011) Tahsilwise changes in population of market centres are considered
here. The Table No. 3.8 denotes tahsilwise growth of opulation of market

61
centres for the decade 1991-2001 and 2001-2011.
It is observed that there are some remarkable variations in the
population growth rate of market carters at different tahsils. The
population change in the market centres at show that the during the year
1991-2001 the changing pattern of the growth rate of the population of
market centres for the region is 12.42 percent. AundhaNagnathtahsil
shows high growth rate i.e. 42.21 percent. Whereas Sengaontahsil
belongs to a group of medium growth rate (15 to 25 percent) it has 18
percent growth rate of population. Remaining tahsils belong to the lowest
growth rate of population that is below 15 percent. They are Kalamnuri
(14.32 percent) Basmath (7.50 percent) and Hingoli (06.65 percent)
4 0 4 8 12 16 20 24
KILOMETRES
N
INDEX
HINGOLI DISTRICT
Tahsilwise Growth in Populationof Market Centres (1991 to 2001)
Above 25 %15 to 25 %Below 15 %

62
Tahsilwise Growth of Population of Market Centres (1991-2011)
Tahsils Actual Growth of
Population
Growth in Percentage
1991-2001 2001-2011 1991-2001 2001-2011
Sengaon 6206 13366 17.95 32.78
Hingoli 4945 17297 06.65 21.80
Aundha N. 8489 13078 42.21 45.73
Kalamnuri 5501 7021 14.32 15.99
Basmath 6632 20475 07.50 17.73
District
Total
31773 71237 12.42 24.77
Source: District Census Handbook, Hingoli.
In the year 2001-2011, it is observed that changing pattern of
growth rate of the population of the market centres for the study region as
a whole is 24.77 percent. The tahsilsAundhaNagnath and Sengaon have a
high growth rate (more than 25 percent) i.e. 45.73 percent and 32.78
percent respectively. Whereas, the tahsils viz., Hingoli, Basmath and
Kalamnuri are in a group of moderate growth rate between 15 to 25
percent.

63
The medium growth rate is found in Hingoli 21.80 percent,
Basmath 17.73 percent and Kalamnuri 16 percent. No any tahsil belong
to the lowest growth rate of population.
It is mainly due to the development of big market centres nearby;
some small markets have been closed. For example the development of
Hingoli daily market centres has adversely affecting on the marketing
function and closed market centres these are Raholi, Sawad, Digras (K)
and Khudaj.
It has also observed for both the decades that the high growth rate
of population is found in AundhaNagnathtahsil. This was due to
development of JawalaBajar market centres and started two new market
centres i.e. Pimpaldari and Bhosi.
4 0 4 8 12 16 20 24
KILOMETRES
N
INDEX
HINGOLI DISTRICT
Tahsilwise Growth in Populationof Market Centres(2001 to 2011)
Map No. 3.9
Above 25 %15 to 25 %Below 15 %

64
3.8 Growth Rate of Market Centres According to their Population
Size:
Here, an attempt has been made to study the tahsilwise market
centres according to their size of population. The market centres have
been classified into six categories.
It is observed from that there is change in the number of market
centres. However, category-wise and tahsilwise classification of shows
considerable shift in categories of markets. In the first category (below
1000 population) there were 02 market centres in the year 1991 in the
whole study region, which has reduced by one market centres in the year
2001 and in 2011 increased by one market centre. In the second category
of the market centres (1000 to 2000 population ) there were 09 market
Centres in the year 1991 in the study region, which has reduced by seven
market centres in the year 2001 and increased by tow market Centres in
the year 2011. In the third category (2000 to 3000 population) of the
market centres has shown constant trend from 05 to 05 in the years 1991
to 2011. The fourth category (3000 to 4000) of the market Centres has
shown declining trend from 07 to 02 in the years 1991 to 2011.
It has reduced by five market centres. In these decades, the fifth
category (4000 to 5000 population of the market centres there were 07
market centres in the year 1991 which has reduced by six market centre
in the year 1991 to 2001. and increased by 07 market centres in the year
2011. The sixth category (above 5000) of market centres has recorded
increase in number from 11 to 16 and thereafter there are constant.

65
Growth of Market Centres According to their Population Size
(1991-2011)
Tahsils Year
s
Number of Market Centres in Each Category
Below 1000
population
1000 to 200
0
2000 to 300
0
3000 to 4000
4000 to 5000
Above
5000
Total
Sengaon
1991 -- -- -- -- -- -- --
2001 -- -- 03 02 -- 04 09
2011 02 01 04 01 02 04 14
Hingoli
1991 01 06 03 03 04 03 20
2001 -- 01 01 -- -- 02 04
2011 -- -- 01 -- 01 02 04
AundhaNagna
th
1991 -- -- -- -- -- -- --
2001 -- -- -- -- -- 03 03
2011 -- 01 -- -- 01 03 05
Kalamnuri
1991 01 02 01 01 -- 03 08
2001 01 01 -- 01 -- 03 06
2011 -- 02 -- -- 01 03 06
Basmath
1991 -- 01 01 03 03 05 13
2001 -- -- 01 01 01 04 07
2011 -- -- -- 01 03 04 08

66
District Total 1991 02 09 05 07 07 11 41
2001 01 02 05 04 01 16 29
2011 02 04 05 02 08 16 37
Source: Compiled by Researcher from district Census Handbook, 1991 to
2011.
The tahsilwise analysis in all categories has shown the high-test
number of market centres (09) in Sengaontahsil and lowest number of
market centres are (03) in AundhaNagnathtahsil in the year 2001.
Basmathtahsil have 07 market centres in all categories followed by
Kalamnuri (06) and Hingoli (04).
In the year 2011, there were 37 market centres in the study region.
The highest market centres were 14 in Sengaontahsil. The lowest market
centres were 04 in Hingolitahsil. 08 market centres were found in
Basmathtahsil followed by 06 in Kalamnuri and 05 in
AundhaNagnathtahsil.
This is due to increase in the size of population of small market
centres, during the period under investigation.
3.9 Summary:
The foregoing analysis clearly shows that the spatial distribution of
market centres is characterized by their uneven distribution throughout
the region. There are 05 daily, 1 bi-weekly and 31 weekly market centres.
Market meetings are held in a week in this region as a whole. The lowest
market meetings are 10 held in Hingoli and AundhaNangnathtahsil and
highest number of market meetings is 19 in Sengaontahsil. Spatial
distribution of market centres are affected by physiography, development
of transportation network, development of economic activities and
population. The daily markets are concentrated in south and east part of

67
the study region, which is relatively plain, fertile and well developed part
of the region. Further it is noted that the present market day cycle are not
properly synchronized. A specific day marketing meetings are being held
at many centres which are very near to each other and it creates many
interruptions in the market cycle. To avoid the interruption and
competition among the market centres, to increase the functional capacity
of the market centres and to make it convenient to the mobile traders
there is need of restructuring the existing market cycles. However, to
realize the relative importance of market centres in the region,
investigations concerning of centrality, hierarchy and sphere of influence
of individual market centres need to be under taken.
Thus, the overall study of the collected data clearly shows that
there is constant increase in the population of Hingoli district. Hingoli
(27.6) and Sengaon (21.0) tahsils have the highest percentage of
population growth rate whereas Kalamnuri (17.5) and Basmath (13.3)
have lowest percentage of population growth rate in district in last
decade. In the study region there is gradual growth of market centres
during last decades. However, it is noteworthy that the growth of market
centres in last two decades has fluctuated from decade to decade.
Multiple factors are responsible for this situation. The changing socio-
economic, political factors and increase in population are the some of the
encouraging factors for this situation. Other factors include increasing
density of communication network, commercialization, development of
irrigation, development of agricultural etc. Beside this better medical
facility, telephone facilities, electricity is also contributing factors.
In the last decade study region has experienced increase in the
number of market centres. Growth of population is a cause of the increase
in number of market centres, there after increased transportation facilities

68
is a reason of increasing the number of market centres. Limited source of
earning is a main reason of increase in market centres in Sengaontahsil.
References:
1. Gharpure, V.T. and Pawar, C.T., (1991): Expected Perspective on
Agro Service Centres in Panchaganga Basin (Maharashtra). Indian
Journal of Regional Science, Vol. XXIII, No. 2, Pp. 17-24.
2. Good, C.M., (1975): Periodic Markets and Travelling Traders in
Uganda; the Geographical Review, Vol. IXV, Pp. 49-72.
3. Hammond, R. and Mcullagh, P.S., (1974): Quantitative Techniques
in Geography, an Introduction, Oxford, Pp. 238-239.
4. Hodder, B.W. (1965): The Distribution of Markets in Yoruba
Land, Scotish Geographical Magazine, 81, Pp. 57-97.
5. Hugar, S.I., (1984): Spatial Analysis of Market Systems in
Dharwad District, Unpublished Ph.D. Thesis, Karnataka
University, Dharwad.
6. Hugar, S.I., (2000): Traditional and Non-Traditional Market
Exchange, A Study in Spatial Development Ganga Kaveri
Publishing House, Varanasi, Pp. 55-71, 144-155.
7. King, L.J., (1962): A Quantative Expression of the Patterns of
Urban Settlements in Selected Areas of the United State,
TijdchriftWoorEconomischeen social Geografie, 53, Pp. 1-7.

69
Chapter IV
Typology of the Market Centers
4.1 Introduction
4.2 Classification Based on Population Size
4.3 Classification Based on Persons Engaged in Tertiary
Activities
4.4 Classification Based Major Commodities
4.5 Classification Based on Number of Shops
4.6 Classification Based on Location of Market Place or Site
4.7 Classification Based on Shape of Market Site
4.8 Classification Based on Road Accessibility
4.9 Classification Based on Railway Accessibility
4.10 Summary
Chapter IV
Typology of the Market Centres
4.1 Introduction:
An understanding of the typology of market centres is necessary in
a study of spatial organization of market centres. Classification, normally,
brings to light a number of features about market centres which have
bearing on the differing interaction patterns between the market and its
customers, the market and its sellers and in a totality, the market and its
hinterland. It, thus, aids in planning and programming further

70
development at the centre, or that development at the periphery and
hence. At the grass roots, ensues as a natural consequence.
In the previous chapter third deals with introduction, spatial
distribution of market centres i.e. ratio of area and market centres, ratio of
inhabited villages and market centres, population and Market Centres
Ratio, rural market centres and their distance from nearest town,
distributional pattern of market centres, distribution of periodicity of
market centres, day-wise distribution of market centres, market cycles,
regional growth characteristic and summary etc. points analysed in detail.
This chapter throws light on typology of market centres in the
study region. Classification of market centres on different bases
discussed. Persons engaged in tertiary activities, estimated average
attendance, function and exchange orientation, major commodities,
market meeting days and their periodicity, number of shops, location of
market place or site, areal coverage of market meeting place, length of
marketing hours etc. bases considered for the classification of market
centres in Hingoli district.
Studies on typology have been done by various geographers who
have also discussed the method of going about such work. McKim has
observed, ‘The classification can be approached through the analysis of
specific information for such market concerning the selection of goods
and services available in the market, the number of firms involved and
their scale of operation and the size and nature of the area served by the
market for varying functions’. However, he cold not adopt this definitive
approach in his classification of periodic markets of Ghana due to
practical difficulties and adopted Skinner’s classification based on size
and function (Skinner, 1964). Scott (1972) has noted that ‘any
classification which attempts to be all inclusive must include market
orientation, function and periodicity’. Accordingly, he distinguished five

71
types of market centres in Nigeria. But he expressed his dissatisfaction:
theoretically all of these are low order markets and are difficult to classify
(Scott, 1972). Hodder and Ukwu have used functional criteria for a
hierarchical classification of periodic markets in eastern Nigeria whereas
Jackson (1971) has classified the periodic markets in southern Ethopia
into two classes on the basis of commodity specialization. Webber and
Symanski (1933) have made a meaningful economic location analysis of
periodic markets on the basis of their characteristics: periodicity, the
mobility of sellers and the agglomeration of sellers.
Bromley (1974) has made a valuable bibliographic study of
‘Periodic Markets’, ‘Daily Markets and Fairs’ in which some aspects of
classification of market centres have also been taken up.
In India, such taxonomic studies of market centres are only a few.
Singh (1962) and Vishwanath (1967) classified rural markets and urban
centres only on the basis of some of the industrial categories mentioned I
the Census Handbooks. Tamaskar (1966) classified the weekly markets in
the Sagar-Damoh Plateau on the basis of population size, area,
commodity and attendance. Mukherjee (1968) also classified the market
centres of Darjeeling area. Ghosh (1972) and Saxena (1975) attempted
classifications of market centres. On the basis of population served, and
the service area. Duggal and Mallick (1974) classified the markets of
Haryana. Wanmali (1976) restricted his study tot eh distribution pattern
of consumer goods in periodic markets of Singhbhum District, South
Bihar. Jana (1978), Srivastava and Gupta (1979), Tamaskar (1979), Singh
(1980) have made a detailed analysis of periodic markets and regulated
market systems in India. Dixit (1980-1986) and Nath and Jain (1981),
Singh and Dixit (1982) have worked out a detailed functional typology of
market centres in the Umland of Kanpur Metropolis. Ghosh (1982) and

72
Khandwe (1982) have presented the typology on the basis of attendance
in a market centre on a marketing day.
4.2 Classification Based on Population Size:
Dixit (1985) classified of market centres based on human numbers.
Tamsaskar (1966) classified the weekly markets in the Sagar, Damoh
plateau on the basis of population size, area, commodities and attendance.
Four classes have been made for rural centres and two for urban
centres and classified in details of market centresin the study region on
the basis of population size. Among the rural market centres four classes
are identified. They are below 2500, 2500 to 4999, and 5000 to 7499 and
above 7500. Among the urban market centres two classes are indentified.
They are below 20000 and above 30000populations. In the group of rural
market centres, 09 market centres belongs to below 2500 population size.
In it the highest number of market centres are five in Sengaon i.e.
Lingpimari (141), Adol (1012), Khillar (800), Kapadsingi (2326) and
Kendra BK. (2366), lowest number of market centre is one each in
Hingoli and AundhaNagnathtahsil i.e. Sirsum (BK) in Hingoli and Bhosi
in AundhaNagnathtahsil. GoulBajar and Bolda these two market centres
belongs to below 2500 population sizeBetween 2500 to 4999 population
size 12 rural market centres arelocated. Out of 11 market centres highest
number of market centres are Five in Sengaontahsil i.e. Palashi (2745),
Kahakar (2836), Shakhara (3006), Jaipur (4123), and Ajegaon (4204) and
lowest number of market centre is one each in Hingoli, AundhaNagnath
and Kalamnuri i.e. Kanhergaonaka (3213), Pimpaldari (4277) and
WarangaPhata(4010). Such types of four market centre in Basmathtahsil
i.e. Aral (3387), ChoundiAmba (4196), Hayatnagar (4377) and Adgaon
(4426).

73
Between 5000 to 7499 population sizesfive market centres are
situated. Out of these highest two market centres are located in
Sengaontahsil i.e. Pusegaon (5992) and Pankanhergaon (6229). Lowest
number of market centre are each in Hingoli, AundhaNagnath and
Kalamnuritahsil i.e. NarsiNamdev (5988), ShiradShahapur (7385),
Dongarkada (6956).
Typology of Market Centres Based on Population Size 2011
Tahsils
Number of Market Centres
Rural Population Urban Population
Below
2500
2500 to
4999
5000 to
7499
7500 to
Above
Below
30000
Above
30000
Sengaon 05 05 02 02 -- --
Hingoli 01 01 01 -- -- 01
AundhaNagnath 01 01 01 02 -- --
Rural Population
30000 & Above
Below 30000
Urban Population4 0 4 8 12 16 20 24
KILOMETRES
N
INDEX
Typology of Market Centres Based onPopulation Size, 2011
Below 25002500 to 49995000 to 7499
7500 & Above

74
Kalamnuri 02 01 01 01 01 --
Basmath -- 04 -- 03 -- 01
District Total 09 12 05 08 01 02
Source:Compile by Researcher Based on Field Work.
Eight market centres are located in above 7500 population size out
of these three are located in Basmathtahsil they are Hatta (8238), Girgaon
(9614) and Kurunda (12324), Sengaon (8466) and Goregaon (9896)
located in Sengaontahsil, AundhaNagnath (14892), and JavalBajar
(13233) located in AundhaNagnathtahsil and AkhadaBalapur (12521)
located in Kalamnuritahsil.
There are three urban market centres in the study region. All these
market centres are tahsils headquarters. They are Hingoli (85137)
Basmath (68937) and Kalamnuri (24797).Hingoli and Basmath are
classified into above 30000 population size and Kalamnuri classified into
below 30000 population size.
4.3 Classification Based on Persons Engaged in Tertiary Activities:
The census of 2011 shows that people are mainly engaged in trade
and commerce. It comprises servicing, repairs, household industries etc.
in one particular category. In the wide sense that are generally included
under the tertiary activities. This category can serve as an important
retailing and whole sailing sector of economic activity. The following
table denotes such classification of market centres in the study region.

75
Typology of Market Centres Based on Persons Engaged in Tertiary
Activities, 2011
Tahsils
Number of Market Centres
Rural Population Urban Population
Below 50 50 to 99 99 to 199 200 and
Above
Below
3500
Above
3500
Sengaon 03 04 03 04 -- --
Hingoli -- -- 02 01 -- 01
AundhaNagnath 01 -- 01 03 -- --
Kalamnuri -- 02 -- 03 01 --
Basmath -- 02 02 03 -- 01
District Total 04 08 08 14 01 02
Source: Compiled by Researcher Based on Field Work.
Among the rural market centres there are four classes and in urban
centres there are two classes in this classification. The rural classes run as
below 50, 50 to 99, 100 to 199 and 200 and above persons engaged in
tertiary activities, on the contrary, urban classes, the numbers run as
below 3500 and above 3500 persons
The four classes of rural market include 34 market centres. The
class below 50 belongs 04 market centres. Out of 04 markets centres the
highest number of market centres 03 are in Sengaontahsil i.e.
Lingpimpari (36), Khillar (28), Adol (40). The lowest number of market
centres is only one and it belongs to AundhaNagnathtahsils. They are
Bhoshi, the exceptions to this group are Hingoli, Kalamnuri and
Basmathtahsil.
The class between 50 to 99 consists of 08 market centres. Out of
eight the highest number of market centres is 04 in Sengaontahsil they are
Kapadsingi (75), Kahakar (80), Palashi (99), and Kendra BK (99).

76
Two market centres each belong to two tahsils i.e. Kalamnuri
(GoulBajar 80, Bolda60) and Basmath (Adgaon99, Hayatnagar90)
Hingoli and AundhaNagnathtahsils are exceptions to this class.
The class between 100-199 includes 08 market centres. Out of
these 03 markets centres are in Sengaontahsil. They are Pankanhergaon -
165, Sakhara-140, Jaipur-110. Two market centres each in Hingoli
(Sirsum-120, Narsi Namdev-190) and Basmath (Aral-160, Girgaon-180).
And only one market centre in AundhaNagnathtahsil i.e. Pimpaldari-120.
Kalamnuritahsil is exception to this class.
The class 200 and above includes 14 market centres. Out of these
the highest number of market centres are four in Sengaontahsil. i.e.
Sengaon -2100, Goregaon -500, Pusegaon-430, and Ajegaon-202. Three
thsils consist 03 market centres each. They are AundhaNagnath -1240,
Jawala Bajar-1200, Shiradshahapur in AundhaNagnathtahsil.
AkhadaBalapur -1300, Waranga-380, Dongarkada-280 in
4 0 4 8 12 16 20 24
KILOMETRES
N
INDEX
Typology of Market CentresBased on Person Engaged in Tertiary Activities,
2011
Below 5050 to 99100 to 199
200 & Above
Rural Population
3500 & Above
Below 3500
Urban Population

77
Kalamnuritahsil and Choundi Amba-290, Hatta-470, Kuranda-940 in
Basmathtahsil. Remaining one market centres in Hingolitahsil i.e.
kanhergannaka-420.
Out of three urban market canters in Hingoli district one include to
the class below 3500 tertiary population i.e. Kalamnuri and two market
centres includes to the class 3500 and above tertiary population. They are
Hingoli-4800 and Basmath -6040. AundhaNagnath and Sengaon are
exception to the class.
4.4 Classification Based Major Commodities:
A different variety of commodities arrive at a market with a
purpose to be traded. The term major is related with the arrival of a
particular type of commodity. Jackson (1971) has classified the periodic
markets in southern Ethiopia into two classes on the basis of commodity
specialization (local and specialized).
The number of major commodities has been classified into rural
and urban markets. Rural markets into four classes and urban markets
into three are divided. A tahsil–wise break up has been demonstrated. It is
observed that maximum number of market centres 12, offer below 3
kinds of commodities for sale, followed by 08 market centres which
offer3 to 4 kinds of major commodities for trade. 08 markets have trading
5 to 6 commodities. Six markets have trading seven and above
commodities.
Out of three urban market centres one which function at the local
level i.e. Kalamnuri, this is below the district level trade. One market
centres function at the district level i.e. Basmath. There is only one
market centre which function at the above district level. The commodities
have considerable trade over larger areas in the case of this one centre.
The district level market centres either import or export commodities
within the district limit.

78
Typology of Market Centres Based on Major Commodities
Tahsils
Number of Market Centres
Rural Urban
Below 03 03 to
04
05 to
06
Above
07 Local Dist.
Above
Dist.
Sengaon 06 03 03 02 -- -- --
Hingoli -- 02 01 -- -- -- 01
AundhaNagnath 02 -- 01 02 -- -- --
Kalamnuri 02 -- 02 01 01 -- --
Basmath 02 03 01 01 -- 01 --
District Total 12 08 08 06 01 01 01
Source:Compiled by Researcher Based on Field Work.
4.5Classification Based on Number of Shops:
In rural markets the shops are not permanent. The sellers come
when the market meets. Sometimes these sellers are seen engaged in
some other occupations for example labours and cultivators etc. there are
some fulltime sellers but they have no permanent shops. They travel from
market to market in search of customers. These are the mobile
shopkeepers or traders. All such traders found at any one market i.e.
local- temporary-permanent and mobile traders. In spite of it there are
also the outsider mobile traders who come from neighboring villages.
On the basis of the number of shops the classification has been four
rural classes and two urban classes of market. The rural classes run as
below 100, 100 to 4999, 500-999 and 1000 and above number of shop.

79
On the other hand two urban classes run as below 2000 and above 2000
number of shop.
Typology Market Centres Based on Number of Shops
Tahsils
Number of Market Centres
Rural Urban
Below 100
100 to 499
500 to 999
Above 1000
Below 1000
Above 1000
Sengaon 10 03 01 -- -- --
Hingoli -- 03 -- -- -- 01
AundhaNagnath 01 02 02 -- -- --
Kalamnuri 01 03 01 -- 01 --
Basmath 04 03 -- -- -- 01
District Total 16 14 04 -- 01 02
Source: Compiled by Researcher Based on Field Work.
Out of 34 rural centres 16 market centres belong to the class below
100 number of shop it is highest number of market centre. The lowest
number of market 04 belongs to 500 to 999 classes. Rest of it 14 market
centres belongs to 100 to 499 class. All there urban market centres belong
to the class below 200 number of shop.
Out of 34 rural markets centre sixteen market centres belong to the
class below 100 numbers of shops. The highest number of market centres
is ten in Sengaontahsil i.e. Geregaon18, Jaipur 33, Lingpiari 35, Adol 40,

80
Kpadsingi 59, Khillar 60, Kendra BK 82, Khakar 90, Pankahnergaon 90,
and Palashi 94. The lowest number of market centrePalashi 94.
Hingolitahsil is an exception to this class.
To the class 100 to 499 belongs 14 market centres these are
Shakhara (119), Ajegaon (140), Pusegaon (138), Narsi (127), Sirsam
(102), Kanhergaonnaka (160), Pimpalari (129), Shiradshahapur (102),
AjgadaBalapur (354), Bolda (347), GoulBajar (122), Girgaon (142),
Hatta (150), and Kurunda (331)
The class 500 to 999 includes 04 market centres two in
AundhaNagnathtahsil and one in Sengaon and Kalamnuritahsil each.
Rests of two tahsils are exceptions to the class.
It is observed that out of three urban market centres all three
market centres. Belong to the class below 1000 number of shop
i.e.Kalamnuriand tot eh class above 1000 number of shops is observed in
Hingoliand Bashmathtahsils. Rest of Sengaon and AundhaNagnathtahsils
are exception to the class.
4 0 4 8 12 16 20 24
KILOMETRES
N
INDEX
Typology of Market Centres Based onMajor Commodities, 2011
Below 100
100 to 499
Above 500
Above 1000
Below 1000

81
4.6Classification Based on Location of Market Place or Site:
Attendance is affected by the location of the market place. If the
market place is at the main road, people can easily come and buy
something. It also provides an opportunity to the outsiders, to purchase
some items while travelling. The location of market near the tank proves
an ideal, specially where there is the scarcity of water. People gather at
the tank to wash, clean and carry water for their needs. So it is easy for
them to buy items from the market. The religious places as temples and
mosques are important for site because at these places festivals are
celebrated and fairs are held frequently with great merriment and
happiness. Therefore these factors have been chosen to classify markets
and their closeness to the factors
Webber and Symanski (1973) have made a meaningful economic
location analysis of periodic markets on the basis of their characteristics,
periodicity, the mobility of sellers (between locations and occupations)
and the agglomeration of sellers. Above three, four factors are responsible
for the growth of market centre and the urban market centre are
developed on roads. Means of transportation, tanks played a vital role in
the development of these market centres.
Typology of Market Centres Based on Market Location
Tahsils
Number of Market Centres
Rural Urban
No Factor
One Factor
Two Factors
Above Two Factors
Below Three
Factors
Above Three Factors
Sengaon 07 04 02 01 -- --
Hingoli 01 01 01 -- 01 --

82
AundhaNagnath 02 -- 02 01 -- --
Kalamnuri -- 03 02 -- 01 --
Basmath 03 04 -- -- 01 --
District Total 13 12 07 02 03 --
Source:Compiled by Researcher Based on Field Work.
Out of 34 rural market centres, 13 market centres are not located
near any above said factors; only local needs of the people have been
playing the causative role in its development. There are 12 market centres
in the rural environment situated near only one factor, 07 are located near
two factors and 02 are located near more than two factors. Out of 03
urban market centresHingoli situated near main road and central market
zone of the city and Dasara “grond (open space for parking) Kalamnuri
situated near main road and bus stand. Basmath situated on main road.
4.7Classification Based on Shape of Market Site:
Market centre can be classified using geometrical shapes of the
marketing sites. The study region shows different shapes on which the
classification is based for example rectangular, square, triangular and
elongated etc.
The shows typology of market centres based on shape of market
site in study region. The classification of rural market centres is in above
various shapes of marketing site. The circular shape of marketing site
includes 12 market centres which is the highest second number of market
centre in rural area. Out of 12 numbers market centres five are in
Sengaontahsil, two are AundhaNagnath, Kalamnuri and Basmathtahsils.
The lowest number of market centre in circular shape of market site is
only one in Hingolitahsil.

83
Typology of Market Centres Based on Shape of Market Site
Tahsils
Number of Market Centres
Rural Urban
Circul
ar
Rectangul
ar
Squar
e
Triangul
ar
Elongated Rectang
ular
Circul
ar
Triangul
ar
Sengaon 05 01 02 02 04 -- -- --
Hingoli 01 01 -- -- 01 -- -- 01
AundhaNagn
ath
02 -- -- 01 02 - -- --
Kalamnuri 02 -- 01 -- 02 01 -- --
Basmath 02 -- -- 01 04 -- 01 --
District
Total
12 02 03 04 13 01 01 01
Source:Compiled by Researcher Based on Field Work.
Two Rectangular shape of marketing site are observed in the study
region. Out of two numbers market centres one is in Sengaon and one in
Hingolitahsils. Out of three Square shape of market site are found in the
study area. Highest two square shape of market site are noticed in
Sengaontahsil and only one square shape of market site are situated in
kalamnuritahsil.
Four market centres are observed in the shape of triangular and
thirteen elongated. Out of four triangular shape of marketing site two
marketing centres are observed in one tahsil i.e. Sengaontahsil. In
remaining two tahsils there is one market centres each. They are in
AundhaNagnath and Basmathtahsils.
Out of thirteen market centres in the elongated shape of market
places in four market sites each tahsils have two market centres i.e.

84
Sengaon and in Basmathtahsil. Two each tahsils have two centres i.e. in
AundhaNagnath and in Kalamnuritahsil. One market centre in the
elongated shape of market place in Hingolitahsil.
All three urban market centres belongs to rectangular shape of
market place they are Hingoli, Basmath and Kalamnuri. Rest of two
tahsils is exception to it.
4.8 Classification Based on Road Accessibility:
Road accessibility plays vital role in marketing. It is an important
factor in this regard. The whole study region is connected by metelled
roads either already constructed or under construction.
34 rural market centres are classified in four categories based on
the distance of the market centre from the road. As i) on the road, ii)
distance from the road 1 to 2 km. iii) 2 to 3 km. distance iv) above 3 km.
distance from the road.
28 market centres are located on the road i.e. the first category of
on the road. Out of these highest numbers of market centres located on
the road are twelve in Sengaontahsil. Two market centres located on the
road are Hingolitahsil. Five market centres located on the road each
tahsils i.e. AundhaNagnath and Basmathtahsils.

85
In one tahsils four market centres are located on the road i.e. Kalamnuri
In the second category of distance of market centre from the road
i.e. 1 to 2 km. five market centres are situated. Out of it, the highest
numbers of market centres are two in Basmathtahsil. One market centres
are found in three tahsils each i.e. in Sengaon, Hingoli and Kalamnuri.
Typology of Market Centres Based on Road Accessibility
Tahsils
Number of Market Centres
Rural Urban
On
Road
1 to 2 km.
from Road
2 to 3 km.
from Road
Above 3 km.
from Road
On
Road
Sengaon 12 01 01 -- --
Hingoli 02 01 -- -- 01
4 0 4 8 12 16 20 24
KILOMETRES
NINDEX
Typology of Market Centres Based onRoad Accessibility, 2011
On Road
Upto 02 km.
Above 2 km
Urban - On Road

86
AundhaNagnath 05 -- -- -- --
Kalamnuri 04 01 -- -- 01
Basmath 05 02 -- -- 01
District Total 28 05 01 -- 03
Source:Compiled by Researcher Based on Field Work. One market centre is located in third category of distance from
road i.e. 2 to 3 km distance i.e. Sengaontahsil. Urban market centres
situated on the road are three except Sengaon and AundhaNagnath. All of
the three market centres are located on the road.
4.9 Classification Based on Railway Accessibility:
Out of 37 market centres 34 rural market centres are divided in four
categories based on the distance of the market centre from the railway
station i) On railway line, ii) Distance from railway station below 15 km.,
iii) Distance-between 15 to 30 km. from railway station, iv) Distance
above 30 km. from the railway station. Purna-Akola railway heads
towards Washim via Basmath through Hingoli district.
Two rural market centres are located on railway line in Hingoli
district; they are Kalamnuri (Bolda) and Basmath (ChoundiAmba).
In second category eight market centres are situated three such
market centres are located in Basmathtahsil. Two market centres each is
found in Hingoli and AundhaNagnathtahsils. One market centre is located
in Sengaontahsil.

87
Typology of Market Centres Based on Railway Accessibility
Tahsils
Number of Market Centres
Rural Urban
On Railway
line
Below 15 km from
R.St.
15-30 km from R.St.
Above 30 km from
R.St.
On Railway
line
Below 05 km from R.St.
Above 05 km from R.St.
Sengaon -- 01 01 12 -- -- --
Hingoli -- 02 01 -- 01 -- --
AundhaNagnath -- 02 02 01 -- -- --
Kalamnuri 01 -- 02 02 -- -- 01
Basmath 01 03 03 -- -- 01 --
District Total 02 08 09 15 01 01 01
Source:Compiled by Researcher Based on Field Work.
The third category of the distance from the railway station between
15 to 30 km. contains nine market centres. Out of these three market
centres found in Basmathtahsil. Out of these two market centre each are
found in two tahsils i.e. AundhaNagnath and Kalamnuritahsils. The
lowest number of market centre is one each in two tahsils namely
Sengaon and Hingolitahsils.
Fifteen market centres are found in the last category of the distance
from the railway station above 30 km. out of fifteen market centres,
twelve market centres are situated in Sengaontahsil. Two market centres
are found in Kalamnuri and one in AundhaNagnathtahsil. Rests of all
tahsils are exceptions to the fourth category.

88
There are three urban market centres located in the entire district
and are classified in three categories i) such as on railway line ii) below
15 km. distance from the railway station and iii) above 15 km. distance
from the railway station. Only one urban market centre are located on
railway line i.e. Hingoli. Below 15 km distance from urban market centre
is located on Basmath and One urban market centres found in distance
above 15 km. from the railway line of the third category i.e. Kalamnuri.
4.10 Summary: The typological analysis of market centres is based on as many
factors. When the development of several topologies is considered, it
shows many important factors the come out.
The examination of the typology indicates that the types of market
centres are dissimilar. It is the result of undulating Physiography and
other physical factors, problems of transportation facilities the problems
4 0 4 8 12 16 20 24
KILOMETRES
NINDEX
Typology of Market Centres Based onRailway Accessibility, 2011
Map No. 4.9
On Railway Line
Below 15 km.
15 to 30 km.
Above 30 km.
Urban-On Railway Line
Urban-Below 15 km.
Urban-Above 15 km.

89
in supplying of goods and services, uneven distribution of population
density, lack of communication facilities etc.
References: 1. Dixit, R. S., (1985) : “Typology of Market Centre Based on Human
Member”, Geographical Mesaic (Mukhopadhyaya, S.C. ed),
Calcutta, Modern Book Agency, Pp. 722-733.
2. Ghosh, M., (1982) : “Market Centre an Important type of
Settlement in North Bengal”, Geographical Review of India, 44, 1.
3. Gupta, S. K., (1967) : “The Landscape of Milk Supply at Baraut”,
The Geographical Observer, 3.
4. Hodder, B. W. and Ukwu, V. I., (1969) : “Markets in West Africa
Studies of Markets and Trade Among the Yorabe and Ibo”, Ibdan,
Ibadan, Univ. Press.
5. Khandwe, M. A., (1982) : “Distributional Pattern and
Classification of Market Centres in the Amravati District”, The
Deccan Geographer, XX, 2.
6. Scott, E. P., (1972) : “The Spatial Structure of Rural Northern
Nigeria – Farmers : Periodic Markets and Villages”, Economic
Geography, 48 July III, Pp. 316-332.

90
Chapter V
Hierarchy of Market Centers
5.1 Introduction
5.2 The Concept of Centrality
5.3 Choice of Methods for Present Study
5.4 Regional Analysis of the Centrality
5.5 The Concept of Hierarchy
5.6 Tahsilwise Distribution of Hierarchical Order of Market Centres
5.7 Application of Christallar’s Central Place Theory
5.8 Summary
Chapter V
Hierarchy of Market Centres

91
5.1 Introduction: The last chapter deals with the study of typology of market centres.
The present chapter aims to present an analysis of centrality and
hierarchy of market centres in Hingoli district. At the same time several
hierarchical classes are also included in the present study.
Indeed, the wealth of descriptive terms available illustrates this
notion; hamlet, village, town, city, metropolis and the like (Berry and
Garrison, 1958). The term ‘central place’ was first used by Mark
Jefferson (1931) to denote a settlement which is the focal point of one or
more economic and social activities of its surrounding area. Walter
Christaller (1933) popularized the term which is in wide use now. Reilly
(1929) realized the relationship between the size of a settlement and its
complementary region and stated that the complexity of functions
prevailing in a larger settlement is much more than that of a smaller one
and hence size of the central place is highly correlated with the size of its
hinterland. According to Christaler, a hierarchical class system is
inevitable in a spatial model of central places which belong to one or the
other class. Three basic models were postulated by him on the basis of the
assumption of an isotropic surface where hexagonal patterns of centrality
emerge.
In India, studies on hierarchy of market centres have been carried
out by Singh (1962). Vishwanath (1967), Mukherjee (1968), Sinha and
Mandal (1974), Saxena (1975), Srivastava (1976) and Jana (1978). The
last named has clairred to present a composite hierarchy considering the
attendance at a market, the quality and quantity of goods traded, the
periodicity of market centers and other factors (1978). Srivastava (1976)
has put up a new methodology based on the number of shops and the total
shop openings at the market centers of Naugarhtahsil of Basti district,

92
U.P. Dixit (1979, 1984), Singh and Dixit (1980) and Sharma (1984) have
also made significant attempts in this direction.
5.2 The Concept of Centrality: Consideration of market centres shows that they differ from each
other in respect of population size, functional capacity and aggregate
importance. Here, an attempt has been made to study the problem of
calculating the centrality values of the market centers in Hingoli district.
The concept of centrality refers to the measure of importance of a
place regarding its functional capacity to meet the needs of the people in
the surrounding area of the market centers. The centrality of market
centres may be indicated, qualitatively as the low and high centrality and
quantitatively with the help of values of centrality. The centrality of
market centres can be calculated by converting the functional base of
market centre into scores and on the basis of frequency and the
importance of functions performed by the place. The centrality of market
centre depends on central functions and these functions definitely have a
certain range beyond the limits of the surrounding region.
The term ‘Central Place’ was first used by Jefferson (1931, 1939)
and it is popularized by Walter Christaller (1933, 1966). Central place is a
point where settlement of economic or social activities takes place.
Central place is platform to exchange goods and services to their
hinterland. Therefore, the centrality of market place is an important
aspect of its functional magnitude which is necessary for the population
of its hinterland.
Shelter is one of the basic needs of mankind. If we consider history
of human civilization, we will find that they were settled in a very small
shape and size. The technological development and the population growth
have made the rural settlement multifunctional. Similarly, later on every

93
settlement obtained some functional importance in the region. The
physical setting of settlement at all centres differs due to the geographical
factors such as climate, topography and water resources are not same. In
this sense, the term central place has been used.
According to Singh (1977), each and every place has certain
importance more or less in accordance with its belongings of certain
functions or services not only for its internal population, but also for
surrounding area. Theoretically, a central place enjoys centrality in a
given area or region with respect to a variety of functions or services for
its adjacent area/ influenced area. To meet the socio-economic needs of
neighbouring settlements, the permanent settlements have certain
functions or activities.
5.3 Choice of Methods for Present Study: There are many methods used by different geographers to
determine the centrality of market place. These methods can be classed
into two groups, single functional method and multifunctional method.
The multifunctional method has been adopted for the present study in
which 58 different parameters have been considered (Appendix II). The
values of centrality have been obtained by using ‘Location Quotient
Method’ of W. K.D. Davies (1967).
5.3.1 Measurement of Centrality by Davies Location Quotient Method:
Davies has used this method for South values. In this method, a
score for any single unit of function is calculated by following formula:
C =푡푇
푋 100 … … … … … … … … … … … … … (퐼)
where;
‘C’ = Score for any function‘t’

94
‘t’ = One unit of function ‘t’
‘T’ = Total number of functional units of function‘t’ in the
Area
The weightage scores of all the market centers have been
considered to calculate the centrality score for the variables calculated by
adding up all values of single variable. We get composite centrality value
or index for each market centre (Appendix II). The centrality values of
market centres calculated by Location Quotient Method are given in.
Centrality Scores of Market Centres Calculated by ‘Location Quotient Method’ and their Ranks
Name of Market
Centres
Centrality value by Location
Quotient Method Rank Name
Centrality
Value Rank
Basmath 1712 1 Sirsum 70 20
Hingoli 1349 2 Narsi (Namdeo) 68 21
AkhadaBalapur 623 3 Hayatnagar 63 22
Kalamnuri 532 4 Ajegaon 54 23
JavalaBajar 481 5 Aral 52 24
Sengaon 459 6 Adgaon 46 25
AundhaNagnath 401 7 Bolda 40 26
Kurunda 238 8 Kendra (BK) 39 27
ShiradShahapur 231 9 Jaipur 36 28
Goregaon 226 10 Kahakar 33 29
Waranga 194 11 Palashi 32 30
Kanhergaonnaka 174 12 GoulBajar 28 31
Hatta 163 13 Pimpaldari 27 32
Pusegaon 139 14 Kapadsingi 26 33

95
Sakhara 125 15 Bhosi 20 34
Dongarkada 123 16 Lingpimpari 15 35
Pankanhergaon 92 17 Adol 13 36
Girgaon 85 18 Khillar 11 37
ChoundiAmba 74 19
Source:Compiled by Researcher.

96
0
200
400
600
800
1000
1200
1400
1600
1800
Cent
ralit
y V
alue
s
Rank of Market Centres
Graph No. 5.1: Centrality Ranks and Hierarchy of Market Centres
Market Centres
II Order
III OrderIV Order

97
5.4 Regional Analysis of the Centrality: The spatial distribution of the centrality values calculated for each market
centre.
The composite scores of centrality gained by Davies (1967) location
quotient method clearly show the notable difference between the higher and lower
values. All the centrality values of each market centres is taken into account from
higher to lower in the study area. The highest centrality values is obtained by
Basmath market centre (1712) and is followed by Hingoli (1349), AkhadaBalapur
(623), Kalamnuri (532), JawalaBajar (481), Sengoan (459) and AundhaNagnath
(401). The above said market centres are important for the study region. Out of
these, five market centres are tahsil headquarters.
4 0 4 8 12 16 20 24
KILOMETRES
N
INDEXCentrality Score
Map No. 5.1
Below 80
80 to 400
400 & Above
Urban-Below 1000
Urban-1000&Above

98
Whereas 80 to 400 centrality values are found by Girgaon (85),
Pankanhergaon (92), Dongarkada (123), Sakhara (125), Pusegaon (139), Hatta
(163), Kanehragaonnaka (174), Warangaphata (194), Goregaon (226),
ShiradShahapur (231) and Kurunda (238).
Below 80 centrality values are observed in Khillar (11), Adol (13),
Lingpimpri (15), Bhosi (20), Kapadsingi (26), Pimpaldari (28), Goulbajar (28),
Palshi (32), Kahakar (33), Jaipur (36), Kendra BK (39), Bolda (40), Adgaon (46),
Aral (52), Ajegaon (54), Hayatnagar (63), NarsiNamdev (68), Sirsum (70) and
ChoundiAmba (74).
5.5 The Concept of Hierarchy: Geographical study of market centres is related to their location, distribution
and spatial interaction. The study area includes spatial organization of roads.
Market centres and their infrastructures are important components of a spatial
organization. Every market centre has a tendency of concentration of different
activities which form a foundation for spatial interaction. The relative locational
pattern of market centres can be examined in terms of hierarchy.
The concept of hierarchy has been, widely, used by many Geographers,
scholars, economists and specialists of different disciplines. In geography the
concept of hierarchy is used not merely for identification of various categories of
market centres but also for organizing market centres within entire study region.
The study of hierarchy is nothing but gradation and grouping into tires of size
classes. In every region there are some large in size regional market centres, a
medium size or sub regional and local or primary / small market centres which
perform complementary functions. There are many bases and foundations to
determine the hierarchical orders or hierarchies, the basis of number of retail or
wholesale establishments threshold, size of market area, volume of commodity

99
arrivals, total turnovers, size of population persons engaged in tertiary activities
etc. thus, the pattern of market hierarchy based on the detailed analysis have
provided a base for planning and development of the market centres.
A study of hierarchical pattern helps to understand the following elements.
i. Spatial interdependence of the centres
ii. Functional / wholeness of the system, and
iii. Clear classification of centres
The major problem of hierarchy is the determination of successive
categories of the market centres in a region.
There are different geographical studies, which have tried to determine in a
best way. They all are of different nature in terms of variables and also in
methodology. These studies can be classed into two categories.
i. Studies based on equipment
ii. Studies based on functioning of equipment
According to Scott (1970), there is a much importance to the uniform value
of all elements. He insists that classification should be based on overall
importance. Considering composition of different types of trade, forms of
organization, size of establishments, size and structure of market area, Scott has
come to the conclusion that it is not easy to measure all the elements in terms of
numerical value and also to correlate to all these elements with each other. The
hierarchy of market centre is determined on the basis of each of the above region.
The total number of shops in a market centres and size of the market area may be
considered as two variables. This is helpful to identify the hierarchy in a simple
manner.
The functioning of equipment based on the sum total of annual turnover in
the form of total value and marketed arrival is another method to determine the

100
hierarchy of market centre. But collecting of data about annual turnover and total
marketed arrival is very difficult, particularly in a developing region.
Marke Jefferson (1931, 1939) was the first to use the term ‘central place’
denoting a settlement, which is the central / focal point of economic and social
activities of its surrounding area. Later on Walter Christaller (1933) used the term
and it became popular onwards. It is frequently used now days. Railleries (1929)
find out the relationship between the size of settlement and its complementary
region and stated that the complexity of functions prevailing in a larger settlement
is much more than that of a smaller one and therefore size of the central place is
highly correlated with the size of its hinterland. In the view of Christallar, a
hierarchical class system is unavailable in a spatial model of central places, which
belongs to one or the other class sets/ sub-sets. He postulates three basis models on
the basis of the assumptions of tropic surface where hexagonal pattern of centrality
has emerged. He has developed three controlling principles for the central place
hierarchy.
Thus:
i. The marketing principle k=3, all areas are served from a minimum set of
central places.
ii. The transport principle k=4, here the distribution is such that as many places
as possible lies on the main transport routes connecting the higher order
centres.
iii. The administrative principle k=7, better administration is the controlling
factor of this principle.
Christaller’s central place theory is an argumentative and much discussed
theory. Very few accept all the aspects of his work. In spite of criticism, his work
has impulse and inspired some of the most advanced as well as scientific work in
geography.

101
August Losch (1939) is another scholar who modified the central place
theory. His economics of location was concerned with the central problem of
location of economic activity. Losch gave more importance to the economic
factors which are very important for spatial pattern of service centre or settlements.
He also believed that the equal distribution pattern spaced because of forces of
concentration and of the operation of economic of scale (Saxena, 1990).
Thrope (1968) has developed hierarchy of services and trade centres on the
basis of sales figures of all English centres in the UK. He comes out with seven
types of centres.
Another scholar Carruthers (1967) proposed a complex method to decide the
hierarchy by using three indices. The first proportion of non-food scales to the
total, second difference between the volume of actual and theoretical sales and
third is related to the presence in each centre of six types of shops i.e. shoes, men’s
wear, female clothing, furniture and furnishing radio, electrical goods and cycles,
jewelry, leather and sports goods.
Another scholar Berry’s (1967) identification of the hierarchy of central
places in Southern Iowa, South Dakota and Chicago is the most remarkable work
in USA. He also has identified seven levels of hierarchy. They are hamlet, village,
large village, small town, regional centre, regional metropolis and national
metropolis and it is based upon variables and their correlations.
Richard E. Preston (1971) has identified a new method to determine the
hierarchy of central place. Preston has used the technique of moving average, the
cumulative averages of differences when plotted on a graph reflect more than one
slope. These different shops can be seen as different groups of central places of
different order.
There are some Indian scholars who have studied the hierarchy of market
centres. They are Vishwanath (1967), Mukharjee (1968), Sinha and Mandal

102
(1974), Saxena (1975), Shrivastava (1978) and Jana (1978). Jana in his study
claimed to represent a composite hierarchy considering the attendance at a market,
the quality and quantity of goods trade, the periodicity of market centres and other
factors. Shrivastava (1976, 1978) has presented a new methodology which is based
on the number of shops and the total openings at the market centres of
Naougarhtahsil of Basti district in Uttar Pradesh. Dixit, another Indian scholar, also
has made an attempt in this regard.
The above mentioned views of various studies of hierarchic class order
shows that there is no uniform or composite index or scale to classify the central
place or the hierarchy of central place.
5.6 Tahsilwise Distribution of Hierarchical Order of Market Centres:
It has been observed that the tahsil wise analysis of hierarchical orders of
market centres in the entire study region are uneven. The highest hierarchical order
i.e. Ist order has no anyone market centre in the study area. In the second order,
there are 07 market centres. Out of these, excluding AkhadaBalapur and
JawalaBajar, all are tahsil headquarters.
INDEXCentrality Score
I Order
II Order
III Order
IV Order
4 0 4 8 12 16 20 24
KILOMETRES
N

103
So far as third order is considered, there are 11 market centres. As tahsilwise
analysis shows that, four market centres are found in Sengaontahsil. Basmath has
three market centres and Kalamnuri has two market centres. Hingoli and
AundhaNagnath belong one market centres each
Tahsilwise Distribution of Hierarchical Orders of Market Centres
Tahsil Number of
Market Centre
Number of Market Centres in Various Hierarchical
Orders
I II III IV
Sengaon 14 -- 01 04 09
Hingoli 04 -- 01 01 02
AundhaNagnath 05 -- 02 01 02
Kalamnuri 06 -- 02 02 02
Basmath 08 -- 01 03 04
District Total 37 -- 07 11 19
Source: Compiled by Researcher.
19 market centres include in fourth order of market centres. The highest nine
market centres are located in Sengaontahsil. It is followed by Basmath four market
centres. Hingoli, AundhaNagnath and Kalamnuri belong to two market centres.
5.7 Application of Christaller’s Central Place Theory: In the view of Christaller’s ‘central place theory’, the size and distribution of
central places is, particularly, based upon principle of marketing (K-3), the widely
known important marketing principle (K-3) system model. In it, the frequency of
occurrence of different levels of central places have followed the progression from
large to small as 1, 2, 6, 18, 54 and so on.
In the present study area, the observed frequency of central places is 07, 11
and 19. So far as the comparative study of it is concerned, it seemed that there is

104
total application of Christaller’scentre place theory. In the study region, no first
order market centres are seen the number in theoretical central places. But the
observed higher level numbers of market centres are much more than the
theoretical number. Then, the deviation from the theoretical number can be
demonstrated clearly by the fact that the preliminary selection of 37 places was
arbitrary. The reason behind it is that we consider all market centres of the study
region as a central place, but in reality most of them are not perfect / adequate in
the criteria of central places. Therefore the conclusion of it is that the hierarchy of
market centres in the study region is analyzed in terms of the marketing principle
of Walter Christaller and he developed his model by considering the following
characteristics (Christaller, 1933).
i. The area was a featureless, plain devoid movement was made features. ii. A situation described as an isotropic surface movement was possible in any
and every direction. iii. The uniformly distributed population and purchasing power of consumers. iv. The consumers act vocationally in space according to the principles of
distance minimization. Theoretical and Existing Hierarchy
Order of Market Centres No. of Central Places
Theoretical Observed
IV th Order 18 19
III rd Order 06 11
II nd Order 02 07
I stOrder 01 Nil
Source: Compiled by Researcher.
As it is observed that the lack of transportation facilities in the hilly area in
the study region, freely movement is not possible as the situation described in an
isotropic surface. It is also seen that population and purchasing powers of

105
consumers is also unevenly distributed in the study region. Though, it is so,
consumer act rationally in space according to the principles of distance
minimization and availability of transportation facilities. (Personal observation)
Therefore the results / consequences obtained do not match perfectly with his
theoretical numbers.
5.8 Summary: To decide the importance of a place in relation to its functional capacity to
serve the needs of the people in concerning area, centrality as a measure plays an
essential role. So far as the study of the importance of the market centres in
Hingoli district is considered, the centrality score is taken in view. It is remarkable
that the urban part is highly developed, prosperous, agriculturally developed and
infrastructural well-bestowed. Therefore urban market centres belong to high order
of centrality, while rural market centres belong to low order of centrality. It is due
to the inadequate agricultural, transportation facilities. Therefore these market
centres are economically backward.
The market centres which are situated in the urban area provide more
services and facilities to the population, whereas market centreslocated in rural
area are more in number but provide fewer facilities to concerning population than
urban market centres. It is also noteworthy that it will furnish the information and
encourage the planners and decision makers in the regional planning point of view
and the total development of the study region as well.
References: 1. Lokhande, T.N., (2001): A Geographical Perspective on Market Centres in
Kolhapur District, Maharashtra, Unpublished Ph.D. Thesis, Shivaji
University, Kolhapur.
2. Losch, A., (1939): The economics of Location, Translated by from German
(1939) into English (1954), New Haven.

106
3. Mukherjee, S.P., (1968): Commercial Activity and Market Hierarchy in a
Part of Eastern Himalaya-Darjeeling; The National Geographical Journal of
India, 14, (II & III), Pune, Sept. Pp. 186-199.
4. Preston, R.E., (1971): The Structure of Central Place System, Economic
Geography, Vol. 47, No. 2, Pp. 136-155.
5. Reilly, W.J., (1929): Methods for the Study of Retail Relationship, Research
Monograph, University of Texas, Bureau of Business Research, Pp. 29-94.
6. Saxena, H.M., (1975): Geography of Transport and Market Centres – A
Case Study of Hadaoti Plateau, S. Chand and Comapany, New Delhi.
7. Saxena H.M., (1990): Marketing Geography, Rawat Publication, Jaipur, P.
16.
8. Smailes, A.E., (1944): The Urban Hierarchy of England and Wales,
Geography, Vol.29, Pp. 41-51.
9. Srivastava, V.K., (1978): Hierarchy of Market Centres-A Methodological
Approach, Uttar Bharat BhugolPatrika, 14, 2.

107
Chapter VI
Trade Areas of Market Centers
6.1 Introduction
6.2 Choice of Methods in Present Study
6.3 Jackson’s Method
6.4 Saxena’s Modified Method
6.5 Summary

108
Chapter VI
Trade Areas 6.1 Introduction: The previous chapter includes the concept of centrality, methods of
measuring centrality i.e. Davies’ location quotient method, regional analysis of the
centrality, concept of hierarchy, tahsilwise distribution of hierarchical order of
market centres, application of Christallar’s central place theory etc. which have
been discussed in detail.
In this chapter, an attempt has been made to delimit the trade area of market
centre individuality. Market centre is related to various aspects such as surrounding
area which is known as trade area, service area or selling area. Consumer and
sellers are attracted towards this area. The trade area is concerned with distance
between the markets and their size. These factors have relative importance of their
own. It comprises the study of the sphere of influence areas whether it is well-
served or poorly served with the help of the measurement of service areas which is
also important to comprehend marketing data, performance of market centre, the
settlement and development of shops, play of the traders and customers etc. Such
study proves importance of the planning for developmental purpose. Many
geographers and scientists have employed different methods to delimit trade area
of market centers. It is seen that all these applied methods are based on gravity
models, some theoretical formulas or empirical methods which are based on field
work and study.
Market centres play vital role to exchange the goods and services. It is the
place where diffusion of innovations and ideas take place. This is how market
centres work as a linkage between the centre regional interrelations and forms a
part of marketing system of the region (V. Trivedi, 1994). The location of market
centre is an importance aspect that supports to attracts the sellers and consumers.

109
They all meet at this place and carry out their selling, buying activities and also
fulfill their wants and needs. Hence, it is important to study the base of market
centre. The importance of market centre is based upon the consumers, traders or
the population which is dependent on the region on which they live. Therefore, the
sphere of influence is most important in this sense. The spatial impact of the
service centers on the surrounding areas is discussed by various geographers (Hart
Shorne, 1980).
The trade area is a phenomenon which is abstract, complex and a combined
result in the size of market itself, functional attractions of the market, its
accessibility, availability and development of transportation network, the range of
goods and services, the attitudes of customers and sellers and the unexpected
population behaviours. These areas or the boundaries of trade areas are simply
generalized and determined one. Each commodity has its own range of goods and
its own trade area.
In this sense, the present chapter largely deals with the demarcation of trade
areas which have different hierarchical trade areas of market centers in the spatial
and population content in the study region. The methods as theoretical and
empirical are employed to the delimitation of trade areas of market centers and on
that basis, the study also becomes important in their various relative aspects.
The linkage of market centers to the other places outside the market centre
limit is determined in the location, size and space point of view. Every market
centre has its own area bounded and determined by economic and social bonds, the
market centre may big or small and it serves the needs of population living in this
area and connects with its surroundings. The above said various factors play
important roles in determining the size of trade area. Thus the physical, and at
limited sense, the political factors are also important.

110
So far as the demarcations, delimitations or identifications and analysis of
the trade areas of market centers are concerned, it is prerequisite for regional and
national planning. These studies are also necessary to understand the spatial
organization on land and it is a core of geography. To delimit the trade area is a
difficult and complex exercise. It is the outcome of multiplicity of functions, each
one of them having its own range of goods and services, consequently a special
functional hinterland. The data of central functions available at market centers and
the villages which are dependent and this data collected through the field work is
very necessary to delimit and determine a trade area of the market centers.
Two approaches are used for the delimitation and identification of trade
area. The first is outwardly from the town regarding to identify from the trade area
and the second is an inwardly from the countryside and it is more related with
consumer’s behavior (Cater, 1972).
Notwithstanding, in the countries like India i.e. developing countries, the
precise and up-to-date data essential to delimit and identify the trade area is not
possible to get. So there is a practical difficulty to acquire precise and correct
information. This is a solution to this problem and it is to obtain the data by the
way to fieldwork. It is also expensive, laborious and difficult to study a large
number of market centre. Therefore, in this type of cases, the theoretical methods
and quantitative methods are to be used and empirical methods are discarded. The
theoretical and quantitative methods can give better result.
6.2 Choice of Methods in Present Study: It is not meant that a demarcated service area boundary is rigid and
absolutely the cause is that, broadly speaking, there is a different service area for
every different commodity and human behavior as well as subjective and is
possibly to change with changing circumstances. In spite of it, by and large, a

111
service area depicts the generalized picture of composite command area of a trade
centre.
It has been clarified before although empirical method requires intensive
fieldwork, the result gained by these methods is more realistic and true. In this
sense, the method i.e. empirical method has been applied to find out the area of
influence of each market centre. Four methods have been used to find theoretical
trade area. These are:
i) Means are population and villages served by each market centre. ii) Saxena’s modified methods iii) Empirical method
6.3 Jackson’s Method:
In the present study, the study region has been demarcated by Jackson’s
(1971). There is influence of 37 market centres in the study region. Jackson has
used this method to demarcate the service areas of South Ethiopian markets. His
formula is given below.
Trade Area =푇표푡푎푙 퐴푟푒푎
푁푢푚푏푒푟 표푓 푀푎푟푘푒푡 퐶푒푛푡푟푒푠
Here, the average area, average number of inhabited villages and average
population served by a market centre has been computed. By and large, it reflects a
generalized picture to give an idea of the proportions prevailing in each tahsil of
the study area.
i) Area Context:
As the area context is considered, the total area of each tahsil was divided by the total number of market centres in the same area, as follows:
Trade Area Km2 =
It is seen that theoretically every market centre supports an area of 130.46 km2 on an average provided in the study region and it is in the space point of view.

112
Theoretical Trade Area of Market Centres
Tahsil Number of
Market Centre
Area Per Market Centre in Km2
No. of Inhabited Villages per Market
Centre
Population per Market Centre
Sengaon 14 80.29 V 09.21 V 14626.28 V
Hingoli 04 242.35 I 34.50 I 67395.25 I
Aundha Nagnath 05 167.00 II 23.60 III 36277.00 IV
Kalamnuri 06 156.97 III 23.67 II 38654.50 II
Basmath 08 116.55 IV 18.13 IV 36414.00 III
Region 37 130.46 18.16 31864.14
Source:Compiled by Researcher.
The largest trade area market centre is in the Hingoli tahsil (242.35 km2). In
Sengaon tahsil, the trade area of each market is on the lowest average which is
80.29 km2. It is due to the fact that though the number of market centre in this
4 0 4 8 12 16 20 24
KILOMETRES
N
INDEX
HINGOLI DISTRICT
Theoretical Trade Area(Area Per Market Centre)
X + 3 S.D.
X + 1 S.D.
X

113
tahsil is high, the total area is also less as compared to other tahsils. Kalamnuri and
Sengaon tahsils have the value less than district value of area per market centre and
remaining tahsils have higher value of district level of this context. The rank orders
of tahsils in this context, run as i) Hingoli (242.35) ii) Aundha Nagnath (167.00)
iii) Kalamnuri (156.97) iv) Basmath (116.55) and Sengaon (80.29)
ii) Village Context:
There are 672 inhabited villages served by 37 market centres in the study
region. In this way, on an average 18.16 villages are taken care by each market
centres in the study region, when the values were calculated for the five tahsils. It
explains that theoretically the market centres of Hingoli tahsil provide 34.5 villages
each whereas Sengaon tahsil serves 09.21 villages each. The trade area in terms of
the number of inhabited villages per market centres of the various tahsils has been
calculated in the following formula:
Trade Area Considering Villages =푁푢푚푏푒푟 표푓 퐼푛ℎ푎푏푖푡푒푑 푉푖푙푙푎푔푒푠푁푢푚푏푒푟 표푓 푀푎푟푘푒푡 퐶푒푛푡푟푒푠
It is observed that as many as three tahsils have comparatively larger trade
areas of their respective market centres, whereas, the two tahsils have smaller trade
areas as their influencial area. The statistical classes of trade areas of market centre
of various tahsils of the study area have been shown in has also been illustrated
cartographically.

114
The rank orders of various tahsils of the study area in this context run as
follows: i) Hingoli (34.5), ii) Kalamnuri (23.67), iii) Aundha Nagnath (23.60), iv)
Basmath (18.13) and v) Sengaon (09.21)
iii) Population Context:
The trade area of market centres of various tahsils of the district have also
been calculated in view of population served by market centres in each tahsil
which have been calculated by following formula:
Trade area considering popualtion =푃표푝푢푙푎푡푖표푛
푁푢푚푏푒푟 표푓 푀푎푟푘푒푡 퐶푒푛푡푟푒푠
Most important indicator is population for the consideration of the extent of
trade areas of various market centres. The study region has population of about
1178973 which is served by 37 market centres. On an average, 31864.14 persons
4 0 4 8 12 16 20 24
KILOMETRES
N
INDEX
HINGOLI DISTRICT
Theoretical Trade Area(Inhabitted Villages Per Market Centre)
X + 1 S.D.
X - 1 S.D.
X - 2 S.D.

115
are served by each of the 37 market centres in the study region. The population of
the five tahsils varies from tahsil to tahsil.
Statistical Trade Area Classes of Market Centres Tahsil Number of Market
Centre
Area Inhabited
Villages
Population
Sengaon 14 푋 + 2 S.D. 푋 - 1 S.D. 푋 - 1 S.D.
Hingoli 04 푋 + 1 S.D. 푋 푋 + 1 S.D.
Aundha Nagnath 05 푋 - 2 S.D. 푋 - 2 S.D. 푋 - 2 S.D.
Kalamnuri 06 푋 푋 + 1 S.D. 푋
Basmath 08 푋 - 1 S.D. 푋 + 1 S.D. 푋 + 2 S.D.
Source: Compiled by Researcher.
The statistical classes are like these it has also been illustrated with the help
of the number of persons served by each market of different tahsils. The rank
orders of various tahsils in this context run as i) Hingoli (67395.25), ii) Kalamnuri
(38654.50), iii) Basmath (36414), iv) Aundha Nagnath (36277), v) Sengaon
(14626.28)

116
6.4 Saxena’s Modified Method:
So far as the demarcation of sphere of influence is considered to demarcate
the zone of influence of 37 market centres, the therotical method of Saxena has
been applied in the present study with the help of total area of the region, total
population of market centres, total area of the region and total population of area.
Redius =(푇표푡푎푙 퐴푟푒푎 표푓 푅푒푔푖표푛)(푇표푡푎푙 푃표푝푢푙푎푡푖표푛 표푓 푀푎푟푘푒푡 퐶푒푛푡푟푒푠)
푇표푡푎푙 푃표푝푢푙푎푡푖표푛 표푓 푡ℎ푒 퐴푟푒푎
It is modified as:
Redius =(푇표푡푎푙 퐴푟푒푎 표푓 푅푒푔푖표푛)(푇표푡푎푙 푃표푝푢푙푎푡푖표푛 표푓 푀푎푟푘푒푡 퐶푒푛푡푟푒푠)
푇표푡푎푙 푃표푝푢푙푎푡푖표푛 표푓 푡ℎ푒 퐴푟푒푎
i) Regional Analysis:
So far as the regional analysis is concerned, the result gained by the
modified formula of Saxena represents that Sengon highest range (5.88 km2) and it
4 0 4 8 12 16 20 24
KILOMETRES
N
INDEX
HINGOLI DISTRICT
Theoretical Trade Area(Population Per Market Centres)
Map No. 6.3
X + 2 S.D.
X + 1 S.D.
X
X - 1 S.D.
X - 2 S.D.

117
is the first order of services. The second order includes Kapadsing (3.08 km2) and
Pimpaldari (4.18 km2) is the last market centre in this order out of 22 market
centres in the second order market centres.
Third order comprises of six market centres which range from Kalam
(10.07) to Goul 2.23 kms. This order belongs to the market centres as Kalam
(10.07), Akhada Balapur (07.15), Dongarkada (5.33), Waranga (4.05), Bolda
(2.42) and Goul (2.23 km2).
This fourth order ranges from 16.80 km for Basmath to Aral 3.72 kms. This
is the last market centre in this order, total 08 market centres.
6.5 Summary: It has been observed that to demarcate trade area of a limited number of
market centers, empirical method can be used suitably but in the study of large
numbers of market centers, mathematical equal and theoretical models are used to
get best result. An attempt is made to use appropriate method in demarking trade
areas of the market centers in study region. The four methods applied to demarcate
the trade area and the result of empirical method and other methods are not similar.
4 0 4 8 12 16 20 24
KILOMETRES
N
INDEX
Sphere of Influence of Market Centres(By Saxena's Modified Method)
II Order
III Order
IV Order

118
Saxena’s modified method provides some quantitative results. The size and
length of service areas are basically dominated by the topography, transportation
network and density of population. It is seen that increasing areas and population
of service centre of any order increase with the range of market centres. It is also
seen that, with increasing order of market centres, the size of service areas of the
lowest level market centres have also increased. Broadly speaking about the
services, the central part of the region is fairly served. It is because, the area is
agriculturally, industrially prosperous, having a well transportation network
facilities, the moderately served area observed in Northern part of the study region,
it is due to the ranges of Ajantha brings abstracts in the way of service area. So far
as poorly served area is considered, it is southern part of the study region. The area
is poorly served due to lack of agricultural, industrial, economical transportation
network and communication facilities.
Furthermore, it is seen by the fieldwork observation that various
villages are captivated towards market centres to satisfy their needs. It is observed
by the empirical study that the market centres of higher order provide goods and
services in wholesale to the lower order market centres. Moreover the lower order
of market centres provides the goods and service in retail to the population of the
area concerned.
References: 1. Saxena, H.M., (1975): Geography of Transport and Market Centres- A Case
Study of Hadaoti Plateau, S. Chand and Company, New Delhi.
2. Patil, J.B., (1994): Spatial Organization and Linkage of Agricultural
Regulated Markets in Upper Krishna Basin, Unpublished Ph.D. Thesis,
Shivaji University, Kolhapur, Pp. 332-333.

119
3. Von Thunen, J.H., (1926): Von Thunen’s Isolated State; Edited by P. Hall,
Translated by C.M. Artenberg, Oxford Pergamon Press (Originally
Published as Der Isolierte Staat, 1926).
4. Ghosal, K., (1972): Market Places and Market Areas; National Geographer,
7, Pp. 85-94.
5. Jana, M.M., (1978): Hierarchy of Market Centres in Lower Silabati Basin,
Geographical Review of India, 40, II, Pp. 167-174.
6. Srivastava, R.C. and Gupta, J.P., (1977): Demarcation of Market Area
Regions of Periodic Markets of Kanpur Metropolis, Indian Science Congress
Proceedings.
7. Dixit, R.S., (1988): Spatial Organisation of Market Centres, Pointer
Publication, Jaipur, Pp. 189-209.
8. Jackson, R.T., (1971): Periodic Markets in Southern Ethiopia, Tans. Of the
Institute of British Geographer, 53, Pp. 31-42.
9. Hugar, S.I., (1992): Locational Character of Regulated Markets of Gulbarga
District, Karnataka State, Indian National Geographer, Vol. 7, Pp. 61-68.
10. Hugar, S.I., (1984): Spatial analysis of Market Systems in Dharwad District,
Unpublished Ph.D. Thesis, Karnataka University, Dharwad.
11. Hugar, S.I., (2000): Traditional and Non-Traditional Market Exchange, A
Study in Spatial Development Ganga Kaveri Publishing House, Varanasi,
Pp. 55-71, 144-155.
12. Hartshone, T.A., (1980): Interpreting the City, An Urban Geography.
13. Trivedi, V., (1994): Dimensions of Market Areas of Periodic Market
Centres, New Dimensions, an Geography and Allied Sciences, Pp. 75-81.

120
Chapter VII
Other Spatial Perspectives
7.1 Introduction
7.2 Development Planning Strategy
7.3 The Synchronization of Market Days
7.4 Planning for Proposed Market Centres
7.5 Other Strategies
7.6 Summary

121
Chapter VII
Other Spatial Perspectives 7.1 Introduction: There is specific place to marketing in Geography. It is well known that
marketing geography is an applied branch of geography. Marketing geography can
provide a base for development and the planning of the markets and the marketing.
Marketing is an important aspect of economy. So far as the development and
planning process is considered there are several ways to consider it. Every system
has its own merits and demerits. The strategic development of market centres is
one of the several ways to deal with rural development. Marketing is considered an
important aspect of the complete package of services and exchanges and so no
specific analysis is available except for the two studies made by Johnson. It is
related, largely, with market centers and their importance for rural development in
India.
In the previous chapter largely deals with the demarcation of trade areas
which have different hierarchical trade areas of market centers in the spatial and
population content in the study region. The methods as theoretical and empirical
are employed to the delimitation of trade areas of market centres and on that basis
the study also becomes important in their various relative aspects.
In this chapter an attempt is made to study the association of market centres
in rural development, as well as the study has been made to investigate, intra-
regional disparities and to suggest the development planning strategies for the
overall development of market system in the study area. here some suggestion are
given to add new market centres for the development and planning of the study by
taking in view each village as on areal unit. Broadly speaking the urban and rural
development or regional development are long term and integrated process and so,

122
there is urgent need of broad base of development planning in order to save time
and space.
Every study of the spatial organizational aspects of market centres must
include distribution, typology, hierarchy and trade area of various market centres
of the study area. Besides, there are some other significant spatial perspectives too,
without which any in-depth study would be rather incomplete. Mention must be
made of such perspectives; synchronization, market cycles/ circuits/ rings, traders’
movement / travel patterns, market designs and the last but not the least important
is that of development planning. All the above perspectives, when considered,
would certainly make a study on spatial organization- the wole, the total or the
complete one. It is indispensable, therefore, to analyze such perspectives of market
centres of the present case as well.
So far as the market centres are concerned they are centres of marketing
activity as well as they are nucleus of development. Market centres have a lot of
importance that may be culturally, socially and economically and they assist to
improve social contacts, and serve as centres of diffusion. They are the focal point
of political, social and other activities. These market centres also work as
controlling points of marketing system. They have a vital role in impulsing
production, consumption and also assist to accelerate the rate of economic
development. In this way, it is observed that the development of market centres
represent the economic development and their growth. It always follows the
development of agricultural, transportation network, and industries, which
consequently, lead to the overall regional development.
Moreover, to the regional development planning has to think the existing
distribution of market centres. Thus, the study of market centres in the study region
plays a vital role in providing services to villages. And these services are partly
moveable and partly fixed. Mobile traders, is a common and unique feature of

123
markets, who meet a particular market centres. In that place number of buyers and
sellers gather with certain hopes and intentions as well as where the price offered
and paid by each is affected by the decisions of others (Belshaw, 1965).
7.2 Development Planning Strategy: The primary purpose is to suggest the planning strategy for the development
of network of market centres in the study area. And it can be particularly, helpful
for the various agencies and the authorities related.
It is the need of time to make development of market centres and marketing
system. It would assist to increase the standard of living of the folks. The
development of market centres can’t be promoted exclusively by agricultural
development. Therefore, the spatial importance to be given to market centres
development. For making integrated rural development, the allocation of separate
plants for the development of market centres is very essential.
Following planning strategies are suggested for the integrated development
of the rural economy.
1) Improvement of information and transportation network
2) The synchronization of market days
3) Planning for proposed new market centres
4) Other strategies
7.3 The Synchronization of Market Days:
The present study shows that weekly market centres dominate the marketing
system of the region. it is noteworthy to see that the existing market day cycles are
not properly synchronized and as the specific day marketing meeting are being
held at many centres the market centres are very near to each other, consequently,
it creates many interruptions in the market cycles.

124
The present market cycles needs to be modifying to avoid the interruption
and competition among market centres, to increase the functional capacity of the
market centres as well as to make it convenient to the mobile traders. It should be
modified in the following ways.
1) Sengaontahsil has 14 market centres. In this tahsil there is no proposed
market centre, there is no need of any change.
2) In Higolitahsil 04 existing market centres are running on separate day and
there is one proposed market centre i.e. Bhandgaon.
3) In AundhaNagnathtahsil only five market centres exist. But one market
meetings are arranged on the same day. i.e. Monday (Gojegaon). The
changing market meetings of Gojegaon (Monday), AkhadaBalapur
(Tusday), Pinpaldari and Goulbajar (Wendsaday), Waranga (Thursday),
Bolda (Fryday) and ShiradShahpur (Saturday).
4) In Kalamnuritahsil there is six market centres exist and it need not any
change.
4 0 4 8 12 16 20 24
KILOMETRES
N
INDEX
Restructuring of Market Cycles
Daily
Sunday
MondayTuesday
W
F
F
F
F
F
F
S
SSa
S
Th & S
S Sa
Sa
T
Th
T
T
ThT
Th
T
Th
Th
M
M
M
M
M
M
M
M
M
W
W
W
D
D
D
S
M
T
W
Th
F
Sa
Wednesday
Thursday
Friday
Saturday
W
M
S

125
5) In Basmathtahsil there are eight market centres for the convenience of
mobile traders for the increase of the functional capacity of market centre.
There is only one proposed market centre i.e. Nahad
7.4 Planning for Proposed New Market Centres:
The study of spatial distributional pattern of market centres, their proportion
to the dependent villages, their market areas, and the population served is useful in
planning for proposed new market centres.
It is observed that the potentiality of certain villages may be upgraded as
market centres. From the overall development and planning it is important to
upgrad villages as market centres in the study area. in consideration of all these
things and with the notice to improve the market and dependent village ratio and to
fill the market settlement gaps the new proposing market centres on favorable sites
are tried to present here
Existing and Proposed Market Centres
Tahsils Existing Market
Centre Proposed Market
Centre Total Number of Market Centre
Sengaon 14 Nil 14
Hingoli 04 01 05
AundhaNagnath 05 01 06
Kalamnuri 06 Nil 06
Basmath 08 01 09
District Total 37 03 40
Source: Compiled by Researcher.

126
So far as the proposed market centres are concerned, 03 villages are
proposed as sites for new market centres. these sites of proposed market centres
have been decided in terms of following important components i) Size of the
population ii) Centrality iii) Easy accessibility iv) Transport Facilities and distance
from the existing market centres and the urban centres v) Hinterland and vi) Site
suitability etc. In spite of all these factors, empirical evidences of the consumer’s,
preference of the market centres are also taken into consideration and in the
identification of the sites of new market centres. By taking in consideration all
these things the spatial reorganization of market centres would definitely improve
efficiency of marketing system by decreasing the market village ratio as well as by
filling up the market settlement gaps. The present centre and proposed market
centres are shown in this way it will certainly increase the efficiency and reduce
some unemployment it will save the time and money of the population. The
increase in trade and exchange of goods, the farmer’s commodity will get
reasonable rates and will help in agricultural development, consequently all these
factors combinly and positively enhance the rural development. The increase in
market centres will also change the service scenario.
Proposed Market Centres
Tahsils Number of Proposed
Market Centres Name of the Proposed
Market Centres
Sengaon Nil ---
Hingoli 01 Bhandegaon
AundhaNagnath 01 Gojegaon
Kalamnuri Nil ---
Basmath 01 Nahad

127
District Total 03 ---
Source: Compiled by Researcher.
Because of the proposed market centres there would be rational proportion
of market and dpendent village ratio, market and population ratio and area
proportion. In consequence of all these factors, it would certainly increase the
efficient functioning of marketing systems and ultimately lead to spatial economic
and rural development. The tahsils as Sengaon (14) and Kalamnuri (06) have no
proposal for new market centres and present markets to the related villages. All
these tahsils have more market centres, urban market centres and total dependent
number of villages is less. For the tahsils viz. Hingoli, AundhaNagnath and
Basmath have a proposal of only one new market centres for each tahsils. It is also
seen that, to avoid the wastage of time and money, most of the villages go for the
4 0 4 8 12 16 20 24
KILOMETRES
NINDEX
Existing and Proposed Market Centres
Proposed MarketCentresExisting MarketCentresRural MarketCentres

128
nearest market sites and generally, do not visit frequently to the market plaes of
longer distance.
It is observed that, during the field work, the various department stores are
well developed and they cater all the needs of the people. These stores provides in
spite of daily required goods and items, the specific facilities to the peasant society
such as quality seeds, fertilizers, pesticides, agricultural implements, utensils,
clothes etc. on affordable price. Despite of all these, some co-operative
departmental stores spread the free consultancy in terms of agricultural inputs and
practices etc. Therefore, it is strongly recommended that the departmental stores as
above said should be started/ initiated at least at each tahsil head quarter and at big
daily market centres.
7.5 Other Strategies:
To captivate the large portion of population there is a need for the
development of efficient market centres and it requires large number of facilities
and concerning institutions. The complementary institutions contains well
developed educational system as schools, colleges, training centres, hospitals,
cinema halls and other entertainment places, different factories etc. it is noteworthy
that most successful and effective markets must be provided by the wide range of
goods and services and it will be easily available to customers. If the market
centres is developed once it also creates positive atmosphere for many
governmental agencies for introducing their products, innovations and to contact
with the large portion of population for the implementation of different schemes
and policies.
The following suggestions would be helpful to the overall development of
market centres.
1) In All market centres i.e. Hingoli, Kalamnuri, Sengaon, AundhaNagnath and
Basmath the space provided for market gathering seems to be inadequate

129
and insufficient to accommodate large proportion of the population and
marketing commodities. This may be also resulted in wastage of goods and
becomes troublesome to the people. Therefore, sites and the locations of
market centres should be extended or shifted in any other open space nearby
and cordoned off from cattle’s market.
2) Adopting the following precautionary measures it is possible to avoid the
malpractices.
i. A general supervision under the control of a shop/ market inspector.
ii. The notification of current price structure on general notice board.
iii. The frequent checking of rates and measurement effectively.
iv. Adequate fresh drinking water and a large space for parking.
3) For the diffusion of innovations in agricultural and irrigation, the use of
market centres by private and governmental agencies.
4) Social awareness about medical, healthcare, natural hazards, total diseases
and family welfare programme through such market centres.
7.6 Summary: The overall analysis, clearly, shows that there is unevenness in the
distribution of market centres and their trade areas. It is seen that the central and
western parts of study region is endowed with well facilities by market centres. In
contrast to it, the northern and southern parts are less facilitated by market centres.
Bearing this scenario in mind three new market centres are proposed in the study
region. This re-organization, spatially, of market centres might obviously improve
the present system as well as increase the pace of the efficient functioning of
market system, the present market centres and proposed market centres,
transportation facilities and communication facilities, and their increase and other
locational strategies might be implemented in the study region. It is obviously to

130
provide the services to the whole study region remarkably to gain recognizable
result in increasing the per capita income, standard of living, agricultural,
industrial, economical development and overall development of the entire study
region.
References: 1. Johnson, E.A.J., (1965): Market Towns and Spatial Development in India,
New Delhi, NCAER.
2. Johnson, E.A.J., (1970): The Organisation of Space in Developing
Countries, Cambridge, Mass Harvard University Press, Pp. 83-114.
3. Saxena, H.M., (1990): Marketing Geography, Rawat Publications, Jaipur, P.
179.
4. Shinde, S.D., (1980): Agriculture in an under Developed Region: A
Geographical Survey, Himalaya Publishing House, Bombay, P. 115.
5. Singh, K.N., (1962): Rural Markets and Urban Centres in Eastern Uttar
Pradesh - A Geographical Anaysis, Unpublished Ph.D. Thesis, Banaras
Hindu University, Varanasi, P. 273.
6. Singh, O. P., (1973): Unnao – A Study in Town Evaluation and Functional
Morphology, National Geographical Journal of India, Vol. XIX, I, P. 34.
7. Singh, S.B., (1982): Periodic Market and Rural Development: A Case Study,
the National Geographical Journal of India, Vol. 28, Pp. 89-90.

131
Chapter VIII
Conclusions and Suggestions
8.1 Introduction
8.2 Conclusion
8.3 Suggestions

132
Chapter VIII
Conclusions and Suggestions
8.1 Introduction:
The present chapter entitled Conclusion and Suggestions deals with the
present situation and expected future prospects of market centers in Hingoli
district. For the success of proposed results of the present investigation, it is the
time and desire to represent all the related matters and concerns in a microcosm in
the study of market centres and marketing system as well. The consequent result
and analysis in the preceding chapters presents the following conclusions and
suggestions.
8.2 Conclusions: Some of the conclusions drawn from the present research work. Major
conclusions related with distribution and growth of market centers and largely
based upon physical, social and economic factors because these factors play a vital
role in the growth of market centers.
The climate is important factor in physical setting of the study region. The
climate of Hingoli district can be included in the sub-tropical temperate category,
characterized by medium rainfall and moderate temperatures. Comparatively, this
climate is hot and dry. The mean daily maximum temperature is observed 41.90c in
summer and the mean daily minimum temperature is found 12.60c in winter
(December) sometimes due to cold waves over northern India; temperatures may
drop to about 60c. May and December are the hottest and coldest months of the
year respectively. On the basis of climatic conditions, the year can be divided into
four seasons:
i) Summer season from March to May with maximum temperature

133
ii) The rainy season from June to October
iii) North eastern monsoon from October to November
iv) Winter season from December to February with minimum temperature.
The northern upland area of the district consisting of Sengoan, Hingoli,
Northern Kalamnuri and AundhaNagnathtahsils have light soils (shallow black
soil) which are sandy loam in texture, brownish black in colour and underlaid with
murum derived from the basaltic rocks. These soils are most suitable for Kharif
crops like Jowar, Bajri and Groundnuts etc.
The southern portion of the district occupying Basmath, southern part of
AundhaNagnath and Kalamnuritahsils have medium to deep black soils, which
vary in texture from clay to clay loams. These soils are retentive in moisture and
rich in plant materials such as lime, magnese, iron and alkalies. These soils suit
both Kharif and Rabi crops.
The trees like Teak, Tirmar, Salani, Palas, Dhawada, Sagwan, Ain, Khair,
Mahua, Tembhurni, Babhul, Bor, Ayoni, Kona and Orange, Mango, Custard apple
such fruits etc. are found in the study region. In grass area, Pawanya, Kusal, Raj
and Rosha grass are seen in the region. The forests also have medicinal plants and
large grassy area. Tembhurni leaves, gum, mahua flowers, fruits and charoli seeds
collection is the major occupation in forest area.
The main cause of rapid growth of population is the decline in the death rate
and increase in the birth rate. It is thus, clear that the regional population is
growing at a rapid rate since 1961, but there was decrease in growth rate of
population in 2001 and 2011.
Accordingly about 77 percent population of the district was literate in 2011.
When the literacy rate of the states as a whole was 82.91 percent, Hingolitahsil has
the highest percentage of literate population i.e. 80.42 percent.

134
Urban population comprises 15.17 percent of the total population in Hingoli
district, which is far less than state average (45.23%). It is observed that Hingoli
has high urban-rural population than district level and also national level.
As per the 2011 census, there were 669 inhabited villages in Hingoli district.
These villages vary in their population size. The number of villages at tahsil level
reveals that Basmathtahsil has the highest number (149), while the lowest numbers
of villages are in AundhaNagnathtahsil (117). There were 13 percent villages
with a population of less than 500. The medium size villages with a population size
of 500-2000 were 66.80 percent, which form a major population size. Further there
were 17.80 percent villages with a population size of 2000 to 4999. However, the
large sized villages with more than 5000 population were only 2.40 percent.
There are three towns in Hingoli district ranging from class II and III with
total area about 39.1 sq.km. The two towns (Hingoli and Basmath) are class II
towns and Kalamnuri town is class III. The total area of urban centre is about 39.1
sq.km. The largest area is 16.4 sq.km. ofHingoli urban centres. The lowest area is
of Kalamnuri urban centre which is 10.8 sq.km.
It has observed that generally large number of weekly market centres is
concentrated in an area, where primary activities are dominant.
Major market centres i.e. 14 centres found in Sengaontahsil. This tahsil has
hilly region and transportation network is not adequate. Due to this, people could
not visit to the surrounding urban centres for their daily needs. Therefore, five
market centres are newly created except old market centres in this tahsil.
Lowest i.e. four market centres found in Hingolitahsil, because of the good
transportation network, people visit Hingoli city frequently.
High centrality market centres are found in south and east part of the district.
High development areas are found in Vasmattahsil and after that Hingolitahsil,
whereas low development area is observed in AundhaNagnath and Sengaontahsils.

135
The foregoing analysis clearly shows that the spatial distribution of market
centres is characterized by their uneven distribution throughout the region. There
are 05 daily, 1 bi-weekly and 31 weekly market centres. Market meetings are held
in a week in this region as a whole. The lowest market meetings are held in Hingoli
and AundhaNangnathtahsil and highest number of market meetings is 18 in
Sengaontahsil. Spatial distribution of market centers are affected by physiography,
development of transportation network, development of economic activities and
population. The daily markets are concentrated in south and east part of the study
region, which is relatively plain, fertile and well developed part of the region.
Whereas weekly market centres are dominant in the north and north-west part of
the region which is hilly and economically backward part of the study region.
It is also observed that the region has random, regular to regular, uniform
distributional pattern of market centers. Near about 22 percents of rural market
centers are located below 20 km distance, 43 percent of rural market centers are
situated between 20 to 40 km. distances from the nearest town. The analysis of the
market cycles reveals that the complete cycle is observed in Sengaon and
Basmattahsil.
Further it is noted that the present market day cycle is not properly
synchronized. On a specific day, marketing meeting being held at many centers
which are very near to each other and it creates many interruptions in the market
cycle. To avoid the interruption and competition among the market centers, to
increase the functional capacity of the market centers and to make it convenient to
the mobile traders, there is need of restructuring the existing market cycles.
However, to realize the relative importance of market centers in the region,
investigations concerning of centrality, hierarchy and sphere of influence of
individual market centers need to be undertaken.

136
Thus, the overall study of the collected data clearly shows that there is
constant increase in the population of Hingolidistrict. Hingoli (27.6) and Sengaon
(21.0) tahsils have the highest percentage of population growth rate
whereasKalamnuri (17.5) and Basmath (13.3) have lowest percentage of
population growth rate in district in the last decade. In the study region, there is
gradual growth of market centers during the last decades. However, it is
noteworthy that the growth of market centers in last two decades has fluctuated
from decade to decade. Multiple factors are responsible for this situation. The
changing socio-economic, political factors and increase in population are the some
of the encouraging factors for this situation. Other factors include increasing
density of communication network, commercialization, development of irrigation,
development of agricultural etc. Besides this better medical facility, telephone
facilities, electricity is also contributing factors.
In the last decade, study region has experienced the increase in the number
of market centers. Growth of population is a cause of the increase in a number of
market centers, thereafter increased transportation facilities are reasons of
increasing the number of market centers. Limited source of earning is a main
reason of increase in market centers in Sengaontahsil.
The typological analysis of market centers is based on as many factors.
When the development of several topologies is considered, it shows many
important factors to come out.
The examination of the typology indicates that the types of market centers
are dissimilar. It is the result of undulating physiography and other physical
factors, problems of transportation facilities the problems in supplying of goods
and services, uneven distribution of population density, lack of communication
facilities etc.

137
To decide the importance of a place in relation to its functional capacity to
serve the needs of the people in concerning area, centrality as a measure, plays an
essential role. So far as the study of the importance of the market centers in
Hingoli district is considered, the centrality score is taken into consideration. The
method of Davies clearly indicates high difference between the lower and higher
values of the score of centrality. It has been clearly seen that the urban places are
with high centrality whereas the low centrality is observed in the rural parts of the
study region. It is remarkable that the urban part is highly developed, prosperous,
agriculturally developed and infrastructural well-bestowed. Therefore urban
market centers belong to high order of centrality, while rural market centers belong
to low order of centrality. It is due to the inadequate agricultural, transportation
facilities. Therefore these market centers are economically backward.
It has been observed that to demarcate trade area of a limited number of
market centers, empirical method can be used suitably but in the study of large
numbers of market centers, mathematical equal and theoretical models are used to
get best result. An attempt is made to use appropriate method in demarking trade
areas of the market centers in study region. The four methods applied to demarcate
the trade area and the result of empirical method and other methods are not similar.
Saxena’s modified method provides some quantitative results. It is also seen
that, with increasing order of market centers, the size of service areas of the lowest
level market centers also increase. Broadly speaking about the services the
Southern part of the region is fairly served. It is because, the area is agriculturally,
prosperous, having well transportation network facilities, the moderately served
area observed in central part of the study region. So far as poorly served area is
considered it is Northern part of the study region. The area is poorly served due to
lack of agricultural, industrial, economical transportation network and
communication facilities.

138
The second order of market centers varies in distribution in the study region.
These market centres are located in agriculturally industrially developed and
transportation network facilitated area of the study region. The third order market
centers are situated in southern part of the study region, which is plain and fertile
area and moderate density of population is observed. This area is agriculturally
prosperous. The fourth order of market centres has no regularity in their shape, and
this is undulating parts with low density of population and also lack of
transportation and communication facilities. It is also seen that the range of goods
and services furnished by this order (IVth) varies from area to area. The service
areas of lower order market centre’s in the vicinity of large cities are small in size
and small in range of goods, it is due to the large market centers overshadow these
small market centers.
The overall analysis for the chapter seven, clearly, shows that there is
unevenness in the distribution of market centre’s and their trade areas. It is seen
that the central and western parts of study region is endowed with well facilities by
market centers. In contrast to it, the northern and southern parts are less facilitated
by market centers. Bearing this scenario in mind three new market centers are
proposed in the study region. This re-organization, spatially, of market centers
might obviously improve the present system as well as increase the pace of the
efficient functioning of market system, the present market centers and proposed
market centers, transportation facilities and communication facilities, and their
increase and other locational strategies might be implemented in the study region.
It is obviously to provide the services to the whole study region remarkably to gain
recognizable result in increasing the per capita income, standard of living,
agricultural, industrial, economical development and overall development of the
entire study region.

139
8.3 Suggestions: So far as the findings stated above is considered, there are some viable
suggestions for the improvement of the market centers and marketing system in the
study region which have been mentioned in the last chapter.
The synchronization of market days is concerned; there is a market week of
seven days. All market cycles have sequential meetings on various days of the
week and having one ‘break’ as a rest day in a week. But the existing market day
schedules are not appropriately synchronized in the study region. It is seen that a
particular day market meets at many centers which are very near to each other, so
much so that, it creates many disturbances in the market cycles.
It is also needed to reconstructing of existing market cycles. The present
existing market cycles are not properly synchronized in the study region. Because
of it there raised various problems particularly for the mobile trades and consumers
and interruptions in the market cycles. It adversely affects the functioning and
growth of market centre.
There should be the market regulation and other strategies so far as the
inadequacies speeded over the study region for the development of market centre
and marketing system is concerned. There are following facilities to be improved.
1. There is a need to control the existing malpractices by general supervision of
shop by market inspector, the notification of current price structure and stock on
general notice board and by the regular checking of weights and measurement
effectively.
2. There is lot of disturbance of the strayed cattle like donkey, pigs, cows etc. and
to avoid this, market centers should be cordoned off and the compound walls
should be built around the market centers. So sites and location of market centre
should be either extended or shifted in nearby open space.

140
3. To avoid the problem of traffic, there should be large space in parking the
vehicles especially for the big market centers.
4. Basic facilities like drinking water, toilets, parking etc. will be provided at the
market meeting places.
5. Inspection of weights and measures is necessary for the consumer’s interest.
6. Implementation of prohibition of adulteration law is necessary.
7. Financial support will be provided for mobile traders.
8. Transport network especially roads will be developed.
There is a need of the development of the transportation network. By the
detailed survey, the transportation network facility in the region helps to prepare on
improved transportation network facilities. On the other hand to develop the road
accessibility, the link road should be constructed between market centers and
villages. There should be an extension of southern central railway line from
Hingoli to other regional market centers.
There is necessity to plan for proposed market centers. The potentiality of
certain villages needs to be upgraded or improved market centers to remove the
market centre gap areas in the study region.
Addition of market centers, the structure of regional marketing and its
pattern would be changed and there would be national proportion of market
village’s ratio (1:9), market population ratio (1:15532) and market area ratio
(1:68). So far the success of co-operative departmental stores should be started at
least at each tahsil headquarter and big market centers. And this additional market
centre and departmental stores would certainly accelerate the efficient functioning
of marketing system.
The above said suggestions and restructured market cycles, locational
strategies, efficient departmental stores and market regulations, measures would

141
combine to affect the existing marketing system and would accelerate the overall
development in the study region.