Regional Review Workshop on Completed Research Activities
301
Regional Review Workshop on Completed Research Activities Proceedings of Review Workshop on Completed Research Activities of Crop Research Directorate held at Batu Fish and Aquatic Life Research Center, Batu, Ethiopia 4-8 Sept. 2017 ■ ■ - ■ ■ Oromia Agricultural Research Institute Oromia Agricultural Research Institute P.O.Box 81265, Finfinne, Ethiopia
-
Upload
khangminh22 -
Category
Documents
-
view
2 -
download
0
Transcript of Regional Review Workshop on Completed Research Activities

Regional Review Workshop on Completed Research Activities
Proceedings of Review Workshop on Completed Research Activities of Crop Research
Directorate held at Batu Fish and Aquatic Life Research Center, Batu, Ethiopia
4-8 Sept. 2017
■ ■ -
■ ■
Oromia Agricultural Research Institute
Oromia Agricultural Research Institute P.O.Box 81265, Finfinne, Ethiopia

Proceedings of Review Workshop on Completed Research Activities of Crop Research
Directorate held at Batu Fish and Aquatic Life Research Center, Batu, Ethiopia 4-8
September, 2017
E d ito rs : Tesfaye Letta, Teshome Bogale, Kedir Wako, Dagnachew Lule, Chemeda Daba,
Zerihun Abebe and Tadesse Birhanu
Designer: Natnael Yisak
4 & m a oO rom la Agricultural R esearch Institute
Oromia Agricultural Research InstituteP.O. Box 81265. Addis Ababa, Ethiopia FAX 0114. 70, 71, 29 tel. 0114707021 E mail oari.infofggmail.com Website: http:Avww.iqqo.org,

Oromia Agricultural Research Institute (IQQO). Crop research Proceeding 2017
© 2017 Oromia Agricultural Research Institute (IQQO)
ISBN 978 99944 72 03 1
789994 472031
Cored Citation: Tesfaye Letta, Teshome Bogale, Kedir Wako. Dagnachew Lule, Chemeda Doha,
Zerihun Abebe and Tadesse Birhanu (eds) 2017. Proceedings o f Review Workshop on Completed
Research Activities o f Crop Research Directorate held at Batu Fish and Aquatic Life Research
Center. Batu. Ethiopia. 2018
Organized by: Communication & Partnership Process o f IQQO
2

Oromiu Agricultural Research Institute (1000), Crop research Proceeding 2017
I. BREED IN G AND GENETICS...................................................................................................... 51. AM M i Mo del for Y ield St a b il it y a n a lysis of l in seed Geno types for th e H ighlands of
B a le , Et h io p ia .............................................................................................................................. 52. Adaptation Study of improved Food B a rle y [H o r d eu m v u lg a r e L.) Varieties a t Kelem
and W est W ollega Zones of W estern Oro m ia ....................................................................... 123. Pa rtic ip a to ry Selection of L en til [L e n s c u lin a r is Medik) Varieties fo r High lands of
Gu ji, South ern E t h io p ia ............................................................................................................174. Adaptation Study of improved Chickpea [C ic e r a r ie t in u m L.) Varieties in Guji zone of
So uthern Et h io p ia ....................................................................................................................215. Adaptation o f Fenugreek [ T r ig o n ella f o e n u m -graecum L.) Varieties a t Midlands o f Guji
Zone, So uthern Or o m ia ........................................................................................................... 256. A dvanced Screen ing of B read W heat Geno types against Majo r W heat D iseases in B ale
287. Geno type x E nviro nm ent Interaction and Y ield St a b il it y of I m pro ved R ice
Varieties(Oryz4 s a tiv a L .) Tested Over Locations a t W estern O rom ia............................308. Y ield St a b il it y and Geno type x en v iro n m en t Interaction of Large S eed Speckled
Common Bean (P h aseolu s vu lgar isL.) Genotypes a t W estern Low lands of O rom ia...... 369. Geno types by Enviro nm ent I nteraction and Grain Y ield St a b il it y of Common B ean
[P h aseo lu s v u l g a r is L .) Genotypes in the W estern Oromia, E th io p ia ................................ 4410. Reg istration o f Lammiif and Jiidhaa Field pea [P is u m s a t iv u m . L) Varieties a t Bako..... 5111. Reg istration of "Haydaroo" New ly Released Emmer W heat ( T r it ic u m dicoccum L.)
Va r iet y for B ale H ig h land s.................................................................................................... 5412. R eg istratio n of "H ortu and W e y ib ” f ield pea v a r iet ie s released for t h e highlands of
B ale and s im ila r agro-ec o lo g ies ............................................................................................ 5913. Geno type by En viro nm ent Interaction (G E I) and St a b il it y an alysis of W h ite bean
g eno types in th e mid a lt it u d e of B ale zone, So utheastern Et h io p ia ................................ 6114. A d a pt a b il it y and St a b il it y A nalysis of Sm all red bean Gen o types using Ad d it ive M ain
effects and M u lt ipl ic a t iv e Interaction (AM M I) M o d e l .....................................................6915. Geno types by E n viro nm ent interaction and st a b il it y an alysis for Eth io pian m u stard
[B rassica c a r in a ta L.) genotypes............................................................................................. 7616. Grain Y ield St a b il it y and Gx E Interaction stu d y in B lack Seed ed F inger M il let
[E le u s in e Coracan a Sub Sp p . co racana ) Genotypes................................................................ 8417. Combining A b ility and H etero tic Grouping of Maize [Z ea ma ys L.) Inbred Lines fo r Yield
and Y ield R elated T r a it s .........................................................................................................9118. Standard Heterosis of Maize [Z ea m ays L.) inbred Lines fo r Grain Yield and Yield
R elated T ra its at Southern Et h io p ia ................................................................................. 10219. Genetic A nalysis of Inbred L ines in L ine x t e st er Mating Design for Grain Y ield and
T ra its R ela ted Y ield in Maize (Z ea Mays L . ) ...................................................................... 11320. Character A ssociation and Path Analysis for Y ield and Y ield R elated T raits in Sesam e
[Sesam um In d ic u m L.) genotypes............................................................................................12321. Grain Y ield S tab ility Analysis fo r Advanced Emmer W heat [ T r itic u m dicoccum )
Geno types in B ale H ighland ..................................................................................................13122. Eva luation of Open Po llin a ted Maize [Z ea amksL.) Varieties fo r mid a ltitu d e v sot
W estern Guzi Zone,Southern orom ia................................................................................ . V i!23. R eg istratio n and relea se of San ete and Mandoyu bread w h ea t v a r iet ies for B ig 'i lands
of B a l e .....................................................................................................................................149

Oromia Agricultural Research Institute (IQQO). Crop research Proceeding 2017
CROP M AN AGEM ENT............................................................................................................. 15324. E f f e c t o f F e r t il iz e r R ate on the Yield and Yield Component o f Ses a m e (Sesam um
in d ic u m I . ) w M oisture Stress environments o f east Harerghe Zone................................15325. R espo n se of sesa m e seed y ield and its components to th e co mbination of d iffer en t NP
f e r t il iz e r s r a t es ..................................................................................................................... 15526. E f fe c t o f N itrogen Fe rt iliz e r Rates on G row th , Y ield and Shelf-Life of Onion [A l l iu m
cepa L .)Varieties in east Hararghe, E th io p ia ...................................................................... 16127. d eter m in a t io n of In tercro ppin g P roportion in Ma iz e for Mo istu re Stress
E nviro n m en ts of B orana , southern Et h io p ia ......................................................................16928. Y ie ld Im pr o vem en t of F inger M il l et due to B len d ed F e r t il iz er s at B ako and Gu t e ....17629. Exper ien c es and th e Challenges in Soybean P roduction Managem ent and P romotions
Su ppo r t ed by NzA frica P roject in S ix Selected D istr ic ts of W estern Or o m ia ............... 18130. E ffect of F e r t il iz e r Ra t e on th e Y ield and Y ield Co m po n en t of Sesam e
(S esa m um in d icu m L.) in Mo istu re St r ess env iro n m ents of east Har er g h e Zo n e ............. 19431. System P ro d uctiv ity as I nfluenced by Do u ble Cro pp in g of M a ize as Green Cob
I n terc ro pped w it h Haricot B ean fo llo w ed by So rghum In terc ro pped w it h Groundnutin F ed is D is t r ic t ......................................................................................................................201PEST M ANAGEM ENT (PATHOLOGY, ENTOMOLOGY AND W E E D )....................................209
32. T h e Impact of P lanting T im e on Sorghum St a lk Bo r er In festation and Dam age In W estHa r a r g h e , Or o m ia ...........................................-....................................................................209
33. Pow dery mildew (Od iu m l in i) and Pasmo [Se p to r ia l in c o la ) combined effect on yield,YIELD COMPONENTS AND OIL CONTENT OF LINSEED ( itNUM USITATISSIMUM L .)...........................216
34. Chocolate spot [B o t r y t is fa b a e Sard.) management on Faba bean [V icia faba L.) throughAPPLICATION OF FUNGICIDE AT CRITICAL SUSCEPTIBLE STAGE OF THE CROP IN BALE HIGHLANDS,So uth eastern Or o m ia ...........................................................................................................224
35. Weed Management Practices and th e ir e ffect on Weeds and Yield o f B a r le y (H o r d eu m
vu lg ar e L.) a t Shambo and Gedo, W estern O rom ia........................................................... 23736. Su rv ey and Identification of Major H ighland and L ow land Pulse Crops D iseases in B a le ,
Et h io p ia ..................................................................................................................................25137. Evaluation and Demonstration of D iffer en t Post-em ergen ce H erb ic id es for
C ontro lling W ild o a t [A vena f a t u a L.) and O ther Grass Weeds in W h eat ( T r it ic u m s p p ) a t Bore, Eth iop ia...................................................................................................................258
38. Evaluatio n of Fungicides against B read W heat Rusts at Gu ji Zone, Southern Oro m ia26439. Su rv ey on D istr ibu t io n and Economic Im portance of W eeds in Cerea l Crops at Gu ji Zone,
Southern Oro m ia ...................................................................................................................270C O FFEE ...................................................................................................................................276
40. S ta tu s o f Coffee Insect Pests in major Coffee (C o ffea arabica L .) growing areas ofEa stern Oro m ia ..................................................................................................................... 276
41. S ta tu s o f Coffee Diseases in major Coffee (C offea a rab ica L .) growing areas o f EasternOr o m ia ................................................................................................................................... 284
42. Determ in in g t h e im pact of mulching practices on t h e early surv ival and subseq uentgro w th perfo rm ances of n ew ly tran splan ted co ffee seed lin g s ....................................291
4
Oromia Agricultural Research Institute (IQQO), Crop research Proceeding 2017
BREED ING AND GENETICSAM M I Model for Yield Stability Analysis of Linseed Genoty pes for the Highlands of Bale. Ethiopia
Tadele Tadesse'*, Amanuel Tekalign1, Gashaw Sefera1 and Behailu Muligeta1 Oromia Agriculture Research Institute, Sinana Agriculture Research Center, Bale-Robe, Ethiopia* Corresponding author: [email protected] / [email protected] AbstractField experiment was conducted at on station of Sinana Agricultural Research Center, Agrfa and Adeba on- farms in the high lands of Bale zone during the year 2014 and 2015.Eleven linseed genotypes were evaluated against two standard checks and a local check. The objective of this study was to identify high yielding and stable linseed variety for the study area. The field experiment was laid out in randomized complete design with four replications. The combined analysis of variance showed highly significant effects of genotypes, environment, and genotype by environment interaction. The partitioning of the total sum of square exhibited that the effect of environment was a predominant source of variation followed by genotypes and GE interaction effect. Genotype G6 and G9 were identified as the best high yielding and stable varieties by all stability parameters used in this study. Hence, these two genotypes are recommended for product in the study area and similar agroecologies.Key Words: AMMI, ASV, GSI, Linseed, Stability Parameter
IntroductionEthiopia is considered to be the center of diversity for linseed (Vavilov, 1926). Linseed is a major oilseed and rotation crop for barley in higher elevations of Arsi, Bale, Gojam, Gonder, Wello, Shewa and Welega parts of Ethiopia. High yields of wheat, barley and tef can be obtained following linseed (Getinet and Negusei 1997). Though the crop has so many important merits, its production per unit areas is very low due to the lack of stable and high yielding cultivars. Therefore, improving yield and yield stability is the main objectives of linseed breeding program in the country. Yield is a complex character where it is highly influenced by both genes as well as environment.
Adaptation is the result of genotypes x environment interaction and generally falls in to two classes: 1) the ability to perform at an acceptable level in a range of environment, general adaptability 2) the ability to perform well in desirable environments, specific adaptability (Farshadfar and Sutka, 2006; Solomon et al., 2008). The genotype-environment interaction reduces association between phenotypic and genotypic values leads to bias in the estimates of gene effect combining ability for various characters sensitive to environmental fluctuations. Such traits are less preferable to selection (Farshadfar and Sutka, 2000). The existence of genotype-environment interaction (GEI) complicates the identification of superior genotypes for a range of environments and calls for the evaluation genotypes in many environments to determine their true genetic potential (Yaghotipoor and Farshadfar, 2007).The importance of G x E interactions in cultivar evaluation and breeding programs has been demonstrated almost in all crops. Various statistical methods (parametric and non-parametric) have been proposed to study genotype -environment interaction (Hussein et al.. 2000; Lin and Binns , 1994; Hussein et a/.,2000; Mohammad et al., 2010). To identify linseed genotypes with wider or specific adaptation to different environments, multi-location yield trial are grown each year. These have lead to empirical identification of superior cultivars, sum of which have been released in several countries. Multi-location yield trials facilitate quantification of the environment and the GEI effects. However, a fact not generally recognized is that, in addition, every yield trial by analyzing processes that determine yield can inexpensively quantify the genetic, physiological and
5

Oromia Agricultural Research Institute (IQQO), Crop research Proceeding 2017
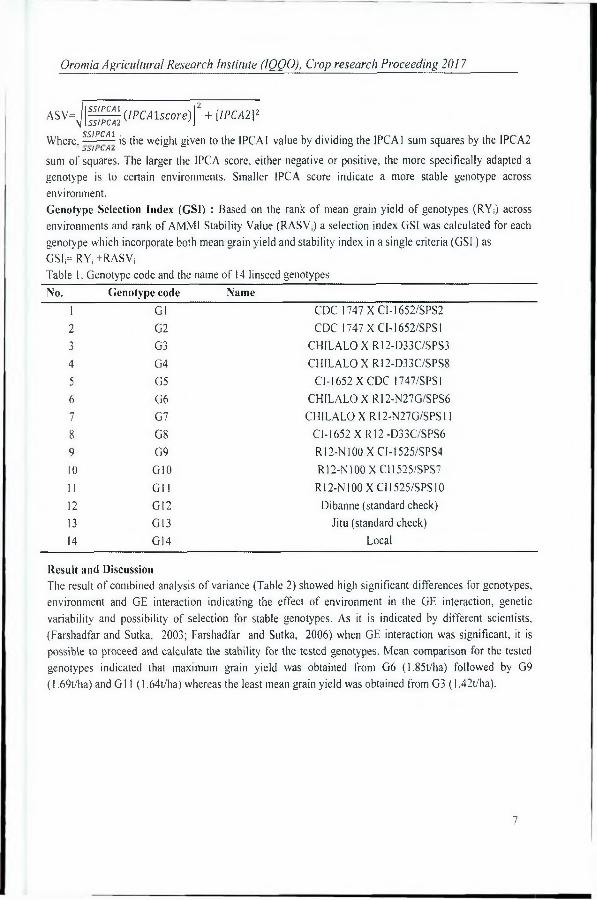
environmental controls that results in yield differences among cultivars. seasons and locations (Tarakanovas and Rusgas, 2006). Various methods of GE interaction analysis exist, including parametric and non-parametric approaches. The most widely used parametric methods is the joint regression including regression coefficient (bi) variance of deviation from regression (S:di) (Farshadfar and Sutka ,2006; Pourdad and Mohammadi, 2008).The ordinary form of ANOVA is an additive model and therefore describes only the main effect. Principal component analysis is a multiplicative model and has the opposite problem of not describing the additive main effects. Linear regression models combine the additive and multiplicative components and thus analyze both main effects and interaction, but in general they confound the interaction with the main effects reducing its power for general significance testing (Farshadfar and Sutka , 2006).The additive main effects and multiplicative interaction (AMMI) model is a powerful multivariate method to multi-environmental trial. This technique, incorporates both additive and multiplicative components into an integrated, powerful least square analysis (Farshadfar and Sutka , 2003; Mohamaddi and Haghparast, 2007; Pourdad and Mohammadi, 2008], Therefore, the objective of the present study was to identify stable and high yielding genotypes.Materials and MethodsThe experiment was carried out at on station of Sinana Agricultural Research Center and on fields of two farmers (Agarfa and Adaba). Sinana Research Center (7° N latitude and 40"E longitude; and 2400m a.s.I.) is located 463 km south east of Addis Ababa and East of Robe, the capital of Bale zone. The other two locations are located (Agarfa) 45-km and (Adaba) 70km from Sinana in the Southwest direction. This experiment was conducted on soil with vertisol clay loam texture during the main season of 2014/15 and 2015/16.Fourteen linseed genotypes were tested for two years across the three test locations. The experiment was laid out in complete randomized block design with four replications on a plot size of 4.8m: (six rows at 20cm apart and 4m long). Yield data was collected from the central four rows. Combined analysis of variance using balanced ANOVA was computed using CROPSTAT program.The additive main effect and multiplicative interaction (AM M I)AMMI analysis was performed using the model suggested by (Crossa et al,. 1991) as:Y n+gi+ej+Xn=ih hv-n,- Y nj+Rjj where.Yjj is the yieldof the i"' genotype in the j lh environment, p is the grand mean, gi is the mean of the i,h genotype minus the grand mean e, is the mean of j th environment minus the grand mean, k„ is the square root of the eigen value of the principal component. Analysis (PCA) axis, ani and Ynj are the principal are the principal component scores for the PCA axis n of the i'h genotype and jlh environment, respectively and R„ is the residual. The GE biplot was projected for the 14 genotypes tested at six environments. The regression of yield for each variety on yield means for each environment was computed and parameters MS-REG. the contribution of each variety to the regression component of the treatment x location interaction and MS-TL the contribution of each variety to interaction MS, were estimated with the CropStat program.AMMI Stability Value (ASV) ; ASV is the distance from the coordinate point to the origin in a two dimensional of IPCA1 score against 1PCA2 scores in the AMMI model ((Purchase et a/.,2000)). Because of the 1PCAI score contributes more to the GE interaction sum of square, a weighted value is needed. This weight is calculated for each genotypes and environment according to the relative contribution of IPCAI to IPCA2 to the interaction SS as follows.
6
Oromia Agricultural Research Institute (IQQO), Crop research Proceeding 2017
A S V = Jg ^ (/ P C ,4 1 s « > r e ) J2 + [/PC/1212SSIPCA1Where, —---- is the weight given to the IPCA1 value by dividing the IPCA1 sum squares by the IPCA2JO //L/tZ
sum of squares. The larger the IPCA score, either negative or positive, the more specifically adapted a genotype is to certain environments. Smaller IPCA score indicate a more stable genotype across environment.Genotype Selection Index (GSI) : Based on the rank of mean grain yield of genotypes (RYj) across environments and rank of AMMI Stability Value (RASV,) a selection index GSI was calculated for each genotype which incorporate both mean grain yield and stability index in a single criteria (GSIj) as G S Ir RYj +RASViTable I. Genotype code and the name of 14 linseed genotypesNo. Genotype code Name
1 G1 CDC 1747 X Cl-1652/SPS22 G2 CDC 1747 X CI-1652/SPSI'jJ G3 CHILALO X R12-D33C/SPS34 G4 CHILALO X RI2-D33C/SPS85 G5 Cl-1652 X CDC 1747/SPSI6 G6 CHILALO X R12-N27G/SPS67 G7 CHILALO X RI2-N27G/SPSII8 G8 Cl-1652 X R12 -D33C/SPS69 G9 R12-N100 X Cl-1525/SPS410 G10 R12-N100 X C11525/SPS711 G li R 12-N100 X Cl 1525/SPS1012 G12 Dibanne (standard check)13 G13 Jitu (standard check)14 G14 Local
Result and DiscussionThe result of combined analysis of variance (Table 2) showed high significant differences for genotypes, environment and GE interaction indicating the effect of environment in the GE interaction, genetic variability and possibility of selection for stable genotypes. As it is indicated by different scientists, (Farshadfar and Sutka, 2003; Farshadfar and Sutka, 2006) when GE interaction was significant, it is possible to proceed and calculate the stability for the tested genotypes. Mean comparison for the tested genotypes indicated that maximum grain yield was obtained from G6 (1.85t/ha) followed by G9 (1.69t/ha) and G 11 (1,64t/ha) whereas the least mean grain yield was obtained from G3 (1.42t/ha).
7

Oromia Agricultural Research Institute (IQQO), Crop research Proceeding 2017
Table 2. Combined analysis of variance for grain yield of linseed at three locations over two yearsSource of Variation Degree of freedom Mean SquareYear (Y) 1 3.55262**Location(L) 2 8.929441**Replication 3 0.509109**Genotype (G) 13 0.281792**Y x L 2 3.07369**Y x G 13 0.103805**Lx G 26 0.099389**Y x L x G 26 0.055773**Residual 249 0.061127**CV% 15.7The result of regression analysis (Table 3) revealed that the main effects of genotypes and GE interaction
were relatively small and accounted 10.01% and 14.71% of the total sum of square (TSS), respectively.Liner GE interaction was not significant and accounted for 18.72% of the variability in the GE
interaction. As a general rule the effectiveness of regression analysis is when 50% of the total sum
squares is accounted for by liner GE interaction (Hayward et al.. 1993), hence regression analysis is notuseful for stability analysis of genotypes .
Table 3. Regression analysis of stability for linseed genotypes
Source of variation D.F. S.S. M.S. TSS(%)Genotypes (G) 13 0.915823 0.070448** 10.01Location (L) 5 6.88972 1.37794** 75.29G X L 65 1.34592 0.020706** 14.71G X Site Reg 13 0.251952 0.019381 18.72Deviation 52 1.09396 0.021038** 81.28TOTAL 83 9.15146
AMMI model analysis: In AMMI model, principal component analysis is based on the matrix of deviation from additivity or residual will be analyzed. In this respect both the results of AMMI analysis, the genotypes and environment will be grouped based on their similar responses (Gauch,1992; Pourdad and Mohammadi, 2008; Wade et al., 1995). Using ANOVA yield sum of square was partitioned into genotype, environment, and GE interaction. GE interaction was further portioned by principal component analysis (Table 4). The result if AMMI analysis indicated that 10.01% of the total variability was justified by genotypes, 75.29% by environments and 14.71% by GE interaction. A large contribution of the environment indicated that environments were diverse, with large difference among environmental means causing most of the variation in grain yield. The same result was reported by (Farshadfar, 2008). The result of AMMI analysis also showed that the first principal component axis (1PCAI) accounted for 63.42% over the interaction SS, IPCA2 and IPCA3 explained 25.16% and 6.69% of the GE interaction SS, respectively. The first two IPCA scores were significant at (P<0.01%) and cumulatively accounted for
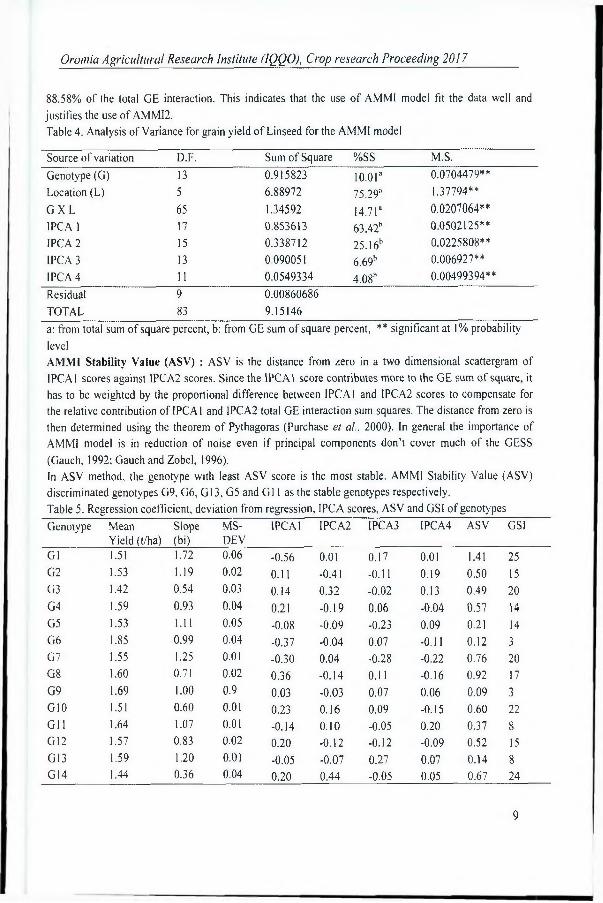
Oromia Agricultural Research Institute (1QQ0), Crop research Proceeding 2017
88.58% of the total GE interaction. This indicates that the use of AMMI model fit the data well and justifies the use of AMMI2.Table 4. Analysis of Variance for grain yield of Linseed for the AMMI model
Source of variation D.F. Sum of Square %SS M.S.Genotype (G) 13 0.915823 10.01a 0.0704479**Location (L) 5 6.88972 75.29a 1.37794**G X L 65 1.34592 14.71a 0.0207064**IPCA 1 17 0.853613 63.42b 0.0502125**IPCA 2 15 0.338712 25.16b 0.0225808**IPCA 3 13 0.090051 6.69b 0.006927**IPCA 4 11 0.0549334 4.08b 0.00499394**Residual 9 0.00860686TOTAL 83 9.15146a: from total sum of square percent, b: from GE sum of square percent, ** significant at 1% probability levelAMMI Stability Value (ASV) : ASV is the distance from zero in a two dimensional scattergram of 1PCA1 scores against 1PCA2 scores. Since the IPCA1 score contributes more to the GE sum of square, it has to be weighted by the proportional difference between IPCA1 and IPCA2 scores to compensate for the relative contribution of 1PCA1 and IPCA2 total GE interaction sum squares. The distance from zero is then determined using the theorem of Pythagoras (Purchase et al.. 2000). In general the importance of AMMI model is in reduction of noise even if principal components don’t cover much of the GESS (Gauch, 1992; Gauch and Zobel, 1996).In ASV method, the genotype with least ASV score is the most stable. AMMI Stability Value (ASV) discriminated genotypes G9, G6, G13, G5 and G11 as the stable genotypes respectively.Table 5. Regression coefficient, deviation from regression, IPCA scores, ASV and GS1 of genotypesGenotype Mean
Yield (t/ha)Slope(bi)
MS-DEV
IPCA1 IPCA2 I PC A3 IPCA4 ASV GSI
Gl 1.51 1.72 0.06 -0.56 0.01 0.17 0.01 1.41 25G2 1.53 1.19 0.02 0.11 -0.41 -0.11 0.19 0.50 15G3 1.42 0.54 0.03 0.14 0.32 -0.02 0.13 0.49 20G4 1.59 0.93 0.04 0.21 -0.19 0.06 -0.04 0.57 14G5 1.53 1.11 0.05 -0.08 -0.09 -0.23 0.09 0.21 14G6 1.85 0.99 0.04 -0.37 -0.04 0.07 -0.11 0.12 3G7 1.55 1.25 0.01 -0.30 0.04 -0.28 -0.22 0.76 20G8 1.60 0.71 0.02 0.36 -0.14 0.11 -0.16 0.92 17G9 1.69 1.00 0.9 0.03 -0.03 0.07 0.06 0.09 3G10 1.51 0.60 0.01 0.23 0.16 0.09 -0.15 0.60 22G il 1.64 1.07 0.01 -0.14 0.10 -0.05 0.20 0.37 8G12 1.57 0.83 0.02 0.20 -0.12 -0.12 -0.09 0.52 15G13 1.59 1.20 0.01 -0.05 -0.07 0.27 0.07 0.14 8G14 1.44 0.36 0.04 0.20 0.44 -0.05 0.05 0.67 24
9

Oromia Agricultural Research Institute (1QQ0), Crop research Proceeding 2017
N.B. MS-DEV= deviation from regression, 1PCA= Interaction Principle Component Analysis axis, ASV= AMMI Stability Value, GSI= Genotype Selection IndexGenotype Selection Index (GSI): As stability per se is not a desirable selection criterion, because the most stable genotypes would not necessarily give the best yield performance (Mohamaddi and Haghparast, 2007), hence, simultaneous consideration of grain yield and ASV in single non-parametric index is needed. Therefore, the rank of ASV and mean grain yield (RY,) are incorporated in single selection index namely Genotype Selection Index (GSI). The least GSI is considered as the most stable with high grain yield. Thus GSI indicates (Table 5). G6 and G9 have the most stability with high grain yield.
Model fit: 88.6% OF GXE SSC=Sinana2015
'° 7 -0.52 -0.24 0.04 0.32 0.6IPCA1
Figure I. Biplot analysis ot'GE interaction based on AMM2 model for the first two interactions principal component scores.
10

Oromia Agricultural Research institute (IQQO). Crop research Proceeding 2017
The AMMO bipiot (Figure I) explained 88.6% of the GE interaction, making it a useful test for interaction. It was observed that most of the genotypes and environments were dispersed around the biplot. Genotypes farther from the center of biplot show specific adaptation. Mohammadi and Amri (2008) in their study revealed that those genotypes which are far from the center of the biplot, have high GE interaction and those genotypes that nearest to the center of bi plot, have high stability.Biplot analysis (Figure I) displayed that genotypes G l, G2 and G14 and environment A, F and C have greatest effect in the GE interaction. Gl has specific adaptation with environment A, while G2 has specific adaptation with environment C. genotypes towards the center of biplot have zero interaction, therefore, have general adaptation with different mean grain yield. Genotypes G6, G9, Gl I, G13 and G5 are located in this category and as the entries G6, G9, Gl I and GI3 have mean grain yield over the grand mean, therefore they can be considered as stable with high performance. The genotype Gl has specific adaptation with environment A because their angle is less than 90 degree and their GE interaction is positive. Genotypes G2, G4. G8 and G12 have positive interaction with environment C, but the length of vector for G2 is more on the environment C, hence it has specific adaptability with environment C. The G3, G10 and GI4 have positive interaction with environment F, but GiO is more adapted to it.Conclusion and recommendationBased on the stability parameters viz. regression coefficient, deviation from regression, the AMMI Stability Value (ASV) and mean grain yield, G6 and G9 were selected as the best two varieties. The result of Genotypes Selection Index (GSI) analysis also showed that the most stable varieties with high grain yield were G6 and G9.Hence, these two genotypes were identified as the best and are recommended for production in the study area and similar agro ecologies.AcknowledgementWe would like to thank Oromia Agricultural Research Institute in providing finance for the activity. We also thank Sinana Agriculture Research Center in full support of all necessary facilities needed to implement the study. Finally our grateful goes to the pulse and oil crops research case team staffs for data collection and trial management during the entire period of the experiment.
ReferencesCrosaa J. 1990. Statistical analysis of multilocation trials. Advance in Agronomy, 44: 55-85 Farshadfar E, and M, Sutka J. 2000. Combining ability analysis of drought tolerance in wheat over
different water regiems. Acta Agron llung. 48(4): 353-361.Crossa J, Fox PN, Pfeiffer WH, Rajaram S and Gauch HG. 1991 AMMI adjustment for statistical analysis
of an interactional wheat yield trial. Theor. App Gent, 81: 27-37 Farshadfar E and Sutka J. 2003. Locating QTLs controlling adaptation in wheat using AMMI model.
Cereal Res Commun 31: 249-254 Farshadfar E, and Sutka E. 2006. Biplot analysis of genotype-environment interacting in durum wheat
using the AMMI model. Acta Agron. Hung, 54: 459-467 Farshadfar E. 2008. Incorporation of AMMI stability value and grain yield in a single non-parametric
index (GSI) in bread wheat. Pak J Biol Sci, 11(4): 1791-1796 Gauch HG. 1992. Statistical anlyis of regional yield trials. AMMI analysis of factorial designs. Is' edn,
Elsevier, New York. ISBN: 0-444-89240-0 Gauch HG and Zobel Rw. 1996. AMMI analysis of yield trials. In: Kang MS, Gauch HG (eds) Genotype
by environment interaction. CRC press Boca Raton FL
11

Oromia Agricultural Research Institute (1QQO/, Crop research Proceeding 2017
Getinet A, and Negusei A. 1997. Highland Oil Crops. A Three Decade Research Experience inEthiopia. Research report No. 30. Institute of Agricultural Research, Addis Ababa,Ethiopia.
Hayward MD, Besemard NO and Romagosa L. 1993. Paint breeding, Principles and Prospects. I41 edn.Chapman and Hall, London U.K. ISBN : 0-412-43390-7
Hussein MA, Bjornstad A and Aastveit AH. 2000. SASG3 ESTAB: A SAS program for computing genotype 3 environment stability statistics. AgronJ, 92: 454-459
Lin CS and Binns MR. 1994. Concepts and methods for analyzing regional trial data for cultivar and location selection. Plan breed Rev, 12: 271-297
Mohaniaddi R and Haghparast R. 2007 Biplot analysis of multi-environment trials for identification of winter wheat mega-environment in Iran. World J.Agri Sci. 3:475-480
Mohammadi R and Amri A. 2008. Comparsion of parametric and non-parametric methods for selecting stable and adapted durum wheat genotypes in variable environments. Euphytica, 159: 419-432
Mohammadi R, Mozaffar Roostaei M, Yousef A. Mostafa A and Amri A. 2010. Relationship of phenotypic stability measures for genotypes of three cereal crops. Can J Plant Sci. 90:819-830
Pourdad SS and Mohammadi R. 2008. Use of stability parameters for comparing safflower genotypes in multi-environment trials. Asian J. Plant Sc, i 7: 100-104
Purchase JL, Hatting H and Vandenventer CS. 2000. Genotype x environment interaction of winter wheat in south Africa: II. Stability analysis of yield performance . South A frJ Plant Soil. 17: 101 - 107
Solomon A, Nigussie M, and Habtamu Z. 2008. Genotype-environment interaction and stability analysis for grain yield of maize (Zea mays L.) in Ethiopia. Asian J. Plant Sci. 7: 163-169
Tarakanovas P and Rusgas V. 2006. Additive main effect and multiplicative interaction analysis of grain yield of wheat varieties in Lithuania. Agron Res, 4: 91-98
Wade LJ. Sarkarung S, Melran CG, Guhey A and Quader B. 1995. Genotype by environment interaction and selection method for identifying improved rainfed lowland rice genotypes. 1st edn, International Rice Research Institute pp: 883-900
Yaghotipoor A and Farshadfar E. 2007. Non-parametric estimation and component analysis of phenotypic stability in chickpea (Cicer arietinum L.) Pa k JB io l S c i. 10: 2646-2649
Vavilov Nl. 1926. Studies on the origin of cultivated plants. Bull. Bet. and PI. breed, 16: 139-248.
Adaptation Study of Improved Food Barley (Hordeum vulgare L.) Varieties at Kelem and West Wollega Zones of Western Oromia
Dereje Abera '* Wakgari Raga1 Gelata Negash1 Abay Guta1 Haro Sabu Agricultural Research Center, P.O.Box 10, Kellem Wollega, Dainbi Dollo
♦Corresponding author: E-mail: [email protected] study was conducted on six improved food barley varieties against local check for their adaptability at Badesso and Mata sub-sites of Haro Sabu Agricidtural Research Center (HSARC) for three consecutive (2014-2016) main cropping seasons with the objectives of identifying and recommending high yielding. insect pest resistant/tolerant varieties for Kelem and West Wollega areas of Western Oromia. The seed were sown in randomized complete block design with three replications in the net plot she of 1.6 m~ using four harvestable rows at the spacing of 0.2m between rows. Agronomic traits viz. number of effective tiller per plant (ETP). number of spikelet per panicle (SPP), plant height (PH),
12

Oromia Agricultural Research Institute (IQQO), Crop research Proceeding 2017
panicle height (PNH). number of grain per spike (GPS), days to 50% heading (DH). days to maturity (DM), thousand seed weight (TSW) and grain yield (GY) were collected. Combined analysis of variance detected significant difference among varieties for all studied traits. GGE biplot analysis was done and ranking based on varieties-focused scaling was used. Two varieties, Dinsho and Abdane were identified as ideal varieties in terms of yielding ability and stability. Hence, these varieties are recommended for production in the study area and similar agroecology in western Oromia.
Key words: Adaptability, Hordeum vulgare, Barley Varieties
IntroductionBarley (Hordeum vulgare L.) is the fifth most cultivated cereal crop of the world (Eshghi and Akhundova, 2010) as cited in Girma (2012). In Ethiopia, it is also the fifth important cereal crop next to tef, maize, sorghum and wheat in total area coverage and total annual production in main season (CSA, 2015). In Ethiopia, barley is the third cereal crop based on yield per unit area (Bayeh and Grando, 2011). Barley can be cultivated at altitudes ranging between 1500 and 3500 above sea level. The ideal production of barley in Ethiopia is between altitudes of 2000 to 3000m above sea level (Tamene et al., 2016). It is a hardy crop grown in wide range of agro-climatic regions under several production systems.In Ethiopia, barley is mainly produced for different purposes including human consumption, malt and animal feed (Bekeie et al., 2005; Horseley and Hochhalter, 2004).The average yield obtained in Oromia was 1.23-ton ha'1 (CSA, 2015) but this is by far less than the potential of the crop. The most important biotic and abiotic factors that reduce yield of barley in Ethiopia are use of poor yielding varieties, insect, disease, poor soil fertility, water logging, and soil acidity and weed competition (Bekeie, 2005). Among these, the lack of improved (high yielding, logging and insect and disease resistant) variety/ies have been mentioned as an important barley production constraints in West and Keiem Wollega Zones of Western Oromia. The improvement of food barley is important in these target area thereby to ensure food security of the farmers. Hence, this experiment was carried to test released barley varieties and recommend the best one for the study area.Materials and MethodsThis experiment was conducted at Badesso and Mata, sub sites of Haro-Sabu Agricultural Research Center for three consecutive years (2014-2016). The elevation of testing sites were 2016 and 2054 m.a.s.l for Mata and Badeso, respectively. The study sites had sandy loam type soil textural class with PH of 4.59 and 5.65, and exchangeable acidity of 0.07 and 0.14 dS/m. at Mata and Badesso, respectively. The six improved food barley varieties introduced from Sinana (Abdane, Biftu, Dafo, Dinsho and Harbu) and one from Holeta (HB-1307) Agricultural Research Centers were evaluated against one local check. The experiment was laid out in randomized complete block design with three replications. The net plot size of1.6 m" with four harvestable rows was used at the spacing of 0.2m between rows. The seed was sown by drilling method and 46 Kgha1 DAP was applied at sowing and then 41 Kgha'1 of Urea was used in split form (50% at sowing and the remaining 50% at 40 days after emergency).
13

Oromia Agricultural Research Institute (IQQO). Crop research Proceeding 2017
Data on number of effective tillers per plant (ETP), number of spikelets per panicle (SPP), PH Plant height in cm (PH). Panicle height in cm (PNH) and number of grain per spike (GPS) were collected. Plot based data were also collected for phonological trait such as days to 50% heading (DH) and days to 50% maturity (DM) and yield components such as thousand seed weight in gram (TSW) and grain yield (YLD) in ton ha .Plant based data were recorded from randomly selected and tagged plants from harvestable rows. The collected data were organized and analyzed using SAS (version 9.01) computer software according to the methods developed by Gomez and Gomez (1980). Similarly, GGE biplot analysis was done using Genstat computer soft ware (2012).Results and DiscussionsCombined analysis of variance revealed significant difference among varieties and across years for all observed traits. Locations had significantly affected all observed traits with the exception of grain per spikelet (GPS) in present study (Table 1). In line with this, Badessa (2014) reported significant (p<0.05) difference among evaluated food barley genotypes for all agronomic traits in other study. The interaction of varieties by years significantly affected all observed agronomic traits with the exception of panicle height. Varieties*location significantly affected all recorded traits excluding panicle height and plant height while varieties*year*location exhibited significant difference for ail observation except plant height.Table 1. Combined analysis of variance for grain yield and yield related traits in barley varieties tested at Mata and Badeso for three years (2014-2016)
sv df DH DM ETP SPP PH PNH GPS TSW GYVar 6 179.56** 622.44** 3.44** 30.55** 759.08** 5.54** 268.89** 162.61** 2.28**Rep 2 2.39 21.94** 0.35 1.89 130.61* 3.04* 4.22 2.54 0.06Year 2 210.58** 44.91** 14.37** 133.14** 3414.90** 21.25** 2496.096** 137.25** 4.48**Location 1 208.29** 23.14** 2.43* 12.89* 135.78* 3.70* 1.65 516.88** 2.01*Var*Year 12 8.86** 18.15** 1.32** 28.34** 64.21* 0.40 123.96** 72.70** 1.29**Var*Loc 6 3.92* 62.92** 1.52* 10.81** 27.84 0.60 173.16** 98.24“ 0.5*Var* Year *Loc
14 12.99** 17.31** 1.23** 10.11** 29.87 1.02* 120.95** 200.66** 2.31*
df =degree of freedom, DH=days to heading, DM=days to maturity, I TP= effective tiller per plant, SPP=number of spikelet per panicle, PH= plant height (cm). PNH=Panicle height (cm), GPS= grains per spikelet, TSW= thousand seed weight (g),GY=grain yield (tonha1)
Mean performance of tested barley varieties tested for different traits is shown in Table 2. Overall mean value of days to heading varied from 48.94 for Dafo to 59.06 days for Dinsho with the mean value of 53.78. Dinsho and Abdane had the longest days to heading while Biftu and Harbu were the earlier varieties. The mean value of days to maturity ranged from 87.39 for Harbu to 105 days for MB-1307 with the mean value of 92.65.Abdane (92.89) and local check (92.94) had the longesi mean value of days to maturity after Dinsho. On the contrary, Dafo (87.83) and Harbu (87.39) had earlier days to maturity (Table 2). The minimum mean value of thousand seed weight was observed for Biftu (30.38) while the maximum value recorded from local check (39.90) with the mean value of 34.40 gm. The higher mean value of thousand seed weight was obtained from Dafo (35.42 gm) and Dinsho (35.38gm) after local check. On the other hands, the mean value of grain yield (GY) varied from 2.28 (HB-1307) to 3.30 (Dinsho) with the mean value of 2.94. Besides, Abdane (3.26), Biftu (3.19) and Dinsho (3.3) showed larger mean grain yield over the other varieties while the least mean grain yield was obtained from HB-1307 (Table 2). Therefore, Abdane, Biftu and Dinsho were identified for better mean performance of grain yield and some yield contributing
14

Oromia Agricultural Research Institute (IQQO), Crop research Proceeding 2017
traits presently. On the contrary, the largest mean value of grain yield was reported previously (Kenielew and Alemayehu, 2011 and Girma, 2012) for HB-1307.Table 2: The mean performance of barley varieties for phonological traits, thousand seed weight and grain yield across two locations for three years (2014-2016)Varieties days to heading days to maturity thousand seed weight grain yield ton ha' 1Abdane 55.44b 92.9bc 34.4bc 3.26aBiftu 52.5cd 91.20d 30.38c 3.2abDafo 48.94e 87.83e 35.4ab 2.83cDinsho 59.06a 91.3cd 35.4ab 3.30aHarbu 52.00d 87.39e 33.8bc 2.82cHB-1307 54.4bc 105.0a 3l.3bc 2.28dLocal 54.2bc 92.9b 39.90a 2.8bcMean 53.79 92.66 34.4 2.94CV (% ) 5.46 2.58 21.3 15.8R-sq 0.75 0.92 0.89 0.88LSD 1.95 1.58 4.86 0.31
The result of GGE bi-plot analysis is shown in figure 1. The environments and genotypes obtained in the concentric (central circle) are considered as ideal environments and stable genotypes respectively (Yan and Rajcan,2002). A variety is more desirable if it is located closer to the ideal variety. Using the ideal genotypes/variety as the center, concentric circles were drawn to help visualize the distance between each varieties and the ideal variety. Therefore, ranking based on the genotypes-focused scaling, assumes that stability and mean yield are equally important (Ezatollah et ai. 2011). Varieties Dinsho, Abdane which fell into the center of concentric circles were ideal varieties in terms of yielding ability and stability when compared to the other varieties. Biftu was located on the next concentric circle and was desirable variety (Figure 1).
Cornparison biplot (Total - 76.34% )
P C I - 6 4 . 5 6 %
Genotype ocoros Envtrcnmont
Figure!. GGE bi-plot based on varieties-focused scaling for comparison of varieties for grain yield potential and stability
15

Oromia Agricultural Research Institute (IQQO), Crop research Proceeding 2017
Conclusion and recommendationAbdane, Biftu and Dinsho had shown higher mean values of grain yield a cross the two sites and alsoexhibited better mean values of grain yield over the three years. GGE bi-piot analysis showed thatDinsho, Abdane were identified as ideal varieties in terms of yielding ability and stability and followed byBiftu. Hence, these varieties are recommended for the study areas and with similar agro-ecologies.ReferenceBayeh Mulat and Grando, S.20II. Barley research and development in Ethiopia. Proceedings of the
second national barley research and development review workshop. 28-30 November 2006. HARC, Holetta, Ethiopia. 1CARDA, PO Box 5466. Aleppo, Syria.
Bedassa Mokonin. 2014. Selection of Barley varieties for their yield potential at low rainfall area based on both quantitative and qualitative characters North West Tigria, Shire, Ethiopia. International Journal of plant breeding and genetics. ISSN -1819-35
Bekeie Hundie. 2005. Infection, biology, epidemiology and resistance of barley land race lines to pyrenophora teres. A PhD Thesis submitted to graduate School of Kasetsart University, Thailand.
Central statistical Authority (CSA). 2015. Agricultural sample survey. Report on area and production of crops (Private peasant holding, meher season). Statistical Bulletin No. 578. Addis Ababa, Ethiopia.
Eshghi, R. and E.Akhundova. 2010. Genetic diversity in hulless barley based on agromorphological traits and RAPD markers and comparison with strorage protein analysis. African Journal of Agricultural Research. 5(1): 97-107.
Ezatolla F, Hassan Z, Reza M. 2011. Evaluation of phenotypic stability in check pea genotypes using GGE bi-plot. Annals of Biological Research 2(6):282-292.
Gen stat. 2012. Gen stat procedure library release. 15lh edition. VSN International Ltd.Girma Gemedi. 2012. Yield and yield components of food barley (Hordeum vulgare L.) varieties as
influenced by sowing date and pesticide application at Holeta, central Ethiopia.Horsley, R.D., Hochhalter, M., 2004. Barley: agronomy. In:Wrigley, C., Corke, H„ Walker, C.E.(eds).
Encyclopedia of grain Science. Vol.l. Elsevier Academic Press. London. United Kingdom. 38- 46.
Kemelew Muhe and Alemayehu Assefa. 2011. Diversity and agronomic potential of barley (Hordeum vulgare L.) Land races in variable production system, Ethiopia. Journal of Agricultural Science Research 1 (4): 148-154.
SAS (Statistical analysis system). 2006. Statistical analysis system (SAS) institute inc., Cary, NC, USA, ISBN-13: 978-1-59047-754-0.
Yan W, Rajcan I. 2002. Bi-plots analysis of the test sites and trait relations of soybean in Ontario. Crop Science. 42:11-20.
16

Oromia Agricultural Research Institute (IQOO). Crop research Proceeding 2017
Participatory Selection of Lentil (Lens culinaris Medik) Varieties for High lands of Guji. Southern Ethiopia
Tekalign Afeta*:. Demissie Alemayehu1, BelachevvDabalo''Bore Agricultural Research Center (BOARC), P. O. Box 21. Bore, Ethiopia Corresponding e-mail: [email protected]/[email protected]
AbstractParticipatory variety selection was carried out in highland of Guji Zone at three selected farmers 'fields during 2016 main cropping season. The objective of this study was to evaluate the performance of released lentil varieties and select the best one for the target production area. Four released lentil varieties were evaluated at on station of Bore Agricultural Research Center and on fields of three selected farmers. Randomized complete block design with three replicat ions was used. Each farmer was considered as a replicate. Significant differences (p<0.05) were observed among varieties in days to flowering, days to maturity, pi am height, number of pods per plant, and grain yield per hectare. Grain yield ranged from 1093 to 1944 kgha1 with grand mean oj 1556 kgha1. Alemaya and Ada a were the two better performing varieties with seed yield of 1944 kgha' and 1861 kgha'. respectively. Based on their own selection criteria farmers also selected these two varieties. The result of this study showed that varieties Alemaya and Derash were adapted varieties to Bore high land and similar agroecologies in Guji zone.Keyword: Lentil. Participatory Variety Selection. Seed yield.
IntroductionLentil (Lens culinaris Medik) is one of the most ancient annual food crops that have been grown as an important (bod source (Fikru et al., 2014). It is cultivated for its seed and mostly eaten as split (Cokkizgin and Shytaya, 2013). The primary product of lentil is its seed, which has relatively higher contents of protein, carbohydrate and calories compared to other legumes (Fikru et al., 2014). It is the most desired crop because of its high average protein content and fast cooking characteristic in many lentil-producing regions. It can be used as a main dish, side dish, or in salads. Seeds can be fried and seasoned for consumption bvit sometimes difficult to cook because of the hard seed coat those results from excessive drying. Its flour is used to make soups, stews, purees, and mixed with cereals to make bread and cake; and as a food for infants (Abralram, 2015).It also plays a significant role in maintenance and improvement of soil fertility. Us cultivation enriches soil nutrient status by adding nitrogen, carbon and organic matter which promotes sustainable cereal- based systems of crop production (Abraham, 2015). Both red and green lentils are produced in the region with variable proportion. It is an important crop in food, feed and farming systems of West Asia and North and East Africa. It has been established in a wide range of agro-ecology but production is limited to tropical areas. The spread of lentil from the center of origin has been accompanied by the selection of traits important for adaptation to environments that can be climate, soil and their impact on season length, abiotic and biotic stresses (Fikru et al., 2014).In the highlands of Guji, farmers as well as Seed Producer Cooperatives (SPCs) are highly demanding better yielding varieties of lentil to maximize their product, and improve the livelihood of their families. Participatory Varietal Selection (PVS) has been proposed as an option to the problem of fitting the crop to a multitude of both target environments and users preferences (Ceccarelli et al. 1996). It is worth mentioning that although farmer participation is often advocated on the basis of equity, there are sound scientific and practical reasons for farmer involvement to increase the efficiency and the effectiveness of a breeding program (Ceccarelli and Grando, 2002). The present study was conducted with the objectives
17

Oromia Agricultural Research Institute (IQQO). Crop research Proceeding 2017
to evaluate and select lentil varieties for high yield and other agronomic traits through farmer’s participation in decision making during the selection process.Materials and MethodsThe experiment was carried out during 2016 main cropping season at Bore Agricultural Research Center, Guji Zone southern Oromia. The experimental site is situated at the latitude of 06‘’23’55" N - 06°24f 15" N and longitude of 38*34'45'' E - 38°35’5"E at an altitude o f2728 m above sea level. The area represents highlands of Guji Zone, receiving high rainfall and characterized by a bimodal rainfall distribution. The first rainy season is from April up to October and the second season starts in late November and ends at the beginning of March. The major soil types are Nitosols (red basaltic soils) and Orthic Aerosols (Yazachew and Kasahun, 2011; Wakeneef al., 2014). The soil is clayey loam in texture and strongly acidic with pH value of around 5.13.Four released lentil genotypes were obtained from Debre Zeit Agricultural Research Center (DZARC) were used for the study. The trial was laid down in randomized complete block design (RCBD) with all three replication on Bore Agricultural Research Center main station as for mother Trial. The three farmer fields were planted with one replication each considered as baby trial. Each genotype was planted in 8 rows of 3 m row length with 20 cm spacing between rows. Diammonium phosphate (DAP) was applied at rate of 100 kg/ha. The whole DAP was applied at sowing. Sowing was done by hand drilling at seed rate of 60-120 kg/ha seeds per row.Agronomic and phenological data were collected on plot and plant basis from the mother trial. Plant height (cm), number of branches per plant, number of pods per plant, and number of seeds per pod, were collected from ten randomly taken plants from the middle six rows in each plot. Grain yield (kg) of the middle six rows in each plot was measured and converted to kilogram per hectare for analysis. The recorded agronomic data were subjected to the analysis of variance (Gomez and Gomez, 1984) using Statistical Analysis Software GenStat discovery 15lhedition.Farmers’ selection process was carried out at physiological maturity of the plant. Every farmer’s group, comprising women and men, made discussion during selection. The selection criteria set by farmers were frost tolerant (FT), seed color (marketability) (Sc), stem strength (St), maturity (early) (M ), shattering ability (Sh), number of pods plant' (PPP) and number of branches plant (BPP).Farmers’ evaluation and selection data were collected on plot basis from the three trials i.e., farmers were grouped around each host farmer of the trials.Farmers’ selection data were analyzed using simple ranking method in accordance with the given value (De Boef and Thijssen, 2007). Simple ranking is a tool often used to identify promising varieties based on farmers’ preferences. The ranking procedure was explained for farmer participants and then each selection criterion was ranked from I to 5 (5 = very good, 4 = good, 3 = average, 2 = poor and I = very poor) for each variety. Ranking was done on consensus where differences are resolved through discussion (De Boef and Thijssen, 2007).ResultsAgronomic traits viz., days to flowering, days to maturity, plant height, number of branches per plant, number of pods per plant, number of seeds per pod and grain yield were analyzed (Table 1). The varieties significantly (P < 0.05) varied for days to flowering and maturity. The difference in days to flowering among the varieties range from 76 days to 80 days. Derash (76 days) was early flowering variety whereas Ada’a, Teshale and Alemaya were late flowering varieties. Similarly, the differences in days to maturity among the genotypes were varied from 136 to 141 days. Derash (136 days) early maturing variety
18

Oromia Agricultural Research Institute (1000), Crop research Proceeding 2017
complete their life cycle in relatively shortest period whereas Ada'a and Alemaya varieties were matured relatively late. Thus early maturing genotypes have the advantage over late maturing types in environments where frost occurrs late in the season. Significant differences (P < 0.05) were also observed among varieties for plant height. Relatively variety, Ada'a was the tallest variety (39.6 cm) followed by Alemaya (33.6 cm) and Derash (32. I cm) whereas the shortest variety was Teshale (31.5 cm).Table 1. Mean values of grain yield and different agronomic traitsGenotypes DF DM PH
(cm)BPP PPP SPP YLD
(kg ha1)Derash 76b 136.0C 32.08b 2.7a 62.3a 1.4a 1324hAda’a 80a 141.3a 39.6a 3.3a 39.lb 1.6a 1861aAlemaya OO o I40.0ab 33.6b 2.8a 40.5b 1.5s 1944aTeshale 79.7a 138.3* 31.5b 2.9a 36. lh 1.4a I093bMean 79.9 138.9 34.2 2.9 44.5 1.5 1556LSD (5%) 1.0 2.6 3.3 NS 17.2 NS 533.9CV (% ) 0.6 0.9 4.8 15.6 19.4 16.1 17.2Where DF= Days to flowering, DM- Days to maturity, PH= Plant height. BPP= Number of branches plant-1. PPP~ Number of pods plant-1. SPP= Number of Seeds pod-1. LSD= Least significant difference. CV=Coefficient of variationSignificant variation (P < 0.05) was observed among varieties for pod number per plant. The highest pod number per plant was recorded for Derash (62.3) and the lowest was for Teshale (36.1cm). There significant difference among the tested varieties (P<0.05%) in grain yield performance. Grain yield ranged from to 1093 to 1944 kgha'1 with grand mean of 1556 kgha''. Alemaya (1944 kgha'1) and Ada'a (1861 kgha1) were top yielding varieties whereas Derash (1304 kgha1) and Teshale (1093 kgha'1) took the least ranks.Fanners Variety EvaluationThe results obtained from farmers’ evaluation in three trials are presented in Table 2. The evaluations mean score value for each genotype ranged from 7.75 to 10.75 (Table 2). Alemaya scored as the best whereas Ada'a was the last. Farmers' ranked Teshale and Derash second and third best varieties, respectively.Table 2. Sum of scores at three farmer sites for each trait, overall means value of each selection criteria and ranking of genotypesVariety Farmer's Criteria Mean Rank
FT Sc St M Sh PPP BPP TotalDerash 9 II 15 12 9 11 9 76 9.50 3Ada'a 13 9 8 4 14 7 7 62 7.75 4Alemaya 14 15 10 8 10 14 15 86 10.75 1Teshale 9 10 13 14 10 12 13 81 10.13 2Where, FT= Frost tolerant. Sc= Seed color (Marketability), St= stem strength (lodging), M= Maturity (early),Sh= shattering ability, PPP= Number of Pods plant-1 and BPP= Number of Branches plant-1 rating of the performance of variety for a given criteria: 5= very good, 4= good, 3= average, 2= poor and 1 = very poor by adopting from De Boefand Thijssen. 2007
Different varieties were selected by different fanners at different farmers’ field due to their performance in the field at selection time. However, including yielding ability criteria, best varieties namely Alemaya, Teshale and Derash were selected as top ranking in the selection /adapted varieties. Except Ada’a and Teshale the same varieties had better performance and found to be promising from the analysis of
19

Oromia Agricultural Research Institute flQQOj. Crop research Proceeding 2017
researchers' collected data of some agronomic trait. Due to its late maturing and lodging character Ada'a variety, got the lowest rank whereas variety Teshale was with the lowest yield. The study showed that participatory approach of variety played a significance role as it confirmed by conventional plant breeding.Farmers and the researcher used different parameters and methods to evaluate the tested genotypes. It is obvious that farmers have demonstrated the ability to select well-adapted and preferred varieties under their circumstances using their own criteria. A range of improved varieties should be available for selection under their participation. In this study researchers consider farmers selection traits in their varietal development such as seed yield, seed size and overall field performance. Generally, the selected varieties have high yield and tolerance to both biotic and abiotic stresses with farmers’ preferences. Conclusions and recommendationAlemaya and Derash gave the higher grain yield and showed better performance in other agronomic traits than the other varieties indicating that they are adapted to the study area. Hence .Alemaya and Derash are recommended for lentil growing areas of Gugi.
ReferenceAbraham Reda. 2015. Lentil {Lens Cw//>wraMedikus) Current Status and Future Prospect of
Production in Ethiopia./!dvance in Plants Agricultural Research, 2(2): 00040. DOI:10.15406/apar.2015.02.0004
Ceccarelli. S. and Grando, S., 2002. Plant breeding with farmers requires testing the assumptions of conventional plant breeding: Lessons from the ICARDA barley program. In: Cleveland DA, Soleri D (eds.) Farmers, scientists and plant breeding: integrating knowledge and practice. CAB1 Publishing International, Wallingford, Oxon. UK. pp 297-332.
Ceccarelli, S., Grando, S., and Booth. R. H.. J 996.International breedingprogrammes and resource- poor farmers: crop improvement in difficult environments. In: Eyzaguirre P, iwanaga M (eds.). Participatory plant breeding.Proceeding of a workshop on participatory plant breeding, 26-29 July 1995, Wageningen, The Netherlands. IPGR1. Italy, pp 99-116.
Cokkizging, A. and Shtaya. M. J. Y., 2013. Lentil; Cultivation Techniques; Utilization and Advances in Transformation, 1(1): 55-62.
De Boef, W. S. and Thijssen, M. H„ 2007. Participator, tools working with crops, varieties and seeds. A guide for professionals applying participatory approaches in agro-biodiversity management, crop improvement and seed sector development.Wageningen, Wageningen International, 83p.
Fikru Mekonnen, Firew Mekbib, Shiv Kumar. Seid Ahmed and Tilak R. Sharma,T.R. 2014.Agromorphologicai traits variability of the Ethiopian lentil and Exotic Genotypes. Advance in Agriculture, 2014: 1-15.
Gomez, K.A. and Gomez, A.A., 1984. Statistical Procedures for Agricultural Research, 2nd edition,John Wiley and Sons, New York, p.680.
Wakene Tigre, Walelign Worku and Wassie Haile, 2014.Effects of nitrogen and phosphorus fertilizer levels on growth and development of barley (Hordeum vulgare L.) at Bore District, Southern Oromia, Ethiopia. American Journal of Life Sciences. 2(5): 260-266.
Yazachew Etefa and Kasahun Dibaba, 2011. Physical and Socio economic profile of Guji zone districts. Bureau of Finance and Economic Development. The National Regional Government of Oromia, Finfinne.
20
Oromia Agricultural Research Institute (1000), Crop research Proceeding 2017
Adaptation Study of Improved Chickpea (Cicer arietinum L.) Varieties in Guji /one of Southern Ethiopia
Deresa Shumi1. Demissie Alemayehul', Tekalign Afeta ~Bore Agricultural Research Center (BOARC), P. O. Box 21. Bore. Ethiopia
'Haramava University. Department of Plant Science. Post Graduate Studies. Dire Daw a E-mail Address: dameadugna@gmu\\. coni/dameadugna@yahoo. com
AbstractA field experiment was conducted at Bore on station. Ana Sora on farm and Adola sub-site using six improved chickpea varieties (Arerti. Dalota. Ejere. Habru. Natoli and Teketave) during 2015/16 Bona cropping season. The objective of the study was to assess the adaptability of these varieties in Guji Zone. The field experiment was laid out in randomized complete block design with three replications. The result revealed that significant IP < 0.05) differences among varieties for number of pods plant’, hundred seed weight and grain yield (kg ha'1) at all the three locations. At Bore on station and Adola sub site, variety Dalota was the best followed by Habru while variety Teketay was the best at Ana Sora on farm. The overall mean indicated that Dalota and Habru were the two best varieties with seed yield of 2411 kg ha '1 and 1822 kg ha'1, respectively. Hence, Dalota and Habru were recommended for production in Guji Zone of Southern Oromia and similar agro-ecologies.
Keyword: Adaptation, Chickpea, Cicer arietinum, Grain yield.
IntroductionChickpea (Cicer arietinum L.) is an ancient crop that belongs to the legume family. It has been grown in Africa, the Middle East, and India for centuries and eaten as dry pulse or green vegetable (Corp et al.,2004). A cool season annual pulse crop is grown in tropical, subtropical, and temperate regions of the world. Most production and consumption of chickpea (95%) takes place in developing countries (Muehlbauer and Tulu, 1997).Chickpea is an important source of protein for millions of people in the developing countries, particularly in South Asia and Africa, who are largely vegetarian either by choice or because of economic reasons. In addition to having high protein content (20-22%), complex carbohydrates, fiber, minerals (phosphorus, calcium, magnesium, iron and zinc) and (3-carotene while low in fat and cholesterol (Corp et al., 2004). Chickpea is Ethiopia’s most important pulse crop widely grown in highland and semi-highland regions of the country mainly on clay soil. It ranked second next to faba bean, which occupies about 239,747.51 hectares of land annually with estimated production of 4.586, 822.55 quintals (CSA, 2014/15). It is also an excellent source of animal feed and plays an important role in the maintenance of soil fertility, particularly in the dry rain fed areas (Katerji etal, 2001) and it fixes Rhizobiuni bacteria on roots(Akcin,1988). The chickpea plant and its straw are used as forage, hay and silage in the vertisol soils of Ethiopian highlands. Besides, similar to other pulse crops it is a good rotational crop and thus improves soil fertility (Yasin and Mathewos. 2016).Guji zone has conducive environment for production of the chickpea. However, this crop has not been yet in production in this zone. Therefore, this activity was carried out to evaluate and select the best performing chickpea variety for the target areas.Materials and MethodsThe study were conducted at Bore on-station. Ana Sora on farm and Adola sub-site of Bore Agricultural Research Center ,Guji Zone Southern Oromia during the "Bona’ cropping season of 2015. The areas located within the altitude range of 1725-2754 m.a.s.l. Six (6) improved Chickpea varieties namely Arerti. Dalota, Ejere. Habru. Natoli and Teketave were introduced from Debre Zeit Agricultural Research
21

Oromia Agricultural Research Institute (IQQO). Crop research Proceeding 2017
Center/EIAR. The treatments were arranged in randomized complete block design (RCBD) with three replications. The plot size was 7.2m: ( 6 rows of three meter length with 40cm spacing between rows) and 10cm between plants while the net harvesting area was 4.48m: (the four central rows). At the time of planting, all plots received a basal application of NPS at the rate of 50kgha'. The experimental fields were managed as per the recommended practices for chickpea.Days to emergence, days to flower initiation, days to physiological maturity, plant height, number of pods, seeds per pod and hundred seed weight were recorded. To determine grain yield per plot the four central rows and were threshed. The grain yield was adjusted to the moisture content of 10% as follows:Adjusted Grain Yield = (100 MC) x u j.V. ed grdin yit-!_ i where MC- is the moisture content of chickpea
seeds at the time of measurement and 10 is the standard moisture content of chickpea in percent.Finally, yield per plot was converted to per hectare basis and the average yield was reported in kg ha' '.The recorded data were subjected to analysis of variance using GenStat discovery 15lh edition software following the standard procedures outlined by Gomez and Gomez (1984). Comparisons among the treatment means were done using Fishers protected least significant difference (LSD) test at 5% Level of significant.
Results and DiscussionAnalysis of variance of the three location show that phenological and growth parameters; namely days to 50% emergency at Bore on station and Adola sub-site, days to 50% flowering at Bore on station and Ana sora on farm, days to physiological maturity at Bore on station and Ana Sora on fann and plant height at Adola sub-site were significant (P < 0.05) for the varieties (Table I). Days to flowering ranged from 71 to 75 days for Bore on station and 71 to 76 days for Ana sora on farm.Days to maturity ranged from 144.3 to 153.7 days for Bore on station and 144.3 to 154.3 days for Ana sora on farm. Similarly, plant height ranged from 46.77 to 62.33 cm for Adola sub site. Yasin and Mathewos (2016) and Yasine/ at., 2017also reported that significant difference among the varieties for plant height for this crop in other study.Analysis of variance of at three locations revealed that number of pods per plant and hundred seed weight were significant (P < 0.05) difference among the varieties (Table 2). Variety Teketaye had the highest average number of pod per plant with 87 pods while Arerti and Ejere showed the lowest average of pod per plant with mean of 61.67 and 64.33 pods, respectively at Bore on station. At Ana sora on farm and Adola sub-site the highest average number of pods per plant was recorded from variety Dalota were 67.33 and 68.80. respectively. The lowest number of pods per plant was recorded from variety Natoli (41.33 and 42.37 pods) at Ana sora on farm and Adola sub-site, respectively. The varietal effect on the hundred seed weight was significant (P <0.05) at three locations and the results (Table 2) indicated that the maximum hundred seed weight (37.78 g, 36.67 g and 40 g) were recorded in variety Dalota, followed by varieties Habru and Natoli with (35.56 g; 35 g), Ejere and Habru (35 g; 33.33 g) and Habru, Natoli and Ejere with (35 g) at Bore on station. Ana sora on farm and Adola sub-site, respectively (Table 2).Variety Dalota had the highest hundred seed weight followed by Habru and Natoli over three locations whereas the variety Arerti had the lowest. This indicates that all the varieties respond differently to the tested locations. According to Yasin and Mathewos (2016) there was significant difference among the varieties for number of pod per plant and hundred seed weight. In other study also Chickpea varieties showeo significant difference on number of pods per plant (Yasin et al.. 2017).
22

Oromia Agricultural Research Institute (lOQO). Crop research Proceeding 2017
Table 1. Mean days to 50% emergency, days to 50% flowering, days to physiological maturity and plant height of chickpea varieties at Bore on station. Ana Sora on farm and Adola sub-site during 2015/16 cropping season
VarietiesPhenology and Growth Parameters
Bore On-station Ana Sora on farm Adola sub-siteDE DF DM PH DE DF DM PH DE DF DM PH
Dalota 9.00b 75.00a 153.70a 59.77a 9.33a 75.67a 1 ,S4.3a 67.10a 9.0a 52.67a 82.00a 52.2bcHabru 9.67a 72.33b 144.30c 56.77a 9.33a 72.33c 144.3b 63.46a 8.0b 52.67a 84.67a 62.33aArerti 10.0a 71.00b 145.0bc 58.20a 10 .0a 71.00c 145.0b 68.27a 8.0b 52.67a 85.00a 46.77cNatoli 10.0a 75.00a 146.3 be 56.17a 9.67a 75.0ab 146.3 b 62.40a 9.0a 54.00a 84.00a 50.03cTeketaye 10.0a 72.33b 147.70b 61.10a 10 .0a 73.0bc 147.7b 75.60a 7.3c 52.67a 83.00a 50.27cF.jere 9.0b 71.00b 144.3c 57.13a 9.33a 71.00c \ 44.3b 66.63a 9.0a 52.00a 82.00a 57.0abMean 9.6 72.78 146.89 58.20 9.61 73.00 147.00 67.20 8.40 52.78 83.44 53.10LSD (5%) 0.4 2.37 3.22 NS NS 2.37 3.53 NS 0.42 NS NS 6.05CV (% ) 2.5 1.80 1.20 7.7 4.9 1.8 1.4 9.3 2.8 1.8 1.6 6.40Means within the same column followed by the same letter (s) are not significantly different at 5% level of significance; DE=Days to emergency, DF=Days to flower, DM = days to maturity, PH = Plant height (cm), LSD = Least Significant difference; NS = Not significant; CV = Coefficient of Variation

Oromia Agricultural Research Institute (IQQO). Crop research Proceeding 2017
Table 2. Mean number of pods plant'1, number of seeds pod and hundred seed weight (g) of chickpea varieties at Bore on station and Ana Sora on farm and Adola sub-site during 2015/16 croppingseason
Yield Component ParametersVarieties Bore On-station Ana Sora on farm Adola sub-site
NPPP NSPP HSW NPPP NSPP HSW NPPP NSPP HSWDalota 74.33ab 1.33s* 37.78“ 67.33“ 1.00“ 36.67“ 69.80“ 1.33* 40.00“Habru 67.33h 1.00" 35.56“b 29.00h 1.00“ 33.33nbc 45.93b 1.00“ 35.00bArerti 61.67c 1.00* 28.89c 44.00h 1.00“ 28.33d 50.53b 1.67“ 26.6TNatoli 77.33ab 1.003 35.00“b 4I.33b 1.00“ 30.00cd 42.37b 1.00“ 35.00bTeketaye 87.00“ 1.00“ 32.78b 42.67b 1.33“ S l^ 6 57.47ab 1.00“ 31.67bEjere 64.33** 1.00“ 34.44b 43.33b 1.00“ 35.00“b 42.50b 1.00“ 35.00bMean 72.0 1.06 34.07 44.60 1.06 32.50 51.40 1.17 33.89LSD(5%) 2.66 NS 3.19 18.87 NS 4.19 16.68 NS 4.69CV (% ) 23.50 22.30 9.90 23.80 22.30 7.30 18.20 28.60 7.80Means within the same column followed by the same letter (s) are not significantly different at 5% level of significance; NPPP = Number o f pods plant-1, NSPP=Number of Seeds pod-1. HSW=Hundred Seed Weight (g), LSD = Least Significant difference; NS = Not significant; CV = Coefficient of Variation
The study revealed that chickpea varieties showed significant (P < 0.05) difference for grain yield (kg ha'1) at three locations (Table 3). Variety Dalota had the highest grain yield (3038 kg ha'1); while Teketave had the lowest grain yield (1139 kg ha 1) at Bore on station. At Ana sora on farm the highest grain yield was recorded from variety Teketaye (2274 kg ha ') followed by Dalota (1892 kg ha 1) and the lowest grain yield was recorded from Ejere (910 kg ha'1) variety. At Adola sub-site the highest average of grain yield was recorded from variety Dalota (2303 kg ha'1) followed by Habru (1986 kg ha'1), whereas the lowest was recorded from Ejere ( 1226 kg ha1) variety. From the overall mean grain yield the highest yield was recorded from variety Dalota (2411 kg ha*1) followed by Habru (1822kg ha'1) while, the lowest from variety Ejere (1264 kg ha !). This indicates that all the varieties respond differently to the tested locations. This result are in line with those of Biru et at. (2014) who tested different improved Chickpea varieties and reported the average grain yield over environments varies from 520 to 2010 kg ha'1. Similarly Yasin and Mathewos (2016) and Yasin et al.(20\l) also reported that there was significant difference for grain yield among the varieties across locations.
Table 3.Mean grain yield in (kg ha'1) of chickpea varieties adaptation trial over three locations during croppi ng season of 2015/16
Grain yield (kg ha' )Varieties Bore On- Ana Sora on Adola sub overall
station farm site meansDalota 3038“ 1892“b 2303“ 2411Habru 2160“b 1319* 1986*b 1822Arerti 1729** 1813ab 1247bc 1596Natoli 1912be 1431** 1455** 1599Teketaye 1139c 2274" 1444bc 1619Ejere 1656bc 910C 1226* 1264Mean 1939 1606 1610LSD 5%) 942.6 798.4 747.5CV (% ) 27.3 27.9 26.10Means within the same column followed by the same letter (s) are not significantly different at 5% level of significance. LSD = Least Significant difference; NS = Not significant; CV = Coefficient of Variation
24

Oromia Agricultural Research Institute (IOQO), Crop research Proceeding 2017
Conclusion and RecommendationThe present study showed the presence of differences among the varieties for grain yield and yield related traits. Chickpea varieties Dalota and Habru were selected for their high grain and other agronomic traits. Therefore, from this study, it could be concluded that Dalota and Habru are the two varieties best adapted to Guj zone.
ReferenceAkcin A. 1988. Edible pulses publications of Agricultural Faculty of Selcukuniversity No: 8 konya-
Turkey (in Turkish).Biru Alemu, Dereje Abera, Alemayehu Adugna and Terefe M. 2014. Adaptation Study of Improved
Kabuli Chickpea (Cicer Arietinum L.) Varieties at Kellem-Wollega Zone. J.o f Nat.Sci.Corp M „ S. Machado D., Ball R„ Similey S. Petrie M. Siemens and Guy, 2004. Chickpea Production
Guide. Oregon State University Extension Service pp 1-14.CSA (Central Statistical Agency). 2014/15. Federal Democratic Republic Of Ethiopia, Agricultural
Sample Survey, Volume I, Report on Area and Production of Major Crops. Statistical Bulletin 532, Addis Ababa, Ethiopia 12 p.
Gomez, K..A. and Gomez, A.A. 1984. Statistical Procedures for Agricultural Research, 2mledition, John Wiley and Sons, New York, p.680.
Katerji N.,Van Hoorn JW , Hamdy A, Mastrorilli M. Owies T, and MalhotraRs, 2001. Response to soil salinity of chickpea varieties differing in drought tolerance. Agricultural water mange,50:83-96.
Muehlbauer F.J. and Tullu A., 1997.Cicer arietinumL.New Crop Fact SHEET.Center for New Crops &Plant Products, Purdue University.
Yasin Goa and Mathewos Ashamo. 2016. Yield Performance and Adaptation of Desi Chick Pea Varieties in Selected Districts of Wolayta and Hadiva Zones of South Ethiopia. International Journal of Research - Granthaalayah, 4 (3): 33-41.
Yasin Goa, Demelash Bassa, Genene Gezahagn and Mekasha Chichaybelew, 2017. Farmers Participatory Evaluation of Chickpea Varieties in MirabBadwacho and Damot Fullasa Districts of Southern Ethiopia. Hydrology Current Research, 8: 264 doi: 10.4172/2157- 7587.1000264.
Adaptation of Fenugreek ( Trigonella foenum-graecum L.)Varieties at Midlands of Guji Zone, Southern Oromia
Solomon Teshome', Arega Amdie2, Tekile Bobo’ and Bariso Wako1 Oromia Agricultural Research Institute, Bore Agricultural Research Center, Ethiopia
AbstractIntroduction of improved fenugreek varieties can boost the yield level in the study area . The experiment was conducted at mid lands of Guji during main season of 2016 cropping season with objective to select adaptable, high yielder and disease resistant fenugreek varieties with good agronomic traits. The trial consists of o f local check and three improved varieties namely Hunda'ol. Ebbisa and Chala. The experiment was laid out in a completely randomized block design with three replications. Days to 50% emergence, flowering, maturity, plant height, number o f pods per plant, 1000 seed weight and total seed yield per hectare were recorded. Analysis of variance showed that significant difference among studied varieties for plant height, thousand seed weight and total seed yield. Local check was the best followed by one improved variety• (Chala) with grain yield of 1750.1 kg ha'1 and 1570.2 kg ha'1, respectively. The result of this study indicated that there is a need of collecting fenugreek landraces from the study area for future breeding activity.
Key words: Adaptation trial, Fenugreek, Improved varieties
25

Oromia Agricultural Research Institute ClQQOj. Crop research Proceeding 2017
IntroductionFenugreek (Trigonella foenum greecum L.) is an important self-pollinated seed spice crop belonging to subfamily Papilionaceae of the family Fabaceae (Suleiman et a l., 2008). ft is native of south Eastern Europe and West Asia and has been part of North African Countries. Argentina, France, Morocco, and Lebanon. Plants are used medicinally in different countries and are a source of many potent and powerful drugs. Fenugreek seed contains protein (9.5%), fat (10%), crude fiber (18.5%), carbohydrate (42.3%) and many other minor nutrients and v itamins. This plant decrease body fats and effective on obesity. The yields can be significant increase in quantity and quality through the suitable management of cultivation, irrigation and harvesting. In this context, fenugreek (Trigonella foenum graecum L.), an annual legume, is extensively cultivated in most regions of the world for its medicinal value (Petropou)os, 2002).Fenugreek can be a very useful legume crop for incorporation into short-term rotation and for hay and silage for livestock feed, for fixation of nitrogen in soil and its fertility, and etc (Sadeghzadeh-Ahari et al., 2009). Fenugreek seeds have been known and valued as medicinal material from very early times. Fenugreek as a chemurgic crop has a wide use for industrial purposes. Its seeds are considered to be of commercial interest as a source of a steroid diosgenin, which is of importance to the pharmaceutical industry (Mehrafarin et al., 2010).The yield potential of fenugreek can be defined as the total biomass produced or agricultural important pan of the crop. The total biomass is a result of the integration of metabolic reactions in the plant. Consequently, any factor influencing the metabolic activity of the plant at any period of its growth can affect the yield (Ahmed et al.. 2010). Metabolic processes of fenugreek plants are greatly governed by both internal, i.e. genetic makeup of the plant and external conditions, which involve two main factors namely climatic and edaphic environmental factors. The yield potential of fenugreek could be regulated through alternation of genetic makeup and reconstitution of genetic structure through breeding programs and/or by modifications of environment through cultural treatments (Ahmed et al., 2010; Basu et al., 2009).Introduction of high yielding varieties can boost the yield levels in the adopted areas. Improved fenugreek cultivars are not yet sufficiently put under production and most of the areas in the Guji zone.To overcome absence of improved variety and management practices introduction and adaptation studies of high yielding varieties with all agronomic management practices are very critical. This experiment was conducted with the objective of selecting and recommending the best high yielding variety for the study area.Material and MethodsThe study was conducted at mid lands of Guji zone during 2016 cropping season at Adola district on three sites. The experimental area is situated average|\ at an altitude of 1768 meters above sea level and is located 469 km south of Addis Ababa along the Hawassa road. The area is averagely characterized by a mean annual rainfall of 978 mm. The main rainy season is from May to October. The average annual maximum and minimum temperature is 22.2 C ° and 10.26 C°, respectively.The trial consists of local check and three improved varieties (Hunda ol, Ebbisa and Chala). The seed source is from Sinana Agricultural Research Center (Hunda'ol and Ebisa) and Debre Zeiyt Agricultural Research Center (Chala). The experiment was laid out in a completely randomized block design with three replications. Gross plot size was 2.2m accommodating a minimum of 5 harvestable rows. Days to 50% emergence, flowering, maturity, plant height (cm), number of pods per plant, thousand seed weight and total seed yield per hectare was recorded.Data were subjected to analysis of variance (ANOVA) using the General Linear Model of the SAS statistical package (SAS, 2003) Version 9.1.3. All significant pairs of treatment means were compared using the LSD at 5% level of significance.
26
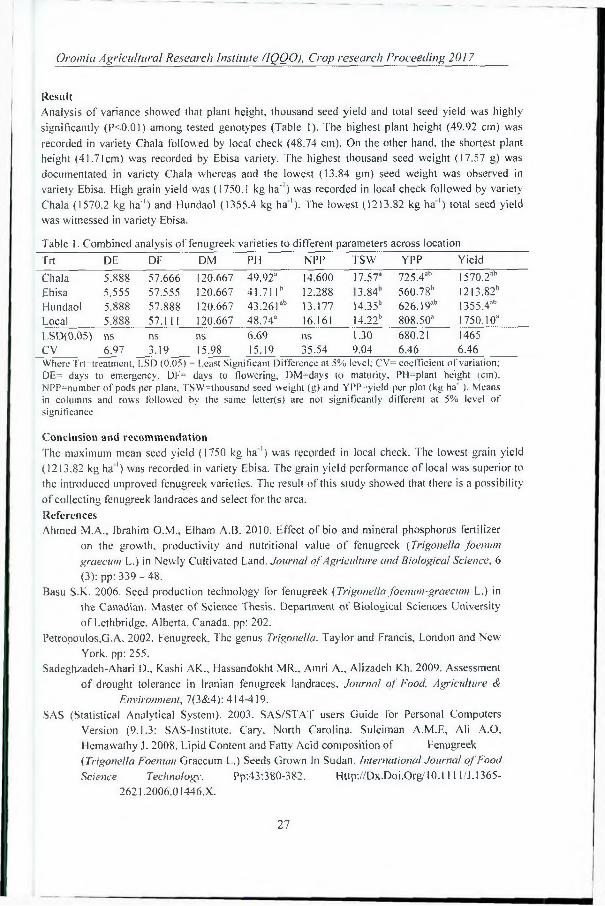
Oromia Agricultural Research Institute (IQQO), Crop research Proceeding 2017
ResultAnalysis of variance showed that plant height, thousand seed yield and total seed yield was highly significantly (P<0.01) among tested genotypes (Table 1). The highest plant height (49.92 cm) was recorded in variety Chala followed by local check (48.74 cm). On the other hand, the shortest plant height (41.71 cm) was recorded by Ebisa variety. The highest thousand seed weight (17.57 g) was documentated in variety Chala whereas and the lowest (13.84 gm) seed weight was observed in variety Ebisa. High grain yield was (1750.1 kg ha'1) was recorded in local check followed by variety Chala (1570.2 kg ha'1) and Hundaol (1355.4 kg ha1). The lowest (1213.82 kg ha1) total seed yield was witnessed in variety Ebisa.
Table 1. Combined analysis of fenugreek varieties to different parameters across locationTrt DE DF DM PH NPP TSW YPP YieldChala 5.888 57.666 120.667 49.92“ 14.600 17.57a 725.4ab 1570.2abEbisa 5.555 57.555 120.667 41.71 lh 12.288 Lk> bo 4 560.78b 1213.82bHundaol 5.888 57.888 120.667 43.261* 13.177 14.35b 626.19ab 1355.4abLocal 5.888 57.111 120.667 48.74a 16.161 14.22b 808.50a 1750.10aLSD(0.05) ns ns ns 6.69 ns 1.30 680.21 1465CV 6.97 3.19 15.98 15.19 35.54 9.04 6.46 6.46Where Trt=treatment, LSD (0.05) = Least Significant Difference at 5% level; CV= coefficient of variation;DE= days to emergency, DF= days to flowering, DM=days to maturity, PH=plant height (cm), NPP=number of pods per plant, TSW=thousand seed weight (g) and YPP=yield per plot (kg ha1). Means in columns and rows followed by the same letters) are not significantly different at 5% level of significance
Conclusion and recommendationThe maximum mean seed yield (1750 kg ha1) was recorded in local check. The lowest grain yield (1213.82 kg ha1) was recorded in variety Ebisa. The grain yield performance of local was superior to the introduced unproved fenugreek varieties. The result of this study showed that there is a possibility of collecting fenugreek landraces and select for the area.ReferencesAhmed M.A., Ibrahim O.M., Elham A.B. 2010. Effect of bio and mineral phosphorus fertilizer
on the growth, productivity and nutritional value of fenugreek (Trigonella foemun graecum L.) in Newly Cultivated Land. Journal of Agriculture and Biological Science, 6 (3): pp: 339-48.
Basu S.K. 2006. Seed production technology for fenugreek (Trigonella foenum-graecum L.) in the Canadian. Master of Science Thesis. Department of Biological Sciences University of Lethbridge, Alberta, Canada, pp; 202.
Petropoulos,G.A. 2002. Fenugreek, The genus Trigonella. Taylor and Francis, London and New York, pp: 255.
Sadeghzadeh-Ahari D., Kashi AK., Hassandokht MR., Amri A., Alizadeh Kh. 2009. Assessment of drought tolerance in Iranian fenugreek landraces. Journal of Food. Agriculture &
Environment, 7(3&4): 414-419.SAS (Statistical Analytical System). 2003. SAS/STAT users Guide for Personal Computers
Version (9.1.3; SAS-lnstitute. Cary, North Carolina. Suleiman A.M.E, Ali A.O, Hemawathy J. 2008. Lipid Content and Fatty Acid composition of Fenugreek (Trigonella Foenum Graecum L.) Seeds Grown In Sudan. International Journal of Food Science Technology’. Pp;43;380-382. Http;//Dx.Doi.Org/l0.l U l/J.1365-
2621.2006.01446.X.
27

Oromia Agricultural Research Institute (IQQO), Crop research Proceeding 2017
Advanced Screening of Bread Wheat Genotypes against Major Wheat Diseases in Bale Tamene Mideksa1* and Wubishet Alemu'
* 'Oromia Agricultural Research Institute, Sinana Agricultural Research Center, P.O.BOX, 208,Bale-Robe. Ethiopia
Corresponding author: gutamesaidlgmail.comAbstractWheat rust diseases caused by Puccinia spp are important diseases of wheat worldwide. One hundred seventy three (173) bread wheat genotypes were screened against stripe and stem rusts caused by Puccinia striiformis f.sp. tritici and Puccinia graminis f.sp. tritici respectively under natural condition. The experiment was conducted during 2016 main cropping season at Sinana Agricultural Research Center. Each genotype was sown in two row of 20 cm spacing, I m long and 20 cm distance between plots in augmented design. One genotype was found immune against stripe rust namely ETBW8900 whereas sixty-six bread wheat genotypes were found immune against stem rust. One genotype was found resistant to stripe rust namely ETBW8715 while one genotype was found resistant against stem rust namely ETBW8885. Forty-five genotypes were found moderately resistant against stripe rust whereas twenty-four genotypes were found moderately resistant to stem rust. Sixteen genotypes were found moderately susceptible to stripe rust while thirty-hvo genotypes were found moderately susceptible against stem rust. One hundred ten genotypes were rated as susceptible against stripe rust whereas fifty genotypes were found susceptible against stem rust. Thirty-eight best performed bread wheat genotypes were selected based on their disease reaction and promoted to the next breeding program for further evaluation.
Keywords: Wheat, Yellow rust, Stem rust, resistant genotype IntroductionWheat is one of the most important widely cultivated cereal crops in Ethiopia. It is cultivated both in bi-modal and uni-modal rain fall areas although it occupies large hectares of cultivated land in the latter rain fall agro ecology.lt ranks fourth in area coverage next to teff, maize and sorghum, respectively (CSA, 2014). Several multifaceted biotic diseases fungal, viruses, bacteria, nematodes pathogens were recorded on wheat in Ethiopia. Among wheat diseases recorded in wheat in Ethiopia, yellow rust, stem rust, Jeaf rust, septoria leaf blotch and fusarium head blight are significantly threatening wheat production in most of wheat producing agro ecologies (Bekele, 2003). Leaf rust is widely distributed in Ethiopia but is most important in some wheat belt areas such Gololcha, Ginnir, and Madda walabu districts in Bale where bread wheat is a dominant crop. Studies conducted on these diseases revealed that the yield losses due to yellow rust, stem rust, leaf rust and septoria are as high as 20-71%, 42-52%, 75 and 82%, respectively, depending on resistance backgrounds of varieties (Bekele, 2003, Dereje, 2003, Eshetu, 1985; Ayele and Wondimu, 1992).The major management method of these diseases is the use of resistant varieties. Efforts made towards resistant variety development to major wheat disease were successful. However, because of rusts pathogens evolution and challenges from new races evolved, resistance screening program become a routine work in wheat improving program in Ethiopia. Breeding for resistance or tolerance to wheat diseases pathogens is one of the most effective ways to reduce crop losses in Ethiopia. However, wheat pathogens can move to a new region and adapt to the resistance traits deployed in modern wheat varieties due to new races evolution .'This results in the emergence of pathogens, which can result in significant losses of wheat production. For example, w heat yellow rust and stem rusts are constantly changing and adapting to the Yr and Sr genes present in the commonly grown varieties that were once resistant to prevalent races in Ethiopia. Wheat diseases are usually best managed by combining the multiple diseases resistance sources staked into one variety rather than single resistance in one variety. To understand how germplasm will react to one or multiple wheat diseases in Ethiopia and stake resistance genes in one variety, it will be necessary to evaluate the available germplasm for
28

Oromia Agricultural Research Institute flOOO), Crop research Proceeding 2017
their resistance to diseases in regular basis. The present study was initiated with the following objectives:To screen bread wheat genotypes for their resistance to major diseases of wheatTo broaden the genetic base of bread genotypes and advance the selected materials for further testMaterials and MethodsThe experiment was conducted at experimental station of Sinana Agricultural Research Center during 2016 main cropping season. 173 CIMMYT materials were obtained from Kulumsa Agricultural Research Center. Each genotypes/lines was sown in two row of 20 cm spacing, 1 in long and 20 cm distance between plots in augmented design. Check cultivars; Digalu, Alidoro, Enkoy, K6295-4A, KBG-01, Kubsa, Madda walabu, Meraro, Millennium, Morocco and PBW-343 were planted at 10 entries interval for comparison. To enhance natural epidemics Morocco and PBW-343 was planted between blocks perpendicular within genotypes. Recommended seed rate 150 kg ha' 1 and fertilizer rate 41/46 N/P2O5 was used at planting. Land preparation and weeding was done manually as recommended for wheat. Disease severity was recorded by estimating the approximate percentage of leaf area affected (modified Cobb scale) (Peterson et al., 1948) on plot bases.Results and DiscussionThe use of resistant variety is considered to be the best options for the management of diseases. Screening available genotypes is better for the search of source of resistant in wheat against wheat rust diseases caused by Puccinia spp. As indicated in table 1 out of 173 genotypes, one genotype was found immune against stripe rust, namely ETBW 8900. Sixty-six genotypes were found immuneagainst stem rust. Genotype (ETBW8715) was found resistant to stripe rust while genotype(ETBW8885) was found resistant against stem rust. Forty-five genotypes were found moderately resistant against stripe rust whereas twenty-four genotypes were also moderately resistant to stem rust. Some of these were ETBW8557, ETBW8734, ETBW8556. ETBW8558, ETBW8559, ETBW8572, ETBW8818 and ETBW8827. Sixteen genotypes were found moderately susceptible against stripe rust while thirty-two genotypes were found moderately susceptible against stem rust. One hundred ten genotypes were found susceptible against stripe rust whereas fifty genotypes were found susceptible to stem rust. This study revealed that 173 genotypes of wheat have shown different level ofsusceptibility and resistance to stripe rust and stem rust. Concurrent with the present findings, it hasbeen reported by Peterson et al (1948) less than 10% (10 MS) stripe rust infection has been reported as the highest resistance and less than 5% (5 MS) is the effective resistance of the wheat variety/line/germplasm.So, this study helps in selecting genotypes to avoid the crops from getting affected by pathogen.Conclusion and RecommendedScreening available bread wheat genotypes is the better for the search of source of resistant against wheat rusts. Out of 173 bread wheat genotypes screened against stripe rust and stem rust, 38 best performed bread wheat genotypes were selected based on their disease reaction and other some agronomic parameters. The selected genotypes will be promoted to the next breeding program for further evaluation.AcknowledgementsThe study was funded by Oromia Agricultural Research Institute. Cereal crops research case team members of Sinana Agricultural Research Center contributed technical and professional assistances for the completion of this work.
29

Oromia Agricultural Research Institute (1QQ0). Crop research Proceeding 2017
ReferencesAyele. B. and Wondimu,B .1992. The importance of stripe rust in the major bread wheat producing
regions of Ethiopia in 1988-90. In: The 7"' Regional Wheat Workshop for Eastern, Central and Southern Africa. Nakuru, Kenya. September 16-19, 1991. CIMMYT. Tanner, D. G. and Mwangi, W. (eds.). pp. 196-202.
Bekeie Hundie. 2003. Short report on yellow rust and stem rust. In: Bedada Girma (ed.). Bale Agricultural Development Enterprise: Proceedings of the Agronomy Workshop. March 20-21. Melkassa, Ethiopia.pp.67-78.
CSA (Central Statistical Authority). 2014. Agricultural survey sample. Report on area and production of crops (private peasant holding, meher season). Statistical Bulletin No 278.Addis Ababa, Ethiopia.
Dereje Hailu, 2003. Effects of Yellow Rust (Puccinia striiformis) on Yield, Yield Components and Quality of Improved Bread Wheat ( Triticum aestivum L.) Varieties (Published M.Sc. Thesis). Alemaya University, Haramaya, Ethiopia.
Eshetu Bekeie. 1985. Review of research on diseases of barley, teff and wheat in Ethiopia, pp 79-108. In: Tsedeke Abate (ed.). A Review of Crop Protection Research in Ethiopia. Proceedings of the First Crop Protection Symposium. Addis Ababa, Ethiopia.
Peterson, R.F., A.B. Campbell and A.E. Hannah. 1948. A diagrammatic scale for estimating rust severity on leaves and stress of cereals. Can. J. Bot. Sci., 26: 496.
Genotype x Environment Interaction and Yield Stability of Improved Rice Varieties(0rvza saliva L.) Tested Over Locations at Western Oromia
‘*Girma Chemeda, 'Gudeta Bedada and 'Girma Mengistu Bako Agricultural Research Center. P.O.Box 3. Bako, Ethiopia
2Oromia Agricultural Research Institute, Finfme Corresponding authore: [email protected]
AbstractEleven rice genotypes were evaluated at 6 environments in Western Ethiopia during 2015 and 2016 main cropping season. The objective of the study nas to determine the magnitude of genotype x environment interaction and performance stability of rice genotypes. The study was conducted using a randomized complete design with 3 replications. Genotype x environment interaction and yield stability were estimated using the additive main effects and multiplicative interaction and site regression genotype plus genotype x environment. Interaction bi plot pooled analysis o f variance for grain yield showed significant (P<0.01 and P<0.05) differences among genotypes, environment, genotype x environment interaction effects. This indicates that genotypes differentially respond to the change in test environments or the test environments differentially discriminated the genotypes or both. Environment accounted for 69.39%. of the total yield variation, genotype for 8.50% and genotype x environment for 3.90%, indicating the need for spatial and temporal replication o f the trials. Regression and AMMI analysis were employed in order to determine the stability of genotypes. The two models regression analysis and AMMI revealed similar result in that variety Adet and Hidassie were stable and widely adapted genotypes. Adet and Hidassie varieties were the most stable and high yielding variety and were therefore recommended for commercial production in the western Ethiopia upland rice growing areas.
Keywords. Rice, genotype x environment interaction, stability parameters, yield
IntroductionMore than half of the world's population depends on rice for its major daily source of food energy and protein and thus the importance of rice in relation to food security and socio-economic stability is self-evident (FAO, 2003). Rice is the fastest growing source of food in Africa. During the past three
30

Oromia Agricultural Research Institute (IOOO), Crop research Proceeding 2017
decades rice grain has seen a steady increase in consumption and demand given its important place in the strategic food security planning policies of many African countries (Norman and Otoo, 2003; Africa Rice Center, 2007; Forum for Agricultural Research in Africa, 2009). Rice is proven to be one of the potential strategic commodity crops that can assure food security and poverty reduction in Ethiopia (Seyum and Gebrekidan, 2005; Gebrekidan and Seyoum, 2006; Zenna et al., 2008). Moreover, rice could also be considered as one of the best and cheapest alternative technology available to small-scale farmers for improving productivity of grain yields in Hooded and swampy environments through efficient utilization of land and water ( Gebrekidan and Seyoum, 2006).The recent surge in demand triggered by soaring import price, consumer preference in urban areas, population growth and rapid urbanization forced the country to expand small-scale and commercial rice production in various agro-ecologies (Zenna et al., 2008). As a result of which, rice production is escalating rapidly from year to year (Gebrekidan and Seyoum, 2006; Aredo el al., 2008; Zenna et al.,2008). Nevertheless, the challenges facing the successful development of the rice sector are huge and includes: lack of adequate rice milling facilities, lack of improved varieties and recommended crop management practices for different rice ecosystems, and biotic and a biotic stresses; low agricultural inputs (fertilizer, improved rice varieties seed, agro-chemicals...etc), poor mechanization and lack of adequate human resource in the value chain (MoARP, 2010).Western Oromia is one of the potential areas where rice is recently introduced and being produced mainly in rain fed upland ecology. However, improved rice varieties and development out puts are very limited in the area to satisfy the growing demand of large and small-scale farmers for improved rice varieties. Grain yield depends on genotype, environment and management practices and their interaction with each other (Messina et a/., 2009). Under the same management conditions, variation in grain yield is principally explained by the effects of genotype and environment (Dingkuhn et a/.,2006). Information of genotype * environment interaction leads to successful evaluation of stable genotype, which could be used for general cultivation.The level of performance of any character is a result of the genotype (G) of the cultivar, the environment in which it is grown (E), and the interaction between G and E (GEI). Interaction between these two explanatory variables gives insight for identifying genotype suitable for specific environments. The environmental effect is typically a large contributor to total variation (Blanche et al., 2009). Moreover, G x E interactions greatly affect the phenotype of a variety, so the stability analysis is required to characterize the performance of varieties in different environments, to help plant breeders in selecting desirable varieties. Mosavi (2013) observed significant yield differences among vice genotypes, environment and genotype by environment interaction. Therefore, the major objective of present study was to evaluate and select high yielding improved rice varieties for upland ecology of western Oromia.Materials and methodsEleven rice varieties including standard check {Chewaka) were tested at three locations, Bako, Chewaka, Like and Guttin for two cropping seasons (2015-2016). Genotypes were planted in a completely randomized block design with three replications in which each plot comprises of six rows having 5 m length. The spacing between rows was 20 cm and the seeds were drilled in rows. Recommended fertilizer rate at 100 kg P20< 100 and UREA per hectare ha' 1 was used. UREA was applied at split half at planting and half at panicale initiation.Management practices were done according to the recommendations for the particular crop and/or location. The middle 4 rows were harvested and the grain yield was adjusted to 14% seed moisture content before data processing for analysis. Grain yield analysis was carried out using regression
31

Oromia Agricultural Research Institute (IQQO), Crop research Proceeding 2017
(Eberhart and Russell, 1966) and AMMI models in Agrobase software (Agrobase, 2000). The linear model proposed by Eberhart and Russell (1966) is:Yij — (ii+bjlj +S2dijwhere Yij is the mean performance of the ith variety (J = 1,2, 3..., n) in the jth environment; is the
mean of the ilh variety over all the environments; bi is the regression coefficient which measures the response of i'h variety to varying environments; S2dij is the deviation from regression of ith variety in the j11' environment and Ij is the environmental index of the j ,h environment. Similarly, the AMMI model (Gauch and Zobel, 1996) is:
Tv/
J ^ = A* + + /%, -i- ^ 2 A n Y ^ S m -+-n- 1
where Yger is the observed yield of genotype g in environment e for replication r; Additive parameters: is the grand mean; ag the deviation of genotype g from the grand mean and (3C is the deviation of environment e; the multiplicative parameters:^ is the singular value for interaction principal component axis (IPCA) n,Yg„ is the genotype eigenvector for axis n, and Se(1 is the environment eigenvector; pgc PCA residuals (noise portion) and is error term.Table l.Discription of tested rice varieties
No Variety Year of Rain fall Ecosystem Days to Yield (ton ha'1)name Release (mm) maturity On-farm On-station
1 Adet 2014 800-1400 Upland 112-120 2.4 4.22 NERICA 13 2014 650-800 Upland 104 3.3 3.83 Getachew 2007 800-1400 Upland 97-125 2.1 3.04 Andassa 2007 800-1400 Upland 111-135 2.5 3.85 Chewaqa 2013 800-1200 Upland 160 3.3 4.26 Hidassie 2012 800-1400 Upland 100-130 2.2-3.2 3.0-4.27 Tana 2007 800-1400 Upland 109-135 2.4 4.48 NERICA-2 2007 Intermittent
IrrigationIrrigatedupland
80-90 3.5 5.5
9 NERICA-4 2006 800-1400 Upland 110 3.0 4.810 Tana 2007 800-1400 Upland 109-135 2.4 4.411 SUPERICA-1 2006 800-1400 Upland 115 2.3 5.1
Results and DiscussionCombined analysis of variance: Genotype (G). environment (E ) and genotype * environment interaction (G EI) were highly significant (P<0.01) for grain yield (Table I). The factors explained rice grain yield was affected by genotype (69.39%), environment (8.50%) and iheir interaction (3.90%). In general, a wide genetic diversity for maximum traits existed in the rice materials used in this study and this may be due to their diverse origins. The effects of G and E showed highly significant mean square (MS) for maximum traits reflected genotypic differences towards adaptation to different environments.Thus the highly significant G * E effects suggest that the genotypes may be selected for adaptation to specific environments. This is in harmony with the findings of Aina et a l., (2009) and Xufei-fei et al., (2014) in G x E interaction effects of cassava genotypes. The significant genotype x environment interaction effects demonstrated that genotypes responded differently to the variation in environmental conditions of locations. This is indicative of the necessity of testing rice varieties at multiple locations. This also attests to the difficulties encountered by breeders in selecting new varieties for release. The large sum of squares for genotypes indicated that the genotypes were diverse, with large differences among genotypic means causing most of the variation in grain yield,
32
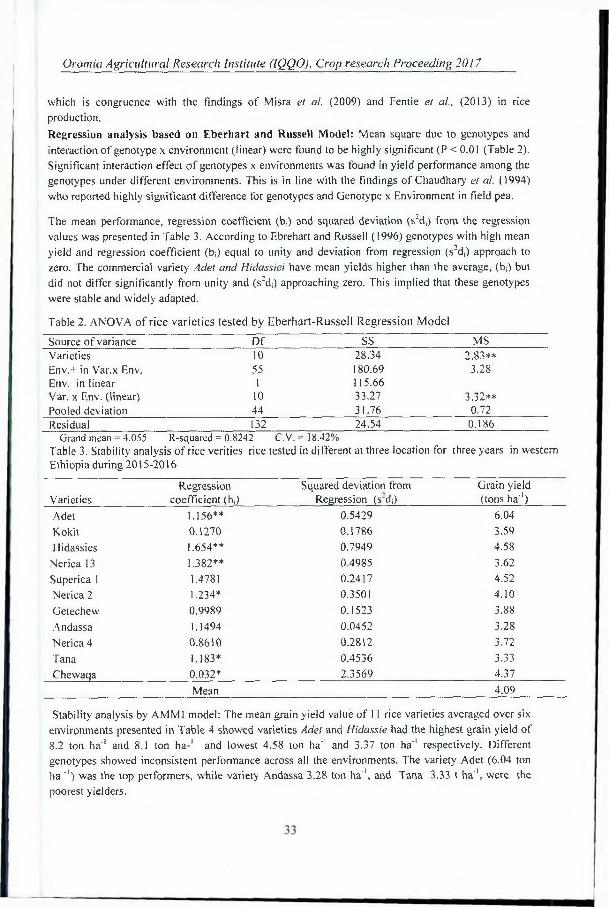
Oromia Agricultural Research Institute (IQQO), Crop research Proceeding 2017
which is congruence with the findings of Misra et al. (2009) and Fentie et al., (2013) in rice production.Regression analysis based on Eberhart and Russell Model: Mean square due to genotypes and interaction of genotype x environment (linear) were found to be highly significant (P < 0.01 (Table 2). Significant interaction effect of genotypes x environments was found in yield performance among the genotypes under different environments. This is in line with the findings of Chaudhary et al. (1994) who reported highly significant difference for genotypes and Genotype x Environment in field pea.
The mean performance, regression coefficient (bj) and squared deviation (s2d,) from the regression values was presented in Table 3. According to Ebrehart and Russell (1996) genotypes with high mean yield and regression coefficient (bi) equal to unity and deviation from regression (s2dj) approach to zero. The commercial variety Adet and Hidassiei have mean yields higher than the average, (bj) but did not differ significantly from unity and (s2d;) approaching zero. This implied that these genotypes were stable and widely adapted.
Table 2. ANOVA of rice varieties tested by Eberhart-Russell Regression ModelSource of variance Df SS MSVarieties 10 28.34 2.83**Env.+ in Var.x Env. 55 180.69 3.28Env. in linear 1 115.66Var. x Env. (linear) 10 33.27 3.32**Pooled deviation 44 31.76 0.72Residual 132 24.54 0.186
Grand mean = 4.055 R-squared = 0.8242 C.V.= 18.42%Table 3. Stability analysis of rice verities rice tested in different at three location for three years in westernEthiopia during 2015-2016
Regression Squared deviation from Grain yieldVarieties coefficient (bj) Regression (s'di) (tons ha'1)Adet 1.156** 0.5429 6.04Kokit 0.1270 0.1786 3.59Hidassies 1.654** 0.7949 4.58Nerica 13 1.382** 0.4985 3.62Superica 1 1.4781 0.2417 4.52Nerica 2 1.234* 0.3501 4.10Getechew 0.9989 0.1523 3.88Andassa 1.1494 0.0452 3.28Nerica 4 0.8610 0.2812 3.72Tana 1.183* 0.4536 3.33Chewaqa 0.032* 2.3569 4.37
Mean 4.09
Stability analysis by AMM1 model: The mean grain yield value of 11 rice varieties averaged over six environments presented in Table 4 showed varieties Adet and Hidassie had the highest grain yield of 8.2 ton ha'1 and 8.1 ton ha-1 and lowest 4.58 ton ha' 1 and 3.37 ton ha'1 respectively. Different genotypes showed inconsistent performance across all the environments. The variety Adet (6.04 ton ha ■') was the top performers, while variety Andassa 3.28 ton ha'1, and Tana 3.33 t ha'1, were the poorest yielders.

Oromia Agricultural Research Institute (IQQOi. Crop research Proceeding 2017
Table 4: Grain yield of rice varieties over location and year at western Oromia
2015/16 2016/17Varieties Uke Chewaqa Bako Bako Uke Guttin Meam Rank
I Adet 6.89 8.23 4.96 6.07 5.52 4.58 6.04 12 Kokit 3.50 3.22 4.00 4.31 3.85 2.66 3.59 83 Hidassies 6.61 8.10 3.37 1.14 4.55 3.69 4.58 24 Nerica 13 4.29 7.32 3.82 2.37 2.36 1.58 3.62 95 Superica 1 6.21 7.73 3.50 1.62 4.48 3.58 4.52 36 Nerica 2 5.30 7.31 3.63 2.04 3.61 2.74 4.10 57 Getechew 4.98 6.35 3.40 2.09 3.70 2.75 3.88 68 Andassa 4.67 5.57 2.68 1.18 3.24 2.31 3.28 119 Nerica 4 4.18 6.35 3.61 2.76 3.20 2.23 3.72 7
10 Tana 4.75 5.67 2.48 1.05 3.52 2.54 3.33 1011 Chewaqa 3.59 4.98 5.69 6.07 3.45 2.42 4.37 4
Mean 5.00 6.44 3.74 2.79 3.77 2.82 4.09Table 5: Partitioning of the explained rice variety
mean square (MS) from AMMI analysis for seed yield tested
Source Df MS Genotype x Environment interactionTotal 197Environments 5 69.393**Reps within Env. 12 1.146 IGenotype 10 8.503* IGenotype x Env. 50 3.902** IIPCA 1 14 10.245** 73.52IPCA 2 12 1.901** 11.69Residual 120 0.499
AMMI biplot display:Among the varieties Adet and Hidassie were generally exhibited high yield with high main (additive) effects showing positive (PCA1 score, but variety Adet being the overall best. Hence, variety Adet was identified as specially adapted to the environments of Uke and Chewaka and these two environments were considered as the wide range suitable environments for this variety.ConclusionsThe present study revealed that rice variety yield were liable to a significant fluctuation with changes in the growing environments. G x E interaction effect being almost eight times higher than that of genotype effect. This study clearly demonstrated that the regression and AMMI analyses models were found to be effective for determining the magnitude and pattern of G x E interaction effect in the rice genotypes. From the regression and AMMI analyses, therefore, Adet and Hidassie varieties were the most stable and high yielding genotype and as a result, these were recommended for commercial use for the western Ethiopia upland rice growing areas.
AcknowledgementOromia Institute of Agricultural Research (OAR1) is dully acknowledged for financial support. Further, all research and supportive staff of Bako Research Centers are dully acknowledged for handling the experiment.ReferencesAfrica Rice Center, 2007. Africa rice trend: Overview of recent developments in Sub-Saharan Africa
rice sector. Africa rice Center, Cotonou, Benin, pp: 10,http://www.africarice.org/publications/Rice%20Trend%2023-10-07
34

Oromia Agricultural Research Institute (IQQO), Crop research Proceeding 2017
Agrobase. 2000. Agrobase User’s Guide and Reference Manual. Agronomix Software Inc.. Canada.Aina, O O, A G O Dixon, Ilona Paul and E A Akinrinde. 2009. G » E interaction effects on yield and
yield components of cassava (landraces and improved) genotypes in the savanna regions of Nigeria. African J of Biotech.vol.8 (19), pp.4933-4945.
Aredo, D., W. Tsegaye and R. La Rovere, 2008. Adoption of rice in three sites of SG-2000: Results of rapid appraisal of rice technologies promoted by SG 2000. Nippon IA Research Report No. 6.
Blanche, S B, H S Utomo, I Wenefrida, G O Myers. 2009. Genotype * environment interactions of hybrid and varietal rice cultivers for grain yield and milling quality. Crop Science 49, 201 I - 2018.
Dingkuhn, M, D Luquet, H Kim, L. Tambour, A Clement-Vidal. 2006. Ecomeristem, a model of morphogenesis and competition among sinks in rice.2. Simulating genotype responses to phosphorus deficiency. Functional Plant Biology 33, 325-337.
Eberhart, S.A. and Russell, W.A. 1966. Stability parameters for comparing varieties. Crop Science 6: 36-40.
FAO., 2003. Sustainable rice production for food security. Proceedings of the 20th Session of the International Rice Commission, July 23-26, 2002, Bangkok, Thailand.
Fentie. M, A Assefa and K Belete. 2013. AMMI analysis of yield performance and stability of finger millet genotypes across different environments. World J of Agric. Sci. 9:23 1-237.
Gauch. H.G. and Zobel. R.W. 1996. AMMI analyses of yield trials. In: Kang, M.S. and Gauch, H.G. (eds.). Genotype by Environment Interaction. CRC, Boca Raton, Florida, pp. 85-122.
Gebrekidan, H. and M. Seyoum, 2006. Effects of mineral n and p fertilizers on yield and yield components of Hooded lowland rice on vertisols of fogera plain, Ethiopia. J. Agric. Rural Dev. Trop. Subtrop., 107: 161-176.
Messina, C, G Hammer. Z Dong, D Podlich, M Cooper. 2009. Modelling crop improvement in a GxExM framework via gene-trait-phenotvpe relationships. In: Sadras, V.O., Calderini, D. (Eds.), Crop physiology: Applications for Genetic Improvement and Agronomy. Elsevier, Netherlands, 235-265 p.
Ministry of Agriculture and Rural Development (MoARD).20l0. National Rice Research and Development Strategy of Ethiopia. The Federal Democratic Republic of Ethiopia. Ministry of Agriculture and Rural Development, Addis Ababa, Ethiopia.
Misra, R C, S Das and M C Patnaik. 2009. AMMI model analysis of stability and adaptability of late duration finger millet (Elens ine coracana) genotypes. World Appl. Sci. J. 6:1650-1654.
Mosavi, A A, N B Jelodar, K Kazemitabar.2013. Environmental responses and stability analysis for grain yield of some rice genotypes. World Applied Sciences Journal 21(1), 105-108.
Norman, J.C. and E. Otoo, 2003. Rice development strategy for food security in Africa. Proceedingsof the 20th Session of the International Rice Commission on Sustainable Rice Production forFood Security, July 23-26. 2002, Bangkok, Thailand
XuFei-fei, TANG Fu-fu, SHAO Ya-fang, CHEN Ya-ling, TONG Chuan, BAO Jing- song.2014.Genotype x environment Interaction for agronomic traits of rice revealed by association mapping. Rice Sci. 21 (3): 133-141.
Zenna, N.S., Z. Gebre-Tsadik and T. Berhe, 2008. Moving up in Ethiopia. Rice Today,http://irri.org/knowledge/publications/rice-today/features/features-africa/moving-up-in- ethiopia.
Zenna, N.S., Z. Gebre-Tsadik and T. Berhe, 2008. Moving up in Ethiopia. Rice Today,http://irri.org/knowledge/publications/rice-today/features/features-africa/moving-up-in- ethiopia.
35

Oromia Agricultural Research Institute (IQQO), Crop research Proceeding 2017
Yield Stability and Genotype * Environment Interaction of Large Seed Speckled Common Bean (Phaseolus vulgarisL.) Genotypes at Western Low lands of Oromia
Meseret Tola*, Adane Arega, Chala Debela, Solomon Bekele, Alemayehu Dhabessa and ZerihunAbebe
Bako Agricultural Research Center P.O.box 03, Bako.Oromia, Ethiopia Corresponding author: meserettola342favahoo. corn
AbstractStable yield performance of genotypes is very important in countries like Ethiopia where means to modify environments are limited. However, happening of significant genotype X environment interaction (G EI) complicates selection o f stable genotypes. In western Ethiopia, the yield potential of common bean is underutilized due to inadequate addressing of a ll potential areas and mismatch between selection and production environments. Thus. 17 large speckled common bean genotypes were evaluated at three locations (Bako. Billo and Gule) for two consecutive years to estimate the magnitude of G EI effects and to identify broadly or specifically adapted genotypes during 2015 and 2016 main cropping seasons. The genotypes were arranged in Randomized Complete block Design with three replications.Combined ANOVA, AM M I and GGE bi plot models were used to analyze the data. Both main and interaction effects were highly .significant (P<0.01) and environment, genotype, and G EI explained 49.8%, 25.!% and 20.0% variations, respectively, indicating greater influence of test environments and importance of simultaneous consideration of mean performance and stability. IPCA1 and IPCA2 were highly significant (p < 0.01) and together contributed more than 89.5% variation in the G EI sum of squares. AMMI I bi plot enabled identification of broadly adapted genotypes. G} (DAB-443) and G k, (DAB-364). GGE biplot analysis suggested presence of one megaenvironment and enabled identification of high seed yielding and broadly adapted genotypes (DAB- 449 (G4).
IntroductionCommon bean (Phaseolus vulgaris L.) is the most important grain legume in nearly all lowland and mid-altitude areas of Ethiopia. It is produced primarily by smallholder fanners both for cash and consumption. According to CSA (2016), red common bean was cultivated on 244,049.94 hectare of land and 38049.95 ton was produced with the productivity of 1.5ton ha .In the study zone, the area covered by the crop during 2016 cropping season was 39,469.11 ha and 59788,954 tons was produced with the productivity of 1.51 tons ha'1. Its fastest ripening at the critical food deficit period earlier than othercrops made it an ideal food deficit filler crop. It's suitability for double or triple production per year enabled its production on off season free lands and relatively cheaper labor force. Its reasonable protein content (22%) made it the poor man’s meat securing more than 16.7 million rural people against hidden hunger (Zelekeet al., 2016).In Ethiopia, it is grown suitably in areas with an altitude ranging between 1200 - 2200m above sea level with optimum temperature range of 16 - 28"C and a rainfall of 350-500 mm well distributed over the growing season (Mekbib, 2003). It performs best on deep, friable and well aerated soil with good drainage, reasonably high nutrient content and pH range of 5.8 to 6.5 (Liebenberg, 2002). Particularly, in western Ethiopia common bean is one of the most important cash crops and source of protein for farmers in many lowlands and mid-altitude zones. Apart from being food and a source of income, common bean is also replenishes of soil fertility through biological nitrogen fixation.When genotypes are introduced into new environments, genotype x environment interaction (GEI) is expected and in its presence, selection of superior genotypes based on means averaged over locations is misleading (Ebdon and Gauch, 2002b; Gauch and Zobel, 1997). GEI reflects differences in adaptation and can be exploited by selecting for specific adaptation or minimized by selecting for broad adaptation (Adjei et al., 2010). These objectives can be achieved by grouping environments into mega-environments and then selecting specifically adapted genotypes for each mega
36
Oromia Agricultural Research Institute (1000), Crop research Proceeding 20 / 7
environment or broadly adapted genotypes for wider environments (Zeleke er al, 2016). Multi- location evaluation of genotypes and stability analysis provides useful information for megaenvironment classification and identification of broadly or specifically adapted genotypes (Crossa, 1990). Several statistical analysis have been used for interpretation ofGEl. But currently, AMMI and GGE models are preferred tools for multi-location trials data analysis and which genotype outsmart where pattern discovery (Samonte et al., 2005; Yan et al., 2007;Asfaw et al.. 2009; Namaratu et al.,2009).In western Oromia, there is no or little information on Genotype x Environment interaction and adaptability for large speckeled common bean genotypes. As a result, this study was done to estimate the magnitude of genotype by environment interaction effects and to analyse the stability of genotypes for seed yield performance in western low lands of Oromia.Materials and MethodsSeventeen large speckled common bean genotypes including one standard check were evaluated under rain-fed conditions for two consecutive years (2015-2016) at Bako, Gute and Bilo-boshe. The experimental land was ploughed, disked and harrowed by tractor.The planting was done in mid-June across all locations and randomized complete bock design with three replications was used. Each plot consists six rows of four meter length with spacing of 40cm between rows and 10cm between plants.In organic fertilizer in the form of DAP (18% N and 46% P;Os) was applied at the rate of 100 kg DAP ha'1 during planting time.All other management practices were done as per the recommendations.Multivariate method, Additive Main Effects and Multiplicative Interaction (AMMI) model was used to assess genotype by environment interaction (GEl) pattern AMMI model is expressed as:Yij= u + Gi + E j + CL/.ka.ikyjk) + P„ + etiWhere is the yield of genotype (G) in environment (E) for replicate (r). u is the total yield mean, Gi is the main effect of genotype or the genotype (G) mean deviation (genotype mean minus total yield mean), E, is the main effect of environment or the environment (E) mean deviation, ).k is the singular value for IPCA axis N (N is the number of remain PCA axis in AMMI model: a,*is the genotype (G) eigenvector value for IPCA axis N, ^environment (F.) eigenvector value for IPCA axis. P,j is the is the residual or noise and+ is the error (Gauch. 1992: M. Umma Kulsum et al, 2014). AMMI stability value of the i"' genotype (ASV) was calculated for each genotype and each environment according to the relative contribution of IPCAi to IPCA: to the interaction SS as follows (Purchase et al., 2000):
ASV, =
\I IPCAI. + 11PCA2,
Where, SSipc-ai/SSipca2 is the weight given to the IPCAi value by dividing the IPCA, sum of squares by the IPCAi sum of squares.Based on the rank of mean grain yield of genotypes (RY i) across environments and rank of AMMI stability value (RASVi) a selection index called Genotype Selection Index (GSI) was calculated for each genotype, which incorporates both mean grain yield (RYi) and stability index in single criteria (GSli) as (Purchase, 2000).
G SIi = RASVi + RYiEnvironmental index (Ii) was obtained by the differei e among the mean of each environment and tne general mean. Genotype plus genotype by enviroivnont variation (GGE) was used t:> ns-ess the performance of genotypes in different environments environmental effects ve> ;vnv; cd from the data and results obtained from the data were use; h >e environment and variety scores andthese scores were used to plot the standard principal iponen oi-plots (Yan and Kang, 2003).
37

Oromia Agricultural Research Institute (IQQO). Crop research Proceeding 2017
Analysis of variance was carried out with a statistical analysis system (SAS) version 9.3 software (SAS Institute Inc., 2002). Additive Main Effect and Multiplicative Interaction (AM M I) analysis and GGE bi- plots were performed using Gen Stat 18lh edition statistical package (GenStat, 2016).Results and DiscussionCombined Analysis of Variance for Individual EnvironmentsAnalysis of variance showed statistically significant differences (P<0.01) among genotypes, environments and their interaction for seed yield (Table 1). This indicated the presence of genetic variation among the common bean genotypes and possibility to select high yielding and stable genotypes (s), the environments are variable and the differential response of common bean genotypes across environments. Similar result was reported for common beanand groundnut varieties by Zelekeer al. (2016) and Alemayehu et cd. (2016).Table I. Combined Analysis of variance for seed yield of common bean genotypes evaluated across six environments during 2015 and 2016 main croppingseason.
Source of variation Degree freedom Mean squareEnvironments 5 12668370**Genotypes 16 1993864**Block within environments 2 125429nsInteraction 80 317996**Error 202 30966.00LSD (0.05) 283.30CV (% ) 19.90LSD=Least Significant differences. CV=coefficient of variation. **= significant at P = 0.01, ns = nonsignificant
The mean seed yield of large speckled common bean genotypes across environment (year x location) ranged from 253.7 to 1303.3 kg ha'1. From all genotypes DAB-358 was the lowest yielding (Table 3). The highest grain yield was obtained from genotype DAB-361 followed by DAB-414. The average seed yield across environments ranged from the lowest of 253.7 kg ha 1 for DAB-358 genotype to the highest of 1303.3 kg ha ' for DAB-361 genotype (Table I). This difference could be due to their genetic potential. DAB-472 genotype was the top ranking genotype at two environments (Bako-2015 and Gute-2015). DAB-367 ranked first at Boshe-2015. DAB-361 at Bako-2016 and Gute-2016 (Table 2). The difference in yield rank of varieties across the environments revealed the high crossover type of GxE interaction.
38

Oromia Agricultural Research Institute (IQQO). Crop research Proceeding 2017
Table 2. Mean seed yield and economically important diseases of ofLarge Speckled common bean genotypes grown across six environments in western Oromia ________________________ _
Seed yield (kg ha'1) *CBB (1-9) Scale Anthracnose (1 -9) Scale2015 2016 2015/16 2015/16
Genotype Bako Boshe Gute Bako Boshe Gute Mean Bako Boshe Gute Bako Boshe GuteDAB-446 1565 851 591.3 1180 941 535 943.9 3 3 5 3 3 5DAB-286 1279 1171 78.0 736.3 509 379 692.1 3 2 4 4 4 5DAB-443 1516 618 429.3 468.3 327 303 610.3 3 2 4 5 4 4DAB-361 2650 693 573.0 1426.0 918 1560 1303.3 3 2 4 2 4 4DAB-414 2481 818 789.0 1167.3 1112 953 1220.1 3 2 4 2 1 3DAB-344 2286 914 122.3 941.7 779 479 920.3 3 2 4 3 2 2
DAB-341 2274 838 295.3 1092.3 961
OOooo 1059.8 3 2 4 2 2 2
DAB-367 2575 1157 537.3 1254.7 728 560 1135.3 3 2 4 3 3 3DAB-358 438 312 172.3 334.0 116 150 253.7 3 3 4 7 6 6DAB-364 1782 573 732.0 1138.0 684 670 929.8 3 2 4 2 2 3DAB-410 1944 991 89.7 844.0 497 481 807.8 3 2 4 3 3 5DAB-337 1320 475 170.0 717.3 490 522 615.7 3 2 4 2 4 5DAB-366 2869 800 604.0 1023.3 1031 918 1207.6 2 1 4 2 2 3DAB-449 2876 914 822.0 961.7 810 798 1197.0 3 2 4 3 2 4DAB-472 2931 891 1127.0 1034.0 755 594 1222.0 2 2 4 2 2 2
DAB-360 508 793 42.0 533.7 423 308 434.6 3 2 5 5 3 4St. check 711 692 276.3 425.3 479 147 455.1 3 2 4 6 3 5LSD (0.05) 450.7 286.9 361.4 259.4 280.9 199.1 113.3CV(%) 14.3 21.2 39.0 17.3 24.8 19.8 22.5*C BB—common bacterial Blight score on leaf
39

Oromia Agricultural Research Institute (IQQO), Crop research Proceeding 2017
AM M I mode) analysis: The AMMI model analysis of variance for seed yield is presented in Table 4. This analysis also showed presence of highly significant (p < 0.01) differences among common bean genotypes for seed yield performance. From the total treatment sum of squares, the largest portion was due to environmental main effect (49.8%) followed by genotypes main effect (25.1%) and the effect of GEI was 20%. The largest portion of environments sum of squares indicated greater influence of the environments on seed yield performance of common bean genotypes and contributed greater to GLI when compared to that of genotypes as main effects.Similar results were reported by Yayis. et al. (2014) and Akande. et al. (2009). Substantial percentage of G x E interaction was explained by I PC A -1 (13.7%) followed by JPCA-2 (2.9%) and therefore used to plot a two dimensional GGE biplot. Amare and Tamado (2014) suggested the most accurate model for AMMI can be predicted by using the first two IPCA.
Table 3: Partitioning of the explained sum of square (SS) and mean square (MS) from AMMI analysis for seed yield of seventeen common bean genotypesSource o variation DF Sum of square. Explained SS (% ) Mean squareTotal 305 127189405 100 417014T reatments 101 120683338 94.9 1194885**Genotypes 16 31901822 25.1 1993864**Environments 5 63341850 49.8 12668370**Block 12 1255369 0.98 104614**Interactions 80 25439666 20.0 317996**IPCA 1 20 17461216 13.7 873061**IPCA 2 18 3709783 2.9 206099**Residuals 42 4268667 101635Pooled error 192 5250698 27347Key: ns= non- significant, **= significant at 1% and *= significant at 5% probability level. SS= sum of square. DF= degree of freedom.
AM M I biplots analysis: AMMI1 biplot showed G, (DAB-443) and G |0 (DAB-364) as broadly adapted and high seed yielding.The variation of yield for each genotype was significant at different environments. Genotypes DAB-361, DAB-414, DAB-446, DAB-366, and DAB-449 were specifically adapted to high yielding environments (l ie I). Considering the 1PCA-1 score, DAB- 360 was the most unstable genotype and also adapted to lower yielding environments. DAB-443 and DAB-364 were more stable in comparison to other genotypes. Genotype DAB-443 was adapted to low yielding environments and also relatively stable (Fig 1).G-. (DAB-286), G<, (DAB- 358), Ci 12 (DAB-337), G |6 (DAB-360), G|? (standard check) were adapted to low yielding environments but not stable. Genotypes DAB-443 (G3) and DAB-364 (G|0) have IPC'A-I value nearest to zeroby which they were shown to have a higher stability for seed yield than other genotypes (Fig 1). DAB-361 (G4) had highest seed yield followed byDAB-472 (G ]5),DAB-414 (G5) and DAB-366 (G ,3) (Fig 1).
40

Oromia Agricultural Research Institute (1000). Crop research Proceeding 2017
i k o -j
s «»432>— IK 0> 4
zaco> — —:33(©>4
^JfK) 7790 IK ****< > I 1290 I li3<M> ir7 9 0 2*MM»(O r B r f i «4<fi|rtTRB0)
Figure- 1. Biplot of interaction principal component axis (1PCA1) against mean seed yield of 17 common bean genotypes evaluated across sixenvironments.
AM M I stability value and genotype selection index analysis : According to AMMI stability value (ASV), genotypes, DAB-443 and DAB-364 were found to be broadly adapted. According to GSI, genotypes, DAB-414. DAB-364 and DAB-361 with relatively lower values were found high seed yielding and broadly adapted genotypes (Table 5).
Table5. AMMI stability value, genotype selection index and ranks based on them for seed yield of 17 common bean genotypes evaluated at six locations during 2015 and 2016 cropping seasons.
Genotypes Seed yield (kg ha1) ASV RY RASV GSIDAB-446 1003.0 41.6 8 7 15DAB-286 676.6 51.0 12 9 21DAB-443 610.2 8.7 13 1 14DAB-361 1330.1 51.1 1 10 1 1DAB-414 1220.1 35.0 3 6 9DAB-344 901.5 29.1 10 5 15DAB-341 1085.7 28.2 7 4 11DAB-367 1135.3 45.3 6 8 14DAB-358 247.3 80.2 17 16 33DAB-364 929.9 12.0 9 2 11DAB-410 808.8 16.8 11 3 14DAB-337 552.4 57.6 14 11 25DAB-366 1206.7 74.0 4 13 17DAB-449 1194.6 72.6 5 12 17DAB-472 1222.2 76.9 2 14 16DAB-360 434.7 97.9 16 17 33Standard check 455.1 78.7 15 15 30Keys: ASV: AMMI stability value, RY: Rank of yield, RASV: Rank of AMMI stability value and GSI: Genotype selection index
41

Oromia Agricultural Research Institute (IQQO), Crop research Proceeding 2017
GGE bi plot analysis
In GGE biplot (Fig 2), IPCA-1 and IPCA-2 explained 82.28 and 7.23%, respectively, of genotypes by environment interaction and made a total of 89.5%. The other study conducted on groundnut crop explained an interaction of 85.9% extracted from IPCA-1 and IPCA-2 (Alemayehu et al., 2016). The polygon view of the GGE-biplot analysis helps one detect cross-over and non-crossover genotype-by- environment interaction and possible mega environments in multi-location yield trials (Yan et al.2007). DAB-361 (G4), DAB-449 (G4) and DAB-358 (G9) were vertex genotypes (Fig 2). They are best in the environment lying within their respective sector in the polygon view of GGE biplot (Yan and Tinker, 2006).
§5
Fig-2. GGE biplot showing mega-locations and their respective higher seed yielding genotypes. Varieties plotted as 1. 2 ... 17. locations are those written in blue color.
ConclusionGEI is differential phenotypic performance of genetically uniform genotypes across test environments. It occurs because different genotypes have different genetic potentials to adjust themselves to variable environments, that is, adaptability. Large speckled common bean genotypes evaluated have highly significant genetic differences for seed yield performance and occurrence of significant GEI complicated selection of high yielding and broadly adapted genotypes.
GGE biplot enabled identification of both high seed yielding and broadly adapted genotypes better than AMMI biplot. ASV and GSI. Among the evaluated genotypes DAB-361 (G4) was both high seed yielding and broadly adapted genotype. Locations, Bako 2015 and Bako 2016 are high seed yield potential locations and ideal for commercial production of common bean genotypes broadly adapted to them. GGE biplot analysis suggested presence of one mega-environments and enabled identification of specifically adapted genotypes.
ReferencesAdjei, A.I., S.O. Dapaah and I.K. Dontwi, 2010. Predicting the best genotype from analysis of
genotype by environment interaction. European J. Sci. Res.. 45(1): 128-135.
Scatter plot (Total - 89 52% )
____ P C 1 - 82_ 2B %
* __
42

Oromia Agricultural Research Institute (IOOO), Crop research Proceeding 2017
Akande, S. R., Taiwo, L. B „ Adegbite, A. A., and Owolade, O. F., 2009. "Genotype x environment interaction for soybean grain yield and other reproductive characters in the forest and savanna agroecologies of South-west Nigeria." Afri. J. of Pin. Sci.. 3:127-132.
Alemayehu Dabessa, Birru Alemu, Zerihun Abebe and Dagnachew Lule. 2016. Genotype by Environment Interaction and Kernel Yield Stability of Groundnut (Arachishypogaea L.) Varieties in Western Oromia, Ethiopia. J. o f Agriculture and Crops, 2( I 1): 113-120.
CSA (Central Statistical Agency). 2016. Agricultural Sample Survey Report on Area and Production of Major Crops. 1:21 -22.
Ebdon, J. S, H.G Gauch, 2002b. Additive main effect and multiplicative interaction analysis of national turfgrass performance trials: Cultivar recommendations. Crop Sci. 42: 497-506.
Gauch, H.G.,and R.W. Zobel. 1997. Identifying mega-environments and targeting genotypes. Crop Sci. 37: 11-326.
GenStat. 2016. GenStat Procedure Library Release. 18'1' edition. VSN International Ltd.Liebenberg. J. A., 2002. Dry bean production. Dry bean production manual compiled by Directorate
Agricultural information services Department of Agriculture in cooperation with ARC, Seed Crops Institute. SouthAfrica. (Available athttp://www.ndg.agric.za/publications (Accessed July 2010)
Mekbib, F„ 2003. Yield stability in common bean (Phaseolus vulgaris L.) genotypes. Euph. 130: 147-153.
Purchase, J.L., H. Hatting and Cs.Vandenventer, 2000. Genotype by environments interaction of w'heat in South Africa: stability analysis of yield performance. South Africa J. o f plant sci. 17: 101-107.
Yan W „ Tinker N.A. 2006. Biplot analysis of multi-environment trial data: Principles and applications. Canadian Journal of Plant Science 86. 623-645.
Yan, W., and Kang, M.S. 2003. GGE Biplot Analysis: a Graphical Tool for Breeders, Geneticists and Agronomists. CRC Press, Boca Raton.
Yayis. R., Agdew. B.. and Yasin, G., 2014. "Genotype x environment interaction and Additive main effect and multiplicative interaction analysis for Field pea yield stability in SNNPR state, Ethiopia." International Journal of Sustainable Agricultural Research, vol. 1, pp. 28-38.
Zeleke Ashango, Berhanu Amsalu, Kidane Tumisa, Kassaye Negash and Asnake Fikie. 2016. Seed Yield Stability and Genotype x Environmentlnteraction of Common Bean (Phaseolus vulgarisL.) Lines in Ethiopia. International Journal of Plant Breeding and Crop Science, 3(2): 135-144.
43

Oromia Agricultural Research Institute (1QQO), Crop research Proceeding 2017
Genotypes by Environment Interaction and Grain Yield Stability of Common Bean (Phaseolus vulgaris L.) Genotypes in the Western Oromia, EthiopiaMeseret Tola1*, Adane Arega'. Chala Debela1, Alemayehu Dhabesa1, Zerihun Abebe1 and Solomon Bekele1Bako Agricultural Research Center, P.O. Box 03, Bako, Ethiopia
Corresponding author: [email protected] AbstractCommon bean (Phaseolus vulgaris L.) is the world 's most important food legume for direct human consumption. In Ethiopia, common bean is one of the most important cash crop and source of protein for farmers in many lowlands and mid-land areas. Genetic improvement is a crucial component that contributes to agriculture productivity’. Fourteen promising common bean genotypes including standard checks(Anger and SER-125) were evaluated using RCBD with three replications at Bako main research station and Billo Boshe and Gute research sub sites during 2014 and 2015 main cropping seasons. A ll agronomic and disease data were analysed and based on this results, three promising genotypes were found to be superior as compared to standard checks across the test environment. Based on analysis of grain yield stability and adaptability\ genotype K.W-006 showed better stability? followed by KW-013 across locations with grain yield of 2857Kg/ha and 2558Kg/ha respectively.
Key words: Bean, GxE interaction, Grain yield, Stability IntroductionThe common bean (Phaseolus vulgaris L.) is the world’s most important food legume for direct use, with a production of about 12 million metric tons per year. It is the chief source of dietary protein for most of Latin American and sub-Saharan African people, supplying about 20% of the protein intake per person (Akibode and Maredia, 2011; Argaw et al., 2015). It is largely self-pollinated plant though cross pollination is possible if the stigma contacts with pollen coated bee when extended. Common bean shows variation in growth habits from determinate bush to indeterminate extreme climbing types. The bushy type bean is the most predominant type grown in Africa (Buruchara, 2007). In Ethiopia, common bean production is increasing and according to CSA (2016) report, common bean (white and red) was produced on about 357,299.89ha of land and 540238.9 tons produced in 2016 main cropping season with the productivity of 1.48 t ha'1; which is low as compared to world average of 2.6 t ha'1. This low yield of common bean may be attributed to a combination of several production constraints among which low soil fertility, rainfall variability, diseases and insect-pests, weeds, poor accessibility to good seed and poor crop management practices play a major role (Katungi et al., 2010).
Common bean is adapted to areas with altitudes ranging from below sea level to nearly 3000 meter above sea level (C1AT, 2001). However, it does not grow well below 600 m due to poor pod setting caused by high temperature (Cobley, 1976). Suitable production areas of bean in Ethiopia has been indicated as areas with altitude between 1200-2200 m, mean maximum and minimum temperature of 32 °C and 10 °C, respectively with a rainfall ranging from 350 to 700 mm well distributed over 70-90 days (Imru,1985; Amare and Haile, 1989 ).In Ethiopia, common bean is one of the most important cash crop and source of protein for farmers in many lowlands and mid-land areas. The country’s export earnings is estimated to be over 85 % of export earnings from pulses, exceeding that of other pulses such as lentils, faba bean and chickpea (Negash, 2007). Overall, common bean ranks third as an export commodity in Ethiopia, contributing about 9.5 % of total export value from agriculture (Katungie/ al., 2010). Apart from being food and a source of income, common bean is also replenishes soil fertility through nitrogen fixation.
44
Oromia Agricultural Research Institute (IQQO). Crop research Proceeding 2017
Materials and MethodsFourteen common bean genotypes were evaluated at three locations (Bako, Billo Boshe and Gute) for two consecutive years (2014 and 2015). Except four improved and released common bean varieties, the remaining genotypes included in this study were landrace collections which were collected from different districts in Kellem Wellega Zone. The experimental land was ploughed, and harrowed by tractor. The first ploughing was done before on- set of rainfall. The planting was done in mid-June at each location using a Randomized Complete Block Design with three replications. Each plot consists of six rows of 4m length with 40 and 10cm spacing between rows and seeds respectively. Fertilizer was applied at the rate of 100kg DAP (Di Ammonium Phosphate) per hectare. Among the recorded data grain yield is used for analysis.Multivariate method, Additive Main Effects and Multiplicative Interaction (AMMI) model was used to assess genotype by environment interaction (GEI) pattern. The model used for AMMI analysis is as follow:Y0- n + Gi + E j + (Z/-kO-ik7jk) + Pij + CjjWhere Y is the yield of genotype (G) in environment (E) for replicate (r), // is the total yield mean, Gj is the main effect of genotype or the genotype (G) mean deviation (genotype mean minus total mean yield), £, is the main effect of environment or the environment (E) mean deviation, Xk is the singular value for IPCA axis N (N is the number of remaining PCA axis in AMMI model: a,* is the genotype (G) eigenvector value for IPCA axis N, ^environment (E) eigenvector value for IPCA axis, Pn is the is the residual or noise and+ is the error (Gauch, 1992; Umma Kulsum et al, 2014). AMMI stability value of the ith genotype (ASV) was calculated for each genotype and each environment according to the relative contribution of IPCA I to IPCA2 to the interaction SS as follows (Purchase et al., 2000):
r ~AS Vt =
\Where, SSjj>c.a)/SS|P<A2 is the weight given to the IPCA, value by dividing the IPCA I sum of squares by the 1PCA2 sum of squares.Based on the rank of mean grain yield of genotypes (RY i) across environments and rank of AMMI stability value (RASVi) a selection index called Genotype Selection Index (GSI) was calculated for each genotype, which incorporates both mean grain yield (RYi) and stability index in single criteria (GSIi) as suggested by Purchase, et al.. 2000.G SIi = RASVi + RYiEnvironmental index (Ii) was calculated by subtracting the mean of each environment from the grand mean. Genotype plus genotype by environment variation (GGE) was used to assess the performance of genotypes in different environments. The environmental effects were removed from the data and results obtained from the data were used to calculate environment and variety scores and these scores were used to plot the standard principal component bi-plots (Yan and Kang, 2003).Analysis of variance was carried out using a Statistical Analysis System (SAS) version 9.3 software (SAS Institute Inc., 2002). Additive Main Effect and Multiplicative Interaction (AMMI) analysis and GGE bi- plots were performed using Gen Stat 18"’ edition statistical package (GenStat, 2016).
SSjpcAlSS|PCA2
|1PCA1S + [IPCA2SCort.]:
45

Oromia Agricultural Research Institute (IQOO). Crop research Proceeding 2017
Table I. Lists and sources of genotypes used in this studyS.N Genotypes Source
1 ALB-123 MARC2 ALB-210 MARC3 ALB-87 MARC4 KW-001 landrace5 KW-006 landrace6 KW008 landrace7 KW-011 landrace8 KW-013 landrace9 KW-018 landrace10 KW-020 landrace11 KW-028 landrace12 KW-031 landrace13 KW-036 landrace14 Anger BARC
BARC: Bako Agricultural Research Center. YfARC: Melkassa Agricultural Research Center Results and Discussion Combined Analysis of VarianceThe results of analysis of variance showed that there is statistically significant differences (P<0.01) among genotypes, environments and their interactions for seed yield (Table 2). This indicated the presence of genetic variation among the common bean genotypes and possibility to select high yielding and stable genotype (s), and similarly, the environments are variable and showed the differential response of common bean genotypes across the test environments. Similar result was reported for common bean and groundnut varieties, linseed and niger seed varieties, respectively by Zeleke et al. (2016), Alemayehu et at. (2016) and Tamesgen et al. (2014)Table 2. Combined analysis of variance for grain yield of common bean genotypes evaluated at three environments for two years during 2014 and 2015 main cropping seasons.
Source of variation Degree freedom Mean squareEnvironments 5 7583916**Genotypes 13 2377416**Block within environments 2 665270"sInteraction 65 835009**Error 166 225999LSD (0.05) 766.4CV (% ) 21.6
LSD =Least Significant differences. CV= Coefficient of Variation. ** = significant at P = 0.01, ns = non-significantPerformance of common bean genotypes across environmentsfable 3 showed the average mean grain yield of fourteen common bean genotypes across six environments (year x location). The pooled mean y ield was ranged from 1397 to 2857 kg ha'1. Among the tested genotypes, genotype ALB-87 (Ci3) was the lowest yielding, whereas, the highest grain yield was obtained from genotype KW-006 (G5) followed by KW-013 (G8), KW-011 (G7) and ALB-123 (G I). This difference is attributed to their genetic constitution. KW-006 (G5) genotype was the top ranking genoty pe at Bako-2014, and Billo Boshe 2015. The yield performance of each genotype at each location and season is presented in detail in Table 3. This difference in yield rank of common bean across the environments revealed that there is high crossover ty pe of GxE interaction.
46

Oromia Agricultural Research Institute (1QQ0). Crop research Proceeding 2017
Table: 3. Mean grain yield (kg ha'1) of fourteen common bean genotypes evaluated at three locations during 2014 and 2015 main cropping seasonsNo Genotypes 2014 2015 Pooled
Bako Billo Boshe Gute Bako Billo Boshe Gute means1 ALB-123 2514 2974 1568 3067 2688 1885 24492 ALB-210 2224 2000 2055 1152 1088 1962 17473 ALB-87 2202 2718 2019 397 428 615 13974 KW-001 2782 2895 2077 2352 2370 892 22285 KW-006 3679 3017 2641 2264 3266 2277 28576 KW008 2399 2492 1377 1749 2419 1472 19857 KW-011 3086 2693 1336 2455 3314 2076 24938 KW-013 3175 2591 2926 2382 2367 1676 25209 KW-018 2378 2641 1990 1846 1620 1376 197510 KW-020 2955 2855 2350 2141 2780 1027 235111 KW-028 1937 2441 2226 1828 2757 2817 233412 KW-031 2471 3291 1885 1048 2362 2426 224713 KW-036 2783 2581 2150 1110 2526 1971 218714 Anger (St.ch) 3127 1895 1057 2323 2621 940 1994
Env. means 2694 1865 2649 2329 1975 1672 2197LSD (0.05) 932.0 836.7 793.2 383.8 692.5 441.3 766.4
CV (% ) 20.6 18.8 23.9 12.1 17.7 15.7 21.6AM M I Model Analysis: The AMMI model analysis of variance for grain yield is presented in Table3. This analysis also revealed that presence of highly significant (p < 0.01) differences among common bean genotypes for grain yield performance. From the total treatment sum of squares, the largest portion was due to GEI main effect (33.5%) followed by environments main effect (23.4%) and the effect of genotype was 19.1%. This also indicated the existence of a considerable amount of deferential response among the evaluated common bean genotypes to changes in growing environments and the differential discriminating ability of the test environments. Similar result was reported by Alemayehu et al. (2016). Substantial percentage of G x E interaction was explained by IPCA-1 (46.5%) followed by 1PCA-2 (28.8%) and totally the tow IPCAs explained 75.3% of the total GxE interaction and therefore used to plot GGE biplot. Amare and Tamado (2014) suggested the most accurate model for AMMI can be predicted by using the first two IPCAs.Table 4: Partitioning of the total explained sum of square (SS) and mean square (MS) from AMMI analysis for seed yield of fourteen common bean genotypes
Source of variation DF Sum of square Explained SS (% ) Mean squareTotal 251 161947857 100 645211Treatments 83 123101559 76.01 1483151**Genotypes 13 30906410 19.1 2377416**Environments 5 37919578 23.4 7583916**Block 12 10974576 6.7 914548nsInteractions 65 54275571 33.5 835009**IPCA 1 17 25214410 46.6 1483201**IPCA 2 15 15608892 28.8 1040593**Residuals 33 13452269 407645Error 156 27871722 178665ns= non- significant, **= significant at 1% and *= significant at 5% probability level. SS= sum of square, DF= degree of freedom.AMMI Biplot Analysis: AMMI biplot (Figure 1) with X-axis plotting mean seed yield and Y-axisplotting IPCA I scores illustrate stability and adaptability of common bean genotypes. It has been reported that the IPCA1 scores of a genotypes in AMMI analysis are an indication of the stability
47

Oromia Agricultural Research Institute (IQQO), Crop research Proceeding 2017
or adaptation over environments. It is further stated that the greater the IPCA scores, negative or positive, the more specific adaptation of a genotypes to certain environments. The more the IPCA scores close to zero, the more stable or adapted the genotypes is over all the environments sampled.
Mean YIELD vs IPCA 1 : AMMI plot
+ E2+ 6 4
f♦ 00
+ E 8 | j +C12 +E3
+ E5
n
1800 2000 2200 2400 2600 2800
G r a i n y i e l d ( k g / h a )
Fig: 1 GEI biplot analysis of common bean varietiesGGE Biplot Analysis: An ideal genotype is defined as genotype with the greatest PCI score (mean performance) and with zero GEI, as represented b\ an arrow pointing to it (Figure 2). A genotype is more desirable if it is located closer to the ideal genotype. Thus, using the ideal genotype as the center, concentric circles were drawn to help visualize the distance between each genotype and the ideal genotype. Therefore, the ranking based on the genotype-focused scaling assumes that stability and mean yield are equally important. In this study, G5 which fell closest to the ideal genotype was identified as the most desirable genotype as compared to the rest of the tested common bean genotypes (Figure 2). Similarly, Alemavehu et al. (2016) and Abate et al. (2015) identified ideal genotype based on the genotype-focused scaling assumes that stability and high mean yield of studied genotypes.
C o m p a ris o n bip lo l (To ta l - 7 2 -4 7 '"K,)
i 1 . 'I s g £ g 3tisr. 'sn » a ^ r |
Figure 2. GGE biplot based on genotype-focused scaling for comparison the genotypes with
the ideal genotype.
48

Oromia Agricultural Research Institute (1000), Crop research Proceeding 2017
Ideal test environment is an environment which has more power to discriminate genotypes in
terms of the genotypic main effect as well as environment effect represent the overall
environments. But such type of environment may not exist in real conditions. Therefore, by
assuming a small circle which located in centre of concentric circles and an arrow pointing on
it as ideal environment (Figure 3), it is possible to identify desirable environments which are
found closer to the ideal environment (Yan and Rajcan. 2002). Therefore, among the testing
environments, Billo Boshe-2015 (L-4), which fell near to this ideal environment was
identified as the best desirable testing environment in terms of being the most representative
of the overall environments and powerful lo discriminate common bean genotypes.
C o m p a ris o n biplot (To ta l - 7 2 .4 7 % )
L OC O
CMOQ_
P C 1 - 5 1 . 1 2 %Genotype scores
-+■ Environment scoresO A B C
Figure 3. GGE biploi based on environment-focused scaling for comparison the environments with the ideal environment. AEC: average environment coordinator; PC; principal component ConclusionGEI is differential phenotypic performance of genetically uniform genotypes across test environments. It occurs because different genotypes have different genetic potentials to adjust themselves to variable environments, that is, adaptability. Common bean genotypes evaluated showed highly significant genetic differences for seed yield performance and occurrence of significant GEI complicated selection of high yielding and broadly adapted genotypes. GGE bipiot enabled the
49

identification of both high yielding and broadly adapted genotypes better than AMMI biplot. Among the evaluated genotypes KW-006 (G5) was both high yielder and broadly adapted genotype to the tested environments. Environment, Gute-2015 is high yielding environment and ideal for commercial production of common bean genotypes. GGE biplot analysis identified ideal environment among the tested environments and also enabled to identify common bean genotypes with specific adaptation.
ReferencesAbate, F., Mekbib, F. and Dessalegn, Y. 2015. GGE biplot analysis of multi-environment yield trials
of durum wheat (Triticum turgidum Desf.) genotypes in North Western Ethiopia. American J. Exp. Agriculture, 8, pp. 120-129.
Akibode, S. and Maredia, M. 2011. Global and regional trends in production, trade andconsumption of food legume crops. Michigan State University, East Lansing, Ml
Argaw, A., Mekonnen, E. and Muleta, D. 2015. Agronomic efficiency of N of common bean (Phaseolus vulgaris L.) in some representative soils of Eastern Ethiopia.
Buruchara, R. 2007. Background information on Common Beans (Phaseolus vulgaris L) in Biotechnology, Breeding and Seed Systems for African Crops. The Rockefeller Foundation, Nairobi.
CSA (Central Statistical Agency). 2016. Agricultural Sample Survey Report on Area and Production of Major Crops, 1:21 -22.
CIAT, 2001. International Center for Tropical Agriculture. Common bean: The nearly perfect food.Available at http://webapp.ciat.cgiar.org/ciatinfocu s/beans.htm
Cobley, L. S. 1976. An introduction to the botany of tropica! crops. Longman Group Limited.Katungi, E., Farrow, A., Mutuoki, T., Gebeyehu, S., Karanja, D„ Alamayehu, F. and Buruchara, R.
2010. Improving common bean productivity: An Analysis of socioeconomic factors in Ethiopia and Eastern Kenya. Baseline Report Tropical Legumes 11. Centro Internacional de Agricultura Tropical-CIA T. Cali. Colombia.
Mehari M., Tesfay M., Yirga H., Mesele A., Abebe T., Workineh A. and Amare, B. 2015. GGE biplot analysis of genotype-by-environment interaction and grain yield stability of bread wheat genotypes in South Tigray, Ethiopia. Com.in Biom. and Crop Science 10, 17-26.
Negash, R. 2007. Determinants of adoption of improved haricot bean production package in Alaba special woreda, southern Ethiopia. PhD Thesis, Haramaya University.
Purchase, J.L., H. Hatting and C.Vander. 2000. GxE interaction of wheat in South Africa: Stability analysis of yield performance. South African J.of plan. Sci., 17:101-107
Temesgen, A., Mamo, K. and Lule, D., 2014. GxE Interaction & Grain Yield Stability Analysis of Ethiopian Linseed and Niger Seed Varieties. J. of App. Biosci., 50,7093-7101.
Yan W, Rajcan I., 2002. Biplot analysis of test sites and trait relations of soybean inOntario. Crop Science, 42( 1): 11 -20.
Oromia Agricultural Research Institute (IQQO), Crop research Proceeding 2017______
50

Oromia Agricultural Research Institute (IQQO). Crop research Proceeding 2017
Registration of Lammiif and Jiidhaa Field pea (Pisum sativum. L) Varieties at Bako'Solomon Bekele, 'Alemayehu Dabesa, 'Zerihun Abebe, 'Chala Debele, Ishetu Mogasa,
'Getahu Abera and 'Marara Gidisa 1Bako Agricultural research Center. P O Box 03. Bako. West Shew a. Ethiopia
Corresponding Author: [email protected] and Jiidhaa are the name given for field pea (Pisum sativum L.) varieties with accession number of EH080I0-3 and EH08033-2. respectively after selected and released by Bako Agricultural Research Center for mid and high lands o f Western Oromia and similar agroecologies of Ethiopia. Two years (2014 and 2015) test across three locations (Cedo. Shambu and ArjoJ. These variety showed greater grain yield advantage of 13.4-15.8%, and had better disease resistance than the standard check. Gedo-1. The result of Genotype and Genotype by Environment interaction (GGE) demonstrated that these two varieties were more stable and high yielder than the check. Further. Lammi was released as Shiro type while Jiidhaa was released as Kik type for Agrjo. Shambu and Gedo high land and similar agroecologies.Key Words: Field pea;GGE-billet, Pisum sativum:; Variety Registration.
IntroductionEthiopia holds the number one spot in Africa and sixth in the world in field pea production(FAOSTAT, 2014). Field pea is produced at mid and high altitude areas of Oromia, Central, and Western and southern Tigray, Amahara and SNNPR in Ethiopia. It is a cheap source of protein with essential amino acids (23-25%) for resource poor households (Nawab, et al., 2008). Field pea well perform at high (2300 to 3000) and mid (1800 to 2300 masl) altitude areas. The rainfall requirement of field pea is 800 to 1100 mm for highland and 700 to 900 mm for mid laltitude.The optimum temperature for growth of the crop is ranged 20 to 25°C.Even though, the productivity of field pea is low as 0.5-0.6 tones/ha under low level of farmers practice and rain fed conditions, it can give higher yield 4-6 tones/ha at research fields if improved technologies and inputs are used (Smykal et al.. 2012). Some of the production constrains of Held pea are, biotic stresses (pests) and lack of improvement seed with poor crop management and environmental factors (a biotic stresses) (Telaye et al.. 1994). Breeding is one of the components that develop good varieties that resist or tolerate biotic or a biotic constraints and improve yield potential; this is taken as one of the goal and success of breeding activities.

Oromia Agricultural Research Institute (IQOOj. Crop research Proceeding 2017
Materials and Methods: In 2012, 69 Held pea accessions were obtained from Holeta Agricultural Research Center and tested at nursery stage. Luckily, these accessions had different color that can be used as Shiro (grey) and as Kik (white). Out of these genotypes, sixteen of them were tested in multi location trial as RVT in 2014 and 2015 at Shambu, Gedo and Arjo testing sites. Result of multilocation trial indicated that, accession EH08010-3 and EH08033-2 were the best two with grain yield advantage ol 13.4% and 15.8% over of the standard check, Gedo-1, respectively. These two candidate varieties with accessions No. EH08010-3 and EH08033-2 were tested in variety verification trial against the standard check (Gedo-I) and respective local checks at Shambu, Arjo and Gedo-1 in year 2016. The national variety technical committee the release of EH08010-3 with name of Lammiif and EH08033-2 with name of Jiidhaa were approved.Variety Lammiif and Jiidhaa were recommended to be used as Shiro and Kik type, respectively.Varietal character: Variety Lammiif (EH08010-3» has grey seed color and 100 seed weight of 21.1 g and mean plant height of 152cm.Variety Lammiif has white seed color, 20g of 100 weed weight and 137cm average plant height. Both varieties have seed with irregular shapes and semi smooth character.The detailed agronomic descriptions of the two varieties are indicated in Table 1. fable: I Agronomic and Morphological Characteristics of Lammiif and Jiidhaa field pea varieties
Variety Lammiif(EH08010-3 ) Jiidhaa (EH08033-2)Adaptionarea Shambu,Gedo-l and Arjo Shambu,Gedo-1 and ArjoAltitude(ma.s.l 2000-2600 2000-2600Rainfall(mm) 1000-1200 1000-1200DAP 100 100Seedrate(kg/'ha) 180-200 165-185Spacing(cm) 20x5(Interand Intrarows) 20x5(lnterand Intrarows)Daystoflowering 58-64 58-70Daystomaturity 105-130 110-140Plantheight(cm) 146-156 130-140No.ofpodsperplant 7-18 8-17Seedshapeand character Irregular andsemi smooth Irregular andsemi smoothSeedcolor Grey White greyCotyledoncolor Black LightorangeFlower color Brown WhitelOOseedweight(g) 21.1 20Croppestreactions Resistant to major disease and insect pests Resistant to major disease
Researchfield yield (q/ha) 28-35 27-36Farmersfield (q/ha) 23-30 22-32
Breederseedmaintainer OAR1/BARC OAR l/BA RC
52

Oromia Agricultural Research Institute (1000). Crop research Proceeding 2017Cornparlsori btplot < “Total - 90.54%)
F*0-1 77 63%
Figure 1: GGE- biplot based on environment focused comparison for their suitability as an ideal environment and their relationships.Yield performance: The average seed yield of Lammif and Jidhaa over locations and years in multi- location trial was 3303.3 kgha'1. and 3375.7 kgha1, respectively while that of the standard check. Gedo-I was 2912.7 kgha1. Lammif and Jidhaa have grain yield advantage of 13.41% and 15.89% over the check. Gedo-I, respectively.Reaction to disease: The common field pea diseases in the high land of Arjo, Ciedo and Shambu are bacterial blight, powdery mildew and downy mildew. Both Lammif and Jidhaa were moderately resistant to these diseases.Grain Yield Stability: The result of stability analysis using the method of GGE-biplot showed that both Lammiif and Jiidhaa were stable varieties for their grain yield performance (see Figure 1) ConclusionLammiif and Jiidhaa field pea varieties were well adapted, stable and gave high mean grain yield when compared with standard check Gedo-I. Variety Lammiif was released for its high mean grain yield and for specific use for Shiro while Jiidhaa was to be used for kik. Both varieties were recommended for Arjo, Gedo and Shambu high lands and similar agroecologies.AcknowledgementWe thank the Oromia Agricultural Research Institute for the financial support. We are also thankful to Bako Agricultural Research Center for all support given to us in the carrying out of this experiment. ReferenceFAOSTAT. Food and Agriculture Organization of (he United Nations. In FAOSTAT
database: http://faostat.fao.org/site/567/DesktopDefauli.aspx7PageID=567#ancorAccessed 03 February 2014.)
Navvab. N.N., G.M. Subhani, K. Mahmood, Q. Shakil and A. Saeed, 2008. Genetic variability, correlation and path analysis studies in garden pea (Pisum sativum L J. Journal of Agricultural Research , 46: 333-340.
Smykal, P., G. Aubert, J. Burstin, C.J. Coyne and N.T.H. Ellis et al., 2012. Pea (Pisum sativum L.) in the genomic era. Agronomy, 2: 74-115.
Telaye, A., T. Getachew and B. Demtsu, 1994. Genetics and breeding of Held pea. Proceedings of the 1st National C’ool-Season Food Legumes Review Conference, December 16-20, 1993, Addis Ababa, Ethiopia, pp: 285-214.
53

Oromia Agricultural Research Institute (1QQ0), Crop research Proceeding 2017
Registration of “ Haydaroo” Newly Released Emmer Wheat (Triticum dicoccum L.) Variety for Bale Highlands
'Mulatu Aberra, ‘Tesfaye Letta and 'Tilahun Bayisa 1Sinana Agricultural Research Center, Cereal Crop Research, Bale-Robe, Ethiopia P.O.B 208, Oromia Agricultural Research Institute (OARI). Addis Ababa, Ethiopia
Corresponding author: [email protected] Abstract
Ethiopia has suitable environmental condition for emmer wheat production, however, the productivity of emmer wheat is very low when compared with existing suitable agro-ecologies. This is mainly attributed to lack of stable, high yielding, disease resistant and easly threshable genotypes. Therefore, the objective of this study was to evaluate different promising genotypes and time to verify the most stable, high yielding, easy to thresh and disease resistant emmer wheat genotype for highlands o f Bale. The experiment was carried out at two locations namely Sinana and Goba. Including two checks, fifteen genotypes were evaluated in randomized complete block design (RCBD) with three replications for three consecutive years (2013, 2014 and 2015) during the main cropping seasons. Based on multi-location and multi-year evaluation result, genotypes sinana-01/dz2212//sinana-01 was selected and verified in the year (2016) at multilocations and eventually released by the name Haydaroo' which gave above average grain yield performance in a ll conducted environments where the standard checks gave lower yield. Besides, this variety has a stable yield and uniformity. After evaluation by national variety releasing committee, this cultivar was recommendedfor release in 2017 for highlands of Bale and similar agro-ecologies.
Keywords: emmer wheat, variety, grain yield, varity character, disease reaction IntroductionEmmer (Triticum dicoccum) is a member of the wheat family of annual grasses. Wild emmer wheat (T. turgidum spp. dicoccoides (Korn.) Thell.), is an annual predominantly self-pollinated (Golenberg 1987) tetraploid (genome constitution AABB) species (Zohary & Hopf 2000), is considered to be the progenitor of cultivated durum and bread wheats (Me Fadden & Seares 1946). Wild emmer is fully compatible with the tetraploid (AABB) durum wheat, it can be crossed with the hexaploid (AABBDD) bread wheat (Feldman & Sears 1981), and it harbors wide genetic diversity relevant to the improvement of various economically important traits in cultivated wheat fNevo et al. 2002). Cultivated emmer wheat, T. dicoccum [syn.71 turgidum L. subsp. dicoccon (Schrank) Thell.], is a tetraploid species (AB-genomes) belonging to the Triticum L. genus (Zaharievaet al. 2010). It is predominantly awned with spikelet’s consisting of two well developed kernels. Emmer glumes are long and narrow with sharp beaks. Genetic information like heritability and genetic advance for different yield contributing traits would be of great value enabling the breeder to use best genetic stock for improvement in breeding programme (Yadawad et al., 2015). Emmer wheat possesses valuable traits of resistance to pests and diseases and tolerance to abiotic stresses and is increasingly used as a reservoir of useful genes in wheat breeding. The genomic constitution AA of emmer is thought to be derived from T. monococcum. Various sources of the BB genome have been suggested, T. speltoides. T. searsii, and T. tripsacoides (Morris and Sears 1967; Kimber and Sears 1987). Due to the addition of the BB genome cultivated emmer could be grown in a wider range of environments including regions having high growing season temperatures. Emmer is an ancient wheat crop which20 years ago was considered an underutilized or neglected crop and which it seemed was probably going to be completely abandoned because of its low productivity and threshing and other agro technical problems (Perrino & Fares. 2003; Vita et al.. 2006). Today the increase in interest in natural and organic products has led to a “ rediscovery” of this hulled wheat, which has health characteristics associated with high starch-resistant content (Strehlow et al., 1994; Marconi and Cubadda, 2005). Breeding of emmer has rarely been given attention and its productivity does not usually achieve that of modern bread wheat cultivars (Vita et al. 2006). Meanwhile, some literature presents a similar
54

Oromia Agricultural Research Institute (IQQO). Crop research Proceeding 2017
productivity level of emmer and bread wheat, if varieties are grown in arid conditions (Marconni and Cubadda 2005). Another advantage of emmer, published in the literature is a high quality of production (Zaharieva et al. 2010). Emmer wheat has been traditionally grown and used as a part of the human diet (Marconi and Cubadda 2005). and as requirements for the diversity and high quality of food products become more demanding interest in this wheat variety is increasing (Hammer and Perinno, 1995). The grains contain more crude protein than the grains of modern varieties (Marconi el al.. 1999); whole meal Hour is a valuable source of dietary fibre in its insoluble forms, cellulose and hetnicelluloses, and it contains high quantities of P. Zn, Cu, K, Mg and Mn (Marconi and Cubadda2005). In Ethiopia emmer wheat, locally known as Hayisa (Aja), is used in various ways. Some is ground into flour and baked into special bread (Kita). Some is crushed and cooked with milk or water to make porridge (Genfo), and some is mixed with boiling water and butter to produce gruel. As some literature indicates, emmer's high protein content and smooth and easily digestible starch, infants and nursing mothers especially favor the gruel. In Ethiopia, emmer wheat production is very low as compared to other crop. This is due to lack of improved variety; threshability problem, low cultural practices, and other biotic and abiotic factors. The objective of the current study isto evaluate and release disease resistance, high yielding, threshable, quality, stable and uniform emmer wheat genotype for highlands of Bale and similar agro-ecologies.Materials and MethodsThe experiment was carried out at two locations namely; Sinana and Goba. Sinana Agricultural Research Center is located to South Eastern of Ethiopia at 7°N Latitude and 40°E Longitude; and is located at altitude of 2400 m.a.s.I. The center is 463km far from Addis Ababa to South East and 33km far from Robe capital city of Bale zone to East direction. The other location, Goba is about 48km far from Sinana Agricultural Research Center to South West and 13km far from Robe to South direction. The test materials were crossed at Sinana Agricultural Research Center with objective to improve yield and threshability. Cross was made between geneotypes of emmer wheat and durum wheat (emmer wheat as female and durum wheat as pollen source) then, two times backcrosses was done with emmer wheat genotype (sinana-01). After different filial generations were evaluated at different breeding stages for consecutive years, better lines were selected and promoted to yield trial. Then, yield trial which included about 50 lines were evaluated for one year at Sinana Research Center of which thirteen genotypes were retained from yield trial and promoted to regional variety trial for further evaluation at two environments (Sinana and Goba) for three consecutive years. Planting was conducted at both locations during 2013, 2014 and 2015 main cropping seasons. Complete block design (RCBD) with three replication with plot size of 1.2m wide (6 rows with 20 cm apart) by 2.5m length was used. Four central rows were harvested for grain yield estimate. The seed rate used was lOOkg/ha. Besides, fertilizer rate 18/46 kg/ha N and P;0> 46 was used. All agronomic practices and crop managemet were applied as per recommendation for each location. The genotypes were evaluated for their yield performance, threshability, disease resistance and other agronomic performances. Data were collected on plant and plot basis for morpho-agronomic traits of emmer wheat; days for heading, days for mature, bio-mass weight, grain yield, disease data were assessed on plot basis. On the other hand plant height was assessed on single plant basis of three selected and random sample of plant from each plot and the mean data of the three plants were used for analysis. Yield data was taken per plot basis and converted to quintal ha' 1 for carrying out subsequent statistical analysis. After the trial was conducted in different environments for three consecutive years under variety trial, two best performed emmer wheat genotypes were selected out of 13 genotypes and promoted to variety verification stage.Including one standard check (Sinana-01) and one local check the two promising genotypes (Sinana Ol/ DZ2212// Sinana Oland Snana-01/ Gedilfa// Sinana-01) were planted and evaluated at
55

Oromia Agricultural Research Institute (IQQO). Crop research Proceeding 2017
multilocation during 2016/17 main cropping season. Sinana 01/ DZ22I2// Sinana 01 (Haydaroo) showed superior performance over checks across all locations and years. After it was evaluated at multi-locations, the National Variety Releasing Committee has approved this variety to be released and recommended for the highlands of Bale and similar agro-ecologies and eventually the same variety registered on crop variety registry book.Result and DiscussionAgronomic and Morphological CharacteristicsHaydaroo is awned with spikelet’s consisting of two well developed kernels. Its glumes are long and narrow with sharp beaks. The average plant height is 108cm, and considered as medium height similar to most moder bread wheat varieties. The height of plant has its own merits and demerits. Varieties with high plant height are more competitive to weeds, but they might have some drawbacks such as lodging problem. Haydaroo has medium height and has strong stalk which help withstanding the lodging problem. The variety has erected leaf structure. It has also high bio-mass and good plant stand with 81% average stand percent across all locations (Table 1).Varietal characteristicsA varietal character of Haydaroo includes better disease resistance/tolerance . Also its relative better threshability as compared to the previously released emmer wheat is the peculiar characterstics of this variety which is transferred from durum wheat via crossing followed by backcrosses. The variety has good tillering capacity with high plant stand counts. It took 72 days to head and also took 127 days to reach physiological maturity (Table 1). It has erected growth habit, deep green at vegetative stage, has compact and slightly black awn ear type.The seed color of variety is amber. Details of the characteristics of variety is presented in appendix I .Table 1.Combined over locations and years (2013-2015) grain yield, other agronomic traits and disease reaction of 15 emmer wheat genotypes tested in emmer wheat regional variety trial (EW RVT)
Agronomic, yield and disease dataSN Genotypes DH DM PLH St Gyld/ha Lr1 Sinana'0 l/Ude//Sinana-01(1) 67 127 109 81 2894.12 Sinana-01 /Ude//Sinana-01 (4) 68 126 106 78 2917.6 40s3 Sinana-0 l/Ude//Sinana-01 (22) 70 126 108 80 2933.6 30s4 Sinana-01/Cocorit 71//Sinana-01(4) 65 125 105 79 2753.9 40s5 Sinana-0 l/Cocorit 7 l//Sinana-01(12) 69 126 110 84 3175.5 40s6 Sinana-01 /Gedilfa//Sinana-01(1) 66 127 112 82 3229.6 30ms7 Sinana-0 l/Gedilfa//Sinana-01(8) 64 128 114 84 2915.3 40s8 Sinana-0 l/Gedilfa//Sinana-01 (9) 68 128 109 80 2725.7 40s9 Sinana-01/Gedilfa//Sinana-01(11) 70 126 107 83 2927.6 30s10 Sinana-01/Gedilfa//Sinana-01(12) 70 126 106 82 2984.5 30s11 Sinana-01 /DZ2212//Sinana-01(3) 70 126 106 82 2935.2 25sms12 Sinana-01 /DZ2212//Sinana-01(10) 72 127 108 81 3023.8 30ms13 Sinana-01 xDZ2212//Sinana-01(13) 69 127 108 84 2972.8 40s14 Sinana-01 72 125 105 82 2637.1 40s15 Local 70 125 106 80 2646.3 40s
Mean 68.6 126.5 126.5 81.4 2911.5CV (% ) 4.8 7.7 6.8 9.0 24.6LSD (5%) 2.2 3.0 4.8 4.8 615.4

Oromia Agricultural Research Institute (IOQO), Crop research Proceeding 2017
Key: DH: days for heading. DM: days to maturity, PLH: plant height (cm), St: stand in percentage. Gylha: grain yield (kg ha), Lr: leaf rust (%).S: Susceptible. MS: moderately susceptible. SMS: Suceptible to moderately susceptible, Mr: Moderately resistant. Tr: Trace. I nns: Trace with moderately susceptible, Trmr: Trace with moderately resistant, R: Resistant, CV(%): Coefficient of variations, LSD: Least significant differences, ns: nonsignificant differences based on the 0.05 probability level of LSDYield performanceHighly significant variations were observed among the studied emmer wheat genotypes. The mean grain yield of I laydaroo ranged from 17.8 to 45.7 Qt ha '. The average grain yield ranged from 24.6 to 45.3 quintal per hectare on research field, whereas, 17.8 to 45.7 quintal per hectare at farmers' Held. The mean grain yield of I laydaroo combined over locations and years is 30.24 Qt ha 'which is higher than standard check Sinana-01 (26.3 Qt ha ’) and local check (26.4 Qt ha1) (Table 01). Total yield advantage of Haydaro variety over the standard check Sinana-01 was 14.7% and 14.3 % over the local check. At the stage of variety verification trial, which evaluated at multi-locations in the year 2016. the yield performance of the candidate was superior over checks (Table 2).Table 2. Mean grain yield, agronomic performance and disease reactions of the candidates and the
checks varieties evaluated at the verification stage (in 2016 cropping season)
sN. Genotypes
Agronomic and disease dataDll DM Plh Gy ST Sr Yr Lr
1 Snana-01/Gedilfa//Sinana-01( 1) 56 132 1 12 27.50 75 0 15 ms 10ms2 Local check 59 133 106 29.10 80 Trms 5ms 20ms
Si nana-01 /DZ2212//Si nana-3 01 (Haydaroo) 55 134 108 41.50 95 0 5ms 5 ms
4 Sinana-01 (Standard check) 60 135 105 34.20 85 trms 10ms 15 msKey: DH: days for heading, DM: days to maturity, Plh: plant height (cm). S 1 Stand percent, Gy: grain yield (kg ha), Sr: stem rust (%). Yr: yellow rust (%). Lr: leaf rust (%). S: Susceptible, MS: moderately susceptible, Mr: Moderately resistant. Tr, trace. I nns: Trace with moderately susceptible.
Disease ReactionThe major emmer wheat disease according to their importance in the grow ing area is rusts (Leaf rust, yellow rust and stem rust). Disease data across locations and years were scored and analyzed. Haydroo showed moderate resistance to leaf rust (5%) (Table 2). It is also showed tolerant to yellow and stem rusts (Table 2). Generally, I laydaroo variety is tolerant to diseases, insect pests and other abiotic factors.Adaptation rangeHaydaroo w'as released for highlands of Bale and similar-agro ecologies. It performs very well in areas having an altitude 2400-2500 m.a.s.l. and annual rainfall of 750-1500mm. planting date is from mid June to early September based on the agro-ecologies of the area. The recommended seed rate for the variety is lOOkg/ha and fertilizer rate is 46 kg/ha of P:0< and I8kg/ha of N..Variety maintenanceThe variety will be maintained by Sinana Agricultural Research center/Oromia Agricultural Research Institute.ConclusionThe development of cultivars, which arc adapted to a wide range of diversified environments, is ultimate aim of breeders in crop improvement program. Analysis of genotypes by environment interaction is vital for breeders in order to design the dissemination strategies for new varieties. Precise recommendation of lines for general and specific adaptation requires clear understanding of
57

Oromia Agricultural Research Institute (IQQO). Crop research Proceeding 2017
the real pattern of genotypes by environment interaction. The adaptability of a variety over diverse environments is commonly evaluated by the degree of its interaction with different environments in which it is grown. Based on yield performance, disease reaction and agronomical parameters evaluated, the newly released variety (Haydaroo) is very suitable for the studied environments. It is the most preferred variety with multiple merits (high yielder, disease tolerant, better plant stand, relatively better threshablity and better bio-mass weight) when compared to the checks.
AcknowledgementThe authors are grateful to Oromia Agricultural Research Institute (OAR1) and Sinana Agricultural Research Center (SARC) as well as cereal technology generating team for provision of facilities, financing and implementation of the experiment. We acknowledge Mr Siraj Dafo, Tesfaye Tadase and al! cereal team for trial management and appropriate data collection.Appendix IAgronomic and morphological descriptors Haydaroo variety
1. Variety Name: Haydaroo (Sinana-01/DZ22l2//Sinana-01)2. Adaptation area: Highlands of Bale and similar agro ecology
Altitude (m.a.s.l): 2300-2600 m.a.s.lRainfall: 750-1500mm
3. Seed rate: lOOkg/lia4. Planting date: Mid June to early September in Bale based on the agro-ecologies of the area5. Fertilizer rate (kg/ha):
P205=46N=18
6. Days to heading: 727. Days tc mature: 1278. Plant height: 1089. Growth habit: Erect and deep green at early stage10. Ear type: compact type having of black awn11. Seed color: Amber12. Crop pest reaction: Resistance/tolerance to major emmer wheat disease13. Yield (qt/ha):
Research field: 24.6- 45.3 Farmers field: 17.8-45.7
14. Year of release=201715. Breeder/maintainer: Sinana Agricultural Research Center/Oromia Agricultural Research Institute
ReferencesFeldman M. & Sears E.R. (198I).The wild gene resources of wheat. Scientific American 244, 102—
112.Golenberg E.M. (1987) Estimation of gene flow and genetic neighborhood size by indirect methods in
selfing annual, Triticum dicoccoides. Evolution 41, 1326-1334.HAMMER, K.PERINNO, P., 1995-Plant genetic resources in South Italy and Sicily: studies towards
in situ and on farm conservation. Plant Genetic resources Newsletter, 103,p. 19-23.Kimber G and Sears ER. 1987. Evolution in the genus Triticum and the origin of cultivated wheat. In:
Wheat and Wheat Improvement, 2nd ed (Heyne EG ed). Am Soc Agron, Madison, Wl. Pp. 154-164.
Marconi E, Carcea M, Graziano M, Cubadda R ( I99c>): Kernel properties and pasta-making quality of fi ve European spelt wheat (Triticum spelta L.) cultivars. Cereal Chem 76:25-29.
58

Oromia Agricultural Research Institute (IQQO), Crop research Proceeding 2017
Marconi M.,Cubadda R. (2005):Emmer Wheat. ln:AbdeI-Aal E.-S.M.,Wood P.(eds.): Specialty Grains for Food and Feed. American Association of Cereal Chemists, St.Paul, 63-108.
McFadden E.S. & Seares E.R. (1946). The origin of Triticum spelta and its free-threshing hexaploid relatives. Journal of Heredity 37, 81-89.
Morris,R. and E.R. Sears. 1967. The cytogenetics of wheat and its relatives. In: K.S. Quesenberry and L.P. Reitz (eds.), Wheat and wheat improvement. Agron. Monog. 13. Am. Soc. Agron., Madison, WI.
Nevo E., Korol A.B., Beiles A. & Fahima T. (2002) Evolution of Wild Emmer and Wheat Improvement: Population Genetics, Genetic Resources, and Genome Organization of Wheat's Progenitor, Triticum dicoccoides. Springer-Verlag, Berlin, Germany.
Perrino P, Fares C. 2003. Assessment of genetic diversity and characterization of Italian emmer wheat (Triticum dicoccum Schiibler) populations. Proc. 10th Internationa] Wheat Genetics Symposium, September 1-6, Paestum, Italy, 2: 506-508.
Strehlow W, Hertzka G, Weuffen W. 1994. Aspetti nutrizionali. Le caratteristiche dietetiche del farro nel trattamento di malattie croniche. - In: Perrino P, Semeraro D & Laghetti G (eds). Convegno "II farro un cereale della salute", Potenza, p. 52-66.
Vita P., Riefolo C., Codianni P., Cattivelli L., Fares C. (2006): Agronomic and qualitative traits of T.turgidum ssp. Dicoccum genotypes cultivated in Italy. Euphytica, 150: 195-205.
Yadawad A, Hanchinal R R, Nadaf H L, Desai S A, Suma Biradar , Rudra Naik V. 2015. Genetic variability for yield parameters and rust resistance in f2 population of wheat (Triticum aestivum L.). The Bioscan, 10(2): 707-710.
Zaharieva M., Ayana N.G., Al Hakimi A., Misra S.C., MonneveuxP. (2010): Cultivated emmer wheat (Triticum diccocum Schrank), an old crop with a promising future: a review. Genetics Resources and Crop Evolution, 57: 937-962.
Zohary D. & Hopf M. (2000) Domestication of Plants in the Old World, 3rd edn, pp. 19-58. Oxford University Press, New York, USA.
Registration of “ Hortu and Weyib” field pea varieties released for the highlands of Bale and similar agro-ecologiesTadele Tadesse, Amanuel Teklign, Gashaw Sefera, and Behailu Mulugeta Sinana Agricultural Research Center, P.O. Box 208, Bale-Robe, Ethiopia Corresponding author: [email protected], [email protected] AbstractA total of 15 advanced field pea genotypes were tested under regional variety trial for three years (2012/13 to 2014/15) at three locations (Sinana, Sinja and Agarfa). Bale highland. Among those. Hortu and Weyib, the two newly developed field pea varieties were released for the highlands of Bale and similar agro-ecologies for their best performance than the checks and other genotypes. The two varieties were high yielder and stable across the testing location and years. Accordingly, variety EH02081-8 (Hortu) has a yield advantage o f26.28 % and 43.09%; whereas EH03014-1 (Wey>ib) has 21.72% and 37.92% yield advantage over the standard check (U rji) and local check, respectively. Furthermore, these varieties are stable, best adapted, having large number of pods per plant and tolerant to powdery mildew (Erysiphe polygoni), Downey mildew’ (Pernospora pisi) and ascochvta blight (Mycosphaerella pinnodes). Hortu mainly used for kik purpose, but Weyib is used for shiro. Due to these merits "Hortu and Weyib ” were released in the 2017 cropping season for the highlands of Bale and similar agro-ecologies.
Key words: Field pea, Hortu, Stability, Weyib.
59

Oromia Agricultural Research Ins tit me (1QQO). Crop research Proceeding 2017
Introduction:
Agronomic and Morphological CharactersticsHortu is semi-erect with white seed coat, yellow cotyledon, and white flower. On average. Hortu has an average plant height of 141cm, and requires 67 days for flowering, and 134 days to reach physiological maturity. Average thousand seeds is 197.5gm. and on average. 12 medium length pods per plant (Table 1). On the other hand Weyib has semi erect growth type with gray seed coat, yellow cotyledon, and pink flower. This variety has also plant height of 141cm, and requires 68 and 135 days to give flowers and reaches to physiological maturity respectively. \ Morphological and agronomic characteristics of the varieties is summarized in fable 1.Yield performance:The average seed yield of Hortu combined over locations and oxer years is 4.20tAia whereas for Weyib it is 4.05t/ha which is higher than Urji (standard check) (3.73t/ha), and the local check (2.94t/ha). Under research field Hortu yields 3.8 to 5.4t/ha; weyib gave an average grain yield of 3.6to 5.2t/ha.Table 1 Mean seed yield and other agronomic traits of field pea variety, Hortu and Weyib and checks in multi-location testing, 2015/16
Entry Davs to Days to Plant NO. of No. of 1000 PM“ DM ASB Sflower maturity height
cmPods/plant seeds/pod Seed
wtgt/h
EH0208I-8 67 J34 141 12 4 197.5 4 3 4 4.2(Hortu)BH03014- 67 135 142 12 5 195.4 4 4 4 4.01 (Weyib)Urji 68 135 139 14 4 183.4 5 6 5 3.3Local check 66 134 150 13 4 142.2 6 65 4 2.9Mean 67 135 143 13 4 179.6 3.6
Key: PM. = Powdery Mildew; DM. = Downey Mildew: \SBl.T. = Ascochyta blight 1 Disease score based on I- 9 scale where 1 is highly resistance and 9 is highly susceptibleStability performanceThe two varieties were tested in 9 environmenis (G x E) in order to see their stable performance over the testing sites during the multi-location trial in the regional variety trial. Accordingly, these two varieties were selected since they showed mean gain yield better than the checks with yield advantage of more than 25%. Furthermore the varieties have regression coefficient nearly unity, and they have also the least deviation from regression and the lowest AMMI Stability Value (ASV). This indicates that the varieties are stable over the testing environments. Genotype with the least deviation from regression, with the lowest ASV indicates that the genotype is stable over the testing environment. Diseases ReactionThe major field pea diseases according to their importance in the growing areas are powdery mildew (Erysiphe polygon/), Downey mildew (Peronospdta pisi/ and Aschochyta blight (Mycosphaerella pinnodes) (Asfaw et al., 1993). In 1-9 rating scale, w ith a score of I most resistant, the two varieties scored a mean of 4 for all the above mentioned diseases, and be characterized as moderately resistant (Table I).QualityField pea is one of the best components in day- to- day dish in the form of wet either in its crashed form locally called kik. or in its powder form called shiro. Accordingly, variety Hortu is highly preferred for kik, whereas variety Weyib is mainly used for shiro Adaptation
60

Oromia Agricultural Research Institute (IQQO). Crop research Proceeding 2017
Hortu and Weyib are released for the highlands of Bale, southeastern Ethiopia. It is well adapted in areas having an altitude of 1800 to 2600 m.a.s.l and annual rain fall of 750 to 1000mm. Furthermore; production of these two varieties can be extended to areas having similar agro-ecologies. The two varieties performs best if they are produced with recommended fertilizer rate of lOOkg/ha DAP and with seed rate of 75 kg/ha in clay-loam soil. The recommended planting dale is from the end of July to early August in Meher season and end of March in Bclg season.Variety7 MaintenanceBreeder and foundation seed of the variety is maintained by Oromia Agricultural Research Institute (OAR1). Sinana Agricultural Research Center Ethiopia.AcknowledgementWe thank OAR1 in financing for the development of the varieties. We also thank Sinana Agricultural Research Center Administration staff s in facilitating field evaluation. We acknowledge all pulse and Oil crops research case team staff for data collection and trial management.
Reference:Basford KE, Cooper M (1998). Genotype -Environment Interactions and some consideration of their
implications for wheat breeding in Australia. Aust. Agric. Res. 49: 154-174.Muhammad, A., Ahmad, B., Haqqani, A. and Muhammad, B.. (2003).Genotype environment
interaction for grain yield in chickpea (Cicer arietinum L). Pak.J. Bot.35 2: 181-186.Purchase JL (1997). Parametric stability to describe G-E interactions and yield stability in winter
wheat. PhD. Thesis, Department of Agronomy, Faculty of Agri., Univ. of Orange Free State, Bloemfontein, South Africa
Genotype by Environment Interaction (GEI) and Stability analysis of White bean genotypes in the mid altitude of Bale zone, Southeastern Ethiopia
Tadele Tadesse'*, 'Amanuel Tekalign, 'Behailu Mulugeta and 'Gashaw Sefera Oromia Agriculture Research Institute, Sinana Agriculture Research Center, Bale-Robe, Ethiopia* Corresponding author: [email protected]/[email protected] AbstractTwelve white common bean genotypes were evaluated along with two checks at three diverse locations in the mid altitude of Bale zone, southeastern Ethiopia for two consecutive years (2014 and 2015). The objective o f this work was to see the effect of G EI and evaluate the adaptability and stability performance o f twelve white common bean genotypes using AMMI (Additive main effect and multiplicative interaction) model. The combined analysis of variance over locations revealed highly significant differences among the genotypes, locations and genotypes by location interaction. Among the 14 genotypes, the maximum grain yield over locations was recorded by genotype (G5) ICN Bunsi X S X B 405/5C-1C-/C-5l(2.05t/ha) followed by (G il) 1CN Bunsi X S X B 405/7C-1C-1C-30 (1.96t/ha) and the site that gave the maximum grain yield was Ginir (2.16t/ha). The results of AMMI analysis indicated that the first four AMMI (AMMI-AMMI4) were highly significant (P<0.01). The GE interaction was two times higher than that of the genotype effect, suggesting the possible existence of different environment groups. Based on the AMMI Stability Value (ASV). G12, G5, G7. G il. G3 and G I3 showed stability than others. As stability per se is not a desirable selection criterion and the most stable genotypes would not necessarily give the best yield performance, simultaneous consideration of grain yield and ASV in a single non-parametric index was also considered in identification of best varieties. Based on the Genotype Selection Index (GSI). which considers both the ASV and mean grain yield, genotype G5 and G il were identified as stable genotypes for the study areas.Key Words: AMMI Stability Value (ASV). Common bean. Genotype Selection Index (GSI)
61
Oromia Agricultural Research Institute (IQQO). Crop research Proceeding 2017
IntroductionCommon bean (P. vulgaris L.) germplasm was introduced into Africa from each of the two gene pools in Latin America during the past four centuries (Allen. 1995). Africa is now the second most important common bean producing region in the tropics, following Latin America (Allen, 1995). Beans are now recognized as the second most important source of human dietary protein and the third most important source of calories of all agricultural commodities produced in Eastern and Southern Africa (Pachico, 1993). Bean is a major crop in many parts of Africa, and especially in eastern Africa. An important food to people of all income categories, it is especially important to the poor as a source of dietary protein. Its production is agronomical!) diverse, being grown in many different crop associations. Bean is grown primarily by small-scale farmers in eastern Africa. Unfortunately, the rate of increase in bean production has been exceeded by the rate of population growth. The Association for Strengthening Agricultural Research in Eastern and Central Africa (ASARECA) recognizes research on beans as being of high importance. Bean is an important source of cash for small scale farmers in Africa, whether as part of the total farm income or for providing a marketable product at critical times when farmers have nothing else to sell such as before the maize crop is harvested (Pachico, 1993).Common bean is a well-established component in Ethiopian agriculture and is regarded as the main cash crop and protein source of the farmers in many lowland and mid-altitude regions of Ethiopia with an estimated production area of 239,000 ha (Wortmann and Allen, 1994). The national average yield is 500-700 kg/ha and yield from research station plots is in the range of 2000-3000 kg/ha (Mekbib. 1997). The most suitable bean production areas in Ethiopia are characterized by an altitude range of 1200-2200 masl and mean maximum temperature of less than 32*C, and well distributed rainfall of 350-500 mm throughout thie growing season. Genotype by environment interactions are of major importance to the plant breeder in developing improved cultivars (Kang, 1993).When cultivars are compared over a series of environments, the rankings usually differ and this may cause difficulty in demonstrating the superiority of any cultivar across environments. Since production is highly affected by the effect of environment identifying stable cultivar for maximum yield is essential. A major challenge for plant breeders is determining the appropriate common bean genotypes due to genotype x environment (GE) interactions, which determine the differential response of genotypes among environments. To reduce the effects of GE interactions, it is convenient to know their magnitude and to identify more stable genotypes adapted to specific environments (Cruz and Regazzi, 2007). In this context, several methods to study adaptability and stability have been used to measure GE interactions in common bean (Coimbra et al., 1999; C'arbonell et al., 2004; Ribeiro et al., 2009; Pereira et al., 2009, 2011; Torga et al., 2013). predominantly based on linear regression models (Eberhart and Russell, 1966) and multivariate analyses such as additive main effects and multiplicative interaction analysis (AM MI) (Gauch, 2006). Traditional methods that predict genotype performances in multiple environments are based on a classic approach to statistics, which estimates one or more parameters from a set of observations.Although there are many stability parameters, Eberhart and Russel (1996) model's parameters S2di appeared to be very important. Since the variance of S:di is a function of number of environments hence several environment with minimum replications per environmental are advocated being necessary to obtain reliable estimates of s ’di. To identify the stable genotypes having adaptability over a wide range of agro-climatic conditions is of major significance in crop improvement. Therefore, this study mainly emphasizes to see the effect of GEI and evaluate the adaptability and stability of productivity of twelve white common bean genotypes using AMMI (Additive main effect and multiplicative interaction) model.Materials and Methods
62

Oromia Agricultural Research Institute (IOQO), Crop research Proceeding 2017
In this study 14 white common bean genotypes (Table 1) were evaluated during the main/meher seasons for two consecutive years (2014-2015) across three districts (Ginir, Goro and Dellomena) representing the mid altitude of Bale zone. The was randomized complete block design with four replications. Plot size used was 6.4nr (4 rows at 40cm spacing and 4m long). The two central rows were used for data collection. Combined analysis of variance LSD multiple range test were done using Cropstat software. The additive main effect and multiplicative interaction (AM MI) analysis was performed using the model suggested by Crossa et a/.(1991). The stability parameters like regression coefficient (bi), deviation from regression were also calculated using Cropsta program. AMMI Stability Value (ASV) the distance from the coordinate point to the origin in a two dimensional of IPCAI scores against IPCA2 scores was computed by the model suggested by
Purchase et a l. 2000. A S V = J[ '^ ^ (/PC^lscore) ] 2 + [/PCA212SS1PCA1Where, <;SircA2 *s the weight given to the IPCAI value by dividing the IPCAI sum squares by the
IPCA2 sum of squaresGenotype Selection Index (GSI) also calculated by the formula suggested by Farshadfar. 2003. Here it is calculated by taking the rank of mean grain yield of genotypes (RYj) across environments and rank of AMMI stability value (RASVi).GSIj= RASVi + RYiTable I . List of Genotypes used in the trialSN Genotype Code Genotype name1 GI ICN Bunsi X S X B 405/4C-IC-1C-502 G2 ICN Bunsi X S X B 405/3C-1C-1C-873 G3 ICN Bunsi X S X B 405/9C-IC-1C-704 G4 ICN Bunsi X S X B 405/5C-IC-1C-985 G5 ICN Bunsi X S X B 405/5C-1C-IC-516 G6 ICN Bunsi X S X B 405/1C-1C-1C-317 G7 ICN Bunsi X S X B 405/7C-1C-1C-698 G8 ECAB-06329 G9 ICN Bunsi X S X B 405/7C-1C-1C-5810 G10 ICN Bunsi X S X B 405/3C-1C-1C-49I 1 GI I ICN Bunsi X S X B 405/7C-1C-1C-3012 G12 ICN Bunsi X S X B 405/4C-1C-1C-8013 G 13 Roba-114 G 14 Awash Melka
Result and DiscussionThe combined analysis of variance revealed that significant differences among the genotypes, environment and genotypes by environment interaction (Table 2). Corte et al. (2002) also reported significant differences for mean grain yield of common bean for environments. Similarly Raffis et al. (2004); Dar et al. (2009) and Mwale et al. (2009) also reported significant differences for genotypes by environment interaction for mean grain yield of common bean. The variance due to genotypes by environment interaction was found significant for various traits by Singh et al. (2007). Mean comparison for the tested genotypes indicated that maximum grain yield was obtained from G5 (2.05t/ha) followed by G il (1.96t/ha) and G6 (1.76t/ha) whereas the least mean grain yield was obtained from G8 ( l.52t/ha).
63

Oromia Agricultural Research Institute (IQQO), Crop research Proceeding 2017
Table 2. Combined analysis of variance for mean seed yield of white common bean tested at three locations (Ginir, Goro and Dello mena) for two years (2014-2015)Source of Variation DF Mean SquaresYear (Y) 1 7066210**Location (L) 2 27962200**Replications 3 341310**Genotypes (G) 13 565441**Y*L 2 12546500**Y*G 13 361761**L*G 26 255351**Y*L*G 26 226430**Residual 249 150569**TOTAL 335 451281**CV% 22.7%
**. Significant at 1 % of probability level The regression analysis (Table 3) revealed that the main effects of genotypes, and GE interaction were accounted only for 6.52% and 15.29% of the total sum of square (TSS), respectively (Table 3). Liner GE interaction was not significant and accounted for 5.55% of the variability in the GE interaction. As a general rule the effectiveness of regression analysis is when 50% of the total sum squares is accounted for by liner GE interaction Hayward et al.. (1993), hence regression analysis is not useful for stability analysis of genotypes (Wade et al., 1995).Table 3. Regression analysis of phenotypic stability for white common bean genotypes
Source of variation
D.F. S.S. M.S. TSS%
Genotype (G) 13 1.83768 0.14136** 6.52Location (L) 5 22.0209 4.40418** 78.17
G X L 65 4.3073 0.066266** 15.29G X Site Reg 13 0.239104 0.018393 5.55Deviations 52 4.0682 0.078235** 94.45
Total 83 28.17** Significant at 1% level of probability
The result of AMMI analysis indicated that 6.52% of the total variability was justified by genotypes. 78.17% by environment and 15.29% by genotype. The partitioning of total sum of squares indicated that the environment effect was a predominant source of variation followed by GE and genotype effect. A large SS for environments indicated that the environments were diverse, with large differences among environmental means causing most of the variation in grain yield. The GE interaction effect was two times higher than that of the genotype effect, suggesting that there were sustainable differences in genotypic response across environments. Furthermore, the AMMI analysis revealed that high significant difference for IPCA I, IPCA2, 1PCA3 and 1PCA4. This made it is possible to construct the biplot and calculate genotypes and environment effects (Guach and Zobel, 1996; Yan and Hunt, 2001; Kaya et al. 2002). The first IPCA I accounted for 35.74% of the variability of GE, followed by IPCA2 (35.43%), IPCA3 (20.63%) and IPCA4 (4.7%). The first two IPCA scores were cumulatively accounted for 71.2% of the total GE interaction. This indicated that the use of AMMI model fit the data well and justifies the use of AMMI2 (Table 4). The Interaction Principal Component Axes (IPCA) scores of a genotype in the AMMI analysis indicate the stability of
64

Oromia Agricultural Research Institute (IQQO), Crop research Proceeding 2017
a genotype across environment. The closer the IPCA scores to zero, the more the stable the genotypes across their testing environments.Table 4. Analysis of Variance for grain yield of white common bean for the AMMI model
Source of Variation D.F S.S. TSS% M.S. FGenotypes (G) 13 1.83768 6.52 0.14136**Locations (L) 5 22.0209 78.17 4.40418**
G x L 65 4.3073 15.29 0.066266**AMMI 1 17 1.53941 35.74 0.090554**AMMI 2 15 1.5262 35.43 0.101747**AMMI 2 13 0.888585 20.63 0.068353**AMMI 4 1 1 0.202411 4.70 0.018401**
GXE RESIDUAL 9 0.150694 3.50TOTAL 83 28.1659
** Significant at 1% level of probabilityTable 5 shows effects of genotypes and site values from the additive genotype x environment model. The large differences of effects both on genotypes and on environments were observed. Environments A (0.69 t ha'1) and C (0.21) have the main high significant positive grain yield effects. Environments E (-0.22t/ha) has the main significant negative grain yield effects. Genotypes 5 (0.34t/ha) and Gl I (0.26 t/ha) had a positive grain yield significant effect across all environments. The majority of white common bean varieties had a small positive none significant main effect.Table 5. Effects of white common bean varieties grain yield (t/ha) from the AMMI GE modelVariety Code Environments
Gin2014 (A)
Goro20I4(B )
Gin20l5(C)
Goro2015 (D)
DM2014(E)
DM2015(F)
Genotypeseffects
Gl 0.08 -0.20 0.02 -0.07 0.34 -0.34 0.0 5G2 0.02 0.89 -0.22 0.01 0.18 -0.08 -0.09G3 0.18 -0.33 -0.07 -0.14 0.15 -0.09 0.00G4 0.27 -0.74 -0.1 1 0.10 0.12 -0.30 -0.14G5 0.41 0.13 0.10 -0.20 -0.12 -0.32 0.34**G6 0.01 -0.15 0.30 0.06 O OJ 00 0.17 0.06G7 -0.06 0.12 0.09 -0.10 -0.20 0.16 -0.14G8 0.031 0.11 0.09 0.27 -0.41 -0.09 -0.18G9 -0.47* -0.17 -0.06 0.17 0.08 0.30 -0.16G10 -0.07 -0.26 -0.59* -0.01 0.62** 0.31 0.04Gl 1 0.45 0.15 -0.27 -0.05 -0.38 0.10 0.26*G12 -0.10 0.96 -0.13 0.08 -0.16 0.22 0.02G13 -0.21 0.54 0.33 -0.1 1 0.14 -0.20 -0.09G14 -0.52* -0.19 0.53* 0.00 0.03 0.15 0.03
LocationsEffects
0.69** -0.91 0.21** -0.17 - 0.22** 0.39 1.71**
Key: *, ** significant probability level at 0.05 and 0.1 % , respectivelyTable 6 indicates the different stability parameters that can determine the stability of a given genotypes across the tested environment. Accordingly the regression coefficient (bi), mean grain yield and deviation from regression should be simultaneously seen before deciding about the stability < fa genotype. Furthermore, the AMMI Stability Value (ASV) which is the distance from the coordinate point to the origin in a two dimensional scatter gram of IPCA1 scores against IPCA2 score should
65

Oromia Agricultural Research Institute (IQQO), Crop research Proceeding 2017
also seen to decide the stability of a genotypes (Purchase et al., 2000). In ASV method, the genotype with least ASV score is the most stable. From this study (Table 6), AMMI Stability Value (ASV) discriminated genotypes G 12, G5, G7. G13 and G3 as the stable genotypes respectively.However, since stability in itself should not be the only parameter for selection, as the most stable genotype wouldn't necessarily gives the best yield performance (Mohammadi et al., 2007), hence, simultaneous consideration of grain yield and ASV in single non-parametric index is needed. Therefore, based on the Genotype Selection Index (GSI) G5 and G 11 were considered as the most stable genotypes with high grain yield compared to the others (Table 6).Table 6. Regression coefficient, deviation from regression, IPCA scores, ASV and GSI of genotypes
Genotypes MEAN SLOPE(bi)
MS-DEV IPCA1 IPCA2 I PC A3 IPCA4 ASV GSI
Gl 1.75 0.925 0.06 -0.17 -0.15 -0.43 -0.09 0.23 11G2 1.61 0.882 0.02 -0.15 -0.19 -0.02 -0.16 0.25 18G3 1.7 1.062 0.02 -0.20 -0.09 -0.12 0.18 0.22 13G4 1.57 1.045 0.05 -0.31 -0.04 -0.18 -0.19 0.32 20G5 2.05 1.072 0.09 -0.38 0.30 -0.24 0.14 0.20 3G6 1.76 1.219 0.05 0.22 0.35 0.15 0.20 0.41 14G7 1.57 0.995 0.02 0.11 0.16 0.14 0.16 0.20 14G8 1.52 0.966 0.07 0.02 0.37 0.16 -0.39 0.37 24G9 1.55 0.84 0.08 0.41 -0.24 0.23 -0.20 0.48 25G10 1.75 1.038 0.22 -0.11 -0.82 0.20 0.15 0.83 18Gl 1 1.96 1.054 0.10 -0.41 0.25 0.41 0.14 0.21 6G12 1.72 0.951 0.03 0.08 0.01 0.33 -0.07 0.09 8G13 1.62 0.863 0.05 0.21 0.05 -0.41 -0.01 0.22 15G14 1.74 0.987 0.15 0.67 0.04 -0.22 0.15 0.68 19
Key:. MS-DEV= deviation from regression. IPCA= Interaction Principle Component Analysis axis, ASV= AMMI Stability Value, GSI= Genotype Selection IndexThe last stage of the AMMI analysis is the graphical representation of genotypes and environment in the biplot (Gabriel, 1971) and identification of mega-environment. The biplot graphics are used to analyze the description of genotypes, environments and the interaction between them. The first singular axis of the AMMI analysis captures the highest percentage of the “pattern” of the data (Gauch, 1988). A high percentage of the SS GEI (Sum Square of the GE interaction) is explained by the first two axes (71.2%) and the highest part of the “pattern” of the GEI will be captured.
According to the values of the two first principal components (IPCA1 and IPCA2) or by Fig. 1, G5, G1 1, G6, G I and GI0 are the genotypes with more productive in the environmental conditions prevailing during crop development. But G10, interact negatively to most of the environments, though it gives high grain yield above the grand mean. Regarding the stability, G5, G il, G12, G13 and G7 are considered as the stable genotypes. However, when we see their GSI (Genotype Selection Index) which associate both the ASV and the grain yield, G5 and Gl I are the more stable genotypes with high grain yield across the testing sites. G10 is more specifically adapted environment E and G9 to environment F.
66

Oromia Agricultural Research Institute (IQQO), Crop research Proceeding 2017
I PC/ v2
3 A=GinirB=Gor
M O D F I F IT - 71 2% O F E S S
C=Gir»ir 2015
V
1 5 - 1312 D=Goro 2015
F=De!lomena 2015
10
■° % .9IPCA1
E=Dellomena 2014
0.06 0.38-0.58 -0.26
Fig. I. Biplot analysis of GE interaction based on AMM2 model for the first two interactions principal component scores.
ConclusionAMMI analysis of multi-environment yield trials serves for two main purposes: (i) understanding complex GEI, including delineating mega-environments and selecting genotypes to exploit narrow adaptations, and (ii) gaining accuracy to improve recommendations, repeatability, selections and genetic gain. Therefore, according to the present study, genotypes G5, GI I and G12 display higher adaptability and stability and thus recommended to be used in all environments included in the study. The genotypes GI3 and G7 present high mean productivity. However, they were unstable and specific adaptation to the environments of high quality i.e. environment D. Environment A gives the highest mean grain yield (2.395t/ha) and environment B gave the lowest mean grain yield (0.80t/ha). These can be considered example of favorable and unfavorable environments respectively. Therefore, from this study G5 and GI I were considered as the most stable genotypes and therefore, identified as candidate genotypes for possible release.
AcknowledgementWe gratefully acknowledged the Oromia Agricultural Research Institute for the financial support. Sinana Agricultural Research Center for providing all necessary facilities and Pulse and Oil Crops Research Case team staffs for trial management and data collection.ReferencesAllen, David J. (1995). An annotated list of diseases, pathogens and associated fungi of the common
bean (Phaseolus vulgaris) in Eastern and Southern Africa . CAB International; Cali, CO:
0.7
67

Oromia Agricultural Research Institute (IQQO). Crop research Proceeding 2017
Centro Intemacional de Agriculture Tropical (C1AT), Wallingford, GB. 42 p. (Phytopathological paper no. 34)
Carbonell SAM, Azevedo Filho JA , Dias LAS, Garcia AAF, (2004). Common bean cultivars and lines interactions with environments. Sci. Agric. 61: 169-177
Coimbra JLM , Carvalho F1F, Hemp S and Silva SA. (1999). Adaptability and phenotypic stability of collor bean genotypes (Phaseolus vulgaris L.) in three different environments. Cienc. Rural 29: 441-448.
Crossa J, Fox PN, Pfeiffer WH, Rajaram S and Gauch HG. (1991). AMMI adjustment for statistical analysis of an interactional wheat yield trial. Theor. App Gent. 81: 27-37
Corte AD, Moda-Cirino V, and Destro D. (2002). Adaptability and phenotypic stability in early common bean cultivars and lines. Crop Breed and Apl. Biotech 2(4): 525-533
Cruz CD and Regazzi AJ. (2007). Modelos biometricos aplicados ao melhoramento genetico.Imprensa Universitaria, Visosa.
Dar SA, Pir FA, Manzar A, and Lone AA. (2009). Studies on genotype x environment interaction and stability for seed yield in common bean (Phaseolus vulgaris L.). Trends in Biosci 2(2): 21-22
Eberhart SA and Russell WA. (1966). Stability parameters for comparing varieties. Crop Sci. 6: Farshadfar E and Sutka J. (2003). Locating QTLs controlling adaptation in wheat using AMMI model.
Cereal Res Commun 31: 249-254 Gabriel KR. (1971). The biplot graphic display of matrices with application to principal component
analysis. Biometrika 58: 453-467 Gauch HG and Zobel RW. (1988). Predictive and postdictive success of statistical analysis of yield
trials. Theoretical and Applied genetics 76: 1-10 Gauch HG and Zobel RW. (1996). AMMI analysis of yield trials. In: Kang MS, Gauch HG (eds)
Genotype by environment interaction. CRC press Boca Raton FL Gauch HG.(2006).Statistical analysis of yield trials by AMMI and GGE. Crop Sci. 46:1488-1500. Hayward MD, Besemard NO and Romagosa L. (1993). Paint breeding, Principles and Prospects. I"
edn. Chapman and Hall, London U.K. ISBN : 0^12^3390-7 Kang MS. (1993). Simultaneous selection for yield and stability in crop performance trials.
Consequence for growers. Agro J. 85: 754-757 Kaya Y, Palta C and Taner S. (2002). Additive main effects and multiplicative interactions analysis of
yield performance in bread wheat genotypes across environments. Turk J. Agric. For. 26: 275-279
Mekbib, F., (1997). Farmer Participatory common bean (P. vulgaris) genotype evaluation: the case of eastern Ethiopia. Expt Agric 33: 399-408
Mohamaddf R and Haghparast R. (2007). Biplot analysis of multi-environment trials for identification of winter wheat mega-environment in Iran. World J.Agri Sci. 3: 475-480
Mwale VM, Bokosi JM , Masangano CM, Kwapata MB, Kambambe VF1 and Miles C. (2009). Performance of climber common bean (Phaseolus vulgaris L.) lines under Research Design Farm managed (RDFM) system in three bean agro-ecological zones of Marawi. African J Biotech 8(11): 2460-2468
Pachico D. 1993. The demand for bean technology. In: Henry G, ed. Trends in CIAT commodities (1993). CIAT, Cali, Colombia, p 60-73.
Pereira HS, Melo LC, Faria LC, Peloso MJD. (2009). Adaptability and stability of common bean genotypes with carioca grain type for central Brazil. Pesquisa Agropecu. Bras. 44: 29-37.
Pereira HS, Melo LC, Peloso MJD, Faria LC. (2011). Complex interaction between genotypes and sowing seasons of carioca common bean in Goias/Distrito Federal. Crop Breed. Appl. BiotechnoJ. 11:207-215

Oromia Agricultural Research Institute (IQQOj, Crop research Proceeding 2017
Purchase JL, Hatting H and Vandenventer CS. (2000). Genotype x environment interaction of winter wheat in south Africa: 11. Stability analysis of yield performance . South Afr J Plant Soil. 17: 101-107
Raffls SA, Newaz MA and Khan N. (2004). Stability analysis for pod and seed production in dry bean {Phaseolus vulgaris L.) Asian J Plant Sci 3(2): 239-242
Ribeiro NF, Souza JF, Antunes IF and Poersch NL. (2009). Yield stability of common bean cultivars of different commercial groups in Rio Grande do Sul State. Bragantia 68: 339-346.
Singh Ak, Tomer AK, Tyagi K and Singh PP. (2007). Stability analysis for yield and its component in French bean (Phaseolus vulgaris L.) Legume Res 30(3): 166-172
Torga PP, Melo PGS, Pereira HS, Faria LC. (2013). Interaction of common beans cultivars of the black group with years, locations and sowing seasons. Euphytica 189: 239-248.
Wade LJ, Sarkarung S, Melran CG, Guhey A and Quader B. (1995). Genotype by environment interaction and selection method for identifying improved rainfed lowland rice genotypes. I s1 edn, International Rice Research Institute pp: 883-900
Wortmann CS; Allen DJ. (1994). African bean production environments: their definition, characteristics and constraints. ClAT, Kampala, Uganda. (Network on Bean Research in Africa Occasional Publication Series, no. I I.)
Yan W and Hunt LA. (2001). Interpretation of genotype x environment interaction for winter wheat yield in Ontario. Crop Sci 41: 19-25
Adaptability and Stability Analysis of Small red bean Genotypes using Additive Main effects and Multiplicative Interaction (AM M I) ModelTadele Tadesse1*, Amanuel Tekalign1. Behailu Mulugeta1 and Gashaw Sefera'Oromia Agriculture Research Institute. Sinana Agriculture Research Center, Bale-Robe, Ethiopia* Corresponding author: [email protected]/[email protected] AbstractGenotype x location interaction effects are of special interest for breeding programs to identify adaptation targets, adaptive traits and test sites. Sixteen small red seed bean genotypes were evaluated at Goro. Ginir and Dellomena districts of Bale zone during 2015 and 2016 main cropping season. The cultivars were arranged in a randomized complete block design with three replications. The combined analysis of variance for mean grain yield revealed significant variation for genotypes, environment and GE interaction. The analysis of variance for the AMMI revealed that significant variation for genotypes, environment and GE interaction. From this analysis 42.53% vim explained by AMMI I followed by AMMI 2 (28.29%). AMMI 3 (19.76%) and AMMI 4 (7.10%) of the interaction sum of squares. Therefore, the first two AMMI components justified 70.82% of the GE interaction sum of squares. The stability parameters regression coefficient (bi). deviation from regression analysis and AMMI stability value ASV identified G7. G6. G I 1. G I and G12 showed the least value for ASV indicating as these genotypes showed stable performance over the sites. However stable cultivar wouldn't necessarily gave the highest seed yield. Therefore based on Genotype Selection Index (GSI) which considers both the ASV and the mean yield, G8. G3. G6 an G7 were the most stable genotypes identijied over the tested environments. Therefore, out of the tested genotypes. G8 and G3 were identified as stable cultivar to be selected for possible release during the coming cropping seasons.
Key words: Adaptability, AMMI, ASV, GSI, Stability
IntroductionThe common bean (Phaseolus vulgaris L.) is the most important food legume for direct consumption in the world. Among major food crops, it has one of the highest levels of variation in growth habit,
69

Oromia Agricultural Research Institute (IQQO). Crop research Proceeding 2017
seed characteristics (size, shape and color), maturity and adaptation. It also has a tremendous variability (> 40,000 germplasms). Germplasm collection in beans compares well with other important commodities on a worldwide basis. Phaseolus vulgaris is produced in a range of crop systems and environments in regions as diverse as Latin America, Africa, the Middle East, China, Europe, the United States, and Canada (Peters, 1993; Wortmann and Allen 1994). Common bean is the most important crop for soil health due its excellent biological nitrogen fixation and food security crops for its source of starch, protein, dietary fiber, minerals and vitamins (Broughton, 2003).It is the most important grain legume in nearly all lowland and mid altitude areas of Ethiopia. It is produced primarily by smallholder farmers both for cash and consumption. In 2014, it was cultivated by 3.34 mill ion smallholders on 340 thousand hectare of land which is about 20% of total farm land allocated for pulses (CSA, 2014). It is also an important source of income for the farmers and an export commodity that generates foreign currency for the country. It ranks third as an export commodity in Ethiopia, contributing about 9.5 % of total export value from agriculture. Its fastest ripening at the critical hunger period earlier than other crops made it an ideal food security crop. It is double or triple cropped per year enabling cultivation of free land and engaging relatively cheaper labor after the harvest or failure of main season crops. Its high protein content made it the poor man's meat securing more than 16.7 million people against hidden hunger. Therefore, advanced small red common bean lines reported for their higher seed yield potential were introduced and evaluated at multiple locations.
The wide occurrence of genotype x environment interaction (GEI) is the basic cause of difference between genotypes in their yield stability, or in other words: ranking of the genotype depends on the particular environmental conditions where it is grown. Numerous stability parameters have been developed to investigate GEI (Huehn, 1990). Among them Additive main effects and multiplicative interaction (AM M I) analysis (Gauch 1992) is particularly effective for depicting adaptive responses (Crossa 1990; Annicchiarico 1997). Parametric stability statistics obtained by linear regression models (Finlay and Wilkinson, 1963; Eberhart and Russell, 1966; Shukla, 1972) are mathematically simple and biologically interpretable; however, few researchers use statistical measures of yield stability in their breeding programs. To maintain improved agricultural productivity, the development of varieties with high yielding potential is the ultimate goal of plant breeders in a crop improvement program. In the recent years of haricot bean breeding in Ethiopia, special focuses have been given to develop varieties with improved grain yield, good seed color and size, as well as resistant to major diseases. In addition to high yielding potential, a successfully developed new cultivar should have a stable performance and broad adaptation over a wide range of environments. However, frequent variation experienced both from season to season and from place to place within a shorter distance is among the most important features of the Ethiopian environmental conditions (EMA, 1988). The objectives of this study were therefore to identify the most stable bean lines across the studied environments.Materials and MethodsA total of 16 small seeded red common bean genotypes were evaluated to evaluate their adaptability and the stability in grain yield performance (Table 1). The test locations were Goro, Ginnir, and dellomena districts, the mid-altitude of Bale zone, southeastern Ethiopiaduring bona 2015 and 2016 cropping season. The genotypes were arranged using randomized complete block design with four replications and plot size of 6.4m2 (4 rows at 0.4m spacing of 4m row length). Combined analysis of variance using balanced ANOVA (Analysis of Variance) was computed using Cropstat program. AMMI analysis was performed using the model suggested by Crossa et al. (1991).
70
Oromia Agricultural Research Institute (IQQO), Crop research Proceeding 2017
The ASV is the distance from the coordinate point to the origin in a two dimensional of 1PCA1 score against IPCA2 scores in the AMMI model (Purchase et al., 2000). This weight is calculated for each genotypes and environment according to the relative contribution of 1PCA1 to IPCA2 to the interaction SS as follows,
A S V = J I H t ^ C/PC^ Is c o re jJ2 + V P C A 2 V
Where, S-IPCA1 is the weight given to the IPCA I value by dividing the 1PCA1 sum squares by the55/ P CA 2
IPCA2 sum of squares. The larger the IPCA score, either negative or positive, the more specifically adapted a genotype is to certain environments. Smaller IPCA score indicate a more stable genotype across environment.Genotype Selection Index (GSI): GSI was calculated for each genotype which incorporate both mean grain yield and stability index in a single criteria (GSIj) as GSIj= RY, +RASVjTable 1. Lists of genotypes used in the trial along with their genotypic code
Genotype code Genotype nameGl ECAB-0295G2 ECAB-0287G3 SELIAN-97G4 ECAB-020203G5 SIMAMAG6 SER-1 19G7 ECAB-0281G8 RBC-592G9 ECAB-0236G10 SER-118G il EC A B -0242GI2 625-BRB-183G13 ECAB-0224G 14 MELKA DAMEGI5 NAS1RG16 OMO-95
Result and DiscussionsThe combined analysis for the mean grain yield showed that genotypes (G), locations (L), years (Y), genotype x location (GL), genotypes x year (GY), location by year (LY), and genotypes x location x year (GLY) effects were highly significant (p <0.01) (Table 2). This indicated the variability among genotypes, locations and years. Similar findings were reported by Mekbib (2003), Asfaw et al. (2008) and Tamene and Tadese (2014) for common bean varieties performance and their growing environments in Ethiopia. The significant GL, GY, LY, and GLY were also indicated that the relative performance of genotypes at different locations and years was not similar.
71

Oromia Agricultural Research Institute tIQQOA Crop research Proceeding 2017
Table 2. Combined mean grain yield of Small red bean genotypes tested across locations (Goro, Ginnir and Dellomena) during meher 2015 to 2016.Source of variation DF Sum of squares Mean squaresYear (Y ) 1 12.0496 12.0496**Location (L) 2 31.9999 16.0**Replication 3 0.844609 0.281536**Genotype (G) 15 8.92123 0.594749**Y X L 2 10.0307 5.01533**Y X G 15 3.22062 0.214708**L X G 30 8.1449 0.271497**Y X LX G 30 8.34951 0.278317**RESIDUAL 285 55.8643 0.196015Total 383 139.425 0.364035AM M I analysis: Genotype, location and genotype by environment interaction were assessed by the additive main effect and multiplicative interaction (AM M I) model (Table 3). The analysis of variance of AMMI model for grain yield showed significant effect for genotypes, environment, and GE interaction. These result showed that 65.05% of the total sum of square was attributed to environment effects, only 10.77 and 24.17% to genotype and GE interaction effects, respectively. The effect of environment was responsible for the largest part of the variation, tailed by genotype and genotype by environment interaction. The same result was reported by Reza et al.. 2007; Noorul et al.. 2015; Tarakanovas et al.. 2006 and. The GX E sum of squares was 2.24 times larger than for genotypes, which determined substantial differences in genotypic response across environment.
I he GE interaction was partitioned into four parts of interaction principal component analysis (IPCA). AMMI 1 accounted for 42.53%, the second AMMI accounted for 28.29%, the third 19.76% and the fourth 7.10% respectively. The first two AMMI accounted for 70.82% of the GE sum of squares. This made as the construction of the biplot and genotype and environment effects (Gauch and Zobel, 1996; Yan and Hunt, 2001; Kaya et al.. 2002).Table 3. Analysis of Variance for the AMMI model for small red bean grain yield (t/ha) of the genotypes across environments
Source of Variation D.F. S.S. M.S. %TSSGenotypes (G) 15 2.23833 0.149222** 10.77Locations (L) 5 13.5158 2.70316** 65.05G X L 75 5.02163 0.066955** 24.17AMMI COMPONENT 1 19 2.13592 0.112417** 42.53AMMI COMPONENT 2 17 1.42043 0.083555** 28.29AMMI COMPONENT 3 15 0.992167 0.066145** 19.76AMMI COMPONENT 4 13 0.356746 0.027442** 7.10GXE RESIDUAL 11 0.116365 2.32TOTAL 95 20.7767
Stability performanceThe stability parameters such as regression coefficient (bi), deviation from regression (S2di), IPCA scores, AMMI Stability Value (ASV) and Genotype Selection Index (GSI) for the grain yield of the genotypes are presented in Table 4.The regression of coefficient (bi) value for genotypes G5 (1.035), G8 (1.04), G l 1 (1.065) and G 13 (1.085) were close to unity implying these genoty pes are stable over the environments. Furthermore,
72

Oromia Agricultural Research Institute (lOQO), Crop research Proceeding 2017
the deviation from regression for G8 (0.02), G6 (0.01), and G7 (0.01) were the lowest compared to others. The ASV was also lower for G7, G6, G I 1, G I, G12 and G2. But not all genotypes showing stable performance gave optimum grain yield. Therefore, only genotype G8, G3 and G6 showed stable high grain yield performance with relatively lower ASV value implying wider adaptability across test locations.
Table 4. Mean grain yield, regression coefficient, deviation from regression, IPCA scores ASV and GSI for small red bean genotypes across environments.
Genotypes Code MEAN Slop (bi) MS-DEV(s2di)
IPCAI 1PCA2 I PC A3 IPCA4 ASV GSI
GI 1.83 0.876 0.05 0.15 -0.19 -0.32 0.20 0.31 12G2 1.81 0.712 0.06 0.18 -0.26 -0.37 0.24 0.39 15G3 2.04 0.763 0.06 -0.18 0.35 0.19 0.31 0.46 12G4 1.86 0.866 0.05 -0.24 -0.12 -0.28 -0.18 0.41 15G5 2.01 1.035 0.07 -0.19 0.38 0.06 -0.24 0.49 15G6 2.01 0.939 0.01 -0.16 0.04 0.04 0.02 0.27 6G7 1.78 0.918 0.01 -0.10 0.04 0.11 0.12 0.17 12G8 2.04 1.04 0.02 0.20 -0.28 0.16 -0.33 0.43 10G9 1.81 0.66 0.07 -0.38 -0.26 -0.26 0.03 0.67 23G10 1.88 1.172 0.06 -0.19 -0.26 0.33 -0.25 0.40 12GI 1 1.87 1.065 0.08 -0.01 -0.28 0.46 0.07 0.28 9GI2 1.73 0.898 0.03 -0.14 -0.30 -0.04 0.05 0.38 18G13 1.64 1.085 0.08 0.12 0.41 -0.30 -0.20 0.45 25G 14 1.71 0.778 0.09 -0.31 0.46 -0.06 0.01 0.68 29G 15 1.76 1.133 0.08 0.35 0.14 0.33 0.26 0.59 25G16 1.45 1.544 0.23 0.88 0.11 -0.07 -0.13 1.44 32
A graphic representation of grain yield showed in AMMI biplot was generated using the genotypic and environmental score of the first tw'o IPCA (Fig. 1). Most of the genotypes showed negative interaction with environment B, E and F. On the other hand, G I, G2, G10, G il and G12 showed positive interaction with environment B, E and F. Genotypes 5, G13 and G14 were more specifically adapted to environment A. Whereas, GI5 was more adapted to environment D. G I, G2 and GI I were more adapted to environment B. Similarly G9, G10 and G12 were more adapted to environment E. The other genotypes which found around the origin (with the lowest vector from the origin) such as G6, G7, G8 and G3 were the most stable across the study environments.
73
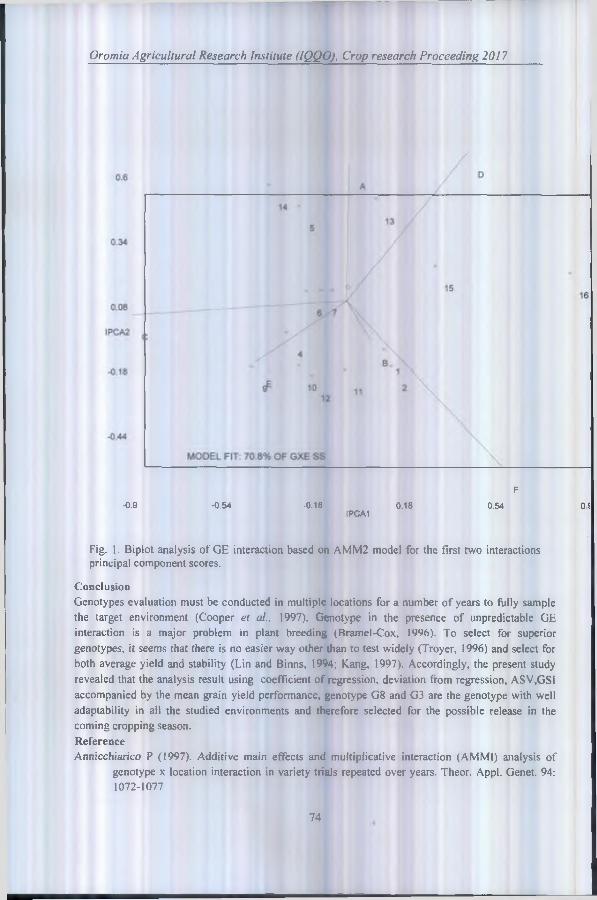
Oromia Agricultural Research Institute (IQQO). Crop research Proceeding 2017
F
-0.9 -0 .54 -0.18 0.18 0.54 OSIPCA1
Fig. 1. Biplot analysis of GE interaction based on AMM2 model for the first two interactions principal component scores.
ConclusionGenotypes evaluation must be conducted in multiple locations for a number of years to fully sample the target environment (Cooper et al.. 1997). Genotype in the presence of unpredictable GE interaction is a major problem in plant breeding (Bramel-Cox, 1996). To select for superior genotypes, it seems that there is no easier way other than to test widely (Troyer, 1996) and select for both average yield and stability (Lin and Binns, 1994; Kang, 1997). Accordingly, the present study revealed that the analysis result using coefficient of regression, deviation from regression, ASV,GSI accompanied by the mean grain yield performance, genotype G8 and G3 are the genotype with well adaptability in all the studied environments and therefore selected for the possible release in the coming cropping season.ReferenceAnnicchiarico P (1997). Additive main effects and multiplicative interaction (AM M I) analysis of
genotype x location interaction in variety trials repeated over years. Theor. Appl. Genet. 94: 1072-1077
74

Oromia Agricultural Research Institute (IOQO), Crop research Proceeding 2017
Asfaw A, T. Assefa, B. Amsalu, K. Negash, F. Alemayehu, and F. Grum (2008). Adaptation and Yield Stability of small Red Bean Elite Lines in Ethiopia. International J. o f Plant Breed, and Genet., 2(2): 51-63.
Bramel-Cox PJ (1996), Breeding for reliability of performance across unpredictable environments. In: Genotyp by environment interaction, Kang MS, and Gauch HG (Eds.) CRC Oress, Boca Raton, FL., 309-339
Broughton W.J., G.Hernadez, W.W.Blair, S.E.Beebe,P.Gepts. J.Vanderleyden (2003). Beans Phaseolus Spp.)Model food legumes, Plant Soil 252 (55-128)
Central Statistical Agency (CSA). (2014). Agricultural sample survey. Report on area and production of crop (private peasant holdings, meher season), vol.l, CSA, Addis Ababa.
Cooper M, Stucker RE, Delacy IH and Harch BD (1997). Wheat breeding nurseries, target environments and indirect selection for grain yield. Crop Sci., 37: 1168-1176
Crossa J (1990). Statistical analysis of multi-location trials. Advance in Agronomy, 44: 55-85 Crossa J, Fox PN, Pfeiffer WH, Rajaram S and Gauch HG (1991) AMMI adjustment for statistical
analysis of an interactional wheat yield trial. Theor. App Gent, 81: 27-37 Eberhart SA, Russel WA (1966). Stability parameters for comparing varieties. Crop Sci. 6:36 -40. Ethiopian Mapping Authority (EMA), National Atlas of Ethiopia, Ethiopian Mapping Authority,
Addis Ababa, (1988).Finlay KW, Wilkinson GN (1963). The analysis of adaptation in plant breeding program. Aust. J.
Agric. Res. 14:742-754.Gauch HG (1992). Statistical anlvis of regional yield trials. AMMI analysis of factorial designs. 1st
edn, Elsevier, New York, ISBN: 0-444-89240-0 Gauch HG and Zobel RW (1996). AMMI analysis of yield trials. In: Kang MS, Gauch HG (eds)
Genotype by environment interaction. CRC press Boca Raton FL Huehn M (1990). Nonparametric measures of phenotypic stability. Part 1: theory. Euphytica 47:189-
194.Kang MS (1997). Using genotype by environment interaction for crop genotype development. Adv.
Agron., 62: 199-252Kava Y. Palta C and Taner S (2002). Additive main effects and multiplicative interactions analysis of
yield performance in bread wheat genotypes across environments. Turk J. Agric. For. 26: 275-279
Lin CS and Binns MR (1994). Concepts and methods for analyzing regional trial data for cultivar and location selection. Plan breed Rev, 12: 271-297
Mekbib, F(2003). Yield stability in common bean (Phaseolus vulgaris L.) genotypes. Euph. 130/ 147- 153.
Noorul S, Mushaq A, Rakash V, Asifa B and Zahoor A (2015). Stability analysis in Wheat: An application of additive mani effects and multiplicative interaction. AJAR 10(4): 295-300
Peters, A (1993). China. Michigan Dry Bean Digest. 17(4): 18-20.’urchase JL, Hatting H and Vandenventer CS (2000). Genotype x environment interaction of winter
wheat in south Africa: II. Stability analysis of yield performance . South Afr J Plant Soil. 17: 101-107
Reza M, Mohammad A, Akbar S, and Amri D (2007). Identification of Stability and Adaptability in Advance Durum genotypes using AMMI analysis. Asian J. pi. Sci 6(8): 1261-1268
Shukla GK (1972). Some statistical aspects of partitioning genotype environmental components of variability. Heredity. 29:237-245.
Tamene T., S. G. Tadese (2014). Sites Regression GGE Biplot Analysis of Haricot Bean (Phaseolus vulgaris L .) Genotypes in three Contrasting Environments. World Journal of Agricultural
75
Oromia Agricultural Research Institute (IQQO), Crop research Proceeding 2017
Research. Vol. 2(5), 228-236;Available Troyer AF. 1996. Breeding for widely adapted popular maize hybrids. Euphytica, 92: 163-174
Tarakanovas P and Rusgas V (2006). Additive main effect and multiplicative interaction analysis of grain yield of wheat varieties in Lithuania. Agron Res, 4: 91-98
Wortmann, CS., and Allen, DJ (1994). African bean production environments; their definition, characteristics, and constraints. Network on Bean Research in Africa. Occasional Publication Series no. 11. pp. 47. Dar es Salaam, Tanzania.
Yan, W „ and Hunt LA. (2001). Interpretation of genotype x environment interaction for winter wheat yield in Ontario. Crop Sci 41:19-25
Genotypes by Environment interaction and stability analysis for Ethiopian Mustard (Brassica carinata L.) genotypesTadele Tadesse'*, Amanuel Tekalign1, Gashaw Sefera1. and Behailu Mulugeta1'Oromia Agriculture Research Institute, Sinana Agriculture Research Center, Bale-Robe, Ethiopia* Corresponding author: [email protected] or [email protected] genotype x environment interaction (G EI) has an influence on the selection and recommendation of genotypes. To this end, G x E interaction and grain yield stability study • was conducted for 17 advanced Ethiopian mustard genotypes across three districts (Sinana. Adaba and Agarfa) in the highlands o f Bale zone during 2014 and 2015 main cropping season. The design used was randomized complete block design with four replications and plot size of 7.2m2 (6 rows at 30cm spacing with row length o f 4m). The combined analysis fo r the mean grain yield was highly significant (p<0.01) for genotypes, environment and genotype x environment interaction. The mean seed yield of these six environments ranged from 0.9427 t h a ' for Agarfa in 2014 to 2.645 t ha ' for Sinana in 2014. Five genotypes namely G4, G7, G8. G9 and G14 gave mean seed yield above the grand mean. The analysis of variance for the AMMI model indicated that 49.59% of the total sum squares (TSS) was accounted by AMMI1 followed by AMMI 2(27.08%), AMMI 3(10.16) and AMMI 4 (7.87%). respectively. Therefore, 76.7% of the GE sum squares was justified by the first Uvo AMMI (AMMI I and AMMI 2) components. The regression coefficient (bi) ofgenotypes ranged from 0.629 to 1.345. Genotypes G7 was the most stable and well adaptive with optimum grain yield (2.21 t ha-1), bi- value nearer to unity (bi - 1.03) and minimum value of deviation from regression (0.12). Based on the AMMI Stability Value (ASV). G12. GIO, GI7. G5, G3, G2, G7, and G8 showed the lowest ASV indicating as they are most stable. However the most stable genotypes would not necessarily give the highest yield. Therefore, based on mean grain yield and the result of stability parameters such as ASV, bi and Genotypes Selection Index (GSI). genotype G7 was found the best candidate variety and thus recommendedfor possible release for the test environments and similar agro-ecologies.
Key words: AMMI, ASV, Biplot, GSI, mustard. Stability
IntroductionBrassica carinata (2n=34) is an amphidiploid (an allopolyploid behaving as a diploid) derived from an ancient cross between Brassica oleracea (2n=I8) and Brassica nigra (2n=]6 ) (Mabberley, 2008; Stace, 2010). Throughout most of Africa, where it is cultivated, it is used as leafy vegetable, but in Ethiopia, it is also grown for its seed oil (Mnzava and Schippers, 2007; NGRP, 2014; Taylor et al., 2010; Warwick et al., 2006). Wild forms of Brassica carinata have not been reported but there are diverse ecotypes (Alemayehu and Becker, 2002).The species is currently being bred to improve a variety of traits Brassica carinata likely originated in Ethiopia a few thousand years ago (Mnzava and Schippers, 2007; Warwick et al., 2006). Its exact native distribution is not well understood because it has been cultivated for a long time in Africa. Furthermore, it is often confused with B. juncea (Mnzava and Schippers, 2007). It is currently
76

Oromia Agricultural Research Institute (IQQO), Crop research Proceeding 2017
cultivated, native, and/or escaping from cultivation in many countries in Africa (Mnzava and Schippers, 2007). "Truly wild types are not known" (Mnzava and Schippers, 2007). Stability of yield under different environments is an important concern in plant breeding programs. The goal of plant breeders in crop improvement programs is to develop varieties, which are widely adapted to diversified environments. Some genotypes perform well in some environments but not so well in others (Dhillon et al., 1999). This variability in response is due to genotype * environment (G x E) interaction. These interactions of genotypes with environments can be attributed to environmental stresses like drought, temperature, rainfall, soil texture and diseases. The adaptability of a variety over diverse environments is usually tested by its degree of interaction with different growing environments. A variety or genotype is considered to be more adaptive or stable if it has a high mean yield but low degree of fluctuation in yielding ability when grown over diverse environments (Falconer, 1981). Failure of genotypes to respond consistently to variable environmental conditions is attributed to Genotype x Environment Interaction (GEI). Knowledge of GEI is advantageous to have a cultivar that gives consistently high yield in either a broad range of environments or to specific areas. It also helps to increase efficiency of breeding program and selection of best genotypes. Therefore, this work was initiated to see the adaptability and stability of mustard genotypes for the highlands of Bale zone.Materials and MethodsSeventeen mustard genotypes (Table I) including two released varieties and local cultivar were evaluated for two consecutive years (2014 to 2015) at three locations (Sinana, Adaba and Afarfa) in the highlands of Bale zone, southeastern Ethiopia. The genotypes were arranged using randomized complete block design with four replications with plot size of 7.2m' (6 rows at 30cm spacing in rows of 4m long). The four central rows were used for data collection and as net harvestable area. Combined analysis of variance using balanced ANOVA (Analysis of Variance) was computed using Cropstat software program. The additive main effect and multiplicative interaction (AMMI) analysis was performed using the model suggested by Crossa et al. ( 1991).The AMMI Stability Value (ASV) is the distance from the coordinate point to the origin in a two dimensional of Interaction Principal Component Axis (IPCA 1) score against IPCA2 scores in the AMMI model (Purchase et al., 2000). This weight is calculated for each genotypes and environment according to the relative contribution of IPCAI to 1PCA2 to the interaction SS as follows,
A S W l l ^ ( / P C 4 l 5 C 0 r e ) f + l I P C A 2 ] 2Where, is the weight given to the IPCAI value by dividing the IPCAI sum squares by the1PCA2 sum of squares. The larger the IPCA score, either negative or positive, the more specifically adapted a genotype is to certain environments. Smaller IPCA score indicate a more stable genotype across environment.Genotype Selection Index (GSI): a selection index GSI was calculated for each genotype which incorporate both mean grain yield and stability index in a single criteria (GSIj) as:GSIj= RYi +RASV,
77

Oromia Agricultural Research Institute (IQQO), Crop research Proceeding 2017
Table 1 Lists of Genotypes used in the studyGenotype code Genotype name
Gl YDZ1-A088/AG2 PGRC/E 21257G3 PGRC/E 210102G4 PGRC/E 208594/1G5 PGRC/E 20140/BG6 PGRC/E 21013G7 PGRC/E 21207/AG8 PGRC/E 208419/1G9 YDZ1-A088/5
G10 PGRC/E 208524/3G il PGRC/E 21007/BG12 PGRC/E 21312G13 PGRC/E 210114G14 PGRC/E 208584/4G15 ShayaG16 Yellow dodolaG17 Local check
Result and DiscussionThe pooled analysis of variance for mean grain yield revealed that highly significant differences (p<0.01) for genotypes, environment and GE interaction (Table 2). Similar findings has been reported by Ali et al. (2001); Mirza et al. (2002); Khan et al. (1988); Wani (1992); Aslam et al. (2015); Maqbool et al. (2015).Table 2. Combined analysis variance for mean seed yield of mustard tested at three locations (Sinana, Agarfa, and Adaba) for two years (2014-2015)
Source of variation
DF Meansquare
Year (Y ) 1 4.58072**Location (L) 2 64.6334**Replication 3 0.367477**Genotype (G) 16 0.556143**Y x L 2 7.29348**Y X G 16 0.484343**LX G L 32 0.385236**Y X L X G 32 0.278298**Residual 303 0.371115**Total 407 0.736771
** Significant at 1% level of probabilityThe significant G * E interaction (GEI) showed that ranking of genotypes were changed over locations for the grain yield performance due to the presence of crossover. This shows the difficulties that crop breeders encountered in selecting widely adapted varieties. These difficulties arise from the masking effects of variable environment (Goncalves et a l. 2003) over the genetic performance of the variety. Mean comparison for the tested genotypes indicated that maximum grain yield was obtained from G7 (2.21t/ha) followed by G9 (1.82t/ha) and G8 (1.78t/ha), whereas the least mean grain yield
78
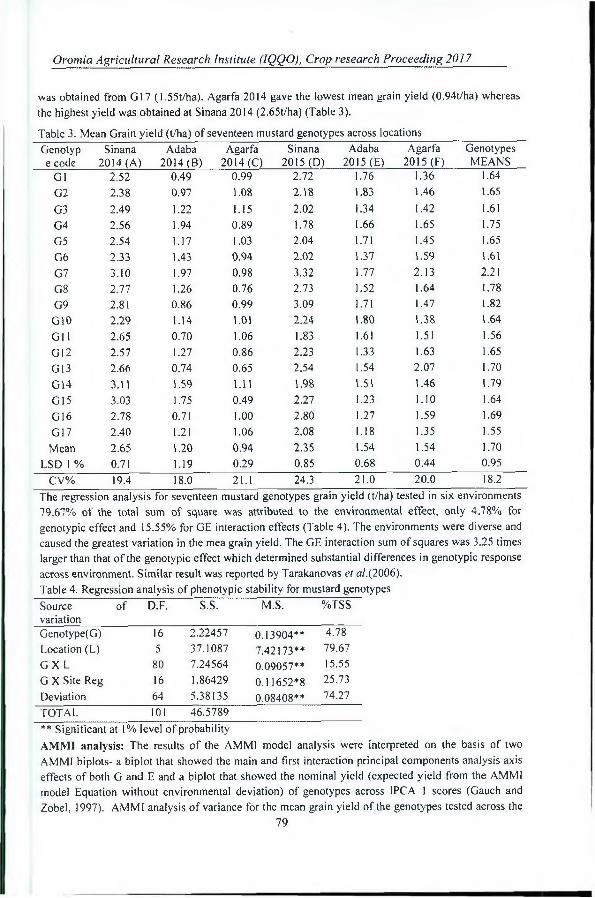
Oromia Agricultural Research Institute (IQQO), Crop research Proceeding 2017
was obtained from G17 (1.55t/ha). Agarfa 2014 gave the lowest mean grain yield (0.94t/ha) whereas the highest yield was obtained at Sinana 2014 (2.65t/ha) (Table 3).Table 3. Mean Grain yield (t/ha) of seventeen mustard genotypes across locationsGenotyp e code
Sinana2014(A)
Adaba2014(B)
Agarfa 20 F4 (C)
Sinana 2015 (D)
Adaba 2015 (E)
Agarfa2015(F)
GenotypesMEANS
GI 2.52 0.49 0.99 2.72 1.76 1.36 1.64G2 2.38 0.97 1.08 2.18 1.83 1.46 1.65G3 2.49 1.22 1.15 2.02 1.34 1.42 1.61G4 2.56 1.94 0.89 1.78 1.66 1.65 1.75G5 2.54 1.17 1.03 2.04 1.71 1.45 1.65G6 2.33 1.43 0.94 2.02 1.37 1.59 1.61G7 3.10 1.97 0.98 3.32 1.77 2.13 2.21G8 2.77 1.26 0.76 2.73 1.52 1.64 1.78G9 2.81 0.86 0.99 3.09 1.71 1.47 1.82G10 2.29 1.14 1.01 2.24 1.80 1.38 1.64G il 2.65 0.70 1.06 1.83 1.61 1.51 1.56GI2 2.57 1.27 0.86 2.23 1.33 1.63 1.65G13 2.66 0.74 0.65 2.54 1.54 2.07 1.70G14 3.11 1.59 1.11 1.98 1.51 1.46 1.79G15 3.03 1.75 0.49 2.27 1.23 1.10 1.64G I6 2.78 0.71 1.00 2.80 1.27 1.59 1.69G17 2.40 1.21 1.06 2.08 1.18 1.35 1.55Mean 2.65 1.20 0.94 2.35 1.54 1.54 1.70
LSD 1 % 0.71 1.19 0.29 0.85 0.68 0.44 0.95CV% 19.4 18.0 21.1 24.3 21.0 20.0 18.2
The regression analysis for seventeen mustard genotypes grain yield (t/ha) tested in six environments 79.67% of the total sum of square was attributed to the environmental effect, only 4.78% for genotypic effect and 15.55% for GE interaction effects (Table 4). The environments were diverse and caused the greatest variation in the mea grain yield. The GE interaction sum of squares was 3.25 times larger than that of the genotypic effect which determined substantial differences in genotypic response across environment. Similar result was reported by Tarakanovas et al.(2006).Table 4. Regression analysis of phenotypic stability for mustard genotypesSource of variation
D.F. S.S. M.S. %TSS
Genotype(G) 16 2.22457 0.13904** 4.78Location (L) 5 37.1087 7.42173** 79.67G X L 80 7.24564 0.09057** 15.55G X Site Reg 16 1.86429 0.11652*8 25.73Deviation 64 5.38135 0.08408** 74.27TOTAL 101 46.5789** Significant at 1% level of probabilityAM M I analysis: The results of the AMMI model analysis were interpreted on the basis of two AMMI biplots- a biplot that showed the main and first interaction principal components analysis axis effects of both G and E and a biplot that showed the nominal yield (expected yield from the AMMI model Equation without environmental deviation) of genotypes across IPCA 1 scores (Gauch and Zobel, 1997). AMMI analysis of variance for the mean grain yield of the genotypes tested across the
79

Oromia Agricultural Research Institute (IQQO). Crop research Proceeding 2017
studied environments revealed that significant variation was observed for genotypes, environment, and GE interaction, it was observed that 49.59% of the GE interaction sum of squares was accounted for AMMI I, followed by AMMI 2, (27.08%), AMMI 3 (10.16%) and AMMI 4 (7.87%) (Table 5). The first two IPCA scores were cumulatively accounted for 76.67% of the total GE interaction. This indicates the importance of taking GE interaction into consideration when targeting mustard into specific location. Furthermore, the use of AMMI model fit the data well and justifies the use of AMMf2 (Table 5).Table 5. AMMI analysis for variance for the effect of genotypes, environment and GE interaction on grain yield of mustardSource of Variation D.F. S.S. %TSS M.S.Genotype (G ) 16 2.22457 4.78 0.139036**Location (L) 5 37.1087 79.67 7.42173**G X L 80 7.24564 15.55 0.090571**AMMI 1 20 3.59298 49.59 0.179649**AMMf 2 18 1.96212 27.08 0.109007**AMMI 3 16 0.735865 10.16 0.045992**AMMI 4 14 0.570418 7.87 0.040744**GXE RESIDUAL 12 0.38426 5.30TOTAL 101 46.5789The stability parameters: The stability parameters from seed yield were calculated for 17 the genotypes (Table 6). The regression coefficient (bi) of genotypes ranged from 0.629 to 1.345. G9 had the highest regression coefficient (bi =1.345) followed by G16 (bi =1.306). The genotypes G il (bi=0.925), G I2 (bi=0.954), GI4 and (bi=0.958) had regression coefficient lower than unity (bi <I) indicating that these genotypes are suitable for unfavorable environments. The G7 (bi= 1.03) had regression coefficient close to unity and low deviation from regression indicated that this genotype is the most stable, adaptable and suitable for commercial cultivation across the tested environments. Similar results have been reported by AJi et al. (2002). Furthermore, the AMMJ Stability Value (ASV) which is the distance from the coordinate point to the origin in a two dimensional scatter gram of IPCA 1 scores against IPCA2 score should also seen to decide the stability of a genotypes (Purchase et al.. 2000). AMMI Stability Value (ASV) discriminated genotypes G 12, G10, G17, G5, G3, G2, G8, and G7, as the stable genotypes respectively. However, stability itself should not be the only parameter for selection, as the most stable genotype may not necessarily gives the best yield performance (Mohammadi et al.. 2007). Hence, simultaneous consideration of grain yield and ASV in single non-parametric index is needed. Therefore, based on the Genotype Selection Index (GSI) and all other parameters, genotypes G7 was considered as the most stable genotypes with high grain yield compared to the others (Table 6).
80

Oromia Agricultural Research Institute (IQQO), Crop research Proceeding 2017
Table 6. Mean grain yield, regression coefficient (bi), deviation from regression (s'di), IPCA scores ASV and GSI for 17 mustard genotypes tested across the environmentsGenotypes
CodeMEAN Slop
(bi)MS-DEV(s2di)
IPCAl 1PCA2 1PCA3 IPCA4 ASV GSI
Gl 1.64 1.198 0.16 -0.570 0.177 -0.161 0.201 1.06 27G2 1.65 0.824 0.05 -0.072 0.375 0.031 0.216 0.40 14G3 1.60 0.786 0.02 0.180 0.176 -0.077 -0.041 0.37 21G4 1.74 0.629 0.15 0.650 0.062 0.252 0.092 1.19 22G5 1.65 0.833 0.02 0.122 0.262 -0.040 0.079 0.34 12G6 1.61 0.728 0.02 0.277 0.074 0.259 0.040 0.51 24G7 2.21 1.03 0.12 -0.064 -0.590 0.293 0.137 0.60 11G8 1.78 1.212 0.02 -0.150 -0.297 0.073 0.032 0.40 12G9 1.82 1.345 0.10 -0.536 -0.162 -0.215 0.203 0.99 17G10 1.64 0.801 0.03 -0.001 0.258 0.071 0.391 0.26 13G il 1.56 0.925 0.10 -0.042 0.453 -0.145 -0.339 0.46 25G12 1.65 0.954 0.01 0.095 -0.064 0.147 -0.121 0.19 8G13 1.70 1.231 0.13 -0.381 -0.043 0.452 -0.412 0.70 17G14 1.79 0.958 0.12 0.400 -0.005 -0.373 -0.273 0.73 15GI5 1.64 1.23 0.21 0.389 -0.596 -0.376 0.041 0.93 25G16 1.69 1.302 0.09 -0.461 -0.144 -0.139 -0.246 0.86 20G17 1.55 0.812 0.02 0.160 0.066 -0.053 -0.002 0.30 20
Fig. 1 represents the AMMI biplot for grain yield of mustard genotypes grown in six environments. The mean performance and IPCA1 scores for both the genotypes and environments used to construct the bipiots are presented in Table 6. In AMMI biplot presentation, when a variety and environment have the same sign on IPCAl axis, their interaction is positive and if different their interaction is negative. If a variety or an environment has a IPCAl score of nearly zero, it has small interaction effects and thus considered as stable over wide range of environments. However, varieties with high mean performance and large IPCAl scores were considered as having specific adaptability to favorable environments. From this study, four genotypes G8, GI5, G9 and G16 were positively interacted with Environment A, B and D whereas other genotypes interact with these environments negatively. In similar fashion the rest genotypes were positively interacted with environment C, E and F. Those genotypes found around the origin are considered to be more stable. G4, G7, G8, G9 and G14 gave mean seed yield above the grand mean. However, regarding their stability G4, G14, G8 and G9 were though they had high mean performance these genotypes are more suited to specific environments. On the other hand G7 which gave the highest grain yield and having lower GSI is considered as the most stable genotypes for all the environments under study.
81

Oromia Agricultural Research Institute (IQQO), Crop research Proceeding 2017
ol? C =D ellom ena20l4
E=Gor
10 S'3
- 0.(813 12
4
916 I \ MODEL FIT: 76.7% OF GXE8 A=Ginnir
___________________________2014 _______________________B=Goro 2014
SS
D=Ginnir 2015 15
Fig. I . Biplot analysis of (9£ intera&it)jj( $ i3on AMM2 model tor the first two interactions principal component scores.ConclusionThis paper demonstrated the usefulness of AMMI model, and biplot analyses in interpretation of grain yield data from a multi environment experiment in identifying stable genotypes. The AMMI model analysis provided estimates of the magnitude and significance of the effects of GE interaction and its interaction principal components relative to G and E effects. Stability and adaptability of genotypes were estimated through AMMI biplots. Generally, based on mean grain yield, coefficient of regression and deviation from regression, ASV and GSI genotype G7 is the genotype with well adaptability in all the studied environments and therefore selected for the possible release in the coming cropping season.AcknowledgmentThe authors kindly acknowledged Oromia Agricultural Research Institute for the financial support, Sinana Agricultural Research Center for providing all necessary facilities and Pulse and Oil Crops Research Case team staffs for trial management and data collection.ReferencesAlemayehu, N., and H. Becker (2002). Genotypic diversity and patterns of variation in a germplasm
material of Ethiopian mustard (Brassica carinata A. Braun). Genetic Resources and Crop Evolution 49(6):573-582.
Ali, N., Javidfar, F., Attry AA. (2002). Stability analysis of seed yield in winter type rapeseed {Brassica napus) varieties. Pak. J. Bot., 34(2): 151-155.
Ali, N., M.S. Nawaz, M.Y. Mirza and G.R. Hazara. (2001). Stability analysis for pod yield in groundnut (Arachis hypogaeaL.). Pak. J. Bot., 33: 191-196.
Aslam, M., M.A. Maqbool, M. Yaseen, Q.U. Zaman. (2015). AMMI Biplot analysis for comparative evaluation of maize genotypes under different saline environments. Pak. J. Agric. Sci.. 52: 339 -347.
Crossa J, Fox PN, Pfeiffer WH, Rajaram S and Gauch HG. (1991) AMMI adjustment for statistical analysis of an interactional wheat yield trial. Theor. App Gent, 81: 27-37
82
Oromia Agricultural Research Institute (1QQO), Crop research Proceeding 2017
Dhillon, S.S., K. Sing and K.S. Bar. (1999). Stability analysis of elite strain in Indian mustard. Proc.I Oth Intl. Rapeseed Congress held at Canberra, Aust.
Falconer DS. Introduction to quantitative genetics. 2nd ed. Longman Group Limited, New York. (1981 );340.
Gauch, H.G., Jr., and R.W. Zobel. (1997). Identifying mega-environments and targeting genotypes. Crop Sci. 37:311-326.
Goncalves P, Bartoletto N, Martins R, and Gallo P. (2003). Genotype x environment interaction and phenotypic stability for girth growth rubber yield of Hevea clones in Sao Paulo State. Brazil Genetics and Molecular biology 26: 441 -448.
Khan, I.A., B.A. Malik and M. Bashir. (1988). Investigation of genotype x environments interaction for seed yield in chickpea. Pak. J. Bot.. 20: 201-204.
Mabberley, D. (2008). Mabberley's Plant-Book: A Portable Dictionary of Plants, Their Classification and Uses (3rd edt.). Cambridge University Press, New York. 1021 pp.
Maqbool, M.A., M. Aslam, H. Ali, T.M. Shah, B.M. Atta. (2015). GGE biplot analysis based selection of superior chickpea (Cicer arietinum L.) inbred lines under variable water environments. Pak. J. Bot., 47: 1901-1908.
Mirza, M.Y., A. Qayyum, A. Naazar, M.S. Nawaz and S.S. Mehdi. (2002). Stability analysis for yield in 22 soybean. Pak. J. Agric. Sci.
Mnzava, N. A., and R. R. Schippers. (2007). Brassica carinata A. Braun.: Internet record from Plant Resources of Tropical Africa (PROTA), Online Database.
Mohammadi R and Flaghparast R. (2007) Biplot analysis of multi-environment trials for identification of winter wheat mega-environment in Iran. World J.Agri Sci. 3: 475-480
Purchase JL , Hatting H and Vandenventer CS. (2000). G x E of winter wheat in south Africa: II. Stability analysis of yield performance . South Afr J Plant Soil. 17: 101 -107
Stace, C. (2010). New Flora of the British Isles (3rd ed.). Cambridge University Press, Cambridge, United Kingdom. 1130 pp.
Tarakanovas P and Rusgas V. (2006). Additive main effect and multiplicative interaction analysis of grain yield of wheat varieties in Lithuania. Agron Res, 4: 91-98
Taylor, D. C., K. C. Falk, C. D. Palmer, J. Hammerlindl, V. Babic. E. Mietkiewska, A. Jadhav, E. F. Marillia, T. Francis, T. Hoffman, E. M. Giblin, V. Katavic, and W. A. Keller. (2010). Brassica carinata - A new molecular farming platform for delivering bio-industrial oil feedstocks: Case studies of genetic modifications to improve very long-chain fatty acid and oil content in seeds. Biofuels, Bioproducts and Biorefining 4(5):538-561.
Warwick, S. I., R. K. Gugel, T. McDonald, and K. C. Falk. (2006). Genetic variation of Ethiopian mustard (Brassica carinata A. Braun) germplasm in western Canada. Genetic Resources and Crop Evolution 53(2):297-312.
tyani, S.A. (1992). Genotype x environment interaction for yield and its components in Indian mustard. Adv. Plant Sci.r 5: 421-425.
83

Oromia Agricultural Research Institute (IQQO), Crop research Proceeding 2017
Grain Yield Stability and GxE Interaction Study in Black Seeded Finger Millet (Eleusine Coracana Sub Spp. Coracana) GenotypesKebede Dessalegn1*, Dagnachew Lule2, Girma Chemeda1. Girma Mengistu2, Kassa Mamo1 Megersa Debela1 and Chemeda Birhanu1
'Bako Agricultural Research Center. P. O, Box 03, Bako, West Shoa, Ethiopia 2Oromia Agricultural Research Institute, Addis Ababa, Ethiopia
*Corresponding author: E-mail: kebeleni dgmail.comAbstractField trial vvas conducted using twelve black seeded finger millet (Eleusine coracana)genotypes across two locations (Bako and Gute) for three years (2014 - 2016) to identify stable high yielding, and widely adaptable genotypes. These genotypes were evaluated against local and standard checks (Degu) for grain yield, disease reaction and other agronomic traits. The additive main effect and multiplicative interaction (AMMI) model analysis of variance revealed highly significant (P<0.01) variations among environments, genotype. GxE interaction and Interaction Principal Component Analysis (IPCA-I). This indicates that, the genotypes respond differently over environments and the test environments are highly variable. Only the first IPCA-I was significant (p < 0.01) and contributed to 48.39 % o f the total genotype by environment interaction. It is found that BKFM0020, Acc. BKFM0006 and Acc. BKFM0010 were high yielder, have IPCA value closer to zero. Analysis using Eberhart and Russell model showed that genotypes BKFM0020. Acc. BKFM0006 and Acc. BKFM0010 were the most stable. Further, those selected potential candidate genotypes showed resistance to blast which is a major threat for finger millet production particularly in western Ethiopia. Genotype and genotype by environment interaction (GGE) analysis also revealed that these candidate genotypes were stable and high yielder. Therefore these genotypes were selected for possible release in the tested areas o f western Oromia and similar agro-ecologies.
Keyword: Genotypes; Finger millet (Eleusinecoracana) . Magnaportheoryze, GxE, GGE biplot, AMMI
IntroductionFingermillet (Eleusinecoracana (L.)Gaertn) is an ailotetraploid (2n = 4* = 36) annual cereal crop that includes two distinct subspecies: subsp. Coracana (cultivated finger millet) and subsp. Africana (wild finger millet) (Hilu, 1994). It is potentially a climate-resilient with highly nutritious and antioxidant properties (Kumar et al, 2017). Very importantly, finger milfet grain is gluten-free, rich in calcium, fiber, iron and, has excellent malting qualities (Chandrashekar, 2010 and Pradhan, et al, 2010). Beside its importance there are production limiting factors and productivity of finger millet crop including blast disease caused by Magna porthegrisea (anamorph pyriculariagrisea).Litnited availability of stable high yielding and disease tolerant finger millet variety is one of the major production constraints in the country.Exploitation of genetic variability is the most important tool in plant breeding and this has to be inferred by phenotypic expression. The performance of a genotype is dependent on its genetic potential, the environment, and the interaction between the genotype and the environment (Yan, 2001; Yan and Flunt, 2001). Genotypes by environment (GxE) interactions are considered to be among the major factors limiting response to selection and the efficiency of breeding programs. Plant breeders need to identify adaptable and stable high yielding genotypes with other desirable traits under varying environmental conditions prior to release as a variety (Flores et al.. 1998; Mustapha et al., 2001).An appropriate analytical model such as additive main effects and multiplicative interaction (AM M I) can treat both the additive main effect and multiplicative interaction component employing the analysis of variance (ANOVA) and Interaction Principal Components (IPCA) (Gauch and Zobel, 1996). Furthermore, AMMI bi-plot and GG bi-plot analysis are considered as an effective graphical
84

Oromia Agricultural Research Institute (IQOO), Crop research Proceeding 2017
tool to diagnose genotype by environment interaction patterns (Gauch and Zobel, 1996; Yuksel et a l, 2002. Also the regression model suggested by Eberhart and Russell (1966) allows for the computation of a complete analysis of variance with individual stability regression coefficient (bi) estimates and deviation from regression line (s:di). The model considers a stable variety as the one with a high mean yield, bi = 1 and s2di = 0. The Eberhart and Russell (1996) model and AMMi stability analysis could be the preferable tools to identify stable, high yielding and adaptable genotype (s) for varied or specific environments. The plant breeders need to identify adaptable and stable high yielding genotypes with other desirable traits under varying environmental conditions prior to release as a variety (Flores et a l, 1998; Showemimo et a l, 2000; Mustapha et a l, 2001). Therefore, Bako Agricultural Research Center collected different accessions of black seeded finger millet in order to address farmers’ preference for disease resistance and yield related traits. Thus, the primary objective of the study is to develop adaptable, stable high yielding and disease tolerant finger millet varieties for western Oromia and similar agro ecologies.
Materials and methodTwelve black seeded fmgev millet (Eleusin ecoracana (L.) Gaertn) genotypes including local and standard check (Degu) were tested at Bako and Gute for three cropping seasons (2014-2016). Genotypes were planted in a randomized completely block design (RCBD) with three replications in which each plot comprises of five rows having 5 m length. The spacing between rows and plants were 40 cm and 10 cm, respectively. Seed rate of 15 kg ha' 1 and fertilizer rate of 110 kg ha' 1 DAP (NPS) and 65 kg ha'1 UREA were used. UREA was applied in split form; half at planting and the rest half at 35 days after emergence. Management practices were done as per recommendations. The middle three rows were harvested and grain yield analysis was carried out using regression (Eberhart and Russell) and AMMI and GGE biplot to identify stable and widely adaptable high yielding genotypes.Data Analysis: Grain yield analysis was carried out using regression (Eberhart and Russell, 1966) and AMMI models in Agrobase software (Agrobase, 2000) and GGEBiplot using Gstat I5,h edition soft ware. Additive main effect and multiplicative interaction ( AMMI) model; The AMMI model equation: Yger =ji+ag+PeT£nXnygn5en+ £ger+pge; Whereas: Yger is the observed yield of genotype (g) in environment (e) for replication (r); Additive parameters: p is the grand mean; ag is the deviation of genotype g from the grand mean, Pe is the deviation of the environment e; Multiplicative parameters: A.n is the singular value for IPCA, ygn is the genotype eigenvector for axis n, and 5en is the environment eigenvector; Eger is error term and pge is PCA residual. Eberhart and Russell Regression Model: Yij = pi +bilj +S2dij; where Yij is the mean performance of the ith variety (1=1, 2, 3..., n) in the jth environment: jui is the mean of the ith variety over all the environments; bi is the regression coefficient which measures the response of ith variety to varying environments; S'dij is the deviation from regression of ith variety in the jth environment and Ij is the environmental index of the jth environment.
Result and DiscussionAnalysis of variance: The Analysis of Variance revealed significant differences between genotypes for the grain yield in all environments except Gute 2015 and 2016 (Table 1). Indicate that the presence of genetic variability among the genotypes in the wide-range of environments. The mean grain yield over the eleven tested genotypes ranged from 1.775 ton ha '(Degu) to 2.763ton ha'1 (BKFM0020) with a grand mean of 2.18 ton ha-1 (Table I).
85

Oromia Agricultural Research Institute (IQQO), Crop research Proceeding 2017
Table I : Finger millet black seeded Genotypes Mean Grain yield (ton ha ') over location across years
Mean Grain Yield tonha '
GenotBako Gute
2014 2015 2016 2014 2015 2016 Mean BSS215984 1.136 3.205 1.821 1.841 1.406 2.146 1.93 2216035 1.301 2.531 2.177 2.557 1.657 2.535 2.13 12)6045 J.042 3.064 1.412 2.304 1.374 2.670 1.98 1BK.FM0001 1.469 3.342 2.184 3.059 1.204 2.427 2.28 1BKFM0006 1.814 3.263 2.562 2.776 2.015 2.886 2.56 1BK.FM00I0 1.196 3.694 2.247 3.228 1.376 2.508 2.38 IBK.FM0014 1.578 2.979 1.748 2.776 1.338 1.813 2.04 2BKFM0020 2.560 3.849 2.721 2.889 2.146 2.410 2.78 1BKFM0023 1.617 3.367 1.984 3.327 1.788 1.900 2.33 2BKFM0024 0.938 2.92 1.669 3.189 1.458 2.44 2.10 2Degu 1.590 2.636 1.926 1.526 1.343 1.628 1.78 2Local 0.972 2.68 2.264 1.723 1.313 2.544 1.92 2Mean 1.435 3.127 2.06 2.6 1.535 2.325 2.180LSD 0.579 0.794 0.712 0.977 0.7692 0.945 0.796CV 23.80 15.00 20.30 22.2 29.200 23.900 00.00F-value * * ** ns ns nsBSS Blast Severity Score (1-5), CV=coefficient of variation, LSD= Least Significant Difference
Additive Main Effects and Multiplicative Interaction (AM MI) ModeI:The combined analysis of variance revealed highly significant (P<0.01) variations among environments, Genotypes, and Principal Component Analysis IPCA-1 and 1PCA-II but showed non-significant difference for genotype x environment interactions and the remaining (IPCA) interaction (Table 2). This indicates that, the genotypes respond differently over environments or genotypes responses were affected by an environment and the test environments are highly variable. The mean grain yield across six environments ranges from 1.435 ton ha'1 at Bako in 2014 to 3.127 ton ha'1 at Bako location in 2015 main cropping seasons (Table 1). i.e., not only the genotypes and locations, but also variations inseasons, and environmental conditions during different seasons significantly influence the grain yield performance. Similar results were reported by (Girma et al, 2011) in field pea and (Dagnachew et al, 2014) in Triticale.In the present study, considerable percentage of GxE interaction (48.39%) is explained by IPCA-I followed by 28.63% and 13.91% for IPCA-II and IPCA-II1, respectively. The first and second IPCA were significant, but the remaining IPCA axes were nonsignificant (Table 2). In the present study, we preferred the first IPCA used to describe genotype by environment interaction and placement on the bi-plots. Accordingly, the AMMI analysis result revealed that BKFM0020, BKFM006 and BKFM0010 were attained IPCA values (0.3531, -0.6458 and -0.2144) relatively close to zero and gave better yield, hence are better stable and widely adaptable genotypes across location with higher yield (Table 3).BK.FM0014, Acc. 216035, BKFM001 and Acc. 215984, with IPCA value close to zero (0.1353, - 0.1529, 0.2232 and -0.2789) and relatively stable but gave lower grain.Whereas, Degu and BKFM0024 were gave lower mean grain yield and scored IPCA value deviating from zero (-0.6818 and 0.5276), indicated, these genotypes are not stable (Table 3). AsnakeWorku et al. (2013) and Yuksel et al. (2002) reported results that are in agreement with the present study. The environments
86

Oromia Agricultural Research Institute (10Q0), Crop research Proceeding 2017
of Bako 2015 gave the higher environmental mean yields (3.13 ton ha'1). Similarly BKFM0020 followed by BICFM0010 gave the highest grain yield (3.849 and 3.694 ton ha'1) respectively at Bako location during the 2015 cropping season than they did at other locations and years (Table. 1). Therefore, BKFM0020, BKFM0006 and BK.FM0010 genotypes could be potential candidates for variety verification as revealed using AMMI model and observed in the actual field condition. Further analysis was made using the Eberhart and Russell regression model for confirmation of the result obtained by AMMI model and for proper recommendation of the genotypes.Table 2: Analysis of variance for Additive Main effects and Multiple Interaction (AMMI)
Source D f SS MS % GXE % cumulative Explained interaction
Environments 5 75.606 15.121**Genotypes 11 16.710 1.519**Genotype x Envt. Interactions 55 23.544 0.428*IPCA I 15 11.394 0.760 ** 48.39 48.39IPCA II 13 6.740 0.518 * 28.63 77.02IPCA III 11 3.276 0.298'15 13.91 90.93Residuals 132 35.702 0.270Grand mean = 2. 18; R2 — 0.7719; Coefficient of variation (CV, % ) = 23.98%; * ** = Significant atP < 0.05 and P < 0.01 levels, respectively.Table 3: Mean grain yield (GY) (ton ha' and IPCAI scores of genotypes
Description of Genotype name IPCAI Mean GYgenotypes score ton ha' 1
a Local -0.4924 1.92b BKFM0020 -0.3531 2.78c BKFM0023 0.3325 2.34d 215984 -0.2789 1.93e BKFM0006 -0.2144 2.56f BKFM0024 0.5276 2.10g BKFM0010 0.6458 2.38h 216045 0.3091 1.91i BKFM0014 0.1353 2.05j BKFM0001 0.2232 2.28k 216035 -0.1529 2.131 Degu -0.6818 1.78
EnvironmentsA Bako 2014 -0.4415 1.44B Bako2015 0.2633 3.13C Bako20l6 -0.7193 1.97D Gute 2014 1.0516 2.61E Gute2015 -0.2344 1.55F Gute20l6 0.0804 2.31
87

Oromia Agricultural Research Institute (lOQO), Crop research Proceeding 2017
AMMI Biplot showing genotypes grain yield stability and preferential adaptation over environmentusing Agro-base soft
Regression Analysis Based on Eberhart and Russell Model : Ebrehart and Russell (1996) model indicates, genotypes with high mean yield and regression coefficient (bi) equal to unity and deviation Ifrom regression (s2di) approach to zero would be selected. An ideal genotype has the highest average Igrain yield, a regression coefficient (bi) value of approximately one and a mean square deviation from regression (s“di) value close to zero. According to the model analysis result, pipeline genotypes BKFM0020, BKFM0006 and BKFM00I0 were the most promising candidates gave high grain yield (2.78, 2.56 and 2.38 ton ha'), with regression coefficients (bi) approaching one (0.742, 0.8176 and 1.0578) and acceptable deviation from regression (s~di) (0.0385, -0.0661 and -0.0248), respectively, implying that they are stable, widely adaptable and high yielder than the other genotypes (Table 3). Kebede et al., 2016 also reported similar result on stability and wide adaptability of finger millet genotypes tested over locations. These results are consistent with those reported by Farshadfar (2008).
The regression coefficients were significant!} different from unity and square deviation from regression (s:di) value deviate from zero for accession 216045 and regression coefficients was highly deviate from unity for Degu (Table 3). This indicates that these genotypes are less stable and adaptable over the environments. Genotypes. 215984. BKFM0023 and BKFM0014 were showed better stability and had wide adaptable over environment but inferior in grain yield. The result obtained using Eberhart and Russell (19%) model is highly agreed with AMMI model. Dogan et al.(2011) reported results that are in agreement with those in the present study.
88

Oromia Agricultural Research Institute (IQQO), Crop research Proceeding 2017
Table 4: Analysis of variance for grain yield using the Eberhart and Russell Regression Model
Source Df SS Mean square (MS)Total 215 38.62Varieties 11 5.57 0.506**Env.+ ir\ Var.x Env. 60 33.05 0.551Env. in linear 1 25.20Var. x Env. (linear) 11 2.01 0.184NsPooled deviation 48 5.82 0.121♦ Grand mean = 2.18; R2 = 0.8239; Coefficient of variation (CV. %>) — 24.51%, ** * ** .
Significant at P < 0.05 and P < 0.01 levels, respectively.Table 5: Regression coefficient (bi) and squared deviation from linearity of regression (s2di) by the
test genotypes revealed using Eberhart and Russell model.
GenotypesRegression coefficient (bi)
Squared deviations from regression (S2di)
Grain yield (ton ha-1)
Local 0.8531 0.1408 1.92BKFM0020 0.7416 0.0385 2.78BKFM0023 1.1115 0.0702 2.34215984 1.0165 0.0095 1.933KFM0006 0.8176 -0.0661 2.56BKFM0024 1.2493 0.0580 2.103KFM0010 1.0578 -0.0284 2.38216045 1.1817 0.1351 1.91BKFM0014 0.9784 -0.0117 2.05BKFM000I 1.2590 -0.0387 2.28216035 0.7171 -0.0184 2.13Degu 0.4956 0.0358 1.78Local 0.8531 0.1408 1.92BKFM0020 0.7416 0.0385 2.78BKFM0023 L I 115 0.0702 2.34
♦ Standard error o f beta = 0.2403; t - Tons; ha = HectareOomporison tXplot <~TotaU - 7’e.»40X»)
u L ® = E
Fig 1 :GGEBiplotanalysis showing grain yield stability of genotypes and environments In generally, analysis, AMMI, GGE biplot and Eberhart and Russell model revealed that genotype BKFM0020, BK.FM006 and BKFM0010 were stable and high yielding genotypes and therefore,
89

Oromia Agricultural Research Institute (IQQO), Crop research Proceeding 20 J 7
selected and proposed to W T for possible release under wider environmental conditions western Oromia and similar agro-ecologies of the country.ConclusionThe experiment was conducted using twelve finger millet genotypes and evaluated against standard and local checks for three years at Gute and Bako. Analysis of variance (ANOVA) showed significant variation among the genotypes for grain yield at all environments except Gute 2015 and 2016.The candidate finger millet genotypes (BKFM0020. BKFM0006and BKFM0010) gave high grain yield, showed better adaptability and stable performance than the standard and the local check. The genotypes were also relatively tolerant to blast disease. Considerable percentage of GxE interaction (48.39%) is explained by IPCA-l followed by 28.63 and 13.91% for IPCA-11 and 1PCA-II1, respectively. The first and second IPCA were significant, but the remaining IPCA axes were nonsignificant. AMMI analysis result revealed that BKFM0020, BKFM006 and BKFM0010 were attaining IPCA values (0.3531, -0.6458 and -0.2144) relatively close to zero and gave better yield, hence are better stable and widely adaptable genotypes across location with higher yield. BKFM0014, Acc. 216035, BKFM001 and Acc. 215984, with IPCA value close to zero (0.1353, -0.1529, 0.2232 and -0.2789) relatively stable but gave lower grain yield. Whereas, Degu and BKFM0024 were gave lower mean grain yield and scored IPCA value deviating from zero (-0.6818 and 0.5276), indicated, these genotypes are not stableAccording to Eberhart and Russell models (regression analysis), the genotypes BKFM0020, BKFM006 and BKFM0010 were stable and widely adapted. The regression coefficients were significantly different from unity and square deviation from regression (s2di) value deviate from zero for 2 J 6045 and regression coefficients was highly deviate from unity for Degu . This indicates that the genotypes are less stable and adaptable over the environments.Based on the regression, AMMI and GGE biplot analyses, therefore, BKFM0020, BKFM006 and BKFM0010 were the most stable and high yielding genotypes and as a result, they were proposed for variety verification at Bako, Gute and similar agro-ecologies.AcknowledgmentsWe would like to acknowledge Oromia Agricultural Research Institute for funding the research. The authors also express their gratitude to Bako Agricultural Research Center and all staff members of the Cereal Technology Generation Team for their devoted experimental field management and data collection during the whole implementation of the experiment.ReferencesChandrashekar A. 2010. Finger millet: Eleusin ecoracana. Adv FoodNutr Res. 59:215-62 Eberhart, S. A. and Russell, W.A. 1966. Stability Parameters for Comparing Varieties. Crop Science,
6: 36-40.Eberhart, S.A. and Russell, W.A. 1966.Stability parameters for comparing varieties. Crop Sci. 6:36-
40.Flores, F., Moreno, M.T. and Cubero, J.l. 1998.A Comparison of Univariate and Multivariate
Methods To Analyze GXE Interaction. Field Crops Res. 56: 271-286.Gauch, H. G. and Zobel, R.W. 1996. AMMI Analysis of Yield Trials. In: Genotype by Environment
Interaction, pp. 85-122, (Kang, M. and Gauch. H. eds). Boca Raton. CRC Press, New York. Flilu K.W. 1994. Validation of the combination Elensinecoracana subspecies Africana Phytologia',
76(5):410—11Kumar A, Metwal M, Kaur S, Gupta AK, Puranik S, Singh S, Singh M, Gupta S, Babu BK, Sood S.
2017. NutraceuticalValue of Finger Millet (Eleusinecoracana (L.) Gaertn.), and Their Improvement Using Omics Approaches. Plant Sci. BMC Genomics 18:465
90

Oromia Agricultural Research Institute (IQQO), Crop research Proceeding 2017
Mustapha, A.A., Showemimo, F.A., Aminu-kano, A. 2001. Yield Stability Analysis of Promising Triticale Cultivars in Nigeria. J. Arid Agric. 11: I - 4. 20
Pradhan A, Nag S, Patil S. 2010. Dietary Management of Finger Millet (Eleusin ecoracana L. Gaerth) Controls Diabetes. Curr Sci. 98 (6):763-5
Yan, W. and Hunt, L.A. 2001 .Interpretation of Genotype X Environment Interaction for Winter Wheat Yield In Ontario. Crop Science 41: 19-25.
Yan,W. 2001. GGE Biplot-A Windows Application for Graphical Analysis of Multi-Environment Trial Data and Other Types of Two-Way Data. Agronomy Journal 93: 1111-1118.
Yuksel Kaya, Palta, C. and Taner, S. 2002. Additive Main Effects and Multiplicative Interactions Analysis of Yield Performances In Bread Wheat Genotypes Across Environments. Turk J Agric For. 26:275-279.
Combining Ability and Heterotic Grouping of Maize (Zea mays L.) Inbred Lines for Yield and Yield Related Traits
'Natol BakalaHundera,~ Birahanu Abate, 3Mandefro Nigussie 'Yabello Pastoral and Dry Land Agricultural Research Center
:School of Plant and Horticultural Science, Hawassa University, Ethiopia ' Oxfam America Deputy Regional Director, Ethiopia
Corresponding Author: E-mail:-natymartyko@gmailcomFax: +2510464460261. P.O.Box 85 AbstractA field experiment was conducted at Hawassa during the 2015 cropping season to estimate combining ability of elite maize genotypes. Line x tester analysis involving 64 crosses was generated by crossing 32 selected maize inbred lines with two testers. The experiment was designed using alpha-lattice design with two replications. Analysis of variance showed that, mean squares of genotypes were significant for all traits except, ear position and cob per plant. Cross L31xT2 manifested highest mean grain yield (8.68 t/ha) and highest specific combining ability's effect (1.85 t/ha). L8 exhibited the highest GCA whereas L32 exhibited the lowest GCA effect. Based on their mean grain yield, and SC A L31XT2, L8XT1. L26XT1, L23XT2, IJ2XT2, L16XTI. L23XT1, L21XT1. L21XT2. L8XT2 andL15XT2 are promising crosses that could go forward across location testing or next steps in the breeding process.
Keywords: Combining ability, Cross, Heterotic grouping, Inbred line, Zea mays.IntroductionImproving yield is the main objective of breeding programs in grain crops. Developing high yielding hybrids along with other favorable traits is receiving considerable attention to increase yield per unit area. Hybrid cultivars played a great role in increments of maize per unit area. Early in the development of hybrid maize, information on combining ability among maize germplasms is essential in maximizing the effectiveness of hybrid development (Kanagarasuef al.. 2010). Combining ability is one of the powerful tools to identify the best combiner parents in a series of its crosses and it provides information on the nature and magnitude of gene actions (Uddin et al., 2008).
The two types of combining ability are: general combining ability (GCA) and specific combining ability (SCA). GCA is the average performance of parents in a series of crosses and SCA designates those cases in which certain combinations perform relatively better or worse than would be expected on the basis of average performance of parents. Heterotic grouping is a group of related or unrelated genotypes from the same or different populations that indicate similar combining ability and heterotic response when crossed with testers from other genetically diverse germplasm groups (Melchinger et al., 1998).
91
Oromia Agricultural Research Institute (IQQO), Crop research Proceeding 2017
Line x tester mating design is an efficient procedure as it allows the inclusion of a large number of entries, estimate combining ability, gene effects, male and female relationship, heterotic grouping and aid to select desirable parents and crosses (Sharma, 2006). The knowledge of combining ability is important to develop desired hybrids (Mwimalier al., 2015). Thus, this study was carried out to estimate general and specific combining abilities of maize inbred lines for yield and yield related traits, to identify suitable parents for developing maize hybrids and to determine heterotic groups of inbred lines.
Materials and MethodsInbred lines (32) coded as L I, L2...L32 and two testers coded as T! and T2 were crossed in line x tester mating scheme to generate 64 crosses (Kempthome, 1957). Crosses were planted along with similarly maturing checks BHQPY-545 and BH-546 at Hawassa. The house is situated in 7°4rN and 38°31'E latitude and longitude, respectively, at an altitude of 1700 m.a.s.l. in the central rift valley of Ethiopia. The experiment planted by using a-lattice design 6x11 arrangement with two replications (Kempthome, 1957). Each block comprises of 11 units having 5.1 m long and 9.75 m width with the spacing of 0.75 m between rows and 0.30 m between plants. All cultural practices performed as per required. Data like days to maturity (DM), field weight, seed moisture content and thousand kernel weight (TKW ) were collected plot based while data like plant height (PH), ear height (EH), ear length (EL), number of rows per ear (NRPE), ear diameter (ED) and number of kernels per row (NCPR) collected in plant bases. Biomass (BM ) and grain yield (G Y) calculated by using the following formula
Grain yield (t ha1) — eig ,.*li0°- MC)*0. 8<17 * I0:000J ' n x 85 X 3.85 x 100 kgWhere: MC = Moisture content of grain at harvest, 0.8= Shelling percentage, 85- Standard moisture content of grain, n = number of plants harvested, 17= Total number of plants in a plot, 10000 = Area of hectare in square meters Data AnalysisAnalyses of variance for all crosses were computed using SAS computer software.The mathematical model used for the combining ability analysis is given as:Yijk=n+rk+li +tj+ (1 x t) ij+eijkWhere; Yjjk= the value of a character measured on i^x j* progeny in k!h replication, |i = general mean, rw=effect of k"’ replication, 1( = general combining ability (GCA) effects of i,h line, tj = general combining ability (GCA) effect of the j ,h tester, (1 x t) „= specific combining ability (SCA) of the ith line and j'1' tester, eyk= experimental error of ijk,h observation Estimation of general combining ability effects (GCA)Means of each cross were used for analysis of combining ability. For each trait, general combining ability (GCA) effects were estimated using the formula suggested by (Patterson and Williams, 1976)GCA of lines: gj= i - —^
& tr ireWhere; xi... total of ilh lines over testers, x...= grand total, I = number of lines, t = number of testers and r= number of replicationsGCA of testers: gi=^: — —° lr IrtWhere; x.j =total of the j lh tester over lines, x...= grand total, 1 = number of lines, j = number oftesters and r = number of replicationsEstimation of specific combining ability effects (SCA)SCA effects were estimated as deviation of each cross mean from all hybrids mean adjusted for corresponding GCA of parents.
92

Oromia Agricultural Research Institute (IQQO), Crop research Proceeding 2017
Specific combining ability of line x tester^
^ r tr rl IrtWhere; xij= value of the j "1 lines with i"' testers, Xi= total of ith over all tester, xj.= total of j lh tester over all lines, x...= grand total crosses, 1= number of lines, t= number of testers and r= number of replication.Heterotic grouping: Groupings of inbred lines were conducting based on SCA effect of crosses and mean grain yield performance. Inbred lines showing positive SCA effect and with greater or equal mean grain yield with tester (A) CML 159 were grouped under heterotic group “A” . Similarly, inbred lines displaying positive SCA effect with tester “B” and mean grain yield greater or equal to mean yield of the hybrid grouped under heterotic group “B” (Menkire/ al.. 2008).Results and DiscussionMean squares due to crosses were significant P < .05 for days to maturity, number of rows per ear, number of kernels per row, ear length, grain yield, thousand-kernel weight and biomass. Thisndicates that, the crosses were sufficiently different from each other for these traits and hence,
selection is possible to identify the most desirable crosses. In line with this finding, (Shushav et al. 2013) found significant differences among crosses for yield and yield related traits. The mean square due to lines showed significant P < .01 for traits like grain yield, thousand kernel weight, ear length and days to maturity (Table 1). Significant differences among lines indicate greater diversity in the parental lines. (Hailegebrial et al. 2015) found a significance difference between GCA effects of lines in grain yield, days to maturity, plant height, ear height, ear length, number of rows per ear and number of kernels per row. Different authors (Mosa, 2010 and Girma et al., 2015) reported similar results. The mean square due to testers showed significant differences at P <.05 for days to maturity and ear diameter (Table I ). These results were consistent with (Melkamu et al., 2013). In contrast to this finding, (Shushav et al. 2013) and Ram et al. 2015) reported significance difference between testers in grain yield and ear height of maize.Estimation of General Combining Ability Effects: Estimates of GCA effects of the 32 lines and 2esters are presented in table 2. Line L8 exhibited the maximum GCA effect (1.97 t/ha) followed by L23 which exhibit (1.72 t/ha), whereas L32 exhibited the lowest GCA effect of all (-1.51 t/ha) followed by L2 which exhibit (-1.21 t/ha), the result revealed the existence of the best and poorest general combiners in the group of inbred lines studied, respectively.nbred lines possesses good GCA effect were L2, L I2, L21, L23 and L31 based on grain yield which
could be utilized in maize grain yield improvement programs. Both positive and negative GCA effects reported for grain yield in maize by several investigators (Chandel and Mankotia, 2014 and Melkamu et al.. 2013). In contrast to the current finding, (Bayisa, 2008) found non-significant GCA effects for grain yield in line x tester analysis of maize inbred lines. For days to maturity three lines L I3, L18 and L27 showed negative GCA effects. Negative GCA effects indicate that they may be good sources of genes for earliness and positive GCA increases the tendency of late maturity. The current results are in general agreement with the findings of many researchers (Mosa, 2010; Rahman et al.. 2010 and Girma et al., 2015) reported significant positive and negative GCA effects for days to maturity. The GCA estimates ranged from -18.55 to 23.95 cm in plant height. Among all lines, thirteen inbred lines showed positive GCA effects. Line, L5 and L31 showed significant positive GCA effects indicating that these lines significantly contributed to taller plant stature. On the other hand, nineteen lines showed negative GCA effects. Line LI5 showed significant negative GCA effects, indicating that these lines contributed to reduced plant stature in their crosses. None of the testers showed significant GCA effects in plant height. In line with the present finding (Rahman et al.. 2010 and Girma et al..2015) found significant positive and negative GCA effects for plant height.
93

Oromia Agricultural Research Institute (1QQO), Crop research Proceeding 2017
With respect to ear height, GCA estimate of lines ranged from -5.98 to 4.02cm (Table 2). Three lines L7, L I 1 and L30 showed negative and significant GCA effects, whereas, six lines L5, L8, L12, L17, LJ9 and L3I showed positive and significant GCA effect. L7 (-5.98 cm), L I I(-4.84 cm) and L30 (- 3.73 cm ) were good general combiners while L8 and L 12 showed the highest GCA effects (4.02 cm), which indicates the tendency to increase ear height.Table I. Mean squares for yield and yield related traits of 64 maize testcrosses and 2 checks evaluated at Hawassa, 2015Source variation df DM PH EL NRPC NCPR ED TSW GY BM
(days) (cm) (cm) (no) (no) (cm) (g) (t/ha) (t/haCrosses 63 15.4** 441.3"1 5.67* 0.54* 13.9* 0.13re 4579** 3.00** 3.44Line (GCA) 31 11.9** 414.3ra 7.23** 0.46** 13.5* 0.12"5 5626** 2.96** 2.96Tester(GCA) 1 40.5** 30.0 “ 0.28 0.002"5 5.28 “ 0.48* 66841,5 5.48 “ 2.01Line x Tester 31 18.0** 481.6'” 4.24™ 0.6** 14.5* 0.13"5 3464 05 295.60** 3.97(SCA)Error 60 3.82 290.34 3.01 0.32 8.55 0.09 50.0 1.58 1.42Cv 2.01 9.44 12.53 5.50 9.17 7.33 20.34 27.02 22.0
94

Oromia Agricultural Research Institute (IQQO), Crop research Proceeding 2017
Table 2. Estimates of general combining ability effects for grain yield and yield related traits of maizelines and tester studied in line x tester crosses at Hawassa 2015
s DM PH(cm) EH(cm) EL(cm) NRPC NKPR ED(cm) TKW(g) GY(t/ha)
L! -0.42 -5.55 -1.98 -0.39 0.87** -0.67 0.04 -2.70 -0.01L2 2.33 -12.55 -1.23 -1.22 -0.33* -1.77 -0.07 -1.45 -1.21**L3 1.08 -13.05 -1.98 -0.68 0.17 0.63 -0.13 -30.20** -0.32L4 '0.67 -2.05 0.27 0.27 -0.03 1.98 -0.08 -8.95* 0.08L5 -0.17 23.45* 3.52* 0.80 -0.28 -0.97 0.16 21.05** 0.51L6 1.83 -8.05 -1.98 -3.26** -0.33* -2.82 -0.24* -66.45** -0.52L7 -0.17 -5.55 -5.98* -0.41 -0.23 -1.87 0.00 -21.45** -0.54*L8 1.83 16.95 4.02* 2.29** 0.27 1.93 0.31* 39.80** 1.97**L9 0.58 -11.05 -1.73 -1.70 0.32* -1.67 -0.14 -30.20** -0.77*JO 2.83 -7.05 -1.23 0.27 0.27 0.93 -0.09 -28.95** -0.41.11 5.08 -18.55* -4.48* -2.12** -0.03 -1.47 -0.15 -33.95** -0.72**.12 -2.42 16.45 4.02* 1.19 0.02 1.78 0.20 41.05** 1.23**.13 -0.92 -0.05 1.02 0.24 0.17 0.78 0.26* 49.80** 0.35.14 1.58 3.45 0.27 -1.39 -0.38* -0.97 -0.24* -23.95** -0.98**.15 -2.42 3.45 0.52 -0.27 0.27 -0.47 0.13 9.80* 0.43.16 -1.17 -2.05 1.02 0.65 -0.08 0.48 0.18 6.05 0.40.17 0.83 4.45 3.52* 1.16 0.32 0.18 0.18 24.80** -0.77**.18 -0.67 7.45 -0.23 0.24 0.27 -2.62 0.08 21.05** 0.32.19 -0.17 2.45 3.77* -1.65* -0.38* -1.27 -0.16 -38.95** -0.19.20 0.33 -2.05 -0.48 -0.21 -0.18 0.78 -0.26* -50.20** -0.70*121 -3.42 1.45 -2.48 2.44** 0.17 0.98 0.18 49.80** 1.36**J22 -0.67 -2.05 2.52 0.73 -0.43* -0.07 -0.01 -7.70* -0.0001.23 -2.17 10.95 0.27 2.89** -0.03 3.23* 0.28* 116.05** 1.72**.24 -0.42 -9.55 1.27 -0.46 -0.23 -1.62 -0.33** -28.95** 0.49.25 0.08 -4.05 -0.98 -0.24 -0.7** -2.12 -0.05 29.80** -0.64*L26 -0.17 5.95 -0.23 1.91* 0.07 1.18 -0.08 41.05** 0.20.27 -2.17 -1.55 -1.23 -0.31 0.17 4.78** -0.(3 -33.95** -0.60*L28 -0.67 3.45 0.27 0.54 0.62* 1.03 0.14 -12.70** 0.08L29 -0.92 -2.05 -0.98 -1.14 -0.03 -1.02 -0.14 -25.20** -0.93**L30 0.33 -6.55 -3.73* -0.29 -0.13 0.73 0.03 -12.70** 0.25L31 L33 23.95* 3.77* 0.89 -0.03 2.73 0.09 28.55** 1.48**L32 -0.17 -10.55 1.02 -0.77 -0.23 -2.87 -0.03 -20.20** -1.51**Um-) 0.84 6.90 2.89 0.61 0.19 1.07 0.09 2.50 0.19-gj Tines 1.38 12.05 6.06 1.23 0.40 2.07 0.21 5.00 0.84:ster 1 0.56 -0.48 -0.88 0.05 -0.02 -0.20 0.06 7.2** 0.21**:ster 2 -0.56 0.48 0.88 -0.05 0.02 0.20 -0.06 -7.2** -0.2)**E m± 0.24 2.13 1.07 0.22 0.07 0.37 0.04 0.88 149.26
____ 0.35 3.01 1.51 0.31 0.10 0.52 0.05 1.25 0.211SE (m±.) - standard error o f mean. SE (gi - gj) lines -standard error o f difference in lines. SE (gi - gj) testers = standarderror o f difference in testers **highly significant P < .01 * significant P< 0.05
The GCA estimates in ear length ranged from -3.26 to 2.89 cm (Table 2). Four lines, (L 8, L21, L23 and L26) showed positive and significant GCA effects. Positive GCA effect contributes to increased grain yield in its hybrid combinations. On the other hand, three lines (L8, L I I and L I9) showed negative GCA effects. The GCA estimates of number of rows per cob of parental lines ranged from - 0.73 to 0.62 (Table 2). Three lines (L I, L9 and L28) showed positive and significant GCA effects. Similarly, Girma et al. (2015) reported significant positive and negative GCA effects in ear height and number of rows per cob.Positive GCA effect in the number of rows per cob is very important yield parameter directly contributes to increased grain yield in its hybrid combinations. In contrast, six lines (L2, L6, L I4, L I9, L22 and L25) showed significant negative GCA effects (Table 2). Similarly, Melkamu et a l
95

Oromia Agricultural Research Institute (1QQ0), Crop research Proceeding 2017
(2013) reported significant positive and negative GCA effects in ear height and number of rows per cob. The GCA estimates of inbred lines ranged from -2.87 to 4.78 in number of kernels per rows (Table 2). Two lines (L23 and L27) showed positive and significant GCA effects indicate good general combination for this trait and contributes to increased grain yield in its hybrid combinations. Hence, lines with high GCA effects for this trait can be suitable parents for hybrid formation as well as for inclusion in future breeding programs. Such parents contribute favorable alleles in the process of synthesis of new varieties. Habtamu and Hadji (2010) reported similar result. The GCA of inbred lines ranged from -0.33 to 0.31cm in ear diameter (Table 2). Three lines L8, L13 and L23 showed positive and significant GCA effects to the desirable direction and contribute to increased grain yield in its hybrid combinations. Four lines L6, L I4, L20 and L24 showed significant and negative SCA effects (Table 2). (Kamara et al. 2010) also reported significant positive and negative ear diameter. The GCA effects of inbred lines ranged from -66.45 to 116.05 g in thousand-kernel weight (Table 2). Lines L23, L13 and L21 were good general combiners while L6, L19 and L20 were poor combiners for thousand-kernel weight (Table 2). Lines with positive GCA effect could have vital potential for genetic improvement of this trait in breeding programs. Tester 1 is a best combiner for plant height (- 0.48), ear height (0.88), ear length (0.05), ear diameter (0.06), thousand kernel weight (7.20), grain yield (0.21) while Tester 2 is a best combiner for days to maturity (-0.56), number of kernels per row (0.02) and number of rows per cob (0.2) (Table 2 ). Shushay et al. (2013) found best combiner tester for thousand kernels. Wali et al. (2010) reported best combiner tester for grain yield, number of rows per cob and ear length.Estimation of Specific Combining Ability Effects: With respect to grain yield, both positive and negative significant estimates of SCA effects observed among crosses. Estimation of SCA effects in crosses ranged from -1.85 to 1.85 t ha1 (Table 3). Crosses L6xTl, LI5xT2, L17xTI, L25xT2, L26xTI and L31 xT 1) were best specific combiners while crosses like L6xT2, L15xTI, L17xT2, L25xTl, L26xT2 and L31xT2 were poor specific combiners. Best combiner crosses in estimation of SCA to use in maize improvement program. A current finding is pact with die report of (Shushay et al., 2013). For days to maturity, estimates of SCA effects ranged from (-4.69 to 4.69 days) (Table 3). Four crosses LlOxTl, L Ilx T I, L12xTl, L18xT2 and four crosses LlxT2, LllxT2, Ll2xT2 and L18xTl had significantly positive and negative SCA effects difference respectively. Significant negative SCA effects in days to maturity indicate that these crosses were good specific combiners and were effective if exploited to develop early maturing maize varieties. In agreement with current study, Melkamu et al. (2013) reported significant positive and negative estimates of SCA effects for days to maturity. Estimates of SCA effects in plant height crosses L2xT2 (29 cm) and L2xTI (-29 cm) were good and poor specific combiners, respectively (Table 3). A cross with highest negative SCA effect is advantageous in case of lodging resistance development. Ali et al. 2012 and Ali et al. 2014 reported significant positive and negative SCA effects in maize.For ear height crosses, LI9xT2 (15.63cm) best specific combiner while cross LI9xTl (-15.63cm) poor specific combiner (Table 3). Positive SCA efTects in ear height (ear placement) causes lodging while negative SCA effect increases wild animal attack, which could ultimately affect the quantity and quality of final grain yield. Likewise, EL-Hosary and Elgammaal (2013) and Shushay et al. (2013) reported significant negative and positive estimates of SCA effects. The estimates of SCA effects for crosses in number of row per cob ranged from -0.88 to 0.88 (Table 3). Crosses with significant positive SCA effects were (L7xT2, and L3lxT2) were good specific combiners, while crosses with significant negative SCA effects (L7xTl and L31xTl) were poor specific combiners for number of rows per cob (Table 3). For a number of kernels per row estimates of SCA effects ranged from -4.05 to 4.05 (Table 3). Cross with significant positive SCA effects (L25xTI) were good specific
96

Oromia Agricultural Research Institute (IQQO), Crop research Proceeding 2017
combiner. Similarly, (Shushay et al. 2013) reported significant positive and negative SCA effect for number of kernels per row. Estimates of SCA effects for ear diameter ranged from -0.37 to 0.37cm. Six crosses showed significant estimates of SCA effects (Table 3). Good specific combiner was L23xT2, while the poorest was L23xT2 cross. Crosses with positive and significant SCA effects L10xT2, L17xTl and L23xT2 had desirable trait for this trait. In agreement with current funding Tajwar and Chakraborty (2013) found significant positive and negative SCA effects in maize ear diameter. Estimates of SCA effects of thousand-kernel weight of crosses ranged from -57.9 to 57.9 g (Table 3). Fifty crosses exhibited significant estimates of SCA effects (Table 3). Good specific combiner was L I lxTl, while the poorest cross was L I lxT2. Crosses with positive and significant SCA effects for this trait are desirable as this trait directly contributes to grain yield of maize. Rovaris et al. (2014) reported significant positive and negative SCA effects from thousand-kernel weigh
Table 3. Specific combining ability effects for 64 crosses in respect of thirteen traits tested at Hawassa2015 cropping season
Crosses DM(days)
PH(cm)
EH(cm)
EL(cm)
NRPC(no)
NCPC(no)
ED(cm)
TSW(g)
GY(t/ha)
LlxT l 0.44 7.98 6.88 0.87 -0.58 -0.30 -0.20 -0.90 0.07L 1 xT2 -0.44 -7.98 -6.88 -0.87 0.58 0.30 0.20 0.90 -0.07L2xT 1 -0.81 -29 0** -1 1.63* -1.46 -0.38 -1.10 -0.08 -12.15* -0.10L2xT2 0.81 29.0** 11.63* 1.46 0.38 1.10 0.08 12.15* 0.10L3XT1 -1.06 -0.52 -2.13 0.30 -0.08 0.80 0.09 -23.4** -0.21L3XT2 1.06 0.52 2.13 -0.30 0.08 -0.80 -0.09 23.4** 0.21L4XT1 1.19 4.48 3.38 -0.05 0.02 -0.15 -0.06 -2.15 -0.29L4XT2 -1.19 -4.48 -3.38 0.05 -0.02 0.15 0.06 2.15 0.29L5XT1 -1.81 -15.02* -3.13 -1.64 0.27 0.10 -0.06 -39.7** -0.21L5XT2 1.81 15.02* 3.13 1.64 -0.27 -0.10 0.06 39.7** 0.21L6XT1 0.69 8.48 7.88 1.45 0.02 0.55 0.19 17.9** 1.24**L6XT2 -0.69 -8.48 -7.88 -1.45 -0.02 -0.55 -0.19 _j7 9** -1.24**L7XTI -1.31 -9.02 3.88 -0.80 -0.88* -3.20 -0.14 -22.2** -0.86*L7XT2 1.31 9.02 -3.88 0.80 0.88* 3.20 0.14 22.2** 0.86*L8XT1 -0.81 11.48 5.88 -0.09 0.22 1.10 0.08 -5.90 0.52L8XT2 0.81 -11.48 -5.88 0.09 -0.22 -1.10 -0.08 5.90 -0.52L9XT1 1.44 7.48 -5.63 0.44 0.67 0.00 0.08 31.6** 0.54L9XT2 -1.44 -7.48 5.63 -0.44 -0.67 0.00 -0.08 -31.6** -0.54LI0XT1 4.69** 2.48 2.38 -0.17 0.22 0.00 -0.31* -17.2** -0.97*L10XT2 -4.69** -2.48 -2.38 0.17 -0.22 0.00 0.31* 17.2** 0.97*L11XT1 4 44** 3.98 -1.13 1.03 -0.48 0.70 0.24 57.9** 0.82*L11XT2 -4 44** -3.98 1.13 -1.03 0.48 -0.70 -0.24 -57.9** -0.82*L12XT1 3.44* 1.98 1.88 -0.35 0.07 -1.85 0.01 -4.65 -0.42L12XT2 -3.44* -1.98 -1.88 0.35 -0.07 1.85 -0.01 4.65 0.42L13XT1 2.44 -7.52 -2.13 -0.90 0.52 0.45 -0.04 -40.9** 0.49L13XT2 -2.44 7.52 2.13 0.90 -0.52 -0.45 0.04 40.9** -0.49L14XT1 -0.06 13.98 -1.63 1.24 -0.33 2.40 0.24 55.4* 0.70LI4XT2 0.06 -13.98 1.63 -1.24 0.33 -2.40 -0.24 -55.4* -0.70L 15XT1 -2.06 -9.02 -4.13 -0.73 0.42 -2.90 -0.03 -13.4* -1.03**L15XT2 2.06 9.02 4.13 0.73 -0.42 2.90 0.03 13.4* 1.03**L16XT1 0.19 -5.52 -6.13 0.77 -0.03 0.75 0.10 45.4** 0.88*L.16XT2 -0.19 5.52 6.13 -0.77 0.03 -0.75 -0.10 -45.4** -0.88*L17XT1 0.19 7.98 -1.13 1.13 0.37 2.55 0.35* 39 1 ** 1.71**L17XT2 -0.19 -7.98 1.13 -1.13 -0.37 -2.55 -0.35* _39 ] ** -1.71**L18XT1 -3.81* -2.02 2.38 0.10 -0.18 1.55 0.01 -27.2** -0.56
97

Oromia Agricultural Research Institute (IQQO), Crop research Proceeding 2017
Crosses DM(days)
PH(cm)
EH(cm)
EL(cm)
NRPC(no)
NCPC(no)
ED(cm)
TSW(8)
GY(t/ha)
L18XT2 3.81* 2.02 -2.38 -0.10 0.18 -1.55 -0.01 27.2** 0.56L19XT1 -0.31 -14.02* -15.63** 0.13 0.37 -0.90 0.10 0.35 -0.30L19XT2 0.31 14.02* 15.63** -0.13 -0.37 0.90 -0.10 -0.35 0.30L20XT1 0.69 8.48 1.88 1.25 -0.13 1.15 -0.03 14.1* 0.72L20XT2 -0.69 -8.48 -1.88 -1.25 0.13 -1.15 0.03 -14.1* -0.72L21XT1 -2.56 -4.02 6.88 -1.34 0.32 -1.05 0.07 11.60* -0.20L21XT2 2.56 4.02 -6.88 1.34 -0.32 1.05 -0.07 -11.60* • 0.20L22XT1 -0.81 3.48 0.88 1.46 0.12 2.70 0.21 49.1** 0.83*L22XT2 0.81 -3.48 -0.88 -1.46 -0.12 -2.70 -0.21 -49.1** -0.83*L23XT1 -2.31 3.48 1.38 -1.35 0.52 -3.30 -0.37* -39.7** -0.48L23XT2 2.31 -3.48 -1.38 1.35 -0.52 3.30 0.37* 39.7** 0.48L24XT1 -2.56 2.98 2.38 -0.58 -0.28 -1.35 0.07 -27.2** -0.88*L24XT2 2.56 -2.98 -2.38 0.58 0.28 1.35 -0.07 21.2** 0.88*L25XT1 1.44 -3.52 -1.13 -1.68 0.22 -4.05* -0.29 -15.9** -1.25**L25XT2 -1.44 3.52 1.13 1.68 -0.22 4.05* 0.29 15.9** 1.25**L26XT1 -2.81 27.5** 8.38 0.95 0.42 3.05 0.29 30.4** 1.74**L26XT2 2.81 -27.5** -8.38 -0.95 -0.42 -3.05 -0.29 -30.4** -1.74**L27XT1 2.69 9.98 2.38 -0.25 -0.08 -1.15 -0.01 5.35 -0.73L27XT2 -2.69 -9.98 -2.38 0.25 0.08 1.15 0.01 -5.35 0.73L28XTI -1.81 4.98 4.38 1.50 -0.53 3.30 -0.20 1.60 0.39L28XT2 1.81 -4.98 -4.38 -1.50 0.53 -3.30 0.20 -1.60 -0.39L29XT1 -1.06 -0.52 -1.13 0.26 0.02 2.75 -0.15 -13.4* -0.07L29XT2 1.06 0.52 1.13 -0.26 -0.02 -2.75 0.15 13.4* 0.07L30XT1 0.19 -1.02 -4.63 1.03 0.42 -0.60 0.18 21.6** 0.67L30XT2 -0.19 1.02 4.63 -1.03 -0.42 0.60 -0.18 -21.6** -0.67L3IXT1 1.69 -22.5** -8.63 -0.95 -0.88* -0.80 -0.10 -29.65** -1.85**L3IXT2 -1.69 22.5** 8.63 0.95 0.88* 0.80 0.10 29.65** 1.85**L32XT1 0.19 -8.02 6.88 -1.61 -0.28 -1.30 -0.24 -45.9** -0.90*L32XT2 -0.19 8.02 -6.88 1.61 0.28 1.30 0.24 45.9** 0.90*SE(m±) SE(Sij -Ski)
1.191.95
9.7617.04
4.098.57
0.871.73
0.270.57
1.512.92
0.120.30
3.547.07
0.271.19
SE (m) = standard error of mean, SE (Sjj-Ski) = standard error of differenceHeterotic Groups: The results exhibited that, from thirty-two inbred lines, twelve inbred lines viz, L6, L8, L I 1, L I3, L I6, L I7, L20, L22, L26, L28 and L30 were showing positive SCA effects, exhibiting negative SCA effects with CML 159 and grain yield greater than the mean grain yield when crossed to CML 144. On the other hand fourteen inbred lines viz. L4, L5, L7, L10, L I 2, L I 5, L I8, L I9, L21, L23, L24, L25, L27 and L31 showed positive SCA effects, exhibited negative SCA effects with CML 144 and grain yield greater than the mean yield of lines when crossed to CML 159 (Table 4). Six inbred lines viz. L2, L3, L9, L14, L29 and L32 showed non-significant SCA and yield less than the mean grain yield when crossed to both testers were classified as C group (Table 4). Legesse et al. (2009) classified inbred lines into different heterotic groups based on mean grain yield and estimation of SCA effects. Similarly, Gurung and Koirala (2002) were classified ten inbred lines into three main groups A, B and AB heterotic groups based on SCA of grain yield and mean grain yield.
98

Oromia Agricultural Research Institute (IQQO), Crop research Proceeding 2017
Table 4. Heterotic grouping of maize lines corresponding to testersLines CML144 (group "B") SCA CML159 (group
"A")SCA Heterotic
groupL I 5.74 0.07 5.19 -0.07 BL2 4.45 -0.1 4.24 0.1 CL3 5.24 -0.21 5.25 0.21 CL4 5.56 -0.29 5.73 0.29 AL5 6.06 -0.21 6.07 0.21 AL6 6.49 1.24** 3.59 -1.24** BL7 4.37 -0.86* 5.67 0.86* AL8 8.25 0.52 6.81 -0.52 BL9 5.53 0.54 4.03 -0.54 CL10 4.39 -0.97* 5.92 0.97* ALI 1 5.86 0.82* 3.81 -0.82* BL12 6.58 -0.42 7.00 0.42 AL13 6.61 0.49 5.22 -0.49 BL14 5.49 0.7 3.67 -0.7 CL15 5.17 -1.03** 6.82 1.03** AL16 7.04 0.88* 4.88 -0.88* BL17 6.71 1.71** 2.88 -1.71** BL18 5.53 -0.56 6.23 0.56 AL19 5.27 -0.3 5.46 0.3 AL20 5.79 0.72 3.93 -0.72 BL21 6.93 -0.2 6.91 0.2 AL22 6.60 0.83* 4.52 -0.83* BL23 7.00 -0.48 7.56 0.48 AL24 5.37 -0.88* 6.72 0.88* AL25 3.88 -1.25** 5.97 1.25** AL26 7.70 1.74** 3.82 -1.74** BL27 4.44 -0.73 5.48 0.73 AL28 6.24 0.39 5.04 -0.39 BL29 4.77 -0.07 4.49 0.07 CL30 6.69 0.67 4.94 -0.67 BL31 5.39 -1.85** 8.68 1.85** AL32 3.36 -0.90* 4.75 0.90* CMean 5.77 5.35
* ancj ** significant at (P<0.05 and 0.01) respectively
99

Oromia Agricultural Research Institute (IQQO), Crop research Proceeding 2017
ConclusionThe current study revealed the presence of considerable amount of variability among crosses and lines. These permit us to select promising lines and hybrids for future use. SCA variance played greater role in controlling most of the studied characters. The significant differences among hybrids and lines for most traits indicate the possibility of selection for improvement of yield and yield related traits. Inbred lines identified for desirable GCA effects were L I, L8, L9, L2I, L23, L27 and L28. For grain yield, inbred lines L8 and L23 were the best general combiners. These lines also showed positive and highly significant GCA effects for ear length, ear diameter and thousand-kernel weight. These lines can possibly be used to develop high yielding and early maturing synthetic variety. Five crosses viz., L31XT2, L26XT1, L17XT1, L25XT2 and L6XT1 have shown high positive SCA effects for grain yield involving parents of positive GCA effects can be exploited for the development of single cross hybrids. The results of the current study identified inbred lines with positive GCA that can be used for OPV development and potential crosses with reasonable SCA that can be advanced to the next stage of breeding program. In addition, the information from this study may possibly be useful for researchers who would like to advance these breeding materials.AcknowledgmentI would like acknowledge Oromia Agriculture Research Institute (OARI) for funding. I wish to express my gratitude to Yabello Pastoral and Dryland Agricultural Research Center for facilitating financial assistance during the study. I also express my sincere appreciations and thanks to Hawassa maize research staffs for their supports in planting, trial management and data collection.ReferencesAli A, ur Rahman H, Shah L, Shah K.A, Rehman S (2014). Heterosis for grain yield and its attributing
components in maize variety azam using line* tester analysis method. Academia Journal of Agricultural Research, 2( 11 ):225-230.
Ali F, Irfan ASh, Mohammad N, Muhammad YK, Jhieram U, Jianbing Y (2012). Heterosis for yield and agronomic attributes in diverse maize germplasm. Australian Journal of Crop Science 6(3): 455.
Bayisa A (2008). Heterosis and Combining Ability of Transitional highland maize MSc. Thesis. School of Graduate Studies, Alemaya University, Ethiopia.
Chandel U, Mankotia S (2014). Combining ability in local and CIMMYT inbred lines of maize. For grain, yield and yield components using linextester. SABRAO Journal of Breeding and Genetics.46 (2):256-264.
EL-Hosary AA, Elgammaal AA (2013). Utilization of line * tester model for evaluating the combining ability of some new white maize inbred lines. Egypt Journal of Plant Breed. 17(l):79-72.
Girma H, Sentayehu A, Berhanu T, Temesgen M (2015). Test Cross Performance and Combining Ability of Maize Inbred Lines at Bako, Western Ethiopia. Global Journals Incolusion. (USA). (15): 2249-4626.
Gurung DB, Koirala KB (2002b). Characterization of maize landraces from the mid and far western hills of Nepal. Ibid. (12)100-104,
Habtamu Z, Hadji T (2010). Combining ability analysis for yield and yield related traits in quality protein maize (Zea mays L.) inbred lines. International Journal of Biological Science. (2): 87-97.
Hailegebrial K, Getachew A, Legesse W (2015). Combining Ability and Gene action Estimation in Elite Maize. 5( 15): 123-133.
100

Oromia Agricultural Research Institute (IQQO), Crop research Proceeding 2017
Kamara. Mohamed M, Ibrahim El-Degwy S, Hiroyuki K (2010). Estimation combining ability of some maize inbred lines using line x tester mating design under two nitrogen levels." Australian Journal of Crop Science 8,(9): 1336.
Kanagarasu S, Nallathambi G, Ganesan KN (2010). Combining ability analysis for yield and its component traits in maize (Zea mays L.). Electronic Journal of plant breeding 1(4): 915-920.
Kempthorne O (1957). An introduction to genetic statistics, John Wiley and sons. Inc. New York.Legesse BW, Pixley KV, Botha AM (2009). Combining Ability and Heterotic Grouping of High and
Transition Maize Inbred Lines. (54): I -9Melchinger, Albrecht E, Ramesh K Gumber (1998). Overview of heterosis and heterotic groups in
agronomic crops. Concepts and breeding of heterosis in crop plants conceptsandbree. 29-44.Melkamu E, Tadesse D, Yigzaw D (2013). Combing ability, Gene Action and Heterosis Estimation in
Quality Protein Maize. International Journal of Scientific and Research Publications. (3): 1-17Menkir A, Melake-Berhan A, Ivan I, A. Adepoju,2008. Grouping of tropical mid-altitude maize inbred
lines on the basis of yield data and molecular markers. Theoretical and applied genetics 108(8): 1582-1590.
Mosa H ,2010. Estimation of combining ability of maize Inbred lines using top cross mating design. Journal of Agricultural Research.36(l):l-16.
Mwimali M, Derera J, Tongoona P, Mugo S, Gichuru L, 2015. Combining ability for stem borer resistance and heterotic orientation of maize inbred lines using CIMMYT single cross testers under Chilo partellus infestation. Journal of Plant Breeding and Crop Science. 7( 11): 310-326.
Patterson H D, Williams E R ,1976. A new class of resolvable incomplete block designs. Biometrika. 83- 92.
Rahman H, Arifuddin Z, Shah S, Shah A, Iqbal M Khalil IH .2010. Evaluations of maize S2 lines in test cross combinations 1: flowering and morphological traits. Pakistan J. Bot. 42(3): 1619-1627.
Ram L, Singh R, Singh SK ,2015. Study of Combining Ability Using QPM donors as Testers for Yield and Yield Traits in Maize. SABRAO Journal of Breeding and Genetics. 47 (2):99-l 12.
Rovaris, Sara RS, Maria EAG Zagatto, Eduardo Sawazaki,2014. Combining ability of white corn genotypes with two commercial hybrids." Maydica 59(1): 96-103.
Sharma J.2006. Statistical and biometrical techniques in plant breeding.led. New Age International. New Delhi.India.
Shushay W, Habtamu Z, Dagne W, Gissa F . 2013. Line x tester analysis of maize inbred lines for grain yield and yield related traits. Asian Journal of Plant Science and Research. 3(5):12-19
Singh RK, Chaudhary BD , 1985. Biometrical methods in quantitative genetic analyses. Kalyani publishers, Ludhiana, (New-Delhi).
Tajwar T, Chakraborty M , 2013. Combining ability and heterosis for grain yield and its components in maize inbreds over environments (Zea mays L.). African Journal of Agricultural Research 8(25): 3276-3280.
Uddin M S, Amiruzzaman M, Bagum SA. Hakim MA. Ali MR , 2008. Combining ability and heterosis in maize (Zea mays L.). Bangladesh Journal of Plant Breeding and Genetics 21 (1): 21-28.
W ali MC, Kachapur RM, Chandrashekhar CP, Kulkarni VR, Devara SB, Navadagi , 2010. Gene action and combining ability studies in single cross hybrids of maize (Zea mays L.). Karnataka Journal of Agricultural Sciences 23(4): 557-562.
101

Oromia Agricultural Research Institute (IQQO), Crop research Proceeding 2017
Standard Heterosis of Maize (Zea mays L.) Inbred Lines for Grain Yield and Yield Related Traits at Southern Ethiopia
'Natol BakalaHundera' Birahanu Abate, Mandefro Nigussie 'Yabello Pastoral and Dry Land Agricultural Research Center
2School of Plant and Horticultural Science, Hawassa University, Ethiopia Oxfam America Deputy Regional Director, Ethiopia
Corresponding Author: E-mail:[email protected]:+251046446026 L P.O.Box 85 AbstractMaize (Zea mays L.) is important cereal crop produced as most staple food in the world. A field experiment was conducted at Hawassa national maize research sub center site during 2015 cropping season for different agronomic traits. A line x tester analysis involving 64 hybrids generated by crossing 32 elite maize inbred lines with two testers. The experiment was planted by using alpha-lattice design (6x11) with two replications. Sixty'four hybrids with 2 checks were tested in objected to estimate standard heterosis for yield and yield related traits. From this study, considerable standard heterosis was observed for all studied traits. The highest significant positive standard heterosis for grain yield was manifested by L31XT2 (102.33%). Hybrid L31XT2 was the best combination as evaluated through combining ability and standard heterosis. The presence of substantial heterotic potential that could be exploited in maize breeding program and possibility of developing desirable hybrid combinations and synthetic varieties through crossing and or recombination of inbred lines with desirable traits of interest.
Key words: Heterosis; hybrid; Line x tester; Maize; Yield.
IntroductionMaize (Zea mays L) is plant of the tribe Maydeae of the grass family Poaceae. Maize is cultivated globally leading total yield production of crop and third most important food crops after wheat and rice. It is a versatile crop grown over a range of agro climatic zones. The first three leading countries in production of maize in the world are United States, China, and Brazil and they produce approximately 79% of total maize production per year of the world.Maize is one of the most important crop and mostly grown into six agro ecological zones based on altitude and annual rainfall in Ethiopia (MOA, 2005). Major cereal crops grown in Ethiopia are Teff (Eragrostistef), Maize (Zea mays L), Wheat (Triticumaestivum L.) and Sorghum (Sorghum bicolor L.). Maize is second in area of production whereas it ranks first in total grain production, followed by teff. wheat and sorghum (CSA, 20l4).The popularity of maize in Ethiopia is partly because of its high value as a food, feed and source of fuel for rural families. Approximately 88 % of maize produced in Ethiopia is consumed as food, both as green and dry grain.Hybrid varieties are the first generations of (F l) from crosses between two pure lines, inbred lines, open pollinated varieties, clones, or other populations that are genetically dissimilar. The production and development of hybrid maize is one of the breakthroughs and greatest accomplishments of plant breeding. Breeding strategies based on selection of hybrids require expected level of heterosis. Heterosis is important in breeding program especially for hybrid pollinated crop and is a great achievement to meet the world’s food needs (Duvick, 1999). Standard heterosis is estimated over standard commercial hybrid. The study of standard heterosis among maize germplasm is essential in maximizing the effectiveness of hybrid cultivars selection especially in hybrid pollinated crops. It has practical importance in plant breeding. It is also referred as useful or economic heterosis. Therefore, the present study is objected to estimate standard heterosis in maize hybrids for yield and yield related traits and to identify potential hybrid for future breeding schemes.
102

Oromia Agricultural Research Institute (IQQO), Crop research Proceeding 2017
Materials and methodsThe experiment was conducted at Hawassa Research Center field in 2015 cropping season. Hawassa is situated at 7°4TS! and 38°31 'E latitude and longitude, respectively, at an altitude of 1700 meter above sea level (m.a.s.l). in the central rift valley of Ethiopia. The soil of the study area is characterized by well- drained sandy loam {46% sand, 28% silt and 26% clay), with pH of 7.1. It has 0.21% total Nitrogen, 15.65 ppm P, 14.52 ppm Iron and 20.30 meq/100 gm of Calcium (Waga Mazengia, 2011). The total annual rainfall for the past 12 years ranges from 776 mm to 1145 mm (average 988.1 mm) with an average maximum and minimum air temperature of 26.6 °C and 13.7 °C, respectively (Shiferaw et al., 2011; Sime and Aune, 2014).The materials comprised of 32 inbred lines coded as L I, L2...L32 and two testers coded as T1 and T2. The inbred lines crossed with testers in line x tester mating design to generate 64 FI hybrids at Bako National Maize Research Project (BNMRC) following procedure of Kempthome (1957). The hybrids were planted along with similarly maturing hybrid maize varieties as a check viz BHQPY-545 and BH- 546 during 2015 main cropping season at Hawassa. The experiment was planted by using a-lattice design 6x1 i genotype arrangement (Patterson and Willianms, 1976) w'ith two replications. Each block comprises of 11 units having 5.1 meter long and 9.75 meter width with the spacing of 0.75 meter between rows and 0.30 meter between plants. All cultural practices like weeding and cultivation was done manually throughout the entire growing season as required. Data of 12 quantitative traits were collected viz., days to 50% emergence, days to 50% anthesis. days to 50% silking, days to maturity, Plant height. Ear height. Ear length. Number of rows per ear. Ear diameter and Number of kernels per row, 1000 kernel weight and grain yield later converted to mean values.Data analysisCollected data were subjected to PROC M1SED SAS computer software. The nature and magnitude of heterosis was estimated in relation to standard checks for traits that showed significant differences following the method suggested by Falconer and Mackay (1996):SH (% ) = (F I - SV)/SV X 100Where, FI = Mean value of the hybrid, SV= Mean value of the standard variety and SH = standard heterosisThe differences in the magnitude of heterosis tested following the procedure of Panse and Sukhatme (1961). T-test was used for significance test among hybrids and checks. Standard error and critical difference were computed as:SE (d) = (2MSe/r)1/2 CD=SE(a)xtWhere; SE (d) is standard error of the difference, MSe = error mean square from analysis of variance, r = the number of replication. CD ^Critical difference and t= value of t at error degree of freedom.The computed t-value was tested against the t-value at error degree of freedom corresponding to 5 or 1% level of significance.Results and Discussion Analysis of VarianceAnalysis of variance showed that, mean squares of genotypes were significant (P<0.05) for all traits except anthesis silking interval, ear position and cob per plant. Mean squares due to crosses were significant (P<0.05) for days to 50% anthesis, days to 50% silking, days to maturity, number of rows per ear, number of kernel per row, ear length, grain yield and thousand kernel weight (Table 1). This indicates that the hybrids were sufficiently different from each other and selection is possible to identify the most
103
Oromia Agricultural Research Institute (IQQO), Crop research Proceeding 2017
desirable hybrids. In line to these finding also different authors reported significant difference among hybrids in yield and yield related traits in different parts of Ethiopia (Legesse et al., 2009; Mossisa et al., 2009 and Shushay, 2014).The Estimates of Standard Heterosis: The estimates of heterosis over the best standard check were computed for grain yield and yield related traits among genotypes were presented in (Table 2). Both standard checks used to estimate standard heterosis produce below mean grain yield per hectare. BHQPY- 545 was relativity the best standard check in mean grain yield per hectare than BH-546. Significant amount of heterosis was observed for all the traits under study however the magnitude varied with traits (Table 2).Among all hybrids none of them showed significant negative standard heterosis over BHQPY-545 in days to anthesis but eight hybrids showed highly significant positive standard heterosis (Table 2). One hybrid showed significant negative standard heterosis over BH-546 while three hybrids showed significant positive standard heterosis over BH-546 (Table 2). Three hybrids showed significant positive standard heterosis for days to maturity over both BH-546 and BHQPY-545. Hybrids showed heterosis in negative direction is considered to be desirable for days to 50 per cent tasseling, days to 50 per cent silking and days to maturity in developing early maturing varieties while for the hybrids shown positive and significant standard heterosis the reverse is true. Earliness is a desirable character as it is useful in multiple cropping and increases water and land use efficiency. The current finding is similar with the finding of Kumar et al., (2012). Hybrids that showed negative days to anthesis, silking and days to maturity stands for earliness of the hybrids while for hybrids shown positive standard heterosis the reverse is true. Shushay, (2014) argued with current finding.For ear length thirty three hybrids showed significant negative standard heterosis for ear length over BHQPY-545 while none of them showed significant positive heterosis over BHQPY-545. Six hybrids showed significant positive standard heterosis for ear height over BH-546 while only one hybrid showed significant positive standard heterosis for ear length over BH-546 (Table 2). Negative heterosis for plant height and ear height is desirable for breeding short statured hybrids and which implying that these hybrids would mature earlier. Ali et al., (2014) and Ziggiju et al., (2016) reported significant positive and negative standard heterosis for ear length and plant height
104

Oromia Agricultural Research Institute (IQQO). Crop research Proceeding 2017
Table 1. Mean squares for grain yield and yield related traits in 64 hybrids and 2 checks evaluated at Hawassa, 2015
Source df DA DS DM PH EH EL NRPC NCPR ED TSW GY BYVariation (days) (days) (days) (cm) (cm) (cm) (no) (no) (cm) (g) (t/ha) (t/ha)Replication 1 1.09 nS 0.6 lns 3.66'“ 1.94 303.30* 1.91“ 0.02ns 17.90ns 0.03 "s 37.12ns 0.69ns 1.08 nsIncomplete 5 9.10** 10.50** 14.80** 813.9** 376.50** 9.87** 0.60ns 9.80ns 0.17"* 4687 ns 3.02* 4.47**block(b/r)Genotypes 65 6.05** 6.00** 14.96** 442.11* 1 15.20** 5.91** 0.54* 13.52* 0.13** 4824** 2.94** 3.58**Hybrids 63 6.09* 6.01** 15.4** 441.30"* 115.50 “ 5.67* 0.54* 13.90* 0.13 "* 4579** 3.00** 3.44**Error 60 3.12 2.73 3.82 290.34 73.43 3.01 0.32 8.55 0.09 50.0 1.588 1.42CV (% ) - 2.931 2.803 2.005 9.44 9.43 12.53 5.5 9.17 7.33 20.34 27.02 27.2DA=days to anthesis, DS=days to silking, DM=days to maturity, PH=plant eight, EH=ear height, EL=ear length, NRPC=number of row per cob, NCPR=number of kernel per cob, ED= ear diameter, TSW= thousand kernel weight, GY=grain yield, BY=biological yield, CPP=cob per plant. *and** significant at P<0.05 and P<0.01 respectively ns=non significance.
105

Oromia Agricultural Research Institute (IQQO). Crop research Proceeding 2017
Based on number of kernels row per cobs two hybrids showed significant positive standard heterosis over BH-546. The highest significant positive standard heterosis for kernels row per cob was manifested by LlxT2 (16.7%) followed by L28XT2 (14.4%) (Table 2). Two hybrids showed significant positive standard heterosis for number of kernels per row over BHQPY-545 while six hybrids showed significant negative standard heterosis. Two hybrids showed significant positive standard heterosis for number of kernel per row over BH-546 while five hybrids showed significant negative standard heterosis. The highest significant positive standard heterosis for number of kernel per row manifested by L23 X T2 I followed by L28 X T2 (16.1%). (Table 2) Amiruzzaman et al., (2010) and Senthil et al., (2014) observed significant positive and negative standard heterosis for number of rows per cob.
Based on thousand kernel weight fifty one hybrids showed significant negative standard heterosis for thousand kernel weights over BHQPY-545 while two hybrids showed significant positive standard heterosis for thousand kernel weights over BHQPY-545 and forty nine hybrids showed significant positive standard heterosis for thousand kernel weights over BH-546 white ten hybrids showed significant negative standard heterosis for thousand kernel weights over BH-546 (Table 2). Ali et al.. (2014) were observed significant positive standard heterosis for thousand grain weight.
Grain yield improvement is one of the most important objectives in maize breeding program and is the main selection criteria in maize. Percent heterosis over standard checks for grain yield was presented in Table 2. For grain yield fourteen hybrids showed significant positive standard heterosis over BHQPY-545 and seventeen hybrids showed significant positive standard heterosis over BH-546. None of hybrids showed significant negative standard heterosis over both BHQPY-545 and BH-546. (Table 2) The highest significant positive standard heterosis obtained by hybrid L31 X T2 (102.33%) which is followed by hybrid L8XT1 (93.02%). Our results are matching to the earlier findings by Leggese (2009); Mosa et al., (2010); Rodrigo etal.. (2012), Ziggiju etal.. (2016); Ali et al.. (2014); Elmyhum (2014); Girma et al., (2015). Zeleke (2015) also reported standard heterosis for grain yield ranging from -8.9% to 28.9%.
Table 2. The magnitude of standard heterosis for 64 hybrids over BHQPY-545 and BH-546 for grain yield and yield related traits evaluated at Hawassa, 2015.
Crosses DA DS DM PH EHBHQPY
-545BH-546
BHQPY-545
BH-546 BHQPY-545
BH-546 BHQPY-545
BH-546
BHQPY-545 s
LlxTI 6.90** 4.03* 6.71** 3.25 0.97 0.97 -7.93 -3.24 -6.67 o.<LlxT2 2.76 0 3.36 0.00 -0.32 -0.32 -14.50 -10.2 -16.6* -10L2xT\ 4.14* 1.34 4.70** 1.30 1.94 1.94 -27.30 -23.6 -20.8** -15.L2xT2 0.69 -2.01 0.67 -2.60 2.26 2.26 -1.32 3.70 0.00 7.L3XT1 6.21** 3.36 7.38** 3.90* 0.97 0.97 -14.90 -10.60 -14.2* -8.(L3XT2 0.69 -2.01 0.67 -2.60 1.61 1.61 -14.10 -9.72 -9.17 -2.(L4XT1 -0.69 -3.36 0.00 -3.25 1.29 1.29 -7.93 -3.24 -5.83 0A14X12 4.83* 2.01 4.70** 1.30 -0.97 -0.97 -11.50 -6.94 -10.00 -3.:L5XT1 1.38 -1.34 0.67 -2.6 -0.32 -0.32 -5.29 -0.46 -5.83 0.{
106
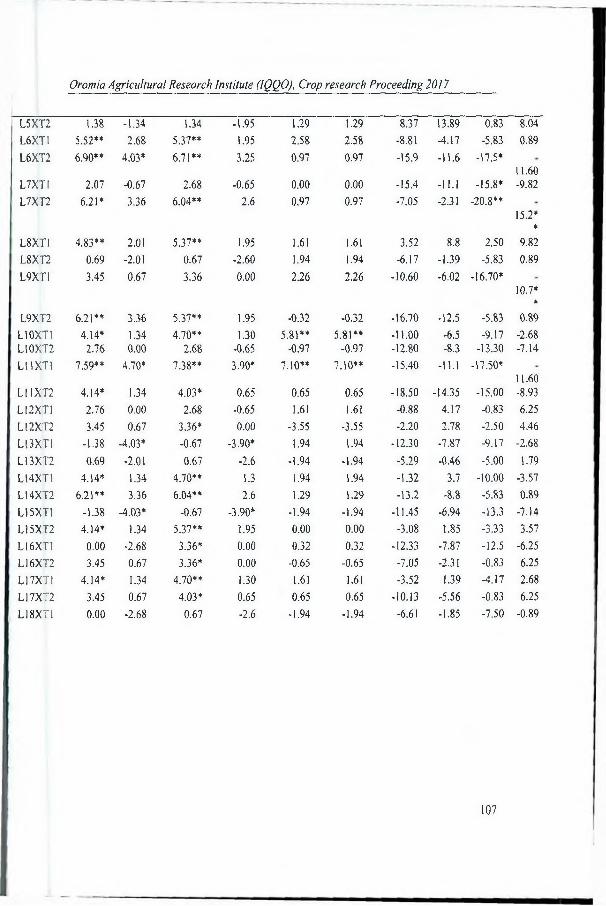
Oromia Agricultural Research Institute (IQQO), Crop research Proceeding 2017
L5XT2 1.38 -1.34 1.34 -1.95L6XT1 5.52** 2.68 5.37** 1.95L6XT2 6.90** 4.03* 6.71** 3.25
L7XTI 2.07 -0.67 2.68 -0.65L7XT2 6.21* 3.36 6.04** 2.6
L8XT1 4.83** 2.01 5.37** 1.95L8XT2 0.69 -2.01 0.67 -2.60L9XT1 3.45 0.67 3.36 0.00
L9XT2 6.21** 3.36 5.37** 1.95L10XT1 4.14* 1.34 4.70** 1.30L10XT2 2.76 0.00 2.68 -0.65L11XT1 7.59** 4.70* 7.38** 3.90*
LI1XT2 4.14* 1.34 4.03* 0.65L12XT1 2.76 0.00 2.68 -0.65L12XT2 3.45 0.67 3.36* 0.00L13XT1 -1.38 -4.03* -0.67 -3.90*L13XT2 0.69 -2.01 0.67 -2.6L14XT1 4.14* 1.34 4.70** 1.3L14XT2 6.21** 3.36 6.04** 2.6L15XT1 -1.38 4.03* -0.67 -3.90*L15XT2 4.14* 1.34 5.37** 1.95L16XT1 0.00 -2.68 3.36* 0.00L16XT2 3.45 0.67 3.36* 0.00L17XT1 4.14* 1.34 4.70** 1.30L17XT2 3.45 0.67 4.03* 0.65L18XT1 0.00 -2.68 0.67 -2.6
1.29 1.29 8.37 13.89 0.83 8.042.58 2.58 -8.81 4.17 -5.83 0.890.97 0.97 -15.9 -11.6 -17.5*
11.600.00 0.00 -15.4 -11.1 -15.8* -9.820.97 0.97 -7.05 -2.31 -20.8**
15.2**
1.61 1.61 3.52 8.8 2.50 9.821.94 1.94 -6.17 -1.39 -5.83 0.892.26 2.26 -10.60 -6.02 -16.70*
10.7**
-0.32 -0.32 -16.70 -12.5 -5.83 0.895.81** 5.81** -11.00 -6.5 -9.17 -2.68
-0.97 -0.97 -12.80 -8.3 -13.30 -7.147.10** 7.10** -15.40 -11.1 -17.50*
11.600.65 0.65 -18.50 -14.35 -15.00 -8.931.61 1.61 -0.88 4.17 -0.83 6.25
-3.55 -3.55 -2.20 2.78 -2.50 4.461.94 1.94 -12.30 -7.87 -9.17 -2.68
-1.94 -1.94 -5.29 -0.46 -5.00 1.791.94 1.94 -1.32 3.7 -10.00 -3.571.29 1.29 -13.2 -8.8 -5.83 0.89
-1.94 -1.94 -11.45 -6.94 -13.3 -7.140.00 0.00 -3.08 1.85 -3.33 3.570.32 0.32 -12.33 -7.87 -12.5 -6.25
-0.65 -0.65 -7.05 -2.31 -0.83 6.251.61 1.61 -3.52 1.39 4.17 2.680.65 0.65 -10.13 -5.56 -0.83 6.25
-1.94 -1.94 -6.61 -1.85 -7.50 -0.89
107

Oromia Agricultural Research Institute (IQQO). Crop research Proceeding 2017
Continuation of table 2..Crosses DA DS DM PH EH
BHQ PY-545
BH-546 BHQPY-545
BH-546 B H Q P Y-545
BH'546 BHQPY-545
BH-546 BHQPY-545
BH-546
L18XT2 0.00 -2.68 0.00 -3.25 2.26 2.26 -4.41 0.46 -10.00 -3.:
L19XTI 3.45 0.67 4.70** 1.3 0.65 0.65 -14.1 -9.72 -15.80 -9.i
L I9 X T2 3.45 0.67 4.03* 0.65 032 0.32 -1.32 3.7 11.70 19,(
L20XT1 0.00 -2.68 0.00 -3.25 1.61 1.61 -6.17 -1.39 -8.33 -1.1
L20XT2 5.52** 2.68 6.04** 2.6 0.00 0.00 -1332 -8.8 -10.00 -3.5
L21XT1 2.07 -0.67 2.01 -1.30 -2.9 -2.90 -10.13 -5.56 -7.50 -O i
L 2 IX T2 1.38 -1.34 2.01 -1.30 -0.32 -0.32 -6.17 -139 -17.5* u |
L22XT1 4.14* 1.34 4.03* 0.65 0.00 0.00 -8.37 -3.7 -4.17 2.6
L22XT2 6.21 *• 3.36 5.37** 1.95 0.32 0.32 -11.01 -6.48 -4.17 2.6
L23XT1 1.38 -1.34 0.67 -2.6 -1.94 -1.94 -2.64 2.31 -7.50 -0.8
L23XT2 4.14* 1.34 4.03* 0.65 0.32 0.32 -5.29 -0.46 -8.33 -1.7
L24XT1 -1.38 -4.03* -0.67 -3.90* -0.97 -0.97 -11.89 -7.41 -5.00 1.7
L24XT2 2.76 0.00 3.36* 0.00 1.61 1.61 -14.10 -9.72 -7.50 -0.8
L25XTI 2.76 0.00 3.36* 0.00 1.94 1.94 -1233 -7.87 -11.70 -5.3
L25XT2 3.45 0.67 3.36* 0.00 -0.65 -0.65 -8.81 -4.17 -8.33 -1.7
L26XT1 1.38 -1.34 1.34 -1.95 -0.97 -0.97 5.73 11.11 -2.50 4.4
L26XT2 2.76 0.00 2.68 -0.65 1.94 1.94 -18.06 -13.89 -15.00 -8.9
L27XTI -0.69 -3.36 -0.67 -3.90 1.29 1.29 -539 -0.46 -9.17 -2.6
L27XT2 -1.38 -4.03* -1.34 -4.55** -2.90 -2.90 -13.66 -9.26 -1330 -7.1
L28XT1 3.45 0.67 3.36* 0.00 -0.65 -0.65 -5.29 -0.46 -5.00 1.7
L28XT2 1.38 -1.34 1.34 -1.95 0.97 0.97 -9.25 -4.63 -10.8 -4.4
L29XT1 2.76 0.00 3.36 0.00 -032 -0.32 -10.13 -5.56 -13.30 -7.1.
L29XT2 6.90** 4.03* 6.71** 3.25 032 0.32 -9.25 -4.63 -8.330 -1.7*
L30XT1 4.14* 1.34 4.03* 0.65 1.29 1.29 -12.33 -7.87 -19.2* -13,
L30XT2 6.90** 4.03* 6.71** 3.25 0.32 032 -11.01 -6.48 -10.00 -3.5'
L3IX T1 4.14* 1.34 4.03* 0.65 2.90 2.90 -8.37 -3.7 -10.00 -3.5'
L3 IX T2 5.52** 2.68 5.37** 1.95 0.00 0.00 11.89 17.59 5.83 13.*
L32X TI 4.83** 2.01 4.70** 1.30 0.97 0.97 -17.18 -12.96 -1.67 S.3<
L32XT2 1.38 -1.34 1.34 -1.95 0.00 0.00 -9.69 -5.09 -11.70 -$.:><
SE(m±) 3.12 2.73 3.82 290.34 73.43
C D 0.05 3.53 3.3 3.91 34.06 17.14
C D 0.01 4.7 4.4 5.2 45.3 22.79
DA~days to anthesis, DS~days to silking, DM=days to maturity, PH=plant eight. EH=ear height, E i-ear length, NRPC=number o f row per cob. NCPR=number o f kernel per cob. ED= ear diameter, TSH'= thousand kernelweight. GY-grain yield, BY biological yield, CPP -cob per plant.SE (m±) -standard error o f a mean. CD =critical difference
108

Oromia Agricultural Research Institute (IQQO), Crop research Proceeding 2017
environment for years on large scale for adaptation to wider agro-clirnatic conditions before their commercial cultivation.
Acknowledgment1 would like to acknowledge Oromia Agriculture Research Institute (OAR1) for funding. I wish to express my gratitude to Yabello Pastoral and Dry Land Agricultural Research Center for facilitating financial assistance during the study. 1 also express my sincere appreciations and thanks to Hawassa maize research staffs for their supports in planting, trial management and data collection.ReferencesAli A, ur Rahman H, Shah L, Shah KA, Rehman S. Heterosis for grain yield and its attributing
components in maize variety azam using line* tester analysis method. Academia Journal ofAgricultural Research. 2014;2( 11 ):225-30.
Amiruzzaman M, Islam MA, Hassan L, Rohman MM. Combining ability and heterosis for yield andcomponent characters in maize. Academic journal of plant Sciences. 20l0;3(2):79-84.
Duvick DN. Heterosis: feeding people and protecting natural resources. The genetics and exploitation of heterosis in crops. 1999 Jan: 19-29.
Elmyhum M. Estimation of combining ability and heterosis of quality protein maize inbred lines. African Journal of Agricultural Research. 2013 Dec 12;8(48):6309-I7.
Falconer DS and Mackay TFC .1996. Introduction to quantitative genetics. 4th ed. Benjamin Cummings, England, pp. 245-247.
Girma C. Hosana, SentayehuAlamerew. BerhanuTadesse, TemesgenMenamo.Test Hybrid Performance and Combining Ability of Maize (Zea Mays L.) Inbred Lines at Bako, Western Ethiopia. Global Journals Inc. (USA). 2015. 15 (4) Version 1.0. Online ISSN: 2249-4626.
Hoisington D, Khairallah M, Reeves T. Ribaut JM, Skovmand B, Taba S, Warburton M. Plant genetic resources: What can they contribute toward increased crop productivity?. Proceedings of the National Academy of Sciences. 1999 May 25;96( 11 ):5937-43.
Kempthorne 0. An introduction to genetic statistics. An introduction to genetic statistics.. 1957.Legesse BW, Pixley KV, Botha AM. Combining ability and heterotic grouping of highland transition
maize inbred lines.Mekonen S, Alenui T, Kassa B, Forbes G. Evaluation of contact fungicide spray regimes for control of
late blight (Phytophthora infestans) in southern Ethiopia using potato cultivars with different levels of host resistance. Tropical Plant Pathology. 2011 Feb;36( 1 ):21 -7.
Mosa HE. Estimation of combining ability of maize inbred lines using top cross mating design. J.Agricul. Res. Kafer El-Sheikh University. 20!0;36:)-4.
Mosisa W, Legesse W. Berhanu T, Girma D, Girum A, Wende A, Tolera K, Gezahegn B, Dagne W. Solomon A, Habtamu Z. SESSION II: Maize breeding and genetics. InMeeting the challenges of global climate change and food security through innovative maize research. Proceedings of the National Maize Workshop of Ethiopia, 3; Addis Ababa, Ethiopia; 18-20 April, 2011 (p. 17). C1MMYT.
Panse VG, Sukhatme PV. Statistical Methods for Agric. Workers, ICAR Publication, New Delhi. 1961. pp. 145.
112

Oromia Agricultural Research Institute (IQQO), Crop research Proceeding 2017
Rank Hybrids
Grain yield Days to maturity
ton/haHeterosis over BH QPY-545
Heterosis over BH-546
Days taken to mature
Heterosis over BH QPY-545
Heterosis over BH- 546
1 L31XT2 8.68 97.73** 102.33** 155.0 0.00 0.002 L8XT1 8.25 88.64** 93.02** 157.5 1.61 1.613 L26XT1 7.70 75.00** 79.07** 153.5 -0.97 -0.974 L23XT2 7.56 72.73** 76.74** 155.5 0.32 0.325 L12XT2 7.04 59.09* 62.79* 149.5 -3.5* -3.5*6 L16XT1 7.00 59.09* 62.79* 155.5 0.32 0.32
7 L23XT1 7.00 59.09* 62.79* 152.0 -1.94 -1.94
8 L21XT1 6.93 56.82* 60.47* 150.5 -2.90 -2.90
9 L21XT2 6.91 56.82* 60.47* 154.5 -0.32 -0.32
10 L8XT2 6.82 54.55* 58.14* 158.0 1.94 1.94
Checks
1 BHQPY-545 4.4 1552 BH-546 4.3 155
Potential hybridsFrom current study, eleven potential hybrids were identified either for release as hybrids or for further use in maize breeding program after further verification of the results. The yield potential of the hybrids ranged from 6.82 to 8.68 ton/ha (Table 3). A hybrid with higher standard heterosis over standard checks was used for hybrid maize development. The first ten hybrids L31XT2, L8XT1, L26XTI, L23XT2, L12XT2, L16XT1, L23XT1, L2IXT1, L21XT2, L8XT2 had high mean performance and standard heterosis over both checks for grain yield and other yield contributing traits like number of kernels per row, 1000 kernel weight, number of kernel rows per ear, ear diameter and ear length.Table 3. List of potential hybrids identified based on grain yield evaluated at Hawassa in 2015.
ConclusionsSignificant differences observed among hybrids for yield and yield related traits indicate presence of genetic variability and high magnitude of standard heterosis over commercial check. In the current finding, considerable amount of heterosis was obtained over best standard check (BHQPY-545) from hybrid (L31XT2) 97.73% in grain yield. The same hybrid gives 102.33% yield advantage over BH-546. Top ten yield advantages hybrids over both standard checks are L31XT2, L8XT1, L26XT1, L23XT2, L12XT2, L16XT1, L23XT1 and L21XTIin range of 54.55% to 102.33%.Among these ten hybrids five of them have negative heterosis of days to maturity over both hybrids. Negative standard heterosis is required for traits like plant height, disease and pest reaction, ear height and days to maturity. Hybrids L31XT2, L8XTI, L26XTL L23XT2 and L12XT2 have positive ear length, number of kernel per row, number of rows per cob. and thousand kernel weight over standard check. These results indicate most hybrids are earlier than commercial check. Positive standard heterosis is desirable for breeding long statured hybrids and varieties for grain yield. Among hybrids L31XT2 was the most prominent combination for grain yield. It is suggested to evaluate these hybrids in multi-
111

Oromia Agricultural Research Institute (IQQO), Crop research Proceeding 2017
Continuation of table 2...Crosses EL NRPC NCPR TKW GY
BHQPY-545
BH-546 BHQPY-545
3H-546 BHQPY-545
BH-546 BHQPY-545
BH-546 BHQPY-545
BH-546
L18XT1 -15.40 6.90 6.10 0.00 -5.39 -4.10 -25.93 14.3** 25.00 27.90LI8XT2 -16.8* 5.20 9.10* 2.90 -12.70* -11.50* -16.05* 29.5** 40.90 44.20LI9XT1 -24.3** -4.20 5.30 -0.70 -8.40 -7.10 -33.95* 1.90 20.50 23.30L19XT2 -26.0** -6.40 0.00 -5.70 -2.43 -1.09 -37.7** -3.80* 25.00 27.90L20XT1 -11.90 11.30 3.03 -2.90 2.70 4.10 -33.3** 2.86 31.80 34.90L20XT2 -24.5** -4.50 5.30 -0.70 -2.43 -1.09 -43.8** -13.3** -11.40 -9.30L2IXT1 -11.80 11.60 9.10* 2.90 -2.70 -1.37 -9.26 40.00** 56.8* 60.50*L21XT2 0.67 27.30* 4.60 -1.40 4.04 5.46 -18.52* 25.70** 56.8* 60.50*L22XTI -6.50 18.30* 3.00 -2.90 4.58 6.01 -14.2 32.40** 50.00 53.5**L22XT2 -20.9* -0.06 1.50 -4.30 -8.89 -7.65 41.98* -10.5** 2.30 4.70L23XT1 -9.60 14.30 9.10* 2.90 -2.70 -1.37 -5.56 45.7** 59.1* 62.80*L23XT2 22.90 30.1** 1.50 -4.30 16.2** 17.8** 10.49 70.40** 72.7** 76.70**L24XTI -21.90 -1.33 1.50 -4.30 -10.50 -9.30 -38.3** 4.80** 22.70 25.60L24XT2 -16.9* 5.10 6.10 0.00 -2.16 -0.82 -28.4** 10.50** 52.3* 55.80*L25XT1 -26.2** -6.70 1.50 4.30 -19.1** -18.0** -20.9** 21.90** -11.40 -9.30L25XT2 -10.60 13.10 -1.50 -7.10 3.77 5.19 -16.67* 28.60** 36.40 39.50L26XT1 23.3** 22.3** 9.10* 2.90 8.8 9 10.40 6.79 43.80** 75.0** 79.10**L26XT2 -12.90 10.20 3.03 -2.90 -6.47 -5.19 -25.3** 15.20** -13.6 -11.60L27XT1 -19.7* 1.58 6.10 0.00 7.28 8.74 -31.5** 5.70** 0.00 2.30L27XT2 -17.6* 4.00 7.60 1.43 14.6* 16.1** -37.7** -3.80* 25.00 27.90L28XT1 -7.20 17.3* 6.10 0.00 9.20 10.70 -27.2** 12.40** 40.90 44.20 iiL28XT2 -22.1** -1.46 14.40* 7.90 -7.55 -6.28 -31.5** 5.70** 13.60 16.30L29XT1 -21.2* -0.36 5.30 -0.70 2.16 3.55 -33.9** 1.90 9.10 11.60L29XT2 -24.2** -4.10 5.30 -0.70 -11.6* -10.40 -30.9** 6.7** 2.3 4.70 :L30XTI -13.40 9.50 7.60 1.40 -2.16 -0.82 -22.2** 20.0** 52.3* 55.80“L30XT2 -23.8** -3.60 1.50 -4.30 2.16 3.55 -36.4** -1.9 11.4 14.00L31XT1 -17.3* 4.60 -1.50 -7.10 2.70 4.10 -24.8** 16.2** 22.7 25.60 j;L31XT2 28.60 25.50 12.10* 5.70 8.09 9.56 -13.58 33.3** 97.7** 102.3**L32XT1 -28.4** -9.50 1.50 -4.30 -13.80* -12.60* 40.7** -8.6** -22.7 -20.90L32XT2 -13.40 9.50 6.10 0.00 -5.66 -4.37 -21.6** 20.9** 6.8 9.30SE(m±) CD 0.05 CD 0.01
3.01 3.47 4.6 (
0.321.131.5
8.555.837.76
5014.1418.81
1.432.393.18 !
DA=days to anthesis, DS-days to silking, DM=days 1o maturity, PH=plant eight. EH=ear height. EL=ear length, NRPC=numher of row per cob, NCPR-number of kernel per cob, ED- ear diameter, TSW- thousand kernel weight, GY-grain yield, B Y-biological yield, CPP=cob per plant.SE (m±) -standard error of a mean, CD =critical difference
110

Oromia Agricultural Research Institute (IQQO), Crop research Proceeding 2017
Continuation of table 2.Crosses EL NRPC NCPR TSW GY
BHQPY-545
BH-546 BHQPY-545
BH-546 BHQPY-545
BH-546 BHQPY-545
BH-546 BHQPY-545
BH-546
LlxT l -14.70 7.90 7.60 1.40 -5.12 -3.83 -25.30** 15.20** 29.50 32.60
LlxT2 -23.5** -3.30 16.7** 10.0* -2.43 -1.09 -28.4** 10.50** 18.20 20.90
L2xTl -29.9** -11.30 0.00 -5.70 -10.20 -9.00 -27.7** 11.40** 2.30 4.70
L2xT2 -16.3* 5.80 6.06 0.00 -3.23 -1.91 -25.3** 15.20** -4.50 -2.30
L3XT1 -18.8* 2.70 6.06 0.00 1.35 2.73 -37.6** -3.80* 18.20 20.90
L3XT2 -22.2* -1.58 7.60 1.40 -1.89 -0.55 -29.6** 8.60** 18.20 20.90
L4XT1 -15.90 6.25 5.30 -0.71 2.43 3.83 -212** 12.40** 27.30 30.20
L4XT2 -15.90 6.30 5.30 -0.71 4.31 5.74 -29.6** 8.60** 29.50 32.60
L5XT1 -21.0* -0.12 5.30 -0.71 -4.85 -3.55 -29.0** 9.50** 38.60 41.90
L5XT2 -5.80 19.20* 1.50 -4.30 -4.31 -3.01 -12.96 34.30** 38.60 41.90
L6XT1 -25.7** -6.10 3.00 -2.90 -8.63 -7.38 -36.4** -1.90 47.70 51.20
L6XT2 -40.1** -24.2** 3.00 -2.90 -10.50 ■929 -48.7** -21.0** -18.20 -16.30
L7XTI -22.8** -2.37 -3.00 -8.60 -16.2** -15.0** -35.2** 0.00 0.00 2.3.00
L7XT2 -15.60 6.70 10.60* 4.30 2.16 3.55 -27.8** 11.4** 29.50 32.60
L8XT1 16.4* 18.3* 9.10* 2.90 5.66 7.10 16.05* 16.1** 88.6** 93.0**
L8XT2 -6.040 18.8* 6.10 10.00 0.81 2.19 -16.67 28.6** 54.50* 58.10*
L9XT1 -23.0** -2.70 12.9** 6.40 -7.01 -5.74 -24.1** 17.10** 25.00 27.90
L9XT2 -27.7** -8.60 3.00 -2.90 -5.93 -4.64 -43.2** -12.4** -9.10 -7.00
L10XT1 -16.6* 5.50 9.10* 2.90 0.00 1.37 -35.8** -0.95 0.00 2.30
L10XT2 -15.40 7.00 6.10 0.00 1.08 2.46 -30.9** 6.70** 34.10 37.20
L11XT1 -22.3** -1.70 1.50 -4.30 -4.58 -3.28 -18.5* 25.7** 34.10 37.20
L11XT2 -32.6** -14.70 9.10* 2.90 -7.28 -6.01 -50.6** -23.8** -13.60 -11.60
L12XT1 22.9** 20.10* 6.10 0.00 -2.70 -1.37 -15.4* 30.5** 50.00 53.50*
L12XT2 -10.10 13.70 5.30 -0.71 8.36 9.84 16.7* 28.6** 59.10** 62.80*
L13XT1 -20.1* 0.97 10.60* 4.30 0.81 2.19 -22.2** 20.0** 50.00 53.50*
L13XT2 -11.90 11.30 3.00 -2.90 -0.54 0.82 -5.56 45.7** 18.20 20.90
L14XT1 -17.8* 4.00 0.00 -5.70 1.35 2.73 -16.67* 28.6** 25.00 27.90
L14XT2 -30.1** -11.60 5.30 -0.70 -10.50 -929 -47.5** -19.1** -15.90 -14.00
L15XT1 -21.8** -1.15 10.60* 4.30 -11.6* -10.4* -25.3** 15.24** 18.20 20.90
L15XT2 -15.30 7.20 4.60 -1.40 5.12 6.56 -22.2** 20.00** 54.50* 58.10*
L16XT1 -10.20 13.50 4.60 -1.40 0.81 2.19 -11.73 36.2** 59.10* 62.80*
L16XT2 -18.0* 3.60 5.30 -0.70 -2.16 -0.82 -37.7** -3.8* 11.40 14.00
L17XT1 -6.00 18.90* 10.60* 4.30 4.85 6.28 -8.64 41.00** 52.30* 55.8*
L17XT2 -17.3* 4.60 5.30 -0.70 -7.82 -6.56 -31.5** 5.1** -34.10 -32.6
L18XT1 -15.40 6.90 6.10 0.00 -5.39 -4.10 -25.93 14.3** 25.00 27.90
109
Oromia Agricultural Research Institute (IQQO), Crop research Proceeding 2017
Patterson HD, Williams ER. A new class of resolvable incomplete block designs. Biometrika. 1976 Apr 1:83-92.
Rodrigo 0, Faria MV, Neumann M. Battistelli GM, Tegoni RG, Resende JT. Genetic divergence among maize hybrids and correlations with heterosis and combining ability. Acta Scientiarum. Agronomy. 2012 Mar:34(l):37-44.
Senthil Kumar P, Bharthi P. Studies on relationship between gca nad sea effects in maize (Z. mays L.).Elect. J. Plant Breed. 2009;1:24-7.
Shushay W Standard Heterosis of Maize (Zea mays L.) Inbred Lines for Grain Yield and Yield Related Traits in Central Rift Valley of Ethiopia. Journal of Biology, Agriculture and Healthcare ..2014. 4(23) 2224-3208
Sime G, Aune JB. Maize response to fertilizer dosing at three sites in the Central Rift Valley of Ethiopia.Agronomy. 2014 Sep 5;4(3):436-51.
Tang J, Yan J, Ma X, Teng W, Wu W, Dai J, Dhillon BS, Melchinger AE, Li J. Dissection of the genetic basis of heterosis in an elite maize hybrid by QTL mapping in an immortalized F2 population. Theoretical and applied genetics. 2010 Jan 1; 120(2):333-40.
Zeleke H. Heterosis and combining ability for grain yield and yield component traits of maize in Eastern Ethiopia. Science, Technology and Arts Research Journal. 2015;4(3):32-7.
Ziggiju M, Habtamu Z, Legesse W. 2016.Standard heterosis of pipeline maize (Zea mays 1.) hybrids for grain yield and yield related traits at Pawe, Northwestern Ethiopia International Journal of Plant Breeding and Crop Science Vol. 3(2), pp. 135-144
Genetic Analysis of Inbred Lines in Line * Tester Mating Design for Grain Yield and Traits Related Yield in Maize (Zea Mays L.)
'Natol Bakala* :Berhanu Abate ’Mandefiro Nigusie 'Oromia Agricultural Research Institute Yabello Pastoral and Dryland Agricultural Research Center
:School of Plant and Horticultural Science, Hawassa University, Ethiopia ’Oxfam America Deputy Regional Director, P.O. Box 85 Ethiopia
Corresponding Author: E-mail:[email protected]:+2510464460261,AbstractMaize is one the most important cereal crop widely grown in the world. Maize crosses along with similar maturing checks were evaluated at Hawassa in 2015-2016 cropping season to understand the nature of gene action governing yield and its attributes through line * tester analysis and to study genetic contribution of line, tester and the interaction of line * tester to total variation. The experiment was planted by using a-lattice design 6*11 arrangement. Cross Ln xT2 showed the highest mean grain yield than both checks. The result showed that, lines played an important role towards days to anthesis. days to silking, ear length, number of rows per cob and number of kernels per row. indicates predominant of maternal lines. Based on analysis of genetic variance, for traits variance due to specific combining ability (o2sca) was higher than variance due to general combining ability (o2gca) indicated, non-additive gene action was important than additive gene action in the inheritance of these traits. These best cross combinations could be effectively utilized in maize breeding for the improvement of yield components and thus their incorporation in further breeding program is suggested.Keywords: Additive, non-additive. Cross, Genotypes, line x tester
113

Oromia Agricultural Research Institute (IQQO), Crop research Proceeding 2017
IntroductionMaize is one of the most important cereal crops in the world after wheat and rice. Maize is being nutritionally an important crop used as food and feed. It is a source of industrial materials for the production of fuel, oil, starch, syrup; gluten, alcohol, glucose, ethanol and many more products. Its cultivation extends over a wide range of geographical and environmental conditions ranging from 58°N to 40°S. Portuguese traders introduced maize to Ethiopia in 16lh or 17th century (Haffnagel, 1961). Currently, in Ethiopia, maize is one of the most important cereal crops grown in almost all parts of the country. The popularity of maize in Ethiopia is partly because of its high value as a food, fodder and source of fuel for rural area. Approximately 88% of maize produced in Ethiopia is consumed as food, both as green and dry grain (Abate et al. 2015).The total annual production and productivity of maize in Ethiopia exceeds all other cereal crops except Tef in area coverage (Mosisa et al. 2011.Objective of maize breeding programs is evaluation of best yielding and adaptive. Improvement of varieties (genotypes) needs well documented information of genetic information. Breeders conducted a genetic analysis for yield and yield related traits of genotypes. In fact, maize has been subjected to extensive genetic studies than any other crops (Hallauer and Miranda, 1988). Several biometrical techniques were used to study genetic analysis of quantitative traits. Among, line * tester is suggested by Kempthorne (1957) and is used to breed both self and cross pollination plants. This method efficient study large number of lines and provides reliable estimates of genetic components, estimates of specific combining ability (SCA), general combining ability (GCA) and gene action governing quantitative traits. Therefore, the current study is objected to understand the nature of gene action governing yield and its attributes through line x tester analysis and to study genetic contribution of line, tester and the interaction of line x tester to total variation.Materials and MethodsField experiment was conducted at Hawassa research center located at 7°4'N and 38°31'E latitude and longitude, respectively, at an altitude of 1700 m.a.s.l. in the central rift valley of Ethiopia. Sixty-four crosses developed by crossing 32 inbred lines with two testers in line x tester mating design (Kemperton, 1957). Inbred lines (32) were coded as L u L2...L32 and two testers CML-144 (F2) -21-2-2-1- I/CMLI44 and CML-144 (F2) -15-2-2-2-1/CML159 were coded as Ti and T2. Sixty-four crosses were planted along with similarly maturing checks BHQPY-545 and BH-546 at Hawassa. The experiment was planted by using a-lattice design 6*11 arrangement (Patterson and Williams, 1976) with two replications. Each block comprises of 11 units having 5.1 meters long and 9.75 meters width with the spacing of 0.75 meter between rows and 0.30 meter between plants. All cultural practices were performed as per required. Data like days to maturity (DM), field weight, seed moisture content and thousand kernel weight (TKW) were collected plot bases while data like plant height (PH), ear height (EH), ear length (EL), number of rows per ear (NRPE), ear diameter (ED) and number of kernels per row (NCPR) collected in plant bases. Biomass (BM ) and grain yield (GY) calculated by using ihe following formulary • • u u -K Freshearweighx (100-MC)x0.8» 1 7 x 10,000, , n . r .Gram yield (t ha ) ---------- -------- Where: MC =moisture content of gram at
nx 85 X 3.85 X 100 w
harvest, 0.8=shelling percentage, 85=standard moisture content of grain, n=number of plants harvested,17=total number of plants in a plot, 10000 = Area of hectare in square meters.
114

Oromia Agricultural Research Institute (1QQ0), Crop research Proceeding 2017
Table 1. Lists of crosses and checks used in the experiment
Stock ID B K 152-1 B K 152-2 BK 152-3 BK 152-4 BK 152-5 BK 152-6 BK 152-7 BK 152-8 BK 152-9 BK 152-10 BK152-11 BK 152-12 BK 152-13 BK 152-14 BK152-15 BK 152-16 BK152-17 BK 152-18 BK 152-19 BK 152-20 BK 152-21 BK 152-22 BK 152-23 BK 152-24 BK 152-25 BK 152-26 BK 152-27 BK 152-28 BK 152-30 BK 152-31 BK 152-32 BK 152-33 BK 152-34 BK 152-35 BK 152-36 BK 152-37 BK 152-38 BK 152-39 BK 152-40 BK 152-41 BK 152-42 BK 152-43 BK 152-44 BK 152-45
BK02BK02-BK02-BK02-BK02BK02-BK02-BK02'BK02BK02-BK02BK02BK02'BK02-BK02BK02BK02'BK02BK02BK02BK02-BK02BK02BK02-BK02BK02BK02BK02BK02BK02BK02BK02BK02BK02BK02BK02BK02BK02BK02BK02BK02BK02BK02BK02
Z-311 Z-311 Z-311 Z-311 Z-311 Z-311 Z-311 Z-311 Z-311 Z-311 Z-311 Z-311 Z-311 Z-311 Z-311 Z-311 Z-311 Z-311 Z-311 Z-311 Z-311 Z-311 Z-311 •Z-311 ■Z-311 Z-311 Z-311 Z-311 Z-311 Z-311 Z-311 ■Z-311 Z-311 Z-311 ■Z-311 -Z-311 Z-311 Z-311 Z-311
-Z-311 Z-311 Z-311 Z-311 Z-311
-28(F2)-B--28(F2)-B--28(F2)-B--28(F2)-B--28(F2)-B--28(F2)-B--28(F2)-B--28(F2)-B--28(F2)-B--28(F2)-B--28(F2)-B--28(F2)-B--28(F2)-B--28(F2)-B--28(F2)-B--28(F2)-B--28(F2)-B--28(F2)-B--28(F2)-B--28(F2)-B--28(F2)-B--28(F2)-B--28(F2)-B--28(F2)-B--28(F2)-B--28(F2)-B'-28(F2)-B'-28(F2)-B--28(F2)-B--28(F2)-B--28(F2)-B--28(F2)-B--28(F2)-B--28(F2)-B--28(F2)-B--28(F2)-B--28(F2)-B--28(F2)-B--28(F2)-B--28(F2)-B--28(F2)-B--28(F2)-B--28(F2)-B--28(F2)-B-
Pedigree x CML-144(F2)-4-l-l-l x CML-144(F2)-4-l-1-1 x CML-144(F2)-4-2-2-l x CML-144(F2)-4-2-2-l x CML-144(F2)-4-3-2-l x CML-144(F2)-4-3-2-l x CML-144(F2)-15-1-1- x CML-144(F2)-15-1-1- x CML-144(F2)-15-2-1 - x CML-144(F2)-15-2-1 - x CML-144(F2)-15-2-1- x CML-144(F2)-15-2-1 ■ x CML-144(F2)-15-2-1- x CML-144(F2)-15-2-1 - x CML-144(F2)-15-2-2- x CML-144(F2)-15-2-2- x CML-144(F2)-15-2-3- x CML-144(F2)-15-2-3- x CML-144(F2)-15-2-3- x CML-144(F2)-15-2-3- X CML-144(F2)-17-3-1 - x CML-144(F2)-17-3-1 - x CML-144(F2)-17-3-1- x CML-144(F2)-17-3-1- x CML-144(F2)-17-3-2- x CML-144(F2)-17-3-2- x CML-l44(F2)-21-2-2- x CML-144(F2)-21-2-2- x CML-144(F2)-48-l-l- x CML-144(F2)-48-1 -1 - x CML-144(F2)-48-2-l- x CML-144(F2)-48-2-l- x CML-144(F2)-50-3-1 - x CML-144(F2)-50-3-l- x CML-144(F2)-50-3-l- x CML-144(F2)-50-3-l- x CML-144(F2)-61-l-2- x CML-144(F2)-61-1 -2- x CML-144(F2)-61-l-2- x CML-144(F2)-61-1-2- x CML- 144(F2)-61-2-1 - x CML-144(F2)-61-2-l- -1-1-1-1/CMLl 44 -1-1-1-1/CML159
-1/CML 144 -1/CML159 -1/CML 144 -1/CML159 -1/CML 144 -1/CML159 I - 1/CML144 1-1/CML159 1-1/CML144 1-1/CML159 1-2/CML1441-2/CML1592- 1/CML 144 2-1/CML 159 2-1/CML 144 2-1/CMLI591-1 /C M L 144 1 -1 /CML 1592-1/CML144 2-1/CML1591-1/CML144 1 -1/CML 1592-1/CML 144 2-1/CML159 1-1/CML144 1 -1/CML 159 1 -1/CML 144 1-1/CML159 • 1 - 1/CML 144 1 -1/CML 159 1-1 /C M L 144 ■1-1/CML159 ■1 -1/CML 144 1 -1/CML 159 ■2- 1/CML 144 •2-1/CML159 I-1/CML144 1-1/CML159 ■1-2/CML144 •1-2/CML159 1 -1/CML 144 •1 -1/CML 159
CodeL|XT iLlxT2L2xTlL2xT2L3*TIL3xT2L4xTlL4xT2L5xTIL5xT2L6xTlL6xT2L7xTlL7xT2L8xTlL8xT2L9xTIL9XT2LlOxTlLI0xT2L llx T lLllxT2L12xT1L12xT2L13xT1L13xT2L14xTlL14xT2L15xTlL15xT2L l6xTlL16xT2L17xT1L17xT2L18xT1L18xT2L19xT1L19xT2L20xT1L20xT2L21xTlL21xT2L22xTlL22xT2
115

Oromia Agricultural Research Institute (IQQO). Crop research Proceeding 2017
B K 152-46 BK02-Z-311 -28(F2)-B-1-1-2-1-1/CML144 L23XT1BK152-47 BK02-Z-311 -28(F2)-B- 1-1-2-1-1/CML159 L23xT2BK 152-48 BK02-Z-311 -28(F2)-B-1 -1 -2-2- 1/CML 144 L24xTlBK 152-49 BK02-Z-311 -28(F2)-B-1 -1 -2-2- 1/CML 159 L24xT2BK152-50 BLWBAM-QPM2006 F2-15-2-1 -1-1-1/CML 144 L25xTlBK 152-51 BLWBAM-QPM2006 F2 -15-2-1 -1-1 -1/CML 159 L25xT2BK 152-52 BLWBAM-QPM2006 F2 -15-2-1 -1-2-1/CML144 L26xTJBK 152-53 BLWBAM-QPM2006 F2 -15-2-1 -1 -2-1 /CML159 L26xT2BK152-54 (CML-142 x 144-7-b(F2) x i44-7-b(F2) x 144-7-b)-B-12-1 -1-2>1 - L27xTlBK 152-55 (CML-142 x l44-7-b(F2)x 144-7-b(F2) x 144-7-b)-B-l 2-1-1-2-1- L27xT2BK 152-56 (CML-142 x |44-7-b(F2)x I44-7-b(F2) x 144-7-b)-B-12-1-1-2-1- L28xTlBK 152-57 (CML-142 x 144-7-b(F2)x |44-7-b(F2)x |44-7-b)-B-12-l-l-2-l- L28xT2BK 152-58 (CML-142 x 144-7-b(F2) x 144-7-b(F2) x 144-7-b)-B-12-l-2-l-l- L29xTlBK 152-59 (CML-142 x l44-7-b(F2)x ]44-7-b(F2) x 144-7-b)-B-12-l-2-M- L29xT2BK 152-60 (CML-142 x |44-7-b(F2) x 144-7-b(F2) x 144-7-b)-B-12-1-2-2-1- L30xTlBK 152-61 (CML-142 x i44-7-b(F2) x 144-7-b(F2) x 144-7-b)-B-12-1-2-2-1- L30xT2BK 152-62 (CML-142 x l44-7-b(F2) x 144-7-b(F2) x 144-7-b)-B-12-1-2-2-1-2 L31xTlBK 152-63 (CML-142 x 144-7-b(F2)x l44-7-b(F2) x 144-7-b)-B-12-1-2-2-1-2 L31xT2BK 152-64 (CML-142 x 144-7-b(F2) x 144-7-b(F2) x 144-7-b)-B-12-1 -3-1-1-1/ L32xTlBK 152-65 (CML-142 x 144-7-b(F2)x i44-7-b(F2) x 144-7-b)-B-l2-1-3-1-1- L32XT2Checks BHQPY-545 BHQPY-545
BH-546 BH-546
Data analysisAll collected data were subjected to SAS computer software to test the significance genotypes (Gomez and Gomez, 1984). Genetic parameter analysis and proportional contribution of line tester and line x tester were done only for treatment Genetic parameter analysis
M SlX to2GCA=---- a— ----- fc-, a2SCA=MSt-rtl ’ r
The ratio of o2GCA to o2SCA was express as -r o;SCA
Additive varianceo2l=[Ms(l)-Mse]/rt=l/2o2A, o2A=2o2lo2t=[Ms(t)-Mse]/rl= 1 /2c2 A o2A=2o2tcr2A-[2(y2J+202t]/2=o-T+2o2t o2D=dominance variance a2lt=[Ms(lxt)-Mse]/r= (^D
Average degree of dominance (a) was calculated according to the following equation:a=V2o2D/o2A, if a = 0 no dominance, if a = <1 > 0 partial dominance, if a = 1 complete dominance, if a >1 over dominance
Where: a2GCA=variance of General Combining ability, a2SCA=variance of Specific Combining Ability, MSNmean square of line, MSt=mean square of tester, MSIxt=mean square of line x tester, Mine.
116
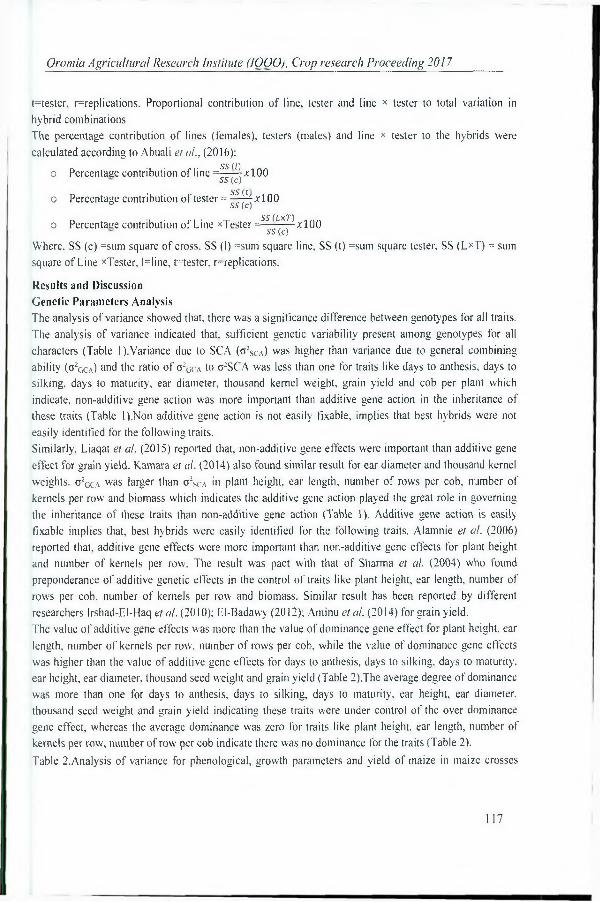
Oromia Agricultural Research Institute (1000), Crop research Proceeding 2017
t=tester. ^replications. Proportional contribution of line, tester and line x tester to total variation in hybrid combinationsThe percentage contribution of lines (females), testers (males) and line x tester to the hybrids were calculated according to Abuali et al., (2016):
SS (I)o Percentage contribution of line =--- *100ss (c )
o Percentage contribution of tester = ^-^-xlOOSS (L x T )
o Percentage contribution of Line xTester ----- *100S S (c )
Where. SS (c) =sum square of cross, SS (I) =sum square line, SS (t) =sum square tester, SS (L*T) = sum square of Line xTester, Nine, t=tester, r—replications.
Results and Discussion Genetic Parameters AnalysisThe analysis of variance showed that, there was a significance difference between genotypes for all traits. The analysis of variance indicated that, sufficient genetic variability present among genotypes for all characters (Table l).Variance due to SCA (o2sca) was higher than variance due to general combining ability (o2GCa.) and the ratio of o2gca to c2SCA was less than one for traits like days to anthesis, days to silking, days to maturity, ear diameter, thousand kernel weight, grain yield and cob per plant which indicate, non-additive gene action was more important than additive gene action in the inheritance of these traits (Table l).Non additive gene action is not easily fixable, implies that best hybrids were not easily identified for the following traits.Similarly, Liaqat et al. (2015) reported that, non-additive gene effects were important than additive gene effect for grain yield. Kamara et al. (2014) also found similar result for ear diameter and thousand kernel weights. c 2g c a was larger than o 2sca in plant height, ear length, number of rows per cob. number of kernels per row and biomass which indicates the additive gene action played the great role in governing the inheritance of these traits than non-additive gene action (Table 1). Additive gene action is easily fixable implies that, best hybrids were easily identified for the following traits. Alamnie et al. (2006) reported that, additive gene effects were more important than non-additive gene effects for plant height and number of kernels per row. The result was pact with that of Sharma et al. (2004) who found preponderance of additive genetic effects in the control of traits like plant height, ear length, number of rows per cob, number of kernels per row and biomass. Similar result has been reported by different researchers Irshad-FJ-Haq et al. (2010); El-Badawy (2012); Aminu et al. (2014) for grain yield.The value of additive gene effects was more than the value of dominance gene effect for plant height, ear length, number of kernels per row, number of rows per cob, while the value of dominance gene effects was higher than the value of additive gene effects for days to anthesis, days to silking, days to maturity, ear height, ear diameter, thousand seed weight and grain yield (Table 2).The average degree of dominance was more than one for days to anthesis, days to silking, days to maturity, ear height, ear diameter, thousand seed weight and grain yield indicating these traits were under control of the over dominance gene effect, whereas the average dominance was zero for traits like plant height, ear length, number of kernels per row, number of row per cob indicate there was no dominance for the traits (Table 2).Table 2.Analysis of variance for phenological, growth parameters and yield of maize in maize crosses
117

Oromia Agricultural Research Institute (IQQO), Crop research Proceeding 2017
f, , DA DS DM PH EH E L NRPC NCPR ED TSW G YVariation__________________ DF (days) (days) (days)_______ (cm)_________(cm)_________(cm)_______(no)_______ (no)_______ (cm)_______£g)__________(t/ha)Replication I 1.09“ 0.61 3.66m 1.94 303.03* 1.91“ 0.02m 17.89“ 0.03“ 37.12“ 0.69“Block 5 9.10** 10.5“ 14.8** 813.9** 376.5** 9.87** 0.60"* 9.81ra 0.17“ 4687“ 3.02*Genotypes_______65 6.05** 6.00** 14.96** 442.11* 115.2** 5.91** 0.54*______ 13.52* 0.13** 4824** 2.94“Error____________60 3.12_______ 2/73_______ 3JS2_________ 290.34 73.43________ ^01________0.32* 8.55_______ 009_______ 50__________ 1.58aV c a 0 T i Q M 0 J7 2A7 L25 005 0.0001 0A2 0XH 88 9 0.06g* s c a 5.53 1.83 31.5 -210.8 26.9 -1.84 -0.29 -1.97 0.41 4952 4.01c ^ o c V c ^ s c a 0.02 0.04 0.01 -0.01 0.05 -0.03 0 -0.06 0.02 0.02 0.01o2 A 0.43 0.31 1.49 9.89 5.01 0.2 0.01 0.47 0.02 355.93 2.39< 0 22.12 7.32 126 -843.2 107.6 -7.36 -1.19 -7.88 1.66 19808 1.6A_______________________10.1 6.91________ [3,01________ 0____________ 6 55________ 0__________ 0__________ 0___________13.71 10.55 1.16** highly significant at P<0.01,* significant difference at P<0.05, ns=non-significant, DA=days to anthesis. DS=days to silking, DM=days to maturity. PH=plant height. EH=Ear height, EL=ear length, NRPC=number o f rows per cob, NCPR=number o f kernel per row, ED=ear diameter, TSW=thousand seed weight, GY=grain yield. (blk/Rincom plete blocks with in replication, <j“ocA=variance of general combining ability, t sc A=var*ance of specific combining ability, o3A=additive variance, o^^dominance variance, §= average degree of dominance.
118
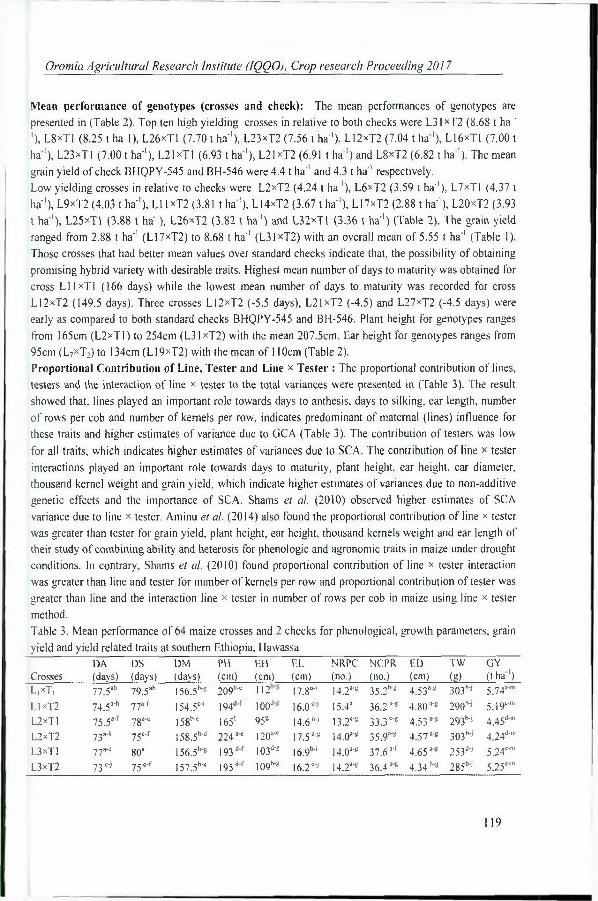
Oromia Agricultural Research Institute (IQQO), Crop research Proceeding 2017
Mean performance of genotypes (crosses and check): The mean performances of genotypes are presented in (Table 2). Top ten high yielding crosses in relative to both checks were L31XT2 (8.68 t ha ' '), L8*TI (8.25 t ha I), L26*T1 (7.70 t ha'1), L23xT2 (7.56 t ha’1), L12*T2 (7.04 t ha1), L16><T1 (7.00 t ha1), L23><T1 (7.00 t ha'1), L21><TI (6.93 t ha1), L21*T2 (6.91 t ha'1) and L8*T2 (6.82 t ha'1). The mean grain yield of check BHQPY-545 and BH-546 were 4.4 t ha” and 4.3 t ha’1 respectively.Low yielding crosses in relative to checks were L2*T2 (4.24 t ha'1), L6XT2 (3.59 t ha'1), L7xTl (4.37 t ha'1), L9xT2 (4.03 t ha'1), LI |xT2 (3.81 t ha1), L14xT2 (3.67 t ha'1), L17*T2 (2.88 t ha'1), L20XT2 (3.93 t ha'1), L25*T1 (3.88 t ha'1), L26*T2 (3.82 t ha'1) and L32*T1 (3.36 t ha'1) (Table 2). The grain yield ranged from 2.88 t ha'1 (L17xT2) to 8.68 t ha'1 (L31XT2) with an overall mean of 5.55 t ha'1 (Table 1). Those crosses that had better mean values over standard checks indicate that, the possibility of obtaining promising hybrid variety with desirable traits. Highest mean number of days to maturity was obtained for cross L Ilx T l (166 days) while the lowest mean number of days to maturity was recorded for cross L12xT2 (149.5 days). Three crosses L I2 XT2 (-5.5 days), L21XT2 (-4.5) and L27xT2 (-4.5 days) were early as compared to both standard checks BHQPY-545 and BH-546. Plant height for genotypes ranges from 165cm (L2xTl) to 254cm (L31xT2) with the mean 207.5cm. Ear height for genotypes ranges from 95cm (L7xT:) to 134cm (L19xT2) with the mean of 110cm (Table 2).Proportional Contribution of Line, Tester and Line x Tester : The proportional contribution of lines, testers and the interaction of line * tester to the total variances were presented in (Table 3). The result showed that, lines played an important role towards days to anthesis, days to silking, ear length, number of rows per cob and number of kernels per row, indicates predominant of maternal (lines) influence for these traits and higher estimates of variance due to GCA (Table 3). The contribution of testers was low for all traits, which indicates higher estimates of variances due to SCA. The contribution of line x tester interactions played an important role towards days to maturity, plant height, ear height, ear diameter, thousand kernel weight and grain yield, which indicate higher estimates of variances due to non-additive genetic effects and the importance of SCA. Shams et al. (2010) observed higher estimates of SCA variance due to line x tester. Aminu et al. (2014) also found the proportional contribution of line x tester was greater than tester for grain yield, plant height, ear height, thousand kernels weight and ear length of their study of combining ability and heterosis for phenologic and agronomic traits in maize under drought conditions. In contrary. Shams et al. (2010) found proportional contribution of line x tester interaction was greater than line and tester for number of kernels per row and proportional contribution of tester was greater than line and the interaction line x tester in number of rows per cob in maize using line x tester method.Table 3. Mean performance of 64 maize crosses and 2 checks for phenological, growth parameters, grain yield and yield related traits at southern Ethiopia, Hawassa
CrossesDA(days)
DS(days)
DM(days)
I’ ll(cm)
E ll(cm)
EL(cm)
NRPC(no.)
NCPR(no.)
ED(cm)
TW(§)
GY (t ha ')
L,xT, 77.5ab 79.5ab 156.5b'g 209h'c 112 17.8“'' I4.2a'g 35.2** 4.53a'g 303b'J 5.74amLlxT2 74.5a'h 77a-f 154.5ci 194df 100d' 16.0dj 15.43 36.2 a'g 4.80 a'g 290b‘j 5.19c'mL2xTl 75.5a'f 78ac 158 c 165' 95s 14.6,vi 13.2*® 33.3 c's 4.53 s'* 293N 4.45d’mL2XT2 y3 a-k 75c‘f 158.5b'd 224ae 120ac 17.5 a'g 14.0ag 35.9a‘g 4.57 a‘g 303b'j 424d-">L3xTI 77a-c 80a 156.5bg 193df 103d’s I6.9M 14.0a'g 37.6 a'r 4.65ag 253J-j 5.24c"nL3xT2 73 c'j 75 c'f 157.5b'c 195df 109b’g 16.2d j 14.28'8 36.4as 4.34 285bj 5.25c',n
119

L4*TJ 72e-g 74.5 J57 209^ 1J3-* 17.5ag 13.9b_J 38.0a‘‘ 4.55 a's 295b‘J 5.56b'mL4xT2 76a'e 78” 153.5ci 201ef 108* 17.5ag 13.9^ 38.7 4.54 285^ 5.73a'mL5XT1 73.5b_g 75£-f 154.5°-' 215 M 113-* 16.5dj 13.9^ 35.3 4.78 a'g 288n 6.06a 1L5xT2 73.5* 75.5b_f 157^ 246ab 121^ 19.7"* 13.4^ 35.51x8 4.78 a'g 353*'g 6.07L6*TI 76.5” 1 78.5” 1 159* 207^ J l 3.-8 15.5^ )3.6CJ 33.9 c‘g 4.63 a'g 258C'J 6.49akL6XT2 77.5ab 79.5ab 156.5* 191el 99C-S 12.5* 13.6^ 33.2cg 4.13s 208° 3.59kmL7XT1 74 » 76.5-f 155^ 192ef 101* 16.1 ^ 12.8s 31.1** 4.55 a'g 263c'j 4.37d'mL7XT2 77™ i r c 156.5* 211^ 95* 17.6ag 14.6~ 37.9af 4.70ag 293H 5.67b"nL8xTI 76“ 78.5” 1 157.5^ 235**d 123” \9.5“ 14.4-r 39.2a< 5.07ab 340ag 8.25abL8*T2 73c‘j 75cf 158 2 1 3 a_c 113*'e 19.6a< 14.0*‘s 37.4 a’f 4.79 a’g 338a'h 6.818'8L9XTI 75-g 77».f 158.5b~d 203cf ioo“-g 16.1dj 14.9^ 34.5c*8 4.623g 308h 5 53 *mL9XT2 77” 78.5” 1 154.5°' 189cl 11^ 15.1f*j 13.6CJ 34.9C‘- 4.34 h-8 230*-j 4.03e'mLlOxTl 75.5af 78 « 164a 202cf 109* 17.4a-* 14.4*'r 37.188 4.29cg 260°-j 4.39d'mL10xT2 74.5a‘h 76.5“*f 153.5^ 198cf 106^ 17.7 a’g 14.0*’8 37.5 a‘f 4.78 a'g 280N 5.928'1L llx T l 78a 80a 166a 192cf 99** 16.2 d'j 13.4df 35.4 a-g 4.78 330a_i 5.86L I 1xT2 75.5if 77.5*r 156.5* 185el 103d*8 14.iij 14.4*-f 34.4** 4.17dg 200* 3.811""L12xH 74.5a'h 76.5af 157.5^ 225” ,,9 ~ 18.2as 14.0"'8 36. r g 4.89” 343-g 6.58*L12xT2 75 77a'r I49.5i 222” 117*"f 1 s.s0*8 13.9^ 40.2ab 4.75a’8 338a'h 7.00”L13*T1 71.5fg 74cf 158^ 199 c*r 109* \6.r> 14.6” 37.4-f 4.90ad 315n 6.61*L13xT2 73 N 75c-r 152* 215” 115*8 18.4 13.6CJ 36.918 4.86af 383” 5.22c’mL14xT1 75.5“'f 78” 158^ 224” 108^ 17.2“* 13.2*8 37.6af 4.69ag 338a_d 5.49b'"’L !4 xT2 77“ 79” 157b-f 197 d-r II3 * 8 14.6hj 13.9^ 33.2c*8 4.08g 213n 3.67j'mL15xT1 71.5fg 74cf 152* 201cf 106* 16.3di I4.6a< 32.8d’8 4.79ag 303n 5.17c'mL I5 xT2 75,5*"f 78.5^ 155w 220” 1 I6**8 17.7ag 13.8^ 39.0 “ 4 72-8 315* 6.82agL I6 xT1 72.5c'g 77»-r 155.5W 199cf 105* 18.7 a'g 13.8^ 37.4 a'f 4.97” 358a'f 7.04” *LJ6*T2 75** 77a"f 154* 2 11^ , ,9.< 17. Iw 13.9^ 36.3^ 4.64 a's 253^ 4.88™L17xT1 75.5a'f 78” 157.5^ 219” I15T* 19.6a< 14.6M 38.9M 5.22a 370” 6.71*1LI7*T2 75 a'g 77.5af 156.5* 204 b‘f 119*-* 17.2ag 13.9^ 34,2 c’g 4.39 h-8 278cj 2.88mL I8xTl 72.3d-8 75c'f 152* 212« 111^ 14.0- 8 35.1c*8 4.778-8 300N 5.53b’mL I8 xT2 72.5h 74.5df 158.5^ 2 J 7 ” ,ogb-s 17.4a’8 14.4*-f 32.4 c‘g 4.63a’8 3408'8 6.23s-'LI9xTl 75 ** 78” 156.5b"B 195df 101** 15.8cj 13.9^ 34.0CB 4.62*B 268C'J 5.27b‘mL19xT2 75-g 77.5*f I55.5W 224” 134* 15.4ei 13.2eg 36.2 4.30cg 253d'J 5.46b'mL20*TI 72.5d‘g 74.5d'r 157.5^ 2138-4 110* 18.4a'8 13.6C'J 38.1af 4.39 h"8 270” 5 79a‘mL20xT2 76.58"1 79 « 155b-i 197 d'f 108^ 15.8 13.9^ 36.2 *g 4.33cs 22# 3.93fmL2lxTl 74a'g 76ar 150.5* 204^ Hl^s 18.4ag 14.4-f 36.1 *8 4.93” 368” 6.93”L21xT2 73.5* 76 * r 154.5* 213” 99 <=-8 21.0ab 13.8^ 38.6M 4.67 a-g 330*- 6.9 lafL22xTl 75.5af 77.5-f 155^ 208^ I15*-g 19.5M 13.6cj 38.8ae 4.89ae 348a'g 6.60,JL22*T2 77« 78.5iH) 155.5W 202cf 115* 16.5 13.4^ 33.8cg 4.34 h-* 235fj 4.52d'mL23xri 73.5* 75c'f 152* 221 ” 111^ 18.9ag 14.4*'f 36.1ag 4.59a'8 383” 7.00”L23xT2 75.5af 77.5af iss.s6-' 215” 110^ 21.5a 13.4d*f 43.1“ 5.213 448a 7.56”L24xT1 71.5fg 74cl 153.5c‘i 200cf 114*'* 16.3dj 13.4d'f 33.2 4.42 250* 5.37b"nL24xT2 74.5"‘h 77 a"r 157.5^ 195 d'r 11 ih 17.3 a'g I4.0**8 36.3a'8 4.16e's 290* 6.72a'hL25*T1 74.5a*h 77af 158^ 199cf 106b_i 15.4ej 13.4d'f 30.0s 4.34 320* 3.88g'mL25xT2 75a'g 77a'f 154dj 207 b-f 110^ 18.7*-g 13.0fg 38.5 "■* 4.80a'8 338"d 5.978'1L26xT1 73.5* 75.5b‘f 153.5" 240” 117*-' 20.2a'd 14.4a'f 40.4” 4.89” 378* 7.70”L26xT2 74.5a‘h 76.5a'f 158^ I86cf 102^ 18.208 13.6cj 34.7 c'g 4.19dg 303b' 3.82h'mL27xT1 72** 74cf 157M 2 J5 ” 109* 16.8n I4.0a- 39.8a‘d 4.55ag 278c 4.44 d'mL27xT2 7 I8 73.5f I50.5ij 196 d*f !06n 17.2ag l4.2-g 42.5ab 4.44 bg 253d- s^s6"11L28xT1 75 77a-f 154* 215” 11# * 19.4aH: 14.0*’8 40.5” 4.63 a’g 295*- 6.24a''L28xT2 73.5b"8 75.5b-‘ 156.5 * 206 w I07b"s 16.3dJ 15.1ab 34.3cg 4.90ad 278c 5.04c'mL29xT1 74.5ah 77 * f 154.5" 204 I06^g 16.4dj 13.9^ 37.9-f 4.39 N 268" 5.77cmL29xT2 77.5,b 79.5ab 155.5W 206 b"f llO ^8 15.8^ 13.9^ 328d-g 4.57a’8 2806- 4.49d'ra
120

Oromia Agricultural Research Institute (IQQO), Crop research Proceeding 2017
L30*T1 77.5ab 77.53'1 - |57 b-T- 199 c'! 97'b 18.1 a'¥ 14 2a's 36.3 a'g 4.90a“l 315bj 6.693'1L30xT2 77.5ab 79.5ab 155.5b" 202 c'f 108b-g 15.9 13.4J-' 37.9af 4.41 h"8 258CJ 4.94c'mL31xTI 75.5a'f 77.5a’r 159.5" 208b'e l08b-g 17.3 a‘g 13# 38.1af 4.68 305 5.39b"nL31xT2 76.5a"d 78.5a'd 155b’’ 254a 127ab 19.1ac 14.8ad 40.1 a*d 4.75 a'E 350ag 8.68aL32xTl 76 a’c 783 c 156.5**-® 188d 1 1 8 a'* 14.9s'1 13.4“-' 32.0e‘s 4.41b-g 240,J 3.36lmL32xT2 73.5b‘g 75.5b_f is s *7-' 205 b'f 106b"g 18.1as 14.0a'e 35.0 c's 4.77 a‘B 318b‘J 4.75c'mBH545QPY 72.5d‘s 74.5d'f 155b'' 227^ 120ae 20.9 13.2 37.1 a's 5.00a'c 405ab 4.43d i"BH-546 74.5a'h 7? a-f 155b- 216ae 112b'e 16.5 14.0 36.6 a‘g 4.53 a-g 263 4.33d mCV (% ) 2.93 2.80 2.01 9.44 9.43 12.5 5.5 9.2 7.31 20.36 26.79R2 0.70 0.73 0.82 0.65 0.69 0.71 0.65 0.64 0.64 0.69 0.71Grand (m) 74.7 76.8 155.8 207.5 110 17.3 13.9 36.4 4.62 299.8 5.58Means with the same letter are not significantly different from each other. DA=days to anthesis. DS=days to silking. DM=days to maturity, PH=plant height, EH=Ear height, EL=ear length, NRPC=number of rows per cob. ><CPR=number of kernel per row, ED=ear diameter, TSW=thousand seed weight, GY-grain yield, CV=coefficient of v ariance.Table 4. Proportional contribution of line, tester and line * tester interaction to total variance for 11 traits of maize hybrids tested at Hawassa_____________________________________________________________Source DA DS DM PH EH EL NRPC NCPR ED TSW GYVariation (days) (days) (days) (cm) (cm) (cm) (no) (no) (cm) (g) (t/ha)Line (% ) 58.00 55.00 38.00 46.00 44.70 60 52.30 63.10 42.20 47.90 44.20Tester (% ) 2.10 1.20 4.20 0.10 1.30 0 3.30 0.10 0.00 0.60 5.90
Line x 39.90 44.00 58.00 54.00 54.00 40 44.20 36.80 57.80 51.50 49.80Tester (% )
DA=days to anthesis, I)S=days to silking. DM=days to maturity. PI I=plant height, EH=Ear height, EL=ear length, NRPC=number of rows per cob, NCPR=number of kernel per row, LD=ear diameter, TSW=thousand seed weight, GY=grain yield.
Conclusions”he analysis of variance showed sufficient genetic variability among genotypes for ail characters. c 2Sca
was greater than o2Gca for traits like days to anthesis, days to silking, days to maturity, ear diameter, thousand kernel weight, grain yield. a2(iCA was larger than o2Sc a in plant height, ear length, number of rows per cob, number of kernels per row and biomass. The proportional contribution of line is greater than tester and the interaction of line * tester for traits like days to anthesis, days to silking, ear length, number of rows per cob and number of kernels per row. The proportional contribution of line * tester is greater than line and tester for traits days to maturity, plant height, ear height, ear diameter, thousand kernel weight and grain yield.Acknowledgment1 would like to acknowledge Oromia Agriculture Research Institute (OARJ) for funding. 1 wish to express :ny gratitude to Yabello Pastoral and Dryland Agricultural Research Center for facilitating financial assistance during the study. I also express my sincere appreciations and thanks to Hawassa maize research >taffs for their supports in planting, trial management and data collection.References\bate T, Shiferaw B, Menkir A. Wegary D, Kebede Y. Tesfaye K, Kassie M, Bogale G, Tadesse B. Keno
T (2015). Factors that transformed maize productivity in Ethiopia. Food Security. 1 ;7(5):965-81. Abuali Al, Khalafalla MM, Abdelmula AA, Idris AE, Osman AM 2016. Combining ability and heterosis
for yield and yield components in maize (Zea mays L.).
121

Oromia Agricultural Research Institute (IQQO). Crop research Proceeding 2017
Atanaw A. Nayakar NY, Wali MC 2010. Combining ability, heterosis and per se performance of height characters in maize. Karnataka Journal of Agricultural Sciences. 29; 16(1).
Aminu D, Garba M, Muhammad AS 2014. Combining ability and heterosis for phenologic and agronomic traits in maize (Zea mays L.) under drought conditions in the Northern Guinea Savanna of Bomo State, Nigeria. African Journal of Biotechnology. 13(24).
El-Badawy ME 2012. Estimation of genetic parameters in three maize crosses for yield and its attributes. Asian Journal of Crop Science. 1 ;4(4): 127.
Gomez KA, Gomez AA 1984. Statistical procedures for agricultural research. John Wiley & Sons; Feb 17.
Hallauer AR, Miranda Filho JB 1988. Quantitative genetics in maize breeding, 2nd edn (Iowa State University Press: Ames, 1A).
Irshad-ul-Haq M, Ajmal SU, Munir M, Gulfaraz M 2010. Gene action studies of different quantitative traits in maize. Pak. J. Bot. 42(2): 1021-30.
Kamara MM, El-Degwy IS, Koyama H 2014. Estimation combining ability of some maize inbred lines using line x tester mating design under two nitrogen levels. Australian Journal of Crop Science. 8(9): 1336.
Kempthome O 1957. An introduction to genetic statistics. An introduction to genetic statistics.Mosisa W, Legesse W, Berhanu T, Girma D, Girum A. Wende A, Tolera K, Gezahegn B, Dagne W,
Solomon A, Habtamu Z 2011. Status and future direction of maize research and production in Ethiopia. InMeeting the Challenges of Global Climate Change and Food Security through Innovative Maize Research (p. 17).
Panhwar SA, Baloch MJ, Jatoi WA, Veesar NF, Majeedano MS 2008. Combining ability- estimates from line x tester mating design in upland cotton. Proceedings of the Pakistan Academy of Sciences (Pakistan).
Patterson HD, Williams ER 1976. A new class of resolvable incomplete block designs. BiometrikaJ :83-Shams MA. Choukan RA, Majidi ES, Darvish FA. Estimation of combining ability and gene action in
maize using line* tester method under three irrigation regimes. Journal of Research in Agricultural Science. 2010 Jan l;6(l):l9-28.tttp://www.sid.ir/en/VEWSSID/J_pdf/l 34020101003
Sharma S, Narwal, MS, Kumar R. Dass S 2004. Line * Tester analysis in maize. Forage Research. 5(30), 28-30.
122
Oromia Agricultural Research Institute (IQQO), Crop research Proceeding 2017
Character Association and Path Analysis for Yield and Yield Related Traits in Sesame (Sesamum Indicum L.) genotypes
Chemeda Daba1 'Bako Agricultural Research Center
Corresponding author email: [email protected]
AbstractDeterminations of seed yield components that affect seed yield to the maximum extent are important in formulating an effective breeding program in sesame. Ten sesame genotypes were evaluated in randomized complete block design with three replications at four locations for two cropping seasons (2011 and 2012) with an objective to determine the association among seed yield and its related traits. Association between days to flowering, days to maturity, plant height, branches per plant and seed yield per plant was assessed by correlation coefficient and path analysis. Capsules per plant had significant positive phenotypic and genotypic correlation with seed yield per plant. Days to flowering, day's to maturity, plant height and branches per plant had low positive or negative non-significant phenotypic and phenotypic correlations with seed yield per plant. The path analysis based on seed yield as a dependent variable showed that days to maturity had the highest positive direct effect on seed yield at genotypic level. Days to flowering had the highest positive indirect genotypic effect on seed yield through days to maturity. Capsules per plant had high positive phenotypic and genotypic direct effect on seed yield. The direct effects of capsules per plant was almost equal to correlation coefficients with seed yield per plant, indicating that this trait is important for indirect selection. From this study, to improve seed yield in sesame, emphasis should be give on selection of plants with more capsules.
Keywords: Breeding, characters, correlation coefficients, sesame genotypes
IntroductionSesame is indigenous important oilseed produced by small-scale farmers for domestic use and as cash crop in Ethiopia. Us growing areas are in the trend of increasing due to area expansion; however, there is high completion for land with high yielding crops like maize and sorghum. Comparatively, low seed yield is one of the most important reasons that sesame needs breeding to provide more yield (Furat and Uzun, 2010). There is a need of developing high yielding varieties that can be used commercially in Ethiopia.Determinations of seed yield components that affect yield to the maximum extent are important in formulating an effective breeding program in sesame. Breeding process in sesame is not an easy because its seed yield is a complex phenomenon involving several contributing factors which are highly correlated v,ith environmental interaction and thus these factors influence seed production both directly and indirectly (Raus et al 2004). Direct selection for yield could be difficult because successful seed selection depends on the information on genetic variability and association of yield components with seed yield (Ibrahim and Khidir, 2012). A study of nature and degree of association of component characters with yield assumes greater importance for fixing up characters that play a decisive role in influencing yield. Selection would, therefore, be more effective, if it is based on component characters rather than yield.The understanding of the relationship between yields and its components is crucial in selection process and this relationship can be explained by means of correlation and path coefficient analysis. Correlation studies provide reliable information on the nature, extent and direction of selection (Yol et al., 2010). However, it may not give satisfactory results because its analytical resolution is limited to identification of mutual association among parameters. In crop breeding path analysis has been widely used to identify
123

Oromia Agricultural Research Institute (IQQO). Crop research Proceeding 2017
traits that have significant effect on yield for potential use in selection (Ibrahim and Khidir, 2012; Rao et al., 2013; Bharathi. et al., 2015).This technique is useful in determining the direct influence of one variable on the other and also separate the correlation coefficient into direct effect (path coefficient and indirect effect (extents exerted through other independent variables (Yucel, 2004).
Correlation studies, together with path analysis provide a better understanding of the association of different characters with seed yield in sesame. Several researchers (Salehi et al.. 2010; Sumathi and Muralidharan. 2010; Yol, et al., 2010; Azeez and Morakinyo, 2011; Begum and Dasgupta. 2011; Kurdistani et al.. 2011; Ibrahim and Khidir. 2012)); Desawi et al.2014; Mohammed, 2015) have worked out character associations to create proper database for sesame breeding practices. Their results differ widely for trait to trait which could be attributed due to differences in genetic material used for their studies. Therefore, this experiment was designed to estimate the degree of association among seed yield and its related traits in sesame genotypes from EthiopiaMaterials and methodsThe experimental materials for the present study comprised of two released varieties viz., Obsa and Dicho. seven elite breeding lines and a local check. Wama (Table 1). These genotypes were selected among the different landraces collected from Western Ethiopia based on their relative yield performance and disease resistance by Bako Agricultural Research Center. The local check was a cultivar mostly grown by farmers in the Wama Valley. All the test genotypes are white seeded, that fetch high price in the market. The ten sesame genotypes were grown in four locations (Angar, Uke, Wama and Bako) in 2011 and 2012 crop seasons. The genotypes were planted in the mid June each year at each location in randomized complete block design, with three replications. The seeds were drilled in each row at rate of 5 kg ha' in plot consisting of six rows with spacing of 40 cm. A fertilizer rate of 46 kg N ha 1 was applied at planting. Twenty days after planting, thinning was done to 10 cm spacing between plants. Four times hand weeding was done at two weeks interval, starting 15 days after planting. Seed yield per plot of the middle four rows were taken and used to estimate and report yield kg ha'1. Data were recorded on days to flowering, days to maturity, plant height, and capsules per plant and yield per plant.Table 1. List of genotypes used in this study and their silent features
No. Genotype Collection zone Altitude(masl)
DM PH BP CPP YPP BB
1 EW002 East Wellega 1470 124 140 9 143 17 R2 BG006 Benshangul-Gumuz 1000 123 138 7 141 16 R3 EW023- 2 East Wellega 1580 125 142 5 109 12 MR4 EW003-1 Horo-Guduru Wellega 1400 122 145 7 141 17 R5 E WOO 11-4 East Wellega 1384 124 140 8 124 14 R6 EW008-1 East Wellega 1402 121 137 7 138 16 MS7 E W011-2 East Wellega 1342 124 139 7 144 16 R8 Obsa Horo-Guduru Wellega 1395 119 135 7 125 14 R9 Dicho East Wellega 1460 120 140 8 130 16 MR10 W’ania (Local) East Welleea 1430 121 137 6 131 15 MRR=resistant. MR=moderately resistant. MS= moderately susceptible : Source: Bako Agricultural Research CeneterStatistical AnalysisPhenotypic, genotypic and environmental correlation coefficients were estimated using the formulae of Al-Jibouri et al. A958). Path coefficient analysis was used for exhibiting the direct and indirect effect on
124

Oromia Agricultural Research Institute (IQQO), Crop research Proceeding 2017
seed yield according to methods suggested by Dewey and Lu (1959).The inter association between the important yield components were ascertained by working out the path coefficient analysis at phenotypic and genotypic correlation coefficients. This was accomplished by partitioning the direct and indirect effects of various yield components upon seed yield. Seed yield was considered as resultant variable, whereas days to flowering, days to maturity, plant height, number of branches and capsules per plant were supposed to be the causal variables.
ResultsAnalysis of variance revealed that there was highly significant (p<0.01) difference among the genotypes for all characters studied (Table 2). The correlation coefficient of seed yield and yield components was shown in Table 3. Seed yield is the trait of primary interest and showed highly significant positive correlation with capsules per plant at genotypic, phenotypic and environment levels. It had weak negative association with days to flowering and days to maturity both at phenotypic and genotypic levels. Seed \ ield had positive non-significant positive association with plant height and branches per plant at phenotypic level. The genotypic correlation of plant height and branches per plant with seed yield was non- significant and negative. Days to flowering had highly significant positive association with days to maturity at phenotypic and genotypic levels. This character had a non- significant positive association with plant height both at phenotypic and genotypic level. Days to flowering had showed highly significant and positive genotypic with branches per plant. At phenotypic level, the association between days to flowering and branches per plant was positive but non-significant. Days to maturity had showed positive association with plant height and branches per plant at both genotypic and phenotypic levels. On the other hand, this character had weak negative association with capsules per plant at both phenotypic and genotypic levels. Plant height had positive correlation with branches per plant at all levels. At both phenotypic and genotypic levels the correlation between plant height and capsules per plant was nonsignificant and negative. The correlation between branches per plant and capsules per plant was positive at levels. In most cases the magnitude of genotypic correlation coefficients was higher than the corresponding phenotypic coefficients. All the traits except capsules per plant had non-significant positive or negative correlation with seed yield per plant at both phenotypic and genotypic levels.fable 2. Analysis of variance for different characters in sesame
Source DF Meansquare
DM PH BP CP SY
Location 3 385.9** 388.04** 23064.57** 45.62** 8798.5200 101.64**Rep 2 1.800 26.400* 18.050" 10.17** 9630.80** 125.49**Year 1 4.300 640.20** 18779.70** 156.81* 5133.750* 77.230*Genotype 9 70.5** 77.91** 220.410* 5.87** 3058.59** 42.00**Genotype x Year 9 45.4** 85.630* 185.8400 7.660ns 1315.06ns 10.91 O'"Genotype x Location 27 9.310 5.6700 87.8300 0.870ns mi.28ns 15.28nsLocation x Year 3 116.15** 118.17* 2125.60** 25.69** 134358.6** 1175.92**Genotype x Location x Year
27 11.210* 8.400 187.40** 1.410ns 1591.94ns 16.350"'
Error 158 7.070 7.630 98.4300 1.6000 1070.390 14.0100Mean 67.00 124.00 132.00 7.44 135.00 15.10CV%= 3.96 2.23 7.49 17.01 24.23 25.10
DF=Days to flowering, DM=Days to maturity, PH= Plant height, BP= Branches per plant, CP= Capsules per plant. YP= Yield per plant
125

Oromia Agricultural Research Institute (IQQO), Crop research Proceeding 2017
Table 3. Combined correlation coefficient across years and locations among six quantitative traits in sesame at genotypic, phenotypic and environmental levelsTraits DF DM PH BP CPDM rP 0.6801*
rG 0.8384**rE 0.1172rP 0.1134 0.3004
Ph rG 0.2794 0.5858rE -0.0734 -0.008rP 0.5274 0.2884 0.2705
BP rG 0.8048** 0.4033 0.3761rE 0.0402 0.0831 0.3423
CP rP -0.0263 -0.0706 -0.0284 0.1668rG -0.0875 -0.1506 -0.3113 0.1190rE 0.0636 0.0495 0.1456 0.4327
SY rP -0.0618 -0.1190 0.0951 0.1807 0.9545**rG -0.1714 -0.2230 '0.0460 -0.0291 0.9813**rE 0.1173 0.0542 0.1930 0.3057 0.9378**
DF= days to flowering. DM = Days to maturity, PH = plant height (cm). BP= branch pet plant. CP-capsules per plant. SY =seed yield per plant (g)
Estimates of direct and indirect effects at phenotypic and genotypic levels are presented in Table 3. At phenotypic level, the highest positive direct effect was exerted by capsules per plant on seed yield per plant. Days to flowering exhibited positive direct effect on seed yield at phenotypic level. On the other hand, this trait had the highest negative direct effect on seed yield at genotypic level. Days to flowering via days to maturity and branches per plant gave high positive genotypic indirect effect on seed yield per plant. At genotypic level, high negative direct effect was shown on seed yield per plant by days to maturity. At the same level plant height and branches per plant had positive direct effect on seed yield per plant. Maximum positive direct genotypic effect was exerted on seed yield per plant by days to maturity. Branch per plant and capsules per plant exerted high positive direct effect on seed yield per plant at genotypic level. Maximum direct negative genotypic effect was shown by days to flowering. At genotypic level plant height indirectly contributed to seed yield through days to maturity. Branches per plant had positive indirect effect on seed yield via plant height and capsules per plant at phenotypic level. This trait also had positive indirect effect through days to maturity and capsules per plant. In general, all traits except days to maturity had positive but non-significant direct effect on seed yield at phenotypic level. At genotypic level days to maturity, branches per plant and capsules per plant exhibited positive direct effects on seed yield per plant.
126
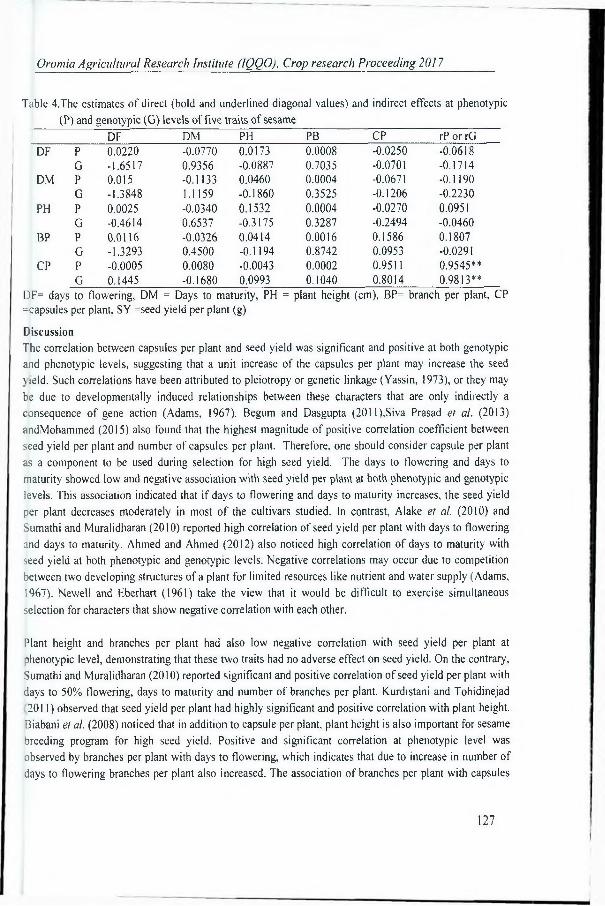
Oromia Agricultural Research Institute (IQQO), Crop research Proceeding 2017
Table 4.The estimates of direct (bold and underlined diagonal values) and indirect effects at phenotypic (P) and genotypic (G) levels of five traits of sesame
DF DM PH PB CP rP or rGDF
DM
PH
BP
CP
p 0.0220 -0.0770 0.0173 0.0008 -0.0250 -0.0618G -1.6517 0.9356 -0.0887 0.7035 -0.0701 -0.1714P 0.015 -0.1133 0.0460 0.0004 -0.0671 -0.1190G -1.3848 1.1159 -0.1860 0.3525 -0.1206 -0.2230P 0.0025 -0.0340 0.1532 0.0004 -0.0270 0.0951G -0.4614 0.6537 -0.3175 0.3287 -0.2494 -0.0460P 0.0116 -0.0326 0.0414 0.0016 0.1586 0.1807G -1.3293 0.4500 -0.1194 0.8742 0.0953 -0.0291P -0.0005 0.0080 -0.0043 0.0002 0.9511 0.9545**G 0.1445 -0.1680 0.0993 0.1040 0.8014 0.9813**
DF= days to flowering, DM = Days to maturity, PH = plant height (cm), BP= branch per plant, CP =capsules per plant, SY =seed yield per plant (g)
DiscussionThe correlation between capsules per plant and seed yield was significant and positive at both genotypic and phenotypic levels, suggesting that a unit increase of the capsules per plant may increase the seed \ield. Such correlations have been attributed to pleiotropy or genetic linkage (Yassin, 1973), or they may be due to developmental induced relationships between these characters that are only indirectly a consequence of gene action (Adams, 1967). Begum and Dasgupta (2011 ),Siva Prasad et al. (2013) andMohammed (2015) also found that the highest magnitude of positive correlation coefficient between seed yield per plant and number of capsules per plant. Therefore, one should consider capsule per plant as a component to be used during selection for high seed yield. The days to flowering and days to maturity showed low and negative association with seed yield per plant at both phenotypic and genotypic levels. This association indicated that if days to flowering and days to maturity increases, the seed yield per plant decreases moderately in most of the cultivars studied. In contrast, Alake et al. (2010) and Sumathi and Muralidharan (2010) reported high correlation of seed yield per plant with days to flowering and days to maturity. Ahmed and Ahmed (2012) also noticed high correlation of days to maturity with seed yield at both phenotypic and genotypic levels. Negative correlations may occur due to competition between two developing structures of a plant for limited resources like nutrient and water supply (Adams, 1967). Newell and Eberhart (1961) take the view that it would be difficult to exercise simultaneous selection for characters that show negative correlation with each other.
Plant height and branches per plant had also low negative correlation with seed yield per plant at phenotypic level, demonstrating that these two traits had no adverse effect on seed yield. On die contrary, Sumathi and Muralidharan (2010) reported significant and positive correlation of seed yield per plant with days to 50% flowering, days to maturity and number of branches per plant. Kurdistani and Tohidinejad '2011) observed that seed yield per plant had highly significant and positive correlation with plant height. Biabani et al. (2008) noticed that in addition to capsule per plant, plant height is also important for sesame breeding program for high seed yield. Positive and significant correlation at phenotypic level was observed by branches per plant with days to flowering, which indicates that due to increase in number of days to flowering branches per plant also increased. The association of branches per plant with capsules
127

Oromia Agricultural Research Institute (IQQO). Crop research Proceeding 2017
per plant at phenotypic and genotypic levels was positive and non-significant, signifying that the improvement in the branches per plant would not have any bad effect on capsules per plant. According to Gnanasekaran et a/.(2008) number of branches per plant and number of capsules per plant should be given importance in selection program to get high seed yields in sesame. The correlation between branches per plant and seed yield was small and positive. In line with the present result, Desawi et al. (2014) reported positive and significant phenotypic and genotypic correlation of branches per plant with seed yield per plant. Days to flowering was significantly and positively correlated with days to maturity at both phenoty pic and genotypic levels, suggesting that the number of days to mature is highly dependent on the number of days to flower.The association between plant height and branches per plant was positive at both levels. Earlier reports of Sumathi and Muralidharan. (2010) revealed the positive association of plant height with number of branches per plant and number of capsules per plant. At both phenotypic and genotypic levels, the correlation between plant height and capsules per plant was non-significant and negative.In most cases genotypic correlation coefficients were slightly higher than their corresponding phenotypic correlation coefficients, indicating that there was a close agreement between phenotypic and genotypic correlations in most of the cases. This close similarity may be due to the reduced environmental variance. Thus the phenotypic correlation reflects more or less the real association among characters in this study. The high positive direct effect of capsules per plant on seed yield was observed at phenotypic level. These positive direct effect point out that with other characters held constant increasing capsules per plant will increase seed yield per plant. However, the more complex indirect effects play a more important role and may mask the direct influence. Different findings (Yol, et al., . 2010; Salehi et al., 2010; Azeez and Morakinyo, 2011; Ibrahim and Khidir, 2012; Bharathi et al., 2015) suggested that, capsules per plant can be good selection criteria for single plant seed yield in sesame.
The negative genotypic association of days to flowering with seed yield per plant resulted largely from its high negative direct effects and indirect effects through plant height and capsules per plant. On the contrary, Gidey et al. (2013) reported that days to flowering exerted positive direct effect on seed yield. Days to flowering via days to maturity gave the highest positive genotypic indirect effect on seed yield per plant.
Days to maturity had the highest positive genotypic direct effect on seed yield per plant; however, it exerted high negative indirect effect on seed yield per plant through days to flowering, plant height and capsule per plant. The net system of opposing influences diluted the positive direct and largely contributed to its negative correlation with seed yield per plant. Contrasting result was reported by Gidey et al. (2013) in which days to maturity had negative direct effect on seed yield.
The positive phenotypic association of plant height with seed yield was mainly due to the positive phenotypic direct effect. On the other hand, the negative direct genotypic effect of plant height was resulted in negative genotypic correlation of plant height with seed yield per plant. Quite the reverse. Yol et al. (2010) observed that plant height had the highest positive direct effect on seed yield. Khan et al. (2001) reported that the number of capsules per plant contributed the highest towards seed yield followed
128

Oromia Agricultural Research Institute (IQQO), Crop research Proceeding 2017
plant height. According to these workers, selection emphasis on these traits could result in improvement in seed yield in sesame.
The positive high genotypic direct effect of branches per plant on seed yield was removed by the high negative indirect effect through days to flowering and resulted in its negative association with seed yield per plant. Siva Prasad et al. (2013) also observed that the number of branches per plant recorded the highest magnitude of direct effect on seed yield. Branches per plant had positive phenotypic and genotypic indirect effect on seed yield via capsules per plant. Similarly, Ibrahim and Khidir (2012) observed that that number of branches per plant via number of capsules per plant gave the highest positive indirect effect on seed yield per plant. The positive and significant correlation of capsules per plant with seed yield per plant and its positive direct effect on seed yield per plant indicated that indirect selection based on this attribute may be helpful in producing high yielding sesame varieties. Chowdhury et al. (2010) and Aremu et al. (2011) reached similar conclusion.ConclusionThe correlation between capsules per plant and seed yield was significant and positive at both genotypic and phenotypic levels indicating that the indirect selection for seed yield based on this trait was effective. Therefore, capsule per plant can be considered as the best criteria for improving seed yield in sesame breeding program. Branches per plant had positive phenotypic and genotypic direct effect on seed yield indicating that this trait can be considered, as is an important trait for indirect selection by far next to capsules per plant.ReferenceAhmed, S.B.M. and Ahmed, A.F. 2012. Genotype x season interaction and characters association of
some Sesame (Sesamum indicum L.) genotypes under rain-fed conditions of Sudan. African Journal of Plant Science, 6(1): 39-42.
.Make, C.O.,Ojo, D.K., Adebisi, M.A. and Ayo-Vaughan, M.A.2010. Selection criteria for Nigerian sesame (Sesamum indicum L.) genotypes. J. of Trop. Agri., 48 (1-2): 49-51.
Adams, M.W.1967. Basis of yield component compensation in crop plants with special reference to the field bean (Phaseolus vulgaris L.). Crop Sci., 7:505-510.
Ali-Jibour H.A. Miller, P.A. and Robinson HP. 1959. Genetic and environmental variances and covariance in upland cotton cross of interspecific origin. AgriJ. 50:633-636.
Aremu, C.O., Adewale, D.B. and Adetunji, I. A. 2011. Cause and effect variations and trait selection index for indigenous sesame (Sesamum indicum L.) genotypes. Inter. J. of Appl.Agri.l and Apicultural Res., 7 (1&2): 64-71.
Azeez, M.A. and Morakinvo, J.A. 2011. Path Analysis of the Relationships between Single Plant Seed Yield and Some Morphological Traits in Sesame (Sesamum indicum L.). International Journal of Plant Breeding and Genetics, 5: 358-368
Biabani, A.R.and H. Pakniyat, 2008. Evaluation of seed yield-related characters in sesame (Sesamum indicum L.) using factor and path analysis. Pak. J. Biol. Sci., 11: 1157-1160.
Bharathi, D., Rao,V.T. Venkanna, V.and Bhadru, D. 2015. Association analysis in sesame (Sesamum indicum L.). Inter. J. of Appl. Bio. and Pharmaceutical Teclin.. 6(1) :210-212.
129

Oromia Agricultural Research Institute (IQQO), Crop research Proceeding 2017
Begum. T. and Dasgupta, T. 2011. Effect of mutagens on character association in sesame (Sesamum indicum L.). Pak. J. Bot.. 43(1): 243-251.
Chowdhury, S. Datta, A.K. Saha A. Sengupta S. Paul R. Maity S.and Das A. 2010. Traits influencing yield sesame (Sesamum indicum L.) and multi traits of yield parameters in some desirable plant types. Indian Journal of Science and Technoloy. 3 (2).
Desawi Hdru, Sentayehu Alamerew and Daniel Endale. 2014. Assessment of Genetic Variability, Genetic Advance, Correlation and Path Analysis for Morphological Traits in Sesame Genotypes. Asian Journal of Agricultural Research. 8: 181-194.
Dewey, D.R. and Lu, K,H. 1959. A correlation and path coefficient analysis of component of crested wheat grass seed production. Agron. J.,5 1:515-518.
Furat, S and Uzun, B.2010. The use of agro-morphological characters for the assessment of geneticdiverasity in sesame (Sesamum indicum L). POJ, 3:85-91.
Gidey, Y.T. Kebede, S. A. and Gashabeza, G.T.2013. Assessment of genetic variability, genetic advance, correlation and path analysis for morphological traits in sesame genotypes.Int.J.PI. Breed.Gen., 7( 1 ):21 -34.
Gnanasekaran, M.; Jebaraj, S.; Muthuramu, S.; 2008.Correlation and path co-efficient analysis in sesame (Sesamum indicum L.). Plant archives, 8(1): 167-169.
Ibrahim S. E. and Khidir M. 0. 2012. Genotypic correlation and path coefficient analysis of yield and some yield components in sesame (Sesamum indicum L.) .Inter. J. ofAgri. Sc.. 2(8): 664-670.
Khan, N.I., Akbar,M.,Mahmoud, K.S. and Iqbal.S.2001.Character association and path coefficient analysis in sesame (Sesamum indicum L .) J . Bio l.Sci. 3:99-100.
Kurdistani, R. and Tohidinejad, E. 2011. Yield potential evaluation and path analysis of different sesamegenotypes under various level of iron. African J. of Plant Sci., 5(15):862-866.
Mohammed Abate. 2015. Genetic diversity, association of traits and genotype x environment interaction of sesame (Sesamum indicum L.) in Ethiopia .PhD Thesis. Haramaya University, Haramaya , Ethiopia. pp71 -89.
Newell LC, Eberhart SA (1961) Clone and progeny evaluation in the improvement of switch grass (Panicum vigatum L.). Crop Sci 1:117-121.
Rao, T.V., Bharathi,D.. Mohan.Y.C., Venkanna, V. and Bhadru, D. 2013. Genetic variability and association analysis in sesame. (Sesamum indicum L.). Crop Res.46 (1, 2&3): 122-125.
Rathore, P.K., Gupta,V.P. and Plaha,P.1993.Nature of variation and interrelationship among seed yield and some physiological traits in pea. Crop (mprov., 20:51-54.
Rauf, S., Khan. M.T., Sadaqat, H.A. and Khan, A.1.2004. Correlation and path coefficient analysis of yield components in cotton (Gossypium hirsutum L.). lnt J Agr Biol 6:686-688.
Siva Prasad Y. V. N., Krishna, M.S.R. and Yadavalli.V.2013. Correlation and Path analysis in F2 and F3 generations of Cross JLSV 4 X TC 25 in sesamum (Sesamum indicum L.). Advanced Crop Science, 13(5): 370-375.
Salehi, M. Saeedi, G., 2010. Genetic variation in local populations of breeding lines derived from sesame seeds, Eleventh Iranian Crop Science Congress.
Sumathi,P. and Muralidharan.V. 2010. Analysis of genetic variability, association and path analysis in the hybrids of sesame (Sesamum indicum L.) Tropical Agricultural Research & Extension13(3):63-67.
130
Oromia Agricultural Research Institute (1QQ0), Crop research Proceeding 2017
Yassin ,T.E. 1973. Genotypic and phenotypic variances and correlations in field beans (Vicia faba L.). J Agric Sci Camb., 81:445-448.
Yol, E. Karaman, E., Furat, S. and Uzan, B. 2010. Assessment of selection criteria in sesame by using correlation coefficient, path and factor analysis. Australian J.Crop.Sc. 4(48): 598- 602.
Yucel.C.2004.Correlation and path coefficient analysis of seed yield component in narbon beans ( Vicia narbonensis L.). Turk.J.Agric.For., 28:371-376.
Grain Yield Stability Analysis for Advanced Emmer Wheat (Triticum dicoccum) Genotypes in Bale Highland
Tilahun Bayisa1*, Tesfaye Letta2, Mulatu Abera'' Sinana Agricultural Research Center. P.O.Box 208. Bale-Robe, Ethiopia ' Oromia Agricultural Research Institute, P.O.Box:81265, Addis Abeba, Ethiopia Corresponding, author: Email: [email protected]
Emmer wheat landraces are locally adapted to diverse ecological zones. The diversity of emmer wheat is seriously threatened by genetic erosion due to the increase in bread wheat production. It comprises about 7% of Ethiopia’s entire wheat production. The objective of this study was to evaluate the stability of advanced emmer wheat genotypes in Bale highland. The field experiment was conducted at two locations including Sinana and Goba during 2013 to 2015 main cropping seasons using 15 emmer wheat genotypes. The treatments were arranged in a randomized complete block design with three replications. Pooled analysis of variance for gain yield indicated the main effect differences among genotypes, environments, and the interaction effects were highly significant (p < 0.01). The environmental effect is accounted for 86.5% of the total yield variation, whereas, genotype and G x E interaction effects were only accounted for 3.1% and 10.4% of the total variation, respectively. The average environmental grain yield ranged from the lowest of 1865.5 kg ha'1 at Goba in 2014 to the highest of4617.5 kg ha'1 at the same location in 2015, with a grand mean of2917.1kgha'. Genotypes G2. G10 and G9 showed first interaction principal component axis (IPCA I) scores close to zero, indicating stable performance across the test environments. Environments Sinana 2013 and Sinana 2014 were the best environments with the high mean yield of from the first four AMMI selected per environments. The proportion of the first interaction principal component axis sum of squares 34.00% to the interaction sum of squares and the second interaction principal component 28.23%. This indicated that the existence of differential yield responses among the genotypes across the testing environments due to the presence of significant G * E interaction effect.
Keywords: AMMI, Emmer wheat, GxE interaction, PCA
IntroductionWild emmer wheat (T. turgidum ssp. dicoccoides (korn.) Thell) is the tetraploid (2n=4x=28; genome BBAA) progenitor of both domesticated tetraploid durum wheat (T. turgidum ssp.durum(Desf.) MacKey) and hexaploid (In = 6x = 42; BBAADD) bread wheat (71 aestivum L.). It is thought to have originated and diversified in the Near East Fertile Crescent region through adaptation to a spectrum of ecological conditions. It is genetically compatible with durum wheat (T. turgidum ssp. durum) and can be crossed with bread wheat (T. aestivum L.) (Feldman, 2001). It is expected that early immigrants of Hamites
131

Oromia Agricultural Research Institute (IQQO), Crop research Proceeding 2017
brought emmer wheat to Ethiopia, some 5,000 years ago and was introduced into the Ethiopian Highlands from Egypt along the Nile River (Fuller et al., 2011 and Oliveira et al., 2012). Emmer wheat comprises about 7% of Ethiopia’s entire wheat production (BOST1D. 19%). The major production areas in Ethiopia include Bale, Arsi, Shewa, Harerge, Wollo, Gojam and Gondar. It is known by different vernacular names such as “Aja” (in Amharic), “ Hayssa” or “Matajebo” (in Afaan Oromo). Emmer wheat landraces are locally adapted to diverse ecological /ones. The diversity of emmer wheat is seriously threatened by genetic erosion due to the increase in bread wheat production. The urgent need to preserve and utilize landrace genetic resources as a safeguard against an unpredictable future is evident (Haile et al.. 2012).Targeting variety selection onto its growing environments is the prime interest of any plant- breeding program. To realize this, a rigorous genotypes performance evaluation across locations and years mostly at the final stage of variety development process. Selecting genotypes for high mean yield and yield stability has been a challenge for breeders. The requirement for stable genotypes that perform well over a wide range of environments becomes increasingly important as farmers need reliable production quantity (Gauch et al., 2008). Therefore, identifying most stable genotypes is an important objective in many plant breeding programs for all crops, including emmer wheat. The performance of a genotype is determined by three factors: genotypic main effect (G), environmental main effect (E) and their interaction (Yan et al., 2007). The GE interactions structure is an important aspect of both plant breeding programs and the introductions of new improved crop cultivars as yield stability analysis (Neac?u, 2011). The objective of this study was to evaluate the stability and grain yield performance of advanced and promising emmer wheat genotypes in Bale highland.Materials and MethodsThe field experiment was conducted at two locations including Sinana and Goba during 2013 to 2015 main cropping seasons using 15 emmer wheat genotypes, year location combination being considered as environment. Sinana is characterized by bimodal rainfall pattern and annual total rainfall ranges from 750 to 1400 mm. The main season receives 270 to 842 mm rainfall, while the short season receives from 250 to 562 mm. Goba is characterized as high-altitude environment receiving enough rainfall with even distribution throughout the cropping season. Full description of the 2 test locations and 15 emmer wheat genotypes are given in Table 1 and Table 2. respectively. The treatments were arranged in a randomized complete block design with three replications. The plot size was 3nr with six rows of 2.5m long and spacing of 20cm between rows. 150kgha ! seed rate was used at both test sites. For statistical analysis, yield from net plot area of 2m' was harvested and converted info kg ha'1 base at 12% standard grain moisture content.Table 1. Description of the test locations
Locations Geographical position Altitude (m.a.s.l)Latitude LongitudeSinanaGoba
07°07’N 07° 01’N
40° 10’E 40° 00' E
24002550
132

Oromia Agricultural Research Institute (IQQO), Crop research Proceeding 2017
Table 2. Description of the 15 emmer wheat genotypes tested across 2 different environments during 2013-2015 cropping season
sN Genotype Source SN Genotype Source1 S inana-01 /U de//S i nana-01 # 1 SARC Cross 9 Sinana-01 /Gedilfa//Sinana-01 # 11 SARC Cross2 Sinana-01 /Ude//Si nana-01 #4 SARC Cross 10 S i nana-01 / Ged i 1 fa//S inana-01 # 12 SARC Cross3 Sinana-01 AJde//Sinana-01 #22 SARC Cross 11 Sinana-01 /DZ2212//Sinana-01 #3 SARC Cross4 Sinana-01 /Cocorit 71 //Sinana-01 #4 SARC Cross 12 Sinana-01 /DZ2212//Sinana-01 # 10 SARC Cross5 Sinana-01/Cocorit 71 //Sinana-01 # 1 SARC Cross 13 Sinana-01 /DZ2212//Sinana-01 # 13 SARC Cross
Sinana-01/Gedilfa//Sinana-01#1 SARC Cross Sinana-01 Standard6 Sinana-01/Gedilfa//Sinana-0I #8 14 check7 Sinana-01 /Ged i 1 fa//S inana-01 # SARC Cross 15 Local Landrace8 Sinana-0 l/Gedilfa//Sinana-02# SARC Cross* SARC Cross = Sinana Agriculture Research Center cross
Statistical Procedures: The grain yield data was subjected to analysis of variance using the Genstat 15,h Edition Statistical Package. Variance combined analysis of variance was done using the procedure to partition the total variation into components due to genotype (G), environment (E) and G * E nteraction effects. The following model was used for combined ANOVA:Yyk= p + Gj+ Ej+GEq+ Bnj,+
Where Yijk is an observed value of genotype i in block k of environment j; p is a grand mean; Gj is effect of genotype i; Ej is an environmental effect; GEy is the interaction effect of genotype i with environment j; is the effect of block k in environment j; eyk is an error effect of genotype i in block k of environment j. Genotype was regarded as a fixed effect while environment was regarded as a random effect. The main effect of E was tested against the replication within environment, the main effect of G was tested against the G * E interaction, and the G x E interaction was tested against pooled error. Separation of the main effect was done using least significant difference Test at 5% probability level.ResultGenotype performance: Pooled analysis of variance for gain yield (kg ha'1) of the 15 emmer wheat genotypes tested across six environments was shown in (Table 3). The main effect differences among genotypes, environments, and the interaction effects were highly significant (p < 0.01). The environmental effect is accounted for 86.5% of the total yield variation, whereas, genotype and G x E interaction effects were only accounted for 3.1% and 10.4% of the total variation, respectively (Table 3). This shows that grain yield of emmer wheat genotypes was found to be significantly affected by changes in the environment, followed by G x E interaction and genotypic effects (Table 3). This may indicated the existence of a considerable amount of deferential response among the genotypes to changes in growing environments and the differential discriminating ability of the test environments. Such circumstances are believed to minimize the usefulness of cultivars (Pham and Kang 1988) by confounding their yield performances. Thus, it is very important to study in depth the yield levels, adaptation patterns and stability of emmer wheat genotypes in multiple environments. The average environmental grain yield across genotypes ranged from the lowest of 1865.5 kg ha' 1 at Goba in
133

Oromia Agricultural Research Institute (IQQO), Crop research Proceeding 2017
2014 to the highest of 4617.5 kg ha'1 at Goba in 2015, with a grand mean of 2917.1kg ha'1 (Table 4). The genotypes grain yield across environments ranged from the lowest of 2637.1 kg ha"1 for G 14 to3229.6 kg ha 1 for G6 (Table 4). Therefore, genotype by environment interaction that makes it difficult to select the best performing and most stable genotypes is an important consideration in plant breeding programs (Bramel-Cox, 1996)Table 3. Combined analysis of variance for grain yield of 15 emmer wheat genotypes grown at 6 environmentsSource DF SS MS FTreatments 89 186640138 2097080 11.45**Genotypes 14 5746041 410431 2.24**Environments 5 161426464 32285293 64.16**Interactions 70 19467634 278109 1.52*IPCA 18 7205042 400280 2.19**IPCA 16 6272475 392030 2.14**Residuals 36 5990117 166392 0.91Error*=Significant al 0.05 probability- level.
168**= significant at
307611420.01 nrnbabilitv level. 183102
square and F= F- value
Genotype stability: The relative magnitude and direction of genotypes along the horizontal and
vertical axis of the graph is important to understand the response pattern of genotypes across
environments. Genotypes with fPCA I scores close to zero expressed general adaptation whereas the
larger scores depict more specific adaptation to environments with IPCAI scores of the same sign
(Ebdon and Gauch 2002). Accordingly, genotypes G2. GIO and G9 , with their relative IPCAI scores
close to zero, have less response to the interaction and showed general adaptation to the test
environments. Genotype G5 demonstrated large positive IPCAI score and found better adapted to
environment Sinana 2014 with larger and same sign IPCI score followed by G3 and G7. In contrast,
genotypes GI3, G6 and G12, with their larger negative IPCI scores were adapted to environments Goba
2013 and Goba 2014 (Figure 1). The best cultivar should hold high yield with stable performance across a
range of environments. Environments Sinana 2013 and Sinana 2014 were the best environments with the
mean yield of 3891kgha‘‘ and 2835kgha', respectively from the first four AMMI selected per environments.
AM M I Analysis: The application of AMMI model for partitioning the G * E interaction effect revealed
that only the first two terms of AMMI were significant based on Gollob’s F-test (Gollob, 1968). These
two multiplicative component sum of squares, with their cumulative were captured 62.23% of the G * E
interaction sum of squares. In this study, the proportion of the first interaction principal component axis
sum of squares (IPCAI = 34.00%) to the interaction sum of squares and the second interaction principal
component (IPCA2 = 28.23%) (Table 3). This indicated that the existence of differential yield responses
134

Oromia Agricultural Research Institute (IQQO). Crop research Proceeding 2017
among the genotypes across the testing environments due to the presence of significant G x E interaction
effect.
Prediction assessments were indicated that AMMI with only the first two multiplicative component axes
was adequate for cross-validation of the variation explained by the G x E interaction (Zobel et al., 1988).
The present investigation also revealed that the first two multiplicative components of the interaction term
were significant at p < 0.01 (Table 3). Thus, the interaction pattern of the 15 emmer wheat genotypes with the 6 environments scattered over the first two AMMI multiplicative components of genotypes and
environments visualized the pattern of affinity between the genotypes and the environments.
PCI - 34.0|)%
W r W W S r c sMega-Environ ments
Figure 1. AMMI biplot analysis showing the mega-environments and their respective high yielding
genotypes.
135
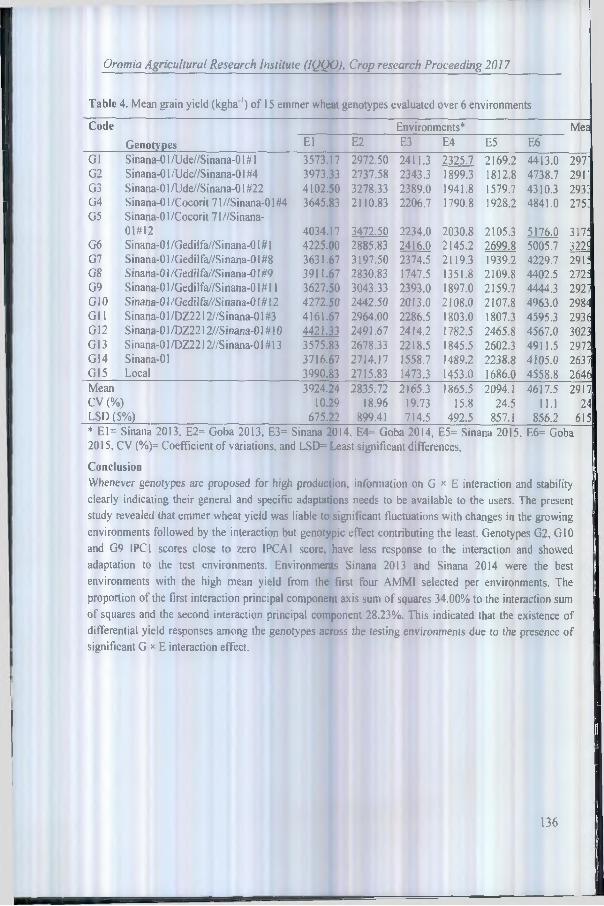
Oromia Agricultural Research Institute (IQQO), Crop research Proceeding 2017
Table 4. Mean grain yield (kgha1) of 15 emmer wheat genotypes evaluated over 6 environments
Code Environments* MeaGenotypes El E2 E3 E4 E5 E6
Gl Sinana-01 /Ude//Sinana-01 # 1 3573.17 2972.50 2411.3 2325.7 2169.2 4413.0 297'G2 Sinana-01 /Ude//Sinana-01 #4 3973.33 2737.58 2343.3 1899.3 1812.8 4738.7 291'G3 Sinana-01 /Ude//Sinana-01 #22 4102.50 3278.33 2389.0 1941.8 1579.7 4310.3 293:G4 Sinana-0 l/Cocorit 71//Sinana-01 #4 3645.83 2110.83 2206.7 1790.8 1928.2 4841.0 275:G5 Sinana-01/Cocorit 71//Sinana-
01#12 4034.17 3472.50 2234.0 2030.8 2105.3 5176.0 317!G6 Sinana-01 /Gedi!fa//Sinana-01 # 1 4225.00 2885.83 2416.0 2145.2 2699.8 5005.7 322<G7 Sinana-01 /Gedilfa//Sinana-01 #8 3631.67 3197.50 2374.5 2119.3 1939.2 4229.7 291:G8 Sinana-0 l/Gedilfa//Sinana-0l #9 3911.67 2830.83 1747.5 1351.8 2109.8 4402.5 2725G9 Sinana-01 /Gedilfa//Sinana-01 # 11 3627.50 3043.33 2393.0 1897.0 2159.7 4444.3 292'G10 Sinana-01 /Gedilfa//Sinana-01 # 12 4272.50 2442.50 2013.0 2108.0 2107.8 4963.0 2984Gl 1 Sinana-01 /DZ2212//Sinana-01 #3 4161.67 2964.00 2286.5 1803.0 1807.3 4595.3 293(G12 Sinana-01 /DZ2212//Sinana-01 # 10 4421.33 2491.67 2414.2 1782.5 2465.8 4567.0 3023G13 Sinana-01 /DZ2212//Sinana-01#13 3575.83 2678.33 2218.5 1845.5 2602.3 4911.5 2972G14 Sinana-01 3716.67 2714.17 1558.7 1489.2 2238.8 4105.0 2637G15 Local 3990.83 2715.83 1473.3 1453.0 1686.0 4558.8 2646Mean 3924.24 2835.72 2165.3 1865.5 2094.1 4617.5 2917CV (% ) 10.29 18.96 19.73 15.8 24.5 11.1 24LSD (5%) 675.22 899.41 714.5 492.5 857.1 856.2 615* El= Sinana 2013, E2= Goba 2013, E3= Sinana 2014, E4= Goba 2014, E5= Sinana 2015, E6= Goba2015, CV (%)= Coefficient of variations, and LSD= Least significant differences,ConclusionWhenever genotypes are proposed for high production, information on G x E interaction and stability clearly indicating their general and specific adaptations needs to be available to the users. The present study revealed that emmer wheat yield was liable to significant fluctuations with changes in the growing environments followed by the interaction but genotypic effect contributing the least. Genotypes G2, G10 and G9 IPC1 scores close to zero IPCAl score, have less response to the interaction and showed adaptation to the test environments. Environments Sinana 2013 and Sinana 2014 were the best environments with the high mean yield from the first four AMMI selected per environments. The proportion of the first interaction principal component axis sum of squares 34.00% to the interaction sum of squares and the second interaction principal component 28.23%. This indicated that the existence of differential yield responses among the genotypes across the testing environments due to the presence of significant G x E interaction effect.
136

Oromia Agricultural Research Institute (IQQO), Crop research Proceeding 2017
ReferenceBOSTID 1996. Lost crops of Africa, Vol. 1 Grains. The National Academy of Science.Bramel-Cox P.J.,1996. Breeding for reliability of performance across unpredictable environments, in:
M.S. Kang, H.H. Gauch Jr. (Eds.), Genotype-by-Environment Interaction, CRC Press, Bota Raton, Florida 1996, pp. 309-339
Ebdon JS, Gauch HG.2002. Additive main effect and multiplicative interaction analysis of national turf- grass performance trials. Crop Sci, 2002; 42: 489-496.
Feldman M 2001. The origin of cultivated wheat. In: Bonjean AP, Angus WJ (eds) The w'orld wheat book. Lavoisier Tech & Doc, Paris, pp 3-56
Fuller DQ, Willcox G, Aliaby RG 2011. Cultivation and domestication had multiple origins; Arguments against the core area hypothesis for the origins of agriculture in the Near East. World Archaeol. 43:628-652.
Gauch H.G., Piepho H.P., Annicchiaricoc P.,2008. Statistical analysis ofyield trials by AMMI and GGE. Further considerations Crop Science. - 2008, vol. 48, p. 866-889
Gollob HF„ 1968. A statistical model which combines features of factor analytic and analysis of variance techniques. Psychometrika, 1968; 33: 73-1 15.
Haile JK, Hammer K, Badebo A. Nachit MM, Ro"der MS 2012. Genetic diversity assessment ofEthiopian tetraploid w'heat Iandraces and improved durum wheat varieties usingmicrosatellites and markers linked with stem rust resistance. Genet. Resour. Crop Evol.60(2):513-527
Neac§u A.,2011. Grain protein concentration and its stability in a set of winter wheat cultivars, grown in diverse environments and management practices Romanian Agricultural Research. 2011, vol. 28, p.29-36
Oliveira HR, Campana M, Jones H, Hunt H, Leigh F, Lister DL, Jones MK 2012. Tetraploid wheatIandraces in the Mediterranean basin: taxonomy, evolution and genetic diversity. PLoS One 7(5):e37063.
Pham HN, Kang MS., 1988 Interrelationships among and repeatability of several stability statistics estimated from international maize trials. Crop Sci. 1988; 28: 925-928.
Yan W., Kang M.S., Ma B., Wood S., Cornelius P.L., 2007. GGE biplot vs. AMMI analysis of genotype-by-environment data Crop Science. 2007, vol. 47, p. 643—655
Zobel RW, Wright MJ, Gauch HG„ 1988. Statistical analysis of a yield trial. Agron. J. 1988; 80: 388- 393.
137

Oromia Agricultural Research Institute (IQQO), Crop research Proceeding 2017
Evaluation of Open Pollinated Maize (Zea mays L.) Varieties for mid altitude areas of Western Guzi Zone, Southern Oromia
‘*Natol Bekeie, TolasaTaye. 'Yonas Shimeli and 'Zelalem Teku Oromia Agricultural Research Institute, Yabello Pastoral and Dryland Agricultural Research
♦Corresponding author: e-mail:[email protected] is one of the most important cereals crop broadly adapted to different agro-ecologies worldwide. Different genotypes have different performance in each region that can be capitalized to maximize productivity. Six open pollinated maize varieties were brought from Bako National Maize Research Center and planted in RCBD with three replications at Galana and Abaya sub site of Yabello Pastoral and Dryland Agriculture Research Center for three respective years. Analysis of variance showed that, significant yield difference was recorded among genotypes. The combined analysis of variance indicated that highest average grain yield of 5.85 t/ha was obtained from Gibe-2 followed by 5.63 t/ha for Kulani variety’ across years and locations. Stability analysis revealed Kulani was the most stable variety among all while Gibe 2 was unstable. The Additive main and multiplicative interaction stability value (ASV) of Kulani and ABO-Bako were close to zero (0.08 and 0.27, respectively), while the ASV of Gibe 2 was relatively higher (1.62) deviating from zero. Therefore. Kulani was stable and high yielder across environments while Gibe 2 was high yielder in specific environment (unstable). So, and Kulani had been promoted for cultivation in Galana and Abaya districts of southern Oromia and areas with similar agro ecologies, while Gibe 2 was recommended for Galana district.
Keywords: Adaptation, ASV, Genotypes, Stability, Zea mays
IntroductionMaize (Zea may’s L.) (2n=20) is also known as com, belongs to the family Poceaceae and is a versatile crop that adapts easily to a wide range of production environments (Gerpacio and Pingali, 2007; Riedelsheimer et al., 2012). Maize is the third most important crop in the world in terms of growing area, production and grain yield (Shiri et al., 2010) and it is important basic crop of trade product and recurring ingredient for millions of people in sub-Saharan Africa (Nzuve et al., 2013). Maize is a multipurpose crop that acclimates effortlessly to a wide variety of production set of conditions (FAO, 2015). Maize occupies a crucial role in the world economy and is traded widely. Maize demand is proposed to increase by 50% worldwide and by 93% in sub-Saharan Africa between 1995 and 2020 (FAO, 2016). Maize is one of the staple foods in Ethiopia, whose importance in consumption as well as production has significantly increased.In Ethiopia average maize grain yield is low due to problems like insect pest damage, lack of high yielding varieties and poor crop management practices. The most important problem reported by farmers in Western Guji Zone was the lack of adaptable maize varieties and majority of the farmers in the area are growing local varieties. So far, no effort has been made in the zone to introduce and adapt improved maize varieties.
Genotype by environment interactions are the most importance to the plant breeder in selecting appropriate variety for appropriate environmental condition. Different genotypes may have different performance in each region that can be capitalized to maximize productivity (Souza et al., 2008). Variability in grain yield is due to difference in genetic potential among genotypes and environment effect. Grain yield is quantitative in nature, which usually exhibits GEI, which necessitates evaluation in
138

Oromia Agricultural Research Institute (IQQO), Crop research Proceeding 2017
multi-environment trials before doing advanced selection (Khalil et al, 2010).The presence of genotype by environment interaction (GEI) frequently changes the varieties ranks in different environments due to cross interaction making their proper selection difficult. Therefore, it is essential to analyze and converse genotype by environment interaction which help us in getting information on adaptability and stability of performance of genotypes. The method commonly used for analysis of GXE interaction is AMMI ( Additive Main Effects and Multiplicative Interaction) approach as a measure of stability and adaptability. The AMMI model is a better model for analysis of GxE interaction in multiplication varietal trials (Zobel ei al., 1988). It does not only give estimate of total GxE interaction effect of each genotype but also partitions it into interaction effects due to environments. Thus, the current experiment is aimed at evaluation of open pollinated maize varieties for the adaptability and stability of grain yield and yield related traits for mid altitude areas of Western Guji Zone
Materials and Methods
Experimental Materials and DesignTable 1. Lists and description of materials used in an experiment Source: (EARO, 2004)Six open pollinated maize varieties (table 1) were brought from Bako National Maize Research Center and planted at Yabello Pastoral and Dryland Agriculture Research Center sub site Galana and Abaya for three consecutive years. A completely randomized block design with three replications was used. The plants were grown according to the recommended agronomic practices. Each plot was 12.6 nr sizes with 6 rows of 3m length and 25cm x75cm spacing was used. The harvested plot size was 8.4 m2 four (4) rows at the middle of each plot. The recommended fertilizer rate was used for all genotypes at each site. Collected data: All agronomic data such as days to physiological maturity (DM), hundred kernels weights, plant height, ear length, ear height, number of kernels per row and number of row per cob were collected following method used by Natol et al., (2017).Data analysis: Analysis of variance for phenological, yield and yield related data were done with the PROC ANOVA procedure in SAS software with genotypes being considered as fixed effects andreplication within environment being as random effect as per the method described by Gomez and Gomez(1984). Least significant different (LSD) was used for mean separation. Adaptability and stability of the genotypes was estimated using the Genstat 15,h edition. G x E biplots were generated to evaluate the genotypes simultaneously for yield and stability. ASV (AMMI Stability Values) were estimated for both genotypes and environments. The AMMI (Additive Main Effect and Multiplicative Interaction) model, which combines standard analysis of variance with principal component analysis, was used to investigate of G x E interaction. In AMMI model the contribution of each genotype and each environment to the G x E interaction is assessed by using the biplot graph display in which yield means are plotted against the scores of the IPCA (Interaction Principal Component Axis) (Zobel et al. 1988). The AMMI model is: Yy=jji + gi +e: +IXk +aik yjk +R;iWhere, Yy is the yield of i'h genotypes in j lh environment; |i the overall mean; gj isthe effect of the ith genotype; ej is the effect of the j lh environment; Xk is the square root of the eigenvalue of the PCA axis k. Then aik and yjk are the principal components scores for PCA (Principal Component Axis) k of the ilh genotype and j ‘h environment, respectively, and Ry is the residual. Environment and genotype PCA scores are expressed as unit vector times the square root of A.k
139

Oromia Agricultural Research Institute (IQQO), Crop research Proceeding 2017
Variety Year of release
Altitude(masl)
Rain fall (mm)
Maturitydate
Yield on research field (kg/ha)
Production status
Kulani 1995 1700-1400 1000-1200 150 6000-7000 Under productionABO-Bako 1985 500-1000 1000-1200 150 5000-7000 Under production 1Gutto 1988 1000-1700 800-1200 126 3000-5000 Under production 1Gibe I 2001 1000-1800 1000-1700 145 6000-7000 Under production 1Gambella 2002 500-1000 1000-1200 110 6000-7050 Under production(environment PC A score = Xk0.05yik, genotype PCA score = A.k0.05aik (Zobel et al., 1988). In order to rank the genotypes used for this study in terms of stability, AMMI stability value (ASV) was calculated for each genotype following the procedure proposed by Purchase (1997) as follows:
A SV = J [ (IP -— ^ ^ CA1SS-]2 -f [IPCA Zscore]2
Where, ASV=AMMI Stability Value; IPCA1SS= Interaction Principal Component Axis I sum of squares; IPCA J score = Interaction Principal Component Axis I score; IPCA2score = Interaction Principal Component Axis 2 score.Results and DiscussionMean performance of Varieties across locationsDays to maturity: Analysis of variance showed that, there is significant difference among varieties in days to maturity (P<0.01) for three consecutive years for both sites. Kulani was late mature among all genotypes which took 153days and I50.67days in 2014 and 2015 cropping season respectively. Gambella matured earlier than other genotypes under study for Galana site (table 3). At Abaya site, Kulani was late maturing one among all genotypes understudy, which took 150.67, 152.00 and 151.67days in 2014, 2015 and 2016 cropping season respectively. Gambella took 103.67, 111.33 and 110.32days to mature in 2014,2015 and 2016 cropping seasons, (table 3). Taye et al. (2015) found significant differences among genotypes in their study of high land maize evaluation.Grain yield: Analysis of variance showed significant different among genotypes in grain yield in all cropping season. The higher grain yield was obtained from Kulani 6.48t/ha in 2014, 4.65t/ha in 2015 and 5.01 t/ha in 20J6 cropping season while, the lowest grain yield was obtained from Gutto LMS 4.31 t/ha, 4.28t/ha and 4.28t/ha in 2014, 2015 and 2016 cropping seasons respectively (table 3). The yield variability observed among genotype, showed the potential of the variety and specific adaptability of the genotype. For Abaya site, maximum grain yield was obtained from Gibe 2 (5.08, 6.50 and 6.7 lt/ha in 2014, 2015 and 2016 cropping season respectively. Bassa and Goa (2016) reported that different maize varieties produce significantly different grain yields at different locations over years. Taye et al. (2016) also reported significant yield difference among different maize genotypes
140

Oromia Agricultural Research Institute (IQQO), Crop research Proceeding 2017
Table 2. Mean performance of days to maturity and grain yield for Abaya and Galana site
Varieties Days to maturity (days) Mean Grain yield (t/ha) MeanGalana site Abaya Site Galana site Abaya Site2014 2015 2016 2014 2015 2016 2014 2015 2016 2014 2015 2016
Gibe-1 143b 141.67b 143.67c 141.67b 146b 146.33b 144.83b 5.21b 4.52ab 4.35b 4.52ab 4.47c 6.28a 5.42cGibe-2 132c 135.00c 137.67d 135.00c 139c 137.00c 136.17c 5.41b 4.65a 4.57b 4.65a 6.50a 6.65a 5.85aABO-Bako 152a 145.67b 152.33a 145.67b 149ab 150.67a 149.83a 5.44b 4.25c 4.68ab 4.25c 4.57c 5.49b 4.93eGutto-LMS I24d 127.33d 126.67e 127.33d 125d 126.00d 125.83d 4.31c 4.28bc 4.28b 4.28bc 4.26c 4.21c 4.03fGambella IlOe I03.67e 110.67f 103.67e 11 l.33e 110.32e 110.1 le 5.54b 4.52ab 4.67ab 4.52ab 4.15c 6.20a 5.16dKulani 153a 150.67a 147.67b 150.67a 152a 151.67a 151.06a 6.48a 4.42abc 5.01a 5.08a 5.47b 6.71a 5.63bLSD y*** 4 45*** 3 48*** 445*** 4 13*** 3 34*** 145*** 0.76*** 0.24** 0.42* 0.24** 0.42*** 0.59*** 0.22***CV (% ) 1.88 2.27 1.40 2.27 1.66 1.34 1.60 4.41 2.92 5.03 2.92 4.75 5.48 6.45
*, **, *** = significant at P < 0.05, at P < 0.01 and at P< 0.001, respectively, ns = non-significant. DM=days to maturity, Yld=grain yield, LSD=least significantdifference, CV=coefficient of variance
141

Oromia Agricultural Research Institute (IQQO), Crop research Proceeding 2017
Combined Analysis of Variance: Combining analysis of variance (ANOVA) across locations for grain yield showed a significant in genotype * location interaction suggesting that genotypes x environment interactions influenced the yield performance of maize genotypes. Similarly, Workie et al. (2013) reported different genotypes perform differently for yield and yield related traits under different environmental conditions.Combined analysis of variance showed that a very highly significant (P<0.0001) variation was observed between genotypes, environment and the genotypes x environment interaction for plant height, ear height. Cob diameter, hundred seed weight and grain yield (Table 4). This indicated that the varieties and the test environments are variable, and the varieties performed differently across locations and years for almost all traits. Combined analysis of variance indicated that genotypes and environment showed significant effect (P<0.05) while G x E had non-significant effect on number of rows per cob and number of seeds per row. Traits less affected by environments are high heritability (Epmat-Le Signor et al., 2001).
142

Oromia Agricultural Research Institute (IQQO), Crop research Proceeding 2017
Table 3. Over all mean of maize genotypes for yield, yield related traits and phonological growths
Varieties
Traits mean
DM (days) PH(cm)
EH(cm)
NRPC(no)
CD(cm)
NSPR(no)
HSW(g)
YLD(t/ha)
Gibe-1 144.83b 144.28c 97.48ab 13.69ab 4.39c 35.26ab 31.72b 5.42cGibe-2 136.17c 178.39a 90.41 c 13.33bc 4.32c 34.04abc 31,67bc 5.85aA 130-Bako 149.83a 181.57a 94.73bc 13.39b 4.34c 35.56ab 29.58cd 4.93eGutto-LMS 125.83d 163.53 b 89.56c 12.44c 5.87b 33.56bc 29.03de 4.03 fGambella 1 10.1 Ie 180.78a 95.35bc 14.44a 4.27c 35.83a 27.64e 5.16dKulani 151.06a 181.74a 103.60a 13.33bc 6.33a 32.97c 34.00a 5.63b
Significance levelReplication 9.36ns 6.48ns 138.50ns 4.08ns 0.04ns 30.07* 3.21 ns 0.03nsGenotype 4568.84*** 4119.92*** 470.81*** 7.44** 15.45*** 24.88* 9.36*** 5.52***Environment 27.55*** 822.90*** 296.06** 19 04*** 38.68*** 307.08*** 66.07*** 7.87***Genotype x Environment 12.84** 327.37*** 267.90*** 1.85ns 16.35*** 13.1 Ins 42.24*** 1.20***Error 4.83 1 13.91 85.13 1.96 0.15 9.36 6.85 0.09CV (% ) 6.22 1.61 9.69 10.13 7.86 8.86 8.57 5.61
*, **, *** = significant at P < 0.05, at P < 0.01 and at P< 0.001, respectively, ns = non-significant. DM=days to maturity, PH=plant height, EH=ear height, NRPC=number of rows per cob, NSPR=number of seeds per row, HSW=hundred seed weight, CD=cob diameter and YId=grain yield.
143

—
8.007.00
_ 6.00 sf 5.00 ■c!a 4.oo >| 3.00uo
2.00
LOO
0.00
Locations
Figure 1: The performance of maize varieties across three years at Abaya and Galana sub sites
GEI is existing when the reaction norms for different genotypes are not parallel (Van Eeuwijk et al., 2005). An extreme form of GEI is by cross-over interaction, where the ranking of the genotypes varies with the environmental conditions (Crossa et al., 2004). There was a rank change of varieties across years which may mean the presence of crossover interaction. Kulani and Gambella were relatively well performed and high yielder across years, while Gutto LMS showed poor but consistent yield performance across years and locations (Fig 1). There was a change in rank of genotypes across years which may suggest the presence of crossover interaction. Similarly, Akbar et al. (2009) and Hussain et al. (2011) reported significant differences among maize cultivars for grain yield under different environmental condition.
Stability Analysis: The AMMI analysis provides a graphical representation to precis the information of main effect and interaction effect for genotypes and environments on the same graph. Variance of the data on yield showed that all the three components genotype (G), environment (E) and G x E interaction were highly significant indicating broad range of diversity existed among varieties, location and seasonal variations (Table 5). Further, the mean squares from AMMI analysis indicated variation among G, E and G x E interaction showed highly significant different level at (P< 0.01) (Table 6). G x E interaction was further partitioned into two principal component analysis axis (IPCA) interactions. This variability was may be due to larger dissimilarity in rainfall, number of rainy days in each environment and high variation in mean sunshine hours among the environments. Several authors also reported supportive results (Nzuve et al., 2013; Kumar and Singh. 2015 and Miah et al., 2016).
Oromia Agricultural Research Institute (IQQO). Crop research Proceeding 2017
Gibel
Gibe2
ABO-Bako
Gutto LM S
Gambella
Kulani
Galana Galana Galana Abaya Abaya Abaya2014 2015 2016 2014 2015 2016
144

Oromia Agricultural Research Institute (IQQO), Crop research Proceeding 2017
Table 4. Combined analyses of variance using AMMI Model.
Source of variation df Sum Square Mean Square Sum SquaresExplained% total % G x E
Total 107 101.25 0.5Genotypes 5 27.60 5.52** 27.26Environments 5 39.36 7.87** 38.87Genotype x environment 25 26.22 l05** 25.90
IPCAl 9 13.63 1.51** 51.98IPCAI1 7 7.47 1.07** 28.49
Residuals 9 5.13 0.57**Error 60 5.13 0.0900** p<0.01
Table 5. IPCA 1and IPCA 2 scores, genotypes mean and six open pollinated maize varietiestested at six locations.
Genotypes Graph ID Genotype mean IPCAg[I] IPCAg[2] ASVABO-Bako ABO 4.93 0.46 0.01 0.29Gambella Gambella 5.16 0.40 0.52 0.49Gibe-1 Gibel 5.42 -0.61 0.54 0.79Gibe-2 Gibe2 5.85 -0.92 -0.69 1.62Gutto-LMS Gutto 4.30 0.74 -0.68 1.20Kulani Kulani 5.63 -0.06 0.28 0.08Grand mean 5.22iPCA=lnteraction Principal Component Axis, ASV=AMM1 stability value.
By plotting both the genotypes and the environments on the same graph, the relationship between genotypes and the environments can be seen clearly. The larger the IPCA scores, either positive or negative, as it is a comparative value, the better specifically a genotype is adapted to certain environments (Table 6). The more IPCA scores approximate to zero, the more stable the genotype is to overall environments. Accordingly, Kulani has IPCA value close to zero, high yielder and stable genotypes across environments (table 6). ABO-Bako was a variety IPCA value relatively close to zero (stable) but gave lower yield below the average. Whereas, Gibe 1 and Gibe 2 were high yielder but, relatively higher IPCA score value deviating from zero, indicating that these varieties were not stable and thus adaptable for specific environment. The genotypes with high ASV were most unstable and while genotypes with low ASV were stable. The ASV indicated that the genotypes Kulani and ABO were most stable across environments and the genotypes, Gibe 2 and Gutto-LMS performed superiorly in certain environments (table 6). The sign of the scores indicate the pattern of interaction of the genotypes across environments and the reaction of environments for the different genotypes. Genotypes and environments with similar sign of IPCAl scores interact positively for yield (tone/ha). But, if they have opposite sign of IPCAl
145

Oromia Agricultural Research Institute (1QQ0), Crop research Proceeding 2017
scores, their interaction is negative and the environment is not favorable for the genotype (Zobel et al, 1988; Crossa et al., 1991). Similar results were reported by Abera et al. (2013) and Anley et al. (2013).Figure 2. AMMI-1 model for grain yield (t/ha) showing the means of genotypes (numbers) and environments (upper case letter followed by number).Genotype Gibe 2, Gibe 1 and Kulani were the genotypes with the above average grain yield. Conversely, genotypes Gutto, ABO-Bako and Gambella had yield below mean grain yield (figure 2). Genotypes Kulani and Gibe 2 had higher mean grain yield at favorable environment while Gutto and ABO had lower mean grain yield at unfavorable environment. With regards to environment, Galanal and Abaya3 had higher grain yield than mean grain yield of environments and were considered as favorable environments while environments like Abayal, Abaya2, Galana2 and Galana3 had below average grain yield and were considered as unfavorable environments (figure 2).AM M I 2 bi-plot: the AM M I 2 bi plot with IPC I in X-axis and IPC2 in the Y-axis were plotted below (figure 3). The first interaction principal component (IP C I) explained 73.19% and the second interaction principal component (IPC2) explained 14.79% of the sum of square of GEI. The two IPC ’s cumulatively explained about 87.98% of the sum of squares of G EI (figure 3). Purchase (1997) stated that, genotypes close to origin are stable while those far from origin are considered
Plo4 of Varieties & Environments IPCA 2 scores versos means
O .B -
0.6 -
0.4 -C/307 0.2 -
«=r 0-0 -o□_
-0-2 -
-0-4 -
-0.6 -
-o .a -
-t* Gutto
AMWK
■erCtbc 2
Golano2 • <3olfir>«3 »
*ab6 -
ttGjmbelta«K t ia n i
Galanal
syaa4.25 4. SO 4 .7 6 5.00 5-25 S.SO S.7S 8.00
M e a n G r a in v ie Id (t/h a )to as unstable genotypes. Regarding adaptability the genotype closest to a given vector in anyenvironment is adaptive to that specific environment and the farthest from a given vector in anyenvironment is less adaptive to that specific environment. Inline to the following principle Gibe 2 wasadaptable to Abaya2 and Abayal environments while Kulani and Gibe I were adaptable to Abaya3,Galanal and Galana3 environments.
146

Oromia Agricultural Research Institute (IQQO). Crop research Proceeding 2017
Scatter plot <Total - 87.98%)
P C I - 7 a i 9 %
EBTfvwOtntnrtatsr'rt! s c o p e s
F:g. 3. AMMl-2 mode) for grain yield (t/ha) showing the IPCA scores of open pollinated maize genotypes (numbers) planted across environments (upper cases followed by numbers)
ConclusionA total of six open pollinated maize varieties were evaluate for their adaptability and grain yield performance in West Guji zone. Analysis of variance for Phenological, yield and yield related traits across locations and years indicated the presence of significance difference among genotypes. The result revealed that Kulani variety gave high yielder at Abaya which is followed by Gambella variety. Gibe 2 was high yielder at Galana followed by Kulani. The result from stability analysis revealed that Kulani was high yielder and stable across test environments relative to other genotypes. ABO-Bako was also relatively stable but gave lower yield below the average. Gibe-1 and Gibe-2 varieties were high yielder but adaptable for specific environment. ASV analysis showed that Kulani and ABO-Bako were most stable across environments but Gibe 2 performed superiorly in certain environments. Generally, Kulani was recommended for wider adaptability, but Gibe 2 showed specific adaptability and recommended for specific area.ReferenceAnley W, Zeleke H, Dessalegn Y, 2013. Genotype X environment interaction of maize (Zea mays L.)
across North Western Ethiopia. Journal of Plant Breeding and Crop Science. 30;5(9):l7l-8l. Bustos-Korts D, Malosetti M, Chapman S, van Eeuwijk F, 2016. Modelling of genotype by environment
interaction and prediction of complex traits across multiple environments as a synthesis of crop growth modelling, genetics and statistics. InCrop systems biology, (pp. 55-82). Springer International Publishing.
Carvalho LC, Damasceno-Silva KJ, de Moura Rocha M, Oliveira GC, 2016. Evolution of methodology for the study of adaptability and stability in cultivated species. African Journal of Agricultural Research. 24;l l(I2):990-!000.
147

Riedelsheimer C, Czedik-Eysenberg A. Grieder C, Lisec J, Technow F, Sulpice R. Altmann T, Stitt M, Willmitzer L, Melchinger AE. 2012. Genomic and metabolic prediction of complex heterotic traits in hybrid maize. Nature genetics. 1;44(2):217-20.
Bassa D, Goa Y, 2016. Performance Evaluation and Adaptation of Improved Maize (Zea mays L) Varieties for Highland of Alicho.Silti and Analemo Districts of Southern Ethiopia. Journal of Natural Sciences Research. ISSN 2224-3186. (15).
Daniel Tadesse, Zenebe G. Medhin, Asrat Ayalew. 2014. Participatory on Farm Evaluation of Improved Maize Varieties in Chilga District of North Western Ethiopia. International Journal of Agriculture and Forestry 2014,4(5): 402-407
FAO (Food and Agriculture Organization of the United Nations), 2015. FAOSTAT, Retrieved November 26, 2016 from http://fa0stat3.fa0.0rg/d0wnl0ad/Q/QC/E.
FAO (World Food Organization), 2016. The State Of Food Insecurity in the World: Undernourishment around the World in 2016. http://faostat.fao.org/default.aspx. Accessed 20, September 2016.
Frutos E, Galindo MP, Leiva V,2014. An interactive biplot implementation in R for modeling genotype- by-environment interaction. Stochastic Environmental Research and Risk Assessment. 1;28(7): 1629-41.
Kumari SS, Sarada C, Naidu LN,2016. Stability for seed yield in ajwain based on Gentoype Selection Index. Indian Journal of Agricultural Research. 1 ;50(3):244-8.
Kumar P, Singh NK.2015. Determining behaviour of maize genotypes and growing environments using AMMI statistics. SAARC Journal of Agriculture. 15; 13(1): 162-73.
Malosetti M. Ribaut JM, van Eeuwijk FA. The statistical analysis of multi-environment data: modeling genotype-by-environment interaction and its genetic basis. Frontiers in physiology. 2013;4.
Miah MA, Ahmed S, Uddin MS,2016. Assessment of yield stability of maize inbred lines in multi- environment trials. Bangladesh Journal of Scientific and Industrial Research. 28;51(l):61-8.
Bakala N,Abate B, Nigusie M, 2017. Standard Heterosis of Maize (Zea mays L.) Inbred Lines for Grain Yieldand Yieid Related Traits at Southern Ethiopia, Hawassa. American-Eurasian J. Agric. and Environ. Sci., 17 (3): pp 257-264. https://www.idosi.org/aejaes/jaesl7(3)17/1 l.pd
Nzuve F, Githiri S, Mukunya DM, Gethi J.2013. Analysis of genotype x environment interaction for grain yield in maize hybrids. Journal of Agricultural Science. 15;5( 11):75.
SAS, 2008. User’s guide SAS/STAT® version 9.2. SAS Institute, Cary, NCSouza FR, Ribeiro PH, Veloso CA, Correa LA,2002. Yielding and phenotypic stability of corn cultivars
in three municipal districts of Para State. Brazil. Pesquisa Agropecuaria Brasileira.;37(9): 1269-74.
Taye T, Bekele N, Shimalis Y,2016. Evaluation of highland maize at Buie hora District of Southern Oromia, Southern Ethiopia. African Journal of Agricultural Research. 25; 11(34):3178- 81 .http://www.academicioumais.org/AJAR
Liu Y J, Chuan DU, Tian ML, Hu EL, Huang YB. 2010. Yield stability of maize hybrids evaluated in maize regional trials in southwestern china using nonparametric methods. Agricultural Sciences in China. 1;9(W): 1413-22.
Zobel RW, Wright MJ, Gauch HG,1988. Statistical analysis of a yield trial. Agronomy journal. 1988:80(3):388-93.
Oromia Agricultural Research Institute (IQQO), Crop research Proceeding 2017_________
148

Oromia Agricultural Research Institute (IQQO), Crop research Proceeding 2017
Registration and release of Sanete and Mandoyu bread wheat varieties for Highlands of BaleTilahun Bayisa^, Tesfaye Letta: Mohammed Abinas’, Wubshet Alemu1, Bekele Hundie4 and Ayalneh Tilahun'
Sinana Agricultural Research Center, P.O. Box 208, Bale-Robe, Ethiopia, :Oromia agricultural research institute, 'International Center for Agricultural Research in Dry Areas (ICARDA), Kulumsa, 4KuIumsa
agricultural research center, 'International center for wheat and maize improvement (C1MMYT) Corresponding author: [email protected]
AbstractFifteen bread wheat genotypes which were introduced from International Center for Agricultural Research in Dry Areas (ICARDA) were evaluated across different years and location to identify high yielding, stable and disease resistant wheat cultivars for the highlands of Bale and similar agroecologies. Out of the tested entries, bread wheat genotypes 14F/HAR 1685 and WORRAKATTA/PASTOR)were found to be the highest yielding and disease resistant as compared to the standard checks (Madda walabu and K6295-4a). These genotypes were eventually evaluated by the National Variety Release Committee (NVRC) and officially recommended for release for Highlands of Bale and Similar agro ecologies. Genotypes 14F/HAR 1685 and WORRAKATTA/PASTOR were named as Sanate and Mandoyu respectively.Keywords: Bread wheat, ICARDA NVRC
IntroductionThe development of cultivars, which are adapted to a wider range of diverse environments, is the ultimate aim of plant breeders in a crop improvement program. The adaptability of a variety over diverse environments is commonly evaluated by the degree of its interaction with different environments in which it is grown. Wheat is the major and strategic crop in Ethiopia. Lack of improved bread wheat varieties is among the major constraints to crop production. Even though, many bread wheat varieties were released for production in Bale over years, most of them are pushed out of production within few years of release mainly due to disease pressure (particularly rusts).To combat this problem, developing and releasing improved bread wheat varieties with different genetic background is imperative. With the effort of releasing bread wheat varieties in the highlands of Bale, a number of wheat genotypes introduced from International Center for Agricultural Research in Dry Areas (ICARDA) were evaluated across locations and years. These genotypes were tested at Sinana on station in a preliminary and advanced observation nursery followed by preliminary yield trial. At later stage, multi location testing was conducted in 2011/12 and 2012/13 cropping seasons to identify superior genotypes for eventual release.Materials and MethodsAbout fifteen bread wheat genotypes along with two standard checks (Madda walabu and K6295-4a) and one local check (Hollandi) were evaluated in multilocation trial across years (2011/12 and 2012/13 cropping seasons) and locations (Sinana, Selka, Goba and Agarfa) to identify high yielding and disease resistant wheat genotypes .The experiment was laid out in Randomized Complete Block Design with four replications and with plot area of 1.2 m (6 rows, 20cm apart) x 2.5m (3m"). The seed rate of 150kg/ha and fertilizer rates of 41/46 (N/P2O5) was used, respectively. Grain yield and disease data were collected. ResultSanete (14F/H A R 1685)Agronomic and morphological characteristics
149

Oromia Agricultural Research Institute (IQQO). Crop research Proceeding 2017
The agronomic and morphological characteristics of variety Sanete were presented in appendix 1. Yield PerformanceMulti location testing was conducted within the regional variety trial, which consists of 15 including standard check Madda Walabu, K6295-4a and local check Hollandi. Yield performance of the overall location presented in table 1.
Table 1. Mean agronomic traits and yield data of the released bread wheat Sanete and check in multilocation testing, 2011-2012SN Variety DH DM PLH TKW HLW GY (kg/ha)1 Sanete (14F/HAR 1685) 71 141 102 39.5 80.0 4480.52 Madda Walabu 71 143 99 43.2 69.6 3518.23 K6295-4a 73 145 113 35.3 72.8 4107.84 Hollandi 66 141 120 40.3 71.5 3108.3DH= days to heading. DM= Days to mature. Plh(cm)= plant height in cm. TKW~ thousand kernel weight in gm HLW= Hectoliter weight and Yield(qt/ha)= grain yield in quintal in hectare.
The results of combined yield over locations and over years showed that, variety Sanate gave 44.8 qt/ha yield which is higher than standard checks Madda walabu (35.2qt/ha) and K6295-4a (41 qt/ha). Locations by year mean of Sanete have showed a yield advantage of 26.2% over standard check Madda walabu and 42.7% over local check Hollandi (Table 1).Disease ReactionThe released variety ‘Sanete" showed resistance reaction to stem rust and yellow rust. The maximum score of stem rust overall location was lOmr where as standard check Madda walabu and K6295-4a were showed a of score 50s and 5ms respectively (Table 2).Table 2. The Disease reaction of variety Sanete and checksSN Variety SR YR LR1 Sanete (14F/HAR 1685) lOmr lOmr 10ms2 Madda Walabu 50s 20mr 5ms3 K6295-4a 5 ms trms 20ms4 Hollandi 30s 20mr 10msSr= stem rust (%), Yp= Yellow rust (%), Lr= leaf rust (%), s= susceptible reaction, ms= moderately susceptible reaction, mr= moderately resistance reaction and tr= trace level of disease percentage less than 5%
AdaptationSanete is released for the Highlands of Bale and for the areas having similar agro ecologies. The cultivar has wide range of adaptation area within altitude ranging from 2300 m.a.s.l to 2600 m.a.s.l and an annual rain fall of 750mm to 1500mm (Appendices I). It could be possible to extend the production of this variety to other similar agro-ecologies. This variety gives a better yield if produced with recommended fertilizer rate of 100kg DAP/ha and 50kg Urea/ha at the seed rate of 150kg/ha for broadcasting.Mandoyu (WORRAKATTA/PASTOR)Agronomic and Morphological characteristicsThe agronomic and morphological characteristics of variety Mandoyu is presented in appendix 2.Yield Performance
150

Oromia Agricultural Research Institute (IQQO), Crop research Proceeding 2017
Multi location testing was conducted within the regional variety trial, which consists of 18 bread wheat genotypes including standard check Sofumer, Tusie and local check Hollandi. The trial was evaluated at three districts for two consecutive years in the highlands of Bale. Yield performance of the overall locations is presented in table 3.Table 3. Mean agronomic traits and yield data of the released bread wheat variety Mandoyu and check in multilocation testing, 2011 -2012 ______SN Variety DH DM PLH TKW HLW Yield (qt/ha)1 Mandoyu
(WORRAK.ATTA/PASTOR)68 139 85.3 36.2 70.6 4275.5
2 Sofumer 67 136 96.8 39.9 72.0 3571.53 Tusie 68 139 98.8 34.6 73.0 3684.04 Hollandi 66.4 138 119.9 40.4 71.9 3126.2DM= days to heading, DM- Days to mature. Plh(cm)= plant height in cm. TKW= thousand kernel II
Hectoliter weight and Yield(qt/ha) ~ grain yield in quintal in hectare.
The results of combined over locations and years showed that, variety Mandoyu gave 42.8qt/ha yield which is higher than standard check Sofumer 35.7qt/hat and Tusie 36.8qt/ha. Locations by years mean of yield of Mandoyu showed yield advantage of 20% and 16% over standard checks Sofumer and Tusie respectively and 42.7% over local check Hollandi.Disease ReactionThe released variety Mandoyu showed resistance reaction to stem rust and moderately susceptible to yellow rust (Table 4). The maximum score of stem rust overall locations was Trr (less than 5%) where as standard check Sofumer and Tusie were showed stem rust scores of 30s and 50s respectively.Table 4. The maximum disease reaction of variety Mandoyu and checksSN Variety SR YR LR1 Mandoyu (WORRAKATTA/PASTOR) trr 10ms 5ms2 Sofumer 30s 5 ms 5ms3 Tusie 50s 10ms 5ms4 Hollandi 30s 60s 5 msSr= stem rust (% ), Yr~ Yellow rust (%>), L r- leaf rust (% ), s- susceptible reaction ms- moderately susceptible reaction, mr- moderately resistance reaction and tr- trace level oj disease percentage less than 5%
AdaptationMadoyu is released for the Highlands of Bale and areas having similar agro ecologies. The cultivar has wide range of adaptation ranging from 2200 m.a.s.l to 2500 m.a.s.l and with an annual rain fall of 750mm to 1500mm (Table 5). It could be possible to extend the production of this variety to other similar agro- ecologies. This variety gave a better yield if produced with recommended fertilizer rate of 100kg DAP/ha and 50kg Urea/ha at the seed rate of 150kg/ha for broadcasting.N ariety MaintenanceThe breeder and pre-basic seeds of these two released bread wheat varieties will be maintained by Sinana Agricultural Research Center of Oromia agricultural research institute (IQQO).
151

Oromia Agricultural Research Institute (IQQO), Crop research Proceeding 2017
Apendix 1. Agronomic and morphological descriptors of Sanete variety
• Variety Name: Sanete (14F/ HAR 1685)• Adaptation area: Highlands of Bale and similar agro ecology o Altitude (m.a.s.l): 2300-2600m.a.s.Io Rainfall (mm): 750-1500• Seed rate (kg/ha): 150• Planting date: Mid June to early September in Bale based on the agro-ecology of the area• Fertilizer rate (kg/ha):o P205=46o N= 41• Days to heading: 71• Days to mature: 141• Plant height(cm): 102• Growth habit: Erect• Ear type: Compact• 1000 seed weight(g): 39.5• Seed color: Red to Amber• Hectoliter weight(kg/hl): 80.0• Yield (qt/ha''):o Research field: 52.8-66.9o Farmers’ field: 32.5-42.9• Year of release: 2014
Apendix 2. Agronomic and morphological descriptors of Mandoyu variety• Variety Name: Mandoyu (WORRAKATTA/PASTOR)• Adaptation area: Highlands of Bale and similar agro ecology o Altitude (m.a.s.l): 2200-2500m.a.s.lo Rainfall (mm): 750-1500• Seed rate (kg/ha): 150• Planting date: Mid June to early September in Bale based on the agro-ecology of the area• Fertilizer rate (kg/ha):o P205=46o N= 41• Days to heading: 68• Days to mature: 139• Plant height(cm): 85.3• Growth habit: Erect• Ear type: Compact• 1000 seed weight(g): 36.2• Seed color: White• Hectoliter weight(kg/hl): 81.5• Crop pest reaction resistant to stem rust• Yield (qt/ha1):o Research field: 49.5-58.6o Farmers’ field: 27.7-42.6• Year of release: 2014
152

Oromia Agricultural Research Institute (IQQO), Crop research Proceeding 2017
Conclusion and recommendationBread wheat varieties Sanate and Mandoyu were released for the Highlands of Bale, however, these varieties mighty perform well under agro-ecologies similar to Highlands of Bale and hence, these varieties should be evaluated via adaptation trial to recommend in areas similar to Bale highlands. These varieties showed resistant to moderately resistant to currently existing yellow and stem rust races and hence can be used as alternative varieties where these two rusts are important.
CROP MANAGEMENT
Effect of Fertilizer Rate on the Yield and Yield Component of Sesame(Sesamum indicumL.)\n Moisture Stress environments of east Harerghe Zone
Adugna Hunduma' ’and Habte Birhanu'Fedis Agricultural Research Center P.O. Box, 904 Harar, Ethiopia.
^Corresponding author: [email protected] Abstract
Field experiments were conducted with the objective of identifying and recommending optimum combined phosphorus and nitrogen fertilizer rates for sesame production at Fadis Boke and Errer sub-sites in 2014 and 2015 cropping seasons. Four different phosphorus rates (0, 40. 60. and 80 kg ha'1) in the form of PjO j and four nitrogen nutrient rates (0. 10. 20.and 30 kg N ha'1) were combined and used as treatments using sesame variety’ "Tate". The experiment was laid out in RCBD with three replications. Data were collected and analyzed for sesame seed yield, number of sesame branches and pods per plant, and number of seeds per pod under the different combinations of the fertilizers rates. The results of the study showed analysis of over location and season of the different NP fertilizer rates combination significantly (p<0.05) affected the yield components and seed yield of sesame. The highest sesame seed yield (891). number branches per plant (28.71)) and number of pods per plant (68.67) were obtained from sesame crops received 60P20} kg ha'1 and 30N kg ha'1 NP integrations of the fertilizers rates. The yield of sesame seed achieved from the combination of 60P205 kg ha'1 and SON kg hd‘ NP fertilizer rates was 35.7 and 72 /(, greater than the average yields of all the rest fertilizer combinations and the no fertilizer application, respectively. Similarly, the highest number of sesame branches per plant obtained from the combination of'60P:0 < kg ha' and 30N kg ha'1 NP fertilizer rates was 66.4 and 43.6% greater than the average number of branches per plant of all the rest fertilizer combinations and the no fertilizer application, respectively. Furthermore, the combined mean number of sesame pods per plant recorded from the combination of 6OP2O5 kg ha'' and 30N kg ha'1 NP fertilizer rates was 42.4% greater than the no fertilizer application treatment. Therefore, to sesame growing farmers in Haraghe zone application of the combination of 60PjOj kg ha'1 and 30N kg ha'1 phosphorus and nitrogen fertilizer rates can be recommended for improved sesame production and productivity particularly to at Fedis, Errer and other similar environments of the area.Keyword: Nitrogen, Phosphorus, Sesame seed yield, number of branches, pods
IntroductionSesame (Sesamumindicum) is grown in areas with annual rainfall of 625to1100mm and temperature of greater than 27 degree Celsius . The crop is tolerant to drought, but not to water logging and excessive rainfall. Sesame is well adapted to a wide range of soils, but requires deep, well-drained, fertile sandy loams. Oromia National State is a major producer of sesame crop next to Tigray and Amhara National Regional States of Ethiopia. Sesame contributes to more than 80% of the export earning of oil seeds and
153

Oromia Agricultural Research Institute (IQQO), Crop research Proceeding 2017
become the second foreign currency earning crop after coffee in the country. Ethiopian sesame seed market covers quiet a wide range of countries all over the world. The growing demand in the world market and the available capacity to expand sesame production could contribute to the economic growth of Ethiopia (Haile Abera, 2009). At present, the Ethiopian government devotes considerable resources to research and extension in view of encouraging small scale farmers to increase their oil seed, particularly sesame, productivity for international high market demand of the crop to increase export earnings of the country. The oilseeds sector is one of Ethiopia’s fastest growing and important sectors, both in terms of its foreign exchange earnings and as a main source of income for over three million Ethiopians.Study reports indicate that Ethiopia is among the six producers of sesame seed, linseed and Niger seed in the world (Wijnandsef al., 2009). The major sesame seed producing regions are situated in the North West and South West Ethiopian in Humera, north Gondar and Wollega (Wijnandsef al., 2007; CSA, 2013). For instance, the main source of farmers’ income in western Tigray is sesame sales.Sesame is deep rooted and scavenges for fertility below the wheat root zone, but that only works once. The sesame strips lower nutrient reserve, and the fertility will not be available for future sesame crops. Research results have shown that nitrogen and phosphorus (NP) fertilizersare critical for high sesame seed yields, particularly in acidic soils. The major constraints in sesame production worldwide are lack of wider adapting cultivars, shattering of pods at maturity, nonsynchronous maturity, poor stand establishment, lack of fertilizer responses, profuse branching, and low harvest index (Ashri, 1994).Similarly, besides unavailability of improved sesame varieties with good production traits, lack recommendations of NP fertilizers rates in Hararghe in general and in Fedis sesame growing environments is limiting the production and productivity of the crop. Thusan experiment initiated with the objective of identifying NP fertilizers rate combinations that can increase the productivity of sesame in growing environments of east Hararghe.Materials and MethodsDescription of Experimental Site: The study was conducted under rain fed conditions at two location (Fadis; Boke site) and Errer sub-site. The sub-site is geographically located at the latitude of 9° 07'N and longitude of 42° 04'E at an altitude of 1702 meters above sea level. The area is situated at a distance of 24 km north of Harar city. The soil of the experimental site is black with surface soil texture of sand clay loam that contains 8.2% organic matter, 0.13% total nitrogen, 4.99ppm available phosphorus, \.6&Cmoti+) kg' 1 soil exchangeable potassium and a pH value of 8.26. It received mean annual rainfall of 860.4mm in the last five years. The area is characterized by a bimodal rainfall distribution pattern and maximum rain received from April to June while irregular and erratic rains are received from August to October. The mean maximum and minimum annual temperatures of the area are 27.7 and 11.3°c, respectively, for the past five years (Fadis Agriculture Research Center Metrological Station, 2015 unpublished).The second experimental area of our experiment Errer Sub-site is located at Errer valley of Babiledistrict, located at 34km east of Harar cit. The area receives an average annual rainfall of 400 to 600mm and suited at an altitude range of 950 to 2000 meters above sea level. The environment is characterized as extremely lowland suitable for the production of sesame.Experimental Materials, Treatments and DesignsThis experiment were planted at Fadis, Boke station and Errer experimental sub-site with the objectives of evaiuating,identifying and, recommending the best combination of NP fertilizers rates that can
154

Oromia Agricultural Research Institute (IQQO), Crop research Proceeding 2017
maximize sesame yield and it components in lowland and mid-altitude environments of Eastern Harerghe sesame producing areas. The treatments consisted of a combinations of four nitrogen fertilizer rates (0, 10, 20 and SOkgNha'1) in the form of UREA and four phosphorus levels (0, 40, 60 and SOkgP^Osha'1) in the form Di-Ammonium Phosphate (DAP). Sesame variety “Tate” was used for the experiment. Sixteen (16) factorial combinations of NP fertilizers rates were arranged in a Randomized complete block design (RCBD) with three replications. The experimental field was ploughed, harrowed and ridged 40 cm apart. A mixture of one part of sesame seed and two parts of course river sand were sown manually at depth about 1cm depth at and the emerged plants were later thinned at 10cm intra-row spacing of plant per stand two weeks after sowing to keep crop population densities of 250,000 plants per hectare. All Phosphorus fertilizer rates were applied at planting to all the plots and all the nitrogen fertilizer rates were divided in .o two equal amounts and applied at two and six weeks after sowing. All other cultural and agronomic practices were applied uniformly to all the experimental plots.Data Collection: Data were collected for number of branches per plant, number of pods per plant, number of seed per pod, and seed yield per hectare (kg/ha)for analysis and interpretations.Data Management and Statistical Analysis: Analysis of variance (ANOVA) was computed for all collected data using GenStat 15th edition. Treatment means were separated using Duncan least significant difference method (LSD) at 5% probability level for all statistically different means.Results and Discussion
Response of sesame seed yield and its components to the combination of different NP fertilizers ratesThe analysis of variance for 2014 cropping season revealed that the interaction of phosphorus and nitrogen fertilizers rate resulted in statistically significant differences (p<0.05) for sesame seed yield and number of branches per plant at Boko and Errer experimental sub-sites. These interactions also significantly (p<0.05) affected the number of pods per plant at Errer sub-site but did not at Boke sub-site. Number of seeds per pod was not affected by the interaction effect of the fertilizers at both experimental sub-sites (Table 1).In contrary, except the number of seeds per pods at Errer sub-site, all the seed yield of sesame, number of branches and pods per plant and seed per pod were significantly affect by the interaction effects of the fertilizers during 2015 cropping season(Table 2)Accordingly, in 2014, the highest mean seed yield (867.8) and number of branches per plant (23.33) were recorded for sesame crops that received the combination of 60 P:0 5 kg ha’1 and 30 N kg ha' 1 and 40 P:0 5 kg ha-1 and 20 N kg ha' 1 phosphorus and nitrogen fertilizers rates, respectively at Boke experimental sub-site while fertilizer combination of 60 P20 5 kg ha' 1 and 30 N kg ha'1 resulted in the highest mean values of sesame seed yield and number of branches at Errer sub-site (Table 1). This maximum yield achieved at Boke from the combination of 60 P:05 kg ha'1 and 30 N kg ha' 1 was superior to yields obtained when all the nitrogen fertilizer rates are applied without phosphorus, combination of 40 P:0? kg ha'1 and 30 N kg ha'1, and 80 P20? kg ha' 1 and 0 N kg ha' 1 while the maximum number of branches per plant obtained at the same sub-site from the combination of fertilizer rates at 40 P O? kg ha'1 and 20 N kg ha' 1 was significantly higher than all the rest fertilizer combinations except for 0 P:05 kg ha' 1 and 10, 20, 30 N kg ha'1, 60 P2O5 kg ha' 1 and 10 and 30 N kg ha'1 phosphorus and nitrogen fertilizer combinations (Table I). Significantly the highest maximum sesame seed yield (912.5) was obtained at Errer experimental sub-site from the combination of 60 P:05
155
Oromia Agricultural Research Institute (IQQO), Crop research Proceeding 2017
kg ha 1 and 30 N kg ha': phosphorus and nitrogen rates which was superior to all the rest fertilizer combination rates. At Error, again significantly a maximum number of branches per plant (22.33) was achieved from combining 60 P2O5 kg ha and 30 N kg ha rates of phosphorus and nitrogen fertilizers which was superior to the number of branches obtained from no fertilizer treatment, 0 P;0 5 kg ha*1 and 10 N kg ha'1, 40 P2O5 kg ha and 0 and 10 N kg ha , 40 P:0? kg ha and 30 N kg ha ', 60 P2O5 kg ha'1 and 0 to 20 N kg ha'1, and 80 P2O5 kg ha and 0 to 30 N kg ha combinations of the fertilizers.The number of pods per plant (67.33 and 67.00) of sesame was highest at Errer sub-site from the combination of 40 and 8OP2O5 kg ha' 1 and 0 N kg ha 1 rates of the fertilizers and these were only superior to the number of sesame pods per plat achieved by the combination of OP2O5 kg ha' 1 and 30N kg ha'1, and 80 P2O5 kg ha'1 and 20 and 30N kg ha'' phosphorus and nitrogen fertilizers rates (Table 1). Similar to 2014, in 2015 cropping season 6OP2O5 kg ha ! and 30N kg ha 'combination of the fertilizers resulted in the highest maximum sesame seed yields (964.2 and 897.2), and number of branches and pods per plant (15.17 and 9.6; and 96.43 and 74.67), respectively at Boke and Errer experimental sub-sites and these numbers were a superior to all the rest fertilizer combination treatments (Table 2) The results obtained from the study on sesame yield differences at different combinations of NP fertilizer rates is in agreement with the results of Siddiketa/. (2016) who reported increased and significant sesame seed yields when varying rates of NP fertilizers were combined for different environments. Similarly, (Reddy, 2004) reported that integrationof nitrogen and phosphorus fertilizers of different rates showed variations in number of pods and branches per plant.Over cropping season and location effects of NP fertilizers rate combinations on sesame seed yieldCombined analysis of variance over location and cropping seasons showed statistically significant differences (p<0.05) for sesame seed yields due to combination of the different rates of phosphorus and nitrogen fertilizers (Table 3). The maximum and superior sesame seed yield (891) to all the rest of NP fertilizer combination rates was obtained from the integration of 6OP2O5 kg ha' 1 and 30N kg ha'1 phosphorus and nitrogen fertilizers. This sesame seed yield achieved from the combination of 6OP2O5 kg ha' and 30N kg ha ’NP fertilizer rates was 35.7 and 72% greater than the average yields of all the rest fertilizer combinations and the no fertilizer application, respectively. This result confirms the finding of (Shiferawe/ al.. 2012) who reported 35% sesame seed yield increment due to application of 38/29 kg ha'1 NP2O5 fertilizers at planting. Similarly, Hosseine/ al. (2007) recorded the highest sesame seed yield with the application of 60 kg N ha'1 and Okparae/ al. (2007) found that application of 75 kg N ha'1 and 26 kg P ha'1 significantly increased sesame seed yield per hectare.Over cropping season and location effects of NP fertilizers rate combinations on sesame number of branches per plantCombined analysis of variance over location and cropping seasons showed statistically significant differences (p<0.05) for sesame number of branches per plant as a result of combining different rates of phosphorus and nitrogen fertilizers (Table 3). The maximum and superior number of branches per plant (28.71) to all the rest of NP fertilizer combination rates was obtained from the integration of 6OP2O5 kg ha' and 30N kg ha'1 phosphorus and nitrogen fertilizers. This highest sesame number of branches per plant achieved from the combination of 6OP2O5 kg ha and 30N kg ha 'NP fertilizer rates was 66.4 and 43.6% greater than the average number of branches per plant of all the rest fertilizer combinations and the no fertilizer application, respectively. This result confirms the finding of Olowe and Busari (2000) who
156

Oromia Agricultural Research Institute (IQQO), Crop research Proceeding 2017
found that application of 60 kg N ha' and 13kg P ha'1 produced significantly the highest number of branches per plant.Over cropping season and location effects of NP fertilizer rate combinations on sesame number of pods per plant and seeds per podCombined analysis of variance over location and cropping seasons showed statistically significant differences (p<0.05) for sesame number of pods per plant as a result of combining different rates of phosphorus and nitrogen fertilizers, however, the interaction did not affect the number of seeds per pod (Table 3). The maximum number of pods per plant (68.67) was obtained from the integration of 6OP2O5 kg ha' 1 and 30N kg ha' 1 phosphorus and nitrogen fertilizers. This combined mean number of sesame pods per plant achieved from the combination of 6OP2O5 kg ha-1 and 30N kg ha'NP fertilizer rates was 42.4% greater than the no fertilizer application treatment. This result confirms the finding of Olowe and Busari (2000) who found that application of 60 kg N ha'1 and 13kg P ha'1 produced significantly the highest number of sesame capsules/pods per plant.Conclusion and RecommendationsThe results of these experimental researches from both locations across the experimental years indicated that sesame seed yield, and number of branches and pods per plant were significantly influenced by the combination of different phosphorus and nitrogen fertilizer rates across locations and experimental seasons. Sesame plantsreceived 6OP2O5 kg ha' 1 and 30N kg ha'NP integrations of the fertilizers rates resulted in significantly the highest combined means of sesame seed yield (891), number of branches per plant (28.71) and number of pods per plant (68.67) compared to crops treated with most of the fertilizer combinations and the no fertilizer control plots. The yield of sesame seed achieved from the combination of 6OP2O5 kg ha' 1 and 30N kg ha 'NP fertilizer rates was 35.7 and 72% greater than the average yields of all the rest fertilizer combinations and the no fertilizer application, respectively. Similarly, the highest number of sesame branches per plant obtained from the combination of 6OP2O5 kg ha' 1 and 30N kg ha' NP fertilizer rates was 66.4 and 43.6% greater than the average number of branches per plant of all the
rest fertilizer combinations and the no fertilizer application, respectively. Furthermore, the combined mean number of sesame pods per plant recorded from the combination of 6OP2O5 kg ha' 1 and 30N kg ha' NP fertilizer rates was 42.4% greater than the no fertilizer application treatment. Therefore, to sesame
growing fanners in Haraghe zone application of the combination of 6OP2O5 kg ha' 1 and 30N kg ha'! phosphorus and nitrogen fertilizer rates can be recommended for improved sesame production and productivity particularly to at Fedis, Errer and other similar environments of the area.
157
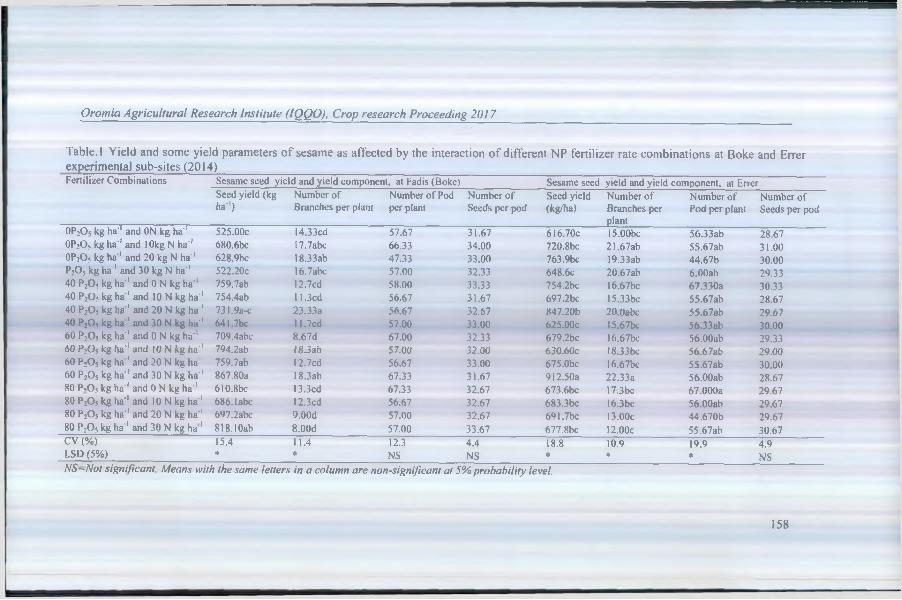
Oromia Agricultural Research Institute (IQQO), Crop research Proceeding 2017_______________
Table. 1 Yield and some yield parameters of sesame as affected by the interaction of different NP fertilizer rate combinations at Boke and Errer experimental sub-sites (2014)_____________________ _________ ___________________________________________Fertilizer Combinations Sesame seed yield and yield component, at Fadis (Boke)__________________ Sesame seed yield and yield component, at Errer
Seed yield (kg Number of Number of Pod Number of Seed yield Number of Number of Number ofha'1) Branches per plant per plant Seeds per pod (kg/ha) Branches per
plantPod per plant Seeds per pod
0P2O5 kg ha' 1 and ON kg ha-1 525.00c I4.33cd 57.67 31.67 616.70c I5.00bc 56.33ab 28.670P2O5 kg ha‘' and 10kg N ha-' 680.6bc I7.7abc 66.33 34.00 720.8bc 21.67ab 55.67ab 31.00OP2O5 kg ha 1 and 20 kg N ha' 1 628.9bc I8.33ab 47.33 33.00 763.9bc I9.33ab 44.67b 30.00P2O} kg ha' 1 and 30 kg N ha' 1 522.20c 16.7abc 57.00 32.33 648.6c 20.67ab 6.00ab 29.3340 P20< kg ha' 1 and 0 N kg ha' 1 759.7ab I2.7cd 58.00 33.33 754.2bc 16.67bc 67.330a 30.3340 P2O5 kg ha 1 and 10 N kg ha'1 754.4ab 11.3cd 56.67 31.67 697.2bc 15.33bc 55.67ab 28.6740 P2Oj kg ha 1 and 20 N kg ha' 1 73J.9a-c 23.33a 56.67 32.67 847.20b 20.0abc 55.67ab 29.6740 P20«i kg ha 1 and 30 N kg ha’1 64l.7bc 1 l.7cd 57.00 33.00 625.00c 15.67bc 56.33ab 30.0060 P2O5 kg ha' 1 and 0 N kg ha'' 709.4abc 8.67d 67.00 32.33 679.2bc I6.67bc 56.00ab 29.3360 P2Of, kg ha' 1 and 10 N kg ha'1 794.2ab 18.3 ab 57.00 32.00 630.60c I8.33bc 56.67ab 29.0060 P:0 5 kg ha 1 and 20 N kg ha 1 759.7ab I2.7cd 56.67 33.00 675.Obc 16.67bc 55.67ab 30.0060 P20 5 kg ha' 1 and 30 N kg ha' 1 867.80a 18.3ab 67.33 31.67 912.50a 22.33a 56.00ab 28.6780 P1O5 kg ha' 1 and 0 N kg ha' 1 6 l0.8bc 13.3cd 67.33 32.67 673.6bc 17.3bc 67.000a 29.6780 P20$ kg ha' 1 and 10 N kg ha' 1 686.1abc I2.3cd 56.67 32.67 683.3bc 16.3bc 56.00ab 29.6780 P2O5 kg ha 1 and 20 N kg ha' 1 697.2abc 9.00d 57.00 32.67 69l.7bc 13.00c 44.670b 29.6780 P:Os kg ha' 1 and 30Nkg ha1 818.1 Oab 8.00d 57.00 33.67 677.8bc 12.00c 55.67ab 30.67CV (% ) 15.4 11.4 12.3 4.4 18.8 10.9 19.9 4.9LSD (5% ) * ♦ NS NS * * * NSN S~N ot significant. M eans with the same letters in a column are nonsign ificant at 5 % probab ility level.
158

Oromia Agricultural Research Institute (IQQO), Crop research Proceeding 2017
Table.2 Yield and some yield parameters of sesame as affected by the interaction of different N P fertilizer rate combinations at Boke and Errer experimental sub-sites (2015)Fertilizer Combinations Sesame seed yield and yield components at Fadis (Boke) Sesame seed yield and yield components at E rre r
Seed yield (kg ha'1)
Number o f Branches per
plant
Number o f Pod per plant
Number of Seeds per pod
Seed yield (kg h a1)
Number of Number of Branches per Pod per plant
plant
Number of Seeds per
podOPjOs kg ha' 1 and ON kg ha-1 598.60b 7.4bc 65.5bc 44.33b 652.50d 5.67c 69.6 7ab 46OPjOs kg ha' 1 and 10kg N ha' 1 664.40b 6.00c 56.00c 53.0ab 746.10c 6.33c 64.3 3 ab 42OPjO; kg ha' 1 and 20 kg N ha' 1 715.0ab 6.33c 56.33c 44.00b 772.2bc 6.33c 62.33ab 45OP2O 5 kg ha-1 and 30 kg N ha' 1 650.80b 4.33c 49.33c 54.0ab 702.80c 6.00c 61.00ab 4440 P 20 5 kg ha' 1 and 0 N kg ha' 1 700.60b 5.8bc 59.8bc 55.7ab 756.90c 7.67b 73.67ab 4440 P 2O 5 kg ha'! and 10 N kg ha' 1 S86.7ab 6.5bc 87.2ab 53.7ab 748.90c 7.00b 72.00ab 4440 P2O 5 kg ha 1 and 20 N kg ha' 1 865.3ab 7.53b 89.Bab 57.0ab 807.5ab 7.33b 71.33ab 4640 P 2O 5 kg ha'1 and 30 N kg ha' 1 804.2ah 6.83c 56.83c 44.33b 799.70h 6.67b 62.67ab 4460 P2O 5 kg ha' 1 and 0 N kg ha' 1 723.60b 5.2bc 67.7ac 59.33a 727.80b 6.33c 62.33ab 4460 P2O 5 kg ha' 1 and 10 N kg ha 1 938.90a 6 .3 be 60.3bc 55.7ab 760.60c 9.00a 69.00ab 4660 P2O5 kg ha 1 and 20 N kg ha 1 741.lab 12.4ab 59.2bc 49.3ab 780.00b 7.67b 59.670b 4460 P20 5 kg ha' 1 and 30 N kg ha’ 1 964.20a 15.17a 96.40a 6 ! .Oab 897.20a 9.67a 74.670a 4480 P2O5 kg ha’ 1 and 0 N kg ha’ 1 898.6ab 5.33c 50.33c 53.7ab 653.60d 6.67b 64.67ab 4680 P2O 5 kg ha' 1 and 10 N kg ha' 1 672.5ab 7.0bc 75.0ac 48.3ab 643.90d 5.67c 59.670b 4480 P20 5 kg ha' 1 and 20 N kg ha' 1 891.4ab 5.17c 52.17c 49.7ab 774.2bc 6.00c 66.00ab 4580 P20 5 kg ha' 1 and 30 N kg ha' 1 842.8ab 6.5bc 65.5bc 47.0ab 646.1 Od 7.33b 74.330a 43CV (% ) 19.10 25.80 25.80 13.10 16.70 7.30 7.30 6.40LSD (5 % ) 269.70 7.6 27.6 1 1.42 170.68 1.33 11.70 NSNS~Not significant. Means with the same letters in a column are nonsignificant at 5% probability level.
159

Oromia Agricultural Research Institute (IQQO), Crop research Proceeding 2017
Table.3 The overall mean interaction of sesame yield of the two locations (Erer and Fadis) in 2014 &2015
Fertilizer CombinationsSeed yield
(kg ha1)
Number of Branches per plant
Number of Pods Pod per plant
Number of Seeds per pod
0P;O5 kg ha' 1 and ON kg ha'1 518.1 Od 20.00b 48.21b 41.58OP2O5 kg ha‘l and lOkgNha'1 703.0bc 17.42b 58.2 lab 40.00OP2O5 kg ha’1 and 20 kg N ha'1 670.0bc 17.33b 57.50ab 38.080P;O5 kg ha'1 and 30 kg N ha'1 651.6bc 19.42b 57.75ab 39.9240 P2O5 kg ha' 1 and 0 N kg ha' 1 692.8bc 15.71b 57.83ab 41.0040 P205 kg ha and 10 N kg ha'1 696.9bc 19.2lb 57.46ab 39.6740 P2O5 kg ha'1 and 20 N kg ha' 1 763.00b 23.62b 57.004b 41.5040 P:0 5 kg ha 1 and 30 N kg ha' 1 617.6cd I4.2lc 57.67ab 37.8360 P20 5 kg ha' 1 and 0 N kg ha'1 6I7.7cd 15.02c 58.00ab 41.4260 P205 kg ha 1 and 10 N kg ha' 1 652.2bc 20.00b 58.58ab 40.8360 P2O5 kg ha'1 and 20 N kg ha1 639.00c 14.54c 58.2 lab 39.0860 P2O5 kg ha' 1 and 30 N kg ha'1 891.00a 28.71a 68.670a 38.8380 P2O5 kg ha'1 and 0 N kg ha'1 659.2bc 18.92b 58.54ab 40.5080 P2O5 kg ha' 1 and 10N kg ha'1 6l4.0cd 13.33c 58.33ab 38.6780 P2O5 kg ha' 1 and 20 N kg ha'1 663.6bc 17.54b 57.58ab 39.3380 P2O5 kg ha'1 and 30 N kg ha'1 693.7bc 12.46c 58.17ab 38.67CV (% ) 18.30 13.60 19.80 9.60LSD (5%) 126.00 3.62 11.28 NS
NS = Nonsignificant; Means with the same letters in column are nonsignificant at 5% probability level.ReferenceAkhtar K.S., Buriro M., Nadeem A., Ahmed N., Saeed Z., Mohammad F.. and Ahmed S., 2015. Response
of Various Sesame Varieties under the Influence of Nitrogen and Phosphorus Doses, (February), 405-412.
Ashri A., 1994. Genetic resources of sesame: Present and future perspectives. In: Arora, R.K. and Riley, K.W. (Eds). Sesame Biodiversity in Asia-Conservation, Evaluation and Improvement, IPGRl Office for South Asia, New Delhi, India. Pp. 25-39.
Central Statistical Agency, 2013. Agricultural Sample Survey 2012/2013 (2005 E.C.), Report on Area and Production of Crops (Private Peasant Holdings. Meher Season), Vol. I .
Hossein M. A., A. Hamid and S. Nasreen, 2007. Effect of nitrogen and phosphorus fertilizer on N/P uptake and yield performance of Groundnut (Arachishypogea L.). J. Agric. Res. 45 (2): 119-127
Okpara D. A., C. O. Muoneke and T. A. Ojikpong, 2007. Effects of nitrogen and phosphorus fertilizer rates on the growth and yield of sesame (Sesamummdicum L.) in the Southeastern Rainforest Belt of Nigeria. Nigerian Agri. J. (38): 1-11.
Olowe V. 1. O., and Busari L. D., 2000, Response of Sesame (Sesamumindicum L.) to Nitrogen and Phosphorous Application in Southern Guinea Savanna of Nigeria. Tropical OilseedJournal. 30- 37.
160

Oromia Agricultural Research Institute (IQQO), Crop research Proceeding 2017
Reddy SR., 2004. Principles of Crop Production. Kelyani Publishers, New Delhi, India p. 649.Shiferaw Tadesse, ZerihunAbebe. TadesseBirhanu, ToleraAbera. AschalewSisay, Dagnachew Lule and AbeyaTemesgen, 2011. Effects of fertilizer and cultural practices on seed yield and yield
components of sesame and linseed in Western Oromia. Pp. //?:GeremewTerefe, AdugnaWakjira and DejeneGorfu (eds.)
Siddik A., Shirazy B. J., Islam M. M., and Hoque A., 2016. Combined effect of nitrogen and NAA on the yield of Sesame (Sesamumindicum L.), 1-9. http://doi.org/10.15192/PSCP.SA.2016.
Wijnands Biersteker J., Van Loo E.N., 2009. Oil seed business opportunity in Ethiopia. Oil seedresearch report. Addis Ababa. Ethiopia.
Wijnands J., Biersteker J., and Hiel R., 2007. Oilseeds Business Opportunities in Ethiopia. The Hague 30.
Effect of Nitrogen Fertilizer Rates on Growth, Yield and Shelf-Life of Onion (Allium cepa L.)Varieties in east Hararghe, Ethiopia
1Gebisa Benti, 'Nigussie Dechassa and'Tamado Tana 'Fedis Agricultural Research Center. Oromia Agricultural Research Institute, Ethiopia
'Department of Plant Sciences. Haramaya University, Ethiopia Corresponding author. GebisaBenti. Email: [email protected]
AbstractFarmers in Fedis district of east Hararghe zone where onion is grown produce onion from unknown seed sources which results in small bulb sizes leading to low total and marketable bulb yieldswith much reduced shelf life. The framers also apply different Nitrogen fertilizer rates due to lack of information how much to be applied. Therefore, fieldexperiment was conducted at Fedis Agricultural Research Center (FARC), during the main cropping season of 2014 to investigate the effect of application of different Nitrogen fertilizer rates on growth, yield, and shelf life of onion varieties. The results revealed that nitrogen fertilizer rates significantly affected onion bolting percentage. (P<0.001), marketable bulb yields and percent dried stored bulb weight losses (P<0.05). similarly, the results of this study revealed there were significant (P<0.01) differences in bolting percentage, number of leaves per plant, days to physiological maturity, percent bulb dry mater content and dried stored bulb weight loss, and marketable bulb yield among the onion varieties tested. The results confirmed application of 150 and 200 kg N ha" significantly reduced the shelf life of dried stored onion bulbs reducing their shelf life and did not increase bulb yields of the onion varieties compared to the application of 50 or 100kg N ha'1 both of which resulted in significantly improved bulb yields and prolonged shelf life of stored dried bulbs through reducing physiological bulb weight losses. According to the results obtained, application of 100 kg N ha'1 significantly reduced physiological weight loss of stored onion bulbs by 4 and 9% compared to the application of 150 and 200 kg N ha'1 at 90 days of storage period, respectively. The study also identified Bombay Red onion variety to be recommended for its high total and marketable bulb yields, early maturity and superior storage shelf life quality over the other two varieties. Therefore, Bombay Red variety with the application of 50 to 100 kg N ha'' can be recommended to onion growing areas of Fedis and similar environments in east Hararghe zone.Key words: Adama Red, Bombay Red, Nasik Red, nitrogen, shelf life, bulb, marketable yield
161

Oromia Agricultural Research Institute (IQQO), Crop research Proceeding 2017
IntroductionOnion [Allium cepaL.) is an important vegetable crop belonging to the family Alliaceae. It is the most widely grown and popular crop among the Alliums. It is an indispensable item in every kitchen as a vegetable and condiment used to flavor many of the food stuffs. Therefore, onion is popularly referred to as “Queen of Kitchen’ (Selvaraj, 1976).Onion is produced all round seasons and has comparatively low storage ability and bulbs are usually stored until the harvest of next season crop or for longer periods due to seasonal glut of onion in the market. Significant losses in quality and quantity of onion occur during storage. Storage of onion bulbs has, therefore, become a serious problem in the tropical countries like Ethiopia. The losses, where no bottom ventilation is provided, are estimated to the extent of 30 to 35 percent due to drainage, 10 to 12 percent by decay and 8 to 12 percent on an account of sprouting, depending upon the relative humidity and temperature during the rainy season (Maini and Chakrabarti, 2000).Farmers sometimes apply excess amount of fertilizers targeting only for bulb yield, but they do not consider postharvest effects of nitrogen fertilizers. High nitrogen supply favors poor postharvest quality of onion bulbs (Olsen and Kurtz, 1982). In Ethiopia, Ethiopia Institute of Agricultural Research (EIAR) recommended nitrogen fertilizer of 150 kg ha' 1 in the form of UREA as a blanket recommendation (Lemma and Shimelis, 2003), which was not practiced in eastern part of Harerghe; where farmers mainly produceKhat (Cat ha edulis¥ orsk.), sorghum, groundnut, and onion during lean periods.In Eastern Ethiopia, whenever available, growers use farmyard manure as well as nitrogen fertilizer to increase bulb yields.However, no data are available to substantiate the belief that benefits can be obtained from fertilization of onion, especially under low soil moisture conditions of eastern Hararghe(KebedeWoldetsadik, 2003). In areas of eastern Hararghe where onion is produced, the land size is small which led to the use of chemical fertilizers and animal manure intensity to high levels (BezabihEmana and Hadera Gebremedhin. 2007). The farmers of the area also produce onions from unknown seed sources, which have small bulb sizes with low bulb yields. About 31% of vegetable producing Hararghe farmers used local varieties and improved varieties needed to produce the desired product are said to be unavailable. The principal aims of bulb crops storage are to maintain the ‘quality capital’ present at harvest and to satisfy consumer demand for extended availability of bulbs of satisfactory quality (Gubb and Tavis, 2002). Farmers store onion bulbs in their living house immediately after harvest without curing and shortly they sell bulbs cheap due to the surplus of the onion bulbs in the markets. Generally, a better understanding of the nitrogen fertilizer requirements of onion is needed in order to develop management strategies, which optimize fertilizer use of the crop. Moreover, improved varieties and fertilizer management for onions may help improve quality, particularly bulb size and storability, and thus offer growers premium prices. It was assumed that onion varieties would vajy in their responses to nitrogen fertilization levels. It is important to investigate the nitrogen fertilizer requirement of the onion varieties at the area and justify its effect on the storage life of onion. Therefore, field experiment was conducted with the objective of investigating the effects of nitrogen fertilizer rates on plant growth, bulb yield and shelf-life of onion varieties.Materials and MethodsDescription of the Study Area: A field study was conducted under rain fed conditions at Fedis Agricultural Research Center (FARC) at Boke sub-site. The sub-site is geographically located at the latitude of 9° 07? and longitude of 42° 04'E at an altitude of 1702 meters above sea level. The area is situated at a distance of 24 km north of Harar city. The soil of the experimental site is black with surface
162

Oromia Agricultural Research Institute (IQQO), Crop research Proceeding 2017
soil texture of sand clay loam that contains 8.2% organic matter, 0.13% total nitrogen, 4.99ppmavailable phosphorus, 1.68Cni0|(+) kg' soil exchangeable potassium and a pH value of 8.26. It received mean annual rainfall of 860.4mm in the last five years. The area is characterized by a bimodal rainfall distribution pattern andmaximum rain received from April to June while irregular and erratic rains are received from August to October. The mean maximum and minimum annual temperaturesof the area are 27.7 andl 1.3°c, respectively, for the past five years (Fadis Agriculture Research Center Metrological Station, 2015 unpublished).Experimental Materials, Treatments and Designs: The experiment was composed of factorial combinations of three improved varieties of onion namely Adarna Red. Nasik Red, and Bombay Red) five nitrogen fertilizer rates (0, 50, 100. 150, and 200 kg ha’1) and arranged in a randomized complete block (RCB) design with three replications during 2014 cropping season. Each treatment combination was assigned randomly to experimental units within a block. The gross plot size of each experimental plot was 2m long and 3m wide (6m') and net plot size of 4.8nr was used for data collection.All the seeds of the onion varieties were sown on well prepared seed beds to raise seedlings on a 5tn long and 1,2m wide 'aised beds in 5cm spaced rows. Watering and weeding of seedling at nursery were carried out manually. Single row transplanting of onion seedlings was used at a spacing of 20cm and 10cm between rows and plants, respectively after seedlings grown to 3 to 4 leaves reaching height of 12 to 15 cm five weeks after sowing. Only disease free and uniform seedlings were transplanted. Nitrogen was side dressed in the form of Urea (46% N) in two splits of equal amounts 3 and 6 weeks after transplanting depending on the specified rate. Experimental plots were supplemented with irrigation at transplanting and two weeks after transplanting due to shortage of rainfall. All other agronomic and cultural practices were uniformly applied to the treatments as per recommendations. Plants in the middle eight rows were considered for recording data. Plants on the border rows and at both ends of each row were also excluded to avoid border effects.A storage experiment was also conducted after harvesting. Bulbs from each treatment were cured for five days and subjected to storage treatments in clean and cemented room on wooden shelf used for storage. Onion bulbs of uniform size numbering 200 were obtained from each treatment and stored. The onion bulbs were stored for three months at average maximum and minimum temperatures of 29.4°c and 8.6°c, respectively at mean relative humidity of 40.3 percent.Data bulbon bulb weight loss were recorded at 10 days intervalfor 90 days of storage period.Data CollectionDays to maturity: The number of days required to reach physiological maturity was recorded when most leaves dried and fell off. Onion is considered to be matured when the leaves become senesced and fallen off.Number of leaves per plant: Number of leaves per plant was recorded at maturity counting from 10 plants samples per treatment.Bolting (% ): Plants that showed flower capes during vegetative growth were counted and calculated as the ratio of bolters per total plants in the plot and the values were expressed in percentage.Bulb dry matter content (% ): The fresh weight of 15 randomly collected mature bulbs of the sample plants was measured and averaged after curing for five days and the average bulb fresh weight was determined and expressed in gram. The randomly sampled fifteen mature bulbs from each plot were chopped to small pieces and samples of 200 g chopped bulbs were sampled for each plot and oven dried at 70°cto obtain percent dry matter after weighing as follows:
163
Oromia Agricultural Research Institute (IQQO), Crop research Proceeding 2017
DW (%) = [(DW+CW)-CWj/l(200gj *100 Where: DW = dry weight; CW = container weight; and F’W = fresh weightMarketable bulb yield (ton ha '): Marketable bulb yield refers to the weight of healthy bulbs ranging from 20g to 160g in weight. Bulbs below 20g in weight were considered too small to be marketed whereas those above 160 g were considered oversized (Lemma and Shimelis, 2003). Accordingly, this parameter was determined from all plants in the central rows at the final harvest.Unmarketable bulb yield (ton ha1): It includes diseased, under size (below 20g in weight), oversize (above 160g in weight) and split bulbs were considered as unmarketable bulbs.Total bulb yield (ton ha'1): To obtain the value of total bulb yield, marketable and unmarketable bulb yields were summed up and expressed in tons ha'1.Stored bulb (Physiological) weight loss (%):Bulb weight loss was determined using samples of 30 bulbs of medium size randomly taken from each treatment. Weight loss of bulbs was recorded in 10 days’ intervals till 90 days of storage period. The physiological weight loss was calculated using the formula:
PfVL (% ) = Initial weieht - Final weieht at I0th intervals * 100 Initial weight
Where: PWL = Physiological Weight Loss Statistical Data AnalysisData were subjected to analysis of variance using the Generalized Linear Model of SAS Statistical Software package (SAS institute, 2003). Means that differed significantly were separated using the LSD (Least Significant Difference) test at 5% probably level of significance.Results and DiscussionThe effect of variety and different nitrogen rates on onion days to maturity, number of leaves and bolting percentagesThe analysis of variance showed that the main effect different rates of nitrogen fertilizer was resulted in statistically significant differences (p<0.05) for onion bolting percentages, however had no effect on plant days to maturity and number of leaves. But, these growth parameters were significantly affected by the main effect of varieties (Table 1). No variety by nitrogen fertilizer rates interaction effect was observed for these parameters. Accordingly, onion varieties with no nitrogen fertilizer application resulted in superior bolting percentage (5.6%) to plants received all the nitrogen fertilizer rates. The result showed, high amount of nitrogen fertilization (200 kg ha ) resulted in reduced bolting (3.8) percentage. The analysis indicated increasing the rate of nitrogen fertilizer from nil up to 50 and 100 kg N ha'1, reduced bolting percentage by 18 and 23%, respectively compared to the no fertilizer treatment. Similarly, increasing the rate of nitrogen fertilizer further to 150 and 200 kg N ha'1 reduced bolting percentage by 27 and 32%, respectively compared to control (Table l).The result of this study confirmed the findings of Abdissae/ al. (2011) who reported the proportion of onion bolters decreased by about 11 and 22% in response to the application of 69 and 92kg N ha !. respectively compared to no fertilizer application. Considering the main effects of varieties, Nasik red matured later than (131.9 days) the other two varieties while variety Bombay red significantly matured earlierthan Nasik red and Adama red varieties by 19 and11 days, respectively. (Table 1). This result is in line with the report of MandefroNigussieef al. (2009), who indicated differences in maturity periods of the tested varieties.The highest mean number of leaves were recorded for Nasik red and Bombay red varieties.Both varieties exceeded Adama Red by 18 and 22%, respectively in number of leaves produced. Adama red and
164
Oromia Agricultural Research Institute (IQQO), Crop research Proceeding 2017
Bombay red varieties achieved the highest mean percentage of bolting (Table 1). This showed that bolting is a genetic characteristic in addition to being under the influences of different agronomic practices such as nitrogen application The onion genotypes also differ in ease of seed stalk development and kinds of physiological defects like pre-mature bolting (MandefroNigussieef al., 2009).The effect of variety and different nitrogen rates on onion days to maturity, number of leaves and bolting percentagesThe analysis of variance showed that the main effect different rates of nitrogen fertilizer was resulted in statistically significant differences (p<0.05) for onion marketable bulb yield.However, percent bulb dry mater content, unmarketable and total bulb yields were not affected. In contrary, the main effect of variety resulted in statistically significant differences (p<0.05) for percent bulb dry mater content, unmarketable and total bulb yields (Table 2). But, no variety by nitrogen fertilizer rates interaction effect was observed for these parameters. Accordingly, the highest bulb dry mater content was recorded for Nasil Red variety which achieved 9 and 15% more percentage of bulb dry content than Adama Red and Bombay red varieties, respectively. This finding is in line with that MandefroNigussiee/' o/.(2009) who also indicated that onion bulb dry contents are attributes of varietal differences.Similarly, significant (P < 0.01) difference was observed among the three varieties in marketable, unmarketable and total bulb yields. Variety Bombay Red was the highest in total and marketable bulb yields than Adama Red and Nasik Red. Bombay Red exceeded Adama and Nasik Red by 8% in total bulb yield, and also higher than the two varieties by 7 and 8% in marketable bulb yield respectively. The onion bulb yields also attributed due to the varietal differences. This result was in line with the study of Gautame/ al. (2006) who reported that the mean highest bulb yield differs among different onion varieties and genotypes.The effect of variety and different nitrogen rates on stored bulb physiological weight loss The analysis of variance showed that application of different rates of Nitrogen fertilizer significantly affected (p<0.05) bulb weight losses starting 30 days after storage was made and for the rest storage times. But, stored bulb weight loss was not affected by the different Nitrogen fertilizer rates the first 20 days of storage period. Variety significantly (P < 0.05) affected bulb weight loss at storage periods of 10 and 20 days. Bulb weight loss increased by 18 to 23% as number of storage periods increased from 30 to 90 days for onion bulbs received the maximum N-fertilizer rate (200 kg ha'1) compared to bulbs obtained from no N-fertilizer application (Table 3). Increasing nitrogen rate from nil to higher rates linearly increased stored bulb weight loss throughout all the storage periods. At early storage periods, variety Adama Red had 11.8 and 12% bulb weight losses over Bombay Red at 10 and 20 days after storage, respectively (Table 3). However, stored bulb weight loss among the varieties did not differ significantly as the storage period was prolonged beyond 20 days. This result is in conformity with findings of Kospell and Randle (1997) who reported loss in variety dehydrator ‘Number 3’ and cultivar ‘Granex 33’ during the first month of storage, which was gradual weight loss with increased storage time.The changes in the chemical composition of bulbs can accelerate or inhibit certain physiological processes (Jurgel- Malocka and Suchorska-Orlowska, 2008), and significantly affect the bulb shelf life.Conclusion and RecommendationsOnion is the most important crop grown in eastern part of Ethiopia by smallholder farmers. Farmers produce onion from seeds of unknown sources ending with small bulb size with low bulb yield harvests. They apply different Nitrogen fertilizer rates where thre was no recommendations so far. Fedis district of east Hararghe zone where onion is grown is categorized as lowland, where suboptimalNitrogen fertilizer
165

Oromia Agricultural Research Institute (IQQO), Crop research Proceeding 2017
application was expected to improve the bulb yield and postharvest quality of onion due to low moisture conditions of the soil. Therefore, improved varieties and Nitrogen fertilizer management might help increase in bulb yield, bulb quality, particularly bulb size and storabilitv, and thus offer growers premium prices.This study generally confirmed that application of higher Nitrogen fertilizer roses of 150 and 200 kg N ha' 1 did not significantly improve number of onionleaves, days to plant physiological maturity, percent bulb dry water content, marketable bulb yields, and highly reduced the shelf life of stored dried bulbs compared to application of 100 kg N ha" But, application of 50 and 100 kg N ha'1 significantly reduced physiological dried bulb weightloss and resulted in significant increase of marketable bulb yields. The study also identified Bombay Red onion variety to be recommended for its high total and marketable bulb yields, early maturity and superior storage shelf life quality over the other two varieties. Therefore, Bombay Red variety with application of 50 to 100 kg N ha' 1 can be recommended to onion growing areas of Fedis and similar environments in east Hararghe zone of Oromia National Regional State.Table I. The main effect of nitrogen fertilizer rates and varieties on days to maturity, number of leaves per plant and bolting of onion varieties
Nitrogen rate (kg ha'1) Days to maturity Number of Leaves Bolting (% )0 120.30 8.00 56.0a50 120.80 9.89 45.8b100 121.60 9.22 43.2bc150 122.80 10.22 40.8cd200 124.00 9.56 38.0d
LSD (0.05) NS NS 0.48Varieties
Adama Red 120.50b 8.00b 45.7aNasik Red 131.90a 9.80a 40.8b
Bombay Red 113.30c 10.27a 47.8aLSD (0.05) 2.41 1.24 3.1
CV (% ) 2.60 17.70 11.2NS: nonsignificant. Means with the same letters in a column are nonsignificant at 5% probability level.
166

Oromia Agricultural Research Institute (IQQO), Crop research Proceeding 2017
Table 2. The main effect of nitrogen fertilizer rates and varieties on percent bulb dry mater content, marketable, unmarketable and total bulb yields of onion varieties
Nitrogen rate (kg ha'1)
Bulb Dry Mater Content (% )
Marketable Bulb Yield (ton ha'1)
Unmarketable Bulb Yield (ton ha’1)
Total Bulb Yield (ton ha'1)
0 13.05 223 0b 5.62 28.1250 13.68 24.02ab 5.58 29.6100 13.97 24.25a 5.12 29.37150 14.58 24.93a 5.27 30.2200 14.88 23.37ab 5.38 28.75
LSD (0.05) NS 0.95 _ NS NSVarieties
Adama Red 13.87b 23.35b 5.10b 28.45bNasik Red 15.12a 23.08b 5.23b 28.31b
Bombay Red 13.11b 25.00a 5.87a 30.87aLSD (0.05) 1.13 0/74 0.31 o t T
CV (% ) 10.80 7.00 9.09 5.90NS: nonsignificant. Means with the same letters in a column are nonsignificant at 5% probability level
Table 3. The main effect of nitrogen fertilizer rates and varieties on percent bulb weight losses of onion varieties
Treatments Percentage of Bulb Weight Loss Across Storage periods
Storage Periods (Days)10 20 30 40 50 60 70 80 90
Nitrogen Fertilizer Rates (Kg H a1)0 1.38 1.96 2.27b 2.55b 2.91c 3.24d ~T.76d 4.10d 4.46d50 1.33 1.91 2.36b 2.79b 3.24ab 3.71c 4.12c 4.51c 4.88c100 1.31 1.88 2.37b 2.82b 3.33b 3.87bc 4.34bc 4.74bc 5.11 be150 1.32 1.93 2.44b 2.90b 3.54ab 4. Bab 4.58ab 5.00ab 5.32b200 1.38 2.06 2.77a 3.25a 3.88a 4.430a 4.90a 5.250a 5.60aLSD (% ) NS NS 0.33 0.34 0.37 0.36 0.32 0.31 0.28VarietiesAdama Red 1.44a 2.09a 2.49 2.86 3.38 3.85 4.37 4.8 5.18Nasik Red 1.33ab 1.92ab 2.44 2.85 3.35 3.86 4.3 4.67 5.02Bombay Red 1.27b 1.83b 2.39 2.88 3.42 3.92 4.35 4.69 5.02LSD (% ) 0.12 0.18 NS ~NS NS NS NS NS NSCV (% ) 12 12.5 14.1 12.5 11.3 9.6 7.8 6.8 5.7NS: nonsignificant. Means with the same letters in a column are nonsignificant at 5% probability level.
167

AcknowledgementsThe authors are greatly indebted to the Oromia Agricultural Research Institute for funding the research.We are also most grateful to Amsalu Wegari and Adane Ashebir for their involvements in field datacollection. Our heartily thanks also go to Prof. Nigussie Dechasa and Tamado Tana (PhD.) for theirconstructive comments and suggestions for the success of this research experiment.ReferencesAbdissa Y., Tekalign T., and Pant L.M., 2011. Growth, bulb yield and quality of onion (Allium
cepa L.) as influenced by ritrogen and phosphorous fertilization on vertisol. African Journal of Agricultural Research, Vol. 6( 14), pp: 3252 - 3258.
BezabihEmana and Hadera Gebremedhin, 2007. Constraints and opportunities of horticulture production and marketing in Eastern Ethiopia. DCG Report No. 46, Norway. Internet: http://www.drylands- group.org, Accessed on September 2014.
Gautam I.P., Khatri B., and Paudel G.P., 2006. Evaluation of different varieties of onion and their transplanting times for off-season production. Nepal Agricultural Research, Vol. 1. Palpa, Nepal.
Jurgel-Malocka G„ and Suchorska-Orlowska. J., 2008. The effect of nitrogen fertilization on content of microelements in selected onions. Journal of Elemental 13(2):227—234.
KebedeWoldetsadik, 2003. Shallot (Allium cepc var. ascolonicum) response to plant nutrients and soil moisture in a sub-humid fooica! climate. Doctoral dissertation. Swedish University of Agricultural Sciences, Alna'p.
Kopsell D.E., and Randle W.R., ’997. Onion cultivars differ in pungency and bulb quality changes during storage. Horticultural Sciences, 32: 1260-1263.
Lemma D., and Slvmelis A., 2003. Research Experience in Onion Production. Research Report Number, 55, EARO, Addis Ababa Ethiopia.
Maini S.B., and Chakrabarti A.K., 2000. Post-harvest management of onions andgarlic.Souvenir,National symposium on onion and garlic production and postharvestmanagement: Challenges and Strategies, 19-21 November 2000, National Research Centre for Onion and Garlic, Raigurunagar, Nasik, pp. 25-32.
Mandefro N., Ante.neh G., Chimdo A., and Abebe K., (eds). (2009). Improved technologies and resource management for Ethiopian Agriculture. A Training Manual. RCBP-MoARD, Addis Ababa. Ethiopia.
Olsen R.A., and Kurtz L.T.. 1982. Crop nitrogen requirements, utilization and fertilization, pp.567- 604. In: F.J, Stevenson (ed.). Agronomy. Nitrogen in Agricultural Soils. Madison. Wisconsin, USA.
SAS his itute. 2003. Statistical Analysis Software (SAS) user’s guide Version 9.2. SAS Institute, Inc., Cary, NC, USA. Onion: Queer, of the kitchen. Kisan World, 3(12): 32-34.
Oromia Agricultural Research Institute (IQQO), Crop research Proceeding 2017 _______
168

Oromia Agricultural Research Institute (IQQO), Crop research Proceeding 2017
Determination of Intercropping Proportion in Maize for Moisture Stress Environments of Borana, southern Ethiopia
Natol Bekeie1, Tolasa Taye1 and Yonas Shimelis''Yabello Pastoral and Dryland Agricultural Research Center, P.O.Box 85. Yabello
AbstractMaize and common bean intercropping is one of the most commonly used agronomic practices in Ethiopia where maize and the legume are predominantly produced. Intercropping is the production of two or more crops simultaneously in both space and time. Field studies were conducted at Yabello Pastoral and Dry Land Agricultural Research Center on-station during 2011 and 2012 cropping seasons to identify the most productive and profitable maize and common bean intercropping arrangements suitable for moisture stress environments of Borana. The experiment was laid out in randomized complete block (RCB) design with three replications in both cropping seasons. The experiment used seven treatments consisting of three maize and common bean intercropping arrangements namely planting single, double and three rows of common bean between two maize rows, sole stand of both crops, broadcasting common bean under row planted maize, and farmers' practices (broadcasting of both crops mixtures) -to be used as a check for comparison. The results of the pooled mean analysis revealed statistically significant differences among the different maize and common bean intercropping arrangements, the usual farmer practices and sole production systems of the crops. These maize and common bean arrangements resulted in 28.5%, 27.1% and 21% more yields than independent sole production of maize, respectively. Sim ilarly, these three arrangements recorded 91.6%, 89.6% and 80.6% more total yields than producing sole common bean, respectively. Intercropping one and two rows of common bean between two maize rows and broadcasting the legume under row planted maize produced the highest land equivalent ratio (LER) which resulted in i23%. 135% and 108.5% more land equivalent coefficients (LEC) than the minimum acceptable value of 25% for LEC to be profitable and efficient for production of two crops under intercropping systems. The highest monetary advantage index (MAI) were also recorded for these three maize and common bean intercropping arrangements which achieved 58.2%. 62.9% and 52.8% more MAI than sole maize production as well as 41.6%), 45.8%) and 36.8% more MAI than the sole production of common bean, respectively. The results of the two cropping seasons experiments, proved intercropping either one or two rows of common bean between two maize rows increased the land use efficiency, improved the total productivity of a given unit area of land and resulted better economic returns. Therefore, any of these maize and common bean intercropping combinations can be recommended for moisture stress environments of Borena and similar agroecologies of southern Oromia.Keywords: arrangement, intercropping. LER. LEC. MAI. sole cropping IntroductionMaize (Zea mays L.), is the third most important cereal crop after wheat and rice in the world (FAO,2015). Maize exceeds all other cereal crops in terms of annual production and productivity in Ethiopia (CSA, 2016). Common bean (Phaseolus vulgaris L.) is one of the most important and widely cultivated species of bean in in Ethiopia. Both maize and common bean play key role in human nutrition and improved livelihood through improving household income for small and large scale farmers. Maize also supplies large amounts of energy and when fail to mature provides high quality feed for animals (Dahmardeh et al., 2009). Common bean is considered as the main cash crop and a protein source of the farmers in many low lands and mid altitude environments of Ethiopia (Rahmeto. 2007).Intercropping is a commonly used agricultural cropping practice and is growing of two or more crops simultaneously on the same field in both time and space (Thobatsi, 2009). It is considered one among the many crop intensification strategies to increase agricultural productivity per unit area of a given land. The principal
169

Oromia Agricultural Research Institute (IQQO). Crop research Proceeding 2017
reasons for farmers to intercrop crops are flexibility, profit maximization, risk minimization against crop failure, soil conservation and maintenance, weed control and balanced nutrition (Ofori et al., 2014).One way towards better fanning is to look for the most effective associated cropping systems of legumewith non-leguminouscrops(Berglund, 2004). Maize and legume intercropping has become one of the solutions for food security among small scale maize producers. In most intercropping systems, growth and yield of legumes are usually suppressed by the dominant crop (Tamiru, 2013). The overall arrangement and the relative proportion of component crops are important in determining yields and production efficiencies of cereal and legume intercrop systems (Zardari et al., 2013). Studies showed that mixtures of cereals and legumes produce higher grain yields than sole cropping systems (Dapaah, 2003).The vigor of a given crop in any production system in Ethiopian is governed by the amount and distribution of rain. In moisture stress areas like Borana lowlands, shortage and erratic distribution of rain has a direct effect on the amount of available food. Droughtis a significant and a common phenomenon in these areasand crop stability is a challenging for fanners in the environment. Two of among the many ways to overcome these challenges are useof drought tolerant crops and best agronomic practices particularly intercropping of maize andcommon bean which has become one of the solutions for food security among small scale maize producers (Thobatsi, 2009). In most part of Borana lowland environments, traditionally maize and common bean combination has been practiced by small scale farmers growing to increase total productivity of a given area of land. Most farmers practice broadcasting of both crops mixtures without knowing the negative effect of the association system when the population of the crops increase beyond the optimum plant population per hectare. Therefore, experimental research was developed to identify the best and optimum maize and common bean intercropping systems that can increase productivity, land use efficiency and in turn improve income from a given area of land in moisture stressed environments of Borena, sothem Oromia.Materials and Methods Decry ption of the Study AreaResearch experiments were conducted at Yabello Pastoral and Dtyland Agricultural Research Center on station for two consecutive cropping seasons in 2012 and 2013. Geographically the research center is located 563km south of Addis Ababa. It liesat 04° 52' 49" and 038° 08' 55" latitude and longitude, respectively, at 1656meters above sea level. The soil of the experimental area is characterized as well- drained sandy loam (46% sand, 36% silt and 18% clay), with 7.03 pH value. It has 0.026% total nitrogen, 15.36ppm Phosphorus and 20.4 meq of/lOOgm soil cation exchange capacity(CEC). The total annual rainfall and average temperature in 2011 and 2012 were 851.6mm and 719.0mm; and 19.3°c and 20.6°c, respectively. The major annual crops grown in the study area are maize (Zea mays L.), common bean (Phaseolus vulgaris L.), tef (Eragrostis tef L.) wheat ( Triticum aesvivumL.) among which maize and common bean being the predominant and staple food crops in the area and Borena zone in general. Experimental Materials and DesignSeven treatments consisting of three maize and common bean intercropping anangements namely planting single, double and three rows of common bean between two maize rows, sole stand of both crops, broadcasting common bean under row planted maize, and farmers' practices (broadcasting of both crops mixtures) -to be used as a check for comparison. The experiment was laid out in a Randomized Complete Block (RCB) design with three replications. Open pollinated maize variety (OPV) Melkassa-1
170
Oromia Agricultural Research Institute (IQQO), Crop research Proceeding 2017
andcommon bean variety Omo-95 were used for this experiment Recommended 75 and 25cm intra and inter-row spacing, respectively were used for maize planting in all treatments except for the farmers’ practices where broadcasting was used. The common bean was planted between two maize rows of intercropping treatments at 10cm spacing between plants.Data and Profitability Analysis: Analyses of variance(ANOVA) was computed using SAS computer software version 9.2 (SAS, 2002). Treatment means were separated using least significant difference method (LSD) at 5% probability level for statistically different means.(Goinez and Gomez,: 984).Analysis of productivity and economic benefits were also done using land equivalent ratio (LER) to access yield and land use efficiency of the different intercropping practices compared to sole production of both crops. The LER values were computed using the formula described by Willey (1991).
LER = Yab/Yaa + Yba/Ybb;Where, Yab\s yield per unit area of a crop in intercrop (maize), Yaa is yield per unit area of sole crop (sole maize), Yba is yield per unit area of crop b (common bean) in intercrop. Ybb is yield per unit area of sole crop b (common bean).In addition, land equivalent coefficient (LEC)was calculated according to Ashenafi (2016) as follows;
LEC=LERm *LERcb;Where, LERm-hnd equivalent ratio of maize and LERhb= land equivalent ratio of common bean Similarly, monetary advantage index (MAI), an important index used to access the profitability of the yield obtained from maize and additional common in intercropping cropping systems compared to the usual independent sole production of the crops. Therefore, the monetary advantage index (MAI) was calculated according to (Mahapatra, 2011).
MAI- Mm+Mcb; Mm -Pm*Ym;Mcb = Pcb*Ycb MAI = (Pm*Ym) + (Pcb*Ycb)
Where, Pm=price of maize; Ym=yield of maize; Pcb=price of common bean; Ycb=yield of common bean The market prices of maize and common bean seeds per kg in Birr was collected from the Yabello grain markets during the cropping seasons. Accordingly, market prices of 6 and 10 Birr kg' for maize and common bean, respectively were used to compute the MAI for the cropping seasons.
Results and DiscussionEffect of intercropped common bean arrangements on maize yield and yield componentsvnalysis of variance showed statistically significant differences (Table 2) among treatments for maize ear
length, ear diameter, plant height and maize grain yields(p<0.05) across cropping seasons. But thousand maize seed weight showed statistically no difference among all the treatments. The highest maize ear length, ear diameter and maize grain yield were obtained from sole maize production system while all maize plots received different common bean arrangements statistically resulted in superior plant heights to broadcasted maize and common bean mixtures.This implies all the common bean arrangements in maize and common bean intercropping systems 'educed the ear length, ear diameter and grain yield of maize compared to sole maize production system. rhis result is similar to the results (Tolesa et al., 2016; Natol et al., 2017) who also reported reduced yield and yield components for different maize genotypes when intercropped with legumes in moisture stressed areas. These authors indicated that this might be due to the change in synergy of the two crops to compete ior the limited availability of moisture under such environments. These results were also further justified
171

Oromia Agricultural Research Institute (IQQO), Crop research Proceeding 2017
by Hailu et al. (2015), who reported a contrast result in adequate moisture areas under maize-tomato intercropping.Combined analysis of variance over cropping seasons showed statistically significant difference (p<0.05) for maize grain yield among the different maize and common bean arrangements under intercropping and sole production system (Tables land 2). The highest total grain yieldswere obtained when one, two and three rows of common bean were planted between two maize rows. Intercropping two rows of common bean in maize resulted in average total grain yields of 5.73t ha‘followed by 5.671 ha 'and 5.121 ha'when two and three rows of the food legume was intercropped in maize, respectively ensuring land use efficiency compared to independent sole production of both crops.Productivity and Benefit of Maize and Common Bean IntercroppingLand equivalent ratio (LER): Land equivalent ratio (LER) is the relative area of land required to produce a given sole crop to produce yields achieved through intercropping. The result of the analysis showed that total and pooled mean LER across and over cropping seasons, respectively were greater than one for all maize and common bean combinations (Table 3). The highest total and pooled mean LER were obtained from intercropped maize with one and two rows of common bean across and over cropping seasons.These results indicated that intercropping of common bean and maize increased the land use efficiency than producing both crops independently which might contribute much to the production of more yield from a given unit area of land through intensification. Similar results were reported by Hirpha (2014) and Ashenafi (2016) who also obtained higher land equivalent ratio for maize and common bean intercropping.Land equivalent coefficient (LEC): Under intercropping production system, the minimum acceptable land equivalent coefficient is 25% (Adetiloye et al., 1983) with values exceeding 25% indicating greater land use efficiency and yield advantage over sole crop production systems. Accordingly, the result of this study showed that all the maize and common bean combinations resulted in more than 25% LEC with the minimum value recorded for broadcasting both crops mixtures; the farmer practice while the highest was recorded for intercropping two rows of common bean between two maize rows (Table 3). This result is in line with the finding of Yesuf (2003); Egbe (2005); Ashenafi, (2016) and Belstie et al. (2016)who obtained LEC values greater than the minimum acceptable limit in their studies of intercropping maize with different legumes.Monetary advantage index (MAI): Analysis of MAI values showed increased monetary values for maize and common bean combinations compared to sole and farmers’ practices production systems (Table 3). Particularly higher MAI were found when one and two rows of common bean intercropped in maize as well as broadcasted common bean under row planted maize. The result of this study is in line with other similar research results (Yilmaz, (2008); Ashenafi. (2016) and Belstie et al. (2016) who also found higher monetary advantage index for maize and legume intercropping systems.Conclusion and RecommendationsThe pooled means showed the highest significant land equivalent ratio, land equivalent coefficient, monetary advantage index, and total yield could be achieved through intercropping one and two common bean rows between two maize rows in moisture stress area of Yabelo, souther Oromia. Besides, crop intensification through intercropping of maize and common bean in moisture stress environments can reduce the down side risk of crop failure especially in short rain fall seasons. Therefore, from the two cropping season experimental results, intercropping one or two rows of common bean rows between two
172

Oromia Agricultural Research Institute (IQOO). Crop research Proceeding 2017
maize rows can be recommended for increased total yield per unit area, land use efficiencies and monetary advantages.
Table I . The effect of different proportion of intercropping common bean in to maize on grain yields of maize and common bean across cropping seasonsTreatment 2012 2011
Grain Yields (t ha'1) Grain Yields (t ha'1)Maize Common
beanTotal Maize Common
beanTotal
Sole Maize 4.51 0.00 4.51 4.41 0.00 4.46Sole Common bean (CB) 0.00 3.13 3.13 0.00 2.85 2.99
CB row between 2 maize rows 3.91 1.95 5.86 3.65 1.98 5.732 CB rows between 2 maize rows 3.38 2.50 5.88 3.17 2.29 5.673 CB rows between 2 maize rows 3.11 2.03 5.14 2.93 2.16 5.12Maize in row and CB broadcasted 3.38 2.30 5.68 3.17 1.95 5.40Both Maize and CB broadcasted 2.39 2.11 4.5 2.19 1.91 4.30CB=common beanTable 2. Combined mean yield and yield components of maize as affected by different proportion of intercropping common bean in to maize (pooled data of two years)Treatments ED (cm) Ell (cm) EL (cm) PH (cm) TSW (g) Total yields (t ha'1)Sole maize 4.55a 47.51 a 13.76a 130.250a 283.05a 4.46b1 CB row between 2 maize rows 4.25bc 47.10a 11.52b 122.39ab 291.08a 2.99c2 CB rows between 2 maize rows 4.03c 52.10a 10.62bc 118.37ab 279.41a 5.73a- CB rows between 2 maize rows 4.32b 50.78a 13.390a I24.68ab 281.84a 5.67aMaize in row and CB broadcasted 3.75d 46.73ab 10.79bc 119.60ab 290.74a 5. labBoth Maize and CB broadcasted 3.8cd 38.430b 9.64c 105.32b 281.10a 5.4abMean 4.13 47.11 11.62 116.64 284.53 4.81LSD *** ** *** *** ns ***Means with the same letters within a column are not significantly different■ S's non -s lgn i/ico nf and ** significant at p<0 05. [W=degree o f
reedom. EL =Ear ength, EH=ear height. E D E a r diameter. PH Plant height, and TSW = Thousand seed weight; ( B Common bean
173

Oromia Agricultural Research Institute (IQQO), Crop research Proceeding 2017
Tabic 3. The effects ol intercropping different proportion of common bean in to maize on productivity and benefit of maize and common bean production
Treatments Cropping Seasons Cropping Seasons Cropping Seasons Cropping Seasons Pooled mean___________ 2012_______________________ 2011___________ 2012 2011
Grain Yields (t/ha) Grain Yields (t/ha)Maize Common Total Maize Common
bean beanMaize sole 4.51 0 4.51 4.41 0Sole Common bean (C B ) 0 3.13 3.13 0 2.851 C B row between 2 maize rows
3.91 1.95 5.86 3.65 1.98
2 C B rows between 2 maize rows
3.38 2.5 5.88 3.17 2.29
3 C B rows between 2 maize rows
3.11 2.03 5.14 2.93 2.16
Maize in row and CB broadcasted
3.38 2.3 5.68 3.17 1.95
Both Maize and C B broadcasted
2.39 2.11 4.5 2.19 1.91
Total LER(Maize)
LER(CB)
LER(Total)
LER(Maize)
LER(CB)
LER(Total)
LER M Af LEC
4.46 - - - - - - - 26760 -
2.99 - - - - - - - 29900 -5.73 0.86 0.62 1.48 0.82 0.69 1.51 1.495 42330 0.56
5.67 0.74 0.79 1.53 0.71 0.80 1.51 1.520 43600 0.59
5.115 0.68 0.64 1.32 0.66 0.75 1.41 1.365 39070 0.48
5.4 0.74 0.73 1.47 0.71 0.68 1.39 1.430 40900 0.52
4.3 0.52 0.67 1.19 0.49 0.67 1.16 1.175 33840 0.35
174
Oromia Agricultural Research Institute (IQQO), Crop research Proceeding 2017
ReferencesAdetiloye P.O., F.O.C., Ezedinmaand B. N. Okigbo, 1983. "A land equivalent coefficient (LEC)
concept for the evaluation of competitive and productive interactions in simple to complex crop mixtures." Ecological Modelling, 19, No. 1 (1983): 27-39.
Ashenafi N.A., 2016. Advantages of Maize-Haricot bean Intercropping over Sole Cropping through Competition Indices at west Badewacho woreda, Hadiya Zone, SNNPR. cadeyw/c Research Journal of Agricultural science and research. 4(1): 1-8
Belstie L., Walelign W., and Sheleme B „ 2016. Determinations of Haricot Bean (Phaseolus vulgaris L.) Planting Density and Spatial Arrangement for Staggered Intercropping with Maize (Zea mays L.) at Wondo Genet, Southern Ethiopia. Academic Research Journal of Agricultural science and researchA(6), 297-320
Berglund P., 2004. Farming practices and crop production (No. 04: 2).CSA (Central Statistical Agency of Ethiopia), 2016. Accessed on June, 18. 2017Dahmardeh M., Ghanbari A., Syasar B.A., and M. RAMROD!, 2009. Effect of inter-cropping maize
with cowpea on green forage yield and quality evaluation. Asian Journal of Plant Science 8:235-239.
Dapaah H.K., Asafu-Agyei J.N., Ennin S. A., and Yamoah C., 2003. Yield stability of cassava, maize, soya bean and cowpea intercrops. The Journal of Agricultural Science, 140{ 1), pp.73-82.
Egbe O.M., 2005. Evaluation of agronomic potentials of some pigeon pea genotypes for intercropping with maize and sorghum in Southern Guinea Savanna. PhDdissertation, University of Agriculture, Makurdi, Nigeria.
FAO (Food and Agricultural Organization), 2015. Food and Agriculture Organization. Gomez A., and Gomez A., 1984. Statistical procedures for agricultural research. 2nd ed., Willey J. and Son I., New York, USA, PP: 97-107
Hirpa T., 2014. Effect of Intercrop Row Arrangement on Maize and Haricot Bean Productivityand the Residual Soil. Global Journal of Science Frontier Research, 14(A).
Mahapatra S.C., 2011. Study of grass-legume intercropping system in terms of competition indices and monetary advantage index under acid lateritic soil of India. American journal of experimental agriculture, 1( 1), pp. 1 -6.
Natol Bakala Hundera. Birahanu Abate and Mandefro Nigussie, 2017. Standard Heterosis of Maize (Zea maysL.) Inbred Lines for Grain Yieldand Yield Related Traits at Southern Ethiopia, Hawassa. American-Eurasian J. Agric. and Environ. Sci., 17 (3): 257-264.
Ofori E., Oteng-Darko P., Berchie J.N., Nimako F.O., Yeboah S., and Danquah E.O., 2014. Monitoring of soil moisture regime and w'ater use efficiency under maize cowpea cropping system. Int. J. Curr. Microbiol. App. Sci, 3( 10), pp.837-848.
Rahmeto N., 2007. Determinants of Adoption oflmproved Haricot Bean Production Package in Alaba Special Woreda. Southern Ethiopia.
SAS Institute, 2002. Statistical Analysis Software (SAS) user’s guide Version 9.2. SAS Institute, Inc., Cary, NC, USA.
Tamiru H., 2013. Maize productivity as affected by intercropping date of companion legume crops. PeakJ. Agric. Sci. l(5):70-82.
Thobatsi T.J., 2009. Growth and Yield Response of Maize (Zea mays L.) and Cowpea (Vigna Unguiculata L.) In Intercropping System. Masters Dissertation. University Of Pretoria.
175

Oromia Agricultural Research Institute (IQQO), Crop research Proceeding 2017
Tolessa Taye, Natol Bekeie and Yonas Shimalis, 2016. Evaluation of highland maize at Buie hora District of Southern Oromia, Southern Ethiopia. African Journal of Agricultural Research, 11(34), pp. 3178-3181.
Willey R.W., 1991. Evaluation and presentation of intercropping advantages. Experimental Agriculture.21:119-123.
Yesuf M., 2003. Effects of planting arrangement and population densities of haricot bean on the productivity of sorghum/haricot bean additive mixture. M.Sc. Thesis, Alemaya University.Pp.57.
Yilmaz §., Atak M., and Erayman M., 2008. Identification of advantages of maize-legume intercropping over solitary cropping through competition indices in the East Mediterranean Region. Turkish Journal of Agriculture and Forestry, 32(2), pp. 111-119.
Zardari M.A., Jung L.T. and Zakaria M.N.B., 2013. Hybrid Multi-cloud Data Security (HMCDS) Model and Data Classification. In Advanced Computer Science Applications and Technologies (ACSAT), 2013, pp. 166-171. IEEE.
Yield Improvement of Finger Millet due to Blended Fertilizers at Bako and Gute' Fufa Anbessa, Dagnachew LuleMagarsa Kebede.Zarihun Ababe.Magarsa Dabala, Gudeta Badada.
Kebede Desalagn.Girma Chemeda.Chamada B. and Hailu F.'Bako Agricultural Research Center. P.O.Box -West Shoa, Ethiopia.
E-mail:AbstractFinger millet (Eleusine coracana (L.) is an important crop in Ethiopia and other African countries due to its drought tolerance and nutritive value. It is widely cultivated and used in Ethiopia in dry land areas of the countiy that may be its origin and diversity. A field experiment was conducted to determine optimum nutrient requirement o f finger millet for maximum economic yield. It was on sandy loam soils at Bako Research Center on station and Gute Sub-station for two years in 2015 and 2016. One finger millet variety (Adis-01) was used as test variety. Three types of fertilizer (NPS, Urea. DAP) were applied at different rates where Borax was uniformly applied across the plots. The result indicates that there is significant difference among the treatments in yield and plant height. At Bako. the highest yield (3801kg/ha) was recorded when the blend of 70kg Urea, 100kg NPS and 6kg borax is applied per hectare. Sim ilarly,at Gute. the highest yield (3642kg/ha) was recorded when the blend o f 90kg Urea, 100kg NPS and 6kg borax is applied per hectare. The economic analysis shows the feasibility of the two treatments hence they are recommended for use in these area and similar agro ecologiesIntroductionFinger millet (Eleusine coracana (L.) is an important crop in dry land of Africa including Ethiopia. It is drought tolerant and high nutritive value crop (Apoorva,K.B. et al.). The crop is also important due to its superior nutritive value and excellent feed in dry lands of East African countries and some parts of Asian countries (Wekha N. et al 2016). It is widely cultivated and extremely adapted in dry lands of Ethiopia and wide range of environment for its efficient nutrition and storage quality (Birhanu Ayalew 2015, Dagnchew et al. 2012). Its origin is considered to be Ethiopia and the highlands of Uganda (Asfaw A. et al, 2011; Dagnachew L. 2012). The crop is also important for its durability in a traditional storage due to small size of its grain that can’t be damaged by storage insects. It is also tolerant to soil nutrient deficiency and can give some yield in degraded soil (Wekha N. et al2016).This does not mean there is no need of nutrients application for good yield of finger millet. It needs good soil fertility for its growth and development. Bekeie A. et al 2016 reported good yield in
176

Oromia Agricultural Research Institute (1000), Crop research Proceeding 2017
fertile soils and in the farm treated with chemical and organic nutrients. Leaching of fertilizer in high rain fall areas is the main problem hence nutrients are insufficient for the plant. Therefore, application of fertilizer for the crop will be a must (Patil S .et al 2015). Even though it is an important crop in Africa with multiple advantages, it is still a lost crop of the continent concerning its management and consumption (Kumarnaik.A.H. et al. 2016). In Africa finger millet growers do not apply fertilizers in their field. The growers in Asia, Sub-Saharan Africa and India grow the crop on marginal land with low nutrient application hence low yield (Patro & Madhuri, 2014). Nutrients are important for the crop even though it is tolerant to nutrient deficiency compared to the other cereal crops. In Ethiopia, its yield is limited bellow 3700kg/ha due to poor crop management such as low or no nutrient application, improved variety, disease management & other pests (CHRISPU O.A. ODUORI 2008).The study was conducted with the objective to determine optimum blended fertilizer rate for finger millet in high rain fall areas of western Oromia.Materials and MethodsThe field experiment was conducted at Bako Agricultural Research Center (on station) and Gute sub site located 250km and 310 km respectively, west of Addis Ababa in East wellega zone. The soils of study areas were sandy loam with texture suitable for finger millet. The experiment was conducted for two years 2015 and 2016 cropping seasons on the two sites. The field experiment was laid in Randomized Complete Block Design in factorial arrangement in three replications. The number of treatments were 18 including one control and the DAP (lOOkg/ha) that was used before in the area for purpose of comparison. The rest treatments were four levels of NPS combined w ith four levels of Urea. Borax fertilizer was mixed with both NPS and Urea as a source of Boron for the crop. The rate of Borax was 6kg/100kg of NPS to avoid plant toxicity.The total number of plot was 54 w ith four harvestable rows of 5m length in each plot. The distance between rows was 20cm and seeds were drilled across the rows. Urea was applied in split ('/2 at planting time and the rest after first weeding). The recently released variety (Adis-01) was used for the experiment. All yield and yield components data such as plant height, number of tiller, number of finger per plant, length of finger, grain yield and straw yields were collected and the data was analyzed using Genstate statistical software.
Result and DiscussionEffect of fertilizer on grain yield: The statistical analysis showed that the plot that received 90 kg Urea, 150 kg NPS and 6kg Borax produced highest average yield (3642kgha ') at Gute while the mixture of 70kg Urea, 100kg NPS and 6kg Borax at Bako produced the highest yield (3801kgha''). The lowest grain yield was recorded in untreated plot. There was significant yield difference among the treatments at both sites. The plots that received 90kg Urea & 100kg NPS,50kg Urea & 150kg NPS,70kg Urea & 1 50 NPS and 50kg Urea & 75kg NPS with mixing of 6kg Borax fertilizer produced the grain yield of 2954kg,2833kg,2755kg & 2562kg per hectare at Gute and 3676, 3581 & 3635 at Bako respectively (Table 1).Plant Height: The statistical analysis showed that there is a highly significant difference among treatments at both sites. The plot that received 65kg Urea & lOOkgDAP showed highest plant height (73.67cm) followed by the plot that received 70kg Urea & I25kgNPS at Gute (Table 1). The plot that received 90kg Urea 125kg NPS with the mix of 6kg Borax fertilizer showed highest plant height (87.7cm) among treatments followed by 50kg Urea & 100kg NPS at Bako.Above Ground Bioniass: Thestatistical analysis showed that there is highly significant difference among treatments. The plot that received 90kg Urea & 125kg NPS blended with 6kgha‘‘ Borax
177

Oromia Agricultural Research Institute (IQQO), Crop research Proceeding 2017
produced 9009kg ha'1 above ground biomass followed by 65kg Urea & 100kg DAP at Gute (Table 1). The plot that received fertilizer 70kg Urea & 100kg NPS blended with 6kg ha'1 Borax produced 24068kgha ‘ above ground biomass followed by 30kg Urea & 125kg NPS, at Bako (Table 1). Generally, the study showed that there was highly significant difference among treatments the two fertilizers Urea and NPS blended with the fertilizer Borax. In the study economic analysis was done for the interaction of the treatments. Therefore, the miture of 90kg Urea with 100kg NPS at Gute and 70kg Urea with 100kg NPS at Bako blended with 6kgha-1 Borax are economically feasible.
NPS per hectare in kg □ 2015 □ 2016
8 2° £ -a to® tJ
L. Q .
Fig.3:-Effect of NPS on yield of finger millet at Gute on station 2015 & 2016 cropping season
Urea per hectare(kg) 12015 I 2016
0322oj £>- CLE 1X3 2 o(JJ INa> o300 rtj 1_____ra >< m i I
Fig.4:-Effect of Urea on yield of finger millet at Gute on station in cropping season of 2015 and 2015
178

Oromia Agricultural Research Institute (IQQO). Crop research Proceeding 2017
Table 1:-Mean of treatments interaction effect grain yield, plant height and above ground biomass at Gute and BakoNo T reatment Treatment rnean/lia(kg)
Urea/ha(kg) NPS/ha(kg) Gute BakoG/yield AGBM Pll G/yield AGBM PM
1 90 150 3642a 8224bcd 66.55bcde 3676ab 21885bc 80.5bcdef2 90 100 2‘)54b 6667fg 63.28efg I6875h 7l).‘)3cdef3 50 150 2833b 8068bcd 70.82abc 3l36de 18455 fg 78.4fgh4 70 150 2755bc 8010bcd 71.08abc 3161de 1891 lfg 79.73bcdef5 50 75 2562cd 7628de 60.42g 3057def 19807ef 82.63bcd6 65 100 2470de 8580ab 73.67a 3581b 21854bc 82.08bcde7 30 150 2357def 8404abc 67.41bcde 3073def 21635bcd 79def8 90 125 2339ef 9009a 69.37abcd 3176de 21818bc 87.7a9 30 125 2334ef 7217ef 63.92efg 3635ab 22562b 77.3fgh10 70 125 2276efg 8179bcd 71,78ab 2532h 18328g 78.7efg11 30 100 2275efg 6602fgh 69.83abcd 3039ef 20547dc 75.22ghi12 70 100 2252fg 7505de 60.7fg 24068a 7X.f*7el'g13 70 75 2204fg 7978bcd 66.47bcde 3235cd 18995 fg 78.75efg14 50 100 2183fg 7824cde 67.79bcde 2935fg 1939 lfg 84.13ab15 30 75 2171% 5949ghi 60.63g 3370c 19922ef 73.4i16 90 75 2117g 5870hi 64.57defg 2798g 19417 fg 74.77hi17 50 125 1678h 5394i 66.03cdef 3396c 20833cde 82.68bc18 0 0 889i 2717 45.87h 1201i 901 Oi 52.97jCv(% ) 7.6 9.1 7.1 5.4 4.9 7.1Lsd 206.3 752.1 5.4 179.9 1 1 12.1 3.7F-prob ** ** ** ** ** **
TabIe2:-Economic analysis of the treatments at Gute
No Urea/NPSB/ Cost Grain/ha Gross Benefit (Birr) Net Benefit Dominance MRR(kg/ha) (ETB) (kg) (birr.)
1 0/0 0 889 7112 71122 30/75 1620 2171 17368 15748 5.33 50/75 1900 2562 20496 18596 10.174 30/100 2020 2275 18200 16180 D5 70/75 2180 2204 17632 15452 D6 50/100 2300 2183 17464 15164 D7 30/125 2420 2334 18672 16252 0.138 90/75 2460 2117 16936 14476 D9 70/100 2580 2252 18016 15436 D10 65/100 DAP 2590 2470 19760 17170 1.6111 50/125 2700 1678 13424 10724 D12 30/150 2820 2357 18856 16036 D13 90/100 2860 2954 23632 20772 13.3414 70/125 2980 2276 18208 15228 D15 50/150 3100 2833 22664 19564 D16 90/125 3260 2339 18712 15452 D17 70/150 3380 2755 2204 18660 D18 90/150 3660 3642 29136 25476 5.88
179

Oromia Agricultural Research Institute (IQQO). Crop research Proceeding 2017
Table2:-Economic analysis of the treatments at BakoNo Urea/NPSB Cost Grain/ha Gross Benefit Net Benefit Dominance MRR
(kg/ha) (ETB) (kg) (Birr) (birr.)1 0/0 0 1201 96082 30/75 1620 3370 26960 25340 9.73 50/75 1900 3057 24456 22556 D4 30/100 2020 3039 24312 22292 D5 70/75 2180 3235 25880 23700 D6 50/100 2300 2935 23480 21180 D7 30/125 2420 3635 29080 26660 1.658 90/75 2460 2798 22384 1992 D9 70/100 2580 3801 30408 |' 27828 7.310 65/100 DAP 2590 3581 28648 26058 D11 50/125 2700 3396 27168 24468 D12 30/150 2820 3073 24584 21764 D13 90/100 2860 3109 24872 22012 D14 70/125 2980 2532 20256 17276 D15 50/150 3100 3136 25088 21988 D16 90/125 3260 3176 25408 22148 D17 70/150 3380 3161 25288 21908 D18 90/150 3660 3676 29408 25748 D
Conclusion and RecommendationFertilizer level influences the yield of finger millet at bako and Gute and the optimum fertilizer rate at Gute is 100kg NPS/ha and 90kg Urea/ha. The optimum fertilizer rate at Bako is 70kg Urea/ha and 100kg NPS/ha that produces highest yield and economically feasible. The bio-mass and plant height of the crop also increased by the above level of fertilizer. Therefore, the farmers and investors of the area and policy makers are advised to use this opiimum fertilizer rate to get economically feasible high yield.ReferencesApoorval.K.B. Prakash,S.S, lRajash,N.L.& Nandi.B. STC'R Approach for optimizing integratedplant
nutrient supply on Growth, yield and Economics of finger millet (Eleusine corocana(L)Kumar Naik,A.H.,Rama Candra prasada,T.U. and Basavarsa,T. Infulance of chromolaena odorata
compost on growth and yield of finger millet ,JOSR Journal of Agriculture and veterinary science (IOSR-JAVS) e-ISSN:2319-2380.p-ISSN;2319-2372. Volume 9,Issue 7ver. 1( J uly ,2016),pp20-24
Patial,S.V.,Bhosale,A.S,and kahambal,P.D.(E!Tect of various levels of fertilizers on growth and yield of finger millet, IOSR Journal of Agriculture and veterinary science (IOSR-JAVS).e- ISSN:2319-2380,p-ISSN:2319-2372 volume 8.1ssue 6 Ver.I(June 2015).49-52
Birihanu Ayalew, Trends,Growth & Instability of finger millet production in Ethiopia, Research Journal of Agriculture and Environmental management Vol.4(2),pp078-08l Fab.2015.
Asfaw Adugna ,Tesfaye Tesso, Erenso Degu, Tasfaye fadese, Fayera Margal.Wasihun Leggese, Chameda Daba, (Geno type by Environment Interaction and yield stability analysis in finger millet
(Elusine corocana L.Gaerth)\n Ethiopia. American Journal of plant science,2011,2,408-415. Dagnachew Lule, Kasahun Tesfaye and Masresha Fetene. Qualitative traits diversity and eco-
geographical distribution in Finger millet (Eleusine corocana GUR ESub sp.corocana Iandraces from eastern and South eastern Africa; An implication for germ plasm collection and conservation. African Journal of plant science vol.6(l3).pp.346-354, 2012.
180
Oromia Agricultural Research Institute (IQQO), Crop research Proceeding 2017
T.SS.K.patro and J.madhuri (Identification of resistant varieties of finger millet to leaf, Neck and finger blast (International Journal of food , Agriculture and veterinary science ISSN2277-209 x (online) 2014 vol.4(2).May-August,pp,7-11/Patro and Madhuri;
Experiences and the Challenges in Soybean Production Management and Promotions Supported by N2Africa Project in Six Selected Districts of Western OromiaZerihun Abebe, 'Adane Arega, 'Tadesse Birhanu, 'Kifle Degefa. 'Chala Dabala, 'Aletnayo Dabasa, Getachew Birru, 'Meseret Tola and 'Solomon Bekele
'Bako Agricultural Research Center/ Oromia Agricultural Research Institute P.O.box 03, Bako W'est Shoa
Corresponding author: [email protected] AbstractSoybean is often described as a miracle golden bean due to its multi advantages, but its benefits are not well exploited in Ethiopian smallholder farmers. Some of the main problems that may limit its potential exploitation are lack or limited access to inputs (improved seed and quality inoculants), inappropriate and non-specific recommendations, lack of labor-saving farm tools and poor market linkage across soybean value chains. Many efforts have been made by National and Regional Agricultural Research Institutes in developing or adapting improved varieties with some agronomic managements since 1950, but the production rates are still low when compared to other crops. Recently, many international non-government organizations are very interested toinvestin soybean production technologies in order to boost the benefit of smallholder farmers of Ethiopia. N>A frica project is one of the internat ional projects that mainly focuses on legume value chains with the aim to putting nitrogen fixation to work for smallholder farmers in Africa. The project focuses on soybean value chain in six districts of Western Oromia under ‘Chewaka' cluster. Some of the project s outputs in thetargetedareas resulted in 24-70% yield increase over the control when 50 kg ha 'phosphorus fertilizer (+P) with Rhizobiuminculcation (+R) was applied. Sim ilarly, the highest dry biomass yield (-how much?-)(both hulm and husk dry weight), which is a potential for animal feed, was obtained when both +P+R were applied while the lowest dry weight (how much?) was recorded from the control plot. Not all farmers bene fitted to the same extent from the application of P and/or R. Even though more than 90% of the farmers saw a positive response to the application o f P and R, around 10% of the farmers saw negative yield response. This requires further invesigation for nonresponsiveness of the soil. On the other hand, less than 50% of the farmers saw negative yield response when either of the two fertilizer sources was applied, indicating the combined application of P and R is very crucial. In Addition to field experiment, the project also engaged in farmers capacity’ building, demonstration, dissemination, input delivery and output market access with the aim to address more smallholder farmers to be benefited from the soybean technologies. More than 7500 farmers (30% women) were trained in soybean agronomic management and soybean recipe preparation and utilization in six districts. More than 2500 farmers directly benefited from disn-ibution of all soybean inputs since 2013 in the targeted districts. Around 4000 farmers got awareness about soybean technologies through evaluation and field day event s.These' achievements were possible due to collaboration with local partners/stakeholders ( e.g Self-help Africa. CHAI. SIMLESA, MfM, BOA and Primary cooperatives etc). Even though the project made many efforts on the promotion of soybean technologies, the benefit for the farmers is still very low due to many limiting factors that need immediate attention by the stakeholders. Some of the main challenges are lack of access to inputs (seeds, quality’ inoculants and pre-emergence herbicide ), the issue of nonresponsive soils, lack of labor-saving tools ( planter, thresher, soy grinder and soy milk processor) and poor market linkage across soybean value chains.
Keywords: Soybean, Inoculant, Capacity building, Diagnosis, Demonstration, Adaptation/pre-scaling up, Input supply and Market Access

Oromia Agricultural Research Institute (IQQO), Crop research Proceeding 2017
IntroductionSoybean is one of the food crops which is native to China but well commercialized in America. About 55% of the USA edible oil consumption source is from soybean (Goldsmith, 2017). The world- leading producer of soybean is still the USA and followed by Brazil and Argentina in Latin America, and China in Asia (Spicer, 2017). Nigeria is the highest Africa’s soybean producer (39%), closely followed by South Africa (35%) while Uganda is the third highest African producer (14%) (Spicer, 2017). Soybean is often described as the miracle golden bean, the meat that grows on vines, the protein hope of the future and the salvation crop among others. These attributions are mainly due to the relatively high protein content (about 40%) contained in soybean seeds (Adelodun, 2011). It is one of the least expensive sources of protein when compared to eggs, milk, beef, and cowpea. It also contains approximately 20% unsaturated and non-cholesterol fatty acid, oleic and linoleic acids, and it is suitable for reducing heart ailment which may be caused or aggravated by excessive intake of cholesterol from animal fat (Adelodun, 2011). Moreover, many studies showed that mature soybean seed contains vitamins such as thiamine, niacin, riboflavin, choline, vitamins E and K, which are necessary for normal body growth and development Adelodun, 2011: Keyser and Li, 1992).Soybean is a pulse crop with multiple food and economic advantages for small-scale farmers. It is used as food for home consumption, raw materials for local factories and feed for dairy animals or fattening farms ( Abebe, 2017; Sisay Bekeie. 2017). Many types of soybean recipes can be prepared with cereal and vegetable crops. Most of the smallholder farmers who are currently producing soybean in Chewaka area use the soybean products as parts of their staple food. Its byproducts (soybean cake and soybean residues) are the main sources of animal feeds since it has good crude protein sources. Soybean has 45-50% crude protein content when compared with either wheat bran or noug cake (Sisay Bekeie, 2017). In addition, soybean residues (both hulm and husk) have higher nutrient contents compared to other crop residue sources. In addition, soybean has the capacity to fix atmospheric nitrogen from the air through symbiosis with Rhizobium bacteria and thus contributes to improved soil fertility when grown in rotation with cereals (Ronner et al., 2016; Vugt et al., 2017). As a result, it has an additional advantage of reducing N fertilizer requirement for subsequent crops in a rotation( Abebe and Haile, 2017). Therefore, it can be grown in rotation with cereals like maize, finger millet, and sorghum.Many efforts have been made in soybean variety development and/or adaptation with different agronomic and other management options since 1950 in Ethiopian agricultural production systems (Addisu et.al, 2016). Recently, different non-government organizations and projects like N2Africa project, soybean innovation lab and Clinton Access Initiatives, are working on soybean value chain particularly in areas where soybean has a good potential for grain production. Among them, The N2Africa project worked on soybean value chains, mainly focusing on research managed agronomy, capacity building in soybean production and utilization, demonstration and promotion of best bet soybean technologies and market linkages. Therefore, the objective of this paper is to summarize the experiences in achievements and the challenges in undertaking these activities in some districts of Western Oromia for the last five years (2013-2017) during the implementation of the project.Material and MethodsThe N2 Africa project started in 2013 as bridging year focusing on major legume crops, particularly soybean value chains in Western parts of Oromia Region. The project mainly focused on four pillars; (1) Research managed agronomy, (2) Stakeholders’ capacity building on improved soybean technologies, agribusiness, soybean recipe preparations and other value additions, (3) Input
182

Oromia Agricultural Research Institute (IQQO), Crop research Proceeding 2017
distributions ( seeds, inoculants and others), (4) demonstration and adaptations or pre-scaling up of best bet soybean technologies and (5) access to market for soybean producers.The project was implemented by 1QQO-BARC supported by N2 Africa in six districts of Western Oromia. The selected districts are Bako Tibe, Ilu Galan, and Dano from West Shoa, Gobu Sayo and Wayu Tuka from East Wollega and Ilu-Harar (Chewaka) are from Buno Badelle Zones. In 2013 cropping season, mother and baby trial for participatory variety selection and one input trial (50 kg DAP/ha & Inoculants (+P+R), 50 kg DAP/ha & no inoculants (+P-R), only inoculants (-P+R) and the control (-P-R)) were conducted to select best bet varieties along with good agronomic practices. Six released soybean varieties were evaluated under farmers’ condition for participatory variety selection while Didessa variety was used to evaluate the effect of different inputs (+P+R. +P-R,-P+R,-P-R).In 2014 cropping season, the response of fertilizer sources (+P+R, +P-R,-P+R,-P-R) under diagnosis trial was also conducted on 26 farmers’ plots in Gobu Sayo district. At the same time, both demonstration and adaptation/pre-scaling up have been conducted to show and demonstrate the best bet performed varieties along with the inoculants. Therefore, both seeds for improved varieties and the inoculants were distributed in the selected districts. The inoculants were bought from Menagesha Biotech. Yield assessments for adaptation and demonstration trials were conducted in each district to evaluate the performance of the crop across locations. The yield for diagnosis trial from each farmer’s plot was measured.Training for different stakeholders (targeted farmers, DA. District experts, primary cooperatives and local NGOs) for capacity building was delivered since 2013. The training mainly focused on soybean production and management, post-harvest handling, soybean recipe preparations and utilization, agribusiness development and value additions, and means of access to market linkages. The training was conducted in collaboration with the identified local partners and/or stakeholders, such as Self Help Africa, Clinton Health Access Initiatives (CHAJ), IFDC-2Scale, Menschen Fur Menschen ( MfVl), farmers union cooperatives. Agricultural experts of Districts, Development Agents (DA) and local agro-dealers.Different farmers’ forums were organized toevaluate soybean trials as a means of experience sharing among the farmers. The farmers evaluated the performances of the crop under the demonstration trials that received different input (+P+R, +P-R,-P+R,-P-R) using their own evaluation criteria. On the other hand, farmers’ field day events as a means of technology promotion tools have been arranged in some farmers’ fields since 2013. Both male and female farmers were engaged in both evaluation and field day events.Finally, yield assessment on forty farmers’ fields was done by harvesting from 100m' in order to estimate the performance of the crop under farmers’ management conditions and to assess the yield variability across the districts and/ or peasant associations.Result and DiscussionYield Response of soybean to fertilizer (P) and/or Rhizobium Inoculation (R): The response of soybean to Rhizobium inoculation and fertilizer rates showed significant differences across cropping seasons. The highest grain yield was obtained when both the inoculants and chemical fertilizer (50 kg DAP/ha) were applied across all cropping seasons. The result in Figure-1 showed that more than 70% (in 2014), 52% (in 2015) and 24% (in 2016) yield advantages were recorded when both the inoculants and 50kg DAP/ha were applied compared to the control plot receiving no fertilizer sources. However, yield performance of the crop in 2016 was not significantly different when both inoculants and the chemical fertilizer were applied compared to the independent application of only chemical fertilizer
183

Oromia Agricultural Research Institute (IQQO), Crop research Proceeding 2017
and Rhizobium inoculation or without fertilizer sources. The result of 2014 and 2015 confirm the results of other reports (Keyser and Li, 1992) who also found that application of only rhizobium inoculation to the crop significantly improved the yield of soybean over the control similar to the
Figure-1: The Effect of Rhizobium Inoculation and Chemical Fertilizer rates (50 kg DAP/ha) on yield of soybean on Farmers’ fieldSoybean haulm and husk contain good amounts of crude protein (CP) which is important for animal feed, particularly for fattening. In addition to the increased dry weight of both hulm and husk, the improvement of CP content of soybean haulm was attained due to Rhizobiuminocu\at\ons and chemical fertilizer applications (Sisay, 2017).The result in Figure-2 indicates that significantly more dry weight of hulm could be harvested compared lo the husk dry weight. The highest hulm dry weight in 2016 was obtained when both Rhizobium inoculation and the chemical fertilizer were applied compared to the uses of either of the two fertilizer sources independently or no fertilizer sources. However, the total dry weight of husk was not significantly affected by treatment variations. In general, the highest total dry weight of biomass (both husk and hulm) could be harvested when both Rhizobium and chemical fertilizer were applied, and hence advisable and recommended.
Treatments
Figure-2: The Effect of Rhizobium Inoculation and Chemical Fertilizer rates ( 50 kg DAP/ha) on husk and hulm dry biomass of soybean on Farmers’ field.Yield Variability: Biomass and grain yield of soybean were significantly affected by the application of P and/or R, but the responses were not uniform across locations and farmers. This indicated that not
184

Oromia Agricultural Research Institute (IOQO), Crop research Proceeding 2017
all farmers benefttted uniformly from the application of P and/or R (Figure 3). The yield response to P and/or R across fanners' fields in 2014 cropping season indicated that the yield performance was varied from less than 500 kg ha'1 to more than 4300 kg ha"' (Figure 3). The highest soybean yield (4319 kg ha1) was achieved on a fanner plot when both P and R were applied while the lowest yield under the same input application ( 949 kg ha'1) was recorded on the other farmer plot, indicating that there are more than 3 tons ha'1 yield gaps between the two farmers. On the other hand, the crop did not respond to the application of P and/or R when compared to the control plot, and this might be due to the non-responsiveness of the soil which needs further research to identify the major limiting factors that determine the responsiveness of the treatments as also suggested by Ronner et al., 2016.
Figure 3: Soybean grain yields control (kg ha ') and the response to P. R and P + R for individual farms in Gobu Sayo District ( 2014). P = 50 kg P ha 1 applied as DAP fertilizer; R = seed inoculated with Bradyrhizobium japonicum.
The result indicated in figure-5 show that more than 90% of the farmers observed a positive response to the application of P and R compared to the control plots. Gains of more than 1400 kg ha 1 was achieved by about 15 and 13% of the farmers who applied P and R, and R or P respectively, compared to the control plot. Only 3% of the total farmers who applied P and/or R achieved yield gains of 2500 kg ha'1 compared to the control plot. A similar result was reported in Nigeria where all farmers did not gain yield advantage when P and/or R were used compared to the control plot (Ronner et al.. 2016). However, more than 50% of the total farmers observed a positive response to the application of either P or R compared to the control plot. In other words, less than 50% of the farmers came across negative yield response when either of the two fertilizer sources was applied independently. Only less than 10% of the farmers observed negative yield responses when both P and R were applied compared to the control plot. The 3% negative penalty was caused by inappropriate weed management, particularly at the early stage. Some farmers start weeding other plots two weeks after either P or R applied plots are weeded. In other words, weed management was not uniformly applied across all farmers’ plots. However, more than 30-35% of the farmers did not see yield gain when either P or R was applied compared to the control. This may indicate that sole application of chemical fertilizer as P sources and Rhizobium inoculation did not significantly increase yield since both have complementary effect on nutrient utilization efficiencies (Abebe Zerihun, 2015). In general, the negative yield gains might be due to other factors, particularly no weed management at an early stage of the crop, or lack of integrated application of P and R that might hamper the response of the crop.
185

Oromia Agricultural Research Institute (IQQO), Crop research Proceeding 2017
Figure 5: Cumulative probability of estimated absolute yield response (kg ha yield of P and/or R minus control yield). P =50 kg P ha ! applied as DAP fertilizer; R - seed inoculated with Bradyrhizobium japonicum. Achievements on Capacity Building, Input Distribution, and other Promotion Approaches
Capacity Building: One of the main targets of this project was to equip the fanners with soybean production technologies starting from land preparation to post-harvesthandling and soybean recipe preparation and utilization. Both general training and training of trainers (ToT) were given in each targeted district across all cropping seasons. More than 7500 farmers, of which 30% were women, and technical personnel (development agents. Primary cooperative unions, NGOs, experts, woreda Agricultural Offices management bodies) have attended the general training on soybean production and management and soybean recipe preparation and utilization (for women) in the last four years. The training was conducted not only by NiAfrica project, but also in collaboration with different stakeholders in different districts, namely Selfhelp Africa (in Bako Tibe district), !FDC-2ScaIe ( in 11 u— Harar district), Menshun fur Menshin ( in Dano District), Clinton Access Initiative (CHAI) in more than 10 districts of East Wollega and West Shoa zones, SIM LESA project ( Wayu Tuka, Gobu Sayo, Bako Tibe and Ilu Galan districts). These organizations and projects contributed a Jot in promotion of soybean production technologies through different approaches (training, demonstration, adaptation/pre-scaling up, evaluation events and field days)Direct Benefits to the farmers: Both soybean seeds and inoculants were distributed to the farmers directly in addition to the demonstration and/or diagnostic trials conducted on their farm plots. In all six targeted districts, more than 2500 fanners were directly benefited through the delivery of improved soybean seeds and inoculants and through hosting demonstration trials at least on 400nr areas (Table I). More than 85% of the direct beneficiaries have got seed and inoculants to plant an area of 0.25 ha of land.
In addition to capacity building offered to the targeted farmers, more than 4000 farmers were exposed to awareness on soybean production technologies through evaluation events on demonstration trials and field days organized on adaptation trials hosted by the target farmers in all the locations (Table 1).
186

Oromia Agricultural Research Institute (IQQO), Crop research Proceeding 2017
Table I : Number of farmers and technical staff participated on soybean technologies promotion in six districts (Bako Tibe, WayuTuka, Gobu Sayo, Ilu Galan, Dano, Ilu Harar) in 2013-2017 Dissemination approaches Cropping Seasons
2013 2014 2015 2016 2017 Total
General training for farmers 0 1198 1548 1511 1150 5407
Training for TOT ( training for trainee) 0 53 199 140 50 442
Training on recipe soybean preparation 0 384 685 78 540 1687
Diagnosis 0 30 0 0 0 30
Demonstration 45 150 23 16 14 248
Adaptation/pre-scaling up 0 680 640 491 450 2261
Number of participants on evaluation events 0 0 621 0 0 621
Number of participants on field day events 570 382 648 2064 0 3664
Total 615 2877 4364 4300 2204 14360
In general, more than 14,000 farmers got the awareness on the general knowledge and skill of soybean production technologies directly or indirectly and hence are capable of producing the crop though they still need technical support from the development agents and other local technical personnel.Input Distribution and Training Materials preparation: Both soybean seeds of four varieties ( Didessa, Ethio-Yugosilavia, Ketta, and Korme) were distributed in six targeted districts in the last five years (Table 2). Bako Agricultural Research Center (BARC) has played a key role in distributing both the seeds and inoculants in five districts ( Bako Tibe, Ilu Galan, Gobu Sayo, Wayu Tuka and Ilu Harar) while MfM distributed more than 3.5 tons in five kebeles of Dano district in 2016 and 2017 cropping seasons. A total of 19 tons of soybean seeds and 5000 sachets of bio-fertilizers (inoculants) were distributed to the direct beneficiaries.Moreover, leaflets explaining about soybean production and management technologies, and soybean recipe preparation methodologies were prepared in the local language (Afan Oromo) and distributed to the farmers, DAs, and other local NGOs and GO experts during training, evaluation forum and field day events. More than 3000 copies of the leaflets were printed and distributed in each targeted district for the five years duration (Table 2). On the other hand, 4000 copies of a technical manual prepared in the local language in collaboration with lFDC-2Scale and Selfhelp Africa projects were printed and distributed to the farmers.
187

Oromia Agricultural Research Institute (IQQO), Crop research Proceeding 2017
Table 2: Amounts of inputs (soybean seeds and inoculants) and training materials (leaflet andtechnical manual) distributed in the last five years (2013-2017)
Input distributedCropping Systems
2013 2014 2015 2016 2017 TotalSoybean seeds (tons) 0.5 3.2 2.6 6.9 5.8 19.0
Inoculants ( sachets) 120 330 300 250 4000 5000
Number of training materials distributed
Leaflets 640 580 1250 1300 0 3770
Soybean training manual
0 0 0 4000 0 4000
Lessons from on-farm yield assessments: The yield assessment was done on forty farmers’ plots by collecting representative samples from direct beneficiaries who have accessed all the inputs (soybean seeds, inoculants, and chemical fertilizer) in 2016 cropping season in five targeted districts. The result of this assessment indicated that there is huge variability of yield performances across the districts and/or peasant associations (PA). The analysis of the collected samples indicated that more than 33, 27, 26, and 24% yield increases were observed in Dano district compared to Bako Tibe, Wayu Tuka, Gobu Sayo and Ilu Galan districts, respectively. The maximum average yield (2284 kg ha'1) was recorded in Dano Roge PA of Dano District while the minimum average yield (1565 kg ha1) was observed in Seden Kite PA of Bako Tibe District (Figure 6). This result confirms that soybean has a potential yield performance to be grown in all the districts although yield variability might be related to the variation in soil fertility, inappropriate uses of the inputs (both inoculants and chemical fertilizers), inappropriate time and frequency of weeding, differences in pre and post-harvest handlings as well as poor close supervision of the development agents.
Figure 6 : Soybean yield performances under fanners' management in each PA of five districts in 2016 cropping season. (PA= Peasant Associations; n= number of sample in each PA; BT= Bako Tibe ( OH= Oda Haro and SK=Seden Kite PA); Dano district ( DR= Danno Roge and DH=Dirre Harrayu PA); GS= Gobu Sayo district ( GT=Gambela Tarre PA); IG= Ilu Galan district ( JD= Jato Dirki and SI=Seden Ilu PA) and WT= Wayu Tuka district ( BM=Boneya Molo))
188

Oromia Agricultural Research Institute (IOQO), Crop research Proceeding 2017
Lessons and experiences, of farmers in Dano District where more than 54% of the farmers produced a minimum of 2000 kg ha"1 and 33% of the farmers achieved a yield of not less than 2500 kg ha'1 should be adopted. On the other hand, only 20% of the farmers have got soybean yield of fewer than 1500 kg'1 and the lowest yield recorded was 1000 kg'1 (Figure 7). On average, soybean yields of more 2200 and 2100 kg ha'1 were recorded in Dano Roge and Dirre Harayu PAs, respectively. These good achievements were due to close supervision of the development agents (MfM staff members) and MfM expert staffs who provided regular technical backup, particularly at the time of planting to ensure optimum plant populations, an appropriate fertilization and inoculation placements, appropriate time and frequencies of weed control and technically supporting the farmers on pre and post-harvest handing methods. Excellent lessons can be Iemt from Farmer 1 and Fanner 3 in Dano Roge and Dirre Harrayu PAs who achieved about 3600 kg ha'1 soybean yields. However, there are soybean yields as low as 1900 and 2600 kg ha'1 in Dano Roge and Dirre Harrayu, respectively compared to the minimum producers in respective PAs, indicating that there are still huge yield gaps among the farmers. The low yields produced might have been due to soil fertility variations, the nonresponsiveness of the soils to the applied inputs, inappropriate management practices from the time of planting to post-harvest handling. Therefore, these results clearly indicated that many efforts are required from DA and district experts, research organization and other stakeholders to minimize these yield gaps and hence increase the productivity.
4000
3 5 00
3000
2500
M 2 00 0o Jj^ 1 500-c?
1 ooog 500 CP o
Dano RogeYield Performance o f Soybean in eaeln Farmers' fields o f two PAs
Figure 7: Soybean Yield performances under farmer’s management in Dano Roge and Dirre Harrayu District in 2016 cropping season. F,.n= represent the sampled farmers in each PA Challenges and Possible SolutionsPoor Quality of the inoculants: Menagesha Biotech is one of the popular private share companies that are currently producing many biofertilizers for different legume crops, namely common bean, soybean, field pea, chickpea and etc. The demand for the inoculants are increasing from time to time as the popularization of the technology is widely addressed by different GO and NGOs. As evidence, not more than 10,000 sackets of the biofertilizers for different legume crops were distributed in 2011 while more than 70,000 sackets of different strains were nationally distributed in 2016 cropping season. Currently, the problem of poor quality of strain is emerging, particularly on soybean inoculants that are suitable for the acid soil areas of Western Oromia. For instance, more than 250 sackets of LEGUME-FfX biofertilizer were purchased from Menagesha Biotech in the 2016 cropping season by the project for Bako Agricultural Research Center. However, these strains did not respond.
189

Oromia Agricultural Research Institute (IQQO), Crop research Proceeding 2017
hence the crops suffered nitrogen deficiency andtinaily, considerable yield loss occurred on almost all of the hosting farmers’ plots. A lesson has been learned that there is a need to bring inoculant quality control system in the soybean production value chain with the increasing popularity and demand of the inoculants. Therefore, due attention should be given by government bodies and policymakers about the quality control and certification issue.Non-responsive soils: The result of the analysis of diagnosis and demonstration plots indicated not all farmers benefited from the production technologies of soybean. Although all hosting farmers were supplied with the same soybean technologies (improved seeds, inoculants, and chemical fertilizers) some of the farmers achieved lower yields compared to the control plot, indicating that soils of these farmers’ plots are not responding to the applied inputs. This needs further research. Even though NiAfrica project gave attention to solve the problem of non-responsive soils, additional efforts should be made by different research organizations to address the problem.Weed Control Problem: The only and most practiced weed control method in soybean crop is hand weeding. But, farmers are seriously demanding pre-emergence herbicide in the local market. Almost all farmers have adopted the use of different pre- and post-emergence herbicides to control weeds in maize and want to have similar options for soybean production. Bako Agricultural Research Center has conducted two years evaluation trials on pre-emergence herbicide (Dual gold) for soybean weed control, and the result indicated that application of this pre-emergence chemical plus one time hand weeding, 30-40 days after planting can effectively control weeds and significantly increase the yield of soybean. However, the chemical is not locally and/or nationally available for the end users. Currently, the area of soybean production in targeted areas has been increasing as a result of the wide popularization and pre-scaling up activities done by different NGO (CHA1) and thus needs for alternative weed control methods. Therefore, the availability of pre-emergence and/or post-emergence (if any) herbicides at the local market are crucial. It is critical for soybean technology adoption as a package hence the responsible bodies have to take appropriate measure sooner than later.Lack of soybean planter and thresher: While the area for soybean production is increasing from time to time, the demand for labor-saving tools such as planters and threshers are emerging issues, particularly for soybean seed producers and local investors where there is ashortage and /or high competition for labor at critical production time. Soybean planter is now a major problem particularly for private soybean seed producers as labor requirement at planting is very high and costly. For instance, Ano Agro Industry P.L.C has been producing soybean seeds mainly using human labor. However, planting soybean seeds using human labor leads to overpopulation of the plant as the seeds were simply drilled into the prepared rows and hence reduce the quality of the seed besides requiring high labor cost. Lack of soybean thresher is another problem. The current practice of threshing with human labor causes seed breakage resulting into low seed quality. Therefore, it is suggested that making these labor-saving tools locally available is an important issue. All concerned bodies like IQQO’s agricultural Engineering research centers should consider the development and production of these tools locally in their future plans at lower cost. These centers should take the lead to produce small-scale planters and threshers for smallholder soybean producing farmers to make labor-saving tools locally available.Lack of women labor saving tools: It is obvious that soymilk can be prepared from soybean seed through developedprocedures though it needs more human labor when prepared using locally available materials at the household level ( soya grinder prepared from flat stone). Many efforts have been made by BARC teams in delivering training on how to prepare soybean meals, food recipe
190
Oromia Agricultural Research Institute (IQQO), Crop research Proceeding 2017
preparation, and utilization, particularly for women who directly or indirectly participated in the N2Africa project. However, the women and other participants were strongly complaining that grinding using local grinder is labor intensive, resulting in poor soymilk quality, color and flavor. Soybean seed ground using local grinder produces low-qualitydough and many other defects have also been observed. The remaining soymilk preparation procedure after grinding is still labor intensive and may lead to poor milk quality products. However, one of the main objectives of N2Africa project is to empower women in value addition of legume products, like on soymilk production as an enterprise and networking, to increase the benefits from legume (soybean) production. In absence of locally available women labor-saving tools, it is difficult to plan women economic empowerment on legume value chains through value additions like soymilk production at an intended enterprise level. Therefore, it is kindly suggested that the availability of modified soybeangrinder andsoymilk processors locally ensure business opportunities to soybean processing soymilk enterprises and other value-added soybean products producers. The good and adaptable experience from Ghana indicates that soya dairy business sustainably improves nutrition and economic development as labor-saving tools like soybean seed grinder and soymilk processors are locally available for the end users (http://sovbeaninnovationlab.illinois.edu).Poor Market linkage and absence of local collectors: While the area of soybean production is increasing from time to time, the problem of the local market for soybean bulk product is an emerging issue. One of the main bottlenecks in soybean marketing is that there are no local soybean bulk collectors as the market linkage from the bottom to the final grain buyers are very weak and/or never been there in some areas. Farmers are continuouslycomplaining at different forums (during training, evaluation and field day events) about lack of market. However, there is no excess product available in order to satisfy the amount of grain required by the local collectors, particularly in areas where soybean productions are currently underway.On the other hand, the demand for soybean bulk production at the national level is very high. For instance, Gut-Agro Industry needs more than 5000 metric tons per annum of legume seeds including soybean grain for the production of blended soymilk flour (Wolde-meskel, 2017). Similarly. Alema Koudijs Feed Factory (AKF) has been producing poultry feeds from soybean seeds and its annual demand for the seed is very high. Moreover, the government of Ethiopia has made an agreement for the production of up to 39000 metric tons of com-soybean blend ( CDB) with eight different local manufacturers, namely Guts Agro Industry PLC, FA FA food share company, Healthcare food manufacture company. Nourish Business Group PLC, Bekana PLC, Abbay International PLC and Kidan PLC (Francom and Counselor, 2016). Currently, CHAI (Clinton Health Access Initiatives) is also widely popularizing soybean production and processing technologies through capacity development, conducting demonstration trials and field day organization to meet their annual demand of the soybean grain product of more 18000 metric tons only from Oromia regions. This indicates the demand of soybean grain bulk at the national level is very high while the linkage among local producers and the final grain buyers is very weak. Therefore, many efforts are needed to sustainably make market linkage among the producers and the final grain buyers.
Potential Opportunities: Different local NGOs, such as Self Help Africa (Bako Tibe), CHAI (Bako Tibe, Ilu galan, Dano. Wayu Tuka) and CASCAPE (Wayu Tuka), MfM ( Dano) have been attracted for soybean wide dissemination in areas where the crop has potential for production. In addition, formally organized women groups have been identified in three peasant associations in Dano District. For instance, MfM has formally organized them and provided initial capital to inter into agribusiness.
191

Oromia Agricultural Research Institute (IQQO), Crop research Proceeding 2017
like animal fattening, poultry production, and soya dairy business. This good opportunity help to establish women led agribusiness in soybean value chain (soybean value addition like preparation of Baltina, soya milk processing and animal fattening using legume residue, grain/seed cleaning and grading). Bore-Bako union ( Bako area) and other local farmers cooperatives are willing to supply inputs required for the production of soybean-based on the farmers demand. The govemmentis also interested to break the problem of mono-cropping practices which is an important initiative to strategize legume technology dissemination widely and rapidly. Finally, local seed producers such as Ano Agro-Industry and farmers’ cooperative unions ( community-based seed production systems) are also potential to avail demand based quality legume seeds for the farmers while Bako Agricultural Research Center can provide basic seed for the certified seed producers.
SummaryThere are good opportunities in terms of environmental suitability for soybean production in Western Parts of Oromia. But most of the smallholder farmers are not benefited from it. Some of the main reasons that hinder or limit the potential benefits of soybean are limited or unavailability of improved technologies (specific agronomic recommendations), limited access to inputs and skill/knowledge about production and management practices, lack of pre-emergence herbicides, lack of labor-saving tools ( soybean planter, threshers, grinder and soymilk processors) and the lack or limited access to market and market linkage between the producers and the final grain buyers.Many efforts have been made by the support of NUAfrica project in collaboration with different local partners and stakeholders to solve the main challenges that limit the potential benefits of soybean for the smallholder farmers. The project intervention started with addressing capacity building (from production up to utilization of soybean) for the targeted farmers in six districts of Western Oromia region. Many research managed agronomy, demonstration and adaptation trials have been directly conducted on farmers’ field and a lot of best-bet practices have bee generated and recommended. Moreover, evaluation and field day events at different crop stages have been organized to further promote and popularize the technologies. More than 14,000 farmers and other stakeholders have been directly and indirectly addressed in the targete districts.However, the area of soybean production has not been increased as expected due to unsolved production and processing problems that still remain the main challenges. Some of these challenges that need to be addressed immediately are the problem of inoculants quality, unavailability of preemergence herbicides (Dualgold) and postemergence (if any) herbicides, lack of labor-saving tools (planter, thresher, soybean grinder and soymilk processors) and weak market linkage across soybean value chain. Therefore, the role of different partners is very crucial to solving such problems so that the farmers’ benefits more from soybean while in turn the problem of maize monocropping practices can also be addressed.AcknowledgmentIn the first place, the authors greatly acknowledge NiAfrica projects for the financial support. The role of Bako Agricultural Research Center played in managerial aspects is also very appreciated. Moreover, the authors sincerely acknowledge all partners and/or stakeholders such as S1MLESA, Self-help Africa, lFDC-2Scale, MfM, CHA1, BOA, Cooperative Unions contributing in different angles for the success of the activities. Finally, it is our pleasure to acknowledge all staff members of Pulse and Oil Crops Research Team of BARC for planting, supervising and collecting all required data since the start of the project in 2013.References
192

Oromia Agricultural Research Institute (IQQO), Crop research Proceeding 2017
Abebe, Z., 2017. On-farm Yield variability and Responses of Common bean (Phaseolus vulgaris L.) Varieties of Rhizobium Inoculation with Inorganic Fertilizer Rates. J. Anim. &Plant Sci. 32, 5120-5133.
Abebe, Z. and H.D., 2017. The Effect of Organic and Inorganic Fertilizers on the Yield of Two Contrasting Soybean Varieties and Residual Nutrient Effects on a Subsequent Finger, Agronomy, doi: 10.3390/agronomy7020042
Abebe Zerihun, D.A. and E.W.-M., 2015. On-Farm Yield Responses of Soybean [Glycine max L. (Merrill)] to Fertilizer Sources Under Different Soil Acidity Status in Gobu Sayo District, Western Ethiopia. J. Agron. 14, 30-36. doi:D01:10.3923/ja.2015.30.36
Addisu Bezabeh, E.A., and M.A., 2016. Trends in soybean production and productivity: evidence from three districts of southwest Ethiopia 5, 69-75.
Adelodun, K.., 2011. Soybean: African’s Potential Cinderella Food Crop, Soybean-Biochemistry, Chemistry and Physiology, Prof. Tzi-Bu Ng (Ed.), lSBN:978-953-307-219-7. InTech.
Francom, M.G., Counselor, A., 2016. Ethiopia ’ s Demand for Corn -Soya Blend Expands Due to Drought: This Report Contains Assessments of Commodity and Trade Issues Made by USDA Staff and not Necessarily Statements of Official U.S. Government Policy. Addis Ababa Ethiopia.
Goldsmith, P., 2017. Soybean, A New Technology For Development: Soybean Innovation Lab Center for the African Studies Brown Bag Series University of Illinois.
Keyser, H.H., Li, F., 1992. The potential for increasing biological nitrogen fixation in soybean. Plant Soil 141, 119-135.
Ronner, E., Franke, A.C., Vanlauwe, B., Dianda, M., Edeh, E., Ukem, B., Bala, A., Heerwaarden, J. Van, Giller, K.E., 2016. Field Crops Research Understanding variability in soybean yield and response to P-fertilizer and rhizobium inoculants on fanners ’ fields in northern Nigeria. F. Crop. Res. 186, 133-145.
Sisay Bekele, 2017. Effects of Phosphorus Fertilizer and Inoculation on Yield Legumes In Mixed Crop-Livestock Production System Of Ethiopia. Hawassa University, Hawassa, Ethiopia.
Spicer, B., 2017. Top 10 Soybean Producing Countries [www document]. Maps world. URL http://www.mapsofworld.com/world-top-ten/soybean-producing-countries.html
Vugt, D. Van, Franke, A.C., Giller, K.E., 2017. Agriculture, Ecosystems and Environment Understanding variability in the benefits of N 2 - fixation in soybean-maize rotations on smallholder farmers ’ fields in Malawi, doi: 10.1016/j.agee.2017.05.008
Wolde-meskel, E., 2017. Moving forward the legume technology and value chain for sustainable development. ILR I'N 2Africa-Ethiopia: Highlights of Project Progress. Addis Ababa Ethiopia.
193

Oromia Agricultural Research Institute (IQQO), Crop research Proceeding 2017
Effect of Fertilizer Rate on the Yield and Yield Component of Sesame (SesamumindicumL.) in Moisture Stress environments of east Harerghe Zone
Adugna Hunduma1 ’and Habte Birhanu'Fedis Agricultural Research Center P.O. Box, 904 Harar. Ethiopia.
^Corresponding author Email address: adenhund@gmai 1 .com AbstractField experiments were conducted with the objective of identifying and recommending optimum combined phosphorus and nitrogen fertilizer rates for sesame production at Fadis Boke and Errer sub-sites in 2014 and 2015 cropping seasons. Four different phosphorus rates (0, 40, 60. and 80 kg ha'1) in the form of P2O) and four nitrogen nutrient rates (0, 10, 20,and 30 kg N hd1) were combined and used as treatments using sesame variety "Tate The experiment was laid out in RCBD with three replications. Data were collected and analyzed for sesame seed yield, number of sesame branches and pods per plant, and number o f seeds per pod under the different combinations of the fertilizers rates. The results of the study showed analysis o f over location and season of the different NP fertilizer rates combination significantly (p<0.05) affected the yield components and seed yield of sesame. The highest sesame seed yield (891). number branches per plant (28.71)) and number of pods per plant (68.67) were obtained from sesame crops received 6OP1O} kg ha ‘ and 30N kg ha'1 NP integrations of the fertilizers rates. The yield of sesame seed achieved from the combination of 6OP2O5 kg ha and 30N kg ha ' NP fertilizer rates was 35.7 and 72% greater than the average yields of all the rest fertilizer combinations and the no fertilizer application, respectively. Sim ilarly, the highest number o f sesame branches per plant obtained from the combination of 60P205 kg ha'1 and 30N kg ha1 NP fertilizer rates was 66.4 and 43.6% greater than the average number of branches per plant of all the rest fertilizer combinations and the no fertilizer application, respectively. Furthermore, the combined mean number of sesame pods per plant recorded from the combination of 6OP1O5 kg ha1 and 30N kg ha 1 NP fertilizer rates was 42.4% greater than the no fertilizer application treatment. Therefore, to sesame growing farmers in Haraghe zone application o f the combination of 6QP20} kg ha'1 and 30N kg hd' phosphorus and nitrogen fertilizer rates can be recommended for improved sesame production and productivity particularly to at Fedis, Errer and other similar environments of the area.Keywords: Nitrogen, Phosphorus, Sesame seed yield, number of branches, pods IntroductionSesame (Sesamumindicum) is grown in areas wiib annual rainfall of 625tol 100mm and temperature of greater than 27 degree Celsius . The crop is tolerant to drought, but not to water logging and excessive rainfall. Sesame is well adapted to a wide range of soils, but requires deep, well-drained, fertile sandy loams. Oromia National State is a major producer of sesame crop next to Tigray and Amhara National Regional States of Ethiopia. Sesame contributes to more than 80% of the export earning of oil seeds and become the second foreign currency earning crop after coffee in the country. Ethiopian sesame seed market covers quiet a wide range of countries all over the world. The growing demand in the world market and the available capacity to expand sesame production could contribute to the economic growth of Ethiopia (Haile Abera. 2009). At present, the Ethiopian government devotes considerable resources to research and extension in view of encouraging small scale farmers to increase their oil seed, particularly sesame, productivity for international high market demand of the crop to increase export earnings of the country. The oilseeds sector is one of Ethiopia’s fastest growing and important sectors, both in terms of its foreign exchange earnings and as a main source of income for over three million Ethiopians. Study reports indicate that Ethiopia is among the six producers of sesame seed, linseed and Niger seed in the world (Wijnandser al., 2009). The major sesame seed producing regions are situated in the North West and South West Ethiopian in Humera,
194

Oromia Agricultural Research Institute (IQQO), Crop research Proceeding 2017
north Gondar and Wollega (Wijnandse/ al., 2007; CSA, 2013). For instance, the main source of fanners’ income in western Tigray is sesame sales.Sesame is deep rooted and scavenges for fertility below the wheat root zone, but that only works once. The sesame strips lower nutrient reserve, and the fertility will not be available for future sesame crops. Research results have shown that nitrogen and phosphorus (NP) fertilizersare critical for high sesame seed yields, particularly in acidic soils. The major constraints in sesame production worldwide are lack of wider adapting cultivars, shattering of pods at maturity, nonsynchronous maturity, poor stand establishment, lack of fertilizer responses, profuse branching, and low harvest index (Ashri, 1994). Similarly, besides unavailability of improved sesame varieties with good production traits, lack recommendations of NP fertilizers rates in Hararghe in general and in Fedis sesame growing environments is limiting the production and productivity of the crop. Thusan experiment initiated with the objective of identifying NP fertilizers rate combinations that can increase the productivity of sesame in growing environments of east Hararghe. Materials and Methods Description of Experimental SiteThe study was conducted under rain fed conditions at two location (Fadis; Boke site) and Errer subsite. The sub-site is geographically located at the latitude of 9° 07^ and longitude of 42° 04'E at an altitude of 1702 meters above sea level. The area is situated at a distance of 24 km north of Harar city. The soil of the experimental site is black with surface soil texture of sand clay loam that contains 8.2% organic matter, 0.13% total nitrogen, 4.99ppm available phosphorus, I SCmoi r> kg"' soil exchangeable potassium and a pH value of 8.26. It received mean annual rainfall of 860.4mm in the last five years. The area is characterized by a bimodal rainfall distribution pattern and maximum rain received from April to June while inegular and enatic rains are received from August to October. The mean maximum and minimum annual temperatures of the area are 27.7 and 11.3°c, respectively, for the past five years (Fadis Agriculture Research Center Metrological Station, 2015 unpublished).The second experimental area of our experiment Errer Sub-site is located at Errer valley of Babiledistrict, located at 34km east of Harar cit. The area receives an average annual rainfall of 400 to 600mm and suited at an altitude range of 950 to 2000 meters above sea level. The environment is characterized as extremely lowland suitable for the production of sesame.Experimental Materials, Treatments and DesignsThis experiment were planted at Fadis, Boke station and Errer experimental sub-site with the objectives of evaluating,identifying and, recommending the best combination of NP fertilizers ratesthatcan maximizesesame yield and it components in lowland and mid-altitude environments of Eastern Harerghe sesame producing areas. The treatments consisted of a combinations of four nitrogen fertilizer rates (0, 10, 20 and 30kgNha-1) in the form of UREA and four phosphorus levels (0, 40, 60 and 80kgP20jha ') in the form Di-Ammonium Phosphate (DAP). Sesame variety “Tate” was used for the experiment. Sixteen (16) factorialcombinations of NP fertilizers rates were arranged in a Randomized complete block design (RCBD) with three replications. The experimental field was ploughed, harrowed and ridged 40 cm apart. A mixture of one part of sesame seed and two parts of course river sand were sown manually at depth about 1cm depth at and the emerged plants were later thinned at 10cm intra-row spacing of plant per stand two weeks after sowing to keep crop population densities of 250,000 plants per hectare. All Phosphorus fertilizer rates were applied at planting to all the plots and all the nitrogen fertilizer rates were divided in to two equal amounts and applied at two and six weeks after sowing. All other cultural and agronomic practices were applied uniformly to all the experimental plots.
195

Oromia Agricultural Research Institute (IQQO), Crop research Proceeding 2017
Data CollectionData were collected for number of branches per plant, number of pods per plant, number of seed per pod,and seed yield per hectare (kg/ha)for analysts and interpretations.Data Management and Statistical AnalysisAnalysis of variance (ANOVA) was computed for all collected data using GenStat 15th edition. Treatment means were separated using Duncanleast significant difference method (LSD) at 5% probability level for all statistically different means.Results and DiscussionResponse of sesame seed yield and its components to the combination of different NP fertilizers rates.The analysis of variance for 2014 cropping season revealed that the interaction of phosphorus and nitrogen fertilizers rate resulted in statistically significant differences (p<0.05) for sesame seed yield and number of branches per plant at Boko and Errer experimental sub-sites. These interactions also significantly (p<0.05) affected the number of pods per plant at Errer sub-site but did not at Boke sub-site. Number of seeds per pod was not affected by the interaction effect of the fertilizers at both experimental sub-sites (Table 1). In contrary, except the number of seeds per pods at Errer sub-site, all the seed yield of sesame, number of branches and pods per plant and seed per pod were significantly affect by the interaction effects of the fertilizers during 2015 cropping season(Table 2)Accordingly, in 2014, the highest mean seed yield (867.8) and number of branches per plant (23.33) were recorded for sesame crops that received the combination of 60 P:0 5 kg ha' 1 and 30 N kg ha' 1 and 40 P2Os kg ha' 1 and 20 N kg ha 1 phosphorus and nitrogen fertilizers rates, respectively at Boke experimental sub-site while fertilizer combination of 60 P2O5 kg ha 1 and 30 N kg ha'1 resulted in the highest mean values of sesame seed yield and number of branches at Errer sub-site (Table 1). This maximum yield achieved at Boke from the combination of 60 P2O5 kg ha' 1 and 30 N kg ha 1 was superior to yields obtained when all the nitrogen fertilizer rates are applied without phosphorus, combination of 40 P2Os kg ha-' and 30 N kg ha'1, and 80 P20 5 kg ha' 1 and 0 N kg ha 1 while the maximum number of branches per plant obtained at the same sub-site from the combination of fertilizer rates at 40 P20 5 kg ha'1 and 20 N kg ha 1 was significantly higher than all the rest fertilizer combinations except for 0 P20 5 kg ha'1 and 10, 20, 30 N kg ha'1, 60 P2O5 kg ha and 10 and 30 N kg ha'1 phosphorus and nitrogen fertilizer combinations (Table 1). Significantly the highest maximum sesame seed yield (912.5) was obtained at Errer experimental sub-site from the combination of 60 P20 5 kg ha'1 and 30 N kg ha' 1 phosphorus and nitrogen rates which was superior to all the rest fertilizer combination rates. At Error, again significantly a maximum number of branches per plant (22.33) was achieved from combining 60 P20s kg ha 1 and 30 N kg ha’1 rates of phosphorus and nitrogen fertilizers which was superior to the number of branches obtained from no fertilizer treatment, 0 P2Os kg ha 1 and 10 N kg ha1, 40 P20 5 kg ha'1 and 0 and 10 N kg ha1, 40 P2Os kg ha and 30 N kg ha'1, 60 P2O5 kg ha' 1 and 0 to 20 N kg ha'1, and 80 P20 5 kg ha'1 and 0 to 30 N kg ha'' combinations of the fertilizers. The number of pods per plant (67.33 and 67.00) of sesame was highest at Errer sub-site from the combination of 40 and 8OP2O5 kg ha'1 and0 N kg ha' 1 rates of the fertilizers and these were only superior to the number of sesame pods per plat achieved by the combination of OP2O5 kg ha' 1 and 30N kg ha'1, and 80 P20 5 kg ha'1 and 20 and 30N kg ha 1 phosphorus and nitrogen fertilizers rates (Table I). Similar to 2014, in 2015 cropping season 60P?Oj kg ha 1 and 30N kg ha 'combination of the fertilizers resulted in the highest maximum sesame seed yields (964.2 and 897.2), and number of branches and pods per plant (15.17 and 9.6; and 96.43 and 74.67). respectively at Boke and Errer experimental sub-sites and these numbers were a superior to all the rest fertilizer combination treatments (Table 2) The results obtained from the study on sesame yield differences at different combinations of NP fertilizer rates is in agreement with the
196

Oromia Agricultural Research Institute (IQQO), Crop research Proceeding 2017
results of Siddikem/. (2016) who reported increased and significant sesame seed yields when varying rates of NP fertilizers were combined for different environments. Similarly, (Reddy, 2004) reported that integrationof nitrogen and phosphorus fertilizers of different rates showed variations in number of pods and branches per plant.Over cropping season and location effects of NP fertilizers rate combinations on sesame seed yieldCombined analysis of variance over location and cropping seasons showed statistically significant differences (p<0.05) for sesame seed yields due to combination of the different rates of phosphorus and nitrogen fertilizers (Table 3). The maximum and superior sesame seed yield (891) to all the rest of NP fertilizer combination rates was obtained from the integration of 60P20 5 kg ha' 1 and 30N kg ha'! phosphorus and nitrogen fertilizers. This sesame seed yield achieved from the combination of 6OP2O5 kg ha' 1 and 30N kg ha’'NP fertilizer rates was 35.7 and 72% greater than the average yields of all the rest fertilizer combinations and the no fertilizer application, respectively. This result confirms the finding of (Shiferawef a/., 2012) who reported 35% sesame seed yield increment due to application of 38/29 kg ha'1 NP2O5 fertilizers at planting. Similarly, Hosseiner al. (2007) recorded the highest sesame seed yield with the application of 60 kg N ha' 1 and Okparae/ al. (2007) found that application of 75 kg N ha'1 and 26 kg P ha' 1 significantly increased sesame seed yield per hectare.Over cropping season and location effects of NP fertilizers rate combinations on sesame number of branches per plantCombined analysis of variance over location and cropping seasons showed statistically significant differences (p<0.05) for sesame number of branches per plant as a result of combining different rates of phosphorus and nitrogen fertilizers (Table 3). The maximum and superior number of branches per plant(28.71) to all the rest of NP fertilizer combination rates was obtained from the integration of 6 OP2O5 kg ha' 1 and 30N kg ha' 1 phosphorus and nitrogen fertilizers. This highest sesame number of branches per plant achieved from the combination of 60P20> kg ha'1 and 30N kg ha''NP fertilizer rates was 66.4 and 43.6% greater than the average number of branches per plant of all the rest fertilizer combinations and the no fertilizer application, respectively. This result confirms the finding of Olowe and Busari (2000) who found that application of 60 kg N ha' 1 and 13kg P ha'1 produced significantly the highest number of branches per plant.Over cropping season and location effects of NP fertilizer rate combinations on sesame number of pods per plant and seeds per podCombined analysis of variance over location and cropping seasons showed statistically significant differences (p<0.05) for sesame number of pods per plant as a result of combining different rates of phosphorus and nitrogen fertilizers, however, the interaction did not affect the number of seeds per pod (Table 3). The maximum number of pods per plant (68.67) was obtained from the integration of 6 OP2O5 kg ha'1 and 30N kg ha' 1 phosphorus and nitrogen fertilizers. This combined mean number of sesame pods per plant achieved from the combination of 60P20 5 kg ha' 1 and 3QN kg ha'NP fertilizer rates was 42.4% greater than the no fertilizer application treatment. This result confirms the finding of Olowe and Busari (2000) who found that application of 60 kg N ha"1 and 13kg P ha'1 produced significantly the highest number of sesame capsules/pods per plant.Conclusion and RecommendationsThe results of these experimental researches from both locations across the experimental years indicated that sesame seed yield, and number of branches and pods per plant were significantly influenced by the combination of different phosphorus and nitrogen fertilizer rates across locations and experimental seasons. Sesame plantsreceived 6 OP2O5 kg ha' 1 and 30N kg ha 'NP integrations of
197

Oromia Agricultural Research Institute (IQQO), Crop research Proceeding 2017
the fertilizers rates resulted in significantly the highest combined means of sesame seed yield (891), number of branches per plant (28.71) and number of pods per plant (68.67) compared to crops treated with most of the fertilizer combinations and the no fertilizer control plots. The yield of sesame seed achieved from the combination of 60P20 5 kg ha"' and 30N kg ha 'NP fertilizer rates was 35.7 and 72% greater than the average yields of all the rest fertilizer combinations and the no fertilizer application, respectively. Similarly, the highest number of sesame branches per plant obtained from the combination of 60P20 5 kg ha' 1 and 30N kg ha 'NP fertilizer rates was 66.4 and 43.6% greater than the average number of branches per plant of all the rest fertilizer combinations and the no fertilizer application, respectively. Furthermore, the combined mean number of sesame pods per plant recorded from the combination of 60P20 S kg ha 1 and 30N kg ha 'NP fertilizer rates was 42.4% greater than the no fertilizer application treatment. Therefore, to sesame growing farmers in Haraghe zone application of the combination of 60P20 5 kg ha' 1 and 30N kg ha 1 phosphorus and nitrogen fertilizer rates can be recommended for improved sesame production and productivity particularly to at Fedis, Errer and other similar environments of the area.
Table. 1 Yield and some yield parameters of sesame as affected by the interaction of different NP fertilizer rate combinations at Boke and Errer experimental sub-sites (2014)
Fertilizer Com binations Sesame seed yield and yield component, at Fadis (B oke)
Sesame seed yield and yield component, at Errer
Seed yield (kg
ha'1)
Num ber o f Branches per plant
Num ber o f Pod
per plant
Num be r of
Seeds per pod
Seedyield
(kg/ha)
Num be r o f
Branch es per plant
Num be r o f
Pod per plant
Num b er o f
Seeds per pod
0P2O 5 kg ha'1 and ON kg ha-1 525.0c 14.33cd 57.67 31.67 616.7c 15.00bc 56.33ab 28.67
OP2O j kg ha'1 and lO k g N ha'1 680.6bc 17.67abc 66.33 34 720.8bc 2l.67ab 55.67ab 31
0P2O 5 kg ha'1 and 20 kg N h a 1 628.9bc 18.33ab 47.33 33 763.9bc 19.33ab 44.67b 30
OP2O j kg ha'1 and 30 kg N ha'1 522.2c I6.67abc 57 32.33 648.6c 20.67ab 6.00ab 29.33
40 P20 5 kg ha'1 and 0 N kg ha'1 759.7ab 12.67cd 58 33.33 754.2bc 16.67bc 67.33a 30.33
40 P iO j kg ha'1 and 1 0 N kg ha'1 754.4ab 11.33cd 56.67 31.67 697.2bc I5.33bc 55.67ab 28.67
40 P20< kg ha'1 and 20 N kg ha'1 731.9abc 23.33a 56.67 32.67 847.2b 20.00ab 55.67ab 29.67
40 P20 5 kg ha'1 and 30 N kg ha'1 641.7bc 11.67cd 57 33 625.0cc
15.67bc 56.33ab 30
60 P2O j kg ha'1 and 0 N kg ha 1 709.4abc 8.67d 67 32.33 679.2bc 16.67bc 56.00ab 29.33
60 P20 5 kg ha'1 and 10 N kg ha'1 794.2ab I8.33ab 57 32 630.6c 18.33bc 56.67ab 29
60 P20 5 kg ha'1 and 20 N kg ha'1 759.7ab 12.67cd 56.67 33 675.0bc 16.67bc 55.67ab 30
60 P ,0 5 kg ha'1 and 30 N kg ha'1 867.8a I8.33ab 67.33 31.67 912.5a 22.33a 56.00ab 28.67
80 P20 5 kg ha'1 and 0 N kg ha'1 610.8bc 13.33cd 67.33 32.67 673.6bc 17.33bc 67.00a 29.67
80 P20< kg ha'1 and 10 N kg ha'1 686.labc 12.33cd 56.67 32.67 683.3bc 16.33bc 56.00ab 29.67
80 PiO.c kg ha'1 and 20 N kg ha'1 697.2abc 9.00d 57 32.67 691.7bc 13c 44.67b 29.67
80 P20 5 kg h a '1 and 30 N kg h a '1 818. lab 8.00d 57 33.67 677.8bc 12c 55.67ab 30.67
C V ( % ) 15.4 11.4 12.3 4.4 18.8 10.9 19.9 4.9
L S D (5 % ) • * N S N S * • * N S
NS=Not significant. Means with the same letters in a column are nonsignificant at 5% probability level.
198
Oromia Agricultural Research Institute (IQQO), Crop research Proceeding 2017
Table.2 Yield and some yield parameters of sesame as affected by the interaction of different NP fertilizer rate combinations at Boke and Errerexperimental sun-sues z>) Fertilizer Combinations Sesame seed yield and yield components at Fadis (Boke) Sesame seed yield and yield components at Errer
Seed Number of Number of Number of Seed Number of Number N umberyield (kg Branches per Pod per Seeds per yield (kg Branches per of Pod per of Seeds
ha'1) plant plant pod ha'1) plant plant per pod0P2O5 kg ha' 1 and ON kg ha"1 598.6b 7.47bc 65.5bc 44.33b 652.5d 5.67c 69.67ab 460P:O5 kg ha-1 and 10kg N ha' 1 664.4b 6.00c 56.00c 53.00ab 746.1c 6.33c 64.33ab 42OP2O5 kg ha'1 and 20 kg N ha' 1 715ab 6.33c 56.33c 44.00b 772.2bc 6.33c 62.33ab 45.330P2Os kg ha 1 and 30 kg N ha 1 650.8b 4.33c 49.33c 54.00ab 702.8c 6.00c 61.00ab 4440 P2O5 kg ha' 1 and 0 N kg ha' 1 700.6b 5.83bc 59.83bc 55.67ab 756.9c 7.67b 73.67ab 44.6740 P2O5 kg ha' 1 and 10 N kg ha' 1 886.7ab 6.5bc 87.17ab 53.67ab 748.9c 7.00b 72.00ab 44.6740 P2O5 kg ha' 1 and 20 N kg ha 1 865.3ab 7.53b 89.83ab 57.00ab 807.5ab 7.33b 71.33ab 46.6740 P2O5 kg ha' 1 and 30 N kg ha' 1 804.2ab 6.83c 56.83c 44.33b 799.7b 6.67b 62.67ab 4460 P2O5 kg ha' 1 and 0 N kg ha' 1 723.6b 5.17bc 67.67abc 59.33a 727.8b 6.33c 62.33ab 44.6760 P2O5 kg ha 1 and 10 N kg ha' 1 938.9a 6.33bc 60.33bc 55.67ab 760.6c 9.00a 69.00ab 46.6760 P:0<, kg ha' 1 and 20 N kg ha' 1 741.lab 12.43ab 59.17bc 49.33ab 780.0b 7.67b 59.67b 4460 P:0 5 kg ha' 1 and 30 N kg ha'1 964.2a 15.17a 96.43a 61.00ab 897.2a 9.67a 74.67a 4480 P2O5 kg ha'1 and 0 N kg ha' 1 898.6ab 5.33c 50.33c 53.67ab 653.6d 6.67b 64.67ab 4680 P2O5 kg ha'1 and 10 N kg ha' 1 672.5ab 7.00bc 75.00abc 48.33ab 643.9d 5.67c 59.67b 4480 P2O5 kg ha' 1 and 20 N kg ha'1 891.4ab 5.17c 52.17c 49.67ab 774.2bc 6 .00c 66.00ab 45.3380 P2O5 kg ha'1 and 30 N kg ha' 1 842.8ab 6.50bc 65.50bc 47.00ab 646. Id 7.33b 74.33a 43.33CV (% ) 19.1 25.8 25.8 13.1 16.7 7.3 7.3 6.4LSD (5%) 269.7 7.6 27.6 11.42 170.68 1.33 11.7 NSNS=Not significant. Means with the same letters in a column ore non-significant at 5% probability level.
199
Oromia Agricultural Research Institute (IQQO), Crop research Proceeding 2017
Table.3 The overall mean interaction of sesame yield of the two locations (Erer and Fadis) in 2014 & 2015
Fertilizer Combinations Seed yield (kg ha'1)Number of
Branches per plant
Number of Pods Pod per plant
Number of Seeds per
pod0P2O5 kg ha 1 and ON kg ha' 1 518.lOd 20.00b 48.21b 41.580P2O5 kg ha'1 and 10kg N ha'1 703.00bc 17.42b 58.2 lab 40.00OP2O5 kgha' and 20 kgNha'1 670.0bc 17.33b 57.50ab 38.080P2C>5 kg ha'1 and 30 kgNha1 651,6bc 19.42b 57.75ab 39.9240 P205 kg ha'1 and 0 N kg ha'1 692.8bc 15.71b 57.83ab 41.0040 P2O5 kg ha 1 and 10N kg ha'1 696.9bc 19.21b 57.46ab 39.6740 P205 kg ha'1 and 20 N kg ha 1 763b.00 23.62b 57.04b 41.5040 P205 kg ha'1 and 30 N kg ha'1 617.6cd 14.21c 57.67ab 37.8360 P:05 kg ha' 1 and 0 N kg ha'1 6I7.7cd 15.02c 58.00ab 41.4260 P205 kgha' 1 and 10N kg ha'1 652.2bc 20.00b 58.58ab 40.8360 P205 kg ha' and 20 N kg ha'1 639.00c 14.54c 58.2 lab 39.0860 P2O5 kg ha'1 and 30 N kg ha'1 891.00a 28.71a 68.67a 38.8380 P205 kg ha'1 and 0 N kg ha'1 659.2bc 18.92b 58.54ab 40.5080 P:05 kg ha'1 and 10 N kg ha'1 614.0cd 13.33c 58.33ab 38.6780 P205 kg ha'1 and 20 N kg ha'1 663.6bc 17.54b 57.58ab 39.3380 P205 kg ha' 1 and 30 N kg ha'1 693.7bc 12.46c 58.17ab 38.67CV (%) 18.3 13.6 19.8 9.6LSD (5%) 126 3.62 11.28 NS
NS = Nonsignificant: Means with the same letters in column are nonsignificant at 5% probability level.
ReferenceAkhtar K..S., Buriro M.. Nadeem A., Ahmed N., Saeed Z., Mohammad F., and Ahmed S., 2015.
Response of Various Sesame Varieties under the Influence of Nitrogen and Phosphorus Doses, (February), 405-412.
Ashri A., 1994. Genetic resources of sesame: Present and future perspectives. In: Arora, R.K. and Riley, K.W. (Eds). Sesame Biodiversity in Asia-Conservation, Evaluation and Improvement, 1PGR1 Office for South Asia, New Delhi, India. Pp. 25-39.
Central Statistical Agency, 2013. Agricultural Sample Survey 2012/2013 (2005 E.C.), Report on Area and Production of Crops (Private Peasant Holdings, Meher Season), Vol. 1.
Hossein M. A., A. Hamid and S. Nasreen, 2007. Effect of nitrogen and phosphorus fertilizer on N/Puptake and yield performance of Groundnut (Arachishypogea L.). J. Agric. Res. 45 (2): 119- 127
Okpara D. A., C. O. Muoneke and T. A. Ojikpong, 2007. Effects of nitrogen and phosphorus fertilizer rates on the growth and yield of sesame (Sesamumindicum L.) in the Southeastern Rainforest Belt of Nigeria. Nigerian Agri. J. (38): 1-11.
Olowe V. /. O., and Busari L. D., 2000. Response of Sesame (Sesamumindicum L.) to Nitrogen and Phosphorous Application in Southern Guinea Savanna of Nigeria. Tropical OilseedJournal. 30- 37.
Reddy SR., 2004. Principles of Crop Production. Kelyani Publishers, New Delhi, India p. 649.
200

Oromia Agricultural Research Institute (IQQO). Crop research Proceeding 2017
Shiferaw Tadesse, ZerihunAbebe, TadesseBirhanu, ToleraAbera, AschalewSisay, Dagnachew Lule and AbeyaTemesgen, 2011. Effects of fertilizer and cultural practices on seed yield and yield components of sesame and linseed in Western Oromia. Pp. ///.GeremewTerefe, AdugnaWakjira and DejeneGorfu (eds.)
Siddik A.. Shirazy B. J., Islam M. M., and Hoque A., 2016. Combined effect of nitrogen and NAA on the yield of Sesame (Sesamum indicum L.),l-9. http://doi.ors/10.15192/PSCP.SA.2016.
Wijnands J.H.M., Biersteker J., Van Loo E.N., 2009. Oil seed business opportunity in Ethiopia. Oil seed research report. Addis Ababa, Ethiopia.
Wijnands J., Biersteker J„ and Hiel R., 2007. Oilseeds Business Opportunities in Ethiopia. The Hague 30 pp.
System Productivity as Influenced by Double Cropping of Maize as Green Cob Intercropped with Haricot Bean followed by Sorghum Intercropped with Groundnut in Fedis District
Fuad Abduselam1’, Alemayehu Biri1 and Zeleke Lagesse11 Fedis Agricultural Research Center, P.O. Box, 904 Harar, Ethiopia
Corresponding author: [email protected] cropping system is one of the main agronomic practices that can copeup with variable climate changes and/or erratic rainfall distribution and amount. Such types of practices can hamper total crop failure due to erratic rainfall distribution, which is also true for Fadis and similar ag?v-ecological areas. Therefore, thee study was conducted at Fedis Agricultural Research station duringf 2015 and 2016 cropping seasons. The experiment had two components: the first preceding component crops were early types of four maize varieties ( Melkasa-2, Melkasa-3, Melkasa-4 and Melkasa-6) intercropped with a haricot bean variety ( Awash melka) as wel as sole cropping and planted in Belg rainy season whereas ihe second component of the succeeding component crops in which four early types of sorghum ( Gambela 1107. Birhan. Gubiye and Hormat) varieties were intercropped with groundnut as well as sole cropping were planted in the main seasons ( meher season). The experiment was laid out using RCBD with three replications. The result revealed that the highest grain yield of haricot bean was obtained from sole Awash melka (2344 kg ha'1) whereas the highest effective ear of maize in 2016 year were obtained from Melkasa-2 intercropped with Awash melka. and Melkasa-6 intercropped with Awash melka variety of haricot bean. On the other hand, the highest grain yield of sorghum in succeeding cropping system was obtained from Gam bell a 1107 under sole and intercropped with groundnut and the next highest yield was obtained from sole Hormat variety. The highest monetary value were obtained when Melkasa-2 ((85998 ETB ha'1) intercropped with Awash melka and as sole (74286 ETB ha'1) as preceding component crops. On the other hand, the monetary value from the succeeding component crops were obtained from ntercropping Gambella 1107 variety with groundnut variety (29809 Birr ha'1 ) followed by Hormat ntercropped with groundnut (29794 Birr ha ). Therefore, early planting of Melkasa-2 as intercropping with early types of haricot bean as preceding crops during the Belg' seasons and use of Gambella 1107 variety of sorghum as main crop intercropped with the early types of groundnut as second crops can also be used as the succeeding crops in double cropping practices in Fadis and similar agro-ecology’ areas receiving bi-modal rainfall distribution.
Keywords: double cropping, Maize, Haricot bean, Sorghum, Groundnut and Intercropping IntroductionDouble-cropping (also known as sequential cropping) is the practice of planting a second crop immediately following the harvest of a first crop, thus harvesting two crops from the same field in one year. This is a case of multiple cropping, which requires a season long enough and crops that mature
201

Oromia Agricultural Research Institute (IQQO), Crop research Proceeding 2017
quickly enough to allow two harvests in one year. Intercropping, the simultaneous growing of two or more crops in space and time on the same land is an important feature of cropping systems in the tropics (Francis, 1986; Connolly et al., 2001). In many parts of Ethiopia sorghum is usually grown mixed with crops, especially legumes. Intercropping is one of the cropping systems covering about 20% of the total sorghum production in the country (Yilma 1977). The most common advantage of intercropping is the production of greater yield on a given piece of land by making more efficient use of the available growth resources using a mixture of crops of different rooting ability, canopy structure, height, and nutrient requirements based on the complementary utilization of growth resources by the component crops (references). Moreover, intercropping improves soil fertility through biological nitrogen fixation with the use of legumes, increases soil conservation. Intercrops often reduce pest incidence and improve forage quality by increasing crude protein yield of forage (references). Intercropping provides insurance against crop failure or against unstable market prices for a given commodity, especially in areas subject to extreme weather conditions such as frost, drought, and flood (references). Thus, it offers greater financial stability than sole cropping, which makes the system particularly suitable for labor-intensive small farms. Besides, intercropping allows lower inputs through reduced fertilizer and pesticide requirements, thus minimizing environmental impacts of agriculture.However, farmers in Fedis district were accustomed to sow the local varieties and even striga resistant varieties at the middle of April. This is because farmers are not volunteer to leave their land idle until the right planting time (from middle of June to the beginning of July) of the early maturing striga resistant varieties. As a result, these improved varieties were matured before the local varieties and became susceptible to the high bird infestation prevailed in the area. So, this resulted in complete crop failure. To alleviate this problem it is important to accomplish participatory action research which helps the farmer to compare his already accustomed and untimely planting practice with double cropping of improved, adapted and early maturing with his active involvement in management and evaluation of the crops.. With this background, this study was done to assess the effect of double cropping on yield, and yield components of the component crops and to compare the productivity of the double cropping system with the single cropping system.Materials and Methods Description of the study areaThe experiment was conducted at Fedis Agricultural Research Center in Fedis district and. Fedis district is found at latitude between 8°22’ and 9°14’ North and longitude between 42°02’ and 42°19’ East, in middle and low land areas and the altitude range is from 1200-1600m.a.s.l with a prevalence of low lands. The district receives average annual rainfall of 400-804 mm; the minimum and maximum air temperature of 20-25°c and 30-35°c, respectively.The experiment was conducted during the main cropping season of 2015 and 2016 under rain fed conditions. Boko is 24km far from Harar town in the South direction. Commonly sorghum is the staple crop cultivated by farmers, in the vicinity of the site. Vertisols and Afilsols soil type are common to the area (Fedis Woreda Profile, 2011). Soil is loam in texture with pH of 7.4 (FARC, 2012). As in the most of the Horn of Africa, two rainy seasons characterize Fedis woreda’s climate. The first named ‘Belg’ is the shortest one and takes place between March and May. while the second and the most important is ‘Meher’ between July and October. The rainfall distribution during the year is bi-modal, with a dry-spell period during the months of June and July which, depending on its duration, may affect crop growth.Description of the Experimental Materials
202
Oromia Agricultural Research Institute (IQQO), Crop research Proceeding 2017
The experimental materials used for this study were divided into two, which were used as preceding and succeeding crops. The crops used as preceding crops (early types of maize and haricot bean) were selected on the basis of their current and potential importance and mainly for their early maturity. The succeeding crop used was sorghum and ground nut. Field trials were arranged in randomized complete blocks design in three replications using nine treatment combinations. Plot size used was 3.5 m x 3 m for each treatment during both seasons. The trial was started with sole planting and intercropping of 4 early maturing OPV maize varieties namely: Melkasa-2, Melkasa-3, Melkasa-4 and Melkasa-6 and were intercropped with one early maturing haricot bean. Awash melka variety as precursor crops. The Maize was harvested at green cob stage which is locally known as “Ashita” . As succeeding treatment, four sorghum varieties (Gambela 1107, Birhan, Gubiye and Hormat) were planted with one early maturing Groundnut variety (worer 98).The first sowing was planted at sowing time of local sorghum varieties (in the middle of April at the onset of the first rain). Then all the necessary management was accomplished according to the recommendation. Fanners from different PAs in the vicinity were invited to see the performance of the different crops and their perception regarding the performance of the varieties. At green cob stage, the maize was harvested and the haricot bean was harvested at maturity. After the preceding crops were harvested, the succeeding crops ( both sorghum and groundnut) were planted on the plots, and four early maturing OPV sorghum varieties were planted as sole and intercropped with groundnut. . At sowing, all plots received a basal application of Di Ammonium Phosphate (DAP, 18% N, 20% P) at the rate of 50 kg ha'1. At knee height growth stage of maize and sorghum, N in the form of urea (46% N) was applied at the rate of 100 kg ha 1 to all plots. Hand weeding and frequent hoeing were done for weeds.’able 1: Treatments used as preceding and succeeding for the experiment
No Preceding treatments Succeeding treatments1 Melkasa 2 + Awash melka Birhan + Groundnut ( Werer 98)2 Melkasa 3 + Awash melka Hormat + Groudnut (Werer 98)3 Melkasa 4 + Awash melka Gubiye + Groundnut ( Werer 98)4 Melkasa 6 + Awash melka Gambela 1107 +Groundnut(Werer 98)5 Sole Melkasa 2 Sole Birhan6 Sole Melkasa 3 Sole Hormat7 Sole Melkasa 4 Sole Gambela 11078 Sole Melkasa 6 sole gambela 11079 Sole Haricotbean sole GN
AM= Haricot bean variety Awash melka, GN= Ground nut variety werer 98Data collectionData collected for Maize was number of effective ear harvested were counted and converted into kg ha'1 since the economic part considered for this activity were at green cob stage “Ashita” and data collected for haricot bean and ground nut were grain yield while data collected for sorghum were days to flowering, days to maturity, plant height and grain yield.Gross Monetary Value (GMV): GMV was determined to evaluate the economic advantage of the cropping system as compared to sole cropping. It was calculated from the yield of preceding and succeeding treatment combinations in order to measure the profitability of double cropping as compared to sole cropping of the component crops. Gross monetary value was calculated by multiplying yields of the component crops by their respective market price as stated by Willey (1979). During July 2016, the price for haricot bean and Maize “Ashita” were 12 and 2 Ethiopian Birr (ETB) per kg and per ear
203

Oromia Agricultural Research Institute (IQQO), Crop research Proceeding 2017
respectively, and 10 ETB kg' for haricot bean in 2015 and the price for sorghum grain and groundnut was 8 and 27 ETB kg '. While during December 2016, 7 and 22 ETB per kg for sorghum grain and groundnut yield respectively, at Harar grain market. Thus, this price was used to calculate the monetary value of the treatments used in this experiment.Data AnalysisAnalysis of variance for the design was carried out using Genstat 15th edition software for the parameters studied following the standard procedures outlined by Gomez and Gomez (1984). When the treatment effects were found to be significant, the means were separated using the least significant difference (LSD) test at 5% level of probability.Result and Discussion Preceding treatments
Comparison of crops that have different economic part, growth patterns and yield components is so difficult. However, since one of the objectives was to select the best sequential combination for ‘Belg' season to be followed by sorghum which is considered as major crop and grown during ‘Meher’. One of the characteristics that are required to be fulfilled is its earliness before time of planting for sorghum for Meher' from end of June up to mid-July. Thus, the majorly considered data for the preceding crops were
earliness of targeted economic part. Maize green cob called “Ashita” were considered as economic part of which only effective ears were considered to be eaten after roasting in this experiment.In 2015 cropping season, maize has failed to bear any ear due to drought while in 2016 cropping season, effective ears had showed highly significant difference ( at P < 0.01) and haricot bean variety had showed non-significant difference in 2015 and while highly significant difference ( at P< 0.01) were observed in 2016 on haricot bean yield (kg ha1) during the study (Table 1). The result also showed that yield of haricot in 2015 was very low compared to 2016 which were due to stress happened in the growing season of 2016 (Table 2).Table 2: Mean performance of effective ear of maize and haricot bean yield for preceding treatments at Fedis during 2016 and 2017 cropping season_____________________________________________________
Treatment2015 2016
Effective ear (No.) HB yield (kg ha' ')
Effective ear (No.) HB yield (kg ha"')
M-2 x AM 633 38095b 1743bM-3 x AM 717 24762* 1292*M-4 x AM 660 22540e 1285*M-6 x AM 575 32063c 954cSole M-2 - 41270° -
Sole M-6 - 27302d -
Sole M-4 - 25079* -
Sole M-3 - 26349d -
Sole AM 1057 - 2344“LSD 421.5 2762.8 507.1CV 30.7 5.3 17.7P (0.05) NS ** **
204

Oromia Agricultural Research Institute (IQQO), Crop research Proceeding 2017
In 2016 cropping season, the highest effective ear of maize were obtained from the treatment of sole M-2 (41270 cobs ha'1), M-2 x AM (38095 cobs ha'1) and M-6 x AM ( cobs ha1) while the lowest effective ear number were obtained from M-4 x AM (22540 cobs ha'1) and M-3 x AM (24762). In the same cropping seson, the highest grain yield of haricot bean were obtained from sole AM (2344 kg ha'1) followed by M-2 x AM (1743 kg ha'1) and M-3 x AM (1292 kg ha'1). Similar research findings in the study area revealed that same variety of haricot bean yielded up to 1519 kg ha'1 (Fuad et al., 2017). In another study conducted by Fadis Agricultural Research Center (FARC), 2013 it has been reported that on double cropping of common bean varieties followed by main season early maturing striga resistant sorghum varieties at Boko, common bean variety Awash Melka was recorded highest yield of 1862.8 kgha'1 (FARC, 2013).Succeeding treatments : The treatments used during succeeding period were four sole sorghum, one sole ground nut and intercropping of the four sorghum varieties with ground nut variety (Werer 98). Sorghum had shown significant difference (P < 0.05) on days to flowering and highly significant difference (P < 0.01) on days to maturity and plant height in 2016. On the other hand, non-significant difference were observed on days to flowering and days to maturity while plant height was showed highly significant variations (P < 0.01) in 2015 main season. (Table 3). The variation observed among the varieties was due to varietal difference.The latest days to flowering were observed by Gambella 1107 variety in both cases of sole and intercropping taking 74 days after planting followed by Gubiye X GN (74 days), Sole Hormat (73 days) and Hormat intercropped with groundnut (72 days) which are all statistically at par during 2016 cropping season (Table 3). However, the earliest days to flowering were observed by Birhan variety under both sole and intercropping taking 68 and 70 days, respectively. Fuad et al. (2015) has reported that Gambella 1107 showed the earliest days to flower at Fedis (71 days after planting) and Erer ( 69 days after planting) which is in agreement with the current research finding.. The same authors in the same locations revealed that Gubiye variety of sorghum took 59-68 days after planting to flower (Fuad et al., 2017; Samuel et al.,2013).Table 3: Mean performance of growth parameters of succeeding treatments of sorghum at Fedis during 2015-2016 cropping seasons
2015 2016T reatment DF DM PH (cm) DF DM PH (cm)
(Days) (Days) (Days) (Days)Gambella 1107 +GN 73.33 129.67 166.83 74.33a 131.703 152.403Sole Gambella 1107 74.33 133.00 173.38 74.33a 130.703 149.303Gubiye + GN 75.33 131.67 113.2C 73.67ab 119.30* 100.90°sole Hormat 73.33 132.00 132.7b 73.33ab 131,00a 127.00°Hormat +GN 72.33 129.67 123.2** 72.00abc 129.70a 120.00*sole Gubiye 72.00 128.33 129.00h 71,67abc 115.30c 102.30"Birhan +GN 67.67 124.00 133.40b 70.00* 122.70b 102.70desole Birhan 69.67 127.00 125.50* 68.33c 120.70k> 112.40;dLSD 5.16 6.62 14.05 3.87 4.57 9.92CV 4.10 2.90 5.90 3.10 2.10 4.70P (0.05)L)K= Davs to tlowenne. DM=
NSL)avs to maturity. PH=
NSPlant height. UN=
**Ciround nui
* ** **
205

Oromia Agricultural Research Institute (IQQO), Crop research Proceeding 2017
Earliest days to maturity in 2016 year were observed by sole Gubiye (115 days) followed by Gubiye intercropped with Groundnut (119 days) and sole Birhan (121 days). However, the latest day to maturity recorded were 132, 131 and 131 days to mature for Gambella 1107 intercropped with Groundnut, sole Hormat and sole Gambella 1107 respectively (Table 3). Days to maturing of 117 and 113 days at Fedis and erer respectively. Similar results were also reported in the same study areas for the same varieties (Fuad et al., 2015; Tekle and Zemach, 2014).Yield of succeeding sole and intercropped sorghum and ground nut
Analysis of variance revealed that highly significant differences (P < 0.01) on sorghum yield (kg ha1) were observed during 2015 and 2016 cropping seasons. On the other hand, significant difference on yield performance of groundnut either in sole or intercropping was observed only in 2015 cropping season.. Overall, significantly higher yield was observed in sole cropping for each variety as compared to yield obtained under intercropping within each variety for sorghum except for Birhan and Gubiye in 2015. The highest grain yield of sorghum were obtained from sole and intercropped of Gambella 1107 variety and sole Hormat in both cropping seasons.. However, the lowest yield were obtained from sole Birhan (2111 kg ha1) and sole Gubiye (2625 kg ha'1) in 2015 and sole Gubiye (2006 kg ha ') and Gubiye intercropped with groundnut variety in 2016. The yield obtained during 2016 season for sorghum was low compared to previous seasons and the potential of the varieties. Similarly, ground nut yield was very low compared to potential of the variety which was due to weather condition of the season confounded with the climate change hampering/affecting crop production in the study area and in the country in general.Table 4: Mean performance of yield of sorghum and ground nut at Fedis during 2015-2016 cropping seasons
Treatment2015 2016Sorehum vield (Kgha'1)
GN yield (Kg ha'1)
Sorghum yield (Kg ha'1)
GN yield (Kg ha'1)
Gambella 1107+ GN 4340a 222.5b 2410a 360Hormat + GN 3584abc 420.6“ 2368ab 382Birhan + GN 2816^ 299.0b 2290abc 383Gubiye + GN 2511“* 296.2b 1916° 342Sole Gambella 1107 4951“ - 2603a -
sole Hormat 4051ab - 2378ab -
sole Gubiye 2625* - 2006bc -
sole Birhan 211 Id - 2397ab -
Sole GN - 260.0b - 552LSD 1408.2 115.2 396.8 172.4CV 23.8 20.4 9.9 22.7P (0.05) ** * * NSGN= Ground nut
Monetary Value of the Cropping SystemMonetary value of preceding treatmentsAnalysis of Monetary value of effective ear of maize, haricot bean and combination of preceding treatments revealed highly significant difference (P < 0.01) in 2016, but not significant 2015 year.. The price used to calculate monetary value was obtained from Harar local market which was 10 and 12
206

Oromia Agricultural Research Institute (IQQO), Crop research Proceeding 2017
Ethiopian Birr (ETB) for haricot bean in 2015 and 2016 respectively and 2 ETB for maize per Ear (Table5).Table 5: Monetary value (ETB ha'1) of different cropping sequence grown in double cropping system during preceding time at Fedis in 2015 and 2016.Treatment 2015 2016
MVM MVHB MVPT MVM MVHB MVPT
M-2 x AM - 6333 6333 6857Ib 17427b 85998aM-3 x AM - 7175 7175 44571* 12923* 57495d
M-4 x AM - 6603 6603 4057 lc 12847* 53419*
M-6 x AM - 5746 5746 577!4C 953 7C 6725lc
Sole M-2 - - - 74286a - 74286b
Sole M-6 - - - 49143d - 49143cf
Sole M-4 - - - 45143* - 45143''
Sole M-3 - - - 47429d - 47429f
Sole AM - 10571 10571 - 23439s 23439s
LSD - 4214.7 42147 4973 5071.4 5924.8
CV (%) - 30.7 30.7 5.3 17.7 6.1
P (0.05) - NS NS ** ** **
M= Melkasa, AM= Awash melka, MVM= Monetary value from maize, MVHB= Monetary value from Haricot bean, MVPT= Monetary value from preceding treatment combinations.
The higher total monetary value of maize (74286ETB ha ') and haricot bean (23439 ETB ha'1) was gained from sole Melkasa-2 and sole Awash melka, respectively. However, the highest monetary value were obtained when intercropping of Melkasa-2 with Awash melka (85998 ETB ha1) and sole Melkasa-2 (74286 ETB ha'1) during preceding time (Table 5). The highest monetary value obtained from treatments consisting of Melkasa-2 due to its earliness the the higher number effective ears were harvested. (Table 5) .Overall, total monetary value obtained was low in 2015 due to maize failure. However, diversifying farm products have such an advantage in which at least some income can be generated from the haricot bean remaining.Monetary value of succeeding treatments : The result of monetary value of the succeeding component crops revealed that the highest total monetary value (29809 Birr ha'1) was gained from intercropping Gambella 1107 variety of sorghum with groundnut (werer 98)followed by Hormat intercropped with groundnut (29794 Birr ha'1) (Table 6). The highest monetary value in this treatment of intercropping might be because of diversified options although the yields obtained from groundnut were low (Table 6).
207

Oromia Agricultural Research Institute (IQQO), Crop research Proceeding 2017
Table 6: Monetary value (ETB ha1) of sorghum-Groundnut intercropping as succeeding in doublecropping system at Fedis in 2015 and 2016 cropping seasons.Treatment 2008 2009
M VS M VGN M VST M VS MVGN M VSTGambela 1107 X GN 30378“ 4896b 35274“ 20076“ 9733 29809“Hormat X GN 25089abc 9254“ 34343* 19479“ 10315 29794“Birhan X GN 19711bcd 6579b 26290abc 18857“ 10342 29199“Gubiye X GN 17578cd 6516b 24094^ 15327b 9226 24553bSole Gambela 1107 34656a - 34656“ 20825“ . 20825csole Hormat 28356ab - 28356"* 19022“ . 19022cdsole Gubiye 18378cd - 18378cd 16051b - 16051*sole Birhan 14778d - 14778* 19708“ - 19708cSole GN - 5720b 5720e - 14907 14907eLSD 9857.5 2533.9 9647.1 2505.4 4653.9 3597.9CV (% ) 23.8 20.4 22.6 7.7 22.7 9.2P (0.05) ** * ** ** NS **
Conclusion and RecommendationMultiple cropping in a given season can be an insurance against total crop failure, by diversifying farm product one could guarantee his family for self sufficiency and increase his income. Overall, during preceding time in 2015 maize has failed to bear any ear due to drought and in 2016 effective ear has showed highly significant difference (P < 0.01) and haricot bean variety has showed non-significant difference in 2015 while highly significant differences on haricot bean yield (P< 0.01) were observed in 2016 cropping season. The highest grain yield of haricot bean was obtained from sole Awash melka (2344 kg ha'1) whereas the highest effective ear of maize in 2016 year were obtained from the treatment of sole and intercropping of Melkasa-2 with Awash melka, and Melkasa-6 intercropped with Awash melka variety of haricot bean. On the other hand, the highest grain yield of sorghum was obtained from Gambella 1107 under sole and intercropped with groundnut and the next highest yield was obtained from sole Hormat variety. The highest monetary value were obtained when Melkasa-2 ((85998 ETB ha'1) intercropped with Awash melka and as sole (74286 ETB ha ) as preceding component crops. On the other hand, the monetary value from the succeeding component crops were obtained from intercropping Gambella 1107 variety with groundnut variety (29809 Birr ha 1 ) followed by Hormat intercropped with groundnut (29794 Birr ha1). Therefore, early planting of Melkasa-2 as intercropping with early types of haricot bean as preceding crops during the ‘Belg’ seasons and use ofGambella 1107 variety of sorghum as main crop intercropped with the early types of groundnut as second crops can also be used as the succeeding crops in double cropping practices in Fadis and similar agro-ecology areas receiving bi-modal rainfall distribution.ReferencesFedisAgricultural Research Center (FARC), 2013. Soil Chemical Analysis: Regional Review,Zeway,
Ethiopia.Fedis Woreda Profile. 2011. Socio-economic Profile of Fedis District. East Hararghe, Ethiopia. FuadAbduselam, TamadoTana, Jamal Abdulahi. HabteNida, TayeTadese. Evaluation of Double Cropping
System for Sorghum Production at Fedis, Eastern Ethiopia. Journal of Plant Sciences. Vol. 5, No.2, 2017, pp. 75-81. doi: 10.11648/j.jps.20170502.15
208

Oromia Agricultural Research Institute (IQQO), Crop research Proceeding 2017
Gomez, K.A. and Gomez, A.A. 1984. Statistical Procedures for Agricultural Research, 2nd edition, John Wiley and Sons, New York, p.680.
Samuel Tegene, BirhanuAtomsa, Amsalu Ayana, AsratZewidie, AlemayehuBiri,GabisaBanti, Solomon Ayele and FikaduTaddesse, 2013. Efforts towards solving the disasterous effect of extreme strigahermonticainfestation and shortage of rain on sorghum production in the lowlands of eastern Ethiopia.Open American Journal of Agricultural ResearchVol. 1, No. 1: PP:01 - 15
TekleYoseph and ZemachSorsa, 2014. Evaluation of Sorghum (Sorghum bicolor (L.) Moench) Varieties, for Yield and Yield Components at Kako,Southern Ethiopia. Journal of Plant Sciences. Vol. 2, No. 4, 2014, pp. 129-133. doi: 10.11648/j.jps.20140204.12
PEST MANAGEMENT (PATHOLOGY, ENTOMOLOGY AND W EED )
The Impact of Planting Time on Sorghum Stalk Borer Infestation and Damage In West Hararghe, Oromia
Abdela Usmae1*, Abubaker Terbush1, Gabayo Chala1 and Kinde Lemesa1 Mechara Agricultural Research Center; Cereal Research Team; P.O.Box: 19, Mechara, Ethiopia
Corresponding author: [email protected] is the first most important cereal crop in West Hararghe. However, national figure of grain production still remains below the world average grain production per unit area due to different biotic and a biotic factor. Among the biotic factors, stalk borer is considered to be the most important insect pests of sorghum and maize in all areas of the country. As a management option, different scholars recommended sowing date. But there was conflicting report on the relationship between sowing time and borer infestation and damage. Even though sorghum is susceptible to stem borer in the area, there is no recommended sowing date that has been done so far. Therefore, it is very crucial to identify the better days of sowing in the zone to reduce pest infestation and increase yield of the crop. Thus, this experiment was designed to evaluate the effect of sowing date on infestation of sorghum stalk borer. Chiro variety was used for experimentation and sown at seven days interval for six weeks starting from I s' onset of rainfall. The treatments were arranged in RCBD with three replications. Each treatment had a control plot that was treated with two insecticides, carbaryle powders and Alpha cypermethrine. Based on combined analysis, mean percent infestation did not show significant variation (P<0.05) over location but it was highly significant at (P< 0.01) over years. The percent stalk borer incidence on untreated plot was highly significant at (P< 0.01) on both over years and over location. These variations also were shown significant at (P< 0.05) on percent stem tunnel length on untreated experimental plot over location while not significant on treated experimental plot.Length of the feeding tunnel and exit holes in sorghum stem and leaves were significantly higher in earlier planted crop than delayed sorghum. In general chemicals treatment with early planting double the grain yield at Hirna sub site but, based on pest infestation status late planting was recommended at both location (Mechara and Hirna) to reduce pest infestation and damageKeywords: Sorghum (Sorghum bicolor L), Chiro, Sowing date, B.fusca and C. partellus
IntroductionSorghum is the fourth primary staple food crop in Ethiopia after teff, maize, and wheat, both in area coverage, and production (CSA, 2012). In the country cereals comprise 78.23% (8.8 million ha) of the field crops of which sorghum accounts for 14.41%. In Ethiopia sorghum is grown in almost ali regions occupying an estimated total land area of 1.6 million ha (CSA, 2012). The productivity of sorghum in
209
Oromia Agricultural Research Institute (IQQO), Crop research Proceeding 2017
Ethiopia is low when compared to other African countries (FAOSTAT, 2006). Ethiopia’s average productivity of sorghum is <1.35 tons ha-1, ranking it fifth in Africa. It is a multipurpose crop, being utilized in different forms where the grain is used for making “ Injera" (large round pancake made from fermented dough) and “Telia” (local beverage drinks). It is also consumed in boiled and roasted forms. Sorghum is also essential source of feed for livestock where the stalk is used to feed animals in dry season. Moreover, its stalk is used as firewood and construction material.The national average sorghum productivity in Ethiopia is 2.0 tons/ha (CSA, 2012) which is far below the global average of 3.2 tons/ha (FAO, 2005). This is because of a number of factors. Several production constraints were identified as hindrance for sorghum production and productivity enhancement. The major constraints include drought, striga, insect pests (Stalk borer, midge and shoot fly), disease (grain mold, anthracnose and smut) and others. Among insect pests, stalk borers are considered to be the most important insect pests of sorghum and maize in all areas of the country (Jepson, 1954). Economically important species include the maize stalk borer (Bussoela fusca), the spotted stalk borer (Chilo partellus), and the pink stalk borer (Sesamia calamistis). Bussoela is important at higher altitudes (1700 meter above sea level and higher) whereas Chilo and Sesamia are important in the mid-altitudes (below 1700 m) (Sharma &Gautam, 2010). Contrary to these reports, B. fusca does occur in the lower altitudes in East Africa and it feeds on only a few host plant species (Addis, 2016). Yield loss due to stem borers in Africa vary from 0-100% among ecological zones, regions and seasons. In Sub Saharan Africa, they can cause 20-40% losses during cultivation and 30-90% losses postharvest and during storage (Nyukuri et al., 2014).In Ethiopia, both B. fusca and C. partellus are considered to be the most damaging insect pests, with reported yield losses of 0 to 100, 39 to 100, 10 to 19 and 2 to 27% from South, North, East and Western Ethiopia, respectively (Melaku and Gashawbeza, 1993; Melaku et al., 2006). The average yield loss of maize caused by cereal stem borers in Ethiopia can be estimated between 20 - 50% (Boeke et al., 2004). The severity and nature of stem borer damage depends upon the borer species, the plant growth stage, the number of larvae feeding on the plant and the plant’s reaction to the borer feeding. Feeding by borer larvae on sorghum and maize plants usually results in crop losses as a consequence of death of the growing point (dead heart), early leaf senescence, reduced translocation, lodging and direct damage to the ears (Nyukuri etal., 2014).Management options for control of stem borers are manipulation of sowing dates, inter-cropping, natural enemies of stem borers, chemical control, botanical, host-plant resistance and genetically modified maize. In Ethiopia, a number of experiments on sowing date effects on stem borer damage were conducted. However, the results obtained were variable. Contrary to what was known in the past, early planting in Ethiopia averted stem borer damage maleku et al (2006) reported decreasing borer population damage with delays in planting in Addis Zemen areas of Amhara region. This indicated that in northern Ethiopia where there was one effective rainy season and long dry season, the borer incidence behaved differently from regions receiving bimodal rain fall in the country such as Hawasa, Ziway, Adama, and Sirinka. Such a situation could also arise from current climate change. Therefore, early planting or late planting can be recommended in different areas. Even the term early is relative as it is linked to the onset of rainfall. For example, early sowing for Hawasa and Arsi Nagele is in mid to the end of April, while sowing for Ziway, Melkassa and Meiso is in mid to end of June. Identification of proper time of sowing has long been recommended for various pest and disease problems. However, there are conflicting reports on the relationship between sowing time and borer infestation and damage. In general, most authors
210

Oromia Agricultural Research Institute (IQQO), Crop research Proceeding 2017
recommended early planting while a few of them recommended late planting which suggests the need for optimizing sowing dates based on location (Melaku et al, 2006). Even though sorghum is susceptible for stem borer in the area, there was no recommended sowing date that had been done so far. Therefore, it is very crucial to identify the better sowing period in the study area to reduce pest infestation and increase yield of the crop. Therefore, this study was designed to evaluate the effect of sowing date on infestation of sorghum stalk borer.Materials and MethodsA field experiment was conducted to study the appropriate time of sowing that reduce the infestation of sorghum stem borer in one sorghum variety (Chiro) at Hirna (Haramaya University research sub site) and Mechara Agricultural Research center. The crop was sown at seven days interval six times starting from the onset of rainfall within the range of sorghum sowing in the area. This had been done starting from V' weeks of April in the first year (2014/15) and 1st week of May in the second year (2015/16)because of rainfall problem. The plot size was 3.75 m x 4.5 m =16.88m‘ with75cm and 25cm row and b/n plant spacing, respectively.The design used was RCBD in three replications. Each treatment has a control plot and replicated three times. In protected condition carbaryle powder was applied at the time of sowing and whole application of carbaryle powder was done at 12 days after sowing to manage soil inhabitant insect pest. One spray with Alpha cypermethrin was also done on 35th day after sowing, in order to protect the crop from stem borer and shoot fly. Observations were taken at regular intervals starting from fifteenth day of emergence of the crop for various pests. For stem borer incidence the observations on leaf scraping and pinhole damage was made at 35 DAE of the crop. The observations were made by counting the number of plants showing the symptoms and dividing to the total number of plants emerged per plot, then it was converted into percent leaf damage. Identification of the stem borer was carried out with reference to the key developed by Overholt et al. (2001).Data collectedThe data of percentage of infestation, Incidence, Stem tunnel length (cm) and adjusted grain yield (ku/ha) were collected using the following methods:
No. of larvae per plant%age of infestation = r— ----—---------- ------ p T T T x 100Total no. of larvae per each sampled plot
No. of leaf scraped or exit holed plant per plot (infected plant)% Incidence = ----------- — :-------------------------------------— --- ;------- X 100Total no. of plant sampled per plot
Stem tunneled (cm)% tunneling = -— —--- ---:------- — X 100Total length of the plant sampledYield Difference (ku/ha) =TMY-UMYWhere: TMY=Treated mean yield; UMY=Untreated mean yieldFor exit hole and tunnel length measurement, five plants from each date of planting were collected. Plant damage percentage was assessed during the vegetative stage just before butting stage visually by counting healthy and damaged plants. However, the exit holes made by stem borer from the five sampled plants were counted visually after removing the intact leaves on stem, and then proceed for tunnel length measurement. The mean length of tunneling was taken from five randomly selected plants at harvest. Thereafter, the sampled plants were dissected longitudinally, and then the groove made by stem borer was measured by using simple measuring scale in centimeter.
211

Oromia Agricultural Research Institute (IQQO). Crop research Proceeding 2017
Data analysis: All data were transformed before analysis, using the square-root transformation formula V(x+0.5). GenStat Statistical package 15th edition was used for the data analysis. LSD at 5% was used to separate the means.Results and Discussion : Over year mean percentage of stem borer infestation and Tunneling were not significant at (P<0.05) while percent incidence showed significant difference on untreated plot at Mechara (Table 1). At Hima, all parameters under consideration (Infestation, Incidence and Tunneling % ) on both treated and untreated plots were not significant at (P< 0.05) (Table 2). Even if it was not significant in all parameters in all location, the mean percentage of the first three (1-4) weeks sown sorghum crop were recorded higher than the last two (5 and 6) weeks cropped sorghum.
Table 1. Over year mean percentage of Infestation, Incidence and tunneling by stem borers at MecharaSowing date % Infestation % Incidence % Tunneling
Treated Untreated T reated Untreated Treated Untreated1st week 8.2 19.70 2.22 6.95a 24.62 33.682nd week 6.4 23.10 0.77 6.93a 18.67 26.073rd week 11.1 21.83 1.99 5.1 lab 11.73 25.504th week 7.9 20.15 2.64 3.37ab 12.15 22.325th week 13.0 0.67 1.88 1.62b 12.97 23.736th week 0.0 0.33 0.81 0.95b 11.92 14.60Mean 7.8 14.3 1.72 4.16 15.3 24.3LSD (5%) Ns Ns Ns 4.07 Ns NsS.E. 5.88 18.71 2.25 3.44 13.84 3.95Note: 1 week (Mechara 4/10/2014, 10/5/2015); 2 week (Mechara 4/17/2014, 17/5/2015); 3 week (Mechara 4/24/2014. 24/5/2015); 4 week (Mechara 5/1/2014, 31/5/2015); 5 week (Mechara 5/8/2014,6/6/2015); 6 week (Mechara 5/15/2014, 13/6/2015); Ns= not significant. LSD- Least significant Difference; S.E.= Standard Errors
Table 2. Over year mean percentage of (Infestation, Incidence and tunneling by stem borers at HimaSowing date % infestation Coincidence % Tunneling
Treated Untreated T reated Untreated Treated Untreated1 week 3.95 14.13 6.58 10.60 44.33 40.332 week 9.50 18.31 7.87 10.15 25.33 41.503 week 6.12 14.68 3.35 6.63 26.17 39.334 week 11.33 13.97 3.10 10.03 32.50 40.335 week 9.18 11.62 6.28 3.55 34.33 41.336 week 10.55 13.67 6.95 5.92 25.00 37.17Mean 8.4 14.4 5.7 7.81 31.3 40.0LSD (5%) Ns Ns Ns Ns Ns NsS.E. 11.29 13.78 2.00 5.44 35.09 2.46Note: 1 week (Hima 4/16/2014, 11/5/15); 2 week (Hima 4/23/2014, 18/5/2015); 3 week (Hima 4/30/2014, 25/5/2015); 4 week (Hima 5/7/2014, 1/6/2015); 5 week (Hima 5/14/2014, 8/6/2015); 6 week (Hima 5/21/2014. 15/6/2015); Ns = not significant, LSD=Least significant Difference, S.E. = Standard Errors
Based on combined analysis, mean percent infestation did not show significant variation (P<0.05) over location but highly significant at (P< 0.01) over years. The percent stalk borer incidence on untreated plot was highly significant at (P< 0.01) on both over years and over location. These variations were also significant at (P< 0.05) on percent stem tunnel length in untreated plot over location but not significant in treated plot (Table 3). The highest score of combined mean of untreated plot was observed on the sorghum plants sown at the first fourth (1-4) weeks after the onset of rainfall.
212

Oromia Agricultural Research Institute (IQQO), Crop research Proceeding 2017
Table 3. Combined analysis of percent infestation, incidence and tunneling, and grain yield over years andover location
% Infestation % Incidence % Tunneling Grain Yield (ku/ha)Sowing date T reated Untreated T reated Untreated Treated Untreated Treated Untreated1 week 6.1 16.9 4.4 8.8a 6.2 20.0ab 22.3a 16.9a2 week 7.9 20.7 4.3 8.5a 3.5 22.7a 16.4abc 17.4a3 week 8.6 18.3 2.6 5.8ab 3.3 I9.5ab 17.4ab 13.lab4 week 9.6 17.0 2.8 6.7ab 6.5 I5.0ab 19.0ab 1 l.7ab5 week 11.1 6.1 4.1 2.6b 4.8 I2.8ab 9.1 be 6.9b6 week 5.3 7.0 3.9 3.4b 5.0 9.1b 7.4c 8.2bMean 8.1 12.4 3.7 5.98 4.9 15.2 12.4*LSD Ns Ns Ns 3 9** Ns 10.0* 9.1* 7.4(5%) Location Ns 7.8* 2.4** 2.3** Ns 5.7* Ns Ns
Year 5.5** 6.4** Ns 2.4* Ns Ns 4 -j*** 3 9***CV% 29.3 24.9 25.5 21.1 18.2 26.2 9.9 8.2
Note: I week (Hirna 4/16/2014, 11/5/15, Mechara 4/10/2014, 10/5/2015), 2 week (Hirna 4/23/2014, 18/5/2015, Mechara 4/17/2014 , 17/5/2015) 3 week(Hirna 4/30/2014, 25/5/2015, Mechara 4/24/2014. 24/5/2015), 4 week (Hirna 5/7/2014.1/6/2015, Mechara 5/1/2014. 31/5/2015) 5 weekfHirna 5/14/2014. 8/6/2015. Mechara5/8/2014,6/6/2015) 6 weekfHirna 5/21/2014. 8/6/2015. Mechara5/15/2014, 6/13/2015). ***-very highly significant.** - highly significant, *-significant, Ns -not significant, LSD- Least significant Difference , CV- Coefficient of variation, Trt- TreatmentStatistically, grain yield was highly significant at (p<0.01) on untreated plot while significant at (p< 0.05) on the treated plots at Hirna. But There was no significant variation on both treated and untreated plots at Mechara. Even though there was no significant variation between the treatments, but there was variation between treatments mean. The highest positive yield difference of (10.66) was recorded on the 4 weeks sown sorghum crop at Hirna experimental site. While the negative yield difference of (-4.57) were recorded on the 6 week cropped sorghum at Mechara (Table 4).Table 4. Over year mean grain yield difference from cypermethrine treated and untreated treatment atboth Hirna and Mechara
Sowing date
Grain Yield (ku/ha) by locationMechara Hirna
Treated Untreated Difference Treated Untreated Difference1 week 17.75 16.03 1.72 26.74a* 17.91a** 8.832 week 18.36 18.28 0.08 14.35ab 16.56a** -2.213 week 19.37 13.23 6.14 15.44ab I2.96ab 2.484 week 17.09 17.06 0.03 20.93ab 10.27abc 10.665 week 8.78 7.72 1.06 9.40b 6.86bc 2.546 week 7.26 11.83 -4.57 7.48b 4.50c 2.98Mean 14.8 14.0 0.74 15.7 11.5 4.21LSD (5%) Ns Ns 12.92* 7.22**CV% 9.7 9 8.7 8.7Note: 1 week (Hirna 4/16/2014. 11/5/15, Mechara 4/10/2014 ,10/5/2015), 2 week (Hirna 4/23/2014, 18/5/2015, Mechara 4/17/2014 , 17/5/2015) 3 week (Hirna 4/30/2014, 25/5/2015, Mechara 4/24/2014, 24/5/2015), 4 week (Hirna 5/7/2014,1/6/2015, Mechara 5/1/2014,31/5/2015) 5 week(Hima 5/14/2014, 8/6/2015, Mechara 5/8/2014,6/6/2015) 6 week(Hima 5/21/2014, 8/6/2015, Mechara5/15/2014, 6/13/2015), ***-very highly significant,** - highly significant, * significant, Ns -not significant, LSD- Least significant Difference , CV- Coefficient of variation
213

Oromia Agricultural Research Institute (IQQO), Crop research Proceeding 2017
Combined mean percent (infestation, incidence and stem tunnel) on treated and untreated plots screened for stem borers damage is shown in Table 3. The result shows that the highest mean percent (infestation, incidence and stem tunnel) were scouted on the sorghum planted at the first fourth (1-4) weeks on the onset of rainfall. In this case sorghum crop sown some weeks later after the first and second rain was less infected than immediately sown sorghum crop in both location and years. ISU, (2012) reported that later sown maize is less affected by stem borer larvae than earlier sowing as it disrupts their seasonal cycle. It is thought that at the start of the rainy season, borer populations arising from diapausing-generation larvae will still be building up and cause heavy damage to the crop. In addition, Maleku et al (2006) reported decreasing borer population damage with delays in planting. The highest numbers of larvae (Figure lc), exit hole and stem tunnel length by stalk borer (Figure 1A & B) were recorded on earlier than late planted sorghum. During late planting there were enough alternate preferable grassy weeds and other cereal crop than earlier planted sorghum that made adult insects to distribute over and reduce population density of ovipositor adults and minimize the damage of the main crop.The African maize stalk borer is primarily a pest of maize and sorghum; other hosts include pearl millet, finger millet, sugarcane and many wild grasses including Johnson grass (Sorghum halepense), elephant grass, wild Sudan grass and Guinea grass comparably preferred for ovipositor. Because of this stalk borer infestation was reduced by half in such area. Buddhi et al. (2015) also states that as adult population in the field fluctuates in response to ambient condition, the degree of damage by larvae may also be fluctuated.The highest positive yield difference of (10.27) was observed on the fourth week planted sorghum crop at Hirna. While the large negative yield difference of (-4.57) scored on the sixth weeks planted sorghum crop at Mechara. Weeks with (+ve) yield difference record means insecticide is important for the area for sorghum production whereas (~ve) yield difference record shows no need of wasting the chemical for control. These yield difference mightn’t only due to stem borer but also other factors such as recommended plant density (determined by the yield potential of an area), bird pest and rainfall distribution had a major influence on harvests (Table 1).Symptoms of stem borer damage were first observed on the leaves and stalk in all treatments, and the differences between their combine means were significant on both over years and location. Damage is caused by the larvae which at first feed on the young leaves but soon tunnel into the stems and produce about22.7% tunnel length.In addition to this, Songa et al. (2001) observed that stem borers damage greatly reduced maize yield with tunnel lengths greater than 20 cm causing a 40% potential yield loss. During the early stages of crop growth, larvae may kill the growing points, resulting in the production of ‘dead hearts’ with a consequent loss of crop stand.At later stages of growth, extensive tunneling inside the stems weakens the plant but the crop can tolerate than the earlier growth stage. Similarly, Walker (1960) reported that in East-Africa infestation at an early stage of plant growth will reduce the yield up to 36 kg grain per ha for every 1% plant infestation in high potential plantings. An infestation at a later stage is less injurious. A 33% yield loss was found in plants with more than one stem borers exit hole (Songa et al., 2001).Conclusion and RecommendationThe combined analyzed results of this study confirm that the percent infestation was not significant (P<0.05) over location but highly significant (P< 0.01) over years. Grain yield was highly significant (p<0.01) on untreated check at Hirna while non significant at Mechara. It shows that manipulation of sowing date has variable in the reduction of stalk borer infestation and damages from one location to another. As a result, the sorghum crop which had been sown at 5 week (Hirna 5/14/2014, 8/6/2015,
214

Oromia Agricultural Research Institute (IQQO), Crop research Proceeding 2017
Mechara 5/8/2014,6/6/20)5), and 6 week (Hima 5/21/2014, 8/6/2015, Mechara5/15/2014, 6/13/2015) were less infected than earlier planted at (1 week (Hima 4/16/2014, 11/5/15, Mechara 4/10/2014,10/5/2015), 2 week (Hima 4/23/2014, 18/5/2015, Mechara 4/17/2014 , 17/5/2015) and 3 week (Hirna 4/30/2014, 25/5/2015, Mechara 4/24/2014, 24/5/2015)) planting date. The highest numbers of iarvae and exit hole were recorded on earlier than late planted sorghum. This study, therefore, showed that the leave and stems of sorghum planted at the 1- 4 weeks more damaged than the 5 - 6 weeks cropped. Yield was also influenced by plant stand, bird pest and rainfall distribution in the study area. As recommendation, late planting was recommended for both location (Mechara and Hirna) to reduce pest infestations and damage if there is enough rainfall. Based on the yield difference for Hirna area 1 and 4 weeks sowing with cypermethrin treatment doubled the yield of sorghum grain. While for Mechara area 2, 4 and 6 weeks sowing without chemical treatment were recommended starting from the onset of rainfall.ReferencesAddis Tadesse Tekle. 2016. Assessment on Distribution. Biology and Management of Maize Stem Borer
{Busseola fusca Fuller) in Ethiopia Vol.6. No.5, 115 Boeke SJ, Baumgart 1R, Van loon J J A. 2004. Toxicity and repellence of African plants traditionally used
for the protection of stored cowpea against Callosobruchus maculatus. J. Stored Prod. Res. 40:423-438.
Buddhi Bahadur Achhami, Santa Bahadur BK and Ghana Shyam Bhandari. 2015. Assessment of maize stem borer damages on hybrid maizevarieties in Chitwan, Nepal p 53-63.
Chinwada, P. and Overholt, W.A. 2001. Natural enemies of maize stem borers on the highveld of Zimbabwe. African Entomology, 9: 67-75
CSA (Central Statistics Agency). 2012. Report on Area and Production of Crops of Central Statistics Agency. Central Statistics Agency, Addis Ababa. Ethiopia.
Erica Chemoh. 2014. Sorghum stem borers Busseola fusca, Chilo partellus, Sesamia calamistis. Africa soil Health consortium, africasoilhealth.cabi.org/wpcms/wp-content/.../02/47-cereals-maize- stalk-borers.pdf
FAO. 2005. Food Insecurity in the World - Food and Agriculture Organization of the ... wwwfao.org/3/a- a0200e.pdf
FAOSTAT. 2006. Database of agricultural production. FAO Statistical Databases (FAOSTAT).http://faostat.fao. org/default. aspx.
ISU (Iowa State University). 2012. Field Crop Insects. Iowa Soybean Association, p 4-5 JEPSON, W.F., 1954. A critical review of the world literature on the lepidopterous stalk borers of tropical
graminaceous crops. London, Commonw. Inst. Ent., 127 pp.Lucius Joseph Bamaiyi and Oniemayin Modupe Ifejeola Joan. 2011. Management of stem borers on
some quality protein maize varieties. Department of Crop Protection, Institute for Agricultural Research, Ahmadu Bello University, Zaria, Nigeria. Journal of Agricultural Sciences Vol. 56. No.3. P 197-205.
Melaku W, Gashawbeza A .1993. Determination of the relative abundance and dynamics of stemborers species on sorghum. In: Proceedings of the joint conference EPC/'CEE, 5-6 March 1992. Addis Ababa, Ethiopia, p. 26.
Melaku W, Fritz S, Kairu E, Charles O .2006. Cereal yield losses caused by lepidopterous stem borers at different nitrogen fertilizers rates in Ethiopia. J. App. Entoni. 130:220-229.
215

Oromia Agricultural Research Institute (IQQO), Crop research Proceeding 2017
Nyukuri R.W; Kirui S.C; Cheramgoi E; Chirchir E and Mwale R. 20)4. Damage of stem borer species to Zea mays L., Sorghum bicolor L. and Refugia graminae, Africa Journal of Food Science and Technology, 5(2): 37-45
Overiholt. W. A., K. V. N. Mnes muf and R. Goebel. 200). Fieild Guide to. the - S em borer Larvae of Maize, Sorghwm and Sugarca:ne in Eastern amd Southern Africa
Sharma, P.N., and Gautam, P. 2010. Assessment of yield loss in maize due to attack by the maize borer, Chilo partellus (Swinhoe). Nepal Journal o f Science and Technology, 11, 25-30.
Songa, J.M., Guofa, Z. and Overholt, W.A., 2001. Relationships of stem borer damage and plant physiological conditions of eastern Kenya. Insect Science and its Application, 21(3): 243-249.
Walker, P.T. 1960. Insecticide studies on the maize stalk borer, Busseola fusca (Fuller), in East Africa. Bulletin of Entomological Research 51 (2):321-351.
Powdery mildew (Odium lini) and Pasmo (Septoria lincola) combined effect on yield, yield components and oil content of linseed (Linum usitatissimum L.)
Ermias TeshomeSinana Agricultural Research Center, P.O.Box 208, Bale-Robe, Ethiopia.
E-mail: [email protected] (Linum usitatissimum L.) is a traditional oil crop and is the third most important oilseeds in the higher altitudes of Ethiopia. It is the first most important oilseed crop in the highlands of Bale both in productivity and area of production. The experiment was conducted for the last three years during 2013/14. 2014/15 and 2015/16 main cropping season at Sinana on-station and welte'i berisa. The trial was laid out in RCBD with 3 replications. Local linseed variety and "Dibene” were used in the experiment. To create a disease gradient a fungicide Odeon was used with a rate 2.5 kg/ha in different spray interval. At welte'i berisa: A NOVA for pasmo disease depicted significant difference (P<0.05) between treatments. The highest and the lowest pasmo disease severity of 58.03% and 23.46 % was recorded from local landrace with no spray and Dibene variety sprayed at 7days interval, respectively. For Powdery mildew. ANOVA showed significant statistical variation (P<0.05) between treatments. The highest powdery mildew severity ( 64.20%) was recorded from local linseed landrace without fungicide spray, while the lowest severity (30.86%) was recorded in Dibene variety sprayed at 7 days interval. Similarly. Analysis of Variance for pasmo (Septoria licola) showed that there was significant difference (P<0.05) between treatments at Sinana on-staion. The highest pasmo disease severity (23.46%) was recorded from the local landrace with no fungicide spray,while the lowest severity (12.96%) was recorded from Dibene variety sprayed at 7 days interval. Likewise, there is statistically significant difference (P<0.05) between treatments for powdery mildew. The highest powdery mildew severity (46.3%) was recorded from non-sprayed local variety; while the lowest (22.84%) was recorded from Dibene variety sprayed at 7 days interval. There was significant difference for most of the agronomic parameters considered. The highest (2859.3 kg/ha) and the lowest (2316.8 kg/ha) grain yield was recorded from Dibene variety sprayed at 14 days interval and non sprayed local landrace, respectively. Therefore, application of a fungicide Odeon at 14 days interval for the management of pasmo and Powdery mildew diseases is recommended.
Key words: ANOVA, Yield loss, Pasmo, Powdery mildew and Grain yield IntroductionLinseed (Linum usitatissimum L.) has been traditional oil crop of Ethiopia and it is the third most important oilseeds in the higher altitudes, whereas the first in Bale highlands in its area of production and
216
Oromia Agricultural Research Institute (IQQO), Crop research Proceeding 2017
productivity (CSA, 2008/09). Ethiopia is the fifth producer of linseed in the world with a total share of about 5% of the world production. It is usually grown in rotation with wheat; barley and teff. Oromia is the first producer of linseed with total share of 75% of domestic production in Ethiopia (Wijnands et al.,2009). Regardless of the potential for linseed production in Bale, biotic stresses, particularly diseases are the major yield limiting factors. Among diseases associated with linseed production, Pasmo (Septoria lincola) and powdery mildew (Odium Uni) are the most important. But diseases like Altemaria, botrytis grey mold and wilt are common across the world where linseed is produced (Perryman et al., 1998). Despite the disease presure and importance of the crop, pathological studies are lacking in Bale highlands hence management methods are not yet developed. Yield loss assessment was not conducted for major linseed diseaes in Bale highlands. Therefore, this work is intended to till the gaps regarding managing of major diseases of linseed in Bale highlands. This trial was initiated in order to investigate the combined effect of Powdery mildew (Odium lini) and Pasmo (Septoria lincola) on yield, yield components and oil content of linseed.Materials and MethodsThe field experiment was conducted during 2013/14, 2014/15 and 2015/16 bona cropping season at SARC on-station experimental field and welte’i berisa farmer’s field. The trial was laid out in RCB Design in 3 replications. ‘Dibene’ and local linseed verities were used in this study. The disease severity gradient was created by spraying the fungicide Odeon (Chlorothalonil) at a rate of 2.5kg/ha at different spray interval. The fungicide was sprayed at intervals and frequency was arranged the way it can create disease infection gradient to assess the effect of the diseases on linseed yield and yield components. The first spray was applied immediately after the diseases occurrence. The plot size was 1.2m x 3m with 0.2m, lm and 1.5m row, plot and block spacings were, respectively. All other agronomic practices were properly applied as per the agronomic recommendation for the crop. The disease development was rated using 1-9 scoring scale (Bernier et al., 1993). The disease severity rated in scoring scale was converted into percentage disease severity (DS) for analysis (Wheeler, 1969).
Result and DiscussionOut of the evaluated eight (8) treatments, most of them were found effective against linseed Pasmo and Powdery mildew management.Sinana On-stationAnalysis of variance (ANOVA) for Pasmo (Septoria lincola) depicted that there is significant difference (P<0.05) between treatments. The highest Pasmo disease severity of 23.46% was recorded in local linseed variety without fungicide spray, while the lowest severity of 12.96% was recorded from Dibene variety sprayed every 7 (seven) days. In the third year, there was high powdery mildew disease pressure that showed statistically significant variation (P<0.05) between treatments. The highest powdery mildew disease severity (46.30%) was recorded from a plot with local linseed variety without fungicide spray, while the lowest powdery mildew disease severity (22.84%) was recorded from Dibene variety sprayed every 7 (seven) days (Table 2). There was no statistically significant difference in number of boll per plant, date of flowering and biomass yield between treatments. ANOVA for seed per boll showed significantly different (P<0.05) variations between treatments. The maximum number of seed per boll 9.56) was counted from Local variety sprayed every seven (7) and fourteen (14) days. Whereas the owest seed per boll (7.78) was counted from local linseed landrace sprayed every twenty one (21) days.
217

Oromia Agricultural Research Institute (IQQO), Crop research Proceeding 2017
Table 2. El feet ot Powdery mildew (Odium Uni) and Pasmo (Septoria lincola) diseases on yield and yield components of linseed at Sinana On- station
‘Parameters*Trt. Pa PM Tlr/plnt Branch/pint Boll/pint Sd/boll Plntht %stnd BM 1000SW YId kg/haDO J9.J4 31.48 5.56 28.11 86.22 8.11 112.67 81.67 2750.0 6.53 2699.0D7 12.96 22.84 5.00 23.89 70.44 9.44 108.22 88.33 2783.3 6.53 2802.9D14 14.82 25.31 4.33 22.11 68.67 9.33 108.33 88.33 2816.7 6.27 2859.3D21 15.43 27.16 4.33 20.89 73.33 9.11 103.33 88.33 2716.7 6.73 2693.1LO 23.46 46.30 5.22 30.33 81.78 8.67 102.78 80.00 2583.3 6.07 2316.8L7 17.28 40.74 5.89 29. J 1 87.44 9.56 101.11 76.67 2700.0 6.13 2555.8LI4 20.37 36.42 5.00 30.89 97.89 9.56 102.22 76.67 2416.7 6.27 2612.8L21 21.61 38.27 4.00 27.33 83.89 7.78 99.44 80.00 2700.0 6.13 2498.3CV (% ) 14.74 15.19 14.97 13.55 21.27 9.50 2.52 5.25 13.14 2.03 10.21LSDoos 4.63 8.83 1.27 6.23 NS 1.47 4.56 7.50 NS 0.22 464.72
sprayed every twenty one days. L()-Local linseed landrace with no fungicide spray. L7-Local linseed landrace sprayed even• seven days. L I 4-Local linseed landrace sprayed every fourteen days. L21 -Local linseed landrace sprayed every twenty one days. Pa-Pasmo Disease severity, PM-Powdery mildew disease severity
218

Oromia Agricultural Research Institute (IQQO), Crop research Proceeding 2017
Percent plant stand (%stand) was one of the parameters influenced by the fungicide application; ANOVA for this parameter also indicated that there is significant variation among the treatments. The highest stand percentage (88.33) was recorded from Dibene variety sprayed every seven (7), fourteen (14) and twenty one (21) days and the lowest stand percent (76.67) was recorded from local linseed variety sprayed seven (7) and fourteen (14) days. Thousand seed weight (TSW) was also among the parameters influenced by fungicide application. The maximum thousand seed weight of 6.73g was recorded from Dibene variety sprayed every twenty one (21) days; whereas the minimum thousand seed weight of 6.07g was recorded from local linseed variety without fungicide spray. Grain yield was significantly differenent (P<0.05) between treatments. The highest grain yield (2859.30kg/ha) was obtained from Dibene variety sprayed every fourteen days (14) days while the lowest grain yield (2316.8kg/ha) was recorded from local linseed variety without fungicide spray.
Welte’i BersiaAnalysis of variance (ANOVA) for Pasmo (Septoria lincola) showed significant difference (P<0.05) between treatments. The highest Pasmo disease severity (58.03%) was recorded from a plot with local linseed landrace without fungicide spray while the lowest severity (23.46%) was recorded from Dibene variety sprayed every 7 (seven) days. There was high powdery mildew disease pressure that resulted in statistically significant variation (P<0.05) between treatments. The highest severity (64.20%) was recorded from a plot with local linseed variety without fungicide spray while the lowest severity (30.86%) was recorded from Dibene variety sprayed every 7(seven) days (Table 3). ANOVA for seed per boll showed significantly different (P<0.05) variations between treatments. The maximum number of seed per boll (9.56) was counted from Local variety sprayed every seven (7) days. Whereas the lowest seed per boll (7.89) was counted from local linseed landrace sprayed every fourteen (14) days. Percent plant stand (%stand) was one of the parameters influenced by the fungicide application; ANOVA for this parameter also indicated significant variation among the treatments.
219

Oromia Agricultural Research Institute (IQQO). Crop research Proceeding 2017
Table 3: Effect of Powdery mildew (Odium fin i) and Pasmo (Septoria lincola) diseases on yield and yield components of linseed at Welte’i Berisa _________________________________________________ * ParametersTrt.________Pa PM Tlr/plnt Branch/pint Boll/plnt Sd/boll Plntht %stnd BM 1000SW Yld kg/haDO 38.27 48.15 3.33 18.56 30.00 8.89 98.89 90.00 2216.7 5.80 1161.3D7 23.46 30.86 2.56 15.22 32.33 9.00 97.22 86.67 2166.7 5.70 1704.8D14 30.86 37.04 2.11 10.44 26.89 8.56 87.22 78.33 1983.3 5.80 1733.6D21 30.86 43.21 2.56 13.00 27.44 9.00 87.22 88.33 2000.0 5.87 1309.0L0 58.03 64.20 2.44 14.89 30.89 9.44 84.44 86.67 1783.3 5.27 1045.6L7 45.68 50.62 2.89 18.56 35.89 9.56 91.11 83.33 2100.0 5.30 1646.3L14 38.27 46.91 2.44 11.22 18.44 7.89 71.67 75.00 1083.3 5.53 1745.2L21 46.91 56.79 4.11 24.78 33.33 9.11 88.89 75.00 1450.0 5.30 1315.0CV (% ) 18.27 20.38 40.58 31.14 29.76 6.73 11.69 9.92 35.04 3.17 18.21L S D o.05 12.35 16.66 1.97 8.53 15.14 1.04 17.88 14.24 1120.8 0.31 459.51♦DO-Dibene variety with no fungicide. D7-Dibene variety sprayed every seven days. DI4-Dibene variety sprayed every fourteen days, D21-Dibene variety sprayed every twenty one days, LO-Local linseed landrace with no fungicide spray, L7-Local linseed landracc sprayed every seven days, L14-Local linseed landrace sprayed every fourteen days, L21-Local linseed landracc sprayed every twenty one days, Pa-Pasmo Disease severity, PM-Powdery mildew disease severity.
220
Oromia Agricultural Research Institute (IQQO), Crop research Proceeding 2017
The highest stand percentage (90.0%) was recorded from Dibene variety without fungicide spray and the lowest stand percent (75.00%) was recorded from local linseed variety sprayed every fourteen (14) and twenty one (21) days. Thousand seed weight (TSW) was also among the parameters influenced by fungicide application. The maximum thousand seed weight (5.87g) was recorded from Dibene variety sprayed every twenty one (21) days; whereas the minimum thousand seed weight (5.27g) was recorded from local linseed variety without fungicide spray. In case of grain yield, ANOVA showed statistically significant differences (P<0.05) between treatments. The highes grain yield of 1733.6kg/ha was obtained from Dibene variety sprayed every fourteen days (14) days and the lowest grain yield of I045.6kg/ha was recorded from local linseed variety without fungicide spray.
Conclusion and RecommendationAlthough this is a one year result, a fungicide Odeon (Chlorothalonil) application a fungicide Odeon (Chlorothalonil) is very crucial in linseed production package. From this study it can be recommended that the application of Odeon (Chlorothalonil) at fourteen (14) days interval is important. As seen from the data in the table 2 and 3; most of the essential parameters have positively responded for the fungicide application. As we compare the unsprayed plots with the sprayed plots, there was a significant difference for most of the parameters in test. The grain yield from the highest yielding plot exceeds the lowest yielding plot by 542.5 kg/ha at Sinana on-station and 688.0 kg/ha at welte’i berisaa due to the control of pasmo and powdery mildew diseases over unsprayed plots. This dictates that the use of fungicide for linseed production is one of the most important and crucial component of linseed production packages. Therefore, a fungicide Odeon (Chlorothalonil) is recommended for farmers (both small scale and large scale producers) against major diseases of linseed (Powdery mildew and Pasmo). Based on the current data, Dibene variety sprayed every fourteen (14) days with this fungicide is found to be most important against infection by the two major diseases (Powdery mildew and Pasmo) of linseed. Therefore, based on biological data and cost-benefit analysis result Dibene variety sprayed twice at fourteen (14) days interval is recommended for both small and large scale producers of the crop
221

Oromia Agricultural Research Institute (IQQO), Crop research Proceeding 2017
Cost-Benefit AnalysisTable 5: Total variable cost of fungicide application and costs associated with it for protected plots at Sinana in 2013/14, 2014/15 and 2015/16GC main cropping season
List of items and activities as a source of costs (Ethiopian Birr)______________________________________________Fungicide
No. Treatment Rate(kgha'')
Frequency Cost (ETH Birr)
Sprayerrent
Labor cost to spray
Labor cost for water supply
Cleaningequipment
Cost for water
Totalvariable cost
1 DO 0 0 0 0 0 0 0 0 02 D7 2.5 3 2250 60 105 45 15 24 24993 D14 2.5 2 1500 40 70 30 10 16 16664 D21 2.5 2 1500 40 70 30 10 16 16665 L0 2.5 0 0 0 0 0 0 0 06 L7 2.5 3 2250 60 105 45 15 24 24997 L14 2.5 2 1500 40 70 30 10 16 16668 L21 2.5 2 1500 40 70 30 10 16 1666Note.DO-Dibene variety with no fungicide, D7-Dibene variety sprayed every seven days, Dl4-Dibene variety sprayed every fourteen days. D21-
Dibene variety sprayed every twenty one days. LO-Local linseed landrace with no fungicide spray, L7-Local linseed landrace sprayed every seven days, L14-Local linseed landrace sprayed every fourteen days. L2 / -Local linseed landrace sprayed every twenty one days.
222

Oromia Agricultural Research Institute (IQQO), Crop research Proceeding 2017
Table 6: Cost-benefit assessment of fungicide application frequency against Chocolate spot o f Faba bean at Sinana in 2013/14, 2014/15 and 2015/16 GC main cropping season
No. Treatment Fungicide (kgha1) Yield kgha'1 SR (E T B h a 1) M C (E T B h a 1) M B (E T B ha'1) M RR (% )1 DO 0 1930.15 34742.7 0 34742.7 0.002 D7 7.5 2253.85 40569.3 2499 38070.3 312.473 D 14 5 2296.45 41336.1 1666 39670.1 564.744 D21 5 2001.05 36018.9 1666 34352.9 245.585 L0 0 1681.2 30261.6 0 30261.6 0.006 L7 7.5 2101.05 37818.9 2499 35319.9 202.417 L14 5 2179 39222 1666 37556 437.848 L21 5 1906.65 34319.7 1666 32653.7 143.58
SR = Sale revenue; MC = Marginal cost; MB = Marginal benefit; MRR = marginal rate of return
223

Oromia Agricultural Research Institute (IQQO), Crop research Proceeding 2017
ReferencesBernier, C.C., S.B. Hanounik, M.M. Hussein and H.A. Mohamed, 1993. Field manual of common faba
bean diseases in the Nile Valley. International Center for Agricultural Research in the Dry Areas (ICARDA) Information Bulletin No. 3.
Central Statistical Authority (CSA), 2008/09 (2001 EC). Crop Production Forecast Sample Survey: Report on area, production and yield of major crops tor private peasant holdings in Ethiopia, Meher Season #439, Dec. 2008, Addis Ababa, Ethiopia.
Perryman S. A. M.,P. Gladders and A. Barrow, 1998. Diseases of winter linseed: occurrence, effects and importance. ADAS Boxworth, Cambridge, PP. 77.
Wheeler, J.B., 1969. An introduction to plant diseases. Wiley, london, P. 347.Wijnands J.H.M., J. Biersteker and E.N. van Loo, 2009. Oilseeds business opportunities in Ethiopia.
Public Private Partnership on Oilseeds.
Chocolate spot (Botrytis fabae Sard.) management on Faba bean (Vicia faba L.) through application of fungicide at critical susceptible stage of the crop in Bale highlands. Southeastern Oromia
ErmiasTeshome*1 Sinana Agricultural Research Center, P.O.Box 208, Bale-Robe, Ethiopia.*Corresponding author: [email protected] AbstractDue to its high nutritive value. Faba bean (Vicia faba L.) is one of the most important food legumes in the world and in Bale-highlands as well. An experiment was conducted for three years (2013/14, 2014/15 and 2015/16) at Sinana Agricultural Research Center with the objectives of identifying the critical growth stage of faba bean susceptible to chocolate spot infection and to determine the right stage of fungicide spray for Chocolate spot management. The trial was arranged in RCBD with three replications. Disease severity was scored on 20 randomly pre- tagged plants from the central four rows. Area under the disease progress curve (A UDPC) and disease progress rate (r) were derived from percent disease severity index. Logistic model (ln[y/ (l-y)J) was employed to estimate the disease progression and data were analyzed using SAS procedure. The association of disease parameters with yield and yield related traits were assessed using Correlation and Regression analysis. The partial budget analysis was done to see the financial profitability of fungicide application for the management of chocolate spot on Faba bean. ANOVA for disease severity. AUDPC and r have shown statistically significant difference (p<0.Q00l) between treatments. The highest Chocolate spot disease severity o f48.95% and the lowest (19.75%) were recorded from a plot without fungicide treatment and from a plot treated three times at flowering stage, respectively. Similarly, the highest AUDPC (2534.3%-days) and r (0.029554 units') and the lowest AUDPC (978.7%-days) and r (-0.006925units 1) were calculated from a plot without fungicide spray and a plot sprayed with a fungicide three times at flowering stage, respectively. Regarding yield and yield related traits: ANOVA have shown significant variations (P<0.05) between treatments for number of pods per plant, seeds per pod. TKW and grain yield. The highest number of pods per plant (29.66), seeds per pod (3.25), TKW (575.07g) and grain yield (3515.4kg/ha) were recorded from plots sprayed three times at flowering stage: while the lowest number of pods per plant (14.01), seeds per pod (2.08),TKW (485.57g) and grain yield (2347.1 kg/ha) were recorded from check. Simple linear regression o f grain yield with Chocolate spot severity index and AUDPC have revealed significant difference (P<0.0001) between treatments: the estimated slope of the regression line obtained for Chocolate spot severity index was -47.80 and for AUDPC was-1.00. The Correlation of grain yield with Chocolate spot severity index and AUDPC shows that Chocolate spot severity index and AUDPC have significant negative correlation
224

Oromia Agricultural Research Institute (IQQO), Crop research Proceeding 2017
with grain yield (r- -0.52938, P<0.0001) and (r= -0.64815, P<0.0001), respectively. In partial budget analysis, the highest marginal benefit (30669.60 ha'1 ETB) was obtained from Mancozeb 80% WP sprayed plot (three times at weekly interval during flowering stage). However, the maximum marginal rate of return (MRR) of 2307.43% was obtained from a plot sprayed with Mancozeb 80% WP once at flowering stage. Therefore, foliar application of 2.5 kg/ha Mancozeb 80% WP once at flowering stage is recommended for the management of Faba bean chocolate spot.
Key words: Faba bean. Chocolate spot, Botrytis fabae Sard. Disease severity index, AUDPC, and Disease progress curve
IntroductionFaba bean (Vicia faba L.) is one of the earliest domesticated food legumes in the world, probably in the ate Neolithic period (Metayer, 2004). It is used as human food in developing and as an animal feed in developed countries. Food value of faba bean is high and this legume has been considered as a substitute of meat due to its high protein content (24-41 % ) and provides the much needed protein supplement to the diet of rural households (Crepona et al., 2010).From the economic point of view, faba bean is a source of cash to the farmers and foreign currency to the country. Nowadays, Ethiopian farmers are getting awareness on the role of legumes in general and faba bean in particular in improving soil fertility and soil health; there by widely using Faba bean in rotation with cereals (Sahile et al., 2008a). The crop occupies the largest area in Ethiopia among other pulses and currently the total area under cultivation is increasing dramatically which is estimated to be about 521,000 ha from which 6,886,670 quintals are produced (MoARD, 2008).The crop is grown in several regions of the country receiving annual rainfall of 700-1000 mm (ICARDA, 2006). Despite the availability of high yielding varieties in Ethiopia, the average yield of Faba bean under small-holder farmers is not more than 1.8 t ha'1 (CSA, 2014 and MoA, 2011). This low productivity is attributed to its susceptibility to biotic stresses mainly diseases (Sahile et al., 2008a; Mussa et al., 2008; Nigussie et al.,2008 and Berhanu et al., 2003). The most important yield limiting diseases are chocolate spot (Botrytis fabae), rust (Uromyces vicia-fabae), black root rot (Fusarium solani) and Aschochyta blight (Ascochyta fabae) (Mussa et o/., 2008; Ahmed et al., 2010). Different Experiments have conducted so far on the management of Chocolate spot.However, all of them were focusing on the frequency of the fungicides to be applied and crop growth stage was not considered. Furthermore, the development and rate of progress of the disease in relation to the host growth stage are important epidemiological factors determining the level of crop damage (Ermias et al., 2013). Therefore, this study was initiated with the objective of evaluating the effect of Faba bean growth stage and fungicide frequency on the management of chocolate spot.Materials and Methods Description of Experimental SiteThe experiment was conducted for three consecutive years; 2013/14, 2014/15 and 2015/16 during the main cropping season of Bale highlands at Sinana Agricultural Research Center (SARC), southeast Ethiopia. The location represents the highlands of Bale which is the major Faba bean production area. It is high rainfall area and is expected to be suitable environment (hot spot) for the development of chocolate spot disease. SARC is located at 7°7’ N (latitude) and 40° 10’ E (longitude) at about 2400 m.a.s.l and receives 750-1000 mm mean annual rain fall. Its mean annual temperature is 9-21 °C (Nefo et al., 2008). The dominant soil type is pellic vertisol and slightly acidic (Dagne et al.. 2016).Treatments and Design
225

Oromia Agricultural Research Institute (IQQO). Crop research Proceeding 2017
The experiment was arranged in three replications in RCB Design. An improved Faba bean variety ‘Shallo' was evaluated on a plot size of 3m x 2.4 m with a total of 6 seeding rows. The spacing between row, plot and replication were 0.4m, 2m and 2m, respectively. Disease infection gradient was created by spraying a fungicide Mancozeb 80% WP at a rate of 2.5 kg/ha. A fungicide sprays were made at different crop growth stages and frequencies (Table 1).Table 1: Treatment Arrangement
Treatment No. Beginning of spray_________ Frequency of spray1 At flower initiation (FI1) 12 At flower initiation (FI2) 23 At flower initiation (FI3) 34 At flowering (F1) 15 At flowering (F2) 26 At flowering (F3) 37 At pod initiation (PI 1) 18 At pod initiation (P12) 29 At pod initiation (PI3) 310 At 50% pod set stage (PS 1) 111 At 50% pod set stage (PS2) 212 At 50% pod set stage (PS3) 313 Un treated check (UC) 0
Untreated check (UC) which was not receiving a fungicide spray was included as negative control for treatment comparison. Fungicide application started immediately after the development of the first observable diseases symptom and then the spray were made at a regular interval. Seed rate, fertilizer rate, weeding and other all agronomic packages are applied as per the recommendation for the crop.Data Management and Statistical AnalysisLogistic, [In [(Y/l-Y)], (Vander Plank 1963) and Gompertz, -ln[-ln(Y)], (Berger, 1981) models were compared for estimation of disease parameters in each treatment. Goodness of the fit of the models was tested using coefficient of determination (R2) and Logistic model was found to fit best. Therefore, Independent variables for field experiment data under different treatments were analyzed using logistic model, ln[y/ (1-y)] with the SAS Procedure (SAS Institute, 1998). The slope of the regression line estimated the disease progress rate in different treatments. Disease scoring was conducted in a 1-9 diseases scoring scale (Bemier et al., 1993). The data was converted to percentage severity index (PS1) according to Wheeler (1969). Mean separation was made based on LSD technique at 5% probability level.AUDPC values were calculated for each plot using the formula developed by (Shaner and Finney, 1977). ANOVA was performed for disease severity index (Wheeler, 1969), AUDPC (Shaner and Finney, 1977), and rate of disease progress (r).The association of disease parameters with yield and yield related parameters was assessed using Correlation and regression analysis.p ^ . __________ Sum of Numerical Ratings X 100_________
N um ber of Plants Scored X Maximum Score on Scale................ ' ee er,AUDPC = EP-i10.5(X)+1 + Xj)(t j+1 — t j ) ..................... 4........... 2 (Shaner and Finney, 1977)Where, Xj= the PSI of disease at the i,h assessmentt,= is the time of the i* assessment in days from the first assessment daten= total number of disease assessmentsCost-Benefit Analysis
226

Oromia Agricultural Research Institute (IQQO), Crop research Proceeding 2017
The cost of production and benefit of each treatment was analyzed using partial budget analysis. Marginal rate of return (MRR) was computed by considering the total variable costs incurred in each treatment. In this experiment the sum cost of fungicide, water, Sprayer rent, labor for spraying, Labor of water supply and Labor for cleaning equipments were considered as total variable cost. The yield and economic data were collected to compare the advantage of fungicide application on different crop growth stage and frequency for the management of Chocolate spot disease. The MRR was used as major criteria which measures the effect of additional investment on net reuirns (CIMMYT, 1988). MRR provides the benefit value obtained as a function of the additional investment or cost incurred for the management of Chocolate spot in percentage.MRR = 777 x 100
Die
Where: - MRR- Marginal Rate of Return, DNl-Difference in Net Income compared with control, DIC- Difference in Input Cost compared with control.The total income from each treatment was obtained as sale revenue (SR) from the product (grain of Faba bean) and the marginal cost (MC) is computed as a sum of all production costs that varied and marginal benefit (MB) is calculated as a difference of sale revenue and marginal cost Results and DiscussionThe combined Analysis of variance over years have shown that there was statistically significant difference between treatments for disease parameters (severity (%), Area Under Disease Progress Curve (AUDPC) (%-days) and Disease Progress Rate (r) (units day'1)) and for yield and yield components (No. of Tillers per plant, No. of Pods per Plant, No. of Seeds per Pod, Biomass yield (kg/ha), Thousand Kernel Weight (TKW (g)) and Grain yield (kg/ha)) (Table 2 and Table 3). Statistically significant difference (P<0.0001) was observed for disease severity. The highest severity (48.95 % ) was recorded from a plot without fungicide treatment (untreated check), while the lowest disease severity (19.75 % ) was recorded from a plot sprayed three times at flowering stage (Figure 1 and Table 2). This finding is comparable with Sahile et al. (2008c) who have reported mean disease severity index ranging from 25 to 46.6% in sprayed plots, in comparison with 56.7% in unsprayed plots.
Table 2. Effect of Fungicide application Timing and Frequency on Chocolate spot Disease parametersTreatment Severity (% ) AUDPC (%-days) r (units-day'1)
Spraying at flower initiation (FI 1) 40.59 2138.90 0.014666Spraying at flower initiation (FI2) 34.29 1801.80 0.010758Spraying at flower initiation (FI3) 30.45 1575.00 0.006384Spraying at flowering (F I) 32.20 1685.20 0.002545Spraying at flowering (F2) 26.72 1361.10 -0.004055Spraying at flowering (F3) 19.75 978.70 -0.006925Spraying at pod initiation (PI 1) 34.75 1827.80 0.009291Spraying at pod initiation (PI2) 32.36 1691.70 0.005777Spraying at pod initiation (PI3) 27.83 1445.40 0.001928Spraying at 50% pod set stage (PS1) 33.95 1782.40 0.006685Spraying at 50% pod set stage (PS2) 34.57 1821.30 0.008845Spraying at 50% pod set stage (PS3) 33.54 1763.00 0.009205Untreated check (UC) 48.95 2534.30 0.029554CV (% ) 15.82 21.09 159.82L S D (d<o.o5) 5.79 401.77 0.0105Note: LSD-Least Significant Difference, CV-Coefficient of variation
227

Oromia Agricultural Research Institute (IQQO), Crop research Proceeding 2017
Similar result was also reported by Ermias and Addisu. (2013) and El-Sayed et al., (2011) when they found the highest chocolate spot severity from non treated plot and the reverse from controlled plot. In general, the disease severity has shown a decreasing trend as the spray frequency increases from one to three times (Figure 2 and Table 2).
70 -
65
60 -
55 -
g 50 ■
45 ■d>
S 4000 35 -to 30 ■
Q 25
20 -
15 -
10
60—«— 9 0
D a y s A fte r P la n t in g ( D A P )
Figure I : Chocolate spot progress curve as affected by the combination of Faba bean growth stage and fungicide spray frequency on “shalo” variety at Sinana.In the same way, statistically very highly significant difference (P<0.0001) was observed for AUDPC and disease progress rate (r). The highest AUDPC of 2534.3 %-days and the lowest AUDPC (978.7 %-days) were obtained from untreated plot and a plot sprayed three times at flowering crop growth stage, respectively (Table 2). Similarly Dagne et al., (2016) and El-Sayed et al., (201 l)have reported the highest and the lowest AUDPC from non protected and fully protected plots, respectively. The highest and the lowest chocolate spot disease progress rate (r) of 0.029554 units-day'1 and -0.006925 units-day*1, respectively were observed in unreated plot and a plot sprayed three times at flowering stage, respectively.
S e v e r i t y
Si
F u n g i c i d e S p r a y F r e q u e n c y
Figure 2: Effect of Fungicide Spray Frequency on Development and Progress of Chocolate spot Disease Severity on Variety Shalo at Sinana.
228

Oromia Agricultural Research Institute (IQQO), Crop research Proceeding 2017
Similar result was reported by El-Sayed et al., (2011) and Dagne et al.. (2016). In general, all of the chocolate spot disease severity, AUDPC and disease progress rate (r) have shown an increasing trend as the days after planting (DAP) progresses ((Figure I and Table 2). On the other hand, combinations ot Faba bean growth stage and fungicide spray frequency have shown an effect on chocolate spot development, progression and severity (Figure 3 and Table 2).
F11 FI2 FI3 F1 F2 F3 PI1 PI2 PI3 PS1 PS2 PS3 UC
F a b a b e a n G r o w t h S t a g e a n d S p r a y F r e q u e n c y
Figure 3: Effect of growth stages and fungicide spray frequencies on Chocolate spot severity
The maximum number of tillers per plant (3.21) and pods per plant (29.66) were recorded from the plots sprayed three times at flowering stage; while the smallest tillers per plant (2.02) and pods per plant (14.01) were recorded from unsprayed plots (Table 3). Ermias and Addisu, (2013) reported similar result from their study on integrated management of faba bean chocolate spot. Similarly, the highest number oi seeds per pod (3.25), plant height (169.46 cm) and the biomass yield (2510.4 kg/ha) were recorded from plots sprayed three times at flowering stage while the lowest for all were recorded from unspraved plots (Table 3). (El-Sayed et al., 2011; Ermias and Addisu. 2013 and Dagne et al.. 2016) reported that the high disease severity and the highest AUDPC are directly aligned with the lowest yield components in agreement with the finding of this study.
Simple linear regression model was employed to assess the relationship between chocolate spot severity index and grain yield. This showed significant difference (P<0.000l) between treatments. The estimated slope of the regression line obtained for disease severity index was -43.84. This estimate shows that for each unit increase in percent severity index of chocolate spot, there was a Faba bean grain yield loss ot 43.84 kg/ha (Figure 4). Based on the coefficient of determination (R2) values calculated, the equations explained that about 57.94% of losses in Faba bean grain yield occurred due to chocolate spot disease. F- statistics calculated have shown very high significance (P<0.0001) of the over all probability of the equation (Figure 4a). Similarly, the simple linear regression analysis between grain yield and AUDPC has resulted significant difference (P<0.0001) between treatments. The estimated slope of the regression line obtained for AUDPC was -0.96 This estimate shows that for each unit increase in AUDPC, there was a Faba bean grain yield loss of 960 g/ha (Figure 4b).
229

Oromia Agricultural Research Institute (IQQO), Crop research Proceeding 2017
Likewise, pair wise Pearson correlation analysis was employed to assess the relationship between chocolate spot disease parameters and yield and yield related traits of Faba bean. Chocolate spot disease severity index have significant negative correlation with number of pods per plant (r= -0.77268, P<0.0001). Number of seed per pod and Biomass (kg) have similarly significant negative correlation with chocolate spot severity (r= -0.52578, P<0.0001 andr= -0.67263, P<0.0001, respectively). Likewise, chocolate spot disease severity was found to be negatively significantly correlated with TKW (g) and Faba bean grain yield (r= -0.63994, P<0.0001 and r= -0.52938, P<0.0001, respectively) (Table 4). On the same way, significant negative correlation (r= -0.77723, P<0.0001; r= -0.53576, P<0.0001 and r= - 0.68662, P<0.0001) were found between AUDPC and number of pods per plant, number of seeds per pod and biomass (kg), respectively.
230
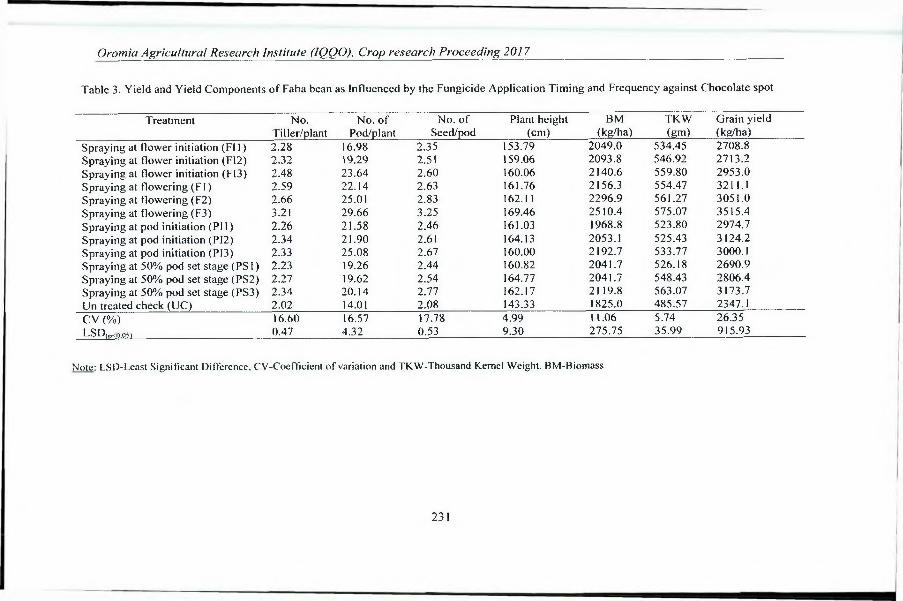
Oromia Agricultural Research Institute (IQQO), Crop research Proceeding 2017
Table 3. Yield and Yield Components of Faba bean as Influenced by the Fungicide Application Timing and Frequency against Chocolate spot
T reatment No. No. of No. of Plant height BM TKW Grain yieldTiller/plant Pod/plant Seed/pod (cm) (kg/ha) (gm) (kg/ha)
Spraying at flower initiation (FI 1) 2.28 16.98 2.35 153.79 2049.0 534.45 2708.8Spraying at flower initiation (F12) 2.32 19.29 2.51 159.06 2093.8 546.92 2713.2Spraying at flower initiation (FI3) 2.48 23.64 2.60 160.06 2140.6 559.80 2953.0Spraying at flowering (F I) 2.59 22.14 2.63 161.76 2156.3 554.47 3211.1Spraying at flowering (F2) 2.66 25.01 2.83 162.11 2296.9 561.27 3051.0Spraying at flowering (F3) 3.21 29.66 3.25 169.46 2510.4 575.07 3515.4Spraying at pod initiation (PI 1) 2.26 21.58 2.46 161.03 1968.8 523.80 2974.7Spraying at pod initiation (PI2) 2.34 21.90 2.61 164.13 2053.1 525.43 3124.2Spraying at pod initiation (PI3) 2.33 25.08 2.67 160.00 2192.7 533.77 3000.1Spraying at 50% pod set stage (PS 1) 2.23 19.26 2.44 160.82 2041.7 526.18 2690.9Spraying at 50% pod set stage (PS2) 2.27 19.62 2.54 164.77 2041.7 548.43 2806.4Spraying at 50% pod set stage (PS3) 2.34 20.14 2.77 162.17 2119.8 563.07 3173.7Un treated check (UC) 2.02 14.01 2.08 143.33 1825.0 485.57 2347.1CV (% ) 16.60 16.57 17.78 4.99 11.06 5.74 26.35LSD(P<0.05) 0.47 4.32 0.53 9.30 275.75 35.99 915.93
Note: LSD-Least Significant Difference, CV-Coefflcient of variation and TKW-Thousand Kernel Weight. BM-Biomass
231

Oromia Agricultural Research Institute (IQQO), Crop research Proceeding 2017
Chocolate spot disease severity (X)
Area Under Disease Progress Curve (35-days)
Figure 4: Estimated relationship between losses in Faba bean grain yield and Chocolate spot severity index (A) and AUDPC (B) at Sinana
Similarly, AUDPC have strong negative correlation (r= -0.71781, P<0.0001 and r= '0.64815, P<0.0001) with TKW and grain yield, respectively. It was observed that, disease progress rate (r) have significant negative correlation with number of pods per plant (r= -0.67737, P<0.0001), number of seeds per pod(r= -0.44209, P<0.0001) and Biomass yield (r= -0.52945, P<0.0001), respectively. And also TKW (r= - 0.59177, P<0.0001) and grain yield (r= -0.45336, P<0.00l), respectively have significant negative correlation with disease progress rate (Table 4).
232

Oromia Agricultural Research Institute (IOQO). Crop research Proceeding 2017
Table 4: Pair wise Pearson correlation coefficients among disease parameters, yield and yield Components of Faba beanCh. spot AUDPC r No. pod/plant No. seed/pod BM TKW Grain yield
Ch. Spot 0.97386’” 0.86460**' -0.77268’“ -0.52578*“ -0.67263’*J -0.63994*" -0.52938*”AUDPC 0.97386” * 0.86161*“ -0.77723“ ' -0.53576“ ’ -0.68662*“ -0.71781’" -0.64815R 0.86460**' 0.86161’” -0.67737'“ -0.44209'“ -0.52945*“ -0.59177**’ -0.45336*”No. pod/plant -0.77268“ ' -0.77723'“ -0.67737’“ 0.64125“ * 0.68230*“ 0.53496” ' 0.53494’”No. seed/pod -0.52578'" -0.53576'“ -0.44209” ’ 0.64125'“ 0.57535'“ 0.43676’ 0.44245BM -0.67263’" -0.68662“ ’ -0.52945“ * 0.68230'“ 0.57535"* 0.60126 0.63634TKW -0.63994’" -0.71781“ ’ -0.59177*“ 0.53496“ ’ 0.43676“ * 0.60126*“ 0.77309*”Grain yield -0.52938’" -0.64815’“ -0.45336’“ 0.53494*“ 0.44245*“ 0.63634'“ 0.77309’”
T able 5:Total variable cost of fungicide application and costs associated wilh it at Sinana.No. T reatment List of items and activities as a source of costs (Ethiopian Birr)
Rate(kgha' 1
Fungicide
Fre ) que
ney
Cost(ET IIBirr)
Spraye r rent
Labor cost to spray
Labor cost for water supply
Cleaningequipment
Cost for water
Total variable cost
1 Un treated check 0 0 0 0 0 0 0 0 0.002 Spraying at llovver initiation 2.5 1 240 20 35 15 5 8 323.003 Spraying at flower initiation 2.5 2 480 40 70 30 10 16 646.004 Spraying at flower initiation 2.5 3 720 60 105 45 15 24 969.005 Spraying at flowering 2.5 1 240 20 35 15 5 8 323.006 Spraying at flowering 2.5 2 480 40 70 30 10 16 646.007 Spraying at flowering 2.5 3 720 60 105 45 15 24 969.008 Spraying at pod initiation 2.5 1 240 20 35 15 5 8 323.009 Spraying at pod initiation 2.5 2 480 40 70 30 10 16 646.0010 Spraying at pod initiation 2.5 3 720 60 105 45 15 24 969.001 1 Spraying at 50% pod set stage 2.5 1 240 20 35 15 5 8 323.0012 Spraying at 50% pod set stage 2.5 2 480 40 70 30 10 16 646.0013 Spraying al 50% pod set stage 2.5 3 720 60 105 45 15 24 969.00
233

Oromia Agricultural Research Institute (IQQO), Crop research Proceeding 2017
Cost-Benefit AnalysisThe Partial budget analysis shows that the highest marginal benefit (30669.60 ha'1 ETB) was obtained from a plot sprayed with Mancozeb 80% WP three times at weekly interval at flowering stage followed by a plot sprayed once at flowering stage (ETB 28576.90ha'). The lowest (ETB 21123.90ha') was obtained from unsprayed check (Table 6).The highest marginal rate of return (ETB 2307.43 % ) was obtained from a treatment sprayed once at flowering stage. Accordingly, for every ETB 1.00 invested in Mancozeb 80% WP sprayed once at flowering stage, there was a gain of about ETB 23.07 (Table 6). The highest Faba bean grain yield (3515.4 kgha'1) and the highest marginal benefit (30669.6 ETB'1) were obtained from the three times sprayed plot during the flowering stage, followed by a plot sprayed once at flowering. Its yield was 3211.1 kgha1 with a marginal benefit of 28576.9 ETB*1.Therefore, from the economic profitability point of view, production of moderately resistant Faba bean variety Shalo sprayed once with Mancozeb 80% WP at flowering stage is the most profitable business under small holder farmers’ condition at the current Faba bean price.
234

Oromia Agricultural Research Institute (IQQO), Crop research Proceeding 2017
Table 6: Cost-benefit analysis of fungicide application frequency against Chocolate spot of Faba bean at Sinana in 2013/14, 2014/15 and 2015/16 GC
No. Treatment Fungicide (kgha1) Yield kgha'1 SR (ETB ha'1) MC (ETB ha'1) MB (ETB ha'1) MRR (% )1 Un treated check 0.0 2347.1 21123.90 0.00 21123.90 02 Spraying at flower initiation 1 2.5 2708.8 24379.20 323.00 24056.20 907.833 Spraying at flower initiation 2 2.5 2713.2 24418.80 646.00 23772.80 410.054 Spraying at flower initiation 3 2.5 2953.0 26577.00 969.00 25608.00 462.765 Spraying at flowering I 2.5 3211.1 28899.90 323.00 28576.90 2307.436 Spraying at flowering 2 2.5 3051.0 27459.00 646.00 26813.00 880.677 Spraying at flowering 3 2.5 3515.4 31638.60 969.00 30669.60 985.118 Spraying at pod initiation 1 2.5 2974.7 26772.30 323.00 26449.30 1648.739 Spraying at pod initiation 2 2.5 3124.2 28117.80 646.00 27471.80 982.6510 Spraying at pod initiation 3 2.5 3000.1 27000.90 969.00 26031.90 506.5011 Spraying at 50% pod set stage 1 2.5 2690.9 24218.10 323.00 23895.10 857.9612 Spraying at 50% pod set stage 2 2.5 2806.4 25257.60 646.00 24611.60 539.8913 Spraying at 50% pod set stage 3 2.5 3173.7 28563.30 969.00 27594.30 667.74
SR = Sale revenue; MC = Marginal cost; MB = Marginal benefit; MRR = marginal rate of return
I

Oromia Agricultural Research Institute (IQQO), Crop research Proceeding 2017
Conclusion and RecommendationChocolate spot epidemic frequently occurs and causes high yield losses in the highlands of Bale as farmers are growing local cultivar. Therefore, this study was initiated with the objective of investigating the effect of Mancozeb 80% WP spra\ frequency at different growth stages of Faba bean on chocoJate spot disease progress and yield and yield components. The result indicated that application of Mancozeb 80% WP fungicide once at flowering stage of the crop is found to be the right frequency and stage for optimum yield (3211.1kg ha ') and profitability. Flowering period is found to be the most susceptible stage to chocolate spot infection. This can be observed from the lowest severity and other disease data recorded when fungicide is applied at this stage. Hence, flowering is the right stage to apply disease management measures. Maximum marginal benefit (M B) of 30669.60 ETB ha'1 was recorded from a plot sprayed three times at flowering stage. The highest marginal rate of return (2307.43%) was obtained from a plot sprayed once at flowering stage. Therefore, based on the biological yield and cost-benefit analysis (MRR), one time spray of Mancozeb 80% WP at flowering stage at a rate of 2.5kgha’' is recommended for the management of Faba bean Chocolate spot and optimum yield. Sustainable productivity with minimum effect on environment can be achieved by the use of integrated management options. In this particular case to, it is highly recommended to use moderately resistant varieties in combination with the fungicide and recommended agronomic practices.
ReferencesAhmed, S., Imtiaz, M., Kumar, S., Maalouf, F. and Malhotra, R., 2010. Impacts of climate change on
disease of legumes areas. Paper presented at the International conference: Food security and Climate Change in Dry Areas: 1-4 February 2010, Amman. Jordan.
Berger, R.D. 1981. Comparison of the Gompertz and Logistic equation to describe plant disease progress. Phytopathology. 71: 716-719.
Berhanu, M., Getachew, M., Teshome, G. and Temesgen, B., 2003. Faba bean and field pea diseases research in Ethiopia. In: Ali, K., Kenneni, G., Ahmed, S., Malhotra, R., Beniwal, S., Makkouk, K., Halila, M.H. (Eds.)., 2003. Food and forage legumes of Ethiopia: Progress and prospects. Proceedings of the Workshop on Food and Forage Legumes. 22-26 September 2003, Addis Ababa. Ethiopia pp 278-287.
Campbell, C.L., Madden, V.L. 1990. Introduction to plant disease epidemiology. New York: John Wiley and Sons, Inc.
CIMMYT (International Maize and Wheat Center), 1988. From Agronomic data to farmers’ recommendations: An Economic training manual. Completely revised edition. CIMMYT, Mexico, D.F.
Crepona, K., Marget, P., Peyronnet, C., Carroueea. B., Arese, P., Due, G., 2010. Nutritional value of faba bean (Vicia faba L.) seeds for feed and food. Field Crop Research. 115: 329-339.
CSA (Central Statistical Agency), 2014. Report on area and production of major crops (private peasant holdings, meher season). Statistical bulletin 1(532): 10-14.
Dagne Kora, Temam Hussein and Seid Ahmed, 2016. Epidemiology of chocolate spot (Botrytis fabae Sard.) on faba bean (Vicia faba L.) in the Highlands of Bale, Sinana district. Southeastern Ethiopia. Vol. 4(1), pp. 131-138.
Ermias Teshome and Addisu Tagegn, 2013. Integrated management of Chocolate spot (Botrytis fabae Sard.) of Faba bean (Vicia faba L.) at highlands of Bale, south eastern Ethiopia. Research Journal of Agricultural and Environmental Management. Vol. 2(1), pp. 011-014.
Ermias Teshome, Chemeda Fininsa and Samuel Sahile, 2013. In vivo Assay for Antagonistic Potential of Fungal Isolates against Faba bean (Vicia faba L.) Chocolate Spot (Botrytis fabae Sard.). Jordan Journal o f Biological Sciences, pi 83-189.
236

Oromia Agricultural Research Institute (IQQO), Crop research Proceeding 2017
IC A RD A (International Center for Agricultural Research in Dry Areas), 2006. Technology Generations and Dissemination for Sustainable Production of Cereals and Cool Season Legumes. International Center for Agricultural Research in the Dry Areas, Aleppo, Syria.256 p.
Metayer, 2004. V icia faba breeding for sustainable agriculture in Europe. Gie feverole.M oA (Ministry of Agriculture), 2011. Animal and Plant Health Regulation Directorate.Crop variety
register. Issue No. 14. Addis Ababa, Ethiopia, pp. 71-73.M oARD (Ministry of Agriculture and Rural Development), 2008. Animal and Plant Health
Regulatory Directorate. Crop Variety Register.Issue No.l 1 Addis Ababa, Ethiopia.Mussa, J., Dereje Gorfu and Gemechu Keneni, 2008. Procedures of Faba Bean Improvement through
Hybridization. Technical Manual No. 21, Ethiopian Institute of Agricultural Research. p48.Nefb, Kedir; Geleto, Tilahun; and Aman, Alio (eds.), 2008. Fifteen years achievements: Oromia
Agricultual Research Institute, Sinana Agricultural Research Center, Bale-Robe, Southeast Ethiopia.
Sahiie Samuel, Chemeda Fininsa, P.K.Sakhuja and Seid Ahmed, 2008a. Effect o f mixed cropping and fungicides on chocolate spot (Bo trtyis fabae ) o f faba bean (v ic ia fab a ) in Ethiopia. Crop Protection.21:275-282.
Sahiie, S., Ahmed, S., Fininsa, C., Abang, M.M. and Sakhuja, P.K. 2008c. Yield loss of faba bean (V icia faba) due to chocolate spot (Botrytis fabae) in sole and mixed cropping systems in Ethiopia. Plant Protection, 43:12, 1144-1159.
SA S Institute. 1998. SAS/STAT guide for personal computers, version 6.12 edition. Cary, NC: SA S Institute.
Shaner, G. and Finney, R.E., 1977. The effect of nitrogen fertilization in the expression o f slow- mildewing resistance in Knox wheat. Phytopathology, 67, 1051-1056. doi:10.1094/Phyto-67-1051.
Van der Plank, J.E . 1963. Epidemiology o f Plant Disease.New York and London Academic publishers. 206p.
Wheeler, J.B ., 1969. An introduction to plant diseases. W iley, london, P. 347.
Weed Management Practices and their effect on Weeds and Yield of Barley (Hordeum vulgare L.) at Shambo and Gedo, Western OromiaMegersa Kebede*1, Tigist Bidira2, Geleta Gerama1, Girma Chemeda1, Kasa Mamo', Megersa Debela1 and Hailu Feyisa1,! Oromia Agricultural Research Institute, Bako Agricultural Research Center
2 Ethiopian Institute of Agricultural Research, Jimma Agricultural Research Center, P.O .BO X 192, Jima, Ethiopia"“Corresponding Authors’ email: - [email protected] AbstractA fie ld experiment on weed control in barley was conducted during the main season o f 2015/2016. D ifferent weed management practices were evaluated w ith the hand weeding and weedy check, fo r weed com petition and grain y ie ld o f barley. The tria l was la id out in random ized com plete block design in three replications. Results o f the experim ent revealed (hat sign ifican tly lowest total weed density’ (13.3m 2) and (29.7 m 2) and maximum gra in y ie ld o f (4312.5 and 4382.6 kg h a '1) w ith (50.7 and 54.4 % ) harvest index were recorded in two times hand weeded p lot at Shambo and Gedo sites, respectively. The low est total weed d iy weight (20.3 m 2)an d (17.8g mi2) with highest control efficiency (81. 7 and 72.4 % ) were recorded from two times hand weeded plots fo llow ed byD ical 720 gm/lt SL + Fenoxaprop-P-Ethyl 69 gm/lt at these respective locations. The highest weed density (49.5m ) and ( 102.0 m '2), and lowest g rain y ie ld (2525.7 kg ha J) and (2776.9 kg h a '1) was obtained from weedy check at Shambo and Gedo, respectively. Econom ic analysis shows that the maximum rate o f return (36.4162 and 35.91566) was obtained from D ica l fo llow ed by Fenoxaprop-P-Ethyl 69 gm/lt + D ica l 720 gm/lt SL (4.080275 and 6.5375) at Sham bo and Gedo, respectively. It can be concluded that integration o f Fenoxaprop-P-Ethyl 69 gm/lt w ith D ica l 720 gm/lt SL o r one time hand weeding was quite effective to contro l m ajor broad and grass weed species observed in barley fie lds.
Key words: - Integrated practices, Barley, weed reduction, Grain yield.
237

Oromia Agricultural Research Institute (IQQO). Crop research Proceeding 2017
IntroductionEthiopia is the second largest barley (Hordeum \mlgare L.) producer in Africa, next to Morocco, accounting for about 25 percent of the total barley production in the continent (FAO, 2014). It is grown mainly in the highlands of the country and represents approximately 11% share of the total area where grain is cropped (CACC, 2003). It is predominantly grown at altitudes ranging from 2000 to 3000 m.a.s.l in various regions of the country. It is also preferred by subsistence farmers because of its ability to grow on marginal farms, unlike other cereals. Barley has a wide range of uses. Its grain is used as a staple food, for malting and for making local drinks, and is sold for cash. The grain is rich in Zinc, iron and soluble fibers and higher in contents of vitamin A and E than other cereals. Its straw and stem stubs are used for animal feed and thatching. The annual average national yield of the crop is only 1200 kg/ha (CSA, 2005). The low national average yield, which is far below the world average, could be partially attributed to poor weed management, which results in high competition from weeds. Yield gains from weed control, on the other hand, ranges from 14-60 percent depending on the location and type of weed (Negewo et at., 2011; Negewo et at., 2006). Weeds are important constraint in agricultural production systems, acting at same tropic level as the crop: weeds capture a part of the available resources that are essential for plant growth (Oerke, 2006; Ryan et al., 2009; Smith et al.,2010). Weeds compete with crop plants for various resources such as water and nutrients, resulting in low yields (Jarwar et al., 2005). By competing for light, water, space and nutrients, weeds can reduce crop yield and quality and can lead to billions of dollars in global crop losses annually (Das, 2008; Srinivasrao et al., 2014).Weed control plays an important role in raising barley grain yield, since weeds cause great losses in yield that reaches 48.9 % (Metwally et al., 2000). Effective weed management is critical to maintaining agricultural productivity (Ahmed et al., 2010; Verma, 2014). Weeds can be controlled through different management practices in barley fields. These include cultural, physical, chemical and integrated methods. Hand weeding is the most practiced weed control option in barley. Manual weed control is labour intensive and therefore limits the production area (Verma et al., 2008; Dubey,2014). Chemical control is the most common, efficient and economical method of control (Dailey et al.. 2006; Marwat et al.. 2008). In many barley producing areas, barley fields are mostly treated with broadleaf herbicides. The herbicide 2, 4 dichlorophenoxy acetic acid (Dical) was the first to be introduced in rain-fed areas for the control of broadleaved weeds (Goetze 1976, Qasim 1982). Under partial weed management, it is common to observe barley fields infested with grass weeds, causing yield losses of up to 60% in some barley growing areas of Ethiopia (Alemu Hailye et al., 1999). El- Bawab and Kholousy (2003) reported that controlling weeds by herbicidal treatments increased grain yield by about 40.3 and 13.6%, compared with unweeded and hand weeding treatments, respectively. Several herbicides are available to control barley weeds. Metosulam and sulfamoylurea herbicides were introduced as new selective herbicides for controlling broadleaved weeds in cereals (El- Metwally, 2002). Fenoxaprop-p-ethyl and clodinafop-propargyl are two selective herbicides for control of grass weeds in wheat and barley (Nassar, 2008). El- Metwally and El-Rokiek (2007) also found that the two herbicides provided control of narrow leaf weeds (97.7% reduction in dry weight after 90 DFS). Several combinations of herbicides are there that can provide good control of broad and narrow leaved weeds and cause significant reduction in their density and increase yield attributes(Chaudhry et al., 2008; Bostrom & Fogelfors, 2002; Khan & Rashid, 1994). Integrated weed management relies on weed management principles that are proved to be suitable for long term weed management by combining the use of cultural, mechanical, thermal, biological and chemical means based on ecological approaches (Singh, 2014; Kewat, 2014).Despite suitable environmental condition of Western Oromia highlands and importance of barley as food, malting and cash crop for farmers, both broad and grass weeds infestation has been a major constraint to barley production in these areas. Few investigations indicated that most broadleaf weeds are effectively controlled by hand weeding because they are easier to identify and can also be controlled using cheaply available 2, 4-D herbicide. However, no effective and applicable technology
238

Oromia Agricultural Research Institute (IQQO), Crop research Proceeding 2017
has yet been adopted to control grass weed species in barley in these areas. Hand weeding failed to control most grasses, especially wild oat, which resembles the crop and cause higher damage as they compete with the crop throughout the growing season. Hence, the introduction of any revised weed management technology which is economically and agronomical feasible, such as combination of herbicides and/or with hand weeding should be investigated for western Oromia barley growing areas. Thus, the objective of this study was to identify and develop effective weed management option/s in Barley (Hordeum vulgare L.) in Western Oromia.Materials and MethodsDescription of Study Areas: The experiments were conducted at Shambo and Gedo on farmers’ field for one year (2015/16) during the main cropping season. Gedo site is found in Western Showa zone about 60 km North West o f Ambo, the capital town of the zone. It is located at 09°012’ 84” N latitude, 37° 26’ 23.9” E longitude and altitude of 2438 masl. The soil is clay loam in texture. Shambo site is found in Horo-Guduru Wolega zone about 4 km northwest of Shambo, the capital town of the zone. It is located on geographic coordinates of 09°037’23.0” N latitude, 370 40’ 33.2” E longitudes and altitude of 2609masl.Treatments, Experimental Design and Crop Husbandry: The experiment contains seven treatments arranged in Randomized Complete Block Design (R C BD ) in three replications on 4m x 5m plot size. Treatments comprised of post-emergence application of Fenoxaprop-P-Ethyl 69 gm/lt, Dical, Fenoxaprop-P-Ethyl 69 gm/lt + Dical 720 gm/lt SL, Fenoxaprop-P-Ethyl 69 gm/lt + One times hand w'eeding at 40 DAS, Dical 720 gm/lt SL + One times hand weeding at 40 DAS, Two times hand weeding at 25 and 40 DAS, and weedy check. Improved Food barley variety “ HB-1307” with seed rate of 85 kg ha'1 was used in the experiment. The herbicides were applied at 30 days after sowing or (between 2-4 crop leaves stage) using Knapsack sprayer fitted with flat fan nozzle by mixing 200 liters of water per hectare. Dical 720 gm/lt SL and Fenoxaprop-P-Ethyl 69 gm/lt were applied at the rates of 1 L and 1.25 L h a 1, respectively.Table 1. Trade and Common Name of Herbicides and Rates
Trade Name Common Name Rates per hectareDical Dical 720 gm/lt SL 1 LRalon Super E W 144 Fenoxaprop-P-Ethyl 69 gm/lt 5
D a ta co lle c tio n a n d A n a ly s is
All agronomic practices were applied as per recommendation and necessary data were collected from both weed and barley crop. Weed infestation was assessed and scored by number and species by throwing quadrate with 50cm x 50cm area three times per plot as per method described by Cruz et al. (1986). Percentage of weed inhibition (PW1) was calculated by the formula:
/ N W T \P e rce n ta g e o f w eed in h ib itio n ( P W l ) = \^NWC — —J * 100 ............................... ( Eq n . 1)
Where, N W C & N W T are number of weeds (rrf2) in weedy check and any particular treatment, respectively.Weeds within quadrant were harvested and dried in oven dry. The dry weight o f each species was taken by an electrical balance and expressed in g m z. Weed control efficiency (W C E ) was calculated using the following formula developed by Sawant and Jadhav (1985),
/ WDT\W eed co n tro l e f f ic a c y (W C E ) = f WDC — — * 100 ........................( Eq n . 2 )
Where, W D C & W D T are weed dry weight (g m'2) in weedy check and any particular treatment, respectively.The collected data were subjected to analysis of variance (A N O V A ) using SA S the statistical software (SA S, 2008) (version 9.2). The mean separation, in cases where there were significant differences among treatments, was done using LSD (0.05) to facilitate the comparison of all pairs of treatment means (Montgomery, 2001).Data of weed parameters were transformed in square root for statistical analysis V x+0.5 (Panse and Sukhamet 1967).
239

Oromia Agricultural Research Institute (IQQO), Crop research Proceeding 2017
Results and DiscusionWeed Flora Composition: Various weeds species were observed in the experimental fields. They can be categorized under broad and grass weed species. A total of 18 weed species (11 broadleaf and 7 grass species) belonging to 10 families were recorded (Table 2). Among grass weed species, Avena fatua, Phalaris paradoxa, Oplismus hetilatus and setana pum ila were the major ones. On the other hand, Guizotia scarba, Spergula Arvensis, Raphanus raphanustrum. Galium sporium, and Polygnom nepalensis were the major broad leaf weed species observed in the trial fields across locations.Table 2. Scientific names, family, life form and categories of weeds in experimental field
Scientific name Family Life form (Category)Achyranthes aspera Acanthaceae Annual(Broadleaved)A vena fatua Graminaea Annual(Grass)Caylusea abyssinica Resedaceae Annual(Broadleaved)Commolina latifolia Commelinaceae Annual(Broadleaved)Corrigoila capensis Caryophyllaceae Annual( Broad leaved)Digitaria ternate Graminaea Annual(Grass)Galinsoga Parviflora Asteraceae Annual(Broad leaved)Galium sporium Rubiaceae Annual(broadleaved)Guizotia scarab Asteraceae Annuaf(Broadleaved)Oplismus hertilutus Graminaea Annual(Grass)Phalaris paradoxa Graminaea Annual(Grass)Poa Annua Graminaea Annual(Grass)Polygonum nepalense. Polygnonaceae Annual( Broadleaved)Rhaphanus raphanistrum Brassicaceae Annual(Broadleaved)Setaria pumila Graminaea Annual(Grass)Snodonia Polystachia Graminaea Annual(Grass)Spergula arvensis Caryophyllaceae Annual(Broadleaved)Stachvs arvensis Labiatae Annual(Broadleaved)
Weed Density (m'2) and Percentage Weed Reduction: Results of the experiment revealed that all weed management practices reduced weed density significantly as compared to weedy check (Table 3). But the level of reduction varies based on the type of practices. This is in analogy with findings of Rekha et al., (2002) who reported that weed density was lower in all weeding practices compared to the un-weeded control plot. Among the weed management practices, the minimum total weed density (13.3m ’ and 29.7 m ") was recorded in two times hand weeded plots followed by Fenoxaprop-P-Ethyl 69 gm/lt + One times hand weeding ( 16.0m’2 and 30.3m'2) at Shambo and Gedo, respectively. The lower number of weed density shows the effectiveness of management practices in weed suppression compared to the maximum total weed density (49.5m'2 and 102.0 m'2) observed in weedy check plots at Shambo and Gedo, respectively. This result is supported by the reports of Singh and Pillai (1993). From post-emergence herbicides, plots treated with Fenoxaprop-P-Ethy) 69 gm/lt alone shown the minimum number of grass weed species at both study locations and scored higher number of broad leaved weed species. Nassar (2008) reported that Fenoxaprop-p-ethyl and clodinafop-propargyl are the two herbicides effective against grass weeds. In contrast, application of Dical 720 gm/lt SL alone at thirty days after sowing (30 DAS) scored the minimum number of broad lea f weed species. These variations are due to the selective nature of those herbicides. This result was in line with the finding of Nano et al. (2012) who reported 2, 4-DEE to be ineffective in reducing the population of grassy weeds but effectively controlled broad leaved weed species. Thus, Dical 720 gm/lt SL can be a better option for broadleaf weed infested fields in the periods o f labor shortage. These results are also in accordance with those of Salarzai et a l. (1999) and Nati (1994) who concluded that herbicides significantly affected the weed population per unit area.Combination of herbicides (Dical 720 gm/lt SL + Fenoxaprop-P-Ethyl 69 gm/lt) effectively controlled both broad and narrow leaved weed species. Herbicides m ixtures that are effective against target weed species can show synergetic effect and result in sufficient management.
240

Oromia Agricultural Research Institute (IQQO), Crop research Proceeding 2017
This result is in analogy with the findings of (Chaudhry et al., 2008; Bostrom &Fogelfors, 2002; Khan & Rashid, 1994) where several combinations ofherbicides provided good control ofbroad and narrow leaved weeds and caused significantreduction in their density andincrease yield attributes ascompared to check plots. Percentage weed reductions of all the treatments were different (Table 3). The maximum percentage of weed reduction (72.9 and 70.8 % ) was recorded from two times hand weeded plot followed by Fenoxaprop-P-Ethyl 69 gm/lt + One times hand weeded plots (66.0 and 70.2%) at Shambo and Gedo, respectively. Results had shown variation across location for weed density that could be mainly due environmental factors.Weed dry weight (g m'2) and weed control efficiency (W CE % ): Results of the experiments regarding weed dry weight (g m'2) and weed control efficiency (WCE % ) depicted that both of these parameters were significantly affected by weed management practices (Table 4). All treatments significantly reduced weed dry weight (g m'2) as compared to weedy check. This is in analogy with the finding of Sharma et al. (1998) and Saini, (2000) who reported significant reduction in weed dry matter accumulation with weed control treatments. Statistically significant difference was observed among treatments for total weed dry weight (g m 2) at both study areas. The maximum total weed dry weights (111 and 65.5g m'2) were recorded from un-treated plots at Shambo and Gedo, respectively. Singh and Kumar (1999) also reported that the maximum weed dry weight was recorded in the un-weeded control which was significantly higher compared to other weed control practices. The minimum total weed dry weights (20.3 and 17.8g m"“) were observed in two times hand weeded plots at Shambo and Gedo, respectively.Table 3. Effect of weed management practices on weed density(m'") at study areas
Weed Density (m'2) at 80 DAS
Shambo
Weed Density (m-2) at 80DAS
GedoTreatm ents B ro a d ( m ‘2) Gr ass ( m ' 2) T o t a l ( m ‘2) P W R ( % ) B r o a d (m '
2)I2 .7 ± 3 .6 c
G r a s s ( m ‘
2)30.7 ±5.5
a
T o t a l ( m-2}
P W R ( % )
Dic al 9 .7± 3.1b !0 .7 ± 3 .2 b a 20.3 ±4 .5 bc 58.6 7.6b)
4 3.3 ±6 .6b
5 7 .3 ±7 .7 b
D ic a i + F e n o x 9.5 ± 3 .1 b 7.8 ± 2.8b 17.3±4 .2bc 64.5 ±8 .0 ba 2 5 .3 ± 5 b 12.7±3.5b
38.0 ±6 .le bd
62.8 ± 7 .9 ba
Fenox 12.5±3 .5b 7.1 ± 2.6b c 19.5±4 .4bc 60.5 ±7 .8 ba 26.0 ±5 .1 b 15.3 ±3 .9b
4 1 .3 ±6 .4bc
59.3 ± 7 .7 b
F e n o x + H W ( l x ) 7.1 ± 2 . 6b 9 .7± 3.1b 16.7±4 .1bc 6 6.0 ±8 .1 ba 14.0±3.7c 16.3±3 .9b
30.3 ±5 .5d
70.2 ±8.3 a
D i c a l + H W ( l x ) 10.5±3 .2b I0 .7 ± 3 .3 b a 21.1 ± 4 . 7b 57.4 ±7 .6 b I9 .3 ± 4 .4 bc
11.3±3.4 b
30.7 ±5 .6cd
69.9 a±8.4
H W ( 2 X ) 1 0 .2 ± 3 . lb 3 .1 ± 1.7c 13.3±3.7c 72 .9 ±8.5 a 17.0±4. lb c
12.7±3.5b
2 9 .7 ±5 .4d
7 0.8 ±8.4 a
U N W D 3 S.3± 5.9 a 14.2±3.8a 49.5 ±7 .0 a 0 C 73 .3 ±8.6 a 2 8 .7 ±5 .4a
102.0±l0.1a
0c
L S D ( 0 . 0 5 ) 5.7 4.4 7.2 12.6 9.8 8 10.7 10.2
C V ( % ) 12.68 15.69 10.79 6.51 11.2 12.3 7.7 5.1
F-test ** ** ** ** ** ** ** **
Note: - Means followed by the same letter within columns has statistically no difference.LSD= list signifance difference, CV (% ) = Coefficient of variation, F-test= probability signifance difference & highly signifance difference, respectively, PW R(%) = Percentage wee WD — weedy check, Fenox = Fenoxaprop-P-Ethyl 69 gm/lt, Dical + HW (lx) = Dical 720 £ weeding. Fenox+ D ical— Fenoxaprop-P-Ethyl 69 gm/lt + Dical 720 gm/lt SL, HW(2x}~ weeded. Fenox + HW (lx) = Fenoxaprop-P-E thy I 69 gm/lt + One times hand weeding
241

Oromia Agricultural Research Institute (IQQO). Crop research Proceeding 2017
Application of Dical 720 gm/lt SL and Fenoxaprop-P-Ethyl 69 gm/lt alone and in integration significantly reduced the total weed dry weight as compared with un-treated plots. The reduction in weed dry weight might be due to the inhibition effect of herbicide treatments on growth and development of weeds. These results are generally in agreement with the reports of Turk et al (2003); Nassar (2008) and EL-Metwally and Soudy (2009). Combination of these chemicals with one times hand weeding also resulted insignificantreduction of weed dry weight. Treatments had shown different weed control efficacy. Twice hand weeding provided maximum weed control efficacy (81.7 and 72.4 % ) followed by Dical 720 gm/lt SL + Fenoxaprop-P-Ethyl 69 gm/lt (77.8 and 68.6 % ) treated plots at Shambo and Gedo, respectively. These results are in accordance with the findings of Shah and Koul (1990) and Thakur (1994), who observed higher WCE under twice hand weeding carried out at20 and 40 days after sowing in maize crop.
242

Oromia Agricultural Research Institute (IQQO), Crop research Proceeding 2017
Table 4. Effect of weed management practices on weed dry matter(g m '2) at Shambo and Gedo
Weed Dry \veight(g m at 80 days after sowing
TreatmentsShambo GedoBroad(u m':) Grassfg m:) Total(g m :) WCE (%) Broad(g m ’) Grass (g m “) Total (g m ° ) WCE(%)
Dical 22.0b±4.7be 23.0±4.6a 43.7±6.5 b 60.7±7.7d 16.5±4.0be 16.7±4.0a 33.1 ±5.7b 50. l±7.0e
Dical+Fenox I6.3±4.0cd 8.3±2.9b 24.7 ±+5.0 cde 77.8 ±8.8bac 10.7±3.2c 9.5±3.1b 20.2± 4.5ed 68.6±8.3baFenox 26.0±5.1b 9.3±3b 35.3±5.9bcd 68.2± 8.2bad 21.7±4.6b 8.4±2.9b 30.l±5.5be 53.9±7.3bcFenox+HW I4.0±3.6c 7.3±2.7b 21.3 ±4.6 de 75.1±9.0ba 15.3±3.9bc 8±2.8b 23.3±4.8ebd 64.8±8.0bacDical+HW 25 ± 5.0b 12.0±3.4bb 37.0 ±6.1 be 66.7±8.2 de 12±3.5c 10.2±3.2b 22.2±4.7ed 65.8±8.lba
HW(2X) 13.3 ± 3.6d 7.0±2.6b 20.3±4.5e 81.7±9.0a 9.8±3.1e 8.0±2.8b \7.8±4.2d 72.4±8.5a
UN WD 82a± 13.03a 29.0 ± 5.4a 111 ±10.5a Oe 48.0±6.9a 17.5±4.2a 65.5±8. la
LSD 7.1 10.8 14.8 13.3 7.7 6.1 10.8 14.8CV (%) 10.1 18.3 11.2 6.6 11.8 15.4 10.3 OO Lri
F-test ** ** ** ** ** * »* **
Note: - Means followed by the same letter within columns has statistically no difference.LSD= list sign if a nee difference, CV (% ) = Coefficient o f variation, F-test~ probability value,*,** = signifance difference & highly signifance difference, respectively, WCE(%) = weed control efficacy ,UN WD = weedy check, Fenox- Fenoxaprop-P-Ethyl 69 gm/lt. Dical +HlV(lx) = Dical 72(1 gm/lt SL + One times hand weeding, Fenox + Dical= Fenoxaprop-P-Ethyl 69 gm/lt + Dical 720 gm/lt SL, HW(2x)= two times hand weeded, Fenox + HW(!x)=Fenoxaprop-P-Ethyl 69 gm/lt + One times hand weeding
243

Yield and yield related parameters of barley: Analysis of variance revealed that there is statistically significant difference observed among treatments in yield and yield components like plant height, number of tillers m':, spike length and thousand kernel weight (Table 5 & 6).Number of tillers: All treatments were superior over un-weeded (weedy) check across locations in number of tillers they produced. Maximum number of tillers were obtained from two times hand weeded (199.7 and 215.6 m‘2) plots. However, the minimum number of tillers( 154.7 and 183.4 m'2) were observed in un-weeded plots at Shambo and Gedo, respectively. The combinations of treatments significantly increased the number of tillers compared to other treatments except two times hand weeding. This maximum number of tillers wasprimarily due to the better crop growth as a result of less competition with weeds. This is in agreement with the findings of Ijaz et al. (2008) who reported that better weed control increased the nutrients availability to the crop which ultimately increased the spike bearing tillers. Application of herbicides alone resulted in lower number of tillers, while doses of herbicides when supplemented with one hand weeding resulted in better tiller numbers.Plant height: Among the treatments the highest plant heights (115.3 and 116 cm) were measured from two times hand weeded plots followed by Dical 720 gm/lt SL + one times hand weeded at (40 DAS), having (109 and 115.4 cm) at Shambo and Gedo, respectively while the minimum plant height (100 and 103 cm) were scored in weedy check plot in similar order. The maximum plant height scored is due to efficient weed control provided by these treatments. The minimum plant height is attributed to adverse crop affect caused by heavy weed competition for resource which in turn suppressed crop growth. This result is in analogy with (Oerke. 2006; Ryan et aJ., 2009; Smith et al., 2010).
Panicle length: Analysis of variance revealed that panicle length was statistically significantly affected by weed management practices (p<0.05) at Shambo, while no statistically significance difference was observed for panicle length at Gedo site (Table 5). But, numerical difference was observed. Plots treated with combination of Dical 720 gm/lt SL and Fenoxaprop-P-Ethyl 69 gm/lt scored the highest panicle length (7.2 and 6.9 cm) where the lowest (6.3 and 6.0 cm) was observed in un-weeded plot at Shambo and Gedo, respectively.
Number of grain per spike: Number of grain per spike is one of the basic parameters in studying weed management practices to assess its impact on crop and weeds. Results showed that there is significant difference among treatments in of number of grain per spike. All treatments showed superiority over un-weeded plots. The maximum number of grain per spike (48.5) was obtained from the plots treated with hand weeding + Fenoxaprop-P-Ethyi 69 gm/lt followed by two times hand weeding (46.9) at Shambo site, whereas maximum (51.1) grain per spike was found in Dical 720 gm/lt SL + Fenoxaprop-P-Ethyl 69 gm/lt followed by hand weeding + Fenoxaprop-P-Ethyl 69 gm/lt (50.9) at Gedo site. The minimum number of grain per spike (42.2 and 46.0) was obtained from un-weeded plots at Shambo and Gedo, respectively. Significantly higher number of grains is the result of easily accessible growth factors (nutrient, moisture and light) for individual plant that retained more flowers and higher net assimilation rate in the absence of competition from weeds. Also the development of more and vigorous leaves under low weed infestation might have helped to improve the photosynthetic efficiency of the crop and supported higher number of grains. Similar result was reported by (Chaudhry et al., 2008; Bostrom & Fogelfors, 2002; Khan & Rashid, 1994).
244

Oromia Agricultural Research Institute (IQQO), Crop research Proceeding 2017
Grain yield as affected by weed management practices: Grain yield was affected significantly by weed management practices. The maximum grain yield (43)2.5 and 4382.6 kg ha ') was recorded in two times hand weeded plot. This maximum yield is due to effective w-eed management achieved by hand weeding without possible adverse effect. The minimum yield (2525.7 and 2776.9 kg ha1) was recorded in weedy check at Shambo and Gedo, respectively, attributed to maximum weed infestation that can heavily compete for resource. This is in analogy with the reports of Jarwar et at., (2005) which suggests weeds compete with crop plants for various resources such as water and nutrients, resulting in low yields. Chaudhary et al., 2008; Dailey et al., f2006) also reported that high weeds intensity and more competition time with crop plants cause more reduction in crop yield. Post-emergence application of Fenoxaprop-P-Ethyl 69 gm/lt alone 'SfKttved the least (3532.2 and 3533.5 kg) grain yield is comp&retf other treatments exceptun-treated check at Shambo and Gedo, respectively.Combination of management practices provided better yield as compared with single management practices. This performance might be due to synergistic effect in weed control provided by integration of management options. This is in conformity with Singh (2014); Kewat, (2014). Integration of the two herbicides, Fenoxaprop-P-Ethyl 69 gm/lt at the rate of 1.25 L and Dical 720 gm/lt SL 1 L per hectare gave the maximum yields (4166.7 and 4303.5 kg) next to two times hand weeding at Shambo and Gedo, respectively. This is due to the fact thatcombination of herbicides resulted in broad spectrum effect that achieved effective management for almost all weed species which in turn leads to increase in grain yield. It is in analogy with the findings of Chaudhry et al., 2008; Bostrom & Fogelfors, 2002; Khan & Rashid, 1994 who reported combinations of herbicides can provide good control of broad and narrow leaved w'eeds and cause significant reduction in their density and increase yield attributes as compared to check. The combination of herbicides with hand weeding also showed better yield compared to herbicidal application alone and un-weeded check
Harvest index as influenced by weed management radices: Harvest index of the crop was significantly affected by treatments. There was highly significant difference among weed management practices at both study sites (Table 5 & 6). The variation in harvest index under different treatments is due to variation in the grain yield and yield related parameters. Two times hand weeding produced significantly maximum harvest index (50.7 and 54.4 % ) followed by Fenoxaprop-P-Ethyl 69 gm/lt + one times hand weeding (47.3 and 53.0 % ) at Shambo and Gedo, respectively. Whereas the minimum (22.0 and 27.6 % ) was obtained from weedy check plots at those respective locations. In agreement with this result, Nano (20)2) reported that twice hand weeding showed the highest harvest index (46%) than other treatments on the same variety.
245
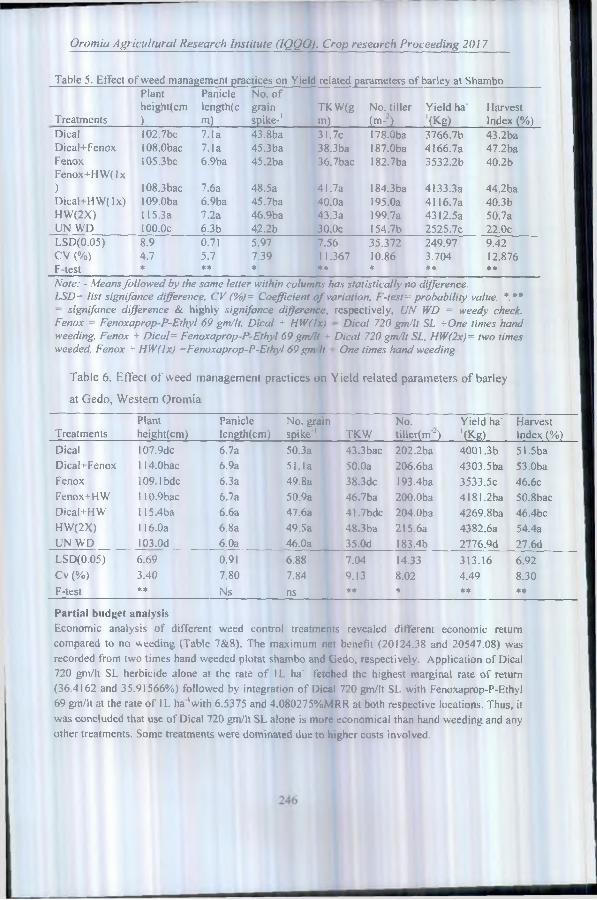
Oromia Agricultural Research Institute (IQQO), Crop research Proceeding 20 J 7
Table 5. Effect of weed management practices on Yield related parameters of barley at Shambo
Treatments
Plantheight(cm)
Panicle)ength(c_m) .
No. ofgrainspike-1
TKW(gm)
No. tiller (m-:)
Yield ha' '(Kg)
Harvest Index (% )
Dical I02.7bc 7.1a 43.8ba 31.7c 178.0ba 3766.7b 43.2baDical+Fenox I08.0bac 7.1a 45.3ba 38.3ba I87.0ba 4166.7a 47.2baFenox I05.3bc 6.9ba 45.2ba 36.7bac 182.7ba 3532.2b 40.2bFenox+HW(lx) I08.3bac 7.6a 48.5a 41.7a 184.3ba 4133.3a 44.2baDical+HW(lx) 109.0ba 6.9ba 45.7ba 40.0a 195.0a 4116.7a 40.3bHW(2X) 115.3a 7.2a 46.9ba 43.3a 199.7a 4312.5a 50.7aUN WD 100.0c 6.3b 42.2b 30.0c 154.7b 2525.7c 22.0cLSD(0.05) 8.9 0.71 5.97 7.56 35.372 249.97 9.42CV (% ) 4.7 5.7 7.39 11.367 10.86 3.704 12.876F-test * ** * ** * ** **Note: - Means followed by the same letter within columns has statistically no difference.LSD= list signifance difference, CV (%)= Coefficient of variation. F-test= probability value. *.** = signifance difference & highly signifance difference, respectively, UN WD = weedy check. Fenox = Fenoxaprop-P-Ethyl 69 gm/lt. D ical + HW(lx) - Dical 720 gm/ll SL +One times hand weeding. Fenox + Dical= Fenoxaprop-P-Ethyl 69 gm/lt + Dical 720 gm/lt SL. HW(2x) = two times weeded. Fenox + HW (lx) =Fenoxaprop-P-Ethyl 69 gm It One times hand weeding
Table 6. Effect of weed management practices on Yield related parameters of barleyat Gedo, Western Oromia
TreatmentsPlantheight(cm)
Paniclelength(cm)
No. grain spike'1 TKW
No.tiller(m'*)
Yield ha" '(Kg)
Harvest Index (% )
Dical I07.9dc 6.7a 50.3a 43.3bac 202.2ba 4001.3b 51.5baDical+Fenox 114.0bac 6.9a 51.1a 50.0a 206.6ba 4303.5ba 5 3.ObaFenox 109.1 bdc 6.3a 49.8a 38.3dc I93.4ba 3533.5c 46.6cFenox+HW 110.9bac 6.7a 50.9a 46.7ba 200.Oba 4181,2ba 50.8bacDical+HW 115.4ba 6.6a 47.6a 41,7bdc 204.0ba 4269.8ba 46.4bcHW(2X) 116.0a 6.8a 49.5a 48.3ba 215.6a 4382.6a 54.4aUN WD I03.0d 6.0a 46.0a 35.Od 183.4b 2776.9d 27.6dLSD(0.05) 6.69 0.91 6.88 7.04 14.33 313.16 6.92Cv (% ) 3.40 7.80 7.84 9.13 8.02 4.49 8.30F-test ** Ns ns ** * ** **
Partial budget analysisEconomic analysis of different weed control treatments revealed different economic return compared to no weeding (Table 7&8). The maximum net benefit (20124.38 and 20547.08) was recorded from two times hand weeded plotat shambo and Gedo, respectively. Application of Dical 720 gm/lt SL herbicide alone at the rate of IL ha'1 fetched the highest marginal rate of return (36.4162 and 35.91566%) followed by integration of Dical 720 gm/lt SL with Fenoxaprop-P-Ethyl 69 gm/lt at the rate of 1L ha 'with 6.5375 and 4.080275%MRR at both respective locations. Thus, it was concluded that use of Dical 720 gm/lt SL alone is more economical than hand weeding and any other treatments. Some treatments were dominated due to higher costs involved.
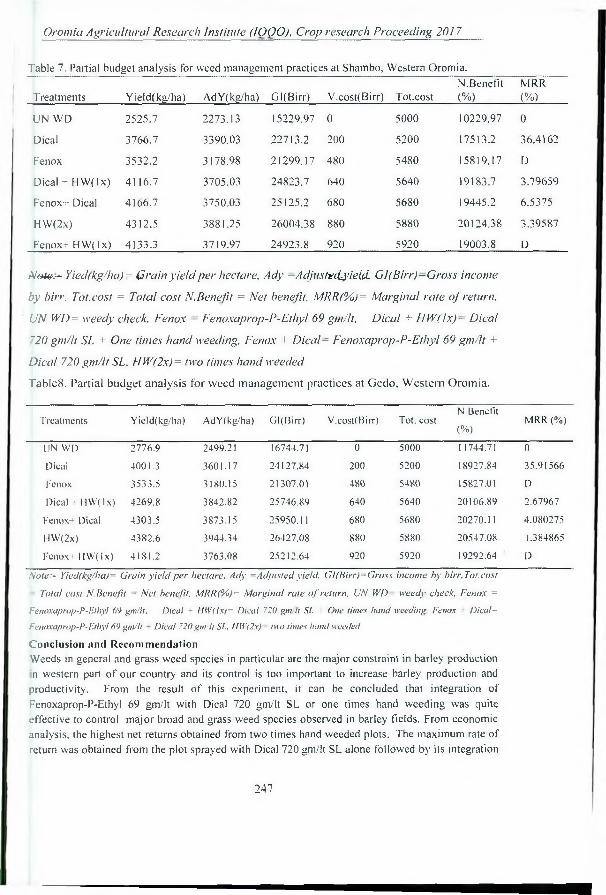
Oromia Agricultural Research Institute (IQQO), Crop research Proceeding 2017
Table 7. Partial budget analysis for weed management practices at Shambo, Western Oromia.
T reatments Yield(kg/ha) AdY(kg/ha) GI(Birr) V.cost(Birr) Tot.costN.Benefit (% )
MRR(% )
UN WD 2525.7 2273.13 15229.97 0 5000 10229.97 0
Dical 3766.7 3390.03 22713.2 200 5200 17513.2 36.4162
Fenox 3532.2 3178.98 21299.17 480 5480 15819.17 D
Dical + It W (lx) 4116.7 3705.03 24823.7 640 5640 19183.7 3.79659
Fenox+ Dical 4166.7 3750.03 25125.2 680 5680 19445.2 6.5375
H W(2x) 4312.5 3881.25 26004.38 880 5880 20124.38 3.39587
Fenox+ HW( lx) 4133.3 3719.97 24923.8 920 5920 19003.8 D
Ate*?.-- Yied(kg/ha)= G rain yield per hectare. Ady —Adjust-ecLyieid. G I (B irr)—Gross income
by birr. Tot. cost = Total cost N. Benefit = Net benefit. M RR(%)= M arginal rate o f return.
UN WD= weedy check. Fenox Fenoxaprop-P-Ethyl 69 gm/lt, D ical + IlW (lx )- D ical
"20 gm/lt SL + One times hand weeding, Fenox + D ical -= Fenoxaprop-P-Ethyl 69 gm/lt +
D ical 720 gm/lt SL. HW(2x)= two times hand weeded
Table8. Partial budget analysis for weed management practices at Gedo, Western Oromia.
Treatments Yield(kg/ha) AdY(kg/ha) Gl( Birr) V.cost(Birr) Tot. costN.Benefit (%)
MRR (%)
UN WD 2776.9 2499.21 16744.71 0 5000 11744.71 0Dical 4001.3 3601.17 24127.84 200 5200 18927.84 35.91566Fenox 3533.5 3180.15 21307.01 480 5480 15827.01 DDical + HW(lx) 4269.8 3842.82 25746.89 640 5640 20106.89 2.67967Fenox+ Dical 4303.5 3873.15 25950.1 1 680 5680 20270.11 4.080275HW(2x) 4382.6 3944.34 26427.08 880 5880 20547.08 1.384865Fenox+ FIW(lx) 4181.2 3763.08 25212.64 920 5920 19292.64 D
Note:- Yied(kg/ha)= Grain y ie ld p er hectare. Ady = Adjusted yield, GI(Birr)=Gross income by birr, Tot.cost Total cost N. Benefit ~ N et benefit. MRR(%)= Marginal rate o f return. UN WD weedy check, Fenox =
Fenoxaprop-P-Ethyl 69 gm/lt, Dical - HW(lx)= Dical 720 gm/lt SL - One times hand weeding. Fenox + Dical= Fenoxaprop-P-Ethyl 69 gm/lt + Dical 720 gm/lt SL, HW(2x) two limes hand weeded Conclusion and RecommendationWeeds in general and grass weed species in particular are the major constraint in barley production n western part of our country and its control is too important to increase barley production and
productivity. From the result of this experiment, it can be concluded that integration of Fenoxaprop-P-Ethyl 69 gm/lt with Dical 720 gm/lt SL or one times hand weeding was quite effective to control major broad and grass weed species observed in barley fields. From economic analysis, the highest net returns obtained from two times hand weeded plots. The maximum rate of return was obtained from the plot sprayed with Dical 720 gm/lt SL alone followed by its integration
247
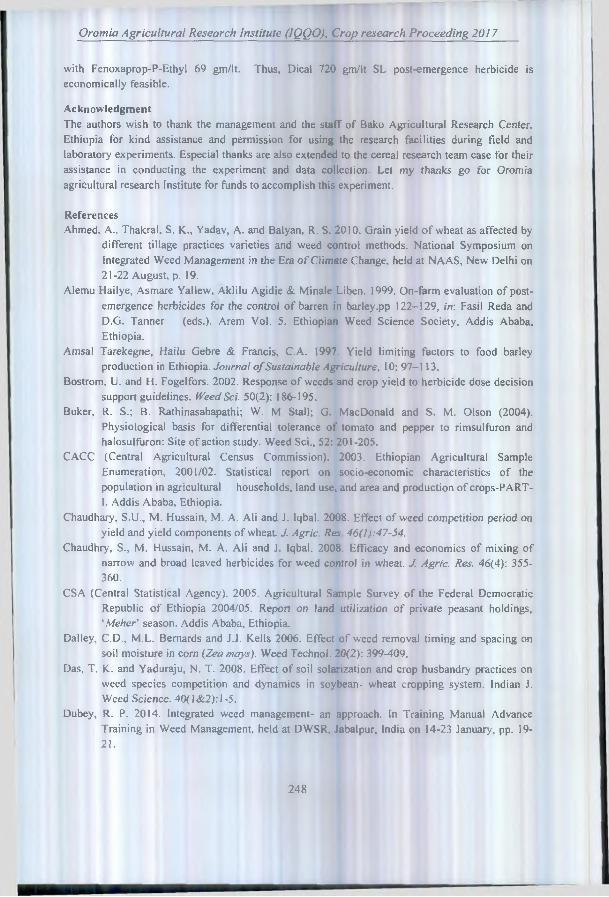
Oromia Agricultural Research Institute (IQQO). Crop research Proceeding 2017
with Fenoxaprop-P-Ethyl 69 gm/lt. Thus, Dical 720 gm/lt SL post-emergence herbicide is economically feasible.
AcknowledgmentThe authors wish to thank the management and the staff of Bako Agricultural Research Center, Ethiopia for kind assistance and permission for using the research facilities during field and laboratory experiments. Especial thanks are also extended to the cereal research team case for their assistance in conducting the experiment and data collection. Let my thanks go for Oromia agricultural research Institute for funds to accomplish this experiment.
ReferencesAhmed, A., Thakral, S. K., Yadav, A. and Balyan, R. S. 2010. Grain yield of wheat as affected by
different tillage practices varieties and weed control methods. National Symposium on Integrated Weed Management in the Era of Climate Change, held at NAAS, New Delhi on21 -22 August, p. 19.
Alemu Hailye, Asmare Yallew, Aklilu Agidie & Minaie Liben. 1999. On-farm evaluation of postemergence herbicides for the control of barren in barley.pp 122-129, in: Fasil Reda and D.G. Tanner (eds.). Arem Vol. 5. Ethiopian Weed Science Society, Addis Ababa, Ethiopia.
Amsa! Tarekegne, Hailu Gebre & Francis, C.A. 1997. Yield limiting factors to food barley production in Ethiopia. Journal of Sustainable Agriculture, 10: 97-113.
Bostrom, U. and H. Fogelfors. 2002. Response of weeds and crop yield to herbicide dose decision support guidelines. Weed Sci. 50(2): 186-195.
Buker, R. S.; B. Rathinasabapathi; W. M Stall; G. MacDonald and S. M. Olson (2004). Physiological basis for differential tolerance of tomato and pepper to rimsulfuron and halosulfuron: Site of action study. Weed Sci., 52: 201-205.
CACC (Central Agricultural Census Commission). 2003. Ethiopian Agricultural Sample Enumeration, 2001/02. Statistical report on socio-economic characteristics of the population in agricultural households, land use, and area and production of crops-PART- I. Addis Ababa, Ethiopia.
Chaudhary, S.U., M. Hussain, M. A. Ali and J. Iqbal. 2008. Effect of weed competition period on yield and yield components of wheat J. Agric. Res 46(l):47-54.
Chaudhry, S., M. Hussain, M. A. Ali and J. Iqbal. 2008. Efficacy and economics of mixing of narrow and broad leaved herbicides for weed control in wheat. J. Agric. Res. 46(4): 355- 360.
CSA (Central Statistical Agency). 2005. Agricultural Sample Survey of the Federal Democratic Republic of Ethiopia 2004/05. Report on land utilization of private peasant holdings,‘Meher’ season. Addis Ababa, Ethiopia.
Dailey, C.D., M.L. Bernards and J.J. Kells 2006. Effect of weed removal timing and spacing on soil moisture in corn (Zea mays). Weed Technol. 20(2): 399-409.
Das, T. K. and Yaduraju, N. T. 2008. Effect of soil solarization and crop husbandry practices on weed species competition and dynamics in soybean- wheat cropping system. Indian J. Weed Science. 40( I &2): I ~5.
Dubey, R. P. 2014. Integrated weed management- an approach. In Training Manual Advance Training in Weed Management, held at DWSR, Jabalpur, India on 14-23 January, pp. 19- 21 .
248

Oromia Agricultural Research Institute (IQQO), Crop research Proceeding 2017
El-Bawab, A. M. O. and A. O. Kholousy (2003). Effect of seeding rate and method of weed control on theProductivity of Giza 2000, a promising barley line, under new lands condition. Egypt. J. of Agric. Res., 81 (3): 1085 -1098.
EI-Metwally, I. M. and H.S. Soudy (2009). Herbicides tank mixtures efficiency on weeds and wheat productivity.
EI-Metwally, I. M. and K. G. El-Rokiek (2007). Response of wheat plants and accompanied weeds to some new herbicides alone or combined in sequence. Arab Univ. J. Agric. Sci, Ain Shams Univ., 15:513 - 525.
El-Metwally, I. M. (2002). Performance of some wheat cultivars and associated weeds to someweed control treatments. Zagazig J. Agric. Res., 29(6):1907-1927.
FAO (Food and Agriculture Organization). 2014. Food Balance Sheets. FAOSTAT. Rome. (http://faostat3.fao.Org/download/FB/FBS/E).
Goetze, N., 1976: Jordan Wheat Research and Production. Final Report, pp. 206— 207. US Agency for International Development, Washington, DC.
Gomez, K. A. and A. A. Gomez (1984). Statistical Procedures for Agriculture Research. A Wiley - Inter Science Publication, John Wiley & Sons, Inc. New York, USA.
Hashim, S., K.B. Marwat and G. Hassan. 2002. Response of wheat varieties to substituted ureaherbicides. Pak. J. Weed Sci. Res. 8(1-2): 49-55.
Hussein, H. F. and E. R. EI-Desoki (2001). Impact of weed control treatments and seeding rate on weeds and productivity on barley (Hordeum vulgare) plants. J. Agric. Sci. Mansoura Univ., 26(6):3677-3688.
Ijaz AK, Hassan G, Marwat KB, Daur 1 (2008). Efficacy of some pre and post emergence herbicides on yield and yield components of canola. Pak. J. Bot. 40:1943-1947.
Ivany, J.A. (2005). Response of three potato ( Solatium tuberosum) cultivars to pyrafluven-ethyl used as adesiccant in Canada. Crop Prot., 24:836 -841.
Jarwar AD, Arain MA, Rajput LS (2005). Chemical weed control in wheat. Pak. J. Weed Sci. Res. 11:11-15.
Kewat, M. L. 2014. Improved weed management in Rabi crops. National Training on Advances in Weed Management pp. 22-25.
Khan, M.H., G. Hassan, N. Khan and M.A. Khan. 2003. Efficacy of different herbicides forcontrolling broadleaf weeds in wheat. Asian J. Plant Sci. 2: 254-56.
Khan, R.W. and A. Rashid. 1994. Efficacy of herbicides for the control of grassy and broad leafweeds in wheat crop at El-Maraj Libya. Pak. J. Bot. 26(2): 327-330.
Malviya, A. and Singh, B. 2007. Weed dynamics, productivity and economics of maize as affected by integrated weed management under rainfed condition. Indian J. Agronomy. 52(4): 321 - 24.
Metwally, G. M.; A. A. A. Hassan and S. A. Ahmed (2000). Influence of some herbicides on barley yield and yield components and the common associated weeds. J. Agric. Sci. Mansoura Univ., 25( 10):6009 - 6019.
Muhammad, A; M, Hussain; G. Hussain and A. Rashid (2007). Efficacy of different herbicides for weed control in wheat crop. Pak. J. Weed Sci. Res.. 13(1-2’): 1-7.
Muhammad. A, KBM, Khan, K Naeem and AK Ijaz. 2003. Efficacy of different herbicides on the yield and yield components of maize. Asian Journal of Plant Sciences, 2: 300-304.
Negewo, T., Feyissa, A., Liben, M. and Zemichael. B. 2011. Achievements of research on weeds and their management in barley in Ethiopia. In: Mulatu, B. and Grando, S. (eds). 2011.
249

Oromia Agricultural Research Institute (IQQO), Crop research Proceeding 2017
Barley Research 55 and Development in Ethiopia. Proceedings of the 2nd National BarleyResearch and Development Review Workshop. 28-30 November 2006, HARC, Holetta,Ethiopia. 1CARDA, PO Box 5466, Aleppo, Syria.
Negewo, T., Mekuria, M. and Hussien, T. 2006. Competition effects of major weed species atvarious densities on yield and yield components of barley (Hordeum vulgare L.). Pest Management Journal of Ethiopia, 10: 53-59.
Nano Alemu, jjsharma and Firdissa lticha, 2012. Influence of Weed management practices and Nitrogen levels on yield and yield attributes of Bread wheat ( Triticum aestivum L.) at Kulumsa, Southeastern Ethiopia, An M.Sc. Thesis presented to the School of Graduate Studies o f Haramaya University
Nassar, A. N. M. (2008). Response of two barley varieties to mineral and biological nitrogenous fertilizer and weed control treatments. J. Agric. Sci. Mansoura Univ., 33 (1 ):29-51.
Nati, D. 1994. Weed control in wheat. Terra-e-Sole 49 (1): 625,426-428.Oerke, E-C. (2006). Crop losses to pests. The Journal of Agricultural Science, Vol. 144, No. 1,
(Feb 2006), pp. 3-43, ISSN 0021-8596.Panse and Sukhamet 1967. Statistical method for agricultural workers. ICAR publication, New
Delhi. Pp. 62Qasim, J. R., 1982: The competitive and allelopathic effects and chemical control of Syrian sage
(Salviasyriaca L.) in wheat. MSc Thesis, University of Jordan, Amman.Rana, M.C. and N.N. Angiras, 1993. Studies on persistence of imazethapyr applied in soybean and
its residual effect on wheat + pea cropping system. Integrated weed management for sustainable agriculture. In:Proceedings of an Indian Society of Weed Science IntemationalSymposium, VoJ. II, Pp: 106-8. Hisar, India, 18-20 November 1993
Rashid, A. and R. U. Khan (2008). Comparative effect of varieties and fertilizer levels on barley (Hordeum vulgare). Int. J. of Agric. and Bio, 10(1): 124 -126.
Rekha, K.B. Raju, M.S. and Reddy, M.D. 2002. Effect of herbicide in transplant aman rice. Indian J. Weed Sci. 34(1-2): 123-125
Riemens, M. M., Widge, R. V. D.. BJeeker, P. O. and Lotz, L. 2007. Effect of stale seedbed preparation and subsequent weed control in lettuce on weeds. Weed Research. 47: 149- 156.
Ryan, M. R., Smith, R. G. and Mortensen, D. A. 2009. Weed: crop competition relationships differ between organic and conventional cropping systems. Weed Research. 49: 572-580.
Saini,JP. 2000. Efficacy of atrazine as post emergence herbicide for weed control in maize (Zea maysL.) under rain fed conditions. Indian Journal of Agriculture Sciences, 70: 801-803.
Salarzai, A., U. Maqsood, A. Wajid, N. Shawani and M. Ahmad. 1999. Effect of different herbicides on weed population and yield of wheat {Triticum aestivum). Pak. J. Biol. Sci. 2(2): 350-351.
Shah, MH and PK Koul. 1990. Fertilizer and herbicide compatibility to control weeds in maize under moisture stress conditions. Annual Agriculture Research, 11 : 21-29.
Shakoor, A, M Nadeem and CO Ahmed. 19 86. Efficiency of different herbicides for control of weed in maize under rain-fed conditions. Pakistan Journal of Agricultural Research, 7: 264-268.
Sharma, V, DR Thakur and JJ Sharma. 1998. Effect of metolachlor and its combination with atrazine on weed control in maize (Zea mays L.). Indian Journal of Agronomy, 43: 677- 680.
Singh. R. 2014. Weed management in major kharif and rabi crops. National Training on Advances in Weed Management, pp. 31 -40.
250

Oromia Agricultural Research Institute (IQQO), Crop research Proceeding 2017
Singh, S.P. and Kumar, R.M. 1999. Efficacy of single and sequential application of herbicides on weed control in transplanted rice. Indain J. Weed Sci. 13(3-4): 222-224.
Singh SP and Pillai KG (1993). Weed control in direct seeded rice under puddle conditions.IndianJ. PI. Protec 21: 224-227.
Srinivasarao, M., Haider, A. and Pramanick, M. 2014. Efficacy of glyphosate 71% sg (ammonium salt) on weed management in tea. The Ecoscane. 6: 91 -95.
Stroud, A. 1989. Weed Management in Ethiopia: an extension and training manual. FAO, Rome, Italy.
Thakur, DR. 1994. Weed management in intercropping systems based on maize under rain fed mid Hill condition. Indian Journal of Agronomy, 39 : 203-213.
Turk, M. A.; A. M. Tawaha; N. Samarah and N. Allataifeh (2003). The response of awn less six row barley (Hordeum vulgare L.) to nitrogen fertilizer application and weed control methods in the absence of moisture stress. Pak. J. Agron., 2:101-108.
Verma, S. K. and Singh, S. B. 2008. Enhancing of wheat production through appropriateagronomic management. Indian Farming. 58(5): 15-18.
Survey and Identification of Major Highland and Lowland Pulse Crops Diseases in Bale, Ethiopia
'"Ermias Teshoine, 2Addisu Tegegn and 'Dagne Kora 'Sinana Agricultural Research Center, P.O.Box 208, Bale-Robe, Ethiopia.
2Oromia Agricultural Research Inistitute, P.O.Box 81265, Finfine, Ethiopia ‘Corresponding author: ermiastafa@gmai 1 .com
AbstractEthiopia is one of the major producer countries of the major food legumes (Faba bean, Field pea. Lentil, Common bean and Chick pea). The nutritive value, the highest social value and an immediate cash source value of pulse crops made it very popular crops in the country. The surveys were conducted in different survey routes of highlands, mid-altitudes and low-land districts of Bale Zone for two years in 2015/16 EC and 2016/17 EC during Bona' and 'Gena' cropping seasons. Pulse crops farms were assessed within 5-10 km in the survey routes of the districts Sinana, Goba. Dinsho, Agarfa. Gassera. Goro, Ginir, Gololcha, Sewena & Delo-mena. The disease incidence and severity were rated based on 1-9 scoring scale and disease prevalence was calculated according to the procedure. During the 2015/16 and 2016/17 GC surveys a total o f285 pulse crops fields were visited out of which 250farms were during the main "Bona ” season. With 55% of total assessed farms Faba bean wav the most predominant crop during the survey time. Among the sites visited, Ginir and Agarfa were the most visited sites covering 23% and 22% of the districts considered, respectively. The diseases intensity (Incidence, Severity and Prevalence) was assessed based on the standard method for the crops. Rust (Uromyces fabaey was the foremost important Faba bean disease during the survey period. Whereas, Ascochyta blight (Ascochyta fabae) and Chocolate spot fBotrytis fabae,/ were recorded as the second and the third important Faba bean diseases. Rust, Ascochyta blight and Chocolate spot diseases with incidence values 99.13 %, 92.56% and 93.57% and severity of 3.99, 3.87 and 2.96, respectively was the most important diseases. Whereas, prevalence of Rust, Ascochyta blight and Chocolate spot diseases were found to be 98.57%, 100%, and 93.81%, respectively which shows the dispersion of the diseases over location. On the other hand. Black root rot (Fusarium solani) is becoming the newly emerging important Faba bean disease in recent years. During this survey, black root rot incidence as high as 100% was recorded in Sinana district. Viral diseases were also recorded in most of the districts as another emerging faba bean disease with as high as up to about 22% incidence. In case of chick pea, Ascochyta blight was the most important disease however root rot as high as up to 31% incidence was recorded as emerging important disease.
Key words: Survey, diseases, incidence, severity and prevalence251

Oromia Agricultural Research Institute (IQQO), Crop research Proceeding 2017
IntroductionEthiopia is one of the major producer countries of food legumes such as Faba bean, Field pea, Lentil and Chick pea and Bale is among the major producing zones of these pulse crops in Ethiopia. However, the total area coverage of these crops and the average productivity is extremely low less than 0.8 t/ha. Among a number of factors for low productivity, diseases are the most important constraints. A survey conducted before JO years to identify the major diseases of pulse in the highlands of Bale indicated several pathogens affecting these crops. Powdery mildew caused by Erysiphae Polygoni, Downy mildew caused by Peronospora pisi, Ascochyta disease complex caused by Microspherella pinocles. Ascochyta pisi, and Phoma medicaginis var. pinodella are the most important diseases of Field pea in Bale highlands (SARC, 2003). Diseases like chocolate spot, Ascochyta blight and rust are among the production constraints of faba bean. According to the research results from Holeta and Debre Zeyit ARC, chocolate spot and rust caused, yield loss of 34.1% and 14-21% respectively (Asfaw, et al.. 1994). Rust caused by Uromyces fabae pers de bery is the most economically important disease in the highlands of Bale.The disease can cause a complete crop failure even though yield loss on plot basis varies form 30- 60%. Another experiment also has confirmed that it can cause heavy losses when it occurs before flowering/podding stage and susceptible varieties can be killed under sever epidemics (Geletu and Yadeta, 1993). Although, survey of crops diseases has to be conducted at least every 5 years, survey of pulse crops diseases has been conducted 10 years ago. Recently there are some reports and also observations of some diseases occurrence in Bale area. Therefore, this activity is proposed to check the status of pulse crops diseases.Materials and MethodsThe surveys were conducted in different survey routes of highlands, mid-altitudes and low-land districts of Bale Zone in 2015/16 EC and 2016/17 EC during Bona’ and ‘Gena’ cropping seasons. A representative pulse crops farms available within every five to ten (5-10) km in the survey routes of both the highland and mid-altitude Woredas (Sinana, Goba, Dinsho, Agarfa, Gassera, Goro, Ginir, Gololcha, Sewena & Delo-mena) (Figure 1). The farms were visited by walking diagonally across the field and samples were collected where necessary. The disease severity and Incidence was rated based on the diseases scoring standard scale 1-9 scoring scales (Bernier et al., 1993). Most of the diseases were identified in the field and some diseases samples were identified in the
Figure 1: A map showing districts covered during the survey in 2015/16 GC and 2016/17 GC252

Oromia Agricultural Research Institute (IQQO), Crop research Proceeding 2017
ResultsSurveys of highland and lowland pulse crops diseases were conducted during the main cropping season ‘Bona’ and the second season “ Gena” of 2015/16 and 2016/17 GC in the highland, midaltitude and lowland districts of Bale zone. The survey districts were highlands (Agarfa, Dinsho, Gassera, Goba and Sinana), mid-altitude (Gololcha and Ginir) and lowlands (Goro, Delo-mena and Sewena). In all the districts as much as possible the representative farms were visited and as much as necessary specimens were collected. Most of the diseases were identified on spot (on the field) and some were identified in SARC plant pathology laboratory.
Number of Pulse Crops Farms Concidered During the Survey
■ 2015/16 ■ 2016/17
78
Faba bean Field pea Lentil Chick pea Haricot bean
Figure 2: Pulse crops farms frequency during the 2015/16 and 2016/17 GC pulse crops diseases survey in ‘Bona’ Season
During the survey, a total of 285 pulse crops fields were visited in all over the districts out of which 250 farms were during ‘Bona’ and 35 farms were assessed during ‘Gena' season. Diseases of 5 pulse crops (Faba bean. Lentil, Field pea. Chick pea and Haricot bean) were assessed (Figure 2, Figure 3, Table I and Table 2).Among the pulse crops farms visited, Faba bean was the most predominant pulse crop recorded (137 farms) which accounts for about 55% the total assessed farms and common bean (4 farms) is the least recorded pulse crop in all the survey districts which accounts for 1.7% of the total surveyed farms during the main 'Bona’ cropping season (Figure 2 and Table 1).
20
15
10
5
0 □Faba bean
'Gena' Season2016/17
Field pea Lentil
Figure 3: Puise crops farms frequency during the 2016/17 GC pulse crops diseases survey in ‘Gena’ Season
253
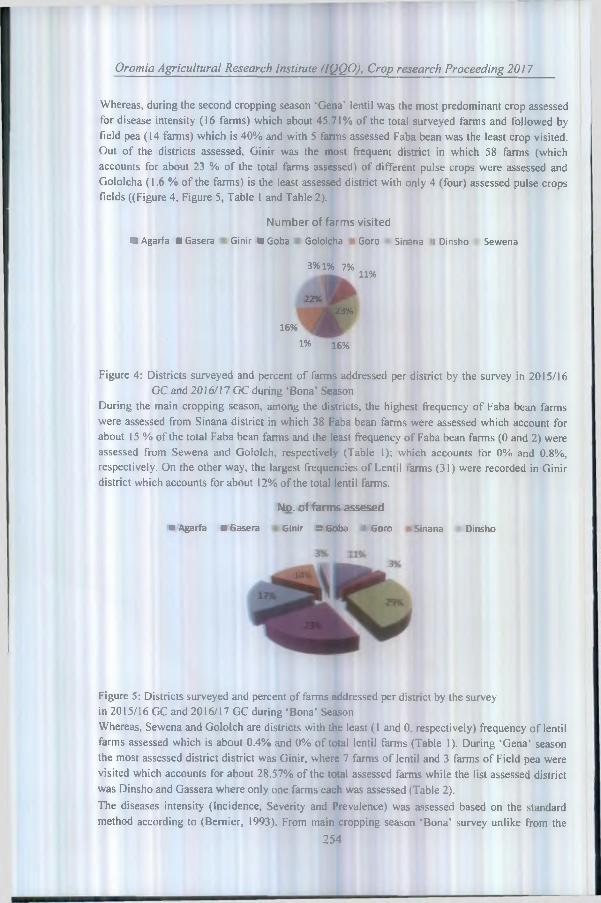
Oromia Agricultural Research Institute (IQQO), Crop research Proceeding 2017
Whereas, during the second cropping season 'Gena' lentil was the most predominant crop assessed for disease intensity (16 farms) which about 45.71% of the total surveyed farms and followed by field pea (14 farms) which is 40% and with 5 farms assessed Faba bean was the least crop visited. Out of the districts assessed, Ginir was the most frequent district in which 58 farms (which accounts for about 23 % of the total farms assessed) of different pulse crops were assessed and Gololcha (1.6 % of the farms) is the least assessed district with only 4 (four) assessed pulse crops fields ((Figure 4, Figure 5, Table 1 and Table 2).
Number of farms visited■ Agarfa ■ Gasera Ginir ■ Goba Gololcha Goro Sinana i Dinsho Sewena
3%1% 7%11%
22%I f16%
1% 16%
Figure 4: Districts surveyed and percent of farms addressed per district by the survey in 2015/16 GC and 2016/17 GC during ‘Bona’ Season
During the main cropping season, among the districts, the highest frequency of Faba bean farms were assessed from Sinana district in which 38 Faba bean farms were assessed which account for about 15 % of the total Faba bean farms and the least frequency of Faba bean farms (0 and 2) were assessed from Sewena and Gololch, respectively (Table 1); which accounts for 0% and 0.8%, respectively. On the other way, the largest frequencies of Lentil :arms (31) were recorded in Ginir district which accounts for about 12% of the total lentil farms.
No. of farms assesed■ Agarfa ■ Gasera Ginir ■ Goba i Goro ! Sinana Dinsho
Figure 5: Districts surveyed and percent of farms addressed per district by the survey in 2015/16 GC and 2016/17 GC during ‘Bona’ SeasonWhereas, Sewena and Gololch are districts with die least (1 and 0. respectively) frequency of lentil farms assessed which is about 0.4% and 0% of total lentil farms (Table 1). During ‘Gena’ season the most assessed district district was Ginir, where 7 farms of lentil and 3 farms of Field pea were visited which accounts for about 28.57% of the total assessed farms while the list assessed district was Dinsho and Gassera where only one farms each was assessed (Table 2).The diseases intensity (Incidence, Severity and Prevalence) was assessed based on the standard method according to (Bernier, 1993). From main cropping season ‘Bona’ survey unlike from the
254

Oromia Agricultural Research Institute (IQQO), Crop research Proceeding 2017
previous’ information we have; from the current survey result it was recorded that Rust (Uromyces fabae) was found to be the foremost important Faba bean disease during 'Bona’ season with high incidence and severity value of the disease (Table 3). Whereas, Ascochyta blight (Ascochyta fabae) and Chocolate spot [Botrytis fabae) were recorded as the second and the third important Faba bean diseases (Table 3).Although from previous information Chocolate spot was the foremost important disease of Faba bean, the current survey resulted that Rust and Ascochyta blight diseases come to be the most important diseases of Faba bean however this diseases appear at the stage that does not damage the crop as chocolate spot. This might be due to the reason that the survey was conducted late in the season at the time when chocolate spot was hidden by maturity and natural wilting.Table 1: Frequency of Pulse Crops Farms per district and Districts covered by the survey during2015/16 G.C and 2016/17 GC survey in ‘Bona’ seasonDistricts Faba bean Field pea Lentil Chick pea Haricot bean TotalAgarfa 12 1 1 2 0 16Dinsho 11 0 0 0 0 11Gassera 20 6 1 0 0 27Sinana 38 7 8 1 0 54Goba 33 5 1 0 0 39Goro 11 2 19 7 1 40Ginir 10 12 31 3 2 58
Sewena 0 0 1 0 1 2Gololcha 2 I 0 0 0 3
Total 137 34 62 13 4 250
Table 2: Frequency of Pulse Crops Farms per district and Districts covered by the survey during the 2016/17 GC survey in ‘Gena’ seasonDistricts Faba bean Field pea Lentil Chick pea Haricot bean TotalAgarfa - 3 1 - - 4Dinsho 1 - - - - 1Gassera - I - - - 1Sinana 1 2 2 - - 5Goba 1 4 3 - - 8Goro 2 1 3 - - 6Ginir - 3 7 - - 10Total 5 14 16 - - 35
On the other hand, Black root rot (Fusarium solani) is becoming the newly emerging important Faba bean disease in recent years. During this survey, black root rot incidence as high as 100% was recorded in Sinana district (Hisu). Viral diseases were also recorded in most of the districts as another emerging faba bean disease with as high as up to about 22% incidence. In case of chick pea, Ascochyta blight was the most important disease however root rot as high as up to 31% incidence was recorded as emerging important disease. Similarly other diseases of pulse crops were assessed and summarized in Table 3 below. During 2016/17 GC ‘Gena’ season survey. Rust was found to be the foremost important disease of Faba bean with high incidence (100%) and Severity (3.3) values.
255

Oromia Agricultural Research Institute (IQQO), Crop research Proceeding 2017
Table 3: Percent Diseases Incidence, Severity and Prevalence of pulse crops diseases in 2015/16 GC and 2017/18 GC during ‘Bona’ Season SurveyDiseases Faba bean Field pea Lentil Chick pea Common bean
Inc. Sev. Pre Inc. Sev. Pre Inc. Sev Pre Inc. Sev Pre Inc. Sev Pre
Chocolat e spot
93.57
2.96 93.81
- * - - - - - - - - -
Rust 99.13
3.99 98.57
■ - - 28.33
1.00
20.42
- - - 95,00
4.2 100 5
Ascochyt a blight
92.56
3.87 100.00
98.22
4.03 100.00
50.60
1.08
41.10
44.25
1.75
75.00
Black Root rot
11.93
- 63.49
- - - - - - - - - - -
Pow M. D
100.00
3.00 20.00
78.17
4.00 58.06
25.75
2.09
12.41
- - - - •
Downymildew
- - - 97.00
3.85 38.43
Root rot - • ■ - - - 5.00
■ 36.25
31.07
- 57.92
- '
Stemp.le af blight
38.13
1.75 22.38
- - - - - - - - - - ~
Anthracnose
28.75
1.0 50 0
Leafblight
50.00
1.6 50 7
Virus 1 21.98
- 18.28
- - - r * - - - - - '
Virus 2 1.50 - 6.25
* - - f- - - - - - - -I h e crops has not the sp ec ified disease
And the second important disease was Ascochyta blight disease with incidence (100%) and severity (3) values where chocolate spot had incidence (20%) and severity (2) values far below the above two diseases (Table 4). Similarly, important diseases of pulse crops during ‘Gena’ season are summarized in Table 4 below.
Table 4: Percent Diseases Incidence, Severity and Prevalence of pulse crops diseases in 2016/17 GCduring ‘Gena’ Season SurveyDiseases Faba bean Field pea Lentil
Inc. Sev. Pre. Inc. Sev. Pre. Inc. Sev. Pre.Chocolate spot 100.0 2.0 20.0 - - - - - -
Rust 100.0 3.3 60.0 - - - 50.0 4.0 3.13Ascochyta blight 100.0 3.0 100.0 100.00 3.29 100.00 100.0 1.8 37.50Black Root rot 15.0 15.0 6.0 - - - 5.0 5.0 0.31Powdery mildew - - - 83.16 3.50 47.50 100.0 2.0 6.25Downy mildew - - 100.00 4.00 7.J4 - - -
Summary and ConclusionEthiopia is one of the major producer countries of food legumes such as Faba bean, Field pea, Lentil and Chick pea. Similarly, Bale is among the major producing zones of these pulse crops in Ethiopia. However, pulse crops are threatening by a number of biotic and abaiotic constraints. Among which, diseases are the most important constraint. Survey conducted before 10 years to identify the major diseases of pulse in the highlands of Bale indicated several pathogens affecting these crops. Powdery mildew caused by Erysiphae Polygoni, Downy mildew caused by Peronospora pisi, Ascochyta disease complex caused by Microspherella pinodes, Ascochyta pisi,
256

Oromia Agricultural Research Institute (IQQO), Crop research Proceeding 2017
and Phoma medicaginis var. pinodella are the most important diseases of Field pea in Bale highlands (SARC, 2003). To identify the status of pulse crops diseases in the highlands of Bale, a survey was conducted during 2015/16 and 2016/17 GC in both main season ‘Bona’ and short season 4Gean\ The survey was covered all districts of the zone where pulse crops are grown and as much as possible farms were assessed. From the result of the current survey we have observed that there are a number of dynamisms in the pulse crops disease. Chocolate spot has been the foremost important disease of Faba bean for a long years in the southeastern part of the country and everywhere Faba bean is grown. However, at this time the trend is on the way to change where Rust and Ascochyta blight were found the most important diseases of the crop during this survey. On the other way, some viral diseases and black root rot of faba bean is becoming an emerging disease of the crop in most areas where the crop is under production.ReferencesAsfaw Telaye. Geletu Bejiga and Alem Berhe, 1994. Role of Cool-Season Food Legumes and their
Production Constraints in Ethiopian Agriculture. Pp 3-16. In: Asfaw Telaye, Geletu Bejiga, Mohan C.
Saxena and Mohamoud B. Solh, (eds.), 1994. Cool season Food Legumes of Ethiopia. Proceeding of the first National-Cool Season Food Legumes Review Conference, 16-20 December 1993, Addis Ababa, Ethiopia. ICARDA/lnstitute of Agricultural Research. 1CARDA: Aleppo, Syria. Vii + 440 pp.
Bernier, C.C., S.B. Hanounik, M.M. Hussein and H.A. Mohamed, 1993. Field manual of common faba bean diseases in the Nile Valley. International Center for Agricultural Research in the Dry Areas (ICARDA) Information Bulletin No. 3.
Geletu Bejiga and Yadeta Anbassa. 1993. Genetics and Breeding Research in Ethiopia. P. 180. In: Asfaw Telaye, Geletu Bejiga, Mohan C. Saxena and Mohamoud B. Solh, (eds.), 1994. Cool season Food Legumes of Ethiopia. Proceeding of the first National-Cool Season Food Legumes Review Conference, 16-20 December 1993, Addis Ababa, Ethiopia. ICARDA/lnstitute of Agricultural Research. ICARDA: Aleppo, Syria. Vii + 440 pp.
Sinana Agricultural Research Center Progress Report 2003. Sinana, Bale-Robe, Ethiopia
257

Oromia Agricultural Research Institute (IQQO), Crop research Proceeding 2017
Evaluation and Demonstration of Different Post-emergence Herbicides for Controlling Wild oat (Avena fatua L.) and Other Grass Weeds in Wheat (Triticum spp) at Bore, Ethiopia
Yared Tesfaye1, Kebna Assefa', Girma Teshome' and Obsa Cimdesa1 BoreAgriculturalResearchCentre, P.O.Box21 ,Guji-Bore,Ethiopia
AbstractIn the high lands of Ethiopia, weed causes considerable yield losses on wheat production due to absence of better management options for the producers. This also true, in the highlands of Guji Zone. Southern Oromia. Field experiment w as conducted to study the effect of different postemergence herbicides to control wild oat and other grass weeds in wheat (Triticum aestivum L.) at Bore Agricultural Research Center on station and Ana Sora district on farm during 2015/16 cropping season to identify the most effective herbicide for the control of the targeted weeds thereby improving wheat production of the area. The experiment was laid out in randomized complete block design using three replications. Pallas 450D. Current 8EC, Ralon super 144. hand weeding at tillering and weedy check were used as treatments. The combined analyzed data showed that significant variation among treatments for a ll parameters tested. Among herbicides. Pallas 450D showed better control o f wild oat and other grass weeds. In other cases, hand weeding and hoeing at tillering resulted in lowest weed density. Highest grain yield (4210.7 kg ha' ') was recorded in Pallas 450D followed by Current SEC (4000.3 kg ha ). Partial budget analysis revealed that .applying Pallas 450D had the highest net field benefit (30591.9 ET birr) followed by Current 8EC(29512.3ET birr ha ' compared to Ralon Super 144(26265.1ET birr ha1), Three times hand weeding ( 22911.6 ET birr ha ’) and weedy check (22919.4ET birr ha '/.However. Current 8EC had showed maximum economic profitability than Pallas 450D and other types with marginal rate of return(MRR) of 6494.4%. Therefore. Current 8EC at rate of litre h a ' is the best herbicide fo r the effective control o f wild oat and other grass weeds in wheat under proper cultural practices and there by improve yield production of wheat up to 25.1% at high lands of Guji Zone, Southern Oromia.Key words: Herbicide, Weed, Economic profitability or MRR (% )
IntroductionWheat (Triticum aestivum L.) is the most important cereal crop cultivated worldwide and there by sustaining the livelihood of the world hungrier. Wheat serves as staple food for more than 40% of the world population (Peng et al., 2011). Of the total cereal crop in Ethiopia, wheat ranked fourth next to sorghum both in terms of area (1.66 million hectare) and production (42.19 million qt) (CSA, 2016). The national average yield of the crop is about 2.5 t ha 1 (CSA, 2016). This is by far below the global average which is about 3.5 t ha'1. Multifaceted biotic and biotic factor are responsible for this low yield, cultivation of unimproved low yield varieties, insufficient and erratic rainfall, poor agronomic practices, disease and insect pests are among the most important constraints to wheat production in Ethiopia (Hailu,199l; Dereje and Yaynu, 2000).Weeds are one of the major factors reducing crop yield, deteriorate quality of crops and reduce farmers’ income. Weed infestation is a very serious and less attended issue in the country. It has been estimated that delaying in weed causes up 35 % yield loses in wheat annually (Kebede Desta, 2000). They compete with crop plants for light, nutrient, moisture and space which they could be either of broad leaf or grasses (Amon 1972). The major weeds compete with wheat are: Wild oat (avena fatua), Phalaris minor, Cirsium arvense. Convolvulus arvensis. Ammi visnaga, Chenopodium album, Carthamus oxycantha andEuphorbia helioscopiais are grassy weeds which have now became a threat to the nutritional requirement of mankind.Wild oat (Avena fatua) has increased tremendously in rain fed areas in the country. It is an annual grass and difficult to eradicate because the seeds shatter before crop maturation and many of the seeds are plowed into the soil where they lie dormant for one to many years and germinated when they are turned up near the surface (Amon 1972).
258

Oromia Agricultural Research Institute (IQQO), Crop research Proceeding 2017
Weed control is a major component in the production system of wheat whether it may manually, mechanically or physically. The use of herbicide is considered to be the most viable option for controlling weeds in wheat production. However, the existence of many grass weeds, specially, wild oat (avena fatua) create obstacle to increase production and productivity of wheat.Despite of development of high yielder, insect pest resistance varieties and other agronomic packages production of wheat in Southern Oromia is challenged with several grass weed infestation. They are more problematic in wheat production than broadleaf species because of the selective nature of available herbicides and the difficulties of distinguishing between species while hand weeding. Hence many weed management practices such as, two times hand weeding, Mecoprop, 2,4-D, Brittox and the ready tank mixture of Mecoprop and 2,4-D, all at respective manufacturer recommendation rates can be a best management option in wheat production, control only broad leaves species while grass weeds, especially, wild oat (Avena fatua) compete with cropand causes significant yield losses in southern Oromia farming community.Therefore, the present study was conducted to address the following objectives:
o To evaluate the efficacy of different herbicides on wild oat and other grass weedso To identify and recommend economically visible herbicides for wheat production to the study
areaMaterials and MethodsDescription of the study area: The experiment w'as conducted at Bore Agricultural Research center on station and Ana Sora district on farm during 2015 and 2016 the main cropping season. Bore is located at about 387 km from the capital, Fifine to South while Ana Sora is about 25 km from Bore which is 402 km from Finfine to similar direction. Both locations represented high land agro-ecologies of Guji Zone having an altitude range of 2200-2780 M.a.s.l. Both locations receive an annual rain fall of 1200-1750 mm per annum. Maize, barley and wheat are majorly produced cereal crops in the area. For this experiment, two types of weed management practices (cultural and chemical) involving five treatments were used. Pallas 450D, Current 8EC, Ralon super!44, hand weeding at tillering and weedy check were the utilized treatments. Improved bread wheat variety (Senate) was used as seed source. Twenty liter capacity manual knapsack sprayer was used for applying the herbicide. Quadrant having a size of 2.5nr was used to score weed population.Experimental design and treatment applicationThe trial was arranged in Randomized Complete Block Design (RCBD) with three replications on 5 m x 5 m plot size. 1 m and 1.5 m were used between the plots and the blocks respectively. All inputs and agronomic practices were applied as per of its recommendation for wheat production. All herbicides were emulsified in water at recommended rate and applied once time at 30 days or (between 2-4 crop leaves stage) after sowing using manual knapsack sprayer and weed infestation was assessed and scored by number and species by throwing quadrate with 50 cm x 50 cm area three times per plot.Data collection and analysis: Data was collected on various parameters including tillers per plant, plant height, number of grains per spike, thousand kernel weights, grain yield and straw yield. Four harvestable rows were used for yield and other agronomic data source. Adjusted data was subjected to analysis of variance (ANOVA) as suggested by Gomez and Gomez (1984) using SAS soft ware (version 2009). Least significant difference at 5% probability level was used to test the mean separation.Harvest index (% ) was calculated by the following formula;
Grain yieldH I = ------------- -------------* 100Total above ground dry biomass
259

Oromia Agricultural Research Institute (IQQO), Crop research Proceeding 2017
Economic data were collected to compare the economic advantage of each herbicide in different treatments. These included variable input costs and costs for the herbicides and labour during the execution of the experiment. Costs of herbicides were obtained from pesticide companies and local distributing agencies. Based on the data obtained from both locations, economic analysis was computed using partial budget analyses and Marginal Rate of Return (MRR) (CIMM1T, 1988). The following formulas were used to compute partial budget and marginal rate of return (MRR) analysis, respectively.
Net field benefits (NBs) = Gross field benefits (GB) - Total Variable costs (TVC) MRR = DN1/DIC
Where: MRR = the marginal rate of return;DNI = difference in net income compared with control; and
DIC = difference in input cost compared with control.Results and DiscussionAnalysis of variance: Combined analyzed data of two locations revealed that, all the utilized treatments showed statistically significant variations (P<0.05) for all the parameters tested except spike length that showed highly significant variation (P<0.01). Similarly, highly significant effect of the herbicides was observed across the locations (Table 1).Table!. Mean squares of different parameters of bread wheat as affected by herbicide andlocation at Bore and Ana-Sora during 2016/17 cropping seasonSource of variation DF NT NFT PH(cm) PL(cm) SL(cm) B1M TKW(g) GY/P
Herbicide 4 2.82* 2.8* 72.27* 0.68’ 259.22“ 45.97* 386.67 * 1322.33*Replication 2 O.K"5 0.28“ 36.44“ 0.006 2.53re 5.02 120 "* 266.57 “Location 1 121.97*’ 158.33** 2815.14** 12.58” 288.3** 630.73** 653.33* 8672.56**Error 10 0.88 0.77 11.69 0.36 28.42 16.07 120 336.39
* **, Significant at p<0.05. P<0.01, LSD= Least significance difference (P<0.0S), NT- Number of tillers. NFT= Number of fertile tiller. PH= Plant height (cm), PL~Peduncle length (cm). SL= Spike length (cm), GPS- Grain /spike, TKW~ Thousand kernel weigh1, GY/ha-Grain yield per hectare (Kg)Plant height: Highly significant variation was observed across location among herbicides treatment plants for plant height (Table 2). Similar result was also reported by Zahara Mohammed and Shugute Addisu, 2016 who also found highly significant variation among different herbicides for plant height over the locations tested. However, non-significant variation among the tested herbicides was reported by Sareta et al.. 2016. Analysis of the data indicated significantly heights (97.22 cm) plant height observed from plot treated with Pallas 45 OD followed by Current 8EC (92.99 cm) and Ralon Super 92.78 cm. Whereas, significantly lowest plant height was depicted by hand weeding (89.51cm) followed by weedy check (88.36 cm).Peduncle length: Analysis of variance showed highly significant differences peduncle length was observed due to herbicide (Table 2). Means for peduncle length of the treatments was ranged from 6.70 to 7.59 cm with the mean value of 7.12 cm (Table 2). Among the treatments, the maximum peduncle length (7.59 cm) was recorded from Pallas 450D followed by Current 8EC (7.31cm) and Ralon Super 144 (7.02 cm); while the minimum peduncle length (6.70 cm) was recorded by weedy check (6.15 cm) followed by hand weeding (6.99 cm).
Spike length: Height of spike is an important part of plant growth parameter for cereal crops that could determines the grain holding capacity of a particular variety. Thus, in current study significant effect was observed on spike length due to weed management and locations. According
260

Oromia Agricultural Research Institute (IQQO), Crop research Proceeding 2017
to analysis of the data, maximum spike length was obtained from plots treated with Pallas 4500 (52 cm) followed by Current 8 EC (51.83 cm). But, short spike length was scored from un-treatedplots or weedy check (39 cm) followed by hand weeding (39.83cm).
Table 2.Mean effect of different w'eed management practices on different parameters of Breadwheat at Bore and Ana Sora during 2015/16 cropping seasonT reatinents NT NFT PH PL SL GPS TKW GYLD HI (%)Pallas 450D 5.75n 5.42a 97.22“ 7.59a 52.003 31.573 53.33a 4210.73 35.98aCurrent 8EC 5.54a 5.33a 92.99h 7.3 lab 51.833 29.2 lab 46.67ab 4000.33 35.01aRalon Super 144 5.0ab 4.67ab 92.78b 7.02ab 4l.l7b 26.74b 40.0bc 3569.3“b 33.83aHand weeding 4.9ab 4.611"1 89.511* 6.99ab 39.83h 26.19b 36.67bc 3544.0ab 33.62aWeedy check 3.99b 3.72b 88.36c 6.70b 39.0b 24.50b 33.33c 2996.0b 28.39bMean 5.04 4.75 92.17 7.12 44.77 27.64 42.00 3664.07 33.37CV (%) 18.63 18.51 3.71 8.42 11.92 14.50 26.08 15.83 10.53
LSD= least significant difference. CV=coefficient of variation. NT- Number of tillers. NFT= Number of fertile tiller, PH= Plant height (cm), PL-Peduncle length (cm), SL- Spike length (cm). GPS= Grain /spike, TKW=Thousand kernel weight. H I (% ) = harvest index. GY/ha-Grain yield per hectare (Kg)
Yield and yield components: According to the result of the analysed data, all the treatments had showed significant (P<0.05) effect on number of tillers at both locations. Number of tillers per plant was scored in a range of 3.99 to 5.75 with the mean value of 5.04. Maximum number of tillers per plant was scored from plots treated with Pallas 450D (5.75) followed by current 8 EC (5.54) and Ralon Super 144(5). However, minimum number of tillers per plant was scored from weedy check (3.99). Similar research report was reported by Sareta et al.. 2016, where he found significant effect of different herbicides on number of tillers.Grain per spike was significant affected by herbicides treatments (P<0.05). The highest grain per spike was recorded from Pallas 450D (3 1.57) treated plot. The lowest grain per spike was recorded from un-treated plot (24.5) followed by plot treated by hand weeding (26.19) and Ralon super (26.74) (Table 2).As it is revealed by the study result, applying recommended rate of Pallas 450D at effective stage of weed emergence would significantly affect weed population and improve number of wheat grain development through proper utilization of available nutrients without any competitionThousand kernel weight: The combined analysis over locations was showed significant variation of thousand kernel weight comparing herbicide and weedy check. However, there was no significant variation between herbicides. The mean value of thousand kernel weight (TKW ) due to herbicide application was ranged from 33.33 to 53.33(Table 2).The maximum TKW was obtained from the plot treated by Pallas 450D (53.33) followed by Current 8EC(46.67).The lowest number of TKW was obtained from un-weeded or weedy plots (33.33).Harvest index: Combined analysis of the study revealed that, statistically non-significant difference was observed on harvest index of bread wheat due to the application of different herbicides and hand weeding except weedy check. The mean value range of 28.39% to 35.98% of harvest index with mean value of 33.35% was obtained from the study. High harvest index was obtained from plot treated by Pallas 450D followed by the rest of herbicides and hand weeding. Lowest value of harvest index (28.39%) was obtained from un-treated plot.Grain yield: According to the combined analysis of this study, statistically significant variation of grain yield was observed among the herbicides with the range of 2996 kg ha’1 to 4210 kg ha'1 with mean value of 3664.07 kg ha'l(Table 2). The highest grain yield was recorded from Pallas 450D (4210 kg ha1) followed by current 8 EC (4000kg ha1). The lowest grain yield was recorded from
261

Oromia Agricultural Research Institute (IQQO), Crop research Proceeding 2017
weedy check treatment (2996kg ha ‘).This result is concord with the result of Sareta et al.. 2016 who found high grain yield per hectare from herbicide treatment and low yield from weedy check treatment.Weed control efficiencyEffect of different herbicides on weed control was observed (Table 3).The highest weed control efficacy (82.95%) was recorded from hand weeding followed by Pallas 45 OD (74.01 % ) during early stage of wheat growth, while the lowest (48%) control efficiency observed from weedy check and Ralon super EW 144. Similarly the highest weed control efficiency was observed from plot treated with Pallas 450D and hand weeding during head emergence and dough stage. Interestingly, as stage of crop development increase there was decrement in weed control efficiency and Pallas 45 OD application was better than all applied herbicides at both sites against both grassy and broadleaved weeds. These finding are in accordance with (Ashiq and Noor, 2007) who reported that herbicides with broad spectrum provided better weed control efficiency than control treatment. Table 3. Weed control efficacy of different herbicides at different growth stage of wheat at Bore and Ana-Sora during 2016/17 cropping season
Treatments Weed control efficiency (% )Early jointing
stageHead emergence
stageDough stage 1
Pallas 45 OD Current 8 EC Ralon super EW 144 Hand weeding Weedy check
74.048.148.083.0
66.842.036.0 67.9
47.5 25.927.5 46.3
Weed density: Major weed density in bread wheat was significantly (P<0.05%) affected by weed management options. Among the weed management options the minimum weeds density (2.61 m'2) was recorded in hand weeding followed by Pallas 45 OD (3.05 m'2) , Current 8 EC (4.03 m'2) and Ralon Super EW 144 while the maximum total weed density (6.53 m ) was in weedy check ( Table 4). These finding are in accordance with result of (Ashiq and Noor Ahmad, 2007) who stated that weed population is lower in herbicides treated plot than control plot.Table 4. Effect of different herbicides on weed density (rrT2) at different crop growth stages of bread wheat at Bore and Ana Sora during 2016/17 cropping season
Weed density (m'z) |Treatments Jointing stage Ear head emergence stage dough stagelPallas 450D Current 8EC Ralon super EW 14
Hand weeding Weedy check
0.63(15.83)1.20(30.00)1.19(29.65)0.21(5.25)1.83(45.74)
0.60(14.96)1.30(32.54)1.20(30.22)0.44(10.89)2.66(66.55)
0.77(19.20)1.76(43.95)2.03(50.83)0.74(18.42)3.62(90.48)1
Value in breaks are transformed
Weed species: As part of the study, identification of weed species which were observed in quadrant was also conducted. Because it is imperative to know the nature of the existing weeds species per unit area towards seeking effective management practice. Accordingly, about 11 weed species which have different families, life cycle and life category were identified from both trial
262

Oromia Agricultural Research Institute (IQQO), Crop research Proceeding 2017
sites. Out of these species 63.63% were categorized under grass weeds and 36.36 were broad leaved species. However, all of the identified weed species from both sites have annual life cycle (Table 4).Table 4. Major weed species identified from the experimental sites (Bore and Ana Sora) during 2016/17 growing season
Scientific name Family Life form categoryA vena fatua L. Poaceae Grasse weedsBromus pectinatus, (Pilg ) Poaceae Grass weedsSnowdenia Polystachya(Freser\.) Poaceae Grass weedsPhalaris paradoxa L. Poaceae Grass weedsGalinsonga parviflora Cav. Asteraceae Broad leavedBidens pilosaL Asteraceae Broad leavedChenopodium album L. Chenopodiaceae Broad leavedGuizot iascabra( V is)Ch i o v Asteraceae Broad leavedPolygonumnepalense L. Polygonaceae Broad leavedGalium Rubiaceae Broad leavedTagetes minuta L. Asteraceae Broad leaved
Partial budget analysisYield and economic data were collected to compare the economic advantage of each herbicide with control treatment. Accordingly, cost of each herbicides were estimated based on the season price which was 1100 ET birr for 0.5 litre Pallas 450D, 570 birr for 1 litre Current 8EC,and 520 birr for 0.51itre Ralon super 144. Labour cost for three times hand weeding was calculated as 35 birr/person/day*40*3 which was - 4200. The average grain price of wheat was 850 birr per 100 kg in 2016/17 season. Average daily labourer cost and rent for knapsack sprayer for herbicide application was 520 birr ha'1. To minimise un-necessary exaggerations of grain yield, productivity of the location mean grain yield obtained was adjusted by 10%. Labour costs for three times hand weeding were determined by man-days and it was 4200 ha'1 indicating that application of Pallas 450D had the highest net field benefits. But, the marginal rate of return (MRR) analysis revealed that Current 8EC was more profitable for farmers, and resulted in a MRR of 6494.4% (Table 5).Table 5: Partials budget analysis of different herbicides for control of weeds at Bore and Ana Sora, Southern Oromia
Treatments Rate of herbicide L ha'1
Net benefit in birr
Total variable cost in birr MRR (% )
Weedy check 0.00 22919.40 0.00 0.00Ralon Super 144 0.50 26265.10 1040.00 321.70Current 8EC 1.00 29512.30 1090 6494.40Pallas 450D 0.50 30591.90 1620 203.70Hand weeding (3x) 0.00 22911.60 4200 D
ConclusionsIn the present study different herbicides had showed significant effect on different characters of bread wheat variety as affected by weed management efficiency. Highest grain yield was obtained from plot treated with Pallas 45 OD (4201 kg ha'1) followed by current 8 EC (4000kg ha'1). Partial budge analysis indicated that applying Pallas 450D had the highest net field benefit (30591.9 ET birr) followed by Current 8EC (29512.3ET birr ha"1 ). However, Current 8EC had showed
263

Oromia Agricultural Research Institute (IQQO), Crop research Proceeding 2017
maximum economic profitability than Pallas 450D and other types with marginal rate of return (M RR) of 6494.4%.Therefore, Current 8 EC at rate of litre ha 1 is profitable herbicide for the effective control of wild oat and other grass weeds in wheat and there by improve yield production of wheat up to 25.1% under proper land management during the season market price of wheat and herbicide at high lands of Guji Zone, Southern Oromia.
ReferencesCIMMYT, 1988. From agronomic data to farmer recommendations: An Economics Workbook.
Mexico, D.F.: CIMMYT, ISBN 968-127-19 pp. 8-28 Gomez, K.A. and A.A. Gomez., 1984. Statistical Procedures for Agricultural Research, 2nd edit.
John Wiley and Sons, New York.Kebede Desta, 2000. In: Starkey P and Sirrralenga T (eds), Animal power for weed control. A
resource book of the Animal Traction Network for Eastern and Southern Africa (ATNESA), Technical Centre.
Peng J, Sun D, Nevo E (2011). Wild emmer wheat, Triticum dicoccoides, occupies a pivotal position in wheat domestication. AJCS 5:1127-1143
SAS Institute (2002). SAS enterprise guide, Version 9.0 SAS Inst., Cary, NC, USA.Zahara Mohammed, Shugute Addisu. Evaluation of Sequential Application of Herbicides for Broad
and Grass Weed Management in Durum Wheat, Ethiopia. American Journal of Environmental and Resource Economics. Vol. 1, No. 1, 2016, pp. 32-36. doi: JO. J J648/j.a
Evaluation of Fungicides against Bread Wheat Rusts at Guji Zone, Southern OromiaYared Tesfaye1, Girm Teshome', Obsa Cimdesa' and Kebna Asefa1
'BoreAgriculturalResearchCentre. P.O.Box21, Guji-Bore,Ethiopia AbstractWheat is one of the most important cereal crops in terms of the area coverage, volume of production and the number o f farmers engaged in its production. However, the production and productivity of wheat is affected by various biotic and abiotic stresses. Among the biotic stresses, the three rusts (yellow rust, stem rust and leaf rust) caused by Puccinia striiformis fisp. rritici, Puccinia graminis f.sp. tritici, and P.triticina respectively were the most destructivedi.seaseofwheat (TriticumaestivumL.). Field experiment was conducted to evaluate the efficacy of fungicides against wheat rusts at Guji zone on Bore on-station and Yirba on-farm in 2016 main cropping season. Four different fungicides including un-sprayed plot were used as a treatment. The experiment was laid out in RCBD with three replications at both locations. Theeffectsoffungicideon wheat rust and yieldof susceptible breadwheat (Kubsa) werestudiedinbothmajorwheatgrowing districts (Bore and Yirba) o f Guji Zone. Disease onset was vary from early to late, strip rust was start from tillering, leaf rust was observed at jointing and stem rust was occur late after head emergency atbothlocations. Fungicide spray treatments significantly reduced both yellow rust and stem rust diseases severity to the lowest level possible over the un-sprayed check. Further, there was statistically significant difference (p = 5%) between the test J'ungicides and un-sprayed check in reducing wheat rust (yellow rust, stem rust and leaf rust) severity. There is significant difference (p = 5%) in plant height, panicle length, total number of tiller, number o f fertile tiller, seed per spike, grain yield and thousand kernel weight between fungicide treatments and un-treated. The disease resulted in relative grain yield losses of up to 72.05% at Boreand 72.25% atYirbaonun- sprayedplots.Generally, commercial fungicides like Rex Duo and Tilt gave nearlycompleteprotection onthe susceptible bread wheatvarieties. However. Tilt had maximum economic profitability than Rex Duo with the marginal rate of return (MRR) o f6494.4%
Keywords:Puccinia striformis, Puccinia graminis f.sp. tritici, P.triticina,Triticum aestivum, and Fungicide.
264

Oromia Agricultural Research Institute (IQQO), Crop research Proceeding 2017
IntroductionBread wheat (Triticum aestivum L.) is one of the most widely grown and most consumed food crops all over the world. It is the most important crop among the cereals by area coverage and followed by maize (Zea mays L.), barley (Hordeum vulgare L.) and sorghum (Sorghum bicolor L.) in its economic importance (FAO, 2009). Annually, wheat is produced on 224.53 million hectares of land and 672.2 million metric tons of wheat is produced in the world (USDA, 2010). According to this report the world average wheat production is 2.99 tons /ha. Wheat ranks fourth in area production next to tef. maize and sorghum. About 4.6 million farmers produce 4.2 million tons of wheat across 1.6 million hectares of land with average productivity of 2.45 tons/ha (CSA, 2014). However, the production and productivity of wheat is curtailed by various biotic and abiotic factors. Among the biotic factors, wheat rust diseases are the most series and wheat production bottlenecks. Wheat rust (stripe rust, leaf rust, stem rust) caused by P.striformis, P.graminis f.sp tritici, P.triticina respectively are highly destructive disease of wheat (Triticum aestivum L.). Under favorable conditions, stem rust can cause yield losses of up to 100% in susceptiblevarieties (Roelfs, 1985; Leonardand Szabo, 2005). Whereas, yield loss of up to 71% was recorded in bread wheat due to yellow rust in Bale highlands (Bekele, 2003; Dereje, 2003). However, in severe cases 100% yield loss was recorded on the highly susceptible varieties due to yellow rust (CIMMYT, 2010). Through the widespread use of resistant varieties, however, stem and yellow rust are currently largely under control worldwide except in eastern Africa.Forreasonsthatdue to either introduction of exotic races or evolvement of new local races and changes in environmental factors (Wubishet and Chemeda. 2016).Trials were conducted during 2016 in different areas of Ethiopia showed that wheat rust has been increasing. The major strategy for the management of wheat rust in Ethiopia would remain focused on the development of resistant varieties and chemical options.To come up with this; several fungicides have been evaluated against rusts and are being used in wheat production. Hence, evaluation of new fungicides against wheat rust is important to sustain wheat production and productivity. Thus, the objective of this study is to evaluate the efficacy of fungicides against wheat rust diseases and evaluate and promote economic and agronomic feasibility of fungicide against wheat rust control at Guji highlands.MaterialsandmethodsField experiments were executed at Gujihighlands of Ethiopia under rain fed conditions during 2016and 2017main croppingseasons at Bore Research Center on station and Yirba farmer'sfield. Boie located at 06°24.000’N,038°35’.019 Eandat 2450 meters above sealevel (m.a.s.l).The rnonthl meanminimum and maximum temperatures are 9.3 and 20.9 °C, respectively. Yirba experimental site w’as located at 06o13.36’N,38°42.367’E and 2584 m.a.s.l.Both locations receive an annual rain fall of 1200-1750 mm per annum.The minimum and maximum temperatures of Yirba are 7.3 and 22.8°C, respectively. Both locations represent major wheat-growing and wheat rust prone areas.They are also characterized by bimodal rainfall, the short rainy season extending from March to July and the main season from July to December. Four types of fungicides (Tilt250 E.C., Rex Duo, Natura 250 EW, and BayletonWP25) and un-sprayed plots (check) a total of five treatments were used. Treated plots received sprays of every 20days in which the first spray was done at first appearance of yellow rust. Susceptible bread wheat variety ‘Kubsa’ was used from original seed source. Fungicides were manually sprayed with the help of twenty liters capacity knapsack sprayer. During fungicide sprays, plastic sheets were used to separate the plot being sprayed from the adjacent plots. The trial was arranged in randomized complete Block Design (RCBD) with three replications on 5 m x 5 m plot size. 1.5 m and 2 m were used between the plots and the blocks respectively. All inputs and agronomic practices were applied as per of its recommendation for wheat production.
265

Oromia Agricultural Research Institute (IQQO), Crop research Proceeding 2017
Data collection and analysisData was collected on various parameters including (leaf rust, yellow rust and stem rust) infestation. Severity was assessed and recorded using the modified Cobb’s scale (Peterson et al., 1948), by assessing 46 randomly pre-tagged plants. Agronomic parameters like plant height, spike length, tillers per plant (fertile tillers), plant height, number of grains per spike, thousand kernel weights and grain yield and other parameters were assessed. During disease assessment,the growth stage of the crop was recorded based on Zadokseta/.( 1974) to observe onset and progress of the disease in relation to wheat phenology.Disease assessmenti-severity of yellow, stem and leafrust was estimated as proportion of the leaf and head infectionof a plant affected by the disease. Disease assessment was made at weekly interval from the time of symptom appearance to physiological maturity of the crop. Severity was recorded using the modified Cobb’s scale (Petersonero/., 1948),by assessing 23 randomly pretagged plants.Crop yield and thousand-kernelweight:- grain yield was harvested from the middle rows and adjusted to 12.5% moisture content .The weight of thousand kernels was sampled at random from the total grains harvested from each experimental plot counted and measured at the same moisture level. The collected data was subjected to analysis of variance (ANOVA) as suggested by Gomez and Gomez (1984) using SAS soft ware (version 2009). Least significant difference at 5% probability level was used to test the mean separation.Relative yieldlossestimation:-The relative losses in yield and yield component of each treatment were determined as a percentage of that of the protected plots (treated) as compared to unprotected (un-treated) plots.RL (% ) = (Y 1-Y2) X 100
Y1Where, RL (% ) = percent of relative yield loss, Yl= mean of the respective parameter on protected plots (plots with maximum protection) and Y2= mean of the respective parameter in unprotected plots (i.e. unsprayed plots or spraye plots with varying level of disease).Result and DiscussionWheat rust epidemics, severity and reaction were significantly varied due to fungicide application (Table 1). The combined analysis over locations were significant (P<0.05) varied among the fungicides in levels of severity of yellow rust, with the exception of Rex Duo and Tilt. Lower levels of yellow rust severity were observed on Rex Duo (4.99) and Tilt (5.83). Highest yellow rust severities were recorded on un-sprayed plots (61.67). The disease resulted in relative grain yield losses of up to 71.06% average at both locations.Table 1.Combined analysis result of terminal wheat rust severity levels on bread wheat with different fungicide spray at Bore andYirba, Southern Oromia, 2016
Terminalwheatrustseverity(%)
Yellow rust Stem rust Leaf rustRex Duo 4.99“ 2.66* 0.00“
Tilt 250 EC 5.83s 4.50* 0.00aNatura 250 EW 11.67“b 8.99* 6.50cBayletone WP25 19.99b 11.66* 4.00b
Unsprayed 61,67c 29.16b 14.16dLSD (0.05%) 9.36 15.00 1.77
CV (% ) 16.19 47.41 12.96
266

Oromia Agricultural Research Institute (IQQO), Crop research Proceeding 2017
Effect on grain yield and yield component: Grain yield was significantly (P < 0.05) increased by fungicide applications (Table 2) at both locations. Further, Rex Dou provide significant yield increase over the other at both locations. Relative yield losses due to wheat rust reached 72.25 % and 71.86% on un-sprayed check at Bore and Yirba respectively. The thousand kernel weight (TKW ) was also significantly increased by fungicide application at both locations. The maximum TKT of 60 gram was recorded from both locations.Table2: Grainyieldandthousandkemelweightofbreadwheatand relative yield lossesdueto wheatrustunderdifferentfungicidesprayatBoreand Yirba in 2016.
Fungicides
LocationBore Yirba
Yield(kgha-1)
Loss(% )
TKW(g) Yield(kgha-1)
Loss(% )
TKW(g)
Rex Duo 3484“ 00.00 60.003 3880a 0.00 60.00aTilt250EC 3093b 11.20 60.00a 3286b 15.31 60.00*Natura250EW 2169c 37.70 53.00b 2423c 37.54 46.60bBa\ ietonWP25 2266c 34.94 53.00b 230 lc 40.69 46.60bUnsprayed 967d 72.25 24.00c 71.86 23.30°LSD (0.05%) 2.24 8.64 2.17 18.63CV (% ) 7.52 13.88 4.79 21.11There is significant difference in plant height between fungicide treatments and un-sprayed plot (Table 3). However, there is no significant difference among Rex Duo and Tilt 250EC. Even though there was no statistical variation of plant height among fungicides treated plots, relatively better plant height (70.72 cm) was obtained from Rex Duo. The shortest plant height (64.22 cm) was obtained from non-treated plots.Effects of fungicides on number of tillers were also significant. The highest (2.72) number of tillers was recorded from treated plots whereas the lowest number of tiller ( 1.44) was recorded from un sprayed checks. Effect of fungicide treatments on grains per spike was also significant. Significantly highest (47.50) number of grains per spike was recorded from plot treated with Rex Duo followed by Tilt250EC whereas the lowest ( 15.20) was recorded from un-sprayed check. This result is in accordance with the work of (Hailu and Fininsa, 2007) who found relationship between stripe rust (Puccinia striiformis) and grain quality of bread wheat (Triticumaestivuni) in the highlands of Bale, southeastern Ethiopia.Table 3: Combined effect of fungicide application on wheat hieght, panicle length and seed per spike as affected by three rust at Bore and Yirba of Guji high lands in 2016.Fungicides Plant hieght
(cm)Pancle length
(cm)Nunber of
effective tilleersSeed/spike
Rex Duo 70.72a 7.27a 2.72a 47.50aTilt250 E.C 70.33a 6.88a 2.72a 36.70bNatura250EW 66.27ab 6.88a 2.55a 27.83cBayleton WP25 66.52ab 6.72a 2.67a 25.50cControl 64.22b 6.05b 1.44b 15.20dLSD (0.05%) 4.78 0.57 0.43 3.40CV (% ) 5.91 7.10 15.10 9.32
Fungicide efficacy is based on proper application timing to achieve optimum effectiveness of the fungicide. Differences in efficacy among fungicide products were determined by direct comparisons among products in field tests and highly influenced by environment if we based on a single application of the company labeled rate (Kiersten Wise, 2016). All the current commercial wheat cultivars in East Africa are susceptible to the new wheat rust races and it is not possible to
267

Oromia Agricultural Research Institute (IQQO), Crop research Proceeding 2017
grow a profitable crop without the application of fungicides (Wanyera et al., 2009). Fungicide t in Ethiopia showed up tol334.30kg/ha higher yield advantage in the treated versus the un-trez plots (Wubishet and Tamene, 2016). Ordish and Dufour (1969) noted the popularity of spray fungicides to control crop diseases, returns of up to three times the cost involved often w realized from fungicide application.Partial Budget AnalysisPartial budget analysis was done to identify the rewarding treatments. Yield from experimei plots was adjusted downward by 10% for management difference for to reflect the differei between the experimental yield and the yield that farmers could expect from the same treatm (Getachew and Taye, 2005). Three years average market grain price of wheat (Ethiopian Birr13.5 per kg of wheat) at farm-gate and price of Rex Duo, Tilt, Natura and Bayletone was at 1 It ha ' spraying labor of 40 ETB per person day were used. Labor for wheat field management wa person- days per hectare. The result oft he partial budget analysis is given in (Table 4). The pan budget analysis revealed that the highest net benefit of (birr 27217.3 ha) was obtained from application of Rex Duo fungicide, where as the control treatment (nil application of fungicide) g£ the lowest net benefit (birr 5075.67 ha'1).Table 4: Partial budget analysis of fungicide application for wheat rust management at Guji hi lands, 2016 __________
Treatments
Yieldkg/ha
AdjustedYield(kg/ha)
Grossbenefit(Birr/ha)
Costs that vary (ETB /ha
Netbenefit(Birr/ha)
CTC CINB
M(°/i
Fungicide Labour
T.cost
Control J 029.5 926.55 8750.75 - 0 0 5075.67 0.0 00.0
BayJeron 2283.5 2055.15 19409.75 500 200 700 16768.35 7000 11692 1
Natura 2296.0 2066.40 19516.00 530 200 730 16834.40 30 66Tilt 250EC 3189.5 2870.55 27110.75 650 200 862 23537.25 132 6702 5Rex Duo 3682.0 33 f 3.80 31297.00 750 200 950 27217.30 88 3680 4
The partial budget analysis further revealed that the application of Tilt at 1 liter ha' provided tl highest marginal rate of the return (MRR) of 5077.9% (Table 4) suggesting for each birr invests in wheat production, the producer would collect birr 5.077 after recovering his cost. Since tl MRR assumed in this study was 100%. the treatment with application of Tilt fungicide gave i acceptable MRR. Therefore. Till fungicide application would be economical to be recommende on wheat to control wheat rust at Guji highlands of Ethiopia Conclusion and RecommendationsAlthough wheat rust appears early to late during the crop season,it could develop to sevei epidemic levels and could be an important factor limiting bread wheat production in Gu highlands of Ethiopia. Location variations in severity of the disease are may be related t differences in weather conditions. Despite variations among fungicides effectiveness, brea wheat was severely attacked by wheat rust in the absence of fungicide application.There is a urgent need for developing resistant varieties to the existing wheat rust pathotypes.Fungicides were found to be effective in reducing wheat rust severityand improving crop yielc Partial budget analysis of the study revealed that, applying Rex Duo had the highest net fief benefit (27217.3ET birr) followed by Tilt (23537.25ET birr ha1 compared to Natura, (16834 bii ha '), Bayletone (16768.3 birr ha ') and unspraved check (5075.67 birr ha'1). However, Tilt 250 E.(
268

Oromia Agricultural Research Institute (IQQO), Crop research Proceeding 2017
had showed maximum economic profitability than Rex Duo and other fungicides with marginal rate of return (M RR) of 6494.4%. Therefore, application of Tilt 250 EC at rate of 0.5 litre ha'1 was found to be economical foe bread wheat production and there by improve yield of susceptible bread wheat up to 25.1% under proper management and the current market price of Guji high lands, Southern Oromia.ReferencesBekele Hundie. 2003. Short report on stripe rust and stem rust. In Bedada Girma (ed.). Pp.67-68.
BADE. 2003. Bale Agricultural Development Enterprise. Proceedings of the Agronomy Workshop. Addis Ababa, Ethiopia.
Cook, R. J. and King, J. E. 1984. Loss caused by cereal diseases and the economics of fungicidal control. Plant Diseases: Infection, Damage and Loss, Blackwell, pp. 237-245, ISBN 0632011262, Oxford, UK.
CSA (Central Statistical Authority). 2014. Agricultural survey sample. Report on area and production of crops (private peasant holding, meher season). Statistical Bulletin No 278. Addis Ababa, Ethiopia.
Dereje Hailu. 2003. Effect of stripe rust (Puccinia striiformis) on yield and yield components and quality of improved bread wheat (Triticum aestivum) varieties. MSc Thesis. Alemaya University.99pp.
FAO (Food and Agriculture Organization of the United Nations). 2009. Wheat Flour. FAO Agribusiness hand book. Rome, Italy. Available at www.eastagri.org.
Getachew Agegnehu and Taye Bekele. 2005. On-farm integrated soil fertility management in wheat on nitisols of central Ethiopian highlands. Ethiopian Journal o f NaturalResources. 7: 141-155.
Hailu, D. and Fininsa, C. 2007. Relationship between stripe rust (Puccinia striiformis) and grain quality of bread wheat (Triticumaestivum) in the highlands of Bale, southeastern Ethiopia. International Journalof Food, Agriculture and Environment 5: 2430.
Jeger, M.J. 2004. Analysis of disease progress as a basis for evaluating disease management practices. Annual Review of Phytopathology 42: 61 -82.
Leonard, K.J. and Szabo, L.J. 2005. Stem rust of small grains and grasses caused by Pucciniagraminis. Molecular Plant Pathology 6: 99111.
Ordish, G. and Dufour, D. (1969). Economic bases for protection against plant diseases. Annual Review o f Phytopathology', Vol. 7, No. 1, (January 1969), pp. 31-50, ISSN 0066-4286
Roelfs, A.P. 1985a. The cereal rusts, Vol. II; diseases, distribution, epidemiology and control.Orlando (FL): Academic Press. Chapter 1, Wheat and rye stem rust; p. 3-37.
Roelfs, A.P. 1985b. The cereal rusts. Vol. II: diseases, distribution, epidemiology and control.Orlando (FL): Academic Press. Chapter 13, Epidemiology in North America, pp. 403-434.
Tadesse, K., Amare, A. and Ayalew, B. 2010. Effect of fungicide on the development of wheat stem rust and yield of wheat varieties in highlands of Ethiopia. African Crop Science Journal. 18( 1 ):23-33.
USDA (United States Department of Agriculture). 2010. World Agricultural Production.Wubishet Alemu & Tamene Mideksa .2016.International Journal of Research Studies in
Agricultural Sciences (IJRSAS) Volume 2. Issue 9, 2016. PP 35-40.Wubishet Alemu and Chemeda Fininsa. 2016. Effects of Environment on Wheat Varieties’ Yellow
Rust Resistance, Yield and Yield Related Traits in South-Eastern Ethiopia. Sciencepublishinggroup. Plant. 4(3): 14-22.
Wubishet Alemu and Tamene Mideksa. 2015. Verification and Evaluation of Fungicides Efficacy against Wheat Rust Diseases on Bread Wheat (Triticum aestivum L.) in the Highlands of
269

Oromia Agricultural Research Institute (IQQO), Crop research Proceeding 2017
Bale, Southeastern Ethiopia. International Journal of Research Studies in Agricultural Sciences (IJRSAS) Volume 2. Issue 9, 2016. PP 35-40
Survey on Distribution and Economic Importance of Weeds in Cereal Crops at Guji Zone, Southern Oromia
Siyoum A*'., Yared T1., Kebna A . andObsa Cimdesa1 Bore Agricultural Research Centre, P.O.Box21.Guji-Bore,Ethiopia
■"Corresponding author:[email protected] AbstractA weed survey was carried out during 2014 and 2015 main cropping seasons with in three agro- ecologies o f Guji zone of Southern Oromia. Objectives of the study were investigation distribution and exploring the most dominant weed flora in cereal crops. For this survey, data was collected from six agro-ecologically representative districts where rwo districts were purposively selected from each agro-ecology. From each districts four Peasant Associations were selected and totally. 220 fields were assessed. Collected data was analyzed using quantitative and descriptive tools. Accordingly, a total of 42 weed taxa belonging to 18 fam ilies were identified. Among these families. Gramineae. compositae, Polygonaceae and Rubiaceae were the most abundant families recorded during the investigation. Snowden polistachia. Avena fatua. Bromus pectinatus Thunb, Phalaris paradoxa L. Setaria pumila. Digitaria abyssinica, Galansoga Palviflora. Guizotia scabra. Tagetes minuta, Bidens pilosa, Bidense pachloma. Parthinium hystrophorus. Polygonum nepalense. Oxygonum sinuatum. Rumex abyssinica. Andropogon abyssinicus. Lauracaea cornuta. Galium sporium. Galansoga palviflora. were the most frequent species (68%) followed by Snowden Polistachia (51%).Furthermore, most of farmers(90%) in high land districts mentioned Snowden polistachia as important weeds whereas Galansoga palviflora was mentioned as the worst weed. Additionally, based on the collected data, these hvo weeds were found the most abundant, frequency and dominant weed species at highla/ul agro-ecologies o f Guji Zone. In other hand. Setaria verticillata and Setaria pumila were identified as the most abundant, frequency and dominant weed species o f cereal crops at both Mid land and Low land agro-ecologies of Guji Zone. In general, this study would provide basic information regarding the situation of cereal crop weeds in different agro ecologies of Guji Zone that could serve as corner stone for future research on weed.Key words: Cereal crops, weeds, dominance, frequency, abundance
IntroductionIn Ethiopia, wheat production is majorly hindered by several biotic and a biotic factors. Among biotic factors, weed holds large portions. Weeds is a plant that interfere with the objective and requirements of man, cause great yield loss in cultivated crop by competing for the limited natural resource, including plant nutrient, soil moisture, light, space etc., particularly in areas where continuous monoculture is practiced. In addition to their direct effect on the crop, weed can harbor pathogen, insect pest, rodent and wild animals.Weeds represent one of the greatest limiting factors to efficient crop production as they cause greater economic losses on agricultural lands than all other pests combined (Patil and Jadhav, 2013). Because, it has been estimated that weeds cause a yield loss of about 10% in the less developed countries and 25% in the least developed countries (Akobundu, 1987). Even if the amount of yield loss is not clearly estimated, it’s observed that loss caused by this pest is likely to be high in most areas of Ethiopia where crops are dominantly grown. Likewise, the problem is very decisive at high land agro-ecologies of the country. This might be due to the occurrence of high rain fall throughout crop growing seasons. In such conditions, conducive environments will be created for the development as well as spreading out of different weed species to compete with the intended crops to be grown.
270

Oromia Agricultural Research Institute (IQQO), Crop research Proceeding 2017
Thus, presence of each weed population in an arable field is usually the result of ecological reactions to previous management practices, soil characteristics of the site and the regional (Salonen, 1993; Andersson & Milberg, 1998). Weed management practices are varying with nature of weeds, time of weed emergence, cropping system etc. Thus, weed identification before adopting management strategies are necessary in particular crops (Himalaya Subedi, 2013). As a result, several weed species are found in different agro-ecological regions of the country. So, identifying important weed species found in specific locations is very essential.Because, knowledge of the weed community structure is an important component of weed management, and is essential in setting priorities for both weed management and research. In view of this, the present survey was conducted to address the following objectives; (i) to identify agro- ecological distribution of weed species in cereal crops; (ii) to assess and identify cereal weeds dominancy, frequency and abundance, (iii) to assess the influence of some environmental factors and crop management practices on weed species composition and distribution in cereal crops in the study area.Materials and methodsThe survey was carried out at three agro-ecologies of high land, mid land and low lands of Guji Zone, Southern Oromia during 2014/15 main cropping season. Guji zone is located at an altitude of 600-2700 m.a.s.l. with a distance of 604 km from the capital Finfine (Addis Ababa) to the South. Geographically, the Zone is situated at 05 39’59” .99 North latitude and 39 " 00'0” .00 East longitude and bordered by SNNP in the North, Bale administrative Zone to South East, Somali Regional state in the South and Borena administrative Zone in the West. Guji Zone has structured by thirty rural districts and two urban districts with about 35,454 km" land coverage and above 1.6 million populations (Zonal data). About 68% of the Zone climatic condition is characterized as Kola, 19% Weina Dega and 13% Dega. The Zone receives an annual rain fall of 500-1750 mm with a maximum and minimum temperature of 30.5°c and 10.5°c respectively. Agriculture holds large portion of the Zone economic sector integrated with others.Survey methodology: For this survey, districts were selected using a stratified sampling method based on altitudes; low altitude (<1600 m.a.s.l), medium altitude (1600±I900 m.a.s.l), high altitude (>1900 m.a.s.l). Accordingly, two districts were selected from each agro-ecology. Thus, Bore and Anna Sora were selected from high land districts, Adola and Shakiso from mid land while Hara- kelo and Liba were selected for low land. From the selected districts four PA's were purposively selected. Cereal crop fields were selected regardless of field size and on the grounds of accessibility or adjacent to road at every 5 km using vehicle speedo meter. In each field, three to five 0.5 m x 0.5m quadrants were used following an inverted W pattern (Thomas, 1985). Percentage cover (the ground area covered by the vertical projection of above-ground plant parts) was estimated visually for each of the weed species in each quadrant. Weed identification in the field was done based on weed identification guides (Terry and Michieka, 1987; Stroud and Parker, 1989).Data on major environmental factors and crop management practices believed to influence the weed flora in general and cereal crop in particular in each field were collected by observation (soil type, topography, type of crop), measurement (altitude), interviewing farmers (number of ploughings before planting, month of planting, fertilizer use, number of weeding before the survey date) as well as from secondary sources (administrative zone, rainfall). Environmental and crop management variables of nominal type (administrative zone, soil type, topography, crop type, fertilizer use) were converted into binary dummy variables that take the value 1 if the field belongs to the category or 0 if it does not. Altitude, number of ploughings, month of planting, number of weeding and rainfall were quantitative variables and hence measured on an interval scale. Survey date was used as a co variable in the data analysis.
271
Oromia Agricultural Research Institute (IQQO). Crop research Proceeding 2017
Farmers interview: Fanners were requested to respond to 15 questions on weeds and weed control in general on cereal crop in particular. Because answers tended to be relatively consistent within each village, only a subset (n ' 148) of the farmers whose fields had been surveyed was interviewed.Method of data analysesThe data on weed species were summarized using:Frequency: The number of fields in which a species occurred expressed a percentage of the total number of fields surveyed; Abundance: A = £W/N, where, A = abundance, W = number of individuals of a weed species, N = Sample numberDominance: D = A/ £AxlOO, Where, D = dominance, £A = total abundance of all species andField uniformity: the number of sampling quadrants in which a species. Occurred in a field expressed as percentage of the total number of samples.ResultsFor this study, six districts which were clustered under three agro-ecologies and a total of twenty four Peasant associations were addressed. About, 220 fields from all PA's were assessed during the study (Table 1). A total of 42 weed species belonging to seven plant families were recorded from the three agro-ecologies of Guji zone. Among these families, Gramineae was identified as the most dominant weed family (43.86%) followed by Compositae (33.84) whereas Rubiaceae (4.79%) c£ Polygonaceae (4.62%) were the list abundant weed families.However, different weed species were identified at each agro-ecology based on abundance, frequency and uniformity in the field. About 20 weed species having dominance range of 1.8- 17.58, frequency 6-80, abundance 3-29.3 and field uniformity of 9-43 were identified from high land agro-ecology (Table 1). Accordingly, Galisonga Palviflora. Snowden Polistachia. Avena fatua and Phalaria paradoxa L were the most dominant, frequent and abundant weed species identified at high land agro-ecologies of Guji zone. During the survey, it was also observed that these al] weeds are majorly affecting cereal crop production.Interviewed farmers also suggested as these all weeds are significantly affecting yield and beyond their capacity to control due to the convalesce nature of the weed species towards management practices undertaken. Farmers described that, climatic conditions of the area were highly contributing for the development and poor management practices. Because, the area was known with continuous rain fall throughout the growing season as a result it's difficult for them to undertake land preparation on time and its management practices properly. In line with the farmers suggestion, it's observed that most of the assessed fields were not properly managed starting from land preparation to pests management.fwo types of weed management practiced were observed. Hand weeding was majorly practiced for weed management in most of the fields observed (85%) with different frequency. In most of the fields, 1-2 times of hand weeding practices was observed to be undertaken. In some cases, unweeding fields were also identified. However, less number of the assessed fields were attempted to manage using ineffective and recommended packages of herbicides (15%).Tef, maize, wheat and barley are major cereal crops produced in mid land agro-ecology of Guji Zone. However, similar to the high land agro-ecology production of these crops were also significantly hindered by several weed species. During this study, about 17 weed species having dominance range of 0.14-13.3, frequency 24-88, abundance 0.2-19 and field uniformity of 12-51 were identified from Mid land agro-ecology (Table 2). Among, the identified species Setaria Pumila. Setaria Verticillata and Digitaria abysinica were showed dominance >10 and >75 frequency. Particularly(5e/ar;o Pumila is a major grass weed species highly affecting cereal crops including tef, wheat and barley at mid land agro-ecology of Guji Zone.
272

Oromia Agricultural Research Institute (IQQO), Crop research Proceeding 2017
Table 1: Major troublesome weed species of cereal crop fields in high lands of Guji Zone, Southern Oromia and their quantitative measures over two years (2015/2016) cropping season_____________
Botanical name Local nameFamilyname
Freq Abun
danceDominance
Fielduniformity
J.Galansoga Palviflora Darachesa Compositae 80 29.30 17.58 432. Snowden Polistachia Muja Gramineae 67 28.00 16.79 423. Avena fatua. Jigda Gramineae 64 13.80 8.29 394. Phalaris paradoxa Asandabo Gramineae 61 10.70 6.42 375. Bromus pectinatus Gishe Gramineae 43 9.80 5.88 376. Polygonum Nepalense7. Pennisetum
Abadabo Polygonaceae 60 9.70 5.82 28
polystachion 8. Pennisetum
— Gramineae 19 3.20 1.92 28
clandestinum9. Guizot ia Sea bra (vis.)
— Gramineae 28 4.60 2.76 28
chiov Hada Compositae 39 7.70 4.62 2710. Galium Sporium Matane Rubiaceae 52 8.00 4.79 2311. Bidens pilosa12. Erucastrum
Qaqabata Compositae 50 8.20 4.92 23
arabicum Zaroo Cruciferae 49 8.80 5.28 2113. Rumex abyssinica Aba bo Polygonaceae 20 4.40 2.64 1814. Bidense pachloma birra Compositae 19 3.10 1.86 1715. Cynodon dactylon Sardo - 19 3.60 2.16 1716. Tagetes minuta Ajo Compositae 18 7.50 4.50 1717. Oxygonum sinuatum - Polygonaceae 12 3.30 1.98 1218.Lolium temulentum - Gramineae 6 3.00 1.80 9
Even though, Fanners were undertaking several management practices, it was observed that the weed is not effectively controlled. This could be due to several factors. Systematic nature of some problematic weed species towards any management practices is one of the major problem in controlling weeds in field. Most of the assessed fields in mid land were observed with Setaria Pumila and Setaria Verticillata weed species devastation. Farmers were also remarked that these weed species were majorly affecting their fields and beyond their control. Some of the observed Fields were totally competed by weeds than the intended crops.From this situation, it was suggested that proper land preparation (timely and frequency), using
weed free planting materials (source of seeds used to control weed movement to unreached fields), absence of scheduled cereal crop rotation with other recommended crops (to inhabit source of the inoculums for the pest), untimely planting that might be creating active season for weed emergence and expansion. In proper management practices(time of undertaking weed management based on the appearance and weed species, methods of weed managements used for different types of weed species etc.) is also another factor observed in most of the fields assessed.In general, absence of effective weed management practices in mid land agro-ecology of Guji Zone is majorly contributed for the occurrence and spreading out of several devastating weed species to the area. Except few fanners, most of them were managing their field manually (hand weeding) due to several reasons. Because, they perceived that use of herbicides in crop production was considered to be cost, negative effect both on environment and animals, even grain produced by herbicide is harmful to feed. So, in order to improve the production and productivity of cereal crops
273

Oromia Agricultural Research Institute (IQQO). Crop research Proceeding 2017
at mid land agro-ecology of Guji Zone, weed management practices need unlimited attention towards bringing attitudinal change to farmers on using recommended herbicides as well as supplying the herbicides as required.
Table 2. Major troublesome weed species of cereal crop fields identified from mid land agroecology of Guji Zone, during 2015/16 cropping seasons.
No Botanical name Local Family Freq Abun Dom- Fieldname uency dance inancy uniformity
I Setaria pumila Asnadabo Gramine ae 88 19.0 13.30 512 Setaria verticillata. Asnadabo Gramineae ~ 17.0 11.90 483 Sorghum
arundianaceum - Gramineae 61 10.0 7.02 284 Digitaria abyssinica Marga Gramineae 78 18.3 12.80 475 Cyperus rotundus - Cyperaceae 36 8.6 4.77 226 Galansoga palviflora Darachesa Compositae 73 9.73 6.83 417 Cynodon dactylon Sardo Gramineae 71 5.6 3.93 338 Guzotia scabra. Haadaa Compositae 69 9.7 6.81 359 Bidens pilosa Qaqabata Compositae 79 7.3 5.12 3710 Commelina Banjibenghalensis Commelinaceae 42 3.5 2.46 1111 Tagetes minuta Ajoo Compositae 57 6.4 4.53 2712 Datura stramonium Banji Solanaceae 33 3.2 2.24 1613 Nicandra physalodes - Solanaceae 43 0.6 0.42 1814 Galium Sporium Ashkit Rubiaceae 55 13.8 9.68 2715 Erucastrum arabicum Zero Cruci ferae 47 4.3 3.04 2216 Xanthium spinosum Qoraatti Compositae 32 5.2 3.65 1717 Xanthium strumarium Qoraatti Compositae 24 0.2 0.14 12
Like that of mid land, tef, maize and wheat are major cereal crops produced at low land. Weed is a major pest affecting the production of these crops. From the survey collected data, about 9 weed species having dominance range of 5.93-20.78, frequency 30-76, abundance 8-28 and field uniformity of 9-44 were identified from low land agro-ecology (Table 2). Among the identified species, Setaria verticillata was the dominant weed species at low land (20.78) followed by Parthenium hysterophorus L. (14.84), Xanthium spinosum L. (12.84) and Xanthium strumarium L. (Table 3). Despite the fact that some weeds, such as Argemone mexicana and Xanthium spinosum, had low frequency they were considered to be problematic weeds by farmers. Thus, high frequency does not indicate the economic or sociological importance of a weed species, as some weeds have other uses, such as feed for livestock, which can be especially important in the lowlands.
274

Oromia Agricultural Research Institute (IQQO), Crop research Proceeding 2017
Table 3 Major troublesome weed species of cereal crop fields identified from low land agro- ecology of Guji Zone, during 2015/16 cropping seasons.
Botanical name Local name FamilyFrequency
Abundance
Dom-inancy
Fielduniformit
y1 Setaria verticillata Migira saree Gramineae 76 28.00 20.80 442 Setaria pumila Migira saree Gramineae 73 14.80 11.00 413 Amranthus hybridus Raafuu amaranthaceae 68 11.00 8.16 314 Amaranthus spinosus
PartheniumRaafuu amaranthaceae 63 8.00 5.93 27
5 hysterophorus Anemele Compositae 63 19.00 14.10 396 Xanthium spinosum
XanthiumQoraattii Asteraceae 56 17.30 12.80 21
7 strumarium Qoraattii Asteraceae 48 13.50 9.65 168 Commelina latifolia - Commelinacea 31 10.60 7.86 99 Argemone Mexicana Qoraatti Paraveraceae 30 12.60 9.32 12
ConclusionsIn crop production, weed management holds large portion. Particularly, cereal crops are majorly competent with different weed species. In order to provide effective weed management options to the producers, identification of the most problematic weed species in particular area is an important scheme for any intervention to be planned with regard to weed management. As a result, this study also conducted to identify the most problematic cereal weeds found at different agro-ecologies of Guji Zone using different quantitative parameters and factors contributing for their occurrence. Through this survey study, the most abundant and troublesome weed species found in small scale farms of different agro-ecologies of Guji Zone were ranked. The differences were observed between soils, crop types and between locations in weed flora composition, in terms of frequency, abundance and dominance in the highlands, mid land and low land agro-ecologies. Accordingly, Galansoga Palviflora and Snowden Polistachia were identified as the most dominant weed species from high land agro ecology , whileSetaria verticillata (L.) and Setaria pumila from mid land agro ecology whereas Setaria Verticillata Xanthium strumarium L. ,Parthenium hysterophorus L. and Xanthium spinosum L were identified as dominant weed species from lowland agro-ecology of Guji zone. Poor land preparation(time and frequency),use of poor quality seeds, absence of crop rotation, lack of awareness on importance of weed management using recommended herbicides, method of sowing (broadcasting), in accessibility and incompatibility price of herbicides were identified as major factors contributing for the occurrence and spreading of weed species throughout the study area. Therefore, this study has provided preliminary information regarding weed taxonomy of Guji Zone and would serve as base line for any research as well as strategies to be implemented towards weed management options.ReferencesAkobundu 10., 1987. Weed Science in the Tropics. Principles and Practices. Wiley, Chicester,
UK.Andersson and Milberg, 1998. Weed Flora and the relative importance of site, crop, crop rotation,
and nitrogen. Weed Science 46, 30-38.Himalaya Subedi, 2013. Wheat Weed Identification and Management under Cereal Production
System Nepal.Joz//-«o/ of Sustainable Society Vol. 2(3), 74-85 DOI:10.11634/216825851302470
275

Oromia Agricultural Research Institute (IQQO), Crop research Proceeding 2017
Patil Vishwas S. and Jadhav Prakash S., 2013. A Survey of Weed Flora in Crop Fields of Satara Tahsil (M.S.), India. Universal Journal of Environmental Research and Technology. Vol 3(2): 233-241
SALONEN J (1993) Weed infestation and factors affecting weed incidence in spring cereals in Finland- a multivariate approach. Agricultural Science in Finland 2, 525-536. jere.20160101.14
CO FFEEStatus of Coffee Insect Pests in major Coffee (Coffea arabica L.) growing areas of Eastern Oromia
Mohammedsani Amin1* and Hika Bersisa1 1Oromia Agricultural Research Institute, Mechara Research Center, Coffee research team
P.O.Box: 19, Mechara, West Hararghe, Ethiopia ♦Corresponding author's E-mail: [email protected]
AbstractThe yield and quality of coffee in the country had been significantly reduced by biotic factors (diseases. insects, weeds etc.) and abiotic factors (temperature, drought, and rain pattern). Hararghe coffee is among the specialty coffee which is vital to the economy of Ethiopia, as one of the major sources of foreign currency earnings. However, its production and productivity has been decreasing due to limiting factors that include major insect pest, such as antestia bug (AnB), bloch leaf miner (BLM ) and green scale (GrS). Therefore in order to establish the effective management of the insect pest, there was a need to ascertain their current infestation and spread in Eastern Oromia coffee growing areas. To this end. extensive survey was conducted in August 2015. The study covered representative sites known for high production and high cup quality in the districts of West (Daro Labu. Habro. Boke) and East (Bedeno) Hararghe zones. Presence or absence and prevalence or volume of the insect pest was determined as infestation and severity, respectively. The infestation by Antestia bug was severe in all lowland PAs of all districts in which up to 15 Antestia bug per tree was recorded. The economic threshold level for the insect is three bugs per tree. Higher infestations of blotch leaf miner (18%) and green scale insect (36%) were recorded in D/labu and Boke districts respectively. 27% infestation by antestia bug was recorded in Habro. These three are identified as the major insect pests o f coffee and are becoming a big threat for coffee production in the areas. Green leaf scale was severe on berry (19.48%) in Boke while high antestia bug severity (2.22%) was observed in Habro district. However, the severity of BLM in all studied areas was very low (0.81%). The current climate change may have favored the infestation by these pests. Generally, from the results o f the study, there is a major shift in the status of coffee the pests in Hararghe. therefore, development and/or adoption of management options of the insect pests in region should get immediate attention.
Keywords: Insect pests; infestation; severity
IntroductionCoffee is the most important and valuable agricultural commodity in Ethiopia and in the world supporting the economic growth and providing job opportunity to millions of people. Ethiopia is Africa’s largest coffee producer and the world’s fifth largest exporter of Arabica coffee. In 2015/16 total production was 6.4 million 60 kg bags, of which 3.7 million were consumed in Ethiopia (ICO,2015). Hararghe ( located in Eastern Oromia, Ethiopia) is one of the areas known for quality coffee production where coffee is sun coffee and it is usually grown at an altitude range from 1600-2100 m, often near dwellings. On the eastern side of the Rift Valley, the Hararghe coffee zone usually receives far less total rainfall (800-1200 mm per year) than all other coffee growing areas. Thus farmers complain an increase in the frequency and severity of drought. , There is a gradual reduction in rainfall over several decades (Moat et al., 2017). The crop is prone to a number of
276

Oromia Agricultural Research Institute (IQQO). Crop research Proceeding 2017
diseases and insect pests that attack fruits, leaves, stems and roots and reduce the yield and marketability (Aebissa, 2012). Thus, the yield and quality of cotYee are significantly reduced by biotic factors (diseases, insects, weeds etc.) and abiotic factors (temperature, drought and rain pattern).Coffee plants show climate-related stress through the increased occurrence, and intensity of pest attacks (Moat et al., 2017). The major coffee pests known to occur in Ethiopia are antestia bug, coffee berry & stem borer, leaf minor and scale insects. The problem of pests is higher in more intensively managed systems like home garden coffee of Hararghe. Hence, farmers sometimes might be obliged to consider uses of chemical pesticides (Tadesse, 2015). Insect pests are among the number of factors that limit coffee production both in quality and quantity (Million and Bayissa, 1986).Globally, an estimated crop loss by insect pests is about 13%, but it can be higher up to 96% in Africa. The antestia bug is a major coffee pest that feeds on all vegetative and fruiting pans of the coffee tree leading to yield reduction and poor quality of coffee beans (Ahmed et al., 2016).White stem borer (Anthores leuconatus), antestia bug (Antestiopsis sp.), coffee berry borer (Hypothenemus hampeiand) and blotch leaf miner (Leucoptera meyricki) are the four major economically important pests observed in different coffee plantation. Other coffee pests cause low economic damage (Aebissa, 2012; Nahayol and Bayisenge, 2012). Antestia bug, blotch leaf miner and green scale are the three major insect pests in Hararghe area (M A RC , 2010; 2015). A crop loss of 15-27% in total bean weight has been associated with infestation of 2-4 antestia bugs per tree.The density of Antestia bug ranged from 1-2 per tree is considered as the economic thresh hold level (Mugo et al, 2013). Antesia bug (C. alpinus De Lotto) causes the death of bearing branches (Million. 2000). Green scale is a common and serious problem in coffee which sucks the plant resulting in reduced growth and crop yield and requires constant attention particularly in dry areas. Blotch Leaf Miner (B L M ) feeds on the palisade parenchyma cells of the leaves (Ramiro et al., 2004). In Ethiopia, cultural practices like shading and pruning are used for insect pest control. The problem of pests is higher in the more intensively managed systems like plantations and home gardens. This could be attributed to narrow genetic pool of the coffee stock, reduced shade and habitat complexity.Therefore, as an essential prerequisite in the effective management of major coffee insect pests, there was a need to find out the current infestation level and spread of those insect pests. Hence, the survey was conducted to identify major coffee insect pests distribution, infestation and severity in major coffee growing areas of eastern Oromia.Materials and methodsDescription of the studied areas: Four major coffee producing districts (D/Labu, Habro. Boke
and Bedeno) were purposively selected from West and East Hararghe zones. Each district was categorized in to highland, lowland and midland agro ecologies. From each agro-ecology 4 farmers farms were sampled in interval of 5 km.Methods of insect pest assessmentInsect pest infestation: From each selected and sampled farms 50 trees were diagonally assessed for the presence or absence of antestia bug, green scale and blotch leaf miner (B L M ). The infestation is calculated as a percentage of infected trees to the total assessed tree.Insect pest severity: For severity of B L M and green scale assessment, a sample size of 10 trees with relatively uniform age was systematically selected at a distance of about 6-8 m within tiie sampling fann. Each tree was classified into top. middle and bottom branches strata. From each stratum, a pair of branches was selected for pest data recording. Pest damaged and healthy
277

Oromia Agricultural Research Institute (IQQ O), Crop research Proceeding 2017
berries/leaves were counted and then percentages of infected berries/leaves over total countedberries/leaves were computed as pest severity as follows:
Total infected berries/leavesSeverity (% ) = -— ;------ — ------ ---- X 100iota! ocounted bernes/leaves
For antestia bug (AnB) severity assessment, 10 trees were randomly selected with in farm, each!sampled trees with muslin cloth underneath. A few minutes later the trees were shaken and number'of Antestia bug (AnB) was counted. Alternatively, hand collection of antestia per sample trees wasdone to determine number of the insect per tree.Data analysisThe collected data was subjected to Excel speared sheet and summarized. The mean percentage of' pest infestation and severity were computed for each sample farm. Final data were analysed using SPSS 20 software package.Results and DiscussionStatus of insect pest across the districtsInfestation of antestia bug was observed in lowland PAs of all districts where up to 15 antestia bugs per tree was recorded (Figure J ). This is severe infestation where I -2 bugs per tree is considered as economic threshold level. This requires immediate application of control measure. Similarly, the infestation of green scale insect (15%) and blotch leaf miner (9%) were recorded showing that these are major pests that are becoming a big threat for coffee production in the areas. High infestation (17.5%) of BLM is recorded in Daro Labu followed by Habro (9.5%) and the least 1.7% in Bedeno (Figure 1). While, the highest (36%) and the least (1%) infestation of green scale was recorded in Boke and Bedeno, respectively with over all mean infestation of 15% (Figure I ).The overall mean infestation of BLM. GrS and AnB were 9, 15 and 11%, respectively (Figure 1). This may show the impact of environment on different insect pest. In agreement with this, Esayas et al. f2008) reported that, whether factors, host plants and natural enemies may attribute for distribution and seasonal changes in population of the insect.The severity of all incest pests significantly varied between the districts. Accordingly, the highest green scale severity was recorded in Boke district and the lowest in Daro Labau and Bedeno with overall 9% severity mean (Table 1). However, the highest severity of green scale on berry (19.5%) and leaf (13%) was observed in Boke than all distracts with over location mean of 7.2% and 4.5 % (Table 1). Higher antestia bug severity was recorded in Habro followed by Boke and zero in Bedeno district with over al) mean of 1.04% (Table I). This shows the need to focus on different insect pests as a priority for management in different districts.
Figure 1. The occurrence/infestation of major insect pests in major coffee growing districts of Hararghe zones
278

Oromia Agricultural Research Institute (IQQO), Crop research Proceeding 2017
Table 1. Mean severity of insect pests under different Hararghe coffee growing districts
District Severity of Insect pests (% )BLM GrS on berry GrS on leaf AnB
Daro Labu 0.59 9.26 4.96 0.78Habro 0.85 0.00 0.02 2.22Boke 1.20 19.48 12.97 1.17Bedeno 0.59 0.00 0.00 0.00Mean 0.81 7.18 4.49 1.04Range 0-4 0-91 0-62 0-12Std. Dev. 1.11 20.05 13.22 2.65
Key: BLM = blotch leaf miner; GrS = green scale; AnB = Antestia bugStatus of insect pests under different coffee growing agro-ecology: In all studied agroecologies, the severity of green leaf scale was higher compared to the other insect pests. High mean infestation (33%) of GrS in midland and no AnB severity in highland area of Bedeno district (Table 2). The pests” distribution and dominancy in the agro ecological were different. The highest mean (19.20%) severity on berry due to AnB in midland and the least severity was recorded in the highland indicating the effect of Agro-ecology on distribution and infestation status of insect pests in coffee growing areas of Eastern and Western Hararghe (Table 2).Table 2. Mean infestation and severity of insect pests under different coffee growing agro-ecology.Coffee growing Infestation (% ) Severity (%Agro-ecology BLM GrS AnB BLM GrS berry GrS leaf AnBHighland 6.00 4.38 1.25 0.81 0.91 0.45 0.00Midland 7.13 33.13 0.63 0.4 19.2 11.97 0.13Lowland 12.88 6.50 32.13 1.21 1.44 1.04 3.00Mean 8.67 14.67 11.33 0.81 7.18 4.49 1.04Range 0-70 0-100 0-100 0-4 0-91 0-62 0-12Std. Dev. 13.31 29.13 26.75 1.11 20.05 13.22 2.65Key: BLM=blotch leaf miner; GrS=Green scale; AnB=Antestia bug
Within the districts, there are differences on the infestation and severity of pests across agro ecologies. The highest infestation of 9, 15 and 5% of BLM, GrS and AnB w'ere recorded under highland of D/Labu, Boke and Bedeno districts, respectively (Table 3). Whereas the highest; 85% of GrS, 13.5% of BLM and 2.5% of AnB was observed in the midland of Boke, Habro and D/Labu district, respectively (Table 3). In lowland of Habro district AnB infestation was high (80%) followed by Boke district, while the highest (33% BLM and 16% GrS) in lowland of Darolabu recorded (Table 3).
The high severity of GrS both on leaf and berry and BLM were observed in midland of Boke followed by D/Labu district and it was very low under highland of all districts (Table 3). In all highlands of all districts the severity of AnB was zero, but in lowland its severity was high (7% at Habro followed by Boke) (Table 3).
279

Oromia Agricultural Research Institute (IQQO), Crop research Proceeding 2017
Table 3. Infestation and severity of the insect pests in districts and under different coffee growing agro-ecologies
Infestation of the insects (% ) per agro-ecologyDistrictname Highland Midland Lowland
BLM Green Scale AnB BLM Green Scale AnB BLM Green Scale AnBD/Labu 9.00 0.00 0.00 10.50 45.00 2.50 33.00 16.00 13.50Habro 8.00 2.50 0.00 13.50 0.00 0.00 7.00 2.50 80.00Boke 7.00 15.00 0.00 4.50 85.00 0.00 6.50 7.50 35.00Bedeno 0.00 0.00 5.00 0.00 2.50 0.00 5.00 0.00 0.00Mean 6.00 4.38 1.25 7.13 33.13 0.63 12.88 6.50 32.13
Severity of the insects (% ) per agro-ecology
District Highland Midland Lowlandname
BLMGrS GrS on on berry leaf
AnB BLMGrSonberry
GrSonleaf
AnB BLMGrS GrS on on berry leaf
AnB
D/Labu 0.86 0 0.37 0 0.53 23.81 11.20 0.5 0.37 3.98 3.31 1.85Habro 0.98 0 0.05 0 0.71 0.00 0.00 0 0.86 0.00 0.00 6.65Boke 1.41 3.66 1.38 0 0.35 53.01 36.69 0 1.83 1.77 0.85 3.50Bedeno 0.00 0.00 0.00 0 0.00 0.00 0.00 0 1.77 0.00 0.00 0.00Mean 0.81 0.91 0.45 0 0.4 19.20 11.97 0.13 1.21 1.44 1.04 3.00Key: BLM=blotch leaf miner; GrS=Green scale; AnB^Anteslia bug
Relationship between coffee shade tree status and occurrence of pests: High mean infestation (19%) of GrS and (16%) AnB were recorded in un-shaded coffee farms (Table 4). And, there was no AnB occurrence under fully shaded coffee in this area. This shows coffee tree shading limits AnB occurrence. The major coffee insect pests varied in their severity on coffee as a result of shade. According to Kimani et al. (2002), in some insect pests, shade depressed their severity while others were positively favored. Shade trees reduce excessive light, mulch the soil with their Jitter, create hostile conditions for pests and diseases, and harbor a variety of predatory animals (Beer et al., 1998). Coffee shade tree can reduce antestia population by producing unfavorable temperature and humidity conditions to antestia bugs, which prefer dense foliage (Crowe and Tadasse ,1984). So this survey result also confirms previous findings.Table 4. Effect of coffee shade on the occurrence of different pests in Hararghe.
(( *------------------------------ .----------- ------------------------____________ Shade status
Insect pest status Unshaded ShadedMean Range Std. Dev. Mean Range Std. Dev.
BLM infestation (% ) 10 0-70 15.2 5.4 0-20 6.3BLM severity (% ) 0.8 0-4 1.04 0.8 0-4 1.3GrS infestation (% ) 19.2 0-100 33.0 3.6 0-4 10.8GrS severity on berry (% ) 9.7 0-91 23.3 l.l 0-15 3.9GrS severity on leaf (% ) 6.3 0-62 15.4 0.1 0-1 0.3AnB infestation (% ) 16.0 0-100 30.7 0.0 0.0 0.0AnB severity (% ) 1.5 0-12 3.1 0.0 0.0 0.0
Key: BLM=blotch leaf miner; GrS=Green scale; AnB^Antestia bug
Insect infestation across different environment varied depending on their shade status. In Bedeno AnB infestation was 5%under open un-shaded farms while there was infestation in shaded coffee farms. Similarly, the highest (35.83%) mean infestation of GrS was recorded in Boke under open un-shaded farm. In Daro Labu only BLM severity was higher under fully shaded than open un-
280

Oromia Agricultural Research Institute (IOOO), Crop research Proceeding 2017
shaded fields. But the other pests were less severe under fully shaded than open un-shaded farms. In Habro, high infestation and severity of BLM was recorded under fully shaded compared to unshaded farms (Table 5). This might have been due to the coffee leaf insect pests more attracted to shady environment and/or might have been the interruption of the activity of natural enemy by the shade canopy as it is supported by Lan and Wintgens (2004) who recommended that the use of shade has a direct relationship with the behavior of the pests. Attacks have been found to be more severe where the coffee is grown under heavy shade or is closely planted and un-pruned or inadequately de-suckered. A single, very large, dense shade tree can cause a serious local infestation (Le Pelley, 1968; Jameson, 1970; Bardner, 1985). This result indicates the importance of proper coffee tree and shade management for the control of insect pests based on their behavior. Table 5. Mean infestation and severity of insect pest under different coffee farm shade status and environments
District Shade statusInfestation (% ) Severity (% )
BLM GrS AnB BLM GrS on berry GrS on leaf AnB
D/Labu Unshaded 24.86 29.14 9.14 0.52 13.77 8.29 1.34Shaded 7.20 8.00 0.00 0.69 2.95 0.29 0.00
Habro Unshaded 8.55 1.82 29.09 0.83 0.00 0.02 2.42Shaded 20.00 0.00 0.00 1.08 0.00 0.00 0.00
Boke Unshaded 6.00 35.83 11.67 1.20 19.48 12.97 1.17Shaded na na na na na Na na
Bedeno Unshaded 0.00 0.00 5.00 0.00 0.00 0.00 0.00Shaded 2.50 1.25 0.00 0.88 0.00 0.00 0.00
Mean Unshaded 9.85 16.70 13.73 0.64 8.31 5.32 1.23Shaded 9.90 3.08
Antestia him0.00 0.88 0.98 0.10 0.00
Effect of agronomic practice on status of insect pests : Different agronomic practices showed different impact on the insect pests. As the result (Table 6) shows, except infestation of BLM (13%) all the other insect pests were less severe in slashing practice. 18% of GrS infestation is observed under cultivation practice. Slashing reduced the infestation and severity of insect pests compared to the rest activities except in GrS severity on berry (9%) across the surveyed districts.
Table 6. Effect of agronomic practices on the infestation and severity of insect pests
Agronomic practices Infestation (% ) Severity (% )BLM GrS AnB BLM GrS on berry GrS on leaf AnB
Slashing 13.33 3.33 3.33 0.04 0.00 0.00 0.00Cultivation 6.73 18.18 4.91 0.41 9.16 4.39 0.67Intercropping 8.45 15.61 15.16 1.09 7.88 5.39 1.37Mean 8.67 14.67 11.33 0.81 7.18 4.49 1.04
In Bedeno, ploughing/cultivation activity was the best for insect pest control. In Boke, higher infestation and severity of insect pests were recorded in intercropping compared to cultivation. Similar result was observed in Habro district. This shows the harmful effect of intercropping coffee with other crops by favouring the occurrence of pests. Intercropping coffee with crops such as bananas is believed to favor higher pest infestations (Le Pelley, 1968; Jameson, 1970: Bardner, 1985).
281

Oromia Agricultural Research Institute (IQQO), Crop research Proceeding 2017
Table 7. Agronomic effect on infestation and severity of insect pests in the districts.District Agronomic practice Infestation (% ) Severity (% )name GrS on
BLM GrS AnB BLM berry iGrS on leaf AnBIntercropping 24.67 18.00 3.33 1.09 4.71 4.40 0.67
D/Labu Slashing 70.00 10.00 0.00 0.00 0.00 0.00 0.00Cultivation 8.25 22.50 6.75 0.47 12.13 5.79 0.93Intercropping 10.40 2.00 32.00 1.00 0.00 0.02 2.66
Habro Slashing 10.00 0.00 0.00 0.21 0.00 0.00 0.00Cultivation 0.00 0.00 0.00 0.00 0.00 0.00 0.00
Boke Intercropping 5.82 37.27 12.73 1.23 20.91 13.98 1.27Cultivation 8.00 20.00 0.00 0.78 3.71 1.93 0.00Intercropping 2.86 0.00 0.00 1.01 0.00 0.00 0.00
Bedeno Slashing 0.00 2.50 5.00 0.00 0.00 0.00 0.00Cultivation 0.00 0.00 0.00 0.00 0.00 0.00 0.00Intercropping 10.94 14.32 12.02 1.08 6.41 4.60 1.15
Mean Slashing 26.67 4.17 1.67 0.07 0.00 0.00 0.00Cultivation 4.06 10.63 1.69 0.31 3.96 1.93 0.23
Conclusion and recommendationInsect pests such as antestia bug, blotch leaf miner and green scale were assessed in major Hararghe coffee producing districts. The finding confirmed that currently they are critical problems, most often are not controlled by any insecticide since it is not affordable to the farmers. The insect pest infestation and severity varied among and within the districts depending on environmental conditions and management practices applied. Hararghe coffee is increasingly threatened by antestia bug, blotch leaf miner and green scale insects. The use of shade has direct relationship with reducing infestation and severity of insect pest. Agronomic practices like cultivation, slashing can be options in cultural control of the insect pests. A field experiment that leads to the development of integrated pest management strategy should be designed to confirm the results of this survey.Therefore, for sustainable, environmentally friendly organic coffee production that fetches premium price to farmers and the country at large, the integrated insect pest management of these major pests should be given attention. Research should be strengthened in coffee insect pest protection. Location specific insect pests resistant/tolerant cultivars should be developed as long-term solution. Ethiopia is believed to possess about 99.8% of the total Arabica coffee genetic diversity. These diverse genetic resources are vital in selecting coffee cultivars that are of high quality, resistant to diseases/insect pests, and adapt to climate extremes (drought/ temperature). Farmers purposely maintain diverse landraces on their farm to overcome environmental stresses like diseases, pests, and drought and also conserve varieties that have specific qualities and are high yielding. The research should focus on the integration of pest management options for the management of the insect pests.ReferenceAebissa B. (2012). Developing a knowledge based system for coffee disease diagnosis and
treatment, A Thesis,Addis Ababa University, Addis Ababa, Ethiopia.Bardner, R. (1985). Coffee Rehabilitation Programme, Uganda - Consultancy Report on
Entomology. January, 1985.Beer J, Muschler R, Kass D, Somarriba E (1998). Shade management in coffee and cacao
plantations. Agroforestry Systems, 38: 139-164.
282

Oromia Agricultural Research Institute (IQQO), Crop research Proceeding 2017
Crowe, T.J. and Tadesse Gebermedhin (1984).Coffee pests in Ethiopia, their Biology and control, 1AR. Addis Ababa, Ethiopia. Crown coffee (2002). Ethiopian Coffee Speciality (un published). Addis Ababa, Ethiopia.
Culin, J.D., and Yeargan.K.V (1983). A comparative study of spider communities in alfalfa and soybean ecosystems: Foliage-dwelling spiders. Ann. Entomol. Soc. Am. 76:825- 831.
ICO (2015). Historical Data on the Global Coffee Trade. International Coffee Organization(ICO) Website: http ://www.ico.org/new_historical.asp?section=Statistics
Jameson, A.D. (1970). Agriculture in Uganda. Oxford University press, Oxford.Kimani M., Little T. and Janny G.M. (2002). Introduction to Coffee Management through
Discovery Learning,Lan, C.C. and Wintgens, N.J. (2004). Major pests of coffee in the Esia Pacific Region. In: coffee:
growing, processing, sustainable production (Wintgens, J.N. ed.) 389- 418pp. W ILEY- VCH verlag GmbH & Co. KGaA. Weinheim, Jermeny.
Le Pelley R.H (1968). Pests of coffee. Longmans green and Co. Ltd., LondonMillion Abebe (2000). Significance of Arthropod pests of coffee in Ethiopia. In: proceedings of
workshop on the control of CBD in Ethiopia, 66-71pp. 13-15 August 1999. IAR, Addis Ababa, Ethiopia.
Million Abebe and Bayisa Mormene (1986). A review of coffee pest management research in Ethiopia. In: A review of crop protection research in Ethiopia. Proceedings of the first Ethiopia crop protection svmposium. 4.8 February 1985. (Tsedeke Abate, ed.) 163-178pp. IAR, Addis Ababa, Ethiopia.
Moat, J., Williams, J., Baena, S., Wilkinson, T., Demissew, S., Challa, Z.K., Gole, T.W. and Davis.A.P. (2017). Coffee Farming and Climate Change in Ethiopia: Impacts, Forecasts, Resilience and Opportunities. -Summary. The Strategic Climate Institutions Programme (SCIP). Royal Botanic Gardens, Kew (UK). Pp. 37
Mugo, H.M., Kimemia, J.K., and Mwangi J.M., (2013). Severity of antestia bugs Antestiopsis spp. and other key insect pests under shade coffee in Kenya, I.J.S.N., 4(2):324-327.
Nahayol A. and Bayisenge J. (2012). Biological control of coffee antestia bugs (Antestiopsislineaticolis) by using Beauveriabassiana. J.New York Sci., 5(12).
Nooris. R.F (2003). Concept in integrated pest management. Prentice-Holl, inc. NewDelhi.Tadesse Woldemariam Gole (2015). Coffee Production Systems In Ethiopia. Environment and
Coffee Forest Forum (ECFF), Addis Abeba, Ethiopia. Pp. 61
283

Oromia Agricultural Research Institute (IQQO), Crop research Proceeding 2017
Status of Coffee Diseases in major Coffee (Coffea arabica L.) growing areas of Eastern Oromia
Mohammedsani Amin1* and Hika Bersisa1 'Mechara Research Center, Coffee Research Team , Mechara, West Hararghe, Ethiopia
♦Corresponding author’s E-mail: [email protected] coffee is among the specialty coffee which is vital to the economy of Ethiopia, as one of the major sources of foreign currency earnings. However, its production and productivity has been decreasing due to limiting factors that include major diseases, such as coffee leaf rust (CLR). coffee berry disease (CBD. branch dieback (BDB) and coffee wilt disease (CWD). In order to establish effective management of the diseases, there is a need to ascertain their current incidence and spread in Eastern Oromia coffee growing areas. To this end. extensive survey was conducted in August 2015. The survey was conducted in four major coffee producing districts, three of them (D/Labu, Habro & Boke) are located in West and one district (Bedeno) in East Hararghe zones. Presence or absence and volume of the diseases were determined as incidence and severity, respectively. The result indicates that CBD. CLR and BDB were highly affecting the coffee tree followed by BDB. However. CWD incidence was only observed in Daro Labu and Bedeno district at very low level to less than 3% with overall average o f 0.92%. The mean severity of CBD was 29% with range o f 0-89 and its highest (45%) severity in Bedeno followed by Boke (26%) district, while average CLR severity was 6.3% with the range of 0-19. Also, the mean severity of BDB is 25% with the range of 0-74 and highest (40%) in Boke followed by Habro (25%) district. The disease occurrence was very> high across all study> areas with an average incidence of 66% 33% and 47% for CBD. CLR and BDB. respectively. Thus, currently CBD. CLR and BDB are economically important diseases which cause severe loss of yield. Generally, from the results of the study, there was the major shift in the status of coffee diseases in Hararghe. Therefore, the diseases in the region shoidd get due attention immediately.Keywords: major disease; Hararghe coffee; incidence; severity
IntroductionCoffee is one the most important commodities produced primarily for consumption as a beverage by more than one third of the world’s population in more than 80 countries around the world. In Ethiopia, it is the single commodity that provides source of revenue for many millions of people (Rutherford and Phiri, 2006). The wide climatic and soil factors offer the country to birth place of Arabica coffee which accounts for 80% of the world coffee. Ethiopia is Africa’s largest coffee producer and the world’s 5th largest exporter of Arabica coffee (ICO, 2015). About 70% of Ethiopian coffee is produced in Oromia Regional State.
Despite the largest share in export and economic contribution, several constraints have been identified that affect the production and utilization of coffee. Of these constraints, perennial coffee diseases pressure are the most serious issue confronting Oromia’s coffee production, and calls for immediate control measures. Climate change is believed to be playing its role where new diseases occur as an outbreak. The area known as Hararghe comprises the eastern most of the specialty coffee growing zones of Oromia (Ameyu, 2017). In Hararghe. an increase in temperature threatens the coffee at an alarming rate and become more conducive for disease prevalence (Iscaro, 2014). As climate change becomes increasingly severe, an assessment of the status of coffee disease could be especially valuable to those hoping to create adaptation strategies and policies (Battiste et al2016). Significant proportion of potential coffee yields is annually lost due to persistent disease problems. Previously, the major coffee diseases in Ethiopia were coffee berry disease (CBD) and coffee wilt disease (CWD), but nowadays, coffee leaf rust (CLR) and branch dieback (BD B) are common and economically important coffee problems particularly in Hararghe. Therefore in the
284

romia Agricultural Research Institute (IQQO), Crop research Proceeding 2017
C B D , C L R , C W D and B O B became a big threat for Hararghe coffee production. Recent study jiammedsani, 2011) showed that up to 53-100% yield loss was observed due to above jioned diseases in some individual Haraghe coffee producing farms. Mohammedsani, 2011 rted 5 4 % and 74% occurrence o f C B D and C L R respectively during 2010 in Hararghe zones the highest incidence in Bedeno and Boke district. Extensive biological survey o f major coffee ses in major coffee growing areas o f West & East Hararghe was conducted with the objective ►cument the incidence and severity o f the major coffee diseases in different Hararghe coffee ucing agro-ecologies there by recommend the possible intervention required.2r i a l a n d m e t h o d sc r i p t i o n o f t h e s t u d y a r e a s : The assessment covered the most important four major coffee ing districts o f Hararghe zones in eastern Oromia. The selected districts were Daro Labu,o and Boke from West and Bedeno from East Hararghe zones. The assessment was conducted August to September 2015 on several small-scale coffee farms. The areas are known for their cup quality Harar coffee brand, which fetch premium price in the world market. The climate o f the study areas during 2015 is shown in Figure 1.
Jan Feb M ar Apr M ay Jun Ju l
i Total R .F (m m ) « < ^ M a x T. oC
Aug Sep Oct N ov Dec
M in T. oC «^ *»M ean T. oC
ire 1. M onthly total rainfall and minimum, maximum and mean temperature o f the study area ng 2015 cropping season.t h o d s o f A s s e s s m e n t : Each district was categorized into three agro-ecology (highland, midland owland) based on their altitudinal variation (Table 1). From each agro-ecology four (4) esentative coffee farms with approximately sim ilar age coffee trees were selected as sample s at the interval o f 3-5 km. Forty eight 48 (12 per district) farm plots were assessed for the ases and other required information were collected. At each farm, a questionnaire was rinistered and the owner was asked about the age o f the tree, type o f coffee species and disease ory. The fields were observed for agronomic practice applied, weed control method, shade tree dition (shaded or non-shaded), slope o f the land and other factors that contribute in occurrence, ribution and severity o f the diseases. Geographical information such as altitude, longitude & tude o f each farm was recorded, using G P S at a central point per farm surveyed.>le 1 The classification o f each selected coffee growing agro-ecology based on altitudinal iation of each district
District nameAltitude variation per agro-ecology (m.a.s.l)
Low land M idland Highlando Labu
Dro ceieno
1669-1715 1731-1765 171 1 - 1760 1577 - 1618
1729- 1755 1801 -1875 1840 - 1875 1771 - 1937
1795 - 1870 1865 - 1925 1885 - 1940 2008 -2061
285

Oromia Agricultural Research Institute (IQQO), Crop research Proceeding 2017
Disease data collection proceduresData was collected on incidence, severity and prevalence of major coffee diseases for each selected coffee mother trees following formula or procedures developed by different authors.CBD, CWD and BDB incidence assessmentIn each visited farm, fifty (50) trees were observed in a diagonal line across the farm for thepresence or absence of symptoms of coffee berr> disease (CBD), coffee wilt disease (CWD),branch dieback (BBD ) and others. Total numbers of infected and healthy trees were counted. Theincidences of the diseases were calculated as a ratio of infected number of mother trees over thetotal number of observed trees as follows:
, „ Total infected treeIncidence (% ) = — ---- — — X 100Total observed treeCBD and BDB severity assessment: A sample size of 10 trees with relatively uniform age was systematically selected at a distance of about 6-8 m within the selected farm. Each tree classified into three strata of branches (top, middle and bottom). From each stratum two branches were selected to record disease severity. Disease damaged and healthy berries/branches were counted and then percentages of diseased berries/branches over total counted berries/branches were computed as severity as follows:
Total infected berries/branchesSeverity (% ) = — ------— —— :— —--- — X 100Total ocounted bernes/branchesC LR incidence, severity and SLD assessment: Ten (10) coffee trees were randomly selected
from each farm. Three pairs of branches representing upper, middle and lower canopy layers of thetree were also selected for the assessment. Rust incidence expressed in percentage was determinedas the number of diseased leaves per branch. Thus, total of 60 pairs of leaves were collected fromeach farm in plastic bags. Severity and sporulation density (SLD ) were recorded. Finally rustseverity was measured as the proportion of leaf area rusted using diagrammatic scale, 1, 3, 5, 7 &10 indicates 1%, 3%, 5%, 7% and 10% of leaf area rusted, respectively. Any rust severity on theleaves was estimated by an average number of pustules per leaf making a cumulative count of eachsporulation lesion area following the Kushalappa and Chaves (1980) procedure (Figure 2). At thesame time, sporulation lesion density (SLD) was measured as number of sporulated lesions perinfected leaves. Severity is total sum of leaf area rusted.Data analysisThe data were summarized on excel spreadsheet software and the mean disease incidence, severity and SLD were computed for each coffee tree. Completed questionnaires were entered into Microsoft Excel spread sheets where variable codes assigned. Data were then analyzed using Statistical Package for Social Sciences (SPSS). Disease infections were also tested for agro ecological variation, agronomic practice, shade type and farm slope.
286

Oromia Agricultural Research Institute (IQQO), Crop research Proceeding 2017
Results and DiscussionIncidence and severity of the disease: The result showed that, CBD was very severe problem at the high land of Bedeno followed by Boke district, where as CLR was sever at Boke followed by lowland of Bedeno (Table 2). CWD infection was observed only in Daro Labu district at very low level (less than 3% with overall average infection of 0.92% and ranges from 0-20%) (Table2). The incidences of CBD, CLR & BDB were very high across all study areas with a mean value of 66%, 33% and 47% respectively, (Table2). The significant variation on incidence and severity were observed among the agro-ecology (Table 2 and Figure 3-5). The mean incidence of CBD ranged between 35. 5% at Daro Labu and 79.67%at Bedeno where as the severity of the disease varied between 18.5 % and 44.7% at Daro Labu and Bedeno, respectively (Table 2). This shows an increase in disease pressure in comparison with 2010 in which mean incidence ranged between 33.75% at Daro Labu and 70.19% at Bedeno and the severity of the disease varied between 6.34% and 28.53% at Daro Labu and Bedeno, respectively (Mohammedsani, 2011). Similar trend can also be observed from the reports of Eshetu et al. (2000) where the average severity of CBD was 32 % in 1997. High incidence of CBD may be explained by the recurrent climate change with high/low rainfall in all study areas. Similarly, Cook (1975) explained that, in general, high rainfall, high humidity or wetness and relatively low temperature persisting for long period favors CBD development at high altitudes. Fluctuation of climate in the coffee growing area resulted in reduction in the yield and quality, increasing the outbreak of pests and diseases, increasing cost of production and reduced area of production.Table 2. Mean incidence and severity of major disease across major coffee growing districts of Hararghe during 2015 cropping seasonDistrict Incidence (% ) Severity (% )name CBD CLR BDB CWD CBD BDBD/Labu 35.50 14.09 43.33 2.83 18.52 23.81Habro 75.50 20.41 56.00 0.00 25.41 24.47Boke 72.17 50.26 73.67 0.00 26.09 40.20Bedeno 79.67 46.49 15.17 0.83 44.72 10.09Mean 65.71 32.81 47.04 0.92 28.68 24.64Range 0-100 0-75 0-100 0-20 0-89 0-74Std. Dev. 27.52 25.23 29.66 3.74 18.27 19.19The three diseases (CBD, CLR and BDB) occurred across all the districts in all the agro ecologies with variable ranges of incidences and severities (Table 2 and 3). This indicates that the diseases are very important in both lowland and highland coffee growing agro ecologies of Hararghe and may cause significant yield loss. Such disease occurrence may cause considerable yield losses in the study areas. According to Biratu (1995) yield losses due to CBD was 52.5 % and can be as high as 100% (total loss) in some individual farm plots in Habro district (West Haraghe). Similarly, Biratu (1998) reported that coffee cultivation has been hampered by CBD that decreased the annual coffee production by an average of 47%. As MCTD (1989) reported, the national coffee yield loss due to CBD was about 20%. According Silva et al., (2006) CLR may cause yield losses varying between 10-40% in different countries.
287

Oromia Agricultural Research Institute (IQQO), C 'rop research Proceeding 2017
Table 2. Regional and ecological variation on the Severity of major coffee disease in Hararghe areas
Districtname
Severity of different diseases per agro-ecology (% )Highland Midland Lowland
CBD CLR BDB CBD CLR BDB CBD CLR BDBD/Labu 29.87 1.72 7.46 11.06 2.12 24.72 14.62 0.92 39.25Habro 32.07 8.24 19.36 18.41 0.18 28.94 25.76 8.16 25.11Boke 22.40 7.74 50.53 33.98 9.91 27.90 21.89 7.03 42.16Bedeno 64.23 2.61 4.98 41.91 14.91 6.67 28.02 12.15 18.64Mean 37.14 5.08 20.58 26.34 6.78 22.06 22.57 7.07 31.29Range 0-86.8 0.02-
170-
56.5 0.23-65 0-19.3
0-48.2
0.2-35.97
0.25-18.8
3.37-74.1
Std. Dev. 24.14 5.01 19.64 15.81 6.91 15.15 9.52 5.98 21.60
150
100
50
Highland Midland Lowland
D/Lab u Habro Boke Bedeno
Figure 3. CBD incidence across each-agro ecology per districtCLR severity and sporulation density (SLD) was high at Bedeno followed by Boke district and the minimum values was recorded from D/Labu district with the overall mean of about 6% and 4% of severity and SLD (Figure 5).
CBD C LR Disease types
BD B
HighlandMidlandLowland
Figure 4. Incidence of CBD, CLR & BDB per coffee grow ing agro-ecology of Hararghe regions
15
10
5
0Boke Bedeno Habro D/Labu Mean
288
. i
Oromia Agricultural Research Institute (IQQO), Crop research Proceeding 2017
un-shaded coffee farms (Table 4). Shade tree was best in reducing the incidence and severity of CBD and BDB. Although, CLR incidence was lower under shade, rust severity was higher compared to un-shaded coffee (Table 4). The shades may serve as a barrier for inoculum; hence reduced incidence. But the microclimate of the shade may favor growth and development of the pathogen once infection occurs hence higher severity. Similarly agronomic management practice shows different effects on the severity and incidence of the disease (Table 5). Accordingly, cultivation of coffee farm as practiced by most of Hararghe farmers can reduce more disease occurrence that all other management practice. Well managed pants are generally resistant and/or tolerant to diseases.Table 4. Effect of coffee shade on the mean Incidence and severity of different coffee diseases
Incidence (% ) Severity (% ) CLRShade type CBD CLR BDB CBD CLR BDB sporulation
densityUn-shaded 66.35 33.32 57.76 26.05 6.08 30.62 3.94Shaded 64.14 31.57 21.00 35.07 6.85 10.12 4.72Mean 65.71 32.81 47.04 28.68 6.31 24.64 4.17
Table 5. Effect of agronomic practices on the disease infestation
Agronomicpractice
Incidence (% ) Severity (% ) CLRCBD CLR BDB CBD CLR BDB Sporulation
densitySlashing 81.00 31.30 25.70 44.70 6.20 23.20 4.29Cultivation 46.73 23.33 46.73 24.17 3.87 21.43 2.43Intercropping 69.48 36.46 51.29 27.29 7.18 26.06 4.76Mean 65.71 32.81 47.04 28.68 6.31 24.64 4.17
Farmers’ Coffee varieties: Farmers in the study areas still depend on the heterogeneous local land race cultivars, which are known by different vernacular names. This shows that; farmers in the area have their own local names to distinguish the coffee types grown on their farms. There are six locally known agro-types, which have distinct difference in morphology, yield, resistant to the disease and agronomic characteristics (Table 6). The names are derived from the name of the first collector or introducer, the area of collection, or the agronomic characteristics of each coffee type. Farmers grow a minimum of two local varieties in their individual orchards based on their tolerance to moisture stress, resistance to disease and pests. Accordingly, for the low altitude, where CBD prevalence is low, but high temperature and shortage of moisture is problem, they grow more adapted land races, such as Shumbure and Mayra. However, although cultivars are known to be inferior in terms of their productivity, in the CBD prone areas, they grow less susceptible cultivars such as, Shumbure. Charcharo and Wagare. But, all the respondents are very interested to plant high-yielder, disease resistant and drought tolerant adaptable improved coffee varieties. Improving new cultivars resistant to pests and diseases, more productive, well adapted to the local climatic and soil conditions, and have acceptable and desired quality for the market is very important.
289
Oromia Agricultural Research Institute (IQQO), Crop research Proceeding 2017
Table 6. Local coffee Iandraces growing by the farmers in the study areas.
No. Local name Frequency Percentage1 Shumbure 33 68.82 Cherchero 5 10.43 Shunkiyi 5 10.44 Abadir 2 4.25 Wagare 2 4.26 Muyra 1 2.1
Conclusion and recommendationThe finding indicates that four coffee diseases CBD, CLR, CWD and BDB are the major diseases in all the districts. Their incidence and severity varied among and within the areas based on the agro-ecological conditions and production system of coffee. All the areas are increasingly threatened by the diseases where there is considerable coffee berry, leaf and bearing branch Josses, respectively across all location and agro ecology. However, the current study showed that even if CWD was reported in earlier times on coffee Arabica in Ethiopia, the survey result showed very low incidence across the coffee production areas as compared to higher incidence in plantation and garden coffee, attributed to variation in resistance among the coffee germplasm and low intensity cultural practices in the forest. Generally, coffee production potential of Harerghe areas has been highly decreasing & changing to khat due to the above all mentioned results.Therefore, for producing sustainable, environmentally friendly organic coffee fetching premium price to farmers, integrated management of diseases should be given attention. Research should be strengthened in coffee disease protection by developing disease resistant cultivars as long-term solution. Farmers’ indigenous knowledge needs to be explored; and ultimately all practices integrated with research work. As a last and short term option research should also be focused on appropriate chemical efficacy test for disease control. This in turn could help to increase income generation of coffee producers in specific & to the country in general: thereby increase foreign currency eaemings.ReferencesBelete, Y., Belachew, B. & Fininsa, C. (2014). Performance evaluation of indigenous Arabica
coffee genotypes across different environments. Journal o f Plant Breeding and Crop Science 6: J 7 J-J 78.
Cook, R.T.A. 1975. Screening coffee plants for resistance to CBD. Coffee Research Foundation Kenya. Annual Report 1973/4.
Ebisa Dufera Bongase (2017). Impacts of climate change on global coffee production industry: Review. African Journal of Agricultural Research, Vol. 12(19), 1607-1611.
Eshetu D., Teame G. and Girma A., 2000. Significance of minor coffee diseases of Coffea arabica L. in Ethiopia; a review. In: Proceedings of the workshop on control of coffee berry disease in Ethiopia, 13-15 August 1999, Addis Ababa, Ethiopia. Pp 58-64.
ICO (2015). Historical Data on the Global Coffee Trade. International Coffee Organization (ICO) Website: http://www.ico.org/new historical.asp?section=Statistics
Kushalappa, A.C. and Chaves, G.M. 1980. An analysis of development of coffee rust in the field.Fitopatologia Brasileira 5: 95-103.
Rutherford M. A. and Pbiri N. (2006). Pests and Diseases of Coffee in Eastern Africa: A Technical and Advisory Manual. CAB International, Wallingford, UK)
Silva M.C., Varzea V., Guerra-Guimaraes L., Azinheira H.G., Fernandez D, Petitot A.S., BertrandB., Lashermes P. and Nicole M. 2006. Coffee resistance to main diseases: leaf rust and coffee berry disease. Brazilian journal of plant physiology, 18(1) 119-147.
290

Oromia Agricultural Research Institute (IQQO), Crop research Proceeding 2017
Determining the impact of mulching practices on the early survival and subsequent growth performances of newly transplanted coffee seedlings
Mohammedsani Amin*1. Ahera Jaleta' and Hika Bersisa'1Mechara Research Center, Coffee Research Team. Mechara. Eastern Ethiopia
*Corresponding Author's email: mamasaniaminfr/ \ ahoo.comAbstractThe current global temperature has been increasing over the years due to recurrent climate change and variability, which directly or indirectly affects the agriculture sector. This has made the necessity for farmers to get the best out of the varying rainfall amount and distribution.Experiments were conducted with the objectives of identifying effective mulching materials and their optimum mulching thicknesses for newly transplanted coffee seedlings at Mechara Agricultural Research Center (MARC) on-station and Sakina on-farm during 2015 and 2016. Coffee seedlings of Mechara-1 variety and organic mulching materials of maize stover and vetiver grass at 5 cm and 10cm mulching depths were compared with farm ers' practices of using soil as mulching material and no mulch bare soils. The experiment was laid out in RCBD with three replications.Data were analyzed for seedling survival rate.soil moisture content, moisture stress score, weed density and subsequent early growth performance of the coffee seedlings under the different mulching treatments. The resultsshowed that there are statistically significant differences (p <0.05) among the treatments for most parameters studied at both locations and seasons. The highest seedling survival rate, soil moisture contentand different growth parameters, and the minimum moisture stress score were recorded for coffee seedlings treated with maize stover and vetiver grass mulches compared to the no-mulch bare soils and farmers' practices of using soil as a mulching material. However, vetiver grassmulches applied at 5cmmulching thickness resulted in the highest combined over location and season percentage of coffee seedling survival rate (94.6%).soil moisture content (16.5%), the lowest moisture stress score (1.5)and the highest mean values of the different early growth measurements of coffee seedlings. Weed species and their densities were lowest of all under coffee seedlings treated by maize stover mulches at 10cm mulching depth. Therefore, from these results, mulching newly transplanted coffee seedlings with vetiver grass at 5cm mulching depth can be recommended to farmers in Daro-Labu district and similar moisture stress areas of Haraghe as this practice conserved soil moisture resulting in better seedlings survival through increasing their tolerance to moisture deficits.
Keywords: Vtiver grass; maize stover; survival rate; soil moisture; moisture stress, coffee seedlings
IntroductionCoffee (Coffee Arabica L.) is a non-alcoholic stimulant beverage crop that belongs to the family Rubiaceae and genus Coffea(CFC, 2004). Growing coffee provides income for about 25% of Ethiopia's population and is the country's top export (NPR , 2017).The country is the largest African producer of Arabica coffee. The crop is the backbone of the country's economy in which more than 15 million Ethiopians depend on it for living (NPR. 2017). Coffee accounts for more than 25% of the GNP, 40% of the total export earnings, absorbing 25% of the employment opportunity for both rural and urban dwellers, and 10% of the total government revenue GD P (CFC, 2004).Currently, the effects of climate change; higher temperatures and rainfall variability could take a toll on the country's ability to farm this treasured crop. And the frequency of droughts has increased in recent years, affecting coffee growing regions as well. Ethiopia could lose from 39 to 59% of its current coffee-growing areas to climate change by the end of the century, according to a new study published in Nature Plants (NPR, 2017).Despite the favorable climatic conditions, diversified genome and long history of its production in Ethiopia, coffee genetic erosion is increasing from time to time due to climate change.The traditional farmer depends entirely on rainfall as a source of moisture forcoffee productionin Ethiopia. But in the recent past, frequent droughts of varying
291

Oromia Agricultural Research Institute (IQQO), Crop research Proceeding 2017
degrees have been experienced in the tropics (Norman et al., 2011).According to the study, Ethiopia's coffee-growing areas could expand despite climate change, if farmers moved their farms to higher altitudes and adopted other mitigation strategies such as irrigating and mulching. Currently, the most severe stress conditions (wilting and curling of leaves, loss of coffee crop, and plant death through drought) were recorded in the Hararghe coffee growingenvironments. In many Hararghe coffee gardens, cultivation appeared to be lacking suitable farming practices such as mulching and/ terracing or irrigation required for growing coffee in this area which, due to low rainfall, is not ideally suited to coffee production (Moat et al., 20l7).0ne ofthe most important methods of moisture conservation is use of mulches. The use of mulch in coffee farms has been on the increase over the years especially during the first few years after transplanting seedling. Mulching is the covering of the soil with different materials (e.g. grass, compost, manure) not only helps to preserve soil moisture and decrease soil temperature (reducing evapotranspiration), but it can also increase soil fertility, suppress weeds, and improve rainfall penetration into the ground. Mulching has been used to good effect in Kenya, Tanzania and other countries in East Africa (Moat et al., 2017). Hararghe is one of the areas currently under influence of climate change. It is moisture deficit area. In addition the tradition of using different mulching materials such as grass, maize and sorghum stovers, banana leaves, wood barks, coffee husk and etc. is not well adapted by Hararghe coffee growing farmers. The mulching thickness of these materials is also not yet identified in the area. There is no any research output in the area for what type and how much to apply. As a result of these problems early survival of transplanted coffee seedling is becoming the most limiting factor for coffee production to the crop growing farmers of the area. Thus, scientific researchesare required to ascertain the precise outcomes and benefits of on-farm interventions for better coffee production and productivity in coffee growing environments of Hararghe. Therefore, field experiments were established with the objectives of identify ing effective mulching materials and to determine their mulching thicknessesthat can improves the survival rate of transplanted coffee seedlings for increased productivity.Materials and MethodsDescription of the Study Area: Experimentswere conducted at Mechara Agricultural Research Center (MARC) on-station and Sakina on-farm during 2015 and 2016 cropping seasons.Geographically, Mechara is located 434 km east of Addis Ababa in Daro-Labu district of west Hararghe Zone of Oromia National Regional State. It has analtitude of I760meters above sea level with annual average temperature and rainfall of I6°c and 963 mm, respectively. The major soil type of the center is sandy loam clay, which is reddish in color.Sakina is 22km away from Mechara, found at an elevation of 1711 meters above sea level. It is categorized as one of the low land environmentsin the Daro-Labu district.Experimental Materials, Treatments and DesignsThe experiments at both locations were made up of four mulching treatments of maize stover and vetiver grass with different mulching thicknesses. These treatments were compared with the usual soil mulching farmers’ practices and no mulch treatments. The treatments were arranged in randomized complete block (RCB) design with three replications at both locations across the cropping seasons. Amongrecently released improved Hararghe coffee varieties, Mechara-/variety, which is recommended for the area, was used as a test material.Experimental Procedures and Methods of Application: Seedlings of Mechara-lcoffee variety were raised in polyethylene bag at MARC nursery site. After the seedlings grown and produced 8 true leaves, they were transplanted to the experimental fields in to already prepared planting holes in the month ofAugust 2014. The mulching treatment materials were applied at the end of September which is characterized by the termination of rainfall and start of dry season. The mulch
292

Oromia Agricultural Research Institute (1000), Crop research Proceeding 2017
treatments were kept under the seedlings until the commencement of early Ae/grain (end of March 2015 and 2016). All other agronomic and cultural practiceswere uniformly applied to the treatments as per recommendations. The mulching materials were applied by spreading under the transplanted coffee seedlings as per their mulching depths at 10cm distances away from the trunk of the seedlings/tree.Data and Methods of CollectionsData for seedling survival rate, soil moisture content, moisture stress score, weed density and species, soil property, and growth performance of the seedlings were collected from each treatment at different time intervals. The methods of data collection were as follows:Coffee seedling survival rateThe total number of survived and dead seedlings throughout the dry period from the time ofmulchingai the end of September 20l4to the beginning of rainy season (end of March 2015) wererecorded for all the treatments at both experimental locations. The percentages of dead seedlingsfrom the total number of seedling at early application of mulching materials per plot andtreatmentswere calculated using the following formula.
No. of diedseedlinqsatendofdryperiodSeedling Survivalrate (% ) = —-- ;--- —-------- ---- — :--- ---— — X 100
Total seedlings at early application of mulchingSoil moisture contentSoil sampleswere collectedat a depth of 40cm and fresh weight the soil samples were recordedusing sensitive balance. These soil samples then were subjected to oven dry at I05°c for 72 hours.The dry weights of the oven dried soil samples were recordedto calculate the percentage of soilmoisture content per plot and mulch treatments as follows:
Freshw eightofsoil(gm ) — Dryweightofsoil (gm)Soi/moisture (% ) = ----------- -----—— 7— — ------------------- c----- X 100Dryweightofsoil (gm)
The soil moisture content data wererecordedat 30 days interval throughoutthe dry period extendingfrom end of September to March across the experimental years to determine the moistureconservation efficiency of each mulching treatment.Moisture stress score (1-5 scale): Moisture stress scoreswere recorded from all plants per experimental plotstwice per day early in the morning and late at noon at monthly interval for four consecutive times along with soil sample collections for soil moisture content measurement immediately after application of the mulching materials lasting throughout the dry period of each experimental season.A scale of I to 5 was used to score the moisture stress wherel=all leaves green and turgid; 2- most leaves still turgid but younger leaves show leaf folding; 3= all leaves wilt or fold; 4- leaves partially turning pale and partly shed showing severe wilting; and 5=leaves completely turning brown, dry and mostly dropping.Weed species and density: The number of weeds and species emerged per plot was recorded twice before the application of mulching treatments and at the end of the dry period. This was done by listing the names and counting the number of emerged weeds per species under three sample coffee seedlings which covered an area of 2500cm" per experimental plots.Seedling growth performance: Coffee seedling growth performance data were recorded for total seedling height, stem diameter (girth), number of primary branches, and canopy diameter from five central representative seedlings/trees per plot.Total height (TH): The length of the plant starting from the ground level to the tip of the tree on main stem was measured using tape meter.Girth (mm): the girth (stem diameter) of coffee tree on main stem was measured using digital caliper at 10cm from the ground level.Number of primarybranches (NPB): Total number of primary branches was counted per tree.
293

Oromia Agricultural Research Institute (IQQO), Crop research Proceeding 2017
Canopy diameter CD. averagelength of tree canopy was measured from east-west and north-south direction, from the widest portion of the tree canopy.Data AnalysisAnalysis of variance (ANOVA) was computed for all collected data using GenStat 15th edition. Treatment means were separated using fishery’s protected least significant difference method (LSD) at 5% probability level for statistically differentmeans.Results and DiscussionThe effect of mulchingmaterials and mulching thicknesseson seedling survival rate: Theanalysis variance showed statistically significant different percentage of seedling survival across locations in 2016 while non-significant in 2015 cropping seasons. But, the combined analysis of variance across seasons and locations resulted in statistically different (p<0.05) for the measured percentage of seedling survival rates (Table I). Accordingly the highest combined mean seedling survival rate (94.6%) was recorded bycoffee seedlings received vetiver grass at 5cm mulching thicknessacross the growing seasons followed by the same mulching material at 10cm mulching depth (Table 1). The least seedling survival rates were recorded from plots with no mulch followed by the farmers' practices of using soil mulch.The reason for the highest seedlings survival rates recorded under vetiver grass mulches at 5cm mulching thicknesscould be due to the fact that the mulches allowedseedling roots to extend, grow and establish deep in to the soil through conserving moisture compared to bare soils. The result of experiment is in line with that ofLinda (2007) who reported seedling root development and density were greatest under organic mulches compared to bare soil.The effect of mulching materials and mulching thicknesses on soil moisture content: Theanalysis of variance for soil moisture content showed statistically significant differences (p<0.05) among the mulching treatments across seasons at Sakina on-farm while the 2015 results were statistically non-significant for MARC on-station (Table 2). The combined analysis of variance for soil moisture content, however, resulted in statistically significant differences across the cropping seasons and experimental locations (Table 2). Accordingly, statistically the maximum pooled mean percent (16.5%) of soil moisture content across locations and seasons was recorded for soils of coffee seedlings mulched with vetiver grass at 5cm mulching thickness. This result is supported by findings of different authors (SinkeviCienee/ al..2009; Taparauskiene and Miseckaite, 2013; Bert and Cregg, 2009; Nkansaht?/. a l 2003) who reported organic mulching increased soil moisture content compared tobare soils under transplanted seedlings.Effects of mulching materials and mulching thicknesseson moisture stress score The analysis of variance for moisture stress showed statistically significant differences (p<0.05) among the mulching treatments across the experimental seasons at Sakina on-farm while the 2015 results were statistically non-significant for MARC on-station (Table 2). However, the combined analysis of variance for moisture stress resulted in statistically significant differences across the cropping seasons and experimental locations (Table 3). Statistically the least pooled mean (1.5) score of moisture stress across locations and seasons was recorded from coffee seedlings mulched with vetiver grass at 5cm and 10cm mulching thicknesses.Effects of mulching materials and mulching thicknesseson weed suppression : The analysis of variance for weed species and density for growing seasons and location showed statistically significant differences (p<0.05) among the mulching treatments (Table 4). Similarly, the combined analysis of variance for weed species and densities resulted in statistically significant differences across the cropping seasons and experimental locations (Table 4). Statistically the lowest mean number of weed species (2 and 2.3) and (0.3 and 1.6) were recorded in coffee seedlings mulched by maize stover at 10cm and 5cm mulching thicknesses, respectively at both locations. But weed
294

Oromia Agricultural Research Institute (IQQO), Crop research Proceeding 2017
densities were all low in coffee seedlings received either maize stover or vetiver grass at both mulching thicknesses compared to the farmers’ practices of using soil as mulching material and the bare soil with no mulch (Table 4). Similarly, the pooled means of both the number of weed species and their densities were significantly reduced in coffee seedlings mulched with both maize stover and vetiver grass for both thicknesses compared to the control mulching treatments. The results of this study is in support of the findings achieved by (Salman et al., 2015; Edyta, 2014; Linda, 2007; and Norman et al., 201 l)who also reported that organic mulching reduces weed infestation and enhances growth and yield of crops.Effects of mulching materials and mulching thicknessesonearlygrowth performance of the seedlings: The analysis of variance for early seedling growth performances showed statistically significant differences (p<0.05) among the mulching treatments at Sakina on-farm across both cropping seasons (Table 5). Statistically the highest mean values for plant height, stem diameter (Girth) and seedling canopy diameter were achieved for coffee seedlings mulched by vetiver grass at 5cm mulching thicknesses in 2015and 2016 but the highest seedling canopy diameter was also recorded under vetiver grass mulches at 10cm mulching thickness in 2016 for the on-farm research experiment (Table 5). In contrast, statistically the highest mean number of primary branches were achieved by coffee seedlings treated with maize stover mulches at 5cm and 10cm mulching thicknesses in 2015 and mulching of maize stover at 10cm mulching thickness in 2016 for Sakina on-farm. However, most of the mulch treatments are statistically at par among each other but superior to the no mulch treatment control and farmers’ practices of using soil as a mulching material for growth performance parameters.The analysis of variance for early seedling growth performances showed statistically significant differences (p<0.05) among the mulching treatments in both 2015 and 2016 experimental seasons except for stem diameter (girth) in 2015 at MARC on-station (Table 6). All the mulching treatments showed statistically superior coffee seedling growth performances to the no mulch and farmers’ practices with vetiver grass mulching at 5cm mulching thickness resulted in the highest measurements of the growth parameters (Table 6). The results of the study conducted at both experimental locations in 2015 and 2016 on the coffee seedling growth performances as affected by the mulching materials and thicknesses are in line with other similar studies (Linda, 2007; Manuel et al., 2000; Thakur et al., 2000; Norman et al.. 2002; Nkansahe/ al.. 2003; Gandhi and Bains, 2006; Moniruzzaman, 2006; Awodoyin, 2007; Ojeniyie/' al.. 2007; Iftikhare/ al., 2011; Dauda, 2012; Norman et al., 2011) who reported that mulching enhanced early growths of transplanted seedlings through improvingseedling survival and enhancing root establishment of the seedlings as mulches provide improved soil moisture conservation, reduced soil temperature, reduced weed infestation and nutrient availability as a result of reduced leaching of nutrients.Conclusions and RecommendationsThe results of these experimental researches from both locations across the experimental years indicated that soil moisture content, survival rates of transplanted coffee seedlings, early growth performances, moisture stress scores and weed suppression were significantly influenced by mulching materials and mulching thicknesses. Sotlsreceivedvetiver grass mulch at 5cm mulching thickness retained significantly the highest percentage of seedling survival rates (94.6%) and soil moisture (16.5%) compared to soils under no and soil mulches treatments. This mulching practice also significantly reduced the impact of moisture stress to the transplanted coffee seedlings resulting in the lowest moisture stress score of 1.5.The mulching treatments also significantly affected the early growth performances of transplanted coffee seedlingswherevetiver grass mulch at 5cm mulching thickness achievedvigor growths. Superior pooled means of plant height, stem diameter (girth), number of primary branch and
295

Oromia Agricultural Research Institute (IQQO), Crop research Proceeding 2017
seedling canopy diameter were recorded bytransplanted coffee seedlings treated with vetiver grass mulch at 5cm mulching thicknesses. In general, the studies confirmed mulching newly transplanted coffee seedlings by vetiver grass mulches at mulching thickness of 5cm exhibited highest seedling survival rates, improved soil moisture contents, reduced moisture stress effects, vigor seedling growth performances and reduced weed infestations. Therefore, coffee growing farmers in Haraghe zone where rainfall variability causes moisture stress the limiting factor for the production of the crop, the use of vetiver grass as mulching material at 5cm mulching thickness through spreading the grass within 30cm radius and 10cm away from the trunk of newly transplanted coffee seedlings/tree starting from end of September when rainfall terminates every growing season for increased production and productivity. Immediate on-farm demonstration and pre-scaling up activities should get due attention to take this result to the end users.
Table 1. Effect of mulching materials and thicknesses on survival rate of newly transplanted coffee seedlings at MARC and Sakina
TreatmentSeedling Survival rate (% )
MARC on-station Sakina on-farm 2015 2016 Means 2015 2016 Means
Combinedmeans
Maize stover mulch 5cm thickness 100 93.30a 96.70a 85.0 66.7ab 75.8ab 86.3abcMaize stover mulch 10cm thickness 100 88.3ab 94.3ab 83.3 66.7ab 75.0ab 84.6abcVetiver grass mulch 5cm thickness 100 96.70a 98.30a 95.0 86.7a 90.8a 94.600aVetiver grass mulch 10cm thickness 100 96.70a 98.30a 88.3 75.0ab 81.7ab 90.00abSoil mulch (farmer practice) 99.0 76.7bc 87.8bc 85.0 61.7ab 73.3ab 80.60beWithout mulch (control) 96.7 74.00c 85.30c 85.0 48.0b 66.5b 75.009cMean 99.3 87.7 93.5 86.9 67.5 77.1 85.3LSD (5%) NS 13.4 6.4 13.7 32.1 21.2 12.3CV% 1.9 8.4 3.8 8.6 26.2 15.1 7.9Means with the same letters in a column are non-significant at 5% probability level. NS=Non- significantTable 2. Soil moisture content as affected by mulching materials and thicknesses under newly transplanted coffee seedlings at MARC on-station and Sakina on-farm
Soil moisture content (% ) by location and yearCombine d meanTreatment MARC on-station Sakina on-farm
2015 2016 Mean 2015 2016 MeanMaize stover mulch 5cm thickness 11.1a 10.7c 11.0b 18.2ab 8.4bc 13.3b 12.1 beMaize stover mulch 10cm thickness 11.1a 11.6bc 11.4b 22. lab 8.4bc 15.5ab 13.3bVetiver grass mulch 5cm thickness 11.1a 17.4a 14.3a 26.1a 11.4a 18.7a 16.5aVetiver grass mulch 10cm thickness 11.1a 12.6b 11.9b 22. lab 8.8b I5.9ab 13.7bSoil mulch (farmer practice) 10.1a 8.73d 9.9c 14.9b 7.2cd 11.1b 10.8cWithout mulch (control) 7.3b 7.48d 7.3d 14.9b 6.4d 12.9b 9.8cMean 10.3 11.4 11.0 19.7 8.4 14.6 12.7LSD (5%) 2.7 1.7 1.31 10.7 1.4 5.3 2.6CV% 14.4 8.4 6.6 28.9 9.5 20.3 11.4
Means with the same letters in column are non-significant at 5% probability level.
296
Oromia Agricultural Research Institute (IQQO), Crop research Proceeding 2017
Table 3. Effect of mulching materials and thicknesses on moisture stress tolerance for newly transplanted coffee seedlings at MARc on-station and Sakina on-farm
T reatmentMARC on-station Sakina on-farm Combined
mean2015 2016 Mean 2015 2016 MeanMaize stover mulch 5cm thickness 1,2ab 2.4b 1.8bc 2.9bc 2.2b 2.6b 2.2bMaize stover mulch 1 Ocm thickness 1.0a 2. lab 1.6ab 3.2c 2.2b 2.7b 2.2bVetiver grass mulch 5cm thickness 1.0a 1.6a 1.3a 1.5a 1.8a 1.6a 1.5aVetiver grass mulch 10cm thickness 1.0a 1.8a 1.4ab 1.6a 1.5a 1.5a 1.5aSoil mulch (farmer practice) 1.5bc 2.0ab 1.8bc 3.2c 2.4bc 2.8b 2.3bWithout mulch (control) 1,8c 2.5b 2.2c 1.8ab 2.7c 2.3b 2.1bMean 1.27 1.98 1.66 2.08 2.22 2.17 1.74LSD (5%) 0.4 0.5 0.4 1.1 0.4 0.6 0.4C.V (% ) 21.9 14.2 13.7 26.5 10.1 15.7 11.2
M eans w ith the sam e letters in a column are n onsign ifican t at 5 % probability’ level.
Table 4.Total weed density and weed species emerged as affected by different mulching materials and thicknesses ___Treatments Weed Species Weed Densities
MARCon-station
Sakinaon-farm
Mean MARCon-station
Sakinaon-farm
Mean
Maize stover mulch 5cm thickness 2.3a 1.6ab 2ab 5.3a 6.3a 5.8aMaize stover mulch 10cm thickness 2.0a 0.3a 1.2a 3.0a 2.7a 2.8aVetiver grass mulch 5cm thickness 4.0ab 2.3ab 3.2 be 12.0a 4.0a 8.0aVetiver grass mulch 10cm thickness 5.7bc 3.0bc 4.3cd 15.3a 7.7ab 11.5aSoil mulch (farmer practice) 6.7bc 5.0cd 5.8de 34.7b 19.3bc 27bWithout mulch (control) 7.0c 6.0d 6.5e 41.7b 21.3c 31.5bMean 4.6 3.0 3.8 18.7 10.2 14.4LSD (5%) 2.9 2.1 1.8 17.6 12.1 10.3CV% 34.4 37.6 26.2 51.8 37.0 39.5M eans w ith the sam e letters in column are nonsign ifican t at 5 % probability’ level.
Table 5. Early growth performance of newly transplanted coffee seedling as affected by mulching materials and thicknesses at Sakina on-farm
2015 2016T reatment PH Girth NPB CD PH Girth NPB CD
(cm) (mm) (cm) (cm) (mm) (cm)Maize stover mulch 5cm thickness 41.3ab 6.33b 9.40a 17.7b 80.7ab 19. lbc 20.3abc 75.4abMaize stover mulch 10cm thickness 38.6ab 6.27b 9.40a 19.5b 90.6a 18.3bc 23.9a 73.0abVetiver grass mulch 5cm thickness 43.6a 8.33a 9.20ab 27.4a 90.4a 23.4a 21.4ab 84.4aVetiver grass mulch 10cm thickness 39.6ab 6.60b 8.93ab 19.9b 91.9a 19.6ab 21.lab 85.9aSoil mulch (farmer practice) 29.8bc 5.47b 8.13ab 18.3b 73.9b 15.4bc )8.5bc 66.7abWithout mulch (control) 26.4c 5.73b 6.87b 19.3b 74.0b 14.9c 15.4c 60.6bLSD (5%) 11.54 1.44 2.4 5.23 14.48 4.39 5.27 22.94CV% 17.40 12.30 15.20 14.10 9.50 13.10 14.40 17.00
M eans w ith the same letters in column are nonsign ifican t at 5 % p rob ab ility leve l; Key: PH = P lan t height; N P B ; num ber o f p rim ary branch; CD = Canopy diam eter
297

Oromia Agricultural Research Institute (IQQO), Crop research Proceeding 2017
Table 6. Early growth performance of newly transplanted coffee seedling as affected by mulching materials and thicknesses at MARC on-station
2015 2016Treatment PH
(cm)Girth(mm
)NPB CD
(cm) PH(cm) Girth(mm) NPB CD
(cm)Stalk of maize with 5cm thickness 48.7ab 9.6a 8.4ab 32.4a-c 80.7abc 19. lab 20.3abc 75.4abStalk of maize with 10cm thickness 42.7ab 8.9a 7.2bc 31.3a-c 91,9ab 18.3ab 23.9ab 73.0abVetivar grass with 5cm thickness 52.1a 10.1a 9.2a 36.80a 97.1oa 21.10a 26.40a 91.10aVetivar grass with 10cm thickness 52.6a 9.9a 7.8a-c 35.7ab 85.2a-c 19.6ab 2!.Iabc 79.3abSoil mulch (farmer practice) 40.9b 8.5a 7.0bc 28.1bc 77.2bc 17. lab 18.5bc 66.7bWithout mulch (control) 39.3b 8.1a 6.4c 25.1c 70.7oc 14.90b 15.40c 57.3bLSD (5%) 11.11 2.60 1.90 8.57 18.24 5.05 6.95 23.35CV% 13.30 15.50 13.80 14.90 12.00 15.10 18.30 17.40Means with the same letters in column are nonsignificant at 5% probability level. Key; PH^plant height; NPB: number o f primary branch; CD=Canopy diameter
ReferencesAwodoyin R. O., Ogbeide F. I. and Olowe O., 2007. Effects of three mulch types on the growth
and yield of tomato (LvcopersiconesculentumM'xII.) and weed suppression in Ibadan, Rainforest-savanna Transition Zone of Nigeria. Tropical Agricultural Research and Extension..
Bert M. and Cregg, 2009. Weed control and organic mulches affect physiology and growth oflandscape shrubs. Hortscience, 44(5): 1419-1424.
CFC (Common Fund for Commodities), 2004. Improving coffee quality in east and CentralAfrica through enhanced Processing practices: A (CFC/1CO/22) Project for Rwanda and Ethiopia, Final Appraisal Report. The Netherlands, Amsterdam.
Dauda B.M., 2012. Effects of grassed and synthetic mulching materials on growth and yield of sweet pepper (Capsicum annumL.) in Mubi, Nigeria. Journal of Agricultureand Social Sciences, 8: 97-99.
Edyta K., 2014. The effect of soil mulching with organic mulches, on weed infestation in broccoli and tomato cultivated under polypropylene fiber, and without a cover. Journal of Plant Protection Research, 54:2.
Gandhi N. and Bains G. S., 2006. Effect of mulching and date of transplanting on yield contributing characters of tomato. Journal of Research. Punjab Agriculture, 43( 1): 6-9.
Iftikhar A., Zahoor H., Shuaib R., Noor-Un- Nisa M., and Summar A. N., 2011. Response of vegetative and reproductive components of chili to inorganic and organic mulches. Pakistan Journal of AgriculturalSc/ewe, 48( 1): 19-24.
Linda C., 2007. Impact of Mulches on Landscape Plants and the Environment: A Review. Journal of Environmental Horticulture, 25(4): 239-249.
Manuel C. P., Allison M. D„ and Stafford M. A. C., 2000. Comparison of organic and synthetic mulch for bell pepper production at three levels of drip irrigation. Proc. Fla. State Horticulture Society, 113: 234-236.
Moat J., Williams J., Baena S., Wilkinson T., Demissew S., Challa Z.K., Gole T.W., and Davis A.P., 2017. Coffee Farming and Climate Change in Ethiopia: Impacts, Forecasts,

Oromia Agricultural Research Institute (IQQO), Crop research Proceeding 2017
Resilience and Opportunities. -Summary. The Strategic Climate Institutions Program (SCIP). Royal Botanic Gardens, Kew (UK). Pp. 37.
Moniruzzaman M., 2006. Effects of Plant Spacing and Mulching on Yield and Profitability of mulch in arid region of India. Agrochemica. 31: 183-202.
Nkansah G. O., Owusu E. O., Bonsu K. O. and Dennis E. A., 2003. Effect of mulch type on the growth, yield and fruit quality of tomato (Lycopersiconesculentum Mill). Ghana Journal of Horticulture. 3: 55-64.
Norman J.C., Opata J., and Ofori E., 2011. Growth and yield of okra and hot pepper as affected by mulching. Ghana Journal of Horticulture, 9: 35-42
Norman J. C., Asante I., and Nartey I. T., 2002. Mulching effects on growth, partitioning and yield of sweet corn. Ghana Journal of Horticulture. 1: 16-20.
NPR. 2017. Coffee Farmers Are 'On the Front Lines of Climate Change' internet source at http://newsok.com/article/5553732
Ojeniyi S. O., Awodun M. A., and Odedina S. A., 2007. Effect of Animal Manure, Amended Spent Grain and Cocoa Husk on Nutrient Status, Growth and Yield of Tomato. Middle -East Journal of Scientific Research.2( 1 ):33-36
Salman A., Muhammad A.S.R., Muhammad F.S.,Syeda S.Z., Imran H.K., Muhammad A., Abdulmanan S., Rashid L, and Muhammad S.Z., 2015. Mulching Strategies for Weeds Control and Water Conservation in Cotton. ARPN Journal of Agricultural and Biological Science, 10: 8.
Sinkeviiiene A.,Jodaugiene D.,Pupaliene R., and Urboniene M., 2009).The influence of organic mulches on soil properties. Agronomy Research, 7(1): 485-491.
Taparauskiene L. and MiseckaiteO., 2013. Effect of Mulch on Soil Moisture Depletion and Strawberry Yield in Sub-Humid Area.Aleksandras Stulginskis University, Kaunas, Lithuania.
Thakur P.S., Anju T., and Kanaujia S. P., 2000. Reversal of water stress effects: Mulching impact on the performance of Capsicum annuumL.under water deficit .Indian Journal of Horticulture,57(3): 250-254.
299

IS BN 978-99944-72-02-4
9 789994 72024 >
P in
td
by
An
sol
pre
sste
ch
pic
0911
25
82
26