Bankable Feasibility Study Completed with Exceptional ... - ASX
244
ASX Release www.kaliumlakes.com.au Page 1 of 35 Tuesday 18 September 2018 Bankable Feasibility Study Completed with Exceptional Financial Outcomes Kalium Lakes Limited (Kalium Lakes) (ASX:KLL) is pleased to announce the completion of the Bankable (or Definitive) Feasibility Study (BFS) including an updated Ore Reserve for the 100% owned Beyondie Sulphate Of Potash Project (Beyondie SOP Project or BSOPP) in Western Australia. A summary of the highlights of the BFS are detailed below. For further information refer to the attached, JORC (2012) and NI 43-101 Technical Report – Bankable Feasibility Study, compiled by German Potash Experts and Competent Persons, K-UTEC AG Salt Technologies (K-UTEC). Highlights • Robust, Bankable Project: BFS confirms that Kalium Lakes’ 100% Owned, Beyondie Sulphate Of Potash Project (BSOPP), is technically and financially robust, with production anticipated in 2020. • 90% Increase in Ore Reserves: Based solely within the Stage 1 Approval Footprint (Figure 8), which represents less than a quarter of total lake surface area within the tenement package 1 : Proved Reserve of 1.65 Mt @ 13,830 mg/l SOP at a cut-off grade of 2,500mg/l K Probable Reserve of 3.49 Mt @ 11,820 mg/l SOP at a cut-off grade of 2,500mg/l K Measured Resource of 1.72 Mt @ 11,488 mg/l SOP Indicated Resource of 9.17 Mt @ 12,459 mg/l SOP Inferred Resource of 8.75 Mt @ 12,593 mg/l SOP • Increased Production Rates: The base case outcome of the BFS for the Beyondie SOP Project is a 164ktpa SOP operation. This is an increase of 10% on the Pre-Feasibility Study (PFS) based on (amongst other matters) an update to the Company's increased Ore Reserve, detailed brine extraction modelling, pilot scale pond and processing outcomes. After taking into consideration operational, SOP market and financing risk management perspectives, the Company has confirmed a phased ramp-up development scenario, starting with a commercial demonstration scale 82ktpa SOP operation, before ramping up to a 164ktpa full scale SOP production facility. • Extended Mine Life In Excess of 30 years 2 : Based on production of 164ktpa SOP, the extended mine life represents an increase of 7 years on the PFS estimated mine life. The Economic Evaluation excludes any production post 30 years from the Base Case Mine Plan. • Improved Financial Outcomes for the Base Case: Refer to Table 1 for details 3 . Pre-tax NPV 8 A$575M, IRR of 20% Average EBITDA of A$116Mpa, EBITDA margin of 61% A payback period of 7 years and Life of Mine (LOM) 30 years Free cash flows of more than +A$2B Based on CRU forecast US$606/t nominal average LOM SOP @ $A/$US exchange rate of 0.73. 1 Refer to Table 3, plus JORC Table 1 in the technical report titled "JORC (2012) and NI 43-101 Technical Report – Bankable Feasibility Study” for further details. 2 Refer to Cautionary Statement - The base mine plan comprises Ore Reserves (83%) and Indicated Mineral Resources (11%), it is partly based on Inferred Mineral Resources (6%) see Figure 5. 3 Refer to Table 4 and the technical report titled "JORC (2012) and NI 43-101 Technical Report" Technical Report – Bankable Feasibility Study” for further details.
-
Upload
khangminh22 -
Category
Documents
-
view
5 -
download
0
Transcript of Bankable Feasibility Study Completed with Exceptional ... - ASX

ASX Release
www.kaliumlakes.com.au Page 1 of 35
Tuesday 18 September 2018
Bankable Feasibility Study Completed with Exceptional Financial Outcomes
Kalium Lakes Limited (Kalium Lakes) (ASX:KLL) is pleased to announce the completion of the Bankable (or Definitive) Feasibility Study (BFS) including an updated Ore Reserve for the 100% owned Beyondie Sulphate Of Potash Project (Beyondie SOP Project or BSOPP) in Western Australia. A summary of the highlights of the BFS are detailed below. For further information refer to the attached, JORC (2012) and NI 43-101 Technical Report – Bankable Feasibility Study, compiled by German Potash Experts and Competent Persons, K-UTEC AG Salt Technologies (K-UTEC).
Highlights
• Robust, Bankable Project: BFS confirms that Kalium Lakes’ 100% Owned, Beyondie Sulphate Of Potash Project (BSOPP), is technically and financially robust, with production anticipated in 2020.
• 90% Increase in Ore Reserves: Based solely within the Stage 1 Approval Footprint (Figure 8), which represents less than a quarter of total lake surface area within the tenement package 1:
Proved Reserve of 1.65 Mt @ 13,830 mg/l SOP at a cut-off grade of 2,500mg/l K Probable Reserve of 3.49 Mt @ 11,820 mg/l SOP at a cut-off grade of 2,500mg/l K
Measured Resource of 1.72 Mt @ 11,488 mg/l SOP Indicated Resource of 9.17 Mt @ 12,459 mg/l SOP Inferred Resource of 8.75 Mt @ 12,593 mg/l SOP
• Increased Production Rates: The base case outcome of the BFS for the Beyondie SOP Project is a 164ktpa SOP operation. This is an increase of 10% on the Pre-Feasibility Study (PFS) based on (amongst other matters) an update to the Company's increased Ore Reserve, detailed brine extraction modelling, pilot scale pond and processing outcomes. After taking into consideration operational, SOP market and financing risk management perspectives, the Company has confirmed a phased ramp-up development scenario, starting with a commercial demonstration scale 82ktpa SOP operation, before ramping up to a 164ktpa full scale SOP production facility.
• Extended Mine Life In Excess of 30 years 2: Based on production of 164ktpa SOP, the extended mine life represents an increase of 7 years on the PFS estimated mine life. The Economic Evaluation excludes any production post 30 years from the Base Case Mine Plan.
• Improved Financial Outcomes for the Base Case: Refer to Table 1 for details 3.
Pre-tax NPV8 A$575M, IRR of 20%
Average EBITDA of A$116Mpa, EBITDA margin of 61%
A payback period of 7 years and Life of Mine (LOM) 30 years
Free cash flows of more than +A$2B
Based on CRU forecast US$606/t nominal average LOM SOP @ $A/$US exchange rate of 0.73.
1 Refer to Table 3, plus JORC Table 1 in the technical report titled "JORC (2012) and NI 43-101 Technical Report – Bankable Feasibility Study” for further details. 2 Refer to Cautionary Statement - The base mine plan comprises Ore Reserves (83%) and Indicated Mineral Resources (11%), it is partly based on Inferred Mineral Resources (6%) see Figure 5. 3 Refer to Table 4 and the technical report titled "JORC (2012) and NI 43-101 Technical Report" Technical Report – Bankable Feasibility Study” for further details.

www.kaliumlakes.com.au Page 2 of 35
• Strong Market Fundamentals:
CRU estimates that average CFR Australian prices in the first year of full production (FY2022) will be US$530/t with prices rising to US$961-997/t in 2040. CRU forecasts a 2.8%pa growth in SOP.
Kalium Lakes to produce a premium Standard, Granular and Soluble suite of products at >51%K2O and <0.5% Chloride. Each product will attract a different price and premium.
Offtake Terms Sheet executed with German fertiliser producer and distributor K+S for 100% of Phase 1 production. The Offtake arrangement is subject to the execution of a formal binding offtake agreement and satisfaction of certain conditions precedent, including completion of due diligence by K+S.
• Bankable Staged Development Cost Base 4
Estimated LOM Operating Cash Cost of A$231/t SOP FOB Fremantle Port 5. This will place the Beyondie SOP Project amongst the lowest cost global SOP production (Figure 6).
Pre-production Capital Cost of A$159 million for the initial 82ktpa phase. A deferred capital cost of A$125 million is required to ramp up production to 164ktpa SOP.
Pricing has been received from contractors and suppliers for more than 80% of Capex Costs.
Option to install a gas pipeline at a capital cost of A$29 million which would result in an operating costs reduction of A$31-34 per tonne.
• Confirmed Approvals Pathway:
Early works approvals are in place from the Environmental Protection Authority of Western Australia (EPA) and Department of Mines, Industry Regulation and Safety (DMIRS), with formal approval for the full-scale project anticipated to be in place during Q4 2018.
Two Native Title Land Access Agreements have been executed allowing for the consent to the grant of mining leases, ancillary tenure and approvals required for the BSOPP.
Two Mining Leases and 10 Miscellaneous Licences have been granted for the Beyondie SOP Project.
• Low Cost Financing Identified:
The Company is proposing to fund the project capital expenditure by a combination of up to 60% debt and the residual equity.
The Company has progressed the process for debt financing with initial due diligence completed and Expression of Interest (EOI) term sheets received.
The Company estimates that approximately A$42 million of the project capital expenditure is expected to qualify under the German Export Credit Agency (ECA) scheme which has received a positive preliminary assessment decision by the German Government Inter-Ministerial Committee (IMC) and Euler Hermes Aktiengesellschaft (Hermes), the appointed export credit agency that administers the German ECA scheme for the German Government.
Australian Government’s Northern Australia Infrastructure Facility (NAIF) has provided written confirmation that the NAIF Board has considered a Strategic Assessment Paper for the BSOPP and has consented to the NAIF Executive continuing its investigation.
• Kalium Lakes’ Board has now endorsed the commencement of early works and Front-End Engineering and Design (FEED) prior to a Final Investment Decision (FID).
4 Refer to the technical report titled "JORC (2012) and NI 43-101 Technical Report" Technical Report – Bankable Feasibility Study” for further details. 5 Operating Cash Costs FOB includes all mining, processing, site administration, product haulage to port and ports costs, but excludes head office corporate costs, sustaining costs, royalties and taxes.

www.kaliumlakes.com.au Page 3 of 35
Managing Director, Brett Hazelden, commented: “The Bankable Feasibility Study and Ore Reserve present a set of compelling technical and economic outcomes, to both investors and financial institutions. The Project has been designed to be a low cost, long life and high margin producer. “Kalium Lakes is proud to be the first Sulphate Of Potash developer to complete a Bankable Feasibility Study, for an Australian deposit which allows for an initial mine life of between 30 to 50 years,” he said. “The Technical Report attached to this ASX announcement is only a summary of the full BFS Report which contains more than 800 pages in 19 sections, as well as an appendices volume with in excess of 1,500 separate supporting documents. “In terms of the Australian SOP sector, this BFS sets the benchmark for the level of detail required in order to finance this type of project. Founded in October 2014, Kalium Lakes has now invested more than A$30 million in the exploration and development of the Beyondie SOP Project. “As a result of the extensive detail delivered in the BFS Report, the exceptional financial outcome, and the positive engagement with financial institutions, the Board has now endorsed the commencement of early works and final engineering. This will allow us to complete the critical path activities associated with the timely construction of the project including, most importantly, the road upgrades and accommodation facility. “On behalf of Kalium Lakes, I wish to thank our key consultants and employees for the quality work undertaken. We look forward to announcing a Final Investment Decision following the receipt of credit and other necessary approvals,” Mr Hazelden said.
Next Steps
• Commence Early Works Construction Activities Q3 2018
• Commence Front End Engineering and Design (FEED) Q4 2018
• Finalise Binding Offtake Agreements Q4 2018
• Award EPC/M and Lump Sum Contracts Q4 2018
• Primary Project Approvals Anticipated Q4 2018
• Finance Due Diligence Complete Q4 2018
• Project Financing Complete Q1 2019
• Final Investment Decision (FID) Q1 2019
• Full Construction Activities ~15 Months from FID
• Commissioning and Ramp Up to Name Plate Throughput During 2020
Cautionary Statement The Company advises that while the BFS Base Case is predominantly based on Ore Reserves (83%) and Indicated Mineral Resources (11%), it is also partly based on Inferred Mineral Resources (6%) over the 30 year Mine Life. Further the Company advises that the Bank Finance Case is based on 86% Ore Reserve and 14% Indicated Mineral Resources over the 50 year Mine Life. No Exploration Target material has been included in the economic valuation or production target of the Beyondie SOP Project. There is a lower level of geological confidence associated with Inferred Mineral Resources and there is no certainty that further exploration work will result in the determination of Indicated Mineral Resources or that the Inferred Mineral Resources will add to the economics of the Beyondie SOP Project. However, in preparation of the production target and associated NPV, each of the modifying factors was considered and has therefore passed the economics test.

www.kaliumlakes.com.au Page 4 of 35
BFS Background
The BFS has been prepared by KLL in conjunction with leading industry specialists including K-UTEC, DRA Global, Advisian, Shawmac, Wyntak and Preston Consulting as the principal technical consultants, as well as RSM, DLA Piper Australia, HopgoodGanim Lawyers and BurnVoir Corporate Finance as accounting, legal, commercial and financial advisors. Kalium Lakes adheres to the JORC 2012 Code and the Canadian Institute of Mining, Metallurgy and Petroleum Best Practice Guidelines for Resource and Reserve Estimation for Brines (CIM Guideline). In addition, the Company is part of the Association of Mining and Exploration Companies (AMEC) Potash Working Group which has developed guidelines to define a brine Mineral Resource and Ore Reserve, in order to increase the certainty, clarity and transparency in reporting of these resources. Kalium Lakes undertakes a gated project investment evaluation process that is accepted as industry best practice as illustrated in Figure 1. The BFS concluded a base case of 82ktpa ramping up to 164ktpa of SOP and aims to present information at the necessary level of definition and accuracy in accordance with the JORC Code and the AACE International® guidelines for developing a Class 3 (Bankable / Definitive Feasibility Study) estimate. Kalium Lakes considers that the implementation of the Project in two phases provides an ideal strategy that minimises initial upfront capital costs, manages risk, reduces shareholder dilution and enters the market in a sustainable, non-disruptive manner. The Beyondie SOP Project location and tenements are shown in Figure 2 and Figure 8 as well as existing transport infrastructure, access road, the Goldfields Gas Pipeline (GGP) and the Kumarina Roadhouse located on the Great Northern Highway.
Figure 1 – Kalium Lakes Gated Investment Evaluation Process

www.kaliumlakes.com.au Page 5 of 35
Figure 2 – Beyondie Sulphate Of Potash Project Location – Western Australia

www.kaliumlakes.com.au Page 6 of 35
Beyondie Sulphate Of Potash Project Production Process
Sulphate of Potash (SOP) is a widely-used agricultural fertiliser with annual global consumption of 6.6Mtpa. Australia currently imports 100% of its potash requirements from overseas producers. SOP can be produced by extracting brine (hypersaline water) from underground, then evaporating the water to precipitate mixed potassium salts which are, in turn, purified to produce the SOP fertiliser, as illustrated in Figure 3: (a) Brine Pumping: brine is extracted from basal sands (or the lower aquifer) using submersible bores,
as well as pumping of trenches from the upper aquifer;
(b) Brine Solar Evaporation: brine is pumped to solar evaporation ponds where it sequentially precipitates calcium, sodium, potassium and magnesium mixed salts in separate ponds;
(c) Salt Harvesting: the mixed potassium salts that have crystallized from the solar evaporation ponds are mechanically harvested and stockpiled;
(d) Purification Processing: the mixed potassium salts are fed into a purification plant facility where the potassium are salts converted into schoenite through a conversion and recycling process and are then separated from halite via flotation. The resultant schoenite slurry undergoes thermal decomposition into SOP; and
(e) SOP Fertiliser: after drying and compaction in a purification plant, the SOP is ready to be used and sold as a final product.
Figure 3 - SOP Production Process

www.kaliumlakes.com.au Page 7 of 35
Key BFS Parameters, Assumptions and Statistics
The Base Case of the BFS for the Beyondie SOP Project is a phased ramp-up development scenario, starting with a commercial demonstration scale 82ktpa SOP operation, before ramping up to a 164ktpa full scale SOP production facility with a mine life in excess of 30 years. The Company has considered each of the JORC Code modifying factors in arriving at the preferred base case including an assessment of project economics, weighed against the ability to finance the project, as well as the technical risks and resulting market supply and demand impact. A summary of the key parameters, assumptions and statistics is presented in Table 1. Table 1 - Key Parameters, Assumptions and Statistics
Facility Key Area / Characteristic Details/Comments
Location Mine Beyondie Paleo Valley, 78 km East of Kumarina Road House (refer Figure 2 & 7)
Leases and Licences Exploration Leases: E69/3306, E69/3309, E69/3339, E69/3340, E69/3341, E69/3342, E6/3343, E69/3344, E69/3345, E69/3346, E69/3347, E69/3348, E69/3349, E69/3351, E69/3352. Miscellaneous Licences: L52/162, L52/186, L52/187, L52/190, L52/193, L69/28, L69/29, L69/30, L69/3, L69/32, L69/34, L69/35 (Application), L69/36 (Application). Mining Leases: M69/145, M69/146
Tenement Area >2,400 km2 granted tenements
Marketing Product Sales SOP - K2SO4 Targeting Australian Potash market initially
No Australian production of Potash
Mix of standard, granular and soluble SOP product – 22.5:60:17.5 split
Base product (K2O>51%) premium ranges of granular 5-8% and soluble 20-25%
Premium products (K2O>52%) to achieve an additional 3-10% premium
Initial Export and Expansion into Asian Markets
Resource & Reserve
Low Na:K Ratio 8.8 : 1
Deposit Type Subsurface Brine, Lake surface, Paleo valley and Bedrock aquifers
Aquifer Extent 30,000 ha lake surfaces & Paleo Valley 100-250 km in length
Aquifer Depth Variable Up to 100m
K2SO4 Mineral Resource (JORC/CIM)
Measured 1.72 Mt SOP @ 11,488 mg/L K2SO4
Indicated 9.17 Mt SOP @ 12,459 mg/L K2SO4
Inferred 8.75 Mt SOP @ 12,593 mg/L K2SO4
Total 19.64 Mt SOP @ 12,434 mg/L K2SO4
Exploration Target 3.7 to 20.7 Mt K2SO4 @ 4,000 -7,350 mg/L K2SO4
Non-CIM Mineral Resource (For Comparative Purposes Only)
Total Stored Brine Estimate
159.7 Mt SOP (For Comparative Purposes Only)
Reserve Cut Off Grade 2,500mg/l K (Potassium)
K2SO4 Ore Reserve (JORC/CIM) Proved 1.65 Mt SOP, 13,830 mg/L K2SO4
Probable 3.49 Mt SOP, 11,820 mg/L K2SO4
Total 5.14 Mt SOP, 12,400 mg/L K2SO4
Brine Extraction 82 ktpa 164 ktpa
Equipment & Communications Diesel / Solar Powered Brine Extraction Pumps and Piping with Telemetry
Stage 1 Extraction Bores Number of bores inclusive of pump stations 36 41
Stage 1 Extraction Trenches Trenches inclusive of pump stations ~58 km ~58 km
Brine Volume Annual Volume Flow (Gl/a) 7.9 – 9.4 10.9 – 17.8
Average Flow Rate (l/s) 256 - 300 352 - 566
Stage 1 Approval Footprint Assumes Beyondie, 10 Mile and Sunshine Only (refer 1)
Brine Evaporation
Evaporation Ponds 82 ktpa 164 ktpa
Total Area (ha) 445 890
Operating Hours 8,766 hours per year
Potassium Recovery 94%
Pond Seal 1mm HDPE Liner

www.kaliumlakes.com.au Page 8 of 35
Facility Key Area / Characteristic Details/Comments
Equipment Trucks, harvesting equipment, pipes and pumps
Excess Salt Disposal Stockpiled on lake and / or sold as a product
Purification Plant Operating Hours 7,500 hours per year, 85% asset utilisation
SOP Plant Summary Front end loader (FEL) reclaim from raw salt stockpile, crushing, conversion, flotation, crystallisation, compaction, product stockpiling and packaging
Production Level 82 ktpa SOP start up, expanding to 164 ktpa SOP
Potassium Recovery 77%
Product Packaging 25 kg bags, 1.2 tonne Bulk Bags, Loose Bulk Product
Infrastructure General Buildings & facilities for construction, processing, haul road
Support Infrastructure Cooling towers, Chillers, Demineralised Water and Steam production
Communications Satellite & microwave data plus mobile data communications
Business Systems Ellipse, Cube / INX, Citect Ampla, MS Office 365 and other industry typical systems
Laboratory Contractor operated Laboratory
Water Supply & Treatment Solar & diesel-powered water bores delivering 1 – 2 Gl/a connecting 3 supply areas connected via pipelines & water treatment plants
Waste Water Treatment WWTP located at Village. Septic tanks / leach drains at all other locations
Operations Accommodation 82 ktpa: 60 Permanent ensuite rooms incl. of shut down & visitor allowance
164 ktpa: 85 Permanent ensuite rooms incl. of shut down & visitor allowance
Gas Supply 82 - 164 ktpa: Gas Bullets on Site, gas supplied by truck (or Gas pipeline)
164 ktpa and above: 78 km, small diameter pipeline, connected to Goldfields Gas Pipeline
Diesel Storage 2 off 110kl self-bunded tanks
Power Generation 82 ktpa: Installed capacity of 7.5 MW
164 ktpa: Installed capacity of 11.9 MW
Access Road & Product Haulage
Access Road 78km unsealed road from the sealed Great Northern Hwy.
Turn off located near Kumarina Roadhouse (refer Figure 2 and 7)
Distance to Distribution Locations (refer Figure 6)
Perth / Fremantle / Kwinana 1,088 km
Geraldton 862 km
Fleet Details Standard highway fleet operated by Toll Mining Services
90-110 t payload triple or quad trailer road trains
Port Port Location Fremantle and/or Kwinana and/or Geraldton (refer Figure 2)
Product Delivery Container (i.e. packaged 25kg bags, 1.2 tonne Bulk Bags) / Container Bulk / Bulk
Storage Shed in Perth operated by Toll Mining Services
Shipping Container cargo or normal shipping container protocols at Fremantle Port, or bulk materials handling facility Kwinana or Geraldton Port
Operating Personnel
Roster 2 weeks on and 2 weeks off (Family Friendly)
Airport Newman commercial domestic flights
Work Force 82 ktpa 164 ktpa
Total Personnel 58 85
Climate Rainfall Average annual mean rainfall of 238 mm
Temperature Average annual mean minimum temperature is 15˚C
Average annual mean maximum temperature is 31˚C
Evaporation Average annual evaporation is estimated to be 4,100 mm
Relative humidity 15% to 40%
Winds Predominantly Easterlies
BFS Accuracy Capex Accuracy +/- 15% Class 3 (AACE)
Opex Accuracy +/- 15%

www.kaliumlakes.com.au Page 9 of 35
Mineral Resources Estimation Methodology
• A 3D geological model was constructed in Leapfrog Geo v4.2 implicit modelling software from Aranz
Geo Limited. The model used all available drilling data, surface mapping and geophysical data to model the geology across the Beyondie, Ten Mile Lake and Lake Sunshine areas. The topography of the model was derived from high precision ortho imagery of the main lake areas and bore sites. The ortho imagery has a horizontal accuracy of 0.2 m and vertical accuracy of 0.08 m, all drill holes were levelled to the topography in the model.
• All drill hole assays for potassium, sulphate and magnesium were brought into the model as 1m intervals when taken from drilling or as composites where assays are representative of screened intervals from bores (i.e. test pumping and bore development).
• The Edge module in Leapfrog Geo v4.2 was used for block modelling and numerical estimation. Two block models were constructed, one for Beyondie and Ten Mile Lake, and one for Lake Sunshine. Beyondie and Ten Mile Lake utilised standard block sizes of 250m in the x and y direction and 5m in the z direction. While Lake Sunshine used the same x and y block size but 2.5m blocks in the z direction. Sub blocking was used to refine the block model in areas where geological surfaces intersect blocks. Parent blocks were split by up to four blocks in the x and y direction and two blocks in the z direction.
• Estimators were set up for potassium, sulphate and magnesium for the below water table domain. The domain was clipped to boundaries of the defined resource categories and tenements, as hard boundaries.. The base of the domain was defined as 460m AHD. Parameter concentrations were estimated across the cells using Ordinary Kriging, ellipsoid search parameters were assigned following review of the variography of each parameter. The search parameters for each block model are listed below:
Ten Mile Lake and Beyondie o Ellipsoid Ranges - Max. = 3000m, Int. = 1800m, Min. = 61m o No. of Samples – Max = 20, Min = 5.
Lake Sunshine o Ellipsoid Ranges - Max. = 3000m, Int. = 2000m, Min. = 100m o No. of Samples – Max = 20, Min = 3.
• Variogram models for each parameter are presented. Nearest neighbour (NN) and inverse distance squared (ID2) estimators were also run for potassium as check accuracy calculations. The average grade of each model swath (average cell value in one plane) and the plots of each model are presented in x, y and z directions for potassium. These plots show that the model adopted (k:3x3x2) is appropriate when plotted against the ID2 and NN methods.
• Specific yield was calculated for the surficial lake sediments using the average of the trench test-pumping analysis results. For all other lithologies the average values from calibrated BMR logging were used.
• SOP grade from potassium concentrations were calculated using a conversion of 2.228475, accounting for the atomic weight of sulphate (sulphur and oxygen) in the K2SO4 formula.
• Resource tonnages were calculated by multiplying the volume of the Resource Zone in each lithology by the specific yield and SOP grade to obtain the drainable SOP volume.
• Drill hole spacing in the various project areas includes; Beyondie and Ten Mile Surficial Sediments is between 1600 and 150m (average is approximately 250m); Beyondie and Ten Mile Palaeochannel and Bedrock is between 1600 and 150m (average is approximately 270 m); Sunshine Surficial Sediments is between 3000 and 150m (average is approximately 250m); Sunshine Palaeochannel and Bedrock is between 3000 and 150m (average is approximately 450m)
Significant detail and additional information relating to mineral resources methodology was provided in the
Company’s ASX announcement “Significant Resource Upgrade - Beyondie SOP Project” released on
4 September 2018 and is also provided in the attached JORC (2012) and NI 43-101 Technical Report – Bankable Feasibility Study.

www.kaliumlakes.com.au Page 10 of 35
Updated Ore Reserve Basis
The process of turning Mineral Resources in to Ore Reserves in a Brine deposit involves the application of mining modifying factors with the use of a groundwater numerical model. The model simulates the flow of brine to abstraction points with an associated concentration of potassium and sulphate to produce tonnes of SOP as part of a mine plan. The abstraction rates and life of the mine are limited by the aquifer properties and storage potential of the host aquifers. These properties are calibrated within the numerical model to collected pumping data and water level observation to most accurately represent the hydraulic system. The Ore Reserve estimate has been developed using detailed integrated groundwater flow and solute transport finite element modelling in FEFLOW, an industry standard numerical groundwater modelling platform. The models have been used to simulate the Ore Reserve estimate and develop mine plans for the BSOPP. The detailed modelling reports describe the construction, calibration and operation of the model to reporting guidelines. The groundwater models were developed to evaluate the recoverable resource from the shallow unconfined aquifer and deep confined aquifer in the vicinity of Ten Mile Lake and Lake Sunshine. The aquifer properties of the model have been zoned according to the Resource model and calibrated to steady state and transient conditions utilising all pumping and recovery data, including test pumping, trial pond pumping and the measurements observed in monitoring bores across the project in each aquifer and aquitard. Brine concentrations were imported to the groundwater model from the resource block model. A number of abstraction Scenarios (mine plans) were developed to test the proposed throughput variations of the mine at rates of between 82 ktpa to 164 ktpta with and without recharge over the life of mine of +30 years to understand the various factors affecting the mine plan. A total process (evaporation ponds and purification plant) recovery factor of 72% was used to derive the SOP production rates from the annual abstracted brine. Seasonal evaporation pond demands were simulated on a quarterly basis for the first ten years of operations. Annual production rates have been simulated from year 11 to year 30. Abstraction rates and concentrations have been modelled iteratively to manage grade and determine the variation in pumping regime necessary to meet the pond requirements. The Ore Reserve estimate is based on the 82 ktpa to 164 ktpa ramp up mine plan for 30 years with no recharge. Abstraction capture zone analysis was used to determine the origin of brine from each abstraction point (Production bore or trench) throughout the life of mine. Capture zones emanating outside of the resource evaluation zones were omitted from the estimate. Proved and Probable Reserve volumes were derived from the capture zones originating from the Measured and Indicated Resource zones respectively. Measured and Indicated Resources have been determined from confidence in geological and brine extent through drill spacing, areas which have extended pumping and drawdown data recorded so that hydraulic calibration can be undertaken and have at least two different methods of measuring aquifer properties. Though the lake surface has Measured Resources for the top 5 m the effects of variable recharge on this zone means that these Measured Resources convert to the Probable Reserve category only. The effects of recharge can influence the grade of the lake surface sediments. The leaching potential of these sediments has been measured and modelled within the solute model. Recharge has a net replenishment of the resource but will dilute the resource in late mine life which has been accounted for in the mine plans. The impacts of lake surface recharge have been determined by comparing the differences of the mine plan with and without recharge. The Ore Reserve estimate does not include any recharge. A cut-off grade of 2,500 mg/L potassium has been applied to the Ore Reserve to reduce excess brine volumes supplied to the ponds which would decrease production rates of SOP due to a more dilute brine requiring additional evaporation area and time. This has been managed in the mine plan by turning off production bores when the potassium grade goes below this concentration. In addition to potassium and sulphate, the pumped brine contains quantities of magnesium, sodium and chloride that have been quantified. The specific gravity from each abstraction point has also been modelled by a ratio to potassium. Density is not considered to be material to the Ore Reserve estimate given the low density gradients that have been mapped across the deposits. Production bore well losses have an impact on the abstraction recovery and have been measured during testing, these losses have been accounted for in the abstraction yields simulated at each production bore.

www.kaliumlakes.com.au Page 11 of 35
The capture zones for the deep aquifer at 10 Mile is presented Figure 4, these show the origin of brine abstraction at year 30 of the mine life. The origins of these capture zones determine the category of either Proven or Probable Reserves. Capture zones emanating from the Measured Resources of the Deep Aquifer are categorised as Proven Reserves and other abstraction is allocated to Probable Reserves.
Figure 4 - 10 Mile Lake Production Bore Capture Zones
The Ore Reserves only take into account the Measured and Indicated Resources of Ten Mile and Lake Sunshine, they do not include 0.7 Mt of Indicated Mineral Resources from the regional lake sediments that form Stage 2 of the Project. A summary of the abstraction for the Ore Reserves is provided in the Table 2 below. The Ore Reserve estimate is considered to be a conservative representation of the aquifer systems with general reasonable confidence in modelled outputs during the early to mid-life of mine, with confidence reducing during later mine life. This confidence is spatially represented with the highest levels of confidence around the areas with good geological and test pumping control and the lowest areas of confidence with limited data available. It is important to note that hydrogeological numerical models have significant areas of uncertainty and that the mine plan developed over a 30 year period is not definitive. Model sensitivity, predictive uncertainty analysis and professional judgement have been incorporated into the numerical model development to determine the most sensitive parameters. A conservative approach to these parameters has been adopted to ensure the model is representative of the level of understanding of the hydrogeology.

www.kaliumlakes.com.au Page 12 of 35
Table 2 – Produced Brine and Mass
Abstraction Point
Brine Volume
(m3) Pumping
(days)
Average Pumping
Rate (m3/d)
K Production Concentration (mg/L) K Mass
Produced (kt)
SO4 Mass Produced
(kt)
K2SO4
Mass Produced
(kt) Min Max Ave
Ten Mile Production Bores 103,859,143 10,942 1,124 5,084 10,686 8,078 785 2,252 1,749
Ten Mile Trench Pumps 28,251,441 9,887 850 3,371 9,385 7,037 205 598 457
Sunshine Production Bores 226,355,423 10,396 831.94 2,500 7,414 5,225 961 2,778 2,141
Sunshine Trench Pumps 55,491,554 9,356 1,636 2,500 7,513 6,305 351 964 782
Sum of Mass (Mt) 2.30 6.60 5.13
Based on the methodology outlined above, the Proved and Probable Reserve estimates are detailed in Table 3 respectively. Table 3 – Ore Reserves
Aquifer Type Brine Volume
(106 m3) K
(mg/L) K Mass
(Mt) SO4
(mg/L) SO4 Mass
(Mt) K2SO4 Mass
(Mt)
Production Bores 119 6,207 0.74 17,945 2.14 1.65
Total Proved Reserve 119 6,207 0.74 17,945 2.14 1.65
Lake Surface Sediments 212 4,755 1.01 13,669 2.90 2.25
Production Bores 83 6,713 0.56 18,867 1.57 1.24
Total Probable Reserve 295 5,306 1.57 15,129 4.46 3.49
Total Ore Reserve 414 5,565 2.30 15,940 6.60 5.13
Financial Outcomes, Assumptions and Evaluation
Kalium Lakes has considered two financial cases below and in Table 4.
1. Base Case: A phased ramp-up development scenario, starting with a commercial demonstration scale 82ktpa SOP operation, before ramping up to a 164ktpa full scale SOP production facility with a mine life of 30 years based on Ore Reserves (83%), Indicated Mineral Resources (11%) and Inferred Mineral Resources (6%) (Figure 5).
2. Bank Finance Case: As financial institutions will only consider initial product development
parameters this case reflects a constant 82ktpa SOP production facility with a mine life of 50 years based on 86% Reserves and 14% Indicated Mineral Resources (Figure 6).
A discounted cash flow analysis (DCF) was used to calculate key project valuation indicators for the project, in particular, the Net Present Value (NPV), Internal Rate of Return (IRR) and Earnings Before Interest, Taxation, Depreciation, and Amortisation (EBITDA). NPV, IRR and payback periods are measures of the return that are generated based on the applied assumptions. An 8% discount rate (post–tax, nominal) was used for NPV calculations based on a Weighted Average Cost of Capital (WACC) that reflects likely debt margins. A 2% inflation factor is used. The DCF was modelled on a quarterly basis in nominal terms, referenced to CAPEX and OPEX developed in Australian dollars (A$). The project was analysed on an unleveraged (100% equity) basis. A detailed SOP market study was commissioned by KLL and provided by CRU in September 2018, this has been used as the basis for the commodity price, forecasted US$606/t nominal average LOM SOP sales at $A/$US exchange rate of 0.73 under the Base Case. CRU estimates that CFR Australian prices in the first year of full production (FY2022) will be US$530/t with prices rising to US$961-997/t in 2040. CRU forecasts a 2.8%pa growth in SOP. Utilising these Cases, the Kalium Lakes position on the existing producer cost curve is shown in Figure 7.

www.kaliumlakes.com.au Page 13 of 35
Figure 5 – Base Case 30 Year Mine Plan – 164ktpa SOP
Figure 6 – Bank Finance Case 50 Year Mine Plan – 82ktpa SOP

www.kaliumlakes.com.au Page 14 of 35
Table 4 – Financial Evaluation Outcomes, Assumptions and Evaluation
Production Scenario Base Case Bank Finance Case
Description Unit 164 ktpa SOP 82 ktpa SOP
Average LOM Realised Sales Price 6
US$/t SOP 606 643
Exchange Rate A$:US$ 0.73 0.73
Assumed Life of Mine years 30 7 50 8
LOM SOP Produced Tonnes 4,664 4,270
Project NPV8 (Pre-tax, nom) 9 A$M 575 361
Project NPV8 (Post-tax, nom) 9 A$M 347 217
IRR (Pre-tax) % 20.4% 18.5%
IRR (Post-tax) % 16.5% 14.9%
LOM Revenue A$M 5,689 6,876
LOM OPEX Cash Cost FOB 10 A$/t SOP 231 11 284 12
LOM OPEX A$M 1,532 2,141
Initial CAPEX A$M 160 160
LOM CAPEX (incl. Sustaining) A$M 491 308
LOM Royalties 13 A$M 130 155
LOM Corporate Tax A$M 956 1,092
LOM Free Cash Flow (pre-tax) A$M 3,045 3,555
Free Cash Flow (pre-tax) A$M p.a. 108 75
LOM Free Cash Flow (post tax) A$M 2,069 2,463
Free Cash Flow (post tax) A$M p.a. 76 53
LOM EBITDA A$M 3,487 3,838
EBITDA (average) A$M p.a. 116 77
EBITDA Margin % 61.3% 55.8%
CAPEX / EBITDA (average p.a.) x 0.14 0.08
Initial Payback Period (pre-tax) 14 Years 7.0 6.3
Initial Payback Period (post-tax) 14 Years 8.3 7.8
6 Based on CRU forecast US$606/t average LOM SOP under the Base Case (US$643/t under the Bank Finance Case). CRU estimates that CFR Australian prices in the first year of full production (FY2022) will be US$530/t with prices rising to US$961-997/t in 2040. CRU forecasts a 2.8%pa growth in SOP. 7 Refer to Cautionary Statement - The Base Case mine plan comprises Ore Reserves (83%) and Indicated Mineral Resources (11%), it is partly based on Inferred Mineral Resources (6%). No Exploration Target brine has been included in the assumed life of mine or economic evaluation of the project. Refer to the cautionary statement in page 3 of this announcement. See Figure 5. 8 Refer to Cautionary Statement - The Bank Finance Case mine plan comprises 86% Ore Reserves and 14% Indicated Mineral Resources. See Figure 6. 9 NPV as at construction start, Q3 CY2018; a 2% inflation factor used; WACC calculation = 8% Discount Rate. 10 Life of Mine OPEX Cash Cost FOB includes all mining, processing, site administration, product haulage to port and ports costs, but excludes head office corporate costs, sustaining costs, royalties and taxes. 11 Bank Finance Case Assume BOO Power Station for first five years. 12 Base Case Assumes BOO Power Station for first five years and gas pipeline installed from Year 6 onwards. 13 A WA Royalty Rate = A$0.73/t SOP; Native Title Royalty Rate = 0.75% of Mine Gate; Founders’ Royalty = 1.9% gross revenue. 14 Calculated from first production date. For the phased expansion, the payback periods shown are inclusive of ramp up to full production.

www.kaliumlakes.com.au Page 15 of 35
Figure 7 - CRU 2021 SOP project cost curve including Kalium Lakes ($/t)
Figure 8 - Stage 1 and Stage 2 Footprints - Beyondie Sulphate Of Potash Project

www.kaliumlakes.com.au Page 16 of 35
Compliance Statement
The information in this document that relates to Exploration Targets, Exploration Results, Mineral Resources, Ore Reserves and Production Targets have been extracted from the report(s) listed below.
• 13 September 2018: Progressing NAIF Financial Support Decisions.
• 5 September 2018: Clarification Announcement.
• 4 September 2018: Significant Resources Upgrade - Beyondie SOP Project.
• 31 August 2018: Mining Proposal and Mining Tenure Granted.
• 23 July 2018: German Government Progresses Credit Guarantee Scheme.
• 21 July 2018: Offtake Terms Sheet signed with K+S.
• 7 June 2018: Beyondie SOP Project Mining Leases Granted.
• 28 May 2018: EPA Minor Preliminary Works Consent.
• 3 May 2018: BFS Exploration Drill Program Complete.
• 10 April 2018: CFO Transition and Financing Update.
• 22 March 2018: Pilot Pond Update and Harvest Trials.
• 27 February 2018: Purification Plant Recovery Optimisation.
• 8 February 2018: Environmental Approvals Update.
• 18 January 2018: Second Native Title Agreement Signed.
• 3 October 2017: Pre-Feasibility Study with Maiden Ore Reserve Confirms Low Cost, Long Life and High Margin Beyondie SOP Project (Including the attachment, JORC (2012) and NI 43-101 Technical Report, compiled by German Potash Experts and Competent Persons, K-UTEC AG Salt Technologies (K-UTEC)).
• 27 July 2018: Scoping Study Completed with Maiden Resource and Exploration Target for the Carnegie Potash Project.
The report(s) are available to be viewed on the website at: www.kaliumlakes.com.au
Kalium Lakes confirms that it is not aware of any new information or data that materially affects the information included in the original market announcements and, in the case of estimates of Mineral Resources, Ore Reserve Estimates, Exploration Targets or Production Targets, that all material assumptions and technical parameters underpinning the estimates in the relevant market announcement continue to apply and have not materially changed. The Company confirms that the form and context in which the Competent Person’s findings are presented have not been materially modified from the original market announcement.
Competent Persons Statement
The information in this ASX announcement and the accompanying Report that relates to Exploration Targets, Exploration Results, Mineral Resources and Ore Reserves is based on information compiled by Thomas Schicht, a Competent Person who is a Member of a 'Recognised Professional Organisation' (RPO), the European Federation of Geologists, and a registered "European Geologist" (Registration Number 1077) and Anke Penndorf, a Competent Person who is a Member of a RPO, the European Federation of Geologists, and a registered "European Geologist" (Registration Number 1152). Thomas Schicht and Anke Penndorf are full-term employees of K-UTEC AG Salt Technologies (K-UTEC). K-UTEC, Thomas Schicht and Anke Penndorf are not associates or affiliates of Kalium Lakes or any of its affiliates. K-UTEC will receive a fee for the preparation of the Report in accordance with normal professional consulting practices. This fee is not contingent on the conclusions of the Report and K-UTEC, Thomas Schicht and Anke Penndorf will receive no other benefit for the preparation of the Report. Thomas Schicht and Anke Penndorf do not have any pecuniary or other interests that could reasonably be regarded as capable of affecting their ability to provide an unbiased opinion in relation to the Beyondie Potash Project. K-UTEC does not have, at the date of the Report, and has not had within the previous years, any shareholding in or other relationship with Kalium Lakes or the Beyondie Potash Project and consequently considers itself to be independent of Kalium Lakes. Thomas Schicht and Anke Penndorf have sufficient experience that is relevant to the style of mineralisation and type of deposit under consideration and to the activity being undertaken to qualify as a Competent Person as defined in the 2012 Edition of the JORC 'Australasian Code for Reporting of Exploration Results, Mineral Resources and Ore Reserves'. Thomas Schicht and Anke Penndorf consent to the inclusion in the Report of the matters based on their information in the form and context in which it appears.
Cautionary Statement Regarding Forward-Looking Information
Statements regarding plans with respect to the Company’s mineral properties may contain forward looking statements. Statements in relation to future matters can only be made where the Company has a reasonable basis for making those statements. This announcement has been prepared in compliance with the current JORC Code 2012 Edition and the current ASX Listing Rules. The Company believes it has a reasonable basis for making the forward-looking statements, including any production targets, based on the information contained in the announcement and in particular the JORC 2012 and NI 43-101 Technical Report - Bankable Feasibility Study. All statements, trend analysis and other information contained in this document relative to markets for Kalium Lakes, trends in resources, recoveries, production and anticipated expense levels, as well as other statements about anticipated future events or results constitute forward-looking statements. Forward-looking statements are often, but not always, identified by the use of words such as “seek”, “anticipate”, “believe”, “plan”, “estimate”, “expect” and “intend” and statements that an event or result “may”, “will”, “should”, “could” or “might” occur or be achieved and other similar expressions. Forward-looking statements are subject to business and economic risks and uncertainties and other factors that could cause actual results of operations to differ materially from those contained in the forward-looking statements. Forward-looking statements are based on estimates and opinions of management at the date the statements are made. Kalium Lakes does not undertake any obligation to update forward-looking statements even if circumstances or management’s estimates or opinions should change. Investors should not place undue reliance on forward-looking statements.

www.kaliumlakes.com.au Page 17 of 35
Kalium Lakes Limited
ABN: 98 613 656 643 ASX: KLL Ordinary Shares on Issue: 169,793,465 Board of Directors: Chief Financial Officer and Mal Randall Non-Executive Chairman Joint Company Secretary: Christopher Achurch Brett Hazelden Managing Director Rudolph van Niekerk Executive Director Brendan O’Hara Non-Executive Director Joint Company Secretary: Gareth Widger Contact Details: Share Registry: Kalium Lakes Limited Computershare Investor Services Pty Ltd Unit 1, 152 Balcatta Road Level 11, 172 St Georges Terrace BALCATTA WA 6021 Perth, WA 6000 Tel: (within Australia): 1300 850 505 PO Box 610 Tel: (outside Australia): +61 3 9415 4000 BALCATTA WA 6914 Tel: +61 (0)8 9240 3200 Email: [email protected] Web: www.kaliumlakes.com.au

www.kaliumlakes.com.au Page 18 of 35
JORC Code, 2012 Edition – Table 1 Section 1 – Sampling Techniques and Data
Criteria JORC Code explanation Commentary
Sampling techniques
• Nature and quality of sampling (eg cut channels, random chips, or specific specialised industry standard measurement tools appropriate to the minerals under investigation, such as downhole gamma sondes, or handheld XRF instruments, etc). These examples should not be taken as limiting the broad meaning of sampling.
• Include reference to measures taken to ensure sample representivity and the appropriate calibration of any measurement tools or systems used.
• Aspects of the determination of mineralisation that are Material to the Public Report.
• In cases where ‘industry standard’ work has been done this would be relatively simple (eg ‘reverse circulation drilling was used to obtain 1 m samples from which 3 kg was pulverised to produce a 30 g charge for fire assay’). In other cases more explanation may be required, such as where there is coarse gold that has inherent sampling problems. Unusual commodities or mineralisation types (eg submarine nodules) may warrant disclosure of detailed information.
• Brine samples were obtained during drilling from prolonged airlift yields and collected at the cyclone. These samples are interpreted to come from the zone above the drilling depth, although the possibility of downhole flow outside of the drill rods from shallower zones cannot be excluded. These mixed samples were only used for estimation of the inferred resource calculation.
• Brine samples during test production bore pumping were obtained from the end of the discharge line and represent an average composition of groundwater pumped from the screened section of the production bore.
• Brine samples from trench pumping were obtained from the end of the discharge line and are an average representation of the aquifer zone the trench intercepts.
• The sampling program involved the collection of brine samples and samples of the aquifer material during drilling to define the brine and geological variation.
• Lithological samples at 1 m intervals were obtained by a combination of methods including reverse circulation, aircore and auger.
• Brine was obtained during drilling from the cyclone of the drill rig during airlift yields. These samples are interpreted to come from the zone above the drilling depth, although the possibility of downhole flow outside of the drill rods from shallower zones cannot be excluded.
• Sonic drill core was retrieved to obtain representative samples of the sediments that host brine to evaluate the porosity and hydraulic conductivity of the sediments and calibrate the geophysical tools being used. Core was extruded from the sonic core barrel and sealed within plastic core bags and placed in metal core boxes for storage.
• All sonic holes were geophysically logged with the methods listed in this report.
Drilling techniques • Drill type (e.g. core, reverse circulation, open-hole hammer, rotary air blast, auger, Bangka, sonic, etc) and details (e.g. core diameter, triple or standard tube, depth of diamond tails, face-sampling bit or other type, whether core is oriented and if so, by what method, etc).
• Reverse circulation (140 mm diameter), aircore (90 mm and 85 mm diameter) and sonic (150 mm) drilling has been utilised for all exploration and monitoring bore holes drilled during this report.
• HQ diamond tails were used on a number of deep reverse circulation holes to penetrate bedrock stratigraphy. • All shallow lake surface sediment holes were drilled with auger techniques. • All production bores were drilled using conventional mud rotary, casing advancer or sonic techniques. • All holes were drilled vertically.

www.kaliumlakes.com.au Page 19 of 35
Criteria JORC Code explanation Commentary
Drill sample recovery
• Method of recording and assessing core and chip sample recoveries and results assessed.
• Measures taken to maximise sample recovery and ensure representative nature of the samples.
• Whether a relationship exists between sample recovery and grade and whether sample bias may have occurred due to preferential loss/gain of fine/coarse material.
• Geological sample recovery was high, in all lithologies, except fractured bedrock which had lost circulation of drill cuttings in the fracture zone and only returned minor chip samples back to the surface.
• Brine recoveries were high for reverse circulation drilling in the productive aquifer zones (Surficial sediments, palaeochannel sand and bedrock). The low transmissivity clay yielded very low volumes, with more sporadic sampling resulting, generally occurring near the base of the formation.
• Brine recoveries during aircore drilling were minimal due to the nature of the drilling technique. • Airlifts were generally of prolonged duration to obtain representative samples, however water flowing down
from the surficial aquifer during deeper airlift yields cannot be ruled out. • Sonic core was recovered in variable lengths between 1.5 m and 6 m core runs depending on the ground
conditions. The length of the run was marked on each of the core boxes. • Sonic core recovery was generally high with some expansion of the stiff lacustrine clays observed during the
drilling process resulting in excess core.
Geologic Logging • Whether core and chip samples have been geologically and geotechnically logged to a level of detail to support appropriate Mineral Resource estimation, mining studies and metallurgical studies.
• Whether logging is qualitative or quantitative in nature. Core (or costean, channel, etc.) photography.
• The total length and percentage of the relevant intersections logged.
• All drill holes were geologically logged by a qualified geologist. • All geological samples collected during all forms of drilling are qualitatively logged at 1 m intervals, to gain an
understanding of the variability in aquifer materials hosting the brine. • Geological logging and other hydrogeological parameter data is recorded within a database and summarised
into stratigraphic intervals. • Solid samples are collected, washed and stored in chip trays for future reference. • Core was logged and core plugs selected for laboratory testing by a senior geologist. • Downhole geophysical methods (Resistivity, spectral gamma and BMR) were used to assist with lithological
logging. • Geological logging and other hydrogeological parameter data is recorded within a database.
Subsampling techniques and sample preparation
• If core, whether cut or sawn and whether quarter, half or all core taken.
• If non-core, whether riffled, tube sampled, rotary split, etc and whether sampled wet or dry.
• For all sample types, the nature, quality and appropriateness of the sample preparation technique.
• Quality control procedures adopted for all sub-sampling stages to maximise representivity of samples.
• Measures taken to ensure that the sampling is representative of the in situ material collected, including for instance results for field duplicate/ second-half sampling.
• Whether sample sizes are appropriate to the grain size of the material being sampled.
• During drilling all brine was sampled directly from the cyclone during prolonged airlift yields. This provides the most representative sample recovered from the inside return, i.e. from the bit face.
• Aircore drilling with low pressure air aims to collect a brine sample that is representative of the interval immediately above the bit face. However, this method does not exclude the potential for downhole mixing of brine. The fact that the low transmissivity clays were slow to yield brine, while underlying permeable intervals did yield brine with ease provides confidence that representative samples with depth have been obtained.
• Samples from the pumping tests were taken in intervals of between one per day or every two days. • All samples collected are kept cool until delivery to the laboratory in Perth. • Brine samples were collected in 500 ml bottles with little to no air. • Field brine duplicates have been taken at approximately 1 in 11 intervals.

www.kaliumlakes.com.au Page 20 of 35
Criteria JORC Code explanation Commentary
Quality of assay data and laboratory tests
• The nature, quality and appropriateness of the assaying and laboratory procedures used and whether the technique is considered partial or total.
• For geophysical tools, spectrometers, handheld XRF instruments, etc, the parameters used in determining the analysis including instrument make and model, reading times, calibrations factors applied and their derivation, etc.
• Nature of quality control procedures adopted (e.g. standards, blanks, duplicates, external laboratory checks) and whether acceptable levels of accuracy (i.e. lack of bias) and precision have been established.
• Elemental analysis of brine samples are performed by Perth laboratory, the Bureau-Veritas (BV) (formerly Amdel/Ultrace) mineral processing laboratories. BV is certified to the Quality Management Systems standard ISO 9001. Additionally, they have internal standards and procedures for the regular calibration of equipment and quality control methods.
• Laboratory equipment are calibrated with standard solutions. • Analysis methods for the brine samples used are inductively coupled plasma optical emission spectrometry,
Ion Selective Electrode, Inductive coupled plasma mass spectroscopy , volumetrically and colourimetrically. • The assay method and results are suitable for the calculation of a resource estimate. • Repeat assays and reference standards have been undertaken and indicate an average error of less than 5%. • BMR tool calibration was completed by Qtec the developers of the BMR tool utilised (BMR-60). The diameter
of investigations was 280 mm, the signal to noise ratio at this depth of investigation was deemed acceptable. • BMR T2 calibration and cut-offs have been discussed in the report.
Verification of sampling and assaying
• The verification of significant intersections by either independent or alternative company personnel.
• The use of twinned holes. • Documentation of primary data, data entry procedures, data
verification, data storage (physical and electronic) protocols. • Discuss any adjustment to assay data.
• Multiple samples have also been taken from nearby locations during sampling to verify assay results and sampling methods.
• Assays have been completed on samples taken up to two years apart indicating consistent grade. • Assays have been completed on samples obtained from pumping of the aquifer units on a daily basis of up to
29 days at a single location to determine variability of grade during pumping. • Field parameters of SG and total salinity have been taken. • Data concerning sample location was obtained in the field, data entry then performed back in the Perth office
to an electronic database and verified by Advisian. • Assay data remains unadjusted. • Sonic cores are twin holes of exploration air core holes.
Location of data points
• Accuracy and quality of surveys used to locate drill holes (collar and down-hole surveys), trenches, mine workings and other locations used in Mineral Resource estimation.
• Specification of the grid system used. • Quality and adequacy of topographic control.
• Hole location coordinates obtained by a qualified mines surveyor using a Trimble RTK GPS with an accuracy of +/- 25mm in X,Y and +/- 50mm in Z.
• Regional auger holes have been surveyed using a hand held GPS. • The grid system used was MGA94, Zone 51.
Data spacing and distribution
• Data spacing for reporting of Exploration Results. • Whether the data spacing and distribution is sufficient to
establish the degree of geological and grade continuity appropriate for the Mineral Resource and Ore Reserve estimation procedure(s) and classifications applied.
• Whether sample compositing has been applied.
• Drill spacing is discussed in the report. • The drill holes are not on an exact grid due to the irregular spatial nature of the deep targets and access issues
when traversing the lakes.
Orientation of data in relation to geological structure
• Whether the orientation of sampling achieves unbiased sampling of possible structures and the extent to which this is known, considering the deposit type.
• If the relationship between the drilling orientation and the orientation of key mineralised structures is considered to have introduced a sampling bias, this should be assessed and reported if material.
• Not applicable, considering the deposit type. • All drill holes are vertical given the estimated flat lying structure of a salt lake.

www.kaliumlakes.com.au Page 21 of 35
Criteria JORC Code explanation Commentary
Sample security • The measures taken to ensure sample security. • Samples are labelled and transported by KLL personnel to Perth. They are then hand delivered to BV laboratories by KLL personnel.
Audits or reviews The results of any audits or reviews of sampling techniques and data.
• Advisian has conducted a review of works undertaken previously by AQ2 and K-UTEC. • A data review is summarised in the Mineralisation and Resource estimate section of this report. • No audits were undertaken.
Section 2 – Reporting of Exploration Results
Criteria JORC Code explanation Commentary
Mineral tenement and land tenure status
• Type, reference name/number, location and ownership including agreements or material issues with third parties such as joint ventures, partnerships, overriding royalties, native title interests, historical sites, wilderness or national park and environmental settings.
• The security of the tenure held at the time of reporting along with any known impediments to obtaining a licence to operate in the area.
• The BSOPP is 100% owned by Kalium Lakes Limited (KLL or Kalium Lakes) with project tenure held under granted exploration licences: E69/3306, E69/3309, E69/3339, E69/3340, E69/3341, E69/3342, E69/3343, E69/3344, E69/3345, E69/3346, E69/3347, E69/3348, E69/3349, E69/3351, E69/3352.
• KLL also has granted Mining Licences: M69/145 and M69/146. • KLL also has granted Miscellaneous Licences: L52/162, L52/186; L52/187, L52/187, L52/193, L69/28, L69/29,
L69/30, L69/31, L69/32, L69/34, L69/35, L69/36. • KLL has a land access and mineral exploration agreement, and a Mining Land Access Agreement with the
Mungarlu Ngurrarankatja Rirraunkaja (MNR) Aboriginal Corporation over tenures E69/3339, E69/3340, E69/3342, E69/3343, E69/3344, E69/3345, E69/3348, E69/3349 and E69/3351.
• KLL has an exploration and prospecting deed of agreement, and a Mining Land Access Agreement with the Gingirana Native Title Claim Group over tenures E69/3306, E69/3309, E69/3341, E69/3346, E69/3347, E69/3348, E69/3351 and E69/3352.
• MNR and Gingirana have provided letters of Consent to the grant of Mining Leases and Miscellaneous Licences.
Exploration done by other parties
• Acknowledgment and appraisal of exploration by other parties.
• There has been no previous exploration for SOP at the BSOPP by third parties.
Geology • Deposit type, geological setting and style of mineralisation. • The deposit is a brine containing potassium and sulphate ions that can form a potassium sulphate salt. The brine is contained within saturated sediments below the lake surface and in sediments adjacent to the lake. The lakes sit within a broader palaeovalley system that extends over hundreds of kilometres, this system has been eroded into the North-West Officer Basin sediments.
Drillhole Information
A summary of all information material to the understanding of the exploration results including a tabulation of the following information for all Material drillholes:
• easting and northing of the drillhole collar • elevation or RL (Reduced Level – elevation above sea level in
metres) of the drillhole collar • dip and azimuth of the hole • downhole length and interception depth • hole length.
• Information has been included in drill collar tables and bore logs appended to this report or previously reported.
• All holes are vertical.

www.kaliumlakes.com.au Page 22 of 35
Criteria JORC Code explanation Commentary
If the exclusion of this information is justified on the basis that the information is not Material and this exclusion does not detract from the understanding of the report, the Competent Person should clearly explain why this is the case.
Data aggregation methods
• In reporting Exploration Results, weighting averaging techniques, maximum and/or minimum grade truncations (eg cutting of high grades) and cut-off grades are usually Material and should be stated.
• Where aggregate intercepts incorporate short lengths of high grade results and longer lengths of low grade results, the procedure used for such aggregation should be stated and some typical examples of such aggregations should be shown in detail.
• The assumptions used for any reporting of metal equivalent values should be clearly stated.
• No grade cut-offs have been used. • Data aggregation comprised calculation of volume weighted average potassium, sulphate and magnesium
concentration of all Specific Yield and Total Porosity within a Resource area for a given geological unit (i.e. All palaeochannel sand and silcrete zones per area were aggregated and summarised as a volume weighted average).
Relationship between mineralisation widths and intercept lengths
• These relationships are particularly important in the reporting of Exploration Results.
• If the geometry of the mineralisation with respect to the drillhole angle is known, its nature should be reported.
• If it is not known and only the down hole lengths are reported, there should be a clear statement to this effect (e.g. ‘downhole length, true width not known’).
• Not applicable.
Diagrams • Appropriate maps and sections (with scales) and tabulations of intercepts should be included for any significant discovery being reported These should include, but not be limited to a plan view of drill hole collar locations and appropriate sectional views.
• Refer to figures/tables in this announcement.
Balanced reporting • Where comprehensive reporting of all Exploration Results is not practicable, representative reporting of both low and high grades and/or widths should be practiced to avoid misleading reporting of Exploration Results.
• All pertinent results have been reported.

www.kaliumlakes.com.au Page 23 of 35
Criteria JORC Code explanation Commentary
Other substantive exploration data
• Other exploration data, if meaningful and material, should be reported including (but not limited to): geological observations; geophysical survey results; geochemical survey results; bulk samples – size and method of treatment; metallurgical test results; bulk density, groundwater, geotechnical and rock characteristics; potential deleterious or contaminating substances.
• Approximately 1,105 km of gravity and passive seismic geophysical surveys have been completed. The tests were performed to define the deepest parts of the palaeochannel, with traverses undertaken across the channel, extending from 10 Mile Lake to T-Junction Lake.
• Additionally, NanoTEM geophysical surveys have been completed in 2017 to distinguish between highly conductive and less conductive areas to support the passive seismic and gravity interpretations.
• XRF and XRD analysis of the lake sediments has provided a breakdown of the minerals and their percent components of the lake sediments.
• Metallurgical and mineral processing test work has included bench scale solar evaporation tests, milling, flotation and conversion. The results of the test work have enabled preliminary process plant design for the Beyondie brine.
• Other companies have regionally performed exploration for similar brine deposits.
Further work • The nature and scale of planned further work (eg tests for lateral extensions or depth extensions or large-scale step-out drilling).
• Diagrams clearly highlighting the areas of possible extensions, including the main geological interpretations and future drilling areas, provided this information is not commercially sensitive.
• More extensive drilling may confirm the occurrence of basal sands and sandstones throughout the whole palaeodrainage system to the East of the Stage 1 area.
Section 3 Estimation and Reporting of Mineral Resources (Criteria listed in section 1, and where relevant in section 2, also apply to this section.)
Criteria JORC Code explanation Commentary
Database integrity • Measures taken to ensure that data has not been corrupted by, for example, transcription or keying errors, between its initial collection and its use for Mineral Resource estimation purposes.
• Data validation procedures used.
• Cross-check of laboratory assay reports and database. • Review of sample histograms used in Resource models. • QA/QC analysis and protocols as described in Section 10.
Site visits • Comment on any site visits undertaken by the Competent Person and the outcome of those visits.
• If no site visits have been undertaken indicate why this is the case.
• Multiple site visits have been undertaken throughout the field program that has verified the data obtained. • All other site visits are discussed in Section 8.
Geological interpretation
• Confidence in (or conversely, the uncertainty of ) the geological interpretation of the mineral deposit.
• Nature of the data used and of any assumptions made. • The effect, if any, of alternative interpretations on Mineral
Resource estimation.
• The resource is contained within Cenozoic Palaeovalley stratigraphy and the underlying fractured and weathered bedrock.
• The geological model for the indicated and measured resources is well constrained. Drill hole coverage is relatively consistent for the scale of the project, and the deposit is not structurally complex; it is alluvial fill in a palaeovalley depo-centre, within a shallow dipping large sedimentary basin.

www.kaliumlakes.com.au Page 24 of 35
Criteria JORC Code explanation Commentary
• The use of geology in guiding and controlling Mineral Resource estimation.
• The factors affecting continuity both of grade and geology.
• The geological model for the fractured bedrock is less certain, the continuity and structural controls on rock fracturing are not well understood, but can be mapped in geophysical responses and is considered to be associated with the unconformity between formations and structural orientation.
• The geological interpretation informs the volume of the resource. • The nature of aquifer properties in different geologies does affect grade, where transmissivity appears to be
a minor diluting factor in the highest areas of the brine grade. In addition the bedrock appears to be elevated in potassium which likely to be a source of the resource.
• The paleo-topography is key to the determining the aquifers with the highest transmissivity and predicting their extent within the vicinity of the surficial lakes where brine grade, specific yield and transmissivity are highest.
Dimensions • The extent and variability of the Mineral Resource expressed as length (along strike or otherwise), plan width, and depth below surface to the upper and lower limits of the Mineral Resource.
• The length of the mineral resource is defined by the company’s tenement boundaries which have been fit to the margins of the salt lake/palaeodrainage system. Where the tenement boundary is wider than the palaeochannel system, the palaeochannel boundaries have been defined by geophysical surveys (gravity, passive seismic and TEM).
• The thickness of the hosting aquifer holding the brine mineral resources has been based on the groundwater elevation (measured as depth below surface) and a sediment thickness above the impermeable bedrock.
• The mineral resource extends laterally outside of KLL tenement boundaries in some cases, notably at 10 Mile Lake.
• The volume of brine that can be abstracted has been based on a combination of aquifer test pumping and core calibrated geophysical techniques using Borehole Magnetic Resonance (BMR).
Estimation and modelling techniques
• The nature and appropriateness of the estimation technique(s) applied and key assumptions, including treatment of extreme grade values, domaining, interpolation parameters and maximum distance of extrapolation from data points. If a computer assisted estimation method was chosen include a description of computer software and parameters used.
• The availability of check estimates, previous estimates and/or mine production records and whether the Mineral Resource estimate takes appropriate account of such data.
• The assumptions made regarding recovery of by-products. • Estimation of deleterious elements or other non-grade
variables of economic significance (eg sulphur for acid mine drainage characterisation).
• In the case of block model interpolation, the block size in relation to the average sample spacing and the search employed.
• Any assumptions behind modelling of selective mining units. • Any assumptions about correlation between variables.
• Modelling procedures and parameters are discussed in Section Error! Reference source not found.. Additional details are presented below were relevant.
• Potassium, sulphate and magnesium concentration point data were separated by project area (10 Mile Lake and Lake Sunshine) and imported into the leapfrog modelling domain.
• Sand and silcrete zones have been defined by the presence of either one of these facies in the lithological log, these maybe of weathered bedrock origin or transported origins.
• Resource zones were derived in GIS software using drill hole spacing and areas of measured drawdown from extended duration aquifer testing.
• The block model cell sizes took into account the density of the sample spacing within the Measured Resource zones so that on average of at least one sample was attributed to each block in the x and y directions. The block spacing of the z direction considered the vertical variability of the brine within lithologies, an increase in grade with depth is observed in each lithology therefore high resolution z component (2.5 to 5 m) was selected to allow for pinching geology, so this trend in grade variability can be accurately represented. Automatic sub-blocking was used where complex geological contacts are present or greater resolution of sampling was available.
• Volumetric weighted average of SOP grade per Resource Zone was calculated where multiple zones are determined (i.e. upper sand and basal sand zones have been merged into a sand and silcrete group by volumetric weighted average to determine SOP grade).
• Selective mining units have not been considered.

www.kaliumlakes.com.au Page 25 of 35
Criteria JORC Code explanation Commentary
• Description of how the geological interpretation was used to control the resource estimates.
• Discussion of basis for using or not using grade cutting or capping.
• The process of validation, the checking process used, the comparison of model data to drill hole data, and use of reconciliation data if available.
• There are no assumptions about correlation between variables. • No cut-off grade has been used.
Moisture • Whether the tonnages are estimated on a dry basis or with natural moisture, and the method of determination of the moisture content.
• Tonnages of potassium have been estimated on a dry, weight volume basis (%w/v). For example, 10 kg potassium per cubic metre of brine.
Cut-off parameters • The basis of the adopted cut-off grade(s) or quality parameters applied.
• No cut-off grade has been used in this Resource update so that a longer life of mine can be sustained during the in-progress Reserve update.
Mining factors or assumptions
• Assumptions made regarding possible mining methods, minimum mining dimensions and internal (or, if applicable, external) mining dilution. It is always necessary as part of the process of determining reasonable prospects for eventual economic extraction to consider potential mining methods, but the assumptions made regarding mining methods and parameters when estimating Mineral Resources may not always be rigorous. Where this is the case, this should be reported with an explanation of the basis of the mining assumptions made.
• The mining method will be recovery of brine from the underground salt lake by submersible bore pumps targeting the deeper aquifer and shallow trenches targeting the surficial aquifer.
• Though specific yield and total porosity provide a measure of the volume of brine present in an aquifer system, hydraulic conductivity and transmissivity controls are the main factor in defining Mining factors and are discussed in the Reserve.
• It is not possible to extract all the contained brine with these methods, due to the natural physical dynamics of abstraction from an aquifer.
• The Reserve is required to quantify the economically extractable resources.
Metallurgical factors or assumptions
• The basis for assumptions or predictions regarding metallurgical amenability. It is always necessary as part of the process of determining reasonable prospects for eventual economic extraction to consider potential metallurgical methods, but the assumptions regarding metallurgical treatment processes and parameters made when reporting Mineral Resources may not always be rigorous. Where this is the case, this should be reported with an explanation of the basis of the metallurgical assumptions made.
• Chemical assays of brine waters suggest a similar chemical composition to other exploration SOP projects in Western Australia. Feasibility studies abroad have demonstrated that SOP recovery is possible with conventional mineral processing techniques.
• Metallurgical test work on brine water has been carried out in both small scale lab benchtop trials and larger scale evaporation pilot ponds with confirmed results to the efficacy of standard metallurgical recovery methods.
Environmental factors or assumptions
• Assumptions made regarding possible waste and process residue disposal options. It is always necessary as part of the process of determining reasonable prospects for eventual economic extraction to consider the potential environmental impacts of the mining and processing operation. While at this stage the determination of potential environmental impacts, particularly for a greenfields project, may not always be well advanced, the status of early consideration of
• The project is expected to have a limited, localized environmental impact, with minor impacts on surface disturbance associated with excavation, adjacent ”fresher” aquifer systems, stockpiling of salt by-products, stygofauna and potentially groundwater dependent vegetation.
• The project is located in a very remote area and does not expect to contain significant quantities of waste tailings.
• Acid mine drainage is not expected to be an issue.

www.kaliumlakes.com.au Page 26 of 35
Criteria JORC Code explanation Commentary
these potential environmental impacts should be reported. Where these aspects have not been considered this should be reported with an explanation of the environmental assumptions made.
Bulk density • Whether assumed or determined. If assumed, the basis for the assumptions. If determined, the method used, whether wet or dry, the frequency of the measurements, the nature, size and representativeness of the samples.
• The bulk density for bulk material must have been measured by methods that adequately account for void spaces (vugs, porosity, etc), moisture and differences between rock and alteration zones within the deposit.
• Discuss assumptions for bulk density estimates used in the evaluation process of the different materials.
• Tonnages of potassium have been estimated on a dry, weight volume basis(%w/v). For example, 10 kg potassium per cubic metre of brine.
• As the resource is a brine, bulk density is not applicable. • The resource has been calculated from Sy (drainable porosity) determined using a combination of aquifer
testing and laboratory calibrated geophysical methods.
Classification • The basis for the classification of the Mineral Resources into varying confidence categories.
• Whether appropriate account has been taken of all relevant factors (i.e. relative confidence in tonnage/grade estimations, reliability of input data, confidence in continuity of geology and metal values, quality, quantity and distribution of the data).
• Whether the result appropriately reflects the Competent Person’s view of the deposit.
• At this stage of the project an exploration target, inferred, indicated and measured resource are defined. The CIM Best Practice Guidelines for Resource and Reserve Estimation for Lithium Brines and JORC code were used to determine these confidence categories.
Audits or reviews • The results of any audits or reviews of Mineral Resource estimates.
• None
Discussion of relative accuracy/ confidence
• Where appropriate a statement of the relative accuracy and confidence level in the Mineral Resource estimate using an approach or procedure deemed appropriate by the Competent Person. For example, the application of statistical or geostatistical procedures to quantify the relative accuracy of the resource within stated confidence limits, or, if such an approach is not deemed appropriate, a qualitative discussion of the factors that could affect the relative accuracy and confidence of the estimate.
• The statement should specify whether it relates to global or local estimates, and, if local, state the relevant tonnages, which should be relevant to technical and economic evaluation. Documentation should include assumptions made and the procedures used.
• The mineral resource contains aqueous potassium, sulphate and other ions, existing as a brine in a sub-surface salt lake. The current JORC code (2012) deals predominantly with solid minerals, and does not deal with liquid solutions as a resource. The relative accuracy of the stated resource considers the geological uncertainties of dealing with a brine. See also: CIM Best Practice Guidelines for Resource and Reserve Estimation for Lithium Brines, Prepared by the Sub-Committee on Best Practice Guidelines for Resource and Reserve Estimation for Lithium Brines.
• Kalium Lakes is part of the Association of Mining and Exploration Companies (AMEC) Potash Working Group which has developed guidelines to define a brine Mineral Resource and Ore Reserve, in order to increase the certainty, clarity and transparency in reporting of these resources.
• Specific Yield (Sy) estimates to determine drainable brine volume in this Resource estimate have used industry first techniques. However, these techniques are industry best practice in the petroleum industry for estimating Reservoir volumes of all components of a petroleum reservoir therefore are considered to be “industry leading”. Traditional core derived analysis is point based, whilst a continuous log provides a far better means to deriving average properties for individual lithologies.

www.kaliumlakes.com.au Page 27 of 35
Criteria JORC Code explanation Commentary
• These statements of relative accuracy and confidence of the estimate should be compared with production data, where available.
• BMR technology has only recently been made financially economical in the brine resource industry by the use slim-line tools with low sign to noise ratios and appropriate depths of investigation.
Section 4 Estimation and Reporting of Ore Reserves (Criteria listed in section 1, and where relevant in section 2 and 3, also apply to this section.)
Criteria Explanation Comments
Mineral Resource estimate for conversion to Ore Reserves
• Description of the Mineral Resource estimate used as a basis for the conversion to an Ore Reserve.
• Clear statement as to whether the Mineral Resources are reported additional to, or inclusive of, the Ore Reserves.
• See Resources table above (JORC Table 1, Section 3 – Estimation and Reporting of Mineral Reserve), the modelling process and Mineral Reserve estimate are also detailed above.
• Indicated and Measured Resources are reported inclusive of Ore Reserves.
• No inferred resources are included in the Reserve estimate.
Site visits • Comment on any site visits undertaken by the Competent Person and the outcome of those visits.
• If no site visits have been undertaken indicate why this is the case.
• Three site visits by the Competent Persons, the first during August 2015, the second during June 2017 and the third during January/February 2018 . Details of site visit outcomes are described in the relevant site visit reports [7], [11], [19].
Study status • The type and level of study undertaken to enable Mineral Resources to be converted to Ore Reserves.
• The Code requires that a study to at least Pre-Feasibility Study level has been undertaken to convert Mineral Resources to Ore Reserves. Such studies will have been carried out and will have determined a mine plan that is technically achievable and economically viable, and that material Modifying Factors have been considered.
• The Ore Reserve Estmate has been completed in conjunction with a Bankable Feasibility Study with a +/-15% level of accuracy.
• A mine plan has been developed utilising all reserves and resources for the mine production scenarios to support the BFS.
Cut-off parameters
• The basis of the cut-off grade(s) or quality parameters applied.
• A cut off grade of 2,500 mg/L has been applied to the Reserve.
• The solute transport model has been used to predict the grade over the life of mine from each abstraction point, where grades at the abstraction point diminishes below the cut-off grade the production is omitted from the Reserve.
Mining factors or assumptions
• The method and assumptions used as reported in the Pre-Feasibility or Feasibility Study to convert the Mineral Resource to an Ore Reserve (i.e. either by application of appropriate factors by optimisation or by preliminary or detailed design).
• The choice, nature and appropriateness of the selected mining method(s) and other mining parameters
• The volume of convertible resources has been determined by detailed numerical groundwater flow and solute transport modelling. Modelling has been completed to the Australian Groundwater Modelling Guidelines [14] using the FeFlow modelling package [15].
• The construction of the numerical groundwater model is based on the geological model derived from drill data. Drill spacing is such to have high confidence in geology and brine distribution in the resource areas.

www.kaliumlakes.com.au Page 28 of 35
Criteria Explanation Comments
including associated design issues such as pre-strip, access, etc.
• The assumptions made regarding geotechnical parameters (eg pit slopes, stope sizes, etc), grade control and pre-production drilling.
• The major assumptions made and Mineral Resource model used for pit and stope optimisation (if appropriate).
• The mining dilution factors used. • The mining recovery factors used. • Any minimum mining widths used. • The manner in which Inferred Mineral Resources are
utilised in mining studies and the sensitivity of the outcome to their inclusion.
• The infrastructure requirements of the selected mining methods.
• Calibration of the groundwater model to steady state and transient conditions (test pumping data from trenches and bores and trial pond pumping) using an iterative process of manual and automated calibration to reduce statistical residual error between observed data and simulated data.
• Sensitivity analysis to “compare model outputs with different sets of reasonable parameter estimates, both during the period of calibration (the past) and during predictions (in the future)” [14].
• Predictive modelling of the resource recovery by adding production bores within the deep aquifer and extending trenches over the lake surface and simulating pumping rates over the life of mine (30 years).
• Concentration of potassium has been directly input to the numerical model from the block model and simulated using conservative transport parameters.
• Abstraction is mapped using capture zone analysis, any abstraction originating from outside of the Resource zone is factored out of the Reserve calculation.
• Trial lake surface trenches and deep production bores have been tested in the field and proved successful in abstraction of brine. The construction methodology, design and cost determined from the field studies has been adopted for the feasibility study.
• Well efficiencies have been taken into account when simulating abstraction rates. An average well efficiency of 60% is derived for the abstraction assessment.
• Grade control in brine resources relates to the target grade of brine delivered to the concentor ponds. Flexibility in the infrastructure design is considered the grade control management measures.
• Inferred Resources are not included in the Reserve estimate. Inferred Resources make up the later part of the mine plan.
• Hydraulic models have been developed to ensure brine pumping can be undertaken with the selected pipes and pumps in the study.
• New abstraction bores, headworks, power supply, pumping, telemetry and monitoring have been incorporated in the design.
Metallurgical factors or assumptions
• The metallurgical process proposed and the appropriateness of that process to the style of mineralisation.
• Whether the metallurgical process is well-tested technology or novel in nature.
• The nature, amount and representativeness of metallurgical test work undertaken, the nature of the metallurgical domaining applied and the corresponding metallurgical recovery factors applied.
• Any assumptions or allowances made for deleterious elements.
• The existence of any bulk sample or pilot scale test work and the degree to which such samples are considered representative of the orebody as a whole.
• For minerals that are defined by a specification, has the ore reserve estimation been based on the appropriate mineralogy to meet the specifications?
• The metallurgical process is covered broadly through the following stages; Evaporation pond crystallization and harvest of KTMS; Pre-treatment of harvested KTMS; conversion of KTMS to Schoenite; Flotation; Cooling crystallization; conversion of Schoenite to SOP; Dewatering; Drying and Compaction. The process is considered appropriate given the high potassium brine based nature of the mineralisation.
• For 82 ktpa SOP, the project will require: 36 extraction bores, 58 km of trenches, 7.9 – 9.4 GL/a brine flow, 445 hectares of evaporation ponds. For 164 ktpa SOP, the project will require: 41 extraction bores, 58 km of trenches, 10.9 – 17.8 GL/a brine flow, 1,118 hectares of evaporation ponds. Both throughputs include: 8,766 evaporation pond operating hours per year, 94% evaporation pond recovery, 1 mm sealed HDPE lined ponds, 7,500 purification plant operating hours and 77% purification plant recovery.
• The metallurgical process proposed is similar to that used by major existing SOP producers in Utah(Compass Minerals), Luobupo (SDIC), Salar de Atacama(SQM).
• Ten discrete metallurgical test phases were undertaken, utilising a five different industry recognised consultants. Test phases varied from small bench scale evaporation tests, to 10 hectare site pilot pond works and pilot plant testing by K-UTEC.
• There are no elements in the BSOPP brine that are likely to be deleterious.

www.kaliumlakes.com.au Page 29 of 35
Criteria Explanation Comments
• Metallurgical test work has successfully produced SOP of sufficient product purity. Metallurgical test work included the complete process from treatment of feed brine to final production of SOP.
• Initially, a total volume of 2m3 of partially evaporated brine at a density of 1.28 g/cm3 was sent to K-UTEC’s facilities in Sondershausen, Germany for preliminary process test work, see Error! Reference source not found. Error! Reference source not found.. This was followed up with several tonnes of crystallized KTMS produced at the BSOPP’s pilot pond for K-UTEC’s pilot plant and BFS optimisation works, see Error! Reference source not found.. More than 10,000 tonnes of salts have been produced so far, including 3,160 tonnes of mixed potassium salts that can be processed to generate approximately 520 tonnes of SOP, see Error! Reference source not found.. The brine used to produce these bulk samples is from the 10 Mile Lake area, and is a mixture of the surficial and palaeochannel aquifers.
• Hypersaline potash brine is not defined by any specifications.
Environmental • The status of studies of potential environmental impacts of the mining and processing operation. Details of waste rock characterisation and the consideration of potential sites, status of design options considered and, where applicable, the status of approvals for process residue storage and waste dumps should be reported.
• KLL has engaged with key stakeholders such as the Office of the Environmental Protection Authority (OEPA) Terrestrial Branch, DPaW regional experts and Traditional Owners. The issues raised that may represent project constraints and the management actions have been identified and potential management actions are being implemented.
• A biological study programme occurred during 2015-2018 and enabled project planning and impact assessment to commence. The study programme entailed a Level 2 survey for flora and vegetation, fauna and lake fringing vegetation. At this stage, subterranean fauna is not a significant impact on the basis of a maximum allowable drawdown of 50% of the freshwater aquifer plus and adaptive management plan to rotate the use of bores of the 4 fresh water areas.
• Early works approvals are in place from the Environmental Protection Authority of Western Australia (EPA) and Department of Mines, Industry Regulation and Safety (DMIRS), with formal approval for the full-scale project anticipated to be in place during Q4 2018. The bitterns comprising MgCl2 / MgSO4 are proposed to be recovered as Magnesium salts and may be sold if viable. If excess to market requirements they will be placed with the excess halite on 10 Mile Lake or used for dust suppression around the site.
Infrastructure • The existence of appropriate infrastructure: availability of land for plant development, power, water, transportation (particularly for bulk commodities), labour, accommodation; or the ease with which the infrastructure can be provided, or accessed.
• Infrastructure at the mine area, including workshops, warehousing and power generation, will be located within finite footprints and granted exploration tenements, adjacent to the processing plant, to enable control of access and easy operability and maintainability. Ancillary infrastructure is situated within the tenements at locations to provide suitable access and drainage, whilst preventing inundation during or following a storm event.
• The central site administration area is located where the access road enters the site from the west. This area comprises the main administration building, emergency services, laboratory, communications hub, general workshops, stores and fuel farm.
• Fuel for power generation will be supplied in LNG gas bullets for the initial development, or eventually via a 78 km gas spur to be built from the Goldfields Gas Pipeline (GGP) for production levels exceeding 82 ktpa. Access to the Goldfield Gas Pipeline located approximately 78 km to the west of the proposed mine site is achievable and KLL have commenced discussions with APA to confirm tie in and pipeline extension requirements and costs.
• The accommodation village site is located between the proposed process plant and the northern bank of 10 Mile lake, isolated from plant noise and lake surface water by a small elevated hill. The village includes accommodation, recreational facilities such as a sports court and gym, waste water

www.kaliumlakes.com.au Page 30 of 35
Criteria Explanation Comments
treatment, potable water supply and a dedicated power generator. The village will be constructed as part of an Early Works package to provide accommodation for the construction workforce. The accommodation village will be designed to provide housing and messing for ~60 people at the project area.
• Raw water will be pumped from water supply bores located within an area extending West and South of the process plant site. Approximately 1.5-2 GL/a of raw water will be required for the process plant and potable water for 164 ktpa SOP production. Each bore pump will be powered by its own diesel generator through a local control panel, with a wireless telemetry link to the central control system at the plant. Each system will be installed in a fenced compound with a self-bunded diesel storage tank sized to allow for sufficient buffer capacity. Above ground HDPE pipelines will transfer water to a central raw water tank located at the process plant. The raw water tank is sized to hold the required water reserve for fire-fighting purposes, available as a priority supply from a separate flange appropriately positioned on the tank and distributed via fire water pumps. A separate flange and raw water pump set will supply raw water to the workshops, process plant area, administration offices, and Emergency Services Area. A separate water storage tank / fire tank will be situated at the village. Fire and general-purpose water will be reticulated in a common system.
• Raw (bore) water will be treated to potable water standards at the village and workshop area, by packaged plants consisting of fine filtration followed by reverse osmosis, a chlorine dosing and UV treatment. The filtration will remove fine particles from the raw water, while the cal-hypo chlorine dosing system will disinfect the water to meet the requirements of the Australian Drinking Water Guidelines.
• Communications infrastructure will allow a single-channel CB radio envelope along the site access road, with mobile or portable radios operating over a dual-channel, digital mobile radio (DMR) system servicing the main plant and accommodation area and remote borefields. The DMR integrates with the site telemetry system for monitoring of bores. The radio system will also provide a high-speed IP data link to the Telstra 4G network service at Kumarina Roadhouse. A site-LAN will be installed, with access provided via the Wi-Fi network installed as part of the radio system.
• A contractor-operated laboratory building will be installed onsite along with the construction of administration buildings, maintenance workshops and warehouses.
Costs • The derivation of, or assumptions made, regarding projected capital costs in the study.
• The methodology used to estimate operating costs. • Allowances made for the content of deleterious
elements. • The derivation of assumptions made of metal or
commodity price(s), for the principal minerals and co-products.
• The source of exchange rates used in the study. • Derivation of transportation charges. • The basis for forecasting or source of treatment and
refining charges, penalties for failure to meet specification, etc.
• The Capital cost estimate was based on the following fundamentals: o Work Breakdown Structure.
o Material Take-Offs from designs for construction and fabrication.
o Mechanical equipment list, specifications & data sheets.
o Electrical equipment load list.
o Vehicle list.
o Proposals (materials & equipment supply, installation, design & construct, etc.).
o Proposals for construction road freight.
o Freight estimates based on supply weight / volume requirements per 23t payload trailer (2.4m x
14m).
o Direct labour hours and rates build up by first principles.
o Benchmarked allowances and factors (minimal).

www.kaliumlakes.com.au Page 31 of 35
Criteria Explanation Comments
• The allowances made for royalties payable, both Government and private.
o Preferred contracting strategies.
o Use of existing knowledge from previous experience information where no other source was
available.
o Contingency based on capex input confidence and discreet risk modelling.
• The capital cost estimate was completed to an accuracy meeting the criteria of The Association for the Advancement of Cost Engineering (AACE) Class 3 estimate accuracy of ±15%.
• The BFS has developed an operating cost estimate (OPEX) for the BSOPP with an accuracy better than ±15%. The OPEX includes the operating expenditure required to crystallise, process and transport product to Fremantle and Geraldton Port, and various off-take locations, including shipping to the eastern states of Australia, China, Singapore, the USA and New Zealand. All costs are in 2018 Australian dollars.
• The operating cost has been developed around cost elements with the primary activities and items included. The following assumptions have been made associated with operating costs and the base case operating philosophy: o Overall management will be undertaken by KLL.
o Owner operated operations for ex-works production.
o A Haulage contractor will be engaged to provide all transport of SOP product form the site to the
distribution centres in Perth and Geraldton.
o Contractor proposals have been received and form the basis of transportation charges, port and
shipping charges.
o Accommodation villages will be Contractor operated.
o FIFO flights for all personnel will be arranged and managed by KLL.
o Flights have been based on commercial services between Perth and Newman.
o Diesel fuel will be purchased in bulk and distrsibuted by KLL.
o Gas will be supplied as Liquid Natural Gas (LNG) by a new lateral tie-in to the Goldfields Gas
Pipeline (GGP) near Kumarina roadhouse on the Great Northern Highway (GNH), or as
Liquefied Natural Gas (LNG).
o Power will be provided via a 5 year Build Own Operate (BOO) contractor.
o Carbon tax has been excluded.
o Allowances for maintenance down time have been considered by operating unit.
o The estimate base date is Q3, 2018.
o Escalation of the estimate past the base date has been excluded.
o All costs are in Australian dollars (AUD).
o An exchange rate of AU$1.00 = US$0.75 has been used during operations where necessary
based on Bloomberg Rates.
o GST has been excluded.
o Contingency has been applied to the Ex-Works and FOB estimates.

www.kaliumlakes.com.au Page 32 of 35
Criteria Explanation Comments
o All tonnages are on a dry basis unless otherwise indicated. o WA Royalty Rate – non-beneficiated - A$0.73/t SOP o Native Title Royalty – unable to provide o Founders’ Royalty - 1.9% gross revenue
Revenue factors • The derivation of, or assumptions made regarding revenue factors including head grade, metal or commodity price(s) exchange rates, transportation and treatment charges, penalties, net smelter returns, etc.
• The derivation of assumptions made of metal or commodity price(s), for the principal metals, minerals and co-products.
• Product specifications identified and replicated with metallurgical test work.
• Market reports from CRU, Profercy, Greenmarkets, Fertecon and Integer have been utilised to derive the assumption for the SOP price.
• A detailed SOP market study was commissioned by KLL and provided by CRU in September 2018,
this has been used as the basis for the commodity price, forecasted US$606/t average LOM SOP
sales @ $A/$US exchange rate of 0.73.
• CRU estimates that CFR Australian prices in KLL’s first year of full production (2022) will be
US$530/t with prices rising to US$961-997/t in 2040. CRU forecasts a 2.8%pa growth in SOP.
Market assessment
• The demand, supply and stock situation for the particular commodity, consumption trends and factors likely to affect supply and demand into the future.
• A customer and competitor analysis along with the identification of likely market windows for the product.
• Price and volume forecasts and the basis for these forecasts.
• For industrial minerals the customer specification, testing and acceptance requirements prior to a supply contract.
• Demand, supply and stock situation determined for SOP by studying recent market reports from CRU, Fertecon, Green Markets, Profercy and Integer. Reports covered consumptions trends and discussions with factors that can likely affect supply and demand into the future. The reports also covered price and volume forecasts based on market trends.
• The proposed SOP product meets or exceeds current market accepted specifications.
• Offtake Terms Sheet executed with German fertiliser producer and distributor K+S for 100% of
Stage 1 production. The Offtake arrangement is subject to the execution of a formal binding offtake
agreement and satisfaction of certain conditions precedent, including completion of due diligence by
K+S.
• Kalium Lakes has signed non binding Letters of Intent with other offtake partners.
• A detailed customer and competitor analysis has been included in the CRU marketing study.

www.kaliumlakes.com.au Page 33 of 35
Criteria Explanation Comments
Economic • The inputs to the economic analysis to produce the net present value (NPV) in the study, the source and confidence of these economic inputs including estimated inflation, discount rate, etc.
• NPV ranges and sensitivity to variations in the significant assumptions and inputs.
• Discounted cash flow analysis (DCF) was used to calculate key project valuation indicators for the
project, in particular, the Net Present Value (NPV) and Internal Rate of Return (“IRR”). NPV, IRR
and payback periods are measures of the return that are generated based on the applied
assumptions. An 8% discount rate (post–tax, nominal) was used for NPV calculations. A 2%
inflation factor is used. The DCF were modelled on a quarterly basis in nominal terms, referenced to
CAPEX and OPEX developed in Australian dollars (A$). The project was analysed on an
unleveraged (100% equity) basis.
• The macro assumptions in the financial model are as follows:
o Discount Rate (post-tax nominal) – 8% o Corporate Tax Rate - Rate based on ATO guidance – 30% o Depreciation – Straight line o WA Royalty Rate – non-beneficiated - A$0.73/t SOP o Native Title Royalty – unable to provide o Founders’ Royalty - 1.9% gross revenue o Mine Life - Variable, subject to production rate o LOM Exchange Rate A$:US$ - $0.73
o A detailed SOP market study was commissioned by KLL and provided by CRU in September 2018, this has been used as the basis for the commodity price, forecasted US$606/t average LOM SOP sales @ $A/$US exchange rate of 0.73.
o CRU estimates that CFR Australian prices in KLL’s first year of full production (2022) will be US$530/t with prices rising to US$961-997/t in 2040. CRU forecasts a 2.8%pa growth in SOP.
o NPV ranges and sensitivities determined for key assumptions and inputs including,
SOP price, production rate, capital cost, operating cost, foreign exchange, discount
rate, recovery rates and construction delays.
Social • The status of agreements with key stakeholders and matters leading to social licence to operate.
• Two Native Title Land Access Agreements have been executed allowing for the consent to the grant of mining leases, ancillary tenure and approvals required for the BSOPP.
• The BSOPP tenements were originally applied for by Rachlan Holdings Pty Ltd (Rachlan) with an agreement in place to transfer tenure to KLL as soon as practicable after grant, which has occurred for all granted tenements to date.
• All relevant regulatory departments and authorities have been consulted extensively.
• Access agreements are in place with all pastoralists and neighbours that will allow construction and development of the project.
Other • To the extent relevant, the impact of the following on the project and/or on the estimation and classification of the Ore Reserves:
• Any identified material naturally occurring risks. • The status of material legal agreements and marketing
arrangements. • The status of governmental agreements and approvals
critical to the viability of the project, such as mineral tenement status, and government and statutory
• Kalium Lakes has reviewed the legislative requirements and has compiled a register of the environmental, heritage and planning approvals and permits necessary to scope, develop, construct and operate the BSOPP for each development phase. Each phase will require; new specific approvals, or utilise approvals granted in the prior phase, or seek to modify existing approvals. Approvals for the Pilot Scale Development Ponds and Pump Testing are currently in place, inclusive of a 5C dewatering licence for 1.5 Gl/pa. See Error! Reference source not found. for a detailed list of required approvals and current status.

www.kaliumlakes.com.au Page 34 of 35
Criteria Explanation Comments
approvals. There must be reasonable grounds to expect that all necessary Government approvals will be received within the timeframes anticipated in the Pre-Feasibility or Feasibility study. Highlight and discuss the materiality of any unresolved matter that is dependent on a third party on which extraction of the reserve is contingent.
• Early works approvals are in place from the Environmental Protection Authority of Western Australia (EPA) and Department of Mines, Industry Regulation and Safety (DMIRS), with formal approval for the full-scale project anticipated to be in place during Q4 2018.
• Two Mining Leases and 10 Miscellaneous Licences have been granted for the Beyondie SOP Project.
• The level of assessment being targeted is known as an Environmental Review, where an Environmental Review Document is prepared and submitted to the WA Environmental Protection Authority (EPA) for assessment under Part IV of the Environmental Protection Act 1986.
• Kalium Lakes has undertaken extensive consultation with leading agencies to confirm the approvals that will be required. Based on this consultation Kalium Lakes believes that there are reasonable grounds for Government approvals to be received within the timeframes anticipated in the Bankable Feasibility Study.
• Offtake Terms Sheet executed with German fertiliser producer and distributor K+S for 100% of Stage 1 production. The Offtake arrangement is subject to the execution of a formal binding offtake agreement and satisfaction of certain conditions precedent, including completion of due diligence by K+S.
• The Company is proposing to fund the project capital expenditure by a combination of up to 60% debt and the residual in equity.
• Debt financing is well advanced with initial due diligence completed and Expression of Interest (EOI) Term Sheets received.
• The Company estimates that approximately A$42 million of the project capital expenditure is expected to qualify under the German Export Credit Agency (ECA) scheme which has received a positive preliminary assessment decision by the German Government Inter-Ministerial Committee (IMC) and Euler Hermes Aktiengesellschaft (Hermes), the appointed export credit agency that administers the German ECA scheme for the German Government.
• Australian Government’s Northern Australia Infrastructure Facility (NAIF) has provided written confirmation that the NAIF Board has considered a Strategic Assessment Paper for the BSOPP and has consented to the NAIF Executive continuing its investigation.
Classification • The basis for the classification of the Ore Reserves into varying confidence categories.
• Whether the result appropriately reflects the Competent Person’s view of the deposit.
• The proportion of Probable Ore Reserves that have been derived from Measured Mineral Resources (if any).
• Proved and Probable Reserves have been estimated.
• Proved Reserves come from the production bores in the measured zones at Ten Mile and Sunshine deep aquifer. All trench pumps and all other production bores have been allocated to Probable Reserves. Though the lake surface has Measured Mineral Resources for the top 5 m the effects of variable recharge on this zone means that these Resources remain in the Probable category.
• 36% of the Probable Ore Reserves have been derived from the Lake Sediments, 64% from production bores.
• 24% of the Total Reserves have been derived from the Lake Sediments, 76% from production bores.
Audits or reviews
• The results of any audits or reviews of Ore Reserve estimates.
• The Ore Reserve Estimates was reviewed and audited by the Competent Persons.
• The Ore Reserves and the Competent Persons’ report was reviewed by Advisian.

www.kaliumlakes.com.au Page 35 of 35
Criteria Explanation Comments
Discussion of relative accuracy/ confidence
• Where appropriate a statement of the relative accuracy and confidence level in the Ore Reserve estimate using an approach or procedure deemed appropriate by the Competent Person. For example, the application of statistical or geostatistical procedures to quantify the relative accuracy of the reserve within stated confidence limits, or, if such an approach is not deemed appropriate, a qualitative discussion of the factors which could affect the relative accuracy and confidence of the estimate.
• The statement should specify whether it relates to global or local estimates, and, if local, state the relevant tonnages, which should be relevant to technical and economic evaluation. Documentation should include assumptions made and the procedures used.
• Accuracy and confidence discussions should extend to specific discussions of any applied Modifying Factors that may have a material impact on Ore Reserve viability, or for which there are remaining areas of uncertainty at the current study stage.
• It is recognised that this may not be possible or appropriate in all circumstances. These statements of relative accuracy and confidence of the estimate should be compared with production data, where available.
• Model sensitivity and predictive uncertainty analysis has been completed on the numerical models to determine the most sensitive parameters of the model and the reliability of the data used to gain an understanding of the relative accuracy of the model predictions.
• Highly sensitive uncertainties in the modelling include aquifer recharge and vertical leakage from the lacustrine clay. Modelling has taken a conservative approach to these parameters to ensure the model is representative of the level of understanding of the hydrogeology.
• NPV ranges and sensitivities determined for key assumptions and inputs including, SOP price, production rate, capital cost, operating cost, foreign exchange, discount rate and construction delays.
• See Section 24 for a list of potential risks.

Sondershausen, 17. September 2018 Thomas Schicht Anke Penndorf European Geologist (EurGeol) European Geologist (EurGeol) THIS DOCUMENTATION IS SUBJECT OF COPYRIGHT PROTECTION. PUBLICATION, REPRODUCTION AND SALE (EVEN IN PARTS) REQUIRE THE AGREEMENT OF THE
PUBLISHER. SOLELY OUR ORIGINALY SIGNED DOCUMENTS ARE OBLIGING. OTHER TRANSCRIPTS OF OUR DOCUMENTS THEN THE ORIGINAL ONES ARE IN ANY TYPE
(COPY, FILE OR SIMILAR) ASSISTENT MEANS, WHICH ARE NO MORE SUBJECT OF OUR CONTROLLING AFTER LEAVING OUR RANGE OF OUR RESPONSIBILITY. THEREFORE WE CANNOT TAKE ON ANY RESPONSIBILITY FOR THESE TRANSCRIPTS.
Technical Report for the
Beyondie Sulphate of Potash Project, Australia
JORC (2012) and NI 43-101
Bankable Feasibility Study
Client: Kalium Lakes Limited
Unit 1, 152 Balcatta Road
Balcatta WA 6021
Contractor: K-UTEC AG Salt Technologies
Am Petersenschacht 7
99706 Sondershausen
Person in Charge: EurGeol Thomas Schicht
EurGeol Anke Penndorf

Beyondie Sulphate of Potash Project JORC (2012) and NI 43-101 Technical Report - 2018
Report2018_Final_20180917 2
K-UTEC Project Team (Geology, Resources, Geophysics)
EurGeol Thomas Schicht, Qualified Geophysicist
EurGeol Anke Penndorf, Qualified Geologist
List of Content
List of Figures 4
List of Tables 7
List of Appendices 9
Abbreviations 9
Short Glossary 11
0 Summary 16
1 Introduction 18
2 Reliance on other Experts 18
3 Location and Property Description 21 3.1 Coordinate System 21 3.2 Property Description 21 3.3 Permits to Conduct Work 24
4 Accessibility, Climate, Physiography, Local Resources & Infrastructure 24 4.1 Accessibility 24 4.2 Climate 26 4.3 Physiography and Vegetation 30 4.4 Local Resources and Infrastructure 30
5 History 31
6 Site Setting and Mineralisation 31 6.1 Hydrology 31 6.2 Geological Setting 37 6.3 Hydrogeology 39 6.3.1 Aquifer Conditions 40
7 Deposit Type and Mineralisation 42
8 Exploration 43 8.1 Drilling 44 8.2 Augering 46 8.3 Trenching 48 8.4 Geophysical Surface Exploration 50 8.5 Wireline Logging 52 8.6 Aquifer Tests 54 8.7 Trial Pond Pumping 55 8.8 Leaching Potential of the Lake Surface 57 8.8.1 Field Sampling 57 8.8.2 Lab Testing 59 8.8.3 XRD and XRF Analysis 61 8.9 Geological Model Construction 62

Beyondie Sulphate of Potash Project JORC (2012) and NI 43-101 Technical Report - 2018
Report2018_Final_20180917 3
8.10 Porosity and Specific Yield (Drainable Porosity) 63
9 Sampling 64
10 Sample Preparation, Analyses and Security 65
11 Data Verification 66
12 Metallurgical Testing 67 12.1 CQG Trials 67 12.2 Small Scale Pilot Evaporation Trial 67 12.3 K-UTEC – Pre-Feasibility Works 67 12.4 Solar Pond Concentration Pathway Trials 69 12.5 Site Pilot Pond works 70 12.6 SRC – Phase 1 75 12.7 SRC – Phase 2 75 12.8 K-UTEC – Bankable Feasibility Study Optimisation Works 75 12.9 K-UTEC – Pilot Plant works 76 12.10 Compaction Testwork 78
13 Mineral Resource Estimates 78 13.1 Resource Estimation Methodology 80 13.2 Measured Mineral Resource 85 13.3 Indicated Mineral Resource 85 13.4 Inferred Mineral Resource 85 13.5 Exploration Target 85 13.6 Total Brine Volume 87
14 Ore Reserve Estimation 87 14.1 Numerical Modelling 88 14.1.1 Model Development 88 14.1.1.1 Model Domains 89 14.1.1.2 Model Calibration 90 14.1.1.3 Hydraulic and Transport Properties 90 14.1.2 Predictive Scenarios 93 14.1.3 Recharge 94 14.1.4 Production Results 95 14.1.4.1 Abstraction Capture Zones 100 14.1.4.2 Effects of Recharge 102 14.2 Ore Reserve Methodology 103 14.3 Proved and Probable Ore Reserve 104 14.4 Relative Accuracy and Confidence in Reserve Calculation 105 14.5 Other Major Brine Components 105
15 Mining Methods 107
16 Recovery Methods 110
17 Project Infrastructure 115 17.1 Supporting Infrastructure 115 17.1.1 Fresh Water 116 17.1.2 Power Supply 117 17.1.3 Communication Facilities 117 17.1.4 Accommodation 118 17.2 Site Access and Product Haulage 119 17.3 Port 120
18 Market Studies and Contracts 120
19 Environmental Studies, Permitting and Social or Community Impact 121

Beyondie Sulphate of Potash Project JORC (2012) and NI 43-101 Technical Report - 2018
Report2018_Final_20180917 4
19.1 Environmental Studies 121 19.2 Stakeholders 122 19.3 Native Title and Heritage 124 19.4 Permitting and Approvals 125
20 Capital and Operating Costs 126 20.1 Capital Costs 126 20.2 Operating Costs 128
21 Economic Analysis 129
22 Adjacent Properties 132
23 Other Relevant Data and Information 132
24 Risks 132
25 Conclusions 133
26 Recommendations 134
27 References 136
List of Figures
Figure 1: BSOPP Tenement Outline and Project Footprint [31] ..................................................... 23
Figure 2: Stage 1 Tenement Area Map [20] ................................................................................... 23
Figure 3: Project Location [31] ....................................................................................................... 25
Figure 4: Australian Continental Evaporation [4] ............................................................................ 27
Figure 5: Australian Continental Humidity [4] ................................................................................. 27
Figure 6: Wind Roses from Three Rivers Station (BOM) at 3:00 pm and 9:00 am [4][20] .............. 28
Figure 7: Average Daily Sunshine Hours [4] .................................................................................. 29
Figure 8: Solar Exposure [4] .......................................................................................................... 29
Figure 9: Access Track to the Beyondie Site (L52/162, L52/186, L52/187, L69/28, L69/29, L69/30,
M69/145) [20] .............................................................................................................. 30
Figure 10: Catchment areas [21] ................................................................................................... 32
Figure 11: Examples of parallel dunes and salt pans within the catchment [21] ............................. 32
Figure 12: Existing conditions - Flood level estimate for different storm events at 10 Mile Lake [21]
.................................................................................................................................... 36
Figure 13: Existing conditions - Flood level estimate for different storm events at Lake Sunshine [21]
.................................................................................................................................... 36
Figure 14: Interpreted Bedrock Geology [5] [12] ............................................................................ 37

Beyondie Sulphate of Potash Project JORC (2012) and NI 43-101 Technical Report - 2018
Report2018_Final_20180917 5
Figure 15: Extent of Cenozoic Geology [8] .................................................................................... 39
Figure 16: Hydrogeological Conceptual Model [17] ....................................................................... 42
Figure 17: Drillhole Locations at 10 Mile Lake and Beyondie [20] .................................................. 45
Figure 18: Drillhole Locations at Lake Sunshine [20] ..................................................................... 46
Figure 19: Hand Held Auger Drilling [9] ......................................................................................... 47
Figure 20: 2015 Auger Holes [9] .................................................................................................... 47
Figure 21: 2017 Auger Holes [20] .................................................................................................. 48
Figure 22: Trench SST02 in construction [12] ................................................................................ 49
Figure 23: Gypsum crystals in a 2 m long section of trench at SST01 (left) and 2 to 4 cm sized
gypsum crystals (left) [12] ........................................................................................... 50
Figure 24: Gravity and Passive Seismic traverses, Western Area [12] .......................................... 51
Figure 25: Gravity traverses, Eastern Area [12] ............................................................................. 51
Figure 26: BMR Log from TMSN03 [17] ........................................................................................ 53
Figure 27: Aquifer Water Level Response from Trial Pond Operations [17] ................................... 56
Figure 28: Section of 10 Mile Lake Showing Geology, Installed Production Bores and Trial Pond
Pumping Drawdown [17] ............................................................................................. 56
Figure 29: 10 Mile Lake Leach Sampling Locations [17] ................................................................ 58
Figure 30: Lake Sunshine Leach Sampling Locations [17] ............................................................ 58
Figure 31: 10 Mile Lake Leach Testing Results [17] ...................................................................... 60
Figure 32: Lake Sunshine Leach Testing Results [17] ................................................................... 60
Figure 33: Geological Model Section at 10 Mile [17] ...................................................................... 62
Figure 34: Small Scale Pilot Evaporation Ponds [3] ....................................................................... 67
Figure 35: K-UTEC Facilities in Sondershausen, Germany [22] .................................................... 68
Figure 36: Brine Concentration Path as a Function of % Mg [9] ..................................................... 69
Figure 37: DSB Brine Concentration Path [23] .............................................................................. 70
Figure 38: Evaporation Pond Series [24] ....................................................................................... 71
Figure 39: Actual large scale pond brine concentration curves versus previous assumptions and
testwork [20] ................................................................................................................ 73

Beyondie Sulphate of Potash Project JORC (2012) and NI 43-101 Technical Report - 2018
Report2018_Final_20180917 6
Figure 40: Site Pilot Pond Works [24] ............................................................................................ 74
Figure 41: K-UTEC Pilot Plant Facilities [25] ................................................................................. 77
Figure 42: Location of Areas Delineated for Resource Assessment - 10 Mile Lake [17] ................ 82
Figure 43: Location of Areas Delineated for Resource Assessment - Lake Sunshine [17] ............. 82
Figure 44: Location of Areas Delineated for Resource Assessment - Western Area Measured and
Indicated [17] .............................................................................................................. 83
Figure 45: Location of Areas Delineated for Resource Assessment - Eastern Area Indicated
Resources [17] ............................................................................................................ 83
Figure 46: Location of Areas Delineated for Resource Assessment - Western Area Inferred and
Exploration Target [17] ................................................................................................ 84
Figure 47: Location of Areas Delineated for Resource Assessment - Eastern Area Inferred and
Exploration Target [17] ................................................................................................ 84
Figure 48: 10 Mile Lake Hydraulic Conductivity Distribution [17] .................................................... 90
Figure 49: Lake Sunshine Hydraulic Conductivity Distribution [17] ................................................ 91
Figure 50: Lake Sunshine Specific Yield Distribution [17] .............................................................. 91
Figure 51: 10 Mile Lake Specific Yield Distribution [17] ................................................................. 92
Figure 52: 10 Mile Lake Specific Storage Distribution [17] ............................................................. 92
Figure 53: Lake Sunshine Specific Storage Distribution [17] ......................................................... 93
Figure 54: Trench Layout and Associated Unconfined Aquifer Drawdown at Year 30, Scenario 2 -
10 Mile Lake [17] ......................................................................................................... 96
Figure 55: 10 Mile Lake Production Bore Layout and Associated Confined Aquifer Drawdown for
Scenario 2 at Year 30 [17] ........................................................................................... 96
Figure 56: Trench Layout and Associated Unconfined Aquifer Drawdown at Year 30 Scenario 2 –
Sunshine [17] .............................................................................................................. 97
Figure 57: Lake Sunshine Production Bore Layout and Associated Confined Aquifer Drawdown for
Scenario 2 at Year 30 [17] ........................................................................................... 97
Figure 58: Average Annual Concentration of Extracted Brine Scenario 2 – 82 to 164 ktpa SOP
Production [17] ............................................................................................................ 99
Figure 59: 10 Mile Lake Production Bore Capture Zones [17]...................................................... 100
Figure 60: Lake Sunshine Production Bore Capture Zones [17] .................................................. 101

Beyondie Sulphate of Potash Project JORC (2012) and NI 43-101 Technical Report - 2018
Report2018_Final_20180917 7
Figure 61: 10 Mile Trench Capture Zones [17] ............................................................................ 101
Figure 62: Sunshine Trench Capture Zones [17] ......................................................................... 102
Figure 63: Recharge effects to Potassium Mass at Lake Sunshine [17] ...................................... 103
Figure 64: Ratio of other Brine Elements to Potassium [17] ......................................................... 106
Figure 65: Existing production bore set-up [26] ........................................................................... 107
Figure 66: Existing trench pumping set-up [26] ............................................................................ 107
Figure 67: 82 ktpa SOP Mine Plan (Bank Finance Case) [17] ..................................................... 108
Figure 68: 82 ktpa to 164 ktpa SOP Mine Plan (Base Case) [17] ................................................ 109
Figure 69: Stage 1 and Stage 2 Production Areas [12] ................................................................ 109
Figure 70: Evaporation Pond Series [24] ..................................................................................... 110
Figure 71: 164 ktpa SOP Pond and Plant Layout [16] ................................................................. 111
Figure 72: SOP Purification Plant Block Flow Diagram [10] ......................................................... 112
Figure 73: Simplified Process Scheme for Comprehensive Utilisation of Beyondie Brine [10][16] 113
Figure 74: 3D Model of process plant [10][16] ............................................................................. 114
Figure 75: 3D Model of Workshop and Administration Building [10][16] ....................................... 115
Figure 76: Fresh Water Supply Areas [17] ................................................................................... 116
Figure 77: Installed Communications Tower [26] ......................................................................... 118
Figure 78: Proposed Accomodation Village Layout [26]............................................................... 119
Figure 79: SOP Operating Cost Comparison (US$/t) [27] ............................................................ 129
Figure 80: NPV Sensitivity Analysis (US$/t) [20] .......................................................................... 132
List of Tables
Table 1: Mineral Resources Summary (JORC (2012)/CIM) ........................................................... 17
Table 2: Ore Reserves Summary (JORC (2012)/CIM) ................................................................... 17
Table 3: Study Team ..................................................................................................................... 19
Table 4: Beyondie Sulphate of Potash Project Tenement Schedule .............................................. 22
Table 5: Summary Meteorological Conditions for Three Rivers Station (Latitude: 25.13°S •
Longitude: 119.15°E • Elevation 520 m) reported by BOM [4] ..................................... 26

Beyondie Sulphate of Potash Project JORC (2012) and NI 43-101 Technical Report - 2018
Report2018_Final_20180917 8
Table 6: Rainfall and evaporation statistics - Site Data standardised with area long term average
data [20] ...................................................................................................................... 26
Table 7: Basic catchment parameters ........................................................................................... 33
Table 8: IFD Data for 10 Mile Lake and Lake Sunshine ................................................................. 34
Table 9: Estimated Flood levels and volumes at 10 Mile Lake under existing conditions ............... 35
Table 10: Estimated Flood levels and volumes at Lake Sunshine under existing conditions .......... 35
Table 11: Trench Details ............................................................................................................... 48
Table 12: XRF Summary ............................................................................................................... 61
Table 13: XRD Analysis ................................................................................................................. 61
Table 14: 10 Mile Lake and Beyondie Porosity and Specific Yield Ranges .................................... 63
Table 15: Lake Sunshine Porosity and Specific Yield Ranges ....................................................... 63
Table 16: Measured Mineral Resources ........................................................................................ 86
Table 17: Indicated Mineral Resources ......................................................................................... 86
Table 18: Inferred Mineral Resources ............................................................................................ 86
Table 19: Exploration Target ......................................................................................................... 86
Table 20: Resources Summary ..................................................................................................... 87
Table 21: 10 Mile Lake Recharge Parameters ............................................................................... 94
Table 22: Lake Sunshine Recharge Parameters ........................................................................... 95
Table 23: Summary of Reserve Production Scenario 2 – 82 to 164 ktpa SOP Production ............. 98
Table 24: Proved Ore Reserves .................................................................................................. 104
Table 25: Probable Ore Reserves ............................................................................................... 104
Table 26: Ratios of key Brine Elements ....................................................................................... 106
Table 27: Major Equipment List ................................................................................................... 114
Table 28: Raw Water Requirements ............................................................................................ 117
Table 29: Survey Program Undertaken to Date ........................................................................... 121
Table 30: List of Approvals (Demonstration Scale) ...................................................................... 125
Table 31: Capital Cost Estimates (Based on incremental costs) .................................................. 127
Table 32: Operating Cost Estimates ............................................................................................ 128

Beyondie Sulphate of Potash Project JORC (2012) and NI 43-101 Technical Report - 2018
Report2018_Final_20180917 9
Table 33: Financial Summary ...................................................................................................... 130
List of Appendices
Appendix 1 JORC Code, 2012 Edition – Table 1 report
Appendix 2 Drill Hole Assays and Details
Appendix 3 Auger Hole Assays and Details
Appendix 4 Test Pumping Assays and Details
Appendix 5 Test Pumping Results and Summaries
Appendix 6 Variogram Analysis
Appendix 7 BMR Logs
Appendix 8 Geological Sections
Appendix 9 Leach Test Results
Appendix 10 Resource Histograms
Appendix 11 Block Model Sections
Appendix 12 Variograms
Appendix 13 Resource Swath Plots
Abbreviations
Abbreviation Full description Abbreviation Full description
% Percent km2 Square kilometre
°C Degree Celsius KTMS Kainite Type Mixed Salt
AEP Annual Exceedance Probability ktpa Kilotonnes per annum
Ag Silver K-UTEC K-UTEC AG Salt Technologies
Al Aluminium La Lanthanum
APHA American Public Health Association Li Lithium
ARI Average Recurrence Interval LNG Liquified Natural Gas
As Arsenic LOM Life of Mine
asl Above Sea Level Lu Lutetium
ASX Australian Stock Exchange m Metre
Au Gold m2 Square metre
AUD Australian Dollar, Unit of Australian currency
m3 Cubic metre
B Boron Ma Million years
Ba Barium mAHD Metres, Australian Height Datum
Be Beryllium Mg Magnesium
BFS Bankable Feasibility Study mg/l Milligrams per litre
Bi Bismuth MGA94 Map Grid of Australia (1994)
BMR Nuclear Borehole Magnetic Resonance
MgCl2 Magnesium Chloride

Beyondie Sulphate of Potash Project JORC (2012) and NI 43-101 Technical Report - 2018
Report2018_Final_20180917 10
Abbreviation Full description Abbreviation Full description
BOM Bureau of Meteorology Mn Manganese
Br Bromine MNR Mungarlu Ngurrarankatja Rirraunkaja
BSOPP Beyondie Sulphate of Potash Project Mo Molybdenum
BV Bureau Veritas Minerals Laboratory (Canning Vale, Perth)
MOP Muriate of Potash
Ca Calcium Na Sodium
CAPEX Capital Expenditure NaCl Sodium Chloride
CaSO4 Gypsum, Calcium Sulfate Nb Niobium
Cd Cadmium Ni Nickel
Ce Cerium NI National Instrument
CIM Canadian Institute of Mining, Metallurgy and Petroleum
NN Nearest Neighbour
Cl Chloride NPV Net Present Value
Co Cobalt P Phosphorus
Cr Chromium Pb Lead
Cs Caesium Pd Palladium
Cu Copper ppb Parts per billion
DMIRS Department of Mines, Industry, Regulation and Safety
ppm Parts per million
DWER Department of Water and Environment Regulation
Pr Praseodymium
EBITDA Earnings Before Interest, Tax, Depreciation and Amortisation
Pt Platinum
EPA Environmental Protection Authority Rd Rubidium
EPBC Environment Protection and Biodiversity Conservation
Re Rhenium
Er Erbium RORB Runoff Routing Software
Eu Europium RPO Recognised Professional Organisation
EurGeol European Geologist S Sulphur
Fe Iron Sb Antimony
FEED Front End Engineering Design Si Silicon
FEFLOW Finite Element Subsurface FLOW System
Sm Samarium
FOB Free On Board Sn Tin
Ga Gallium SO4 Sulphate
Gd Gadolinium SOP Sulphate of Potash
Ge Germanium Sr Strontium
GGP Goldfields Gas Pipeline SRC Saskatchewan Research Council
GNH Great Northern Highway Sy Specific Yield
HDPE High Density Polyethylene t tonnes
Hf Hafnium Ta Tantalum
Hg Mercury Tb Terbium

Beyondie Sulphate of Potash Project JORC (2012) and NI 43-101 Technical Report - 2018
Report2018_Final_20180917 11
Abbreviation Full description Abbreviation Full description
Ho Holmium Te Tellurium
ICP-OES Inductively Coupled Plasma Optical Emission Spectrometry
Th Thorium
ID2 Inverse Distance Squared Ti Titanium
IFD Intensity-Frequency-Duration Tl Tallium
In Indium Tm Thulium
IRR Internal Rate of Return U Uranium
JORC Joint Ore Reserves Committee V Vanadium
K Potassium W Tungsten
K2SO4 Potassium Sulphate (or SOP) XRD X-ray Diffraction
KCl Potassium Chloride (or MOP) XRF X-ray Fluorescence
kg Kilogram Y Yttrium
KLL Kalium Lakes Limited Yb Ytterbium
KLP Kalium Lakes Potash Pty Ltd Zn Zinc
km Kilometre Zr Zirconium
Short Glossary
Term Full description
Assessment work The amount of work specified under mining law that must be performed each year in order to retain legal control of mining and exploration claims.
Bankable Feasibility Study (JORC / CIM)
Terms such as “Bankable Feasibility Study” and “Definitive Feasibility Study” are noted as being equivalent to a Feasibility Study as defined in this Clause. A Feasibility Study is of a higher level of confidence than a Pre-Feasibility Study and would normally contain mining, infrastructure and process designs completed with sufficient rigour to serve as the basis for an investment decision or to support project financing. Social, environmental and governmental approvals, permits and agreements will be in place, or will be approaching finalisation within the expected development timeframe. The Feasibility Study will contain the application and description of all Modifying factors in a more detailed form than in the Pre-Feasibility Study, and may address implementation issues such as detailed mining schedules, construction ramp up, and project execution plans. [JORC Code, 2012 Edition]
Competent Person A ‘Competent Person’ is a minerals industry professional who is a Member or Fellow of The Australasian Institute of Mining and Metallurgy, or of the Australian Institute of Geoscientists, or of a ‘Recognised Professional Organisation’ (RPO), as included in a list available on the JORC and ASX websites. These organisations have enforceable disciplinary processes including the powers to suspend or expel a member. A Competent Person must have a minimum of five years relevant experience in the style of mineralisation or type of deposit under consideration and in the activity which that person is undertaking.
Conceptual Study A Conceptual or Concept Study stands at the very early stage of a greenfield project to identify all possibilities and conditions to develop this project.
CIM CIM Best Practice Guidelines for Resource and Reserve Estimation for Lithium Brines - A professional code of practice established by the Canadian Institute of Mining, Metallurgy and Petroleum, which is a guideline for Public Reporting of minerals Exploration Results, Mineral Resources and Ore Reserves especially for brines,
Deposit Body of rock or Brine containing a concentration of minerals.

Beyondie Sulphate of Potash Project JORC (2012) and NI 43-101 Technical Report - 2018
Report2018_Final_20180917 12
Term Full description
Exploration Target (JORC) An “Exploration Target” is a statement or estimate of the exploration potential of a mineral deposit in a defined geological setting where the statement or estimate, quoted as a range of tonnes and a range of grade (or Quality), relates to mineralisation for which there has been insufficient exploration to estimate a Mineral Resource.
Feasibility Study (JORC / CIM)
A Feasibility Study is a comprehensive technical and economic study of the selected development option for a mineral project that includes appropriately detailed assessments of applicable Modifying Factors together with any other relevant operational factors and detailed financial analysis that are necessary to demonstrate, at the time of reporting, that extraction is reasonably justified (economically mineable). The results of the study may reasonably serve as the basis for a final decision by a proponent or financial institution to proceed with, or finance, the development of the project.
High grade Rich concentration of the mineral in the deposit.
Indicated Resource (CIM) An Indicated Resource is that part of a Mineral Resource for which quantity, grade or quality, densities, shape and physical characteristics, can be estimated with a level of confidence sufficient to allow the appropriate application of technical and economic parameters, to support mine planning and evaluation of the economic viability of the deposit.
Indicated Resource (JORC) An ‘Indicated Mineral Resource’ is that part of a Mineral Resource for which quantity, grade (or quality), densities, shape and physical characteristics are estimated with sufficient confidence to allow the application of Modifying Factors in sufficient detail to support mine planning and evaluation of the economic viability of the deposit. Geological evidence is derived from adequately detailed and reliable exploration, sampling and testing gathered through appropriate techniques from locations such as outcrops, trenches, pits, workings and drill holes and is sufficient to assume geological and grade (or quality) continuity between points of observation where data and samples are gathered. An Indicated Mineral Resource has a lower level of confidence than that applying to a Measured Mineral Resource and may only be converted to a Probable Ore Reserve.
Inferred Resource (CIM) An Inferred Mineral Resource is that part of a Mineral Resource for which quantity and grade or quality are estimated on the basis of limited geological evidence and sampling. Geological evidence is sufficient to imply but not verify geological and grade or quality continuity. An Inferred Mineral Resource has a lower level of confidence than that applying to an Indicated Mineral Resource and must not be converted to a Mineral Reserve. It is reasonably expected that the majority of Inferred Mineral Resources could be upgraded to Indicated Mineral Resources with continued exploration.
Inferred Resource (JORC) An ‘Inferred Mineral Resource’ is that part of a Mineral Resource for which quantity and grade (or quality) are estimated on the basis of limited geological evidence and sampling. Geological evidence is sufficient to imply but not verify geological and grade (or quality) continuity. It is based on exploration, sampling and testing information gathered through appropriate techniques from locations such as outcrops, trenches, pits, workings and drill holes. An Inferred Mineral Resource has a lower level of confidence than that applying to an Indicated Mineral Resource and must not be converted to an Ore Reserve. It is reasonably expected that the majority of Inferred Mineral Resources could be upgraded to Indicated Mineral Resources with continued exploration.
JORC Code (2012) A professional code of practice established by the Australasian Joint Ore Reserves Committee. That sets minimum standards for Public Reporting of minerals Exploration Results, Mineral Resources and Ore Reserves.
Measured Resource (CIM) That part of a Mineral Resource for which quantity, grade or quality, densities, shape, and physical characteristics are so well established that they can be estimated with confidence sufficient to allow the appropriate application of technical and economic parameters, to support production planning and evaluation of the economic viability of the deposit.

Beyondie Sulphate of Potash Project JORC (2012) and NI 43-101 Technical Report - 2018
Report2018_Final_20180917 13
Term Full description
Measured Resource (JORC)
A ‘Measured Mineral Resource’ is that part of a Mineral Resource for which quantity, grade (or quality), densities, shape and physical characteristics are estimated with confidence sufficient to allow the application of Modifying Factors to support detailed mine planning and final evaluation of the economic viability of the deposit. Geological evidence is derived from detailed and reliable exploration, sampling and testing gathered through appropriate techniques from locations such as outcrops, trenches, pits, workings and drill holes and is sufficient to confirm geological and grade (or quality) continuity between points of observation where data and samples are gathered. A Measured Mineral Resource has a higher level of confidence than that applying to either an Indicated Mineral Resource or an Inferred Mineral Resource. It may be converted to a Proved Ore Reserve or under certain circumstances, to a Probable Ore Reserve.
Mineral Reserve (CIM) A Mineral Reserve is the economically mineable part of a Measured and/or Indicated Mineral Resource. It includes diluting materials and allowances for losses, which may occur when the material is mined or extracted and is defined by studies at Pre-Feasibility or Feasibility level as appropriate that include application of Modifying Factors. Such studies demonstrate that, at the time of reporting, extraction could reasonably be justified. The reference point at which Mineral Reserves are defined, usually the point where the ore is delivered to the processing plant, must be stated. It is important that, in all situations where the reference point is different, such as for a saleable product, a clarifying statement is included to ensure that the reader is fully informed as to what is being reported. The public disclosure of a Mineral Reserve must be demonstrated by a Pre-Feasibility Study or Feasibility Study.
Mineral Resource (JORC) A ‘Mineral Resource’ is a concentration or occurrence of solid material of economic interest in or on the Earth’s crust in such form, grade (or quality), and quantity that there are reasonable prospects for eventual economic extraction. The location, quantity, grade (or quality), continuity and other geological characteristics of a Mineral Resource are known, estimated or interpreted from specific geological evidence and knowledge, including sampling. Mineral Resources are sub-divided, in order of increasing geological confidence, into Inferred, Indicated and Measured categories.
Modifying Factors ‘Modifying Factors’ are considerations used to convert Mineral Resources to Ore Reserves. These include, but are not restricted to, mining, processing, metallurgical, infrastructure, economic, marketing, legal, environmental, social and governmental factors.
National Instrument 43-101 Canadian rule that governs how issuers disclose scientific and technical information about mineral projects to the public.
Ore Reserve (JORC) An ‘Ore Reserve’ is the economically mineable part of a Measured and/or Indicated Mineral Resource. It includes diluting materials and allowances for losses, which may occur when the material is mined or extracted and is defined by studies at Pre-Feasibility or Feasibility level as appropriate that include application of Modifying Factors. Such studies demonstrate that, at the time of reporting, extraction could reasonably be justified. The reference point at which Reserves are defined, usually the point where the ore is delivered to the processing plant, must be stated. It is important that, in all situations where the reference point is different, such as for a saleable product, a clarifying statement is included to ensure that the reader is fully informed as to what is being reported.
Potash Potassium bearing mineral salt deposits; here as a brine.
Pre-Feasibility Study (JORC / CIM)
A Pre-Feasibility Study is a comprehensive study of a range of options for the technical and economic viability of a mineral project that has advanced to a stage where a preferred mining method is established and an effective method of mineral processing is determined. It includes a financial analysis based on reasonable assumptions on the Modifying Factors and the evaluation of any other relevant factors which are sufficient for a Qualified Person, acting reasonably, to determine if all or part of the Mineral Resource may be converted to a Mineral Reserve at the time of reporting.
Probable Reserve (JORC) A ‘Probable Ore Reserve’ is the economically mineable part of an Indicated, and in some circumstances, a Measured Mineral Resource. The confidence in the Modifying

Beyondie Sulphate of Potash Project JORC (2012) and NI 43-101 Technical Report - 2018
Report2018_Final_20180917 14
Term Full description
Factors applying to a Probable Ore Reserve is lower than that applying to a Proved Ore Reserve.
Proved Reserve (JORC) A ‘Proved Ore Reserve’ is the economically mineable part of a Measured Mineral Resource. A Proved Ore Reserve implies a high degree of confidence in the Modifying Factors.
Proven Reserve (CIM) The economically mineable part of a Measured Mineral Resource demonstrated by at least a Preliminary Feasibility Study. This Study must include adequate information on mining, processing, metallurgical, economic, and other relevant factors that demonstrate, at the time of reporting, that economic extraction is justified.

Beyondie Sulphate of Potash Project JORC (2012) and NI 43-101 Technical Report - 2018
Report2018_Final_20180917 15
Compliance Statement
The information in this report that relates to Exploration Targets, Exploration Results, Mineral
Resources or Ore Reserves is based on information compiled by Thomas Schicht, a Competent
Person who is a Member of a 'Recognised Professional Organisation' (RPO), the European
Federation of Geologists and a registered "European Geologist" (Registration Number 1077) and
Anke Penndorf, a Competent Person who is a Member of a RPO, the European Federation of
Geologists, and a registered "European Geologist" (Registration Number 1152).
Thomas Schicht and Anke Penndorf are full-term employees of K-UTEC AG Salt Technologies
(K-UTEC).
K-UTEC, Thomas Schicht and Anke Penndorf are not associates or affiliates of KLL or any of its
affiliates. K-UTEC received a fee for the preparation of the Report in accordance with normal
professional consulting practices. This fee is not contingent on the conclusions of the Report and
K-UTEC, Thomas Schicht and Anke Penndorf will receive no other benefit for the preparation of
the Report. Thomas Schicht and Anke Penndorf do not have any pecuniary or other interests that
could reasonably be regarded as capable of affecting their ability to provide an unbiased opinion in
relation to the Beyondie Sulphate of Potash Project (BSOPP).
K-UTEC does not have, at the date of the Report, and has not had within the previous years, any
shareholding in or other relationship with KLL or the BSOPP and consequently considers itself to
be independent of KLL.
Thomas Schicht and Anke Penndorf have sufficient experience that is relevant to the style of
mineralisation and type of deposit under consideration and to the activity being undertaken to
qualify as a Competent Person as defined in the 2012 Edition of the JORC 'Australasian Code for
Reporting of Exploration Results, Mineral Resources and Ore Reserves'. Thomas Schicht and
Anke Penndorf consent to the inclusion in the Report of the matters based on their information in
the form and context in which it appears.
Sondershausen, 17.09.2018
Thomas Schicht Anke Penndorf European Geologist (EurGeol) European Geologist (EurGeol)

Beyondie Sulphate of Potash Project JORC (2012) and NI 43-101 Technical Report - 2018
Report2018_Final_20180917 16
0 Summary
Kalium Lakes Limited (Kalium Lakes or KLL) is a public company listed on the Australian Stock
Exchange (ASX) with ~ 2,400 km2 of granted tenements at the eastern margin of the East Pilbara
region of Western Australia. KLL is looking to develop a sub-surface brine deposit initially producing
82 ktpa Sulphate of Potash (K2SO4 or SOP) prior to expanding to produce 164 ktpa of SOP product
via evaporation and processing of brine extracted from aquifers within the Beyondie, 10 Mile and
Sunshine tenement holdings, which form part of the Beyondie Sulphate of Potash Project (BSOPP).
KLL entered into an agreement with K-UTEC AG Salt Technologies to prepare a Technical Report
according to the guidelines of the JORC Code 2012 [1] with reference to the CIM Best Practice
Guidelines for Resource and Reserve Estimation for Lithium Brines [2].
The description of the regional geology, local geology and hydrogeology was determined in KLL’s
Bankable Feasibility Study and specified by study reports of Advisian [12], [17].
The BSOPP deposit is a brine, containing the target potassium and sulphate ions required to form a
potassium sulphate salt. The brine is contained within saturated sediments in at least two separate
horizons below the lake surface and in sediments adjacent to the lake. The lakes are located within
the broader IIgarari palaeochannel system that extends over hundreds of kilometres.
The lake surface and alluvial sediments in the upper aquifer host the first brine horizon. The second
brine horizon forms the lower aquifer within the sediments at the base of the palaeochannel and
weathered bedrock. This aquifer is generally continguous however discrete clay lenses and bedrock
highs can separate this aquifer into several sections.
Drilling test pumping and augering programs including sampling of brine and soil material,
geophysical fieldwork, laboratory analysis, pumping tests, borehole nuclear magnetic resonance
(BMR), bore trials and ponds leach testing have occurred at the project area.
Based on data from the fieldwork and laboratory analyses, an assessment of the Mineral Resource
and Ore Reserve has been undertaken. The Mineral Resources and Ore Reserves for SOP are
stated below (see Table 1 and Table 2).

Beyondie Sulphate of Potash Project JORC (2012) and NI 43-101 Technical Report - 2018
Report2018_Final_20180917 17
Table 1: Mineral Resources Summary (JORC (2012)/CIM)
Level Drainable
Brine Volume (M m3)
K Grade (mg/l)
K (Mt)
SO4 (Mt)
Drainable Brine Volume
SOP (Mt)
Total Brine Volume SOP
(Mt)
Measured Mineral
Resource 149 5,155 0.77 2.33 1.72 5.67
Indicated Mineral
Resource 735 5,591 4.11 11.91 9.17 32.42
Inferred Mineral
Resource 695 5,647 3.92 11.86 8.75 121.61
Total Mineral Resource
1,579 5,585 8.80 26.10 19.64 159.70
Mineral Exploration
Target* 920 - 2,810 1,800 - 3,300 1.6 - 9.3 5.0 - 25.6 3.7 – 20.7 40 - 250
*The Kalium Lakes Beyondie SOP Project “Exploration Target” is based on a number of assumptions and limitations and is conceptual in
nature. It is not an indication of a Mineral Resource Estimate in accordance with the JORC Code (2012) and it is uncertain if future
exploration will result in the determination of a Mineral Resource or that the Exploration Target will add to the economics of the BSOPP.
Table 2: Ore Reserves Summary (JORC (2012)/CIM)
Level Drainable Brine
Volume (106 m3)
K Grade (mg/l)
K (106 tonnes)
SO4 (106 tonnes)
SOP (106 tonnes)
Proved Ore Reserve
119 6,207 0.74 2.14 1.65
Probable Ore Reserve
295 5,306 1.57 4.46 3.49
Total Ore Reserve 414 5,565 2.30 6.60 5.13
At the publication date of this Technical Report, a number of exploration programs have been carried
out. The exploration results reveal variations in chemical composition of the brine at different well
depths as well as lateral variations. The results of the chemical analysis of the brine, the long lasting
constant rate pumping tests, grain size analysis, borehole tests, and geophysical investigations,
have lead to values for Measured, Indicated and Inferred Resource classification and values for
Probable Reserve and Proved Reserve Classification. Furthermore, values for an additional
exploration target have been extrapolated from the existing data and knowledge of the lake system
within the underlying palaeochannel. As exploration work continues, the database as well as the
classification of the resources and size of the resource may be increased.
The two selected mining methods, bores and trenching, will allow abstraction of the sub-surface
brine. K-UTEC has developed a recovery method unique to the BSOPP brine, which allows a
production route for SOP. Based on the composition of the deposit brine, the present process flow
sheet considers recovery of SOP as the primary product, with the potential to produce magnesium
by-products such as hydrated magnesium carbonate and magnesium chloride, which have already
been produced at a pilot scale.

Beyondie Sulphate of Potash Project JORC (2012) and NI 43-101 Technical Report - 2018
Report2018_Final_20180917 18
1 Introduction
Kalium Lakes Limited is a public company, listed on the Australian Stock Exchange (ASX), with ~
2,400 km2 of granted mining tenure at the eastern margin of the East Pilbara region of Western
Australia. KLL is looking to develop a sub-surface brine deposit initially producing 82 ktpa Sulphate
of Potash before expanding to produce 164 ktpa of SOP via evaporation and processing within the
Beyondie, 10 Mile and Lake Sunshine tenement holdings, comprising the Stage 1 set of tenements
for the BSOPP. Further expansion into the eastern tenement area, Stage 2, could see a future
expansion to >250 ktpa SOP.
KLL entered into an agreement with K-UTEC AG Salt Technologies to prepare a Technical Report
according to the accepted JORC Code 2012 [1] with reference to the CIM Best Practice Guidelines
for Resource and Reserve Estimation for Lithium Brines [2].
The purpose of the report is to provide KLL with a Mineral Resource and Ore Reserve Estimate that
complies with the guidelines of NI 43-101 and JORC Code (2012). The scope of the report covers
the activities undertaken at the BSOPP area, the results and review of the results by the Qualified
Persons/Competent Persons.
The sources of information and data in this report are varied and can be found in Section 27.
The K-UTEC Competent Persons, Thomas Schicht and Anke Penndorf visited the exploration area
in August 2015, June 2017 and January/February 2018 [7], [11], [19] and could inspect: The deposit
(overview from helicopter and several stops at some of the lakes), current drilling sites, geophysical
fieldwork, core storage, trial solar evaporation ponds, several boreholes – drilled with varying
methods (diamond core, aircore, sonic) – and the recovered material, sampling of soil and water,
production wells, trenches, the drilling contractors, a helicopter drill rig and the auger drilling team.
The K-UTEC competent persons were also able to meet and engage with KLL’s Perth-based
consulting hydrogeologists Advisian, part of the Worley Parsons Group.
2 Reliance on other Experts
In preparing this report, the authors have had to rely on reports not prepared under their supervision.
These reports will be hereinafter identified as being third-party reports. This report includes the
contents of the:
• KLL Concept Study (April 2015 [3])
• KLL Pre-Feasibility Study (September 2017 [9])
• KLL Bankable Feasibility Study (BFS) (September 2018 [20])

Beyondie Sulphate of Potash Project JORC (2012) and NI 43-101 Technical Report - 2018
Report2018_Final_20180917 19
• Various reports by Advisian [12] [17]. Advisian is part of the Worley Parsons Group and
has extensive experience with water supply, dewatering and surface water projects in
hypersaline palaeochannels in Western Australia and as such meets the Competent
Person Requirements for the assessment of a brine resource and hydrogeology.
• DRA Global [16] report on the BSOPP supporting infrastructure. DRA Global is a leader
in delivering process plant design, infrastructure and engineering projects.
K-UTEC have been independently engaged to provide specialist knowledge on the development of
potash brine deposits around the world, specifically the Competent Person role related to brine
processing.
During the concept, pre-feasibility and definitive feasibility phases of the project, K-UTEC provided
guidance on the fieldwork and data acquisition related to the geology, hydrogeology, geophysics,
chemical analysis and processing. The K-UTEC experts have sufficient experience in the exploration
of potash and resource estimation for potash deposits as required by the CIM Standards [2] and the
JORC Code 2012 [1].
The Bankable Feasibility Study was managed by KLL in conjunction with leading industry specialists
including K-UTEC, Advisian (Worley Parsons), DSB International, DRA, Shawmac, Wyntak, Nixon
Consulting and Preston Consulting as the principal technical consultants, as well as RSM, DLA Piper
Australia, HopgoodGanim and BurnVoir Corporate Finance as key accounting, commercial and legal
advisors. The main contributors and consultants engaged for the BFS and their broad areas of
contribution are shown in Table 3.
Table 3: Study Team
Contributor Background Description of Contribution
KLL
The Directors have a track record in
proving up and commercialising resource
assets
Study management/coordination, marketing
strategy, environmental inputs, stakeholder
information, financial modelling
K-UTEC
Germany’s former potash research
institute with more than 60 years’
experience with salt
The evaporation, crystallisation and
purification to a final SOP product
components of the study, including test work
and a site visit
DRA Global
Leader in delivering process plant design,
infrastructure and engineering projects General plant and infrastructure design

Beyondie Sulphate of Potash Project JORC (2012) and NI 43-101 Technical Report - 2018
Report2018_Final_20180917 20
Contributor Background Description of Contribution
BurnVoir Corporate
Finance
Expertise in the area of international
banking, corporate finance and market risk
analysis
Financial Modelling, WACC1, FX2 and Funding
Advice
Advisian (Worley
Parsons)
Specialists in water management for
mining projects
Exploration, Resource and Reserve, water
supply, overall site drainage and the road
construction water
DSB International
Extensive experience in salt field
engineering, design and operation
Pre-Feasibility Study evaporation and
crystallisation pond design, plus Pilot Scale
pond reviews
Soil Water Group Specialists in water management for
mining projects
Pond clay liner test work and porosity
assessment
Braemar Seascope
One of the largest chartering, sale and
purchase ship-broking companies in the
world
Shipping Strategies and shipping rates
estimations
Preston Consulting Project Managers with experience in a
wide range of approvals in WA
Environmental & Approvals Strategy and
Implementation
Shawmac
Consulting Civil and Traffic Engineers,
Risk Managers, ex-Main Roads Western
Australia
Access Road and GNH intersection design
Hetherington’s Tenure Management Consultants Tenure applications
HopgoodGanim Expert legal advice specialising in
resources Legal advice
RSM Australia
A full service national accounting firm
delivering expert corporate financial and
advisory accounting services to clients
across diverse industry sectors
Accounting, commercial and funding advice
Wyntak Pty Ltd Logistics specialists
Mine to port heavy haulage vehicle selection
and options, estimates for capital and
operating costs
Nixon Consulting Product Marketing, Procurement and
Supply Chain specialist
Market representation, procurement,
international trade advice, market research,
supply chain management, freight and
distribution advice
PGM Geotechnical Geotechnical Expert Pond trials and road geotechnical
investigations
1 Weighted Average Cost of Capital
2 Foreign Exchange

Beyondie Sulphate of Potash Project JORC (2012) and NI 43-101 Technical Report - 2018
Report2018_Final_20180917 21
Contributor Background Description of Contribution
DLA Piper Australia Expert legal advice specialising in Native
Title and Tenure Heritage, Native Title & Tenure Legal advice
Specialist Consultants Consultants selected on their specific
skills, experience and expertise
Phoenix, BV-Amdel, Dalesford, Ennovate,
Platinum Matrix, Edge Corporate,
Inceptioneer, Green Markets, Integer, CRU,
Fertecon, NeoMet Engineering
3 Location and Property Description
The BSOPP is located in Western Australia, east of the Great Northern Highway and extending into
the Little Sandy Desert, and covers approximately 2,400 km2 of granted mining tenure. Proposed
brine extraction and processing areas are located within the Little Sandy Desert catchment, which
flows in an easterly direction towards inland lakes. There is no flow path to the ocean and as such it
is a contained system.
3.1 Coordinate System
The grid system used is the MGA94, Zone 51 coordinate system. All coordinates for tenement areas,
boreholes, auger holes and geophysical traverses were given in this system. All overview maps and
thematic maps, which have been generated by KLL, KLL’s consultants or K-UTEC, used this
coordinate system. For reference, the Eastern Beyondie Lake is located at 227,000 E, 7,260,000 N.
3.2 Property Description
Kalium Lakes has been granted several exploration licenses, as well as the following two mining
leases: M69/145 and M69/146 for the 10 Mile Lake and Lake Sunshine areas respectively. KLL has
also been granted miscellaneous licences for various activities including the Beyondie site access
road from the Great Northern Highway, as well as access for gas pipeline, telecommunications and
water supply infrastructure.
Below in Table 4 is a schedule of tenement interests for the BSOPP as at 17 September 2018.

Beyondie Sulphate of Potash Project JORC (2012) and NI 43-101 Technical Report - 2018
Report2018_Final_20180917 22
Table 4: Beyondie Sulphate of Potash Project Tenement Schedule
Note: Kalium Lakes Potash Pty Ltd (KLP) is a wholly owned subsidiary of Kalium Lakes Limited (KLL) Figure 1 shows the general location of the KLL exploration tenements and the tenement boundaries
of the BSOPP. Figure 2 shows the Stage 1 Tenement Area associated with the initial Mining Leases.
Tenement Name Holder State Status Grant Date Interest
Exploration Licences
E69/3306 Yanneri-Terminal KLP WA Granted 17-3-2015 100%
E69/3309 Beyondie - 10-Mile KLP WA Granted 17-4-2015 100%
E69/3339 West Central KLP WA Granted 22-6-2015 100%
E69/3340 White KLP WA Granted 22-6-2015 100%
E69/3341 West Yanneri KLP WA Granted 11-8-2015 100%
E69/3342 Aerodrome KLP WA Granted 22-6-2015 100%
E69/3343 T Junction KLP WA Granted 22-5-2015 100%
E69/3344 Northern KLP WA Granted 22-5-2015 100%
E69/3345 Wilderness KLP WA Granted 22-5-2015 100%
E69/3346 NE Beyondie KLP WA Granted 11-8-2015 100%
E69/3347 South 10 Mile KLP WA Granted 11-8-2015 100%
E69/3348 North Yanneri-Terminal KLP WA Granted 11-8-2015 100%
E69/3349 East Central KLP WA Granted 22-6-2015 100%
E69/3351 Sunshine KLP WA Granted 31-8-2015 100%
E69/3352 Beyondie Infrastructure KLP WA Granted 31-8-2015 100%
Miscellaneous Licences
L52/162 Access Road KLP WA Granted 30-3-2016 100%
L52/186 G N Hwy Access Road KLP WA Granted 30-5-2018 100%
L52/187 Comms Tower 2 KLP WA Granted 30-5-2018 100%
L52/190 Kumarina FW 1 KLP WA Withdrawn 100%
L52/193 Kumarina FW 2 KLP WA Granted 13-8-2018 100%
L69/28 Access Road Diversion KLP WA Granted 7-8-2018 100%
L69/29 Access Road Village KLP WA Granted 7-8-2018 100%
L69/30 Comms Tower 1 KLP WA Granted 30-5-2018 100%
L69/31 Sunshine Access Road KLP WA Granted 7-8-2018 100%
L69/32 10MS FW A KLP WA Granted 14-8-2018 100%
L69/34 10MS FW B KLP WA Granted 14-8-2018 100%
L69/35 10MS FW C KLP WA Application - 100%
L69/36 10MS FW D KLP WA Application - 100%
Mining Leases
M69/145 10 Mile KLP WA Granted 6-6-2018 100%
M69/146 Sunshine KLP WA Granted 6-6-2018 100%

Beyondie Sulphate of Potash Project JORC (2012) and NI 43-101 Technical Report - 2018
Report2018_Final_20180917 23
Figure 1: BSOPP Tenement Outline and Project Footprint [31]
Figure 2: Stage 1 Tenement Area Map [20]

Beyondie Sulphate of Potash Project JORC (2012) and NI 43-101 Technical Report - 2018
Report2018_Final_20180917 24
3.3 Permits to Conduct Work
KLL has obtained the following permits and approvals:
• Several granted Programmes of Work from the Department of Mines, Industry Regulation
and Safety (DMIRS) permitting KLL to undertake exploration activities on the granted
tenements;
• Several 26D well construction licences from the Department of Water & Environmental
Regulation (DWER) that permit KLL to construct the current production bores on
tenements E69/3309, E69/3347, E69/3351 and E69/3346. 26D licences expire yearly,
KLL obtains them prior to drilling campaigns;
• A 5C Licence from the DWER to take up to 1.5GL of water on tenements E69/3309 and
E69/3347 from 25 August 2016 until 22 August 2026;
• A DWER Works Approval to construct and operate a large-scale pilot pond facility for
solar salt production of up to 25 ktpa;
• Early works approvals are in place from the Environmental Protection Authority of
Western Australia (EPA) and Department of Mines, Industry Regulation and Safety
(DMIRS), with formal approval for the full-scale project anticipated to be in place during
Q4 2018.
Additional permits have been requested from government departments including the EPA, DWER,
DMIRS, Department of Environment and Energy for activities including ponds expansion, landfill,
waste water treatment plant and gas pipeline.
4 Accessibility, Climate, Physiography, Local Resources & Infrastructure
4.1 Accessibility
The BSOPP site is located 160 km south, southeast of the iron ore producing town of Newman and
200 km north of the base metals and gold mining areas of Wiluna. The Great Northern Highway
(GNH) provides the main logistical supply link between major supply and distribution centres of
Geraldton Port (862 km) and Perth (1,088 km) (Figure 3).

Beyondie Sulphate of Potash Project JORC (2012) and NI 43-101 Technical Report - 2018
Report2018_Final_20180917 25
Figure 3: Project Location [31]

Beyondie Sulphate of Potash Project JORC (2012) and NI 43-101 Technical Report - 2018
Report2018_Final_20180917 26
Existing nearby infrastructure for site access, transit of personnel and product delivery includes the
GNH, Goldfields Gas Pipeline (GGP) and the Newman Airport.
The BSOPP is approximately 78 km east of the GNH and requires an upgrade of the existing access
road that will connect the site with the GNH near the Kumarina Roadhouse. The road upgrade falls
under the granted miscellaneous licences L52/162, L52/186, L69/28 and L69/29.
The BSOPP site access road follows a western alignment from the mine site over mostly flat country
which contains good road base material, until it intersects with the GNH. Only minor non-perennial
water courses need to be crossed by the access road.
4.2 Climate
The BSOPP area falls within the arid desert climate zone. The regional climate is characterised by
hot summers and warm to cold winters with low annual rainfall. Most of the strongly seasonal rainfall
occurs in the period between December and April. A large percentage of the annual total precipitation
occurs over short periods, associated with thunderstorm activity and cyclonic lows.
The closest weather station with a high level of climate data to the project area is at Three Rivers,
approximately 127 km east-southeast of the site. Table 5 outlines the meteorological conditions for
Three Rivers as reported by the Bureau of Meteorology (BOM, [4]).
The maximum daily temperature (average) at the mine site rises to 39°C in January, the minimum
average temperature is measured at 5°C with extremes to -5°C during June. Mean annual rainfall
is 238 mm.
Table 5: Summary Meteorological Conditions for Three Rivers Station (Latitude: 25.13°S • Longitude: 119.15°E • Elevation 520 m) reported by BOM [4]
Statistic Jan Feb Mar Apr May Jun Jul Aug Sep Oct Nov Dec Annual
Mean max temp (°C) 39.3 36.8 35.4 30.3 25.3 21.1 21.0 23.4 27.8 31.9 35.2 38.0 30.5
Mean min temp (°C) 24.1 22.9 20.6 15.7 10.1 6.6 4.8 6.6 9.7 14.0 18.1 22.0 14.6
Table 6: Rainfall and evaporation statistics - Site Data standardised with area long term average data [20]
Statistic Jan Feb Mar Apr May Jun Jul Aug Sep Oct Nov Dec Annual
Mean rainfall (mm) 45 47 41 24 18 17 11 7 3 7 12 25 258
Mean monthly evaporation (mm)
442 353 361 290 203 144 161 207 272 378 422 468 3700

Beyondie Sulphate of Potash Project JORC (2012) and NI 43-101 Technical Report - 2018
Report2018_Final_20180917 27
Detailed regional meteorological data is currently being collected at the project site with a weather
station, established in February 2015.
Figure 4 and Figure 5 show the Australian Continental Evaporation and Humidity maps with the
approximate location of the BSOPP indicated. These figures illustrate the BSOPP is located in an
area expected to experience some of the lowest humidity and highest evaporation rates in the
country. The wind data from Three Rivers Station shows a predominately easterly direction (see
Figure 6 [4], [20]).
Figure 4: Australian Continental Evaporation [4]
Figure 5: Australian Continental Humidity [4]

Beyondie Sulphate of Potash Project JORC (2012) and NI 43-101 Technical Report - 2018
Report2018_Final_20180917 28
Figure 6: Wind Roses from Three Rivers Station (BOM) at 3:00 pm and 9:00 am [4][20]

Beyondie Sulphate of Potash Project JORC (2012) and NI 43-101 Technical Report - 2018
Report2018_Final_20180917 29
Average daily sunshine hours are around 9 – 10, as shown in Figure 7. The annual solar exposure
for the period of 1 September 2016 to 31 August 2017 was between 20 and 22 MJ/m2 as shown in
Figure 8. Due to the climate, the operations will be continuous with solar evaporation occurring all
year and the process plant operating full time excluding a downtime allowance for preventative and
breakdown maintenance.
Figure 7: Average Daily Sunshine Hours [4]
Figure 8: Solar Exposure [4]
BSOPP
BSOPP

Beyondie Sulphate of Potash Project JORC (2012) and NI 43-101 Technical Report - 2018
Report2018_Final_20180917 30
Being located in the northern half of Western Australia, the region is prone to very infrequent tropical
cyclones and tropical lows. A rainfall intensity frequency duration curve for the site has been used to
estimate the rainfall depth that would occur during rainfall events of defined duration and recurrence
interval. The equivalent rainfall depth from a 72-hour rainfall event at the site is 262 mm.
4.3 Physiography and Vegetation
The landscape around the BSOPP is dominated by extensive sand dunes and flat plains. Several
salt lakes lie within a palaeochannel system which is bordered by hills (bedrock). The altitude above
sea level ranges between approximately 475 m in the east (Lake Aerodrome) and 560 m in the west
(bedrock area north of Beyondie East Lake). The vegetation in the working area is characterised by
scant plant cover and small bushes. The lakes are mostly free of vegetation, except at borders or on
islands.
4.4 Local Resources and Infrastructure
The BSOPP is not inhabited. It is located 78 km to the east of the Great Northern Highway and is
currently accessible via an existing access track (see Figure 9 [20]), with the turnoff located near the
Kumarina Roadhouse.
Figure 9: Access Track to the Beyondie Site (L52/162, L52/186, L52/187, L69/28, L69/29, L69/30,
M69/145) [20]
The BSOPP will concentrate supporting infrastructure mainly at the evaporation and processing area
(project area) and will include offices, ancillary buildings, maintenance facilities, accommodation,
diesel fuel, water, power, communications and Information Technology systems. Infrastructure will
be progressively built and expanded throughout the phased development of the BSOPP.
Fuel for power generation will be sourced as Liquified Natural Gas (LNG) supplied by road train.
Future expansion will include gas supplied from within 78 km via a gas spur from the GGP located
next to the GNH or LNG supplied by road train.

Beyondie Sulphate of Potash Project JORC (2012) and NI 43-101 Technical Report - 2018
Report2018_Final_20180917 31
Accommodation facilities will be required to house people inclusive of shutdown rooms at the project
area. When in operation the site will be operated by a Fly-In Fly-Out workforce with most employees
likely to be based in Perth, Geraldton and Newman. This is common with mining projects in Western
Australia.
It is planned to construct onsite administration buildings, a maintenance workshop and a product
warehouse. In addition to this, a certified contractor will operate an onsite laboratory.
Communications will be supplied for pilot scale works via satellite and then through a microwave
connection originating near the Kumarina Roadhouse and extending 78 km to the project area along
the alignment of the access road. Communications towers have been installed as required for the
initial development and expanded as necessary.
5 History
There has been no previous exploration on the tenements comprising the BSOPP. Prior ownerships
of the property and ownership changes are unknown.
6 Site Setting and Mineralisation
6.1 Hydrology
10 Mile Lake and Lake Sunshine have individual catchments that sit within the upper reaches of a
much larger system. In the geological past, it is considered that the catchments used to be linked by
a large palaeo-drainage system. The current landscape is now a function of the low rainfall and high
evaporation rates within the region.
The catchment areas associated with 10 Mile Lake and Lake Sunshine are shown in Figure 10. The
ephemeral creeks associated with these catchments flow into the lake systems. Analysis of aerial
imagery and topographic survey data suggests there is significant storage within the catchment
areas, which limits the volume of runoff reaching the lakes. The storages are in the form of parallel
dune systems and salt pans, as shown in Figure 11. Surface water is observed to be present on the
lakes for periods of time following heavy rainfall events.

Beyondie Sulphate of Potash Project JORC (2012) and NI 43-101 Technical Report - 2018
Report2018_Final_20180917 32
Figure 10: Catchment areas [21]
Figure 11: Examples of parallel dunes and salt pans within the catchment [21]

Beyondie Sulphate of Potash Project JORC (2012) and NI 43-101 Technical Report - 2018
Report2018_Final_20180917 33
A summary of the basic catchment parameters of Beyondie, 10 Mile Lake and Lake Sunshine is
presented in Table 7 below.
Table 7: Basic catchment parameters
Catchment ID Catchment
Area (km2)
Catchment Centroid Mainstream
Latitude (oS) Longitude (oE) Length (km) Equal Area Slope
(m/km)
10 Mile and Beyondie Lakes
3,160 24.8 120.2 61 0.80
Lake Sunshine 744.8 24.6 120.5 27 2.56
The following methodology was used to model flows into the 10 Mile Lake and Sunshine Lake
systems, estimate associated flood levels and map flood extents [21]:
• Estimate the likely volumes of flooding on the lakes for the 63%, 50%, 20%, 10%, 5%, 2%,
1% Annual Exceedance Probability (AEP) events using:
o available streamflow (if available);
o regional peak flow estimation methods (if available); and/or
o comparison of rainfall records and anecdotal evidence of flooding observed on site.
• Develop a simplified rainfall-runoff model and calibrate by varying the loss model (initial loss,
runoff coefficient) to produce volumes that are similar to the target volumes;
• Develop a rainfall-runoff model (RORB) and use the runoff coefficients to produce flow
hydrographs into the lakes for the 63%, 50%, 20%, 10%, 5%, 2%, 1% AEP events;
• Develop 2D models (TUFLOW) for each lake and use inflow hydrographs and direct rainfall
to simulate flooding for the 63%, 50%, 20%, 10%, 5%, 2%, 1% AEP events; and
• Map the extent of flooding in each of the lakes for the range of flood events.
The catchments only produce flows in large events, therefore a combination of anecdotal evidence,
data available from the Bureau of Meteorology (BOM) and analysis of the aerial imagery was used
to estimate the volume of water entering the lakes for the 63%, 50%, 20%, 10%, 5%, 2%, 1% AEP
events.
Anecdotal evidence was used to provide guidance on the resultant volumes of runoff reaching the
lakes during different AEP rainfall events. For the more regular events, it was noted that there is
generally no flow in creeks and the surface water on lakes was primarily due to direct rainfall.

Beyondie Sulphate of Potash Project JORC (2012) and NI 43-101 Technical Report - 2018
Report2018_Final_20180917 34
Approximately 60 mm of rainfall fell over a 48-hour period during a rainfall event in late January
2018. Based on the Intensity Frequency Duration ((IFD) data in Table 8 this is equivalent to between
a 50% and 20% AEP event (equivalent to 2yr and 5yr Average Recurrance Interval (ARI)). No creek
flow was seen entering the lakes and surface water depth on Lake Sunshine was estimated to be
less than approximately 0.1 m. Topographic survey data was used to estimate the surface water
levels and extents associated with the 50% and 20% AEP event on Lake Sunshine. The peak water
level was estimated to be approximately 531.7 mAHD.
Anecdotal evidence was then used to provide guidance on the resultant volumes of runoff reaching
the lakes during different AEP rainfall events. For the more regular events, it was noted that there is
generally no flow in creeks and the surface water on lakes was primarily due to direct rainfall.
Table 8: IFD Data for 10 Mile Lake and Lake Sunshine
Annual Exceedance Probability / Average Recurrence Interval
63.20% 50% 20% 10% 5% 2% 1%
Duration 1yr 1.44yr 4.88yr 10yr 20yr 50yr 100yr
1 min 1.23 1.47 2.28 2.88 3.49 4.34 5.04
2 min 2.07 2.49 3.88 4.9 5.98 7.57 8.9
3 min 2.88 3.46 5.39 6.81 8.29 10.5 12.3
4 min 3.62 4.34 6.75 8.52 10.4 13 15.2
5 min 4.29 5.14 7.99 10.1 12.2 15.3 17.8
10 min 6.81 8.17 12.7 15.9 19.3 24 27.7
15 min 8.53 10.2 15.9 20 24.1 30 34.6
30 min 11.7 14 21.8 27.4 33.2 41.3 47.9
1 hour 15 18 28 35.3 42.9 53.7 62.6
2 hour 18.6 22.3 34.6 43.8 53.5 67.5 79.2
3 hour 20.9 25 39 49.5 60.5 76.5 89.9
6 hour 25.5 30.5 47.7 60.7 74.5 94.2 111
12 hour 31 37.2 58.5 74.6 91.7 115 135
24 hour 37.1 44.7 70.9 90.7 112 139 161
48 hour 42.9 52.1 83.5 107 132 163 188
72 hour 45.8 55.8 89.9 116 143 176 201
96 hour 47.4 57.9 93.6 120 149 183 209
120 hour 48.5 59.3 95.9 123 153 187 214
144 hour 49.3 60.2 97.4 125 155 190 217
168 hour 49.9 60.9 98.4 127 156 192 219

Beyondie Sulphate of Potash Project JORC (2012) and NI 43-101 Technical Report - 2018
Report2018_Final_20180917 35
Analysis of aerial imagery, topographic survey data, IFD and anecdotal evidence made it possible
to estimate volumes entering the lakes. This was achieved for the 63%, 50%, 20%, 10%, 5%, 2%,
1% AEP events as follows:
• Use aerial imagery and observed water staining to estimate the bankfull depths which are
generally representative of the 50% AEP (2 year ARI) flood extents;
• Interpolate and extrapolate water depths using the 50% AEP depths and the depths
associated with the observed 50% to 20% AEP event; and
• Use topographic survey data and estimated water depths to map flood levels and extents.
Table 9 and Table 10 present the resulting estimated flood levels at 10 Mile Lake and Lake Sunshine
respectively, with the corresponding flood extents mapped in Figure 12 and Figure 13.
6.1.1 Flood Volumes
The flood volumes for rainfall-runoff model calibration were estimated using the topographic survey
data and presented in Table 9 and Table 10 for 10 Mile Lake and Lake Sunshine respectively.
Table 9: Estimated Flood levels and volumes at 10 Mile Lake under existing conditions
AEP Estimated Level (mAHD) Volume (m³)
63% 558.9 954,442
50% 559 2,577,750
20% 559.2 6,868,116
10% 559.4 12,122,441
5% 559.6 18,192,215
2% 559.8 25,029,770
1% 560 32,438,991
Table 10: Estimated Flood levels and volumes at Lake Sunshine under existing conditions
AEP Estimated Level (mAHD) Volume (m³)
63% 531.6 398,965
50% 531.7 1,101,984
20% 531.8 2,621,714
10% 532 6,609,357
5% 532.2 11,221,074
2% 532.4 16,433,500
1% 532.6 21,897,904

Beyondie Sulphate of Potash Project JORC (2012) and NI 43-101 Technical Report - 2018
Report2018_Final_20180917 36
Figure 12: Existing conditions - Flood level estimate for different storm events at 10 Mile Lake [21]
Figure 13: Existing conditions - Flood level estimate for different storm events at Lake Sunshine [21]

Beyondie Sulphate of Potash Project JORC (2012) and NI 43-101 Technical Report - 2018
Report2018_Final_20180917 37
6.2 Geological Setting
The Project area is located within the Collier, Salvation, Scorpion, and North-West Officer Basins.
The Marymia Dome (aged >2660 Ma) is located on the northeast fringe of the Yilgarn Craton (south-
east magin of the Basins) and comprises Archaean greenstone belts intruded by granites, and
notably monzogranitic rocks, which outcrops to the south of the Project.
Monzogranites are characterised as potassium rich and composed mostly of quartz and potassium
feldspar (alkali-feldspar); their proximity to the BSOPP area, along with other granitic inliers, makes
them a suspected source of the potassium enrichment in the region’s sub-surface brine deposits.
Intra-cratonic basin sediments including the Scorpion, Collier, and Salvation Basins comprise the
Bangemall Sub-group and Tooloo Group rocks, Figure 14. The youngest basement units within the
BSOPP, are the units of the North-West Officer Basin, the Sunbeam Group (c. 1000 – 720 Ma).
Mafic intrusions, belonging to the Warakurna Large Igneous Province, c.1078 – 1070 Ma, [13],
outcrop sporadically across the BSOPP area, Figure 14, and can be mapped with the publicly
available regional aeromagnetic data sets. Identified as dolerites and amygdaloidal basalts, they are
interpreted as being members of the Kulkatharra Dolerite suite in the western Salvation Basin area,
while in the east, they are identified as the Prenti Dolerite. These intrusive rocks are also considered
a source for the potassium enrichment.
Figure 14: Interpreted Bedrock Geology [5] [12]

Beyondie Sulphate of Potash Project JORC (2012) and NI 43-101 Technical Report - 2018
Report2018_Final_20180917 38
One of the key events to impact upon the palaeo-landscape was the Late Carboniferous – Early
Permian glaciation. The period stripped the ancient topography through glacial advance, depositing
glacial sediments hundreds of kilometres north and west of the Project region. The residual “scoured”
landscape following glacial retreat produced during those Palaeozoic times is considered to be the
palaeo-drainage network. This network has been subject to sedimentation comprising palaeovalley
fill of Cenozoic sediments which is a primary host for aquifers containing hypersaline brines. Three
phases of Cenozoic sedimentation make up the palaeo-drainage sequence, known as the
palaeovalley sediments, are recognised as:
• Palaeochannel sand – mid to upper Eocene aged
• Lacustrine clay – late Oligocene to mid Miocene aged
• Mixed alluvial and colluvium – Pliocene aged
Derived from palynological aged dating methods, the palaeovalley sedimentary sequence described
above is remarkably uniform across the Australian continent [6]. The basal palaeochannel unit is
dominated by high energy fluvial sands which is considered to have been formed in braided river
depositional environment under wet climatic conditions, these facies are typically located in the
deepest parts of the palaeovalley. Unconformably overlying the basal palaeochannel sand horizon,
are the low energy lacustrine clay horizons interpreted as forming within valley lakes and wetlands.
More discrete fluvial fine sand sequences are present within the lower clay deposits, associated with
lower energy palaeo-stream and channel depositional environments during the drying climate.
Finally, the upper alluvial and colluvial sequence is derived from tectonic adjustments and deflation.
It is varied in nature, and texturally further modified by ferricrete and silcrete weathering and regolith
processes.
All three sediment sequences have been intersected in drilling across the BSOPP, and as described
by Magee [6], occur with remarkable regularity. The extent of Cenozoic sediments within the project
area is presented in Figure 15.
The contact between the Cenozoic sediments and the basement rocks is considered the palaeo-
topography. Deep weathering profiles on this topography have been observed from geophysics and
drilling. The saprolitic profiles represent the long duration this surface has been exposed to
weathering and erosional process which has formed significant unconsolidated and friable
sediments on the margins of the palaeovalley where more weakly cemented sandstones are present.

Beyondie Sulphate of Potash Project JORC (2012) and NI 43-101 Technical Report - 2018
Report2018_Final_20180917 39
Figure 15: Extent of Cenozoic Geology [8]
6.3 Hydrogeology
Two regional aquifer units have been identified within the Cenozoic sediments, the palaeochannel
sand aquifer of Eocene age that is located at the base of the palaeo-drainage system, and the
shallow surficial aquifer comprising Pliocene and Quaternary evaporites, calcrete and silt of the lake
surface and alluvium. These aquifers are considered to be hydrogeologically separated from one
another by a thick sequence of stiff lacustrine clays that form an aquitard.
The regional bedrock is considered to be on the whole of low aquifer potential; however deep
weathering profiles in sandstones of the Jilyili Formation and vesicular basaltic sills in the vicinity of
the palaeovalley have proven to be highly prospective aquifer targets from the 2018 drilling program.
In addition, regional structural features described above and specifically the unconformity between
the Willy Willy Formation and the Backdoor Formation enhance aquifer transmissivity as linear
features.
Groundwater within the surficial aquifer is generally between 0.2 m and 11 m below ground level,
with depth to the ground water table determined by location within the catchment and local
topographic changes. Groundwater flow within the surficial aquifer is generally driven by rainfall and
episodic creek flow recharge to the aquifer system. The groundwater flow direction generally follows
the surface topography, with recharge and groundwater mounding dominant in the ephemeral creek
systems and discharge via evaporation occurring in the playa lakes through evaporation.

Beyondie Sulphate of Potash Project JORC (2012) and NI 43-101 Technical Report - 2018
Report2018_Final_20180917 40
Groundwater within the palaeochannel sand aquifer is confined in nature and has a piezometric head
that is independent to groundwater flow at the groundwater table. Piezometric head is a pressure
response of regional scale that has at a very low gradient (0.00008) from southwest to northeast
across the 10 Mile Lake and Lake Sunshine areas. The piezometric head is generally between 0.1
m and 0.5 m below the elevation of the water table near the centre of the palaeochannel. This head
difference becomes up to 1 m lower at the margins of the palaeovalley. These differences indicate
a degree of vertical downward drainage through the profile and potential mode of recharge from the
surficial aquifer to the palaeochannel sand aquifer, this maybe directly through the clay zones or,
more likely, at the margins of the palaeovalley through weathered and fractured bedrock. More
regional, distal recharge occurs up-hydraulic gradient of the palaeo-drainage systems where the
clays thin and meteoric water can enter the system, at the head-waters of the catchment.
Where bedrock aquifers are encountered below lacustrine clays the groundwater system is confined
in nature. However, where weathered bedrock is exposed outside of the palaeovalley groundwater
is unconfined and moves according to local groundwater table flow patterns.
6.3.1 Aquifer Conditions
The surficial aquifer conditions have been demonstrated on lake by construction and test pumping
of trenches dug in the surface of the playa lakes, and off lake via drilling and test pumping. The
construction of the trenches on lake has indicated a highly layered sequence of silts and evaporites
(gypsum) displaying high transmissivity associated with secondary porosity within evaporite zones
and lower transmissivity in more silty porous flow dominated zones. Vertical hydraulic conductivity
can be two orders of magnitude less than horizontal hydraulic conductivity.
When trenches were pumped, steady state flow conditions were achieved in monitoring pits located
at varying distances away from the pumping trench after between 5 days and 20 days of pumping.
A typical unconfined aquifer response with no boundary conditions was evident during test pumping
of all trenches indicating a laterally extensive aquifer.
Off lake the surficial aquifer generally comprises of low transmissivity silt and soft clay unless calcrete
is encountered. Calcrete is characterised by secondary porosity with very high transmissivity, but
moderate to low storage.
The palaeochannel sand aquifer is a confined porous system, laterally bounded by the edges of the
palaeovalley system and the poddy nature of the sand sequences. The aquifer can be characterised
as behaving as a strip aquifer system where multiple reduced hydraulic conductivity boundaries are
evident in pumping data. Leaky aquifer test pumping responses have been observed in test pumping

Beyondie Sulphate of Potash Project JORC (2012) and NI 43-101 Technical Report - 2018
Report2018_Final_20180917 41
at Lake Sunshine Palaeochannel sand aquifer bores. Drilling during the 2018 aircore program has
confirmed thick weathered sequences of sandstones and basalt present on the margins of the
palaeovalley which have been identified as production bore targets, but also provide leakage to the
deeper palaeochannel sand, which is considered to be in hydraulic connection.
Across the project, silcrete is encountered within the sand sequences in the weathered bedrock and
palaeochannel sand. Silcrete can have a secondary porosity which locally increases transmissivity
and can enhance bore yields.
The confined nature of the deep aquifer means that pumped water abstracted during practical long-
term aquifer testing will originate from confined storage, a pressure response to pumping. Specific
yield will not be obtained from test pumping of confined aquifer bores, therefore estimates of specific
yield have been determined from other methods, during the 2018 field program calibrated Borehole
Nuclear Magnetic Resonance (BMR) logs have been run to obtain in-situ measurements of specific
yield.
Magee (2009) presents pumping records of the Roe Palaeochannel located near Kalgoorlie. These
records indicate that longer term pumping yields are typically between 3 L/s and 11 L/s from the
palaeochannel sand aquifer, but decrease as drawdown hits aquifer boundaries and unconfined
conditions became prominent. The 10 years of pumping data presented in Magee (2009) has shown
that pumping water levels can stabilise once the piezometric head has reached the base of the
lacustrine clay and leakage becomes dominant in the aquifer system. The Roe Palaeochannel and
other Goldfields palaeochannel systems are considered to be of a similar age and depositional
environment as the Beyondie Palaeochannel and the results of the various hydrogeological
investigations have shown similar aquifer responses.
Medium term pumping rates during the depletion of confined storage stage of production will be
calibrated to the test pumping data. However, longer term production rates require six to twelve
months’ worth of pumping data at rates to significantly stress the aquifer to determine the rate of
leakage that influence longer term pumping rates, where leakage has not been measured in the
field, this is only practical during borefield operations, where interference effects between a number
of production bores can occur. Numerical modelling using sensitivity analysis has been utilised to
determine the rate of leakage and longer term sustainable pumping rates of production bores based
on known aquifer geometry and clay hydraulic properties.
The conceptual understanding of the system and the aquifers targeted for brine production is
presented in Figure 16 below.

Beyondie Sulphate of Potash Project JORC (2012) and NI 43-101 Technical Report - 2018
Report2018_Final_20180917 42
Figure 16: Hydrogeological Conceptual Model [17]
7 Deposit Type and Mineralisation
The BSOPP deposit is a brine, containing the target potassium and sulphate ions required to form a
potassium sulphate salt. The brine is contained within saturated sediments in at least four separate
horizons below the lake surface.
The lake bed alluvial sediments form the upper surficial aquifer and host the first brine horizon. The
second brine horizon is hydraulically connected to the upper aquifer and comprises the lacustrine
clay. The basal sand of the palaeochannel and the fractured bedrock form the third and fourth brine
horizons and are considered to be hydraulically disconnected from the shallow aquifer.
Exploration for potassium and sulphate rich brines has concentrated on the more permeable
horizons of the upper surficial aquifer, the basal sand of the palaeochannel and thick weathered
horizons of the sandstone bedrock. The lacustrine clays are considered to be of low permeability
and will not yield brine at economic flow rates, however they may contribute to leakage under long
term pumping conditions.

Beyondie Sulphate of Potash Project JORC (2012) and NI 43-101 Technical Report - 2018
Report2018_Final_20180917 43
8 Exploration
In August 2015, the Competent Persons of K-UTEC, Thomas Schicht and Anke Penndorf, visited
the Beyondie Lakes area. During this visit, K-UTEC staff could observe mud rotary drilling at bore
WB11_TB and could inspect the geophysical traversing being undertaken. The site visit report by K-
UTEC staff for the 2015 exploration is included at reference [7].
In June 2017, the Competent Persons of K-UTEC visited the Beyondie Lakes area again. During
this visit K-UTEC staff could inspect the current drilling sites, trenches and production bores as well
as the trial evaporation ponds near the camp site. Meetings with KLL’s consultants Advisian and
Western Geophysics were held to discuss the progress of the recent exploration and the
interpretation of current data. The 2017 site visit report by K-UTEC staff is included at reference [11].
The Competent Persons of K-UTEC visited the Beyondie Lakes area a third time in February 2018
(see report reference [19]). During this site visit K-UTEC staff could inspect the drilling sites of the
most current aircore and sonic drilling campaign. The new test ponds near the camp could be
inspected as well as the operational production bores for these ponds. Additionally, geological
sampling as well as sampling of surficial water and brine could be observed. Meetings with KLL’s
consultants Advisian and Western Geophysics were held again to discuss the progress of the recent
exploration and the interpretation of current data.
Advisian’s Principal Hydrogeologist has visited site many times between February 2017 and August
2018 typically coinciding with key activities such as commencement of drilling and test pumping
programs to ensure logging, data collection and sampling QA/QC procedures are being adequately
followed.
The Exploration of the BSOPP has involved a complex data collection programme, covering
augering, geophysics, drilling, water and soil sampling, aquifer testing and laboratory tests.
Exploration to date has comprised the following [8], [11], [19], [20]:
• 232 aircore, diamond and sonic drill holes to collect geological and brine samples;
• 400 auger holes across all the lakes up to depths of between 1.5 and 2 m, to collect
information on the lake surface geology and groundwater samples;
• 12 large 200 to 250 mm diameter cased test bores;
• 1,130km of geophysical traverses between 10 Mile Lake and White Lake;
• Installation of 61 monitoring boreholes;
• Excavation of ten trial trenches for 1,640 m of trench;

Beyondie Sulphate of Potash Project JORC (2012) and NI 43-101 Technical Report - 2018
Report2018_Final_20180917 44
• Grain size analysis of 61 sand samples from 12 boreholes, 2 clay samples from 2 boreholes
and 49 lake bed alluvium samples from 18 different lakes;
• 43 laboratory analyses of cores for porosity;
• 12 Borehole Nuclear Magnetic Resonance (BMR) logs;
• 13 mini aquifer tests (1 hr pumping / 1 hr recovery);
• 12 constant rate / recovery aquifer pumping tests;
• Laboratory analysis of water samples collected from augering (427), drilling (589) and during
the aquifer testing and bore development (161);
• 20 leach tests of the surface sediments;
• 16 weeks of bore test pumping;
• 11 weeks of trial trench test pumping;
• 45 weeks of trial pond pumping; and
• >260 million litres of brine pumped from aquifers.
8.1 Drilling
A summary of all drilling that has been undertaken at the project is presented below.
The 2015 drilling program comprised of a number of different methods including conventional air
percussion (to install surface casing), mud rotary drilling (with tricone and/or blade bit), as well as
blade/tricone bit drilling with brine as drilling fluid; all with 165 mm diameter bits. In September 2015,
HQ diamond core drilling and a casing advancer for further exploration drilling and retrieval of core
for laboratory testing was utilised. Where basal sands were encountered, the diamond holes were
reamed out to 300 mm and 200 mm PVC casing and gravel pack was installed. This technique was
employed on bores WB09, WB10, WB11, and WB12.
During the 2017 field program a further 22 aircore drill holes were completed at 10 Mile Lake and 25
at Lake Sunshine to explore the palaeovalley aquifer targets from the extensive geophysical program
to obtain lithological and brine samples and install monitoring bores. 28 monitoring bores were
installed within exploration holes at 10 Mile Lake and 22 monitoring bores were installed within
exploration holes at Lake Sunshine. A number of the exploration holes had dual monitoring bores
installed to monitor shallow and deep aquifer units.
The 2018 drilling field program involved installation of monitoring bores and a production bore using
sonic drilling methods and an extensive aircore exploration program. This program focused on the

Beyondie Sulphate of Potash Project JORC (2012) and NI 43-101 Technical Report - 2018
Report2018_Final_20180917 45
10 Mile Lake and Lake Sunshine Stage 1 production areas. The program involved drilling of 142
aircore exploration holes on transects totalling 7,794 m of drilling. This drilling has confirmed the
geological extent of the target geology and brine mineralisation. A sonic drilling rig followed up the
aircore drilling to twin ten key aircore holes, in order to obtain core for laboratory testing, and install
monitoring bores for a total of 710 m of drilling. An additional production bore (SSSN03PB) has been
installed within the weathered sandstone aquifer at Lake Sunshine.
All geological samples collected during all forms of drilling have been qualitatively logged at 1 m
intervals to gain an understanding of the variability in the aquifer materials hosting the brine. During
conventional and aircore drilling samples were collected washed and stored in chip trays for future
reference. A geological core description with detailed documentation (drilling log, soil profile) has
been prepared for each borehole and is stored within the geological database. Sonic core trays have
been logged and stored onsite.
There are no drilling, sampling or recovery factors noted to date that could materially impact the
accuracy and reliability of the results. Drill data are included in Appendix 2.
All drillhole locations are presented in Figure 17 and Figure 18.
Figure 17: Drillhole Locations at 10 Mile Lake and Beyondie [20]

Beyondie Sulphate of Potash Project JORC (2012) and NI 43-101 Technical Report - 2018
Report2018_Final_20180917 46
Figure 18: Drillhole Locations at Lake Sunshine [20]
8.2 Augering
An auger hole drilling program was completed in 2015 and a follow up program was completed in
2017. Auger hole depths in the 2015 program were approximately 1.5 m depth on an approximate 1
km sample grid on all lake surfaces. The 2017 program resampled approximately 10% of the 2015
sample locations to obtain brine samples and lithological samples for laboratory testing; this program
was drilled to 2 m depth. The auger holes were installed using a motorized, hand held auger. After
the hole was allowed to fill with brine (generally within 5 minutes) samples were collected. When the
sediment had settled in the bottle, a clean sample was decanted to a 500 ml bottle, which was then
kept cool until delivery to the laboratory for analysis.

Beyondie Sulphate of Potash Project JORC (2012) and NI 43-101 Technical Report - 2018
Report2018_Final_20180917 47
Figure 19: Hand Held Auger Drilling [9]
The potassium concentrations for all auger-hole samples obtained to date are shown in Appendix 3,
and the locations are presented in Figure 20 and Figure 21.
Figure 20: 2015 Auger Holes [9]

Beyondie Sulphate of Potash Project JORC (2012) and NI 43-101 Technical Report - 2018
Report2018_Final_20180917 48
Figure 21: 2017 Auger Holes [20]
8.3 Trenching
Trial trenches have been used to investigate the lithology of the top 5 m of lake sediments and test
the ability of these sediments to supply brine. Ten trial trenches were completed: seven at 10 Mile
Lake and three at Lake Sunshine. The details of these trenches are provided in Table 11. Figure 22
shows the trenches being excavated.
Table 11: Trench Details
Trench ID Easting Northing Width (m) Depth (m) Length (m)
TMT01 230,586 7,258,398 1.5 2 500
TMT02 231,362 7,258,232 1.5 2 300
TMT03 231,182 7,258,059 3 5 500
TMT04 231,937 7,256,672 3 5 50
TMT05 232,351 7,256,493 3 5 90

Beyondie Sulphate of Potash Project JORC (2012) and NI 43-101 Technical Report - 2018
Report2018_Final_20180917 49
Trench ID Easting Northing Width (m) Depth (m) Length (m)
TMT06 233,130 7,254,077 1.5 2 80
TMT07 231,521 7,255,833 1.5 2 20
SSTENE 257,359 7,271,673 4 5 44
SSTESE 254,765 7,270,417 4 5 42
SSTNE 260,451 7,276,110 4 5 12
Shallow 2 m deep trenches were initially constructed at 10 Mile Lake using a small traditionally
tracked excavator, later, 5 m deep trenches were constructed at Lake Sunshine and 10 Mile Lake
with the use of a 12 tonne amphibious excavator. The deeper trenches had slopes at approximate 1
in 2 angles to maintain wall stability. Water level monitoring pits were dug with the excavators at a
number of locations between 5 m and 50 m from the trench to facilitate monitoring of the test
pumping.
Figure 22: Trench SST02 in construction [12]
Trenching provided an opportunity to log the bulk geology of the top 5 m of the lake sediments in
profile instead of relying on point samples from drill holes. The layered nature of the sediments was
evident with lithological zone evident related to different flooding events and subsequent evaporite
deposits. Notable brine inflows were evident in the trench walls where coarse gypsum crystals were
present as shown in Figure 23.

Beyondie Sulphate of Potash Project JORC (2012) and NI 43-101 Technical Report - 2018
Report2018_Final_20180917 50
Figure 23: Gypsum crystals in a 2 m long section of trench at SST01 (left) and 2 to 4 cm sized
gypsum crystals (left) [12]
8.4 Geophysical Surface Exploration
Geophysical gravity and passive H/V seismic surveys were undertaken between 2015 and 2017;
1,130 line km of traverse was completed from bedrock outcrop on one side of the palaeovalley to
bedrock outcrop on the other side where possible. The location of the gravity and passive seismic
traverses are presented in Figure 24 and Figure 25. These measurements provide information about
the location and extension of the palaeovalley and the location of the deepest sections where the
palaeochannel is expected to be located.
Gravity and passive H/V seismic methods give an indication to the palaeovalley geometry. The
results were used to plan the exploration drill hole locations to encounter brine within the basal sands
of the palaeochannel and deeply weathered zones of the bedrock.
Following drilling, the gravity and passive H/V seismic data has been integrated and calibrated to
the drilling results which have been used to map the basement surface topography away from the
main exploration areas and used to constrain the geological model in these locations.
Resistivity/conductivity surveys have also been completed using the NanoTEM system to resolve
some ambiguity in the gravity data at a number of key locations. The calibrated integrated
geophysical methods used have enabled a more robust geophysical model to be constructed which
has used two independent methods to locate and map the palaeovalley sediments.

Beyondie Sulphate of Potash Project JORC (2012) and NI 43-101 Technical Report - 2018
Report2018_Final_20180917 51
Figure 24: Gravity and Passive Seismic traverses, Western Area [12]
Figure 25: Gravity traverses, Eastern Area [12]

Beyondie Sulphate of Potash Project JORC (2012) and NI 43-101 Technical Report - 2018
Report2018_Final_20180917 52
8.5 Wireline Logging
Downhole geophysics (spectral gamma, conductivity and Borehole Nuclear Magnetic Resonance
(BMR)) has been completed on all monitoring bores completed in 2018 to measure lithological
changes and in-situ aquifer properties. The BMR logging has been calibrated to laboratory testing of
core plugs to assist with Resource estimation, a similar methodology to what is used in the Petroleum
industry to assist with estimating oil field resources and reservoir modelling. BMR technology
measures the behaviour of hydrogen nuclei when subjected to a magnetic field which can be related
to the volume of water present as bound water (specific retention) and movable water (specific yield,
(Sy)) quantities (Schlumberger 2007, NMRSA 2018).
The BMR logs were calibrated to laboratory controlled magnetic resonance analysis on 11 core plugs
taken from the sonic cores to ensure the cut-off times for specific yield calculation were
representative of the various lithologies. An average calibration was used to reduce the T2 cut-off
from the traditional sandstone derived 33 milli-seconds to 12.6 milli-seconds, this reduced cut-off
results in an increased specific yield portion of the total porosity. The change in cut-off is
representative of the volume of iron present in the sequence, the greater the iron content the lower
the cut-off time.
Notably, the BMR logs have been able to provide insight in to aquifer properties on a resolution
across the palaeovalley sequence and bedrock lithologies not previously observed from test
pumping, drilling or laboratory testing. The results indicate that in-situ specific yields of the basal
sand and silcrete aquifer zones maybe between 10% and 30%, however these zones are
significantly thicker than previously considered, the sandy lenses of the lower clay sequences have
higher specific yields which were previously categorised as lacustrine clays, which is now
incorporated into to the sand and silcrete aquifer resource. An example of a BMR log TMSN03 is
provided in Figure 26, this drill hole is located on the lake edge at 10 Mile Lake and shows the profile
from the lake surface to the base of the palaeochannel with significant sand and Silcrete present in
the bottom 30 m of the drill hole. All calibrated wireline logs are provided in Appendix 7.
When processing the logs for lithological properties for Resource estimating noise peaks and cavities
have been corrected. These features of the logs can be caused by washouts in the drill hole wall,
highly unconsolidated beds or grout seals in the bore annulus. Where these peaks occur in the
alluvium and lake sediments specific yield has been adjusted to 10% and where these occur in the
sandy zones of the palaeochannel and weathered sandstone Sy has been adjusted to 30%,
assuming that the washouts are likely to occur at the most permeable and high storage zones. Total
porosity has been adjusted to 0.45% in these zones.

Beyondie Sulphate of Potash Project JORC (2012) and NI 43-101 Technical Report - 2018
Report2018_Final_20180917 53
Figure 26: BMR Log from TMSN03 [17]

Beyondie Sulphate of Potash Project JORC (2012) and NI 43-101 Technical Report - 2018
Report2018_Final_20180917 54
8.6 Aquifer Tests
In December 2015, several pumping tests were conducted in test production bores to obtain
information on aquifer parameters such as permeability, specific yield and confined storage. In 2017
longer duration constant rate tests were carried out at seven test production bores and six trial
trenches. During 2018 one further aquifer test was completed on a new production bore at Lake
Sunshine installed within the weathered sandstone aquifer and one additional trial trench was
pumped at 10 Mile Lake. The durations of these longer tests ranged from three to twenty-one days.
Other small-scale aquifer tests that have been undertaken include mini constant rate tests (1 hr
pumping / 1 hr recovery) and slug testing at a number of monitoring bore locations.
The palaeochannel test pumping results have concluded the basal sand is extensive and performs
as a confined strip aquifer with leakage. Leakage was observed in bore SSPB19 as a flattening of
the drawdown curve during late time drawdown data. Aquifer properties from the palaeochannel
bores have been remarkably consistent, with permeability ranging from 2.1 m/d to 3.4 m/d and
confined storage from 0.0002 to 0.0008. A leakage parameter of 0.1 was measured at SSPB19.
Test pumping of the weathered sandstone at Lake Sunshine was completed in 2018 with a total of
five weeks of pumping at bore SSSN03PB, the 40 m deep bore sustained 17 L/s for the duration of
the test. The test displayed a leaky aquifer response, which was supported by drawdown being
measured in all shallow and deep monitoring bores on the western side of Lake Sunshine. Aquifer
responses were observed in bedrock, palaeochannel and shallow lake aquifer bores indicating
widespread connectivity. The test resulted in a permeability of between 2 m/d and 5 m/d and a
leakage parameter of between 0.03 and 0.04.
Surficial aquifer trial trench pumping produced reasonably consistent results. The aquifer performed
as unconfined and unbounded under the pumping durations completed, with steady state conditions
achieved in monitoring pits surrounding the trenches. Aquifer properties were surprisingly high, with
permeability ranging from 2.5 m/d to 24 m/d and specific yield ranging from 11% to 25%. These test
results indicated the flow into the trenches is dominated by highly transmissive gypsum zones, but
these zones are generally found throughout the lake sediments. The trenches have performed better
than expected and will contribute a significant proportion of the extractable resources. Aquifer testing
results are presented in Appendix 4 & 5.
Water samples during test pumping were collected, where possible, at intervals of one per day, to
assess changes in brine chemistry under pumping conditions. The test pumping brine chemistry for
all longer-term test pumping is plotted in Appendix 5. The sampling during test pumping has

Beyondie Sulphate of Potash Project JORC (2012) and NI 43-101 Technical Report - 2018
Report2018_Final_20180917 55
produced some fluctuating results in bores TMPB23 and SSPB15, and in trenches TMT02 and
SSTENE. However, a general rising average trend was generally observed in most tests.
8.7 Trial Pond Pumping
The trial evaporation ponds have been in operation since September 2017 and have required regular
filling to maintain water levels in the ponds. Brine has been pumped from WB10 and TMPB12 on the
eastern side of 10 Mile Lake.
During the filling of the ponds flow rates ranged from 10 L/s to 20 L/s, associated with approximately
17 m of aquifer drawdown in the deep confined aquifer between August and October 2017. Between
October 2017 and April 2018 abstraction has continued intermittently in response to water levels in
the ponds, pumping rates ranged from 6 L/s to 12 L/s with deep confined aquifer drawdown steady
at approximately 6 m during March and April 2018 in relation to constant pumping at approximately
6.5 L/s. Since April 2018 the ponds have required less supply in response to lower evaporation rates
and harvesting activities, water levels have slowly recovered, the average intermittent pumping rate
has been approximately 5 L/s during this time. Higher rates of pumping have occurred in June and
July to refill the ponds following harvesting of salts.
There is approximately 58 m of available drawdown within the deep confined aquifer in the vicinity
of WB10 and TMPB12 which can be utilised for additional production. The water table in the upper
aquifer has been stable during the trial ponds pumping period. The pumping has been observed as
centimetre scale drawdown in monitoring bores up to 2.3 km to the east at TMAC15, these responses
will be used to further calibrate the numerical model for the Reserve estimate and re-estimate
sustainable yields. The water level responses in monitoring bores adjacent to TMPB12 are presented
in Figure 27 and the cone of drawdown is indicated on the cross section in Figure 28.
Potassium and sulphate concentrations have been measured during the trial pond pumping which
showed that the concentration have generally been steady with fluctuations (up and down) observed
of less than 5% when pumped from the confined aquifer.

Beyondie Sulphate of Potash Project JORC (2012) and NI 43-101 Technical Report - 2018
Report2018_Final_20180917 56
Figure 27: Aquifer Water Level Response from Trial Pond Operations [17]
Figure 28: Section of 10 Mile Lake Showing Geology, Installed Production Bores and Trial Pond
Pumping Drawdown [17]

Beyondie Sulphate of Potash Project JORC (2012) and NI 43-101 Technical Report - 2018
Report2018_Final_20180917 57
8.8 Leaching Potential of the Lake Surface
The potential for the lake sediments to leach potassium (K) and sulphate (SO4) is important to
understand for the various controls on the nature of lake recharge and its impact to the surficial
resource over the life of mine. During operations lake recharge has potential to effect brine grade
via infiltration of lake surface waters through the unsaturated zone.
After periods of heavy rainfall, surface water can accumulate at the lowest parts of the lakes. This
was observed on Lake Sunshine in January 2018 after approximately 60 mm of rainfall fell over 72
hours which resulted in less than 1 cm depth of surface water within the lowest areas of the lake.
The surface water quality was sampled during the period the lake had surface water on it, the results
showed that total dissolved solids quickly rose from rainwater levels to approximatly 60,000 mg/L (K
= 2,590 mg/L, SO4 = 9,150 mg/L), at the time of the rainfall event, to approximately 250,000 mg/L (K
= 7,780 mg/L, SO4 = 26,100 mg/L) within a week. During the same period there was no surface
water present at 10 Mile Lake so no samples were able to be taken.
Preliminary leach testing of two core samples from 10 Mile Lake surface suggested that significant
volumes of potassium may leach when fresh water is flushed through the sediments, supporting the
findings from the lake surface samping. Therefore, a more extensive sampling and testing program
was completed across 10 Mile Lake and Lake Sunshine to determine the variability of leaching and
infiltration potential for the surface of the lakes.
8.8.1 Field Sampling
Sample points were determined with the aim of characterising the relatively low, medium, and high
points of the lake surfaces. This would cover the area’s most regularly inundated by surface water
and those very rarely inundated, and those areas in between. The sample locations are presented
in Figure 29 and Figure 30.
At each sample point a 150 mm diammeter core sampler was driven into the lake surface to obtain
a relatively undisturbed sample from the lake surface and record the lithology with relevant percent
of gypsum, silt and clay.

Beyondie Sulphate of Potash Project JORC (2012) and NI 43-101 Technical Report - 2018
Report2018_Final_20180917 58
Figure 29: 10 Mile Lake Leach Sampling Locations [17]
Figure 30: Lake Sunshine Leach Sampling Locations [17]

Beyondie Sulphate of Potash Project JORC (2012) and NI 43-101 Technical Report - 2018
Report2018_Final_20180917 59
8.8.2 Lab Testing
Testing was completed in the onsite laboratory at the Beyondie camp. Each test involved infiltrating
a known quantity of fresh water through each core and timing how long it took to infiltrate and yield
up to 125 mm of leached water. This was completed up to three times on each core, the leached
water was sampled and sent for assay and analysed for major species. The core samples were
returned to Perth for X-ray fluorescence (XRF) testwork of all samples and X-ray diffraction (XRD)
testwork of select samples. Leach test sample results are presented in Appendix 9.
For each lake the leached potassium concentration to in situ potassium concentration ratio was
plotted against the total volume recovered to produce a leaching curve as presented in Figure 31
and Figure 32. The trends of these curves show that generally the more water that is flushed through
a core the less potassium is released. Therefore these ratios can be used to determined the volume
of potassium leached from infiltration of known volumes of surface water during operations when an
unsaturated zone has developed. These properties of recharge need to be accounted for when
simulating the effects of recharge to the Resource in the lake sediments.
It is considered that the processes that have been observed above include dissolution of soluble
salts and diffusion between high concentration gradients from brine entrained in the bound and
capillary portions of total moisture content. Due to the inability to accurately measure whether the
potassium has come from the bound porosity or soluable salts this portion of potassium that is added
to the drainable portion of the resources via recharge is not accounted for in the Project‘s Resources
or Reserves but is accounted for here for the purposes of addressing potential dilution due to
recharge.

Beyondie Sulphate of Potash Project JORC (2012) and NI 43-101 Technical Report - 2018
Report2018_Final_20180917 60
Figure 31: 10 Mile Lake Leach Testing Results [17]
Figure 32: Lake Sunshine Leach Testing Results [17]

Beyondie Sulphate of Potash Project JORC (2012) and NI 43-101 Technical Report - 2018
Report2018_Final_20180917 61
8.8.3 XRD and XRF Analysis
XRF and XRD analysis has been completed to characterise the mineralogy and percent make up of
elements at the lake sufaces. The samples analysed were collected from the leach testing sites and
sent to BV for analysis.
XRF analysis shows that approximately 20% of the lake surfaces is comprised of silica (Si). Key
components of potassium (K) and sulphate (SO4) comprise 0.5% to 0.8% and 6.3% to 6.8%
respectively. A summary of the XRF analysis is presented in Table 12 below.
There is a general correlation between the insitu brine grade and the percent of potassium within the
XRF analysis. The higher potassium percentage measured in lake sediments at 10 Mile Lake is
representative of the higher potassium grades of the brine. Indicating potassium within the sediments
does have a control on brine grade.
Table 12: XRF Summary
Si (%) Al (%) Fe (%) Ca (%) Mg (%) S (%) K (%) Na (%) Cl (%) SO4 (%)
10 Mile Lake 17.5 2.6 1.8 8.4 3.7 6.9 0.8 2.9 4.7 6.8
Lake Sunshine 21.0 2.0 1.5 7.8 2.8 6.4 0.5 2.5 4.3 6.3
XRD analysis has provided a measurement of the relative mineral components of the lake surface
sediments. Gypsum is confirmed as the dominant mineral making up between 56% and 71% of the
bulk sample. Quartz and bassanite are the next common minerals, with minor amounts of halite and
amphibole group minerals. A summary of the XRD analysis is presented in Table 13 below.
Table 13: XRD Analysis
Mineral Composition Ten Mile Lake Lake Sunshine
TML07 TML09 SS07 SS10
Gypsum Ca(SO4)(H2O)2 56 61 67 71
Quartz SiO2 22 13 17 11
Bassanite 2CaSO4(H2O) 14 19 11 12
Halite NaCl 5 5 3 4
Amphibole Group* A0-1B2Y5Z8O22(OH,F,Cl)2 3 2 3 2
*A=Ca, Na, K, Pb; B=Ca, Fe2+, Li, Mg, Mn2+, Na; Y=Al, Cr3+, Fe2+, Fe3+, Mg, Mn2+, Ti, Z=Al, Be, Si, Ti.

Beyondie Sulphate of Potash Project JORC (2012) and NI 43-101 Technical Report - 2018
Report2018_Final_20180917 62
8.9 Geological Model Construction
The geological model has been built within Leapfrog Geo v4.2 implicit modelling software from Aranz
Geo Limited. The model used all available drilling data, surface mapping and geophysical data to
model the geology across the Beyondie, 10 Mile Lake and Lake Sunshine areas. The topography of
the model was derived from high precision orthoimagery of the main lake areas and bore sites. The
orthoimagery has a horizontal accuracy of 0.2 m and vertical accuracy of 0.08 m, all bore collars
were levelled to the topography in the model.
The geology has been constrained in areas of the model where drilling has left the aquifers open
and the geophysics is less certain by using polylines to reduce the modelling interpretation.
Sections from the geological model are presented in Appendix 8 and an example from 10 Mile Lake
is presented in Figure 33 below. All cross sections show potassium assays on drill holes within 400
m of each section, composite samples are shown as extended colour block on drill holes.
Figure 33: Geological Model Section at 10 Mile [17]
and Sand

Beyondie Sulphate of Potash Project JORC (2012) and NI 43-101 Technical Report - 2018
Report2018_Final_20180917 63
8.10 Porosity and Specific Yield (Drainable Porosity)
Total porosity is the volume of brine filled pores that is present in a unit volume of material. The
specific yield (or drainable porosity) is the portion of the total porosity that is freely drainable under
gravity. The remaining portion of the total porosity is called specific retention.
Brine resources are determined from the specific yield volume of the aquifer, whilst total porosity is
reported for comparative purposes only. The economic extractable volume is determined by
estimation of a Reserve which takes into account the Mining Factors of a brine including hydraulic
conductivity, the dynamics of the aquifers targeted and brine grade changes.
Total porosity and specific yield have been derived from a number of sources, these include:
• Aquifer testing;
• Laboratory analysis of core and drill samples; and
• Borehole nuclear magnetic resonance (BMR) logging.
The specific yield for the lake sediments is reliant on the aquifer testing results of the trenches, these
results are considered the most representative of the aquifer. Core analysis has been used for
calibration of the BMR logs which have been used as the primary source of specific yield for all other
lithologies, this has provided a very high vertical resolution of specific yield in the lithological profile.
The adopted specific yield and total porosity ranges are presented in Table 14 and Table 15.
Table 14: 10 Mile Lake and Beyondie Porosity and Specific Yield Ranges
Lithology Total Porosity Specific Yield
Range Weighted Mean Range Weighted Mean
Lake Sediments 0.43 - 0.48 0.45 0.11 - 0.25 0.16
Alluvium 0.32 - 0.42 0.39 0.7 - 0.18 0.13
Palaeovalley Clay 0.32 - 0.42 0.36 0.04 - 0.09 0.06
Sand and Silcrete 0.22 - 0.35 0.34 0.17 - 0.22 0.21
Fractured / Weathered Sandstone 0.25 0.25 0.08 0.08
Fractured / Weathered Siltstone 0.22 0.22 0.03 0.03
Table 15: Lake Sunshine Porosity and Specific Yield Ranges
Lithology Total Porosity Specific Yield
Range Weighted Mean Range Weighted Mean
Lake Sediments 0.42 - 0.48 0.45 0.12 - 0.19 0.17
Alluvium 0.29 - 0.38 0.33 0.07 - 0.16 0.14

Beyondie Sulphate of Potash Project JORC (2012) and NI 43-101 Technical Report - 2018
Report2018_Final_20180917 64
Lithology Total Porosity Specific Yield
Range Weighted Mean Range Weighted Mean
Palaeovalley Clay 0.30 - 0.37 0.33 0.07 - 0.08 0.08
Sand and Silcrete 0.17 - 0.32 0.29 0.1 - 0.25 0.21
Fractured / Weathered Sandstone 0.24 0.24 0.08 0.08
Fractured / Weathered Siltstone 0.22 0.22 0.03 0.03
Fractured / Weathered Basalt 0.24 0.24 0.16 0.16
9 Sampling
All drill holes were sampled for lithology and where possible brine quality during drilling. Lithological
samples of aquifer zones in the surficial aquifer (Lake Sediments and Alluvium) and palaeochannel
sand aquifer (Sand and Silcrete) were obtained from drill samples and selected for laboratory testing.
Brine samples were obtained during aircore drilling from the cyclone during extended airlift testing
at varied intervals. These samples are interpreted to be indicative of the depth at which the airlift is
taking place, though some contamination from the surficial aquifer cannot be ruled out. Samples
obtained from test pumping are considered to be the most representative of the target aquifers,
where the aquifer zone is cased and sealed with bentonite to prevent any inter-bore flow, these
samples are considered to be composite samples for resource estimation. Samples obtained from
trench pumping are considered representative of the length and depth of the excavation.
Auger samples are considered representative of the upper surficial aquifer at each of the lake
surfaces, and all samples were taken up to a maximum depth of 1.5 m for the 2015 holes and up to
2 m depth in the 2017 sampling. Wherever possible, auger samples were typically taken at a 1 km
grid spacing.
Sonic core of 100 mm diameter was obtained from ten locations across 10 Mile Lake and Lake
Sunshine. Core was extruded from the core barrel into clear plastic core bags. Core bags were
sealed and placed into core trays, which were labelled at the drill site and stored on site. Following
geophysical logging individual core trays were selected for laboratory testing and transported back
to Perth. The core will be tested for permeability, total porosity, specific yield and laboratory based
magnetic resonance.

Beyondie Sulphate of Potash Project JORC (2012) and NI 43-101 Technical Report - 2018
Report2018_Final_20180917 65
Drill hole spacing in the various project areas is described below:
• Beyondie and 10 Mile Lake Surficial Sediments are between 1,600 m and 150 m (the
average is approximately 250 m);
• Beyondie and 10 Mile Lake Palaeochannel and Bedrock are between 1,600 m and 150
m (the average is approximately 270 m);
• Sunshine Surficial Sediments are between 3,000 m and 150 m (the average is
approximately 250 m); and
• Sunshine Palaeochannel and Bedrock are between 3,000 m and 150 m (the average is
approximately 450 m);
10 Sample Preparation, Analyses and Security
Brine samples collected from drilling or from augering were hand delivered by KLL or Advisian
personnel back to Perth, then handed over to Bureau-Veritas Minerals (BV) for analysis of various
parameters. All brine samples collected were kept cool (<20 ºC), until delivery to the laboratory in
Perth.
Elemental analyses of brine samples have been performed by a reputable laboratory, BV in Canning
Vale. The relationship between KLL and BV is strictly concerned with chemical analysis of samples
and cost estimates for an on-site laboratory. Bureau-Veritas is certified to the Quality Management
Systems standard ISO 9001. Additionally, it has internal standards and procedures for the regular
calibration of equipment and quality control methods. The laboratory equipment is calibrated with
standard solutions.
Duplicate samples (~10 %) were assayed at ALS’ Laboratory in Malaga during the 2015
investigations. ALS are certified to ISO 17025, the standard for testing and calibration in laboratories.
The relationship between KLL and ALS is strictly for the analysis of duplicate samples for the
BSOPP. Following the 2015 laboratory analysis it was determined that BV provided the most
conservative results and were used for the 2017 and 2018 laboratory testing.
Analyses of the brine samples were undertaken using Inductively Coupled Plasma Optical Emission
Spectrometry (ICP-OES), Ion Selective Electrode, and Inductive Coupled Plasma Mass
Spectroscopy. All samples were analysed for Ca, K, Mg, Na, SO4, and Cl. Selected samples were
analysed for a suite of 62 elements: Au, Ag ,As ,Ba, Be, Bi, Br, Cd, Ce, Co, Cs, Cu, Dy, Er, Eu, Ga,
Gd, Ge, Hf, Hg, Ho, In, La, Li, Lu, Mo, Nb, Ni, Pb, Pd, Pr, Pt, Rd, Re, Sb, Sc, Se, Sm, Sn, Sr, Ta,
Tb, Te, Th, Tl, Tm, U, W, Y, Yb, Zn, Zr, Al, B, Ca, Cr, Fe, K, Mg, Mn, Na, P, S, Si, Ti, V.

Beyondie Sulphate of Potash Project JORC (2012) and NI 43-101 Technical Report - 2018
Report2018_Final_20180917 66
The sample preparation and security (no mixed samples, origin of each sample is transparent) as
well as analytical procedures are aligned with international standards to ensure reliable results.
Sonic core samples were sent to Corelabs Perth for analysis. Sub-samples of core were selected by
the senior geologist covering the differing lithological types of the project. Individual core plugs were
obtained by dry icing the sections of core prior to drilling of a core plug. A number of core plugs failed
due to the unconsolidated nature of the sediments.
Lithological Samples were sent to Soil Water Group Laboratories for grain size analysis, porosity
and drainable porosity laboratory testing.
11 Data Verification
As outlined above, duplicate samples (~10%) from the augering program were assayed at ALS’
Laboratory in Malaga in order to verify the assay results performed by BV. ALS is certified to ISO
17025, the standard for testing and calibration in laboratories.
The results showed a good correlation amongst major ions (less than 10%) at both laboratories
except for Sulphur (BV’s values on average about 21% lower). Upon review of this discrepancy, BV
conducted an internal check and found no reason to suggest the Sulphur assay was incorrect. BV
analysed Sulphur by ICP-OES, then converted to SO4 by molecular weight calculation (this method
assumes all S exists as SO4, which may be incorrect). ALS used the method APHA 4500 to analyse
the SO4. For resource assessment, the lower sulphate results were considered as the worst-case
scenario.
The data is judged to be adequate for all calculations made for resource estimates. For a Measured
and Indicated Resource variabilities of less than 10% should be achieved, or a third independent
laboratory should be consulted. BV has been used as the preferred laboratory for all further brine
analysis following the check laboratory results.
Laboratory analytical quality was monitored through the use of randomly selected quality control
repeat samples, in addition to laboratory standards. There were 64 repeat analyses of the 717
samples, representing approximately 1 in every 11 samples. Verification of assay data included ion
balances and comparison of laboratory repeats and duplicates.

Beyondie Sulphate of Potash Project JORC (2012) and NI 43-101 Technical Report - 2018
Report2018_Final_20180917 67
12 Metallurgical Testing
To date, ten discrete phases of metallurgical test work have been undertaken.
12.1 CQG Trials
During the Concept Study, KLL engaged Australian consultants CQG to assist with conducting
bench-scale evaporation testing.
12.2 Small Scale Pilot Evaporation Trial
A small pilot scale evaporation trial was conducted during 2015 with 26,000 litres of brine to
determine seasonal effects on evaporation rates, provide a concentrated brine sample for raw salt
preparation and purification test work in Germany, as well as confirm the brine’s ability to evaporate
to dryness (Figure 34).
Figure 34: Small Scale Pilot Evaporation Ponds [3]
12.3 K-UTEC – Pre-Feasibility Works
KLL engaged K-UTEC to carry out test work and engineering studies to verify the evaporation pond
and purification process design requirements to produce potential saleable products including
Sulphate of Potash (SOP), Epsomite, Bischofite and Magnesium Hydroxide. A two cubic metre
sample of partially evaporated brine at a density of 1.28 g/cm3 was sent to K-UTEC’s facilities in
Sondershausen, Germany, in order to perform a higher level of pilot evaporation and processing
including:

Beyondie Sulphate of Potash Project JORC (2012) and NI 43-101 Technical Report - 2018
Report2018_Final_20180917 68
• Solar Evaporation of Beyondie Brine in a custom built evaporation chamber;
• Pre-treatment of raw Kainite Type Mixed Salt (KTMS) in order to separate NaCl and
MgCl2;
• Decomposition of raw KTMS to primary Schoenite;
• Cooling crystallization of secondary Schoenite from the SOP mother liquor;
• Conversion of Schoenite to SOP;
• Cooling crystallization of Epsomite from the bittern; and
• Crystallization of Bischofite by further evaporation of the bittern.
Figure 35: K-UTEC Facilities in Sondershausen, Germany [22]
The K-UTEC solar evaporation test works were performed over a period of 6 months. Mineralogical
investigation took place concurrently with chemical analysis of brines and harvested salts. Test
results essentially confirm K-UTEC’s assumptions, in particular for the solar evaporation and
processing of the Beyondie brine:

Beyondie Sulphate of Potash Project JORC (2012) and NI 43-101 Technical Report - 2018
Report2018_Final_20180917 69
• Evaporation was completed at a specific gravity of approx. 1.350 g/cm³;
• Confirmation of the expected evaporation path and sequence of the crystallized salts;
• Confirmation of the evaporation rates; and
• Confirmation of pre-treatment, decomposition, crystalisation and conversion to SOP.
12.4 Solar Pond Concentration Pathway Trials
KLL also carried out in-house evaporation tests of the brine to understand its evaporation behaviour
and determine critical points at which potassium and waste products are formed. These tests were
performed in accordance with a procedure supplied by Solar Pond Consultant DSB International
(DSB). DSB is a world renowned expert in the field of solar evaporation pond systems. During the
tests, a sample of brine was placed inside a small container in the laboratory and exposed to
alternating day and night temperature variations as expected on site. Brine was periodically sampled
and analysed for the major ions, (Mg, Na, K, SO4 and Cl). Once the container was half-full, brine
was transferred into another, smaller container. This was repeated until all the brine evaporated. The
concentration path of ions as a function of magnesium was then determined from the tests and is
shown in Figure 36 below.
Figure 36: Brine Concentration Path as a Function of % Mg [9]
DSB’s considerable (50+ years) experience was again tapped, and after analyzing all the results,
provided their interpretation of the concentration path the brine is most likely to follow; this is depicted
in Figure 37. The curve was fit to an equation and is used in KLL’s solar pond modeling. DSB also
provided a generic solar pond sizing model, which was further refined and updated by Kalium Lakes
with support from DRA to achieve the PFS outcomes.

Beyondie Sulphate of Potash Project JORC (2012) and NI 43-101 Technical Report - 2018
Report2018_Final_20180917 70
Figure 37: DSB Brine Concentration Path [23]
12.5 Site Pilot Pond works
The Large Scale Pilot Evaporation Pond program reflects KLL’s development strategy, where a
staged development approach is preceded by a pilot program to verify current assumptions and
operational parameters along with production of bulk samples for marketing purposes. This trial
program is based at the Beyondie, 10 Mile Lake and Lake Sunshine areas of the BSOPP.
The pilot ponds have been operated on a continuous basis (not batch) as recommended by KLL’s
key consultants K-UTEC, DRA and DSB International. The process involves pumping brine from a
bore and/or trench into a concentration pond which evaporates water prior to reaching the salting
point.
At this point brine is gravity fed (not pumped) to the next series of ponds where the sodium salts
crystallise out of solution. The brine is again gravity fed to the series of ponds where potassium salts
commence crystallising out of solution. Finally, a residual magnesium bittern remains, representing
only 1-2% of the original brine volume pumped into the concentrator pond.
Importantly all the ponds are tiered so that the brine can flow via gravity, without the need for pumping
between ponds, Figure 38.
Percent M g
0 1 2 3 4 5 6 7 8 9
Perc
ent o
f io
n sh
own
0.0
5.0
10.0
15.0
20.0
25.0Preliminary Adjusted Brine Concentration Curves
Chloride
Sulfate
Sodium
Potassium
DSB Apr.2016
Eut
ecti
c
halite
only
halite
epsomite
Leonite
lower grade
halite
epsomite
Kainite
halite
epsomite
kainite
high grade
halite
hexahydite
carnallite
high grade
no
salts

Beyondie Sulphate of Potash Project JORC (2012) and NI 43-101 Technical Report - 2018
Report2018_Final_20180917 71
Figure 38: Evaporation Pond Series [24]
The Large Scale Pilot Evaporation Pond program has provided a detailed understanding of the
following parameters:
• Layout and number of ponds;
• Dimensions of ponds to optimise flow path;
• Optimum brine depth within ponds;
• Differential evaporation rates as the brine density increases;
• Brine concentration profile and phase chemistry over seasonal and diurnal ranges;
• Brine entrainment in salt floors;
• Pond floor and liner requirements;
• Harvest equipment and plans;
• Pond start-up procedure;
• Time required to achieve steady state operations; and
• Operations and maintenance requirements.
The large scale evaporation trials have been run over twelve months and follow two previous smaller
scale pilot trials, all of which were utilised to inform the BFS design parameters. A summary of high
level observations and commentary is provided below:
• 260 million litres of brine have been pumped since pump testing began, of which 130
million litres of brine have been pumped into the trial ponds;
• More than 10,000 tonnes of salts have been produced so far, including 3,160 tonnes of
mixed potassium salts that can be processed to generate approximately 520 tonnes of
SOP;

Beyondie Sulphate of Potash Project JORC (2012) and NI 43-101 Technical Report - 2018
Report2018_Final_20180917 72
• Salt growth in each of the ponds varies in thickness from 95 mm to 305 mm during the
seven month trial period, which is an average of 0.52 mm to 2.28 mm per day salt growth. It
should be noted that ponds were progressively brought online during a number of months
as seen in the time series photos (below);
• Importantly the harvested potassium salts contain ~7.5% K2O, accordingly, to achieve 1
tonne of SOP product requires ~7 tonnes of harvested mixed potassium salts which are
then treated in the purification plant to remove residual sodium, magnesium and chloride
salts;
• Salt harvesting can commence on the engineered, 1 mm High Density Polyethylene
(HDPE)-lined off lake ponds after deposition of a 100-150 mm protective salt layer. It will
take 3-6 months to develop this layer, after which all other salts above this level will be
harvestable. This is a significant time saving when compared to other salt and potash brine
operations around the world which are located on salt lakes or clay pans and require
around 400 mm of salt to form a trafficable surface on top of which your harvestable salts
will be located. As a bench marking exercise, Dampier Salt (Karratha) crystallises 250-300
mm of salt growth per annum which would appear to be similar to the KLL pilot scale trials
on an annualised basis, when taking into account seasonal factors. Therefore to crystallise
400 mm of salts would require ~18 months, with a further period to generate sufficient
harvestable salt depths;
• Entrainment of potassium bearing brine is between 10-30% of the salt bed itself and as
such needs to be treated as recovery loss or alternative recovered by drainage through
harvesting of the sodium chloride salts. KLL’s basis of design is to harvest sodium chloride
salts to release entrained brine and also avoid costly pond wall lifts which would need to
occur if the sodium chloride salt was left in the ponds. Due to Kalium Lakes low Na:K ratio,
less sodium chloride salt is produced reducing harvesting requirements;
• All ponds require a free board design ~ 250 mm for a significant 1:100 rainfall event;
• The brine concentration curves developed; theoretically, in the laboratory and during the
initial pilot scale trials have been replicated in the large scale pilot evaporation pond trials.
See Figure 39 below;

Beyondie Sulphate of Potash Project JORC (2012) and NI 43-101 Technical Report - 2018
Report2018_Final_20180917 73
Figure 39: Actual large scale pond brine concentration curves versus previous assumptions and
testwork [20]
• Differential evaporation rates occur as the brine concentration increases. This means fresh
brine evaporates at a significantly faster rate compared to the last potassium mixed salt
pond. This requires the evaporation pond design basis to allow for an increasing ratio of
pond area to brine to achieve the targeted production rate;
• Harvesting trials were conducted with harvest equipment selection, pond harvest intervals
and an overall full scale harvesting plan prepared on the back of these results; and
• Time required to achieve steady state operations is approximately six months, depending
on seasonal effects (temperature and humidity).
Images of the site pond pilot works including land clearing, earthworks, lining, salt crystallization
and harvesting can be viewed in Figure 40.

Beyondie Sulphate of Potash Project JORC (2012) and NI 43-101 Technical Report - 2018
Report2018_Final_20180917 74
Figure 40: Site Pilot Pond Works [24]

Beyondie Sulphate of Potash Project JORC (2012) and NI 43-101 Technical Report - 2018
Report2018_Final_20180917 75
12.6 SRC – Phase 1
The Saskatchewan Research Council (SRC) were engaged by Kalium Lakes Limited under the
direction of DRA Global to confirm and verify the potassium sulphate (SOP) recovery process for the
Beyondie Sulphate of Potash Project in late 2017. Test work undertaken by SRC included: sample
preparation; feed sample analysis and characterization; schoenite conversion; preliminary flotation
tests; preliminary SOP conversion tests and conceptual SOP recovery verification.
Kainite-type mixed salts produced in the large scale site pilot ponds were used as the feed material
for the SRC test work. Preliminary schoenite conversion test results showed liberation of the
minerals. Preliminary flotation test work results showed recoveries between 90% and 98%. The SOP
conversion test work produced product grades between 49% K2O and 51% K2O. Total K recovery
was estimated at 89.7% making a product grade of 50% K2O and without considering plant handling
losses.
12.7 SRC – Phase 2
Following successful completion of the Phase 1 works, SRC was engaged to perform further test
work with the aim of enhancing product recovery. SRC performed the following test work: SOP
conversion & Schoenite Conversion – temperature liquid/solid ratio and time optimization; Flotation
– collector optimization, dosage, direct vs reverse flotation, temperature confirmation; and locked
cycle tests.
Results of the test work included: high grade SOP (>52% K2O being produced); reduced SOP
conversion temperature; ideal schoenite conversion ratio; locked cycle test work verifying the
optimized tests and mass balance; and an overall K recovery of 93.6% without considering plant
handling losses.
12.8 K-UTEC – Bankable Feasibility Study Optimisation Works
With an initial process route established during the pre-feasibility study, optimization test work was
completed by K-UTEC on pre-treatment, KTMS decomposition, flotation, conversion and purification.
Additionally, having identified the flotation test work as the biggest hurdle to product potassium
grade, a cost benefit analysis was performed comparing hot leach vs cold leach vs flotation for
product purification.
Pre-treatment of the harvested mixed potassium salts involved comparing the quantities and
therefore ratios of potassium salts produced from the large scale evaporation pond trials. The salt
types produced are based on grade (which changes depending on the brine input pumping station)

Beyondie Sulphate of Potash Project JORC (2012) and NI 43-101 Technical Report - 2018
Report2018_Final_20180917 76
and temperature (which changes via seasons). The salts are then classified, crushed, milled and
mixed in the correct ratio to be used as feed material for the conversion of Kainite to Schoenite.
The first major chemical process for the production of SOP is conversion of Kainite to Schoenite
through decomposition. This involves mixing the mixed salt with water at ~20oC. Variables tested
during the conversion / decomposition test work included; temperature of the reactor, solution and
clarifier; solid to liquid ratio.
The flotation process is a mineral processing technique which selectively separates minerals based
on their hydrophobicity (water repellence). Flotation can be either direct or reverse, direct flotation
involves floating the valuable mineral, whilst reverse flotation involves floating the waste mineral.
Variables tested for the flotation process included: Crush size, reverse/direct flotation, collector,
collector dosage, pH, retention time, agitator speed, solid to liquid ratio.
The hot leach / cooling crystallization process is based on the differing solubilities of the
dissolved salts in order to separate the waste (sodium chloride) from the concentrate (potassium
salts). The experiment involves pre-crushing, removal of waste and impurities via hot leaching at
~75oC, and cooling crystallization of Schoenite at ~10oC. Variables tested for hot leach / cooling
crystallization included: Salt to leach liquor ratio; temperature; leach liquor composition and stirring
time.
The second decomposition step required in the process is converting Schoenite to raw SOP.
Based on equilibrium data (theory) the optimal temperature for conversion is ~48oC. The same
variables as that of the first decomposition step were tested. The clarified solution contains a large
quantity of dissolved potassium, this is cooled to ~15oC to precipitate Schoenite. This Schoenite is
recycled back to the flotation step to increase yield. Hot decomposition versus cold decomposition
was tested by K-UTEC to test whether a cold decomposition with a lower recovery, would outperform
the increased energy required for a warmer decomposition.
12.9 K-UTEC – Pilot Plant works
KLL engaged K-UTEC to produce approximately 250 kg of SOP, using original materials harvested
from the solar ponds from the large scale evaporation program. The requirement was to produce
SOP at the standard fertilizer grade of >50% K2O. The SOP produced would be used for granulation
test work to determine process parameters for the full scale compaction plant. The pilot works
followed the prescribed process route, all steps where done in bench scale facilities of about 100
litres, this quantity is enough to guarantee the required retention time to complete all reactions.

Beyondie Sulphate of Potash Project JORC (2012) and NI 43-101 Technical Report - 2018
Report2018_Final_20180917 77
The outcome of these works has formed the basis of the BFS design and confirmed product quality
and underlying process plant recovery assumptions. Images of K-UTEC’s pilot plant works to
produce 250 kg of SOP from KLL’s Beyondie brine are shown in Figure 41.
Figure 41: K-UTEC Pilot Plant Facilities [25]

Beyondie Sulphate of Potash Project JORC (2012) and NI 43-101 Technical Report - 2018
Report2018_Final_20180917 78
12.10 Compaction Testwork
Test work for drying & compaction/agglomeration has not been performed by K-UTEC as
compaction and agglomeration are very specialized unit operations, KLL has contracted experts in
the field, Sahut-Conreur (France) & Köppern (Germany) to perform the test work. The compaction
test confirmed the design requirements and formed part of the BFS design basis.
13 Mineral Resource Estimates
The Resource estimate covers updated Indicated and Inferred Resources and new Measured
Resources at 10 Mile Lake, Lake Sunshine and surrounding geology. Existing Indicated Resources,
Inferred Resources and an Exploration Target for the Western and Eastern regional lakes are not
affected by this Resource update. An assessment of the Ore Reserves will be completed as part of
the BFS study which is in progress.
Resource categories are linked to the types of data obtained, drill hole density and confidence; these
are listed below by category below.
Measured Resources have been calculated for areas where:
• Drilling and testing has confirmed local site geology and aquifer geometry to a high level of
confidence;
• Aquifer hydraulic properties (hydraulic conductivity and specific yield) have been
determined by multiple methods to a high level of confidence;
• Test pumping has measured groundwater flow interactions between the various geological
units to confirm extractability; and
• Brine samples have been collected at regular intervals on a dense drill pattern with a high
level of QA/QC to confirm brine concentrations.
Indicated Resources have been calculated for areas where:
• Drilling and testing has confirmed local site geology and aquifer geometry;
• Aquifer hydraulic properties (hydraulic conductivity and specific yield) have been
determined by more limited sampling and testing than Measured Resources;
• Test pumping has been completed to demonstrate extractability; and

Beyondie Sulphate of Potash Project JORC (2012) and NI 43-101 Technical Report - 2018
Report2018_Final_20180917 79
• A number of brine samples have been collected from a selection of locations to confirm
brine concentrations.
Inferred Resources have been calculated, based on a lesser amount of data and confidence, where:
• Geological evidence exists to imply but not verify the existence of brine grade and aquifer
geometry;
• Proven geophysical techniques have been used to infer palaeovalley aquifers away from
the main drilling investigation areas;
• Surface sampling and testing has determined brine grade at shallow depths which has
been inferred to reasonably persist to deeper aquifers as per the existing resource models;
• Aquifer properties can be inferred from tests undertaken in other contiguous areas of the
same palaeovalley system; and
• Non-conventional brine resources due to leaching processes of the lake sediments.
Inferred resources have been calculated where these processes are proven to exist but
further testing is required to increase confidence in the processes creating the mass
transfer of elements.
Exploration Targets have been calculated where:
• No brine-chemistry data exists of any kind to confirm the brine quality, but some aquifer
continuity with known brine resources may be expected based on geophysics (for example
along the palaeochannel reaches between lakes);
• Shallow- augering has provided evidence of high potassium concentrations which may be
expected to occur throughout the sequence (based on potassium distribution with depth
observed elsewhere), but there is no drilling or geophysical data available to provide any
geological context to the brine occurrence, or infer what the sequence at depth may be.
Due to the considerable distances involved between defined brine deposit zones at the BSOPP,
Resources have been split into three separate areas: 10 Mile Lake and Beyondie; Lake Sunshine;
and the Regional Lakes. The Resource update concentrates on upgrading the Resources in the 10
Mile Lake and Lake Sunshine areas of the Project. The aerial extents of these different Resource
categories are presented in Figure 42 and Figure 43.

Beyondie Sulphate of Potash Project JORC (2012) and NI 43-101 Technical Report - 2018
Report2018_Final_20180917 80
Resources have been determined for the five dominant lithological types within the project area:
• Lake surface sediments;
• Alluvial sediments;
• Palaeovalley clay;
• Palaeochannel sand and silcrete; and
• Weathered and fractured bedrock.
13.1 Resource Estimation Methodology
• A 3D geological model was constructed in Leapfrog Geo v4.2 implicit modelling software
from Aranz Geo Limited. The model used all available drilling data, surface mapping and
geophysical data to model the geology across the Beyondie, 10 Mile Lake and Lake
Sunshine areas. The topography of the model was derived from high precision ortho
imagery of the main lake areas and bore sites. The ortho imagery has a horizontal accuracy
of 0.2 m and vertical accuracy of 0.08 m, all drill holes were levelled to the topography in
the model.
• All drill hole assays for potassium, sulphate and magnesium were brought into the model as
1 m intervals when taken from drilling or as composites where assays are representative of
screened intervals from bores (i.e. test pumping and bore development). All database
values used in the models are provided as histograms in Appendix 10.
• The Edge module in Leapfrog Geo v4.2 was used for block modelling and numerical
estimation. Two block models were constructed, one for Beyondie and 10 Mile Lake, and
one for Lake Sunshine. Beyondie and 10 Mile Lake utilised standard block sizes of 250 m
in the x and y direction and 5 m in the z direction. Whilst Lake Sunshine used the same x
and y block size but 2.5 m blocks in the z direction. Sub blocking was used to refine the
block model in areas where geological surfaces intersect blocks. Parent blocks were split
by up to four blocks in the x and y direction and two blocks in the z direction. The block
model grade distributions are presented in Appendix 11.
• Estimators were set up for potassium, sulphate and magnesium for the below water table
domain. The domain was clipped to boundaries of the defined resource categories and
tenements, as hard boundaries, as presented in Figure 42 and Figure 43. The base of the
domain was defined as 460 m AHD. Parameter concentrations were estimated across the
cells using Ordinary Kriging, ellipsoid search parameters were assigned following review of

Beyondie Sulphate of Potash Project JORC (2012) and NI 43-101 Technical Report - 2018
Report2018_Final_20180917 81
the variography of each parameter.
The search parameters for each block model are listed below:
10 Mile Lake and Beyondie
• Ellipsoid Ranges - Max. = 3000m, Int. = 1800m, Min. = 61m
• No. of Samples – Max = 20, Min = 5.
Lake Sunshine
• Ellipsoid Ranges - Max. = 3000m, Int. = 2000m, Min. = 100m
• No. of Samples – Max = 20, Min = 3.
• Variogram models for each parameter are presented in Appendix 12. Nearest neighbour
(NN) and inverse distance squared (ID2) estimators were also run for potassium as check
accuracy calculations. The average grade of each model swath (average cell value in one
plane) and the plots of each model are presented in x, y and z directions for potassium in
Appendix 13. These plots show that the model adopted (k:3x3x2) is appropriate when
plotted against the ID2 and NN methods.
• Specific yield was calculated for the surficial lake sediments using the average of the trench
test-pumping analysis results. For all other lithologies the average values from calibrated
BMR logging were used.
• SOP grade from potassium concentrations were calculated using a conversion of 2.228475,
accounting for the atomic weight of sulphate (sulphur and oxygen) in the K2SO4 formula.
• Resource tonnages were calculated by multiplying the volume of the Resource Zone in
each lithology by the specific yield and SOP grade to obtain the drainable SOP volume.
• The non-conventional brine Resources in the Inferred ategory have been estimated from
the average leaching curves derives for each lake and the average recharge rates derived
from 2D surface water modelling.
The brine volumes listed below cover each of the individual categories, so the total volume would be
the summation of volumes calculated for each level of resource category listed below. The areas
determined for resource assessment are presented in Figure 42 to Figure 47.

Beyondie Sulphate of Potash Project JORC (2012) and NI 43-101 Technical Report - 2018
Report2018_Final_20180917 82
Figure 42: Location of Areas Delineated for Resource Assessment - 10 Mile Lake [17]
Figure 43: Location of Areas Delineated for Resource Assessment - Lake Sunshine [17]

Beyondie Sulphate of Potash Project JORC (2012) and NI 43-101 Technical Report - 2018
Report2018_Final_20180917 83
Figure 44: Location of Areas Delineated for Resource Assessment - Western Area Measured and
Indicated [17]
Figure 45: Location of Areas Delineated for Resource Assessment - Eastern Area Indicated
Resources [17]

Beyondie Sulphate of Potash Project JORC (2012) and NI 43-101 Technical Report - 2018
Report2018_Final_20180917 84
Figure 46: Location of Areas Delineated for Resource Assessment - Western Area Inferred and
Exploration Target [17]
Figure 47: Location of Areas Delineated for Resource Assessment - Eastern Area Inferred and Exploration Target [17]

Beyondie Sulphate of Potash Project JORC (2012) and NI 43-101 Technical Report - 2018
Report2018_Final_20180917 85
13.2 Measured Mineral Resource
Based on the criteria listed above, the brine Measured Resource is provided in the following Table
16.
13.3 Indicated Mineral Resource
Based on the criteria listed above, the brine Indicated Resource is provided in the following
Table 17.
13.4 Inferred Mineral Resource
Based on the criteria listed above, the brine Inferred Resource is provided in the following Table 18.
No Indicated Resource is part of the Inferred Resource.
13.5 Exploration Target
Based on the criteria listed above the Exploration Target is provided as a range, below in Table 19.
The BSOPP Exploration Target is based on a number of assumptions and limitations and is
conceptual in nature. It is not an indication of a Mineral Resource Estimate in accordance with the
JORC Code (2012) and it is uncertain if future exploration will result in the determination of a Mineral
Resource.
The Company wishes to advise that further drilling, trenching and test pumping to further test the
exploration target have not been planned and are not expected to occur until the Stage 1 phase of
the BSOPP is operating.

Beyondie Sulphate of Potash Project JORC (2012) and NI 43-101 Technical Report - 2018
Report2018_Final_20180917 86
Table 16: Measured Mineral Resources
Aquifer Type Volume (106 m3) Total Porosity
(-) Brine Volume
(106 m3) Specific Yield (-)
Drainable Brine Volume (106 m3)
K Grade (mg/L) K Mass (Mt) SO4 Grade
(mg/L) SO4 Mass (Mt)
Mg Grade (mg/L)
Mg Mass (mg/L) SOP Grade
(kg/m3) K2SO4 Mass (Mt)
Lake Surface Sediments
118 0.47 56 0.17 20 7,116 0.14 19,292 0.38 6,488 0.13 15.87 0.31
Alluvium 96 0.33 32 0.12 11 2,940 0.03 7,959 0.09 3,195 0.04 6.56 0.07
Palaeovalley Clay 799 0.35 282 0.06 47 4,609 0.22 14,475 0.68 4,088 0.19 10.28 0.49
Sand and Silcrete 228 0.33 75 0.21 48 5,643 0.27 17,282 0.83 5,062 0.24 12.58 0.60
Fractured / Weathered Bedrock
304 0.24 72 0.08 23 4,648 0.11 14,995 0.34 4,668 0.11 10.37 0.24
Total Resources 1,546 516 149 5,155 0.77 15,606 2.33 4,742 0.71 11.50 1.72
Table 17: Indicated Mineral Resources
Aquifer Type Volume (106 m3) Total Porosity (-) Brine Volume
(106 m3) Specific Yield (-)
Drainable Brine Volume (106 m3)
K Grade (mg/L) K Mass (Mt) SO4 Grade
(mg/L) SO4 Mass (Mt)
Mg Grade (mg/L)
Mg Mass (mg/L) SOP Grade
(kg/m3) K2SO4 Mass (Mt)
Lake Surface Sediments
477 0.45 215 0.11 53 5,993 0.32 18,526 0.99 6,705 0.36 13.36 0.71
Alluvium 1,380 0.36 494 0.13 186 5,090 0.95 14,151 2.63 4,197 0.78 11.35 2.11
Palaeovalley Clay 1,478 0.33 494 0.07 101 6,000 0.61 16,876 1.71 5,451 0.55 13.38 1.36
Sand and Silcrete 332 0.31 104 0.21 69 4,833 0.34 13,841 0.96 4,311 0.30 10.78 0.75
Fractured / Weathered Bedrock
5,505 0.23 1,243 0.06 325 5,846 1.90 17,277 5.61 5,318 1.73 13.04 4.24
Total Resources 9,173 2,550 735 5,591 4.11 16,197 11.91 5,058 3.72 12.47 9.17
Table 18: Inferred Mineral Resources
Aquifer Type Volume (106 m3) Total Porosity (-) Brine Volume
(106 m3) Specific Yield (-)
Drainable Brine Volume (106 m3)
K Grade (mg/L) K Mass (Mt) SO4 Grade
(mg/L) SO4 Mass (Mt)
Mg Grade (mg/L)
Mg Mass (mg/L) SOP Grade
(kg/m3) K2SO4 Mass (Mt)
Lake Surface Leaching
N/A N/A N/A N/A 80 5,373 0.43 16,986 1.36 3,632 0.29 11.98 0.96
Alluvium 2,064 0.45 929 0.11 98 6,239 0.61 18,663 1.82 6,872 0.67 13.91 1.36
Palaeovalley Clay 22,929 0.35 8,025 0.05 401 5,724 2.30 17,185 6.90 6,230 2.50 12.76 5.12
Sand and Silcrete 1,785 0.31 553 0.21 116 5,073 0.59 15,384 1.79 5,391 0.63 11.31 1.31
Total Resources 26,777 9,507 695 5,647 3.92 17,068 11.86 5,881 4.09 12.59 8.75
Table 19: Exploration Target
Geological Layer
Maximum Thickness
(m)
Coverage (km2)
Sediment Volume (106 m3)
Porosity (-)
Total Stored Brine
(106 m3)
Specific Yield (-)
Drainable Brine (106 m3)
K Grade (mg/L)
K Mass (Mt)
SO4 Grade (mg/L)
SO4 Mass (Mt)
Mg Grade (mg/L) Mg Mass (Mt) K2SO4 Mass
(Mt)
Alluvium 6 157 942 0.4 377 0.10 94 2,000 0.2 6,100 0.5 2,300 0.2 0.4
Clays 20 1,148 22,960 0.45 10,332 0.03 689 1,800 1.2 5,500 3.8 2,100 1.4 2.8
Basal Sands 7 108 756 0.35 265 0.18 136 1,600 0.2 5,000 0.7 1,900 0.3 0.5
Total 11,000 920 1,800 1.6 5.0 1.9 3.7
Alluvium 12 157 1,884 0.5 942 0.18 170 3,500 0.6 9,600 1.6 3,900 0.7 1.3
Clays 50 1148 57,400 0.55 31,570 0.08 2,500 3,300 8.3 9,100 22.8 3,700 9.3 18.4
Basal Sands 10 108 1,080 0.45 486 0.28 140 3,200 0.4 8,700 1.2 3,500 0.5 1.0
Total 33,000 2,810 3,300 9.3 25.6 10.4 20.7
Note (Table 16 to 19): Errors are due to rounding.

Beyondie Sulphate of Potash Project JORC (2012) and NI 43-101 Technical Report - 2018
Report2018_Final_20180917 87
13.6 Total Brine Volume
For comparative purposes, the following Table 20 has been provided to compare the above Indicated
and Inferred Resources, as well as the Exploration Target which have all been based on Drainable
Brine Volumes, against other Australian Listed Companies’ Mineral Resources which have been
quoting Resources based on Total Brine Volume. As can be seen the Total Brine Volume is
significantly higher than reporting against the CIM Guidelines of Drainable Brine. For production, the
drainable brine component is the most important volume because not all the total brine can be
extracted.
Table 20: Resources Summary
Level Total Brine Volume
(106 m3) K*
(106 tonne) SO4*
(106 tonne) Mg*
(106 tonne) SOP*
(106 tonne)
Total In-Situ volume associated with the Measured Mineral
Resource
516 2.54 7.77 2.33 5.67
Total In-Situ volume associated with the Indicated Mineral
Resource
2,550 14.54 42.23 13.27 32.42
Total In-Situ volume associated with the
Inferred Mineral Resource
9,507 54.53 163.75 59.36 121.61
Total In-Situ Volume associated with the Exploration Target^
11,000 – 33,000 20 – 110 60 – 300 23– 120 40 – 250
* Tonnage for K, SO4, Mg and SOP were calculated from the average grades of K, SO4 and SOP and the Total Brine Volume for each
resource.
Note: Errors are due to rounding.
^The Kalium Lakes Beyondie SOP Project “Exploration Target” is based on a number of assumptions and limitations and is conceptual
in nature. It is not an indication of a Mineral Resource Estimate in accordance with the JORC Code (2012) and it is uncertain if future
exploration will result in the determination of a Mineral Resource or that the Exploration Target will add to the economics of the BSOPP.
14 Ore Reserve Estimation
The Ore Reserve estimate has been developed by Advisian who have used detailed integrated
numerical groundwater flow and solute transport modelling for the individual lakes and catchments.
Modelling has been completed to the Australian Groundwater Modelling Guidelines [14] using
FEFLOW [15], an industry standard finite element modelling package.
The modelling has been used to simulate the Reserve estimate and develop mine plans for the
BSOPP. The detailed modelling report [17] describes the construction, calibration and operation of
the model to reporting guidelines. The following sections provides an outline of the model
development and outputs that contribute to the Reserve estimate.

Beyondie Sulphate of Potash Project JORC (2012) and NI 43-101 Technical Report - 2018
Report2018_Final_20180917 88
The Competent Persons and the relevant technical consultants have examined information provided
by KLL that constitutes a Bankable Feasibility Study as defined by Clause 39 of the JORC Code and
satisfies the requirements of Clauses 29 and 30 of the JORC Code. The Competent Persons are
satisfied that the Modifying Factors have been adequately addressed in this Study.
14.1 Numerical Modelling
Four separate models have been developed:
• 10 Mile Lake and Beyondie Shallow Aquifer;
• 10 Mile Lake and Beyondie Deep Aquifer;
• Lake Sunshine Shallow Aquifer; and
• Lake Sunshine Deep Aquifer.
14.1.1 Model Development
The groundwater models were developed to evaluate the recoverable resource from the shallow
unconfined aquifer and deep confined aquifer in the vicinity of 10 Mile Lake and Lake Sunshine. The
models used in the PFS were upgraded to account for the following amendments:
• Refinement of each model with the updated geological models;
• Input of additional water level calibration data from the trial ponds pumping at 10 Mile Lake
and long term test pumping at SSSN03PB and associated drawdown recorded in monitoring
bores;
• Update of initial parameter specific yield distribution based on the BMR results (Table 14);
• Modified recharge to the lake surface taking into account the 2D surface water models and
leaching analysis;
• Development of solute transport simulations to account for leaching and mixing of lake
surface recharge;
• Import of the updated block model grade distributions as concentrations of K and SO4; and
• Run additional predictive scenarios based on the 82 ktpa, 82 ktpa ramp up to 164 ktpa, and
with and without recharge.

Beyondie Sulphate of Potash Project JORC (2012) and NI 43-101 Technical Report - 2018
Report2018_Final_20180917 89
14.1.1.1 Model Domains
The model domains are of a regional scale based on the surface water catchment extents of 10 Mile
Lake, Beyondie Lakes and Lake Sunshine, it extends to include the exposed bedrock highs.
The initial mesh created for the regional steady-state model used the Advancing Front Method in
FEFLOW [15]. The mesh was then refined using the elements selections in the vicinity of the lakes
towards the domain boundary. A refined mesh in the vicinity of bores is used for pump testing
calibration of the confined aquifer. The ethos of refining the mesh was to create elements of
dimensions similar to the well diameter at the locations of the pumping wells, and to ensure at least
three elements between any pumping bores and associated observation bores.
The vertical discretisation in the palaeochannel areas used the following layers as a basis:
• Surficial layer, including upper lake sediments (aquifer, 1 layer);
• Lacustrine clays associated with palaeo-drainage systems (aquitard, 3 layers);
• Palaeochannel, contains palaeochannel sands but may be clay where sands are absent
and may also contain weathered bedrock, conductive/non-conductive fracture systems and
dolerite dykes (potential aquifer dependent on location, 1 layers); and
• Bedrock (1 layer).
Areas away from the palaeo-drainage use the following layering:
• Weathered rock (aquifer, 1-2 layers); and
• Bedrock (remaining layers).
The topography of the model used the ortho-imagery that covers the lake and the immediate
surrounds merged with the 1-second Shuttle Radar Topography Mission data for Australia matched
to the centre points of the elements in the mesh. All layers used geological boundaries imported from
the geological model (Section 8.9).
Lateral boundaries of the models were simulated as no-flow boundaries. Evaporation is constant at
4,100 mm at the surface of each model, while the extinction zones vary between 0.5 m and 4 m
depth. Recharge is discussed in Section 14.1.3 below.
Aquifer property zones have been derived from the geological model based on lithology distribution.
Initial aquifer properties are assigned to these zones based upon the test pumping interpretations.

Beyondie Sulphate of Potash Project JORC (2012) and NI 43-101 Technical Report - 2018
Report2018_Final_20180917 90
14.1.1.2 Model Calibration
The models have been calibrated using a combination of manual iterative calibration and automated
calibration using PEST [18]. Steady state conditions were calibrated to the initial water levels
measured across the project. Transient calibration utilised all pumping and recovery data, including
test pumping and trial pond pumping and the associated measurements observed in monitoring
bores across the project in each aquifer and aquitard.
14.1.1.3 Hydraulic and Transport Properties
The distribution of calibrated hydraulic conductivity, specific yield and specific storage (confined
storage) is presented in Figure 49 to Figure 53.
Figure 48: 10 Mile Lake Hydraulic Conductivity Distribution [17]

Beyondie Sulphate of Potash Project JORC (2012) and NI 43-101 Technical Report - 2018
Report2018_Final_20180917 91
Figure 49: Lake Sunshine Hydraulic Conductivity Distribution [17]
Figure 50: Lake Sunshine Specific Yield Distribution [17]

Beyondie Sulphate of Potash Project JORC (2012) and NI 43-101 Technical Report - 2018
Report2018_Final_20180917 92
Figure 51: 10 Mile Lake Specific Yield Distribution [17]
e
Figure 52: 10 Mile Lake Specific Storage Distribution [17]

Beyondie Sulphate of Potash Project JORC (2012) and NI 43-101 Technical Report - 2018
Report2018_Final_20180917 93
Figure 53: Lake Sunshine Specific Storage Distribution [17]
The effective porosity used for transport calculations was set to be identical to the specific yield
values. Longitudinal and transverse dispersivity were set at 5 m and 0.5 m respectively. A range of
dispersivities were tested and the difference in the results was found to be insignificant in terms of
rate of mass produced. Diffusion was allocated across the model as a constant 10E-09 m2/s
14.1.2 Predictive Scenarios
Scenarios were developed to meet the proposed throughput of the mine at rates of 82 ktpa with and
without recharge and 82 to 164 ktpa with no recharge over the life of mine of 30 years.
Scenario 1 – 82 ktpa SOP Production Rate, no recharge;
Scenario 2 – 82 to 164 ktpa SOP Production, no recharge; and
Scenario 3 – 82 to 164 ktpa SOP Production, with recharge.
For all scenarios a total process (evaporation ponds and process plan) recovery factor of 72% was
used to derive the SOP production rates from the annual abstracted brine. Seasonal evaporation
pond demands have been simulated on a quarterly basis for the first ten years of operations. Annual
production rates have been simulated from year 11 to year 30. Abstraction rates have been modelled

Beyondie Sulphate of Potash Project JORC (2012) and NI 43-101 Technical Report - 2018
Report2018_Final_20180917 94
iteratively to manage grade and determine the variation in pumping regime necessary to meet the
pond requirements.
14.1.3 Recharge
Zero recharge is simulated in the calibrated models. Event based recharge is simulated in Scenario
2 and 4 of the predicted scenarios to evaluate its potential impacts to the Resource and mine plan.
The methodology for recharge is discussed below.
Surface water modelling (Section 6.1) has predicted the volumes of water that accumulate on each
lake relative to the AEP. Infiltration testing (Section 8.8) has shown that infiltration rates are far slower
than evaporation rates in the low areas of each lake where surface water often pools. Therefore it is
considered that small (<20% AEP (<5 year ARI)) events, which only inundate these areas will mostly
evaporate rather than infiltrate to the water table during operations and only events larger than the
20% AEP event will infiltrate and volumes of water recharge the lake sediments. The volume of water
that recharges is derived from the total volume of water in the flood event minus the volume of water
that occupies the low areas of the lake where infiltration rates are lower than evaporation.
A concentraton of potassium has been assigned to each recharge event based on the average
unsaturated zone thickness at the time of the event for the lake surface and the average leaching
curve (Figure 31 and Figure 32) relative to the volume of water infiltrating at each lake. Recharge is
then input to the model in the lake as a daily flux at the water table for that event and mixing occurs
via advection and dispersion factors within the model. The nature of the leaching curves suggests
that very large volumes of recharge are required to substantially dilute the insitu brine grade and that
any regular influxes of recharge that are not evaporated will serve as a replenishment to the
Resource. The modelled recharge scenarios are considered average conditions largely determined
from the AEP event volumes.
The parameters for recharge are presented in Table 21 and Table 22.
Table 21: 10 Mile Lake Recharge Parameters
Mine Year 5 10 15 20 25 30
ARI 4.88 yr 10 yr 4.88 yr 20 yr 4.88 yr 10 yr
AEP 20% 10% 20% 5% 20% 10%
Event Recharge Volume m3 6,066,616 11,091,941 6,066,616 16,932,715 6,066,616 11,091,941
Event Recharge Flux L/m2 152.06 278.01 152.06 424.41 152.06 278.01
Recharge Conc. K mg/L 7,055 6,695 6,280 5,219 4,873 4,286
Recharge Conc. SO4 mg/L 22,403 21,260 19,944 16,573 15,473 13,612
Recharge Conc. Mg mg/L 4,182 3,969 3,723 3,094 2,889 2,541

Beyondie Sulphate of Potash Project JORC (2012) and NI 43-101 Technical Report - 2018
Report2018_Final_20180917 95
Table 22: Lake Sunshine Recharge Parameters
Mine Year 5 10 15 20 25 30
ARI 4.88 yr 10 yr 4.88 yr 20 yr 4.88 yr 10 yr
AEP 20% 10% 20% 5% 20% 10%
Event Recharge Volume m3 1,493,243 4,728,572 1,493,243 8,587,975 1,590,605 4,890,842
Event Recharge Flux L/m2 59.65 188.88 59.65 343.04 62.72 206.88
Recharge Conc. K mg/L 6,354 5,456 5,491 4,480 4,731 4,145
Recharge Conc. SO4 mg/L 19,822 17,020 17,130 13,975 14,759 12,929
Recharge Conc. Mg mg/L 5,837 5,012 5,045 4,115 4,346 3,808
14.1.4 Production Results
Scenario 1 – No Recharge at 82 ktpa SOP
Presents the low production rate scenario with no recharge. Actual annual production rates vary
between 84 and 92 ktpa, with an average production rate of 86 ktpa SOP over the life of mine. The
abstracted volume of brine increases by 13% over the life of mine in relation to a 12% reduction in
potassium grade.
Scenario 2 – No Recharge at 82 to 164 ktpa SOP
This scenario has been used to develop the Reserve Estimate. Actual modelled annual production
rates range between 82 and 174 ktpa, with an average production rate of 97 ktpa SOP for the first 4
years, ramping up between Year 4 and Year 5 to 164 ktpa. The average production rate between
year 1 and year 30 was 137 ktpa, Indicated Resources from Stage 2 have been used to supplement
the annual production to meet the 164 ktpa production rate from year 12. The water table drawdown
for 10 Mile Lake and the confined aquifer drawdown for Lake Sunshine and 10 Mile Lake is presented
in Figure 54 to Figure 57 at the end of year 30. A summary of the production from this scenario is
presented in Table 23, the change in concentration of potassium is presented in Figure 58.
Scenario 3 – With Recharge at 82 to 164 ktpa SOP
This scenario has been used to test the impacts of recharge on the mine plan. Actual annual
production rates varied between 82 and 174 ktpa, with an average production rate of 97 ktpa SOP
for the first 4 years, ramping up between Year 4 and Year 5 to 164 ktpa. The average production
rate between year 1 and year 30 was 156 ktpa. The abstracted volume of brine increases by
approximately 15% with the addition of recharge to the simulation. Drawdown optimisation has not
been assessed to date, with optimisation it is anticipated that greater volumes can be abstracted.

Beyondie Sulphate of Potash Project JORC (2012) and NI 43-101 Technical Report - 2018
Report2018_Final_20180917 96
Figure 54: Trench Layout and Associated Unconfined Aquifer Drawdown at Year 30, Scenario 2 -
10 Mile Lake [17]
Figure 55: 10 Mile Lake Production Bore Layout and Associated Confined Aquifer Drawdown for
Scenario 2 at Year 30 [17]

Beyondie Sulphate of Potash Project JORC (2012) and NI 43-101 Technical Report - 2018
Report2018_Final_20180917 97
Figure 56: Trench Layout and Associated Unconfined Aquifer Drawdown at Year 30 Scenario 2 –
Sunshine [17]
Figure 57: Lake Sunshine Production Bore Layout and Associated Confined Aquifer Drawdown for
Scenario 2 at Year 30 [17]

Beyondie Sulphate of Potash Project JORC (2012) and NI 43-101 Technical Report - 2018
Report2018_Final_20180917 98
Table 23: Summary of Reserve Production Scenario 2 – 82 to 164 ktpa SOP Production
Abstraction Point
Brine Volume
(m3)
Pumping (days)
Average Pumping
Rate (m3/d)
K Production Concentration (mg/L) K Mass
Produced (kt)
SO4 Mass Produced
(kt)
K2SO4 Mass
Produced (kt) Minimum Maximum Average
10 Mile Production Bores
TMPB01 3,971,061 10,950 362.65 10,203 10,566 10,418 30.6 84.9 68.2
TMPB04 3,971,446 10,950 362.69 5,084 5,446 5,264 21.0 64.8 46.8
TMPB05 6,879,640 10,950 628.28 5,649 6,077 5,825 39.6 120.1 88.2
TMPB08 11,581,477 10,950 1,057.67 8,718 9,548 8,969 102.8 291.1 229.1
TMPB11 79,056 365 216.59 9,397 9,397 9,397 0.7 2.1 1.7
TMPB02 1,687,378 10,950 154.10 10,206 10,686 10,449 1.5 4.1 3.3
TMPB03 4,696,321 10,950 428.89 6,548 7,934 7,355 35.3 102.3 78.6
TMPB06 9,665,920 10,950 882.73 7,693 8,417 7,991 76.6 220.4 170.8
TMPB07 11,682,792 10,950 1,066.92 8,119 9,700 8,705 99.2 282.7 221.2
TMPB09 20,708,184 10,950 1,891.16 6,177 8,148 7,187 141.9 417.5 316.3
TMPB10 3,044,087 10,950 278.00 6,360 7,469 7,190 24.7 60.5 55.0
TMPB12 17,197,837 10,950 1,570.58 8,105 8,285 8,189 140.6 402.5 313.2
TMPB13 8,774,101 10,950 801.29 7,586 8,487 7,909 70.3 198.7 156.7
10 Mile Trench Pumps
TMTP01 5,098,540 10,950 465.62 7,400 8,820 7,897 42.5 121.4 94.7
TMTP02 1,690,078 2,920 578.79 6,848 9,385 8,630 15.5 43.7 34.6
TMTP03 6,174,855 10,950 563.91 7,819 9,217 8,195 51.9 148.1 115.7
TMTP04 13,140,506 10,950 1,200.05 5,567 6,782 6,036 79.5 239.0 177.2
TMTP05 2,147,462 3,285 653.72 3,371 7,899 6,546 15.7 45.7 35.0
Lake Sunshine Production Bores
SSPB01 3,726,091 3,650 1,020.85 2,500 3,320 2,834 10.2 53.1 22.7
SSPB02 5,290,317 10,950 483.13 3,497 3,811 3,723 19.6 57.6 43.7
SSPB03 1,572,292 3,650 430.77 4,476 4,897 4,717 7.3 20.8 16.2
SSPB04 7,974,985 10,950 728.31 6,490 6,883 6,631 52.7 146.0 117.5
SSPB05 3,553,115 10,950 324.49 7,057 7,274 7,194 25.3 69.7 56.5
SSPB06 4,553,716 10,950 415.86 6,554 6,713 6,636 30.0 83.2 67.0
SSPB07 8,438,975 10,950 770.68 5,982 6,044 6,033 50.9 142.1 113.5
SSPB08 6,808,991 10,950 621.83 4,988 5,197 5,119 34.6 98.2 77.2
SSPB09 8,706,116 10,950 795.08 7,218 7,290 7,258 63.1 173.5 140.7
SSPB10 11,402,901 10,950 1,041.36 6,341 6,428 6,363 72.5 201.4 161.6
SSPB11 1,975,466 10,950 180.41 6,333 6,549 6,372 12.6 35.0 28.1
SSPB12 1,022,603 10,950 93.39 6,183 6,216 6,199 6.3 17.6 14.1
SSPB13 7,025,522 10,950 641.60 5,001 5,317 5,106 17.5 49.7 39.1
SSPB14 2,009,127 10,950 183.48 5,492 5,608 5,587 11.2 31.4 24.9
SSPB15 5,664,471 10,950 517.30 6,496 6,625 6,567 37.0 102.5 82.4
SSPB16 10,736,844 10,950 980.53 5,567 6,175 5,692 61.0 171.0 135.9
SSPB17 11,115,128 10,950 1,015.08 4,233 4,686 4,357 40.7 117.4 90.7
SSPB18 16,847,340 10,950 1,538.57 2,622 3,023 2,938 21.5 65.5 47.9
SSPB19 12,769,038 10,950 1,166.12 3,217 3,714 3,335 21.1 62.9 46.9

Beyondie Sulphate of Potash Project JORC (2012) and NI 43-101 Technical Report - 2018
Report2018_Final_20180917 99
Abstraction Point
Brine Volume
(m3)
Pumping (days)
Average Pumping
Rate (m3/d)
K Production Concentration (mg/L) K Mass
Produced (kt)
SO4 Mass Produced
(kt)
K2SO4 Mass
Produced (kt) Minimum Maximum Average
SSPB20 12,942,834 10,950 1,181.99 4,434 5,399 4,682 59.9 171.6 133.6
SSPB21 7,923,986 10,950 723.65 7,357 7,414 7,399 58.6 160.8 130.6
SSPB23 6,232,865 10,950 569.21 2,700 4,105 3,611 21.1 62.8 47.0
SSPB24 10,271,663 10,950 938.05 3,465 4,179 3,643 37.3 110.1 83.2
SSPB25 13,006,445 10,950 1,187.80 2,739 3,017 2,852 24.9 76.3 55.6
SSPB26 8,302,175 10,950 758.19 6,002 6,095 6,047 50.2 139.9 111.8
SSPB27 12,602,767 10,950 1,150.94 7,016 7,041 7,022 86.5 238.3 192.8
SSPB28 4,095,145 10,950 373.99 6,510 6,730 6,542 26.8 74.4 59.8
Lake Sunshine Trench Pumps
SSTP01 19,743,654 10,950 1,803.07 6,577 7,513 6,870 135.8 366.2 302.6
SSTP02 6,199,979 4,015 1,544.20 2,500 7,439 5,735 36.9 103.1 82.3
SSTP03 9,657,891 7,300 1,323.00 2,500 7,301 5,557 58.9 164.2 131.3
SSTP04 18,958,850 10,950 1,731.40 5,983 6,938 6,286 119.1 331.0 265.4
Figure 58: Average Annual Concentration of Extracted Brine Scenario 2 – 82 to 164 ktpa SOP
Production [17]

Beyondie Sulphate of Potash Project JORC (2012) and NI 43-101 Technical Report - 2018
Report2018_Final_20180917 100
14.1.4.1 Abstraction Capture Zones
Abstraction capture zone analysis was used to determine the origin of brine from each abstraction
point (Production bore or trench). The Backward Pathline tool within FEFLOW was used to map the
particle traces of brine entering each abstraction point throughout the life of mine in Scenario 2.
Capture zones emanating outside of the resource evaluation zones were omitted from the estimate.
Proven and Probable Reserve volumes were derived from the capture zones originating from the
Measured and Indicated Resource zones respectively.
Surficial capture zones were drawn in FEFLOW representing the brine captured in year 30. The
polygon was exported and presented graphically in Figure 59, Figure 60, Figure 61 and Figure 62.
The full particle tracks could not be exported due to the density of the data.
Figure 59: 10 Mile Lake Production Bore Capture Zones [17]

Beyondie Sulphate of Potash Project JORC (2012) and NI 43-101 Technical Report - 2018
Report2018_Final_20180917 101
Figure 60: Lake Sunshine Production Bore Capture Zones [17]
e
Figure 61: 10 Mile Trench Capture Zones [17]

Beyondie Sulphate of Potash Project JORC (2012) and NI 43-101 Technical Report - 2018
Report2018_Final_20180917 102
Figure 62: Sunshine Trench Capture Zones [17]
14.1.4.2 Effects of Recharge
The comparison of the results of the recharge verses the no recharge predictive sceanrios show the
effects of leaching of the lake surface Resource during average rainfall conditions over the life of
mine. The results show that the Resource is replenished with a minimum of a 20% AEP (5 year ARI)
event. Over the 30 year mine life and taking into account average flooding conditions there is
approximately 15% increase in total potassium production, observed from year 11 onwards.
Concentration of potassium in abstracted brine is stabilised as the more dilute brine at the edges of
the lake are buffered by the leached recharge brine. The recharge effects are presented in Figure
63.

Beyondie Sulphate of Potash Project JORC (2012) and NI 43-101 Technical Report - 2018
Report2018_Final_20180917 103
Figure 63: Recharge effects to Potassium Mass at Lake Sunshine [17]
14.2 Ore Reserve Methodology
The results of Scenario 2 have been used to determine the Ore Reserve. The accumulated tonnes
of potassium produced from each production point (bores and trench pumps) over the life of mine
have been output from the solute model. SOP tonnes are calculated by multiplying potassium volume
produced by 2.228475 which is based on the molar mass of K to convert to K2SO4.
Where abstraction points have capture zones originating from outside the Resource Zones the trace
was given a zero concentration and factored into the Reserve calculation. Only brine originating from
inside the Resource Zones are estimated in the Ore Reserve.
Proved Reserves come from the production bores that have capture zones in the Measured
Resources regions of the 10 Mile Lake and Lake Sunshine deep aquifer. All trench pumps and all
other production bores have been allocated to Probable Reserves based on Indicated and Measured
Recources. Though the lake surface has Measured Resources for the top 5 m, the effects of variable
recharge on this zone means that these Resources only convert to the Probable Reserve category.

Beyondie Sulphate of Potash Project JORC (2012) and NI 43-101 Technical Report - 2018
Report2018_Final_20180917 104
A cut-off grade of 2,500 mg/L potassium has been applied to the Ore Reserve to reduce excess bine
volumes supplied to the ponds which would decrease production rates of SOP due to a more dilute
brine requiring additional evaporation area and time. This has been managed in the mine plan, by
turning off production bores when the potassium grade goes below this concentration.
The Ore Reserves only take into account the Measured and Indicated Resources of 10 Mile Lake
and Lake Sunshine, they do not include 0.7 Mt of Indicated Mineral Resources from the regional lake
sediments that form Stage 2 of the Project.
14.3 Proved and Probable Ore Reserve
Based on the methodology outlined above, the Proved and Probable Reserve estimates are detailed
in Table 24 and Table 25 respectively.
Table 24: Proved Ore Reserves
Aquifer Type
Brine Volume (106 m3)
K (mg/L) K Mass
(Mt) SO4 (mg/L)
SO4 Mass (Mt)
SOP Grade (kg/m3)
K2SO4 Mass (Mt)
Production Bores 119 6,207 0.74 17,945 2.14 13.83 1.65
Total Proved Reserve 119 6,207 0.74 17,945 2.14 13.83 1.65
Note: errors are due to rounding
Table 25: Probable Ore Reserves
Aquifer Type
Brine Volume (106 m3)
K (mg/L) K Mass
(Mt) SO4 (mg/L)
SO4 Mass (Mt)
SOP Grade (kg/m3)
K2SO4 Mass (Mt)
Lake Surface Sediments
212 4,755 1.01 13,669 2.90 10.60 2.25
Production Bores 83 6,713 0.56 18,867 1.56 14.96 1.24
Total Probable Reserve
295 5,306 1.57 15,129 4.46 11.82 3.49
Note: errors are due to rounding

Beyondie Sulphate of Potash Project JORC (2012) and NI 43-101 Technical Report - 2018
Report2018_Final_20180917 105
14.4 Relative Accuracy and Confidence in Reserve Calculation
The Ore Reserve estimate is considered to be a conservative representation of the aquifer systems
with general reasonable confidence in modelled outputs during the early to mid life of mine, with
confidence reducing during later mine life. This confidence is spatially represented with the highest
levels of confidence around the areas with good geological and test pumping control and the lowest
areas of confidence with limited data available.
It is important to note that hydrogeological numerical models have significant areas of uncertainty
and that the mine plan developed over a 30 year period is not definitive. Model sensitivity, predictive
uncertainty analysis and professional judgement have been incorporated into the numerical model
development to determine the most sensitive parameters of the model and the reliability of the data
used to gain an understanding of the relative accuracy of the model predictions. The sensitivity and
predictive uncertainty modelling results suggest that the model is a Class 2 level of confidence
according to the Australian Groundwater Modelling Guidelines [14]. A higher class could only be
achieved following a number of years of operational data collection and model verification.
Sensitive uncertainties in the modelling include aquifer recharge, which controls the rate of
drawdown and impacts the brine grade in the lake sediments, and vertical leakage from the
lacustrine clay which controls late mine life abstraction rates in the palaeochannel production bores.
Modelling for the Reserve Estimate has taken a conservative approach to these parameters to
ensure the model is representative of the level of understanding of the hydrogeology.
The management of recharge within the modelling and Reserve Estimate has provided a
conservative assessment of the lake surface Reserves. There is potential once operational data
becomes available or through further testing to more accurately measure the leaching component of
the lake sediments and bring this component into the Mineral Resources and Ore Reserves.
14.5 Other Major Brine Components
In addition to potassium and sulphate, the pumped brine contains quantities of sodium and chloride
that need to be quantified. These elements have not been modelled in the solute transport model
and therefore have been calculated based upon their average ratio to potassium, these are
presented graphically in Figure 64 for both 10 Mile Lake and Lake Sunshine Resources. The
minimum, maximum and average ratios of produced other elements over the life of mine are provided
in Table 26 below.

Beyondie Sulphate of Potash Project JORC (2012) and NI 43-101 Technical Report - 2018
Report2018_Final_20180917 106
Figure 64: Ratio of other Brine Elements to Potassium [17]
Table 26: Ratios of key Brine Elements
Element 10 Mile Lake Lake Sunshine Stage 1 Life of Mine
Min Max Ave Min Max Ave Min Max Ave
S.G. 1.14 1.16 1.15 1.09 1.11 1.10 1.12 1.13 1.12
Na:K 7.3 7.3 7.3 9.4 9.4 9.4 8.3 8.9 8.5
SO4:K 2.9 2.9 2.9 2.8 2.8 2.8 2.8 2.9 2.9
Mg:K 0.8 0.8 0.8 0.9 0.9 0.9 0.9 0.9 0.9
Cl:K 12.6 12.7 12.7 16.4 16.5 16.4 14.4 15.4 14.8

Beyondie Sulphate of Potash Project JORC (2012) and NI 43-101 Technical Report - 2018
Report2018_Final_20180917 107
15 Mining Methods
There are two principal methods applicable to extract the brine:
• Pumping from production bores in the basal sands (lower aquifer) plus leakage from brine
bearing segments within the palaeovalley clay and fractured/weathered bedrock, Figure
65; and
Figure 65: Existing production bore set-up [26]
• Pumping from trenches inside the alluvial sediments (upper aquifer) in trenches up to 10 m
depth, Figure 66.
Figure 66: Existing trench pumping set-up [26]

Beyondie Sulphate of Potash Project JORC (2012) and NI 43-101 Technical Report - 2018
Report2018_Final_20180917 108
Both methods will be used because of the properties of the different aquifers. The design of the bore
field and trenches will be based on the brine demand and aquifer conditions.
Mine plan’s have been developed to plan the sequence of bore and trench operations that will be
utilised over the mine life. This includes the Proved and Probable Reserves, Measured and Indicated
Resources outside of the Reserve and Inferred Resources. The mine plan brings in the Stage 2
resources to assess the mine life scenarios. The deposit life at each lake area has been based on
the modelled outputs from 10 Mile Lake and Lake Sunshine and the percent of reserves and
resources determined on an annual basis, along with annual production rate and grade.
The mine plan is developed based upon the design criteria for the ponds on a quarterly basis. Grade
and volume control was completed iteratively in the mine plan to meet target concentrations and flow
rates for the individual concentrator ponds at 10 Mile Lake and Lake Sunshine. Grade and volume
control were managed by modifying the seasonal abstraction of bores and trenches within the model.
Two scenarios have been developed:
• 82 ktpa SOP (mine life of ~50 years at the production rate – based on Proved Reserves,
Probable Reserves and Indicated Resources only within the Stage 1 + 2 area (Figure 69)
with significant life extension available from the Stage 2 area), Figure 67; and
• 82 – 164 ktpa SOP mine life 30 years to 48 years based on Proved and Probable Reserves
plus Measured, Indicated and Inferred Resources in Stage 1 & 2. It is noted that years 31
onwards have been excluded from the financial evaluation, Figure 68. No optimisation has
been completed on the mine plan for recharge or drawdown. Therefore it is considered
likely that further resources from the indicated and inferred portions of the Stage 1
Resources could be extracted from the mine plan.
Figure 67: 82 ktpa SOP Mine Plan (Bank Finance Case) [17]

Beyondie Sulphate of Potash Project JORC (2012) and NI 43-101 Technical Report - 2018
Report2018_Final_20180917 109
Figure 68: 82 ktpa to 164 ktpa SOP Mine Plan (Base Case) [17]
Figure 69: Stage 1 and Stage 2 Production Areas [12]

Beyondie Sulphate of Potash Project JORC (2012) and NI 43-101 Technical Report - 2018
Report2018_Final_20180917 110
16 Recovery Methods
The general mineral processing concept is comprised of the following areas, which are explained in
further detail below:
• Brine concentration and crystallization of solid raw materials for the processing plant, as
shown in Figure 70 and Figure 71;
• Purification plant; as shown in Figure 72.
Figure 70: Evaporation Pond Series [24]
The brine concentration and crystallization process begins with brine entering the evaporation
ponds whereby water is removed by solar evaporation. This causes gypsum, halite and astrakainite
to crystallise sequentially in the first two sets of ponds. Unless determined economical to process,
the calcium and sodium salts are left within the ponds to be harvested once full. The remaining brine
crystallises producing KTMS comprising leonitic, schoenitic and carnallitic mixed salts in the next set
of ponds. These salts are harvested and stored separately prior to mixing, pre-crushing and
transferral to the SOP plant. The resultant bittern from the solar evaporation process may be
transferred to a magnesium treatment plant.

Beyondie Sulphate of Potash Project JORC (2012) and NI 43-101 Technical Report - 2018
Report2018_Final_20180917 111
Figure 71: 164 ktpa SOP Pond and Plant Layout [16]

Beyondie Sulphate of Potash Project JORC (2012) and NI 43-101 Technical Report - 2018
Report2018_Final_20180917 112
Figure 72: SOP Purification Plant Block Flow Diagram [10]
The purification plant facility can be split into seven major areas:
1. Storage and crushing of potash salts – Harvested raw salts from different evaporation ponds
are stored in separate stockpiles. They are run through a ferrous and non-magnetic particle
seperator before being mixed in a controlled ratio and crushed down to a 1 mm particle size.
Crushing is performed by a combination of hammer crusher and wet hammer mill.
2. Conversion of potash salts to raw schoenite – The crushed, mixed salts are mixed with
cooled SOP mother liquor causing conversion of the mixed salts to schoenite. After conversion,
the schoenite will crystallize separately from halite allowing the separation of the salts from
each other.
3. Flotation of schoenite – The schoenite slurry undergoes conditioning before direct flotation in
flotation cells. Halite tailings are discarded during this process step and primary schoenite is
recovered. By floating the schoenite, the concentration of halite in potassium bearing salts will
be reduced to approximately 10% of its original concentration. Seperation of flotation liquor and
primary schoenite is performed by centrifuges.
4. Cooling crystallization of secondary schoenite – Hot SOP mother liquor is cooled in a five-
stage vacuum cooling crystallization unit, the temperature decrease results in crystallization of

Beyondie Sulphate of Potash Project JORC (2012) and NI 43-101 Technical Report - 2018
Report2018_Final_20180917 113
secondary schoenite. This process step is based on the varying solubility of schoenite
according to its temperature. This is centrifuged and mixed with the primary schoenite from the
previous step.
5. Decomposition of schoenite to SOP – The schoenite is decomposed into SOP by mixing with
warm aqueous SOP solution in a loop reactor at about 48⁰C. The SOP is first centrifuged before
being purified further by washing with aqueous SOP liquor. The liquid is recycled to the
schoenite decomposition step.
6. Drying – The wet, purified SOP is dried through the use of a fluidized bed drier.
7. Compaction and packing of SOP – Depending on product quality requirements (Standard,
soluble grade etc.), and packaging requirements, the product is compacted in a hammer mill
and/or packaged into bags/stored as a bulk product.
The simplified flowsheet is shown in Figure 73. K-UTEC AG Salt Technologies have also provided
typical layouts, block flow diagrams and process flow diagrams along with the detailed crystalliser
and processing report [10].
Figure 73: Simplified Process Scheme for Comprehensive Utilisation of Beyondie Brine [10][16]

Beyondie Sulphate of Potash Project JORC (2012) and NI 43-101 Technical Report - 2018
Report2018_Final_20180917 114
The major equipment used in the processing facility is summarised in Table 27.
Table 27: Major Equipment List
Area Process Description Main Equipment
120 Solar Evaporation Solar ponds, feed brine storage pond, bitterns storage ponds, harvesters
130 Salt Storage and Pre-Crushing Feeder breaker, separators, impact mill, screen, raw salt loader
210 Schoenite Conversion Schoenite reactors, thickener, hydrocyclone
220 Halite Separation Wet screen, hammer mill, floatation cells, belt filters
230 SOP Mother Liquor Cooling and
Schoenite Crystallization
Cooling crystallizers, steam ejectors, stirred tanks, agitators, slurry pumps, solution
pumps, hydrocyclones, pusher centrifuges, mixing condensers, vacuum pumps
240 Crystallization of Raw SOP SOP reactor, slurry pumps, solution pumps, heat exchanger, belt conveyors,
condensate and overflow vessel, hydrocyclones, centrifuges
250 Refining and Compaction of SOP
Hot Leaching reactor, slurry pumps, heat exchangers, belt filter, belt conveyors,
condensate, overflow and filtrate vessels, complete six-stage flash cooling plant,
thickener, hydrocyclones, centrifuges, drier, air fans, dust filter, screw conveyor
260 Storage and Packing of SOP
Bucket elevators, belt conveyors, screw conveyors, shovel loader, crusher, silos,
star feeder, telescope tubes, product shed, truck balance, packing unit with silo,
scale, filling device, big bag feeding and removing equipment
Figure 74: 3D Model of process plant [10][16]

Beyondie Sulphate of Potash Project JORC (2012) and NI 43-101 Technical Report - 2018
Report2018_Final_20180917 115
17 Project Infrastructure
17.1 Supporting Infrastructure
Supporting infrastructure will typically include offices, ancillary buildings, maintenance facilities,
accommodation, diesel fuel, water, power, communications and information technology systems.
Accommodation facilities will be required to house the workforce. It is the intention of the Company
that fuel for power generation will be sourced initially from LNG supplied by road train, then gas
supplied from a 78 km gas spur from the GGP. Miscellaneous Licences have been granted over the
78 km site access road, along which a gas pipeline, communications and other infrastructure may
be established or installed. Newman airport will be used as the air transport hub as the existing
services provide a more cost effective alternative to owner operated or contracted fleet services.
Figure 75 shows the workshop and administration building.
Figure 75: 3D Model of Workshop and Administration Building [10][16]

Beyondie Sulphate of Potash Project JORC (2012) and NI 43-101 Technical Report - 2018
Report2018_Final_20180917 116
17.1.1 Fresh Water
Raw water will be pumped and piped from water supply bores located at 10 Mile South or Kumarina
as shown in Figure 76. Full hydrogeological exploration, testing and modelling has been completed
on both borefield aquifers and reports submitted for abstraction licence applications. It is considered
that 10 Mile South will act as the primary borefield with Kumarina being utilised if required post
expansion to 164 ktpa.
Figure 76: Fresh Water Supply Areas [17]
Each bore pump will be powered from a combination of solar power and a local diesel generator
through a local control panel with a wireless telemetry link to the central control system. Each system
will be installed with a self-bunded diesel storage tank sized to allow for sufficient buffer capacity.
Above ground HDPE pipelines will transfer water to a central raw water dam located adjacent to the
plant, which will be configured with a fire water reserve and will supply raw water to the workshops,
process area, raw water pumps and fire water pumps. A separate water storage tank / fire tank will
be situated at the village. Fire and general purpose water will be reticulated in a common system.
Raw (bore) water will be treated to potable water standards at the admin buildings and workshop area
by a packaged plant consisting of fine filtration followed by a chlorine dosing and ultraviolet treatment.

Beyondie Sulphate of Potash Project JORC (2012) and NI 43-101 Technical Report - 2018
Report2018_Final_20180917 117
The filtration will remove fine particles from the raw water, while the cal-hypo chlorine dosing system
will disinfect the water to meet the requirements of the Australian Drinking Water Guidelines.
Estimated raw water supply in flow rate and annual volumes are shown in Table 28.
Table 28: Raw Water Requirements
Raw Water Supply Required 82 ktpa 164 ktpa
Village (m3/a) 1,916 2,902
Purification Plant (m3/a) 991,249 1,982,498
Non-processing Infrastructure (m3/a) 128 193
Road Maintenance (m3/a) 36,500 73,000
Total Raw Water Required (Gl/a) 1.03 2.06
17.1.2 Power Supply
Electrical power for the operation will be provided by a centralised gas fuelled power station located
near the processing plant. A combination of overhead lines and underground cabling will distribute
power to the plant, workshops, administration facilities and accommodation village.
Fuel for power generation will be sourced from gas supplied by road train for the initial development,
with a DN100 78 km gas spur to be built from the GGP for production at 164 ktpa and above.
Approximately 7 MW of installed power is required for operations at 82 ktpa.
17.1.3 Communication Facilities
Communications systems are to be seamless across all sites and cater for business, village
entertainment and voice communications. KLL have been in discussions with Telstra and other
service providers to provide an integrated and cost-effective communications system for the project.
The functional requirements of the system include:
• Microwave transmission between the Kumarina Roadhouse and the outer edges of the entire
Stage 1 area; and
• The pump controllers for the borefield to be run over wi-fi in order to remotely alter flow rates
from the process plant’s control room.

Beyondie Sulphate of Potash Project JORC (2012) and NI 43-101 Technical Report - 2018
Report2018_Final_20180917 118
Figure 77: Installed Communications Tower [26]
17.1.4 Accommodation
The accommodation village site is located between the process plant and the northern bank of 10
Mile Lake, isolated from plant noise and lake surface water by a small elevated hill. The village
atmosphere will be enhanced by adopting layouts which maximise advantages offered by the local
topography. Roads and pathways will separate vehicles from the accommodation and recreational
areas.

Beyondie Sulphate of Potash Project JORC (2012) and NI 43-101 Technical Report - 2018
Report2018_Final_20180917 119
The village includes accommodation, recreational facilities, waste water treatment, a helipad and
potable water supply. The village will be constructed as an early priority to provide accommodation
for the construction workforce and startup scale operational workforce. The accommodation village
layout is indicated in Figure 78.
Figure 78: Proposed Accomodation Village Layout [26]
17.2 Site Access and Product Haulage
The Beyondie site is due east of the Great Northern Highway (GNH) and requires upgrading and
partially realigning 78 km of existing access road to the processing facility and village. The access
road connects with the GNH just north of the existing Kumarina roadhouse.
Road haulage for transporting product from the Beyondie site to the various distribution centres via
the public road network has been selected as the optimum solution for the BSOPP. This is based on

Beyondie Sulphate of Potash Project JORC (2012) and NI 43-101 Technical Report - 2018
Report2018_Final_20180917 120
the close proximity to existing public road infrastructure, the relatively low product haulage
requirements and diversity in delivery locations.
Trucking options for the BSOPP include a combination of bulk loaded trailers, bulk loaded containers
and break bulk cargo (i.e. bulk bags) loaded on flat top truck trailers and curtain sided taut liners.
Recommended contracting strategies for road haulage includes dedicated contractor owned road
trains utilising back loaded capacity that travel past the Beyondie site to Perth.
17.3 Port
Kalium Lakes has investigated a number of port locations for export of product to the east coast of
Australia and into Asian markets.
Fremantle Port has been determined as the preferred container port, due to its mobile ship-loading
facilities and status as a destination on regular shipping routes.
Kwinana or Geraldton Port have been determined as the preferred ports for bulk export due to the
availability of existing port facilities, proximity to agricultural distribution centres and storage and
stockpiling facilities.
18 Market Studies and Contracts
Kalium Lakes has conducted a review of the potash market utilising leading industry market research
reports (CRU, Green Markets, Integer and Fertecon) and has formed the view that, although the
potassium chloride (KCl or MOP) is well supplied, the premium potassium sulphate (K2SO4 or SOP)
is undersupplied. Based on CRU forecast US$606/t average LOM SOP. CRU estimates that CFR
Australian prices in KLL’s first year of full production (2022) will be US$530/t with prices rising to
US$961-997/t in 2040. CRU forecasts a 2.8%pa growth in SOP.
It is notable that there is also no potash production in Australia, a nation which presently consumes
~360 ktpa of MOP and ~70 ktpa SOP. Thus an opportunity exists to capture the Australian supply
market with opportunities to extend into South East Asia, the Americas and Africa. The current
pricing landed in Australia is US$520/t.
Only five companies have capacity to produce greater than 350 ktpa of SOP and account for
approximately 60% of global supply. China accounts for the largest percentage of supply and has
seen a rapid increase in recent years.

Beyondie Sulphate of Potash Project JORC (2012) and NI 43-101 Technical Report - 2018
Report2018_Final_20180917 121
The BSOPP product will seek to exploit its competitive position within Australia associated with its
low production cost and low cost of freight when compared to overseas suppliers. The principal focus
is to supply the Australian market in the first instance whilst looking at opportunities to diversify
supply into South East Asia and other international locations.
Kalium Lakes has signed an offtake terms sheet with German fertiliser producer and distributor K+S
for 100% of Stage 1 production from the BSOPP. The offtake arrangement is subject to the execution
of a formal binding offtake agreement and satisfaction of certains conditions precedent, including
completion of due diligence by K+S. It is proposed that Kalium Lakes will supply 75 to 82 ktpa of
SOP to K+S over an initial 10 year term.
19 Environmental Studies, Permitting and Social or Community Impact
19.1 Environmental Studies
KLL has initiated and substantially completed an extensive range of baseline environmental studies
and investigations which have been conducted in consultation with government agencies and
regulators including DMIRS, EPA, DWER and DBCA. The survey programme has been completed
to inform a formal environmental impact assessment under the Environmental Protection Act 1986.
To date the following biological surveys in support of the Project have been undertaken by Phoenix
Environmental Sciences:
Table 29: Survey Program Undertaken to Date
Survey Description Area of Coverage Field Dates Report Title
Baseline aquatic
invertebrate fauna
survey
Beyondie Lakes, 10 Mile
Lake
9 Feb 2015; 16 April 2015, 23
July 2015
Waterbird and aquatic invertebrate
survey for the Beyondie Potash Project
Waterbird census Beyondie Lakes, 10 Mile
Lake
9 Feb 2015; 16 April 2015, 23
July 2015
Waterbird and aquatic invertebrate
survey for the Beyondie Potash Project
Level 2 terrestrial
fauna survey (incl.
SREs)
Beyondie Lakes and
proposed haul road to GNH
13-23 April 2015; 8 May 2015 Terrestrial fauna survey for the
Beyondie Potash Project
Level 1 terrestrial
fauna survey (incl.
SREs)
10 Mile Lake perimeter,
evaporation trial pond area
13-23 April 2015; 22-24 July
2015
Terrestrial fauna survey for the
Beyondie Potash Project
Level 1 terrestrial
fauna survey (incl.
SREs)
Lake Sunshine and transport
corridor between LS and TM
6-9 November 2015 Terrestrial fauna survey for the
Beyondie Potash Project

Beyondie Sulphate of Potash Project JORC (2012) and NI 43-101 Technical Report - 2018
Report2018_Final_20180917 122
Survey Description Area of Coverage Field Dates Report Title
Level 1 terrestrial
fauna survey (incl.
SREs)
Four proposed concentrator
lakes
12-17 October 2017 Flora, vegetation and fauna survey for
the Beyondie Sulphate of Potash Project
Concentrator Lakes
Level 2 flora and
vegetation survey
Beyondie Lakes and
proposed haul road to GNH,
evaporation trial pond area
13-23 April 2015 and 22-23
July 2015 (Phase 1); 7-14
October 2015 (Phase 2)
Flora and vegetation survey for the
Beyondie Potash Project
Level 1 flora and
vegetation survey
Four proposed concentrator
lakes
12-17 October 2017 Flora, vegetation and fauna survey for
the Beyondie Sulphate of Potash Project
Concentrator Lakes
Riparian vegetation mapping
10 Mile Lake perimeter 13-23 April; 16 August 2017 (samphire boundaries checked only
Flora and vegetation survey for the Beyondie Potash Project
Level 2 flora and vegetation survey
Lake Sunshine and transport corridor between LS and TM
2-9 November 2015 (Phase 1); 16 August 2017 (checking samphire boundaries only)
Flora and vegetation survey for the Beyondie Potash Project
Subterranean fauna Level 1 assessment
E69/3309, E69/3346, E69/3347, E69/3351 and E69/3352 and regional
29-31 March 2017 Level 1 subterranean fauna assessment of the Beyondie Potash Project
Targeted Night Parrot Survey
10 Mile and Lake Sunshine March, August/September and November 2017
Targeted Night Parrot (Pezoporus occidentalis) Survey for the Beyondie Potash Project
Stygofauna
Level 2 assessment
10 Mile South, Kumarina and Beyondie West, E 69/3347 and E 69/3309
22–27 February 2018 Level 2 stygofauna assessment for the Beyondie Sulphate of Potash Project
Work to characterise the environment is complete to BFS level, to date there have been no significant
issues identified that could not be managed through proper planning or appropriate environmental
management systems. The salt lake systems are reasonably common and extensive, however may
offer a unique habitat for some species.
19.2 Stakeholders
The KLL consultation strategy identifies key external stakeholders and determines how they will be
impacted by the BSOPP and what influence they may have over the project. The aim of such
extensive consultation is to develop productive relationships that ensure the BSOPP is underwritten
by sustainable agreements and the necessary approvals. The consultation strategy has been
developed to secure the approvals necessary for the construction and operation phase of the
BSOPP including the supporting infrasctructure i.e. export road routes and port export facilities which
will require consultation with the following:
• Local Government (Including Shire);
• State Government;
• Commonwealth Government;
• Underlying and Adjacent Mining Companies;

Beyondie Sulphate of Potash Project JORC (2012) and NI 43-101 Technical Report - 2018
Report2018_Final_20180917 123
• Aboriginal groups with a connection to the BSOPP lands; and
• Other community stakeholders, e.g. pastoralists.
Commonwealth, State and Local Government authorities have been briefed on the BSOPP to ensure
any issues, concerns or suggestions are identified and, where appropriate, addressed or responded
to by the project team. The consultations have been ongoing since 2014 and, while they have helped
inform the final BSOPP design, in most cases it results in providing the Government authority with
additional information and clarity about the project. The following regulatory departments and
authorities have been consulted extensively during the BSOPP feasibility study:
• Department of the Environment and Energy (Commonwealth);
• Department of State Development (State);
• Department of Mines, Industry Regulation and Safety (State) formally Department of
Mines and Petroleum;
• Office of the Environmental Protection Authority;
• Department of Biodiversity, Conservation and Attractions (State) formally Department of
Parks and Wildlife;
• Department of Water and Environmental Regulation, Perth and Pilbara Regional Office
(State) formally Department of Environment Regulation and Department of Water;
• Department of Transport (State);
• Department of Planning, Lands and Heritage (State) formally Department of Planning,
Department of Lands and Department of Aboriginal Affairs;
• Department of Health (Commonwealth);
• Environmental Protection Agency (State);
• Main Roads WA (State);
• Mid-West Port Authority (State);
• Minister for Mines (State);
• Minister for Aboriginal Affairs (State);
• Shire of Wiluna (Local authority);
• Shire of Meekatharra (Local authority); and
• Shire of Geraldton (Local authority).

Beyondie Sulphate of Potash Project JORC (2012) and NI 43-101 Technical Report - 2018
Report2018_Final_20180917 124
The consultation strategy also recognises that individuals, companies and broader communities are
interested in the impact that the BSOPP may have on them and can influence the approvals, licences
and agreements for the project. KLL has undertaken extensive engagement with the following
stakeholders to inform them of the BSOPP and discuss any opportunities or concerns that the
stakeholders would like to raise and resolve:
• Gingirana People (represented by the Marputu Aboriginal Corporation);
• Birriliburu People (represented by the Mungarlu Ngurrarankatja Rirraunkaja (MNR)
Aboriginal Corporation);
• Central Desert Native Title Services;
• Kumarina Pastoral Station;
• Marymia Pastoral Station;
• Kumarina Road House;
• APA (Goldfields Gas Pipeline);
• Drillabit;
• Murchison Copper Mines;
• AIC Resources;
• Great Sandy Pty Ltd; and
• Other independent explorers.
19.3 Native Title and Heritage
KLL has successfully negotiated two Land Access and Mineral Exploration Agreements with the
underlying Native Title groups, MNR people and the Gingirana people, which has enabled KLL to
undertake ground disturbing and non-ground disturbing exploration activities.
KLL have executed Mining Land Access Agreements with both the MNR and Gingirana people for
the BSOPP. The agreements notably consent to mining at the project’s commencement areas of
Beyondie Lake, 10 Mile Lake and Lake Sunshine.
A number of ethnographic and archaeological heritage surveys were completed between 2015 and
2018, enabling access for exploration activities. Isolated heritage sites have been identified.

Beyondie Sulphate of Potash Project JORC (2012) and NI 43-101 Technical Report - 2018
Report2018_Final_20180917 125
19.4 Permitting and Approvals
The Approvals Strategy is based on a staged approach to allow progressive and timely approvals
for each development phase of the base case for the BSOPP. The development phases are:
• Pilot Scale Development Ponds;
• Feasibility Studies;
• Debt and Equity Funding;
• Demonstration Scale Project Development – 82 ktpa SOP Production;
• Full Scale Project Development – 164 ktpa SOP Production; and
• Expansion and Enhancement – >250 ktpa SOP Production.
Approvals for the Pilot Scale Development Ponds and test pumping are currently in place. Based on
a legislative review and consultation, the following is a list of approvals required for the full-scale
project, Table 30. A number of these approvals have been secured or are expected to be secured
during 2018 and 2019.
At the completion of mining operations, disturbed areas will be rehabilitated, a Mine Closure Plan
and cost estimate have been developed as part of the BFS and approval requirements.
Table 30: List of Approvals (Demonstration Scale)
Approval Nature of Approval NT
Review
Submission
Status Approval Status
Native Title Act 1993 Mining Land Access Agreement
n/a n/a Secured March 2016 Gingirana
Secured January 2018 MNR
Aboriginal Heritage Act 1972
Cultural Heritage Management Plans
n/a n/a Secured March 2016 Gingirana
Secured January 2018 MNR
Heritage Surveys n/a n/a Secured September 2018
Progressive reviews as required
Section 18 consents n/a n/a Not required
Environmental Protection Act 1986
Part IV – EPA Approval (Early Works)
Complete Submitted
30 Oct 2017 Secured May 2018
Part IV – EPA Approval Complete Submitted
30 Oct 2017
EPA approval expected Q4 2018
Ministerial approval expected Q4 2018
Part V – Works Approval
Evaporation Ponds amendment
Complete Submitted
26 July 2018
Post EPA ministerial statement - Expected Q4 2018
Part V – Licence – Evaporation Ponds amendment
n/a
To be submitted at
commencement of
commissioning
Expected Q4 2019

Beyondie Sulphate of Potash Project JORC (2012) and NI 43-101 Technical Report - 2018
Report2018_Final_20180917 126
Approval Nature of Approval NT
Review
Submission
Status Approval Status
Part V – Works Approval Waste Water Treatment Plant
Complete Submitted May
2018 Expected Q3 2018
Part V – Works Approval Landfill Site
Complete Submitted
September 2018 Post EPA ministerial statement – Expected Q4 2018
Environment Protection and Biodiversity Conservation Act 1999
EPBC Act approval Complete Submitted
October 2017 Expected Q4 2018
Mining Act 1978
Mining Proposal and Closure Plan (Early Works)
Complete Submitted
September 2018 Secured August 2018
Mining Proposal and Closure Plan
Complete Submitted
September 2018 Post EPA ministerial statement – Expected Q4 2018
RIWI Act
5C licences for production (brine) and supply (fresh) – additional bores
- Submitted
January 2018
Post EPA ministerial statement - Expected Q4 2018
26D Licence for bore construction – additional bores
- Submitted
June 2018
Post EPA ministerial statement - Expected Q4 2018
Dangerous Goods Safety Act
Dangerous Goods licence for diesel storage facilities
n/a To be completed
by supplier Expected H1 2019
Dangerous Goods licence for LNG storage facilities
n/a To be completed
by supplier Expected H1 2019
Mines Safety and Inspection Act
Project Management Plan (Early Works)
n/a Submitted
December 2017 Secured February 2018
Project Management Plan n/a Submitted
September 2018 Expected Q4 2018
Petroleum Pipelines Act 1969
Pipeline Licence to Construct
- Submitted July 2018
Expected Q1 2019
Pipeline Licence to Operate
- To be submitted pending licence
Expected Q1 2020
Health Regulation 1974 Approval to construct or install an apparatus for the treatment of sewage
n/a Submitted
August 2018 Expected Q4 2018
Main Roads Act
Building Approvals
Great Northern Hwy Intersection Approval
n/a Submitted
August 2018 Expected Q4 2018
Main Roads Act Shire Building Licence n/a Submitted
September 2018 Expected Q4 2018
20 Capital and Operating Costs
20.1 Capital Costs
The BSOPP capital cost estimate (CAPEX) was developed to an AACE Class 3 estimate with an
implied accuracy of ±15 %. It includes the capital expenditure for extraction, evaporation, processing,
supporting infrastructure, road haulage, port facilities, utilities and services required for the
development of the BSOPP. Capital Costs were developed by area as defined in the Work
Breakdown Structure. The base case development includes a phased ramp up from a start-up of 82
ktpa SOP and then expanding to the BFS case of 164 ktpa. Pre-production Phase 1 capital cost of

Beyondie Sulphate of Potash Project JORC (2012) and NI 43-101 Technical Report - 2018
Report2018_Final_20180917 127
A$159 million for the initial 82 ktpa phase. A deferred capital cost of A$125 million is required to
ramp up production to 164 ktpa SOP. Pricing has been received from contractors and suppliers for
over 80% of capex costs. Table 31 presents the details of the capital cost estimate.
Table 31: Capital Cost Estimates (Based on incremental costs)
Area Area Description
Phase 1 –
Demonstration Scale
Phase 2 –
Full Scale Production
82 ktpa SOP A$M 164 ktpa SOP A$M
1000 Brine Supply & Ponds Evaporation 34.7 32.8
2000 SOP Purification Plant 54.4 47.9
3000 Non-Process Infrastructure 9.4 5.2
4000 Accommodation Village 2.5 0.2
5000 Off-Site Infrastructure 5.3 0.4
6000 Construction Indirect Costs 17.7 13.6
7000 Project Consultants & Management 12.8 8.1
8000 Owners Cost 7.8 7.1
9000 Contingency 15.0 10.0
Total Capital Cost 159.6 125.3
The project will source natural gas for power generation and other uses by initially using storage
bullets on site and then potentially via a connection to the Goldfields Gas Pipeline (GGP) near the
Kumarina roadhouse at the GNH. The approximately 78 km gas pipeline will follow the site access
road alignment. The pipeline design is sufficient to support gas requirements for the expanded
164 ktpa scenario and potential magnesium by-products. A pipeline diameter of DN100 has been
selected and can support flows from 1.16 to 5 TJ/d. An upgrade of the delivery facilities would be
required to support >5 TJ/d flow if a heater was not installed in the initial works.
The option to install a gas pipeline will incur a capital cost of A$29 million but would result in an
operating cost reduction.
The installation timing of the gas pipeline will be determined by securing the appropriate funding
arrangements either during Phase 1, Phase 2 or at a later stage.

Beyondie Sulphate of Potash Project JORC (2012) and NI 43-101 Technical Report - 2018
Report2018_Final_20180917 128
20.2 Operating Costs
An operating cost estimate (OPEX) with an implied accuracy better than ±15 % has been developed
for the BSOPP. The OPEX includes the operating expenditure required to extract, crystallise,
process and transport product to Fremantle or Geraldton Port and various off-take locations,
including shipping to the eastern states of Australia, China, Singapore, the USA and New Zealand.
All costs are in 2018 Australian dollars. Cash Operating Costs were developed for production
scenarios as shown in Table 32.
Table 32: Operating Cost Estimates
Area
Phase 1 –
Demonstration Scale
Phase 2– Full Scale
Production
82 ktpa A$t 164 ktpa A$t
Ex-Works 245.2*1*2 204.6*1*2
Haulage 39.9 42.88
Port (FCA – Containers, FOB – Bulk) 27.6 27.3
Cash Costs 312.7 274.4
Corporate Costs 31.7 23.1
Cash + Corporate Costs 344.4 297.8
Sustaining Capex 16.5 12.3
All In Sustaining Costs A$/t^ 360.9 310.1
AISC US$ (@ 0.73 USD:AUD)^ USD 263 USD 226
^Excludes Royalties and Taxes which are detailed in the Economic Analysis
*1If the gas pipeline is included in the BSOPP, the ex-works operating cost for Phase 1 decreases by $31.5/t SOP and for Phase 2 by $33.9/t SOP.
*2Includes a 5 year Build Own Operate Transfer (BOOT) power station. At the end of the five year BOOT contract, the power station ownership is
transferred to Kalium and the ex-works operating cost for Phase 1 decreases by $31.7/t SOP and for Phase 2 by $18.9/t SOP.
These estimates are in line with existing brine SOP producers, and secondary Mannheim (derived
from MOP) SOP producers as detailed in leading industry market research reports. A global operating
cost curve for existing SOP producers is presented in Figure 79 including the BSOPP’s position based
on the estimates presented in the BFS. This cost curve has been extracted from the CRU SOP market
study report [27].

Beyondie Sulphate of Potash Project JORC (2012) and NI 43-101 Technical Report - 2018
Report2018_Final_20180917 129
Figure 79: SOP Operating Cost Comparison (US$/t) [27]
21 Economic Analysis
Kalium Lakes has considered two financial cases:
1. Base Case: A phased ramp-up development scenario, starting with a commercial
demonstration scale 82ktpa SOP operation, before ramping up to a 164ktpa full scale SOP
production facility with a mine life of 30 years based on Figure 68.
2. Bank Finance Case: As financial institutions will only consider initial product development
parameters this case reflects a constant 82ktpa SOP production facility with a mine life of 50
years based on Figure 67.
Discounted cash flow analysis (DCF) was used to calculate key project valuation indicators for the
project, in particular, the Net Present Value (NPV) and Internal Rate of Return (“IRR”). NPV, IRR
and payback periods are measures of the return that are generated based on the applied
assumptions. An 8% discount rate (post–tax, nominal) was used for NPV calculations. A 2% inflation
factor is used. The DCF were modelled on a quarterly basis in nominal terms, referenced to CAPEX
and OPEX developed in Australian dollars (A$). The project was analysed on an unleveraged (100%
equity) basis.

Beyondie Sulphate of Potash Project JORC (2012) and NI 43-101 Technical Report - 2018
Report2018_Final_20180917 130
The macro assumptions in the financial model are as follows:
• Discount Rate (post-tax nominal) – 8%
• Corporate Tax Rate - Rate based on ATO guidance – 30%
• Depreciation – Straight line
• WA Royalty Rate – non-beneficiated - A$0.73/t SOP
• Native Title Royalty – unable to provide
• Founders’ Royalty - 1.9% gross revenue
• Mine Life - Variable, subject to production rate
• LOM Exchange Rate A$:US$ - $0.73
• A detailed SOP market study was commissioned by KLL and provided by CRU in
September 2018, this has been used as the basis for the commodity price, forecasted
US$606/t average LOM SOP sales @ $A/$US exchange rate of 0.73.
• CRU estimates that CFR Australian prices in KLL’s first year of full production (2022) will
be US$530/t with prices rising to US$961-997/t in 2040. CRU forecasts a 2.8%pa growth in
SOP.
A summary of the financial evaluation is presented in Table 33.
Table 33: Financial Summary
Production Case SOP
Description Unit Base Case
164 ktpa SOP
Bank Finance Case
82 ktpa SOP
Average LOM Reliased Sales Price1 US$/t SOP 606 643
Exchange Rate A$:US$ 0.73 0.73
Assumed Life of Mine years 302 503
LOM SOP Produced Tonnes 4,664 4,270
Project NPV8 (Pre-tax, nom)4 A$M 575 361
Project NPV8 (Post-tax, nom)5 A$M 347 217
IRR (Pre-tax) % 20.4 18.5
IRR (Post-tax) % 16.5 14.9
LOM Revenue A$M 5,689 6,876
LOM OPEX Cash Cost (Real)(FCA – containers, FOB bulk)6 A$/t SOP 2317 2848
LOM OPEX A$M 1,532 2,141
Initial CAPEX A$M 160 160

Beyondie Sulphate of Potash Project JORC (2012) and NI 43-101 Technical Report - 2018
Report2018_Final_20180917 131
Production Case SOP
Description Unit Base Case
164 ktpa SOP
Bank Finance Case
82 ktpa SOP
LOM CAPEX (incl. Sustaining) A$M 491 308
LOM Royalties9 A$M 130 155
LOM Corporate Tax A$M 956 1,092
LOM Free Cash Flow (pre-tax) A$M 3,045 3,555
Free Cash Flow (pre-tax) A$M p.a. 108 75
LOM Free Cash Flow (post tax) A$M 2,069 2,463
Free Cash Flow (post tax) A$M p.a. 76 53
LOM EBITDA A$M 3,487 3,838
EBITDA (average) A$M p.a. 116 77
EBITDA Margin % 61.3 55.8
CAPEX / EBITDA (average p.a.) x 0.14 0.08
Initial Payback Period (pre-tax)10 Years 7.0 6.3
Initial Payback Period (post-tax)11 Years 8.3 7.8
1Based on CRU forecast US$606/t average LOM SOP under the Base Case (US$643/t under the Bank Finance Case). CRU estimates that CFR
Australian prices in the first year of full production (FY2022) will be US$530/t with prices rising to US$961-997/t in 2040. CRU forecasts a 2.8%pa
growth in SOP.
2The Base Case mine plan comprises Ore Reserves (83%) and Indicated Mineral Resources (11%), it is partly based on Inferred Mineral
Resources (6%), per Figure 68. No Exploration Target brine has been included in the assumed life of mine or economic evaluation of the project.
3The Bank Finance Case mine plan comprises 86% Ore Reserves and 14% Indicated Mineral Resources, per Figure 67.
4NPV as at construction start, Q3 CY2018; a 2% inflation factor used; WACC calculation = 8% Discount Rate.
5See Note 4.
6Life of Mine OPEX Cash Cost FOB includes all mining, processing, site administration, product haulage to port and ports costs, but excludes
head office corporate costs, sustaining costs, royalties and taxes.
7 Assumes BOOT Power Station for first five years (See Note *2, Table 32).
8 Assumes BOOT Power Station for first five years and gas pipeline installed from Year 6 onwards (See Notes *1 and *2, Table 32).
9 A WA Royalty Rate = A$0.73/t SOP; Native Title Royalty Rate = 0.75% of Mine Gate; Founders’ Royalty = 1.9% gross revenue.
10 Calculated from first production date. For the phased expansion, the payback periods shown are inclusive of ramp up to full production.
11 See Note 10.
NPV ranges and sensitivities determined for key assumptions and inputs including, SOP price,
production rate, capital cost, operating cost, foreign exchange, discount rate, recovery rates and
construction delays.
Key sensitivities for the base case operation are illustrated in Figure 80. It is only under a low price,
combined with high exchange rate scenario that BSOPP could generate a negative NPV. On the
contrary, weaker AUD/USD exchange rate and SOP prices higher than the base case CRU prices,
would provide additional valuation upside to BSOPP.

Beyondie Sulphate of Potash Project JORC (2012) and NI 43-101 Technical Report - 2018
Report2018_Final_20180917 132
Figure 80: NPV Sensitivity Analysis (US$/t) [20]
22 Adjacent Properties
The BSOPP tenements were chosen because of the outlines of geological formations and the brine
hosting sediments. Only two properties adjoin the area of the BSOPP. The tenement E69/3202
belongs to Kronos Gold LLC (fresh water feed points to Lake Yanneri) and E69/3247 is owned by
AIC Minerals (fresh water feed to Beyondie Lake / 10 Mile Lake and approximately half of 10 Mile
Lake). Neither companies are currently exploring for potash.
23 Other Relevant Data and Information
No other pertinent data or information.
24 Risks
As with all brine deposits, there is a risk that the brine grade is less than expected, highly variable or
is unable to be abstracted from subsurface aquifers at the required rates. Additionally, there are
many non-process related risks, these may be due to any of the following:
• Variability in deposit could influence brine recovery;
• Brine volume and extraction assessment is inaccurate;
• Inability to abstract brine volumes due to low permeability of the aquifer material;
• Purification facility design, operation, recovery and product specification;
• Project delays and cost overruns;
• Evaporation pond design;
• Commodity price and currency volatility;
- AU$100.0m - AU$75.0m - AU$50.0m - AU$25.0m + AU$0.0m + AU$25.0m + AU$50.0m + AU$75.0m + AU$100.0m
-/+ 10% SOP Price
-/+ 10% Production
-/+ 10% Capex
-/+ 10% Opex
-/+ 10% FX
-/+ 2% Discount Rate
1 year delay (no revenue)
Change in Project NPV (AU$M)

Beyondie Sulphate of Potash Project JORC (2012) and NI 43-101 Technical Report - 2018
Report2018_Final_20180917 133
• Dependence on key personnel;
• New operational commodity and lack of experience;
• Inclement weather and natural disasters;
• Statutory approvals may be delayed or may not be attainable at all;
• Title Risk – involuntary relinquishment of tenements;
• Environmental risk due to accidents and unforeseen circumstances;
• Inadequate insurances or unavailable cover;
• Contractual disputes;
• Third party risk i.e. financial failure, default or contractual non-compliance of suppliers,
contractors, clients etc;
• Competition from potential SOP producers;
• Aquifer lithology;
• Capital and operating costs; and
• Changes in regulations and government royalties.
25 Conclusions
Based on current CAPEX and OPEX estimates, the BFS has demonstrated that the BSOPP is
economically and technically robust and has the potential to generate substantial value for
shareholders.
There are upside and downside risks to returns relating to exchange rates, product price, CAPEX,
OPEX and production rates.
Following an assessment of various risks versus valuation metrics, it is recommended that the base
case for the BFS is a phased approach, sized at 82 ktpa initially and ramping up to 164 ktpa.
This approach benefits from the practical benefits of starting with a smaller operation, reduced
upfront CAPEX and ability to de-risk the project from a financier’s perspective for future expansions.

Beyondie Sulphate of Potash Project JORC (2012) and NI 43-101 Technical Report - 2018
Report2018_Final_20180917 134
26 Recommendations
The recommended stages remaining to complete the BSOPP are as follows:
1. Front End Engineering Design (FEED) and final contract negotiations:
• FEED is being completed by KLL’s engineering consultants including K-UTEC, DRA Global
& ZEB Engineering (water pipelines); and
• Finalising major operating and capital cost contracts, as well as binding offtake agreements.
2. Early Works:
• Construction, operation and maintenance of: site access road upgrade; accommodation
camp, including wastewater treatment plant;
• Administration building installation;
• Drilling of all brine and fresh water production bores; and
3. Debt and Equity Funding and Final Investment Decision:
• Commencement and finalisation of equity and debt funding arrangements. This is generally a
4-6 month process with discussions well advanced as at the completion of the BFS.
4. Phase 1 Demonstration Scale Project Development – 82 ktpa SOP Production:
• Installation of ~445 ha evaporation and crystalliser ponds at the Beyondie-10 Mile area and
Lake Sunshine area;
• Installation of 40 production bores and 9 trenches totalling 58 km at 10 Mile and Lake
Sunshines;
• Installation of 82 ktpa SOP purification facility;
• 78 km of access road widening, realignment and construction;
• Installation of 60 person accommodation, buildings, services and utilities as required;
• Installation of communications tower for microwave internet and two way radio;
• Construction of power station;
• Installation of freshwater borefields at 10 Mile South;

Beyondie Sulphate of Potash Project JORC (2012) and NI 43-101 Technical Report - 2018
Report2018_Final_20180917 135
• Use of the Main Roads WA network from the Kumarina Road house located on the Great
Northern Highway (GNH) to the various WA depots and Fremantle, Kwinana and Geraldton
Ports for product delivery;
• Backloaded haulage of product to Perth/Fremantle and Geraldton;
• Use of Fremantle, Kwinana and Geraldton Port Facilities to access export markets to Asia
and the Eastern States of Australia; and
• Installation of a 78 km Natural Gas pipeline to the purification facility at the 10 Mile area.
(Phase 1 or Phase 2 TBC).
5. Full Scale Project Development – 164 ktpa SOP Production:
• Installation of additional evaporation and crystalliser ponds at the Beyondie – 10 Mile and
Lake Sunshines areas;
• Expansion and duplication or purification plant;
• Installation of additional production bores and trenches at western and eastern lakes;
• Expansion of site buildings, services and utilities as required;
• Expansion of port export facilities, including bulk export facilities at Geraldton Port;
• Installation of freshwater borefields at Kumarina and Beyondie;
• Installation of a 78 km Natural Gas pipeline to the purification facility at the 10 Mile area.
(Phase 1 or Phase 2 TBC).
6. Project Expansion and Enhancement – up to 250 ktpa SOP Production
(subject to future investment decisions):
• Installation of additional evaporation and crystalliser ponds at western and eastern lakes;
• Expansion and duplication or purification plant;
• Construction of road and installation of Potassium Brine pipeline from the western and
eastern lakes to the 10 Mile ponds area;
• Installation of additional production bores and trenches at western and eastern lakes;
• Installation of road and Potassium Brine pipeline(s) to, and between western and eastern
lakes;
• Expansion of buildings, services and utilities as required; and
• Expansion of port export facilities as required.

Beyondie Sulphate of Potash Project JORC (2012) and NI 43-101 Technical Report - 2018
Report2018_Final_20180917 136
27 References
[1] JORC, 2012: Australasian Code for Reporting of Mineral Resources and Ore Reserves – The
JORC Code 2012 Edition.- The Joint Ore Reserves Committee of the Australasian Institute of
Mining and Metallurgy and the Australian Institute of Geoscientists and the Minerals Council of
Australia. 20 December 2012.
[2] CIM Best Practice Guidelines for Resource and Reserve Estimation for Lithium Brines, Prepared
by the Sub-Committee on Best Practice Guidelines for Resource and Reserve Estimation for
Lithium Brines.
[3] Kalium Lakes Pty Ltd, 2015: Beyondie Potash Project - Concept Study, unpublished April 2015.
[4] Bureau of Meteorology (BOM): Meteorological Data
[5] BULLEN, Geological Survey of Western Australia, 1995: Australia 1:250,000 Geological Series.
Sheet SG 51 – 1. Second Edition. 1995.
[6] Magee J.W., 2009: Palaeovalley groundwater resources in arid and semi-arid Australia – A
literature review, record 2009/03, Geoscience Australia, Canberra, 224p.
[7] Schicht, T., Penndorf, A., 2015: Report of the site visit to the Salt Lakes of the Beyondie Potash
Project and the visit to the company AQ2 from August 17 to August 21, 2015, unpublished, 31
August 2015.
[8] AQ2, 2016: Assessment of the hydrogeology of Beyondie Project Saline Lake System, Pre-
Feasibility Study Report, unpublished, February 2016.
[9] Kalium Lakes Potash Pty Ltd, 2017: Beyondie Potash Project – Pre-Feasibility Study, unpublished
March 2016.
[10] K-UTEC AG, 2016: Bankable Feasibility Study for the Beyondie Sulphate of Potash Project
project, Australia; Part Crystalisers, Processing. unpublished draft, September 2018.
[11] Schicht, T., Penndorf, A., 2017: Report of the site visit to the Salt Lakes of the Beyondie Potash
Project and the visit to the companies Advisian and Western Geophysics from June 06 to June
11, 2017, unpublished, 11. September 2017.
[12] Advisian, 2017: PFS and Resource Report for the Beyondie Sulphate of Potash Project:
September 2017.
[13] Wingate, M.T. D., Pirajno, F., Morris, P. A., 2004, Warakurna Large Igneous Province: A new
Mesoproterozoic Large Igneous Province in West-Central Australia, Geology: v. 32, no. 2. p.
105-108.

Beyondie Sulphate of Potash Project JORC (2012) and NI 43-101 Technical Report - 2018
Report2018_Final_20180917 137
[14] Barnett, B., Townley, L.R., Post, V., Evans, R.E., Hunt, R.J., Peeters, L., Richardson, S.,
Werner, A.D., Knapton, A., and Boronkay, A, 2012, Australian groundwater modelling guidelines.
Waterlines Report Series No 82, June 2012, National Water Commission, Australian
Government, 191pp.
[15] DHI-WASY GmbH, 2015, FEFLOW 7.0 User Guide, Berlin, Germany, 220pp.
[16] DRA Global: Beyondie Potash Project, Infrastructure Pre-Feasibility Study, Document DRA-
CP1237-PM-RP-001, Dated 23/08/2017.
[17] Advisian, 2018, Hydrogeology and Resource BFS for the Beyondie Sulphate of Potash Project,
September 2018.
[18] Watermark Numerical Computing 2010, PEST Model-Independent Parameter Estimation User
Manual: 5th Edition (with slight additions in 2010), 336pp.
[19] Schicht, T., Penndorf, A. 2018: Report of the site visit to the Salt Lakes and production sites of
the Beyondie Potash Project from January 29 to February 03, 2018, unpublished, 20/02/2018.
[20] Kalium Lakes Pty Ltd, 2018: Beyondie Sulphate of Potash Project – Bankable Feasibility Study,
unpublished September 2018.
[21] Advisian, 2018, Beyondie Sulphate of Potash Project – Surface Water Assessment, April 2018
[22] K-UTEC AG Salt Technologies, 2015: Company Presentation, unpublished, September 2015.
[23] Butts, D., 2016, Kalium Lakes Potash Data Reference Handbook, unpublished, May 2016.
[24] Kalium Lakes Limited, 2018. Pilot Pond Update and Harvest Trials, March 2018.
[25] K-UTEC AG Salt Technologies, 2018. Status Meeting. May 2018.
[26] Kalium Lakes Limited, 2018, unpublished charts, figures or pictures, 2018.
[27] CRU Consulting, 2018, SOP Market Study, unpublished September 2018.
[28] Advisian, 2018, Beyondie Sulphate of Potash Project – Infrastructure Surface Water
Assessment, September 2018

Beyondie Sulphate of Potash Project JORC (2012) and NI 43-101 Technical Report – 2018
Report2018_Final_20180917 138
APPENDIX 1: JORC CODE, 2012 EDITION – TABLE 1 REPORT TEMPLATE
Section 1 – Sampling Techniques and Data
Criteria JORC Code explanation Commentary
Sampling techniques • Nature and quality of sampling (eg cut channels, random chips, or specific specialised industry standard measurement tools appropriate to the minerals under investigation, such as downhole gamma sondes, or handheld XRF instruments, etc). These examples should not be taken as limiting the broad meaning of sampling.
• Include reference to measures taken to ensure sample representivity and the appropriate calibration of any measurement tools or systems used.
• Aspects of the determination of mineralisation that are Material to the Public Report.
• In cases where ‘industry standard’ work has been done this would be relatively simple (eg ‘reverse circulation drilling was used to obtain 1 m samples from which 3 kg was pulverised to produce a 30 g charge for fire assay’). In other cases more explanation may be required, such as where there is coarse gold that has inherent sampling problems. Unusual commodities or mineralisation types (eg submarine nodules) may warrant disclosure of detailed information.
• Brine samples were obtained during drilling from prolonged airlift yields and collected at the cyclone. These samples are interpreted to come from the zone above the drilling depth, although the possibility of downhole flow outside of the drill rods from shallower zones cannot be excluded. These mixed samples were only used for estimation of the inferred resource calculation.
• Brine samples during test production bore pumping were obtained from the end of the discharge line and represent an average composition of groundwater pumped from the screened section of the production bore.
• Brine samples from trench pumping were obtained from the end of the discharge line and are an average representation of the aquifer zone the trench intercepts.
• The sampling program involved the collection of brine samples and samples of the aquifer material during drilling to define the brine and geological variation.
• Lithological samples at 1 m intervals were obtained by a combination of methods including reverse circulation, aircore and auger.
• Brine was obtained during drilling from the cyclone of the drill rig during airlift yields. These samples are interpreted to come from the zone above the drilling depth, although the possibility of downhole flow outside of the drill rods from shallower zones cannot be excluded.
• Sonic drill core was retrieved to obtain representative samples of the sediments that host brine to evaluate the porosity and hydraulic conductivity of the sediments and calibrate the geophysical tools being used. Core was extruded from the sonic core barrel and sealed within plastic core bags and placed in metal core boxes for storage.
• All sonic holes were geophysically logged with the methods listed in this report.
Drilling techniques • Drill type (e.g. core, reverse circulation, open-hole hammer, rotary air blast, auger, Bangka, sonic, etc) and details (e.g. core diameter, triple or standard tube, depth of diamond tails, face-sampling bit or other type, whether core is oriented and if so, by what method, etc).
• Reverse circulation (140 mm diameter), aircore (90 mm and 85 mm diameter) and sonic (150 mm) drilling has been utilised for all exploration and monitoring bore holes drilled during this report.
• HQ diamond tails were used on a number of deep reverse circulation holes to penetrate bedrock stratigraphy.
• All shallow lake surface sediment holes were drilled with auger techniques.
• All production bores were drilled using conventional mud rotary, casing advancer or sonic techniques.
• All holes were drilled vertically.
Drill sample recovery • Method of recording and assessing core and chip sample recoveries and results assessed.
• Measures taken to maximise sample recovery and ensure representative nature of the samples.
• Whether a relationship exists between sample recovery and grade and whether sample bias may have occurred due to preferential loss/gain of fine/coarse material.
• Geological sample recovery was high, in all lithologies, except fractured bedrock which had lost circulation of drill cuttings in the fracture zone and only returned minor chip samples back to the surface.
• Brine recoveries were high for reverse circulation drilling in the productive aquifer zones (Surficial sediments, palaeochannel sand and bedrock). The low transmissivity clay yielded very low volumes, with more sporadic sampling resulting, generally occurring near the base of the formation.
• Brine recoveries during aircore drilling were minimal due to the nature of the drilling technique.
• Airlifts were generally of prolonged duration to obtain representative samples, however water flowing down from the surficial aquifer during deeper airlift yields cannot be ruled out.
• Sonic core was recovered in variable lengths between 1.5 m and 6 m core runs depending on the ground conditions. The length of the run was marked on each of the core boxes.
• Sonic core recovery was generally high with some expansion of the stiff lacustrine clays observed during the drilling process resulting in excess core.
Geologic Logging • Whether core and chip samples have been geologically and geotechnically logged to a level of detail to support appropriate Mineral Resource estimation, mining studies and metallurgical studies.
• Whether logging is qualitative or quantitative in nature. Core (or costean, channel, etc.) photography.
• The total length and percentage of the relevant intersections logged.
• All drill holes were geologically logged by a qualified geologist.
• All geological samples collected during all forms of drilling are qualitatively logged at 1 m intervals, to gain an understanding of the variability in aquifer materials hosting the brine.
• Geological logging and other hydrogeological parameter data is recorded within a database and summarised into stratigraphic intervals.
• Solid samples are collected, washed and stored in chip trays for future reference.
• Core was logged and core plugs selected for laboratory testing by a senior geologist.
• Downhole geophysical methods (Resistivity, spectral gamma and BMR) were used to assist with lithological logging.
• Geological logging and other hydrogeological parameter data is recorded within a database.

Beyondie Sulphate of Potash Project JORC (2012) and NI 43-101 Technical Report – 2018
Report2018_Final_20180917 139
Criteria JORC Code explanation Commentary
Subsampling techniques and sample preparation
• If core, whether cut or sawn and whether quarter, half or all core taken.
• If non-core, whether riffled, tube sampled, rotary split, etc and whether sampled wet or dry.
• For all sample types, the nature, quality and appropriateness of the sample preparation technique.
• Quality control procedures adopted for all sub-sampling stages to maximise representivity of samples.
• Measures taken to ensure that the sampling is representative of the in situ material collected, including for instance results for field duplicate/ second-half sampling.
• Whether sample sizes are appropriate to the grain size of the material being sampled.
• During drilling all brine was sampled directly from the cyclone during prolonged airlift yields. This provides the most representative sample recovered from the inside return, i.e. from the bit face.
• Aircore drilling with low pressure air aims to collect a brine sample that is representative of the interval immediately above the bit face. However, this method does not exclude the potential for downhole mixing of brine. The fact that the low transmissivity clays were slow to yield brine, while underlying permeable intervals did yield brine with ease provides confidence that representative samples with depth have been obtained.
• Samples from the pumping tests were taken in intervals of between one per day or every two days.
• All samples collected are kept cool until delivery to the laboratory in Perth.
• Brine samples were collected in 500 ml bottles with little to no air.
• Field brine duplicates have been taken at approximately 1 in 11 intervals.
Quality of assay data and laboratory tests
• The nature, quality and appropriateness of the assaying and laboratory procedures used and whether the technique is considered partial or total.
• For geophysical tools, spectrometers, handheld XRF instruments, etc, the parameters used in determining the analysis including instrument make and model, reading times, calibrations factors applied and their derivation, etc.
• Nature of quality control procedures adopted (e.g. standards, blanks, duplicates, external laboratory checks) and whether acceptable levels of accuracy (i.e. lack of bias) and precision have been established.
• Elemental analysis of brine samples are performed by Perth laboratory, the Bureau-Veritas (BV) (formerly Amdel/Ultrace) mineral processing laboratories. BV is certified to the Quality Management Systems standard ISO 9001. Additionally, they have internal standards and procedures for the regular calibration of equipment and quality control methods.
• Laboratory equipment are calibrated with standard solutions.
• Analysis methods for the brine samples used are inductively coupled plasma optical emission spectrometry, Ion Selective Electrode, Inductive coupled plasma mass spectroscopy , volumetrically and colourimetrically.
• The assay method and results are suitable for the calculation of a resource estimate.
• Repeat assays and reference standards have been undertaken and indicate an average error of less than 5%.
• BMR tool calibration was completed by Qtec the developers of the BMR tool utilised (BMR-60). The diameter of investigations was 280 mm, the signal to noise ratio at this depth of investigation was deemed acceptable.
• BMR T2 calibration and cut-offs have been discussed in the report.
Verification of sampling and assaying
• The verification of significant intersections by either independent or alternative company personnel.
• The use of twinned holes.
• Documentation of primary data, data entry procedures, data verification, data storage (physical and electronic) protocols.
• Discuss any adjustment to assay data.
• Multiple samples have also been taken from nearby locations during sampling to verify assay results and sampling methods.
• Assays have been completed on samples taken up to two years apart indicating consistent grade.
• Assays have been completed on samples obtained from pumping of the aquifer units on a daily basis of up to 29 days at a single location to determine variability of grade during pumping.
• Field parameters of SG and total salinity have been taken.
• Data concerning sample location was obtained in the field, data entry then performed back in the Perth office to an electronic database and verified by Advisian.
• Assay data remains unadjusted.
• Sonic cores are twin holes of exploration air core holes.
Location of data points • Accuracy and quality of surveys used to locate drill holes (collar and down-hole surveys), trenches, mine workings and other locations used in Mineral Resource estimation.
• Specification of the grid system used.
• Quality and adequacy of topographic control.
• Hole location coordinates obtained by a qualified mines surveyor using a Trimble RTK GPS with an accuracy of +/- 25mm in X,Y and +/- 50mm in Z.
• Regional auger holes have been surveyed using a hand held GPS.
• The grid system used was MGA94, Zone 51.
Data spacing and distribution
• Data spacing for reporting of Exploration Results.
• Whether the data spacing and distribution is sufficient to establish the degree of geological and grade continuity appropriate for the Mineral Resource and Ore Reserve estimation procedure(s) and classifications applied.
• Whether sample compositing has been applied.
• Drill spacing is discussed in the report.
• The drill holes are not on an exact grid due to the irregular spatial nature of the deep targets and access issues when traversing the lakes.
Orientation of data in relation to geological structure
• Whether the orientation of sampling achieves unbiased sampling of possible structures and the extent to which this is known, considering the deposit type.
• If the relationship between the drilling orientation and the orientation of key mineralised structures is considered to have introduced a sampling bias, this should be assessed and reported if material.
• Not applicable, considering the deposit type.
• All drill holes are vertical given the estimated flat lying structure of a salt lake.
Sample security • The measures taken to ensure sample security. • Samples are labelled and transported by KLL personnel to Perth. They are then hand delivered to BV laboratories by KLL personnel.
Audits or reviews The results of any audits or reviews of sampling techniques and data. • Advisian has conducted a review of works undertaken previously by AQ2 and K-UTEC.
• A data review is summarised in the Mineralisation and Resource estimate section of this report.
• No audits were undertaken.

Beyondie Sulphate of Potash Project JORC (2012) and NI 43-101 Technical Report – 2018
Report2018_Final_20180917 140
Section 2 – Reporting of Exploration Results
Criteria JORC Code explanation Commentary
Mineral tenement and land tenure status
• Type, reference name/number, location and ownership including agreements or material issues with third parties such as joint ventures, partnerships, overriding royalties, native title interests, historical sites, wilderness or national park and environmental settings.
• The security of the tenure held at the time of reporting along with any known impediments to obtaining a licence to operate in the area.
• The BSOPP is 100% owned by Kalium Lakes Limited (KLL or Kalium Lakes) with project tenure held under granted exploration licences: E69/3306, E69/3309, E69/3339, E69/3340, E69/3341, E69/3342, E69/3343, E69/3344, E69/3345, E69/3346, E69/3347, E69/3348, E69/3349, E69/3351, E69/3352.
• KLL also has granted Mining Licences: M69/145 and M69/146.
• KLL also has granted Miscellaneous Licences: L52/162, L52/186; L52/187, L52/187, L52/193, L69/28, L69/29, L69/30, L69/31, L69/32, L69/34, L69/35, L69/36.
• KLL has a land access and mineral exploration agreement, and a Mining Land Access Agreement with the Mungarlu Ngurrarankatja Rirraunkaja (MNR) Aboriginal Corporation over tenures E69/3339, E69/3340, E69/3342, E69/3343, E69/3344, E69/3345, E69/3348, E69/3349 and E69/3351.
• KLL has an exploration and prospecting deed of agreement, and a Mining Land Access Agreement with the Gingirana Native Title Claim Group over tenures E69/3306, E69/3309, E69/3341, E69/3346, E69/3347, E69/3348, E69/3351 and E69/3352.
• MNR and Gingirana have provided letters of Consent to the grant of Mining Leases and Miscellaneous Licences.
Exploration done by other parties
• Acknowledgment and appraisal of exploration by other parties. • There has been no previous exploration for SOP at the BSOPP by third parties.
Geology • Deposit type, geological setting and style of mineralisation. • The deposit is a brine containing potassium and sulphate ions that can form a potassium sulphate salt. The brine is contained within saturated sediments below the lake surface and in sediments adjacent to the lake. The lakes sit within a broader palaeovalley system that extends over hundreds of kilometres, this system has been eroded into the North-West Officer Basin sediments.
Drillhole Information A summary of all information material to the understanding of the exploration results including a tabulation of the following information for all Material drillholes:
• easting and northing of the drillhole collar
• elevation or RL (Reduced Level – elevation above sea level in metres) of the drillhole collar
• dip and azimuth of the hole
• downhole length and interception depth
• hole length.
If the exclusion of this information is justified on the basis that the information is not Material and this exclusion does not detract from the understanding of the report, the Competent Person should clearly explain why this is the case.
• Information has been included in drill collar tables and bore logs appended to this report or previously reported.
• All holes are vertical.
Data aggregation methods
• In reporting Exploration Results, weighting averaging techniques, maximum and/or minimum grade truncations (eg cutting of high grades) and cut-off grades are usually Material and should be stated.
• Where aggregate intercepts incorporate short lengths of high grade results and longer lengths of low grade results, the procedure used for such aggregation should be stated and some typical examples of such aggregations should be shown in detail.
• The assumptions used for any reporting of metal equivalent values should be clearly stated.
• No grade cut-offs have been used.
• Data aggregation comprised calculation of volume weighted average potassium, sulphate and magnesium concentration of all Specific Yield and Total Porosity within a Resource area for a given geological unit (i.e. All palaeochannel sand and silcrete zones per area were aggregated and summarised as a volume weighted average).
Relationship between mineralisation widths and intercept lengths
• These relationships are particularly important in the reporting of Exploration Results.
• If the geometry of the mineralisation with respect to the drillhole angle is known, its nature should be reported.
• If it is not known and only the down hole lengths are reported, there should be a clear statement to this effect (e.g. ‘downhole length, true width not known’).
• Not applicable.
Diagrams • Appropriate maps and sections (with scales) and tabulations of intercepts should be included for any significant discovery being reported These should include, but not be limited to a plan view of drill hole collar locations and appropriate sectional views.
• Refer to figures/tables in this announcement.
Balanced reporting • Where comprehensive reporting of all Exploration Results is not practicable, representative reporting of both low and high grades and/or widths should be practiced to avoid misleading reporting of Exploration Results.
• All pertinent results have been reported.

Beyondie Sulphate of Potash Project JORC (2012) and NI 43-101 Technical Report – 2018
Report2018_Final_20180917 141
Criteria JORC Code explanation Commentary
Other substantive exploration data
• Other exploration data, if meaningful and material, should be reported including (but not limited to): geological observations; geophysical survey results; geochemical survey results; bulk samples – size and method of treatment; metallurgical test results; bulk density, groundwater, geotechnical and rock characteristics; potential deleterious or contaminating substances.
• Approximately 1,105 km of gravity and passive seismic geophysical surveys have been completed. The tests were performed to define the deepest parts of the palaeochannel, with traverses undertaken across the channel, extending from 10 Mile Lake to T-Junction Lake.
• Additionally, NanoTEM geophysical surveys have been completed in 2017 to distinguish between highly conductive and less conductive areas to support the passive seismic and gravity interpretations.
• XRF and XRD analysis of the lake sediments has provided a breakdown of the minerals and their percent components of the lake sediments.
• Metallurgical and mineral processing test work has included bench scale solar evaporation tests, milling, flotation and conversion. The results of the test work have enabled preliminary process plant design for the Beyondie brine.
• Other companies have regionally performed exploration for similar brine deposits.
Further work • The nature and scale of planned further work (eg tests for lateral extensions or depth extensions or large-scale step-out drilling).
• Diagrams clearly highlighting the areas of possible extensions, including the main geological interpretations and future drilling areas, provided this information is not commercially sensitive.
• More extensive drilling may confirm the occurrence of basal sands and sandstones throughout the whole palaeodrainage system to the East of the Stage 1 area.
Section 3 Estimation and Reporting of Mineral Resources
(Criteria listed in section 1, and where relevant in section 2, also apply to this section.)
Criteria JORC Code explanation Commentary
Database
integrity
• Measures taken to ensure that data has not been corrupted by, for example, transcription or keying errors, between its initial collection and its use for Mineral Resource estimation purposes.
• Data validation procedures used.
• Cross-check of laboratory assay reports and database.
• Review of sample histograms used in Resource models.
• QA/QC analysis and protocols as described in Section 10.
Site visits • Comment on any site visits undertaken by the Competent Person and the outcome of those visits.
• If no site visits have been undertaken indicate why this is the case.
• Multiple site visits have been undertaken throughout the field program that has verified the data obtained.
• All other site visits are discussed in Section 8.
Geological
interpretation
• Confidence in (or conversely, the uncertainty of ) the geological interpretation of the mineral deposit.
• Nature of the data used and of any assumptions made.
• The effect, if any, of alternative interpretations on Mineral Resource estimation.
• The use of geology in guiding and controlling Mineral Resource estimation.
• The factors affecting continuity both of grade and geology.
• The resource is contained within Cenozoic Palaeovalley stratigraphy and the underlying fractured and weathered bedrock.
• The geological model for the indicated and measured resources is well constrained. Drill hole coverage is relatively consistent for the scale of the project, and the deposit is not structurally complex; it is alluvial fill in a palaeovalley depo-centre, within a shallow dipping large sedimentary basin.
• The geological model for the fractured bedrock is less certain, the continuity and structural controls on rock fracturing are not well understood, but can be mapped in geophysical responses and is considered to be associated with the unconformity between formations and structural orientation.
• The geological interpretation informs the volume of the resource.
• The nature of aquifer properties in different geologies does affect grade, where transmissivity appears to be a minor diluting factor in the highest areas of the brine grade. In addition the bedrock appears to be elevated in potassium which likely to be a source of the resource.
• The paleo-topography is key to the determining the aquifers with the highest transmissivity and predicting their extent within the vicinity of the surficial lakes where brine grade, specific yield and transmissivity are highest.
Dimensions • The extent and variability of the Mineral Resource expressed as length (along strike or otherwise), plan width, and depth below surface to the upper and lower limits of the Mineral Resource.
• The length of the mineral resource is defined by the company’s tenement boundaries which have been fit to the margins of the salt lake/palaeodrainage system. Where the tenement boundary is wider than the palaeochannel system, the palaeochannel boundaries have been defined by geophysical surveys (gravity, passive seismic and TEM).
• The thickness of the hosting aquifer holding the brine mineral resources has been based on the groundwater elevation (measured as depth below surface) and a sediment thickness above the impermeable bedrock.
• The mineral resource extends laterally outside of KLL tenement boundaries in some cases, notably at 10 Mile Lake.
• The volume of brine that can be abstracted has been based on a combination of aquifer test pumping and core calibrated geophysical techniques using Borehole Magnetic Resonance (BMR).

Beyondie Sulphate of Potash Project JORC (2012) and NI 43-101 Technical Report – 2018
Report2018_Final_20180917 142
Criteria JORC Code explanation Commentary
Estimation
and modelling
techniques
• The nature and appropriateness of the estimation technique(s) applied and key assumptions, including treatment of extreme grade values, domaining, interpolation parameters and maximum distance of extrapolation from data points. If a computer assisted estimation method was chosen include a description of computer software and parameters used.
• The availability of check estimates, previous estimates and/or mine production records and whether the Mineral Resource estimate takes appropriate account of such data.
• The assumptions made regarding recovery of by-products.
• Estimation of deleterious elements or other non-grade variables of economic significance (eg sulphur for acid mine drainage characterisation).
• In the case of block model interpolation, the block size in relation to the average sample spacing and the search employed.
• Any assumptions behind modelling of selective mining units.
• Any assumptions about correlation between variables.
• Description of how the geological interpretation was used to control the resource estimates.
• Discussion of basis for using or not using grade cutting or capping.
• The process of validation, the checking process used, the comparison of model data to drill hole data, and use of reconciliation data if available.
• Modelling procedures and parameters are discussed in Section 13. Additional details are presented below were relevant.
• Potassium, sulphate and magnesium concentration point data were separated by project area (10 Mile Lake and Lake Sunshine) and imported into the leapfrog modelling domain.
• Sand and silcrete zones have been defined by the presence of either one of these facies in the lithological log, these maybe of weathered bedrock origin or transported origins.
• Resource zones were derived in GIS software using drill hole spacing and areas of measured drawdown from extended duration aquifer testing.
• The block model cell sizes took into account the density of the sample spacing within the Measured Resource zones so that on average of at least one sample was attributed to each block in the x and y directions. The block spacing of the z direction considered the vertical variability of the brine within lithologies, an increase in grade with depth is observed in each lithology therefore high resolution z component (2.5 to 5 m) was selected to allow for pinching geology, so this trend in grade variability can be accurately represented. Automatic sub-blocking was used where complex geological contacts are present or greater resolution of sampling was available.
• Volumetric weighted average of SOP grade per Resource Zone was calculated where multiple zones are determined (i.e. upper sand and basal sand zones have been merged into a sand and silcrete group by volumetric weighted average to determine SOP grade).
• Selective mining units have not been considered.
• There are no assumptions about correlation between variables.
• No cut-off grade has been used.
Moisture • Whether the tonnages are estimated on a dry basis or with natural moisture, and the method of determination of the moisture content.
• Tonnages of potassium have been estimated on a dry, weight volume basis (%w/v). For example, 10 kg potassium per cubic metre of brine.
Cut-off
parameters
• The basis of the adopted cut-off grade(s) or quality parameters applied. • No cut-off grade has been used in this Resource update so that a longer life of mine can be sustained during the in-progress Reserve update.
Mining factors
or
assumptions
• Assumptions made regarding possible mining methods, minimum mining dimensions and internal (or, if applicable, external) mining dilution. It is always necessary as part of the process of determining reasonable prospects for eventual economic extraction to consider potential mining methods, but the assumptions made regarding mining methods and parameters when estimating Mineral Resources may not always be rigorous. Where this is the case, this should be reported with an explanation of the basis of the mining assumptions made.
• The mining method will be recovery of brine from the underground salt lake by submersible bore pumps targeting the deeper aquifer and shallow trenches targeting the surficial aquifer.
• Though specific yield and total porosity provide a measure of the volume of brine present in an aquifer system, hydraulic conductivity and transmissivity controls are the main factor in defining Mining factors and are discussed in the Reserve.
• It is not possible to extract all the contained brine with these methods, due to the natural physical dynamics of abstraction from an aquifer.
• The Reserve is required to quantify the economically extractable resources.
Metallurgical
factors or
assumptions
• The basis for assumptions or predictions regarding metallurgical amenability. It is always necessary as part of the process of determining reasonable prospects for eventual economic extraction to consider potential metallurgical methods, but the assumptions regarding metallurgical treatment processes and parameters made when reporting Mineral Resources may not always be rigorous. Where this is the case, this should be reported with an explanation of the basis of the metallurgical assumptions made.
• Chemical assays of brine waters suggest a similar chemical composition to other exploration SOP projects in Western Australia. Feasibility studies abroad have demonstrated that SOP recovery is possible with conventional mineral processing techniques.
• Metallurgical test work on brine water has been carried out in both small scale lab benchtop trials and larger scale evaporation pilot ponds with confirmed results to the efficacy of standard metallurgical recovery methods.
Environmental
factors or
assumptions
• Assumptions made regarding possible waste and process residue disposal options. It is always necessary as part of the process of determining reasonable prospects for eventual economic extraction to consider the potential environmental impacts of the mining and processing operation. While at this stage the determination of potential environmental impacts, particularly for a greenfields project, may not always be well advanced, the status of early consideration of these potential environmental impacts should be reported. Where these aspects have not been considered this should be reported with an explanation of the environmental assumptions made.
• The project is expected to have a limited, localized environmental impact, with minor impacts on surface disturbance associated with excavation, adjacent ”fresher” aquifer systems, stockpiling of salt by-products, stygofauna and potentially groundwater dependent vegetation.
• The project is located in a very remote area and does not expect to contain significant quantities of waste tailings.
• Acid mine drainage is not expected to be an issue.
Bulk density • Whether assumed or determined. If assumed, the basis for the assumptions. If determined, the method used, whether wet or dry, the frequency of the measurements, the nature, size and representativeness of the samples.
• The bulk density for bulk material must have been measured by methods that adequately account for void spaces (vugs, porosity, etc), moisture and differences between rock and alteration zones within the deposit.
• Discuss assumptions for bulk density estimates used in the evaluation process of the different materials.
• Tonnages of potassium have been estimated on a dry, weight volume basis(%w/v). For example, 10 kg potassium per cubic metre of brine.
• As the resource is a brine, bulk density is not applicable.
• The resource has been calculated from Sy (drainable porosity) determined using a combination of aquifer testing and laboratory calibrated geophysical methods.
Classification • The basis for the classification of the Mineral Resources into varying confidence categories.
• Whether appropriate account has been taken of all relevant factors (i.e. relative confidence in tonnage/grade estimations, reliability of input data, confidence in continuity of geology and metal values, quality, quantity and distribution of the data).
• Whether the result appropriately reflects the Competent Person’s view of the deposit.
• At this stage of the project an exploration target, inferred, indicated and measured resource are defined. The CIM Best Practice Guidelines for Resource and Reserve Estimation for Lithium Brines and JORC code were used to determine these confidence categories.

Beyondie Sulphate of Potash Project JORC (2012) and NI 43-101 Technical Report – 2018
Report2018_Final_20180917 143
Criteria JORC Code explanation Commentary
Audits or
reviews
• The results of any audits or reviews of Mineral Resource estimates. • None
Discussion of
relative
accuracy/
confidence
• Where appropriate a statement of the relative accuracy and confidence level in the Mineral Resource estimate using an approach or procedure deemed appropriate by the Competent Person. For example, the application of statistical or geostatistical procedures to quantify the relative accuracy of the resource within stated confidence limits, or, if such an approach is not deemed appropriate, a qualitative discussion of the factors that could affect the relative accuracy and confidence of the estimate.
• The statement should specify whether it relates to global or local estimates, and, if local, state the relevant tonnages, which should be relevant to technical and economic evaluation. Documentation should include assumptions made and the procedures used.
• These statements of relative accuracy and confidence of the estimate should be compared with production data, where available.
• The mineral resource contains aqueous potassium, sulphate and other ions, existing as a brine in a sub-surface salt lake. The current JORC code (2012) deals predominantly with solid minerals, and does not deal with liquid solutions as a resource. The relative accuracy of the stated resource considers the geological uncertainties of dealing with a brine. See also: CIM Best Practice Guidelines for Resource and Reserve Estimation for Lithium Brines, Prepared by the Sub-Committee on Best Practice Guidelines for Resource and Reserve Estimation for Lithium Brines.
• Kalium Lakes is part of the Association of Mining and Exploration Companies (AMEC) Potash Working Group which has developed guidelines to define a brine Mineral Resource and Ore Reserve, in order to increase the certainty, clarity and transparency in reporting of these resources.
• Specific Yield (Sy) estimates to determine drainable brine volume in this Resource estimate have used industry first techniques. However, these techniques are industry best practice in the petroleum industry for estimating Reservoir volumes of all components of a petroleum reservoir therefore are considered to be “industry leading”. Traditional core derived analysis is point based, whilst a continuous log provides a far better means to deriving average properties for individual lithologies.
• BMR technology has only recently been made financially economical in the brine resource industry by the use slim-line tools with low sign to noise ratios and appropriate depths of investigation.
Section 4 Estimation and Reporting of Ore Reserves
(Criteria listed in section 1, and where relevant in section 2 and 3, also apply to this section.)
Criteria Explanation Comments
Mineral Resource
estimate for
conversion to Ore
Reserves
• Description of the Mineral Resource estimate used as a basis for the conversion to an Ore Reserve.
• Clear statement as to whether the Mineral Resources are reported additional to, or inclusive of, the Ore Reserves.
• See Resources table above (JORC Table 1, Section 3 – Estimation and Reporting of Mineral Reserve), the modelling process and Mineral Reserve estimate are also detailed above.
• Indicated and Measured Resources are reported inclusive of Ore Reserves.
• No inferred resources are included in the Reserve estimate.
Site visits • Comment on any site visits undertaken by the Competent Person and the outcome of those visits.
• If no site visits have been undertaken indicate why this is the case.
• Three site visits by the Competent Persons, the first during August 2015, the second during June 2017 and the third during January/February 2018 . Details of site visit outcomes are described in the relevant site visit reports [7], [11], [19].
Study status • The type and level of study undertaken to enable Mineral Resources to be converted to Ore Reserves.
• The Code requires that a study to at least Pre-Feasibility Study level has been undertaken to convert Mineral Resources to Ore Reserves. Such studies will have been carried out and will have determined a mine plan that is technically achievable and economically viable, and that material Modifying Factors have been considered.
• The Ore Reserve Estmate has been completed in conjunction with a Bankable Feasibility Study with a +/-15% level of accuracy.
• A mine plan has been developed utilising all reserves and resources for the mine production scenarios to support the BFS.
Cut-off
parameters
• The basis of the cut-off grade(s) or quality parameters applied. • A cut off grade of 2,500 mg/L has been applied to the Reserve.
• The solute transport model has been used to predict the grade over the life of mine from each abstraction point, where grades at the abstraction point diminishes below the cut-off grade the production is omitted from the Reserve.
Mining factors or
assumptions
• The method and assumptions used as reported in the Pre-Feasibility or Feasibility Study to convert the Mineral Resource to an Ore Reserve (i.e. either by application of appropriate factors by optimisation or by preliminary or detailed design).
• The choice, nature and appropriateness of the selected mining method(s) and other mining
parameters including associated design issues such as pre-strip, access, etc.
• The assumptions made regarding geotechnical parameters (eg pit slopes, stope sizes, etc), grade control and pre-production drilling.
• The major assumptions made and Mineral Resource model used for pit and stope optimisation (if appropriate).
• The mining dilution factors used.
• The mining recovery factors used.
• Any minimum mining widths used.
• The volume of convertible resources has been determined by detailed numerical groundwater flow and solute transport modelling. Modelling has been completed to the Australian Groundwater Modelling Guidelines [14] using the FeFlow modelling package [15].
• The construction of the numerical groundwater model is based on the geological model derived from drill data. Drill spacing is such to have high confidence in geology and brine distribution in the resource areas.
• Calibration of the groundwater model to steady state and transient conditions (test pumping data from trenches and bores and trial pond pumping) using an iterative process of manual and automated calibration to reduce statistical residual error between observed data and simulated data.
• Sensitivity analysis to “compare model outputs with different sets of reasonable parameter estimates, both during the period of calibration (the past) and during predictions (in the future)” [14].
• Predictive modelling of the resource recovery by adding production bores within the deep aquifer and extending trenches over the lake surface and simulating pumping rates over the life of mine (30 years).
• Concentration of potassium has been directly input to the numerical model from the block model and simulated using conservative transport parameters.

Beyondie Sulphate of Potash Project JORC (2012) and NI 43-101 Technical Report – 2018
Report2018_Final_20180917 144
Criteria Explanation Comments
• The manner in which Inferred Mineral Resources are utilised in mining studies and the sensitivity of the outcome to their inclusion.
• The infrastructure requirements of the selected mining methods.
• Abstraction is mapped using capture zone analysis, any abstraction originating from outside of the Resource zone is factored out of the Reserve calculation.
• Trial lake surface trenches and deep production bores have been tested in the field and proved successful in abstraction of brine. The construction methodology, design and cost determined from the field studies has been adopted for the feasibility study.
• Well efficiencies have been taken into account when simulating abstraction rates. An average well efficiency of 60% is derived for the abstraction assessment.
• Grade control in brine resources relates to the target grade of brine delivered to the concentor ponds. Flexibility in the infrastructure design is considered the grade control management measures.
• Inferred Resources are not included in the Reserve estimate. Inferred Resources make up the later part of the mine plan.
• Hydraulic models have been developed to ensure brine pumping can be undertaken with the selected pipes and pumps in the study.
• New abstraction bores, headworks, power supply, pumping, telemetry and monitoring have been incorporated in the design.
Metallurgical
factors or
assumptions
• The metallurgical process proposed and the appropriateness of that process to the style of mineralisation.
• Whether the metallurgical process is well-tested technology or novel in nature.
• The nature, amount and representativeness of metallurgical test work undertaken, the nature of the metallurgical domaining applied and the corresponding metallurgical recovery factors applied.
• Any assumptions or allowances made for deleterious elements.
• The existence of any bulk sample or pilot scale test work and the degree to which such samples are considered representative of the orebody as a whole.
• For minerals that are defined by a specification, has the ore reserve estimation been based on the appropriate mineralogy to meet the specifications?
• The metallurgical process is covered broadly through the following stages; Evaporation pond crystallization and harvest of KTMS; Pre-treatment of harvested KTMS; conversion of KTMS to Schoenite; Flotation; Cooling crystallization; conversion of Schoenite to SOP; Dewatering; Drying and Compaction. The process is considered appropriate given the high potassium brine based nature of the mineralisation.
• For 82 ktpa SOP, the project will require: 36 extraction bores, 58 km of trenches, 7.9 – 9.4 GL/a brine flow, 445 hectares of evaporation ponds. For 164 ktpa SOP, the project will require: 41 extraction bores, 58 km of trenches, 10.9 – 17.8 GL/a brine flow, 1,118 hectares of evaporation ponds. Both throughputs include: 8,766 evaporation pond operating hours per year, 94% evaporation pond recovery, 1 mm sealed HDPE lined ponds, 7,500 purification plant operating hours and 77% purification plant recovery.
• The metallurgical process proposed is similar to that used by major existing SOP producers in Utah(Compass Minerals), Luobupo (SDIC), Salar de Atacama(SQM).
• Ten discrete metallurgical test phases were undertaken, utilising a five different industry recognised consultants. Test phases varied from small bench scale evaporation tests, to 10 hectare site pilot pond works and pilot plant testing by K-UTEC.
• There are no elements in the BSOPP brine that are likely to be deleterious.
• Metallurgical test work has successfully produced SOP of sufficient product purity. Metallurgical test work included the complete process from treatment of feed brine to final production of SOP.
• Initially, a total volume of 2m3 of partially evaporated brine at a density of 1.28 g/cm3 was sent to K-UTEC’s facilities in Sondershausen, Germany for preliminary process test work, see Figure 34 Figure 35. This was followed up with several tonnes of crystallized KTMS produced at the BSOPP’s pilot pond for K-UTEC’s pilot plant and BFS optimisation works, see Figure 40. More than 10,000 tonnes of salts have been produced so far, including 3,160 tonnes of mixed potassium salts that can be processed to generate approximately 520 tonnes of SOP, see Figure 39. The brine used to produce these bulk samples is from the 10 Mile Lake area, and is a mixture of the surficial and palaeochannel aquifers.
• Hypersaline potash brine is not defined by any specifications.
Environmental • The status of studies of potential environmental impacts of the mining and processing operation. Details of waste rock characterisation and the consideration of potential sites, status of design options considered and, where applicable, the status of approvals for process residue storage and waste dumps should be reported.
• KLL has engaged with key stakeholders such as the Office of the Environmental Protection Authority (OEPA) Terrestrial Branch, DPaW regional experts and Traditional Owners. The issues raised that may represent project constraints and the management actions have been identified and potential management actions are being implemented.
• A biological study programme occurred during 2015-2018 and enabled project planning and impact assessment to commence. The study programme entailed a Level 2 survey for flora and vegetation, fauna and lake fringing vegetation. At this stage, subterranean fauna is not a significant impact on the basis of a maximum allowable drawdown of 50% of the freshwater aquifer plus and adaptive management plan to rotate the use of bores of the 4 fresh water areas.
• Early works approvals are in place from the Environmental Protection Authority of Western Australia (EPA) and Department of Mines, Industry Regulation and Safety (DMIRS), with formal approval for the full-scale project anticipated to be in place during Q4 2018. The bitterns comprising MgCl2 / MgSO4 are proposed to be recovered as Magnesium salts and may be sold if viable. If excess to market requirements they will be placed with the excess halite on 10 Mile Lake or used for dust suppression around the site.
Infrastructure • The existence of appropriate infrastructure: availability of land for plant development, power, water, transportation (particularly for bulk commodities), labour, accommodation; or the ease with which the infrastructure can be provided, or accessed.
• Infrastructure at the mine area, including workshops, warehousing and power generation, will be located within finite footprints and granted exploration tenements, adjacent to the processing plant, to enable control of access and easy operability and maintainability. Ancillary infrastructure is situated within the tenements at locations to provide suitable access and drainage, whilst preventing inundation during or following a storm event.
• The central site administration area is located where the access road enters the site from the west. This area comprises the main administration building, emergency services, laboratory, communications hub, general workshops, stores and fuel farm.
• Fuel for power generation will be supplied in LNG gas bullets for the initial development, or eventually via a 78 km gas spur to be built from the Goldfields Gas Pipeline (GGP) for production levels exceeding 82 ktpa. Access to the Goldfield Gas Pipeline located approximately 78 km to the west of the proposed mine site is achievable and KLL have commenced discussions with APA to confirm tie in and pipeline extension requirements and costs.
• The accommodation village site is located between the proposed process plant and the northern bank of 10 Mile lake, isolated from plant noise and lake surface water by a small elevated hill. The village includes accommodation, recreational facilities such as a sports court and gym, waste water treatment, potable water supply and a dedicated power generator. The village will be constructed as part of an Early Works package to provide accommodation for the construction workforce. The accommodation village will be designed to provide housing and messing for ~60 people at the project area.

Beyondie Sulphate of Potash Project JORC (2012) and NI 43-101 Technical Report – 2018
Report2018_Final_20180917 145
Criteria Explanation Comments
• Raw water will be pumped from water supply bores located within an area extending West and South of the process plant site. Approximately 1.5-2 GL/a of raw water will be required for the process plant and potable water for 164 ktpa SOP production. Each bore pump will be powered by its own diesel generator through a local control panel, with a wireless telemetry link to the central control system at the plant. Each system will be installed in a fenced compound with a self-bunded diesel storage tank sized to allow for sufficient buffer capacity. Above ground HDPE pipelines will transfer water to a central raw water tank located at the process plant. The raw water tank is sized to hold the required water reserve for fire-fighting purposes, available as a priority supply from a separate flange appropriately positioned on the tank and distributed via fire water pumps. A separate flange and raw water pump set will supply raw water to the workshops, process plant area, administration offices, and Emergency Services Area. A separate water storage tank / fire tank will be situated at the village. Fire and general-purpose water will be reticulated in a common system.
• Raw (bore) water will be treated to potable water standards at the village and workshop area, by packaged plants consisting of fine filtration followed by reverse osmosis, a chlorine dosing and UV treatment. The filtration will remove fine particles from the raw water, while the cal-hypo chlorine dosing system will disinfect the water to meet the requirements of the Australian Drinking Water Guidelines.
• Communications infrastructure will allow a single-channel CB radio envelope along the site access road, with mobile or portable radios operating over a dual-channel, digital mobile radio (DMR) system servicing the main plant and accommodation area and remote borefields. The DMR integrates with the site telemetry system for monitoring of bores. The radio system will also provide a high-speed IP data link to the Telstra 4G network service at Kumarina Roadhouse. A site-LAN will be installed, with access provided via the Wi-Fi network installed as part of the radio system.
• A contractor-operated laboratory building will be installed onsite along with the construction of administration buildings, maintenance workshops and warehouses.
Costs • The derivation of, or assumptions made, regarding projected capital costs in the study.
• The methodology used to estimate operating costs.
• Allowances made for the content of deleterious elements.
• The derivation of assumptions made of metal or commodity price(s), for the principal minerals and co-products.
• The source of exchange rates used in the study.
• Derivation of transportation charges.
• The basis for forecasting or source of treatment and refining charges, penalties for failure to meet specification, etc.
• The allowances made for royalties payable, both Government and private.
• The Capital cost estimate was based on the following fundamentals:
o Work Breakdown Structure.
o Material Take-Offs from designs for construction and fabrication.
o Mechanical equipment list, specifications & data sheets.
o Electrical equipment load list.
o Vehicle list.
o Proposals (materials & equipment supply, installation, design & construct, etc.).
o Proposals for construction road freight.
o Freight estimates based on supply weight / volume requirements per 23t payload trailer (2.4m x 14m).
o Direct labour hours and rates build up by first principles.
o Benchmarked allowances and factors (minimal).
o Preferred contracting strategies.
o Use of existing knowledge from previous experience information where no other source was available.
o Contingency based on capex input confidence and discreet risk modelling.
• The capital cost estimate was completed to an accuracy meeting the criteria of The Association for the Advancement of Cost Engineering (AACE) Class 3 estimate accuracy of ±15%.
• The BFS has developed an operating cost estimate (OPEX) for the BSOPP with an accuracy better than ±15%. The OPEX includes the operating expenditure required to crystallise, process and transport product to Fremantle and Geraldton Port, and various off-take locations, including shipping to the eastern states of Australia, China, Singapore, the USA and New Zealand. All costs are in 2018 Australian dollars.
• The operating cost has been developed around cost elements with the primary activities and items included. The following assumptions have been made associated with operating costs and the base case operating philosophy:
o Overall management will be undertaken by KLL.
o Owner operated operations for ex-works production.
o A Haulage contractor will be engaged to provide all transport of SOP product form the site to the distribution centres in Perth and
Geraldton.
o Contractor proposals have been received and form the basis of transportation charges, port and shipping charges.
o Accommodation villages will be Contractor operated.
o FIFO flights for all personnel will be arranged and managed by KLL.
o Flights have been based on commercial services between Perth and Newman.
o Diesel fuel will be purchased in bulk and distrsibuted by KLL.
o Gas will be supplied as Liquid Natural Gas (LNG) by a new lateral tie-in to the Goldfields Gas Pipeline (GGP) near Kumarina
roadhouse on the Great Northern Highway (GNH), or as Liquefied Natural Gas (LNG).
o Power will be provided via a 5 year Build Own Operate (BOO) contractor.
o Carbon tax has been excluded.
o Allowances for maintenance down time have been considered by operating unit.

Beyondie Sulphate of Potash Project JORC (2012) and NI 43-101 Technical Report – 2018
Report2018_Final_20180917 146
Criteria Explanation Comments
o The estimate base date is Q3, 2018.
o Escalation of the estimate past the base date has been excluded.
o All costs are in Australian dollars (AUD).
o An exchange rate of AU$1.00 = US$0.75 has been used during operations where necessary based on Bloomberg Rates.
o GST has been excluded.
o Contingency has been applied to the Ex-Works and FOB estimates.
o All tonnages are on a dry basis unless otherwise indicated. o WA Royalty Rate – non-beneficiated - A$0.73/t SOP o Native Title Royalty – unable to provide o Founders’ Royalty - 1.9% gross revenue
Revenue factors • The derivation of, or assumptions made regarding revenue factors including head grade, metal or commodity price(s) exchange rates, transportation and treatment charges, penalties, net smelter returns, etc.
• The derivation of assumptions made of metal or commodity price(s), for the principal metals, minerals and co-products.
• Product specifications identified and replicated with metallurgical test work.
• Market reports from CRU, Profercy, Greenmarkets, Fertecon and Integer have been utilised to derive the assumption for the SOP price.
• A detailed SOP market study was commissioned by KLL and provided by CRU in September 2018, this has been used as the basis for
the commodity price, forecasted US$606/t average LOM SOP sales @ $A/$US exchange rate of 0.73.
• CRU estimates that CFR Australian prices in KLL’s first year of full production (2022) will be US$530/t with prices rising to US$961-
997/t in 2040. CRU forecasts a 2.8%pa growth in SOP.
Market
assessment
• The demand, supply and stock situation for the particular commodity, consumption trends and factors likely to affect supply and demand into the future.
• A customer and competitor analysis along with the identification of likely market windows for the product.
• Price and volume forecasts and the basis for these forecasts.
• For industrial minerals the customer specification, testing and acceptance requirements prior to a supply contract.
• Demand, supply and stock situation determined for SOP by studying recent market reports from CRU, Fertecon, Green Markets, Profercy and Integer. Reports covered consumptions trends and discussions with factors that can likely affect supply and demand into the future. The reports also covered price and volume forecasts based on market trends.
• The proposed SOP product meets or exceeds current market accepted specifications.
• Offtake Terms Sheet executed with German fertiliser producer and distributor K+S for 100% of Stage 1 production. The Offtake
arrangement is subject to the execution of a formal binding offtake agreement and satisfaction of certain conditions precedent, including
completion of due diligence by K+S.
• Kalium Lakes has signed non binding Letters of Intent with other offtake partners.
• A detailed customer and competitor analysis has been included in the CRU marketing study.
Economic • The inputs to the economic analysis to produce the net present value (NPV) in the study, the source and confidence of these economic inputs including estimated inflation, discount rate, etc.
• NPV ranges and sensitivity to variations in the significant assumptions and inputs.
• Discounted cash flow analysis (DCF) was used to calculate key project valuation indicators for the project, in particular, the Net Present
Value (NPV) and Internal Rate of Return (“IRR”). NPV, IRR and payback periods are measures of the return that are generated based
on the applied assumptions. An 8% discount rate (post–tax, nominal) was used for NPV calculations. A 2% inflation factor is used. The
DCF were modelled on a quarterly basis in nominal terms, referenced to CAPEX and OPEX developed in Australian dollars (A$). The
project was analysed on an unleveraged (100% equity) basis.
• The macro assumptions in the financial model are as follows:
o Discount Rate (post-tax nominal) – 8% o Corporate Tax Rate - Rate based on ATO guidance – 30% o Depreciation – Straight line o WA Royalty Rate – non-beneficiated - A$0.73/t SOP o Native Title Royalty – unable to provide o Founders’ Royalty - 1.9% gross revenue o Mine Life - Variable, subject to production rate o LOM Exchange Rate A$:US$ - $0.73
o A detailed SOP market study was commissioned by KLL and provided by CRU in September 2018, this has been used as the basis for the commodity price, forecasted US$606/t average LOM SOP sales @ $A/$US exchange rate of 0.73.
o CRU estimates that CFR Australian prices in KLL’s first year of full production (2022) will be US$530/t with prices rising to US$961-997/t in 2040. CRU forecasts a 2.8%pa growth in SOP.
o NPV ranges and sensitivities determined for key assumptions and inputs including, SOP price, production rate, capital
cost, operating cost, foreign exchange, discount rate, recovery rates and construction delays.
Social • The status of agreements with key stakeholders and matters leading to social licence to operate.
• Two Native Title Land Access Agreements have been executed allowing for the consent to the grant of mining leases, ancillary tenure and approvals required for the BSOPP.
• The BSOPP tenements were originally applied for by Rachlan Holdings Pty Ltd (Rachlan) with an agreement in place to transfer tenure to KLL as soon as practicable after grant, which has occurred for all granted tenements to date.
• All relevant regulatory departments and authorities have been consulted extensively.
• Access agreements are in place with all pastoralists and neighbours that will allow construction and development of the project.
Other • To the extent relevant, the impact of the following on the project and/or on the estimation and classification of the Ore Reserves:
• Kalium Lakes has reviewed the legislative requirements and has compiled a register of the environmental, heritage and planning approvals and permits necessary to scope, develop, construct and operate the BSOPP for each development phase. Each phase will

Beyondie Sulphate of Potash Project JORC (2012) and NI 43-101 Technical Report – 2018
Report2018_Final_20180917 147
Criteria Explanation Comments
• Any identified material naturally occurring risks.
• The status of material legal agreements and marketing arrangements.
• The status of governmental agreements and approvals critical to the viability of the project, such as mineral tenement status, and government and statutory approvals. There must be reasonable grounds to expect that all necessary Government approvals will be received within the timeframes anticipated in the Pre-Feasibility or Feasibility study. Highlight and discuss the materiality of any unresolved matter that is dependent on a third party on which extraction of the reserve is contingent.
require; new specific approvals, or utilise approvals granted in the prior phase, or seek to modify existing approvals. Approvals for the Pilot Scale Development Ponds and Pump Testing are currently in place, inclusive of a 5C dewatering licence for 1.5 Gl/pa. See Table 30 for a detailed list of required approvals and current status.
• Early works approvals are in place from the Environmental Protection Authority of Western Australia (EPA) and Department of Mines, Industry Regulation and Safety (DMIRS), with formal approval for the full-scale project anticipated to be in place during Q4 2018.
• Two Mining Leases and 10 Miscellaneous Licences have been granted for the Beyondie SOP Project.
• The level of assessment being targeted is known as an Environmental Review, where an Environmental Review Document is prepared and submitted to the WA Environmental Protection Authority (EPA) for assessment under Part IV of the Environmental Protection Act 1986.
• Kalium Lakes has undertaken extensive consultation with leading agencies to confirm the approvals that will be required. Based on this consultation Kalium Lakes believes that there are reasonable grounds for Government approvals to be received within the timeframes anticipated in the Bankable Feasibility Study.
• Offtake Terms Sheet executed with German fertiliser producer and distributor K+S for 100% of Stage 1 production. The Offtake arrangement is subject to the execution of a formal binding offtake agreement and satisfaction of certain conditions precedent, including completion of due diligence by K+S.
• The Company is proposing to fund the project capital expenditure by a combination of up to 60% debt and the residual in equity.
• Debt financing is well advanced with initial due diligence completed and Expression of Interest (EOI) Term Sheets received.
• The Company estimates that approximately A$42 million of the project capital expenditure is expected to qualify under the German Export Credit Agency (ECA) scheme which has received a positive preliminary assessment decision by the German Government Inter-Ministerial Committee (IMC) and Euler Hermes Aktiengesellschaft (Hermes), the appointed export credit agency that administers the German ECA scheme for the German Government.
• Australian Government’s Northern Australia Infrastructure Facility (NAIF) has provided written confirmation that the NAIF Board has considered a Strategic Assessment Paper for the BSOPP and has consented to the NAIF Executive continuing its investigation.
Classification • The basis for the classification of the Ore Reserves into varying confidence categories.
• Whether the result appropriately reflects the Competent Person’s view of the deposit.
• The proportion of Probable Ore Reserves that have been derived from Measured Mineral Resources (if any).
• Proved and Probable Reserves have been estimated.
• Proved Reserves come from the production bores in the measured zones at Ten Mile and Sunshine deep aquifer. All trench pumps and all other production bores have been allocated to Probable Reserves. Though the lake surface has Measured Mineral Resources for the top 5 m the effects of variable recharge on this zone means that these Resources remain in the Probable category.
• 36% of the Probable Ore Reserves have been derived from the Lake Sediments, 64% from production bores.
• 24% of the Total Reserves have been derived from the Lake Sediments, 76% from production bores.
Audits or reviews • The results of any audits or reviews of Ore Reserve estimates. • The Ore Reserve Estimates was reviewed and audited by the Competent Persons.
• The Ore Reserves and the Competent Persons’ report was reviewed by Advisian.
Discussion of
relative accuracy/
confidence
• Where appropriate a statement of the relative accuracy and confidence level in the Ore Reserve estimate using an approach or procedure deemed appropriate by the Competent Person. For example, the application of statistical or geostatistical procedures to quantify the relative accuracy of the reserve within stated confidence limits, or, if such an approach is not deemed appropriate, a qualitative discussion of the factors which could affect the relative accuracy and confidence of the estimate.
• The statement should specify whether it relates to global or local estimates, and, if local, state the relevant tonnages, which should be relevant to technical and economic evaluation. Documentation should include assumptions made and the procedures used.
• Accuracy and confidence discussions should extend to specific discussions of any applied Modifying Factors that may have a material impact on Ore Reserve viability, or for which there are remaining areas of uncertainty at the current study stage.
• It is recognised that this may not be possible or appropriate in all circumstances. These statements of relative accuracy and confidence of the estimate should be compared with production data, where available.
• Model sensitivity and predictive uncertainty analysis has been completed on the numerical models to determine the most sensitive parameters of the model and the reliability of the data used to gain an understanding of the relative accuracy of the model predictions.
• Highly sensitive uncertainties in the modelling include aquifer recharge and vertical leakage from the lacustrine clay. Modelling has taken a conservative approach to these parameters to ensure the model is representative of the level of understanding of the hydrogeology.
• NPV ranges and sensitivities determined for key assumptions and inputs including, SOP price, production rate, capital cost, operating cost, foreign exchange, discount rate and construction delays.
• See Section 24 for a list of potential risks.

Beyondie Sulphate of Potash Project JORC (2012) and NI 43-101 Technical Report – 2018
Report2018_Final_20180917 148
APPENDIX 2: DRILL HOLE ASSAYS AND DETAILS
Point Reference Location Easting Northing RL (m) Description Depth (m) Dip Azimuth
Assay
Ca Mg Na K Cl SO4
mg/L
SDHTM08 10 Mile 230,359 7,259,357 560 Drilling 48 -90 0 745 5,585 53,350 7,850 89,150 23,397
SDHTM08 10 Mile 228,257 7,260,913 560 Drilling 0 -90 0 737 5,450 51,250 7,780 88,000 23,367
SDHTM08 10 Mile 230,359 7,259,357 560 Drilling 27 -90 0 742 5,430 54,100 7,640 88,000 23,068
SDHTM08 10 Mile 230,359 7,259,357 560 Drilling 30 -90 0 763 5,600 54,800 7,900 88,000 23,936
SDHTM08 10 Mile 230,359 7,259,357 560 Drilling 33 -90 0 766 5,590 53,800 7,860 88,300 23,397
SDHTM08 10 Mile 230,359 7,259,357 560 Drilling 36 -90 0 745 5,585 51,500 7,670 88,150 22,993
SDHTM08 10 Mile 230,359 7,259,357 560 Drilling 39 -90 0 760 5,550 53,600 7,780 88,200 23,457
SDHTM08 10 Mile 230,359 7,259,357 560 Drilling 42 -90 0 748 5,570 53,300 7,820 87,800 23,217
SDHTM08 10 Mile 230,359 7,259,357 560 Drilling 45 -90 0 752 5,640 54,600 7,940 89,600 23,457
SDHTM08 10 Mile 230,359 7,259,357 560 Drilling 3 -90 0 746 5,540 51,800 7,800 88,900 23,068
SDHTM08 10 Mile 230,359 7,259,357 560 Drilling 6 -90 0 742 5,510 52,800 7,780 90,400 23,098
SDHTM08 10 Mile 230,359 7,259,357 560 Drilling 9 -90 0 735 5,480 52,900 7,760 89,200 23,128
SDHTM08 10 Mile 230,359 7,259,357 560 Drilling 12 -90 0 731 5,370 51,800 7,630 88,000 22,858
SDHTM08 10 Mile 230,359 7,259,357 560 Drilling 15 -90 0 746 5,380 50,600 7,550 87,100 22,798
SDHTM08 10 Mile 230,359 7,259,357 560 Drilling 18 -90 0 758 5,430 51,900 7,670 86,900 22,858
SDHTM08 10 Mile 230,359 7,259,357 560 Drilling 21 -90 0 758 5,480 52,600 7,700 86,900 23,367
SDHTM08 10 Mile 230,359 7,259,357 560 Drilling 24 -90 0 735 5,340 53,700 7,540 86,900 22,948
TMAC06 10 Mile 233,139 7,256,566 560 Drilling 42 -90 0 737 6,330 50,100 6,030 85,900 21,600
TMAC06 10 Mile 233,139 7,256,566 560 Drilling 75 -90 0 453 9,370 78,300 9,990 136,000 30,300
TMAC06 10 Mile 233,139 7,256,566 560 Drilling 62 -90 0 762 6,050 47,900 6,050 85,100 21,700
TMAC11 10 Mile 230,975 7,253,145 560 Drilling 77 -90 0 427 9,050 80,900 11,200 140,000 31,800
TMAC11 10 Mile 230,975 7,253,145 560 Drilling 79 -90 0 416 9,060 81,900 11,300 139,000 32,400
TMAC11 10 Mile 233,485 7,256,791 560 Drilling 72 -90 0 519 7,130 66,900 9,070 120,000 25,400
TMAC12 10 Mile 233,485 7,256,791 568 Drilling 84 -90 0 514 7,630 70,200 9,290 121,000 27,300
TMAC13 10 Mile 233,486 7,256,939 568 Drilling 78 -90 0 641 5,560 47,000 6,200 82,300 18,800
TMAC13 10 Mile 233,486 7,256,939 568 Drilling 78 -90 0 638 5,560 47,200 6,200 82,400 18,700
TMAC13 10 Mile 233,486 7,256,939 568 Drilling 16 -90 0 634 4,640 40,100 5,120 68,500 16,300
TMAC13 10 Mile 233,486 7,256,939 568 Drilling 16 -90 0 637 4,600 40,400 5,130 68,200 16,200
TMAC13 10 Mile 233,486 7,256,939 568 Drilling 72 -90 0 518 7,270 68,400 9,220 121,000 27,000
TMAC13 10 Mile 233,486 7,256,939 568 Drilling 84 -90 0 523 7,820 70,000 9,260 123,000 27,800
TMAC13 10 Mile 233,486 7,256,939 568 Drilling 84 -90 0 519 7,780 69,800 9,200 123,000 27,600
TMAC14 10 Mile 233,453 7,257,458 568 Drilling 72 -90 0 519 7,180 68,300 9,200 118,000 26,300
TMAC14 10 Mile 233,453 7,257,458 568 Drilling 75 -90 0 500 7,590 68,900 9,200 121,000 27,300
TMAC21 10 Mile 233,892 7,253,504 561 Drilling 59 -90 0 589 6,930 56,600 7,300 99,300 23,500
TMAC21 10 Mile 233,892 7,253,504 561 Drilling 61 -90 0 890 3,430 30,000 3,840 52,700 12,800
TMAC21 10 Mile 233,892 7,253,504 561 Drilling 61 -90 0 883 3,420 29,400 3,810 52,800 12,600
TMAC15 10 Mile 235,752 7,257,213 571 Drilling 17 -90 0 400 645 7,500 1,190 12,950 2,610
TMAC15 10 Mile 235,752 7,257,213 571 Drilling 17 -90 0 410 640 7,490 1,190 12,950 2,640
TMAC15 10 Mile 235,752 7,257,213 571 Drilling 71 -90 0 519 6,430 57,600 7,730 103,400 23,200
TMAC15 10 Mile 235,752 7,257,213 571 Drilling 78 -90 0 541 6,600 61,300 8,340 108,300 23,900

Beyondie Sulphate of Potash Project JORC (2012) and NI 43-101 Technical Report – 2018
Report2018_Final_20180917 149
Point Reference Location Easting Northing RL (m) Description Depth (m) Dip Azimuth
Assay
Ca Mg Na K Cl SO4
mg/L
TMAC16 10 Mile 232,062 7,254,489 562 Drilling 71 -90 0 493 7,880 66,800 7,880 117,500 28,800
TMAC22 10 Mile 230,516 7,254,836 561 Drilling 65 -90 0 392 9,160 81,900 11,300 144,000 30,300
TMAC22 10 Mile 230,516 7,254,836 561 Drilling 65 -90 0 393 9,210 81,700 11,300 144,000 30,300
TMAC22 10 Mile 230,516 7,254,836 561 Drilling 77 -90 0 400 9,050 82,100 11,400 144,000 30,300
TMAC22 10 Mile 230,516 7,254,836 561 Drilling 79 -90 0 391 9,050 82,400 11,500 146,000 30,000
TMAC23 10 Mile 230,934 7,253,523 563 Drilling 29 -90 0 126 165 940 140 1,500 630
TMAC23 10 Mile 230,934 7,253,523 563 Drilling 82 -90 0 320 6,180 55,900 7,550 96,700 21,700
TMAC24M1 10 Mile 231,840 7,251,994 561 Re-development 58.7 -90 0 751 3,180 25,300 2,940 40,300 13,100
TMAC24M2 10 Mile 231,840 7,251,994 561 Re-development 58.7 -90 0 745 4,480 33,100 3,960 55,450 18,000
TMAC26 10 Mile 232,825 7,253,032 561 Drilling 64 -90 0 808 5,070 39,800 5,390 72,050 18,300
TMAC26 10 Mile 232,825 7,253,032 561 Drilling 64 -90 0 813 5,020 39,800 5,370 71,700 17,900
TMAC27 10 Mile 229,050 7,258,970 561 Drilling 69 -90 0 520 6,360 61,800 8,810 104,350 24,900
TMAC28 10 Mile 231,526 7,258,961 561 Drilling 74 -90 0 469 6,450 60,300 8,310 103,800 25,200
TMAC28 10 Mile 231,526 7,258,961 561 Drilling 74 -90 0 473 6,430 60,900 8,380 104,150 25,100
TMAC30 10 Mile 236,365 7,258,144 561 Drilling 24 -90 0 59 345 4,450 770 7,700 1,020
TMAC09 10 Mile 232,951 7,251,176 561 Drilling 39 -90 0 831 2,490 19,300 2,400 32,000 9,780
WB09TB01 10 Mile 230,482 7,254,260 561 Re-development 53 -90 0 668 3,650 26,600 3,040 43,800 13,400
WB10 10 Mile 233,468 7,257,249 568 Airlift development 72 -90 0 700 4,530 41,900 5,700 72,000 13,430
WB10 10 Mile 233,468 7,257,249 568 Airlift development 72 -90 0 557 7,200 64,600 8,630 108,000 25,080
WB11MBI 10 Mile 233,539 7,255,526 560 Re-development 91 -90 0 716 5,900 43,600 5,100 72,650 20,200
WB11TB01 10 Mile 233,559 7,255,517 560 Re-development 91 -90 0 877 4,880 39,000 4,560 64,600 16,800
WB11 10 Mile 233,540 7,255,533 560 Airlift development 91 -90 0 803 4,560 37,000 4,480 61,200 11,790
WB12 10 Mile 233,894 7,253,901 560 Airlift development 91 -90 0 989 4,300 37,000 4,540 61,500 11,640
WB12 10 Mile 233,894 7,253,901 560 Airlift development 91 -90 0 668 6,805 51,700 6,205 86,500 16,310
WB12 10 Mile 233,894 7,253,901 560 Airlift development 91 -90 0 940 4,150 35,700 4,400 61,000 11,540
WB13 10 Mile 236,154 7,257,232 560 Airlift development 91 -90 0 686 7,320 57,100 7,755 97,800 17,675
SDHB3 Beyondie 223,400 7,259,044 559 Drilling 1.5 -90 0 530 6,440 69,400 11,000 119,000 24,596
SDHB3 Beyondie 223,400 7,259,044 559 Drilling 51 -90 0 545 6,590 69,200 10,900 125,000 25,554
SDHB3 Beyondie 223,400 7,259,044 559 Drilling 60 -90 0 565 6,500 69,800 11,200 125,000 25,315
SDHB3 Beyondie 223,400 7,259,044 559 Drilling 9 -90 0 520 6,460 68,000 10,900 122,000 24,326
SDHB3 Beyondie 223,400 7,259,044 559 Drilling 12 -90 0 525 6,350 66,800 10,800 126,000 24,626
SDHB3 Beyondie 223,400 7,259,044 559 Drilling 15 -90 0 525 6,390 66,200 10,800 125,000 24,835
SDHB3 Beyondie 223,400 7,259,044 559 Drilling 18 -90 0 525 6,610 66,500 10,900 125,000 25,015
SDHB3 Beyondie 223,400 7,259,044 559 Drilling 21 -90 0 525 6,370 65,700 10,800 123,000 24,566
SDHB4 Beyondie 223,400 7,259,044 559 Drilling 3 -90 0 860 4,650 45,200 6,300 78,200 18,214
SDHB4 Beyondie 225,891 7,260,242 560 Drilling 2 -90 0 870 4,720 45,800 6,280 78,700 18,963
SDHB4 Beyondie 225,891 7,260,242 560 Drilling 9 -90 0 845 4,520 44,400 6,170 78,700 17,675
SDHB4 Beyondie 225,891 7,260,242 560 Drilling 12 -90 0 858 4,590 43,400 6,210 79,050 18,005
SDHB4 Beyondie 225,891 7,260,242 560 Drilling 15 -90 0 835 4,590 44,800 6,080 79,400 17,885
SDHB4 Beyondie 225,891 7,260,242 560 Drilling 18 -90 0 840 4,810 45,900 6,270 80,400 18,724
SDHB4 Beyondie 225,891 7,260,242 560 Drilling 21 -90 0 820 4,540 44,600 6,130 79,800 18,155
SDHB5 Beyondie 225,891 7,260,242 560 Drilling 1 -90 0 565 7,660 59,100 9,500 109,000 28,880
SDHB5 Beyondie 224,874 7,259,474 559 Drilling 2 -90 0 580 7,890 58,800 9,600 110,000 29,209
SDHB5 Beyondie 224,874 7,259,474 559 Drilling 9 -90 0 560 7,200 60,100 9,440 112,000 26,962

Beyondie Sulphate of Potash Project JORC (2012) and NI 43-101 Technical Report – 2018
Report2018_Final_20180917 150
Point Reference Location Easting Northing RL (m) Description Depth (m) Dip Azimuth
Assay
Ca Mg Na K Cl SO4
mg/L
SDHB5 Beyondie 224,874 7,259,474 559 Drilling 12 -90 0 560 7,600 61,800 9,440 112,000 29,898
SDHB5 Beyondie 224,874 7,259,474 559 Drilling 15 -90 0 565 7,780 63,000 9,740 110,000 30,857
SDHB5 Beyondie 224,874 7,259,474 559 Drilling 15 -90 0 575 7,940 65,600 10,000 114,000 30,557
SDHB5 Beyondie 224,874 7,259,474 559 Drilling 18 -90 0 535 7,710 64,100 9,900 115,000 29,658
SDHB5 Beyondie 224,874 7,259,474 559 Drilling 21 -90 0 545 8,220 65,200 10,100 115,000 31,156
SDHB5 Beyondie 224,874 7,259,474 559 Drilling 27 -90 0 545 7,760 62,400 9,950 114,000 29,359
SDHB6 Beyondie 224,874 7,259,474 559 Drilling 3 -90 0 880 4,310 45,700 6,690 79,100 17,645
SDHB6 Beyondie 227,305 7,259,097 560 Drilling 6 -90 0 870 4,240 45,200 6,590 78,500 17,286
SDHB6 Beyondie 227,305 7,259,097 560 Drilling 9 -90 0 870 4,270 45,350 6,585 79,400 17,406
SDHB6 Beyondie 227,305 7,259,097 560 Drilling 12 -90 0 855 4,250 43,400 6,560 78,000 17,046
SDHB6 Beyondie 227,305 7,259,097 560 Drilling 15 -90 0 860 4,360 44,600 6,710 79,900 17,166
SDHB6 Beyondie 227,305 7,259,097 560 Drilling 18 -90 0 850 4,290 45,800 6,610 79,500 17,525
SDHB6 Beyondie 227,305 7,259,097 560 Drilling 21 -90 0 860 4,580 46,600 7,010 83,000 17,615
SDHB7 Beyondie 227,305 7,259,097 560 Drilling 3 -90 0 905 3,990 39,400 5,190 66,200 15,968
SDHB7 Beyondie 228,257 7,260,913 560 Drilling 30 -90 0 915 4,060 38,100 5,240 66,200 16,177
SDHB7 Beyondie 228,257 7,260,913 560 Drilling 33 -90 0 910 4,030 37,900 5,210 66,200 15,608
SDHB7 Beyondie 227,305 7,259,097 560 Drilling 6 -90 0 915 4,020 38,900 5,190 66,800 15,758
SDHB7 Beyondie 228,257 7,260,913 560 Drilling 9 -90 0 905 4,020 38,900 5,180 64,600 15,548
SDHB7 Beyondie 228,257 7,260,913 560 Drilling 12 -90 0 915 4,020 39,000 5,170 65,900 15,938
SDHB7 Beyondie 228,257 7,260,913 560 Drilling 15 -90 0 930 3,990 38,100 5,200 66,900 16,058
SDHB7 Beyondie 228,257 7,260,913 560 Drilling 18 -90 0 940 4,020 39,200 5,300 65,700 15,998
SDHB7 Beyondie 228,257 7,260,913 560 Drilling 21 -90 0 940 4,030 38,600 5,260 65,800 16,117
SDHB7 Beyondie 228,257 7,260,913 560 Drilling 24 -90 0 940 4,100 38,700 5,330 66,400 16,177
SDHB7 Beyondie 228,257 7,260,913 560 Drilling 27 -90 0 950 4,140 39,300 5,360 66,200 16,327
SSAC01 Sunshine 242,989 7,266,582 543 Drilling 140 -90 0 635 5,790 57,400 6,780 96,600 20,700
SSAC01 Sunshine 242,989 7,266,582 543 Drilling 90 -90 0 244 1,610 15,300 1,800 25,550 5,250
SSAC01 Sunshine 242,989 7,266,582 543 Drilling 90 -90 0 243 1,590 15,300 1,800 25,400 5,310
SSAC01 Sunshine 242,989 7,266,582 543 Drilling 18 -90 0 86 405 4,050 520 6,950 1,320
SSAC01 Sunshine 242,989 7,266,582 543 Drilling 18 -90 0 88 410 4,090 540 7,000 1,350
SSAC01 Sunshine 242,989 7,266,582 543 Drilling 36 -90 0 55 200 2,130 300 3,450 660
SSAC06 Sunshine 249,574 7,268,965 545 Drilling 53 -90 0 366 5,030 48,400 4,780 83,150 16,900
SSAC13 Sunshine 258,504 7,271,068 540 Drilling 41 -90 0 392 4,390 43,600 3,580 74,050 11,500
SSAC13 Sunshine 258,504 7,271,068 540 Drilling 59 -90 0 392 4,320 42,600 3,530 73,350 11,500
SSAC14 Sunshine 257,922 7,274,721 536 Drilling 47 -90 0 585 6,480 73,700 6,990 123,950 19,200
SSAC15 Sunshine 257,617 7,275,041 533 Drilling 24 -90 0 505 6,050 69,200 6,290 114,350 19,400
SSAC15 Sunshine 257,617 7,275,041 533 Drilling 24 -90 0 511 6,130 68,900 6,300 114,150 19,500
SSAC15 Sunshine 257,617 7,275,041 533 Drilling 59 -90 0 702 5,610 65,700 6,030 107,000 17,100
SSAC18 Sunshine 261,062 7,276,002 540 Drilling 101 -90 0 755 5,640 67,100 6,520 112,900 16,500
SSAC18 Sunshine 261,062 7,276,002 540 Drilling 54 -90 0 766 5,580 66,000 6,530 111,500 16,200
SSAC18 Sunshine 261,062 7,276,002 540 Drilling 54 -90 0 768 5,550 66,200 6,530 111,550 15,900
SSAC18 Sunshine 261,062 7,276,002 540 Drilling 77 -90 0 760 5,590 66,900 6,550 113,450 16,300
SSAC19 Sunshine 264,078 7,276,655 538 Drilling 47 -90 0 652 4,360 50,200 4,280 82,100 14,000
SSAC21 Sunshine 248,414 7,269,423 541 Drilling 53 -90 0 640 6,000 51,600 5,240 88,600 19,300
SSAC22 Sunshine 248,258 7,269,820 540 Drilling 24 -90 0 1,100 2,780 23,800 3,270 44,500 9,450

Beyondie Sulphate of Potash Project JORC (2012) and NI 43-101 Technical Report – 2018
Report2018_Final_20180917 151
Point Reference Location Easting Northing RL (m) Description Depth (m) Dip Azimuth
Assay
Ca Mg Na K Cl SO4
mg/L
SSAC22 Sunshine 248,258 7,269,820 540 Drilling 37 -90 0 1,080 2,800 24,300 3,300 43,950 9,360
SSAC25 Sunshine 255,111 7,272,747 540 Drilling 53 -90 0 547 7,560 76,300 7,470 132,200 21,500
SSAC42 Sunshine 249,756 7,269,754 534 Drilling 37 -90 0 448 3,740 33,700 3,680 58,100 11,900
SSAC034 Sunshine 241,523 7,265,061 558 Drilling 34 -90 0 83 400 3,600 480 6,050 1,290
SSAC034 Sunshine 241,523 7,265,061 558 Drilling 51 -90 0 89 470 4,510 600 7,600 1,500
SSAC034 Sunshine 241,523 7,265,061 558 Drilling 59 -90 0 87 555 5,210 680 8,800 1,860
SSAC034 Sunshine 241,523 7,265,061 558 Drilling 60 -90 0 88 610 5,530 730 9,450 2,010
SSAC035 Sunshine 242,796 7,266,865 544 Drilling 54 -90 0 408 2,360 16,600 1,770 30,350 7,200
SSAC035 Sunshine 242,796 7,266,865 544 Drilling 66 -90 0 264 1,460 10,700 1,160 18,500 4,560
SSAC036 Sunshine 244,151 7,267,248 547 Drilling 16 -90 0 1,040 2,790 32,300 4,460 55,050 12,200
SSAC036 Sunshine 244,151 7,267,248 547 Drilling 31 -90 0 1,040 3,170 35,500 5,000 61,550 12,900
SSAC036 Sunshine 244,151 7,267,248 547 Drilling 57 -90 0 1,040 3,320 35,300 5,050 62,450 13,100
SSAC036 Sunshine 244,151 7,267,248 547 Drilling 69 -90 0 1,020 3,260 35,800 5,030 63,500 13,200
SSAC038 Sunshine 244,516 7,267,313 543 Drilling 33 -90 0 998 3,740 41,000 5,820 70,700 16,000
SSAC038 Sunshine 244,516 7,267,313 543 Drilling 42 -90 0 998 3,660 41,200 5,770 70,350 15,500
SSAC038 Sunshine 244,516 7,267,313 543 Drilling 48 -90 0 998 3,810 40,600 5,810 70,900 15,500
SSAC038 Sunshine 244,516 7,267,313 543 Drilling 54 -90 0 969 4,040 43,000 6,190 74,800 16,400
SSAC038 Sunshine 244,516 7,267,313 543 Drilling 60 -90 0 960 4,070 42,500 6,110 75,150 16,200
SSAC038 Sunshine 244,516 7,267,313 543 Drilling 66 -90 0 928 4,020 43,000 6,060 74,050 16,100
SSAC039 Sunshine 244,090 7,267,920 544 Drilling 26 -90 0 567 1,830 17,500 2,310 30,700 7,110
SSAC040 Sunshine 244,854 7,269,177 538 Drilling 42 -90 0 415 2,100 16,000 1,880 29,450 6,570
SSAC041 Sunshine 244,170 7,269,767 540 Drilling 30 -90 0 65 245 1,820 210 2,950 780
SSAC042 Sunshine 244,308 7,269,452 539 Drilling 42 -90 0 28 65 690 130 1,100 270
SSAC042 Sunshine 244,308 7,269,452 539 Drilling 48 -90 0 62 265 2,280 290 3,900 900
SSAC042 Sunshine 244,308 7,269,452 539 Drilling 53 -90 0 382 2,810 22,600 2,670 40,050 9,420
SSAC043 Sunshine 245,717 7,269,914 539 Drilling 39 -90 0 414 1,560 11,300 1,320 20,200 5,100
SSAC043 Sunshine 245,717 7,269,914 539 Drilling 45 -90 0 497 1,090 7,940 940 13,850 3,870
SSAC043 Sunshine 245,717 7,269,914 539 Drilling 53 -90 0 883 4,630 38,700 4,910 67,350 14,500
SSAC044 Sunshine 245,953 7,269,783 538 Drilling 37 -90 0 1,290 3,080 24,500 3,320 45,700 8,940
SSAC044 Sunshine 245,953 7,269,783 538 Drilling 48 -90 0 1,240 3,230 25,300 3,490 48,150 9,510
SSAC044 Sunshine 245,953 7,269,783 538 Drilling 52 -90 0 1,260 3,250 25,600 3,530 46,900 9,660
SSAC044 Sunshine 245,953 7,269,783 538 Drilling 57 -90 0 1,240 3,230 25,300 3,510 48,500 9,480
SSAC044 Sunshine 245,953 7,269,783 538 Drilling 63 -90 0 1,250 3,310 26,700 3,580 49,200 9,810
SSAC044 Sunshine 245,953 7,269,783 538 Drilling 72 -90 0 1,200 3,510 28,300 3,800 52,200 10,700
SSAC044 Sunshine 245,953 7,269,783 538 Drilling 75 -90 0 1,190 3,560 29,400 3,820 52,900 10,900
SSAC045 Sunshine 245,949 7,269,526 538 Drilling 37 -90 0 1,240 3,250 27,700 3,730 51,150 10,400
SSAC045 Sunshine 245,949 7,269,526 538 Drilling 42 -90 0 1,240 3,260 27,800 3,750 50,950 10,700
SSAC045 Sunshine 245,949 7,269,526 538 Drilling 45 -90 0 1,240 3,260 27,700 3,790 51,150 10,700
SSAC046 Sunshine 247,863 7,269,882 541 Drilling 30 -90 0 1,150 3,050 24,500 3,340 45,350 10,100
SSAC046 Sunshine 247,863 7,269,882 541 Drilling 45 -90 0 1,150 2,950 24,400 3,210 43,750 9,690
SSAC046 Sunshine 247,863 7,269,882 541 Drilling 54 -90 0 1,080 2,850 23,500 3,130 43,050 9,510
SSAC047 Sunshine 247,043 7,269,910 537 Drilling 27 -90 0 1,060 2,890 21,400 2,650 38,450 9,810
SSAC047 Sunshine 247,043 7,269,910 537 Drilling 42 -90 0 1,020 3,100 22,700 2,820 41,250 10,200
SSAC047 Sunshine 247,043 7,269,910 537 Drilling 48 -90 0 770 4,850 38,800 4,660 70,200 14,800

Beyondie Sulphate of Potash Project JORC (2012) and NI 43-101 Technical Report – 2018
Report2018_Final_20180917 152
Point Reference Location Easting Northing RL (m) Description Depth (m) Dip Azimuth
Assay
Ca Mg Na K Cl SO4
mg/L
SSAC048 Sunshine 247,442 7,270,641 536 Drilling 24 -90 0 620 2,420 18,800 2,250 33,850 7,410
SSAC048 Sunshine 247,442 7,270,641 536 Drilling 36 -90 0 503 1,930 15,100 1,770 27,350 5,880
SSAC048 Sunshine 247,442 7,270,641 536 Drilling 48 -90 0 540 2,100 16,300 1,960 29,800 6,540
SSAC048 Sunshine 247,442 7,270,641 536 Drilling 54 -90 0 637 3,310 27,100 3,200 49,050 10,400
SSAC049 Sunshine 247,162 7,271,081 540 Drilling 27 -90 0 386 1,640 12,200 1,220 21,850 5,130
SSAC049 Sunshine 247,162 7,271,081 540 Drilling 45 -90 0 426 2,050 15,300 1,620 28,050 6,540
SSAC049 Sunshine 247,162 7,271,081 540 Drilling 57 -90 0 539 3,020 23,100 2,340 40,550 9,720
SSAC049 Sunshine 247,162 7,271,081 540 Drilling 69 -90 0 612 6,130 48,800 5,390 88,700 19,100
SSAC050 Sunshine 247,579 7,270,288 536 Drilling 30 -90 0 1,070 4,710 39,900 5,480 73,700 13,900
SSAC050 Sunshine 247,579 7,270,288 536 Drilling 42 -90 0 1,020 4,800 41,100 5,540 76,900 14,100
SSAC050 Sunshine 247,579 7,270,288 536 Drilling 49 -90 0 1,030 4,810 40,300 5,580 76,550 14,500
SSAC051 Sunshine 261,751 7,276,749 537 Drilling 21 -90 0 487 2,830 27,200 2,880 49,050 7,470
SSAC051 Sunshine 261,751 7,276,749 537 Drilling 33 -90 0 478 3,010 31,600 3,180 54,850 8,190
SSAC051 Sunshine 261,751 7,276,749 537 Drilling 45 -90 0 525 3,350 32,800 3,450 60,300 9,090
SSAC051 Sunshine 261,751 7,276,749 537 Drilling 57 -90 0 617 4,530 47,200 4,860 85,350 13,300
SSAC051 Sunshine 261,751 7,276,749 537 Drilling 66 -90 0 543 3,660 37,900 3,860 69,150 10,700
SSAC052 Sunshine 261,875 7,276,513 541 Drilling 27 -90 0 456 2,820 26,800 2,700 49,050 7,560
SSAC052 Sunshine 261,875 7,276,513 541 Drilling 39 -90 0 605 3,790 38,800 4,140 71,600 9,870
SSAC053 Sunshine 261,850 7,276,277 539 Drilling 23 -90 0 519 3,200 30,600 3,060 55,400 8,790
SSAC054 Sunshine 261,639 7,276,962 538 Drilling 21 -90 0 205 1,270 14,100 1,420 24,100 3,750
SSAC054 Sunshine 261,639 7,276,962 538 Drilling 30 -90 0 351 2,300 22,800 2,110 37,200 6,810
SSAC054 Sunshine 261,639 7,276,962 538 Drilling 42 -90 0 321 2,090 20,800 1,960 36,000 6,180
SSAC054 Sunshine 261,639 7,276,962 538 Drilling 48 -90 0 349 2,300 21,800 2,100 37,500 6,810
SSAC054 Sunshine 261,639 7,276,962 538 Drilling 54 -90 0 318 2,080 21,000 1,970 35,200 6,330
SSAC054 Sunshine 261,639 7,276,962 538 Drilling 60 -90 0 300 1,970 19,800 1,860 33,800 5,880
SSAC054 Sunshine 261,639 7,276,962 538 Drilling 63 -90 0 309 2,040 20,300 1,940 34,800 6,180
SSAC055 Sunshine 258,203 7,273,609 530 Drilling 20 -90 0 652 6,790 71,500 6,510 127,000 18,300
SSAC055 Sunshine 258,203 7,273,609 530 Drilling 25 -90 0 635 6,920 71,800 6,600 128,000 18,600
SSAC055 Sunshine 258,203 7,273,609 530 Drilling 42 -90 0 629 6,940 74,400 6,690 129,000 18,500
SSAC055 Sunshine 258,203 7,273,609 530 Drilling 43 -90 0 622 7,130 76,200 6,750 133,000 18,800
SSAC056 Sunshine 258,327 7,273,538 530 Drilling 30 -90 0 685 6,580 62,300 5,640 111,000 17,700
SSAC056 Sunshine 258,327 7,273,538 530 Drilling 41 -90 0 623 6,110 62,200 5,400 104,000 16,900
SSAC057 Sunshine 258,497 7,273,430 530 Drilling 21 -90 0 661 5,520 53,600 4,620 92,100 16,100
SSAC057 Sunshine 258,497 7,273,430 530 Drilling 30 -90 0 629 6,450 59,500 5,160 103,000 18,300
SSAC057 Sunshine 258,497 7,273,430 530 Drilling 42 -90 0 601 6,040 56,100 4,950 98,200 16,700
SSAC057 Sunshine 258,497 7,273,430 530 Drilling 48 -90 0 559 4,700 45,200 4,420 77,200 13,800
SSAC057 Sunshine 258,497 7,273,430 530 Drilling 58 -90 0 573 4,510 42,900 3,850 75,000 13,100
SSAC057 Sunshine 258,497 7,273,430 530 Drilling 66 -90 0 533 4,780 46,300 4,100 79,200 13,400
SSAC057 Sunshine 258,497 7,273,430 530 Drilling 69 -90 0 523 4,560 42,500 3,930 76,500 12,700
SSAC058 Sunshine 261,455 7,277,135 539 Drilling 30 -90 0 227 1,360 12,100 1,100 20,500 4,080
SSAC058 Sunshine 261,455 7,277,135 539 Drilling 42 -90 0 234 1,410 12,800 1,150 21,200 4,170
SSAC058 Sunshine 261,455 7,277,135 539 Drilling 48 -90 0 226 1,320 11,900 1,090 20,100 3,870
SSAC058 Sunshine 261,455 7,277,135 539 Drilling 57 -90 0 224 1,330 11,900 1,090 20,100 3,900
SSAC058 Sunshine 261,455 7,277,135 539 Drilling 63 -90 0 405 2,550 25,800 2,570 44,800 7,620

Beyondie Sulphate of Potash Project JORC (2012) and NI 43-101 Technical Report – 2018
Report2018_Final_20180917 153
Point Reference Location Easting Northing RL (m) Description Depth (m) Dip Azimuth
Assay
Ca Mg Na K Cl SO4
mg/L
SSAC058 Sunshine 261,455 7,277,135 539 Drilling 72 -90 0 723 5,190 59,100 6,210 101,000 15,300
SSAC059 Sunshine 248,075 7,269,537 540 Drilling 30 -90 0 784 2,510 19,800 2,300 34,400 8,490
SSAC059 Sunshine 248,075 7,269,537 540 Drilling 45 -90 0 678 3,090 24,800 2,720 43,700 10,100
SSAC059 Sunshine 248,075 7,269,537 540 Drilling 51 -90 0 741 3,720 30,600 3,290 52,000 12,400
SSAC059 Sunshine 248,075 7,269,537 540 Drilling 63 -90 0 666 4,730 40,700 4,280 70,200 15,300
SSAC059 Sunshine 248,075 7,269,537 540 Drilling 68 -90 0 562 6,860 60,100 6,160 104,000 21,500
SSAC060 Sunshine 246,645 7,270,336 536 Drilling 30 -90 0 1,060 3,670 30,300 3,750 54,100 11,200
SSAC060 Sunshine 246,645 7,270,336 536 Drilling 42 -90 0 830 4,720 40,000 4,820 71,600 14,000
SSAC060 Sunshine 246,645 7,270,336 536 Drilling 48 -90 0 796 5,280 44,600 5,370 80,800 15,900
SSAC060 Sunshine 246,645 7,270,336 536 Drilling 57 -90 0 835 3,670 31,700 3,730 54,500 11,100
SSAC060 Sunshine 246,645 7,270,336 536 Drilling 63 -90 0 838 3,820 31,400 3,850 57,300 11,300
SSAC061 Sunshine 245,574 7,269,996 539 Drilling 24 -90 0 355 420 3,000 330 5,050 1,800
SSAC061 Sunshine 245,574 7,269,996 539 Drilling 39 -90 0 218 545 4,050 440 6,650 1,740
SSAC061 Sunshine 245,574 7,269,996 539 Drilling 45 -90 0 603 3,970 34,400 3,730 59,800 13,100
SSAC061 Sunshine 245,574 7,269,996 539 Drilling 51 -90 0 649 4,360 37,500 4,220 66,100 14,300
SSAC061 Sunshine 245,574 7,269,996 539 Drilling 66 -90 0 698 4,780 42,000 4,760 70,500 16,600
SSAC062 Sunshine 249,314 7,269,793 530 Drilling 18 -90 0 985 3,270 29,200 3,780 52,700 10,400
SSAC062 Sunshine 249,314 7,269,793 530 Drilling 30 -90 0 473 6,810 65,700 7,160 112,000 23,300
SSAC062 Sunshine 249,314 7,269,793 530 Drilling 36 -90 0 436 7,010 68,200 7,620 120,000 23,400
SSAC062 Sunshine 249,314 7,269,793 530 Drilling 42 -90 0 417 7,360 76,100 8,320 128,000 24,800
SSAC062 Sunshine 249,314 7,269,793 530 Drilling 48 -90 0 403 7,350 74,500 8,480 131,000 24,600
SSAC062 Sunshine 249,314 7,269,793 530 Drilling 53 -90 0 412 7,440 75,300 8,680 133,000 24,900
SSAC064 Sunshine 242,691 7,267,055 552 Drilling 30 -90 0 77 310 2,510 310 3,750 900
SSAC064 Sunshine 242,691 7,267,055 552 Drilling 42 -90 0 78 325 2,660 330 4,150 990
SSAC064 Sunshine 242,691 7,267,055 552 Drilling 57 -90 0 359 3,200 26,700 3,080 45,700 10,500
SSAC064 Sunshine 242,691 7,267,055 552 Drilling 63 -90 0 373 3,360 27,900 3,190 46,400 11,000
SSAC064 Sunshine 242,691 7,267,055 552 Drilling 68 -90 0 358 3,320 28,700 3,210 47,300 11,000
SSAC065 Sunshine 243,925 7,265,471 547 Drilling 36 -90 0 137 740 6,440 710 10,800 2,130
SSAC065 Sunshine 243,925 7,265,471 547 Drilling 45 -90 0 166 970 8,060 870 13,800 2,850
SSAC065 Sunshine 243,925 7,265,471 547 Drilling 54 -90 0 324 2,090 16,800 1,650 27,700 6,240
SSAC065 Sunshine 243,925 7,265,471 547 Drilling 63 -90 0 434 2,840 22,200 2,230 37,600 8,520
SSAC065 Sunshine 243,925 7,265,471 547 Drilling 68 -90 0 548 3,570 27,200 2,710 46,900 10,900
SSAC066 Sunshine 243,390 7,266,181 545 Drilling 18 -90 0 113 365 3,720 460 5,900 1,560
SSAC066 Sunshine 243,390 7,266,181 545 Drilling 36 -90 0 87 300 2,490 330 4,050 900
SSAC066 Sunshine 243,390 7,266,181 545 Drilling 60 -90 0 151 655 5,530 640 9,000 2,100
SSAC066 Sunshine 243,390 7,266,181 545 Drilling 65 -90 0 135 570 4,710 550 7,850 1,830
SSAC067 Sunshine 248,265 7,270,148 541 Drilling 27 -90 0 1,010 3,520 31,700 3,940 54,700 10,900
SSAC067 Sunshine 248,265 7,270,148 541 Drilling 33 -90 0 938 3,930 35,200 4,220 61,400 12,200
SSAC067 Sunshine 248,265 7,270,148 541 Drilling 38 -90 0 928 4,040 34,800 4,240 60,000 12,200
SSAC068 Sunshine 248,198 7,270,409 542 Drilling 21 -90 0 714 2,990 22,900 2,580 40,400 8,640
SSAC068 Sunshine 248,198 7,270,409 542 Drilling 30 -90 0 864 3,630 29,000 3,260 50,800 10,700
SSAC069 Sunshine 256,883 7,273,184 534 Drilling 33 -90 0 675 5,980 66,700 6,750 118,000 18,000
SSAC069 Sunshine 256,883 7,273,184 534 Drilling 45 -90 0 663 6,210 70,000 7,050 122,000 18,900
SSAC069 Sunshine 256,883 7,273,184 534 Drilling 47 -90 0 635 6,270 70,500 7,210 123,000 19,000

Beyondie Sulphate of Potash Project JORC (2012) and NI 43-101 Technical Report – 2018
Report2018_Final_20180917 154
Point Reference Location Easting Northing RL (m) Description Depth (m) Dip Azimuth
Assay
Ca Mg Na K Cl SO4
mg/L
SSAC070 Sunshine 256,880 7,273,373 534 Drilling 33 -90 0 576 6,570 69,500 6,820 120,000 20,300
SSAC070 Sunshine 256,880 7,273,373 534 Drilling 45 -90 0 620 6,720 69,900 6,950 120,000 19,900
SSAC070 Sunshine 256,880 7,273,373 534 Drilling 47 -90 0 582 6,740 71,000 6,880 122,000 20,000
SSAC071 Sunshine 256,823 7,273,708 529 Drilling 24 -90 0 558 6,730 72,900 7,580 128,000 18,100
SSAC071 Sunshine 256,823 7,273,708 529 Drilling 36 -90 0 562 6,730 75,100 7,550 127,000 18,600
SSAC071 Sunshine 256,823 7,273,708 529 Drilling 42 -90 0 553 6,730 73,900 7,540 127,000 18,600
SSAC072 Sunshine 261,460 7,277,140 540 Drilling 24 -90 0 242 1,520 14,000 1,330 23,900 4,410
SSAC072 Sunshine 261,460 7,277,140 540 Drilling 51 -90 0 469 3,130 32,200 2,910 60,700 9,480
SSAC072 Sunshine 261,460 7,277,140 540 Drilling 53 -90 0 487 3,220 32,200 3,020 53,800 9,510
SSAC073 Sunshine 258,726 7,275,741 531 Drilling 18 -90 0 890 5,040 56,200 6,160 104,000 13,900
SSAC073 Sunshine 258,726 7,275,741 531 Drilling 27 -90 0 842 5,480 62,800 6,570 110,000 15,200
SSAC073 Sunshine 258,726 7,275,741 531 Drilling 39 -90 0 744 5,670 66,400 6,970 113,000 16,500
SSAC073 Sunshine 258,726 7,275,741 531 Drilling 40 -90 0 760 5,710 65,100 6,990 114,000 16,700
SSAC074 Sunshine 258,655 7,275,386 532 Drilling 13 -90 0 938 4,390 51,800 5,470 90,300 14,000
SSAC075 Sunshine 258,818 7,275,076 533 Drilling 15 -90 0 948 4,140 48,700 4,750 82,400 14,200
SSAC076 Sunshine 259,041 7,274,804 535 Drilling 26 -90 0 835 4,870 53,600 5,010 90,100 16,800
TMAC045 10 Mile 230,974 7,254,137 561 Drilling 30 -90 0 351 1,360 5,710 540 8,600 6,090
TMAC045 10 Mile 230,974 7,254,137 561 Drilling 46 -90 0 343 1,870 11,000 1,110 17,000 8,070
TMAC045 10 Mile 230,974 7,254,137 561 Drilling 51 -90 0 337 2,730 18,300 1,970 29,850 10,400
TMAC046 10 Mile 230,923 7,254,248 560 Drilling 21 -90 0 307 855 4,070 420 6,550 3,330
TMAC046 10 Mile 230,923 7,254,248 560 Drilling 56 -90 0 482 7,350 55,300 6,210 92,150 28,900
TMAC047 10 Mile 230,900 7,254,388 563 Drilling 54 -90 0 569 7,350 55,200 6,100 91,950 28,600
TMAC047 10 Mile 230,900 7,254,388 563 Drilling 60 -90 0 499 7,860 63,400 7,610 108,100 30,300
TMAC048 10 Mile 230,880 7,254,602 569 Drilling 54 -90 0 523 8,050 62,800 7,510 107,750 29,600
TMAC048 10 Mile 230,880 7,254,602 569 Drilling 65 -90 0 492 8,320 65,400 8,000 113,750 29,200
TMAC049 10 Mile 230,911 7,254,514 571 Drilling 54 -90 0 540 7,390 56,300 6,180 94,450 28,900
TMAC050 10 Mile 230,941 7,253,691 565 Drilling 63 -90 0 707 4,940 39,100 4,880 66,700 17,200
TMAC050 10 Mile 230,941 7,253,691 565 Drilling 68 -90 0 464 5,680 46,600 6,030 79,850 18,700
TMAC052 10 Mile 231,968 7,254,794 564 Drilling 48 -90 0 694 2,580 17,100 1,970 29,000 10,000
TMAC052 10 Mile 231,968 7,254,794 564 Drilling 57 -90 0 651 3,440 26,300 3,020 44,750 12,600
TMAC053 10 Mile 231,849 7,254,896 566 Drilling 60 -90 0 631 4,860 30,900 3,450 53,000 16,700
TMAC053 10 Mile 231,849 7,254,896 566 Drilling 78 -90 0 599 5,110 34,000 3,760 57,750 18,100
TMAC054 10 Mile 230,952 7,255,130 559 Drilling 66 -90 0 400 9,420 80,100 11,100 143,900 29,600
TMAC055 10 Mile 233,131 7,256,954 563 Drilling 0.5 -90 0 487 8,730 71,500 9,670 129,000 27,600
TMAC055 10 Mile 233,131 7,256,954 563 Drilling 23 -90 0 815 4,850 45,300 6,230 77,700 16,400
TMAC055 10 Mile 233,131 7,256,954 563 Drilling 60 -90 0 523 7,030 64,300 8,720 113,750 24,600
TMAC055 10 Mile 233,131 7,256,954 563 Drilling 75 -90 0 525 7,460 67,800 9,280 119,550 25,000
TMAC055 10 Mile 233,131 7,256,954 563 Drilling 81 -90 0 474 8,640 73,200 9,760 130,050 28,100
TMAC056 10 Mile 233,146 7,256,729 567 Drilling 59 -90 0 619 6,820 62,800 8,380 108,450 24,300
TMAC057 10 Mile 233,114 7,256,293 569 Drilling 69 -90 0 535 8,310 67,400 8,630 119,350 26,900
TMAC057 10 Mile 233,114 7,256,293 569 Drilling 78 -90 0 477 9,170 72,500 9,240 127,050 28,600
TMAC058 10 Mile 233,130 7,255,931 570 Drilling 66 -90 0 538 8,580 68,600 8,650 119,350 28,200
TMAC059 10 Mile 233,064 7,257,104 563 Drilling 72 -90 0 538 7,500 70,200 9,100 120,400 27,200
TMAC059 10 Mile 233,064 7,257,104 563 Drilling 78 -90 0 482 8,280 74,000 9,470 127,600 28,500

Beyondie Sulphate of Potash Project JORC (2012) and NI 43-101 Technical Report – 2018
Report2018_Final_20180917 155
Point Reference Location Easting Northing RL (m) Description Depth (m) Dip Azimuth
Assay
Ca Mg Na K Cl SO4
mg/L
TMAC059 10 Mile 233,064 7,257,104 563 Drilling 85 -90 0 464 8,440 74,000 9,740 130,600 29,000
TMAC060 10 Mile 233,001 7,257,196 562 Drilling 57 -90 0 784 4,740 48,400 7,070 82,500 18,200
TMAC060 10 Mile 233,001 7,257,196 562 Drilling 67 -90 0 510 6,880 63,000 8,010 106,350 25,300
TMAC061 10 Mile 232,927 7,257,276 561 Drilling 57 -90 0 790 4,960 47,100 6,500 79,500 19,300
TMAC061 10 Mile 232,927 7,257,276 561 Drilling 66 -90 0 764 4,990 47,600 6,440 81,100 19,600
TMAC062 10 Mile 233,773 7,256,060 573 Drilling 70 -90 0 477 6,720 54,800 6,440 93,750 26,100
TMAC063 10 Mile 233,775 7,256,290 571 Drilling 57 -90 0 468 3,870 29,300 3,500 50,000 13,800
TMAC063 10 Mile 233,775 7,256,290 571 Drilling 69 -90 0 460 6,010 48,900 5,870 83,000 22,100
TMAC064 10 Mile 233,815 7,256,514 576 Drilling 67 -90 0 428 4,200 33,700 3,970 54,950 15,700
TMAC065 10 Mile 233,753 7,256,708 570 Drilling 68 -90 0 496 6,550 56,300 7,040 96,700 23,600
TMAC065 10 Mile 233,753 7,256,708 570 Drilling 74 -90 0 492 6,240 53,000 6,540 91,250 22,200
TMAC066 10 Mile 234,232 7,256,823 565 Drilling 60 -90 0 423 3,090 25,000 3,050 42,100 11,600
TMAC066 10 Mile 234,232 7,256,823 565 Drilling 72 -90 0 468 6,560 57,200 7,130 97,050 24,100
TMAC066 10 Mile 234,232 7,256,823 565 Drilling 77 -90 0 481 7,420 63,700 8,040 109,150 26,700
TMAC067 10 Mile 234,196 7,257,105 564 Drilling 69 -90 0 535 4,790 45,900 6,040 77,600 17,800
TMAC067 10 Mile 234,196 7,257,105 564 Drilling 70 -90 0 494 7,110 64,500 8,530 111,100 25,800
TMAC068 10 Mile 234,663 7,256,174 571 Drilling 65 -90 0 284 2,220 16,900 1,980 27,300 8,220
TMAC068 10 Mile 234,663 7,256,174 571 Drilling 73 -90 0 456 6,710 55,100 6,280 91,450 25,500
TMAC069 10 Mile 234,599 7,256,435 570 Drilling 60 -90 0 315 2,160 17,300 2,080 27,850 7,950
TMAC069 10 Mile 234,599 7,256,435 570 Drilling 69 -90 0 464 6,870 58,500 6,860 96,900 26,300
TMAC069 10 Mile 234,599 7,256,435 570 Drilling 72 -90 0 464 6,930 58,400 6,920 97,750 26,100
TMAC070 10 Mile 233,349 7,257,823 559 Drilling 60 -90 0 759 5,600 52,700 7,080 90,400 20,200
TMAC070 10 Mile 233,349 7,257,823 559 Drilling 64 -90 0 735 5,520 51,500 6,980 89,150 20,200
TMAC071 10 Mile 233,449 7,257,660 567 Drilling 57 -90 0 817 5,010 49,000 6,750 83,700 17,700
TMAC071 10 Mile 233,449 7,257,660 567 Drilling 67 -90 0 716 5,720 55,200 7,580 95,300 20,600
TMAC072 10 Mile 232,580 7,256,969 558 Drilling 51 -90 0 680 5,930 56,000 8,130 98,300 21,200
TMAC072 10 Mile 232,580 7,256,969 558 Drilling 69 -90 0 482 8,570 73,600 9,540 127,600 28,900
TMAC073 10 Mile 232,664 7,257,044 571 Drilling 51 -90 0 711 5,710 54,000 8,150 96,900 20,600
TMAC073 10 Mile 232,664 7,257,044 571 Drilling 63 -90 0 701 5,910 56,800 8,130 97,950 21,400
TMAC074 10 Mile 232,719 7,257,140 562 Drilling 56 -90 0 747 5,450 51,100 7,330 88,300 19,800
TMAC074 10 Mile 232,719 7,257,140 562 Drilling 63 -90 0 724 5,460 51,200 7,380 89,500 19,800
TMAC074 10 Mile 232,719 7,257,140 562 Drilling 69 -90 0 646 5,980 56,500 7,550 98,650 22,400
TMAC075 10 Mile 232,082 7,257,053 568 Drilling 54 -90 0 626 6,730 56,800 7,200 95,300 24,000
TMAC075 10 Mile 232,082 7,257,053 568 Drilling 66 -90 0 557 6,860 57,700 7,340 101,250 24,400
TMAC076 10 Mile 232,057 7,257,198 562 Drilling 55 -90 0 472 8,840 77,600 10,000 136,000 29,600
TMAC076 10 Mile 232,057 7,257,198 562 Drilling 60 -90 0 436 8,790 78,200 9,900 135,800 28,800
TMAC077 10 Mile 233,298 7,255,394 563 Drilling 56 -90 0 715 5,240 39,200 4,960 70,700 17,600
TMAC077 10 Mile 233,298 7,255,394 563 Drilling 61 -90 0 712 5,430 41,000 5,140 74,050 18,400
TMAC078a 10 Mile 232,870 7,255,294 558 Drilling 12 -90 0 795 5,770 50,000 6,740 90,300 19,100
TMAC078a 10 Mile 232,870 7,255,294 558 Drilling 36 -90 0 826 5,460 46,800 6,350 85,550 18,400
TMAC078a 10 Mile 232,870 7,255,294 558 Drilling 54 -90 0 829 5,610 49,100 6,550 87,500 19,200
TMAC078b 10 Mile 232,870 7,255,294 558 Drilling 6 -90 0 742 6,710 64,200 8,730 109,500 20,200
TMAC078b 10 Mile 232,870 7,255,294 558 Drilling 12 -90 0 551 8,200 79,200 10,900 137,200 23,200
TMAC078b 10 Mile 232,870 7,255,294 558 Drilling 16 -90 0 538 8,410 80,000 11,000 140,200 23,000

Beyondie Sulphate of Potash Project JORC (2012) and NI 43-101 Technical Report – 2018
Report2018_Final_20180917 156
Point Reference Location Easting Northing RL (m) Description Depth (m) Dip Azimuth
Assay
Ca Mg Na K Cl SO4
mg/L
TMAC079 10 Mile 233,918 7,255,679 569 Drilling 58 -90 0 887 4,040 29,400 3,430 51,500 14,900
TMAC079 10 Mile 233,918 7,255,679 569 Drilling 62 -90 0 713 4,250 30,700 3,590 54,650 15,000
TMAC080 10 Mile 233,992 7,255,533 569 Drilling 53 -90 0 693 4,080 29,200 3,360 51,650 14,700
TMAC080 10 Mile 233,992 7,255,533 569 Drilling 59 -90 0 659 5,500 40,600 4,310 71,250 21,100
TMAC081 10 Mile 235,130 7,257,211 565 Drilling 59 -90 0 204 1,070 10,300 1,540 18,750 3,390
TMAC081 10 Mile 235,130 7,257,211 565 Drilling 74 -90 0 394 4,970 43,700 5,820 76,350 17,200
TMAC082 10 Mile 235,509 7,257,560 574 Drilling 59 -90 0 166 920 9,210 1,440 16,500 2,910
TMAC082 10 Mile 235,509 7,257,560 574 Drilling 71 -90 0 174 930 9,230 1,440 16,100 2,940
TMAC083 10 Mile 236,016 7,258,036 579 Drilling 37 -90 0 111 960 8,510 1,170 15,150 3,390
TMAC083 10 Mile 236,016 7,258,036 579 Drilling 81 -90 0 116 1,060 10,300 1,510 17,750 3,570
TMAC083 10 Mile 236,016 7,258,036 579 Drilling 82 -90 0 102 875 8,490 1,280 14,750 2,880
TMAC084 10 Mile 236,895 7,258,664 574 Drilling 39 -90 0 66 315 2,940 330 4,600 1,440
TMAC085 10 Mile 236,897 7,258,489 576 Drilling 31 -90 0 38 130 1,570 290 2,700 480
TMAC086 10 Mile 236,887 7,258,814 581 Drilling 27 -90 0 8 30 790 120 1,100 300
TMAC086 10 Mile 236,887 7,258,814 581 Drilling 30 -90 0 21 55 560 110 850 240
TMAC087 10 Mile 236,440 7,259,824 571 Drilling 27 -90 0 34 40 320 50 550 120
TMAC087 10 Mile 236,440 7,259,824 571 Drilling 57 -90 0 108 455 4,180 520 7,150 1,740
TMAC087 10 Mile 236,440 7,259,824 571 Drilling 66 -90 0 91 340 2,850 340 4,850 1,140
TMAC087 10 Mile 236,440 7,259,824 571 Drilling 69 -90 0 122 480 3,580 410 6,300 1,500
TMAC088 10 Mile 235,789 7,256,956 571 Drilling 36 -90 0 142 820 9,010 1,220 14,300 3,060
TMAC088 10 Mile 235,789 7,256,956 571 Drilling 66 -90 0 400 5,200 46,600 5,540 77,100 19,100
TMAC088 10 Mile 235,789 7,256,956 571 Drilling 70 -90 0 450 6,110 54,600 6,490 89,200 21,900
TMAC089 10 Mile 233,177 7,257,963 560 Drilling 33 -90 0 733 5,510 50,600 6,830 87,100 20,100
TMAC089 10 Mile 233,177 7,257,963 560 Drilling 51 -90 0 754 5,420 50,400 6,620 85,400 20,100
TMAC089 10 Mile 233,177 7,257,963 560 Drilling 59 -90 0 761 5,190 48,800 6,230 80,200 19,600
TMAC090 10 Mile 233,099 7,258,086 561 Drilling 33 -90 0 716 5,360 49,700 6,580 84,100 20,000
TMAC090 10 Mile 233,099 7,258,086 561 Drilling 51 -90 0 733 5,390 49,200 6,580 84,500 20,200
TMAC090 10 Mile 233,099 7,258,086 561 Drilling 59 -90 0 721 5,120 44,900 6,130 78,700 18,800
TMAC091 10 Mile 233,079 7,258,222 563 Drilling 36 -90 0 713 5,400 49,500 6,560 84,300 20,300
TMAC091 10 Mile 233,079 7,258,222 563 Drilling 48 -90 0 697 5,460 49,900 6,640 84,100 20,300
TMAC091 10 Mile 233,079 7,258,222 563 Drilling 61 -90 0 698 5,510 50,600 6,600 83,800 20,000
TMAC091 10 Mile 233,079 7,258,222 563 Drilling 65 -90 0 688 5,340 49,500 6,590 83,800 19,700
TMAC092 10 Mile 233,896 7,257,855 557 Drilling 12 -90 0 703 5,630 58,300 9,180 106,000 19,000
TMAC092 10 Mile 233,896 7,257,855 557 Drilling 39 -90 0 724 5,500 59,200 9,110 105,000 18,700
TMAC092 10 Mile 233,896 7,257,855 557 Drilling 42 -90 0 790 4,770 49,200 7,020 85,400 15,600
TMAC092 10 Mile 233,896 7,257,855 557 Drilling 45 -90 0 714 5,570 61,300 9,180 105,000 18,700
TMAC092 10 Mile 233,896 7,257,855 557 Drilling 51 -90 0 732 5,330 56,600 8,810 101,000 18,200
TMAC092 10 Mile 233,896 7,257,855 557 Drilling 54 -90 0 683 5,150 55,000 8,280 95,200 17,600
TMAC092 10 Mile 233,896 7,257,855 557 Drilling 57 -90 0 707 5,070 55,000 8,280 95,800 17,500
TMAC092 10 Mile 233,896 7,257,855 557 Drilling 64 -90 0 702 5,060 53,200 8,150 93,100 17,000
TMAC093 10 Mile 233,759 7,257,611 556 Drilling 18 -90 0 809 5,050 51,000 7,500 90,700 16,800
TMAC093 10 Mile 233,759 7,257,611 556 Drilling 30 -90 0 785 4,750 47,700 7,020 85,400 16,200
TMAC093 10 Mile 233,759 7,257,611 556 Drilling 60 -90 0 781 4,730 48,600 7,060 83,800 16,100
TMAC093 10 Mile 233,759 7,257,611 556 Drilling 68 -90 0 621 5,940 56,800 8,150 101,000 20,800

Beyondie Sulphate of Potash Project JORC (2012) and NI 43-101 Technical Report – 2018
Report2018_Final_20180917 157
Point Reference Location Easting Northing RL (m) Description Depth (m) Dip Azimuth
Assay
Ca Mg Na K Cl SO4
mg/L
TMAC094 10 Mile 233,967 7,257,182 558 Drilling 33 -90 0 642 4,660 43,000 5,480 71,400 16,400
TMAC094 10 Mile 233,967 7,257,182 558 Drilling 51 -90 0 653 4,820 44,600 5,730 76,400 17,700
TMAC094 10 Mile 233,967 7,257,182 558 Drilling 63 -90 0 641 4,530 42,000 5,420 71,100 16,500
TMAC094 10 Mile 233,967 7,257,182 558 Drilling 69 -90 0 549 5,990 55,000 7,330 95,100 21,100
TMAC094 10 Mile 233,967 7,257,182 558 Drilling 75 -90 0 478 7,480 68,500 8,830 117,000 25,900
TMAC094 10 Mile 233,967 7,257,182 558 Drilling 84 -90 0 477 7,540 67,500 8,870 117,000 26,000
TMAC094 10 Mile 233,967 7,257,182 558 Drilling 86 -90 0 473 7,660 68,200 9,010 118,000 26,800
TMAC095 10 Mile 234,364 7,257,242 565 Drilling 53 -90 0 564 3,300 32,300 4,820 56,550 12,100
TMAC095 10 Mile 234,364 7,257,242 565 Drilling 69 -90 0 553 3,960 38,800 5,580 66,850 14,500
TMAC095 10 Mile 234,364 7,257,242 565 Drilling 72 -90 0 552 5,010 47,400 6,710 81,350 18,100
TMAC095 10 Mile 234,364 7,257,242 565 Drilling 73 -90 0 536 5,170 48,800 6,950 84,800 18,800
TMAC096 10 Mile 232,893 7,255,522 560 Drilling 36 -90 0 851 5,150 41,500 5,320 72,600 18,100
TMAC096 10 Mile 232,893 7,255,522 560 Drilling 43 -90 0 723 6,510 54,000 7,360 97,200 20,400
TMAC096 10 Mile 232,893 7,255,522 560 Drilling 54 -90 0 850 5,040 40,000 5,290 71,900 17,400
TMAC096 10 Mile 232,893 7,255,522 560 Drilling 58 -90 0 822 5,290 43,200 5,830 77,650 17,900
TMAC097 10 Mile 234,219 7,257,373 561 Drilling 21 -90 0 378 995 10,000 1,540 17,800 3,660
TMAC097 10 Mile 234,219 7,257,373 561 Drilling 30 -90 0 694 3,790 38,800 5,870 66,500 13,500
TMAC097 10 Mile 234,219 7,257,373 561 Drilling 39 -90 0 671 3,690 37,200 5,660 65,650 13,200
TMAC097 10 Mile 234,219 7,257,373 561 Drilling 48 -90 0 625 3,480 36,200 5,420 61,800 12,200
TMAC097 10 Mile 234,219 7,257,373 561 Drilling 57 -90 0 633 3,520 36,200 5,500 63,000 12,500
TMAC097 10 Mile 234,219 7,257,373 561 Drilling 66 -90 0 635 3,520 36,400 5,490 62,850 12,500
TMAC097 10 Mile 234,219 7,257,373 561 Drilling 72 -90 0 536 6,990 65,000 9,190 111,200 25,500
TMAC097 10 Mile 234,219 7,257,373 561 Drilling 79 -90 0 518 7,300 66,300 9,400 115,350 26,000
TMAC098 10 Mile 234,512 7,257,886 563 Drilling 34 -90 0 559 3,470 37,200 5,620 66,150 13,100
TMAC099 10 Mile 234,853 7,257,549 561 Drilling 18 -90 0 178 815 8,310 1,130 13,450 3,030
TMAC099 10 Mile 234,853 7,257,549 561 Drilling 30 -90 0 313 2,500 21,700 2,800 36,300 9,330
TMAC099 10 Mile 234,853 7,257,549 561 Drilling 42 -90 0 350 2,960 25,200 3,140 41,900 11,200
TMAC099 10 Mile 234,853 7,257,549 561 Drilling 54 -90 0 317 2,670 23,300 2,950 38,200 9,930
TMAC099 10 Mile 234,853 7,257,549 561 Drilling 63 -90 0 238 1,860 17,700 2,370 29,850 7,320
TMAC099 10 Mile 234,853 7,257,549 561 Drilling 72 -90 0 313 3,340 30,500 4,340 52,900 11,700
TMAC099 10 Mile 234,853 7,257,549 561 Drilling 78 -90 0 423 5,640 51,200 7,210 89,200 19,600
TMAC099 10 Mile 234,853 7,257,549 561 Drilling 81 -90 0 475 7,730 64,900 9,380 117,800 26,400
TMAC100 10 Mile 235,369 7,257,744 565 Drilling 21 -90 0 135 790 8,510 1,350 15,550 2,520
TMAC100 10 Mile 235,369 7,257,744 565 Drilling 30 -90 0 168 980 10,500 1,560 16,750 3,330
TMAC101 10 Mile 233,185 7,255,793 561 Drilling 24 -90 0 758 6,050 49,000 6,430 84,300 20,300
TMAC101 10 Mile 233,185 7,255,793 561 Drilling 36 -90 0 760 5,700 47,200 6,170 81,000 19,400
TMAC101 10 Mile 233,185 7,255,793 561 Drilling 45 -90 0 771 5,840 48,100 6,260 81,000 20,000
TMAC101 10 Mile 233,185 7,255,793 561 Drilling 54 -90 0 891 4,900 41,300 5,440 68,750 17,400
TMAC101 10 Mile 233,185 7,255,793 561 Drilling 60 -90 0 348 6,240 49,100 6,210 84,150 20,800
TMAC101 10 Mile 233,185 7,255,793 561 Drilling 63 -90 0 436 9,460 73,700 9,700 128,300 30,300
TMAC102 10 Mile 233,303 7,255,628 558 Drilling 53 -90 0 475 8,890 69,400 8,970 120,800 28,900
TMAC102 10 Mile 233,303 7,255,628 558 Drilling 57 -90 0 442 7,660 60,000 7,700 105,750 25,200
TMAC102 10 Mile 233,303 7,255,628 558 Drilling 69 -90 0 478 8,770 70,500 8,840 121,500 29,200
TMAC103 10 Mile 233,489 7,255,597 558 Drilling 27 -90 0 762 4,320 34,000 4,440 59,000 15,300

Beyondie Sulphate of Potash Project JORC (2012) and NI 43-101 Technical Report – 2018
Report2018_Final_20180917 158
Point Reference Location Easting Northing RL (m) Description Depth (m) Dip Azimuth
Assay
Ca Mg Na K Cl SO4
mg/L
TMAC103 10 Mile 233,489 7,255,597 558 Drilling 36 -90 0 736 4,230 33,300 4,260 57,050 15,300
TMAC103 10 Mile 233,489 7,255,597 558 Drilling 45 -90 0 736 3,990 31,600 4,130 54,100 14,500
TMAC103 10 Mile 233,489 7,255,597 558 Drilling 54 -90 0 711 3,990 31,900 4,110 55,350 14,400
TMAC103 10 Mile 233,489 7,255,597 558 Drilling 57 -90 0 725 4,030 32,100 4,180 54,300 15,200
TMAC103 10 Mile 233,489 7,255,597 558 Drilling 63 -90 0 660 5,260 41,500 5,350 72,250 18,600
TMAC103 10 Mile 233,489 7,255,597 558 Drilling 67 -90 0 641 5,720 45,000 5,820 78,200 19,600
TMAC104 10 Mile 233,215 7,254,356 569 Drilling 27 -90 0 608 7,430 70,000 9,290 118,700 23,400
TMAC104 10 Mile 233,215 7,254,356 569 Drilling 36 -90 0 644 7,010 66,000 8,780 112,600 22,400
TMAC104 10 Mile 233,215 7,254,356 569 Drilling 45 -90 0 632 7,260 68,500 9,020 113,800 23,300
TMAC104 10 Mile 233,215 7,254,356 569 Drilling 54 -90 0 604 7,180 65,300 9,040 114,850 22,700
TMAC104 10 Mile 233,215 7,254,356 569 Drilling 60 -90 0 539 8,070 70,200 9,430 121,300 25,400
TMAC105 10 Mile 233,514 7,255,223 570 Drilling 48 -90 0 924 3,900 33,000 4,460 58,450 14,300
TMAC105 10 Mile 233,514 7,255,223 570 Drilling 57 -90 0 990 3,790 34,000 4,300 57,050 13,900
TMAC105 10 Mile 233,514 7,255,223 570 Drilling 65 -90 0 978 3,900 35,200 4,440 59,500 14,300
TMAC106 10 Mile 233,651 7,254,433 567 Drilling 39 -90 0 682 4,300 36,700 4,710 63,350 14,800
TMAC106 10 Mile 233,651 7,254,433 567 Drilling 48 -90 0 683 6,980 57,100 7,510 97,050 22,400
TMAC106 10 Mile 233,651 7,254,433 567 Drilling 54 -90 0 617 7,430 60,200 8,190 106,100 24,400
TMAC107 10 Mile 233,785 7,254,077 567 Drilling 21 -90 0 932 4,530 39,600 5,010 67,200 16,200
TMAC107 10 Mile 233,785 7,254,077 567 Drilling 30 -90 0 931 4,460 39,400 4,970 67,900 16,100
TMAC107 10 Mile 233,785 7,254,077 567 Drilling 39 -90 0 930 4,560 39,500 5,100 68,250 16,400
TMAC107 10 Mile 233,785 7,254,077 567 Drilling 48 -90 0 698 6,500 52,200 6,770 90,250 21,900
TMAC107 10 Mile 233,785 7,254,077 567 Drilling 51 -90 0 688 6,720 52,500 6,980 93,050 23,200
TMAC108 10 Mile 233,885 7,253,028 567 Drilling 21 -90 0 946 3,600 29,100 3,580 48,350 13,500
TMAC108 10 Mile 233,885 7,253,028 567 Drilling 33 -90 0 1,000 3,270 26,600 3,340 45,550 12,500
TMAC108 10 Mile 233,885 7,253,028 567 Drilling 42 -90 0 898 4,030 31,000 3,960 53,950 15,200
TMAC108 10 Mile 233,885 7,253,028 567 Drilling 51 -90 0 907 3,830 28,900 3,820 52,350 14,300
TMAC108 10 Mile 233,885 7,253,028 567 Drilling 57 -90 0 884 4,230 31,600 4,180 59,700 15,500
TMAC108 10 Mile 233,885 7,253,028 567 Drilling 63 -90 0 897 4,220 32,400 4,260 57,050 15,500
TMAC109 10 Mile 233,831 7,252,726 567 Drilling 30 -90 0 959 3,390 26,500 3,420 47,450 12,800
TMAC109 10 Mile 233,831 7,252,726 567 Drilling 39 -90 0 958 3,320 26,400 3,370 45,900 12,500
TMAC109 10 Mile 233,831 7,252,726 567 Drilling 48 -90 0 950 3,300 25,700 3,360 46,450 12,500
TMAC109 10 Mile 233,831 7,252,726 567 Drilling 57 -90 0 946 3,300 25,700 3,340 46,450 12,400
TMAC109 10 Mile 233,831 7,252,726 567 Drilling 66 -90 0 956 3,250 25,900 3,280 45,200 12,200
TMAC109 10 Mile 233,831 7,252,726 567 Drilling 75 -90 0 934 3,230 25,900 3,310 45,750 12,300
TMAC110 10 Mile 234,789 7,256,052 584 Drilling 30 -90 0 325 2,730 17,600 2,070 29,850 10,600
TMAC110 10 Mile 234,789 7,256,052 584 Drilling 39 -90 0 280 2,200 15,500 1,850 25,150 8,490
TMAC110 10 Mile 234,789 7,256,052 584 Drilling 48 -90 0 268 2,120 15,000 1,810 24,800 8,040
TMAC110 10 Mile 234,789 7,256,052 584 Drilling 57 -90 0 280 2,320 16,000 1,890 26,200 8,880
TMAC110 10 Mile 234,789 7,256,052 584 Drilling 66 -90 0 298 2,450 16,300 1,970 27,600 9,420
TMAC110 10 Mile 234,789 7,256,052 584 Drilling 75 -90 0 439 6,390 48,900 6,020 86,200 25,100
TMAC110 10 Mile 234,789 7,256,052 584 Drilling 79 -90 0 432 6,300 50,100 5,940 86,550 24,900
TMAC111 10 Mile 235,568 7,256,813 575 Drilling 30 -90 0 127 600 6,950 980 11,350 2,250
TMAC111 10 Mile 235,568 7,256,813 575 Drilling 39 -90 0 131 790 8,530 1,150 13,600 3,060
TMAC111 10 Mile 235,568 7,256,813 575 Drilling 48 -90 0 120 665 7,240 1,040 10,800 2,550

Beyondie Sulphate of Potash Project JORC (2012) and NI 43-101 Technical Report – 2018
Report2018_Final_20180917 159
Point Reference Location Easting Northing RL (m) Description Depth (m) Dip Azimuth
Assay
Ca Mg Na K Cl SO4
mg/L
TMAC111 10 Mile 235,568 7,256,813 575 Drilling 57 -90 0 112 620 7,060 990 11,000 2,460
TMAC111 10 Mile 235,568 7,256,813 575 Drilling 66 -90 0 231 2,510 22,100 2,830 37,000 9,360
TMAC112 10 Mile 236,494 7,259,574 572 Drilling 18 -90 0 32 45 440 140 800 210
TMAC112 10 Mile 236,494 7,259,574 572 Drilling 27 -90 0 96 210 1,030 130 1,950 360
TMAC112 10 Mile 236,494 7,259,574 572 Drilling 36 -90 0 106 295 2,270 280 3,900 750
TMAC112 10 Mile 236,494 7,259,574 572 Drilling 48 -90 0 140 610 4,660 510 7,850 1,890
TMAC112 10 Mile 236,494 7,259,574 572 Drilling 57 -90 0 173 985 7,450 760 12,350 3,180
TMAC112 10 Mile 236,494 7,259,574 572 Drilling 62 -90 0 186 1,150 8,760 900 14,750 3,690
TMAC113 10 Mile 236,211 7,260,316 567 Drilling 24 -90 0 37 40 320 50 500 90
TMAC113 10 Mile 236,211 7,260,316 567 Drilling 33 -90 0 84 180 1,510 200 2,500 450
TMAC113 10 Mile 236,211 7,260,316 567 Drilling 42 -90 0 56 115 880 110 1,400 300
TMAC113 10 Mile 236,211 7,260,316 567 Drilling 51 -90 0 57 110 810 100 1,350 270
TMAC113 10 Mile 236,211 7,260,316 567 Drilling 58 -90 0 61 120 870 100 1,450 360
TMAC115 10 Mile 234,139 7,257,618 560 Drilling 15 -90 0 736 4,060 42,900 6,740 77,150 14,500
TMAC115 10 Mile 234,139 7,257,618 560 Drilling 48 -90 0 669 3,710 39,200 6,180 68,250 13,200
TMAC115 10 Mile 234,139 7,257,618 560 Drilling 57 -90 0 580 3,210 33,100 5,350 59,350 10,900
TMAC115 10 Mile 234,139 7,257,618 560 Drilling 63 -90 0 583 3,260 34,000 5,460 59,850 11,300
TMAC115 10 Mile 234,139 7,257,618 560 Drilling 66 -90 0 676 4,670 46,400 7,250 83,250 16,400
TMAC115 10 Mile 234,139 7,257,618 560 Drilling 72 -90 0 571 6,460 60,200 8,860 106,100 22,900
TMAC115 10 Mile 234,139 7,257,618 560 Drilling 76 -90 0 553 6,300 58,700 8,910 106,100 22,700
TMAC116 10 Mile 233,377 7,258,633 563 Drilling 15 -90 0 597 3,930 38,700 5,240 63,600 14,800
TMAC116 10 Mile 233,377 7,258,633 563 Drilling 27 -90 0 715 4,900 47,600 6,510 79,600 18,500
TMAC116 10 Mile 233,377 7,258,633 563 Drilling 36 -90 0 717 5,040 49,300 6,780 81,900 19,200
TMAC116 10 Mile 233,377 7,258,633 563 Drilling 48 -90 0 707 5,060 49,100 6,860 82,950 18,900
TMAC116 10 Mile 233,377 7,258,633 563 Drilling 57 -90 0 645 5,620 54,500 7,540 91,050 20,300
TMAC116 10 Mile 233,377 7,258,633 563 Drilling 63 -90 0 636 5,770 56,400 7,690 94,750 21,100
TMAC117 10 Mile 232,270 7,258,638 561 Drilling 21 -90 0 836 4,200 44,600 6,560 73,650 16,600
TMAC117 10 Mile 232,270 7,258,638 561 Drilling 39 -90 0 864 3,860 41,200 6,090 68,200 15,600
TMAC117 10 Mile 232,270 7,258,638 561 Drilling 48 -90 0 847 3,900 42,000 6,210 69,400 15,900
TMAC117 10 Mile 232,270 7,258,638 561 Drilling 57 -90 0 880 3,830 41,100 6,070 66,950 15,800
TMAC118 10 Mile 232,151 7,258,230 560 Drilling 30 -90 0 889 4,060 43,800 6,540 71,900 16,200
TMAC118 10 Mile 232,151 7,258,230 560 Drilling 39 -90 0 940 3,710 38,800 5,940 65,200 14,800
TMAC118 10 Mile 232,151 7,258,230 560 Drilling 48 -90 0 922 3,940 42,400 6,300 69,600 16,000
TMAC118 10 Mile 232,151 7,258,230 560 Drilling 54 -90 0 930 3,840 41,500 6,180 68,700 15,700
TMAC118 10 Mile 232,151 7,258,230 560 Drilling 70 -90 0 601 7,050 68,100 9,250 111,400 25,100
TMAC119 10 Mile 232,106 7,257,727 560 Drilling 9 -90 0 849 4,230 40,300 5,560 67,150 17,000
TMAC119 10 Mile 232,106 7,257,727 560 Drilling 18 -90 0 780 5,100 47,100 6,660 78,900 19,800
TMAC119 10 Mile 232,106 7,257,727 560 Drilling 27 -90 0 927 3,640 35,400 5,150 59,400 14,700
TMAC119 10 Mile 232,106 7,257,727 560 Drilling 36 -90 0 933 3,540 34,200 5,020 58,350 14,500
TMAC119 10 Mile 232,106 7,257,727 560 Drilling 45 -90 0 926 3,600 34,100 5,030 57,450 14,400
TMAC119 10 Mile 232,106 7,257,727 560 Drilling 54 -90 0 841 4,060 38,100 5,550 64,850 16,200
TMAC119 10 Mile 232,106 7,257,727 560 Drilling 65 -90 0 797 4,470 42,500 6,010 71,550 17,400
TMAC120 10 Mile 232,072 7,257,356 560 Drilling 12 -90 0 579 6,750 58,200 7,830 100,200 25,300
TMAC120 10 Mile 232,072 7,257,356 560 Drilling 45 -90 0 634 6,460 56,700 7,730 95,600 24,200

Beyondie Sulphate of Potash Project JORC (2012) and NI 43-101 Technical Report – 2018
Report2018_Final_20180917 160
Point Reference Location Easting Northing RL (m) Description Depth (m) Dip Azimuth
Assay
Ca Mg Na K Cl SO4
mg/L
TMAC120 10 Mile 232,072 7,257,356 560 Drilling 54 -90 0 507 7,180 64,100 8,550 106,350 26,600
TMAC120 10 Mile 232,072 7,257,356 560 Drilling 67 -90 0 463 8,040 72,100 9,610 122,150 28,300
TMAC121 10 Mile 232,070 7,257,494 560 Drilling 15 -90 0 598 6,460 57,700 7,800 96,300 24,500
TMAC121 10 Mile 232,070 7,257,494 560 Drilling 24 -90 0 643 5,660 50,700 6,930 85,750 22,100
TMAC121 10 Mile 232,070 7,257,494 560 Drilling 33 -90 0 509 6,570 58,300 8,060 100,200 24,800
TMAC121 10 Mile 232,070 7,257,494 560 Drilling 42 -90 0 550 6,390 57,400 7,810 97,900 24,200
TMAC121 10 Mile 232,070 7,257,494 560 Drilling 51 -90 0 553 6,450 58,000 7,850 97,000 23,900
TMAC121 10 Mile 232,070 7,257,494 560 Drilling 60 -90 0 491 7,450 66,600 9,020 114,250 27,200
TMAC121 10 Mile 232,070 7,257,494 560 Drilling 66 -90 0 508 7,150 64,000 8,730 110,700 25,800
TMAC122 10 Mile 231,295 7,258,994 560 Drilling 18 -90 0 670 5,840 56,900 8,400 95,950 24,200
TMAC122 10 Mile 231,295 7,258,994 560 Drilling 27 -90 0 781 4,840 49,200 7,100 79,450 20,300
TMAC122 10 Mile 231,295 7,258,994 560 Drilling 36 -90 0 713 5,480 53,300 7,830 90,000 22,600
TMAC122 10 Mile 231,295 7,258,994 560 Drilling 45 -90 0 690 5,260 53,600 7,640 85,950 22,100
TMAC122 10 Mile 231,295 7,258,994 560 Drilling 57 -90 0 652 5,570 53,900 7,910 91,050 22,200
TMAC122 10 Mile 231,295 7,258,994 560 Drilling 66 -90 0 671 5,470 53,400 7,810 89,300 22,100
TMAC122 10 Mile 231,295 7,258,994 560 Drilling 81 -90 0 660 5,510 54,800 8,000 91,400 22,800
TMAC122 10 Mile 231,295 7,258,994 560 Drilling 93 -90 0 716 5,450 53,500 7,800 89,650 22,100
TMAC123 10 Mile 231,403 7,259,277 560 Drilling 30 -90 0 760 5,190 49,200 6,770 80,150 21,700
TMAC123 10 Mile 231,403 7,259,277 560 Drilling 51 -90 0 611 5,410 51,300 7,090 84,000 21,500
TMAC124 10 Mile 229,145 7,259,074 560 Drilling 18 -90 0 626 5,300 52,000 7,560 88,050 21,400
TMAC124 10 Mile 229,145 7,259,074 560 Drilling 30 -90 0 598 5,470 53,800 7,670 88,600 22,000
TMAC124 10 Mile 229,145 7,259,074 560 Drilling 43 -90 0 589 5,440 53,600 7,690 90,850 22,400
TMAC124 10 Mile 229,145 7,259,074 560 Drilling 51 -90 0 594 5,460 53,300 7,680 89,800 22,600
TMAC124 10 Mile 229,145 7,259,074 560 Drilling 60 -90 0 569 5,600 54,700 7,840 91,400 22,600
TMAC125 10 Mile 228,869 7,258,856 560 Drilling 9 -90 0 567 5,520 52,100 7,040 88,050 19,900
TMAC125 10 Mile 228,869 7,258,856 560 Drilling 18 -90 0 498 5,960 56,600 7,960 94,050 24,500
TMAC125 10 Mile 228,869 7,258,856 560 Drilling 30 -90 0 525 6,010 56,600 7,850 94,550 23,600
TMAC125 10 Mile 228,869 7,258,856 560 Drilling 39 -90 0 554 5,670 53,100 7,300 90,500 21,100
TMAC125 10 Mile 228,869 7,258,856 560 Drilling 60 -90 0 550 5,880 54,000 7,550 92,250 22,300
TMAC126 10 Mile 232,991 7,259,949 564 Drilling 18 -90 0 431 3,340 30,000 3,700 49,200 12,800
TMAC126 10 Mile 232,991 7,259,949 564 Drilling 39 -90 0 337 2,790 25,600 3,200 42,000 10,500
TMAC126 10 Mile 232,991 7,259,949 564 Drilling 57 -90 0 336 2,730 25,000 3,120 41,300 10,300
TMAC126 10 Mile 232,991 7,259,949 564 Drilling 70 -90 0 419 3,860 34,800 4,460 60,650 14,000
TMAC127 10 Mile 258,721 7,275,738 564 Drilling 24 -90 0 420 3,470 28,900 3,180 46,800 13,900
TMAC127 10 Mile 258,721 7,275,738 564 Drilling 48 -90 0 407 3,490 28,700 3,310 47,800 13,900
TMAC127 10 Mile 258,721 7,275,738 564 Drilling 63 -90 0 460 4,510 40,500 4,810 66,150 17,100

Beyondie Sulphate of Potash Project JORC (2012) and NI 43-101 Technical Report – 2018
Report2018_Final_20180917 161
APPENDIX 3: AUGER HOLE ASSAYS AND DETAILS
Lake Point Reference Easting Northing RL (m) Data Source Sample
Date Dip Azimuth
Down Hole
Width (m)
Depth (m)
Assay
Ca Mg Na K Cl SO4
mg/L
10 Mile B1 230,925 7,255,738 563 2015_Auger 2015 -90 0 0.25 <1.5m 699 7,180 57,800 7,660 120,000 21,504
10 Mile B2 233,648 7,257,946 563 2015_Auger 2015 -90 0 0.25 <1.5m 1,080 2,470 32,100 5,380 56,100 11,441
10 Mile 32 230,000 7,258,500 563 2015_Auger 2015 -90 0 0.25 <1.5m 785 4,390 46,700 7,470 79,500 19,677
10 Mile 33 231,000 7,259,500 565 2015_Auger 2015 -90 0 0.25 <1.5m 816 4,010 36,700 5,310 63,300 18,509
10 Mile 34 231,000 7,258,500 561 2015_Auger 2015 -90 0 0.25 <1.5m 776 4,490 48,400 8,450 84,400 19,827
10 Mile 35 231,000 7,257,500 562 2015_Auger 2015 -90 0 0.25 <1.5m 463 6,730 73,000 11,000 133,000 26,745
10 Mile 36 231,000 7,256,500 562 2015_Auger 2015 -90 0 0.25 <1.5m 513 6,750 70,800 10,650 127,000 26,431
10 Mile 43 232,000 7,259,500 564 2015_Auger 2015 -90 0 0.25 <1.5m 936 4,100 45,100 7,400 84,000 15,904
10 Mile 44 232,000 7,258,500 563 2015_Auger 2015 -90 0 0.25 <1.5m 839 3,880 40,000 6,240 68,500 17,072
10 Mile 45 232,000 7,257,500 563 2015_Auger 2015 -90 0 0.25 <1.5m 1,000 2,820 31,300 4,920 53,400 12,579
10 Mile 46 232,000 7,256,500 561 2015_Auger 2015 -90 0 0.25 <1.5m 537 7,650 67,200 10,000 125,000 24,889
10 Mile 47 232,000 7,255,500 564 2015_Auger 2015 -90 0 0.25 <1.5m 832 5,180 39,100 5,200 68,400 18,958
10 Mile 51 232,000 7,251,500 564 2015_Auger 2015 -90 0 0.25 <1.5m 932 3,070 25,200 3,520 43,300 14,077
10 Mile 60 233,000 7,256,500 563 2015_Auger 2015 -90 0 0.25 <1.5m 860 4,390 37,700 4,900 63,500 16,742
10 Mile 61 233,000 7,255,500 563 2015_Auger 2015 -90 0 0.25 <1.5m 853 5,090 44,200 5,880 78,800 17,161
10 Mile 62 233,000 7,254,500 563 2015_Auger 2015 -90 0 0.25 <1.5m 877 4,870 46,300 6,560 82,300 16,413
10 Mile TML1 223,799 7,259,792 561 2015_Auger 2015 -90 0 0.25 <1.5m 457 7,967 73,701 11,392 132,800 32,850
10 Mile TMBH 1 226,025 7,255,591 560 2015_Auger 2015 -90 0 0.25 <1.5m 600 2,660 21,600 2,910 35,600 11,084
10 Mile TMBH 2 228,521 7,257,319 561 2015_Auger 2015 -90 0 0.25 <1.5m 635 2,660 21,700 2,930 34,800 11,714
10 Mile TME 233,050 7,252,797 565 2015_Auger 2015 -90 0 0.25 <1.5m 480 9,300 75,400 10,400 147,000 24,026
10 Mile TMW 222,778 7,253,100 565 2015_Auger 2015 -90 0 0.25 <1.5m 415 8,760 79,500 12,800 144,000 36,848
10 Mile H7 230,375 7,259,340 564 2015_Auger 2015 -90 0 0.25 <1.5m 903 2,790 29,400 4,530 49,300 13,777
Aerodrome 1 Auger Aerodrome 1 380,000 7,272,500 475 2017_Auger 2017 -90 0 0.25 2 544 6,950 75,300 8,320 133,500 22,600
Aerodrome 2 Auger Aerodrome 2 384,000 7,275,500 476 2017_Auger 2017 -90 0 0.25 2 654 7,000 71,600 7,710 131,950 17,700
Aerodrome 3 Auger Aerodrome 3 377,000 7,277,500 476 2017_Auger 2017 -90 0 0.25 2 652 7,000 71,400 7,690 132,450 17,400
Aerodrome North 4 Auger Aerodrome North 4 370,000 7,285,500 479 2017_Auger 2017 -90 0 0.25 2 1,150 7,760 47,800 6,000 96,550 12,600
Aerodrome A1 378,955 7,276,704 473 2015_Auger 2015 -90 0 0.25 <1.5m 439 8,610 82,300 7,960 138,000 26,326
Aerodrome A2 377,806 7,275,416 474 2015_Auger 2015 -90 0 0.25 <1.5m 480 8,590 88,200 8,420 148,000 23,511
Aerodrome 506 375,378 7,279,311 473 2015_Auger 2015 -90 0 0.25 <1.5m 398 8,270 76,200 9,075 136,000 21,923
Aerodrome 508 376,000 7,278,500 473 2015_Auger 2015 -90 0 0.25 <1.5m 453 8,500 85,300 9,220 153,000 23,271
Aerodrome 508 (1) 376,000 7,278,500 473 2015_Auger 2015 -90 0 0.25 <1.5m 459 8,620 84,300 9,280 151,000 22,762
Aerodrome 513 376,842 7,278,311 473 2015_Auger 2015 -90 0 0.25 <1.5m 498 7,710 82,500 7,580 143,000 21,594
Aerodrome 514 377,000 7,277,500 476 2015_Auger 2015 -90 0 0.25 <1.5m 461 8,610 86,100 9,130 154,000 22,043
Aerodrome 519 377,284 7,276,752 479 2015_Auger 2015 -90 0 0.25 <1.5m 553 6,515 78,300 8,795 135,000 20,156
Aerodrome 520 378,000 7,277,500 473 2015_Auger 2015 -90 0 0.25 <1.5m 458 7,590 83,900 7,640 149,000 22,522
Aerodrome 527 379,000 7,275,500 478 2015_Auger 2015 -90 0 0.25 <1.5m 720 6,000 63,500 6,740 113,000 17,431
Aerodrome 528 379,000 7,274,500 475 2015_Auger 2015 -90 0 0.25 <1.5m 431 7,870 81,600 8,510 149,000 23,301
Aerodrome 529 379,000 7,273,500 481 2015_Auger 2015 -90 0 0.25 <1.5m 401 8,720 83,500 9,060 157,000 23,601
Aerodrome
530 379,158 7,272,500 479 2015_Auger 2015 -90 0 0.25 <1.5m 370 8,190 88,200 10,300 161,000 25,757

Beyondie Sulphate of Potash Project JORC (2012) and NI 43-101 Technical Report – 2018
Report2018_Final_20180917 162
Lake Point Reference Easting Northing RL (m) Data Source Sample
Date Dip Azimuth
Down Hole
Width (m)
Depth (m)
Assay
Ca Mg Na K Cl SO4
mg/L
Aerodrome 531 379,189 7,271,563 481 2015_Auger 2015 -90 0 0.25 <1.5m 561 7,000 71,800 7,820 128,000 20,875
Aerodrome 532 379,653 7,276,248 477 2015_Auger 2015 -90 0 0.25 <1.5m 390 9,580 84,100 8,260 150,000 27,494
Aerodrome 533 380,000 7,275,500 474 2015_Auger 2015 -90 0 0.25 <1.5m 415 9,730 82,500 7,660 147,000 26,236
Aerodrome 534 380,000 7,274,500 475 2015_Auger 2015 -90 0 0.25 <1.5m 916 5,390 47,600 4,370 81,500 15,544
Aerodrome 535 380,000 7,273,500 475 2015_Auger 2015 -90 0 0.25 <1.5m 535 7,050 78,000 7,910 135,000 20,935
Aerodrome 536 380,000 7,272,500 475 2015_Auger 2015 -90 0 0.25 <1.5m 578 6,410 73,600 7,620 126,000 21,444
Aerodrome 538 380,000 7,271,099 473 2015_Auger 2015 -90 0 0.25 <1.5m 456 8,515 83,150 8,000 147,000 24,290
Aerodrome 540 381,095 7,274,996 478 2015_Auger 2015 -90 0 0.25 <1.5m 1,050 4,070 40,100 3,740 68,400 12,369
Aerodrome 541 381,000 7,274,500 478 2015_Auger 2015 -90 0 0.25 <1.5m 667 5,880 70,000 7,460 116,000 20,097
Aerodrome 542 (1) 381,000 7,273,500 477 2015_Auger 2015 -90 0 0.25 <1.5m 567 5,220 75,100 7,670 125,000 22,313
Aerodrome 542 381,000 7,273,500 477 2015_Auger 2015 -90 0 0.25 <1.5m 554 5,100 75,900 7,740 125,000 22,223
Aerodrome 543 381,000 7,272,500 477 2015_Auger 2015 -90 0 0.25 <1.5m 588 6,760 79,500 8,200 132,000 21,564
Aerodrome 544 381,000 7,271,500 474 2015_Auger 2015 -90 0 0.25 <1.5m 676 7,020 68,200 6,920 117,000 19,228
Aerodrome 546 382,000 7,275,500 477 2015_Auger 2015 -90 0 0.25 <1.5m 717 6,840 68,300 6,680 117,000 19,408
Aerodrome 546 (1) 382,000 7,275,500 477 2015_Auger 2015 -90 0 0.25 <1.5m 695 6,880 69,300 6,750 118,000 19,003
Aerodrome 547 382,000 7,274,500 477 2015_Auger 2015 -90 0 0.25 <1.5m 663 6,230 69,900 7,830 117,000 20,546
Aerodrome 548 382,000 7,273,500 477 2015_Auger 2015 -90 0 0.25 <1.5m 631 5,720 73,200 7,370 123,000 19,737
Aerodrome 549 381,874 7,272,595 477 2015_Auger 2015 -90 0 0.25 <1.5m 778 7,230 64,400 5,820 112,000 17,251
Aerodrome 550 381,527 7,271,878 478 2015_Auger 2015 -90 0 0.25 <1.5m 794 5,580 48,900 4,230 81,700 17,311
Aerodrome 552 383,000 7,275,500 476 2015_Auger 2015 -90 0 0.25 <1.5m 631 6,520 73,700 7,760 125,000 20,815
Aerodrome 553 383,000 7,274,500 476 2015_Auger 2015 -90 0 0.25 <1.5m 651 6,220 72,700 7,850 126,000 18,869
Aerodrome 557 384,000 7,275,500 474 2015_Auger 2015 -90 0 0.25 <1.5m 529 9,320 83,400 7,840 144,000 22,103
Aerodrome 559 383,685 7,273,658 475 2015_Auger 2015 -90 0 0.25 <1.5m 410 9,640 78,600 8,890 137,000 21,923
Aerodrome A 381,187 7,273,011 476 2015_Auger 2015 -90 0 0.25 <1.5m 564 6,690 71,600 7,880 133,000 21,660
Aerodrome (NW) A3 370,281 7,286,454 483 2015_Auger 2015 -90 0 0.25 <1.5m 1,290 5,480 33,200 3,880 64,800 10,243
Aerodrome (NW) A4 370,831 7,286,573 485 2015_Auger 2015 -90 0 0.25 <1.5m 1,070 5,800 37,500 4,530 72,600 11,531
Aerodrome (NW) 461 368,000 7,286,500 485 2015_Auger 2015 -90 0 0.25 <1.5m 1,100 6,470 39,100 4,420 80,800 11,890
Aerodrome (NW) 467 369,000 7,285,500 483 2015_Auger 2015 -90 0 0.25 <1.5m 1,160 6,570 42,900 5,210 87,800 11,381
Aerodrome (NW) 467 (1) 369,000 7,285,500 483 2015_Auger 2015 -90 0 0.25 <1.5m 1,170 6,640 43,800 5,320 89,000 11,531
Aerodrome (NW) 468 369,347 7,285,288 483 2015_Auger 2015 -90 0 0.25 <1.5m 1,360 5,500 37,300 4,330 74,500 10,093
Aerodrome (NW) 469 369,000 7,286,500 485 2015_Auger 2015 -90 0 0.25 <1.5m 1,200 5,710 38,000 4,610 74,000 11,052
Aerodrome (NW) 471 370,701 7,284,847 484 2015_Auger 2015 -90 0 0.25 <1.5m 1,230 5,890 40,200 4,650 78,200 10,752
Aerodrome (NW) 479 370,000 7,285,500 483 2015_Auger 2015 -90 0 0.25 <1.5m 1,240 6,050 37,700 4,640 74,800 10,692
Aerodrome (NW) 480 370,063 7,284,847 484 2015_Auger 2015 -90 0 0.25 <1.5m 1,220 5,900 40,300 4,860 77,600 11,231
Aerodrome (NW) 488 370,496 7,287,689 484 2015_Auger 2015 -90 0 0.25 <1.5m 1,360 4,750 28,300 3,340 57,100 9,105
Aerodrome (NW) 490 371,000 7,285,500 483 2015_Auger 2015 -90 0 0.25 <1.5m 1,270 5,640 37,500 4,490 71,700 10,572
Aerodrome (NW) 491 371,284 7,285,067 484 2015_Auger 2015 -90 0 0.25 <1.5m 1,160 5,430 36,800 4,060 68,900 11,800
Beyondie B3 226,163 7,260,513 563 2015_Auger 2015 -90 0 0.25 <1.5m 604 2,070 20,700 3,140 33,500 10,662
Beyondie B4 223,939 7,260,371 563 2015_Auger 2015 -90 0 0.25 <1.5m 1,020 2,950 26,200 3,530 47,400 11,351
Beyondie B5 226,314 7,259,540 563 2015_Auger 2015 -90 0 0.25 <1.5m 959 2,920 30,400 4,620 52,300 13,088
Beyondie B6 227,558 7,259,135 562 2015_Auger 2015 -90 0 0.25 <1.5m 969 713 7,590 1,180 12,500 4,762
Beyondie 11 225,000 7,259,500 563 2015_Auger 2015 -90 0 0.25 <1.5m 790 2,510 25,400 3,700 32,700 12,010

Beyondie Sulphate of Potash Project JORC (2012) and NI 43-101 Technical Report – 2018
Report2018_Final_20180917 163
Lake Point Reference Easting Northing RL (m) Data Source Sample
Date Dip Azimuth
Down Hole
Width (m)
Depth (m)
Assay
Ca Mg Na K Cl SO4
mg/L
Beyondie 11 (1) 225,000 7,259,500 563 2015_Auger 2015 -90 0 0.25 <1.5m 747 2,220 23,100 3,360 38,800 10,812
Beyondie 23 228,000 7,261,500 566 2015_Auger 2015 -90 0 0.25 <1.5m 862 3,940 40,100 6,020 73,600 16,862
Beyondie BL2 223,597 7,258,770 561 2015_Auger 2015 -90 0 0.25 <1.5m 510 6,740 69,800 10,100 123,000 23,966
Beyondie BL1 224,311 7,259,754 561 2015_Auger 2015 -90 0 0.25 <1.5m 567 7,741 66,291 8,882 108,300 29,189
Beyondie Stream BS1 217,112 7,257,953 565 2015_Auger 2015 -90 0 0.25 <1.5m 880 2,225 21,950 3,130 40,050 7,310
Beyondie/10 Mile N2 232,811 7,251,800 563 2015_Auger 2015 -90 0 0.25 <1.5m 959 2,830 28,200 4,100 46,600 12,789
Beyondie/10 Mile N4 224,317 7,258,591 563 2015_Auger 2015 -90 0 0.25 <1.5m 906 3,800 35,700 4,980 59,800 15,993
Beyondie/10 Mile N6 228,003 7,261,488 565 2015_Auger 2015 -90 0 0.25 <1.5m 870 4,000 43,500 6,240 73,500 17,012
Beyondie/10 Mile N7 233,000 7,253,500 562 2015_Auger 2015 -90 0 0.25 <1.5m 861 4,560 41,500 5,570 71,900 16,712
Central (E) EC1 357,345 7,270,169 480 2015_Auger 2015 -90 0 0.25 <1.5m 807 7,070 39,500 5,400 73,000 20,785
Central (E) 425 354,473 7,281,618 478 2015_Auger 2015 -90 0 0.25 <1.5m 322 10,500 79,800 10,900 141,000 39,534
Central (E) 426 354,284 7,281,217 477 2015_Auger 2015 -90 0 0.25 <1.5m 337 8,520 78,200 11,300 131,000 44,326
Central (E) 427 354,630 7,280,847 477 2015_Auger 2015 -90 0 0.25 <1.5m 472 9,940 66,200 8,350 120,000 29,052
Central (E) 429 353,937 7,278,666 478 2015_Auger 2015 -90 0 0.25 <1.5m 803 3,920 22,400 2,630 40,200 12,729
Central (E) 430 354,315 7,277,351 479 2015_Auger 2015 -90 0 0.25 <1.5m 791 6,220 37,800 4,500 68,400 18,449
Central (E) 430 (1) 354,315 7,277,351 479 2015_Auger 2015 -90 0 0.25 <1.5m 800 6,290 37,600 4,500 67,900 19,018
Central (E) 431 354,630 7,279,690 480 2015_Auger 2015 -90 0 0.25 <1.5m 696 6,040 51,400 8,300 93,900 21,894
Central (E) 434 357,575 7,271,067 481 2015_Auger 2015 -90 0 0.25 <1.5m 851 5,780 33,300 4,700 63,300 16,622
Central (E) 436 352,913 7,277,918 480 2015_Auger 2015 -90 0 0.25 <1.5m 800 4,880 29,500 2,980 52,000 17,311
Central (E) 442 358,284 7,271,193 482 2015_Auger 2015 -90 0 0.25 <1.5m 789 6,230 37,500 5,200 67,900 19,498
Central (E) 443 359,000 7,270,500 481 2015_Auger 2015 -90 0 0.25 <1.5m 629 7,365 46,600 7,620 86,900 25,592
Central (E) 443 (1) 359,000 7,270,500 481 2015_Auger 2015 -90 0 0.25 <1.5m 627 7,350 47,200 7,630 87,900 25,038
Central (N) PC6 335,180 7,292,778 475 2015_Auger 2015 -90 0 0.25 <1.5m 463 12,000 74,400 10,100 155,000 25,554
Central (S) PC8 336,052 7,281,468 476 2015_Auger 2015 -90 0 0.25 <1.5m 621 9,710 82,400 5,400 163,000 15,518
Central (W) WC1 335,403 7,281,884 476 2015_Auger 2015 -90 0 0.25 <1.5m 1,220 4,750 31,700 2,570 59,100 10,902
Central (W) WC2 336,869 7,282,657 476 2015_Auger 2015 -90 0 0.25 <1.5m 387 12,000 93,700 6,360 173,000 20,965
Central (W) WC3 334,065 7,292,685 477 2015_Auger 2015 -90 0 0.25 <1.5m 1,030 3,840 25,000 3,770 44,700 12,429
Central (W) WC4 335,913 7,293,437 478 2015_Auger 2015 -90 0 0.25 <1.5m 640 7,380 49,300 6,260 93,700 16,892
Central (W) WC5 337,097 7,291,603 478 2015_Auger 2015 -90 0 0.25 <1.5m 1,880 5,780 32,900 4,310 70,400 6,679
Central (W) WC6 336,861 7,290,535 476 2015_Auger 2015 -90 0 0.25 <1.5m 1,310 2,880 17,400 2,240 34,600 6,020
Central (W) WC7 339,841 7,280,505 477 2015_Auger 2015 -90 0 0.25 <1.5m 386 14,800 83,500 6,820 166,000 23,870
Central (W) 319 329,000 7,282,500 477 2015_Auger 2015 -90 0 0.25 <1.5m 1,010 1,440 8,590 1,330 16,200 5,541
Central (W) 320 (1) 328,811 7,281,847 476 2015_Auger 2015 -90 0 0.25 <1.5m 1,040 1,560 10,700 1,300 20,000 5,900
Central (W) 320 328,811 7,281,847 476 2015_Auger 2015 -90 0 0.25 <1.5m 1,030 1,570 10,800 1,290 20,000 6,080
Central (W) 321 329,401 7,284,807 475 2015_Auger 2015 -90 0 0.25 <1.5m 980 1,500 10,300 1,420 18,000 6,319
Central (W) 323 330,000 7,283,500 475 2015_Auger 2015 -90 0 0.25 <1.5m 1,085 3,400 20,650 3,175 42,300 9,419
Central (W) 324 330,000 7,282,500 476 2015_Auger 2015 -90 0 0.25 <1.5m 1,100 3,300 21,300 2,910 40,800 9,404
Central (W) 325 330,622 7,284,902 477 2015_Auger 2015 -90 0 0.25 <1.5m 966 4,950 29,100 3,780 56,500 13,178
Central (W) 325 (1) 330,622 7,284,902 477 2015_Auger 2015 -90 0 0.25 <1.5m 961 5,110 29,000 3,820 56,700 13,418
Central (W) 327 331,000 7,283,500 475 2015_Auger 2015 -90 0 0.25 <1.5m 898 6,150 40,500 5,760 80,700 14,705
Central (W) 328 330,779 7,283,067 475 2015_Auger 2015 -90 0 0.25 <1.5m 999 5,510 34,700 4,850 68,500 13,148
Central (W) 329 332,347 7,284,839 475 2015_Auger 2015 -90 0 0.25 <1.5m 812 6,940 41,700 5,420 82,600 16,682

Beyondie Sulphate of Potash Project JORC (2012) and NI 43-101 Technical Report – 2018
Report2018_Final_20180917 164
Lake Point Reference Easting Northing RL (m) Data Source Sample
Date Dip Azimuth
Down Hole
Width (m)
Depth (m)
Assay
Ca Mg Na K Cl SO4
mg/L
Central (W) 330 332,000 7,284,500 474 2015_Auger 2015 -90 0 0.25 <1.5m 665 7,500 49,900 7,070 98,600 20,486
Central (W) 331 332,000 7,283,500 475 2015_Auger 2015 -90 0 0.25 <1.5m 966 5,050 32,200 4,470 66,400 12,819
Central (W) 332 340,412 7,294,346 479 2015_Auger 2015 -90 0 0.25 <1.5m 1,580 2,180 11,700 1,610 26,600 4,253
Central (W) 332 (1) 340,412 7,294,346 479 2015_Auger 2015 -90 0 0.25 <1.5m 1,550 2,150 11,600 1,580 26,600 4,103
Central (W) 333 333,063 7,285,217 475 2015_Auger 2015 -90 0 0.25 <1.5m 773 5,550 37,200 4,800 74,600 16,802
Central (W) 334 333,000 7,284,500 475 2015_Auger 2015 -90 0 0.25 <1.5m 890 5,090 31,900 4,730 65,100 13,987
Central (W) 335 333,000 7,283,500 475 2015_Auger 2015 -90 0 0.25 <1.5m 1,010 5,270 34,900 4,720 69,100 12,669
Central (W) 338 333,158 7,283,036 474 2015_Auger 2015 -90 0 0.25 <1.5m 917 4,640 29,200 3,560 57,300 13,328
Central (W) 339 334,126 7,285,185 474 2015_Auger 2015 -90 0 0.25 <1.5m 722 5,830 42,500 5,780 85,400 17,730
Central (W) 340 334,000 7,284,500 476 2015_Auger 2015 -90 0 0.25 <1.5m 930 4,650 36,800 5,810 73,400 12,968
Central (W) 341 334,000 7,283,500 476 2015_Auger 2015 -90 0 0.25 <1.5m 1,110 4,490 32,500 3,990 67,800 10,992
Central (W) 342 (1) 334,000 7,293,500 479 2015_Auger 2015 -90 0 0.25 <1.5m 1,070 4,180 28,300 3,830 56,100 11,591
Central (W) 342 334,000 7,293,500 479 2015_Auger 2015 -90 0 0.25 <1.5m 1,080 4,210 28,800 3,840 56,200 11,740
Central (W) 344 340,333 7,293,548 477 2015_Auger 2015 -90 0 0.25 <1.5m 1,570 2,480 11,700 1,400 26,800 4,582
Central (W) 345 334,252 7,282,784 475 2015_Auger 2015 -90 0 0.25 <1.5m 908 6,150 40,100 4,600 78,300 16,023
Central (W) 346 335,000 7,285,500 477 2015_Auger 2015 -90 0 0.25 <1.5m 1,100 4,230 32,400 4,730 61,200 12,160
Central (W) 347 335,000 7,284,500 476 2015_Auger 2015 -90 0 0.25 <1.5m 1,240 3,580 25,100 2,770 48,600 9,584
Central (W) 347 (1) 335,000 7,284,500 476 2015_Auger 2015 -90 0 0.25 <1.5m 1,230 3,540 25,300 2,750 48,300 9,524
Central (W) 348 335,000 7,283,500 475 2015_Auger 2015 -90 0 0.25 <1.5m 550 9,610 76,500 6,640 146,000 19,378
Central (W) 349 335,315 7,282,689 475 2015_Auger 2015 -90 0 0.25 <1.5m 1,080 7,740 48,000 4,280 95,700 13,238
Central (W) 351 335,819 7,281,036 475 2015_Auger 2015 -90 0 0.25 <1.5m 690 8,990 80,900 5,090 153,000 15,185
Central (W) 352 335,000 7,293,500 477 2015_Auger 2015 -90 0 0.25 <1.5m 636 11,200 62,700 7,790 125,000 22,822
Central (W) 353 335,000 7,292,500 475 2015_Auger 2015 -90 0 0.25 <1.5m 416 12,600 80,200 11,200 155,000 27,075
Central (W) 354 335,032 7,291,752 474 2015_Auger 2015 -90 0 0.25 <1.5m 468 10,200 74,200 10,100 137,000 29,830
Central (W) 356 336,000 7,292,500 474 2015_Auger 2015 -90 0 0.25 <1.5m 545 13,100 81,800 12,600 163,000 19,378
Central (W) 357 336,000 7,291,500 474 2015_Auger 2015 -90 0 0.25 <1.5m 1,600 6,710 44,600 5,870 89,000 8,596
Central (W) 358 336,000 7,290,500 476 2015_Auger 2015 -90 0 0.25 <1.5m 660 2,230 15,100 2,030 28,100 5,361
Central (W) 359 336,819 7,290,004 475 2015_Auger 2015 -90 0 0.25 <1.5m 1,320 6,740 38,500 4,780 75,600 11,141
Central (W) 360 336,630 7,288,847 475 2015_Auger 2015 -90 0 0.25 <1.5m 636 12,200 76,600 10,000 153,000 17,341
Central (W) 361 336,158 7,287,343 476 2015_Auger 2015 -90 0 0.25 <1.5m 873 8,250 58,600 7,040 115,000 15,754
Central (W) 362 336,189 7,286,185 474 2015_Auger 2015 -90 0 0.25 <1.5m 1,070 5,195 40,000 5,215 73,400 14,286
Central (W) 363 336,000 7,285,500 475 2015_Auger 2015 -90 0 0.25 <1.5m 1,210 3,930 33,700 4,100 58,000 12,369
Central (W) 364 336,000 7,284,500 475 2015_Auger 2015 -90 0 0.25 <1.5m 1,250 5,720 40,400 3,410 73,500 12,354
Central (W) 365 336,000 7,283,500 475 2015_Auger 2015 -90 0 0.25 <1.5m 731 13,100 64,600 5,790 128,000 19,917
Central (W) 366 336,000 7,282,500 473 2015_Auger 2015 -90 0 0.25 <1.5m 452 13,400 98,900 7,240 178,000 21,894
Central (W) 367 336,000 7,281,500 475 2015_Auger 2015 -90 0 0.25 <1.5m 714 9,220 84,600 5,440 152,000 16,293
Central (W) 368 336,000 7,280,500 474 2015_Auger 2015 -90 0 0.25 <1.5m 330 17,100 90,900 7,690 181,000 24,799
Central (W) 370 337,000 7,289,500 476 2015_Auger 2015 -90 0 0.25 <1.5m 622 10,600 74,100 9,020 146,000 17,102
Central (W) 371 337,000 7,288,500 474 2015_Auger 2015 -90 0 0.25 <1.5m 554 13,750 80,850 9,835 170,000 15,559
Central (W) 372 337,000 7,287,500 477 2015_Auger 2015 -90 0 0.25 <1.5m 700 13,100 71,700 10,200 153,000 13,987
Central (W) 373 336,779 7,286,343 475 2015_Auger 2015 -90 0 0.25 <1.5m 1,030 7,950 42,800 4,410 86,500 13,807
Central (W) 374 337,000 7,285,500 475 2015_Auger 2015 -90 0 0.25 <1.5m 723 8,580 59,200 6,390 115,000 17,850

Beyondie Sulphate of Potash Project JORC (2012) and NI 43-101 Technical Report – 2018
Report2018_Final_20180917 165
Lake Point Reference Easting Northing RL (m) Data Source Sample
Date Dip Azimuth
Down Hole
Width (m)
Depth (m)
Assay
Ca Mg Na K Cl SO4
mg/L
Central (W) 374(1) 337,000 7,285,500 475 2015_Auger 2015 -90 0 0.25 <1.5m 732 8,790 60,300 6,500 115,000 18,210
Central (W) 375 337,000 7,284,500 475 2015_Auger 2015 -90 0 0.25 <1.5m 490 11,500 78,200 6,350 145,000 23,691
Central (W) 378 337,000 7,281,500 474 2015_Auger 2015 -90 0 0.25 <1.5m 588 9,950 83,000 5,440 154,000 16,682
Central (W) 378 (1) 337,000 7,281,500 474 2015_Auger 2015 -90 0 0.25 <1.5m 585 9,720 82,400 5,360 155,000 16,592
Central (W) 380 338,544 7,291,363 476 2015_Auger 2015 -90 0 0.25 <1.5m 1,880 6,950 37,300 4,800 83,100 6,619
Central (W) 381 336,370 7,292,311 474 2015_Auger 2015 -90 0 0.25 <1.5m 673 11,900 72,000 9,500 149,000 15,245
Central (W) 383 337,905 7,285,248 475 2015_Auger 2015 -90 0 0.25 <1.5m 915 7,580 49,000 4,700 97,200 14,406
Central (W) 384 338,000 7,284,500 475 2015_Auger 2015 -90 0 0.25 <1.5m 1,220 6,000 35,000 3,080 67,900 11,171
Central (W) 385 337,811 7,283,784 475 2015_Auger 2015 -90 0 0.25 <1.5m 538 12,100 73,200 6,090 145,000 20,097
Central (W) 386 337,811 7,282,658 474 2015_Auger 2015 -90 0 0.25 <1.5m 1,020 5,870 30,900 2,300 61,900 13,208
Central (W) 387 337,622 7,282,036 474 2015_Auger 2015 -90 0 0.25 <1.5m 593 13,400 71,100 5,710 146,000 17,910
Central (W) 388 338,000 7,280,500 475 2015_Auger 2015 -90 0 0.25 <1.5m 565 10,900 89,400 5,320 167,000 15,484
Central (W) 389 338,095 7,279,784 473 2015_Auger 2015 -90 0 0.25 <1.5m 582 12,100 75,500 5,950 154,000 16,443
Central (W) 390 336,141 7,279,666 474 2015_Auger 2015 -90 0 0.25 <1.5m 1,260 6,180 35,700 2,610 73,900 9,674
Central (W) 391 339,544 7,278,949 473 2015_Auger 2015 -90 0 0.25 <1.5m 384 14,800 88,300 5,920 174,000 20,576
Central (W) 392 338,811 7,281,343 476 2015_Auger 2015 -90 0 0.25 <1.5m 590 8,110 77,300 5,020 143,000 16,982
Central (W) 393 339,000 7,280,500 473 2015_Auger 2015 -90 0 0.25 <1.5m 553 9,990 83,300 5,470 158,000 16,383
Central (W) 394 339,284 7,280,036 473 2015_Auger 2015 -90 0 0.25 <1.5m 418 12,100 90,200 6,090 174,000 19,228
Central (W) 398 340,000 7,279,500 474 2015_Auger 2015 -90 0 0.25 <1.5m 728 8,800 71,200 4,560 133,000 15,634
Central (W) 398 (1) 340,000 7,279,500 474 2015_Auger 2015 -90 0 0.25 <1.5m 703 8,930 70,300 4,640 135,000 15,634
Central (W) 399 340,000 7,278,500 473 2015_Auger 2015 -90 0 0.25 <1.5m 440 12,100 94,800 5,810 177,000 17,910
Central (W) 400 339,937 7,277,973 473 2015_Auger 2015 -90 0 0.25 <1.5m 407 13,700 94,200 5,620 180,000 18,869
Central (W) 401 341,378 7,281,059 475 2015_Auger 2015 -90 0 0.25 <1.5m 681 9,160 68,900 4,650 129,000 17,551
Central (W) 402 341,000 7,280,500 474 2015_Auger 2015 -90 0 0.25 <1.5m 696 8,810 76,700 4,950 137,000 16,053
Central (W) 403 341,000 7,279,500 474 2015_Auger 2015 -90 0 0.25 <1.5m 237 20,600 90,900 9,850 191,000 31,448
Central (W) 404 341,000 7,278,500 476 2015_Auger 2015 -90 0 0.25 <1.5m 622 10,000 84,600 5,250 154,000 15,963
Central (W) 408 342,189 7,282,059 474 2015_Auger 2015 -90 0 0.25 <1.5m 649 9,900 74,700 4,880 138,000 17,641
Central (W) 409 342,000 7,281,500 476 2015_Auger 2015 -90 0 0.25 <1.5m 714 9,650 69,600 4,590 133,000 16,263
Central (W) 410 342,000 7,280,500 475 2015_Auger 2015 -90 0 0.25 <1.5m 491 13,000 79,900 5,500 155,000 20,636
Central (W) 411 342,000 7,279,500 476 2015_Auger 2015 -90 0 0.25 <1.5m 612 9,720 80,800 4,810 149,000 16,503
Central (W) 412 342,000 7,278,500 473 2015_Auger 2015 -90 0 0.25 <1.5m 363 14,400 94,400 5,980 181,000 21,265
Central (W) 420 341,622 7,278,036 473 2015_Auger 2015 -90 0 0.25 <1.5m 380 15,650 92,850 5,860 181,000 21,115
Central (W) 422 342,811 7,282,217 476 2015_Auger 2015 -90 0 0.25 <1.5m 1,001 5,995 38,200 3,095 72,100 13,612
Central (W) 422 (1) 342,811 7,282,217 476 2015_Auger 2015 -90 0 0.25 <1.5m 1,020 6,000 39,100 3,100 69,300 13,627
Central (W) 423 342,685 7,280,689 475 2015_Auger 2015 -90 0 0.25 <1.5m 601 10,200 78,900 4,960 146,000 17,341
Central (W) 424 342,559 7,279,752 473 2015_Auger 2015 -90 0 0.25 <1.5m 431 13,400 80,800 5,560 157,000 21,654
Central (W) 379 337,000 7,280,500 473 2015_Auger 2015 -90 0 0.25 <1.5m 973 8,130 52,800 3,595 96,300 14,032
Central (W) PC7 333,703 7,284,444 473 2015_Auger 2015 -90 0 0.25 <1.5m 550 11,000 65,300 9,900 139,000 22,229
Central 1 Auger Central 1 335,000 7,292,500 474 2017_Auger 2017 -90 0 0.25 2 418 12,700 82,100 11,600 161,750 22,900
Central 2 Auger Central 2 337,000 7,288,500 474 2017_Auger 2017 -90 0 0.25 2 676 13,500 77,900 10,200 161,200 13,600
Central 3 Auger Central 3 337,000 7,284,500 474 2017_Auger 2017 -90 0 0.25 2 551 10,800 76,600 6,530 150,350 18,300
Central 3 Auger Rpt Central 3 337,000 7,284,500 474 2017_Auger 2017 -90 0 0.25 2 555 11,000 75,400 6,500 149,800 18,700

Beyondie Sulphate of Potash Project JORC (2012) and NI 43-101 Technical Report – 2018
Report2018_Final_20180917 166
Lake Point Reference Easting Northing RL (m) Data Source Sample
Date Dip Azimuth
Down Hole
Width (m)
Depth (m)
Assay
Ca Mg Na K Cl SO4
mg/L
Central 3 Dup Auger Central 3 337,000 7,284,500 474 2017_Auger 2017 -90 0 0.25 2 576 11,000 78,300 6,750 149,300 18,900
Central 4 Auger Central 4 333,703 7,284,444 474 2017_Auger 2017 -90 0 0.25 2 485 11,500 71,900 11,400 141,950 25,300
Central 4 Dup Auger Central 4 333,703 7,284,444 474 2017_Auger 2017 -90 0 0.25 2 481 11,500 71,000 11,500 141,750 25,600
Central 5 Auger Central 5 338,000 7,280,500 474 2017_Auger 2017 -90 0 0.25 2 664 8,850 78,300 5,140 146,300 15,400
Central 6 Auger Central 6 341,000 7,279,500 474 2017_Auger 2017 -90 0 0.25 2 633 9,670 79,500 5,200 150,700 16,200
Central North 1 Auger Central North 1 340,333 7,293,548 475 2017_Auger 2017 -90 0 0.25 2 412 12,600 80,900 11,500 161,050 22,900
Lake Wilderness 1 Auger Lake Wilderness 1 310,000 7,312,500 538 2017_Auger 2017 -90 0 0.25 2 746 9,030 58,400 7,330 111,250 18,800
Lake Wilderness 1 Auger Rpt Lake Wilderness 1 310,000 7,312,500 538 2017_Auger 2017 -90 0 0.25 2 737 8,950 58,000 7,260 111,250 18,900
Lake Wilderness 2 Auger Lake Wilderness 2 312,000 7,311,500 538 2017_Auger 2017 -90 0 0.25 2 776 8,300 57,000 7,770 110,200 16,400
Lake Wilderness South 2 Auger Lake Wilderness South
2 305,633 7,310,032 538 2017_Auger 2017 -90 0 0.25 2 1,170 3,660 28,700 3,740 53,600 10,200
North Sunshine Auger North Sunshine 265,000 7,276,500 535 2017_Auger 2017 -90 0 0.25 2 1,130 4,960 35,400 3,600 66,250 11,400
North Sunshine 3 Auger North Sunshine 3 272,010 7,280,857 533 2017_Auger 2017 -90 0 0.25 2 1,160 4,890 36,300 3,510 64,300 12,400
North Sunshine East Auger North Sunshine East 271,524 7,278,932 535 2017_Auger 2017 -90 0 0.25 2 1,160 4,930 36,500 3,610 66,050 12,200
North T-Junction 1 Auger North T-Junction 1 292,000 7,303,500 514 2017_Auger 2017 -90 0 0.25 2 958 7,860 55,900 5,880 108,650 13,000
North T-Junction 2 Auger North T-Junction 2 294,658 7,307,222 514 2017_Auger 2017 -90 0 0.25 2 927 7,850 50,900 6,930 99,350 14,900
Northern 406 341,252 7,322,626 501 2015_Auger 2015 -90 0 0.25 <1.5m 1,150 2,220 13,400 1,530 24,900 6,739
Northern 407 341,000 7,321,500 501 2015_Auger 2015 -90 0 0.25 <1.5m 1,140 7,460 42,700 5,120 84,600 12,280
Northern 413 341,433 7,321,933 500 2015_Auger 2015 -90 0 0.25 <1.5m 1,010 6,430 41,700 5,550 80,600 13,867
Northern 414 342,000 7,321,500 500 2015_Auger 2015 -90 0 0.25 <1.5m 1,310 4,060 26,600 3,870 52,400 8,775
Northern 415 342,000 7,320,500 502 2015_Auger 2015 -90 0 0.25 <1.5m 1,430 4,970 31,800 4,100 62,500 9,374
Northern 416 342,000 7,319,500 501 2015_Auger 2015 -90 0 0.25 <1.5m 1,560 4,120 21,600 2,720 45,700 7,008
Northern 416 (1) 342,000 7,319,500 501 2015_Auger 2015 -90 0 0.25 <1.5m 1,560 4,080 21,500 2,680 45,900 6,918
Northern 418 342,000 7,317,500 500 2015_Auger 2015 -90 0 0.25 <1.5m 1,470 2,670 13,200 1,790 27,400 5,481
Northern 419 341,590 7,316,689 501 2015_Auger 2015 -90 0 0.25 <1.5m 1,130 1,630 7,770 1,090 16,000 4,433
Northern 1 Auger Northern 1 341,433 7,321,933 501 2017_Auger 2017 -90 0 0.25 2 894 8,740 57,000 8,320 109,700 15,200
Northern 1 Auger Rpt Northern 1 341,433 7,321,933 501 2017_Auger 2017 -90 0 0.25 2 893 8,710 56,900 8,320 110,400 15,400
Northern 2 Auger Northern 2 342,000 7,317,500 501 2017_Auger 2017 -90 0 0.25 2 432 12,700 81,700 11,600 160,700 23,000
Sunshine LS1 250,567 7,270,569 534 2015_Auger 2015 -90 0 0.25 <1.5m 465 8,099 74,071 7,938 127,700 19,117
Sunshine SL5 250,567 7,270,569 534 2015_Auger 2015 -90 0 0.25 <1.5m 425 8,920 79,600 13,000 140,000 37,448
Sunshine S1 251,204 7,271,670 534 2015_Auger 2015 -90 0 0.25 <1.5m 515 8,510 82,300 8,350 144,000 21,474
Sunshine S2 252,058 7,270,801 534 2015_Auger 2015 -90 0 0.25 <1.5m 620 6,620 72,000 8,070 127,000 19,767
Sunshine S2(1) 252,058 7,270,801 535 2015_Auger 2015 -90 0 0.25 <1.5m 621 6,830 73,700 8,200 129,000 20,246
Sunshine S3 252,953 7,272,362 532 2015_Auger 2015 -90 0 0.25 <1.5m 547 7,540 80,000 8,250 140,000 20,366
Sunshine S4 256,979 7,270,642 534 2015_Auger 2015 -90 0 0.25 <1.5m 557 7,750 79,000 7,210 141,000 19,767
Sunshine S5 256,972 7,272,301 538 2015_Auger 2015 -90 0 0.25 <1.5m 838 5,360 54,700 5,690 100,000 15,454
Sunshine S6 258,021 7,274,313 536 2015_Auger 2015 -90 0 0.25 <1.5m 841 4,640 53,900 5,570 91,800 16,503
Sunshine S7 258,088 7,271,383 541 2015_Auger 2015 -90 0 0.25 <1.5m 1,070 3,710 36,450 3,265 62,600 11,890
Sunshine S8 259,202 7,274,397 538 2015_Auger 2015 -90 0 0.25 <1.5m 1,120 3,670 42,400 4,520 72,300 11,651
Sunshine S9 259,221 7,275,346 539 2015_Auger 2015 -90 0 0.25 <1.5m 978 3,840 47,800 4,850 79,300 13,897
Sunshine S10 257,681 7,275,541 534 2015_Auger 2015 -90 0 0.25 <1.5m 1,070 4,450 53,100 5,380 89,800 12,998
Sunshine S10(1) 257,681 7,275,541 534 2015_Auger 2015 -90 0 0.25 <1.5m 1,045 4,255 51,400 5,325 91,200 12,324
Sunshine 124 249,558 7,270,017 536 2015_Auger 2015 -90 0 0.25 <1.5m 786 5,290 45,500 5,270 81,900 13,987

Beyondie Sulphate of Potash Project JORC (2012) and NI 43-101 Technical Report – 2018
Report2018_Final_20180917 167
Lake Point Reference Easting Northing RL (m) Data Source Sample
Date Dip Azimuth
Down Hole
Width (m)
Depth (m)
Assay
Ca Mg Na K Cl SO4
mg/L
Sunshine 126 250,000 7,270,500 538 2015_Auger 2015 -90 0 0.25 <1.5m 512 8,350 83,100 8,410 145,000 21,354
Sunshine 134 252,000 7,272,500 535 2015_Auger 2015 -90 0 0.25 <1.5m 760 7,110 65,800 6,630 130,000 15,814
Sunshine 135 252,000 7,271,500 536 2015_Auger 2015 -90 0 0.25 <1.5m 473 6,910 78,300 8,510 137,000 23,062
Sunshine 137 251,666 7,270,132 532 2015_Auger 2015 -90 0 0.25 <1.5m 515 8,190 76,600 7,840 137,000 20,785
Sunshine 138 252,703 7,272,794 537 2015_Auger 2015 -90 0 0.25 <1.5m 379 11,000 84,200 8,200 151,000 26,326
Sunshine 140 253,000 7,271,500 534 2015_Auger 2015 -90 0 0.25 <1.5m 593 6,350 71,400 7,650 126,000 20,246
Sunshine 141 253,000 7,270,500 535 2015_Auger 2015 -90 0 0.25 <1.5m 580 7,330 77,600 8,210 136,000 19,677
Sunshine 143 253,666 7,272,203 540 2015_Auger 2015 -90 0 0.25 <1.5m 769 5,820 60,600 6,440 106,000 16,622
Sunshine 144 254,000 7,271,500 535 2015_Auger 2015 -90 0 0.25 <1.5m 604 6,160 72,000 7,720 125,000 18,659
Sunshine 145 254,000 7,270,500 535 2015_Auger 2015 -90 0 0.25 <1.5m 571 6,450 73,100 7,990 128,000 21,624
Sunshine 150 255,149 7,272,017 538 2015_Auger 2015 -90 0 0.25 <1.5m 721 4,400 56,400 5,890 96,200 17,850
Sunshine 151 255,000 7,271,500 535 2015_Auger 2015 -90 0 0.25 <1.5m 661 6,020 69,600 7,570 119,000 19,168
Sunshine 152 255,000 7,270,500 534 2015_Auger 2015 -90 0 0.25 <1.5m 634 7,550 69,700 6,460 124,000 19,408
Sunshine 156 256,000 7,272,500 537 2015_Auger 2015 -90 0 0.25 <1.5m 832 5,010 51,400 5,220 85,200 16,862
Sunshine 157 256,000 7,271,500 536 2015_Auger 2015 -90 0 0.25 <1.5m 556 5,460 75,800 8,250 123,000 22,103
Sunshine 158 256,000 7,270,500 533 2015_Auger 2015 -90 0 0.25 <1.5m 685 6,540 69,600 6,710 119,000 17,521
Sunshine 158 (1) 256,000 7,270,500 533 2015_Auger 2015 -90 0 0.25 <1.5m 671 6,530 69,200 6,660 124,000 17,341
Sunshine 167 257,000 7,273,500 538 2015_Auger 2015 -90 0 0.25 <1.5m 666 5,450 71,800 7,690 124,000 18,988
Sunshine 169 257,000 7,271,500 535 2015_Auger 2015 -90 0 0.25 <1.5m 612 5,840 71,600 7,800 124,000 20,396
Sunshine 177 257,000 7,274,500 538 2015_Auger 2015 -90 0 0.25 <1.5m 691 6,320 69,600 7,200 126,000 17,940
Sunshine 179 257,740 7,276,091 536 2015_Auger 2015 -90 0 0.25 <1.5m 814 5,700 58,600 5,560 104,000 16,952
Sunshine 182 258,000 7,273,500 535 2015_Auger 2015 -90 0 0.25 <1.5m 489 8,230 78,500 7,380 141,000 23,271
Sunshine 183 258,000 7,272,500 536 2015_Auger 2015 -90 0 0.25 <1.5m 1,020 3,980 38,300 3,530 68,400 13,358
Sunshine 195 258,443 7,274,058 537 2015_Auger 2015 -90 0 0.25 <1.5m 1,190 3,080 39,000 4,040 67,700 10,932
Sunshine (N) PC1 272,010 7,280,857 533 2015_Auger 2015 -90 0 0.25 <1.5m 1,130 5,980 42,500 4,300 87,400 11,863
Sunshine (NE) TJ1 269,298 7,279,748 535 2015_Auger 2015 -90 0 0.25 <1.5m 978 5,650 44,500 3,610 79,200 15,005
Sunshine (NE) TJ2 271,524 7,278,932 535 2015_Auger 2015 -90 0 0.25 <1.5m 1,050 5,040 38,900 3,900 70,900 13,418
Sunshine (NE) 218 265,000 7,276,500 535 2015_Auger 2015 -90 0 0.25 <1.5m 1,100 3,100 22,800 2,340 40,500 10,273
Sunshine (NE) 224 267,777 7,276,946 534 2015_Auger 2015 -90 0 0.25 <1.5m 1,060 4,310 33,500 3,610 60,000 13,298
Sunshine (NE) 224 (1) 267,777 7,276,946 534 2015_Auger 2015 -90 0 0.25 <1.5m 1,060 4,320 34,300 3,610 60,500 13,388
Sunshine (NE) 229 269,703 7,280,017 535 2015_Auger 2015 -90 0 0.25 <1.5m 1,610 5,350 35,900 2,620 71,800 8,146
Sunshine (NE) 233 271,000 7,280,500 536 2015_Auger 2015 -90 0 0.25 <1.5m 1,220 5,500 40,700 3,680 77,200 11,591
Sunshine (NE) 236 271,000 7,277,500 536 2015_Auger 2015 -90 0 0.25 <1.5m 1,055 4,815 39,100 3,930 69,900 14,121
Sunshine (NE) 237 272,000 7,280,500 536 2015_Auger 2015 -90 0 0.25 <1.5m 1,260 4,280 34,400 3,280 63,100 10,453
Sunshine (NE) 240 271,443 7,277,909 534 2015_Auger 2015 -90 0 0.25 <1.5m 1,180 4,960 38,700 3,780 69,400 12,429
Sunshine (NE) 241 272,284 7,281,437 534 2015_Auger 2015 -90 0 0.25 <1.5m 1,440 4,640 33,500 2,780 62,300 9,464
Sunshine (NE) 243 273,000 7,280,500 538 2015_Auger 2015 -90 0 0.25 <1.5m 1,140 4,280 36,900 3,360 64,000 12,309
Sunshine (NE) 243 (1) 273,000 7,280,500 538 2015_Auger 2015 -90 0 0.25 <1.5m 1,160 4,340 36,700 3,420 64,500 12,429
Sunshine (NE) 244 272,182 7,280,058 535 2015_Auger 2015 -90 0 0.25 <1.5m 1,060 5,750 44,700 4,370 80,700 14,077
Sunshine (NE) 238 272,000 7,279,500 538 2015_Auger 2015 -90 0 0.25 <1.5m 1,090 5,040 40,200 3,870 68,700 12,938
Sunshine (SW) 120 247,000 7,270,500 540 2015_Auger 2015 -90 0 0.25 <1.5m 1,050 4,770 37,500 4,140 66,500 15,095
Sunshine (SW) 123 247,405 7,270,132 541 2015_Auger 2015 -90 0 0.25 <1.5m 1,100 3,570 32,300 4,140 54,600 11,651

Beyondie Sulphate of Potash Project JORC (2012) and NI 43-101 Technical Report – 2018
Report2018_Final_20180917 168
Lake Point Reference Easting Northing RL (m) Data Source Sample
Date Dip Azimuth
Down Hole
Width (m)
Depth (m)
Assay
Ca Mg Na K Cl SO4
mg/L
Terminal T1 258,296 7,291,599 541 2015_Auger 2015 -90 0 0.25 <1.5m 841 4,810 40,600 5,350 73,000 16,952
Terminal 171 257,000 7,293,500 540 2015_Auger 2015 -90 0 0.25 <1.5m 859 5,350 44,600 5,890 82,300 17,221
Terminal 186 258,000 7,293,500 540 2015_Auger 2015 -90 0 0.25 <1.5m 686 6,800 49,400 6,010 92,000 22,672
Terminal 187 258,000 7,292,500 540 2015_Auger 2015 -90 0 0.25 <1.5m 1,020 3,230 27,900 3,580 47,100 12,579
Terminal 191 257,546 7,293,754 541 2015_Auger 2015 -90 0 0.25 <1.5m 716 6,070 44,700 5,090 77,400 21,175
Terminal 196 259,000 7,293,500 540 2015_Auger 2015 -90 0 0.25 <1.5m 752 6,470 52,900 7,090 94,500 21,414
Terminal 196 (1) 259,000 7,293,500 540 2015_Auger 2015 -90 0 0.25 <1.5m 728 6,290 51,200 6,920 92,700 21,115
Terminal 199 259,000 7,290,500 541 2015_Auger 2015 -90 0 0.25 <1.5m 928 4,150 34,800 4,570 62,800 15,305
Terminal 201 258,562 7,293,835 540 2015_Auger 2015 -90 0 0.25 <1.5m 773 6,290 47,800 5,440 85,100 20,815
Terminal 204 260,000 7,293,500 541 2015_Auger 2015 -90 0 0.25 <1.5m 822 6,020 44,300 5,840 81,400 20,007
Terminal 205 260,000 7,292,500 540 2015_Auger 2015 -90 0 0.25 <1.5m 969 5,020 42,400 5,760 77,400 15,095
Terminal 206 260,000 7,291,500 540 2015_Auger 2015 -90 0 0.25 <1.5m 1,100 3,730 30,300 3,900 55,800 11,890
Terminal 209 259,481 7,293,819 540 2015_Auger 2015 -90 0 0.25 <1.5m 960 4,930 38,900 4,640 67,500 15,724
Terminal 211 260,189 7,293,170 540 2015_Auger 2015 -90 0 0.25 <1.5m 979 4,390 36,100 4,800 62,500 15,095
Terminal 215 260,465 7,292,673 540 2015_Auger 2015 -90 0 0.25 <1.5m 1,095 3,905 33,100 4,385 59,000 13,103
Terminal 172 257,000 7,292,500 541 2015_Auger 2015 -90 0 0.25 <1.5m 973 6,740 50,500 6,660 90,400 14,825
Terminal IL2 255,695 7,294,630 544 2015_Auger 2015 -90 0 0.25 <1.5m 315 14,100 80,700 16,400 153,000 51,228
Terminal 1 Auger Terminal 1 257,000 7,293,500 513 2017_Auger 2017 -90 0 0.25 2 939 5,730 44,900 5,670 85,000 14,500
Terminal 2 Auger Terminal 2 260,000 7,291,500 514 2017_Auger 2017 -90 0 0.25 2 939 5,810 47,200 5,860 86,550 14,800
TJ PC3 293,407 7,306,315 514 2015_Auger 2015 -90 0 0.25 <1.5m 822 7,270 48,400 6,490 99,200 14,679
TJ TJ 295,133 7,307,154 514 2015_Auger 2015 -90 0 0.25 <1.5m 1,050 5,070 41,100 5,650 76,800 12,849
TJ (N) 267 291,000 7,303,500 514 2015_Auger 2015 -90 0 0.25 <1.5m 1,070 6,440 46,200 5,350 85,800 14,346
TJ (N) 268 291,000 7,302,500 515 2015_Auger 2015 -90 0 0.25 <1.5m 1,330 6,020 42,500 4,470 80,500 11,082
TJ (N) 272 292,000 7,303,500 515 2015_Auger 2015 -90 0 0.25 <1.5m 1,000 6,380 45,500 5,650 85,600 14,316
TJ (N) 274 293,000 7,306,500 515 2015_Auger 2015 -90 0 0.25 <1.5m 1,220 3,300 24,000 3,030 44,000 8,895
TJ (N) 275 293,000 7,305,500 515 2015_Auger 2015 -90 0 0.25 <1.5m 884 4,640 30,800 4,080 57,800 9,584
TJ (N) 276 293,000 7,304,500 514 2015_Auger 2015 -90 0 0.25 <1.5m 1,140 6,190 40,100 5,140 76,700 13,178
TJ (N) 277 293,000 7,303,500 514 2015_Auger 2015 -90 0 0.25 <1.5m 1,350 4,750 31,300 3,280 57,100 10,123
TJ (N) 279 294,000 7,307,500 513 2015_Auger 2015 -90 0 0.25 <1.5m 1,040 5,890 43,800 5,815 81,550 13,957
TJ (N) 281 294,000 7,305,500 514 2015_Auger 2015 -90 0 0.25 <1.5m 979 7,330 51,100 6,110 96,200 15,185
TJ (N) 281 (1) 294,000 7,305,500 514 2015_Auger 2015 -90 0 0.25 <1.5m 979 7,350 50,500 6,090 96,200 14,975
TJ (N) 282 294,000 7,304,500 514 2015_Auger 2015 -90 0 0.25 <1.5m 1,150 5,880 40,600 4,640 75,700 12,729
TJ (N) 283 295,000 7,307,500 515 2015_Auger 2015 -90 0 0.25 <1.5m 1,000 5,250 44,800 7,120 84,900 14,316
TJ (N) 284 295,000 7,306,500 514 2015_Auger 2015 -90 0 0.25 <1.5m 931 5,720 41,400 5,090 75,500 16,293
TJ (N) 285 294,703 7,305,723 514 2015_Auger 2015 -90 0 0.25 <1.5m 1,090 5,560 37,200 4,310 67,500 13,478
TJ (N) PC4 294,658 7,307,222 514 2015_Auger 2015 -90 0 0.25 <1.5m 984 6,500 48,600 6,580 96,700 13,960
TJ (S) 258 282,000 7,295,500 522 2015_Auger 2015 -90 0 0.25 <1.5m 1,590 4,220 32,000 3,440 59,700 8,296
TJ (S) 259 283,000 7,296,500 521 2015_Auger 2015 -90 0 0.25 <1.5m 1,525 4,480 32,100 3,250 59,200 9,255
TJ (S) 260 282,907 7,295,593 523 2015_Auger 2015 -90 0 0.25 <1.5m 1,490 2,890 21,400 2,400 41,100 7,278
TJ (S) 261 284,000 7,296,500 522 2015_Auger 2015 -90 0 0.25 <1.5m 1,520 4,410 32,900 3,470 62,300 9,195
TJ (S) PC2 290,985 7,302,991 514 2015_Auger 2015 -90 0 0.25 <1.5m 1,055 7,635 51,350 5,600 108,000 12,448
T-Junction 1 Auger T-Junction 1 282,000 7,295,500 522 2017_Auger 2017 -90 0 0.25 2 1,430 4,200 30,700 3,310 60,300 8,400

Beyondie Sulphate of Potash Project JORC (2012) and NI 43-101 Technical Report – 2018
Report2018_Final_20180917 169
Lake Point Reference Easting Northing RL (m) Data Source Sample
Date Dip Azimuth
Down Hole
Width (m)
Depth (m)
Assay
Ca Mg Na K Cl SO4
mg/L
T-Junction 2 Auger T-Junction 2 284,000 7,296,500 522 2017_Auger 2017 -90 0 0.25 2 1,430 4,190 31,100 3,230 58,850 8,430
T-Junction South Auger T-Junction South 277,152 7,290,635 535 2017_Auger 2017 -90 0 0.25 2 1,510 4,250 31,000 3,300 109,150 8,400
White Lake WL1 362,764 7,271,645 483 2015_Auger 2015 -90 0 0.25 <1.5m 602 4,840 46,200 5,690 73,500 20,486
White Lake WL2 362,828 7,270,349 477 2015_Auger 2015 -90 0 0.25 <1.5m 380 9,750 75,800 9,760 137,000 34,143
White Lake WL3 364,119 7,271,740 480 2015_Auger 2015 -90 0 0.25 <1.5m 402 7,540 73,900 9,000 125,000 29,082
White Lake WL4 364,959 7,271,231 476 2015_Auger 2015 -90 0 0.25 <1.5m 384 8,370 79,600 9,280 137,000 30,849
White Lake WL5 364,755 7,269,083 476 2015_Auger 2015 -90 0 0.25 <1.5m 303 10,600 84,000 9,950 147,000 38,037
White Lake WL6 368,055 7,268,763 477 2015_Auger 2015 -90 0 0.25 <1.5m 388 7,940 80,700 9,550 141,000 31,448
White Lake WL6(1) 368,055 7,268,763 477 2015_Auger 2015 -90 0 0.25 <1.5m 393 8,070 80,900 9,530 143,000 32,047
White Lake WL7 370,287 7,265,617 476 2015_Auger 2015 -90 0 0.25 <1.5m 811 3,920 38,800 4,130 64,500 18,240
White Lake WL8 369,960 7,269,333 477 2015_Auger 2015 -90 0 0.25 <1.5m 464 6,985 73,600 8,420 129,000 26,745
White Lake WL9 371,107 7,268,655 481 2015_Auger 2015 -90 0 0.25 <1.5m 478 8,190 76,300 7,800 142,000 27,464
White Lake WL10 376,247 7,266,387 478 2015_Auger 2015 -90 0 0.25 <1.5m 841 4,060 41,100 3,730 68,400 16,982
White Lake WL10(1) 376,247 7,266,387 478 2015_Auger 2015 -90 0 0.25 <1.5m 842 4,030 40,400 3,730 68,000 17,281
White Lake 446 362,110 7,271,020 475 2015_Auger 2015 -90 0 0.25 <1.5m 508 7,830 58,200 7,640 106,000 25,278
White Lake 449 364,000 7,269,500 479 2015_Auger 2015 -90 0 0.25 <1.5m 397 12,600 69,400 8,470 128,000 35,341
White Lake 453 365,779 7,270,248 475 2015_Auger 2015 -90 0 0.25 <1.5m 324 8,980 83,000 9,140 150,000 32,945
White Lake 456 366,842 7,269,154 475 2015_Auger 2015 -90 0 0.25 <1.5m 277 10,700 83,900 9,690 151,000 38,336
White Lake 457 367,000 7,268,500 475 2015_Auger 2015 -90 0 0.25 <1.5m 263 11,800 86,600 11,300 163,000 38,336
White Lake 458 367,347 7,267,910 475 2015_Auger 2015 -90 0 0.25 <1.5m 319 8,550 81,900 10,100 149,000 33,844
White Lake 463 369,000 7,269,500 478 2015_Auger 2015 -90 0 0.25 <1.5m 437 6,800 64,000 8,010 114,000 26,176
White Lake 466 369,000 7,266,500 477 2015_Auger 2015 -90 0 0.25 <1.5m 458 6,940 67,000 8,300 122,000 27,374
White Lake 481 370,748 7,269,059 478 2015_Auger 2015 -90 0 0.25 <1.5m 392 8,460 77,000 8,790 135,000 29,052
White Lake 481 (1) 370,748 7,269,059 478 2015_Auger 2015 -90 0 0.25 <1.5m 391 8,375 76,050 8,600 134,000 28,527
White Lake 483 371,000 7,267,500 479 2015_Auger 2015 -90 0 0.25 <1.5m 479 5,050 71,100 8,090 114,000 31,448
White Lake 484 371,000 7,266,500 476 2015_Auger 2015 -90 0 0.25 <1.5m 493 5,590 65,900 8,500 107,000 28,662
White Lake 485 371,000 7,265,500 478 2015_Auger 2015 -90 0 0.25 <1.5m 420 5,900 81,800 9,320 125,000 33,544
White Lake 486 371,000 7,264,500 477 2015_Auger 2015 -90 0 0.25 <1.5m 474 5,890 73,300 8,990 121,000 29,052
White Lake 487 371,000 7,263,500 483 2015_Auger 2015 -90 0 0.25 <1.5m 725 5,860 58,100 6,380 102,000 19,348
White Lake 493 372,000 7,267,500 479 2015_Auger 2015 -90 0 0.25 <1.5m 535 6,280 67,500 7,950 117,000 24,230
White Lake 494 371,716 7,266,626 477 2015_Auger 2015 -90 0 0.25 <1.5m 645 5,120 56,100 6,640 91,900 23,391
White Lake 495 372,000 7,265,500 476 2015_Auger 2015 -90 0 0.25 <1.5m 479 6,195 74,800 8,925 122,000 30,220
White Lake 496 372,000 7,264,500 477 2015_Auger 2015 -90 0 0.25 <1.5m 878 5,670 52,700 5,840 92,300 16,652
White Lake 496 (1) 372,000 7,264,500 477 2015_Auger 2015 -90 0 0.25 <1.5m 868 5,600 53,600 5,730 92,800 16,772
White Lake 498 372,496 7,268,248 478 2015_Auger 2015 -90 0 0.25 <1.5m 482 8,400 75,100 8,090 131,000 27,434
White Lake 499 372,401 7,267,500 480 2015_Auger 2015 -90 0 0.25 <1.5m 964 3,730 36,500 3,760 62,800 14,226
White Lake 500 372,905 7,266,847 479 2015_Auger 2015 -90 0 0.25 <1.5m 802 4,220 50,100 6,160 82,900 18,958
White Lake 501 373,000 7,265,500 479 2015_Auger 2015 -90 0 0.25 <1.5m 478 5,700 75,300 8,700 121,000 29,621
White Lake 502 373,095 7,263,744 476 2015_Auger 2015 -90 0 0.25 <1.5m 914 4,850 44,000 4,840 75,700 15,574
White Lake 503 373,905 7,265,847 477 2015_Auger 2015 -90 0 0.25 <1.5m 631 6,470 66,000 7,000 114,000 21,205
White Lake 504 375,567 7,266,721 477 2015_Auger 2015 -90 0 0.25 <1.5m 831 5,080 49,100 4,630 81,100 18,000
White Lake 505 374,969 7,265,878 477 2015_Auger 2015 -90 0 0.25 <1.5m 452 8,790 77,300 7,000 130,000 27,704

Beyondie Sulphate of Potash Project JORC (2012) and NI 43-101 Technical Report – 2018
Report2018_Final_20180917 170
Lake Point Reference Easting Northing RL (m) Data Source Sample
Date Dip Azimuth
Down Hole
Width (m)
Depth (m)
Assay
Ca Mg Na K Cl SO4
mg/L
White Lake 510 376,000 7,265,500 477 2015_Auger 2015 -90 0 0.25 <1.5m 504 7,400 75,300 8,210 127,000 25,547
White Lake 515 377,000 7,266,500 478 2015_Auger 2015 -90 0 0.25 <1.5m 372 10,200 84,500 9,890 155,000 27,135
White Lake 515 (1) 377,000 7,266,500 478 2015_Auger 2015 -90 0 0.25 <1.5m 364 10,100 84,400 9,800 156,000 27,255
White Lake 516 377,000 7,265,500 478 2015_Auger 2015 -90 0 0.25 <1.5m 413 7,660 78,800 8,490 135,000 29,621
White Lake 517 377,000 7,264,500 480 2015_Auger 2015 -90 0 0.25 <1.5m 777 5,480 52,500 5,210 90,400 17,940
White Lake 518 375,834 7,264,981 476 2015_Auger 2015 -90 0 0.25 <1.5m 507 7,470 70,400 7,350 119,000 25,727
White Lake 523 377,779 7,265,406 479 2015_Auger 2015 -90 0 0.25 <1.5m 927 4,190 35,700 3,620 61,100 14,466
White Lake 524 378,000 7,264,500 477 2015_Auger 2015 -90 0 0.25 <1.5m 788 5,250 42,400 4,380 72,100 19,078
White Lake WL 370,802 7,266,910 476 2015_Auger 2015 -90 0 0.25 <1.5m 511 6,600 75,200 9,130 126,000 30,258
White Lake 1 Auger White Lake 1 357,345 7,270,169 480 2017_Auger 2017 -90 0 0.25 2 821 6,640 34,900 4,700 66,250 19,400
White Lake 2 Auger White Lake 2 365,779 7,270,248 475 2017_Auger 2017 -90 0 0.25 2 486 7,100 73,000 8,980 124,050 30,000
White Lake 3 Auger White Lake 3 370,802 7,266,910 476 2017_Auger 2017 -90 0 0.25 2 458 6,810 72,800 8,840 124,250 29,500
White Lake 4 Auger White Lake 4 377,000 7,265,500 478 2017_Auger 2017 -90 0 0.25 2 408 7,820 80,800 9,070 142,450 29,800
White Lake W Auger White Lake W 354,284 7,281,217 477 2017_Auger 2017 -90 0 0.25 2 327 12,900 84,200 10,800 158,200 33,900
White Lake W Dup Auger White Lake W 354,284 7,281,217 477 2017_Auger 2017 -90 0 0.25 2 324 12,800 85,200 10,800 157,850 33,600
Wilderness PC5 309,577 7,311,102 505 2015_Auger 2015 -90 0 0.25 <1.5m 765 8,340 56,600 7,390 121,000 17,885
Wilderness U1 320,586 7,310,804 510 2015_Auger 2015 -90 0 0.25 <1.5m 2,570 2,560 11,200 1,400 26,200 3,115
Wilderness 289 309,000 7,311,500 508 2015_Auger 2015 -90 0 0.25 <1.5m 1,030 4,160 30,800 3,920 57,600 11,471
Wilderness 290 309,158 7,310,689 510 2015_Auger 2015 -90 0 0.25 <1.5m 745 4,490 33,800 4,480 62,600 10,572
Wilderness 291 310,000 7,313,500 504 2015_Auger 2015 -90 0 0.25 <1.5m 615 7,190 45,100 5,590 88,000 15,814
Wilderness 292 310,000 7,312,500 506 2015_Auger 2015 -90 0 0.25 <1.5m 1,300 3,820 22,500 3,400 44,300 9,075
Wilderness 293 310,000 7,311,500 506 2015_Auger 2015 -90 0 0.25 <1.5m 908 6,900 46,000 6,220 85,400 17,850
Wilderness 294 310,000 7,310,500 506 2015_Auger 2015 -90 0 0.25 <1.5m 969 6,370 47,500 5,940 88,500 15,305
Wilderness 295 310,158 7,310,193 506 2015_Auger 2015 -90 0 0.25 <1.5m 404 5,420 34,500 4,490 68,000 11,411
Wilderness 296 311,000 7,312,500 506 2015_Auger 2015 -90 0 0.25 <1.5m 1,230 4,380 30,100 4,170 57,900 10,932
Wilderness 297 311,000 7,311,500 506 2015_Auger 2015 -90 0 0.25 <1.5m 960 6,810 45,900 6,520 86,600 15,724
Wilderness 298 311,000 7,310,500 506 2015_Auger 2015 -90 0 0.25 <1.5m 861 6,740 52,400 6,950 99,000 16,413
Wilderness 298 (1) 311,000 7,310,500 506 2015_Auger 2015 -90 0 0.25 <1.5m 858 6,710 51,800 6,930 96,200 16,323
Wilderness 299 312,000 7,312,500 507 2015_Auger 2015 -90 0 0.25 <1.5m 1,125 6,030 43,200 5,915 84,250 13,343
Wilderness 300 312,000 7,311,500 506 2015_Auger 2015 -90 0 0.25 <1.5m 870 8,920 58,500 6,790 117,000 14,196
Wilderness 301 311,842 7,310,721 507 2015_Auger 2015 -90 0 0.25 <1.5m 763 2,980 20,000 2,260 38,600 7,008
Wilderness 302 313,000 7,312,500 505 2015_Auger 2015 -90 0 0.25 <1.5m 723 6,715 47,050 6,560 96,000 9,225
Wilderness 303 312,685 7,311,815 506 2015_Auger 2015 -90 0 0.25 <1.5m 1,240 5,540 34,300 3,540 67,400 10,273
Yanerie 1 2 Auger Yanerie 1 243,334 7,294,635 550 2017_Auger 2017 -90 0 0.25 2 429 11,600 62,700 10,800 112,650 40,200
Yanerie 2 Auger Yanerie 2 247,630 7,297,225 542 2017_Auger 2017 -90 0 0.25 2 527 8,160 55,900 9,160 96,000 33,300
Yanneri IL1 243,334 7,294,635 550 2015_Auger 2015 -90 0 0.25 <1.5m 425 9,420 57,100 10,600 101,000 38,945
Yanneri IL3 241,573 7,298,445 546 2015_Auger 2015 -90 0 0.25 <1.5m 693 7,200 52,550 6,535 97,250 22,963
Yanneri Y1 242,442 7,297,381 547 2015_Auger 2015 -90 0 0.25 <1.5m 613 10,900 52,700 9,220 98,500 37,737
Yanneri Y2 245,664 7,295,084 547 2015_Auger 2015 -90 0 0.25 <1.5m 865 5,030 39,200 6,880 70,100 17,970
Yanneri Y3 244,852 7,295,411 544 2015_Auger 2015 -90 0 0.25 <1.5m 744 6,340 38,500 6,420 71,500 22,552
Yanneri Y4 242,844 7,294,628 543 2015_Auger 2015 -90 0 0.25 <1.5m 686 7,400 39,500 6,830 68,500 27,524
Yanneri Y5 242,453 7,293,438 545 2015_Auger 2015 -90 0 0.25 <1.5m 665 7,470 38,500 5,870 67,800 28,273

Beyondie Sulphate of Potash Project JORC (2012) and NI 43-101 Technical Report – 2018
Report2018_Final_20180917 171
Lake Point Reference Easting Northing RL (m) Data Source Sample
Date Dip Azimuth
Down Hole
Width (m)
Depth (m)
Assay
Ca Mg Na K Cl SO4
mg/L
Yanneri Y6 242,549 7,292,557 549 2015_Auger 2015 -90 0 0.25 <1.5m 827 6,380 38,900 6,640 71,800 19,857
Yanneri Y7 243,821 7,292,698 546 2015_Auger 2015 -90 0 0.25 <1.5m 767 7,280 40,200 6,040 73,600 20,935
Yanneri Y8 242,840 7,291,276 547 2015_Auger 2015 -90 0 0.25 <1.5m 827 6,090 35,300 5,120 64,000 19,557
Yanneri Y8(1) 242,840 7,291,276 547 2015_Auger 2015 -90 0 0.25 <1.5m 835 6,110 35,200 5,090 63,100 19,647
Yanneri Y9 242,397 7,291,525 548 2015_Auger 2015 -90 0 0.25 <1.5m 723 6,895 43,500 7,345 78,000 24,409
Yanneri 86 240,441 7,298,445 546 2015_Auger 2015 -90 0 0.25 <1.5m 861 3,320 16,100 2,710 29,200 11,980
Yanneri 104 245,000 7,294,500 546 2015_Auger 2015 -90 0 0.25 <1.5m 794 6,640 39,900 6,870 76,400 19,887
Yanneri 104 (1) 245,000 7,294,500 546 2015_Auger 2015 -90 0 0.25 <1.5m 798 6,530 39,900 6,810 75,550 19,872
Yanneri 105 245,000 7,293,500 546 2015_Auger 2015 -90 0 0.25 <1.5m 819 5,640 37,700 6,750 68,500 19,138
Yanneri 106 245,000 7,292,500 545 2015_Auger 2015 -90 0 0.25 <1.5m 824 6,820 41,900 5,620 77,800 19,737
Yanneri 110 246,158 7,297,658 545 2015_Auger 2015 -90 0 0.25 <1.5m 676 6,380 35,900 4,880 61,600 25,008
Yanneri 111 246,000 7,296,500 545 2015_Auger 2015 -90 0 0.25 <1.5m 530 7,810 46,600 8,470 86,100 26,356
Yanneri 113 246,000 7,294,500 545 2015_Auger 2015 -90 0 0.25 <1.5m 900 4,940 39,500 6,990 73,800 15,604
Yanneri 117 247,000 7,297,500 546 2015_Auger 2015 -90 0 0.25 <1.5m 598 7,550 47,000 6,620 79,900 30,549
Yanneri 118 247,347 7,296,563 545 2015_Auger 2015 -90 0 0.25 <1.5m 643 6,840 49,200 7,360 81,100 25,907
Yanneri 119 246,811 7,295,721 545 2015_Auger 2015 -90 0 0.25 <1.5m 766 5,970 44,600 6,990 75,250 21,265
Yanneri 119 (1) 246,811 7,295,721 545 2015_Auger 2015 -90 0 0.25 <1.5m 755 5,885 43,100 6,830 75,100 20,875
Yanneri 121 247,842 7,297,374 543 2015_Auger 2015 -90 0 0.25 <1.5m 642 7,180 45,400 6,140 74,400 27,913
Yanneri 122 248,032 7,296,815 545 2015_Auger 2015 -90 0 0.25 <1.5m 714 6,150 42,300 6,210 71,800 22,822
Yanneri Feed YLF1 235,010 7,295,291 547 2015_Auger 2015 -90 0 0.25 <1.5m 935 3,860 17,391 2,768 30,100 12,478
Yanneri/Terminal YT1 254,096 7,296,955 542 2015_Auger 2015 -90 0 0.25 <1.5m 811 4,910 37,700 5,440 67,000 19,827
Yanneri/Terminal YT1 247,630 7,297,225 543 2015_Auger 2015 -90 0 0.25 <1.5m 615 7,600 47,600 7,180 90,900 28,310
Yanneri/Terminal YT2 254,232 7,297,072 542 2015_Auger 2015 -90 0 0.25 <1.5m 794 5,390 41,600 5,730 74,700 19,413

Beyondie Sulphate of Potash Project JORC (2012) and NI 43-101 Technical Report – 2018
Report2018_Final_20180917 172
APPENDIX 4: TEST PUMPING ASSAYS AND DETAILS
Point ID Description Location Easting Northing Representative Aquifer Date
Assay
Ca Mg Na K Cl SO4
mg/L
SDHTM08 Test pump 10 Mile 230,359 7,259,357 Bedrock 2015 731 5,480 53,300 7,680 88,600 22,918
SDHTM08 Test pump 10 Mile 230,359 7,259,357 Bedrock 2015 759 5,460 53,500 7,860 89,300 23,667
SDHTM09 12v Pumping 10 Mile 235,582 7,257,149 Whole profile 2015 156 600 6,750 1,110 12,000 1,887
TMPB12 Test pumping 10 Mile 233,490 7,256,785 Basal Sand 12-Jun-17 489 7,730 69,000 8,930 120,550 25,500
TMPB12 Test pumping 10 Mile 233,490 7,256,785 Basal Sand 13-Jun-17 487 7,770 70,100 9,000 119,850 25,100
TMPB12 Test pumping 10 Mile 233,490 7,256,785 Basal Sand 14-Jun-17 481 7,730 70,200 8,980 120,550 25,600
TMPB12 Test pumping 10 Mile 233,490 7,256,785 Basal Sand 15-Jun-17 479 7,880 69,900 9,130 120,900 26,300
TMPB12 Test pumping 10 Mile 233,490 7,256,785 Basal Sand 16-Jun-17 474 7,990 71,500 9,220 120,700 26,500
TMPB12 Test pumping 10 Mile 233,490 7,256,785 Basal Sand 17-Jun-17 485 7,800 67,700 9,000 121,250 25,200
TMPB12 Test pumping 10 Mile 233,490 7,256,785 Basal Sand 18-Jun-17 493 7,800 71,400 9,020 120,900 25,700
TMPB12 Test pumping 10 Mile 233,490 7,256,785 Basal Sand 19-Jun-17 495 7,840 70,100 9,000 121,400 25,600
TMPB12 Test pumping 10 Mile 233,490 7,256,785 Basal Sand 20-Jun-17 494 7,860 70,500 9,150 121,050 25,800
TMPB12 Test pumping 10 Mile 233,486 7,256,791 Basal Sand 4-Jun-17 496 9,080 70,100 7,730 118,500 27,300
TMPB12 Test pumping 10 Mile 233,486 7,256,791 Basal Sand 22-Jun-17 805 5,410 49,600 6,620 86,650 18,600
TMPB12 Test pumping 10 Mile 233,486 7,256,791 Basal Sand 23-Jun-17 512 8,150 70,400 9,390 121,650 27,100
TMPB12 Test pumping 10 Mile 233,486 7,256,791 Basal Sand 24-Jun-17 507 8,070 71,600 9,380 123,450 27,200
TMPB12 Test pumping 10 Mile 233,486 7,256,791 Basal Sand 25-Jun-17 505 8,090 73,000 9,450 125,900 27,300
TMPB12 Test pumping 10 Mile 233,486 7,256,791 Basal Sand 26-Jun-17 501 8,060 71,100 9,400 127,000 26,600
TMPB12 Test pumping 10 Mile 233,486 7,256,791 Basal Sand 26-Jun-17 508 8,100 71,600 9,480 127,000 26,700
TMPB23 Test pumping 10 Mile 230,918 7,253,522 Fractured Bedrock 1-May-17 403 10,900 78,500 8,890 136,350 32,100
TMPB23 Test pumping 10 Mile 230,918 7,253,522 Fractured Bedrock 6-May-17 413 10,800 75,000 8,610 129,700 30,600
TMPB23 Test pumping 10 Mile 230,918 7,253,522 Fractured Bedrock 7-May-17 398 10,700 78,100 8,890 137,050 31,500
TMPB23 Test pumping 10 Mile 230,918 7,253,522 Fractured Bedrock 7-May-17 407 10,600 78,200 9,070 137,050 30,900
TMPB23 Test pumping 10 Mile 230,918 7,253,522 Fractured Bedrock 8-May-17 405 8,840 77,700 10,600 137,400 29,900
TMPB23 Test pumping 10 Mile 230,918 7,253,522 Fractured Bedrock 8-May-17 400 8,860 78,000 10,700 137,600 29,600
TMPB23 Test pumping 10 Mile 230,918 7,253,522 Fractured Bedrock 9-May-17 400 10,600 79,000 9,000 136,350 31,500
TMPB23 Test pumping 10 Mile 230,918 7,253,522 Fractured Bedrock 4-May-17 651 5,780 66,400 9,990 114,300 21,000
TMPB23 Test pumping 10 Mile 230,918 7,253,522 Fractured Bedrock 5-May-17 411 8,960 80,100 10,900 137,950 29,900
TMPB23 Test pumping 10 Mile 230,918 7,253,522 Fractured Bedrock 5-May-17 413 8,930 79,700 10,700 138,450 29,900
TMPB23 Test pumping 10 Mile 230,918 7,253,522 Fractured Bedrock 6-May-17 410 8,940 79,400 10,900 137,950 29,600
TMPB23 Test pumping 10 Mile 230,918 7,253,522 Fractured Bedrock 7-May-17 405 8,800 79,400 10,800 138,100 29,900
TMPB23 Test pumping 10 Mile 230,918 7,253,522 Fractured Bedrock 8-May-17 407 8,970 78,900 10,700 138,650 29,900
TMPB23 Test pumping 10 Mile 230,918 7,253,522 Fractured Bedrock 9-May-17 408 8,990 80,300 10,700 137,600 30,000
TMPB23 Test pumping 10 Mile 230,918 7,253,522 Fractured Bedrock 9-May-17 405 8,930 79,100 10,700 137,750 30,000
TMPB23 Test pumping 10 Mile 230,918 7,253,522 Fractured Bedrock 28-Apr-17 404 10,700 77,100 9,000 133,200 30,900
TMPB23 Test pumping 10 Mile 230,918 7,253,522 Fractured Bedrock 2-May-17 391 10,400 79,300 8,930 136,700 31,500
TMPB23 Test pumping 10 Mile 230,918 7,253,522 Fractured Bedrock 28-Apr-17 413 10,900 74,900 8,390 129,200 30,300
WB06D 12v Pumping 10 Mile 230,190 7,259,422 Bedrock 2015 378 8,360 94,700 13,300 152,000 32,700
WB07 12v Pumping 10 Mile 230,475 7,257,584 Bedrock 2015 524 7,660 70,200 9,600 124,000 27,210

Beyondie Sulphate of Potash Project JORC (2012) and NI 43-101 Technical Report – 2018
Report2018_Final_20180917 173
Point ID Description Location Easting Northing Representative Aquifer Date
Assay
Ca Mg Na K Cl SO4
mg/L
WB10 Test pumping 10 Mile 233,468 7,257,249 Basal Sand 19-Dec-15 594 6,600 58,100 7,930 101,000 22,620
WB10 Test pumping 10 Mile 233,468 7,257,249 Basal Sand 24-Apr-17 521 8,440 65,000 6,990 109,400 25,600
WB10 Test pumping 10 Mile 233,468 7,257,249 Basal Sand 25-Apr-17 517 8,320 64,200 6,930 109,250 24,800
WB10 Test pumping 10 Mile 233,468 7,257,249 Basal Sand 25-Apr-17 518 8,290 64,700 7,180 108,900 25,100
WB10 Test pumping 10 Mile 233,468 7,257,249 Basal Sand 26-Apr-17 516 8,260 63,500 7,000 109,400 25,400
WB10 Test pumping 10 Mile 233,468 7,257,249 Basal Sand 26-Apr-17 516 8,260 64,600 6,940 109,050 25,400
WB10 Test pumping 10 Mile 233,468 7,257,249 Basal Sand 24-Apr-17 523 8,470 65,200 7,040 109,050 24,900
WB10 Test pumping 10 Mile 233,468 7,257,249 Basal Sand Dec-15 595 5,590 49,900 6,790 86,800 18,870
WB10 Test pumping 10 Mile 233,468 7,257,249 Basal Sand Dec-15 587 6,330 55,700 7,530 96,500 21,600
WB10 Test pumping 10 Mile 233,468 7,257,249 Basal Sand Dec-15 560 6,770 60,700 7,990 104,000 23,310
WB10MBD 12v Pumping 10 Mile 233,468 7,257,249 Basal Sand 2015 707 4,050 36,800 5,280 65,300 13,110
WB10MBI 12v Pumping 10 Mile 233,487 7,257,251 Clay 2015 699 4,550 41,200 5,690 72,900 15,360
WB11MBI 12v Pumping 10 Mile 233,539 7,255,526 Surficial 2015 842 4,510 35,900 4,550 62,600 15,750
WB11MBS 12v Pumping 10 Mile 233,539 7,255,524 Surficial 2015 830 5,100 39,800 4,990 67,500 17,190
WB12 Test pumping 10 Mile 233,894 7,253,901 Upper Sand 15-Dec-15 648 6,780 50,800 6,355 90,450 23,385
WB12 Test pumping 10 Mile 233,894 7,253,901 Upper Sand 14-Dec-15 651 6,700 49,800 6,210 89,800 22,890
WB12 Test pumping 10 Mile 233,894 7,253,901 Upper Sand Dec-15 657 6,650 49,900 6,080 85,300 22,590
WB12 Test pumping 10 Mile 233,894 7,253,901 Upper Sand Dec-15 689 7,080 53,000 6,490 89,100 23,310
WB12 Test pumping 10 Mile 233,894 7,253,901 Upper Sand Dec-15 696 7,050 51,800 6,480 88,100 23,580
WB12 Test pumping 10 Mile 233,894 7,253,901 Upper Sand Dec-15 672 6,890 51,000 6,380 88,600 22,770
WB12 Test pumping 10 Mile 233,894 7,253,901 Upper Sand Dec-15 678 7,140 54,800 6,660 92,100 23,940
WB12 Test pumping 10 Mile 233,894 7,253,901 Upper Sand Dec-15 646 6,910 52,000 6,440 92,600 23,400
WB12 Test pumping 10 Mile 233,894 7,253,901 Upper Sand Dec-15 691 7,205 53,400 6,700 89,450 23,475
WB12 Test pumping 10 Mile 233,894 7,253,901 Upper Sand Dec-15 676 6,900 51,800 6,300 89,600 23,730
WB12 Test pumping 10 Mile 233,894 7,253,901 Upper Sand Dec-15 660 7,090 54,200 6,700 93,800 23,610
WB12MBD 12v Pumping 10 Mile 233,894 7,253,901 Upper Sand 2015 729 5,475 42,800 5,270 74,200 19,125
WB12MBI 12v Pumping 10 Mile 233,888 7,253,923 Clay 2015 999 4,470 38,300 4,840 64,600 15,510
WB19 12v Pumping 10 Mile 235,565 7,257,151 Surficial 2015 230 1,130 12,400 1,870 21,900 3,450
WB23 12v Pumping 10 Mile 235,582 7,257,150 Surficial 2015 265 1,590 16,000 2,290 27,500 5,070
WB25 12v Pumping 10 Mile 235,579 7,257,152 Surficial 2015 476 560 6,575 1,120 10,800 2,250
ESE Trench Test Pumping Sunshine 260,414 7,276,115 Surficial 1-Aug-17 848 6,080 65,000 6,480 115,500 14,800
ESE Trench Test Pumping Sunshine 260,414 7,276,115 Surficial 27-Jul-17 828 5,900 65,600 6,390 116,200 14,600
ESE Trench Test Pumping Sunshine 260,414 7,276,115 Surficial 28-Jul-17 687 6,890 73,500 6,990 130,700 15,700
ESE Trench Test Pumping Sunshine 260,414 7,276,115 Surficial 29-Jul-17 695 6,930 74,700 7,040 130,700 16,100
ESE Trench Test Pumping Sunshine 260,414 7,276,115 Surficial 30-Jul-17 1,000 4,900 52,700 5,010 92,500 13,100
ESE Trench Test Pumping Sunshine 260,414 7,276,115 Surficial 31-Jul-17 707 6,980 73,300 7,040 131,050 16,400
ESE Trench Test Pumping Sunshine 257,690 7,271,774 Surficial 1-Aug-17 630 7,960 73,200 7,080 127,150 19,900
ESE Trench Test Pumping Sunshine 257,690 7,271,774 Surficial 1-Aug-17 617 7,850 73,600 7,000 127,700 19,400
ESE Trench Test Pumping Sunshine 257,690 7,271,774 Surficial 27-Jul-17 673 8,010 72,900 7,130 129,100 20,300
ESE Trench Test Pumping Sunshine 257,690 7,271,774 Surficial 28-Jul-17 630 7,850 70,800 6,960 127,700 19,500
ESE Trench Test Pumping Sunshine 257,690 7,271,774 Surficial 29-Jul-17 631 7,960 72,800 7,090 127,500 19,800

Beyondie Sulphate of Potash Project JORC (2012) and NI 43-101 Technical Report – 2018
Report2018_Final_20180917 174
Point ID Description Location Easting Northing Representative Aquifer Date
Assay
Ca Mg Na K Cl SO4
mg/L
ESE Trench Test Pumping Sunshine 257,690 7,271,774 Surficial 30-Jul-17 621 7,850 72,200 6,980 128,200 19,200
ESE Trench Test Pumping Sunshine 257,690 7,271,774 Surficial 31-Jul-17 623 7,910 72,200 7,040 127,500 19,500
SSAC15M1 Slugtest Sunshine 257,617 7,275,041 Basal Sand 10-Jun-17 784 5,830 60,200 5,860 103,900 17,900
SSAC15M2 Slugtest Sunshine 257,617 7,275,041 Surficial 10-Jun-17 837 5,480 55,200 5,160 95,050 16,300
SSAC16M1 Slugtest Sunshine 257,301 7,275,361 Basal Sand 10-Jun-17 333 4,670 41,400 4,250 73,100 14,000
SSAC16M2 Slugtest Sunshine 257,301 7,275,361 Surficial 10-Jun-17 798 5,110 56,400 5,440 98,600 14,900
SSAC19M1 Slugtest Sunshine 264,078 7,276,655 Basal Sand 10-Jun-17 325 4,630 41,100 4,210 72,150 13,000
SSAC19M2 Slugtest Sunshine 264,078 7,276,655 Surficial 10-Jun-17 201 880 8,890 860 15,050 2,550
SSAC24M1 Slugtest Sunshine 256,660 7,273,834 Basal Sand 10-Jun-17 330 4,650 41,500 4,240 73,800 13,500
SSAC24M2 Slugtest Sunshine 256,660 7,273,834 Surficial 10-Jun-17 472 5,130 46,800 4,650 80,150 14,400
SSPB15 Test pumping Sunshine 257,634 7,275,045 Basal Sand 8-Jul-17 747 6,000 63,000 7,960 120,200 17,900
SSPB15 Test pumping Sunshine 257,634 7,275,045 Basal Sand 8-Jul-17 794 5,560 59,200 6,350 104,600 16,700
SSPB15 Test pumping Sunshine 257,634 7,275,045 Basal Sand 15-Aug-17 707 5,880 66,700 6,310 110,250 17,800
SSPB15 Test pumping Sunshine 257,634 7,275,045 Basal Sand 15-Aug-17 707 5,850 66,200 6,280 109,550 17,600
SSPB15 Test pumping Sunshine 257,634 7,275,045 Basal Sand 18-Aug-17 660 6,600 70,000 7,170 121,450 18,700
SSPB15 Test pumping Sunshine 257,634 7,275,045 Basal Sand 18-Aug-17 680 6,700 71,100 7,250 109,550 19,100
SSPB18 Test pumping Sunshine 261,022 7,275,999 Basal Sand 1-Aug-17 761 5,720 65,600 6,760 113,550 16,000
SSPB18 Test pumping Sunshine 261,022 7,275,999 Basal Sand 17-Jul-17 765 5,440 59,500 6,770 107,600 15,600
SSPB18 Test pumping Sunshine 261,022 7,275,999 Basal Sand 27-Jul-17 763 5,890 65,800 6,870 114,400 16,300
SSPB18 Test pumping Sunshine 261,022 7,275,999 Basal Sand 28-Jul-17 757 5,920 65,700 6,930 113,550 16,200
SSPB18 Test pumping Sunshine 261,022 7,275,999 Basal Sand 29-Jul-17 755 5,820 64,600 6,830 113,350 16,100
SSPB18 Test pumping Sunshine 261,022 7,275,999 Basal Sand 29-Jul-17 784 5,900 64,900 6,880 113,550 16,300
SSPB18 Test pumping Sunshine 261,022 7,275,999 Basal Sand 30-Jul-17 782 5,930 65,100 6,900 114,050 16,200
SSPB18 Test pumping Sunshine 261,022 7,275,999 Basal Sand 31-Jul-17 768 5,720 64,400 6,750 113,550 16,000
SSPB18 Test pumping Sunshine 261,022 7,275,999 Basal Sand 4-Aug-17 769 5,880 65,300 6,840 113,700 16,300
SSPB18 Test pumping Sunshine 261,022 7,275,999 Basal Sand 4-Aug-17 791 5,880 64,400 7,040 112,200 16,300
SSPB19 Test pumping Sunshine 264,084 7,276,673 Basal Sand 10-Aug-17 692 5,000 54,200 4,880 90,600 15,400
SSPB19 Test pumping Sunshine 264,084 7,276,673 Basal Sand 11-Aug-17 680 5,100 55,300 4,890 93,250 15,500
SSPB19 Test pumping Sunshine 264,084 7,276,673 Basal Sand 12-Aug-17 692 5,150 55,700 4,950 91,850 15,600
SSPB19 Test pumping Sunshine 264,084 7,276,673 Basal Sand 13-Aug-17 690 5,210 54,500 4,960 93,950 15,800
SSPB19 Test pumping Sunshine 264,084 7,276,673 Basal Sand 13-Aug-17 684 5,200 55,000 4,930 93,250 15,600
SSPB19 Test pumping Sunshine 264,084 7,276,673 Basal Sand 4-Aug-17 717 5,410 56,000 5,250 93,250 16,400
SSPB19 Test pumping Sunshine 264,084 7,276,673 Basal Sand 4-Aug-17 802 5,930 64,600 7,050 112,200 16,700
SSPB19 Test pumping Sunshine 264,084 7,276,673 Basal Sand 4-Aug-17 698 5,280 54,200 5,120 93,250 16,100
SSPB21 Test pumping Sunshine 248,431 7,269,419 Basal Sand 20-Jul-17 529 6,040 61,800 5,830 104,150 16,700
SSPB21 Test pumping Sunshine 248,431 7,269,419 Basal Sand 20-Jul-17 524 5,960 61,700 5,800 103,950 16,700
SSPB21 Test pumping Sunshine 248,431 7,269,419 Basal Sand 8-Jul-17 607 5,460 46,800 5,330 83,950 17,100
SSPB21 Test pumping Sunshine 248,431 7,269,419 Basal Sand 4-Jul-17 563 5,260 44,900 5,040 80,800 16,400
SSPB21 Test pumping Sunshine 248,431 7,269,419 Basal Sand 4-Jul-17 580 4,720 40,300 4,440 71,500 15,000
SSPB21 Test pumping Sunshine 248,431 7,269,419 Basal Sand 5-Jul-17 580 5,370 47,100 5,220 82,700 17,300
SSPB21 Test pumping Sunshine 248,431 7,269,419 Basal Sand 6-Jul-17 565 4,780 41,200 4,650 72,350 15,200

Beyondie Sulphate of Potash Project JORC (2012) and NI 43-101 Technical Report – 2018
Report2018_Final_20180917 175
Point ID Description Location Easting Northing Representative Aquifer Date
Assay
Ca Mg Na K Cl SO4
mg/L
SSPB21 Test pumping Sunshine 248,431 7,269,419 Basal Sand 6-Jul-17 555 4,720 41,000 4,630 72,000 14,900
SSPB21 Test pumping Sunshine 248,431 7,269,419 Basal Sand 11-Jul-17 604 5,510 47,900 5,370 84,100 17,600
SSPB21 Test pumping Sunshine 248,431 7,269,419 Basal Sand 15-Jul-17 563 5,150 45,200 5,010 79,200 16,300
SSPB21 Test pumping Sunshine 248,431 7,269,419 Basal Sand 16-Jul-17 565 5,170 44,500 5,030 80,050 16,500
SSPB21 Test pumping Sunshine 248,431 7,269,419 Basal Sand 17-Jul-17 567 5,210 45,300 5,040 80,600 16,500
SSPB21 Test pumping Sunshine 248,431 7,269,419 Basal Sand 18-Jul-17 572 5,250 44,600 5,060 80,250 16,400
SSPB21 Test pumping Sunshine 248,431 7,269,419 Basal Sand 20-Jul-17 574 5,290 45,200 5,070 79,900 16,700
SSPB21 Test pumping Sunshine 248,431 7,269,419 Basal Sand 20-Jul-17 572 5,300 45,100 5,040 80,600 16,400
Trench NE Test pumping Sunshine 260,451 7,276,110 Surficial 18-Jul-17 1,070 4,170 46,700 5,000 81,700 12,500
Trench NE Test pumping Sunshine 260,451 7,276,110 Surficial 19-Jul-17 1,100 4,170 46,400 4,950 79,750 12,500
Trench NE Test pumping Sunshine 260,451 7,276,110 Surficial 20-Jul-17 1,050 4,260 47,900 5,160 83,450 12,600
Trench NE Test pumping Sunshine 260,451 7,276,110 Surficial 21-Jul-17 1,030 4,190 48,400 5,080 82,900 12,700
Trench NE Test pumping Sunshine 260,451 7,276,110 Surficial 22-Jul-17 1,060 4,050 46,000 4,880 80,100 12,200
Trench NE Test pumping Sunshine 260,451 7,276,110 Surficial 23-Jul-17 1,020 4,600 51,600 5,550 89,550 13,200
Trench NE Test pumping Sunshine 260,451 7,276,110 Surficial 24-Jul-17 1,060 4,810 52,100 5,700 90,450 13,300
Trench NE Test pumping Sunshine 260,451 7,276,110 Surficial 25-Jul-17 1,050 4,810 52,600 5,710 90,100 13,400
Trench NE Test pumping Sunshine 260,451 7,276,110 Surficial 25-Jul-17 1,060 4,830 52,600 5,780 90,450 13,400

Beyondie Sulphate of Potash Project JORC (2012) and NI 43-101 Technical Report – 2018
Report2018_Final_20180917 176
APPENDIX 5: TEST PUMPING RESULTS AND SUMMARIES

Beyondie Sulphate of Potash Project JORC (2012) and NI 43-101 Technical Report – 2018
Report2018_Final_20180917 177
10 Mile Test Pumping Summary
TEST MONITORIN
G BORE
TEST RATE (L/s)
DURATION METHOD TRANSMISSIVITY
(m2/d)
HYDRAULIC CONDUCTIVITY
(K) (m/d)
CONFINED STORAGE
(-) COMMENTS
Medium to Long Term Yield
Bore Efficiency @ test rate
TMPB23
TMAC23M1
10 6.5 Days
Theis 34 1.4 1.88E-05 Boundary at 300 mins
5 – 8 L/s 75% TMAC22M1 Theis 52 2.2 1.23E-04 Boundary at 2,500 mins
TMAC11M1 Theis 62 2.6 1.08E-04 Boundary at 600 mins
PB Thiem 41 1.7 -
WB10
TMAC12M1
32 – 24
5 Days
Cooper Jacob 168 15.3 3.67E-05
Boundary at 200 mins
18 – 22 L/s 60%
Theis 123 11.1 5.11E-05
TMAC13M1 Theis 124 11.3 8.83E-05
Cooper Jacob 159 14.4 6.51E-05
TMAC14M1 Theis 147 13.3 1.13E-04 Boundary at 300 mins
Cooper Jacob 165 15.0 9.06E-05 Boundary at 300 mins
TMPB26 TMAC26M1 3.5 17 Hours Theis 9 0.7 4.75E-04 2 - 3 L/s 35%
TMPB12 TMAC12M1 12 14 Days Theis 25 2.3 7.79E-04 Some early time leakage observed between 15 mins and 2.5 hours, follows Theis type curve from then on 8 - 10 L/s 60%
Lake Sunshine Test Pumping Summary
TEST MONITORING
BORE
TEST RATE (L/s)
DURATION METHOD TRANSMISSIVITY
(m2/d)
HYDRAULIC CONDUCTIVITY
(m/d)
CONFINED STORAGE (-)
Comments Medium to Long
Term Yield Bore Efficiency @
test rate
SSPB18
SSAC18M1
10 10 days
Theis - Recovery 20 1.9 - Boundary at 600 mins
6 - 10 L/s 40%
SSPB18 Cooper Jacob 29 2.7 2.89E-04
SSPB18 Theis 28 2.5 5.24E-04
SSPB18 Theis - Recovery 18 1.7 - Leaky response
SSAC18M1 Theis 21 1.9 9.16E-04 Poor Fit
SSPB19
SSAC19M1
8 10 days
Cooper Jacob 21 2.3 2.98E-04 Boundary at 200 mins
6 – 10 L/s 65%
SSAC19M1 Theis 23 2.5 2.60E-04 Boundary at 200 mins
SSAC19M1 Theis - Recovery 21 2.3 -
SSAC19 Cooper Jacob 19 2.1 - Leaky response
SSAC19 Theis 21 2.1 - Leaky response
SSAC19 Theis - Recovery 28 3.1 - Boundary at 200 mins
SSPB15
SSAC15M1
4 3 days
Theis 22 3.1 5.37E-04 Boundary at 200 mins
3 – 5 L/s 20% SSAC15M1 Cooper Jacob 24 3.4 4.32E-04
SSAC15M1 Theis Recovery 29 4.1 -
SSPB15 Theis Recovery 20 2.8 -
SSPB21 SSAC21M1
9.5 12 days Theis 23 2.3 2.33E-04
Boundaries not observable 6 – 8 L/s 35% SSPB21 Theis Recovery 19 1.9 -
SSSN03PB
SSSN03MB
17 14 and 21
days
Cooper-Jacob ET 102 2.0 1.36E-03 Leaky aquifer response
12 – 14 L/s 50%
Cooper-Jacob LT 226 4.3 - T and K representative of leakage
Hantush-Jacob 109 2.1 6.64E-03 Leakage parameter – 0.04
SSAC06-M1 Hantush-Jacob 12 0.3 4.96E-04 Monitoring Bore in weathered siltstone
SSAC21-M1 Hantush-Jacob 22 1 2.96E-04 Monitoring Bore in palaeochannel sand
All Bores Thiem 103 4.3 - Bulk aquifer

Beyondie Sulphate of Potash Project JORC (2012) and NI 43-101 Technical Report – 2018
Report2018_Final_20180917 178
APPENDIX 6: STAGE 2 VARIOGRAM ANALYSIS
Aerodrome Lake Sediments Central Lake Sediments T Junction lake Sediments
Coefficient of Variance = 0.26 Coefficient of Variance = 0.43 Coefficient of Variance = 0.27
Error Variance = 1.42E+006 Error Variance = 1.89E+006 Error Variance = 2.69E+006
Terminal and Yanerri Lake Sediments White Lake, Lake Sediments Wilderness Surficial Aquifer
Coefficient of Variance = 0.28 Coefficient of Variance = 0.26 Coefficient of Variance = 0.33
Error Variance = 4.06E+005 Error Variance = 1.31E+006 Error Variance = 1.80E+006

Beyondie Sulphate of Potash Project JORC (2012) and NI 43-101 Technical Report – 2018
Report2018_Final_20180917 179
APPENDIX 7: BMR LOGS

Beyondie Sulphate of Potash Project JORC (2012) and NI 43-101 Technical Report – 2018
Report2018_Final_20180917 180
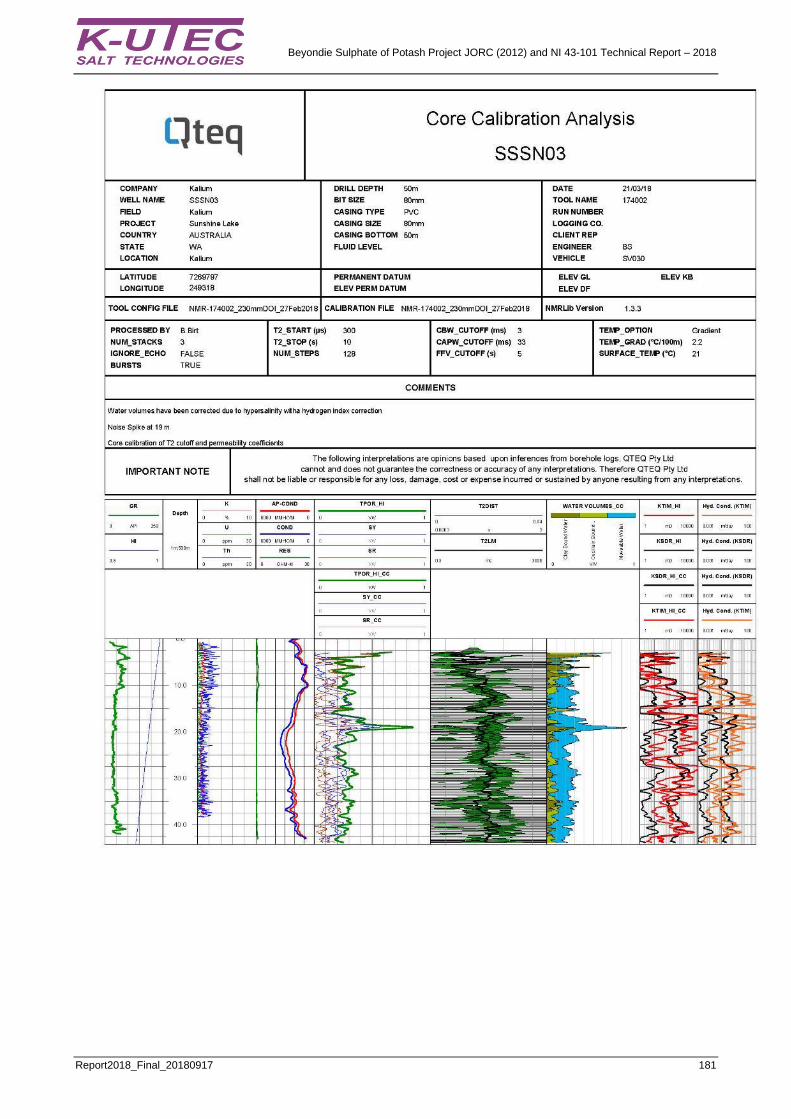
Beyondie Sulphate of Potash Project JORC (2012) and NI 43-101 Technical Report – 2018
Report2018_Final_20180917 181

Beyondie Sulphate of Potash Project JORC (2012) and NI 43-101 Technical Report – 2018
Report2018_Final_20180917 182

Beyondie Sulphate of Potash Project JORC (2012) and NI 43-101 Technical Report – 2018
Report2018_Final_20180917 183

Beyondie Sulphate of Potash Project JORC (2012) and NI 43-101 Technical Report – 2018
Report2018_Final_20180917 184

Beyondie Sulphate of Potash Project JORC (2012) and NI 43-101 Technical Report – 2018
Report2018_Final_20180917 185

Beyondie Sulphate of Potash Project JORC (2012) and NI 43-101 Technical Report – 2018
Report2018_Final_20180917 186

Beyondie Sulphate of Potash Project JORC (2012) and NI 43-101 Technical Report – 2018
Report2018_Final_20180917 187

Beyondie Sulphate of Potash Project JORC (2012) and NI 43-101 Technical Report – 2018
Report2018_Final_20180917 188

Beyondie Sulphate of Potash Project JORC (2012) and NI 43-101 Technical Report – 2018
Report2018_Final_20180917 189
APPENDIX 8: GEOLOGICAL SECTIONS
10 Mile
and Sand
and Sand

Beyondie Sulphate of Potash Project JORC (2012) and NI 43-101 Technical Report – 2018
Report2018_Final_20180917 190
and Sand
and Sand

Beyondie Sulphate of Potash Project JORC (2012) and NI 43-101 Technical Report – 2018
Report2018_Final_20180917 191
Lake Sunshine
and Sand
and Sand

Beyondie Sulphate of Potash Project JORC (2012) and NI 43-101 Technical Report – 2018
Report2018_Final_20180917 192
and Sand
and Sand

Beyondie Sulphate of Potash Project JORC (2012) and NI 43-101 Technical Report – 2018
Report2018_Final_20180917 193
APPENDIX 9: LEACH TEST RESULTS
10 Mile Leach Test Results
Sample ID
Leach Test
Time to fill 128 mL (sec)
Ca (mg/L)
K (mg/L)
Na (mg/L)
Cl (mg/L)
Mg (mg/L)
SO4 (mg/L)
TDS (mg/L)
SG (g/cm3)
TML01 1 9,078 842 5,820 37,500 65,300 3,680 14,700 134,000 1.09
TML01 2 325,000 699 9,620 65,200 107,500 6,620 21,500 215,000 1.14
TML01 3 Incomplete - low infiltration rate
TML02 1 13,045 716 5,590 41,700 74,050 5,250 18,800 156,000 1.1
TML02 2 11,547 875 5,210 37,800 68,900 4,970 17,900 142,000 1.09
TML02 3 10,398 573 890 6,030 8,900 688 3,810 22,400 1.01
TML03 1 Incomplete - low infiltration rate
TML04 1 312 1,040 3,270 23,500 39,200 1,870 8,250 81,600 1.05
TML04 2 298 851 1,750 11,500 18,100 956 5,670 41,400 1.02
TML04 3 162 704 1,130 7,030 10,800 641 4,440 26,400 1.01
TML05 1 325,000 799 8,560 61,800 113,550 6,950 18,800 220,000 1.14
TML05 2 604,800 919 6,630 45,000 73,900 4,630 17,500 151,000 1.1
TML05 3 1,209,600 899 2,760 17,200 28,250 1,800 9,930 62,100 1.04
TML06 1 325,000 293 14,200 107,000 178,450 11,400 31,500 350,000 1.22
TML06 2 565,400 997 4,530 29,200 49,300 3,030 13,300 104,000 1.07
TML06 3 Incomplete - low infiltration rate
TML07 1 123 908 6,940 57,900 103,500 3,360 14,300 197,000 1.12
TML07 2 47
TML07 3 43 651 2,000 6,330 9,350 599 7,110 26,100 1.01
TML08 1 103 948 6,560 51,500 90,600 3,360 14,500 171,000 1.11
TML08 2 94 831 3,920 23,100 36,950 1,570 11,000 80,600 1.05
TML08 3 77 630 1,460 4,950 8,150 457 5,430 20,500 1.01
TML09 1 59 790 5,200 37,000 65,100 2,670 13,900 125,000 1.08
TML09 2 34
TML09 3 38 637 420 1,770 2,450 189 2,760 8,600 1
TML10 1 Incomplete - low infiltration rate

Beyondie Sulphate of Potash Project JORC (2012) and NI 43-101 Technical Report – 2018
Report2018_Final_20180917 194
Lake Sunshine Leach Test Results
Sample ID
Leach Test
Time to fill 128 mL (sec)
Ca (mg/L)
K (mg/L) Na
(mg/L) Cl
(mg/L) Mg
(mg/L) SO4
(mg/L) TDS
(mg/L) SG
(g/cm3)
SSL01 1 600 616 2,590 22,000 39,550 2,260 6,600 56,200 1.05
SSL01 2 500 396 1,110 9,270 20,300 1,030 3,420 40,900 1.02
SSL01 3 400 358 650 5,430 10,400 613 2,520 19,800 1.01
SSL02 1 Incomplete - low infiltration rate
SSL03 1 7,200 428 2,700 28,000 50,350 3,460 8,310 99,800 1.06
SSL03 2 518,400 306 10,100 104,000 183,500 14,800 29,600 356,000 1.22
SSL03 3 Incomplete - low infiltration rate
SSL04 1 180 1,310 3,190 40,200 69,700 2,850 9,180 134,000 1.08
SSL04 2 140 904 1,380 15,700 25,150 1,050 6,360 52,600 1.03
SSL04 3 100 678 630 4,800 8,000 361 3,900 17,900 1.01
SSL05 1 12,000 359 2,670 27,800 50,350 3,410 7,590 98,500 1.06
SSL05 2 72,000 484 7,820 87,800 153,700 11,200 22,200 294,000 1.18
SSL05 3 475,200 434 8,570 91,100 162,400 12,000 23,500 309,000 1.19
SSL06 1 Incomplete - low infiltration rate
SSL07 1 900 1,050 2,290 23,200 38,350 1,780 8,220 79,300 1.05
SSL07 2 600 730 610 5,900 8,550 485 3,930 21,300 1.01
SSL07 3 300 640 230 2,080 3,450 208 2,460 9,100 1
SSL08 1 90,000 201 18,800 86,500 183,500 24,900 50,400 390,000 1.24
SSL08 2 Incomplete - low infiltration rate
SSL09 1 180 1,220 3,900 55,300 97,950 4,660 10,900 186,000 1.12
SSL09 2 150 1,160 1,990 29,300 52,950 1,840 8,100 93,400 1.06
SSL09 3 120 792 910 8,900 14,050 574 5,310 30,900 1.02
SSL10 1 120 1,030 3,300 24,900 42,150 2,240 8,940 86,300 1.06
SSL10 2 90 767 1,080 7,180 11,650 651 4,710 26,300 1.01
SSL10 3 60 644 370 2,360 4,700 227 2,640 9,950 1
SSL11 1 Incomplete - low infiltration rate
SSL12 1 1,200 179 1,750 19,200 32,950 1,790 4,530 64,000 1.04
SSL12 2 79,000 237 14,300 97,500 179,150 17,300 39,300 374,000 1.23
SSL12 3 Incomplete - low
infiltration rate lete
SSL13 1 100 1,080 2,360 21,500 38,200 1,750 7,590 74,700 1.05
SSL13 2 80 833 760 6,980 10,250 557 4,170 24,900 1.01
SSL13 3 60 651 260 2,280 3,800 185 2,550 9,400 1
SSL14 1 750 930 4,820 59,300 101,050 3,780 14,200 194,000 1.12
SSL14 2 500 811 1,710 19,500 28,800 684 9,120 61,100 1.04
SSL14 3 250 558 820 4,750 5,200 218 5,250 17,100 1.01
SSL15 2 1,300 638 1,700 19,000 33,700 1,720 6,330 65,400 1.04
SSL15 3 1,100 401 500 4,890 8,700 441 2,370 16,700 1.01

Beyondie Sulphate of Potash Project JORC (2012) and NI 43-101 Technical Report – 2018
Report2018_Final_20180917 195
APPENDIX 10: RESOURCE HISTOGRAMS 10 Mile

Beyondie Sulphate of Potash Project JORC (2012) and NI 43-101 Technical Report – 2018
Report2018_Final_20180917 196
Lake Sunshine

Beyondie Sulphate of Potash Project JORC (2012) and NI 43-101 Technical Report – 2018
Report2018_Final_20180917 197

Beyondie Sulphate of Potash Project JORC (2012) and NI 43-101 Technical Report – 2018
Report2018_Final_20180917 198
APPENDIX 11: BLOCK MODEL SECTIONS

Beyondie Sulphate of Potash Project JORC (2012) and NI 43-101 Technical Report – 2018
Report2018_Final_20180917 199

Beyondie Sulphate of Potash Project JORC (2012) and NI 43-101 Technical Report – 2018
Report2018_Final_20180917 200

Beyondie Sulphate of Potash Project JORC (2012) and NI 43-101 Technical Report – 2018
Report2018_Final_20180917 201
APPENDIX 12: STAGE 1 VARIOGRAMS 10 MILE

Beyondie Sulphate of Potash Project JORC (2012) and NI 43-101 Technical Report – 2018
Report2018_Final_20180917 202
Lake Sunshine

Beyondie Sulphate of Potash Project JORC (2012) and NI 43-101 Technical Report – 2018
Report2018_Final_20180917 203

Beyondie Sulphate of Potash Project JORC (2012) and NI 43-101 Technical Report – 2018
Report2018_Final_20180917 204
APPENDIX 13: RESOURCE SWATH PLOTS

Beyondie Sulphate of Potash Project JORC (2012) and NI 43-101 Technical Report – 2018
Report2018_Final_20180917 205

Beyondie Sulphate of Potash Project JORC (2012) and NI 43-101 Technical Report – 2018
Report2018_Final_20180917 206

Beyondie Sulphate of Potash Project JORC (2012) and NI 43-101 Technical Report – 2018
Report2018_Final_20180917 207

Beyondie Sulphate of Potash Project JORC (2012) and NI 43-101 Technical Report – 2018
Report2018_Final_20180917 208

Beyondie Sulphate of Potash Project JORC (2012) and NI 43-101 Technical Report – 2018
Report2018_Final_20180917 209