Topical isotretinoin vs. topical retinoic acid in the treatment of acne vulgaris
Upload
khangminh22Category
view
0download
0
EXTEMPORANEOUSLY COMPOUNDED TOPICAL CALCIUM CHANNEL
BLOCKERS FOR WOUNDS AND SKIN ULCERS
by
Arezou Teimouri
Submitted in partial fulfilment of the requirements
for the degree of Master of Science
at
Dalhousie University
Halifax, Nova Scotia
July 2019
© Copyright by Arezou Teimouri, 2019
ii
TABLE OF CONTENTS
LIST OF TABLES ........................................................................................................... iv
LIST OF FIGURES ........................................................................................................ vii
ABSTRACT ....................................................................................................................... x
LIST OF ABREVIATIONS AND SYMBOLS USED .................................................. xi
ACKNOWLEDGEMENTS ........................................................................................... xii
CHAPTER 1 INTRODUCTION ..................................................................................... 1
1.1 ANATOMY AND PHYSIOLOGY OF THE SKIN .............................................................. 1
1.2 WOUND HEALING PROCESS ........................................................................................... 2
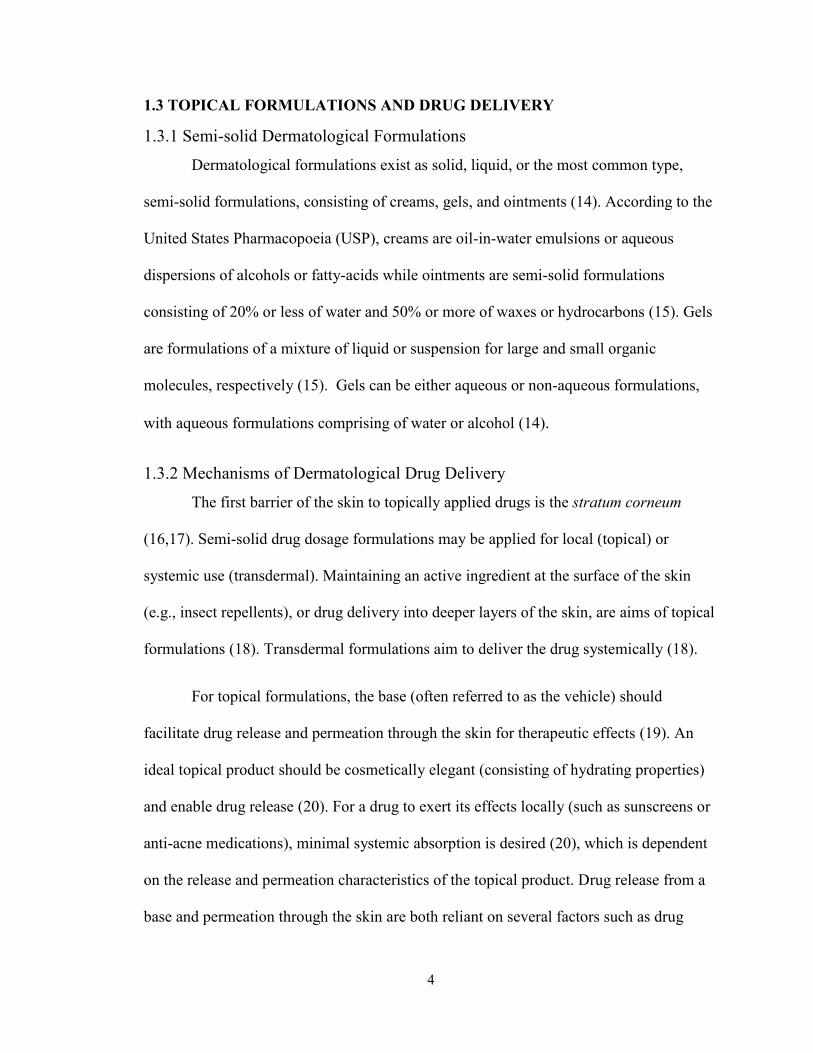
1.3 TOPICAL FORMULATIONS AND DRUG DELIVERY ................................................... 4
1.3.1 Semi-solid Dermatological Formulations ....................................................................... 4
1.3.2 Mechanisms of Dermatological Drug Delivery .............................................................. 4
1.4 CALCIUM CHANNEL BLOCKERS ................................................................................... 5
1.4.1 Pharmacology of Nifedipine and Diltiazem .................................................................... 5
1.4.2 Physicochemical Characteristics of Nifedipine and Diltiazem ....................................... 6
1.4.3 Clinical Application and Research on Topical Use of Calcium Channel Blockers ........ 8
1.5 IN VITRO ASSAYS .............................................................................................................. 9
1.5.1 Drug Release Testing ...................................................................................................... 9
1.5.2 Stability Testing ............................................................................................................ 10
CHAPTER 2 RESEARCH PROPOSAL AND OBJECTIVES .................................. 13
CHAPTER 3 RELEASE AND STABILITY OF COMPOUNDED TOPICAL
NIFEDIPINE ................................................................................................................... 14
3.1 CHEMICALS ...................................................................................................................... 14
3.2 EQUIPMENT AND OTHER SUPPLIES............................................................................ 14
3.3 METHODS .......................................................................................................................... 15
3.3.1 Spectrophotometry Method Validation ......................................................................... 15
3.3.2 HPLC Conditions .......................................................................................................... 17
3.3.3 HPLC Stability Indicating Method Validation ............................................................. 18
3.3.4 Compounding of Formulations ..................................................................................... 19
3.3.5 Drug Extraction Method ............................................................................................... 21
3.3.6 Drug Release Studies .................................................................................................... 22
3.3.7 Stability Testing ............................................................................................................ 24
3.3.8 Data Analysis ................................................................................................................ 26
3.4 RESULTS ............................................................................................................................ 26
iii
3.4.1 Spectrophotometry Method Validation ......................................................................... 26
3.4.2 HPLC Stability Indicating Method Validation ............................................................. 31
3.4.3 Drug Extraction Method ............................................................................................... 37
3.4.4 Nifedipine Release Studies ........................................................................................... 39
3.4.5 Stability Testing: pH Measurement Method and Controls ........................................... 44
3.4.6 Stability of Nifedipine in Glaxal Base™ ...................................................................... 50
3.4.7 Stability of Nifedipine in K-Y® Jelly ........................................................................... 54
3.4.8 Stability of Nifedipine in Aquaphor® Healing Ointment ............................................. 58
3.5 DISCUSSION ...................................................................................................................... 61
CHAPTER 4 RELEASE AND STABILITY OF COMPOUNDED TOPICAL
DILTIAZEM ................................................................................................................... 65
4.1 CHEMICALS ...................................................................................................................... 65
4.2 EQUIPMENT AND OTHER SUPPLIES............................................................................ 65
4.3 METHODS .......................................................................................................................... 66
4.3.1 HPLC Conditions .......................................................................................................... 66
4.3.2 HPLC Stability Indicating Method Validation ............................................................. 67
4.3.3 Compounding of Formulations ..................................................................................... 69
4.3.4 Drug Release Studies .................................................................................................... 70
4.3.5 Stability Testing ............................................................................................................ 70
4.3.6 Drug Extraction Method ............................................................................................... 70
4.3.7 Data Analysis ................................................................................................................ 71
4.4 RESULTS ............................................................................................................................ 72
4.4.1 HPLC Stability Indicating Method Validation ............................................................. 72
4.4.2 Drug Extraction Method ............................................................................................... 76
4.4.3 Diltiazem Release Studies ............................................................................................. 77
4.4.4 Stability Testing: pH Measurement Method and Controls ........................................... 79
4.4.5 Stability of Diltiazem in Glaxal Base™ ........................................................................ 84
4.4.6 Stability of Diltiazem in a Hydroxyethyl Cellulose-based Gel ..................................... 88
4.4.7 Stability of Diltiazem in White Petrolatum ................................................................... 92
4.5 DISCUSSION ...................................................................................................................... 95
CHAPTER 5 SUMMARY AND CONCLUSION ........................................................ 98
5.1 FUTURE RESEARCH ...................................................................................................... 101
BIBLIOGRAPHY ......................................................................................................... 102
iv
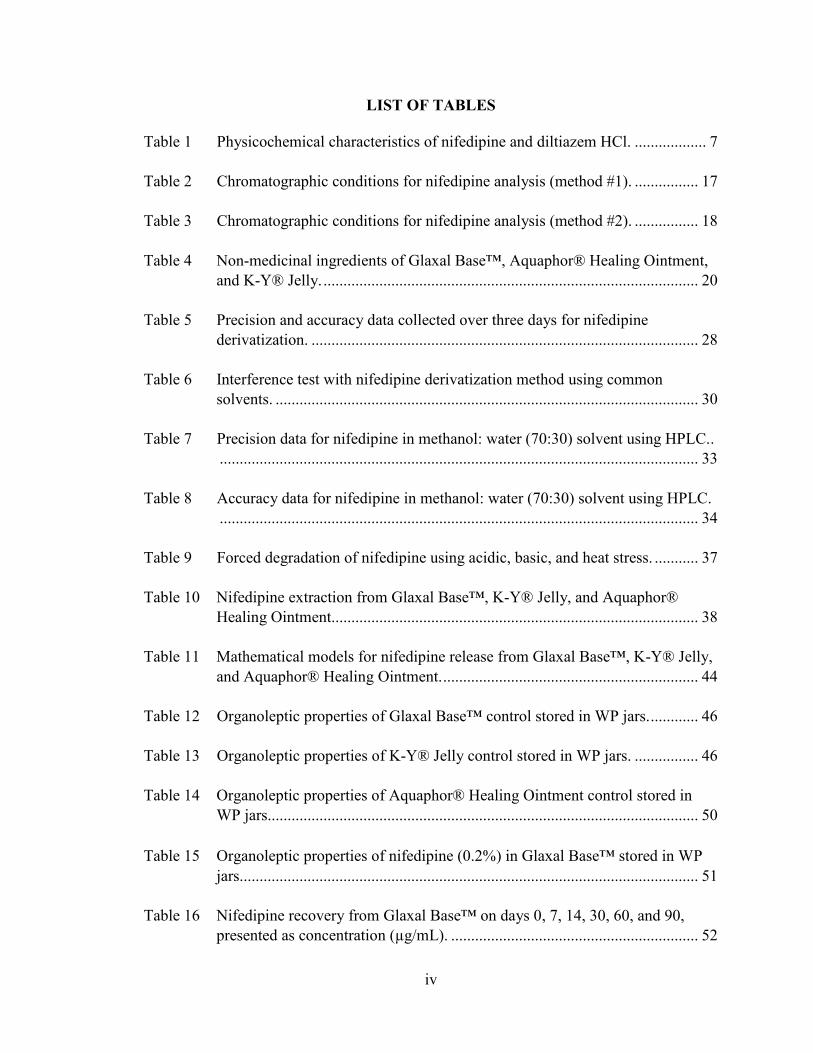
LIST OF TABLES
Table 1 Physicochemical characteristics of nifedipine and diltiazem HCl. .................. 7
Table 2 Chromatographic conditions for nifedipine analysis (method #1). ................ 17
Table 3 Chromatographic conditions for nifedipine analysis (method #2). ................ 18
Table 4 Non-medicinal ingredients of Glaxal Base™, Aquaphor® Healing Ointment,
and K-Y® Jelly. .............................................................................................. 20
Table 5 Precision and accuracy data collected over three days for nifedipine
derivatization. ................................................................................................. 28
Table 6 Interference test with nifedipine derivatization method using common
solvents. .......................................................................................................... 30
Table 7 Precision data for nifedipine in methanol: water (70:30) solvent using HPLC..
........................................................................................................................ 33
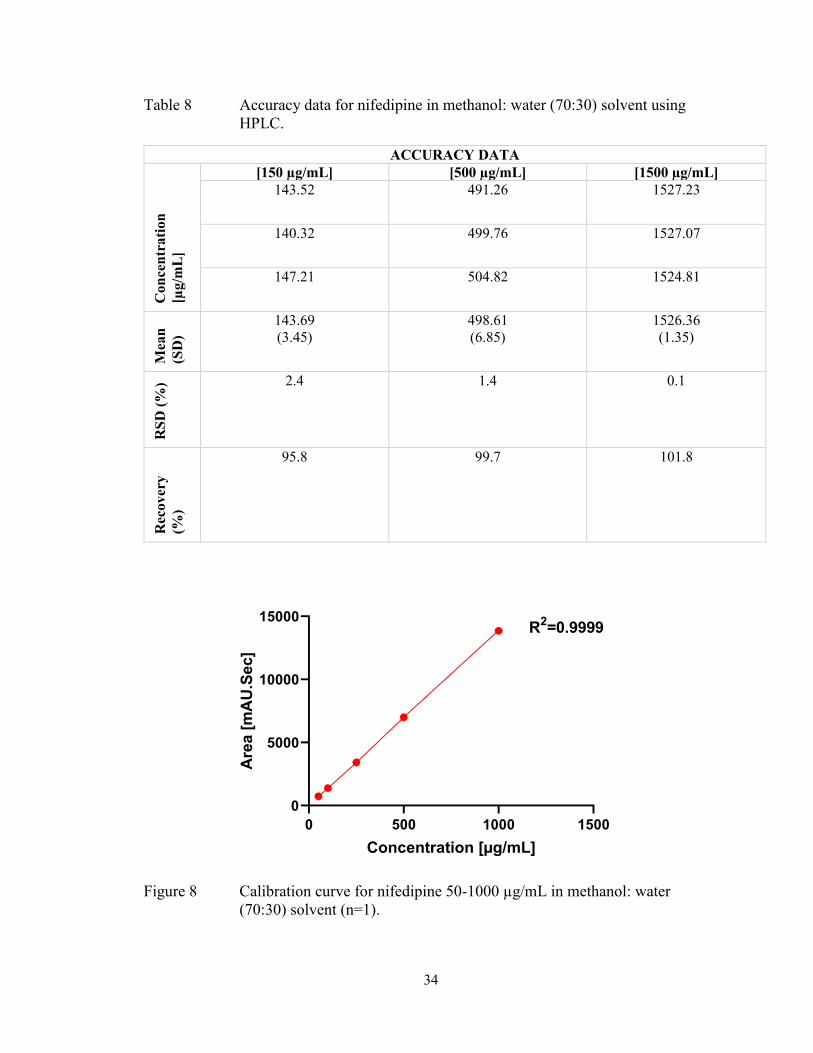
Table 8 Accuracy data for nifedipine in methanol: water (70:30) solvent using HPLC.
........................................................................................................................ 34
Table 9 Forced degradation of nifedipine using acidic, basic, and heat stress. ........... 37
Table 10 Nifedipine extraction from Glaxal Base™, K-Y® Jelly, and Aquaphor®
Healing Ointment............................................................................................ 38
Table 11 Mathematical models for nifedipine release from Glaxal Base™, K-Y® Jelly,
and Aquaphor® Healing Ointment. ................................................................ 44
Table 12 Organoleptic properties of Glaxal Base™ control stored in WP jars. ............ 46
Table 13 Organoleptic properties of K-Y® Jelly control stored in WP jars. ................ 46
Table 14 Organoleptic properties of Aquaphor® Healing Ointment control stored in
WP jars............................................................................................................ 50
Table 15 Organoleptic properties of nifedipine (0.2% in Glaxal Base™ stored in WP
jars................................................................................................................... 51
Table 16 Nifedipine recovery from Glaxal Base™ on days 0, 7, 14, 30, 60, and 90,
presented as concentration (µg/mL). .............................................................. 52
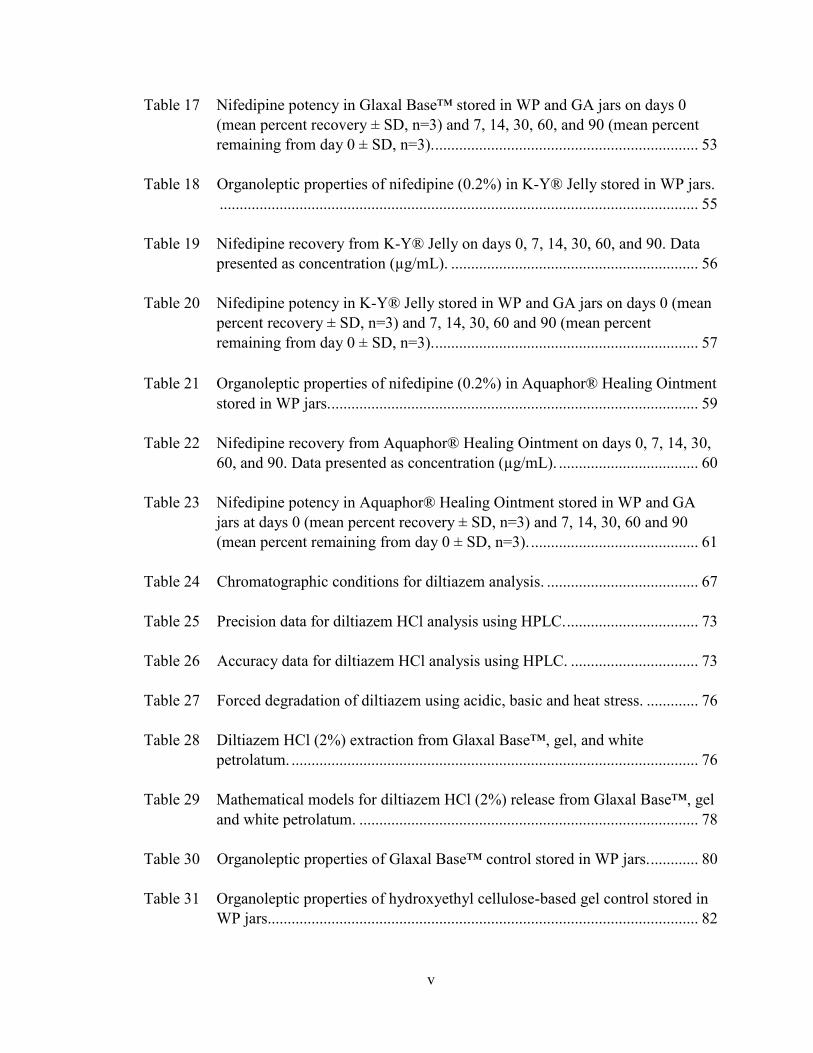
v
Table 17 Nifedipine potency in Glaxal Base™ stored in WP and GA jars on days 0
(mean percent recovery ± SD, n=3) and 7, 14, 30, 60, and 90 (mean percent
remaining from day 0 ± SD, n=3). .................................................................. 53
Table 18 Organoleptic properties of nifedipine (0.2%) in K-Y® Jelly stored in WP jars.
........................................................................................................................ 55
Table 19 Nifedipine recovery from K-Y® Jelly on days 0, 7, 14, 30, 60, and 90. Data
presented as concentration (µg/mL). .............................................................. 56
Table 20 Nifedipine potency in K-Y® Jelly stored in WP and GA jars on days 0 (mean
percent recovery ± SD, n=3) and 7, 14, 30, 60 and 90 (mean percent
remaining from day 0 ± SD, n=3). .................................................................. 57
Table 21 Organoleptic properties of nifedipine (0.2% in Aquaphor® Healing Ointment
stored in WP jars. ............................................................................................ 59
Table 22 Nifedipine recovery from Aquaphor® Healing Ointment on days 0, 7, 14, 30,
60, and 90. Data presented as concentration (µg/mL). ................................... 60
Table 23 Nifedipine potency in Aquaphor® Healing Ointment stored in WP and GA
jars at days 0 (mean percent recovery ± SD, n=3) and 7, 14, 30, 60 and 90
(mean percent remaining from day 0 ± SD, n=3). .......................................... 61
Table 24 Chromatographic conditions for diltiazem analysis. ...................................... 67
Table 25 Precision data for diltiazem HCl analysis using HPLC. ................................. 73
Table 26 Accuracy data for diltiazem HCl analysis using HPLC. ................................ 73
Table 27 Forced degradation of diltiazem using acidic, basic and heat stress. ............. 76
Table 28 Diltiazem HCl (2%) extraction from Glaxal Base™, gel, and white
petrolatum. ...................................................................................................... 76
Table 29 Mathematical models for diltiazem HCl (2%) release from Glaxal Base™, gel
and white petrolatum. ..................................................................................... 78
Table 30 Organoleptic properties of Glaxal Base™ control stored in WP jars. ............ 80
Table 31 Organoleptic properties of hydroxyethyl cellulose-based gel control stored in
WP jars............................................................................................................ 82
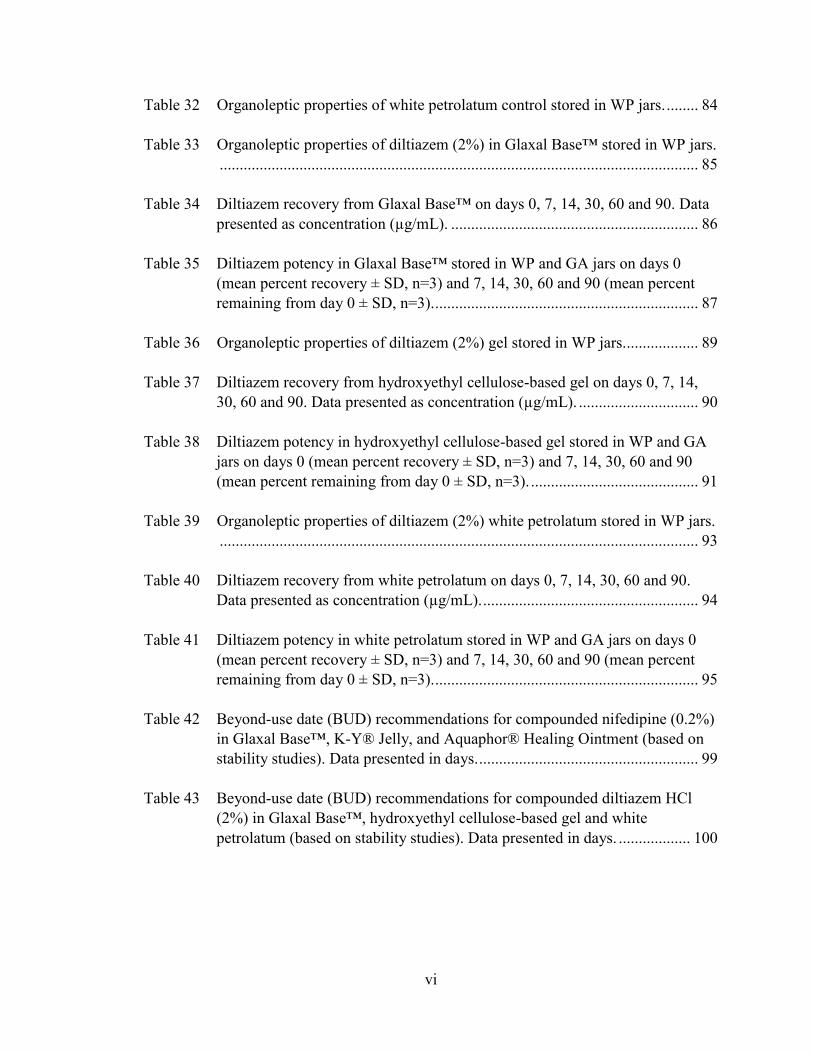
vi
Table 32 Organoleptic properties of white petrolatum control stored in WP jars. ........ 84
Table 33 Organoleptic properties of diltiazem (2%) in Glaxal Base™ stored in WP jars.
........................................................................................................................ 85
Table 34 Diltiazem recovery from Glaxal Base™ on days 0, 7, 14, 30, 60 and 90. Data
presented as concentration (µg/mL). .............................................................. 86
Table 35 Diltiazem potency in Glaxal Base™ stored in WP and GA jars on days 0
(mean percent recovery ± SD, n=3) and 7, 14, 30, 60 and 90 (mean percent
remaining from day 0 ± SD, n=3). .................................................................. 87
Table 36 Organoleptic properties of diltiazem (2%) gel stored in WP jars. .................. 89
Table 37 Diltiazem recovery from hydroxyethyl cellulose-based gel on days 0, 7, 14,
30, 60 and 90. Data presented as concentration (µg/mL). .............................. 90
Table 38 Diltiazem potency in hydroxyethyl cellulose-based gel stored in WP and GA
jars on days 0 (mean percent recovery ± SD, n=3) and 7, 14, 30, 60 and 90
(mean percent remaining from day 0 ± SD, n=3). .......................................... 91
Table 39 Organoleptic properties of diltiazem (2%) white petrolatum stored in WP jars.
........................................................................................................................ 93
Table 40 Diltiazem recovery from white petrolatum on days 0, 7, 14, 30, 60 and 90.
Data presented as concentration (µg/mL). ...................................................... 94
Table 41 Diltiazem potency in white petrolatum stored in WP and GA jars on days 0
(mean percent recovery ± SD, n=3) and 7, 14, 30, 60 and 90 (mean percent
remaining from day 0 ± SD, n=3). .................................................................. 95
Table 42 Beyond-use date (BUD) recommendations for compounded nifedipine (0.2%)
in Glaxal Base™, K-Y® Jelly, and Aquaphor® Healing Ointment (based on
stability studies). Data presented in days. ....................................................... 99
Table 43 Beyond-use date (BUD) recommendations for compounded diltiazem HCl
(2%) in Glaxal Base™, hydroxyethyl cellulose-based gel and white
petrolatum (based on stability studies). Data presented in days. .................. 100

vii
LIST OF FIGURES
Figure 1 A water jacketed Franz diffusion cell captured with iPhone 8 camera and
edited using PowerPoint 2016. ....................................................................... 10
Figure 2 White plastic (A) and glass amber (B) jars used for formulations storage.
Pictures captured with an iPhone 8 camera. ................................................... 26
Figure 3 Absorbance (Abs) versus wavelength (nm) for 100 µg/mL nifedipine in 0.05
M KOH in tertiary butyl alcohol and DMSO. Calibration curve for nifedipine
2 to 100 µg/mL (n=1) (inset figure)................................................................ 27
Figure 4 Calibration plot of nifedipine (2 to 100 µg/mL) using nifedipine in ethanol:
water (70:30) (n=1). ........................................................................................ 31
Figure 5 Chromatogram of nifedipine in methanol solvent (300 µg/mL). ................... 32
Figure 6 Chromatogram of nifedipine (1000 µg/mL) in methanol: water (70:30)
solvent. ............................................................................................................ 32
Figure 7 Calibration curve for nifedipine 50-2000 µg/mL in methanol: water (70:30)
solvent (n=1). .................................................................................................. 33
Figure 8 Calibration curve for nifedipine 50-1000 µg/mL in methanol: water (70:30)
solvent (n=1). .................................................................................................. 34
Figure 9 Chromatograms for forced degradation of nifedipine with acidic (1M HCL)
(A), basic (1M NaOH) (B) and heat (C) conditions (100±1°C). .................... 36
Figure 10 Chromatograms of nifedipine extraction from 2% K-Y® Jelly (A) 0.2% K-
Y® Jelly (B) 0.2% Aquaphor® Healing Ointment (C). ................................. 39
Figure 11 Cumulative amount of nifedipine (μg/mL) that diffused (permeated) through
cellulose filter, cellulose acetate, and mixed cellulose ester membranes. Data
points presented as mean ± SD (n=3). ............................................................ 40
Figure 12 Cumulative release of nifedipine (10% w/w) from Glaxal Base™ and K-Y®
Jelly in ethanol: water 60:40 (A), 70:30 (B), and 80:20 (C). Data points
presented as mean ± SD (n=3). ....................................................................... 41
Figure 13 Cumulative nifedipine 0.2% (A) 2% (B) and 10% (C) release from Glaxal
Base™, K-Y® Jelly, and Aquaphor® Healing Ointment. Data points
presented as mean ± SD (n=3). ....................................................................... 43
viii
Figure 14 pH of nifedipine (0.2%) in Glaxal Base™ and K-Y® Jelly, with direct
measurement (0) and 1:10 dilution. Data is presented as mean ± SD (n=3). . 45
Figure 15 pH of Glaxal Base™ control in WP (A) and GA (B) jars at 23°C, 40°C, and
4°C. Data points presented as mean pH ± SD (n=3). ..................................... 47
Figure 16 pH of K-Y® Jelly control in WP (A) and GA (B) jars at 23°C (WP only),
40°C, and 4°C. Data points presented as mean pH ± SD (n=3). .................... 48
Figure 17 Aquaphor® Healing Ointment control on day 7. Picture captured with iPhone
XS camera. ...................................................................................................... 49
Figure 18 pH of nifedipine (0.2% in Glaxal Base™ in WP (A) and GA (B) jars at 23°C,
40°C, and 4°C. Data points presented as mean pH ± SD (n=3). .................... 54
Figure 19 pH of nifedipine (0.2% in K-Y® Jelly stored in WP (A) and GA (B) jars at
23°C, 40°C, and 4°C. Data points presented as mean pH ± SD (n=3). .......... 58
Figure 20 Nifedipine (0.2% in Aquaphor® Healing Ointment on day 14 in WP (A) and
GA (B) jars at 40±0.5°C. Pictures of day 30, 60, and 90 were similar and not
shown. ............................................................................................................. 59
Figure 21 Diltiazem HCl (1000 µg/mL) in methanol chromatogram. Calibration curve
for diltiazem 80 to 1000 µg/mL (n=1) (inset figure). ..................................... 72
Figure 22 Chromatograms for forced degradation of diltiazem HCl in acidic (1M HCL)
(A), basic (1M NaOH) (B) and heat (C) conditions (100±1°C). Standard
diltiazem 500 µg/mL in methanol is also shown (D). .................................... 75
Figure 23 Cumulative amount of diltiazem (μg/mL) that diffused (permeated) through
cellulose filter, cellulose acetate, and mixed cellulose ester membranes. Data
points presented as mean ± SD (n=3). ............................................................ 77
Figure 24 Cumulative diltiazem HCl (2%) release from Glaxal Base™, hydroxyethyl
cellulose-based gel, and white petrolatum. Data points presented as mean ±
SD (n=3). ........................................................................................................ 78
Figure 25 pH of diltiazem HCl (2%) Glaxal Base™ and gel with 0, 1:5 and 1:10
dilutions. Data is presented as mean pH ± SD (n=3). ..................................... 79
Figure 26 pH of Glaxal Base™ control in WP (A) and GA (B) jars at 23°C (WP only),
40°C, and 4°C. Data points presented as mean pH ± SD (n=3). .................... 81
ix
Figure 27 pH of hydroxyethyl cellulose-based control in WP (A) and GA (B) jars at
23°C (WP only), 40°C, and 4°C. Data points presented as mean pH ± SD
(n=3). .............................................................................................................. 83
Figure 28 pH of diltiazem HCl (2%) in Glaxal Base™ in WP (A) and GA (B) jars at
23°C (WP only), 40°C, and 4°C. Data points presented as mean pH ± SD
(n=3). .............................................................................................................. 88
Figure 29 pH of diltiazem HCl (2%) gel in WP (A) and GA (B) jars at 23°C (WP only),
40°C, and 4°C. Data points presented as mean pH ± SD (n=3). .................... 92
x
ABSTRACT
Compounded topical calcium channel blockers are used for the treatment of
wounds, such as anal fissures and diabetic ulcers. Diltiazem and nifedipine are the
calcium channel blockers with the most evidence for topical use. They are compounded
extemporaneously with cream, gel, and ointment bases. However, drug release and
stability information on these formulations is scarce. This project aimed to: (1) establish
drug release profiles of compounded topical nifedipine and diltiazem in commonly used
cream, gel and ointment bases using Franz diffusion cell system, and (2) determine shelf-
life and beyond-use dates of products stored in white plastic and glass amber containers
at room (23°C), refrigerator (4°C) and elevated (40°C) temperatures for 90 days. The
cream and gel had the highest release and optimal stability for nifedipine and diltiazem,
respectively. This study provides pharmacists with the scientific rationale for
compounding bases selection and storage of topically compounded nifedipine and
diltiazem products.
xi
LIST OF ABREVIATIONS AND SYMBOLS USED
% Percent
® Registered Trademark Symbol
™ Trademark Symbol
BUD Beyond-use date
BC British Columbia
DMSO Dimethyl sulfoxide
DL Detection Limit
GA Glass Amber
h Hour(s)
HCl Hydrochloride
HCL Hydrochloric acid
HPLC High Performance Liquid Chromatography
ICH International Conference on Harmonisation
KOH Potassium hydroxide
mL Millilitre
NaOH Sodium hydroxide
NS Nova Scotia
ON Ontario
PBS Phosphate buffered saline
PEG Polyethylene glycol
PV Poly-vinyl
R2 Coefficient of determination
RPM Rates per minute
RSD Relative Standard Deviation
RT Room Temperature
QC Quality Control
QL Quantification Limit
SD Standard Deviation
USA United States of America
USP United States Pharmacopoeia
WP White Plastic
μg/cm2 Microgram per centimetre square
μg/mL Microgram per millilitre
μL Microlitre
μm Micrometer
xii
ACKNOWLEDGEMENTS
My deepest thanks to Dr. Remigius Agu, my supervisor, for providing me with
the resources, equipment, and guidance for the completion of my research project and
Master of Pharmaceutical Sciences degree. I am grateful for the Pharmacy Endowment
Fund for providing me with a full scholarship to complete my studies. I am also thankful
to Dr. Tannis Jurgens and Dr. Pollen Yeung, my committee members, as well as the
graduate coordinator, Dr. David Jakemen, in their overview of my thesis. It is thanks to
my supervisor’s and committee members’ suggestions that I was able to improve my
research project through revisions and corrections. I would also like to thank Susan
Mansour, the Director of the College of Pharmacy, as well as other College of Pharmacy
staff, for their support. Finally, I am thankful to my family, friends, co-workers and
managers for their support and encouragement. The support and encouragement from my
loved ones has helped me to stay motivated and enthusiastic in completing this project.
1
CHAPTER 1 INTRODUCTION
Compounded topical calcium channel blockers are used for anal fissures treatment
(1) and other wounds, such as diabetic skin ulcers (2,3). These medications are
compounded in community pharmacies with commonly used and readily available bases.
They are assigned beyond-use dates (BUDs) based on compounding guidelines with
scarce literature information on stability. This project aimed to 1) establish drug release
profiles of compounded topical nifedipine and diltiazem with commonly used bases and
2) determine their shelf-life and BUDs, to provide pharmacists with scientific literature
on base selection and stability.
1.1 ANATOMY AND PHYSIOLOGY OF THE SKIN
In the human body, the skin is considered to be the largest organ and consists of
the epidermal and dermal layers (4) with some sources also suggesting a third layer, the
subcutaneous layer (5). The epidermal layer, starting from the outermost layer, is divided
into five layers, which include the stratum corneum, stratum lucidum, stratum
granulosum, stratum spinosum, and stratum basale (5,6). The different layers of the skin
are defined by their position in cell maturation, with the stratum corneum as the final
stage of maturation (4).
The top layer of the skin is the stratum corneum, which sheds continuously (7).
The stratum lucidum is beneath the stratum corneum and is thought to have
waterproofing effects (4). In the next layer, the stratum granulosum, cells undergo
apoptosis (programmed cell death) and consist nearly entirely of the protein keratin that
protects the skin from heat and chemicals (4). The stratum spinosum layer (beneath the
stratum granulosum), consists of Langerhans cells which are a part of the immune system
2
and protect the skin against microorganisms (4,5,8). The first layer of cell maturation is
the stratum basale, where cells divide and proliferate (9). These cells obtain nutrients
from the dermis blood supply and contain cells that produce melanin, which protects the
skin against ultraviolet light (4,9).
Beneath the epidermis is the dermal layer (or dermis) (6,7) which consists of
blood supply with nutrients and includes lymph vessels, glands, nerve fibers, and hair
follicles (4,6). The two dermis layers are the papillary dermis and reticular dermis, which
consist of collagen (6). Collagen and elastin fibers allow the stretching of the skin
without causing damage (4,7).
As the skin is the largest organ of the body, one of its primary functions is to
protect internal organs (5), which it accomplishes by acting as a physical barrier and
preventing dehydration of organs through prevention of fluid loss (4). Body temperature
is also regulated through the skin (6), as is the synthesis of Vitamin D, through a process
mediated by ultraviolet light (9).
1.2 WOUND HEALING PROCESS
Wound healing is a process that involves the four stages of hemostasis,
inflammation, proliferation, and remodeling (10). However, some consider hemostasis
and inflammation as a combined stage (5,11). Hemostasis is the first step in the process
of wound healing (5), and it differentiates acute from chronic wounds, as all stages except
for hemostasis are prolonged in chronic wounds (10). This leads to a longer healing time
with chronic wounds (10). Hemostasis is the process whereby blood vessels constrict and
allow platelets to aggregate in the wound area, leading to growth factors release and
3
recruitment of neutrophils, which begins the inflammatory process within a day of
sustaining the wound (10).
The inflammatory and hemostasis stages take three days in total (11). The
inflammatory mediators, specifically histamine, released during this phase lead to
redness, heat, swelling, and pain (10). Other key players in this process include
neutrophils and macrophages, which are involved in keeping the wound clear of
pathogens (11). Once neutrophils are no longer present, the wound progresses to the
proliferation stage (10).
The proliferative phase is responsible for restructuring the tissue at the wound site
through granulation tissue formation and epithelialization (10). This phase also involves
angiogenesis, the formation of new capillaries (10), which occurs within 3-5 days post-
injury (12). Completion of this phase may take up to three weeks (5,13). Producing new
collagen, elastin, and proteoglycans for tissue repair is the role of fibroblasts in this stage
of wound healing (10). Epithelial cells surrounding the wound migrate to the wound site
in a process called epithelialization (10). Keratinocytes, epithelial cells of the basal layer
of the skin, also begin to proliferate, further contributing to epithelialization (12).
In the remodeling phase, the newly formed capillaries become large vessels, and
scar tissue forms as a result of granulation tissue maturation (10). It is important to note
that the repaired tissue is only ever within 80% of the original (unwounded) tissue's
strength (10,13). Remodeling occurs approximately three weeks after the wound
occurred, marking the end of the wound healing process, yet it may take years for
completion in some cases (13).
4
1.3 TOPICAL FORMULATIONS AND DRUG DELIVERY
1.3.1 Semi-solid Dermatological Formulations
Dermatological formulations exist as solid, liquid, or the most common type,
semi-solid formulations, consisting of creams, gels, and ointments (14). According to the
United States Pharmacopoeia (USP), creams are oil-in-water emulsions or aqueous
dispersions of alcohols or fatty-acids while ointments are semi-solid formulations
consisting of 20% or less of water and 50% or more of waxes or hydrocarbons (15). Gels
are formulations of a mixture of liquid or suspension for large and small organic
molecules, respectively (15). Gels can be either aqueous or non-aqueous formulations,
with aqueous formulations comprising of water or alcohol (14).
1.3.2 Mechanisms of Dermatological Drug Delivery
The first barrier of the skin to topically applied drugs is the stratum corneum
(16,17). Semi-solid drug dosage formulations may be applied for local (topical) or
systemic use (transdermal). Maintaining an active ingredient at the surface of the skin
(e.g., insect repellents), or drug delivery into deeper layers of the skin, are aims of topical
formulations (18). Transdermal formulations aim to deliver the drug systemically (18).
For topical formulations, the base (often referred to as the vehicle) should
facilitate drug release and permeation through the skin for therapeutic effects (19). An
ideal topical product should be cosmetically elegant (consisting of hydrating properties)
and enable drug release (20). For a drug to exert its effects locally (such as sunscreens or
anti-acne medications), minimal systemic absorption is desired (20), which is dependent
on the release and permeation characteristics of the topical product. Drug release from a
base and permeation through the skin are both reliant on several factors such as drug
5
solubility in the base, formulation ingredients (14), and skin variabilities resulting from
age, gender or skin conditions (e.g., psoriasis, eczema) (20). Drug release and
permeation, although related, are often studied in vitro independently of one another.
Although there are other potential methods by which a drug can permeate through the
skin (e.g., transappendageal routes), most drugs diffuse through the skin layers via
intercellular pathways by passive diffusion (17,18).
1.4 CALCIUM CHANNEL BLOCKERS
1.4.1 Pharmacology of Nifedipine and Diltiazem
Nifedipine is a dihydropyridine calcium channel blocker (21), that inhibits the L-
type calcium channels in smooth and cardiac muscles (22). Calcium channels in cardiac
muscles are not available as extensively as in smooth muscle and are thus less affected by
nifedipine at therapeutic doses (21). By blocking the calcium channels, nifedipine can
dilate smooth blood vessels (22). Inhibiting carbonic anhydrase in smooth muscles is
another mechanism by which vasodilation occurs because inhibiting this enzyme causes a
blockage of calcium influx (23). An increase in the supply of oxygen available to the
heart and a decrease in blood pressure are two results of nifedipine's vasodilatory action
(23). With topical use, nifedipine decreases anal pressure and relaxes smooth muscle,
which aids anal fissures healing (24). Calcium channel blockers also increase blood
perfusion to injury sites, allowing wounds such as fissures and diabetic ulcers to heal
(2,25).
Diltiazem is a non-dihydropyridine calcium channel blocker (21) that blocks the
effects of calcium on both smooth and cardiac muscles (22). It does this through three
mechanisms, blocking calcium release from the sarcoplasmic reticulum, blocking the

6
mechanism of ion-gated calcium channels, and possibly damaging or impairing calcium
channels (26). As diltiazem has vasodilatory effects, it can decrease blood pressure and
increase oxygen supply to the heart, similar to nifedipine (26).
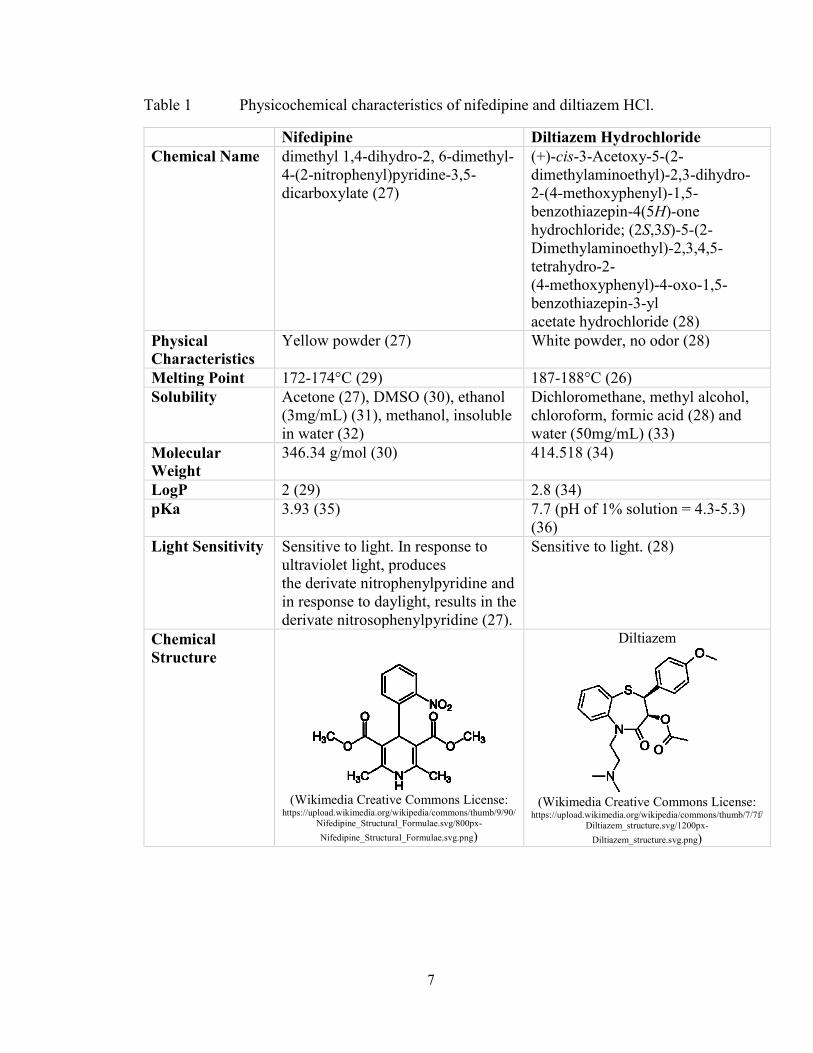
1.4.2 Physicochemical Characteristics of Nifedipine and Diltiazem
Below (Table 1) is a summary of the physicochemical characteristics of
nifedipine and diltiazem hydrochloride (HCl).
7
Table 1 Physicochemical characteristics of nifedipine and diltiazem HCl.
Nifedipine Diltiazem Hydrochloride
Chemical Name dimethyl 1,4-dihydro-2, 6-dimethyl-
4-(2-nitrophenyl)pyridine-3,5-
dicarboxylate (27)
(+)-cis-3-Acetoxy-5-(2-
dimethylaminoethyl)-2,3-dihydro-
2-(4-methoxyphenyl)-1,5-
benzothiazepin-4(5H)-one
hydrochloride; (2S,3S)-5-(2-
Dimethylaminoethyl)-2,3,4,5-
tetrahydro-2-
(4-methoxyphenyl)-4-oxo-1,5-
benzothiazepin-3-yl
acetate hydrochloride (28)
Physical
Characteristics
Yellow powder (27) White powder, no odor (28)
Melting Point 172-174°C (29) 187-188°C (26)
Solubility Acetone (27), DMSO (30), ethanol
(3mg/mL) (31), methanol, insoluble
in water (32)
Dichloromethane, methyl alcohol,
chloroform, formic acid (28) and
water (50mg/mL) (33)
Molecular
Weight
346.34 g/mol (30) 414.518 (34)
LogP 2 (29) 2.8 (34)
pKa 3.93 (35) 7.7 (pH of 1% solution = 4.3-5.3)
(36)
Light Sensitivity Sensitive to light. In response to
ultraviolet light, produces
the derivate nitrophenylpyridine and
in response to daylight, results in the
derivate nitrosophenylpyridine (27).
Sensitive to light. (28)
Chemical
Structure
(Wikimedia Creative Commons License:
https://upload.wikimedia.org/wikipedia/commons/thumb/9/90/
Nifedipine_Structural_Formulae.svg/800px-
Nifedipine_Structural_Formulae.svg.png)
Diltiazem
(Wikimedia Creative Commons License:
https://upload.wikimedia.org/wikipedia/commons/thumb/7/7f/
Diltiazem_structure.svg/1200px-
Diltiazem_structure.svg.png)

8
1.4.3 Clinical Application and Research on Topical Use of Calcium Channel
Blockers
Oral calcium channel blockers have been used for various dermatological
conditions, such as Raynaud's disease, keloid and burn scars, chilblains, erythromelalgia,
calcinosis cutis, and most commonly chronic anal fissures (1). Topical formulations are
used primarily for anal fissures treatment (1,37). Nifedipine and diltiazem are the calcium
channel blockers with the most evidence for treating chronic anal fissures (1). Topical
nifedipine (0.2% and 0.5%) (38,39) and diltiazem (2%) twice daily for eight to twelve
weeks (40,41), have been used for anal fissures treatment. Diltiazem, compounded in
ointment (41), gel (42) and cream (43), had fewer adverse effects with either equal
(41,43) or greater efficacy (42) compared to topical glyceryl trinitrate.
Topical nifedipine’s clinical applications extend to other types of wounds, such as
diabetic ulcers (2,3). In a case report of a 65-year-old patient with a diabetic foot ulcer,
nifedipine 10% gel was effective in healing the wound (2). However, this was used in
conjunction with other wound healing agents (phenytoin and misoprostol) (2). Other case
reports are documented of transdermal nifedipine (2% and 8% in Poloxamer 407 Lecithin
Organo (PLO) gel), applied twice daily for local vasodilation to enhance chronic ulcers
healing (44). In these reports, no systemic adverse effects were observed during the
treatment period (44).
Based on a search of the Health Canada Drug Product Database, a marketed
topical calcium channel product does not currently exist in any formulation in Canada.
However, in Canada, topical calcium channel products can be compounded in
pharmacies. They can be prepared alone or with other ingredients (e.g., lidocaine).

9
1.5 IN VITRO ASSAYS
1.5.1 Drug Release Testing
Drug release and diffusion systems are in vitro methods for assessing drug release
and permeation (14,19,45) by drug diffusion through a membrane (14). They are used to
determine whether a topical medication permeates through the skin to cause systemic
adverse effects (45). Typically, the Franz diffusion cell system is the most used in vitro
drug release testing system for semi-solid formulations (creams, gels, and ointments)
(46).
Each Franz cell contains a donor and receptor chamber with a synthetic or
biological membrane as the division (46). The donor chamber is where the compound of
interest is applied (46,47). The receptor chamber contains receptor fluid in which the
drug of interest is soluble in, to maintain sink conditions (46,47). Typically, phosphate
buffered saline (PBS) or isotonic saline is used as receptor fluid for hydrophilic
compounds (46,47). For hydrophobic compounds, the receptor fluid may be altered to
enhance the solubility of the compound in fluid (46,47). This alternation may include the
addition of surfactants or the use of a water/alcohol mixture (19,47).
The Franz diffusion cell system consists of six cells through which water flows to
maintain the cell temperature (45) at 37°C (14) or 32°C to simulate skin temperature
(47). For drug release studies, the receptor fluid is analyzed at various times (46).
Receptor fluid samples (less than 0.5 mL), are removed with a syringe from the sampling
port (45,47). Receptor fluid is re-added to the cells to replace the amount of fluid
removed (45). The receptor chamber also consists of a magnetic stirrer to mix the
receptor fluid (45).
10
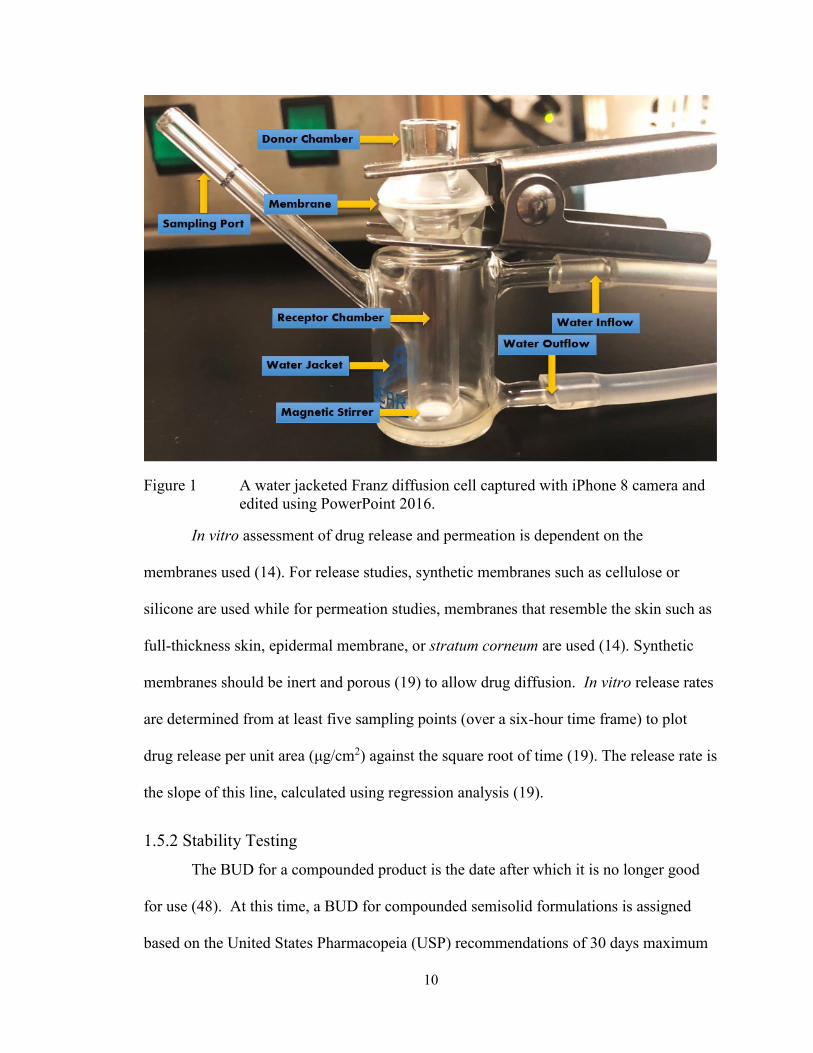
Figure 1 A water jacketed Franz diffusion cell captured with iPhone 8 camera and
edited using PowerPoint 2016.
In vitro assessment of drug release and permeation is dependent on the
membranes used (14). For release studies, synthetic membranes such as cellulose or
silicone are used while for permeation studies, membranes that resemble the skin such as
full-thickness skin, epidermal membrane, or stratum corneum are used (14). Synthetic
membranes should be inert and porous (19) to allow drug diffusion. In vitro release rates
are determined from at least five sampling points (over a six-hour time frame) to plot
drug release per unit area (μg/cm2) against the square root of time (19). The release rate is
the slope of this line, calculated using regression analysis (19).
1.5.2 Stability Testing
The BUD for a compounded product is the date after which it is no longer good
for use (48). At this time, a BUD for compounded semisolid formulations is assigned
based on the United States Pharmacopeia (USP) recommendations of 30 days maximum
11
for water-containing formulations and 180 days or expiration date of any ingredient
(whichever is less) for non-water-containing formulations (48). Stability tests can be
conducted to assign BUDs for compounds using a stability indicating method (which can
also assess potency), to indicate how well a compound maintained its properties from its
initial form (49). Potency, on the other hand, is used for determining the strength of the
drug in the compound, which, according to USP standards, must be within 90-110% or ±
10% (49). Compounds are required to undergo a forced degradation process to ensure
that drug and degradants are separated for stability method development (49). Drug
degradation mechanisms may be determined based on the functional groups present in the
chemical structure of a drug, with common degradation pathways such as hydrolysis,
oxidation, isomerization, and more (50). Hydrolysis is a common method of drug
degradation (51) and is known as a “thermolytic” reaction, indicating that temperature
can affect reaction time with higher temperatures speeding up the reaction (50). A well-
known functional group that undergoes hydrolysis is an ester functional group (50),
present in nifedipine and diltiazem’s chemical structures. Esters can undergo both acidic
and basic hydrolysis, with basic hydrolysis being the faster of the two reactions (50).
Major factors that can affect drug stability include temperature, humidity, light,
and pH (51). In addition to the stability testing, macroscopic and microscopic appearance
of formulations are also assessed (14). Changes in color and phase separation are
examples of macroscopic appearance while observing for particulates using X-ray
diffraction is an example of microscopic appearance (14). Microbial contamination with
the development of odor is also considered (14). To reduce any potential for skin
irritation, pH considerations are important, and typically, most products are formulated in
12
the pH range of 5-6.5, which is similar to skin pH (14). According to the USP, a drop in
pH of one unit may signify product instability by a factor of at least ten (52). According
to Trissel's™ Stability of Compounded Formulations, diltiazem is most stable in the pH
range of 5-6 and degrades at higher pH (7-8) (53).
13
CHAPTER 2 RESEARCH PROPOSAL AND OBJECTIVES
Compounded topical calcium channel blockers are used for healing anal fissures
(1). By decreasing anal pressure, relaxing smooth muscles (24) and increasing blood
perfusion to the lesion sites (25), topical calcium channel blockers have shown efficacy in
healing fissures (37). Based on their pharmacological action and clinical efficacy in
healing fissures, these drugs are hypothesized to heal other types of wounds as well.
In community pharmacies, calcium channel blockers are compounded with
commonly used and readily available bases (i.e., white petrolatum, Aquaphor® Healing
Ointment, Glaxal Base™, Dermabase emulsion, K-Y® Jelly, Secaris® or in the case of
diltiazem, a hydroxyethyl cellulose-based gel). At present, studies on the release,
permeation, and stability of topical nifedipine and diltiazem do not include these bases
(3,54-56). Although nifedipine stability in white petrolatum was assessed (57), other
standard bases have not been studied.
Therefore, the objectives of this research are:
1. To establish drug release profiles of compounded topical nifedipine and diltiazem
HCl in commonly used bases such as a cream (Glaxal Base™), gel (K-Y®
Jelly, hydroxyethyl cellulose-based gel, respectively) and ointment base
(Aquaphor® Healing Ointment, white petrolatum, respectively)
2. To establish the shelf-life and BUDs for the compounded products.
14
CHAPTER 3 RELEASE AND STABILITY OF COMPOUNDED TOPICAL
NIFEDIPINE
3.1 CHEMICALS
Polyethylene Glycol 400 (PEG) NF (Lot: 14700-7326), vegetable glycerine 99%
USP (Lot: 07001-8136) and heavy mineral oil USP (Lot: 06919-8052) were obtained
from Galenova (Saint-Hyacinthe, QC, Canada). Nifedipine USP crystalline powder (Lot:
66548) was acquired from Xenex Laboratories Inc. (Coquitlam, BC, Canada). Glaxal
Base™ cream (Lot: A152264-17205B10 and A160828-18029B10), K-Y® Jelly (Lot:
7264K2 and 7331K2), and Aquaphor® Healing Ointment (Lot: 81554557) were
purchased from Shoppers Drug Mart Pharmacy (Dartmouth, NS, Canada) and Costco
Wholesale (Dartmouth, NS, Canada). Tert-Butyl alcohol, ACS, 99+% (Alfa Aesar, Lot:
P10E020), and dichloromethane (Lot#: SHBC2130V) were purchased from Sigma-
Aldrich (Oakville, ON, Canada). Ethyl alcohol anhydrous (ethanol, Lot: 026135) was
acquired from Greenfield Global (Brampton, ON, Canada). A Barnstead Nanopure II
filtering system was used to process deionized water (18 Ω) in the laboratory.
Chloroform liquid (Lot: 63906) was bought from Xenex Laboratories Inc. (Coquitlam,
BC, Canada). Acetonitrile (Lot: 171203), methanol HPLC Grade (Lot: 178823), dimethyl
sulfoxide (DMSO, Lot: 172592) and potassium hydroxide (KOH, Lot: 114538) were
supplied by Fisher Scientific (Ottawa, ON, Canada). Phosphate Buffered Saline (PBS)
20X (Lot: l2614) and sodium chloride USP (Lot: MAY136BA) were purchased from
Santa Cruz Biotechnology, Inc. (Dallas, TX, USA) and Medisca® Pharmaceutique Inc.
(Montreal, QC, Canada), respectively.
3.2 EQUIPMENT AND OTHER SUPPLIES
The Franz diffusion cell system from PermeGear Inc. (Hellertown, PA, USA),
included the V-series stirrer (V6-CA-01), six Franz cells (9 mm clear jacketed, 5 mL
15
receptor volume, 0.64 cm2 orifice with flat ground joint), pinch clamps and stir bars.
Franz diffusion sampling pipette tips were also purchased from Permegear Inc. The
system was attached to the Lauda Ecoline E100 water bath circulator (Lauda-
Koenigshofen, Germany) for temperature regulation. An infrared thermometer with dual-
laser-points-focus function (DT600 D:S=16:1, -50°C~600°C) was used for temperature
monitoring. Branson 3510 Ultrasonic was purchased from Marshal Scientific
(Cambridge, MA, USA). Cellulose filter paper [Fisher Scientific (Ottawa, ON, Canada)],
cellulose acetate membrane [0.47 µm; Geotech Environmental Euipment Inc. (Denver,
CO. USA)] and mixed cellulose ester (nitrate and acetate) membranes [0.45 µm;
Merck™ Millipore (Etobicoke, ON, Canada)] were used for drug release assays. White
plastic jars (1 oz) with white plastic foam liner caps and glass amber jars (25 mL) with
white plastic poly-vinyl (PV) caps were bought from Galenova (Saint-Hyacinthe, QC,
Canada). The Fischerbrand™ Digital Vortex and a Mettler Toledo™ Micro pH
Electrode: LE422 (attached to a Hanna Instruments HI 2209 pH meter) were obtained
through Fischer Scientific (Ottawa, ON, Canada). For the spectrophotometric analysis, a
Cary 50 UV-Vis (Serial: #03037676; Varian Inc., CA, USA) spectrophotometer was
used. For HPLC sample analysis, a Varian-920 Liquid Chromatograph was used with a
Brava ODS C18 5 μm 130Å 250 x 4.6 mm Column (Lot: 39/004) from Altech Associates
Inc. (Deerfield, IL, USA). A µP Triple-Trak™ incubator from LAB-LINE Instruments
Inc. was used for temperature regulation (40°C).
3.3 METHODS
3.3.1 Spectrophotometry Method Validation
Due to the low absorbance of nifedipine alone, a previously validated
derivatization method (58) was used for the spectrophotometric determination of
16
nifedipine. In this method, potassium hydroxide (KOH) in dimethyl sulfoxide (DMSO)
reacts with the nitro group in nifedipine to form nitroquinoid ion, providing an orange-red
color (58). All quantities used in the original method (58) were divided by four. In-house
method validation was therefore designed based on the International Conference on
Harmonisation (ICH) guidelines (59). Linearity, precision (inter- and intra-day),
accuracy, range, detection limit (DL) and quantification limit (QL) were tested (59). The
DL and QL were calculated by multiplying the standard deviation of the y-intercepts of
regression lines by 3.3 and 10, respectively, and then dividing by the slope of the
calibration curve (59).
A stock solution of nifedipine 1 mg/mL in DMSO was prepared in a 15 mL
centrifuge tube covered with aluminum foil. Various aliquots of this solution ranging
from 5 to 250 L, were used to make a calibration curve (2 to 100 g/mL). To each
aliquot 150 L of 0.05 M KOH in tertiary butyl alcohol was added and the volume
adjusted to 2.5 mL with DMSO. All solutions were prepared fresh daily with 0.05 M
KOH in tertiary butyl alcohol heating at 100°C to increase the solubility of KOH.
Absorbance was measured for 100 g/mL solution, using a reagent blank for comparison.
For precision assessment, three separate quality control (QC) of low, intermediate
and high (5 µg/mL, 40 µg/mL, 100 µg/mL) concentrations were analyzed with the
spectrophotometer in triplicate over three different days. Inter- and intra-day precision
were both assessed. To assess accuracy, three separate concentrations (7 g/mL, 30
g/mL, 80 g/mL) in triplicate were analyzed on three different days. The interval
between the maximum and minimum concentrations for which there was considerable
linearity, precision, and accuracy was determined as the range (59).
17
In addition to the method validation, several solvents were tested to determine
whether there was interference with the derivatization process. These solvents were
chosen based on either their use as receptor fluid for the Franz cell or as solvents to be
used for drug extraction methods. A 1 mg/mL solution of nifedipine in each of these
solvents (1:10 DMSO: PBS, acetonitrile, ethanol: water (50:50), ethanol: water (60:40),
ethanol: water (70:30), ethanol: water (80:20), methanol, saline water 0.9% NaCl,
chloroform and dichloromethane) was prepared. These solutions were derivatized, in
triplicate, to obtain 100 µg/mL of each. Additionally, a calibration curve was made with 1
mg/mL of nifedipine in ethanol: water (70:30) stock solution.
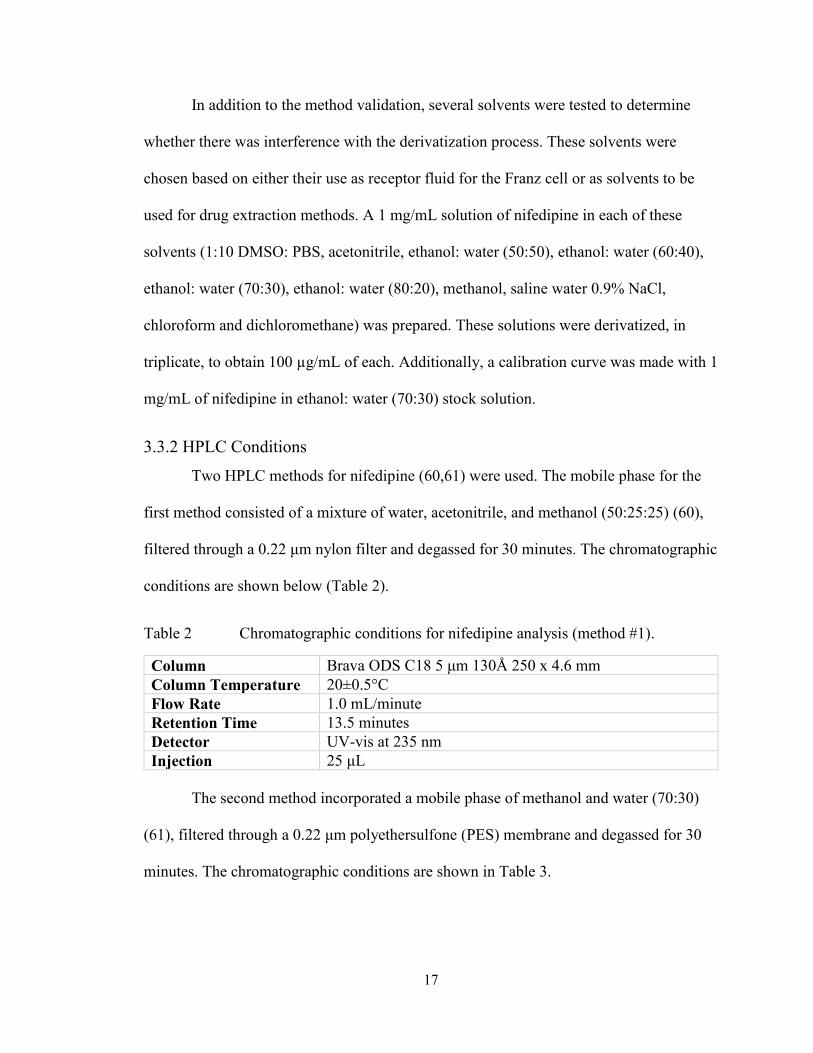
3.3.2 HPLC Conditions
Two HPLC methods for nifedipine (60,61) were used. The mobile phase for the
first method consisted of a mixture of water, acetonitrile, and methanol (50:25:25) (60),
filtered through a 0.22 μm nylon filter and degassed for 30 minutes. The chromatographic
conditions are shown below (Table 2).
Table 2 Chromatographic conditions for nifedipine analysis (method #1).
Column Brava ODS C18 5 μm 130Å 250 x 4.6 mm
Column Temperature 20±0.5°C
Flow Rate 1.0 mL/minute
Retention Time 13.5 minutes
Detector UV-vis at 235 nm
Injection 25 μL
The second method incorporated a mobile phase of methanol and water (70:30)
(61), filtered through a 0.22 μm polyethersulfone (PES) membrane and degassed for 30
minutes. The chromatographic conditions are shown in Table 3.

18
Table 3 Chromatographic conditions for nifedipine analysis (method #2).
Column Brava ODS C18 5 μm 130Å 250 x 4.6 mm
Column Temperature 40±0.5°C
Flow Rate 1.2 mL/minute
Retention Time 3.5 minutes
Detector UV-vis at 262 nm
Injection 20 μL
3.3.3 HPLC Stability Indicating Method Validation
In-house stability indicating validation based on the ICH guidelines was
conducted for the second HPLC method (61) used for analyses. Linearity, specificity,
precision (inter- and intra-day), accuracy, range, DL and QL were tested (59). The DL
and QL were calculated by multiplying the standard deviation of the y-intercepts of
regression lines by 3.3 and 10, respectively, and then dividing by the slope of the
calibration curve (59).
Linearity was assessed in the range of 50-2000 g/mL using seven calibration
points plotted against Area[mAU/Sec]. To assess precision, three separate QC of low,
intermediate, and high (150 g/mL, 500 g/mL, 1500 g/mL) concentrations were
analyzed in triplicate over three different days. Inter- and intra-day precision were
assessed. To evaluate accuracy, three separate concentrations (150 g/mL, 500 g/mL,
1500 g/mL) in triplicate were analyzed. The interval between the maximum and
minimum concentrations for which there was considerable linearity, precision, and
accuracy was determined as the range (59). Specificity was assessed using forced
degradation and drug extraction methods.
Forced degradation methods were employed for in-house stability indicating
validation. Three forced degradation methods were selected (acidic, basic and heat stress)

19
(61,62), with adjustments. For all stress tests, 0.02±0.001 g of nifedipine was weighed
into a 25 mL volumetric flask. For acidic stress, 0.5 mL of 0.1M HCL and for basic
stress, 0.5 mL of 0.1M NaOH was added and maintained at 40±0.5°C in an incubator
(dry heat) for three days. Afterwards, 0.5 mL of 0.1M NaOH and 0.5 mL of 0.1M HCL
were added to the acidic and basic stress tests, respectively, after cooling. The heat stress
test was also maintained at 40±0.5°C for three days. The final volume for all three
solutions was adjusted to 25 mL with methanol, to a final concentration of 800 µg/mL.
In the second method, 0.5 mL of 1M HCL for acidic stress, and 0.5 mL of 1M
NaOH for basic stress, were added to nifedipine. Solutions were kept at 40±0.5°C in an
incubator (dry heat) for six days. After cooling, 0.5 mL of 1M NaOH and 0.5mL of 1M
HCL were added to the acidic and basic stress tests, respectively. The heat stress test was
maintained at 40±0.5°C for 14 days. The final volume for all solutions was adjusted to 25
mL with methanol, to a final concentration of 800 µg/mL.
In the third method, nifedipine (0.02±0.001 g) was weighed into 50 mL centrifuge
tubes. For acidic stress, 1 mL of 1M HCL, and for basic stress, 1 mL of 1M NaOH were
added. Solutions were maintained at 100±1°C for 3 hours (h) in a water bath (wet heat).
After cooling, 1 mL of 1M NaOH and 1 mL of 1M HCL were added to the acidic and
basic stress tests, respectively. The heat stress test was also maintained at 100±1°C for 3
h. The final volume of all solutions was adjusted to 20 mL with methanol, to a final
concentration of 1000 µg/mL.
3.3.4 Compounding of Formulations
Nifedipine 0.2, 2, and 10% (w/w) were compounded with the ointment
(Aquaphor® Healing Ointment), cream (Glaxal Base™) and gel (K-Y® Jelly) bases,
according to the compounding formulas available to pharmacists. For all formulations,
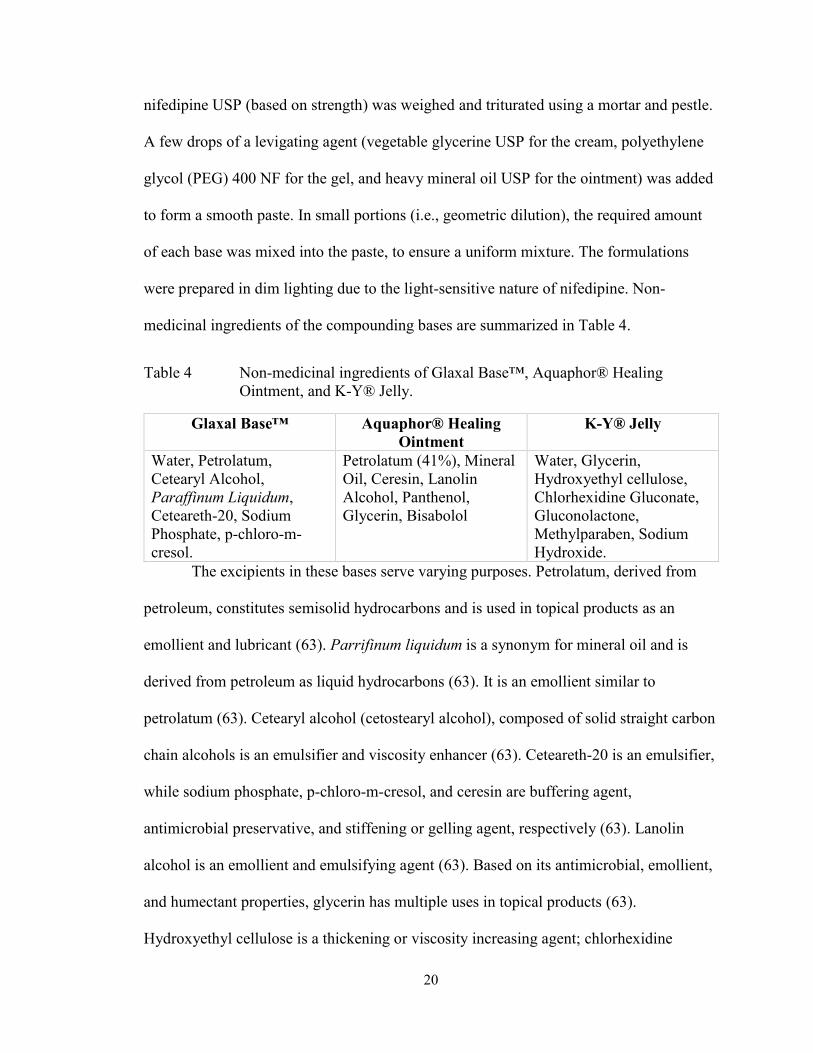
20
nifedipine USP (based on strength) was weighed and triturated using a mortar and pestle.
A few drops of a levigating agent (vegetable glycerine USP for the cream, polyethylene
glycol (PEG) 400 NF for the gel, and heavy mineral oil USP for the ointment) was added
to form a smooth paste. In small portions (i.e., geometric dilution), the required amount
of each base was mixed into the paste, to ensure a uniform mixture. The formulations
were prepared in dim lighting due to the light-sensitive nature of nifedipine. Non-
medicinal ingredients of the compounding bases are summarized in Table 4.
Table 4 Non-medicinal ingredients of Glaxal Base™, Aquaphor® Healing
Ointment, and K-Y® Jelly.
Glaxal Base™ Aquaphor® Healing
Ointment
K-Y® Jelly
Water, Petrolatum,
Cetearyl Alcohol,
Paraffinum Liquidum,
Ceteareth-20, Sodium
Phosphate, p-chloro-m-
cresol.
Petrolatum (41%), Mineral
Oil, Ceresin, Lanolin
Alcohol, Panthenol,
Glycerin, Bisabolol
Water, Glycerin,
Hydroxyethyl cellulose,
Chlorhexidine Gluconate,
Gluconolactone,
Methylparaben, Sodium
Hydroxide.
The excipients in these bases serve varying purposes. Petrolatum, derived from
petroleum, constitutes semisolid hydrocarbons and is used in topical products as an
emollient and lubricant (63). Parrifinum liquidum is a synonym for mineral oil and is
derived from petroleum as liquid hydrocarbons (63). It is an emollient similar to
petrolatum (63). Cetearyl alcohol (cetostearyl alcohol), composed of solid straight carbon
chain alcohols is an emulsifier and viscosity enhancer (63). Ceteareth-20 is an emulsifier,
while sodium phosphate, p-chloro-m-cresol, and ceresin are buffering agent,
antimicrobial preservative, and stiffening or gelling agent, respectively (63). Lanolin
alcohol is an emollient and emulsifying agent (63). Based on its antimicrobial, emollient,
and humectant properties, glycerin has multiple uses in topical products (63).
Hydroxyethyl cellulose is a thickening or viscosity increasing agent; chlorhexidine

21
gluconate has antimicrobial activity against gram-positive and gram-negative bacteria as
well as some fungi, and methylparaben is a preservative (63). For pH adjustment,
gluconolactone, an acidulant and sodium hydroxide, an alkalizing agent are used (63).
Interestingly, bisabolol is derived from the chamomile plant and is used in topical
products for its anti-inflammatory and healing properties (64). Similarly, panthenol
reduces inflammation and has potential healing properties (65).
3.3.5 Drug Extraction Method
Nifedipine extraction from Glaxal Base™, K-Y® Jelly, and Aquaphor® Healing
Ointment was performed using 0.2 and 2% (w/w) concentrations. Several methods were
tried. The methods that resulted in the highest precision and accuracy are described. All
methods were conducted in triplicate to obtain mean recovery (%).
Nifedipine 2% (w/w) in Glaxal Base™, K-Y® Jelly, and Aquaphor® Healing
Ointment was weighed (0.1±0.01 g) into 15 mL centrifuge tubes. For the gel, 5 mL of
methanol was added, sonicated for 10 minutes at 60±1°C, then centrifuged (2000 RPM)
at 22±1°C for 10 minutes. For the cream, 5 mL of methanol was added, vortexed (1500
RPM) for 1 minute, then sonicated for 15 minutes at 30±1°C. This was subsequently
vortexed (1500 RPM) for an additional 2 minutes and centrifuged (2000 RPM) at 14±1°C
for 10 minutes. For the ointment, 5 mL of methanol was added, vortexed (1500 RPM) for
5 minutes, then sonicated for 60 minutes at 60±1°C. The mixture was vortexed (1500
RPM) for another 5 minutes and centrifuged at 22±1°C for 10 minutes. An aliquot of
each mixture was pipetted into HPLC vials.
22
Nifedipine 0.2% (w/w) extraction from Glaxal Base™, K-Y® Jelly, and
Aquaphor® Healing Ointment was completed using the methods for the 2%
formulations, except that 0.25±0.01 g of each formulation was used.
3.3.6 Drug Release Studies
The Franz diffusion cell system (5 mL, 0.64 cm2) was set up according to the
manufacturer's instructions. It was attached to the Lauda Ecoline E100 water bath
circulator, maintained at a temperature of 37°C (14) to simulate the human skin
temperature (34-35°C, monitored with an infrared thermometer). The system was run for
1 h before each experiment. The receptor fluid was degassed using the Branson 3510
Ultrasonic for 1 h to reduce bubble formation during the assay. As nifedipine is a
lipophilic drug with poor aqueous solubility (29,32), a mixture of ethanol/water was
chosen for the receptor fluid. Membranes used for drug release studies were hydrated in
the receptor fluid for 1 h. A magnetic stirrer (600 rpm) was placed in each receptor
chamber.
Using a pipette, each receptor chamber was filled with 5 mL of receptor fluid.
Hydrated membranes were placed slowly on each receptor chamber orifice using a flat
tweezer, ensuring no spillage of receptor fluid and no formation of bubbles in the
chamber. Teflon® O-rings were placed on the membranes, and 0.1±0.03 g of each
formulation was applied on the orifice. On a scale, a spatula on a weigh board was tared,
then used to scoop out the formulation and re-weighed. After applying the formulation on
the orifice, the spatula was re-weighed to calculate the amount of the formulation applied
to the membrane. The donor chambers were placed on top of the Teflon® O-rings,
clamped and covered with layers of Parafilm®. The sampling port was covered with both

23
parafilm and aluminum foil. The Franz diffusion cell system was covered with aluminum
foil for the duration of the experiment due to the light-sensitive nature of nifedipine.
Sampling (0.5 mL) was completed at 0.5, 1, 1.5, 2, 3, 4, and 6 h using sampling
pipette tips specific for the Franz diffusion cell system. The receptor chamber was refilled
with receptor fluid after each sampling, to maintain sink conditions and membrane
contact with the fluid. Samples were maintained in the dark for the duration of the
experiment and analyzed on the same day or placed in cold storage (-80°C) for later
analysis. Experiments for each formulation were conducted in triplicate, and the mean
cumulative release (%) was calculated using equation 1. To determine the mechanism of
drug release, the following mathematical models were used: Higuchi, Zero order, First
order, and Hixson-Crowell model (66,67).
𝑪𝒖𝒎𝒖𝒍𝒂𝒕𝒊𝒗𝒆 𝑹𝒆𝒍𝒆𝒂𝒔𝒆 (%): (𝑽𝒔
𝑽𝒇) 𝒙𝑷(𝒕 − 𝟏) + 𝑷𝒕 ... Equation 1
Where Vs = volume of sample withdrawn, Vf = volume of Franz diffusion cell, Pt =
percentage release at time t and P(t-1) = percentage release of time previous to ‘t’.
For membrane selection (nifedipine release studies), 0.5 mL of a liquid
preparation of nifedipine (10 mg/mL) in receptor fluid [ethanol: water (80:20)] was
placed in the donor chamber of the Franz diffusion cell. Cellulose filter paper, cellulose
acetate and mixed cellulose ester membranes were hydrated in receptor fluid (ethanol:
water 80:20) for 1 h before the study. The release assay was conducted as in section
3.3.6. To calculate the cumulative amount that diffused (permeated) through each
membrane, equation 2 was used.
24
𝑪𝒏 = 𝑪′𝒏 +𝑽𝒔
𝑽𝒕(𝑪′𝒏 − 𝟏 + ⋯ + 𝑪′𝟏) … Equation 2
Where C'n, C’n-1, C’1 = concentration at n, previous sample, and first sample
respectively. Vs = volume of sample in the donor chamber and Vt = volume of sample in
Franz diffusion.
Additionally, to determine whether the receptor fluid would result in a difference
in nifedipine release, nifedipine 10% (w/w) in Glaxal Base™ and K-Y® Jelly were tested
in the following receptor fluids: ethanol: water (60:40), (70:30) and (80:20). Experiments
for each formulation were conducted in triplicate, and the mean cumulative release (%)
was calculated using equation 1 above.
3.3.7 Stability Testing
Compounded nifedipine 0.2% (w/w) in Glaxal Base™, K-Y® Jelly, and
Aquaphor® Healing Ointment, were placed in white plastic (WP) and glass amber (GA;
Figure 2) jars in 20 g quantities, in triplicate. Compounds were stored at refrigerator
(4±3°C), room (23±2°C) and elevated (40±0.5°C) temperatures. Different storage
temperatures were tested for formulation stability as patients may store compounded
products differently than recommended. For example, patients may consider storing
products in the fridge to enhance shelf-life and stability. Products may also be exposed to
higher temperatures accidentally during the summertime. Different storage containers
were also tested as WP jars are the most common and less expensive option for
dispensing topical compounded products, while the GA jars are used for products that are
considered light-sensitive.
25
Formulations were analyzed based on organoleptic properties such as color
homogeneity, phase separation, texture, odor, and application on the skin. Additionally,
the compounding bases and levigating agents alone were used as a control for monitoring
organoleptic and pH changes in the absence of drug at 4, 23, and 40°C for the gel and
cream, and 4 and 40°C for the ointment. The pH of the formulations was measured using
a microelectrode pH meter. The pH meter was calibrated according to standard
calibration methods using buffer solutions with pH of 4 and 7. The pH of freshly
prepared nifedipine 0.2% (w/w) in Glaxal Base™ and K-Y® Jelly and a 1:10 dilution
method in deionized water were compared to determine the difference in dilution
methods for pH monitoring. According to the USP, pH measurements may not be
required when the topical formulation contains a limited quantity of water (68).
Therefore, pH measurements for the ointments were not conducted as part of the stability
testing in this project.
At 0, 7, 14, 30, 60 and 90 days, 1±0.5 g samples of the compounded nifedipine
formulations were collected, stored in 1.5 mL microcentrifuge tubes, and kept in the dark
at -80°C for later data analysis. Control formulations (bases and levigating agents) were
analyzed on the same day.

26
Figure 2 White plastic (A) and glass amber (B) jars used for formulations storage.
Pictures captured with an iPhone 8 camera.
3.3.8 Data Analysis
Two-way ANOVA with Tukey’s post-hoc test was performed using GraphPad
Prism (Version 8.0, GraphPad Software, San Diego California, USA) to assess the
statistical differences between cumulative mean release (%) amongst the three
formulations (cream, gel, ointment). This approach was also used to statistically analyze
the differences between mean pH and mean potency of nifedipine in each formulation
versus time zero at the three different temperatures. A p-value of <0.05 was considered
significant for all statistical analyses. Additionally, USP recommended potency limits
(90-110%) (49), pH (change of 1-unit considered clinically significant) (52), and
organoleptic properties were considered for stability tests.
3.4 RESULTS
3.4.1 Spectrophotometry Method Validation
Scans of derivatized nifedipine 100 µg/mL gave a clear peak at 430 nm and
linearity was observed within a calibration range of 2-100 µg/mL (Figure 3).
A B

27
Figure 3 Absorbance (Abs) versus wavelength (nm) for 100 µg/mL nifedipine in
0.05 M KOH in tertiary butyl alcohol and DMSO. Calibration curve for
nifedipine 2 to 100 µg/mL (n=1) (inset figure).
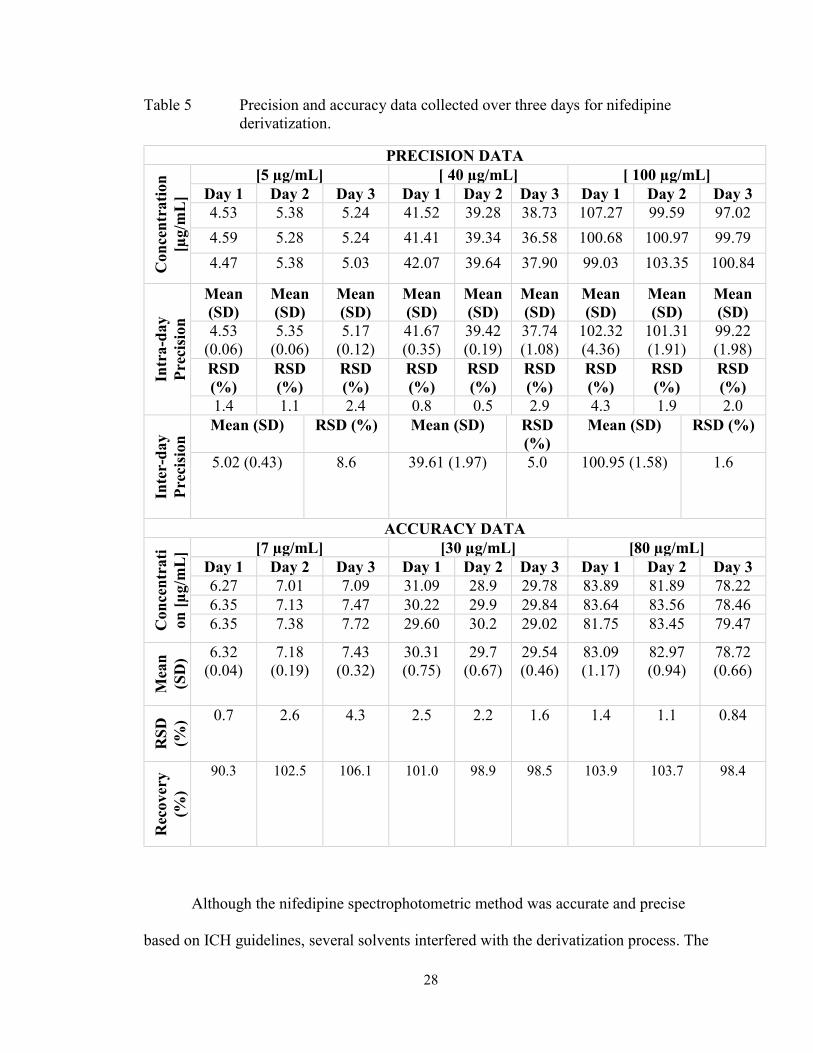
Table 5 shows that the method is both accurate (mean percent recovery 90-110%)
and precise (RSD% <10). Based on these results, the range was determined to be 5-100
µg/mL. The DL and QL were calculated as 3.41 and 10.33 µg/mL, respectively.
0 50 100 150
0
1
2
3
4
Concentration [µg/mL]
Ab
so
rban
ce (
Ab
s)
R2=0.9993
28
Table 5 Precision and accuracy data collected over three days for nifedipine
derivatization.
PRECISION DATA C
on
cen
trati
on
[µg/m
L]
[5 µg/mL] [ 40 µg/mL] [ 100 µg/mL]
Day 1 Day 2 Day 3 Day 1 Day 2 Day 3 Day 1 Day 2 Day 3
4.53 5.38 5.24 41.52 39.28 38.73 107.27 99.59 97.02
4.59 5.28 5.24 41.41 39.34 36.58 100.68 100.97 99.79
4.47 5.38 5.03 42.07 39.64 37.90 99.03 103.35 100.84
Intr
a-d
ay
Pre
cisi
on
Mean
(SD)
Mean
(SD)
Mean
(SD)
Mean
(SD)
Mean
(SD)
Mean
(SD)
Mean
(SD)
Mean
(SD)
Mean
(SD)
4.53
(0.06)
5.35
(0.06)
5.17
(0.12)
41.67
(0.35)
39.42
(0.19)
37.74
(1.08)
102.32
(4.36)
101.31
(1.91)
99.22
(1.98)
RSD
(%)
RSD
(%)
RSD
(%)
RSD
(%)
RSD
(%)
RSD
(%)
RSD
(%)
RSD
(%)
RSD
(%)
1.4 1.1 2.4 0.8 0.5 2.9 4.3 1.9 2.0
Inte
r-d
ay
Pre
cisi
on
Mean (SD) RSD (%) Mean (SD) RSD
(%)
Mean (SD) RSD (%)
5.02 (0.43) 8.6 39.61 (1.97) 5.0 100.95 (1.58) 1.6
ACCURACY DATA
Con
cen
trati
on
[µ
g/m
L] [7 µg/mL] [30 µg/mL] [80 µg/mL]
Day 1 Day 2 Day 3 Day 1 Day 2 Day 3 Day 1 Day 2 Day 3
6.27 7.01 7.09 31.09 28.9 29.78 83.89 81.89 78.22
6.35 7.13 7.47 30.22 29.9 29.84 83.64 83.56 78.46
6.35 7.38 7.72 29.60 30.2 29.02 81.75 83.45 79.47
Mea
n
(SD
) 6.32
(0.04)
7.18
(0.19)
7.43
(0.32)
30.31
(0.75)
29.7
(0.67)
29.54
(0.46)
83.09
(1.17)
82.97
(0.94)
78.72
(0.66)
RS
D
(%) 0.7 2.6 4.3 2.5 2.2 1.6 1.4 1.1 0.84
Rec
overy
(%)
90.3 102.5 106.1 101.0 98.9 98.5 103.9 103.7 98.4
Although the nifedipine spectrophotometric method was accurate and precise
based on ICH guidelines, several solvents interfered with the derivatization process. The
29
solvent interferences limited the derivatization reaction, resulting in unsuccessful or poor
nifedipine derivatization. Table 6 shows the mean recovery (%) of the tested solutions.
Note that the negative values of the amount recovered (µg/mL) indicate the inability of
the spectrophotometer to detect derivatized nifedipine due to unsuccessful derivatization.
Based on these results, acetonitrile and ethanol: water [(60:40), (70:30), (80:20)] did not
interfere with the derivatization process, with a mean recovery of 97.8, 97.7, 97.9 and
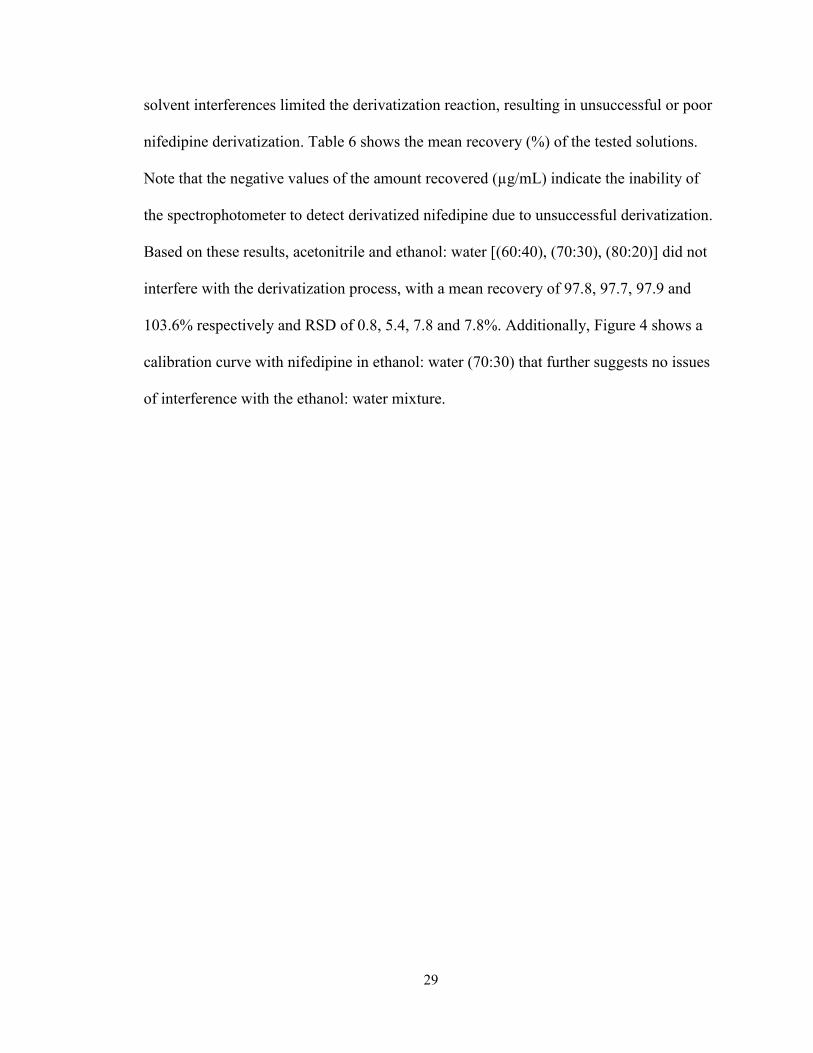
103.6% respectively and RSD of 0.8, 5.4, 7.8 and 7.8%. Additionally, Figure 4 shows a
calibration curve with nifedipine in ethanol: water (70:30) that further suggests no issues
of interference with the ethanol: water mixture.

30
Table 6 Interference test with nifedipine derivatization method using common
solvents.
Concentrations
[µg/mL]
Mean
[µg/mL]
SD RSD
(%)
Recovery
(%)
PBS: DMSO
(10:1)
-1.31
-0.63
-0.70
-0.88 0.38 42.8 -0.9
Acetonitrile 98.21
98.32
96.85
97.80 0.82 0.8 97.8
Ethanol: water
(50:50)
83.41
88.21
86.03
85.88 2.40 2.8 85.9
Ethanol: water
(60:40)
92.19
102.79
98.00
97.66 5.31 5.4 97.7
Ethanol: water
(70:30)
106.60
92.29
94.70
97.86 7.66 7.8 97.9
Ethanol: water
(80:20)
98.22
99.81
112.87
103.63 8.04 7.8 103.6
Methanol 60.54
57.35
76.95
64.94 10.51 16.2 64.9
Saline water
(0.9% NaCl)
43.63
52.32
34.49
43.48 8.91 20.5 43.5
Chloroform -0.61
-0.14
-0.01
-0.25 0.31 124.2 -0.3
Dichloromethane 30.88
39.47
84.26
51.54 28.66 55.6 51.5
31
Figure 4 Calibration plot of nifedipine (2 to 100 µg/mL) using nifedipine in
ethanol: water (70:30) (n=1).
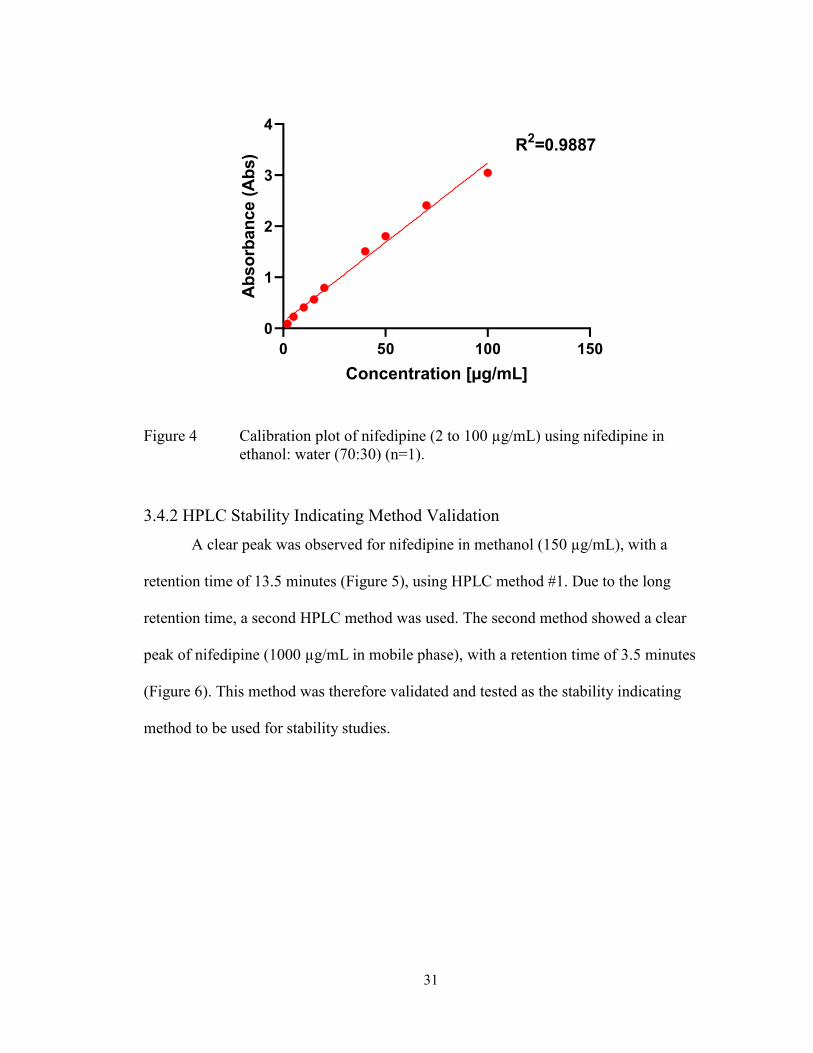
3.4.2 HPLC Stability Indicating Method Validation
A clear peak was observed for nifedipine in methanol (150 µg/mL), with a
retention time of 13.5 minutes (Figure 5), using HPLC method #1. Due to the long
retention time, a second HPLC method was used. The second method showed a clear
peak of nifedipine (1000 µg/mL in mobile phase), with a retention time of 3.5 minutes
(Figure 6). This method was therefore validated and tested as the stability indicating
method to be used for stability studies.
0 50 100 150
0
1
2
3
4
Concentration [µg/mL]
Ab
so
rban
ce (
Ab
s)
R2=0.9887
32
Figure 5 Chromatogram of nifedipine in methanol solvent (150 µg/mL).
Figure 6 Chromatogram of nifedipine (1000 µg/mL) in methanol: water (70:30)
solvent.
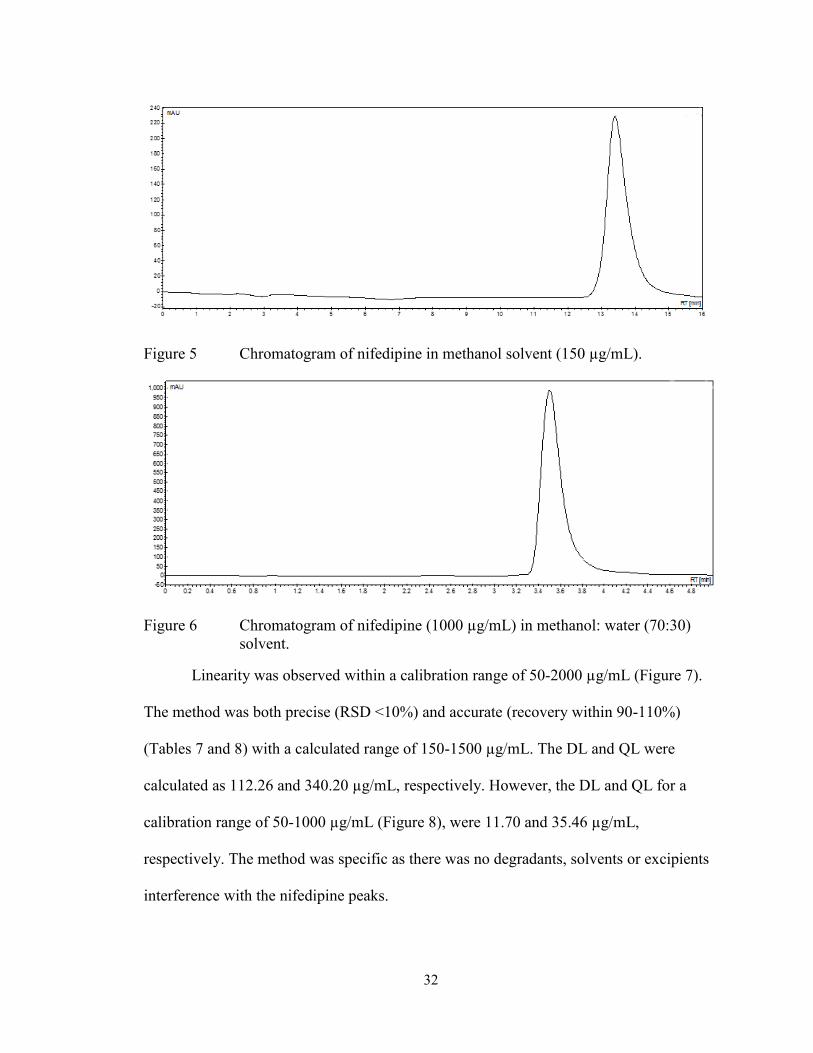
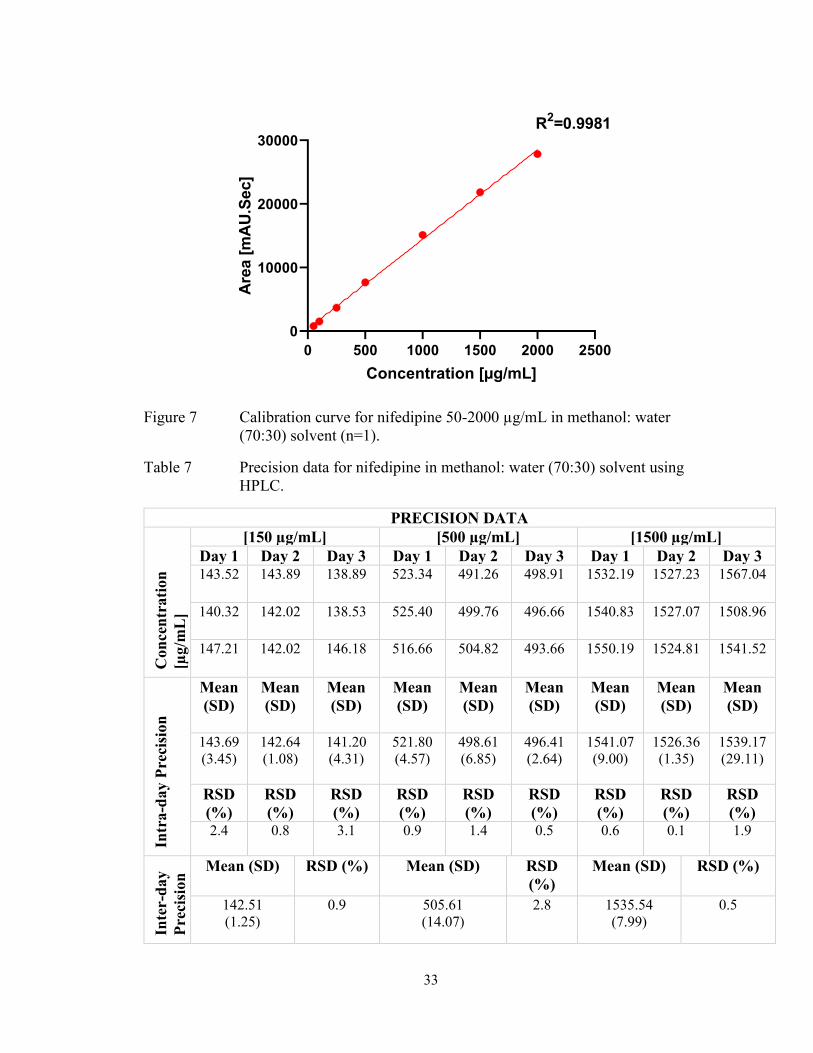
Linearity was observed within a calibration range of 50-2000 µg/mL (Figure 7).
The method was both precise (RSD <10%) and accurate (recovery within 90-110%)
(Tables 7 and 8) with a calculated range of 150-1500 µg/mL. The DL and QL were
calculated as 112.26 and 340.20 µg/mL, respectively. However, the DL and QL for a
calibration range of 50-1000 µg/mL (Figure 8), were 11.70 and 35.46 µg/mL,
respectively. The method was specific as there was no degradants, solvents or excipients
interference with the nifedipine peaks.
33
Figure 7 Calibration curve for nifedipine 50-2000 µg/mL in methanol: water
(70:30) solvent (n=1).
Table 7 Precision data for nifedipine in methanol: water (70:30) solvent using
HPLC.
PRECISION DATA
Con
cen
trati
on
[µg/m
L]
[150 µg/mL] [500 µg/mL] [1500 µg/mL]
Day 1 Day 2 Day 3 Day 1 Day 2 Day 3 Day 1 Day 2 Day 3 143.52 143.89 138.89 523.34 491.26 498.91 1532.19 1527.23 1567.04
140.32
142.02
138.53
525.40
499.76
496.66
1540.83
1527.07
1508.96
147.21
142.02
146.18
516.66
504.82
493.66
1550.19
1524.81
1541.52
Intr
a-d
ay P
reci
sion
Mean
(SD)
Mean
(SD)
Mean
(SD)
Mean
(SD)
Mean
(SD)
Mean
(SD)
Mean
(SD)
Mean
(SD)
Mean
(SD)
143.69
(3.45)
142.64
(1.08)
141.20
(4.31)
521.80
(4.57)
498.61
(6.85)
496.41
(2.64)
1541.07
(9.00)
1526.36
(1.35)
1539.17
(29.11)
RSD
(%)
RSD
(%)
RSD
(%)
RSD
(%)
RSD
(%)
RSD
(%)
RSD
(%)
RSD
(%)
RSD
(%) 2.4 0.8 3.1 0.9 1.4 0.5 0.6
0.1 1.9
Inte
r-d
ay
Pre
cisi
on
Mean (SD) RSD (%) Mean (SD) RSD
(%)
Mean (SD) RSD (%)
142.51
(1.25)
0.9 505.61
(14.07)
2.8 1535.54
(7.99)
0.5
0 500 1000 1500 2000 2500
0
10000
20000
30000
Concentration [µg/mL]
Are
a [
mA
U.S
ec]
R2=0.9981
34
Table 8 Accuracy data for nifedipine in methanol: water (70:30) solvent using
HPLC.
ACCURACY DATA C
on
cen
tra
tio
n
[µg
/mL
] [150 µg/mL] [500 µg/mL] [1500 µg/mL]
143.52 491.26 1527.23
140.32
499.76
1527.07
147.21
504.82
1524.81
Mea
n
(SD
)
143.69
(3.45)
498.61
(6.85)
1526.36
(1.35)
RS
D (
%) 2.4 1.4 0.1
Rec
over
y
(%)
95.8
99.7
101.8
Figure 8 Calibration curve for nifedipine 50-1000 µg/mL in methanol: water
(70:30) solvent (n=1).
0 500 1000 1500
0
5000
10000
15000
Concentration [µg/mL]
Are
a [
mA
U.S
ec]
R2=0.9999
35
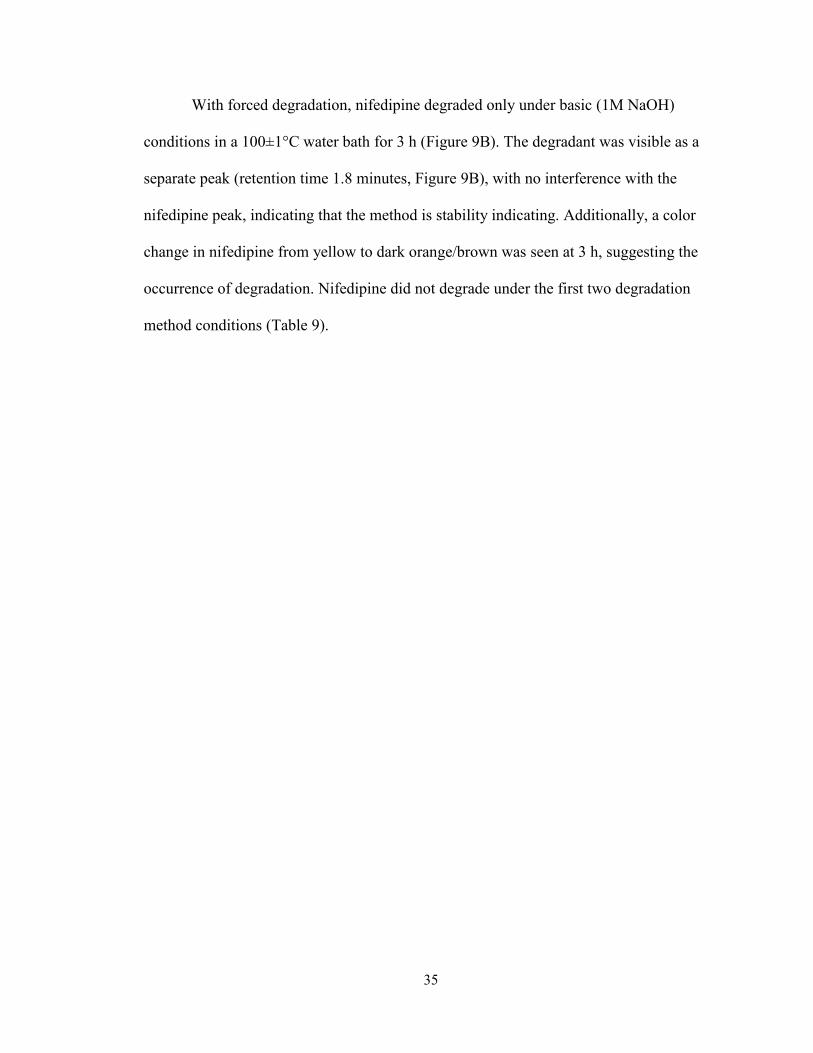
With forced degradation, nifedipine degraded only under basic (1M NaOH)
conditions in a 100±1°C water bath for 3 h (Figure 9B). The degradant was visible as a
separate peak (retention time 1.8 minutes, Figure 9B), with no interference with the
nifedipine peak, indicating that the method is stability indicating. Additionally, a color
change in nifedipine from yellow to dark orange/brown was seen at 3 h, suggesting the
occurrence of degradation. Nifedipine did not degrade under the first two degradation
method conditions (Table 9).

36
Figure 9 Chromatograms for forced degradation of nifedipine with acidic (1M
HCL) (A), basic (1M NaOH) (B) and heat (C) conditions (100±1°C).
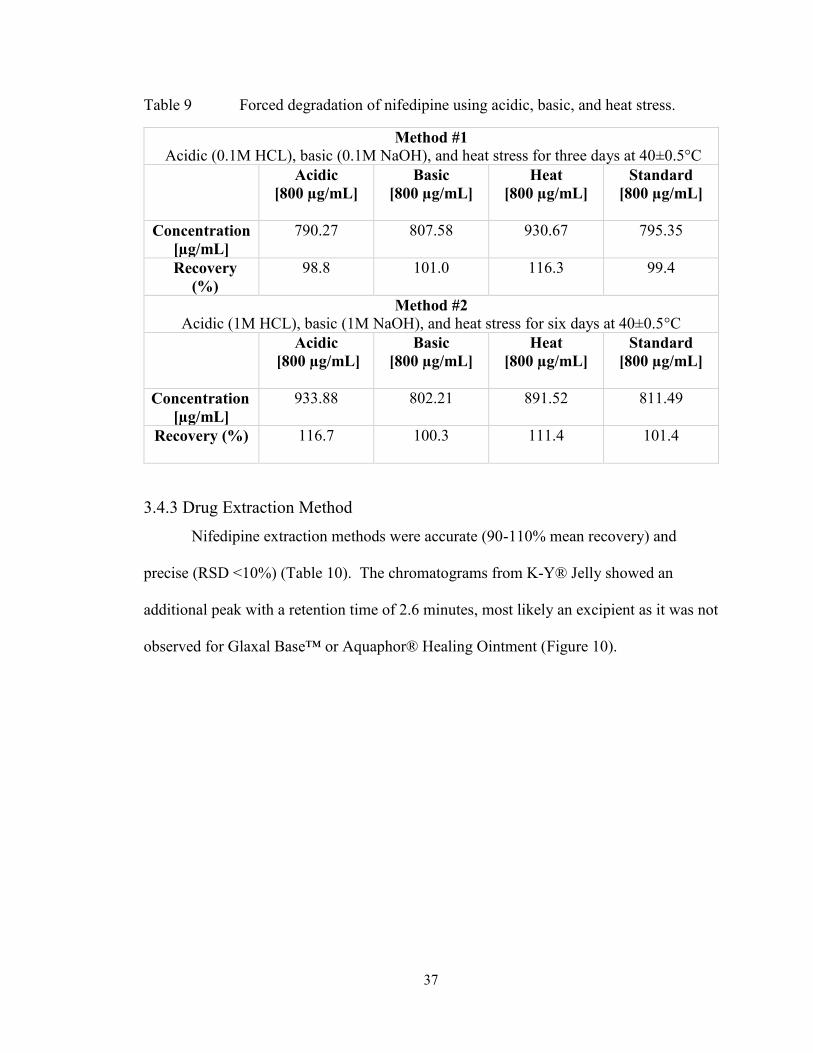
37
Table 9 Forced degradation of nifedipine using acidic, basic, and heat stress.
Method #1
Acidic (0.1M HCL), basic (0.1M NaOH), and heat stress for three days at 40±0.5°C
Acidic
[800 µg/mL]
Basic
[800 µg/mL]
Heat
[800 µg/mL]
Standard
[800 µg/mL]
Concentration
[µg/mL]
790.27
807.58
930.67
795.35
Recovery
(%)
98.8
101.0
116.3
99.4
Method #2
Acidic (1M HCL), basic (1M NaOH), and heat stress for six days at 40±0.5°C
Acidic
[800 µg/mL]
Basic
[800 µg/mL]
Heat
[800 µg/mL]
Standard
[800 µg/mL]
Concentration
[µg/mL]
933.88 802.21 891.52 811.49
Recovery (%) 116.7
100.3 111.4 101.4
3.4.3 Drug Extraction Method
Nifedipine extraction methods were accurate (90-110% mean recovery) and
precise (RSD <10%) (Table 10). The chromatograms from K-Y® Jelly showed an
additional peak with a retention time of 2.6 minutes, most likely an excipient as it was not
observed for Glaxal Base™ or Aquaphor® Healing Ointment (Figure 10).
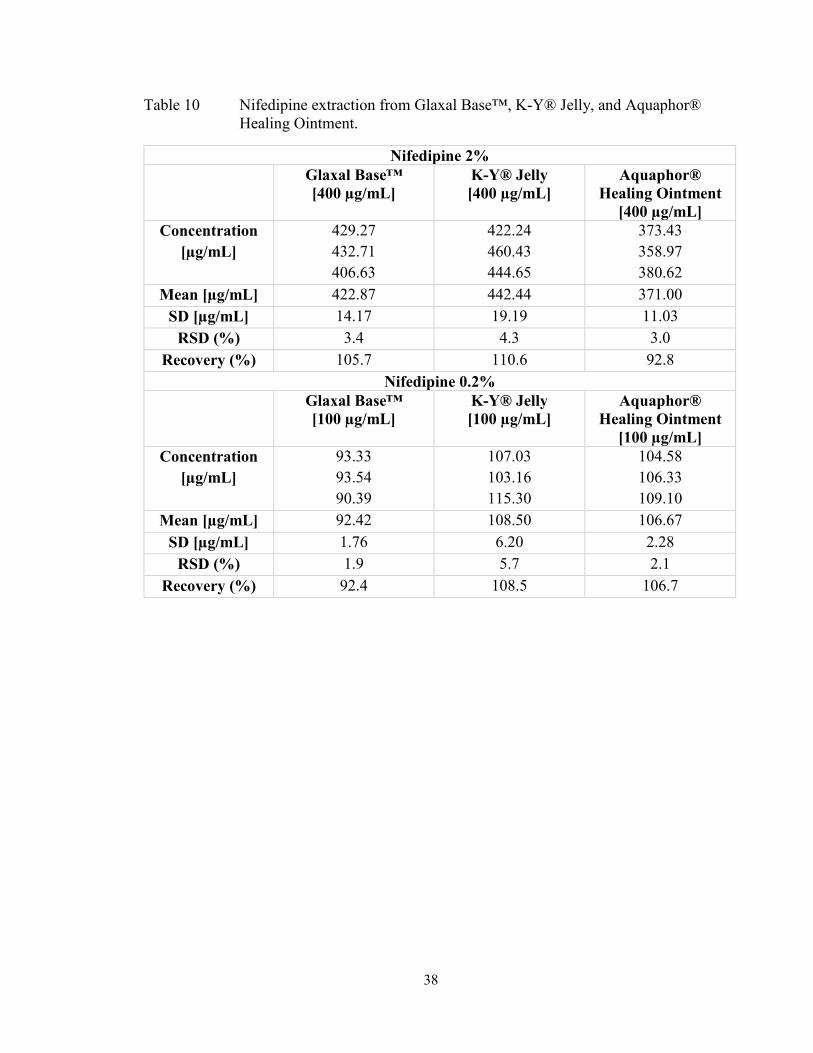
38
Table 10 Nifedipine extraction from Glaxal Base™, K-Y® Jelly, and Aquaphor®
Healing Ointment.
Nifedipine 2%
Glaxal Base™
[400 µg/mL]
K-Y® Jelly
[400 µg/mL]
Aquaphor®
Healing Ointment
[400 µg/mL]
Concentration
[µg/mL]
429.27
432.71
406.63
422.24
460.43
444.65
373.43
358.97
380.62
Mean [µg/mL] 422.87 442.44 371.00
SD [µg/mL] 14.17 19.19 11.03
RSD (%) 3.4 4.3 3.0
Recovery (%) 105.7 110.6 92.8
Nifedipine 0.2%
Glaxal Base™
[100 µg/mL]
K-Y® Jelly
[100 µg/mL]
Aquaphor®
Healing Ointment
[100 µg/mL]
Concentration
[µg/mL]
93.33
93.54
90.39
107.03
103.16
115.30
104.58
106.33
109.10
Mean [µg/mL] 92.42 108.50 106.67
SD [µg/mL] 1.76 6.20 2.28
RSD (%) 1.9 5.7 2.1
Recovery (%) 92.4 108.5 106.7

39
Figure 10 Chromatograms of nifedipine extraction from 2% K-Y® Jelly (A) 0.2%
K-Y® Jelly (B) 0.2% Aquaphor® Healing Ointment (C).
3.4.4 Nifedipine Release Studies
For membrane selection, nifedipine diffusion through cellulose filter and mixed
cellulose ester, was not statistically significant (p>0.05, Figure 11). There was a
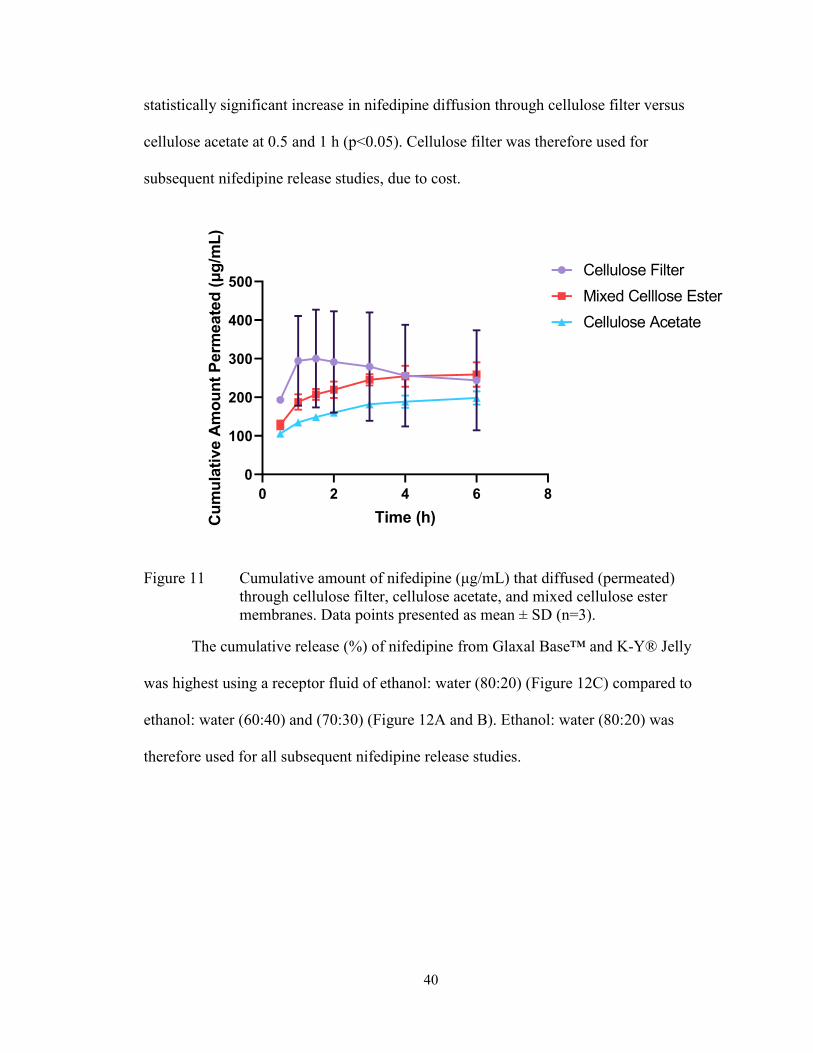
40
statistically significant increase in nifedipine diffusion through cellulose filter versus
cellulose acetate at 0.5 and 1 h (p<0.05). Cellulose filter was therefore used for
subsequent nifedipine release studies, due to cost.
0 2 4 6 8
0
100
200
300
400
500
Time (h)Cu
mu
lati
ve A
mo
un
t P
erm
eate
d (μ
g/m
L)
Cellulose Filter
Mixed Celllose Ester
Cellulose Acetate
Figure 11 Cumulative amount of nifedipine (μg/mL) that diffused (permeated)
through cellulose filter, cellulose acetate, and mixed cellulose ester
membranes. Data points presented as mean ± SD (n=3).
The cumulative release (%) of nifedipine from Glaxal Base™ and K-Y® Jelly
was highest using a receptor fluid of ethanol: water (80:20) (Figure 12C) compared to
ethanol: water (60:40) and (70:30) (Figure 12A and B). Ethanol: water (80:20) was
therefore used for all subsequent nifedipine release studies.

41
Figure 12 Cumulative release of nifedipine (10% w/w) from Glaxal Base™ and K-
Y® Jelly in ethanol: water 60:40 (A), 70:30 (B), and 80:20 (C). Data
points presented as mean ± SD (n=3).
A
B
C
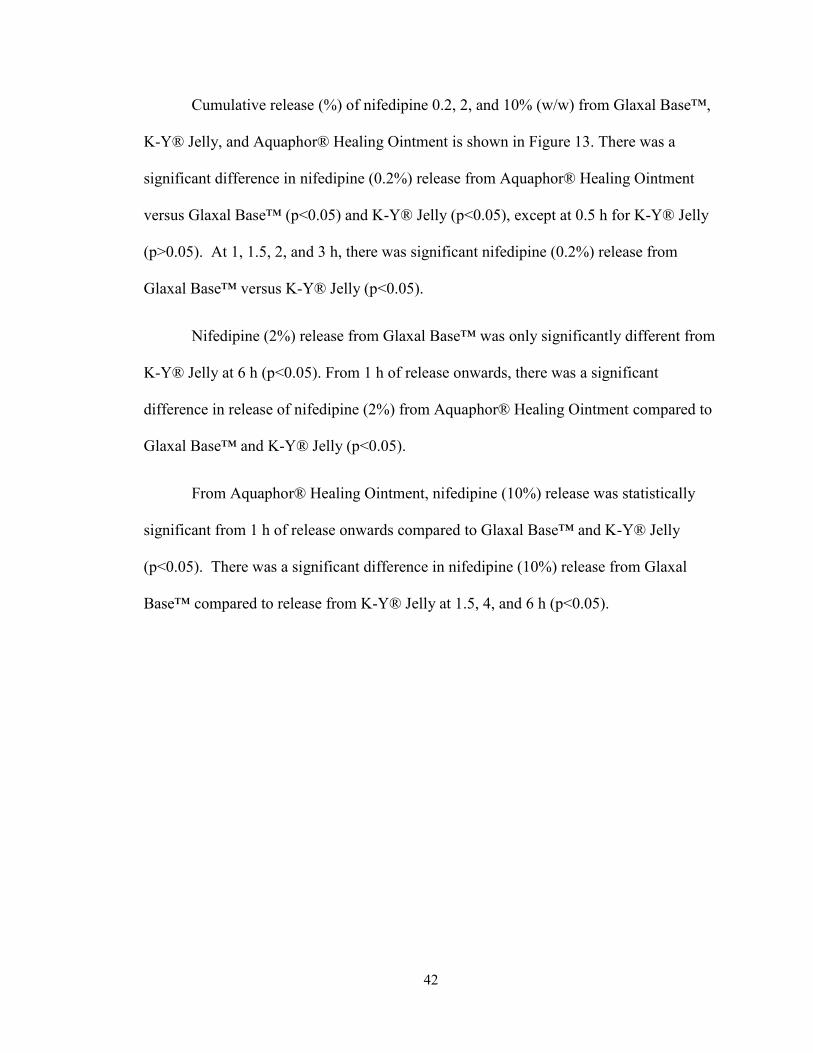
42
Cumulative release (%) of nifedipine 0.2, 2, and 10% (w/w) from Glaxal Base™,
K-Y® Jelly, and Aquaphor® Healing Ointment is shown in Figure 13. There was a
significant difference in nifedipine (0.2%) release from Aquaphor® Healing Ointment
versus Glaxal Base™ (p<0.05) and K-Y® Jelly (p<0.05), except at 0.5 h for K-Y® Jelly
(p>0.05). At 1, 1.5, 2, and 3 h, there was significant nifedipine (0.2%) release from
Glaxal Base™ versus K-Y® Jelly (p<0.05).
Nifedipine (2%) release from Glaxal Base™ was only significantly different from
K-Y® Jelly at 6 h (p<0.05). From 1 h of release onwards, there was a significant
difference in release of nifedipine (2%) from Aquaphor® Healing Ointment compared to
Glaxal Base™ and K-Y® Jelly (p<0.05).
From Aquaphor® Healing Ointment, nifedipine (10%) release was statistically
significant from 1 h of release onwards compared to Glaxal Base™ and K-Y® Jelly
(p<0.05). There was a significant difference in nifedipine (10%) release from Glaxal
Base™ compared to release from K-Y® Jelly at 1.5, 4, and 6 h (p<0.05).
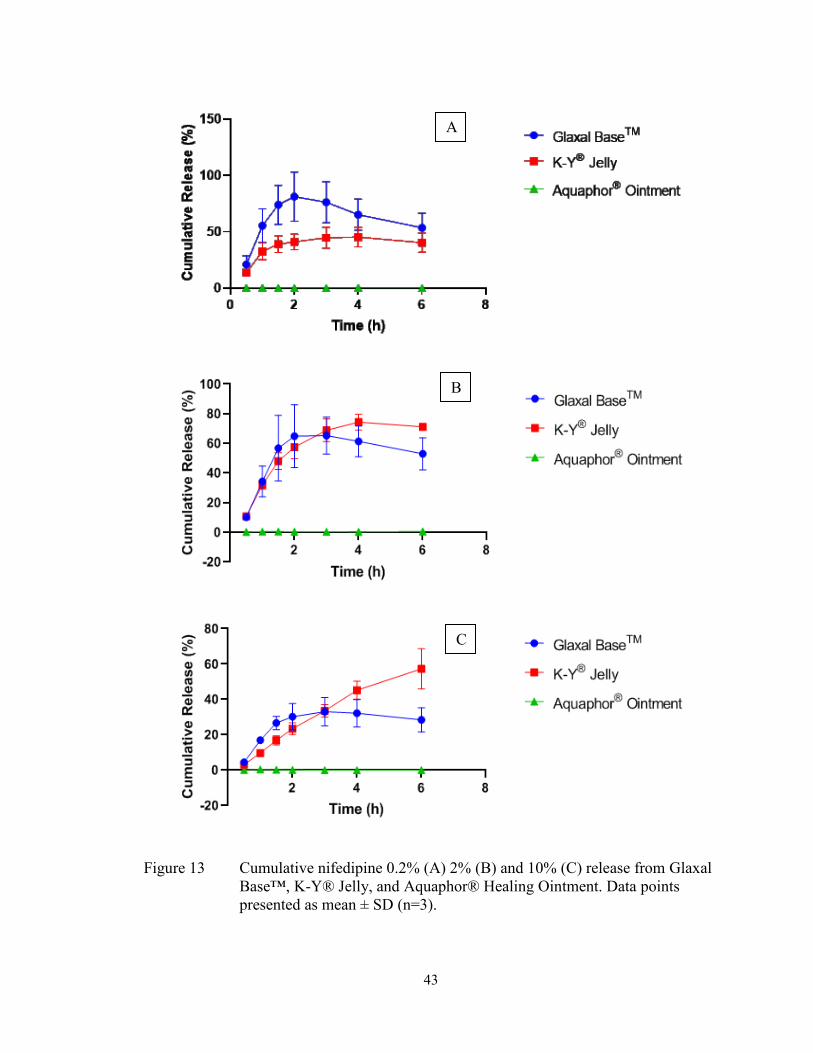
43
Figure 13 Cumulative nifedipine 0.2% (A) 2% (B) and 10% (C) release from Glaxal
Base™, K-Y® Jelly, and Aquaphor® Healing Ointment. Data points
presented as mean ± SD (n=3).
A
B
C
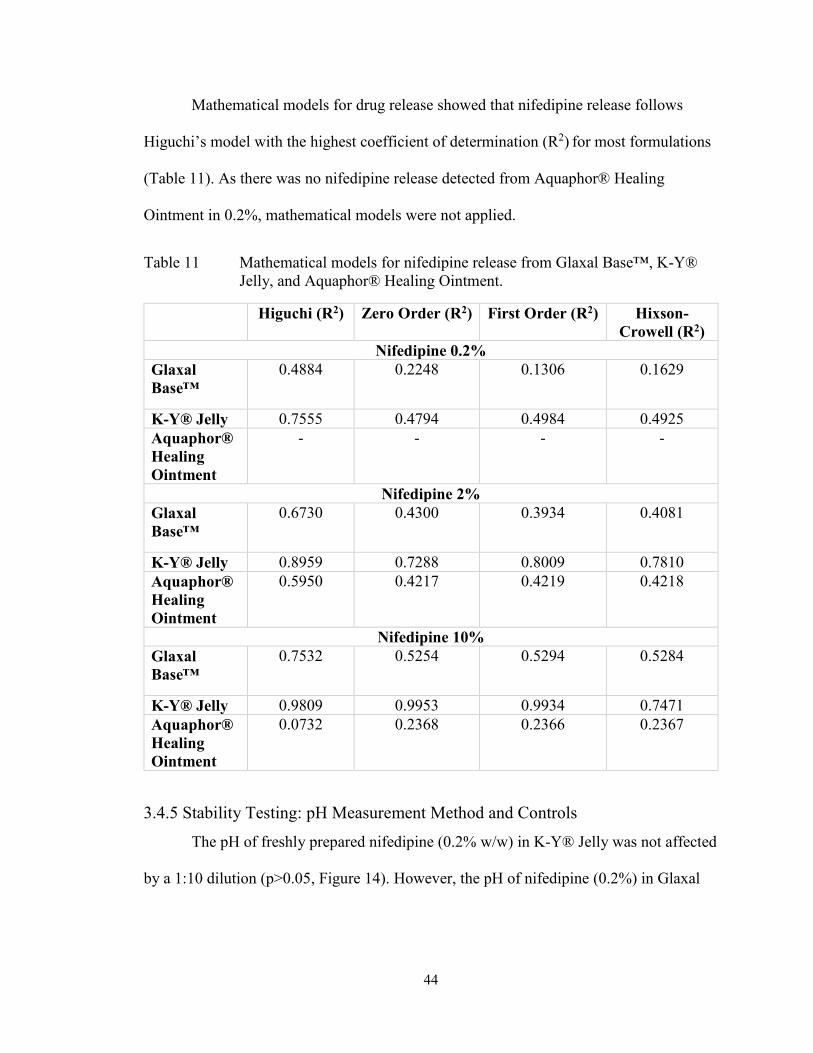
44
Mathematical models for drug release showed that nifedipine release follows
Higuchi’s model with the highest coefficient of determination (R2) for most formulations
(Table 11). As there was no nifedipine release detected from Aquaphor® Healing
Ointment in 0.2%, mathematical models were not applied.
Table 11 Mathematical models for nifedipine release from Glaxal Base™, K-Y®
Jelly, and Aquaphor® Healing Ointment.
Higuchi (R2) Zero Order (R2) First Order (R2) Hixson-
Crowell (R2)
Nifedipine 0.2%
Glaxal
Base™
0.4884
0.2248
0.1306
0.1629
K-Y® Jelly 0.7555 0.4794 0.4984 0.4925
Aquaphor®
Healing
Ointment
- -
-
-
Nifedipine 2%
Glaxal
Base™
0.6730 0.4300
0.3934
0.4081
K-Y® Jelly 0.8959 0.7288 0.8009 0.7810
Aquaphor®
Healing
Ointment
0.5950 0.4217
0.4219
0.4218
Nifedipine 10%
Glaxal
Base™
0.7532 0.5254
0.5294
0.5284
K-Y® Jelly 0.9809 0.9953 0.9934 0.7471
Aquaphor®
Healing
Ointment
0.0732 0.2368
0.2366
0.2367
3.4.5 Stability Testing: pH Measurement Method and Controls
The pH of freshly prepared nifedipine (0.2% w/w) in K-Y® Jelly was not affected
by a 1:10 dilution (p>0.05, Figure 14). However, the pH of nifedipine (0.2%) in Glaxal

45
Base™ increased slightly with a 1:10 dilution in deionized water (p<0.05). Therefore,
formulation pH was measured directly for all stability studies, including controls.
0 1:10 0 1:100
2
4
6
Glaxal BaseTM
K-Y®
Jelly
Dilution
pH
Figure 14 pH of nifedipine (0.2%) in Glaxal Base™ and K-Y® Jelly, with direct
measurement (0) and 1:10 dilution. Data is presented as mean ± SD (n=3).
No changes in organoleptic properties of Glaxal Base™ and K-Y® Jelly controls
at 23°C, was observed (Tables 12 and 13). However, changes in apparent viscosity at 4°C
and 40°C was observed throughout the study (Tables 12 and 13).

46
Table 12 Organoleptic properties of Glaxal Base™ control stored in WP jars.
23°C 4°C 40°C
Day 0 Soft, smooth,
white cream.
Soft, smooth, white
cream.
Soft, smooth, white cream.
Day 7 Same as day 0. Slightly thicker
consistency than day 0.
No significant changes.
Same as day 0.
Day 14 Same as day 0. Slightly thicker
consistency. No
significant changes.
Thinner consistency,
easier to mix.
Day 30 Same as day 0.
Slightly thicker
consistency. No
significant changes.
Thinner consistency,
easier to mix. No
significant changes.
Day 60 Same as day 0.
Slightly softer despite
observations on day 30.
Thinner consistency, softer
and fluffy.
Day 90 Same as day 0. Softer, fluffy cream. No
significant changes.
Thinner consistency, softer
and fluffy.
Results for GA jars were identical and therefore not presented as a separate table.
Table 13 Organoleptic properties of K-Y® Jelly control stored in WP jars.
23°C 4°C 40°C
Day 0 Clear gel with
small bubbles.
Soft to touch and
smooth
application on
the skin.
Clear gel with small
bubbles. Soft to touch
and smooth application
on the skin.
Clear gel with small bubbles.
Soft to touch and smooth
application on the skin.
Day 7 Same as day 0. Same as day 0.
Slightly thicker in
consistency but not a
significant difference.
Same as day 0.
Day 14 Same as day 0. Slightly thicker in
consistency.
Same as day 0.
Day 30 Same as day 0. Slightly thicker in
consistency.
Same as day 0.
Day 60 Same as day 0. Slightly thicker in
consistency.
Same as day 0. Slightly thinner
consistency.
Day 90 Same as day 0. Thicker gel. Thicker consistency was
witnessed despite day 60
observations.
Except for a very slight “warm” odor witnessed with products in GA jars on day 90,
results for GA jars were similar and therefore not presented as a separate table.

47
No significant difference in mean pH of Glaxal Base™ control compared to day 0
at either 4 or 23°C was observed in WP jars (p>0.05, Figure 15A). There was a
significant difference in mean pH on days 60 and 90 compared to day 0 at 40°C (p<0.05).
In GA jars, a significant increase in mean pH at all temperatures, compared to day 0 was
observed (p<0.05. Figure 15B).
0 20 40 60 80 1003.5
4.0
4.5
5.023±2°C
40±0.5°C
4±3°C
Time (days)
pH
0 20 40 60 80 1003.5
4.0
4.5
5.0
5.523±2°C
40±0.5°C
4±3°C
Time (days)
pH
Figure 15 pH of Glaxal Base™ control in WP (A) and GA (B) jars at 23°C, 40°C,
and 4°C. Data points presented as mean pH ± SD (n=3).
A
B
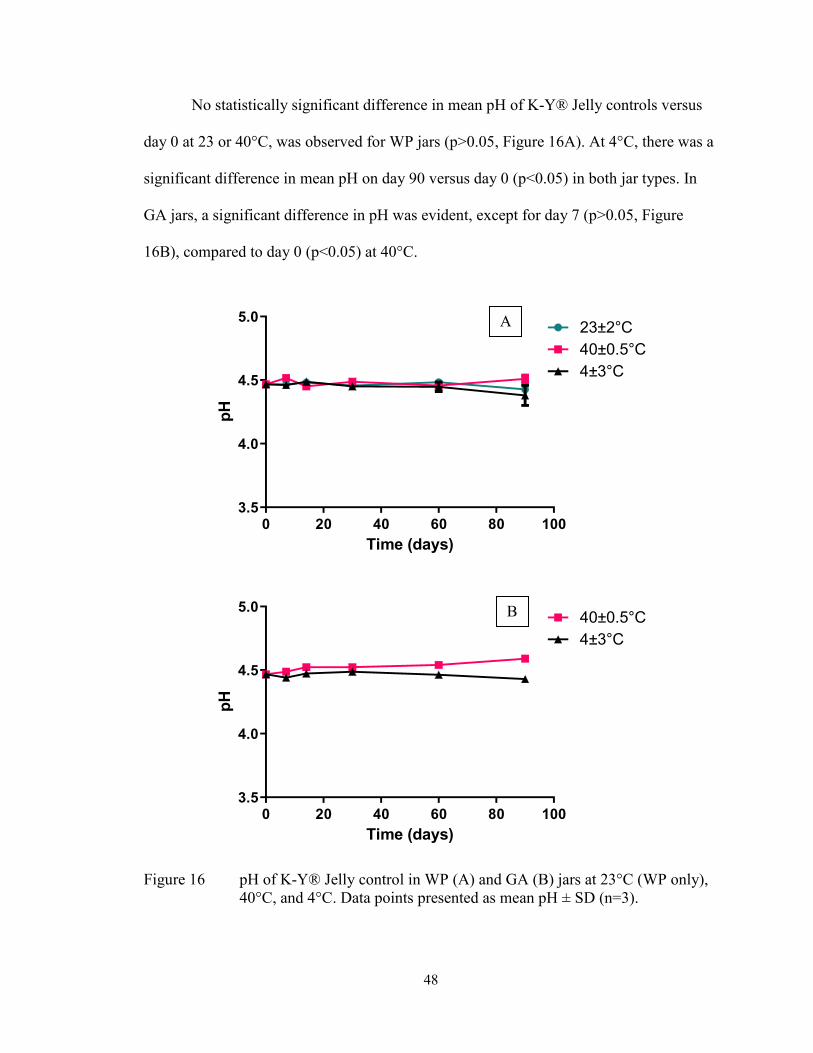
48
No statistically significant difference in mean pH of K-Y® Jelly controls versus
day 0 at 23 or 40°C, was observed for WP jars (p>0.05, Figure 16A). At 4°C, there was a
significant difference in mean pH on day 90 versus day 0 (p<0.05) in both jar types. In
GA jars, a significant difference in pH was evident, except for day 7 (p>0.05, Figure
16B), compared to day 0 (p<0.05) at 40°C.
0 20 40 60 80 1003.5
4.0
4.5
5.023±2°C
40±0.5°C
4±3°C
Time (days)
pH
0 20 40 60 80 1003.5
4.0
4.5
5.040±0.5°C
4±3°C
Time (days)
pH
Figure 16 pH of K-Y® Jelly control in WP (A) and GA (B) jars at 23°C (WP only),
40°C, and 4°C. Data points presented as mean pH ± SD (n=3).
A
B

49
Liquid formation due to phase separation in Aquaphor® Healing Ointment
control was observed as early as day 7 (Figure 17) but was more evident from day 14
onwards.
Figure 17 Aquaphor® Healing Ointment control on day 7. Picture captured with
iPhone XS camera.
By day 14, it was challenging to mix Aquaphor® Healing Ointment stored at 4°C
due to an increase in apparent viscosity (Table 14).
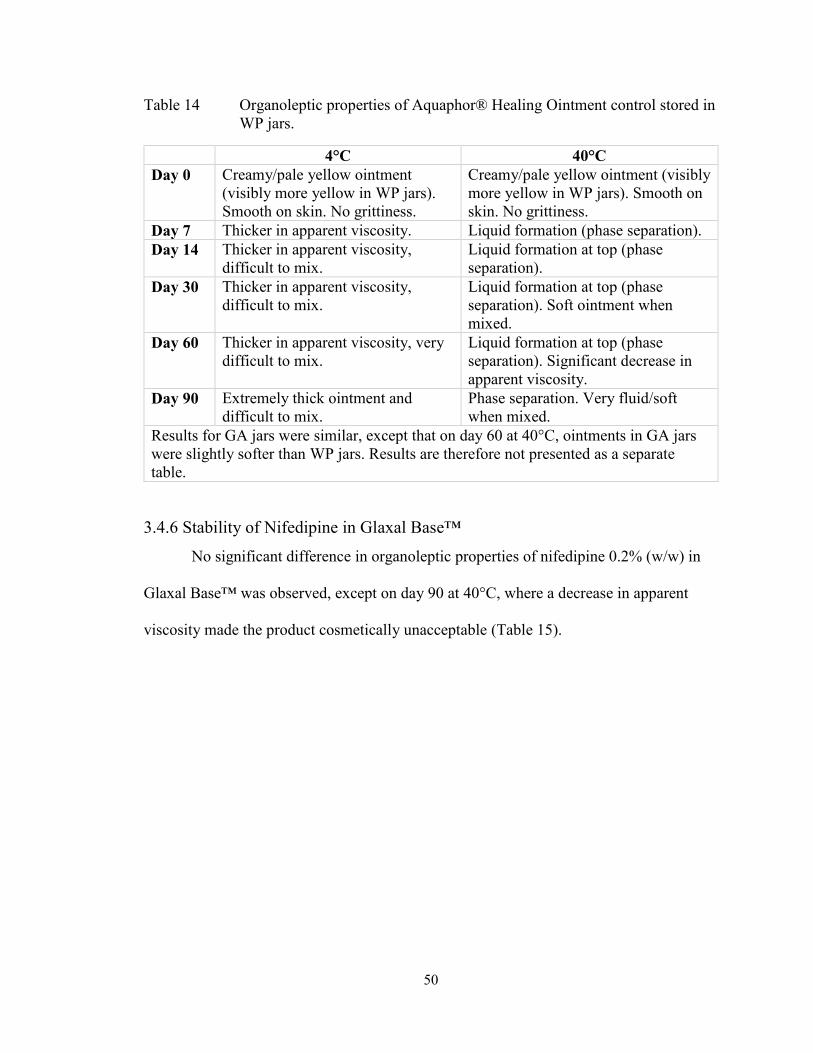
50
Table 14 Organoleptic properties of Aquaphor® Healing Ointment control stored in
WP jars.
4°C 40°C
Day 0 Creamy/pale yellow ointment
(visibly more yellow in WP jars).
Smooth on skin. No grittiness.
Creamy/pale yellow ointment (visibly
more yellow in WP jars). Smooth on
skin. No grittiness.
Day 7 Thicker in apparent viscosity. Liquid formation (phase separation).
Day 14 Thicker in apparent viscosity,
difficult to mix.
Liquid formation at top (phase
separation).
Day 30 Thicker in apparent viscosity,
difficult to mix.
Liquid formation at top (phase
separation). Soft ointment when
mixed.
Day 60 Thicker in apparent viscosity, very
difficult to mix.
Liquid formation at top (phase
separation). Significant decrease in
apparent viscosity.
Day 90 Extremely thick ointment and
difficult to mix.
Phase separation. Very fluid/soft
when mixed.
Results for GA jars were similar, except that on day 60 at 40°C, ointments in GA jars
were slightly softer than WP jars. Results are therefore not presented as a separate
table.
3.4.6 Stability of Nifedipine in Glaxal Base™
No significant difference in organoleptic properties of nifedipine 0.2% (w/w) in
Glaxal Base™ was observed, except on day 90 at 40°C, where a decrease in apparent
viscosity made the product cosmetically unacceptable (Table 15).

51
Table 15 Organoleptic properties of nifedipine (0.2% in Glaxal Base™ stored in
WP jars.
23°C 4°C 40°C
Day 0 Light yellow
cream. Soft to
touch and smooth
application on the
skin. No grittiness.
Uniform color and
consistency.
Smells like Glaxal
Base™.
Light yellow cream.
Soft to touch and
smooth application on
the skin. No grittiness.
Uniform color and
consistency. Smells
like Glaxal Base™.
Light yellow cream. Soft to
touch and smooth
application on the skin. No
grittiness. Uniform color
and consistency. Smells like
Glaxal Base™.
Day 7 Same as day 0. Same as day 0 except
slightly thicker in
consistency.
Same as day 0 except
slightly less viscous.
Day 14 Same as day 0. Slightly thicker in
consistency.
Slightly less viscous.
Day 30 Same as day 0. Slightly thicker in
consistency.
Slightly less viscous.
Day 60 Same as day 0. Slightly thicker in
consistency.
Slightly less viscous.
Day 90 Same as day 0. Slightly thicker in
consistency.
Less viscous in consistency,
almost foam-like. Although
the cream’s application is
still easy, due to a decrease
in viscosity, it is not
cosmetically elegant.
Results from GA jars were identical to WP jars and thus not presented as a separate
table.
Nifedipine recovery from Glaxal Base™ and percent remaining are shown in
Tables 16 and 17, respectively. No significant difference in the mean potency was
observed, compared to day 0, for nifedipine 0.2% (w/w) in Glaxal Base™ in WP jars
(p>0.05). Except on day 14, mean potency remained within the USP recommendations
for 90 days at all three temperatures.
In GA jars, the mean potency was not significantly different from day 0 on days
30 and 90 at 23°C (p<0.05). No significant difference in potency was observed versus

52
day 0 at 4 and 40°C (p>0.05) except for days 7 and 90, respectively (p<0.05). Mean
potency was within the recommended USP range until day 7 at 23°C but for 90 days at
4°C (excluding day 30) and at 40°C (excluding day 7).
Table 16 Nifedipine recovery from Glaxal Base™ on days 0, 7, 14, 30, 60, and 90,
presented as concentration (µg/mL).
Concentration [µg/mL]
WP Jars GA Jars
Day 23°C 4°C 40°C 23°C 4°C 40°C
0 99.71
94.66
101.97
100.62
105.38
96.70
99.38
106.25
96.91
108.56
104.79
104.89
99.67
96.33
105.48
96.70
98.05
92.50
7 97.45
95.37
98.43
104.13
99.21
106.05
102.70
103.90
107.19
101.96
102.79
101.87
104.39
97.76
100.49
111.25
108.42
110.14
14 91.90
84.99
89.65
89.68
90.74
89.05
88.82
105.10
87.287
88.46
90.78
88.37
86.06
99.17
94.26
98.38
94.59
110.76
30 90.44
91.20
87.35
94.10
89.76
90.73
105.72
98.02
103.62
91.24
91.82
93.35
87.71
96.38
86.67
96.10
99.17
94.26
60 93.14
89.66
93.98
115.63
100.46
100.70
95.76
98.85
98.87
94.58
93.32
98.36
95.46
95.04
95.24
97.87
97.67
96.93
90 92.67
89.41
92.17
105.31
98.64
94.30
101.52
103.46
96.85
91.77
90.88
93.73
88.26
94.89
88.25
97.66
100.50
96.96
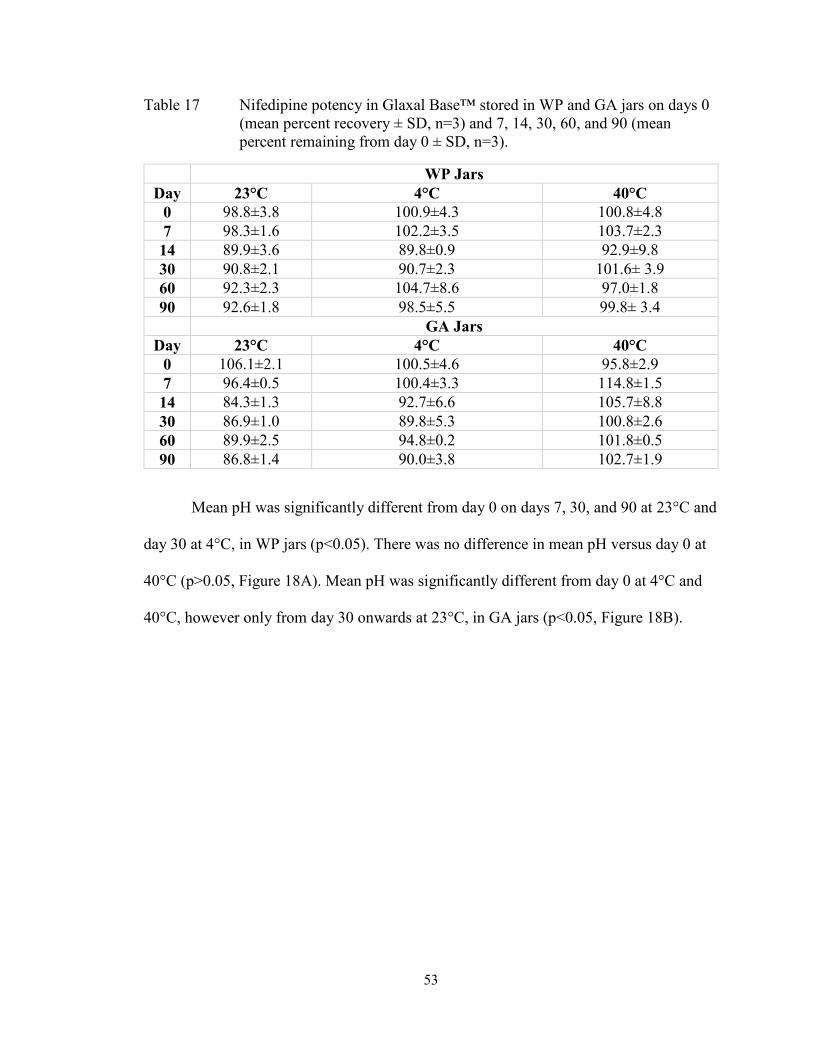
53
Table 17 Nifedipine potency in Glaxal Base™ stored in WP and GA jars on days 0
(mean percent recovery ± SD, n=3) and 7, 14, 30, 60, and 90 (mean
percent remaining from day 0 ± SD, n=3).
WP Jars
Day 23°C 4°C 40°C
0 98.8±3.8 100.9±4.3 100.8±4.8
7 98.3±1.6 102.2±3.5 103.7±2.3
14 89.9±3.6 89.8±0.9 92.9±9.8
30 90.8±2.1 90.7±2.3 101.6± 3.9
60 92.3±2.3 104.7±8.6 97.0±1.8
90 92.6±1.8 98.5±5.5 99.8± 3.4
GA Jars
Day 23°C 4°C 40°C
0 106.1±2.1 100.5±4.6 95.8±2.9
7 96.4±0.5 100.4±3.3 114.8±1.5
14 84.3±1.3 92.7±6.6 105.7±8.8
30 86.9±1.0 89.8±5.3 100.8±2.6
60 89.9±2.5 94.8±0.2 101.8±0.5
90 86.8±1.4 90.0±3.8 102.7±1.9
Mean pH was significantly different from day 0 on days 7, 30, and 90 at 23°C and
day 30 at 4°C, in WP jars (p<0.05). There was no difference in mean pH versus day 0 at
40°C (p>0.05, Figure 18A). Mean pH was significantly different from day 0 at 4°C and
40°C, however only from day 30 onwards at 23°C, in GA jars (p<0.05, Figure 18B).

54
0 20 40 60 80 100
3.5
4.0
4.5
5.0
Time (days)
pH
23±2°C
40±0.5°C
4±3°C
0 20 40 60 80 100
3.5
4.0
4.5
5.0
5.5
Time (days)
pH
23±2°C40±0.5°C
4±3°C
Figure 18 pH of nifedipine (0.2% in Glaxal Base™ in WP (A) and GA (B) jars at
23°C, 40°C, and 4°C. Data points presented as mean pH ± SD (n=3).
3.4.7 Stability of Nifedipine in K-Y® Jelly
Organoleptic properties of nifedipine 0.2% (w/w) in K-Y® Jelly revealed no
changes throughout 60 days at 23°C (Table 18). Thicker consistency of the formulations
B
A
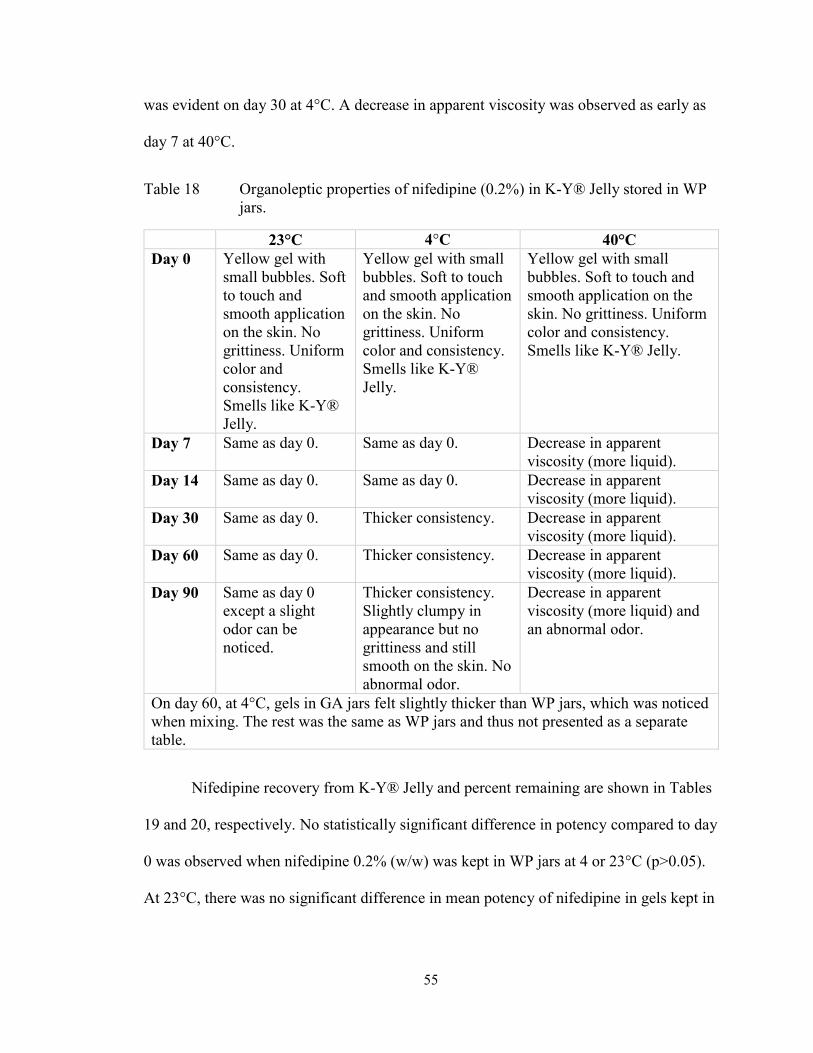
55
was evident on day 30 at 4°C. A decrease in apparent viscosity was observed as early as
day 7 at 40°C.
Table 18 Organoleptic properties of nifedipine (0.2%) in K-Y® Jelly stored in WP
jars.
23°C 4°C 40°C
Day 0 Yellow gel with
small bubbles. Soft
to touch and
smooth application
on the skin. No
grittiness. Uniform
color and
consistency.
Smells like K-Y®
Jelly.
Yellow gel with small
bubbles. Soft to touch
and smooth application
on the skin. No
grittiness. Uniform
color and consistency.
Smells like K-Y®
Jelly.
Yellow gel with small
bubbles. Soft to touch and
smooth application on the
skin. No grittiness. Uniform
color and consistency.
Smells like K-Y® Jelly.
Day 7 Same as day 0. Same as day 0. Decrease in apparent
viscosity (more liquid).
Day 14 Same as day 0. Same as day 0. Decrease in apparent
viscosity (more liquid).
Day 30 Same as day 0. Thicker consistency. Decrease in apparent
viscosity (more liquid).
Day 60 Same as day 0. Thicker consistency. Decrease in apparent
viscosity (more liquid).
Day 90 Same as day 0
except a slight
odor can be
noticed.
Thicker consistency.
Slightly clumpy in
appearance but no
grittiness and still
smooth on the skin. No
abnormal odor.
Decrease in apparent
viscosity (more liquid) and
an abnormal odor.
On day 60, at 4°C, gels in GA jars felt slightly thicker than WP jars, which was noticed
when mixing. The rest was the same as WP jars and thus not presented as a separate
table.
Nifedipine recovery from K-Y® Jelly and percent remaining are shown in Tables
19 and 20, respectively. No statistically significant difference in potency compared to day
0 was observed when nifedipine 0.2% (w/w) was kept in WP jars at 4 or 23°C (p>0.05).
At 23°C, there was no significant difference in mean potency of nifedipine in gels kept in
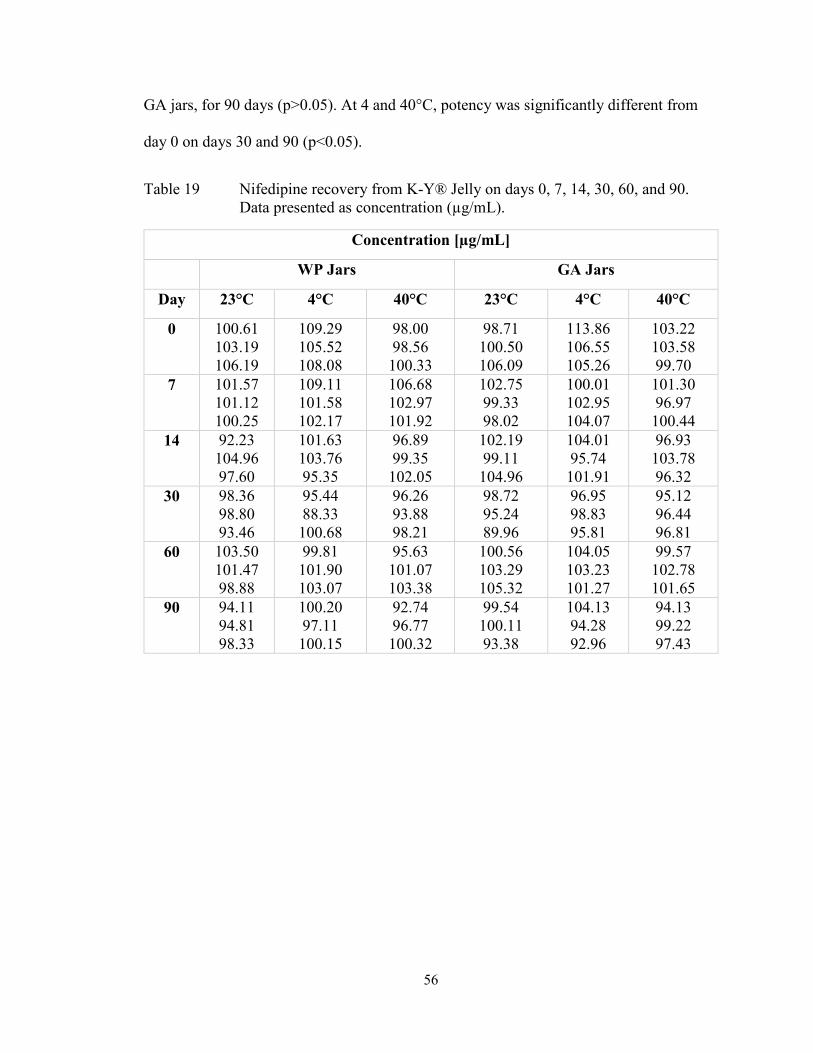
56
GA jars, for 90 days (p>0.05). At 4 and 40°C, potency was significantly different from
day 0 on days 30 and 90 (p<0.05).
Table 19 Nifedipine recovery from K-Y® Jelly on days 0, 7, 14, 30, 60, and 90.
Data presented as concentration (µg/mL).
Concentration [µg/mL]
WP Jars GA Jars
Day 23°C 4°C 40°C 23°C 4°C 40°C
0 100.61
103.19
106.19
109.29
105.52
108.08
98.00
98.56
100.33
98.71
100.50
106.09
113.86
106.55
105.26
103.22
103.58
99.70
7 101.57
101.12
100.25
109.11
101.58
102.17
106.68
102.97
101.92
102.75
99.33
98.02
100.01
102.95
104.07
101.30
96.97
100.44
14 92.23
104.96
97.60
101.63
103.76
95.35
96.89
99.35
102.05
102.19
99.11
104.96
104.01
95.74
101.91
96.93
103.78
96.32
30 98.36
98.80
93.46
95.44
88.33
100.68
96.26
93.88
98.21
98.72
95.24
89.96
96.95
98.83
95.81
95.12
96.44
96.81
60 103.50
101.47
98.88
99.81
101.90
103.07
95.63
101.07
103.38
100.56
103.29
105.32
104.05
103.23
101.27
99.57
102.78
101.65
90 94.11
94.81
98.33
100.20
97.11
100.15
92.74
96.77
100.32
99.54
100.11
93.38
104.13
94.28
92.96
94.13
99.22
97.43

57
Table 20 Nifedipine potency in K-Y® Jelly stored in WP and GA jars on days 0
(mean percent recovery ± SD, n=3) and 7, 14, 30, 60 and 90 (mean percent
remaining from day 0 ± SD, n=3).
WP Jars
Day 23°C 4°C 40°C
0 103. 3±2.8 107.6±1.9 98.9±1.2
7 97.7±0.7 96.9±3.9 104.9±2.5
14 95.1±6.2 93.1±4.1 100.5±2.6
30 93.8±2.9 88.1±5.8 97.1±2.2
60 98.0±2.2 94.4±1.5 101.1±4.0
90 92.7±2.2 92.1±1.6 97.6±3.8
GA Jars
Day 23°C 4°C 40°C
0 101.8±3.9 108.6±4.6 102.2±2.1
7 98.3±2.4 94.3±1.9 97.5±2.2
14 100.3±2.9 92.6±3.9 96.9±4.1
30 93.0±4.3 89.5±1.4 94.1±0.9
60 101.3±2.4 94.8±1.3 99.2±1.6
90 95.9±3.7 94.9±2.5 89.5±5.6
There was a significant difference in pH from day 0 on day 90 at 40°C, in WP jars
(p<0.05, Figure 19A). Mean pH was not significantly different at 23°C (p>0.05). There
was a significant difference on day 30 versus day 0 at 4°C (p<0.05). In GA jars, mean pH
was significantly different on days 30 and 90 compared to day 0 at 23°C (p<0.05, Figure
19B). A statistical difference in the mean pH at 14 and 30 days at 40°C, compared to day
0, was evident (p<0.05). No significant difference in mean pH from day 0 was observed
on days 14 and 90 at 4°C (p>0.05).
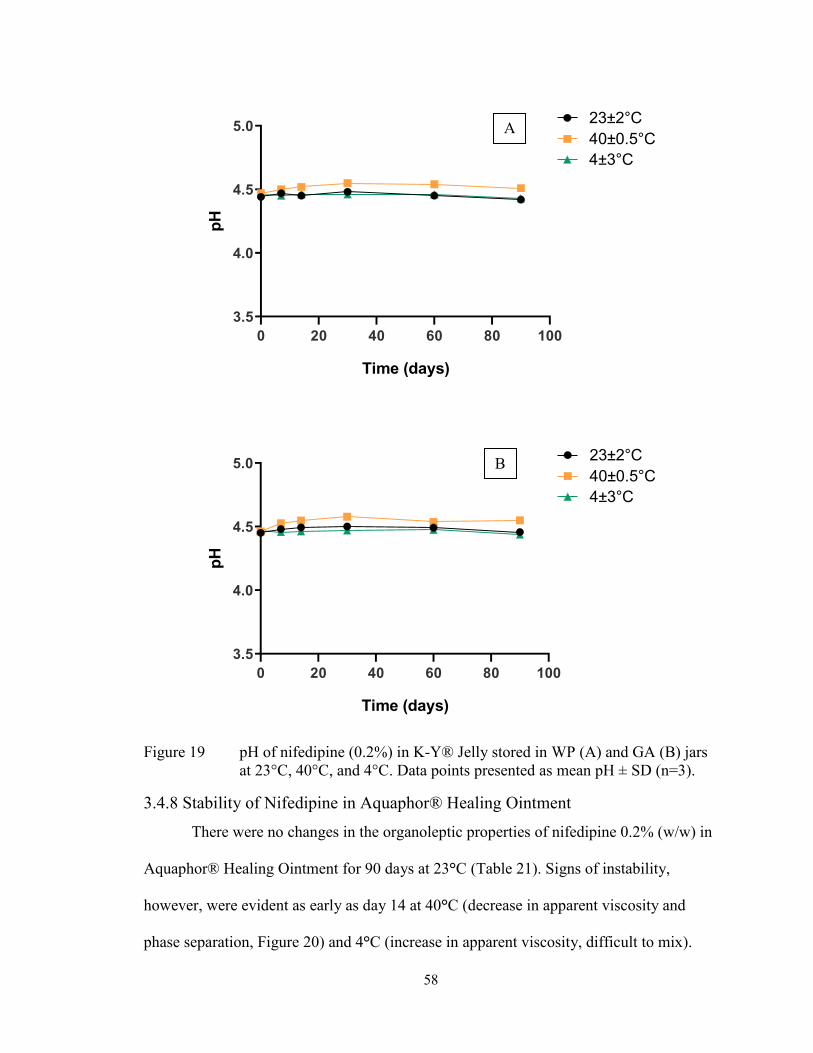
58
0 20 40 60 80 100
3.5
4.0
4.5
5.0
Time (days)
pH
23±2°C
40±0.5°C
4±3°C
0 20 40 60 80 100
3.5
4.0
4.5
5.0
Time (days)
pH
23±2°C
40±0.5°C
4±3°C
Figure 19 pH of nifedipine (0.2% in K-Y® Jelly stored in WP (A) and GA (B) jars
at 23°C, 40°C, and 4°C. Data points presented as mean pH ± SD (n=3).
3.4.8 Stability of Nifedipine in Aquaphor® Healing Ointment
There were no changes in the organoleptic properties of nifedipine 0.2% (w/w) in
Aquaphor® Healing Ointment for 90 days at 23°C (Table 21). Signs of instability,
however, were evident as early as day 14 at 40°C (decrease in apparent viscosity and
phase separation, Figure 20) and 4°C (increase in apparent viscosity, difficult to mix).
A
B
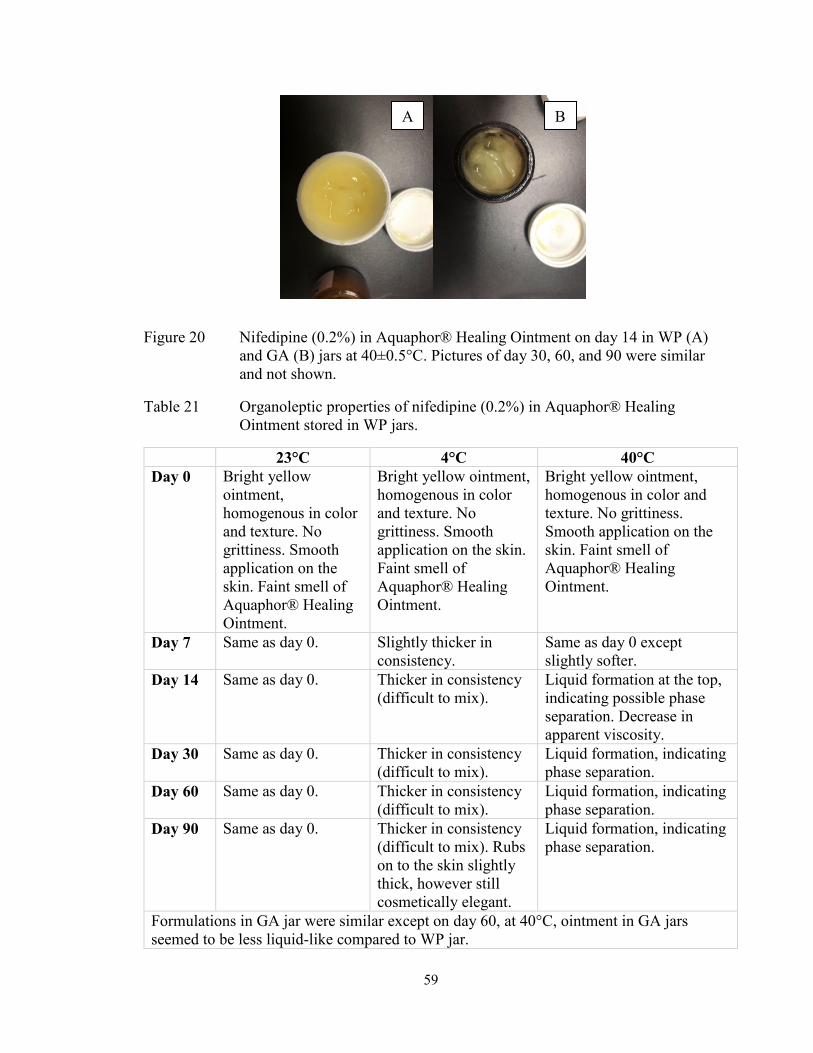
59
Figure 20 Nifedipine (0.2% in Aquaphor® Healing Ointment on day 14 in WP (A)
and GA (B) jars at 40±0.5°C. Pictures of day 30, 60, and 90 were similar
and not shown.
Table 21 Organoleptic properties of nifedipine (0.2% in Aquaphor® Healing
Ointment stored in WP jars.
23°C 4°C 40°C
Day 0 Bright yellow
ointment,
homogenous in color
and texture. No
grittiness. Smooth
application on the
skin. Faint smell of
Aquaphor® Healing
Ointment.
Bright yellow ointment,
homogenous in color
and texture. No
grittiness. Smooth
application on the skin.
Faint smell of
Aquaphor® Healing
Ointment.
Bright yellow ointment,
homogenous in color and
texture. No grittiness.
Smooth application on the
skin. Faint smell of
Aquaphor® Healing
Ointment.
Day 7 Same as day 0. Slightly thicker in
consistency.
Same as day 0 except
slightly softer.
Day 14 Same as day 0. Thicker in consistency
(difficult to mix).
Liquid formation at the top,
indicating possible phase
separation. Decrease in
apparent viscosity.
Day 30 Same as day 0. Thicker in consistency
(difficult to mix).
Liquid formation, indicating
phase separation.
Day 60 Same as day 0. Thicker in consistency
(difficult to mix).
Liquid formation, indicating
phase separation.
Day 90 Same as day 0. Thicker in consistency
(difficult to mix). Rubs
on to the skin slightly
thick, however still
cosmetically elegant.
Liquid formation, indicating
phase separation.
Formulations in GA jar were similar except on day 60, at 40°C, ointment in GA jars
seemed to be less liquid-like compared to WP jar.
A B

60
Nifedipine recovery from Aquaphor® Healing Ointment and percent remaining
are shown in Tables 22 and 23, respectively. No significant difference in nifedipine
potency in Aquaphor® Healing Ointment kept in WP jars, was observed at any
temperature (p>0.05). Nifedipine potency was within the USP recommended limits for 90
days at all temperatures in WP jars. No statistically significant difference in mean
potency was observed for formulations kept in GA jars (p>0.05). However, the potency
of nifedipine in GA jars was only maintained until day 30 (within 90-110%) at 23°C.
Table 22 Nifedipine recovery from Aquaphor® Healing Ointment on days 0, 7, 14,
30, 60, and 90. Data presented as concentration (µg/mL).
Concentration [µg/mL]
WP Jars GA Jars
Day 23°C 4°C 40°C 23°C 4°C 40°C
0 96.19
88.94
89.06
109.96
104.91
99.31
88.20
109.47
104.71
94.69
91.21
87.00
97.66
98.15
116.73
107.67
117.46
116.53
7 101.13
96.68
93.55
104.13
103.42
110.06
99.29
100.58
108.43
104.21
99.53
95.66
93.34
109.23
111.57
132.47
127.90
130.65
14 96.49
98.79
92.85
104.74
100.34
95.39
101.87
107.21
108.69
100.03
97.51
90.86
100.14
97.36
116.18
127.51
123.22
128.52
30 103.35
101.31
97.90
98.37
100.99
97.77
108.51
103.06
105.87
96.92
88.25
99.82
78.74
105.09
115.55
121.79
120.02
130.80
60 92.01
88.57
92.83
115.63
100.46
100.70
95.76
98.85
98.87
94.58
93.32
98.36
95.46
95.04
95.24
102.21
102.01
101.24
90 92.67
89.42
92.17
105.32
98.64
94.30
100.67
102.59
96.04
91.77
90.88
93.73
88.26
94.89
88.45
101.99
104.96
101.26
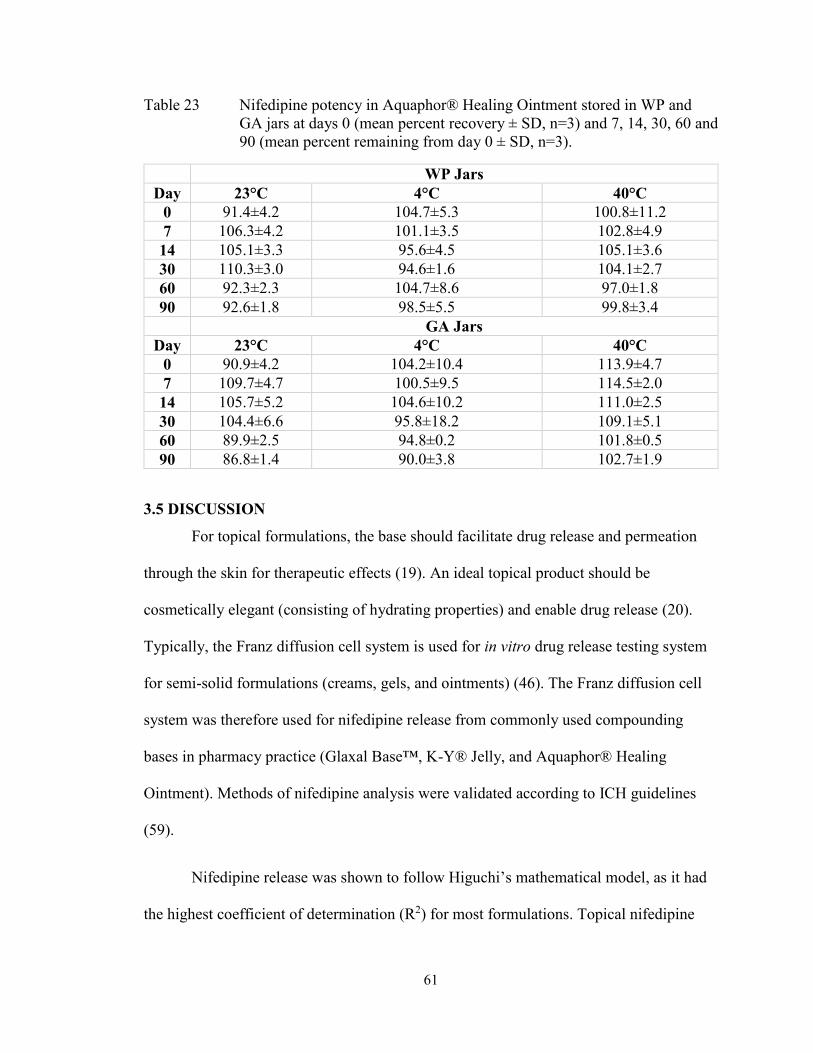
61
Table 23 Nifedipine potency in Aquaphor® Healing Ointment stored in WP and
GA jars at days 0 (mean percent recovery ± SD, n=3) and 7, 14, 30, 60 and
90 (mean percent remaining from day 0 ± SD, n=3).
WP Jars
Day 23°C 4°C 40°C
0 91.4±4.2 104.7±5.3 100.8±11.2
7 106.3±4.2 101.1±3.5 102.8±4.9
14 105.1±3.3 95.6±4.5 105.1±3.6
30 110.3±3.0 94.6±1.6 104.1±2.7
60 92.3±2.3 104.7±8.6 97.0±1.8
90 92.6±1.8 98.5±5.5 99.8±3.4
GA Jars
Day 23°C 4°C 40°C
0 90.9±4.2 104.2±10.4 113.9±4.7
7 109.7±4.7 100.5±9.5 114.5±2.0
14 105.7±5.2 104.6±10.2 111.0±2.5
30 104.4±6.6 95.8±18.2 109.1±5.1
60 89.9±2.5 94.8±0.2 101.8±0.5
90 86.8±1.4 90.0±3.8 102.7±1.9
3.5 DISCUSSION
For topical formulations, the base should facilitate drug release and permeation
through the skin for therapeutic effects (19). An ideal topical product should be
cosmetically elegant (consisting of hydrating properties) and enable drug release (20).
Typically, the Franz diffusion cell system is used for in vitro drug release testing system
for semi-solid formulations (creams, gels, and ointments) (46). The Franz diffusion cell
system was therefore used for nifedipine release from commonly used compounding
bases in pharmacy practice (Glaxal Base™, K-Y® Jelly, and Aquaphor® Healing
Ointment). Methods of nifedipine analysis were validated according to ICH guidelines
(59).
Nifedipine release was shown to follow Higuchi’s mathematical model, as it had
the highest coefficient of determination (R2) for most formulations. Topical nifedipine
62
0.2% (w/w) in Glaxal Base™ showed the highest cumulative release, followed by 2 and
10%, respectively. The higher release with the lower concentration may be due to less
drug resistance. Nifedipine release from Aquaphor® Healing Ointment was minimal,
potentially a result of nifedipine lipophilicity, as lipophilic compounds are released
minimally from lipophilic bases (such as an ointment) (69). At 0.2%, nifedipine release
was highest from Glaxal Base™. At 2 and 10%, nifedipine release was highest from K-
Y® Jelly, although this was only significantly different from Glaxal Base™ at 6 h and
1.5, 4, 6 h, respectively. Glaxal Base™ is the recommended base for compounded
nifedipine (0.2%) for anal fissures treatment. K-Y® Jelly may be used as an alternative.
For higher concentrations of nifedipine (2 and 10%), Glaxal Base™ and K-Y® Jelly are
both reasonable choices for base selection.
Stability studies for nifedipine in Glaxal Base™, K-Y® Jelly, and Aquaphor®
Healing Ointment were also completed using accurate and precise extraction methods
and a validated stability indicating method. Nifedipine potency in Glaxal Base™ (0.2%
w/w) was within the recommended range for 90 days (excluding day 14), in WP jars at
all temperatures. The pH was also stable with a change of less than 1-unit pH. No
significant changes in organoleptic properties were observed at 4 and 23°C. However, at
40°C, a significant decrease in apparent viscosity was evident on day 90, making the
product cosmetically unacceptable. Therefore, a BUD of 90 days was recommended for
nifedipine cream in WP jars stored at 4 and 23°C but only 60 days at 40°C.
When stored in GA jars, nifedipine potency in Glaxal Base™ was outside the
acceptable USP range on day 14 at 23°C but within the range for 90 days at 4°C
(excluding day 30). Potency was increased and outside of recommended range on day 7
63
at 40°C in GA jars, making it difficult to interpret the results. There was an increase in
pH at all temperatures; however, this was not clinically significant (changes were less
than 1-unit pH). While pH increased in GA jars, it decreased (particularly at 40°C) in WP
jars despite Glaxal Base™ containing sodium phosphate as a buffering agent (63).
Increases in pH in glass containers may result from the release of alkali components,
regardless of the type of glass, which can result in instability of the stored product (70).
For example, manufacturing of glass vials can result in an alkaline residue, sodium
borate, etc., which can increase pH by reacting with the stored product, leading to an
exchange of sodium (Na+) for hydronium (H3O+) ions (70). Although the pH of nifedipine
in Glaxal Base™ increased when stored in GA jars, it was not clinically significant.
Additionally, there were no substantial differences in organoleptic properties at 4 and
23°C. However, at 40°C, a decrease in apparent viscosity was evident by day 7 and on
day 90, the product was cosmetically unacceptable. Therefore, formulations stored at
4°C in GA jars may be assigned a BUD of 90 days while only 7 days at 23°C. Based on
the results, it would be more appropriate to store the cream in WP jars at room
temperature.
Nifedipine potency in K-Y® Jelly was within the acceptable range for 90 days in
both WP and GA jars at 23°C and 4°C (excluding day 30). At 40°C, adequate nifedipine
potency was retained for 90 days in WP jars but 60 days in GA jars. No clinically
significant changes in pH at any temperature was observed in either WP or GA jars as K-
Y® Jelly contains gluconolactone, an acidulant, and sodium hydroxide, an alkalizing
agent, which are used to adjust pH (63). Significant organoleptic changes were observed
by day 7 at 40°C (decrease in apparent viscosity and abnormal odor by day 90), day 30 at
64
4°C (thicker consistency) and day 90 at 23°C (abnormal odor). Thus, a BUD of 14 and 60
days is recommended for nifedipine in K-Y® Jelly stored in WP and GA jars at 4 and
23°C, respectively. Nifedipine gel exposed to elevated temperatures (40°C) in WP or GA
jars should be used within 7 days.
Acceptable nifedipine potency in Aquaphor® Healing Ointment was maintained
at all temperatures for 90 days in WP jars. The potency of the drug in GA jars was only
maintained until day 30 at 23°C. The organoleptic properties showed potential instability
as early as day 14 at 40°C (decrease in apparent viscosity and phase separation) and at
4°C (increase in apparent viscosity, difficult to mix). Thus, a BUD of 90 days for
nifedipine in Aquaphor® Healing Ointment stored in WP jars at 23°C was recommended.
If stored in GA jars, nifedipine ointment should be assigned a BUD of 30 days at 23°C.
Nifedipine ointment may be used within 7 days if stored in either WP or GA jars at 4 and
40°C, respectively.
65
CHAPTER 4 RELEASE AND STABILITY OF COMPOUNDED TOPICAL
DILTIAZEM
4.1 CHEMICALS
Diltiazem hydrochloride USP (Lot: 01796-8081), heavy mineral oil USP (Lot:
06919-8052), propylene glycol USP (Lot: 07022-8071), white petrolatum USP (Lot:
01199-8037), methylparaben NF 25g (Lot: 01304-8011), propylparaben NF 25g (Lot:
00933-7052) and hydroxyethyl cellulose 1500cps NF 100g (Lot: 11302-8159) were
purchased from Galenova (Saint-Hyacinthe, QC, Canada). Glaxal Base™ cream (Lot:
A152264-17205B10 and A160828-18029B10) was bought from Shoppers Drug Mart
Pharmacy (Dartmouth, NS, Canada) and Costco Wholesale (Dartmouth, NS, Canada).
Sodium acetate (Batch#: 065K0151) and (+)-Camphor-10-sulfonic acid (Lot:
WXBC7290V) were acquired from Sigma-Aldrich (Oakville, ON, Canada). Sodium
hydroxide (NaOH) solution 10N (Lot: 175869), acetonitrile (Lot: 171203) and methanol
HPLC Grade (Lot: 178823) were from Fisher Scientific (Ottawa, ON, Canada). A
Barnstead Nanopure II filtering system was used to obtain deionized water (18 Ω).
Phosphate Buffered Saline (PBS) 20X (Lot: l2614) from Santa Cruz Biotechnology, Inc.
(Dallas, TX, USA) was used for release studies.
4.2 EQUIPMENT AND OTHER SUPPLIES
The Franz diffusion cell system from PermeGear Inc. (Hellertown, PA, USA),
included the V-series stirrer (V6-CA-01), six Franz cells (9 mm clear jacketed, 5 mL
receptor volume, 0.64 cm2 orifice with flat ground joint), pinch clamps and stir bars.
Franz diffusion sampling pipette tips were also purchased from Permegear Inc.
(Hellertown, PA, USA). The system was attached to the Lauda Ecoline E100 water bath
circulator (Lauda-Koenigshofen, Germany) for temperature regulation. An infrared
66
thermometer with dual-laser-points-focus function (DT600 D:S=16:1, -50°C~600°C) was
used for temperature monitoring. Branson 3510 Ultrasonic was purchased from Marshal
Scientific (Cambridge, MA, USA). Cellulose filter paper [Fisher Scientific (Ottawa, ON,
Canada)], cellulose acetate membrane [0.47 µm; Geotech Environmental Euipment Inc.
(Denver, CO. USA)] and mixed cellulose ester (nitrate and acetate) membranes [0.45 µm;
Merck™ Millipore (Etobicoke, ON, Canada)] were used for drug release assays. White
plastic jars (1 oz) with white plastic foam liner caps and glass amber jars (25mL) with
white plastic poly-vinyl (PV) caps were bought from Galenova (Saint-Hyacinthe, QC,
Canada). The Fischerbrand™ Digital Vortex, a Mettler Toledo™ Micro pH Electrode:
LE422 (attached to a Hanna Instruments HI 2209 pH meter), and Basix
polytetrafluoroethylene (PTFE) 0.2 µm 13 mm syringe filters were purchased from
Fischer Scientific (Ottawa, ON, Canada). For the spectrophotometric analysis, a Cary 50
UV-Vis (Serial: #03037676; Varian Inc., CA, USA) spectrophotometer was used. For
HPLC analysis, a Varian-920 Liquid Chromatograph was used with a Brava ODS C18 5
μm 130Å 250 x 4.6 mm Column (Lot: 39/004) from Altech Associates Inc. (Deerfield,
IL, USA). A µP Triple-Trak™ incubator from LAB-LINE Instruments Inc. was used for
temperature regulation (40°C).
4.3 METHODS
4.3.1 HPLC Conditions
Spectrophotometric (71) and spectrofluorometric (72) methods of analyses for
diltiazem were tested with no reproducible results. Therefore, a USP HPLC method (73)
was used. A mixture of acetonitrile, methanol and buffer solution (50:25:25) constituted
the mobile phase (73), which was filtered through a 0.22 μm nylon membrane and
degassed for 30 minutes before each use. In 1000 mL of 0.1 M sodium acetate solution,
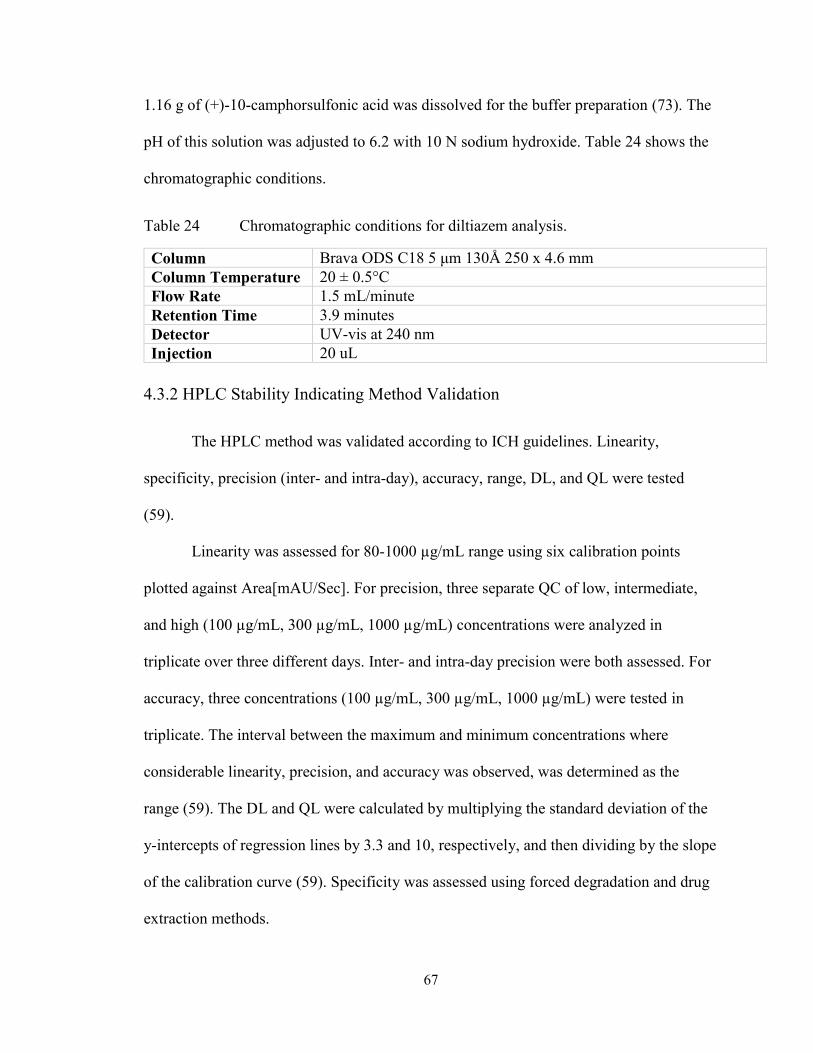
67
1.16 g of (+)-10-camphorsulfonic acid was dissolved for the buffer preparation (73). The
pH of this solution was adjusted to 6.2 with 10 N sodium hydroxide. Table 24 shows the
chromatographic conditions.
Table 24 Chromatographic conditions for diltiazem analysis.
Column Brava ODS C18 5 μm 130Å 250 x 4.6 mm
Column Temperature 20 ± 0.5°C
Flow Rate 1.5 mL/minute
Retention Time 3.9 minutes
Detector UV-vis at 240 nm
Injection 20 uL
4.3.2 HPLC Stability Indicating Method Validation
The HPLC method was validated according to ICH guidelines. Linearity,
specificity, precision (inter- and intra-day), accuracy, range, DL, and QL were tested
(59).
Linearity was assessed for 80-1000 µg/mL range using six calibration points
plotted against Area[mAU/Sec]. For precision, three separate QC of low, intermediate,
and high (100 µg/mL, 300 µg/mL, 1000 µg/mL) concentrations were analyzed in
triplicate over three different days. Inter- and intra-day precision were both assessed. For
accuracy, three concentrations (100 µg/mL, 300 µg/mL, 1000 µg/mL) were tested in
triplicate. The interval between the maximum and minimum concentrations where
considerable linearity, precision, and accuracy was observed, was determined as the
range (59). The DL and QL were calculated by multiplying the standard deviation of the
y-intercepts of regression lines by 3.3 and 10, respectively, and then dividing by the slope
of the calibration curve (59). Specificity was assessed using forced degradation and drug
extraction methods.
68
The HPLC method was shown as stability indicating in published studies, despite
adjustments in mobile phase ratios (62,74). Forced degradation methods were, however,
employed for in-house stability indicating validation. Stress tests (acidic, basic and heat)
were based on conditions from published literature (62,74), with minor adjustments.
In the first method, 0.5 mL of 0.1M HCL (acidic stress) and 0.5 mL of 0.1M
NaOH (basic stress) were added to diltiazem (0.01±0.005 g) in 10 mL volumetric flasks.
Solutions were stored at 40±0.5°C (dry heat) for six days, and 0.5 mL of 0.1M NaOH and
0.5 mL of 0.1M HCL were added to the acidic and basic stress tests, respectively, after
cooling. Solutions were diluted to 10 mL with methanol, to a concentration of 1000
µg/mL.
In the second method, 0.5 mL of 1M HCL (acidic stress) and 0.5 mL of 1M
NaOH (basic stress) were added to diltiazem (0.01±0.005 g) in 25 mL volumetric flasks.
Samples were heated in a 60±1°C water bath (wet heat) for 3.5 h. After cooling, 0.5 mL
of 1M NaOH and 0.5 mL of 1M HCL were added to the acidic and basic stress tests,
respectively. Solutions were diluted to 25 mL with methanol, to a concentration of 400
µg/mL. For the heat stress, diltiazem (0.01±0.005 g), in a 25 mL volumetric flask, was
kept at 40±0.5°C (dry heat) for 23 days. On day 23, the volume was diluted to 25 mL
with methanol, to a final concentration of 400 µg/mL.
For the last method, 1 mL of 1M HCL (acidic stress) and 1 mL of 1M NaOH
(basic stress) were added to diltiazem (0.01±0.005g) in 50 mL centrifuge tubes. Solutions
were kept at 100±1°C for 3 h in a water bath (wet heat). After cooling, 1 mL of 1M
NaOH and 1 mL of 1M HCL were added to the acidic and basic stress tests, respectively.

69
Diltiazem alone was also heated at 100±1°C for 3 h, for the heat stress test. All solutions
were diluted to 20 mL with methanol, to a final concentration of 500 µg/mL.
4.3.3 Compounding of Formulations
Diltiazem hydrochloride (HCl) 2% (w/w) was compounded in Glaxal Base™,
white petrolatum, and a hydroxyethyl cellulose-based gel. Compounding was performed
according to compounding instructions available to pharmacists. Diltiazem HCl USP was
weighed, in required amounts, and triturated using a mortar and pestle. Once finely
triturated, a few drops of levigating agent (propylene glycol USP for Glaxal Base™ and
heavy mineral oil USP for white petrolatum) was added to form a smooth paste. The
amount of base (Glaxal Base™ and white petrolatum) needed was weighed and added to
the paste in small portions (geometric dilution), for a uniform mixture.
For the gel, preserved water was prepared by dissolving methylparaben NF and
propylparaben NF in deionized water (75). Diltiazem HCl in required amounts was
triturated using a mortar and pestle (75). Propylene glycol USP was added to diltiazem
and thoroughly mixed (75). Hydroxyethyl cellulose 1500cps NF was then added in
proportions to the mixture and mixed well (75). Approximately 80% of the preserved
water was heated to 70°C and added to the mixture in a calibrated beaker (75). After
cooling, the mixture was made to final volume using preserved water, resulting in a clear
gel. Compounds were prepared in dim lighting due to the light-sensitive nature of
diltiazem. The non-medicinal ingredients in Glaxal Base™ are shown in Table 4 (Section
3.3.4).
70
4.3.4 Drug Release Studies
The release assay for diltiazem 2% (w/w) in Glaxal Base™, white petrolatum, and
gel, was conducted as described in section 3.3.5, in triplicate. Phosphate buffered saline
(PBS, pH=7.4) was used as the receptor fluid, as diltiazem HCl is water-soluble.
For membrane selection (diltiazem release studies), 0.5 mL of diltiazem HCl in
receptor fluid (1 mg/mL) was placed in the donor chamber of the Franz cell. Cellulose
filter paper, cellulose acetate and mixed cellulose ester membranes were hydrated in
receptor fluid for 1 h before the study. The release assay was conducted, as described in
section 3.3.5 (n=3).
4.3.5 Stability Testing
Compounded diltiazem formulations were kept in white plastic (WP) and glass
amber (GA) jars, in 20 g (or 20 mL gel) quantities, in triplicate. Compounds were stored
at refrigerator (4±3°C), room (23±2°C) and elevated (40±0.5°C) temperatures. Stability
testing was conducted as per section 3.3.7. The pH of freshly prepared diltiazem (2%
w/w) in Glaxal Base™ and gel was measured directly and using a 1:5 and 1:10 dilution in
deionized water, to compare differences in dilution methods for pH monitoring.
4.3.6 Drug Extraction Method
Multiple extraction methods for diltiazem 2% (w/w) from Glaxal Base™, white
petrolatum, and gel were tested. Methods with the highest precision and accuracy are
described.
Diltiazem was extracted from Glaxal Base™ based on a published method (76),
with adjustments. In a 15 mL centrifuge tube, 7 mL of methanol was added to 0.1±0.05 g
diltiazem in Glaxal Base™. The solution was vortexed (1500 RPM) for 1 minute and
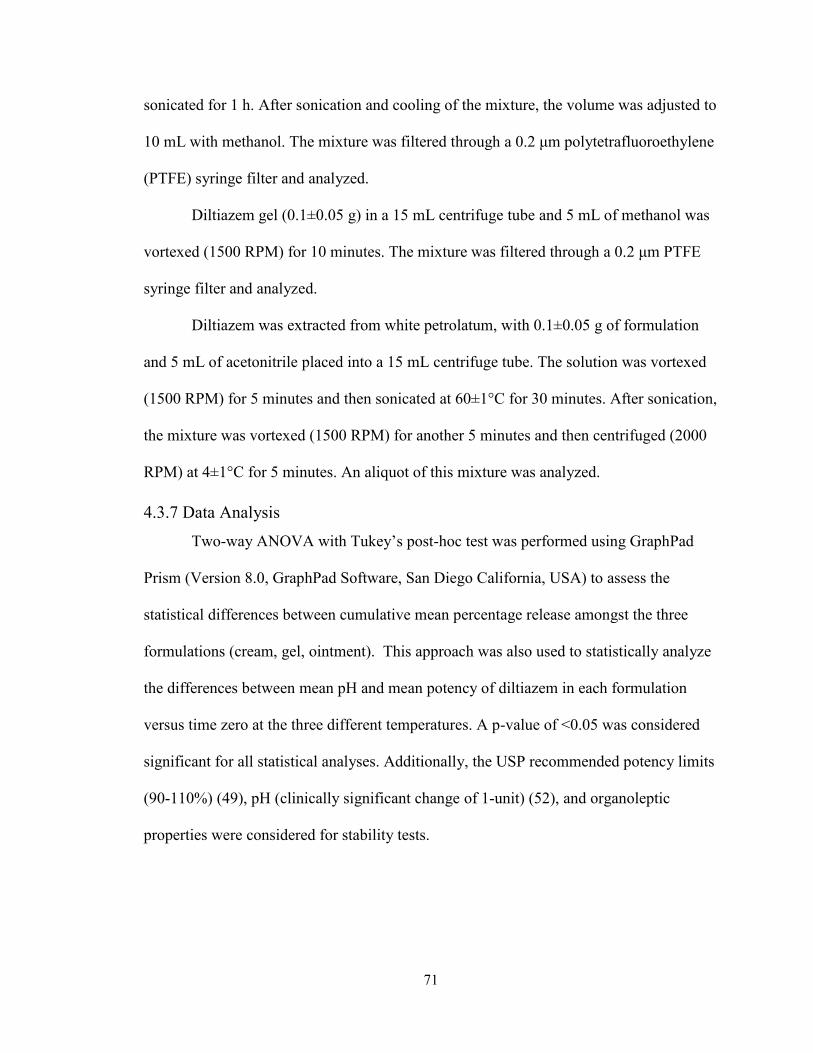
71
sonicated for 1 h. After sonication and cooling of the mixture, the volume was adjusted to
10 mL with methanol. The mixture was filtered through a 0.2 μm polytetrafluoroethylene
(PTFE) syringe filter and analyzed.
Diltiazem gel (0.1±0.05 g) in a 15 mL centrifuge tube and 5 mL of methanol was
vortexed (1500 RPM) for 10 minutes. The mixture was filtered through a 0.2 μm PTFE
syringe filter and analyzed.
Diltiazem was extracted from white petrolatum, with 0.1±0.05 g of formulation
and 5 mL of acetonitrile placed into a 15 mL centrifuge tube. The solution was vortexed
(1500 RPM) for 5 minutes and then sonicated at 60±1°C for 30 minutes. After sonication,
the mixture was vortexed (1500 RPM) for another 5 minutes and then centrifuged (2000
RPM) at 4±1°C for 5 minutes. An aliquot of this mixture was analyzed.
4.3.7 Data Analysis
Two-way ANOVA with Tukey’s post-hoc test was performed using GraphPad
Prism (Version 8.0, GraphPad Software, San Diego California, USA) to assess the
statistical differences between cumulative mean percentage release amongst the three
formulations (cream, gel, ointment). This approach was also used to statistically analyze
the differences between mean pH and mean potency of diltiazem in each formulation
versus time zero at the three different temperatures. A p-value of <0.05 was considered
significant for all statistical analyses. Additionally, the USP recommended potency limits
(90-110%) (49), pH (clinically significant change of 1-unit) (52), and organoleptic
properties were considered for stability tests.
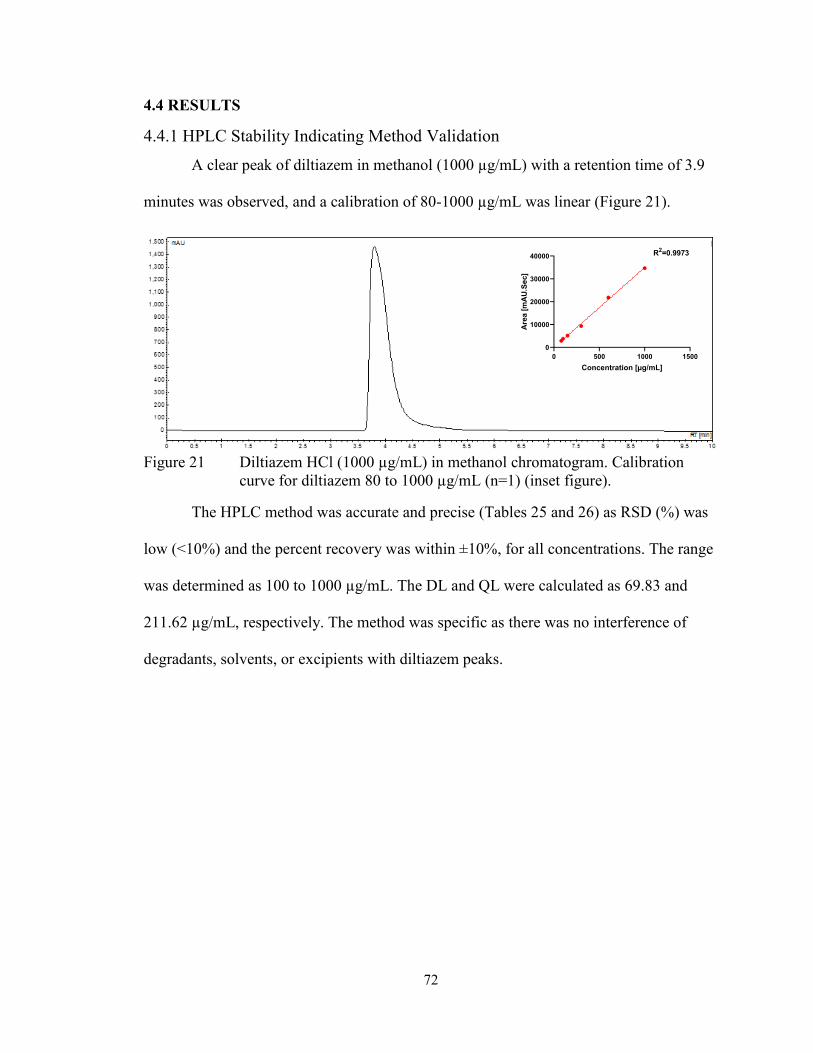
72
4.4 RESULTS
4.4.1 HPLC Stability Indicating Method Validation
A clear peak of diltiazem in methanol (1000 µg/mL) with a retention time of 3.9
minutes was observed, and a calibration of 80-1000 µg/mL was linear (Figure 21).
Figure 21 Diltiazem HCl (1000 µg/mL) in methanol chromatogram. Calibration
curve for diltiazem 80 to 1000 µg/mL (n=1) (inset figure).
The HPLC method was accurate and precise (Tables 25 and 26) as RSD (%) was
low (<10%) and the percent recovery was within ±10%, for all concentrations. The range
was determined as 100 to 1000 µg/mL. The DL and QL were calculated as 69.83 and
211.62 µg/mL, respectively. The method was specific as there was no interference of
degradants, solvents, or excipients with diltiazem peaks.
0 500 1000 1500
0
10000
20000
30000
40000
Concentration [µg/mL]
Are
a [
mA
U.S
ec]
R2=0.9973
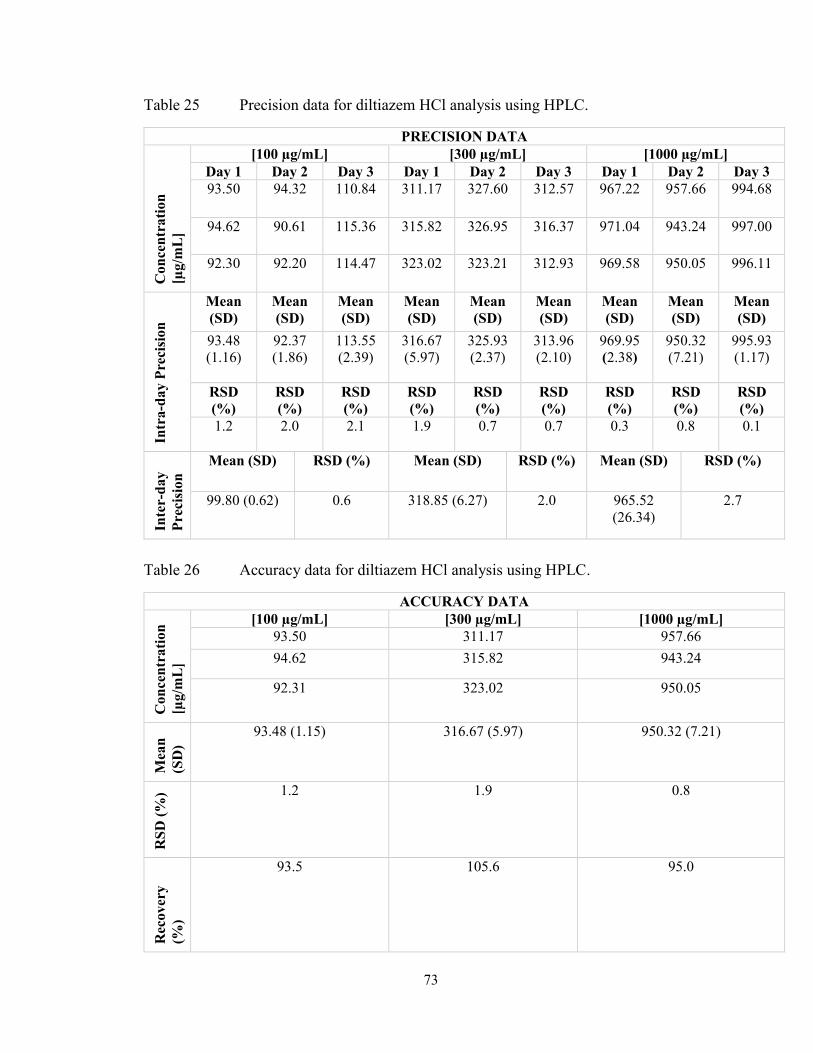
73
Table 25 Precision data for diltiazem HCl analysis using HPLC.
PRECISION DATA
Co
nce
ntr
ati
on
[µg
/mL
]
[100 µg/mL] [300 µg/mL] [1000 µg/mL]
Day 1 Day 2 Day 3 Day 1 Day 2 Day 3 Day 1 Day 2 Day 3
93.50 94.32 110.84 311.17
327.60 312.57 967.22
957.66 994.68
94.62 90.61 115.36 315.82
326.95 316.37 971.04
943.24 997.00
92.30 92.20 114.47 323.02
323.21 312.93 969.58
950.05 996.11
Intr
a-d
ay P
reci
sio
n
Mean
(SD)
Mean
(SD)
Mean
(SD)
Mean
(SD)
Mean
(SD)
Mean
(SD)
Mean
(SD)
Mean
(SD)
Mean
(SD)
93.48
(1.16)
92.37
(1.86)
113.55
(2.39)
316.67
(5.97)
325.93
(2.37)
313.96
(2.10)
969.95
(2.38)
950.32
(7.21)
995.93
(1.17)
RSD
(%)
RSD
(%)
RSD
(%)
RSD
(%)
RSD
(%)
RSD
(%)
RSD
(%)
RSD
(%)
RSD
(%)
1.2 2.0 2.1 1.9
0.7 0.7 0.3
0.8 0.1
Inte
r-d
ay
Pre
cisi
on
Mean (SD) RSD (%) Mean (SD) RSD (%) Mean (SD) RSD (%)
99.80 (0.62) 0.6 318.85 (6.27) 2.0 965.52
(26.34)
2.7
Table 26 Accuracy data for diltiazem HCl analysis using HPLC.
ACCURACY DATA
Con
cen
trati
on
[µg/m
L]
[100 µg/mL] [300 µg/mL] [1000 µg/mL]
93.50 311.17 957.66
94.62 315.82 943.24
92.31 323.02 950.05
Mea
n
(SD
)
93.48 (1.15) 316.67 (5.97) 950.32 (7.21)
RS
D (
%) 1.2 1.9 0.8
Rec
over
y
(%)
93.5 105.6 95.0
74
Diltiazem degraded under basic conditions of 1M NaOH at 60°C for 3.5 h (Table
27) and 1M NaOH at 100°C for 3 h (Figure 22), providing 52.8 and 29.2% recovery,
respectively. Under all other conditions, diltiazem did not degrade revealing between 98.9-
118.0% recovery (Table 27). Additionally, the peaks for diltiazem did not show any
interference from degradants. The chromatograms for diltiazem did not show a separate
peak for the degradants. However, the published literature that validated this method as
stability indicating with adjusted mobile phase ratios, show a longer retention time (9-
25mins), with degradant products appearing earlier (62,74), possibly due to the higher
amount of water used. The method used in this project, however, was the USP method with
a higher ratio of acetonitrile, thus shortening the retention time to 3.9 minutes. It is,
therefore, possible that the degradants left the column at a faster rate and were therefore
not detected. As this is a stability indicating USP method (62,73,74), it was chosen for
stability studies.
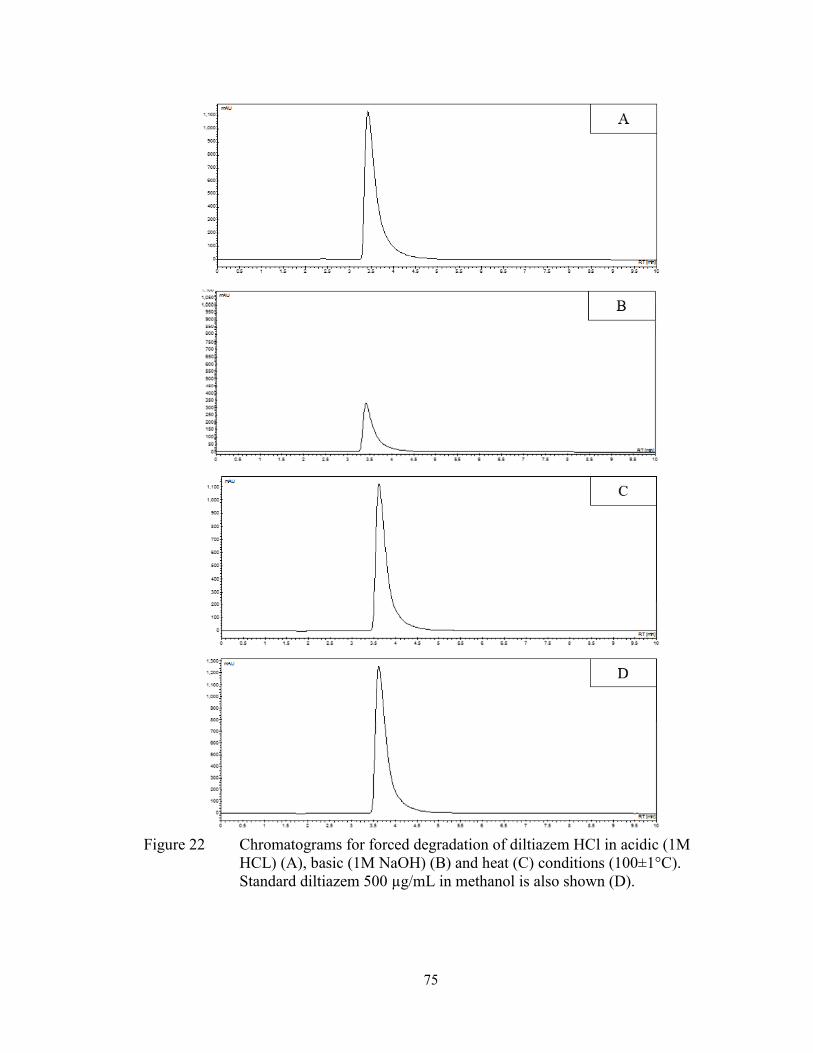
75
Figure 22 Chromatograms for forced degradation of diltiazem HCl in acidic (1M
HCL) (A), basic (1M NaOH) (B) and heat (C) conditions (100±1°C).
Standard diltiazem 500 µg/mL in methanol is also shown (D).

76
Table 27 Forced degradation of diltiazem using acidic, basic and heat stress.
Concentration
[µg/mL]
Recovery
(%)
Method 1
Acidic [1000µg/mL] 1078.75 107.9
Basic [1000µg/mL] 1023.70 102.4
Method 2
Acidic [400µg/mL] 445.20 111.3
Basic [400µg/mL] 211.15 52.8
Heat [400µg/mL] 395.39 98.9
Method 3
Acidic [500µg/mL] 590.20 118.0
Basic [500µg/mL] 146.19 29.2
Heat [500µg/mL] 535.81 107.2
4.4.2 Drug Extraction Method
The drug extraction methods for diltiazem (2% w/w) from Glaxal Base™, gel,
and white petrolatum were precise and accurate with RSD of 2.7, 2.1, 1.7% and mean
recovery of 106.1, 101.7, and 101.7%, respectively.
Table 28 Diltiazem HCl (2%) extraction from Glaxal Base™, gel, and white
petrolatum.
Glaxal Base™
[200 µg/mL]
Gel
[400 µg/mL]
White Petrolatum
[400 µg/mL]
Concentration
[µg/mL]
218.86
208.00
210.08
397.50
407.88
414.54
411.89
409.67
389.82
Mean (SD)
[µg/mL]
212.31 (5.76)
406.64 (8.59) 406.79 (7.00)
RSD (%) 2.7
2.1 1.7
Recovery (%) 106.1 101.7 101.7
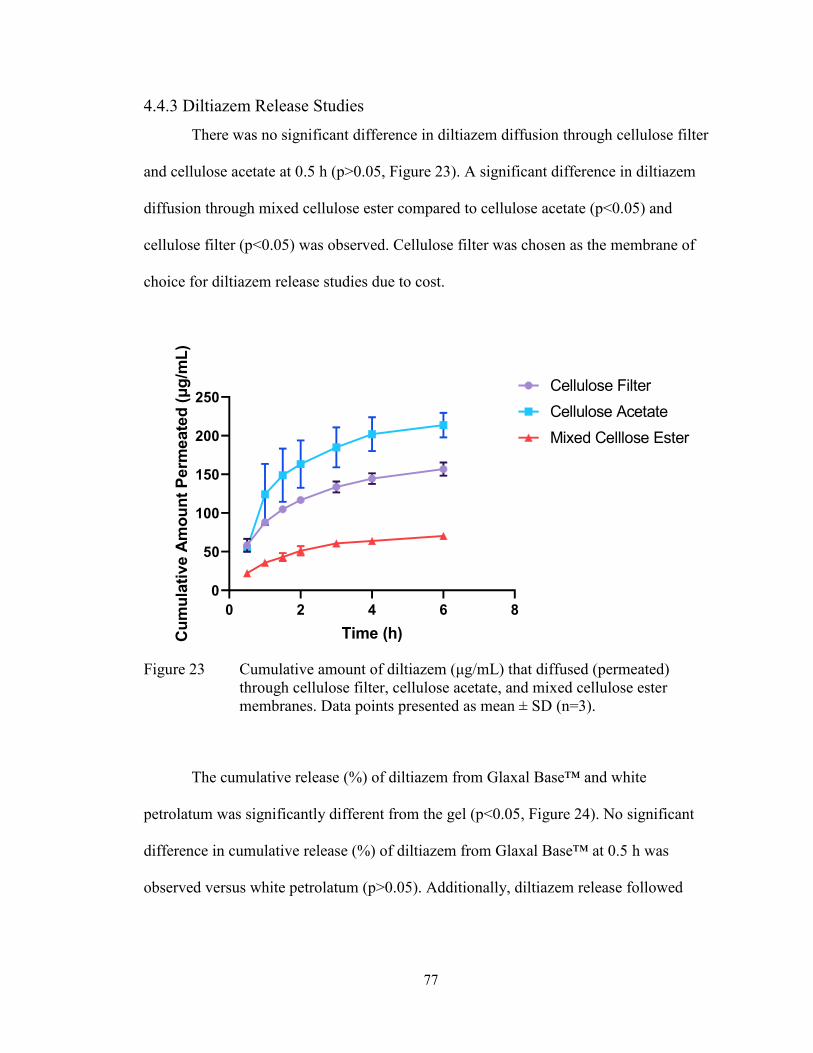
77
4.4.3 Diltiazem Release Studies
There was no significant difference in diltiazem diffusion through cellulose filter
and cellulose acetate at 0.5 h (p>0.05, Figure 23). A significant difference in diltiazem
diffusion through mixed cellulose ester compared to cellulose acetate (p<0.05) and
cellulose filter (p<0.05) was observed. Cellulose filter was chosen as the membrane of
choice for diltiazem release studies due to cost.
0 2 4 6 8
0
50
100
150
200
250
Time (h)Cu
mu
lati
ve A
mo
un
t P
erm
eate
d (μ
g/m
L)
Cellulose Filter
Cellulose Acetate
Mixed Celllose Ester
Figure 23 Cumulative amount of diltiazem (μg/mL) that diffused (permeated)
through cellulose filter, cellulose acetate, and mixed cellulose ester
membranes. Data points presented as mean ± SD (n=3).
The cumulative release (%) of diltiazem from Glaxal Base™ and white
petrolatum was significantly different from the gel (p<0.05, Figure 24). No significant
difference in cumulative release (%) of diltiazem from Glaxal Base™ at 0.5 h was
observed versus white petrolatum (p>0.05). Additionally, diltiazem release followed

78
Higuchi’s mathematical model as it resulted in the highest coefficient of determination
(R2) for all three formulations (Table 29).
0.5 1 1.5 2 3 4 6
0
20
40
60
80
100
Time (h)
Cu
mu
lati
ve R
ele
ase
(%
)Glaxal BaseTM
Gel
White Petrolatum
Figure 24 Cumulative diltiazem HCl (2%) release from Glaxal Base™, hydroxyethyl
cellulose-based gel, and white petrolatum. Data points presented as mean
± SD (n=3).
Table 29 Mathematical models for diltiazem HCl (2%) release from Glaxal Base™,
gel and white petrolatum.
Higuchi (R2) Zero Order (R2) First Order (R2) Hixson-
Crowell (R2)
Glaxal
Base™
0.9427 0.7570 0.8155 0.7963
Gel 0.9724 0.9470 0.9699 0.9630
White
Petrolatum
0.5009 0.2313 0.2298 0.2303
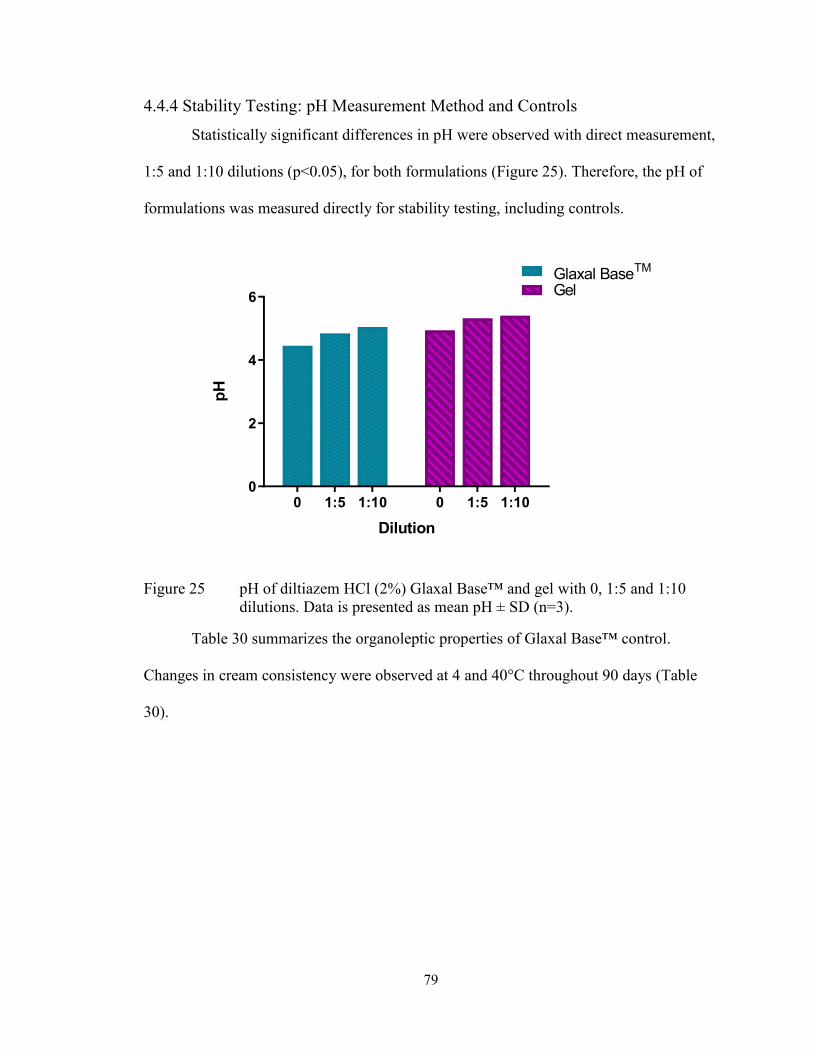
79
4.4.4 Stability Testing: pH Measurement Method and Controls
Statistically significant differences in pH were observed with direct measurement,
1:5 and 1:10 dilutions (p<0.05), for both formulations (Figure 25). Therefore, the pH of
formulations was measured directly for stability testing, including controls.
0 1:5 1:10 0 1:5 1:100
2
4
6
Glaxal BaseTM
Gel
Dilution
pH
Figure 25 pH of diltiazem HCl (2%) Glaxal Base™ and gel with 0, 1:5 and 1:10
dilutions. Data is presented as mean pH ± SD (n=3).
Table 30 summarizes the organoleptic properties of Glaxal Base™ control.
Changes in cream consistency were observed at 4 and 40°C throughout 90 days (Table
30).
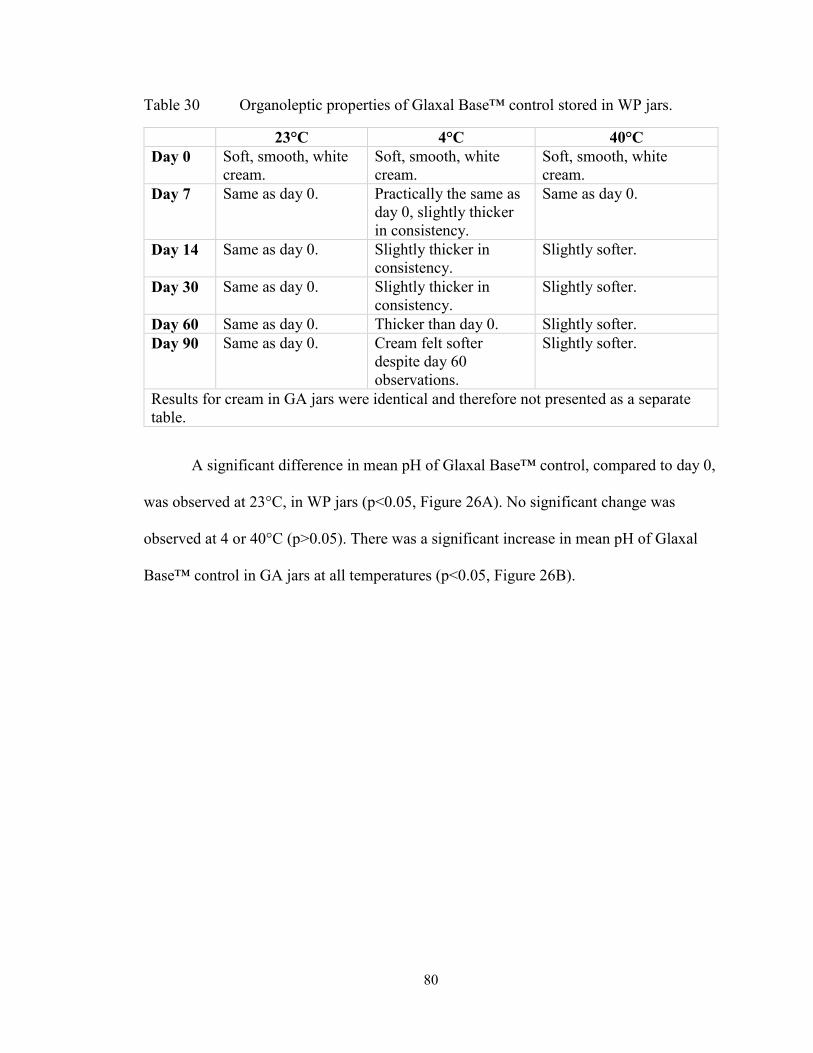
80
Table 30 Organoleptic properties of Glaxal Base™ control stored in WP jars.
23°C 4°C 40°C
Day 0 Soft, smooth, white
cream.
Soft, smooth, white
cream.
Soft, smooth, white
cream.
Day 7 Same as day 0. Practically the same as
day 0, slightly thicker
in consistency.
Same as day 0.
Day 14 Same as day 0. Slightly thicker in
consistency.
Slightly softer.
Day 30 Same as day 0. Slightly thicker in
consistency.
Slightly softer.
Day 60 Same as day 0. Thicker than day 0. Slightly softer.
Day 90 Same as day 0. Cream felt softer
despite day 60
observations.
Slightly softer.
Results for cream in GA jars were identical and therefore not presented as a separate
table.
A significant difference in mean pH of Glaxal Base™ control, compared to day 0,
was observed at 23°C, in WP jars (p<0.05, Figure 26A). No significant change was
observed at 4 or 40°C (p>0.05). There was a significant increase in mean pH of Glaxal
Base™ control in GA jars at all temperatures (p<0.05, Figure 26B).

81
0 20 40 60 80 1003.5
4.0
4.5
5.0
5.523±2°C
40±0.5°C
4±3°C
Time (days)
pH
0 20 40 60 80 1003.5
4.0
4.5
5.0
5.5
6.023±2°C
40±0.5°C
4±3°C
Time (days)
pH
Figure 26 pH of Glaxal Base™ control in WP (A) and GA (B) jars at 23°C (WP
only), 40°C, and 4°C. Data points presented as mean pH ± SD (n=3).
Organoleptic properties of hydroxyethyl cellulose-based gel control are
summarized in Table 31. Changes in gel consistency were evident at 4°C (thicker) and
40°C (decrease in apparent viscosity) by day 14.
A
B
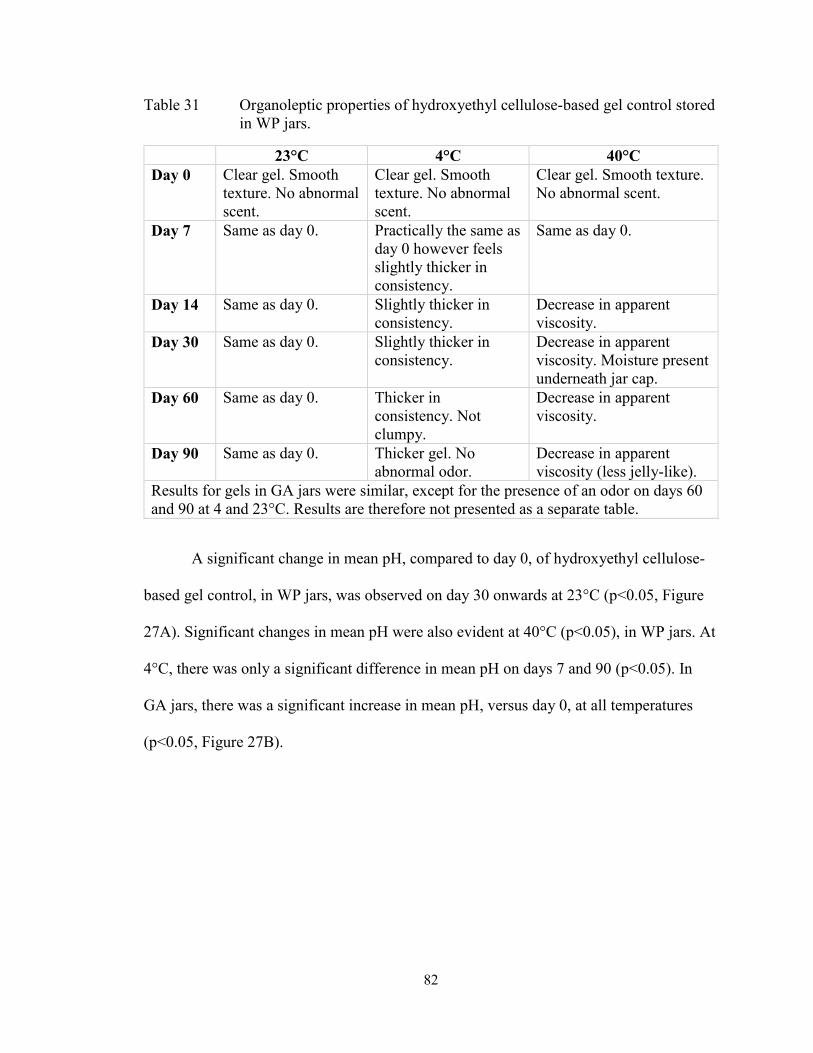
82
Table 31 Organoleptic properties of hydroxyethyl cellulose-based gel control stored
in WP jars.
23°C 4°C 40°C
Day 0 Clear gel. Smooth
texture. No abnormal
scent.
Clear gel. Smooth
texture. No abnormal
scent.
Clear gel. Smooth texture.
No abnormal scent.
Day 7 Same as day 0. Practically the same as
day 0 however feels
slightly thicker in
consistency.
Same as day 0.
Day 14 Same as day 0. Slightly thicker in
consistency.
Decrease in apparent
viscosity.
Day 30 Same as day 0. Slightly thicker in
consistency.
Decrease in apparent
viscosity. Moisture present
underneath jar cap.
Day 60 Same as day 0. Thicker in
consistency. Not
clumpy.
Decrease in apparent
viscosity.
Day 90 Same as day 0. Thicker gel. No
abnormal odor.
Decrease in apparent
viscosity (less jelly-like).
Results for gels in GA jars were similar, except for the presence of an odor on days 60
and 90 at 4 and 23°C. Results are therefore not presented as a separate table.
A significant change in mean pH, compared to day 0, of hydroxyethyl cellulose-
based gel control, in WP jars, was observed on day 30 onwards at 23°C (p<0.05, Figure
27A). Significant changes in mean pH were also evident at 40°C (p<0.05), in WP jars. At
4°C, there was only a significant difference in mean pH on days 7 and 90 (p<0.05). In
GA jars, there was a significant increase in mean pH, versus day 0, at all temperatures
(p<0.05, Figure 27B).
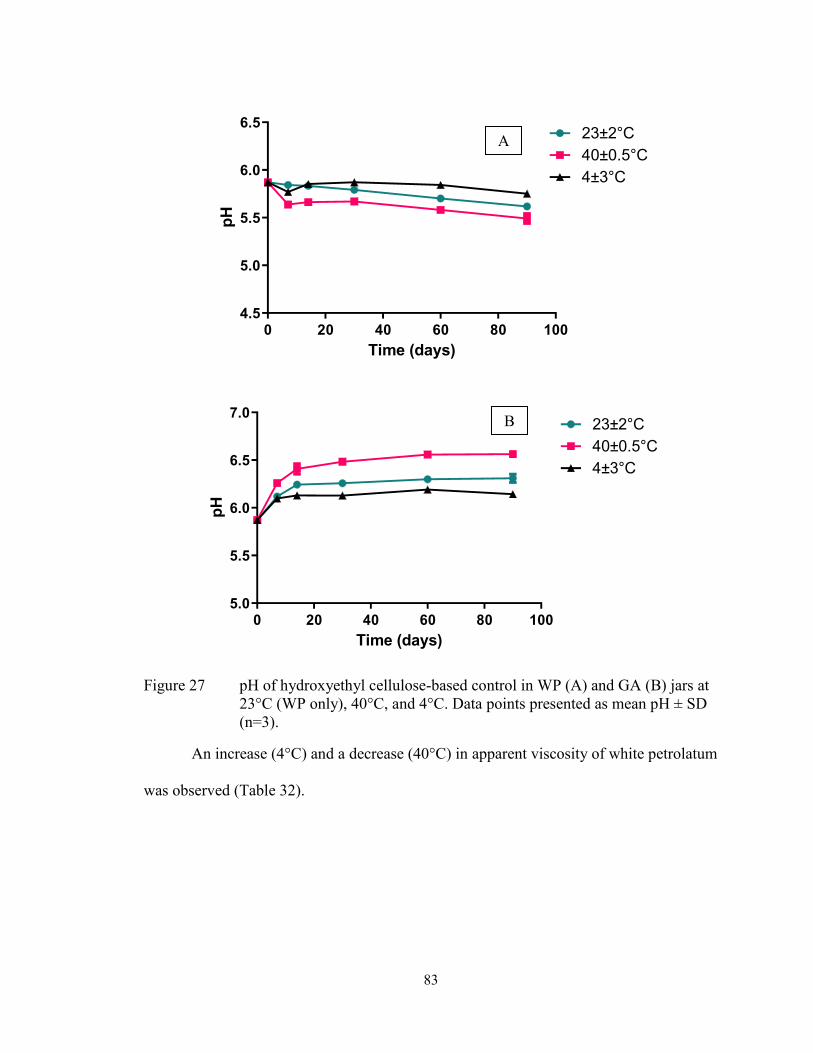
83
0 20 40 60 80 1004.5
5.0
5.5
6.0
6.523±2°C
40±0.5°C
4±3°C
Time (days)
pH
0 20 40 60 80 1005.0
5.5
6.0
6.5
7.023±2°C
40±0.5°C
4±3°C
Time (days)
pH
Figure 27 pH of hydroxyethyl cellulose-based control in WP (A) and GA (B) jars at
23°C (WP only), 40°C, and 4°C. Data points presented as mean pH ± SD
(n=3).
An increase (4°C) and a decrease (40°C) in apparent viscosity of white petrolatum
was observed (Table 32).
B
A

84
Table 32 Organoleptic properties of white petrolatum control stored in WP jars.
4°C 40°C
Day 0 White ointment, smooth on the skin. White ointment, smooth on the skin.
Day 7 Increase in apparent viscosity,
difficult to mix.
Phase separation (liquid formation on
top, more visible in GA jars).
Decrease in apparent viscosity.
Day 14 Increase in apparent viscosity,
difficult to mix.
Decrease in apparent viscosity. Not
ointment-like in appearance.
Day 30 Increase in apparent viscosity,
difficult to mix.
Decrease in apparent viscosity.
Day 60 Increase in apparent viscosity, very
difficult to mix.
Decrease in apparent viscosity.
Day 90 Increase in apparent viscosity, very
difficult to mix.
Decrease in apparent viscosity.
Extremely soft.
Results for ointment in GA jars were identical and therefore not presented as a separate
table.
4.4.5 Stability of Diltiazem in Glaxal Base™
Organoleptic properties of diltiazem 2% (w/w) in Glaxal Base™ is summarized in
Table 33. An increase (4°C) and a decrease (40°C) in apparent viscosity of formulations
was observed by day 7 (Table 33), although changes were not significant. An abnormal
odor, however, was observed on day 90 in WP jars stored at 4°C.
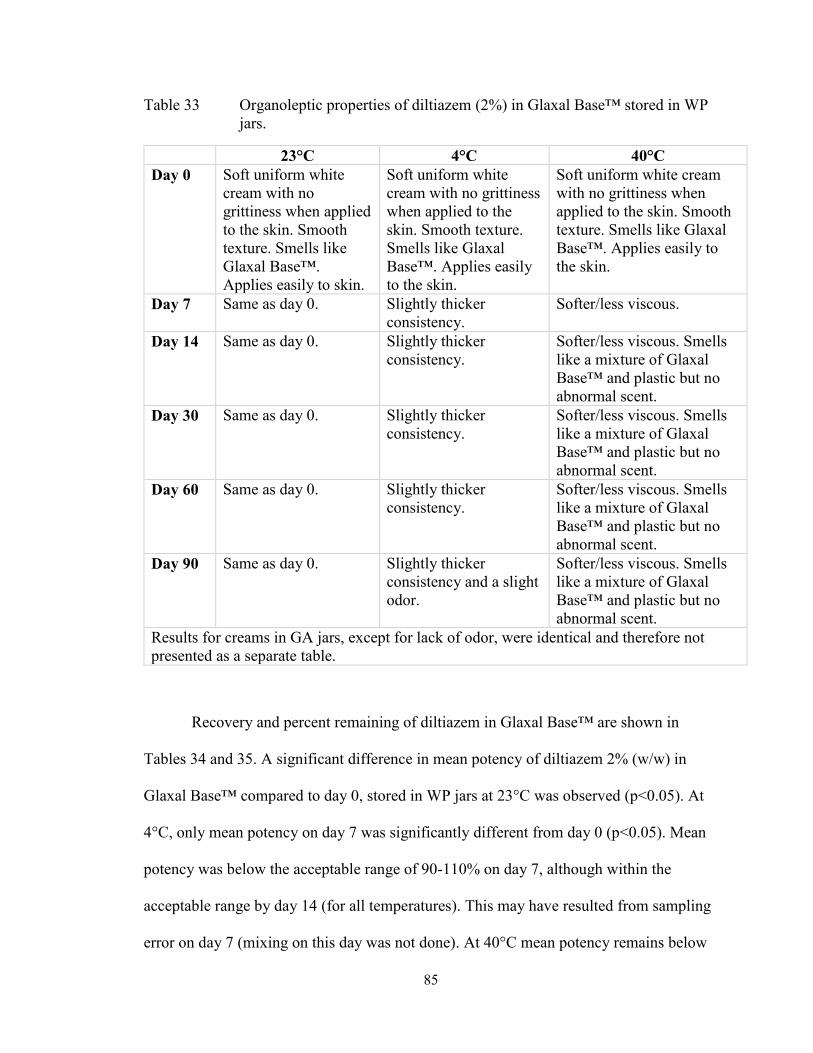
85
Table 33 Organoleptic properties of diltiazem (2%) in Glaxal Base™ stored in WP
jars.
23°C 4°C 40°C
Day 0 Soft uniform white
cream with no
grittiness when applied
to the skin. Smooth
texture. Smells like
Glaxal Base™.
Applies easily to skin.
Soft uniform white
cream with no grittiness
when applied to the
skin. Smooth texture.
Smells like Glaxal
Base™. Applies easily
to the skin.
Soft uniform white cream
with no grittiness when
applied to the skin. Smooth
texture. Smells like Glaxal
Base™. Applies easily to
the skin.
Day 7 Same as day 0. Slightly thicker
consistency.
Softer/less viscous.
Day 14 Same as day 0. Slightly thicker
consistency.
Softer/less viscous. Smells
like a mixture of Glaxal
Base™ and plastic but no
abnormal scent.
Day 30 Same as day 0. Slightly thicker
consistency.
Softer/less viscous. Smells
like a mixture of Glaxal
Base™ and plastic but no
abnormal scent.
Day 60 Same as day 0. Slightly thicker
consistency.
Softer/less viscous. Smells
like a mixture of Glaxal
Base™ and plastic but no
abnormal scent.
Day 90 Same as day 0. Slightly thicker
consistency and a slight
odor.
Softer/less viscous. Smells
like a mixture of Glaxal
Base™ and plastic but no
abnormal scent.
Results for creams in GA jars, except for lack of odor, were identical and therefore not
presented as a separate table.
Recovery and percent remaining of diltiazem in Glaxal Base™ are shown in
Tables 34 and 35. A significant difference in mean potency of diltiazem 2% (w/w) in
Glaxal Base™ compared to day 0, stored in WP jars at 23°C was observed (p<0.05). At
4°C, only mean potency on day 7 was significantly different from day 0 (p<0.05). Mean
potency was below the acceptable range of 90-110% on day 7, although within the
acceptable range by day 14 (for all temperatures). This may have resulted from sampling
error on day 7 (mixing on this day was not done). At 40°C mean potency remains below
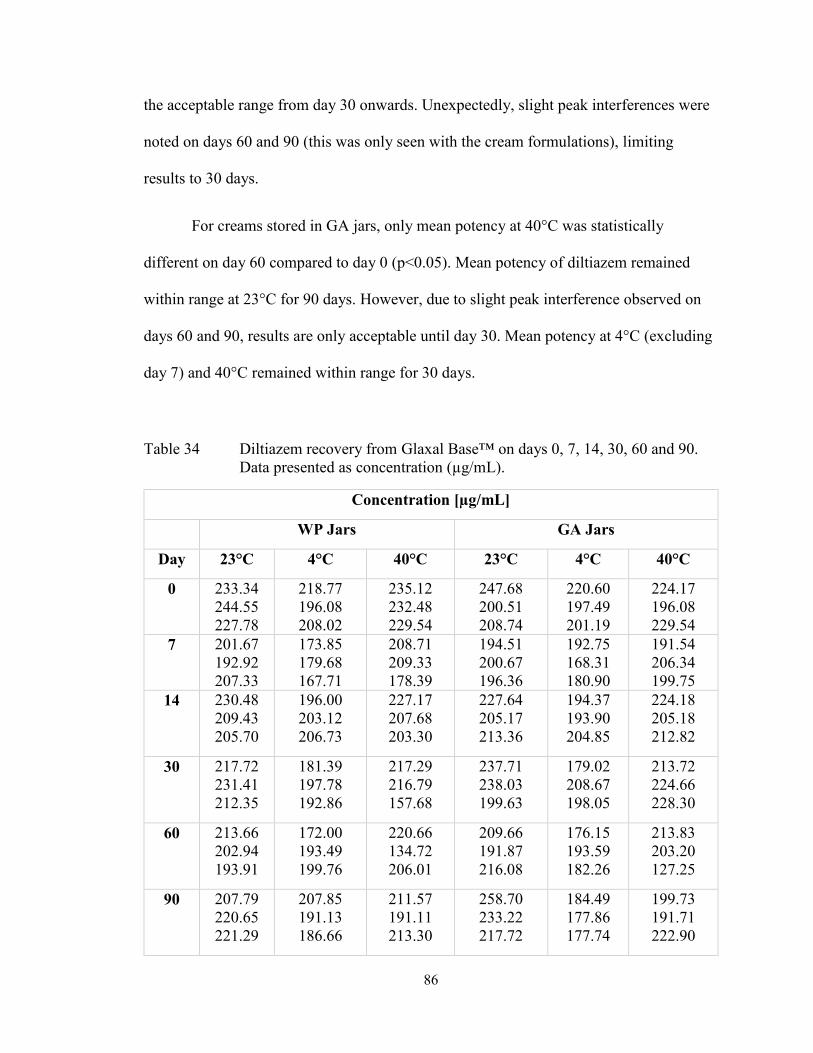
86
the acceptable range from day 30 onwards. Unexpectedly, slight peak interferences were
noted on days 60 and 90 (this was only seen with the cream formulations), limiting
results to 30 days.
For creams stored in GA jars, only mean potency at 40°C was statistically
different on day 60 compared to day 0 (p<0.05). Mean potency of diltiazem remained
within range at 23°C for 90 days. However, due to slight peak interference observed on
days 60 and 90, results are only acceptable until day 30. Mean potency at 4°C (excluding
day 7) and 40°C remained within range for 30 days.
Table 34 Diltiazem recovery from Glaxal Base™ on days 0, 7, 14, 30, 60 and 90.
Data presented as concentration (µg/mL).
Concentration [µg/mL]
WP Jars GA Jars
Day 23°C 4°C 40°C 23°C 4°C 40°C
0 233.34
244.55
227.78
218.77
196.08
208.02
235.12
232.48
229.54
247.68
200.51
208.74
220.60
197.49
201.19
224.17
196.08
229.54
7 201.67
192.92
207.33
173.85
179.68
167.71
208.71
209.33
178.39
194.51
200.67
196.36
192.75
168.31
180.90
191.54
206.34
199.75
14 230.48
209.43
205.70
196.00
203.12
206.73
227.17
207.68
203.30
227.64
205.17
213.36
194.37
193.90
204.85
224.18
205.18
212.82
30 217.72
231.41
212.35
181.39
197.78
192.86
217.29
216.79
157.68
237.71
238.03
199.63
179.02
208.67
198.05
213.72
224.66
228.30
60 213.66
202.94
193.91
172.00
193.49
199.76
220.66
134.72
206.01
209.66
191.87
216.08
176.15
193.59
182.26
213.83
203.20
127.25
90 207.79
220.65
221.29
207.85
191.13
186.66
211.57
191.11
213.30
258.70
233.22
217.72
184.49
177.86
177.74
199.73
191.71
222.90
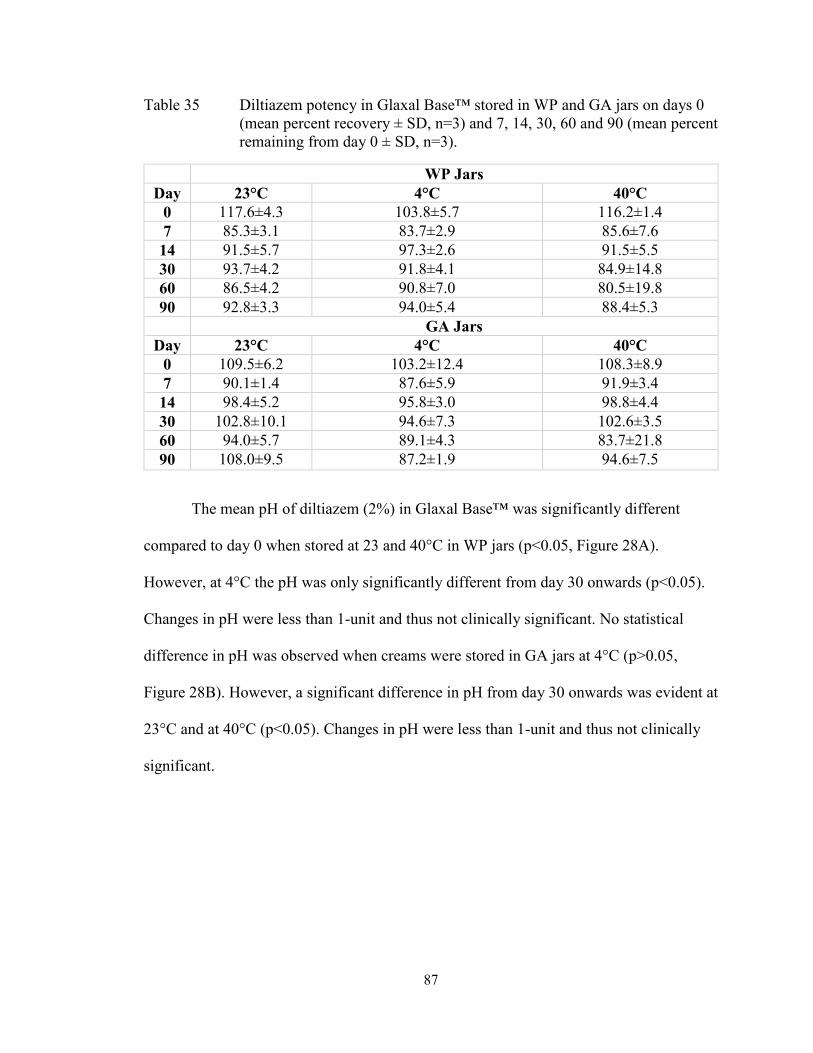
87
Table 35 Diltiazem potency in Glaxal Base™ stored in WP and GA jars on days 0
(mean percent recovery ± SD, n=3) and 7, 14, 30, 60 and 90 (mean percent
remaining from day 0 ± SD, n=3).
WP Jars
Day 23°C 4°C 40°C
0 117.6±4.3 103.8±5.7 116.2±1.4
7 85.3±3.1 83.7±2.9 85.6±7.6
14 91.5±5.7 97.3±2.6 91.5±5.5
30 93.7±4.2 91.8±4.1 84.9±14.8
60 86.5±4.2 90.8±7.0 80.5±19.8
90 92.8±3.3 94.0±5.4 88.4±5.3
GA Jars
Day 23°C 4°C 40°C
0 109.5±6.2 103.2±12.4 108.3±8.9
7 90.1±1.4 87.6±5.9 91.9±3.4
14 98.4±5.2 95.8±3.0 98.8±4.4
30 102.8±10.1 94.6±7.3 102.6±3.5
60 94.0±5.7 89.1±4.3 83.7±21.8
90 108.0±9.5 87.2±1.9 94.6±7.5
The mean pH of diltiazem (2%) in Glaxal Base™ was significantly different
compared to day 0 when stored at 23 and 40°C in WP jars (p<0.05, Figure 28A).
However, at 4°C the pH was only significantly different from day 30 onwards (p<0.05).
Changes in pH were less than 1-unit and thus not clinically significant. No statistical
difference in pH was observed when creams were stored in GA jars at 4°C (p>0.05,
Figure 28B). However, a significant difference in pH from day 30 onwards was evident at
23°C and at 40°C (p<0.05). Changes in pH were less than 1-unit and thus not clinically
significant.

88
0 20 40 60 80 100
3.0
3.5
4.0
4.5
5.0
Time (days)
pH
23±2°C
40±0.5°C
4±3°C
0 20 40 60 80 100
3.0
3.5
4.0
4.5
5.0
Time (days)
pH
23±2°C
40±0.5°C
4±3°C
Figure 28 pH of diltiazem HCl (2%) in Glaxal Base™ in WP (A) and GA (B) jars at
23°C (WP only), 40°C, and 4°C. Data points presented as mean pH ± SD
(n=3).
4.4.6 Stability of Diltiazem in a Hydroxyethyl Cellulose-based Gel
Organoleptic properties of diltiazem 2% (w/w) in a hydroxyethyl cellulose-based
gel is summarized in Table 36. A thicker consistency was observed at 4°C, although
B
A

89
changes were not significant. An abnormal odor (acidic, signifying a decrease in pH),
was observed on days 60 and 90 for gels stored at 40°C (Table 36).
Table 36 Organoleptic properties of diltiazem (2%) gel stored in WP jars.
23°C 4°C 40°C
Day 0 Clear gel. Smooth
on skin. No
grittiness.
Clear gel. Smooth on
skin. No grittiness.
Clear gel. Smooth on skin. No
grittiness.
Day 7 Same as day 0. Slightly thicker
consistency.
Same as day 0.
Day 14 Same as day 0. Slightly thicker
consistency.
Same as day 0.
Day 30 Same as day 0. Slightly thicker
consistency.
Same as day 0.
Day 60 Same as day 0. Slightly thicker
consistency.
Abnormal odor (a vinegar-like
scent) observed.
Day 90 Same as day 0. Slightly thicker
consistency.
A strong abnormal odor (a
vinegar-like scent) observed.
Results for gels in GA jars were identical and therefore not presented as a separate
table.
Diltiazem recovery and potency (percent remaining) in gel formulation is shown
in Tables 37 and 38. A significant difference in mean potency between days 0 and 90 was
observed at 40°C (p<0.05), but no difference was observed for any day compared to day
0 at 23°C or 4°C (p>0.05), in WP jars. Diltiazem potency remained within the
recommended range of 90-110% in WP jars for 90 days at 23°C and 4°C. At 40°C,
potency was above the recommended range on day 90 (Table 38).
In GA jars at 40°C, the diltiazem potency in gels was statistically different
compared to day 0 (p<0.05). For gels stored at 4 and 23°C, there was no significant
difference in mean potency versus day 0 (p>0.05). Mean potency was not within the
acceptable range of 90-110% from day 30 onwards at 40°C, although within range for 90
days at 4 and 23°C (Table 38).

90
Table 37 Diltiazem recovery from hydroxyethyl cellulose-based gel on days 0, 7,
14, 30, 60 and 90. Data presented as concentration (µg/mL).
Concentration [µg/mL]
WP Jars GA Jars
Day 23°C 4°C 40°C 23°C 4°C 40°C
0 405.75
370.82
415.10
366.04
393.00
379.02
379.10
413.19
396.13
401.43
398.85
368.22
391.44
401.86
398.27
369.21
348.91
364.81
7 400.68
389.40
390.94
371.92
409.64
398.25
386.74
411.04
414.76
390.07
403.20
386.74
378.65
357.85
417.49
361.42
382.56
388.93
14 390.16
372.56
370.15
367.32
413.11
365.31
422.32
411.56
383.06
393.30
431.85
377.63
368.35
376.84
413.64
385.43
401.73
402.28
30 413.66
429.05
399.57
397.12
416.70
392.11
395.70
416.33
389.81
353.97
411.84
370.32
389.97
370.96
409.12
391.25
384.11
436.37
60 414.44
435.53
385.86
398.05
358.77
363.38
418.98
402.41
407.73
353.67
410.04
390.39
355.17
389.69
355.17
438.91
444.81
429.05
90 386.07
417.82
401.61
433.11
370.14
358.46
410.01
470.49
471.55
386.83
424.75
367.45
389.60
379.44
445.61
462.13
495.48
470.71
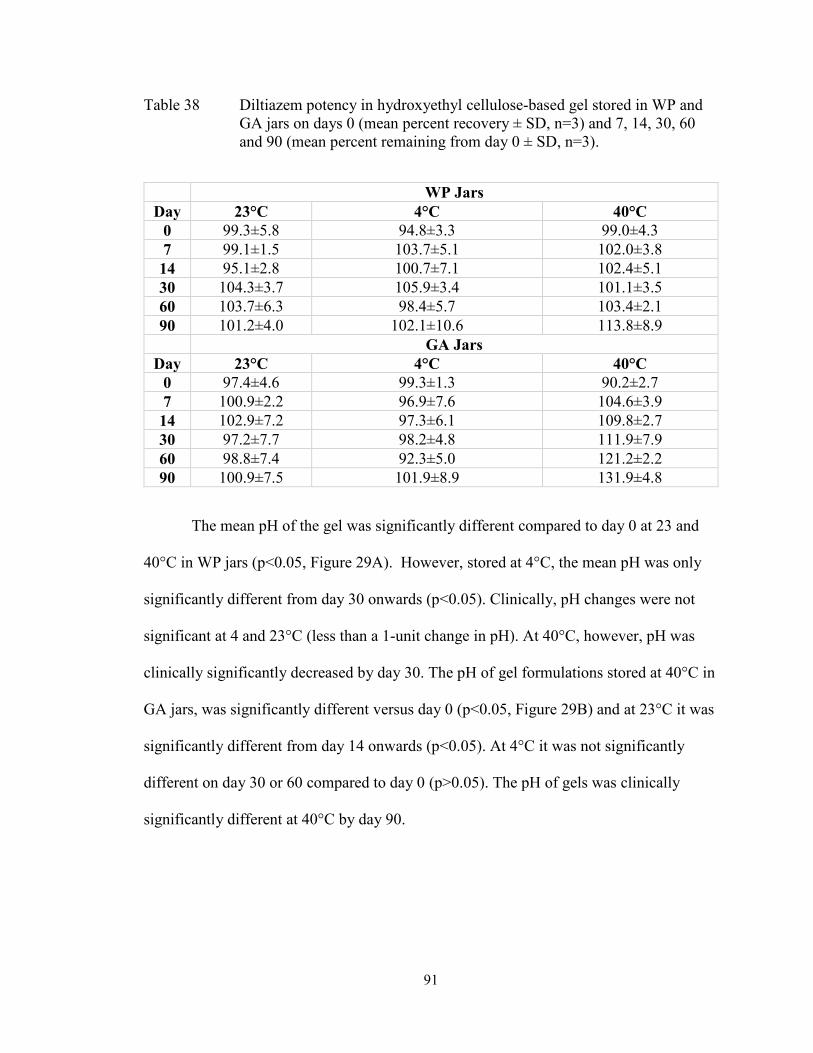
91
Table 38 Diltiazem potency in hydroxyethyl cellulose-based gel stored in WP and
GA jars on days 0 (mean percent recovery ± SD, n=3) and 7, 14, 30, 60
and 90 (mean percent remaining from day 0 ± SD, n=3).
WP Jars
Day 23°C 4°C 40°C
0 99.3±5.8 94.8±3.3 99.0±4.3
7 99.1±1.5 103.7±5.1 102.0±3.8
14 95.1±2.8 100.7±7.1 102.4±5.1
30 104.3±3.7 105.9±3.4 101.1±3.5
60 103.7±6.3 98.4±5.7 103.4±2.1
90 101.2±4.0 102.1±10.6 113.8±8.9
GA Jars
Day 23°C 4°C 40°C
0 97.4±4.6 99.3±1.3 90.2±2.7
7 100.9±2.2 96.9±7.6 104.6±3.9
14 102.9±7.2 97.3±6.1 109.8±2.7
30 97.2±7.7 98.2±4.8 111.9±7.9
60 98.8±7.4 92.3±5.0 121.2±2.2
90 100.9±7.5 101.9±8.9 131.9±4.8
The mean pH of the gel was significantly different compared to day 0 at 23 and
40°C in WP jars (p<0.05, Figure 29A). However, stored at 4°C, the mean pH was only
significantly different from day 30 onwards (p<0.05). Clinically, pH changes were not
significant at 4 and 23°C (less than a 1-unit change in pH). At 40°C, however, pH was
clinically significantly decreased by day 30. The pH of gel formulations stored at 40°C in
GA jars, was significantly different versus day 0 (p<0.05, Figure 29B) and at 23°C it was
significantly different from day 14 onwards (p<0.05). At 4°C it was not significantly
different on day 30 or 60 compared to day 0 (p>0.05). The pH of gels was clinically
significantly different at 40°C by day 90.

92
0 20 40 60 80 100
3.0
3.5
4.0
4.5
5.023±2°C
40±0.5°C
4±3°C
Time (days)
pH
0 10 20 30 40 50 60 70 80 90 100
3.0
3.5
4.0
4.5
5.023±2°C
40±0.5°C
4±3°C
Time (days)
pH
Figure 29 pH of diltiazem HCl (2%) gel in WP (A) and GA (B) jars at 23°C (WP
only), 40°C, and 4°C. Data points presented as mean pH ± SD (n=3).
4.4.7 Stability of Diltiazem in White Petrolatum
Organoleptic properties of diltiazem 2% (w/w) in white petrolatum is summarized
in Table 39. At 40°C, the ointment was less viscous and fluid-like making it cosmetically
unacceptable by day 30 (this was more evident with WP jars). Similarly, at 4°C, the
B
A
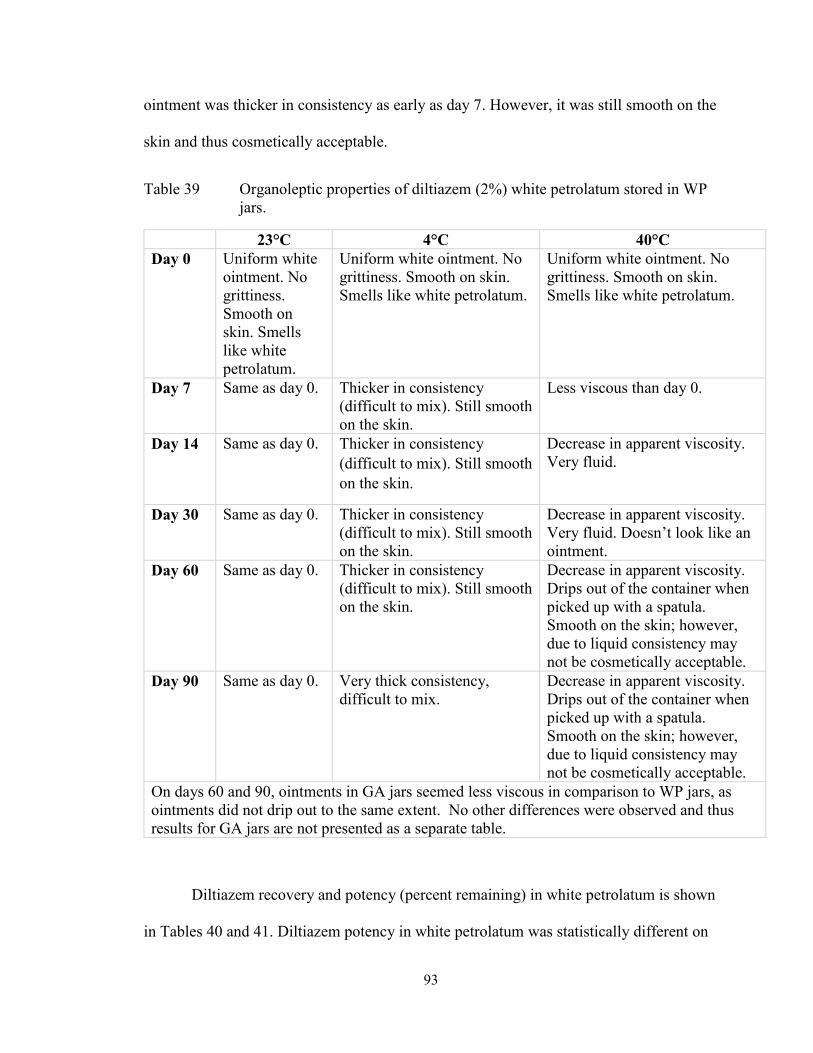
93
ointment was thicker in consistency as early as day 7. However, it was still smooth on the
skin and thus cosmetically acceptable.
Table 39 Organoleptic properties of diltiazem (2%) white petrolatum stored in WP
jars.
23°C 4°C 40°C
Day 0 Uniform white
ointment. No
grittiness.
Smooth on
skin. Smells
like white
petrolatum.
Uniform white ointment. No
grittiness. Smooth on skin.
Smells like white petrolatum.
Uniform white ointment. No
grittiness. Smooth on skin.
Smells like white petrolatum.
Day 7 Same as day 0. Thicker in consistency
(difficult to mix). Still smooth
on the skin.
Less viscous than day 0.
Day 14 Same as day 0. Thicker in consistency
(difficult to mix). Still smooth
on the skin.
Decrease in apparent viscosity.
Very fluid.
Day 30 Same as day 0. Thicker in consistency
(difficult to mix). Still smooth
on the skin.
Decrease in apparent viscosity.
Very fluid. Doesn’t look like an
ointment.
Day 60 Same as day 0. Thicker in consistency
(difficult to mix). Still smooth
on the skin.
Decrease in apparent viscosity.
Drips out of the container when
picked up with a spatula.
Smooth on the skin; however,
due to liquid consistency may
not be cosmetically acceptable.
Day 90 Same as day 0. Very thick consistency,
difficult to mix.
Decrease in apparent viscosity.
Drips out of the container when
picked up with a spatula.
Smooth on the skin; however,
due to liquid consistency may
not be cosmetically acceptable.
On days 60 and 90, ointments in GA jars seemed less viscous in comparison to WP jars, as
ointments did not drip out to the same extent. No other differences were observed and thus
results for GA jars are not presented as a separate table.
Diltiazem recovery and potency (percent remaining) in white petrolatum is shown
in Tables 40 and 41. Diltiazem potency in white petrolatum was statistically different on

94
day 60 compared to day 0 when stored at both 4 and 40°C (p<0.05), in WP jars. The
mean potency was within the acceptable range of 90-110% through 90 days (excluding
day 60), at 4 and 23°C (Table 41). In GA jars, at 40 and 4°C, diltiazem potency on day 30
and 60, respectively, was statistically different from day 0 (p<0.05). At 4 and 23°C,
diltiazem potency was within the acceptable range (90-110%) through 90 days (excluding
day 60).
Table 40 Diltiazem recovery from white petrolatum on days 0, 7, 14, 30, 60 and 90.
Data presented as concentration (µg/mL).
Concentration [µg/mL]
WP Jars GA Jars
Day 23°C 4°C 40°C 23°C 4°C 40°C
0 368.46
374.72
388.06
394.21
403.63
380.39
435.88
375.40
403.82
407.52
439.06
444.64
369.70
348.98
376.91
363.97
379.85
364.04
7 305.45
386.83
402.81
405.17
363.61
444.82
314.17
417.22
387.03
358.79
407.99
476.24
387.57
355.96
320.23
394.16
404.36
444.20
14 375.69
355.87
418.94
383.24
389.76
352.24
318.00
446.28
486.76
364.19
384.91
427.56
400.51
355.10
370.37
421.71
426.35
423.13
30 340.34
395.75
373.03
394.23
402.32
415.22
330.17
380.83
399.07
344.19
418.60
416.80
372.64
417.03
343.63
487.85
389.27
515.76
60 372.94
274.93
351.00
236.58
133.64
206.01
265.77
243.73
373.80
286.76
357.28
424.23
103.10
120.66
115.12
399.20
351.55
352.54
90 383.68
336.78
375.33
380.54
381.03
409.30
282.95
418.92
327.21
362.39
413.01
395.91
356.77
365.91
378.14
367.65
356.14
219.31
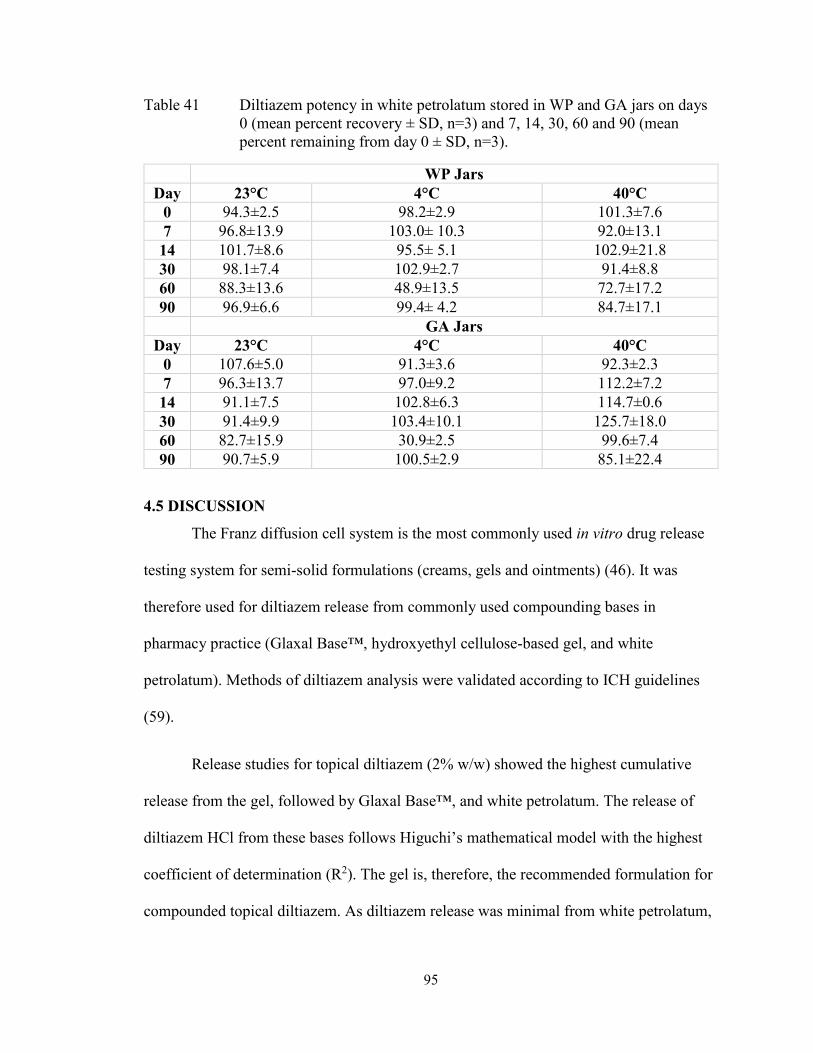
95
Table 41 Diltiazem potency in white petrolatum stored in WP and GA jars on days
0 (mean percent recovery ± SD, n=3) and 7, 14, 30, 60 and 90 (mean
percent remaining from day 0 ± SD, n=3).
WP Jars
Day 23°C 4°C 40°C
0 94.3±2.5 98.2±2.9 101.3±7.6
7 96.8±13.9 103.0± 10.3 92.0±13.1
14 101.7±8.6 95.5± 5.1 102.9±21.8
30 98.1±7.4 102.9±2.7 91.4±8.8
60 88.3±13.6 48.9±13.5 72.7±17.2
90 96.9±6.6 99.4± 4.2 84.7±17.1
GA Jars
Day 23°C 4°C 40°C
0 107.6±5.0 91.3±3.6 92.3±2.3
7 96.3±13.7 97.0±9.2 112.2±7.2
14 91.1±7.5 102.8±6.3 114.7±0.6
30 91.4±9.9 103.4±10.1 125.7±18.0
60 82.7±15.9 30.9±2.5 99.6±7.4
90 90.7±5.9 100.5±2.9 85.1±22.4
4.5 DISCUSSION
The Franz diffusion cell system is the most commonly used in vitro drug release
testing system for semi-solid formulations (creams, gels and ointments) (46). It was
therefore used for diltiazem release from commonly used compounding bases in
pharmacy practice (Glaxal Base™, hydroxyethyl cellulose-based gel, and white
petrolatum). Methods of diltiazem analysis were validated according to ICH guidelines
(59).
Release studies for topical diltiazem (2% w/w) showed the highest cumulative
release from the gel, followed by Glaxal Base™, and white petrolatum. The release of
diltiazem HCl from these bases follows Higuchi’s mathematical model with the highest
coefficient of determination (R2). The gel is, therefore, the recommended formulation for
compounded topical diltiazem. As diltiazem release was minimal from white petrolatum,
96
this base is not recommended for compounding. Additionally, white petrolatum is often
considered cosmetically unacceptable by patients.
Stability studies were conducted for diltiazem 2% (w/w) compounded in Glaxal
Base™, hydroxyethyl cellulose-based gel and white petrolatum to provided pharmacists
with information for assigning BUDs. A USP stability indicating method was validated
and used. Extraction methods for diltiazem were also shown to be accurate and precise.
The stability studies confirm that the recommended BUD of 30 days for
diltiazem (2%) in Glaxal Base™, kept in a dark area such as a bedroom/bedside drawer at
4 and 23°C, is acceptable in either jar type. Mean potency was within an acceptable range
(90-110%), and there were no significant changes in organoleptic properties. However,
due to potential interference with diltiazem peaks on days 60 onwards, a BUD of 30 days
was recommended for diltiazem (2%) in Glaxal Base™. The cream was not
recommended for use if exposed to elevated temperatures (40°C) in WP jars but may be
used within 7 days if stored in GA jars.
Mean potency of diltiazem 2% (w/w) gel, stored at either 4 or 23°C in both jar
types, was within the acceptable range (90-110%) for 90 days. However, an increase in
potency (concentration) of diltiazem at 40°C was evident with time, in both jars.
Moisture loss may have been the cause, as the gel constitutes high water content.
Additionally, a decrease in pH of ~1-unit was evident by days 30 and 90 at 40°C in WP
and GA jars, respectively. This indicates physical instability of the compounded product
due to the change in concentration. The decrease in pH was not surprising as the
formulation did not have a buffering agent. The pH of both the cream and gel
formulations were less affected when maintained at 4°C. Thus, a BUD of 90 days for
97
diltiazem (2%) gel stored at 4 or 23°C, in either WP or GA jar was recommended. Gels
exposed to elevated temperatures (40°C) may be used within 14 and 30 days in GA and
WP jars, respectively.
For diltiazem 2% (w/w) in white petrolatum, stored at 23°C in either jar type, a
BUD of 90 days is recommended. Mean potency was within the acceptable range
(excluding day 60), and there was no apparent evidence of instability (organoleptic
property changes were not significant) at 23°C. At 4°C, the ointment was difficult to mix
from day 7 onwards. On day 60 at 4°C, there was a significant drop in potency. This may
be due to the increase in viscosity of the product and therefore, difficulty in diltiazem
extraction. It is unclear as to why this was not the case for day 90. The increase in
viscosity, however, has implications for clinical use of the product as drug release may be
decreased, leading to a decrease in efficacy. Therefore, storage of the diltiazem 2% cream
at 4°C is not recommended. Diltiazem potency at 40°C was inconsistent in GA jars,
limiting interpretation of results. Potency was within range for 30 days in WP jars,
however a significant decrease in viscosity was evident on day 14 onwards. Ointment
formulations exposed to elevated temperatures (40°C) may, therefore, be used within 7
days if stored in WP jars only.
98
CHAPTER 5 SUMMARY AND CONCLUSION
Compounded topical calcium channel blockers are used for anal fissures treatment
(1), by decreasing anal pressure, relaxing smooth muscles (24) and increasing blood
perfusion to the fissure (25). These medications are compounded in community
pharmacies with commonly used and readily available bases. They are assigned a BUD
based on compounding guidelines with scarce literature information on stability. This
project aimed to establish drug release profiles of compounded topical nifedipine and
diltiazem with commonly used bases and to determine their shelf-life and BUDs, to
provide pharmacists with scientific literature on base selection and stability.
Conducting stability studies for compounded products provides pharmacists with
scientific information for assigning BUDs. Different storage temperatures were tested for
stability in this study as patients may store compounded products differently than
recommended. For example, patients may consider storing products in the fridge to
enhance the shelf-life and stability of products. Products may also be exposed to higher
temperatures accidentally during the summertime. Different storage containers were also
tested as WP jars are the most common and less expensive option for dispensing topical
compounded products, while the GA jars are used for products that are considered light-
sensitive (such as nifedipine and diltiazem).
Glaxal Base™ had the highest nifedipine release at the current clinically used
concentration for anal fissures treatment (0.2%), while both Glaxal Base™ and K-Y®
Jelly may be appropriate choices for higher concentrations (2%, 10%) used for other
types of wounds (e.g., diabetic ulcers). Glaxal Base™ is also more cosmetically elegant
and may be better accepted by patients.

99
Stability studies showed a BUD of 90 days for nifedipine (0.2%) in Glaxal
Base™ cream, stored in WP jars at 4 and 23°C but only 60 days at 40°C (Table 42).
Creams stored in GA jars at 4°C may be assigned a BUD of 90 days while only 7 days at
23°C and should not be used if exposed to elevated temperatures (40°C). A BUD of 60
days was recommended for nifedipine (0.2%) in K-Y® Jelly stored in WP and GA jars at
23°C and 14 days at 4°C. Nifedipine gel may be used within 7 days if stored in either WP
or GA jars at 40°C. For nifedipine (0.2%) in Aquaphor® Healing Ointment, a BUD of 90
days when stored in WP jars at 23°C was recommended. If stored in GA jars, nifedipine
ointment may be assigned a BUD of 30 days at 23°C. At 4 and 40°C, nifedipine ointment
was stable for 7 days, in both jar types.
Table 42 Beyond-use date (BUD) recommendations for compounded nifedipine
(0.2%) in Glaxal Base™, K-Y® Jelly, and Aquaphor® Healing Ointment
(based on stability studies). Data presented in days.
Cream
(Glaxal Base™)
Gel
(K-Y® Jelly)
Ointment
(Aquaphor®)
WP GA WP GA WP GA
23°C 90 7 60 60 90 30
40°C 60 N/A 7 7 7 7
4°C 90 90 14 14 7 7
GA= glass amber jar; WP= white plastic jar
Release studies for 2% (w/w) diltiazem showed the highest cumulative release
from the gel followed by Glaxal Base™, with minimal release from white petrolatum.
Stability studies showed that the currently recommended USP BUD of 30 days is
acceptable for diltiazem (2%) in Glaxal Base™ at 4 and 23°C in either WP or GA jars
(Table 43). The cream, however, is not recommended for use if exposed to elevated
temperatures (40°C) in WP jars but may be used within 7 days if stored in GA jars. A
BUD of 90 days for diltiazem (2%) hydroxyethyl cellulose-based gel, when maintained at

100
4 or 23°C, in either WP or GA jars, is recommended. Gels exposed to elevated
temperatures (40°C) should be used within 14 and 30 days in GA and WP jars,
respectively. Lastly, a BUD of 90 days for diltiazem (2%) ointment (white petrolatum) at
23°C stored in either jar type is acceptable. Ointment formulations exposed to elevated
temperatures (40°C) may be used within 7 days in WP jars. Diltiazem (2%) in white
petrolatum should not be stored at 4°C.
Table 43 Beyond-use date (BUD) recommendations for compounded diltiazem HCl
(2%) in Glaxal Base™, hydroxyethyl cellulose-based gel and white
petrolatum (based on stability studies). Data presented in days.
Cream
(Glaxal Base™)
Gel
(Hydroxyethyl
Cellulose-based)
Ointment
(White Petrolatum)
WP GA WP GA WP GA
23°C 30 30 90 90 90 90
40°C N/A 7 30 14 7 N/A
4°C 30 30 90 90 N/A N/A
GA= glass amber jar, N/A= not applicable (not recommended for use); WP=white
plastic jar
A potential limitation to this study is the storage of WP and GA jars in a dark area
at 23°C (drawer), limiting the study’s external validity as patients may occasionally store
their topical medications in areas with exposure to light. This storage was conducted to
mimic the real-life scenario of patient’s storing their topical medications in
bedroom/bedside drawers as directed. As nifedipine and diltiazem are light-sensitive
drugs, it may have been of interest to determine the effects of storing such compounds in
areas with exposure to light. The application of the BUD assigned to the compounded
preparations in this study is, therefore, limited to jars that are stored in dark areas.
Patients should thus be counseled to store their products in a dark area for the

101
recommended BUDs. Another limitation to this study is the unexpected interference of
peaks for the diltiazem in Glaxal Base™ on days 60 and 90, which limits the BUD of this
preparation to a maximum of 30 days (Table 43).
Based on release and stability results, Glaxal Base™ is the optimal base for
compounded topical nifedipine (0.2%), stored in WP jars at room temperature. Glaxal
Base™ had the highest nifedipine release and was stable for 90 days in WP jars at 23°C
and both jar types at 4°C. For diltiazem (2%), a compounded hydroxyethyl cellulose-
based gel is recommended as it had the highest cumulative release and 90-day stability at
23 and 4°C, stored in either WP or GA jars.
5.1 FUTURE RESEARCH
Interest in the wound healing mechanisms of topical calcium channel blockers
and their role in healing different types of wounds is increasing. It may, therefore, be
useful to develop a commercially available product with the optimal release of the active
ingredient and prolonged stability. Additionally, release and stability studies may be
conducted for nifedipine and diltiazem HCl in other commonly used compounding bases,
such as DermaBASE™ Emulsion. Compounding of other calcium channel blockers,
such as verapamil, into topically used products and determining release and stability may
also provide additional compounding base selection options.
102
BIBLIOGRAPHY
(1) Palamaras I, Kyriakis K. Calcium antagonists in dermatology: A review of the
evidence and research-based studies. Dermatol Online J. 2005;11(2).
(2) Wynn T, Thompson C. Case report: wound care of a diabetic foot ulcer. Int J Pharm
Compd. 2004;8(4):265.
(3) Santis AK, De Freitas Z,Maria Faria, Ricci-Junior E, De Brito-Gitirana L, Fonseca
LB, Santos EP. Nifedipine in semi-solid formulations for topical use in peripheral
vascular disease: preparation, characterization, and permeation assay. Drug Dev Ind
Pharm. 2013; 39(7): 1098-1106.
(4) McLafferty E, Hendry C, Farley A. The integumentary system: anatomy, physiology
and function of skin. Nurs Stand. 2012;27(3):35-42.
(5) Han S. Basics of Wound Healing. In: Han S, editor. Innovations and Advances in
Wound Healing Berlin, Heidelberg: Springer Berlin Heidelberg; 2016. p. 1-37.
(6) Staser K, Demehri S. 2 - Basic Science of the Skin. The Washington manual of
dermatology diagnostics. Philadelphia: Wolters Kluwer; 2016. p. 10-19.
(7) Venus M, Waterman J, McNab I. Basic physiology of the skin. Surgery (Oxford).
2011;29(10):471-474.
(8) Gaboriau HP, Murakami CS. Skin anatomy and flap physiology. Otolaryngol Clin
North Am. 2001;34(3):555-569.
(9) Casey G. Physiology of the skin. Nurs Stand. 2002;16(34):47-51.
(10) Chin GA, Dieglemann RF, Schultz GS. 3 Cellular and Molecular Regulation of
Wound Healing. In: Falabella A, Kirsner R, editors. Wound Healing Baton Rouge:
Chapman and Hall/CRC; 2005. p. 17-37.
(11) Wang P, Huang B, Horng H, Yeh C, Chen Y. Wound healing. J Chin Med Assoc.
2018;81(2):94-101.
(12) Takayama Y. Molecular Regulation of Skin Wound Healing. In: Takayama Y,
editor. Lactoferrin and its Role in Wound Healing Dordrecht: Springer Netherlands;
2012. p. 1-23.
(13) Adams SB, Sabesan VJ, Easley ME. Wound Healing Agents. Crit Care Nurs Clin
North Am. 2012;24(2):255-260.
(14) Brown MB, Turner R, Lim ST. Chapter 14 Topical Product Formulation
Development. In: Benson HA, Watkinson AC, editors. Topical and Transdermal Drug
Delivery: Principles and Practice. First ed.: John Wiley & Sons, Inc.; 2012. p. 255-286.
(15) The United States Pharmacopeial Convention. Topical and Transdermal Drug
Products. Pharmacopeial Forum. 2009;35(3):750-764.
103
(16) Chang R, Raw A, Lionberger R, Yu L. Generic Development of Topical
Dermatologic Products: Formulation Development, Process Development, and Testing of
Topical Dermatologic Products. The AAPS Journal. 2012;15(1):41-52.
(17) Benson HAE. Chapter 1 Skin Structure, Function, and Permeation. In: Benson HA,
Watkinson AC (eds). Topical and Transdermal Drug Delivery: Principles and Practice.
First ed.: John Wiley & Sons, Inc.; 2012. p. 3–22.
(18) Lane ME, Santos P, Watkinson AC, Hadgraft J. Chapter 2 Passive Skin Permeation
Enhancement. In: Benson HA, Watkinson AC (eds). Topical and Transdermal Drug
Delivery: Principles and Practice. First ed.: John Wiley & Sons, Inc.; 2012. p. 23–42.
(19) Shah VP, Elkins JS, Williams RL. Chapter 19. Importance of In Vitro Release
Measurement in Topical Dermatological Dosage Forms. In: Bronaugh RL, Maibach HI,
editors. Topical Absorption of Dermatological Products London: Chapman and
Hall/CRC; 2002. p. 283-297.
(20) Grice JE, Moghimi HR, Ryan E, Zhang Q, Haridass I, Mohammed Y, et al. Non-
formulation Parameters That Affect Penetrant-Skin-Vehicle Interactions and
Percutaneous Absorption. In: Dragicevic N, I. Maibach H, editors. Percutaneous
Penetration Enhancers Drug Penetration Into/Through the Skin: Methodology and
General Considerations Berlin, Heidelberg: Springer Berlin Heidelberg; 2017. p. 45-75.
(21) Whyte I, Buckley N, Dawson A. Calcium channel blockers. Medicine.
2016;44(3):148-150.
(22) Trevor AJ. Katzung & Trevor's pharmacology: examination & board review.
Eleventh edition. New York: McGraw-Hill Education; 2015.
(23) DrugBank. Nifedipine. [internet database] 2018; Available at:
https://www.drugbank.ca/drugs/DB01115. Accessed 02/22, 2018.
(24) Merenstein D, Rosenbaum D. Is topical nifedipine effective for chronic anal
fissures? J Fam Pract. 2003 03;52(3):190-191.
(25) NHS choices. Anal Fissure. 2016; Available at: https://www.nhs.uk/conditions/anal-
fissue/treatment/. Accessed 02/22, 2018.
(26) DrugBank. Diltiazem. [internet database]. 2018; Available at:
https://www.drugbank.ca/drugs/DB00343. Accessed 02/22, 2018.
(27) Royal Pharmaceutical Society. Nifedipine. MedicinesComplete 2018 [internet
database]. Available at https://www.rpharms.com/publications/medicinescomplete.
Accessed 02/22, 2018.
(28) Royal Pharmaceutical Society. Diltiazem Hydrochloride. MedicinesComplete 2018
[internet database]. Available at
https://www.rpharms.com/publications/medicinescomplete. Accessed 02/22, 2018.
(29) Human Metabolome Database (HMDB). Showing metabocard for Nifedipine
(HMDB0015247). Available at: http://www.hmdb.ca/metabolites/HMDB0015247.
Accessed 04/19, 2018.
104
(30) ChemicalBook. Nifedipine. 2017; Available at:
http://www.chemicalbook.com/ChemicalProductProperty_EN_CB6260129.htm.
Accessed 04/19, 2018.
(31) Cayman Chemical. Product Information: Nifedipine. 2018; Available at:
https://www.caymanchem.com/pdfs/11106.pdf. Accessed 11/11, 2018.
(32) National Center for Biotechnology Information. PubChem Compound Database;
CID=4485. Available at: https://pubchem.ncbi.nlm.nih.gov/compound/4485. Accessed
11/11, 2018.
(33) Santa Cruz Biotechnology. Diltiazem hydrochloride (CAS 33286-22-5). Available
at: https://www.scbt.com/scbt/product/diltiazem-hydrochloride-33286-22-5. Accessed
11/11, 2018.
(34) Human Metabolome Database (HMDB). Showing metabocard for Diltiazem
(HMDB0014487). Available at: http://www.hmdb.ca/metabolites/HMDB0014487.
Accessed 04/19, 2018.
(35) Plumley C, Gorman EM, El-Gendy N, Bybee CR, Munson EJ, Berkland C.
Nifedipine nanoparticle agglomeration as a dry powder aerosol formulation strategy. Int J
Pharm. 2009;369(1):136-143.
(36) Valeant Canada LP. PRODUCT MONOGRAPH: TIAZAC XC (Diltiazem
Hydrochloride) Extended-Release Tablets. March 27, 2017:34.
(37) Nelson RL, Manuel D, Gumienny C, Spencer B, Patel K, Schmitt K, et al. A
systematic review and meta-analysis of the treatment of anal fissure. Tech Coloproctol.
2017;21(8):605-625.
(38) Katsinelos P, Kountouras J, Paroutoglou G, Beltsis A, Chatzimavroudis G, Zavos C,
et al. Aggressive treatment of acute anal fissure with 0.5% nifedipine ointment prevents
its evolution to chronicity. World J Gastroenterol. 2006;12(38):6203.
(39) Agrawal V, Kaushal G, Gupta R. Randomized controlled pilot trial of nifedipine as
oral therapy vs topical application in the treatment of fissure-in-ano. Am J Surg.
2013;206(5):748-751.
(40) Bielecki K, Kolodziejczak M. A prospective randomized trial of diltiazem and
glyceryltrinitrate ointment in the treatment of chronic anal fissure. Colorectal Dis.
2003;5(3):256-257.
(41) Sanei B, Mahmoodieh M, Masoudpour H. Comparison of Topical Glyceryl
Trinitrate with Diltiazem Ointment for the Treatment of Chronic Anal Fissure: a
Randomized Clinical Trial. Acta Chir Belg. 2009;109(6):727-730.
(42) Ala S, Saeedi MF, Hadianamrei RF, Ghorbanian A. Topical diltiazem vs. topical
glyceril trinitrate in the treatment of chronic anal fissure: a prospective, randomized,
double-blind trial. Acta Gastroenterol Belg. 2012;75(4):438-42.
105
(43) Kocher HM, Steward M FAU – Leather AJM, FAU LA, Cullen PT. Randomized
clinical trial assessing the side-effects of glyceryl trinitrate and diltiazem hydrochloride in
the treatment of chronic anal fissure. Br J Surg. 2002 Apr;89(4):413-7.
(44) Torsiello MJ, Kopacki MH. Transdermal nifedipine for wound healing: case reports.
Int J Pharm Compd. 2000;4(5):356.
(45) Teledyne Hanson Research. Diffusion Testing. Available at:
https://hansonresearch.com/diffusion-testing/. Accessed 02/23, 2018.
(46) Particle Sciences. Development and Validation of In Vitro Release Testing Methods
for Semisolid Formulations. Technical Brief 2009;10. Available at
https://www.particlesciences.com/news/technical-briefs/2009/in-vitro-release-testing-
methods.html. Accessed 02/23, 2018.
(47) Finnin B, Walters KA, Franz TJ. Chapter 5 In Vitro Skin Permeation Methodology.
In: Benson HA, Watkinson AC, editors. Topical and Transdermal Drug Delivery:
Principles and Practice. First ed.: John Wiley & Sons, Inc.; 2012. p. 85-108.
(48) The United States Pharmacopeia. Chapter <795> Pharmaceutical Compounding -
Nonsterile Preparations. United States Pharmacopeia and National Formulary (USP 37 –
NF 32). Rockville, MD: US Pharmacopeia; 2014.
(49) Allen Jr LV, Bassani GS, Elder Jr EJ, Parr AF. STRENGTH AND STABILITY
TESTING FOR COMPOUNDED PREPARATIONS. 2015; Available at:
https://www.usp.org/sites/default/files/usp/document/FAQs/strength-stability-testing-
compounded-preparations.pdf. Accessed 07/30, 2018.
(50) Baertschi SW, Alsante KM, Reed RA. Pharmaceutical stress testing predicting drug
degradation. 2nd ed. London; New York: Informa Healthcare; 2011.
(51) Allen LV. Science & Technology for the Hospital Pharmacist: pH and Solubility,
Stability, and Absorption, Part II. 2011; Available at:
https://compoundingtoday.com/Newsletter/Science_and_Tech_1112.cfm. Accessed
10/14, 2018.
(52) The United States Pharmacopeia. Chapter <1191> Stability Considerations in
Dispensing Practice. The United States Pharmacopeial Convention (USP 35): US
Pharmacopeia; 2011. p. 840-843.
(53) Trissel LA., Ashworth LD, Ashworth, J, and American Pharmacists Association,
Issuing Body. Trissel's Stability of Compounded Formulations. 6th ed. Washington, DC:
American Pharmacists Association, 2018. Web.
(54) McCluskey SV, Brunn GJ. Nifedipine in compounded oral and topical preparations.
Int J Pharm Compd. 2011; 15(2):166-169.
(55) Dhawan S, Chopra S, Medhi B. Formulation and evaluation of diltiazem
hydrochloride gels for the treatment of anal fissures. Sci Pharm. 2009;77(2):465-482.
106
(56) Buur JL, Baynes RE, Yeatts JL, Davidson G, DeFrancesco TC. Analysis of
diltiazem in Lipoderm® transdermal gel using reversed-phase high-performance liquid
chromatography applied to homogenization and stability studies. J Pharm Biomed
Anal. 2005;38(1):60-65.
(57) Friciu M, Chefson A, Leclair G. Stability of Hydrocortisone, Nifedipine, and
Nitroglycerine Compounded Preparations for the Treatment of Anorectal Conditions. Can
J Hosp Pharm. 2016;69(4):329-333.
(58) Rahman N, Azmi SNH. New spectrophotometric methods for the determination of
nifedipine in pharmaceutical formulations. Acta Biochim Pol. 2005;52(4):915.
(59) International Conference on Harmonisation of Technical Requirements for
Registration of Pharmaceuticals for Human Use. ICH HARMONISED TRIPARTITE
GUIDELINE: VALIDATION OF ANALYTICAL PROCEDURES: TEXT AND
METHODOLOGY Q2(R1). 2005; Available at:
https://www.ich.org/fileadmin/Public_Web_Site/ICH_Products/Guidelines/Quality/Q2_R
1/Step4/Q2_R1__Guideline.pdf. Accessed 08/06, 2018.
(60) Nifedipine. The United States Pharmacopoeia: The National Formulary Volume 3.
USP 34: NF 29 ed. Twinbrook Parkway, Rockville, MD: The United States
Pharmacopeial Convention; 2011. p. 3656-3658.
(61) Kuminek G, Tagliari MP, Granada A, Bertol CD, Langassner SZ, Silva MAS, et al.
Development and validation of a rapid and simple stability-indicating LC method for
nifedipine. J Liq Chromatogr Relat Technol. 2010;33(17):1601-1611.
(62) Abu Nameh ESM. A Validated Stability Indicating HPLC Method for Determination
of Diltiazem Hydrochloride in Tablet Dosage Form. Aust J Basic & Appl Sci.
2013;7(6):730-736.
(63) Sheskey PJ, Cook WG, Cable CG, American PA. Handbook of pharmaceutical
excipients. Eighth edition. Washington, DC: London: Pharmaceutical Press; APhA; 2017.
(64) Russell E, K., Jacob E, S. Bisabolol. Dermatitis. 2010;21(1):57-58.
(65) Clerens I, Goossens A. Allergic contact dermatitis caused by panthenol: a rare but
relevant sensitizer. Contact Derm. 2017;76(2):122-123.
(66) Ramteke K, Dighe P, Kharat A, Patil S. Mathematical models of drug dissolution: a
review. Sch Acad J Pharm. 2014;3(5):388-396.
(67) Singhvi G, Singh M. In-vitro drug release characterization models. Int J Pharm Stud
Res. 2011;2(1):77-84.
(68) The United States Pharmacopeial Convention. <3> TOPICAL AND
TRANSDERMAL PRODUCTS - PRODUCT QUALITY TESTS. 2013; Available at:
https://www.uspnf.com/sites/default/files/usp_pdf/EN/USPNF/revisions/topical_and_tran
sdermal.pdf. Accessed 12/09, 2018.

107
(69) UNC Eshelman School of Pharmacy. The Pharmaceutics and Compounding Library:
Ointment Bases. Available at: https://pharmlabs.unc.edu/labs/ointments/bases.htm.
Accessed 06/30, 2019.
(70) Pillai SAK, Dhawal C, Dileep U, N Nayan Singh R. Pharmaceutical Glass
Interactions: A Review of Possibilities. J Pharm Sci & Res. 2016;8(2):103-111.
(71) Rahman N, Azmi SNH. Spectrophotometric determination of diltiazem
hydrochloride with sodium metavanadate. Microchem J. 2000;65(1):39-43.
(72) Rathod S, M., Shah DA, Parmar RR, Mahajan AN. Spectrofluorimetric
determination of diltiazem hydrochloride in plasma & application to pharmacokinetic
studies. J Pharm Res. 2012;5(4):2280-2285.
(73) Diltiazem Hydrochloride Oral Suspension. The United States Pharmacopoeia: The
National Formulary Volume 2. USP 34: NF 29 ed. Twinbrook Parkway, Rockville, MD:
The United States Pharmacopeial Convention; 2011. p. 2585-2586.
(74) Kaushal G, Sayre BE, Prettyman T. Stability of extemporaneously compounded
diltiazem hydrochloride infusions stored in polyolefin bags. Am J Health Syst Pharm.
2013;70(10):894.
(75) Lloyd V Jr A. Diltiazem HCl 2% Topical Gel. Int J Pharm Compd. 2002 Jan/Feb
(Compounding for Pain Management and Dental Medicine).
(76) Shah M, Sandler L, Rai V, Sharma C, Raghavan L. Quality of compounded topical
2% diltiazem hydrochloride formulations for anal fissure. World J Gastroenterol.
2013;19(34):5645-5650.
Copyright © 2022 FDOKUMEN