Inference on The Doubly Truncated Gamma Distribution For Lifetime Data
Upload
independentCategory
view
0download
0
Dominant-Negative Synthesis Suppression of Voltage-GatedCalcium Channel Cav2.2 Induced by Truncated Constructs
Ayesha Raghib, Federica Bertaso, Anthony Davies, Karen M. Page, Alon Meir, Yuri Bogdanov, andAnnette C. Dolphin
Department of Pharmacology, University College London, London WC1E6BT, United Kingdom
Voltage-gated calcium channel �1 subunits consist of fourdomains (I–IV), each with six transmembrane segments. A num-ber of truncated isoforms have been identified to occur as aresult of alternative splicing or mutation. We have examined thefunctional consequences for expression of full-length Cav2.2(�1B) of its coexpression with truncated constructs of Cav2.2.Domains I-II or domains III-IV, when expressed individually,together with the accessory subunits �1b and �2�-1, did notform functional channels. When they were coexpressed, low-density whole-cell currents and functional channels with prop-erties similar to wild-type channels were observed. However,when domain I-II, domain III-IV, or domain I alone were coex-pressed with full-length Cav2.2, they markedly suppressed itsfunctional expression, although at the single channel level,when channels were recorded, there were no differences in their
biophysical properties. Furthermore, when it was coexpressedwith either domain I-II or domain I, the fluorescence of greenfluorescent protein (GFP)–Cav2.2 and expression of Cav2.2protein was almost abolished. Suppression does not involvesequestration of the Cav� subunit, because loss of GFP–Cav2.2expression also occurred in the absence of � subunit, and theeffect of domain I-II or domain I could not be mimicked by thecytoplasmic I-II loop of Cav2.2. It requires transmembrane seg-ments, because the isolated Cav2.2 N terminus did not haveany effect. Our results indicate that the mechanism of suppres-sion of Cav2.2 by truncated constructs containing domain Iinvolves inhibition of channel synthesis, which may represent arole of endogenously expressed truncated Cav isoforms.
Key words: calcium channel; truncation; expression; sup-pression; protein synthesis; GFP
Voltage-gated calcium channels subserve a number of func-tions, including neurotransmitter release, regulation of genetranscription, and muscle contraction (Catterall, 2000). Theyare heteromeric complexes consisting minimally of three sub-units, namely the pore-forming �1 subunit and the accessory �and �2-� subunits. The �1 subunit is the structural and func-tional core of the channel and consists of four homologousdomains (Dom I–IV), linked by intracellular loops and withintracellular N and C termini. Each domain contains sixtransmembrane-spanning segments (S1–S6). To date, 10 �1subunits have been cloned and expressed (Birnbaumer et al.,1994; Perez-Reyes and Schneider, 1994; Catterall, 2000),termed �1A-�1I and �1S, now renamed Cav1–3 (Ertel et al.,2000).
Mutations in calcium channel �1 subunits can contribute toa number of pathological states, and some of these mutationsinvolve the introduction of a premature stop codon. For exam-ple, in episodic ataxia type-2 (EA-2), a number of mutations inthe Cav2.1 subunit predict truncated forms of this channel(Ophoff et al., 1996; Denier et al., 1999). Most identifiedmutations in EA-2 introduce stop codons at the end of domainII–S6, in domain III–S1, and in the S1 segments of domains III
and IV. The truncation at S1 of domain III is of particularinterest because a 95 kDa protein has been identified thatnormally copurifies with Cav2.1 (Scott et al., 1998). This pro-tein appears to contain domains I, II, and part of the II–IIIloop of Cav2.1. Thus, it is very similar to the predicted trun-cation in EA-2. To date, no naturally occurring two-domainsplice variants of Cav2.1 that would give rise to such a two-domain protein product have been found. Recently, novelsplice variants of Cav1.2 have been identified, generated byalternative splicing in the II-III loop, which predict two trun-cated forms of Cav1.2, consisting of domains I and II (Wielow-ieyski et al., 2001). In addition, a splice variant of Cav2.2 hasbeen identified in humans and rodents that would introduce astop codon near the end of the II-III loop (Mittman, Agnew,2000). The expression of this splice variant would give rise toa protein consisting of domains I and II of Cav2.2. Little isknown about the tissue-specificity or developmental regulationof expression of such splice variants, except that an isoformconsisting of the first two domains of Cav1.1 is the maintranscript in newborn muscle, whereas the four-domain iso-form is predominant in adult muscle (Malouf et al., 1992).Furthermore, it has recently been found that during develop-ment of a tunicate tadpole, a truncated calcium channel withhomology to Cav1.1, consisting of domains III and IV with partof domain II was expressed from a maternal transcript (Oka-gaki et al., 2001).
In the present study, we have examined the expression, physi-ological function, and effects on channel protein levels of trunca-tions of the N-type calcium channel Cav2.2. Our results indicatethat constructs containing transmembrane domain I suppress thesynthesis of full-length Cav2.2.
Received June 11, 2001; revised Aug. 15, 2001; accepted Aug. 23, 2001.This work was supported by the Wellcome Trust and Medical Research Council
(MRC). A.R. was an MRC PhD student. We thank Dr. E. Perez-Reyes for �1bcDNA, Dr. Y. Mori for Cav2.2 cDNA, Dr. H. Chin for �2�-1 cDNA, and Dr. THughes for mut3-GFP cDNA. We thank Nuria Balaguero, Wendy Pratt, andManuela Nieto-Rostro for technical assistance.
A.R. and F.B. contributed equally to this work.Correspondence should be addressed to A. C. Dolphin, Department of Pharma-
cology, University College London, Gower Street, London WC1E6BT, UK. E-mail:[email protected] © 2001 Society for Neuroscience 0270-6474/01/218495-10$15.00/0
The Journal of Neuroscience, November 1, 2001, 21(21):8495–8504

MATERIALS AND METHODSMaterials. The following cDNAs were used: rat �1b (Tomlinson et al.,1993), rabbit Cav2.2 (D14157), rat �2�-1 (M86621), and green fluores-cent protein (GFP) mut3b (Cormack et al., 1996).
Truncated Cav2.2 channel constructs. Constructs containing differentdomains of the rabbit Cav2.2 channel were made using the PCR withprimers incorporating either start or stop codons and restriction enzymesites. The following primers were used: N-term (forward): 5�-GCG ACTAGT ATG GTC CGC TTC GGG GAC �3� and (reverse): 5�-GTA CTCGAG CTA AGG CCA CTC GGT GAT GCG-3� (introduces a stopcodon at the end of the N terminus); Dom I (reverse): 5�-TTA ACT AGTTTA CTG TGC CTT CAC CAT GCG-3� (introduces a stop codon at theend of the I-II loop); Dom I–II (reverse): 5�-CTC GAC TAG TTA CATGGT CAC AAT GTA GTG-3� (introduces a stop codon at the end of theII-III loop); Dom III–IV (forward): 5�-TGG CCA CTA GTA TGG ACAACC TTG CCA ATG-3� (introduces a start codon at the beginning of theII-III loop).
In the GFP–Cav2.2, the stop codon of GFP was removed, and GFP wasfused to the N terminus of Cav2.2 by PCR. The sequence for the forwardprimer was 5�-GAT GAA CTA TAC AAA ATG GTC CGC TTC GG-3�.The sequence in italics indicates the end of GFP (with the stop codonremoved), and the underlined sequence indicates the beginning of Cav2.2.GFP was fused to the Dom I–II construct using the same primer. Enhancedyellow fluorescent protein (EYFP) (Clontech, Cowley, UK) was fused ontothe N terminus of the Dom I construct using the primer, 5�-GAG CTG TACAAG TCC GGA ATG GTC CGC TTC GGG-3�. The sequence in italicsindicates the end of EYFP, and the underlined sequence indicates thebeginning of Cav2.2. For the I–II loop construct, the following primers wereused: 5�-GGAGAATTCGCTATGGAGCGCGAGAGAGTG-3� (forwardwith an EcoRI site and a start codon) and 5�-CTGTGCTCTAGACAT-GCGCCGGATG-3� (reverse with an incorporated XbaI site). The result-ing fragment was digested with EcoRI and XbaI enzymes and ligated inframe with the myc- and His-tags of pcDNA3.1/myc-His(�)A (Invitrogen,Paisley, UK) vector. The validity of the construct was further confirmed byWestern blot, probed with anti-His antibodies (Abs) (Santa Cruz Bio-technology, Santa Cruz, CA), after expression in COS-7 cells. Thesequences of all constructs were verified by automated sequencing.
Yeast two-hybrid screening. Yeast two-hybrid studies were performedusing the Matchmaker Gal4 system (Clontech). The N terminus ofCav2.2 was made by PCR using a forward primer against the vector andthe reverse primer: 5� GAT CTC GAG AGG CCA CTC GGT GATGCG 3�. This gave a product with an NcoI site overlapping the 5� ATGstart codon and an XhoI site at the 3� end. The digested PCR product wassubcloned into the NcoI–XhoI sites of pACT2 and the NcoI-SalI sites ofpAS2–1. The constructs containing the C terminus and the I-II loop weremade using the following primers: C terminus: 5� GTG ACC ATG GACAAT TTT GAG TAC C 3� and 5� TAT CGA ATT CTA GCA CCGGCG GTC G 3�; I-II loop: 5� GTA ACC ATG GCT AAG GAG CGCGAG AG 3� and 5� GTA GGA AAT CTG TGC CTT CAC CAT GC 3�.These PCR products, as well as the entire calcium channel �1b subunit,were subcloned into the NcoI–EcoRI sites of both pACT2 and pAS2–1.Competent yeast cells (Y190 strain) were cotransformed with both plas-mids, and �-galactosidase colony-lift filter assays were performed accord-ing to the user manual (Clontech).
Cell culture and transfection. COS-7 cells were cultured as previouslydescribed (Campbell et al., 1995) and transfected using the Geneportertransfection reagent (Qbiogene, Harefield, UK). Cells were plated ontocoverslips 2–3 hr before transfection. The cDNAs (all at 1 �g/ml) forCav2.2 or truncated domain constructs (Dom I, I–II, III–IV, N terminus,or I–II loop), �2�-1, �1b, and GFP (when used) were mixed in a ratio of1.5 (or 3):2:1:0.2. When both Cav2.2 and truncated construct were bothpresent, the ratios were 1.5:1.5:2:1:0.2. When particular subunits were notused, the volume was made up with water. The DNA mixture andGeneporter (6 �g and 30 �l, respectively) were each diluted in 500 �l ofserum-free medium, mixed, and applied to the cells. After 3.5 hr, 1 ml ofmedium containing 20% serum was added to the cells, which were thenincubated at 37°C for 3 d, followed by incubation at 27°C, where stated.Lactacystin (CN Biosciences, Beeston, UK) was stored at �20 OC as a 3mM stock solution in dimethylsulfoxide (DMSO) and, when used, wasadded to the transfected cells at 30 �M.
Immunocytochemistry and confocal microscopy. COS-7 cells werewashed twice in Tris-buffered saline (TBS; 154 mM NaCl, 20 mM Tris,pH 7.4), then fixed in 4% paraformaldehyde in TBS as described (Briceet al., 1997). The cells were permeabilized in 0.02% Triton X-100 andincubated with blocking solution [20% (v/v) goat serum, 4% (w/v) bovine
serum albumin (BSA), and 0.1% D,L-lysine in TBS]. In experiments usingmouse monoclonal anti-GFP Ab (Clontech), or anti-myc Ab (9E10;Santa Cruz), they were used at 20 and 0.4 �g/ml, respectively, and thesecondary Ab was 10 �g/ml goat anti-mouse IgG conjugated to TexasRed (Molecular Probes, Eugene, OR). In some experiments, cells wereincubated for 20 min with Texas Red phalloidin (6.6 �M; MolecularProbes). The nuclear dye 4�,6-diamidino-2-phenylindole (DAPI; 300 nM;Molecular Probes) was also used to visualize the nucleus. Cells were thenwashed in TBS five times for 5 min each. Coverslips were mounteddirectly onto a microscope slide with Vectorshield (Vector Laboratories,Burlingame, CA), and the cells were examined on a laser-scanningconfocal microscope (Leica TCS SP; Leica, Milton Keynes, UK). Theoptical sections were 0.2 �m, and all images were scanned sequentially toeliminate cross-talk. For the immunocytochemistry experiments, n �number of different transfections performed, with at least two coverslipsof cells analyzed per transfection condition.
Western blotting. COS-7 cells were resuspended in hypotonic buffer (10mM Tris, pH 7.4), containing protease inhibitors (complete EDTA-free;Roche Diagnostics, Lewes, UK) and 2 mM EDTA. Aliquots were takenfor assay of total lysate protein (BCA; Perbio Science, Chester, UK), andthe remainder of each sample was then solubilized in SDS-PAGE samplebuffer containing 2% SDS. The samples were sonicated briefly (threetimes for 5 sec each on ice) and then centrifuged (10,000 � g, 15 min,4°C) to remove any insoluble material. Samples (50 �g of total protein/lane) were separated by SDS-PAGE using 7.5% resolving gels and thentransferred electrophoretically to polyvinylidene fluoride membranes.The membranes were blocked with 3% BSA for 5 hr at 55°C and thenincubated overnight at 20°C with a 1:1000 dilution of either anti-GFPmonoclonal Ab, or an anti-peptide Ab raised in rabbits against residues846–861 within the II-III loop of rabbit brain Cav2.2 and purified byaffinity chromatography using the immobilized synthetic peptide. Sec-ondary Ab (a 1:1000 dilution of goat anti-mouse IgG or goat anti-rabbitIgG horseradish peroxidase conjugate, respectively) was added, and themembranes were incubated for 1 hr. After extensive washing, bound Abswere detected using enhanced chemiluminescence (Amersham Pharma-cia Biotech, Little Chalfont, UK).
Whole-cell electrophysiology. Whole-cell patch-clamp recording wasperformed essentially as previously described (Meir et al., 2000), with 10mM Ba 2� as charge carrier. Only fluorescent cells expressing GFP wereused for recording. The holding potential was �100 mV, and pulses weredelivered every 10 sec. Currents were measured 10 msec after the onsetof the test pulse, and the average over a 2 msec period was calculated andused for subsequent analysis. The current density–voltage ( I–V) rela-tionships were fitted with a modified Boltzmann equation as follows:
I�Gmax(V�Vrev)/(1�exp(�(V�V50,act)/k)),
where I is the current density (in picoamperes per picofarad), Gmax is themaximum conductance (in nanosiemans per picofarad), Vrev is the re-versal potential, V50,act is the midpoint voltage for current activation, andk is the slope factor. Data are expressed as mean � SEM of the numberof replicates, n. Steady-state inactivation properties were measured byapplying 10 sec pulse from �120 to �10 mV in 10 mV increments,followed by a 10 msec repolarization to �100 mV before the 40 msec testpulse to �20 mV. Steady-state inactivation data were fitted with a singleBoltzmann equation of the form:
I/Imax�((A1�A2)/(1�exp(V�V50,inact)/kinact))�A2,
where Imax is the maximal current, V50,inact is the half-maximal voltagefor current inactivation, kinact is the slope factor, and A1 and A2 representthe proportion of inactivating and noninactivating current, respectively.
Single-channel electrophysiology. Recordings were performed on GFP-positive cells at 20–24°C. Recording pipettes were pulled from borosili-cate tubes (World Precision Instruments, Sarasota, FL), coated withSylgard (Sylgard 184, Dow Corning, Wiesbaden, Germany), and fire-polished. The bath solution, designed to zero the resting membranepotential (Meir and Dolphin, 1998) was composed of (in mM): 135K-aspartate, 1 MgCl2, 5 EGTA, and 10 HEPES (titrated with KOH, pH7.3), and the patch pipettes were filled with a solution of the followingcomposition (in mM): 100 BaCl2, 10 TEA-Cl, and 10 HEPES, with 200nM TTX, titrated with TEA-OH to pH 7.4. Both solutions were adjustedto an osmolarity of 320 mOsmol with sucrose. Data were sampled at 10kHz and filtered on-line at 2 kHz. (Axopatch 200B and Digidata 1200;Axon Instruments, Foster City, CA). Voltages were not corrected for
8496 J. Neurosci., November 1, 2001, 21(21):8495–8504 Raghib et al. • Cav2.2 Channel Synthesis Suppressed by Truncated Channels
liquid junction potential (Neher, 1995), measured to be �15 mV in thesesolutions.
Leak subtraction was performed as described (Meir et al., 2000). Eventdetection was performed using the half-amplitude threshold method.Open time was determined by a single or double exponential fit to theopen time distributions. Closed times were determined similarly usingonly patches with no overlapping openings. The latency to first openingwas measured in 2 msec bins and analyzed as described (Meir et al.,2000). In brief, first latency histograms were accumulated and divided bythe number of episodes, to represent the cumulative probability of a firstlatency event (PFL). If necessary these were corrected for the number ofchannels in the patch. We considered the number of detectable simulta-neously overlapping openings as representing the number of channelsactive in the patch (Meir et al., 2000). To strengthen this assumption weincluded in the latency analysis only patches with up to three simulta-neously overlapping openings.
RESULTSExpression of GFP–Cav2.2 and truncated constructsThe functional expression of Cav2.2 in COS-7 cells was investi-gated using N terminal GFP-fusion proteins of Cav2.2 and severaltruncated forms. We first examined whether the GFP-taggedCav2.2, expressed in combination with the accessory subunits �1band �2�-1, was able to reproduce the biophysical properties ofwild-type Cav2.2. An example of a whole-cell recording of IBa
from COS-7 cells transfected with GFP–Cav2.2 cDNA is shownin Figure 1a (top panel), together with the voltage protocol used.The I–V relationship for the GFP-tagged Cav2.2 is shown inFigure 1b ( filled circles). The GFP tag on the N terminus did notinterfere with the functionality of the channel, because the cur-rent density at �20 mV was �55.1 � 8.3 pA/pF for the untaggedCav2.2 channel (n � 12; data not shown), not significantly differ-ent from the GFP–Cav2.2 channel (�59.2 � 17.9 pA/pF; n � 10).Similarly, there were no differences in other parameters of theI–V relationship (see legend to Fig. 1).
GFP-Dom I–II, containing only the first two domains and theintracellular II-III loop of Cav2.2, when expressed with �1b and�2�-1, did not elicit any detectable currents (Fig. 1b, open circles).The same was true for Dom III–IV, indicating that the hemichan-nels are unable to form functional channels alone. In contrast,coexpression of the two hemichannels (either with or without aGFP tag on Dom I–II) resulted in the reproducible expression ofsmall whole-cell currents, with properties otherwise analogous tothe native Cav2.2 (Fig. 1a, middle and bottom panels). In cellsexpressing untagged Dom I–II and Dom III–IV, a �20 mV stepelicited a current of �13.2 � 4.2 pA/pF (n � 8). Coexpression ofthe GFP-Dom I–II with Dom III–IV resulted in the expression ofcurrents with similar amplitude at �20 mV (�11.4 � 3.8 pA/pF;n � 7). In addition, the steady-state inactivation properties of thereconstituted channel composed of Dom I–II and Dom III–IV didnot differ from those of GFP–Cav2.2 (Fig. 1c).
Figure 1. Functional expression of GFP-tagged Cav2.2 and formation offunctional channels by coexpression of constructs consisting of Dom I–IIand Dom III–IV. Cells were transfected with the constructs stated to-gether with �1b and �2�-1 cDNAs. a, IBa recorded from cells transfectedwith: GFP–Cav2.2 (top panel ); GFP-Dom I–II and Dom III–IV (middlepanel ), and Dom I–II and Dom III–IV (bottom panel ). Cells held at �100mV. Test potentials �50 to �70 mV (only traces between �20 and �10mV shown). Asterisks indicate GFP tag. b, Mean I–V relationships forGFP–Cav2.2 (F; n � 10); GFP-Dom I–II and Dom III–IV (‚; n � 6), andDom I–II and Dom III–IV ({; n � 8);. IBa at �20 mV was �59.2 � 17.9pA/pF (n � 10) for GFP–Cav2.2 and �55.1 � 8.3 pA/pF for untaggedCav2.2 (n � 12; p � NS; data not shown). The I–V parameters were alsounaltered for both V50,act (�8.8 � 1.5 mV for Cav2.2 and �3.0 � 3.0 mV
4
for GFP–Cav2.2; p � NS) and k (�4.4 � 0.5 for Cav2.2 and �3.3 � 0.5for GFP–Cav2.2; p � NS). For untagged Dom I–II and Dom III–IV, IBaat �20 mV was �13.2 � 4.2 pA/pF, and the I–V parameters were:V50,act � �11.5 � 2.8 mV, k � �4.8 � 0.6 ( p � NS; compared withCav2.2). GFP-Dom I–II plus Dom III–IV gave similar results (IBa was�11.4 � 3.8 pA/pF) with slight shift of V50,act (�15.0 � 2.0 mV; p � 0.05compared with GFP–Cav2.2) and an increase in k (�5.4 � 0.4 mV; p �0.01). When either Dom I–II or Dom III–IV were expressed alone, nocurrent was detected (E; n � 6). c, Steady-state inactivation curves forGFP–Cav2.2 (F) and Dom I–II plus Dom III–IV (�) together with fits(solid lines). V50,inact was �38.6 � 0.9 mV for GFP–Cav2.2 (n � 5) and�40.1 � 1.3 mV for Dom I–II plus Dom III–IV (n � 5; p � NS), whereaskinact values were �9.8 � 0.8 and �10.9 � 1.1, respectively ( p � NS).
Raghib et al. • Cav2.2 Channel Synthesis Suppressed by Truncated Channels J. Neurosci., November 1, 2001, 21(21):8495–8504 8497
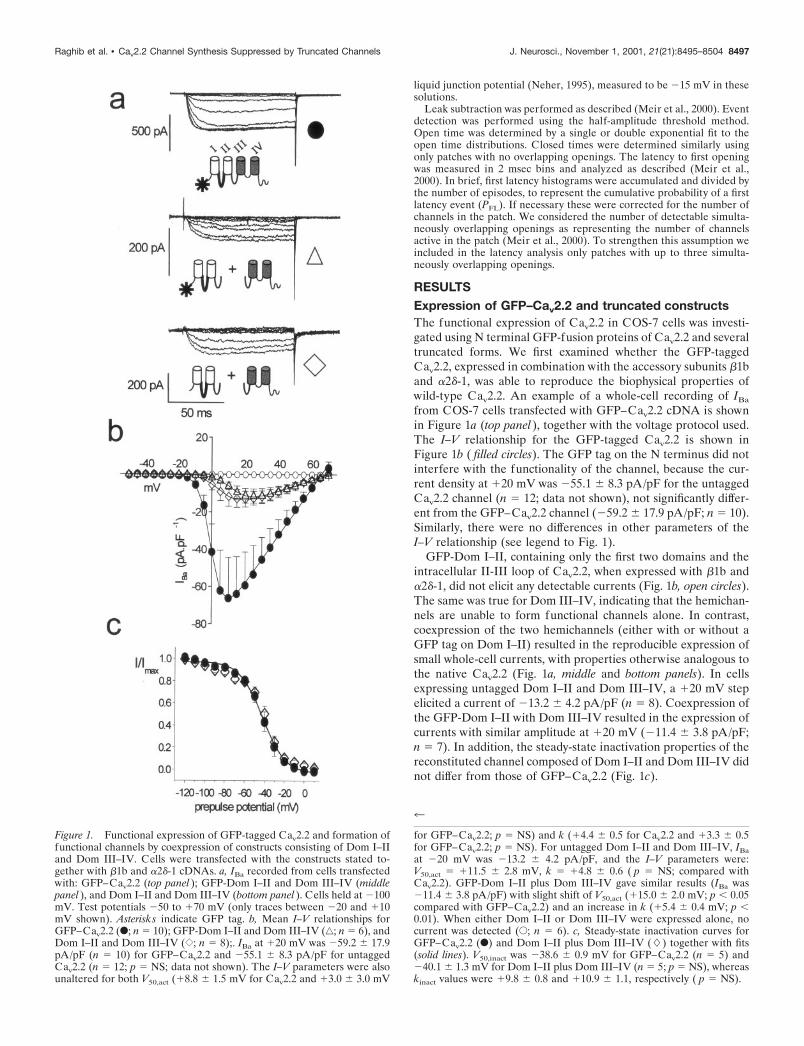
Once the functional integrity of the GFP-tagged channel andhemichannels was proven, the expression of these fusion proteinswas examined using confocal microscopy. Figure 2a shows thelocalization of GFP–Cav2.2. This subunit was expressed through-out the cell (Fig. 2a, lef t panel) (n � 10). The cells were alsostained with Texas Red phalloidin to visualize cortical actin,which delineates the plasma membrane (Fig. 2a, middle panel).The yellow color in the merged image (arrow) indicates that
GFP–Cav2.2 and Texas Red phalloidin are colocalized at theplasma membrane (Fig. 2a, right panel), in accordance with theelectrophysiological results.
Effect of coexpression of two domain constructs onCav2.2 localizationHaving determined the distribution of full-length GFP–Cav2.2,we next investigated the effect of Dom I–II or Dom III–IV on theexpression of GFP–Cav2.2. As shown in Figure 2b, untaggedDom I–II strongly suppressed the expression of GFP–Cav2.2(n � 6). This was evidenced by the complete absence of observ-able GFP-positive cells. This could be attributable to a low levelof expression, below the detection capability of the imagingsystem. Thus, an anti-GFP Ab was used to amplify the signal ofany expressed GFP–Cav2.2 within the cells. The anti-GFP Abwas able to detect GFP–Cav2.2 alone (Fig. 2c) ( n � 4), but nostaining was detectable when GFP–Cav2.2 was coexpressed withDom I–II (Fig. 2d, center panel) ( n � 4). In this case, the presenceof viable cells was established by using the nuclear stain DAPI(Fig. 2d, right panel). These results confirm that Dom I–II greatlyreduces the expression of GFP–Cav2.2.
When GFP-Dom I–II was expressed alone, it was detectable atthe plasma membrane and throughout the cell (Fig. 2e, rightpanel). The subcellular localization of GFP-Dom I–II was iden-tical to that of GFP–Cav2.2 (n � 10). Interestingly, in the con-verse of the coexpression study described above, the expression ofGFP-Dom I–II was not detectably reduced by the presence ofuntagged Cav2.2 (Fig. 2f).
The coexpression of GFP-Dom I–II with Dom III–IV did notalter the GFP expression or localization of GFP-Dom I–II (re-sults not shown; n � 6). In contrast, coexpression of GFP–Cav2.2with Dom III–IV altered the expression of GFP–Cav2.2 withinindividual cells, but did not entirely suppress it (Fig. 2g) (n � 6).In this case, GFP–Cav2.2 showed a perinuclear localization andwas not readily detectable throughout the cytoplasm or at theplasma membrane by confocal microscopy (Fig. 2g).
Functional effects of coexpression of two-domainconstructs with Cav2.2Although immunofluorescence studies indicated that Dom I–IIcompletely suppressed the expression of GFP–Cav2.2, it wasplausible that small amounts of GFP–Cav2.2 were still expressed.This was confirmed by whole-cell recording, which showed thatthere was a marked reduction in IBa current density in cellsexpressing GFP–Cav2.2 together with either Dom I–II or DomIII–IV (Fig. 3a), although the I–V parameters were unchanged(Fig. 3b). IBa at �20 mV was �59.2 � 17.9 pA/pF for GFP–Cav2.2, and was reduced to �19.2 � 3.6 pA/pF when GFP–Cav2.2 was coexpressed with Dom I–II (67% reduction; n � 26;p � 0.001) and �18.1 � 6.1 pA/pF with Dom III–IV (69%reduction; n � 12; p � 0.001). The steady-state inactivationparameters for Cav2.2 were also unchanged by coexpression withDom I–II (Fig. 3c). Because of the suppression effect, it wasnecessary to coexpress free GFP, to facilitate the identification ofsuccessfully transfected cells. This did not alter the amplitude ofcontrol Cav2.2 currents (data not shown). We also examinedwhether the effect of Dom I–II was a nonspecific result of coex-pressing another transmembrane protein, but no reduction in IBa
was observed when Cav2.2 was coexpressed with the �2A-adrenergic receptor under the same conditions (IBa � �80.1 �24.1 pA/pF at �20 mV; n � 6). We further assessed whether thedecrease in Cav2.2 current amplitude when it was coexpressedwith Dom I–II could be a result of an alteration of the ratio
Figure 2. Expression of GFP-tagged Cav2.2 together with Dom I–II orDom III–IV. Cells were transfected with: GFP–Cav2.2 ( a), GFP–Cav2.2and Dom I–II ( b), GFP–Cav2.2 (c), GFP–Cav2.2 and Dom I–II (d);GFP–Dom I–II (e); Cav2.2 and GFP–Dom I–II ( f); and GFP–Cav2.2 andDom III–IV (g), as depicted in the diagrams on the lef t. All cells werecotransfected with �1b and �2�-1. The lef t panel shows GFP fluorescence,the middle panel shows either Texas Red phalloidin (Phal ) staining orimmunolocalization of GFP using anti-GFP Ab, and the right panel showseither the merged image (colocalization indicated by yellow) or DAPIstaining of the nucleus (blue), as stated. Arrow in a indicates colocalizationof phalloidin staining and GFP–Cav2.2 at the plasma membrane.
8498 J. Neurosci., November 1, 2001, 21(21):8495–8504 Raghib et al. • Cav2.2 Channel Synthesis Suppressed by Truncated Channels

between the Cav2.2 and truncated construct cDNAs transfected.Therefore IBa was examined in cells transfected with half of thenormal amount of GFP–Cav2.2-pMT2 cDNA (1.5 �g/dish), withthe same amount of accessory subunits. No reduction in current
amplitude or alteration in I–V parameters were detected (data notshown), indicating that the Cav2.2 cDNA amount was saturating,consistent with the fact that COS-7 cells are SV40 transformed,and the vector pMT2 contains the SV40 origin of replication. We
Figure 3. Functional expression of GFP-tagged Cav2.2 together with constructs consisting of Dom I–II or Dom III–IV. Cells were transfected with thecDNA constructs stated. a, Example traces for GFP–Cav2.2 with either Dom I–II (top) or Dom III–IV (bottom). Asterisks indicate GFP tag. Tracesrecorded between �20 and �10 mV are shown. b, I–V relationships for expression of GFP–Cav2.2 alone (F) or with Dom I–II (�) or Dom III–IV (�).IBa at �20 mV was �19.2 � 3.6 pA/pF for GFP–Cav2.2 plus Dom I–II (n � 26; p � 0.001; compared with control) and �18.1 � 6.1 pA/pF forGFP–Cav2.2 plus Dom III–IV (n � 12; p � 0.001). The respective V50,act � �5.2 � 0.3 mV and � 7.7 � 0.8 mV. Controls (F; n � 10) are the sameas for Figure 1 because the experiments were all performed in parallel. c, Steady-state inactivation for GFP–Cav2.2 plus Dom I–II. V50,inact � �37.8 �0.8 mV; kinact � �9.2 � 0.7; n � 6; p � NS compared with GFP–Cav2.2 (Fig. 1). d, Effect of transfection of different amounts (the standard amount,1 �g, �; or 1.7 �g/dish, f) of �1b cDNA on IBa for GFP–Cav2.2 plus Dom I–II. When using 1.7 �g �1b cDNA, IBa was �19.4 � 10.7 at �20 mV, andV50,act was �10.3 � 0.3 mV, (n � 8). e, I–V relationships for Cav2.2 alone (F; n � 9) or plus myc-tagged I-II loop (ƒ; n � 11). For the controls, IBa at�20 mV was �53.5 � 8.5 pA/pF, and V50,act was �6.2 � 1.5 mV. For cells coexpressing the I–II loop, IBa at �20 mV was �50.3 � 11.4 pA/pF, and V50,actwas �5.1 � 1.4 mV. f, Steady-state inactivation of IBa in cells coexpressing GFP–Cav2.2 and I–II loop; V50,inact � �42.3 � 1.5 mV; kinact � �6.9 � 0.7;n � 5; p � NS compared with GFP–Cav2.2. g, Cells transfected with GFP–Cav2.2 and myc-tagged I-II loop and cotransfected with �1b and �2�-1. GFP,GFP fluorescence; myc, immunolocalization of myc-I-II loop using anti-myc Ab; DAPI, DAPI staining of the nucleus; and merge, merged images. h, Cellstransfected with GFP–Cav2.2 and Dom I–II, in the absence of �2�-1 or �1b. GFP, Lack of GFP fluorescence; Phal, Texas Red phalloidin staining; DAPI,DAPI staining of the nuclei; merge, merged images.
Raghib et al. • Cav2.2 Channel Synthesis Suppressed by Truncated Channels J. Neurosci., November 1, 2001, 21(21):8495–8504 8499
consistently observed that, within the range examined, reductionof the �1 subunit cDNA level decreased the number of cellstransfected but not the current density.
To address the mechanism of suppression, we examinedwhether the suppressive effect of Dom I–II or Dom III–IV onCav2.2 currents could be reduced by coexpression of bothhemichannels together with Cav2.2, a result that might be pre-dicted because our initial studies showed that Dom I–II and DomIII–IV were able to interact together to form functional channels.A protective effect was confirmed, because the IBa current densityat �20 mV in cells expressing GFP–Cav2.2 together with bothDom I–II and Dom III–IV was �44.4 � 11.9 pA/pF (n � 9), anonsignificant 17% reduction ( p � 0.54), compared with �53.5 �8.1 pA/pF�1 (n � 9) for control GFP–Cav2.2 currents (samecontrols as in Fig. 3e, because experiments performed in parallel).
We next examined whether the mechanism of suppressioninvolved an accelerated degradation of Cav2.2, by examining theeffect of the 26 S proteasome inhibitor lactacystin. When incu-bated with cells, at 30 �M, either for the entire period betweentransfection and visualization of GFP–Cav2.2, or for the final 16hr, lactacystin did not increase GFP fluorescence of GFP–Cav2.2coexpressed with Dom I–II (compared with controls receiving thesame amount of solvent, n � 6, results not shown).
Is the suppression of expression of GFP–Cav2.2caused by sequestration of � subunits by thetruncated constructs?The Cav� subunits have been shown to act as chaperone proteinsfor the calcium channel �1 subunits, enhancing their translocationfrom the endoplasmic reticulum to the plasma membrane (Bichetet al., 2000). One possible explanation for the suppression ofCav2.2 currents is that Dom I–II acts to sequester free �1b via itsI-II loop, and therefore limits the amount available for chaper-oning GFP–Cav2.2 to the membrane. To test this hypothesis,cells were transfected with increased �1b cDNA, but this did notenhance Cav2.2 IBa recorded in the presence of Dom I–II (Fig.3d) (IBa current density at �20 mV was �19.4 � 10.7 pA/pF; n �8). To examine further whether the effect of Dom I–II on GFP–Cav2.2 was attributable to scavenging of �1b by the I-II loopwithin Dom I–II, we also coexpressed GFP–Cav2.2 with a con-struct of the Cav2.2 I-II loop, which we have shown to be capableof binding �1b (Bell et al., 2001). No inhibitory effect was ob-served (Fig. 3e); the IBa current density at �20 mV in cellsexpressing GFP–Cav2.2 together with the free I-II loop was�50.3 � 11.4 pA/pF (n � 11), a nonsignificant 5% reduction,compared with �53.5 � 8.1 pA/pF (n � 9) for GFP–Cav2.2currents recorded in parallel, from the same transfections. Thesteady-state inactivation parameters for GFP–Cav2.2 were alsounchanged by coexpression with Dom I–II (Fig. 3f). In agreementwith this, we saw no reduction of GFP–Cav2.2 fluorescence whenit was coexpressed with the I-II loop, either in the presence orabsence of coexpressed �1b (Fig. 3g) (data not shown; n � 2).Furthermore, omission of both coexpressed accessory subunits(�1b and �2�-1) did not affect the ability of Dom I–II to suppressexpression of GFP–Cav2.2, as determined by its fluorescence(Fig. 3h) (n � 6). Because there is very low functional expressionof Cav2.2 channels in the absence of these accessory subunits(Meir et al., 2000), it was not possible to perform the correspond-ing electrophysiological experiments.
In yeast two-hybrid experiments, we observed no interaction of�1b with the intracellular N terminus or the C terminus of Cav2.2(n � 3). In every experiment, an interaction of �1b with a I-II
loop construct was obtained as a positive control (results notshown). This rules out �1b subunit scavenging as a mechanism ofaction of Dom III–IV, which contains the C terminus, but not theI-II loop.
Single channel properties of two domain constructscoexpressed together or with Cav2.2These experiments were performed to determine whether thesmall whole-cell currents obtained either when Dom I–II wascoexpressed with Dom III–IV or when Dom I–II was coexpressedwith Cav2.2 were caused by altered properties of the channelsformed. Single channels were recorded in the cell-attached modeof the patch clamp technique. The recordings were made fromCOS-7 cells transfected with GFP–Cav2.2 alone (Fig. 4a), DomI–II together with Dom III–IV (Fig. 4b), or GFP–Cav2.2 withDom I–II (Fig. 4c). In all cases we could detect single channelswith a similar mean conductance (Fig. 4d), mean open time (Fig.4e), mean closed time (Fig. 4f), and latency to first opening (Fig.4g; shown at �30 mV). These values are very similar to thoseobtained from wild-type Cav2.2 (not tagged with GFP) (Meir etal., 2000).
Effect of coexpression of Dom I or the cytoplasmic Nterminus on Cav2.2 expressionWe next investigated the minimal domain required for suppres-sion of Cav2.2 expression. To this end, GFP–Cav2.2 was coex-pressed with either Dom I or the cytoplasmic N terminus ofCav2.2. The Dom I construct consisted of the intracellular Nterminus, domain I, and the intracellular I-II loop. Immunofluo-rescence studies using YFP-Dom I confirmed its expressionthroughout COS-7 cells (results not shown). In a similar mannerto Dom I–II, untagged Dom I also appeared to abolish theexpression of GFP–Cav2.2, as assessed by confocal microscopy(Fig. 5a) (n � 4). These results were confirmed by using theanti-GFP Ab, which did not reveal any GFP–Cav2.2 (Fig. 5b)(n � 4). Again, this suppression was not affected by the absenceof accessory subunits (results not shown; n � 4). In contrast, theN terminus of Cav2.2 did not have any effect on the expression ofGFP–Cav2.2 or on its subcellular localization (Fig. 5c) (n � 4).GFP–Cav2.2 was localized at the plasma membrane (colocalizedwith phalloidin) and throughout the cytoplasm. In confirmationof these results, IBa recorded from cells expressing GFP–Cav2.2and Dom I was dramatically reduced, compared with controls(Fig. 5d). IBa at �20 mV was �5.2 � 1.9 pA/pF (88.4% reductioncompared with control; n � 8). In contrast, the I–V parameters forcells expressing GFP–Cav2.2 together with the N terminus didnot show any decrease in current amplitude or effect on activation(Fig. 5d). The steady-state inactivation parameters were alsoidentical to those of GFP–Cav2.2 (Fig. 5e). This is in agreementwith the lack of interaction observed between the �1b subunit andthe N terminus of Cav2.2 in the yeast two-hybrid assay.
Effect of coexpression of truncated constructs on theCav2.2 protein levelThe GFP–Cav2.2 expressed alone was detectable by Westernblotting using either an anti-GFP Ab or an Ab against the II-IIIloop of Cav2.2 (band at 250 kDa) (Fig. 6a,b, lane 1). A minorband at 100 kDa was also observed with both Abs, which mighttherefore represent an N terminal degradation product of Cav2.2.When Dom I–II was expressed alone it was detected by anti-Cav2.2, but not anti-GFP Abs (band at 120 kDa in Fig. 6b but not
8500 J. Neurosci., November 1, 2001, 21(21):8495–8504 Raghib et al. • Cav2.2 Channel Synthesis Suppressed by Truncated Channels
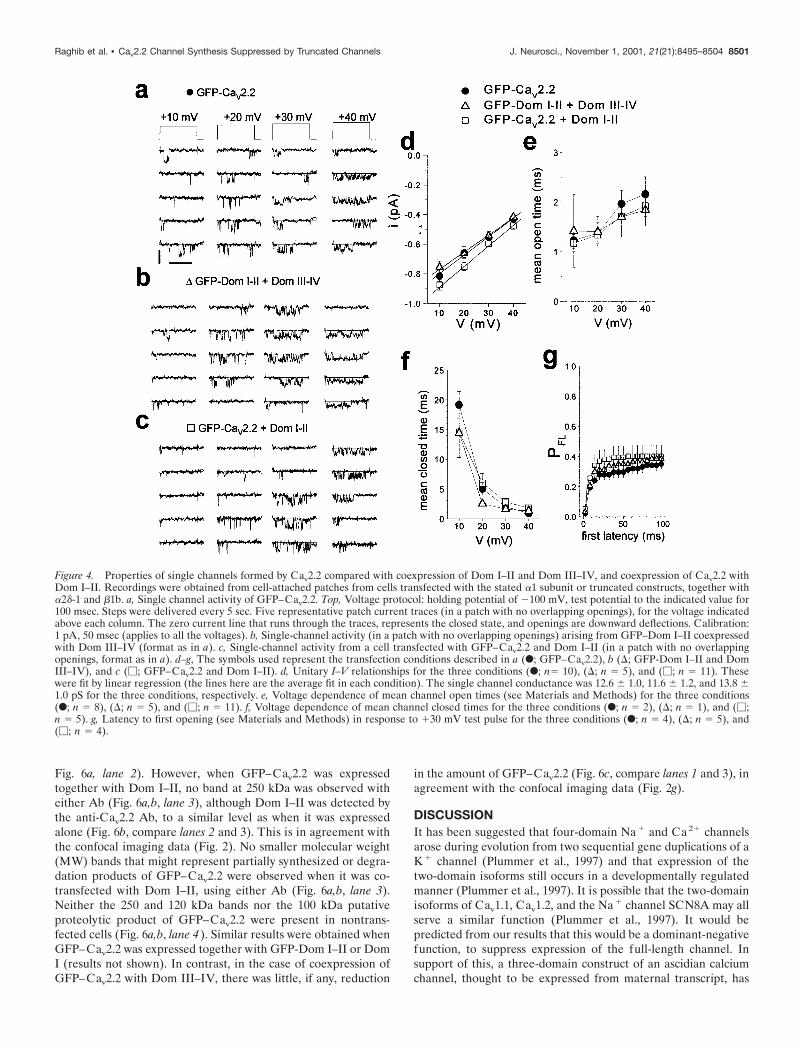
Fig. 6a, lane 2). However, when GFP–Cav2.2 was expressedtogether with Dom I–II, no band at 250 kDa was observed witheither Ab (Fig. 6a,b, lane 3), although Dom I–II was detected bythe anti-Cav2.2 Ab, to a similar level as when it was expressedalone (Fig. 6b, compare lanes 2 and 3). This is in agreement withthe confocal imaging data (Fig. 2). No smaller molecular weight(MW) bands that might represent partially synthesized or degra-dation products of GFP–Cav2.2 were observed when it was co-transfected with Dom I–II, using either Ab (Fig. 6a,b, lane 3).Neither the 250 and 120 kDa bands nor the 100 kDa putativeproteolytic product of GFP–Cav2.2 were present in nontrans-fected cells (Fig. 6a,b, lane 4). Similar results were obtained whenGFP–Cav2.2 was expressed together with GFP-Dom I–II or DomI (results not shown). In contrast, in the case of coexpression ofGFP–Cav2.2 with Dom III–IV, there was little, if any, reduction
in the amount of GFP–Cav2.2 (Fig. 6c, compare lanes 1 and 3), inagreement with the confocal imaging data (Fig. 2g).
DISCUSSIONIt has been suggested that four-domain Na� and Ca2� channelsarose during evolution from two sequential gene duplications of aK� channel (Plummer et al., 1997) and that expression of thetwo-domain isoforms still occurs in a developmentally regulatedmanner (Plummer et al., 1997). It is possible that the two-domainisoforms of Cav1.1, Cav1.2, and the Na� channel SCN8A may allserve a similar function (Plummer et al., 1997). It would bepredicted from our results that this would be a dominant-negativefunction, to suppress expression of the full-length channel. Insupport of this, a three-domain construct of an ascidian calciumchannel, thought to be expressed from maternal transcript, has
Figure 4. Properties of single channels formed by Cav2.2 compared with coexpression of Dom I–II and Dom III–IV, and coexpression of Cav2.2 withDom I–II. Recordings were obtained from cell-attached patches from cells transfected with the stated �1 subunit or truncated constructs, together with�2�-1 and �1b. a, Single channel activity of GFP–Cav2.2. Top, Voltage protocol: holding potential of �100 mV, test potential to the indicated value for100 msec. Steps were delivered every 5 sec. Five representative patch current traces (in a patch with no overlapping openings), for the voltage indicatedabove each column. The zero current line that runs through the traces, represents the closed state, and openings are downward deflections. Calibration:1 pA, 50 msec (applies to all the voltages). b, Single-channel activity (in a patch with no overlapping openings) arising from GFP–Dom I–II coexpressedwith Dom III–IV (format as in a). c, Single-channel activity from a cell transfected with GFP–Cav2.2 and Dom I–II (in a patch with no overlappingopenings, format as in a). d–g, The symbols used represent the transfection conditions described in a (F; GFP–Cav2.2), b (; GFP-Dom I–II and DomIII–IV), and c (�; GFP–Cav2.2 and Dom I–II). d, Unitary I–V relationships for the three conditions (F; n� 10), (; n � 5), and (�; n � 11). Thesewere fit by linear regression (the lines here are the average fit in each condition). The single channel conductance was 12.6 � 1.0, 11.6 � 1.2, and 13.8 �1.0 pS for the three conditions, respectively. e, Voltage dependence of mean channel open times (see Materials and Methods) for the three conditions(F; n � 8), (; n � 5), and (�; n � 11). f, Voltage dependence of mean channel closed times for the three conditions (F; n � 2), (; n � 1), and (�;n � 5). g, Latency to first opening (see Materials and Methods) in response to �30 mV test pulse for the three conditions (F; n � 4), (; n � 5), and(�; n � 4).
Raghib et al. • Cav2.2 Channel Synthesis Suppressed by Truncated Channels J. Neurosci., November 1, 2001, 21(21):8495–8504 8501

recently been shown to suppress expression of the full-lengthascidian calcium channel (Okagaki et al., 2001).
Dominant-negative suppression of K� channel tetramer func-tion by transmembrane fragments has been studied previously forthe Kv channel family (Tu et al., 1995). This suppression effectwas found to involve multiple transmembrane peptides but not toaffect synthesis (Tu et al., 1996). As discussed in that study, theformation of K� channel tetramers will involve multiple interac-tions between domains, and disruption at any stage of biogenesismay be sufficient to cause suppression of functional expression(Tu et al., 1996). In contrast, another recent study showed theexistence of a pathway involving arrest of synthesis and rapiddegradation of mis-folded human ether-a-go-go-related gene(HERG) K� channel tetramers induced by a point mutation(Kagan et al., 2000).
Here we have examined whether the mechanism of suppressionof expression of full-length Cav2.2 by truncated constructs in-volves (1) interference with gating of the channel inserted in theplasma membrane, (2) interference with delivery to the plasmamembrane, (3) increased protein degradation, or (4) synthesisarrest. Below we consider these possibilities in turn.
Is there an impairment of gating caused by association of
channel fragments with full-length Cav2.2 in the plasma mem-brane? From the electrophysiological data, GFP-Dom I–II coex-pressed with Dom III–IV resulted in small but reproduciblewhole-cell calcium channel currents and produced single channelswhose properties, apart from frequency of observation, wereindistinguishable from wild type. Therefore, at least a smallproportion of the truncated constructs must be able to fold andassemble together correctly with the normal topology. Similarresults have recently been obtained for coexpression of two do-main constructs of Cav1.1 (Ahern et al., 2001).
Concerning the mechanism of suppression, a combination ofthe whole-cell and single channel analysis indicates that theinhibition of full-length Cav2.2 currents by Dom I–II is attribut-able to a reduction in the number of channels, because there is noalteration in any of their biophysical properties examined. Al-though fewer Cav2.2 channels reach the plasma membrane, theirgating is not modified by an association with the truncated con-struct. The apparent discrepancy between the confocal imagingdata, where almost no GFP fluorescence was seen when Dom I–IIwas coexpressed with GFP–Cav2.2, and the electrophysiologicaldata, may be a function of the detection limit, which has beencalculated to be 10,000 GFP molecules per tissue culture cell(Patterson et al., 1997). From our data, only 3000 channelswould be required to give rise to the currents observed whenDom I–II is coexpressed with GFP–Cav2.2. It is also possible thatthe GFP tag is synthesized, but mis-folded, and therefore notfluorescent, but it was also not recognized by the GFP Ab.
Is there interference in the delivery of the channel to theplasma membrane? Cav� subunits are involved both in trafficking�1 subunits and in modulating their biophysical properties (Chienet al., 1995; Brice et al., 1997; Bichet et al., 2000; Canti et al.,2001). It is conceivable that trafficking of Cav2.2 through theendoplasmic reticulum might be compromised by scavenging ofCav� subunits by the truncated fragments. However, suppressionwas not prevented by expression of an increased amount of �subunit. Furthermore, the properties of the currents in the pres-
Figure 5. Effect of coexpression of Dom I or the intracellular N terminusof Cav2.2 on Cav2.2 expression and function. All cells were transfectedwith the constructs stated and �1b and �2�-1 accessory subunit cDNAs. a,b, GFP–Cav2.2 and Dom I; c, GFP–Cav2.2 and the N terminus of Cav2.2.Left panel shows GFP fluorescence or immunolocalization of GFP usinganti-GFP Ab; middle panel shows either Texas Red phalloidin or DAPI,and right panel shows the merged image, as stated. d, I–V relationships forGFP–Cav2.2 alone (F, n � 7; IBa � �44.8 � 8.9 pA/pF at �20 mV;V50,act � �6.4 � 2.1 mV); GFP–Cav2.2 plus N terminus (E, n � 11; IBa ��44.9 � 8.6 pA/pF at �20 mV; V50,act � �8.9 � 1.8 mV; p � NS) orGFP–Cav2.2 plus Dom I (�, n � 8; IBa � �5.2 � 1.9 pA/pF at �20 mV;V50,act � �14.7 � 1.5 mV; both p � 0.001 compared with control). e,Steady-state inactivation curve (fitted with a Boltzmann function, solidline) for GFP–Cav2.2 plus N terminus (E; V50,inact � �42.0 � 0.7 mV;kinact � 7.9 � 0.7; n � 5). Data are superimposed on the Boltzmann fit forthe steady-state inactivation curve for GFP–Cav2.2 from Figure 1 forcomparison (dotted line).
Figure 6. Effect of cotransfection of COS-7 cells with Dom I–II on thelevel of expressed full-length GFP–Cav2.2. Western blotting and immu-nodetection using (a, c) anti-GFP Ab (lanes 1–4 ), or anti-rabbit brain �1BII-III loop Ab (b, lanes 1–4 ), performed as described in Materials andMethods. a, b, Lane 1, GFP–Cav2.2; lane 2, Dom I–II; lane 3, GFP–Cav2.2and Dom I–II, and lane 4, no transfected cDNA. Positions of molecularweight markers are shown on the left referring to both a and b. Closedarrow shows position of Cav2.2 band, detected with both Abs, and openarrow shows position of Dom I–II, only detected with anti-II-III loop Ab.Representative of four similar experiments. c, Lane 1: GFP–Cav2.2; lane2, Dom III–IV; lane 3, GFP–Cav2.2 and Dom III–IV, and lane 4, notransfected cDNA. Positions of molecular weight markers are shown onthe lef t. Closed arrow shows position of Cav2.2 band.
8502 J. Neurosci., November 1, 2001, 21(21):8495–8504 Raghib et al. • Cav2.2 Channel Synthesis Suppressed by Truncated Channels

ence of the truncated constructs did not mimic those of Cav2.2expressed without � subunits in COS-7 cells or Xenopus oocytes,where both the V50 for activation and steady-state inactivationwere markedly depolarized (Canti et al., 2000; Meir et al., 2000;Stephens et al., 2000). Moreover, suppression of GFP–Cav2.2protein expression remained evident in the absence of coex-pressed accessory � subunits, indicating that it occurs beforetrafficking out of the endoplasmic reticulum [for which Cav� isrequired (Bichet et al., 2000)]. From yeast two-hybrid experi-ments we found that, of the intracellular I-II loop, the N terminusand the C terminus of Cav2.2, only the I-II loop represents ahigh-affinity interaction site for �1b. However, coexpression ofthe I-II loop with Cav2.2 did not reduce Cav2.2 IBa, again indi-cating that scavenging of � subunits is not responsible for thesuppressive effect of Dom I and Dom I–II. The lack of effect ofthe I-II loop, either to reduce expression or to affect the V50 foractivation is presumably because the � subunit is present inexcess, as also demonstrated in our recent study in Xenopusoocytes, where the maximum effect of �3 on expression occurredat 6 pg of �3 cDNA for 540 pg of Cav2.2 cDNA injected peroocyte (Canti et al., 2001).
Another potential mechanism of suppression would be preven-tion of correct folding of Cav2.2 by the truncated domains, so thatendoplasmic reticulum retention signals are not masked, and themis-folded channel is retained in the endoplasmic reticulum.Although this may be the mechanism of Cav2.2 suppression bythe Dom III–IV construct, where loss of Cav2.2 protein was notobserved (Figs. 2g, 6c), in the case of the truncated constructscontaining domain I, instead of observing an accumulation of theGFP–Cav2.2 signal in the endoplasmic reticulum, we observed analmost complete loss of GFP–Cav2.2 fluorescence (Figs. 2b,d,5a,b).
This points to decreased synthesis or stability of the Cav2.2protein. In experiments to distinguish between these possibilities,we found that inhibition of proteasome activity by lactacystin didnot increase the amount of GFP–Cav2.2 observed in the presenceof Dom I–II, suggesting that the mechanism does not involveenhanced proteolysis, in contrast to the finding with the HERGK� channel mutant (Kagan et al., 2000). From these results, themost likely explanation for suppression by truncated constructscontaining domain I is that synthesis of full-length Cav2.2 isarrested. Furthermore, the intracellular N terminus alone wasineffective, suggesting that suppression may occur by interactionof the nascent transmembrane segments of the first domain ofCav2.2 with Dom I of the truncated construct. Synthesis ofpolytopic proteins passes through a state where up to six nascenttransmembrane �-helices span the endoplasmic reticulum mem-brane, but are not yet integrated in its lipid bilayer, associating viaionic rather than hydrophobic interactions (Borel and Simon,1996). When the initial transmembrane �-helices of Cav2.2 are inthis state, it may be that interference occurs with further synthe-sis of the full-length channel, because of interaction with theDom I and Dom I–II proteins, where, in the absence of all fourtransmembrane domains for assembly, inappropriate residueswould remain exposed. It is possible that this would effectivelyhalt polysomal movement on each Cav2.2 mRNA. The lack ofeffect of the Dom III–IV construct to suppress synthesis of Cav2.2could be attributed to the fact that synthesis and assembly ofCav2.2 is nearer completion before the interaction occurs withtransmembrane segments of Dom III–IV, which then results intrapping in the endoplasmic reticulum. Furthermore, the fact thatthere is a reduction, rather than an increase, in suppression when
Dom I–II and Dom III–IV are together coexpressed with Cav2.2,also points to the exposure of inappropriate residues on the singlyexpressed hemichannels as a mechanism of suppression.
In agreement with the hypothesis that synthesis of Cav2.2 issuppressed, we observed loss of full-length GFP–Cav2.2 protein,when it was coexpressed with either Dom I–II or Dom I. Further-more, no smaller MW partially synthesized or degradation prod-ucts of Cav2.2 were observed. This also points to synthesis arrestat an early stage, rather than enhanced degradation. However,although attenuation of translation is a well established aspect ofthe unfolded protein response that occurs when there is anaccumulation of mis-folded proteins in the endoplasmic reticulum(Chevet et al., 2001), in the present case the synthesis inhibitionwas specific to Cav2.2, because coexpression of Cav2.2 did notappear to reduce the level of Dom I–II, and this may therefore bea novel mechanism. We are currently examining whether theCav2.2 mRNA level is reduced, and if so, whether this is aprimary event, or a consequence of synthesis inhibition.
In conclusion, it is likely that early in the process of synthesis,if Cav2.2 associates with domain I of the truncated constructs inthe endoplasmic reticulum membrane, translation of the full-length Cav2.2 channel is largely prevented. This finding maygeneralize to all normally or pathologically occurring calciumchannel splice variants that form such truncated proteins andrepresent a physiological mechanism for developmental or tissue-specific channel expression.
REFERENCESAhern CA, Arikkath J, Vallejo P, Gurnett CA, Powers PA, Campbell KP,
Coronado R (2001) Intramembrane charge movements andexcitation-contraction coupling expressed by two-domain fragments ofthe Ca 2� channel. Proc Natl Acad Sci USA 98:6935–6940.
Bell DC, Butcher AJ, Berrow NS, Page KM, Brust PF, Nesterova A,Stauderman KA, Seabrook GR, Nurnberg B, Dolphin AC (2001) Bio-physical properties, pharmacology and modulation of human, neuronalL-type (�1D, Cav1.3) voltage-dependent calcium currents. J Neuro-physiol 85:816–828.
Bichet D, Cornet V, Geib S, Carlier E, Volsen S, Hoshi T, Mori Y, DeWaard M (2000) The I-II loop of the Ca 2� channel �1 subunit con-tains an endoplasmic reticulum retention signal antagonized by the �subunit. Neuron 25:177–190.
Birnbaumer L, Campbell KP, Catterall WA, Harpold MM, Hofmann F,Horne WA, Mori Y, Schwartz A, Snutch TP, Tanabe T, Tsien RW(1994) The naming of voltage-gated calcium channels. Neuron13:505–506.
Borel AC, Simon SM (1996) Biogenesis of polytopic membrane pro-teins: membrane segments assemble within translocation channels priorto membrane integration. Cell 85:379–389.
Brice NL, Berrow NS, Campbell V, Page KM, Brickley K, Tedder I,Dolphin AC (1997) Importance of the different � subunits in themembrane expression of the �1A and �2 calcium channel subunits:studies using a depolarisation-sensitive �1A antibody. Eur J Neurosci9:749–759.
Campbell V, Berrow N, Brickley K, Page K, Wade R, Dolphin AC(1995) Voltage-dependent calcium channel �-subunits in combinationwith alpha1 subunits have a GTPase activating effect to promotehydrolysis of GTP by G alphao in rat frontal cortex. FEBS Lett370:135–140.
Canti C, Bogdanov Y, Dolphin AC (2000) Interaction between G pro-teins and accessory � subunits in the regulation of �1B calcium chan-nels in Xenopus oocytes. J Physiol (Lond) 527:419–432.
Canti C, Davies A, Berrow NS, Butcher AJ, Page KM, Dolphin AC(2001) Evidence for two concentration-dependent processes for � sub-unit effects on �1B calcium channels. Biophys J 81:1439–1451.
Catterall WA (2000) Structure and regulation of voltage-gated Ca 2�
channels. Annu Rev Cell Dev Biol 16:521–555.Chevet E, Cameron PH, Pelletier MF, Thomas DY, Bergeron JJM
(2001) The endoplasmic reticulum: integration of protein folding,quality control, signaling and degradation. Curr Opin Struct Biol11:120–124.
Chien AJ, Zhao XL, Shirokov RE, Puri TS, Chang CF, Sun D, Rios E,Hosey MM (1995) Roles of a membrane-localized � subunit in theformation and targeting of functional L-type Ca 2� channels. J BiolChem 270:30036–30044.
Raghib et al. • Cav2.2 Channel Synthesis Suppressed by Truncated Channels J. Neurosci., November 1, 2001, 21(21):8495–8504 8503

Cormack BP, Valdivia RH, Falkow S (1996) FACS-optimized mutantsof the green fluorescent protein (GFP). Gene 173:33–38.
Denier C, Ducros A, Vahedi K, Joutel A, Thierry P, Ritz A, CastelnovoG, Deonna T, Gerard P, Devoize JL, Gayou A, Perrouty B, Soisson T,Autret A, Warter JM, Vighetto A, Van Bogaert P, Alamowitch S,Roullet E, Tournier-Lasserve E (1999) High prevalence ofCACNA1A truncations and broader clinical spectrum in episodicataxia type 2. Neurology 52:1816–1821.
Ertel EA, Campbell KP, Harpold MM, Hofmann F, Mori Y, Perez-ReyesE, Schwartz A, Snutch TP, Tanabe T, Birnbaumer L, Tsien RW,Catterall WA (2000) Nomenclature of voltage-gated calcium channels.Neuron 25:533–535.
Kagan A, Yu Z, Fishman GI, McDonald TV (2000) The dominantnegative LQT2 mutation A561V reduces wild-type HERG expression.J Biol Chem 275:11241–11248.
Malouf NN, McMahon DK, Hainsworth CN, Kay BK (1992) A two-motif isoform of the major calcium channel subunit in skeletal muscle.Neuron 8:899–906.
Meir A, Dolphin AC (1998) Known calcium channel �1 subunits canform low threshold, small conductance channels, with similarities tonative T type channels. Neuron 20:341–351.
Meir A, Bell DC, Stephens GJ, Page KM, Dolphin AC (2000) Calciumchannel � subunit promotes voltage-dependent modulation of �1B byG��. Biophys J 79:731–746.
Mittman S, Agnew WS (2000) Three new alternative spliced exons of thecalcium channel 1B subunit gene CACNA1B. Soc Neurosci Abstr26:40.4
Neher E (1995) Voltage offsets in patch-clamp experiments. In: Single-channel recording (Sakmann B, Neher E, eds), pp 147–153. New York:Plenum.
Okagaki R, Izumi H, Okada T, Nagahora H, Nakajo K, Okamura Y(2001) The maternal transcript for truncated voltage-dependent Ca 2�
channels in the ascidian embryo: a potential suppressive role in Ca 2�
channel expression. Dev Biol 230:258–277.Ophoff RA, Terwindt GM, Vergouwe MN, van Eijk R, Oefner PJ,
Hoffman SM, Lamerdin JE, Mohrenweiser HW, Bulman DE, FerrariM, Haan J, Lindhout D, van Ommen GJ, Hofker MH, Ferrari MD,Frants RR (1996) Familial hemiplegic migraine and episodic ataxiatype-2 are caused by mutations in the Ca 2� channel gene CACNL1A4.Cell 87:543–552.
Patterson GH, Knobel SM, Sharif WD, Kain SR, Piston DW (1997) Useof the green fluorescent protein and its mutants in quantitative fluo-rescence microscopy. Biophys J 73:2782–2790.
Perez-Reyes E, Schneider T (1994) Calcium channels: structure, func-tion, and classification. Drug Dev Res 33:295–318.
Plummer NW, McBurney MW, Meisler MH (1997) Alternative splicingof the sodium channel SCN8A predicts a truncated two-domain proteinin fetal brain and non-neuronal cells. J Biol Chem 272:24008–24015.
Scott VES, Felix R, Arikkath J, Campbell KP (1998) Evidence for a 95kDa short form of the �1A subunit associated with the �-conotoxinMVIIC receptor of the P/Q-type Ca 2� channels. J Neurosci18:641–647.
Stephens GJ, Page KM, Bogdanov Y, Dolphin AC (2000) The �1Bcalcium channel amino terminus contributes determinants for � subunitmediated voltage-dependent inactivation properties. J Physiol (Lond)525:377–390.
Tomlinson WJ, Stea A, Bourinet E, Charnet P, Nargeot J, Snutch TP(1993) Functional properties of a neuronal class C L-type calciumchannel. Neuropharmacology 32:1117–1126.
Tu L, Santarelli V, Deutsch C (1995) Truncated K� channel DNAsequences specifically suppress lymphocyte K� channel gene expres-sion. Biophys J 68:147–156.
Tu LW, Santarelli V, Sheng ZF, Skach W, Pain D, Deutsch C (1996)Voltage-gated K� channels contain multiple intersubunit associationsites. J Biol Chem 271:18904–18911.
Wielowieyski PA, Wigle JT, Salih M, Hum P, Tuana BS (2001) Alter-native Splicing in the Intracellular Loop Connecting Domains II andIII of the �1 Subunit of Cav1.2 Ca 2� Channels Predicts Two-domainPolypeptides with unique C-terminal Tails. J Biol Chem 276:1398–1406.
8504 J. Neurosci., November 1, 2001, 21(21):8495–8504 Raghib et al. • Cav2.2 Channel Synthesis Suppressed by Truncated Channels
Copyright © 2022 FDOKUMEN