Dehydrogenation of n-butane over vanadia catalysts supported on θ-alumina
10
Journal of Catalysis 251 (2007) 59–68 www.elsevier.com/locate/jcat Dehydrogenation of n-butane over vanadia catalysts supported on θ -alumina S. David Jackson ∗ , Sreekala Rugmini WestCHEM, Department of Chemistry, University of Glasgow, Glasgow, G12 8QQ, Scotland, UK Received 27 March 2007; revised 10 July 2007; accepted 13 July 2007 Available online 23 August 2007 Abstract Dehydrogenation of n-butane was studied over three θ -alumina supported catalysts with different loadings of VO x . The catalysts were charac- terised by UV–visible spectroscopy in the as-prepared state and the reduced state. The catalyst with a 1% V loading exhibited a 4+ oxidation state after reduction, whereas the catalysts with 3.5 and 8% V loadings were reduced to a 3+ oxidation state. Oxygen chemisorption gave oxidation state values of 3.8 for the 1% catalyst and 2.6 for the 3.5% catalyst. Both the rate and turnover frequency data confirmed that the sample with the highest proportion of polyvanadate species (3.5V) was the most effective dehydrogenation catalyst. Analysis of the deactivation indicated that butane isomerisation was slow, and deactivation of the isomerisation site was faster than that of the dehydrogenation site. The primary product of butane dehydrogenation was 1-butene, which then isomerised to trans-2-butene. More than three-quarters of the deactivation was due to strongly bound reaction intermediates, which can be removed from the surface at room temperature by treatment in 2% O 2 /Ar. The amount of carbon found on each catalyst after removal of the reaction intermediates was alumina < 1V < 3.5V < 8V. Therefore, the VO x species plays a role in generation of the non-C4 carbonaceous deposits, suggesting either that spillover occurs from the VO x to the support or that some VO x sites catalyse the production of coke but do not catalyse dehydrogenation. © 2007 Elsevier Inc. All rights reserved. Keywords: Dehydrogenation; Butane; Vanadia; Carbon deposition 1. Introduction Catalytic dehydrogenation of light alkanes is a highly impor- tant route for the production of olefins, which are the building blocks of synthetic rubbers, plastics, automotive fuel compo- nents, and other valuable chemical products. Industrial chem- ical processes use chromia- or platinum-based catalysts gen- erally supported on alumina and promoted with alkali metals [1–3]. These processes operate in a cyclical fashion to miti- gate against the severe catalyst deactivation that is observed. The high temperatures required to achieve sensible yields for the dehydrogenation reaction lead to catalyst deactivation by coke deposition [4,5]. Numerous studies on the improvement of existing catalysts and the development of vanadia-based de- hydrogenation catalysts have been reported [6–10]. Alumina- supported vanadia has been extensively studied over the last few years, with the activity and selectivity of vanadia-supported catalysts modified by the structural and physicochemical prop- * Corresponding author. E-mail address: [email protected] (S.D. Jackson). erties of the dispersed species supported on the surface [11–15]. It is generally accepted that supported vanadium oxide can exist as isolated monomeric vanadia species, one- or two- dimensional polyvanadate domains, or bulk V 2 O 5 crystallites. At low vanadium coverage on the support, isolated monovana- dates are the predominant surface species; these condense into polyvanadates and ultimately into bulk V 2 O 5 crystallites as VO x loading increases. It is notable that the structure of dispersed vanadia changes on exposure to water vapour [16–18]. The extent of this ef- fect depends on the nature of the support and has been studied in detail using XANES, Raman, and UV–visible spectroscopic studies [16]. Silica-supported vanadia is highly susceptible to structural changes on exposure to water at room temperature. Water has little effect on VO x /Al 2 O 3 and VO x /TiO 2 structure at room temperature, but at high temperature its effect on the surface structure becomes significant [17]. Further, the redox properties of the vanadia catalysts are important for reactions, and the average oxidation state during catalytic operation de- pends on the relative rates of reduction and reoxidation, as has been discussed previously [12,19–21]. 0021-9517/$ – see front matter © 2007 Elsevier Inc. All rights reserved. doi:10.1016/j.jcat.2007.07.015
-
Upload
independent -
Category
Documents
-
view
0 -
download
0
Transcript of Dehydrogenation of n-butane over vanadia catalysts supported on θ-alumina
Journal of Catalysis 251 (2007) 59–68
www.elsevier.com/locate/jcat
Dehydrogenation of n-butane over vanadia catalysts supported on θ -alumina
S. David Jackson ∗, Sreekala Rugmini
WestCHEM, Department of Chemistry, University of Glasgow, Glasgow, G12 8QQ, Scotland, UK
Received 27 March 2007; revised 10 July 2007; accepted 13 July 2007
Available online 23 August 2007
Abstract
Dehydrogenation of n-butane was studied over three θ -alumina supported catalysts with different loadings of VOx . The catalysts were charac-terised by UV–visible spectroscopy in the as-prepared state and the reduced state. The catalyst with a 1% V loading exhibited a 4+ oxidation stateafter reduction, whereas the catalysts with 3.5 and 8% V loadings were reduced to a 3+ oxidation state. Oxygen chemisorption gave oxidationstate values of 3.8 for the 1% catalyst and 2.6 for the 3.5% catalyst. Both the rate and turnover frequency data confirmed that the sample withthe highest proportion of polyvanadate species (3.5V) was the most effective dehydrogenation catalyst. Analysis of the deactivation indicated thatbutane isomerisation was slow, and deactivation of the isomerisation site was faster than that of the dehydrogenation site. The primary product ofbutane dehydrogenation was 1-butene, which then isomerised to trans-2-butene. More than three-quarters of the deactivation was due to stronglybound reaction intermediates, which can be removed from the surface at room temperature by treatment in 2% O2/Ar. The amount of carbonfound on each catalyst after removal of the reaction intermediates was alumina < 1V < 3.5V < 8V. Therefore, the VOx species plays a rolein generation of the non-C4 carbonaceous deposits, suggesting either that spillover occurs from the VOx to the support or that some VOx sitescatalyse the production of coke but do not catalyse dehydrogenation.© 2007 Elsevier Inc. All rights reserved.
Keywords: Dehydrogenation; Butane; Vanadia; Carbon deposition
1. Introduction
Catalytic dehydrogenation of light alkanes is a highly impor-tant route for the production of olefins, which are the buildingblocks of synthetic rubbers, plastics, automotive fuel compo-nents, and other valuable chemical products. Industrial chem-ical processes use chromia- or platinum-based catalysts gen-erally supported on alumina and promoted with alkali metals[1–3]. These processes operate in a cyclical fashion to miti-gate against the severe catalyst deactivation that is observed.The high temperatures required to achieve sensible yields forthe dehydrogenation reaction lead to catalyst deactivation bycoke deposition [4,5]. Numerous studies on the improvementof existing catalysts and the development of vanadia-based de-hydrogenation catalysts have been reported [6–10]. Alumina-supported vanadia has been extensively studied over the lastfew years, with the activity and selectivity of vanadia-supportedcatalysts modified by the structural and physicochemical prop-
* Corresponding author.E-mail address: [email protected] (S.D. Jackson).
0021-9517/$ – see front matter © 2007 Elsevier Inc. All rights reserved.doi:10.1016/j.jcat.2007.07.015
erties of the dispersed species supported on the surface [11–15].It is generally accepted that supported vanadium oxide canexist as isolated monomeric vanadia species, one- or two-dimensional polyvanadate domains, or bulk V2O5 crystallites.At low vanadium coverage on the support, isolated monovana-dates are the predominant surface species; these condense intopolyvanadates and ultimately into bulk V2O5 crystallites asVOx loading increases.
It is notable that the structure of dispersed vanadia changeson exposure to water vapour [16–18]. The extent of this ef-fect depends on the nature of the support and has been studiedin detail using XANES, Raman, and UV–visible spectroscopicstudies [16]. Silica-supported vanadia is highly susceptible tostructural changes on exposure to water at room temperature.Water has little effect on VOx /Al2O3 and VOx /TiO2 structureat room temperature, but at high temperature its effect on thesurface structure becomes significant [17]. Further, the redoxproperties of the vanadia catalysts are important for reactions,and the average oxidation state during catalytic operation de-pends on the relative rates of reduction and reoxidation, as hasbeen discussed previously [12,19–21].
60 S.D. Jackson, S. Rugmini / Journal of Catalysis 251 (2007) 59–68
A series of vanadia catalysts have been prepared and char-acterised using UV–visible excited Raman spectroscopy [22].Earlier studies on 1 and 3.5% V on alumina showed that iso-lated VOx species are much more effective than polyvana-date species at catalysing carbon deposition during butane de-hydrogenation. It also has been observed that polyvanadatespecies are more effective than isolated vanadia species in de-hydrogenation [23]. Here we report the results of our inves-tigation on θ -alumina-supported vanadia catalysts for the di-rect dehydrogenation of n-butane to butenes and butadiene.Three different vanadia loadings (1, 3.5, and 8% V) on θ -alumina were prepared and characterised using X-ray diffrac-tion (XRD), temperature-programmed reduction (TPR), oxy-gen uptake measurements, and thermal analyses. All three cat-alysts were evaluated, and temperature-programmed oxidation(TPO) was carried out on the coked catalysts to study the natureof the carbon deposit.
2. Experimental
2.1. Catalyst preparation
The catalysts were prepared by incipient wetness impreg-nation with θ -alumina as the support. Before impregnation, thealumina was predried at 353 K overnight. An aqueous NH4VO3(>99%, Aldrich) solution was used to prepare the catalyst witha 1% w/w V loading. Oxalic acid (99%, Aldrich) was added intothe solutions (NH4VO3/oxalic acid = 0.5 molar) for high VOx
loadings (3.5 and 8% V), to ensure dissolution of NH4VO3. Theθ -alumina support (1/20′′ trilobes, surface area = 101 m2 g−1,pore volume = 0.60 ml g−1) was supplied by Johnson Matthey,UK. After impregnation, the samples were mixed thoroughlyusing a rotavap for 2 h at 350 K, dried by purging with air at393 K overnight, and finally calcined at 823 K for 6 h. Thealumina-supported vanadia catalysts with vanadium contentsof 1, 3.5, and 8% are designated 1, 3.5, and 8V, respectively.
2.2. XRD analysis
The crystalline structure of the support and catalysts wasstudied by XRD analysis with a Siemens D 5000 instrumentusing CuKα radiation and operated at 40 kV and 30 mA.
2.3. UV–visible diffuse reflectance spectroscopy
UV–visible spectra were obtained using a Varian Cary 5000Win UV–vis–NIR spectrophotometer equipped with a diffusereflectance attachment (Harrick) with full environmental con-trol. Catalyst reduction was carried in situ using H2 at a flowrate of 10 cm3 min−1.
2.4. Nitrogen adsorption
The surface area of the support and the catalysts were deter-mined from the nitrogen adsorption curve using a Micromerit-ics Gemini III 2375 surface area analyzer after the samples weredegassed at 393 K overnight.
2.5. Thermogravimetric analysis
Thermogravimetric analysis (TGA) of the catalyst precursorand the catalysts was performed using an SDT Q 600 ther-mal analyser coupled to an online mass spectrometer to analyseevolved gases. Temperature-programmed reduction (TPR) wascarried out using the thermal analyser. All measurements wereperformed with a heating rate of 5 deg min−1.
2.6. Oxygen uptake measurements
Oxygen uptake measurements were carried out at room tem-perature and also at 873 K after the catalyst was reduced at873 K using pure H2. After reduction, the catalyst surfacewas purged with He for 30 min, and then pulses of oxygen(∼15 µmol) were introduced at the desired temperature un-til saturation. The amount of oxygen consumed was moni-tored using an online thermal conductivity detector connectedto the effluent of the reactor. The percent uptake is expressedas [O(ads)/M(catalyst)] ×100, assuming an O:M stoichiometryof 1.
2.7. Dehydrogenation activity evaluation
The activity and selectivity of each catalyst were deter-mined using a fixed-bed, continuous-flow reactor. The catalyst(0.25 cm3) was reduced in pure hydrogen (40 cm3 min−1) for1 h at 873 K. The flow was switched to argon, and the systemwas purged for 30 min. Subsequently, n-butane was introducedat a flow rate of 60 cm3 min−1 at 873 K (GHSV = 14,400) andatmospheric pressure. Reaction products were analysed at reg-ular intervals using an online gas chromatograph (Agilent 6890Series-FID, Varian Chrompack capillary column CP7568). Re-generation of the catalysts was carried out using 2% O2/Ar.After a dehydrogenation reaction, the catalyst was purged withargon at 873 K for 0.5 h to remove adsorbed reactant/productsfrom the catalyst surface. The catalyst was then cooled to roomtemperature in a flow of argon, after which the gas flow wasswitched to 2% O2/Ar and the catalyst was heated to 873 K ata programmed heating rate of 10 deg min−1. The temperaturewas maintained at 873 K until regeneration was complete. Thetotal process was monitored by online mass spectrometry.
The conversion and selectivity were calculated (on a car-bon basis) from the reaction products (P ), the total amount ofn-butane fed to the reactor (X), and the amount of butane out(Y ) along with the reaction products:
%conversion = [(X − Y)/X
] × 100,
%selectivity = [P/(X − Y)
] × 100.
The yield of a specific product was obtained by multiplying then-butane conversion by the corresponding selectivity.
2.8. Microanalysis (C and H) of the spent catalysts
An Exeter Analytica CE-440 elemental analyzer was usedto determine %C and %H in the catalysts after evaluation ofdehydrogenation activity.
S.D. Jackson, S. Rugmini / Journal of Catalysis 251 (2007) 59–68 61
3. Results and discussion
The main characteristics of the vanadia catalysts used in thepresent study are given in Table 1. A decrease in BET surfacearea with higher metal loadings was generally observed andcould be related to the blockage of pores by the VOx species.Earlier studies on these catalysts revealed [22,23] that isolatedVOx species dominated at surface densities below 1 V/nm2,polyvanadates coexisted with monovanadates at surface den-sities of 1.2–4.4 V/nm2, and V2O5 formed at a surface den-
Table 1Physicochemical characteristics of the catalysts
Sample Sample description Oxygen uptake Surface area
(m2/g)At 300 K At 873 K
θ -Alumina θ -Alumina – – 1051V 1% V on θ -alumina 11.0 60.0 103.53.5V 3.5% V on θ -alumina 11.0 122.0 93.68V 8% V on θ -alumina 10.2 118.0 76.6
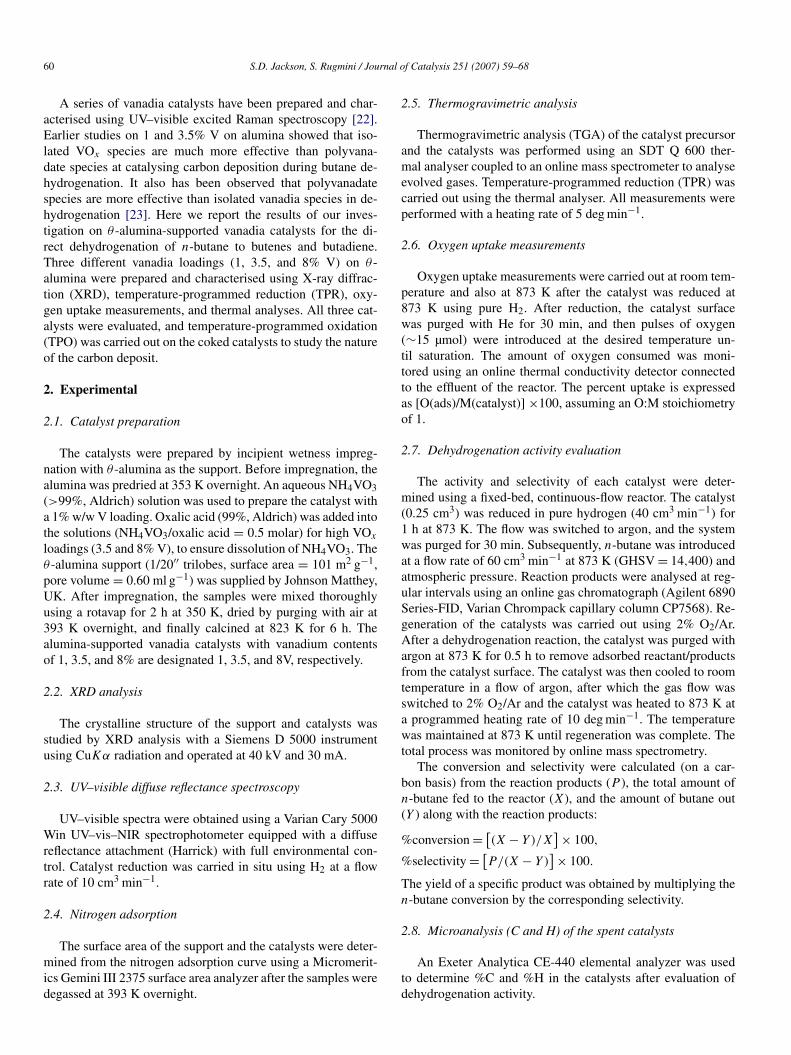
Fig. 1. XRD patterns of θ -alumina and the catalysts.
sity >4.4 V/nm2. The vanadia densities of the catalysts were1.1 V/mn2 for the 1V sample, 3.7 V/nm2 for the 3.5V sam-ple, and 10.4 V/mn2 for the 8V sample. XRD patterns of thesupport and the catalysts are shown in Fig. 1. For lower metalloadings, XRD peak position and intensity were the same as forthe support alumina, indicating (as expected) that the vanadiumoxide species was well dispersed on the surface of the support.However, the XRD pattern for 8V exhibited additional char-acteristic peaks of crystalline V2O5 at 2θ values of 26.3◦ and34.6◦ [12,24].
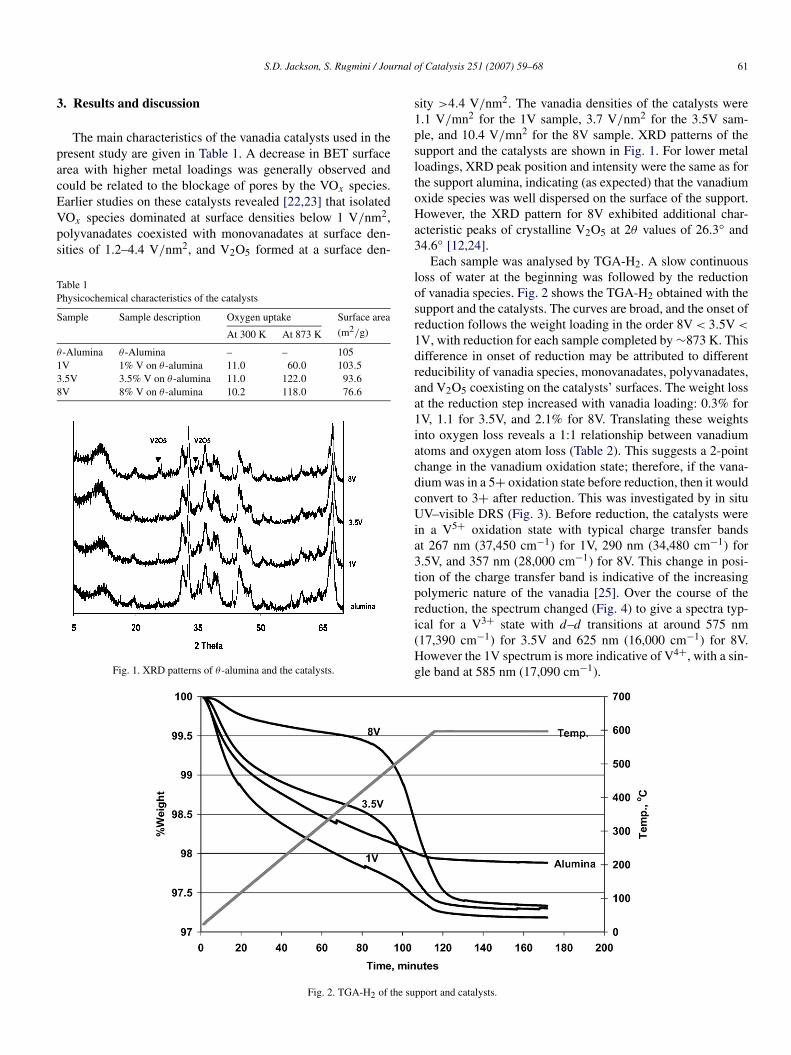
Each sample was analysed by TGA-H2. A slow continuousloss of water at the beginning was followed by the reductionof vanadia species. Fig. 2 shows the TGA-H2 obtained with thesupport and the catalysts. The curves are broad, and the onset ofreduction follows the weight loading in the order 8V < 3.5V <
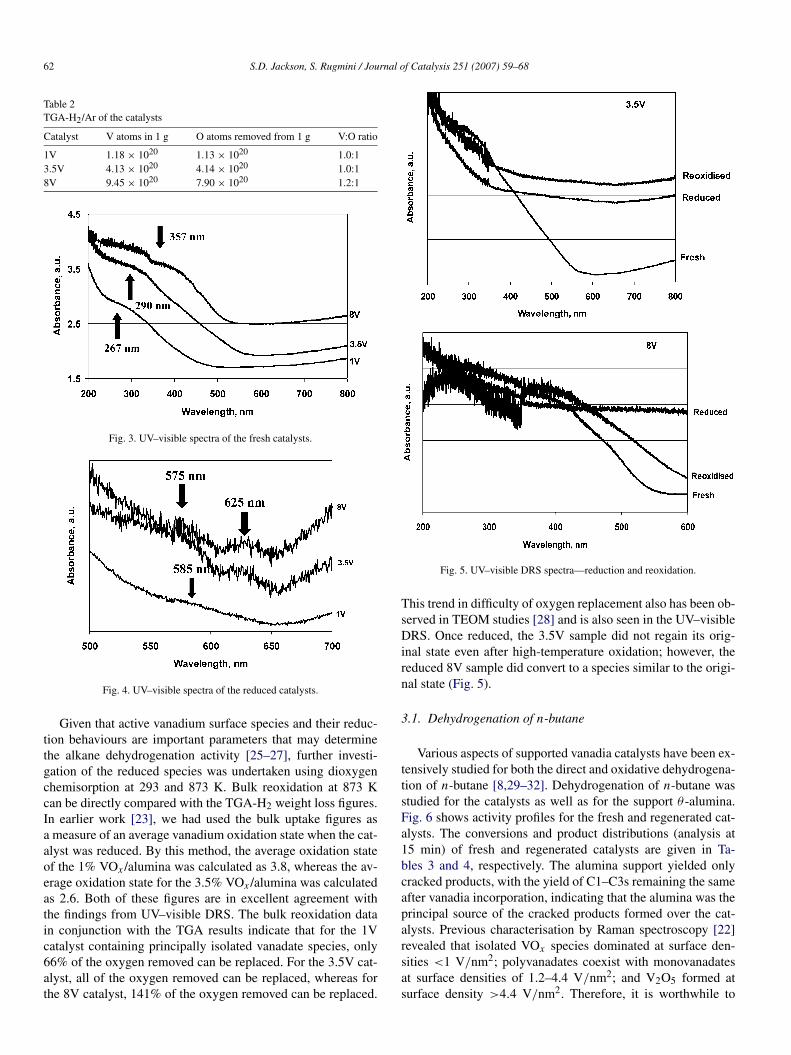
1V, with reduction for each sample completed by ∼873 K. Thisdifference in onset of reduction may be attributed to differentreducibility of vanadia species, monovanadates, polyvanadates,and V2O5 coexisting on the catalysts’ surfaces. The weight lossat the reduction step increased with vanadia loading: 0.3% for1V, 1.1 for 3.5V, and 2.1% for 8V. Translating these weightsinto oxygen loss reveals a 1:1 relationship between vanadiumatoms and oxygen atom loss (Table 2). This suggests a 2-pointchange in the vanadium oxidation state; therefore, if the vana-dium was in a 5+ oxidation state before reduction, then it wouldconvert to 3+ after reduction. This was investigated by in situUV–visible DRS (Fig. 3). Before reduction, the catalysts werein a V5+ oxidation state with typical charge transfer bandsat 267 nm (37,450 cm−1) for 1V, 290 nm (34,480 cm−1) for3.5V, and 357 nm (28,000 cm−1) for 8V. This change in posi-tion of the charge transfer band is indicative of the increasingpolymeric nature of the vanadia [25]. Over the course of thereduction, the spectrum changed (Fig. 4) to give a spectra typ-ical for a V3+ state with d–d transitions at around 575 nm(17,390 cm−1) for 3.5V and 625 nm (16,000 cm−1) for 8V.However the 1V spectrum is more indicative of V4+, with a sin-gle band at 585 nm (17,090 cm−1).
Fig. 2. TGA-H2 of the support and catalysts.
62 S.D. Jackson, S. Rugmini / Journal of Catalysis 251 (2007) 59–68
Table 2TGA-H2/Ar of the catalysts
Catalyst V atoms in 1 g O atoms removed from 1 g V:O ratio
1V 1.18 × 10²⁰ 1.13 × 10²⁰ 1.0:13.5V 4.13 × 10²⁰ 4.14 × 10²⁰ 1.0:18V 9.45 × 10²⁰ 7.90 × 10²⁰ 1.2:1
Fig. 3. UV–visible spectra of the fresh catalysts.
Fig. 4. UV–visible spectra of the reduced catalysts.
Given that active vanadium surface species and their reduc-tion behaviours are important parameters that may determinethe alkane dehydrogenation activity [25–27], further investi-gation of the reduced species was undertaken using dioxygenchemisorption at 293 and 873 K. Bulk reoxidation at 873 Kcan be directly compared with the TGA-H2 weight loss figures.In earlier work [23], we had used the bulk uptake figures asa measure of an average vanadium oxidation state when the cat-alyst was reduced. By this method, the average oxidation stateof the 1% VOx /alumina was calculated as 3.8, whereas the av-erage oxidation state for the 3.5% VOx /alumina was calculatedas 2.6. Both of these figures are in excellent agreement withthe findings from UV–visible DRS. The bulk reoxidation datain conjunction with the TGA results indicate that for the 1Vcatalyst containing principally isolated vanadate species, only66% of the oxygen removed can be replaced. For the 3.5V cat-alyst, all of the oxygen removed can be replaced, whereas forthe 8V catalyst, 141% of the oxygen removed can be replaced.
Fig. 5. UV–visible DRS spectra—reduction and reoxidation.
This trend in difficulty of oxygen replacement also has been ob-served in TEOM studies [28] and is also seen in the UV–visibleDRS. Once reduced, the 3.5V sample did not regain its orig-inal state even after high-temperature oxidation; however, thereduced 8V sample did convert to a species similar to the origi-nal state (Fig. 5).
3.1. Dehydrogenation of n-butane
Various aspects of supported vanadia catalysts have been ex-tensively studied for both the direct and oxidative dehydrogena-tion of n-butane [8,29–32]. Dehydrogenation of n-butane wasstudied for the catalysts as well as for the support θ -alumina.Fig. 6 shows activity profiles for the fresh and regenerated cat-alysts. The conversions and product distributions (analysis at15 min) of fresh and regenerated catalysts are given in Ta-bles 3 and 4, respectively. The alumina support yielded onlycracked products, with the yield of C1–C3s remaining the sameafter vanadia incorporation, indicating that the alumina was theprincipal source of the cracked products formed over the cat-alysts. Previous characterisation by Raman spectroscopy [22]revealed that isolated VOx species dominated at surface den-sities <1 V/nm2; polyvanadates coexist with monovanadatesat surface densities of 1.2–4.4 V/nm2; and V2O5 formed atsurface density >4.4 V/nm2. Therefore, it is worthwhile to
S.D. Jackson, S. Rugmini / Journal of Catalysis 251 (2007) 59–68 63
Fig. 6. n-Butane dehydrogenation: %conversion and yield of products.
Table 3Dehydrogenation of n-butane—%conversion and product distribution. (Fresh catalysts—analysis at 15 min)
Sample %Conv. %Selectivity (yield)
1-Butene Trans-2-butene Cis-2-butene 1,3-Butadiene C1–C3s
θ -Alumina 5.8 0.73 0.60 – – 21.2(0.04) (0.03) (1.2)
1V 6.3 9.03 7.81 6.1 – 16.9(0.6) (0.5) (0.4) (1.07)
3.5V 32.9 20.4 16.9 13.1 5.7 3.4(6.7) (5.6) (4.3) (1.9) (1.1)
8V 17.8 15.9 12.7 9.9 – 5.1(2.8) (2.3) (1.7) (0.9)
Table 4Dehydrogenation of n-butane—%conversion and product distribution. (Regen-erated catalysts—analysis at 15 min)
Sample %Conv. %Selectivity (yield)
1-Butene Trans-2-butene
Cis-2-butene
1,3-Buta-diene
C1–C3s
θ -Alumina 5.8 1.12 0.8 − − 32.7(0.07) (0.05) (1.9)
1V 6.6 9.1 7.7 5.9 − 15.9(0.6) (0.5) (0.4) (1.1)
3.5V 19.1 20.6 16.7 13.0 4.1 6.5(3.9) (3.2) (2.5) (0.8) (1.2)
8V 18.0 19.2 15.5 12.1 − 6.6(3.5) (2.8) (2.2) (1.2)
examine the rate and TOF as functions of vanadium loading(Table 5). TOFs were calculated using the oxygen adsorptiondata at 293 K as measures of surface site density. Both the rate
Table 5Rate of reaction and turn over frequencies with time on stream
TOS(min)
Rate (µmol g−1 s−1) TOF (s−1)
1V 3.5V 8V 1V 3.5V 8V
15 1.1 20.3 5.8 0.051 0.269 0.03730 1.0 5.8 3.7 0.047 0.077 0.02345 1.0 4.7 2.9 0.044 0.063 0.01860 1.0 4.2 2.5 0.044 0.056 0.01675 4.2 2.2 0.056 0.014
105 0.9 3.5 0.041 0.046
and TOF data that the sample with the highest proportion ofpolvanadate species (3.5V) is the most effective dehydrogena-tion catalyst. These results are in keeping with earlier studieson ODH of propane using vanadia catalysts, where the data in-dicated that the monovanadate structure was significantly lessactive than polyvanadates [24]. The V–O–Al species presentin monovanadate structures appear to be more difficult to re-
64 S.D. Jackson, S. Rugmini / Journal of Catalysis 251 (2007) 59–68
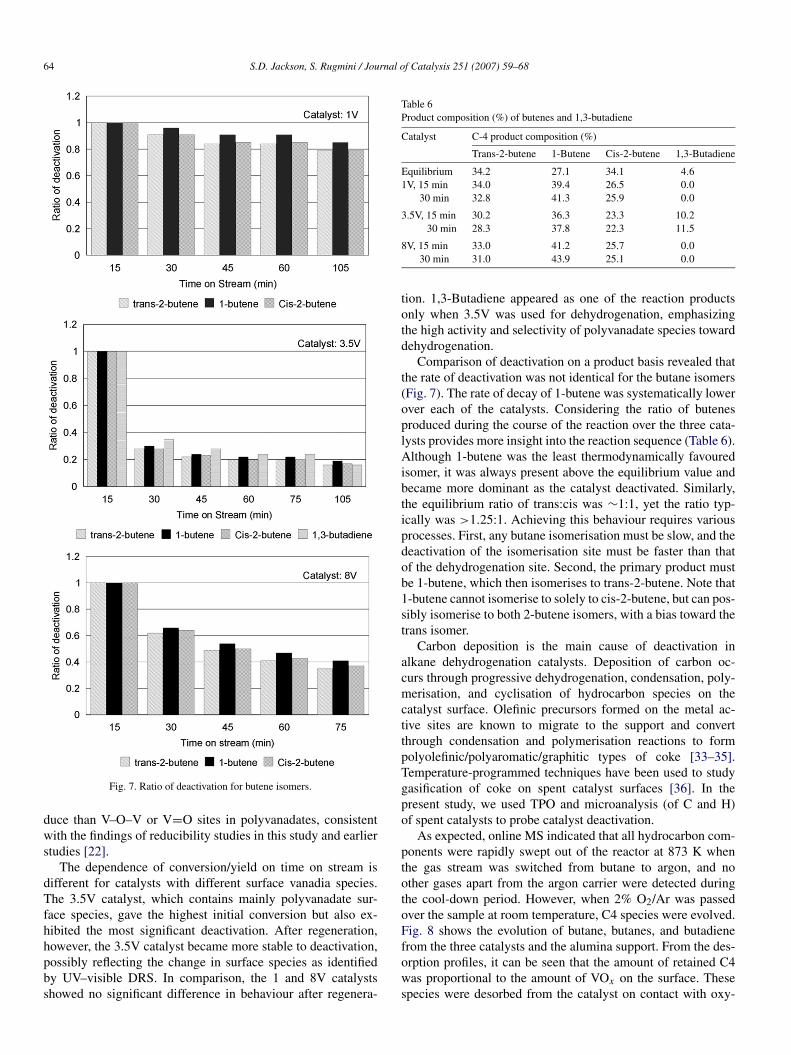
Fig. 7. Ratio of deactivation for butene isomers.
duce than V–O–V or V=O sites in polyvanadates, consistentwith the findings of reducibility studies in this study and earlierstudies [22].
The dependence of conversion/yield on time on stream isdifferent for catalysts with different surface vanadia species.The 3.5V catalyst, which contains mainly polyvanadate sur-face species, gave the highest initial conversion but also ex-hibited the most significant deactivation. After regeneration,however, the 3.5V catalyst became more stable to deactivation,possibly reflecting the change in surface species as identifiedby UV–visible DRS. In comparison, the 1 and 8V catalystsshowed no significant difference in behaviour after regenera-
Table 6Product composition (%) of butenes and 1,3-butadiene
Catalyst C-4 product composition (%)
Trans-2-butene 1-Butene Cis-2-butene 1,3-Butadiene
Equilibrium 34.2 27.1 34.1 4.61V, 15 min 34.0 39.4 26.5 0.0
30 min 32.8 41.3 25.9 0.0
3.5V, 15 min 30.2 36.3 23.3 10.230 min 28.3 37.8 22.3 11.5
8V, 15 min 33.0 41.2 25.7 0.030 min 31.0 43.9 25.1 0.0
tion. 1,3-Butadiene appeared as one of the reaction productsonly when 3.5V was used for dehydrogenation, emphasizingthe high activity and selectivity of polyvanadate species towarddehydrogenation.
Comparison of deactivation on a product basis revealed thatthe rate of deactivation was not identical for the butane isomers(Fig. 7). The rate of decay of 1-butene was systematically lowerover each of the catalysts. Considering the ratio of butenesproduced during the course of the reaction over the three cata-lysts provides more insight into the reaction sequence (Table 6).Although 1-butene was the least thermodynamically favouredisomer, it was always present above the equilibrium value andbecame more dominant as the catalyst deactivated. Similarly,the equilibrium ratio of trans:cis was ∼1:1, yet the ratio typ-ically was >1.25:1. Achieving this behaviour requires variousprocesses. First, any butane isomerisation must be slow, and thedeactivation of the isomerisation site must be faster than thatof the dehydrogenation site. Second, the primary product mustbe 1-butene, which then isomerises to trans-2-butene. Note that1-butene cannot isomerise to solely to cis-2-butene, but can pos-sibly isomerise to both 2-butene isomers, with a bias toward thetrans isomer.
Carbon deposition is the main cause of deactivation inalkane dehydrogenation catalysts. Deposition of carbon oc-curs through progressive dehydrogenation, condensation, poly-merisation, and cyclisation of hydrocarbon species on thecatalyst surface. Olefinic precursors formed on the metal ac-tive sites are known to migrate to the support and convertthrough condensation and polymerisation reactions to formpolyolefinic/polyaromatic/graphitic types of coke [33–35].Temperature-programmed techniques have been used to studygasification of coke on spent catalyst surfaces [36]. In thepresent study, we used TPO and microanalysis (of C and H)of spent catalysts to probe catalyst deactivation.
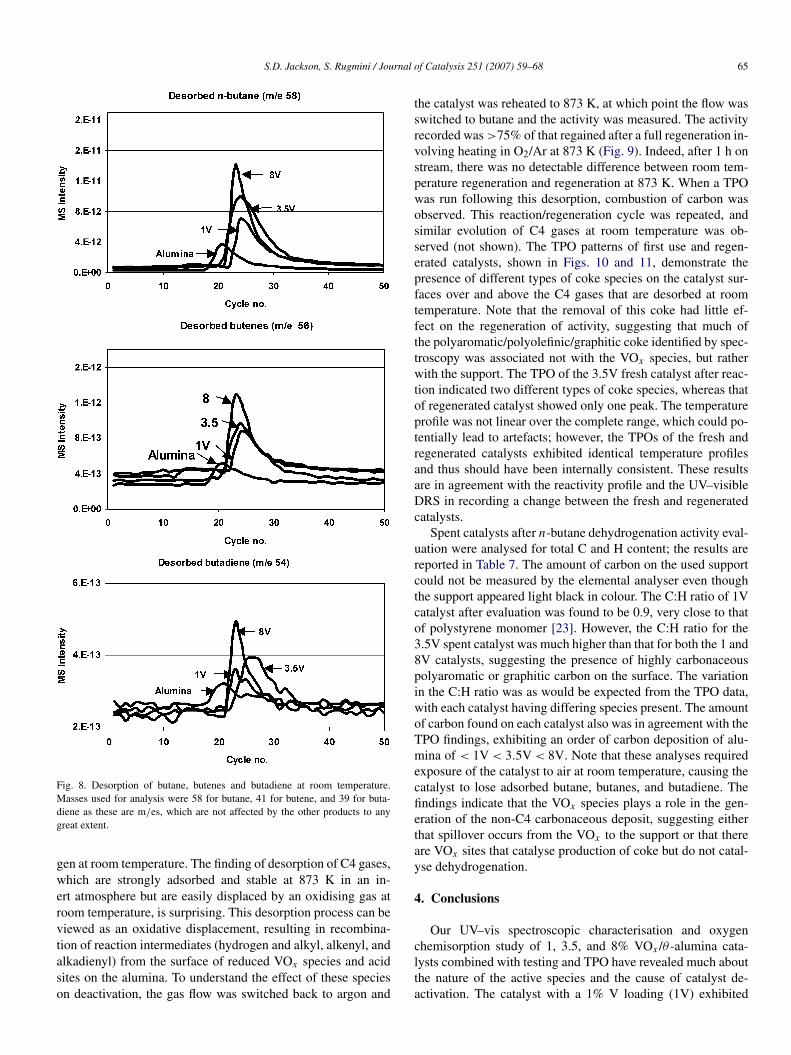
As expected, online MS indicated that all hydrocarbon com-ponents were rapidly swept out of the reactor at 873 K whenthe gas stream was switched from butane to argon, and noother gases apart from the argon carrier were detected duringthe cool-down period. However, when 2% O2/Ar was passedover the sample at room temperature, C4 species were evolved.Fig. 8 shows the evolution of butane, butanes, and butadienefrom the three catalysts and the alumina support. From the des-orption profiles, it can be seen that the amount of retained C4was proportional to the amount of VOx on the surface. Thesespecies were desorbed from the catalyst on contact with oxy-
S.D. Jackson, S. Rugmini / Journal of Catalysis 251 (2007) 59–68 65
Fig. 8. Desorption of butane, butenes and butadiene at room temperature.Masses used for analysis were 58 for butane, 41 for butene, and 39 for buta-diene as these are m/es, which are not affected by the other products to anygreat extent.
gen at room temperature. The finding of desorption of C4 gases,which are strongly adsorbed and stable at 873 K in an in-ert atmosphere but are easily displaced by an oxidising gas atroom temperature, is surprising. This desorption process can beviewed as an oxidative displacement, resulting in recombina-tion of reaction intermediates (hydrogen and alkyl, alkenyl, andalkadienyl) from the surface of reduced VOx species and acidsites on the alumina. To understand the effect of these specieson deactivation, the gas flow was switched back to argon and
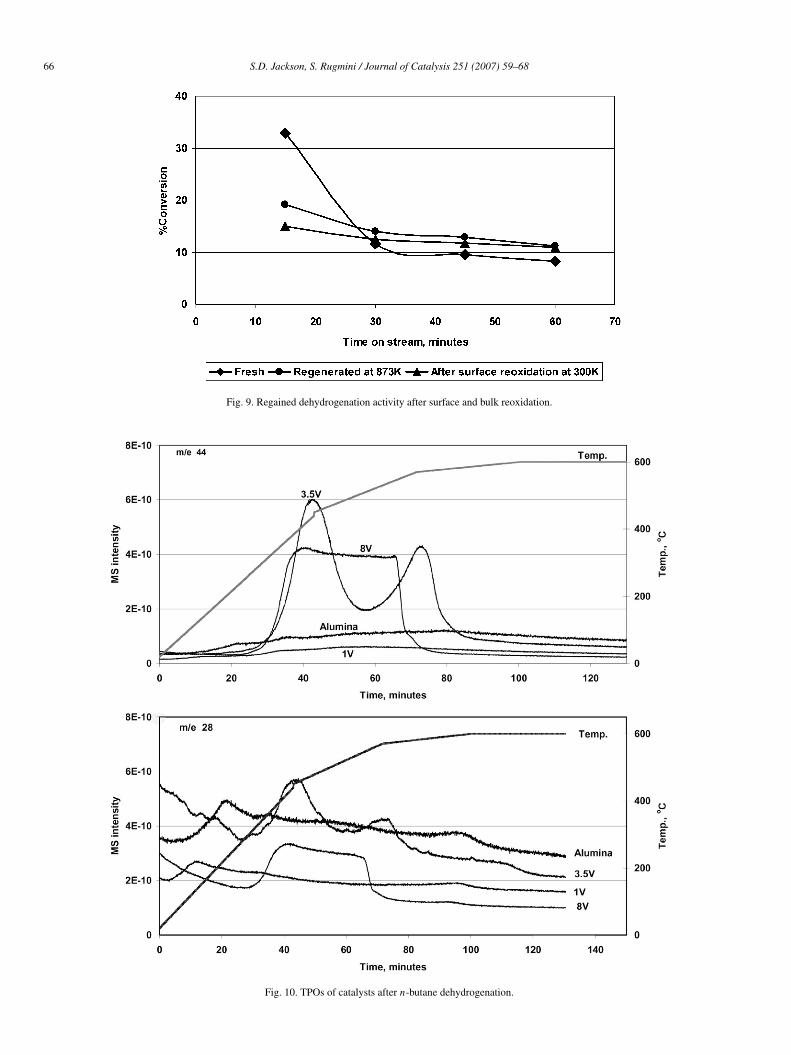
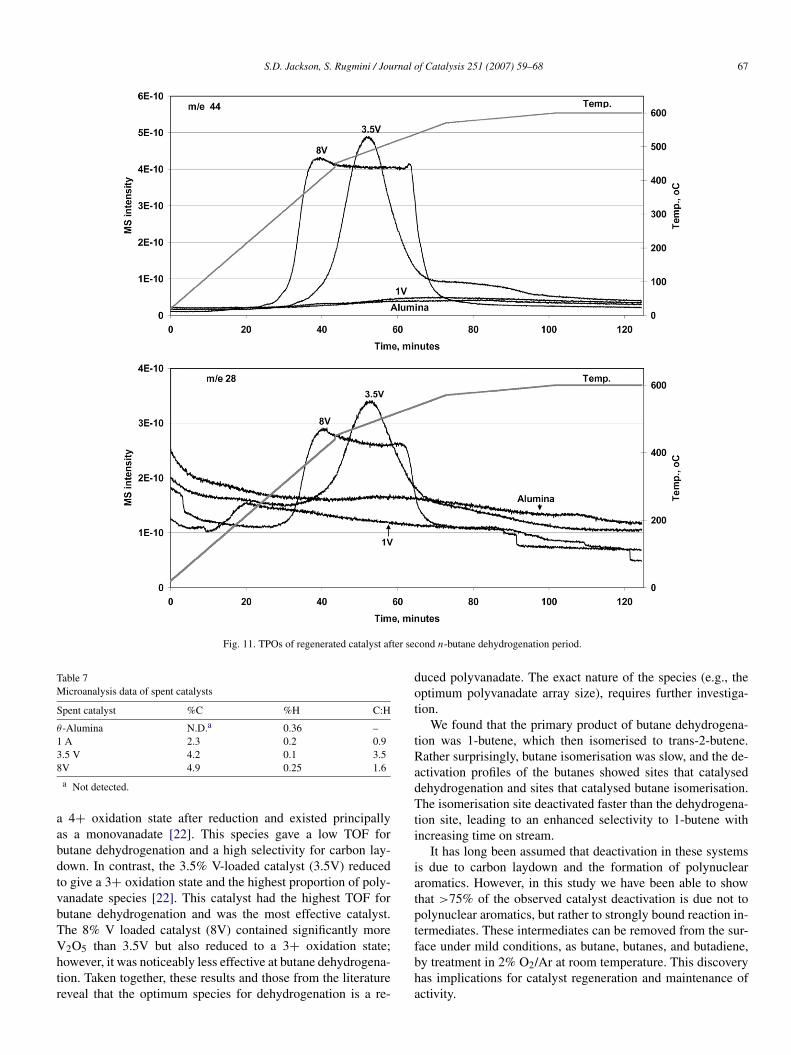
the catalyst was reheated to 873 K, at which point the flow wasswitched to butane and the activity was measured. The activityrecorded was >75% of that regained after a full regeneration in-volving heating in O2/Ar at 873 K (Fig. 9). Indeed, after 1 h onstream, there was no detectable difference between room tem-perature regeneration and regeneration at 873 K. When a TPOwas run following this desorption, combustion of carbon wasobserved. This reaction/regeneration cycle was repeated, andsimilar evolution of C4 gases at room temperature was ob-served (not shown). The TPO patterns of first use and regen-erated catalysts, shown in Figs. 10 and 11, demonstrate thepresence of different types of coke species on the catalyst sur-faces over and above the C4 gases that are desorbed at roomtemperature. Note that the removal of this coke had little ef-fect on the regeneration of activity, suggesting that much ofthe polyaromatic/polyolefinic/graphitic coke identified by spec-troscopy was associated not with the VOx species, but ratherwith the support. The TPO of the 3.5V fresh catalyst after reac-tion indicated two different types of coke species, whereas thatof regenerated catalyst showed only one peak. The temperatureprofile was not linear over the complete range, which could po-tentially lead to artefacts; however, the TPOs of the fresh andregenerated catalysts exhibited identical temperature profilesand thus should have been internally consistent. These resultsare in agreement with the reactivity profile and the UV–visibleDRS in recording a change between the fresh and regeneratedcatalysts.
Spent catalysts after n-butane dehydrogenation activity eval-uation were analysed for total C and H content; the results arereported in Table 7. The amount of carbon on the used supportcould not be measured by the elemental analyser even thoughthe support appeared light black in colour. The C:H ratio of 1Vcatalyst after evaluation was found to be 0.9, very close to thatof polystyrene monomer [23]. However, the C:H ratio for the3.5V spent catalyst was much higher than that for both the 1 and8V catalysts, suggesting the presence of highly carbonaceouspolyaromatic or graphitic carbon on the surface. The variationin the C:H ratio was as would be expected from the TPO data,with each catalyst having differing species present. The amountof carbon found on each catalyst also was in agreement with theTPO findings, exhibiting an order of carbon deposition of alu-mina of < 1V < 3.5V < 8V. Note that these analyses requiredexposure of the catalyst to air at room temperature, causing thecatalyst to lose adsorbed butane, butanes, and butadiene. Thefindings indicate that the VOx species plays a role in the gen-eration of the non-C4 carbonaceous deposit, suggesting eitherthat spillover occurs from the VOx to the support or that thereare VOx sites that catalyse production of coke but do not catal-yse dehydrogenation.
4. Conclusions
Our UV–vis spectroscopic characterisation and oxygenchemisorption study of 1, 3.5, and 8% VOx /θ -alumina cata-lysts combined with testing and TPO have revealed much aboutthe nature of the active species and the cause of catalyst de-activation. The catalyst with a 1% V loading (1V) exhibited
66 S.D. Jackson, S. Rugmini / Journal of Catalysis 251 (2007) 59–68
Fig. 9. Regained dehydrogenation activity after surface and bulk reoxidation.
Fig. 10. TPOs of catalysts after n-butane dehydrogenation.
S.D. Jackson, S. Rugmini / Journal of Catalysis 251 (2007) 59–68 67
Fig. 11. TPOs of regenerated catalyst after second n-butane dehydrogenation period.
Table 7Microanalysis data of spent catalysts
Spent catalyst %C %H C:H
θ -Alumina N.D.a 0.36 –1 A 2.3 0.2 0.93.5 V 4.2 0.1 3.58V 4.9 0.25 1.6
a Not detected.
a 4+ oxidation state after reduction and existed principallyas a monovanadate [22]. This species gave a low TOF forbutane dehydrogenation and a high selectivity for carbon lay-down. In contrast, the 3.5% V-loaded catalyst (3.5V) reducedto give a 3+ oxidation state and the highest proportion of poly-vanadate species [22]. This catalyst had the highest TOF forbutane dehydrogenation and was the most effective catalyst.The 8% V loaded catalyst (8V) contained significantly moreV2O5 than 3.5V but also reduced to a 3+ oxidation state;however, it was noticeably less effective at butane dehydrogena-tion. Taken together, these results and those from the literaturereveal that the optimum species for dehydrogenation is a re-
duced polyvanadate. The exact nature of the species (e.g., theoptimum polyvanadate array size), requires further investiga-tion.
We found that the primary product of butane dehydrogena-tion was 1-butene, which then isomerised to trans-2-butene.Rather surprisingly, butane isomerisation was slow, and the de-activation profiles of the butanes showed sites that catalyseddehydrogenation and sites that catalysed butane isomerisation.The isomerisation site deactivated faster than the dehydrogena-tion site, leading to an enhanced selectivity to 1-butene withincreasing time on stream.
It has long been assumed that deactivation in these systemsis due to carbon laydown and the formation of polynucleararomatics. However, in this study we have been able to showthat >75% of the observed catalyst deactivation is due not topolynuclear aromatics, but rather to strongly bound reaction in-termediates. These intermediates can be removed from the sur-face under mild conditions, as butane, butanes, and butadiene,by treatment in 2% O2/Ar at room temperature. This discoveryhas implications for catalyst regeneration and maintenance ofactivity.
68 S.D. Jackson, S. Rugmini / Journal of Catalysis 251 (2007) 59–68
This is not to say that polynuclear aromatics are not formed.Indeed, TPO and Raman analysis [23] has revealed that polynu-clear aromatics are formed and have differing natures depend-ing on the vanadia species. However, they have little influenceon catalyst deactivation in the early stages. Clearly, pore block-ing by these large entities can be expected to influence thereaction over time. The amount of carbon retained by each cat-alyst after removal of the reaction intermediates was alumina< 1V < 3.5V < 8V, indicating that VOx species also playeda role in the generation of the non-C4 carbonaceous deposit.Our findings also indicate that spillover from the VOx to thesupport occurred and that some VOx sites catalysed coke pro-duction. The possibility of producing polyvanadates that catal-yse dehydrogenation but not carbon laydown is a tantalisingprospect. Minor C1–C3 products were formed over the aluminasupport and were generally independent of vanadia loading,suggesting that they had little effect on formation of the polynu-clear aromatics.
This new understanding of the mechanism of catalyst de-activation has significant implications for catalyst and processdesign. Currently aggressive combustion of retained carbon, inall its forms, is used not only to regenerate the catalyst, but alsoto balance the heat requirements. It is possible to envision a fu-ture catalyst in which no polynuclear aromatics are depositedand any regeneration is subtly done in situ with little heat gen-eration, presenting new challenges to the process engineer.
Acknowledgments
Support was provided by the Engineering and PhysicalSciences Research Council and Johnson Matthey plc underthe ATHENA grant. The authors thank Professor Peter Stair,Dr. Zili Wu, Professor Lynn Gladden, and Dr. James McGregorfor very helpful discussions.
References
[1] T. Hutson Jr., W.C. McCarthy, in: R.A. Meyersn (Ed.), Handbook of Pe-troleum Refining Processes, McGraw–Hill, London, 1986.
[2] P.R. Pujado, B.V. Vora, Hydrocarbon Process. 65 (1990).[3] G.F. Hornaday, F.M. Ferrell, G.A. Mills, Adv. Petrol. Chem. Refining 4
(1961) 451.[4] J.R. Butt, in: J.R. Anderson, M. Boudart (Eds.), Catalysis, Science and
Technology, vol. 6, Springer, Berlin, 1984, p. 16.
[5] G.C. Bond, Appl. Catal. A Gen. 149 (1997) 3.[6] J.M. McNamara, S.D. Jackson, D. Lennon, Catal. Today 81 (2003) 583.[7] S.D. Jackson, P. Leeming, J. Grenfell, J. Catal. 150 (1994) 170.[8] I.E. Wachs, B.M. Weckhuysen, Appl. Catal. A Gen. 157 (1997) 67.[9] J.N.J. van Lingen, O.L.J. Gijzeman, B.M. Weckhuysen, J.H. van Lenthe,
J. Catal. 239 (2006) 34.[10] M.L. Ferreira, M. Volpe, J. Mol. Catal. A Chem. 164 (2000) 281.[11] X. Gao, I.E. Wachs, J. Catal. 192 (2000) 18.[12] J.M. Kanervo, M.E. Harlin, A.O.I. Krause, M.A. Banares, Catal. Today 78
(2003) 171.[13] O.L.J. Gijzeman, J.N.J. van Lingen, J.H. van Lenthe, S.J. Tinnemans, D.E.
Keller, B.M. Weckhuysen, Chem. Phys. Lett. 397 (2004) 277.[14] H.J. Freund, Catal. Today 100 (2005) 3.[15] E.M. Garcia, M.D. Sanchez, G. Tonetto, M.A. Volpe, J. Colloid Interface
Sci. 292 (2005) 179.[16] B. Olthof, A. Khodakov, A.T. Bell, E. Iglesia, J. Phys. Chem. B 104 (2000)
1516.[17] J.M. Jehng, G. Deo, B.M. Weckhuysen, I.E. Wachs, J. Mol. Catal. A 110
(1996) 41.[18] G.T. Went, S.T. Oyama, A.T. Bell, J. Phys. Chem. 94 (1990) 4240.[19] M.M. Koranne, J.G. Goodwin, G. Marcelin, J. Catal. 148 (1994) 369.[20] M.E. Harlin, V.M. Niemi, A.O.I. Krause, B.M. Weckhuysen, J. Catal. 203
(2001) 242.[21] U. Bentrup, A. Martin, G.U. Wolf, Thermochim. Acta 398 (2003) 131.[22] Z. Wu, H.S. Kim, P.C. Stair, S. Rugmini, S.D. Jackson, J. Phys. Chem. B
109 (2005) 2793.[23] S.D. Jackson, S. Rugmini, P.C. Stair, Z. Wu, Chem. Eng. J. 120 (2006)
127.[24] A. Khodakov, B. Olthof, A.T. Bell, E. Iglesia, J. Catal. 181 (1999)
205.[25] F. Arena, F. Frusteri, G. Martra, S. Coluccia, A. Parmaliana, J. Chem. Soc.
Faraday Trans. 93 (1997) 3849.[26] M. Faraldos, J.A. Anderson, M.A. Bañares, J.L.G. Fierro, S.W. Weller,
J. Catal. 168 (1997) 110.[27] M. Faraldos, M.A. Bañares, J.A. Anderson, H. Hu, I.E. Wachs, J.L.G.
Fierro, J. Catal. 160 (1996) 214.[28] J. McGregor, L. Gladden, unpublished work.[29] B.M. Weckhuysen, D.E. Keller, Catal. Today 78 (2003) 25.[30] A. Klisinska, A. Haras, K. Samson, M. Witko, B. Grzybowska, J. Mol.
Catal. A Chem. 210 (2004) 87.[31] A.A. Lemonidou, Appl. Catal. A Gen. 216 (2001) 277.[32] J.M. Lopez Nieto, P. Concepcion, A. Dejoz, H. Knozinger, F. Melo, M.I.
Vazquez, J. Catal. 189 (2000) 147.[33] J.R. Rostrup-Nielsen, in: J.R. Anderson, M. Boudart (Eds.), Catalysis, Sci-
ence and Technology, vol. 5, Springer, Berlin, 1984, chap. 1.[34] J.R. Rostrup-Nielsen, P.E. Hojlund Nielsen, in: J. Oudar, H. Wise (Eds.),
Deactivation and Poisoning of Catalysts, Dekker, New York, 1985,chap. 7.
[35] S.K. Sahoo, P.V.C. Rao, D. Rajeshwer, K.R. Krishnamurthy, I.D. Singh,Appl. Catal. A Gen. 244 (2003) 311.
[36] C.A. Querini, S.C. Fung, Catal. Today 37 (1997) 277.


![The Teaching of [θ] and [ð] Sounds in English - CORE](https://static.fdokumen.com/doc/165x107/6331af3b7f0d9c38da011592/the-teaching-of-and-d-sounds-in-english-core.jpg)

![Prediction of the elastic–plastic behavior of thermoplastic composite laminated plates ([0°/θ°]2) with square hole](https://static.fdokumen.com/doc/165x107/6333426da290d455630a0e97/prediction-of-the-elasticplastic-behavior-of-thermoplastic-composite-laminated.jpg)