Catalytic properties of cobalt and nickel ferrites dispersed in mesoporous silicon oxide for...
10
This journal is c The Royal Society of Chemistry 2011 Catal. Sci. Technol., 2011, 1, 1383–1392 1383 Cite this: Catal. Sci. Technol., 2011, 1, 1383–1392 Catalytic properties of cobalt and nickel ferrites dispersed in mesoporous silicon oxide for ethylbenzene dehydrogenation with CO 2 Tiago Pinheiro Braga, a Ba´rbara Maria Campos Sales, a Antonio Narcisio Pinheiro, a W. T. Herrera, b E. Baggio-Saitovitch b and Antoninho Valentini* a Received 16th May 2011, Accepted 15th August 2011 DOI: 10.1039/c1cy00176k A polymeric precursor method was applied to synthesize catalysts of the general formula MFe 2 O 4 (M = Co and Ni) in order to contribute to studies on ethylbenzene dehydrogenation in the presence of CO 2 . The catalysts were characterized by TG, H 2 -TPR, XRD, Mossbauer spectroscopy (MS), N 2 adsorption/desorption isotherms and TPD-CO 2 . Investigations using XRD and MS revealed that the spinel structures of CoFe 2 O 4 and NiFe 2 O 4 phases were formed. The catalytic results suggested that materials with a spinel structure are particularly interesting for ethylbenzene dehydrogenation. Compared to the other catalysts synthesized the sample containing cobalt ferrite showed higher conversion and good styrene selectivity. The analysis of the spent catalyst (DRX) showed that the CoFe 2 O 4 phase was stable under the reaction conditions and that a coke (TG) deposit was more pronounced for the NiFeSi. 1. Introduction Catalytic ethylbenzene dehydrogenation in the presence of steam (reaction (1)) is a representative process for the produc- tion of styrene, an important monomer for synthetic polymers. 1–4 C 6 H 5 –CH 2 CH 3 (g) " C 6 H 5 –CH Q CH 2 (g) + H 2 (g) (1) The catalysts used in the above process are usually based on iron oxide, which can be further modified by the addition of promoters, such as potassium, chromium, calcium and cerium. 5 Due to relatively fast catalytic deactivation, many research groups have dedicated their efforts to synthesize catalysts with better stability. 6–8 Currently, researchers have studied the use of carbon dioxide (CO 2 ) as a co-feeder gas in ethylbenzene dehydrogen- ization (reaction (2)) with the aim of introducing an alternative route to the steam process. 7–10 C 6 H 5 –CH 2 CH 3 (g) + CO 2 (g) " C 6 H 5 –CH Q CH 2 (g) + CO(g) + H 2 O(g) (2) With this goal in mind, a large amount of catalysts with diverse composition have been tested in ethylbenzene dehydrogenization in the presence of CO 2 . 7–11 Nevertheless, the results observed point to the need for more research to improve catalytic stability and thus to decrease the process cost. Various publications have shown that, for catalysts containing hematite as the active phase, magnetite forms during the dehydrogenation reaction, which subsequently affects the conversion of ethylbenzene to styrene. 4,5,9,12 On the other hand, there are some publications pointing to materials with spinel structures, such as ferrites, as presenting remarkable catalytic activity and stability in this reaction. 13,14 In addition to their attractive redox and acid/base properties, spinel structures are versatile compounds offering structural stability. 15 Therefore, materials of the general type MFe 2 O 4 can be used in heterogeneous catalysis. 15–18 Specifically in the ethylbenzene dehydrogenization reaction, the ferrites of Co and/or Ni may be interesting due to their dehydrogenation ability. Additionally, these ions (Co 2+ or Ni 2+ ) may occupy different positions in the spinel structure, changing the interactions of CO 2 with the catalyst surface and the redox properties of the Fe 3+ , which is the main site for ethylbenzene adsorption. 19 The synthesis of ferrites of Co and Ni with nanometric size has already been described in the literature. 20–22 Nevertheless, in order to apply these materials (ferrites of Co and Ni with nanometric size) in heterogeneous catalysis, it is necessary to avoid the sintering process. In this context, we report the synthesis and characterization of MFe 2 O 4 (M = Ni or Co) compounds embedded in SiO 2 with the purpose of studying their catalytic performance for ethylbenzene dehydrogenation in the presence of carbon dioxide. a Langmuir - Laborato ´rio de Adsorc ¸a ˜o e Cata ´lise, Departamento de Quı´mica Analı´tica e Fı´sico-Quı´mica, Universidade Federal do Ceara ´, Campus do Pici, CEP 60455-970, Fortaleza CE, Brasil. E-mail: [email protected]; Fax: +55 85 3366 9982; Tel: +55 85 3366 9951 b Departamento de Fı´sica Experimental, Centro Brasileiro de Pesquisas em Fı´sica, Rua Dr. Xavier Sigaud 150, CEP 22290-180, Rio de Janeiro RJ, Brasil Catalysis Science & Technology Dynamic Article Links www.rsc.org/catalysis PAPER Downloaded on 20 February 2013 Published on 06 September 2011 on http://pubs.rsc.org | doi:10.1039/C1CY00176K View Article Online / Journal Homepage / Table of Contents for this issue
Transcript of Catalytic properties of cobalt and nickel ferrites dispersed in mesoporous silicon oxide for...
This journal is c The Royal Society of Chemistry 2011 Catal. Sci. Technol., 2011, 1, 1383–1392 1383
Cite this: Catal. Sci. Technol., 2011, 1, 1383–1392
Catalytic properties of cobalt and nickel ferrites dispersed in mesoporous
silicon oxide for ethylbenzene dehydrogenation with CO2
Tiago Pinheiro Braga,aBarbara Maria Campos Sales,
aAntonio Narcisio Pinheiro,
a
W. T. Herrera,bE. Baggio-Saitovitch
band Antoninho Valentini*
a
Received 16th May 2011, Accepted 15th August 2011
DOI: 10.1039/c1cy00176k
A polymeric precursor method was applied to synthesize catalysts of the general formula MFe2O4
(M = Co and Ni) in order to contribute to studies on ethylbenzene dehydrogenation in the
presence of CO2. The catalysts were characterized by TG, H2-TPR, XRD, Mossbauer
spectroscopy (MS), N2 adsorption/desorption isotherms and TPD-CO2. Investigations using XRD
and MS revealed that the spinel structures of CoFe2O4 and NiFe2O4 phases were formed. The
catalytic results suggested that materials with a spinel structure are particularly interesting for
ethylbenzene dehydrogenation. Compared to the other catalysts synthesized the sample containing
cobalt ferrite showed higher conversion and good styrene selectivity. The analysis of the spent
catalyst (DRX) showed that the CoFe2O4 phase was stable under the reaction conditions and that
a coke (TG) deposit was more pronounced for the NiFeSi.
1. Introduction
Catalytic ethylbenzene dehydrogenation in the presence of
steam (reaction (1)) is a representative process for the produc-
tion of styrene, an important monomer for synthetic
polymers.1–4
C6H5–CH2CH3(g) " C6H5–CHQCH2(g) + H2(g) (1)
The catalysts used in the above process are usually based on
iron oxide, which can be further modified by the addition of
promoters, such as potassium, chromium, calcium and
cerium.5 Due to relatively fast catalytic deactivation, many
research groups have dedicated their efforts to synthesize
catalysts with better stability.6–8
Currently, researchers have studied the use of carbon
dioxide (CO2) as a co-feeder gas in ethylbenzene dehydrogen-
ization (reaction (2)) with the aim of introducing an alternative
route to the steam process.7–10
C6H5–CH2CH3(g) + CO2(g)
" C6H5–CHQCH2(g) + CO(g) + H2O(g) (2)
With this goal in mind, a large amount of catalysts with
diverse composition have been tested in ethylbenzene
dehydrogenization in the presence of CO2.7–11 Nevertheless,
the results observed point to the need for more research to
improve catalytic stability and thus to decrease the
process cost.
Various publications have shown that, for catalysts
containing hematite as the active phase, magnetite forms
during the dehydrogenation reaction, which subsequently
affects the conversion of ethylbenzene to styrene.4,5,9,12 On
the other hand, there are some publications pointing to
materials with spinel structures, such as ferrites, as presenting
remarkable catalytic activity and stability in this reaction.13,14
In addition to their attractive redox and acid/base properties,
spinel structures are versatile compounds offering structural
stability.15 Therefore, materials of the general type MFe2O4
can be used in heterogeneous catalysis.15–18 Specifically in the
ethylbenzene dehydrogenization reaction, the ferrites of Co
and/or Ni may be interesting due to their dehydrogenation
ability. Additionally, these ions (Co2+ or Ni2+) may occupy
different positions in the spinel structure, changing the
interactions of CO2 with the catalyst surface and the redox
properties of the Fe3+, which is the main site for ethylbenzene
adsorption.19
The synthesis of ferrites of Co and Ni with nanometric size
has already been described in the literature.20–22 Nevertheless,
in order to apply these materials (ferrites of Co and Ni with
nanometric size) in heterogeneous catalysis, it is necessary to
avoid the sintering process. In this context, we report the
synthesis and characterization of MFe2O4 (M = Ni or Co)
compounds embedded in SiO2 with the purpose of studying
their catalytic performance for ethylbenzene dehydrogenation
in the presence of carbon dioxide.
a Langmuir - Laboratorio de Adsorcao e Catalise, Departamento deQuımica Analıtica e Fısico-Quımica, Universidade Federal do Ceara,Campus do Pici, CEP 60455-970, Fortaleza CE, Brasil.E-mail: [email protected]; Fax: +55 85 3366 9982;Tel: +55 85 3366 9951
bDepartamento de Fısica Experimental, Centro Brasileiro dePesquisas em Fısica, Rua Dr. Xavier Sigaud 150, CEP 22290-180,Rio de Janeiro RJ, Brasil
CatalysisScience & Technology
Dynamic Article Links
www.rsc.org/catalysis PAPER
Dow
nloa
ded
on 2
0 Fe
brua
ry 2
013
Publ
ishe
d on
06
Sept
embe
r 20
11 o
n ht
tp://
pubs
.rsc
.org
| do
i:10.
1039
/C1C
Y00
176K
View Article Online / Journal Homepage / Table of Contents for this issue
1384 Catal. Sci. Technol., 2011, 1, 1383–1392 This journal is c The Royal Society of Chemistry 2011
2. Experimental
2.1. Catalyst preparation
The precursor polymeric method used in this report was based
on the chelation of cations (metals) by citric acid in aqueous
solution.23–25 Nickel nitrate hexahydrate {Ni(NO3)2�6H2O},
cobalt nitrate hexahydrate {Co(NO3)2�6H2O}, iron nitrate
nonahydrate {Fe(NO3)3�9H2O}, tetraethylorthosilicate
(TEOS), citric acid monohydrate (CA){C6H8O7�H2O} and
ethylene glycol (EG) {C2H6O2} were used as starting
materials. A CA/metal ratio of 2 : 1 (mol) was used for all
samples; the metal amount was the sum of Fe3+, Co2+ or
Ni2+ and Si4+, and the mass ratio of CA/EG was kept at 2/3.
The different samples were denoted by the general formula
MFeSi, where M was the transition metal (Co or Ni) used. In
addition, a sample containing only iron oxide and silicon oxide
was prepared and labeled FeSi.
For the synthesis of the CoFeSi sample, 0.0085 mol and
0.017 mol of Co and Fe precursors, respectively, were dissolved
in distilled water at room temperature. CA (0.151 mol) was
dissolved in ethanol at 50 1C followed by the addition of 0.05 mol
of a Si precursor (TEOS) with stirring. Next, the aqueous
solution was added to the CA-TEOS-ethanol solution and stirred
for 15 min at 50 1C. Subsequently, the EG was added and the
mixture was stirred at 100 1C until it became a viscous resin. The
resin was treated at 300 1C for 1 h under air, and the resulting
precursor composite was milled and treated at 700 1C under a
flow of air for 1 h.
2.2. Catalyst characterization
The calcination step was followed by thermogravimetric
analysis (TG) using a 10 1C min�1 heating rate under a flow
of air at 50 ml min�1 for 10 mg of a sample. The crystal
structure of the metal oxides was characterized by X-ray
diffraction analysis (XRD) with a CuKa irradiation source
(l = 1.5418 A, 30 kV and 20 mA). Transmission Mossbauer
spectra were recorded at room temperature and at 4.2 K in
constant acceleration mode with a 57Co (Rh) source. The
Mossbauer data were fitted to discrete Lorentzian functions
using the least-square fitting routine of the NORMOSs
software package. All isomer shift values (d) were quoted
relative to aFe.Specific surface area and pore volume of the catalysts were
determined by N2 adsorption/desorption isotherms at liquid
nitrogen temperature. Before N2 adsorption, the catalyst
sample (40 to 50 mg) was evacuated at 200 1C for 2 h. The
TPR analyses (temperature-programmed reduction) of the
catalysts were carried out in the range of 100–950 1C in a
quartz reactor by passing a 5% H2/N2 flow (30 ml min�1) over
the sample at a heating rate of 10 1C min�1. The H2
consumption was monitored by a thermal conductivity
detector (TCD) connected to the reactor outlet. The CO2
temperature-programmed desorption was carried out in the
range of 40–500 1C under a He flow (10 1C min�1, 30 ml min�1).
The catalysts (200 mg) were preheated under He flow
(30 ml min�1) at 550 1C for 1 h, after which the temperature
was decreased to 60 1C and the He flow was changed to pure
CO2 (30 ml min�1 for 0.5 h). The desorbed CO2 was detected
by an online thermal conductivity detector (TCD) after passing
through a trap (�20 1C) to remove any trace of water.
To assess the amount and the properties of coke deposited,
the spent catalysts were analyzed by thermogravimetric
analysis (TG) using a 10 1C min�1 heating rate under a flow
of air at 50 ml min�1 and Fourier Transform Infrared (FTIR)
in the range of 400 to 4000 cm�1 using KBr pellets containing
1.0 wt% of the sample.
2.3. Catalytic activity
Catalytic tests were carried out in a fixed bed stainless steel
microreactor using 150 mg of a sample at 550 1C and
atmospheric pressure with a CO2 to ethylbenzene molar ratio
of 30. The molar flow rate of ethylbenzene was controlled at
1.446 mmol h�1. Prior to reaction, the catalyst was heated
under a N2 flow (30 ml min�1) up to the reaction temperature,
and the reaction mixture (CO2, ethylbenzene and N2) was then
introduced at a flow rate of 30 ml min�1. The resulting
catalytic ethylbenzene conversion was analyzed by gas
chromatography using an instrument equipped with a FID
and a nonpolar capillary column (30 m � 0.25 mm � 0.25 mm,
similar to AT-1). The ethylbenzene conversion (CEt) was
calculated according to eqn (1), and the styrene selectivity
(SSt) was calculated according to eqn (2).
CEt = (ethylbenzenein� ethylbenzeneout)/ethylbenzenein (1)
SSt = (styreneout)/n(hydrocarbon products) (2)
3. Results and discussion
3.1. Thermal analysis
As in previous publications,23–25 the TG/DTG curves (not
shown) could be divided into two temperature ranges for
weight loss. The first range (40–300 1C) (near 10 wt%) was
related to the evaporation of adsorbed water and any remaining
ethylene glycol. The second stage (300–450 1C) was related to
the decomposition of the residual organic material of the
polymeric chains formed by polyesterification25,26 and
subsequent production of CO2 by the decomposition of
residual organic precursors (near 50 wt%). After that, no
weight loss was detected up to 700 1C, which suggested that
the decomposition of organic material had finished.
Employing organic precursors (CA and EG), which were
removed as volatile compounds during the calcination step in
the preparation of the catalysts, resulted in cavities and the
simultaneous rearrangement of the solid, which might have
been responsible for the morphological properties displayed
by the material (pore diameter and volume).
3.2. X-Ray diffraction
After the calcination process (700 1C under airflow), the
catalyst powders were analyzed by X-ray diffraction (XRD)
to gather information on the solid phase formed (Fig. 1). In
spite of the low crystalline organization, the XRD patterns of
the catalyst CoFeSi suggested the formation of a spinel
structured phase (CoFe2O4, JCPDS 02-1045). Likewise, the
sample NiFeSi also pointed to the spinel structure of nickel
Dow
nloa
ded
on 2
0 Fe
brua
ry 2
013
Publ
ishe
d on
06
Sept
embe
r 20
11 o
n ht
tp://
pubs
.rsc
.org
| do
i:10.
1039
/C1C
Y00
176K
View Article Online

This journal is c The Royal Society of Chemistry 2011 Catal. Sci. Technol., 2011, 1, 1383–1392 1385
ferrite (NiFe2O4, JCPDS 44-1485) in addition to the presence
of nickel oxide (NiO, JCPDS 78-0423). The FeSi sample
showed a hematite pattern (a-Fe2O3, JCPDS 86-2368) and a
maghemite phase (g-Fe2O3, JCPDS 39-1346).
Due to the similarity in the diffraction profile of the nickel
ferrite and cobalt ferrite with the maghemite phase (g-Fe2O3),
the presence of a g-Fe2O3 phase could not be initially ruled out
for CoFeSi and NiFeSi samples.
From the results shown above, it seemed that nickel ferrite
(NiFe2O4) was easier to form than cobalt ferrite (CoFe2O4)
despite the fact that the ionic radii of Fe3+ (0.67 A) were
smaller than the radii of Ni2+ (0.83 A) and closer to
Co2+ (0.68 A). It therefore seemed reasonable to assume that
a replacement of the Fe3+ ions by the Co2+ ions in both the
tetrahedral A and octahedral B sites of the cation sublattices
with the corresponding decrease in the lattice parameters27
would be more favourable than by the larger Ni2+ ions.
To clarify the XRD results, the diagrams were analyzed by
means of the Rietveld refinement procedure28 from which the
crystallographic lattice parameters of the samples were
determined. To achieve this, the DBWS9807 program
described by Young et al.29 was applied. By this method it
was possible to quantify the different phases formed and the
resulting data are listed in Table 1. The crystallite sizes of
the samples were calculated from the XRD patterns using the
Debye–Scherrer formula.30 The calculated results illustrated in
Table 1 indicated that the catalysts were nanometre-sized
crystalline powders and probably with a high number of
crystalline defects.
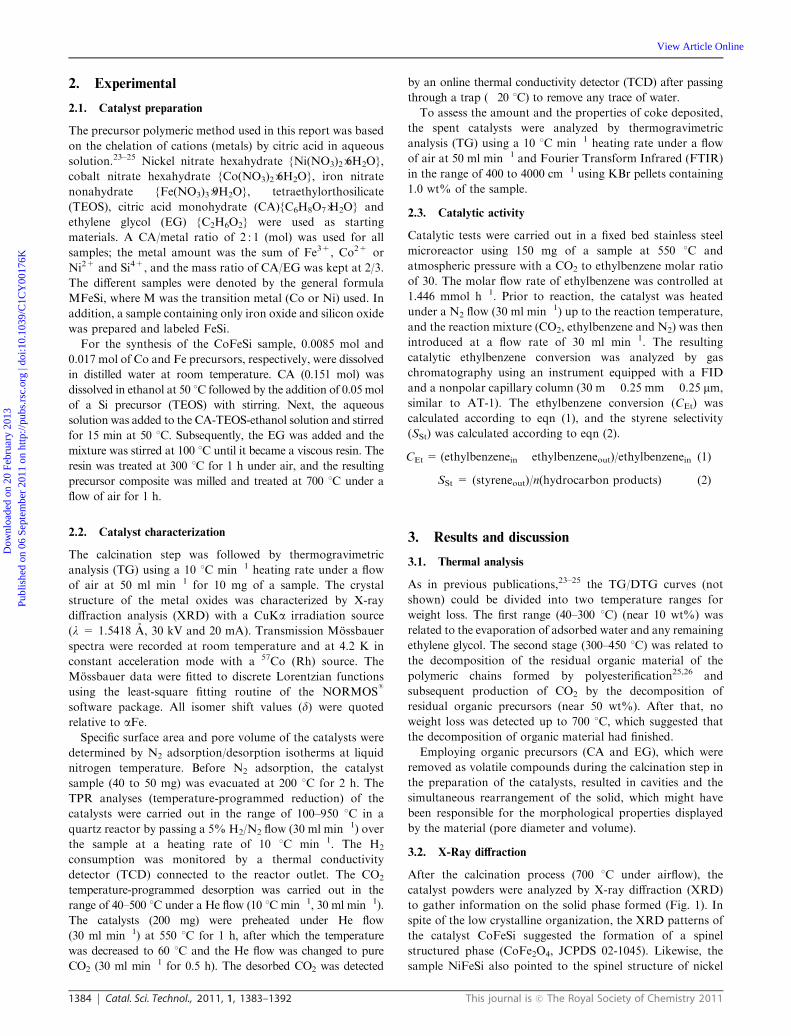
3.3. Mossbauer spectroscopy
As observed in the XRD results, the small size of the particles
synthesized and the slight difference in the lattice parameters
of the maghemita (g-Fe2O3) and ferrite phases (CoFe2O4 and
NiFe2O4) made the XRD insufficient for characterization of
the powders. As shown in Fig. 2a, there were two sextets very
close to one another and a superparamagnetic central doublet
in the Mossbauer spectra of FeSi at room temperature. In
addition, one six-line subspectra with an isomer shift of d =
0.30 mm s�1 relative to aFe, a quadrupole shift of
e = �0.20 mm s�1, and a magnetic hyperfine field Bhf =
51.5 tesla were also observed. This type of pattern is typical of
hematite (a-Fe2O3). The other one six-line subspectra had d =
0.50 mm s�1, a quadrupole shift of e = B0.02 mm s�1, and
Bhf = 50 tesla, which are all characteristics of maghemite.31
Alternatively, the Mossbauer spectrum of the FeSi sample
was also acquired at a low temperature because the influence
of superparamagnetism could be counteracted by reducing the
sample temperature. The superparamagnetic relaxation was
suppressed at 4.2 K (Fig. 2a), but the presence of different iron
environments in the sample was evidenced by two six-line
subspectra. This result corroborated with XRD observations on
the presence of hematite and maghemite phases in the samples.
Similarly, as shown in Fig. 2b and c, the room temperature
Mossbauer spectra of the CoFeSi and NiFeSi samples
exhibited the superposition of a magnetic split sextet pattern
and a superparamagnetic doublet. The Mossbauer spectrum at
4.2 K for the sample CoFeSi was fitted with four subspectra.
Two six-line subspectra with isomer shifts of d = 0.25 and
0.38 mm s�1 (relative to aFe), quadrupole shifts of e = 0.02
and �0.08 mm s�1, and magnetic hyperfine fields of Bhf =
50.3 and 52.3 tesla were attributed to cobalt ferrite. These
hyperfine parameters corresponded to a distribution of Fe in
site A (tetrahedral) and site B (octahedral). Nevertheless, a
broad sextet with Bhf = 30–49 tesla was also observed, which
was probably due to cobalt ferrite with an extremely small
particle size. The broad sextet is typical for Fe particles in the
magnetic relaxation regime. Moreover, at 4.2 K, great deals of
magnetic moments were blocked, as evidenced by the appearance
of a broad and asymmetric magnetic sextet.32 In Fig. 2b
(at 4.2 K), we see that 90% of particles were blocked and
the remaining central doublet (10%) suggested that there were
very small superparamagnetic particles (less than 4 nm). These
results were in agreement with the mean diameter for a CoFeSi
sample (4 nm), as estimated by XRD analysis (Table 1).
The Mossbauer spectrum at 4.2 K for the NiFeSi sample
was fitted with three magnetic subspectra. The hyperfine field
values for sites A (tetrahedral) and B (octahedral) were 49.6
and 52.8 tesla, respectively. The corresponding isomer shift
values were 0.31 and 0.40 mm s�1 relative to aFe. In addition,
one broad sextet with Bhf = 30–51 tesla was observed, which
was probably due to nickel ferrite with a very small particle
size. In addition, the decrease of the magnetic hyperfine field
from the bulk value could be attributed to the very small
particle size.33 In the spectra of NiFeSi (Fig. 2c, 4.2 K), unlike
CoFeSi (Fig. 2b, 4.2 K), we saw that 100% of the particles
were blocked, suggesting that the size of the nanoparticles was
larger than 4 nm of diameter. Thus, the Mossbauer results
Fig. 1 X-Ray diffraction profile of the catalysts after the calcination
process.
Table 1 Relative mass percentage and grain size of the phasesobserved
Crystallinephase
Sample
CoFeSi NiFeSi FeSi
Massa
(%) Gs/nmMassa
(%) Gs/nmMassa
(%) Gs/nm
NiFe2O4 86.2 11.4CoFe2O4 100.0 4.5a-Fe2O3 88.5 13.2g-Fe3O4 11.5 4.1NiO 13.8 15.7
a Mass of crystalline phase (wt%). Gs = grain size (nm).
Dow
nloa
ded
on 2
0 Fe
brua
ry 2
013
Publ
ishe
d on
06
Sept
embe
r 20
11 o
n ht
tp://
pubs
.rsc
.org
| do
i:10.
1039
/C1C
Y00
176K
View Article Online
1386 Catal. Sci. Technol., 2011, 1, 1383–1392 This journal is c The Royal Society of Chemistry 2011
were in agreement with the X-ray diffraction patterns, which
suggested a particle diameter of 11.4 nm (Table 1).
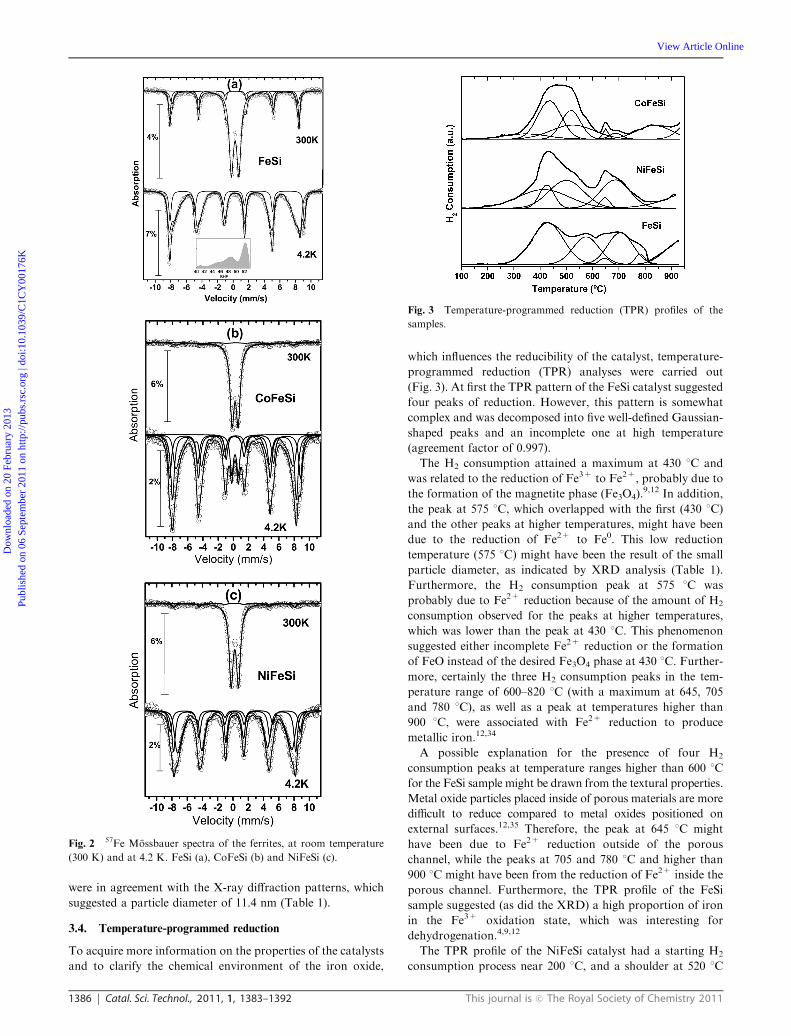
3.4. Temperature-programmed reduction
To acquire more information on the properties of the catalysts
and to clarify the chemical environment of the iron oxide,
which influences the reducibility of the catalyst, temperature-
programmed reduction (TPR) analyses were carried out
(Fig. 3). At first the TPR pattern of the FeSi catalyst suggested
four peaks of reduction. However, this pattern is somewhat
complex and was decomposed into five well-defined Gaussian-
shaped peaks and an incomplete one at high temperature
(agreement factor of 0.997).
The H2 consumption attained a maximum at 430 1C and
was related to the reduction of Fe3+ to Fe2+, probably due to
the formation of the magnetite phase (Fe3O4).9,12 In addition,
the peak at 575 1C, which overlapped with the first (430 1C)
and the other peaks at higher temperatures, might have been
due to the reduction of Fe2+ to Fe0. This low reduction
temperature (575 1C) might have been the result of the small
particle diameter, as indicated by XRD analysis (Table 1).
Furthermore, the H2 consumption peak at 575 1C was
probably due to Fe2+ reduction because of the amount of H2
consumption observed for the peaks at higher temperatures,
which was lower than the peak at 430 1C. This phenomenon
suggested either incomplete Fe2+ reduction or the formation
of FeO instead of the desired Fe3O4 phase at 430 1C. Further-
more, certainly the three H2 consumption peaks in the tem-
perature range of 600–820 1C (with a maximum at 645, 705
and 780 1C), as well as a peak at temperatures higher than
900 1C, were associated with Fe2+ reduction to produce
metallic iron.12,34
A possible explanation for the presence of four H2
consumption peaks at temperature ranges higher than 600 1C
for the FeSi sample might be drawn from the textural properties.
Metal oxide particles placed inside of porous materials are more
difficult to reduce compared to metal oxides positioned on
external surfaces.12,35 Therefore, the peak at 645 1C might
have been due to Fe2+ reduction outside of the porous
channel, while the peaks at 705 and 780 1C and higher than
900 1C might have been from the reduction of Fe2+ inside the
porous channel. Furthermore, the TPR profile of the FeSi
sample suggested (as did the XRD) a high proportion of iron
in the Fe3+ oxidation state, which was interesting for
dehydrogenation.4,9,12
The TPR profile of the NiFeSi catalyst had a starting H2
consumption process near 200 1C, and a shoulder at 520 1C
Fig. 2 57Fe Mossbauer spectra of the ferrites, at room temperature
(300 K) and at 4.2 K. FeSi (a), CoFeSi (b) and NiFeSi (c).
Fig. 3 Temperature-programmed reduction (TPR) profiles of the
samples.
Dow
nloa
ded
on 2
0 Fe
brua
ry 2
013
Publ
ishe
d on
06
Sept
embe
r 20
11 o
n ht
tp://
pubs
.rsc
.org
| do
i:10.
1039
/C1C
Y00
176K
View Article Online
This journal is c The Royal Society of Chemistry 2011 Catal. Sci. Technol., 2011, 1, 1383–1392 1387
was clearly observed. The pattern was decomposed into five
well-defined Gaussian-shaped peaks and an incomplete one at
high temperature (agreement factor of 0.998). The peak at
414 1C could be attributed to the Ni2+ and Fe3+ (to Fe2+)
reduction processes. Similar to the FeSi sample, the peak at
426 1C could be attributed to the reduction of Fe3+ to Fe2+.
The Ni2+ reduction in a temperature range was typical for a
nickel oxide phase dispersed in SiO2,36 which was determined
to be present by XRD analysis (Fig. 1). Nevertheless, the
peak at 500 1C could be attributed to the reduction of Ni2+
in the spinel phase, which had an intense interaction with
the iron oxide and might have been localized in octahedral
or tetrahedral positions. The peaks at temperatures
higher than 600 1C were assumed to be the result of Fe2+
reduction.
The TPR profile of the CoFeSi catalyst presented a poorly
defined pattern, but it was successfully decomposed into seven
well-defined Gaussian-shaped peaks and an incomplete one at
high temperature (agreement factor of 0.998). The weak peak
at 345 1C was associated to the reduction of the Co3O4 phase
(Co3+ to Co2+). The low H2 consumption observed corrobo-
rated with the XRD analysis, which did not indicate the
presence of this phase. The presence of this phase might have
been missed, however, due to a smaller proportion. The peak
at 436 1C was attributed mainly to the reduction of Fe3+ (to
Fe2+). Similar to the NiFeSi sample, the peaks at 518 1C and
at 524 1C could be also attributed to the reduction of Fe3+ to
Fe2+ and the reduction of Co2+ to Co0, both in the spinel
phase and possibly localized in octahedral or tetrahedral
positions. The peaks for temperatures higher than 600 1C
might have been due to Fe2+ reduction influenced by the
cobalt presence and/or textural properties.
Different from the NiFeSi sample the CoFeSi catalyst
showed low H2 consumption peaks in the temperature range
of 600 1C to 700 1C. In addition, it is observed a well defined
H2 consumption peak at 840 1C, which may be due to the
CoFe2O4 phase reduction.
The H2 consumption peaks that appeared at temperatures
higher than 600 1C were particularly interesting for ethylben-
zene dehydrogenation because they provided evidence that the
reaction temperature (550 1C) did not completely reduce the
transitions metals.
Assuming that the iron oxide species (Fe3+) was the
main active site for ethylbenzene dehydrogenation,6 the
TPR profiles suggested that the addition of nickel additives
could not delay the deactivation process during the
catalytic test. However, and at the same level of importance,
the TPR patterns pointed to a mixture of different oxide
phases, as did XRD and Mossbauer analysis. In addition
to the low particle diameter (Table 1), this heterogeneity of
phases in the catalyst composition suggested that these
samples might present a significant number of defects in
the surface, an interesting phenomenon for the catalytic
process.
On the other hand, the H2 consumption profile in a
temperature range higher than 600 1C for the CoFeSi sample
suggests that cobalt addition could delay the catalyst
deactivation due to a reduction process during the catalytic
test carried out at 550 1C.
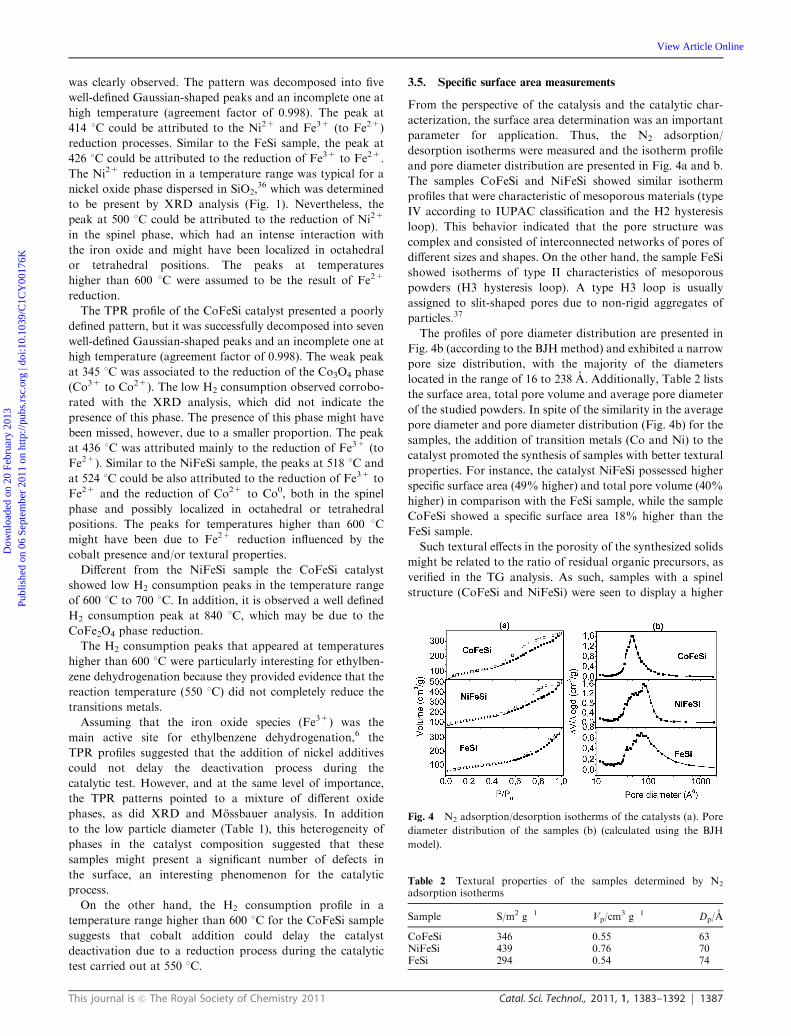
3.5. Specific surface area measurements
From the perspective of the catalysis and the catalytic char-
acterization, the surface area determination was an important
parameter for application. Thus, the N2 adsorption/
desorption isotherms were measured and the isotherm profile
and pore diameter distribution are presented in Fig. 4a and b.
The samples CoFeSi and NiFeSi showed similar isotherm
profiles that were characteristic of mesoporous materials (type
IV according to IUPAC classification and the H2 hysteresis
loop). This behavior indicated that the pore structure was
complex and consisted of interconnected networks of pores of
different sizes and shapes. On the other hand, the sample FeSi
showed isotherms of type II characteristics of mesoporous
powders (H3 hysteresis loop). A type H3 loop is usually
assigned to slit-shaped pores due to non-rigid aggregates of
particles.37
The profiles of pore diameter distribution are presented in
Fig. 4b (according to the BJH method) and exhibited a narrow
pore size distribution, with the majority of the diameters
located in the range of 16 to 238 A. Additionally, Table 2 lists
the surface area, total pore volume and average pore diameter
of the studied powders. In spite of the similarity in the average
pore diameter and pore diameter distribution (Fig. 4b) for the
samples, the addition of transition metals (Co and Ni) to the
catalyst promoted the synthesis of samples with better textural
properties. For instance, the catalyst NiFeSi possessed higher
specific surface area (49% higher) and total pore volume (40%
higher) in comparison with the FeSi sample, while the sample
CoFeSi showed a specific surface area 18% higher than the
FeSi sample.
Such textural effects in the porosity of the synthesized solids
might be related to the ratio of residual organic precursors, as
verified in the TG analysis. As such, samples with a spinel
structure (CoFeSi and NiFeSi) were seen to display a higher
Fig. 4 N2 adsorption/desorption isotherms of the catalysts (a). Pore
diameter distribution of the samples (b) (calculated using the BJH
model).
Table 2 Textural properties of the samples determined by N2
adsorption isotherms
Sample S/m2 g�1 Vp/cm3 g�1 Dp/A
CoFeSi 346 0.55 63NiFeSi 439 0.76 70FeSi 294 0.54 74
Dow
nloa
ded
on 2
0 Fe
brua
ry 2
013
Publ
ishe
d on
06
Sept
embe
r 20
11 o
n ht
tp://
pubs
.rsc
.org
| do
i:10.
1039
/C1C
Y00
176K
View Article Online
1388 Catal. Sci. Technol., 2011, 1, 1383–1392 This journal is c The Royal Society of Chemistry 2011
ratio of residual organic substances. After calcination, this can
result in differences in the characteristics of the pores, which
are perceptible in the values for the surface area, pore volume,
pore diameter and changes in the hysteresis behaviour.
3.6. Temperature-programmed desorption
It is accepted that the basic sites play an important role in
ethylbenzene dehydrogenation.19 Therefore, it was interesting
to determine the effect of nickel and cobalt addition on the
basicity of the catalyst samples. To verify the relative basicity,
temperature-programmed desorption of CO2 (TPD-CO2)
experiments was carried out (Fig. 5). The data in Fig. 5 are
in arbitrary units, and the intensity of the deflection was not
quantified with regard to the number of moles of CO2. Never-
theless, the experimental conditions were rigorously the same
for all samples, and thus it was possible to compare the areas
of the TPD profiles.
The TPD patterns of NiFeSi and FeSi samples showed one
peak for CO2 desorption, while the catalyst CoFeSi presented
two peaks for desorption. The maximum desorption peak for
NiFeSi was observed around 90 1C, whereas the maximum for
FeSi was around 118 1C. On the other hand, the desorption
curves corresponding to the CoFeSi sample were around
97 and 368 1C, respectively. The patterns of TPD-CO2 were
decomposed for all samples into two or three well-defined
Gaussian-shaped peaks. Therefore, different types of basic
sites (or CO2 to metal oxides interactions) might be
distinguished.
The first CO2 desorption temperature range (53–200 1C) was
attributed to weak basicity. However, the second CO2
desorption temperature range (337–420 1C) was typical of a
medium basicity. Thus, the peak of CO2 desorption at 370 1C
suggested that the CoFeSi sample had a higher basic site
strength. Consequently, it was expected that the CoFeSi would
have the highest ethylbenzene conversion, followed by FeSi
and then NiFeSi. Considering the amount of CO2 desorbed
from the sample (the total areas of the TPD profiles), the
number of basic sites followed the order: FeSi > CoFeSi >
NiFeSi. NiFeSi stood out as a solid with relatively low
basicity, while FeSi had a large amount of basic sites.
In general, basic catalysts can improve the adsorption of
acidic CO2 to supply the surface with oxygen, suppressing the
deposition of coke.38 Additionally, the number and strength of
the basic sites of the catalyst had an effect on the catalytic
performance.39 Several research papers12,40 have shown that
the catalytic activity for ethylbenzene dehydrogenization is
increased with improved CO2 adsorption ability.
3.7. Catalytic performance
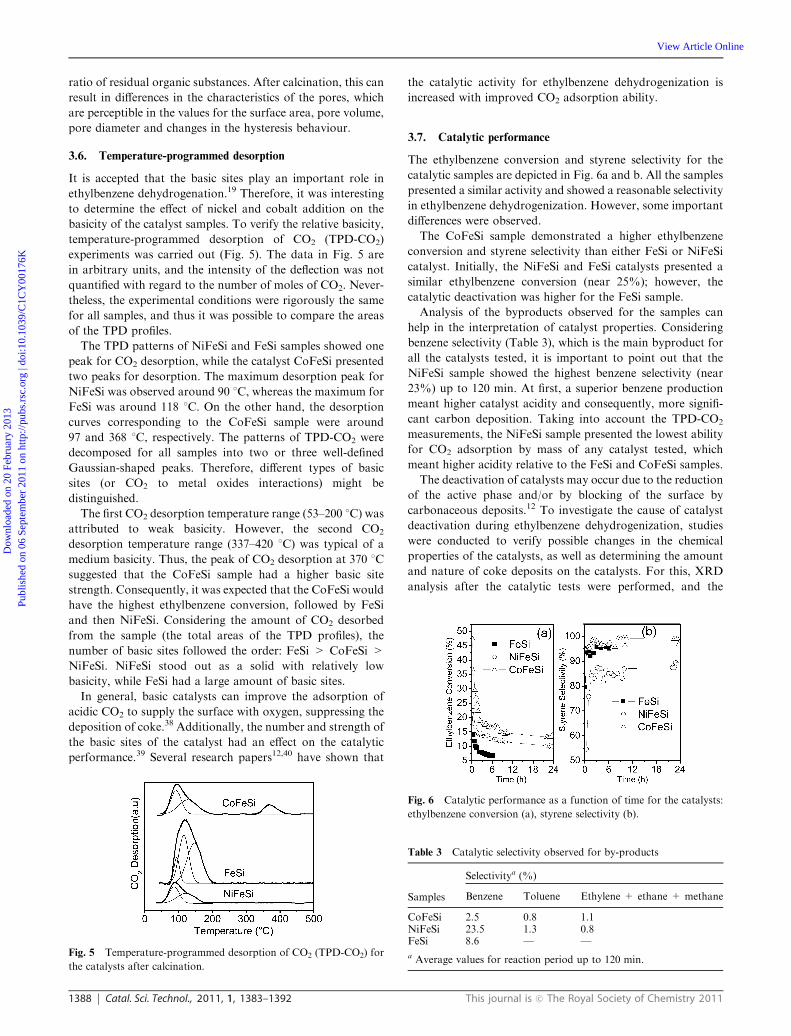
The ethylbenzene conversion and styrene selectivity for the
catalytic samples are depicted in Fig. 6a and b. All the samples
presented a similar activity and showed a reasonable selectivity
in ethylbenzene dehydrogenization. However, some important
differences were observed.
The CoFeSi sample demonstrated a higher ethylbenzene
conversion and styrene selectivity than either FeSi or NiFeSi
catalyst. Initially, the NiFeSi and FeSi catalysts presented a
similar ethylbenzene conversion (near 25%); however, the
catalytic deactivation was higher for the FeSi sample.
Analysis of the byproducts observed for the samples can
help in the interpretation of catalyst properties. Considering
benzene selectivity (Table 3), which is the main byproduct for
all the catalysts tested, it is important to point out that the
NiFeSi sample showed the highest benzene selectivity (near
23%) up to 120 min. At first, a superior benzene production
meant higher catalyst acidity and consequently, more signifi-
cant carbon deposition. Taking into account the TPD-CO2
measurements, the NiFeSi sample presented the lowest ability
for CO2 adsorption by mass of any catalyst tested, which
meant higher acidity relative to the FeSi and CoFeSi samples.
The deactivation of catalysts may occur due to the reduction
of the active phase and/or by blocking of the surface by
carbonaceous deposits.12 To investigate the cause of catalyst
deactivation during ethylbenzene dehydrogenization, studies
were conducted to verify possible changes in the chemical
properties of the catalysts, as well as determining the amount
and nature of coke deposits on the catalysts. For this, XRD
analysis after the catalytic tests were performed, and the
Fig. 5 Temperature-programmed desorption of CO2 (TPD-CO2) for
the catalysts after calcination.
Fig. 6 Catalytic performance as a function of time for the catalysts:
ethylbenzene conversion (a), styrene selectivity (b).
Table 3 Catalytic selectivity observed for by-products
Samples
Selectivitya (%)
Benzene Toluene Ethylene + ethane + methane
CoFeSi 2.5 0.8 1.1NiFeSi 23.5 1.3 0.8FeSi 8.6 — —
a Average values for reaction period up to 120 min.
Dow
nloa
ded
on 2
0 Fe
brua
ry 2
013
Publ
ishe
d on
06
Sept
embe
r 20
11 o
n ht
tp://
pubs
.rsc
.org
| do
i:10.
1039
/C1C
Y00
176K
View Article Online
This journal is c The Royal Society of Chemistry 2011 Catal. Sci. Technol., 2011, 1, 1383–1392 1389
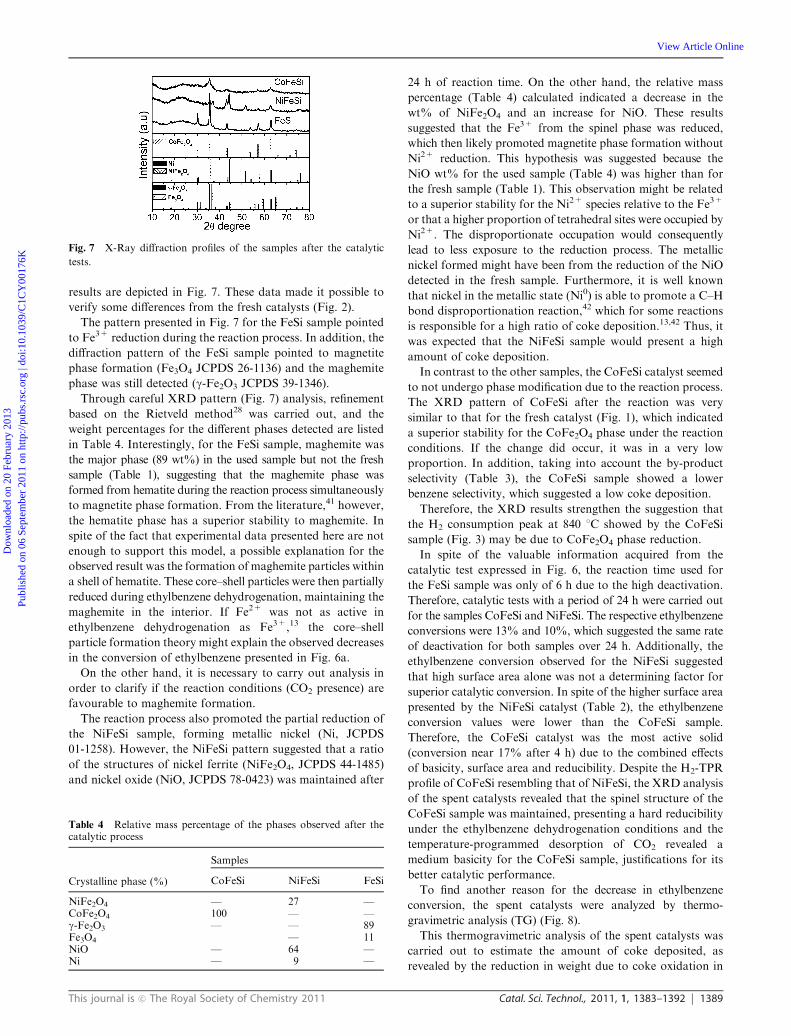
results are depicted in Fig. 7. These data made it possible to
verify some differences from the fresh catalysts (Fig. 2).
The pattern presented in Fig. 7 for the FeSi sample pointed
to Fe3+ reduction during the reaction process. In addition, the
diffraction pattern of the FeSi sample pointed to magnetite
phase formation (Fe3O4 JCPDS 26-1136) and the maghemite
phase was still detected (g-Fe2O3 JCPDS 39-1346).
Through careful XRD pattern (Fig. 7) analysis, refinement
based on the Rietveld method28 was carried out, and the
weight percentages for the different phases detected are listed
in Table 4. Interestingly, for the FeSi sample, maghemite was
the major phase (89 wt%) in the used sample but not the fresh
sample (Table 1), suggesting that the maghemite phase was
formed from hematite during the reaction process simultaneously
to magnetite phase formation. From the literature,41 however,
the hematite phase has a superior stability to maghemite. In
spite of the fact that experimental data presented here are not
enough to support this model, a possible explanation for the
observed result was the formation of maghemite particles within
a shell of hematite. These core–shell particles were then partially
reduced during ethylbenzene dehydrogenation, maintaining the
maghemite in the interior. If Fe2+ was not as active in
ethylbenzene dehydrogenation as Fe3+,13 the core–shell
particle formation theory might explain the observed decreases
in the conversion of ethylbenzene presented in Fig. 6a.
On the other hand, it is necessary to carry out analysis in
order to clarify if the reaction conditions (CO2 presence) are
favourable to maghemite formation.
The reaction process also promoted the partial reduction of
the NiFeSi sample, forming metallic nickel (Ni, JCPDS
01-1258). However, the NiFeSi pattern suggested that a ratio
of the structures of nickel ferrite (NiFe2O4, JCPDS 44-1485)
and nickel oxide (NiO, JCPDS 78-0423) was maintained after
24 h of reaction time. On the other hand, the relative mass
percentage (Table 4) calculated indicated a decrease in the
wt% of NiFe2O4 and an increase for NiO. These results
suggested that the Fe3+ from the spinel phase was reduced,
which then likely promoted magnetite phase formation without
Ni2+ reduction. This hypothesis was suggested because the
NiO wt% for the used sample (Table 4) was higher than for
the fresh sample (Table 1). This observation might be related
to a superior stability for the Ni2+ species relative to the Fe3+
or that a higher proportion of tetrahedral sites were occupied by
Ni2+. The disproportionate occupation would consequently
lead to less exposure to the reduction process. The metallic
nickel formed might have been from the reduction of the NiO
detected in the fresh sample. Furthermore, it is well known
that nickel in the metallic state (Ni0) is able to promote a C–H
bond disproportionation reaction,42 which for some reactions
is responsible for a high ratio of coke deposition.13,42 Thus, it
was expected that the NiFeSi sample would present a high
amount of coke deposition.
In contrast to the other samples, the CoFeSi catalyst seemed
to not undergo phase modification due to the reaction process.
The XRD pattern of CoFeSi after the reaction was very
similar to that for the fresh catalyst (Fig. 1), which indicated
a superior stability for the CoFe2O4 phase under the reaction
conditions. If the change did occur, it was in a very low
proportion. In addition, taking into account the by-product
selectivity (Table 3), the CoFeSi sample showed a lower
benzene selectivity, which suggested a low coke deposition.
Therefore, the XRD results strengthen the suggestion that
the H2 consumption peak at 840 1C showed by the CoFeSi
sample (Fig. 3) may be due to CoFe2O4 phase reduction.
In spite of the valuable information acquired from the
catalytic test expressed in Fig. 6, the reaction time used for
the FeSi sample was only of 6 h due to the high deactivation.
Therefore, catalytic tests with a period of 24 h were carried out
for the samples CoFeSi and NiFeSi. The respective ethylbenzene
conversions were 13% and 10%, which suggested the same rate
of deactivation for both samples over 24 h. Additionally, the
ethylbenzene conversion observed for the NiFeSi suggested
that high surface area alone was not a determining factor for
superior catalytic conversion. In spite of the higher surface area
presented by the NiFeSi catalyst (Table 2), the ethylbenzene
conversion values were lower than the CoFeSi sample.
Therefore, the CoFeSi catalyst was the most active solid
(conversion near 17% after 4 h) due to the combined effects
of basicity, surface area and reducibility. Despite the H2-TPR
profile of CoFeSi resembling that of NiFeSi, the XRD analysis
of the spent catalysts revealed that the spinel structure of the
CoFeSi sample was maintained, presenting a hard reducibility
under the ethylbenzene dehydrogenation conditions and the
temperature-programmed desorption of CO2 revealed a
medium basicity for the CoFeSi sample, justifications for its
better catalytic performance.
To find another reason for the decrease in ethylbenzene
conversion, the spent catalysts were analyzed by thermo-
gravimetric analysis (TG) (Fig. 8).
This thermogravimetric analysis of the spent catalysts was
carried out to estimate the amount of coke deposited, as
revealed by the reduction in weight due to coke oxidation in
Fig. 7 X-Ray diffraction profiles of the samples after the catalytic
tests.
Table 4 Relative mass percentage of the phases observed after thecatalytic process
Crystalline phase (%)
Samples
CoFeSi NiFeSi FeSi
NiFe2O4 — 27 —CoFe2O4 100 — —g-Fe2O3 — — 89Fe3O4 — 11NiO — 64 —Ni — 9 —
Dow
nloa
ded
on 2
0 Fe
brua
ry 2
013
Publ
ishe
d on
06
Sept
embe
r 20
11 o
n ht
tp://
pubs
.rsc
.org
| do
i:10.
1039
/C1C
Y00
176K
View Article Online
1390 Catal. Sci. Technol., 2011, 1, 1383–1392 This journal is c The Royal Society of Chemistry 2011
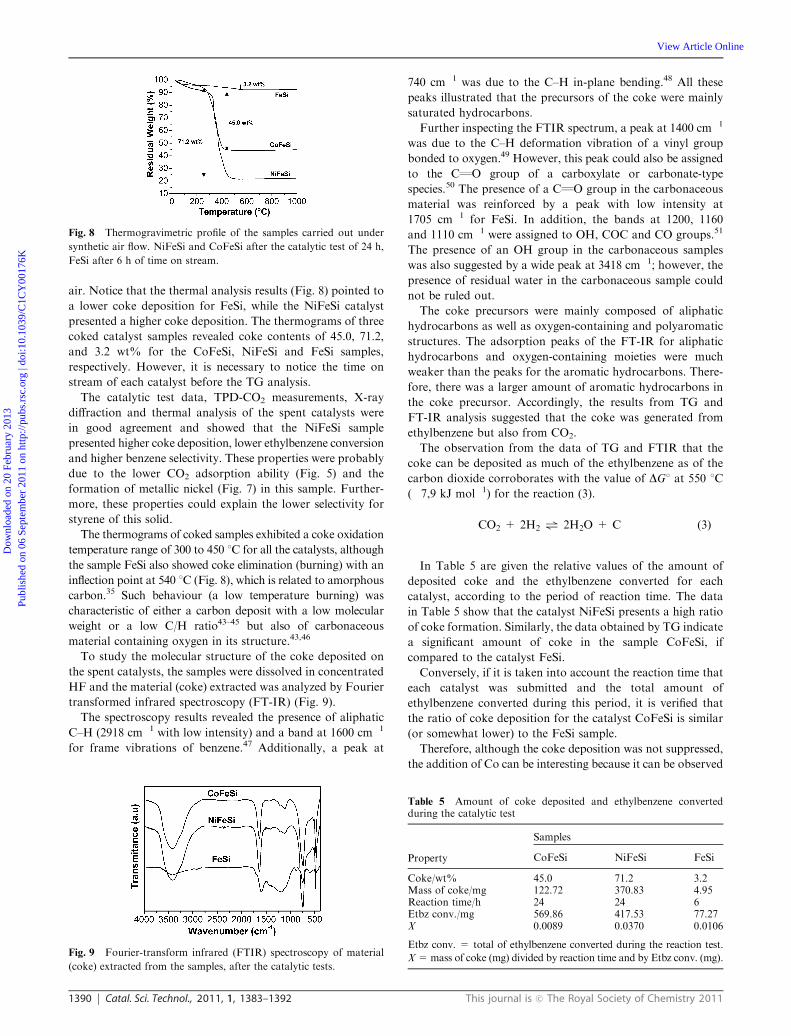
air. Notice that the thermal analysis results (Fig. 8) pointed to
a lower coke deposition for FeSi, while the NiFeSi catalyst
presented a higher coke deposition. The thermograms of three
coked catalyst samples revealed coke contents of 45.0, 71.2,
and 3.2 wt% for the CoFeSi, NiFeSi and FeSi samples,
respectively. However, it is necessary to notice the time on
stream of each catalyst before the TG analysis.
The catalytic test data, TPD-CO2 measurements, X-ray
diffraction and thermal analysis of the spent catalysts were
in good agreement and showed that the NiFeSi sample
presented higher coke deposition, lower ethylbenzene conversion
and higher benzene selectivity. These properties were probably
due to the lower CO2 adsorption ability (Fig. 5) and the
formation of metallic nickel (Fig. 7) in this sample. Further-
more, these properties could explain the lower selectivity for
styrene of this solid.
The thermograms of coked samples exhibited a coke oxidation
temperature range of 300 to 450 1C for all the catalysts, although
the sample FeSi also showed coke elimination (burning) with an
inflection point at 540 1C (Fig. 8), which is related to amorphous
carbon.35 Such behaviour (a low temperature burning) was
characteristic of either a carbon deposit with a low molecular
weight or a low C/H ratio43–45 but also of carbonaceous
material containing oxygen in its structure.43,46
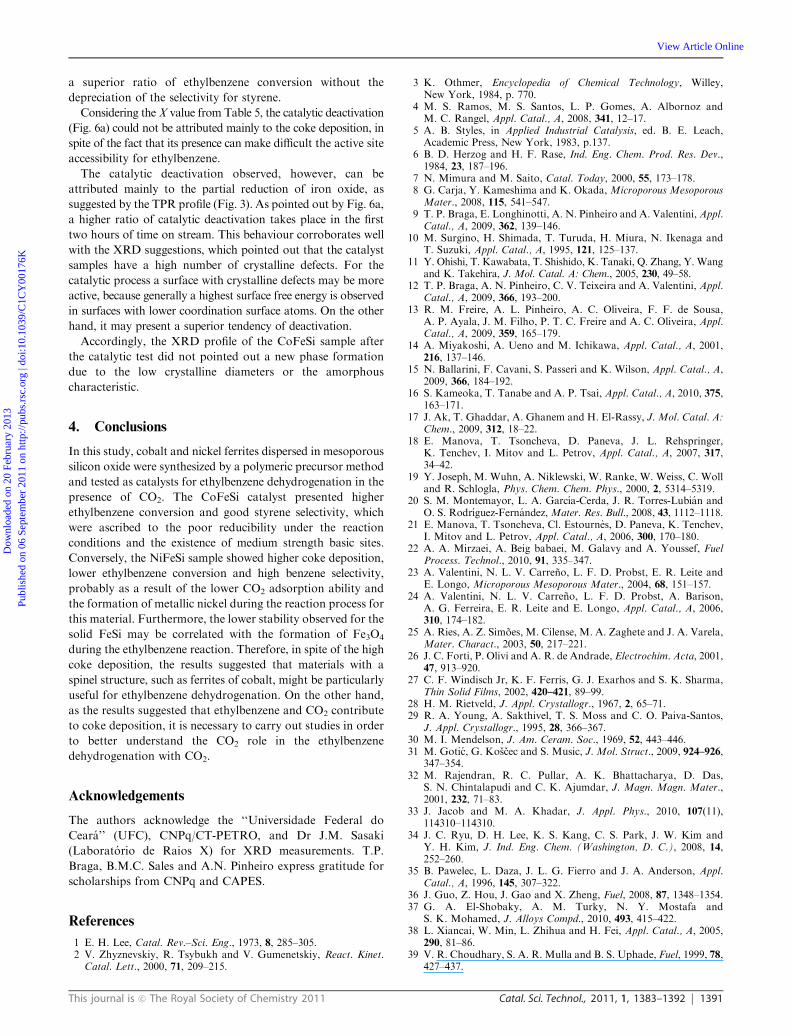
To study the molecular structure of the coke deposited on
the spent catalysts, the samples were dissolved in concentrated
HF and the material (coke) extracted was analyzed by Fourier
transformed infrared spectroscopy (FT-IR) (Fig. 9).
The spectroscopy results revealed the presence of aliphatic
C–H (2918 cm�1 with low intensity) and a band at 1600 cm�1
for frame vibrations of benzene.47 Additionally, a peak at
740 cm�1 was due to the C–H in-plane bending.48 All these
peaks illustrated that the precursors of the coke were mainly
saturated hydrocarbons.
Further inspecting the FTIR spectrum, a peak at 1400 cm�1
was due to the C–H deformation vibration of a vinyl group
bonded to oxygen.49 However, this peak could also be assigned
to the CQO group of a carboxylate or carbonate-type
species.50 The presence of a CQO group in the carbonaceous
material was reinforced by a peak with low intensity at
1705 cm�1 for FeSi. In addition, the bands at 1200, 1160
and 1110 cm�1 were assigned to OH, COC and CO groups.51
The presence of an OH group in the carbonaceous samples
was also suggested by a wide peak at 3418 cm�1; however, the
presence of residual water in the carbonaceous sample could
not be ruled out.
The coke precursors were mainly composed of aliphatic
hydrocarbons as well as oxygen-containing and polyaromatic
structures. The adsorption peaks of the FT-IR for aliphatic
hydrocarbons and oxygen-containing moieties were much
weaker than the peaks for the aromatic hydrocarbons. There-
fore, there was a larger amount of aromatic hydrocarbons in
the coke precursor. Accordingly, the results from TG and
FT-IR analysis suggested that the coke was generated from
ethylbenzene but also from CO2.
The observation from the data of TG and FTIR that the
coke can be deposited as much of the ethylbenzene as of the
carbon dioxide corroborates with the value of DG1 at 550 1C
(�7,9 kJ mol�1) for the reaction (3).
CO2 + 2H2 " 2H2O + C (3)
In Table 5 are given the relative values of the amount of
deposited coke and the ethylbenzene converted for each
catalyst, according to the period of reaction time. The data
in Table 5 show that the catalyst NiFeSi presents a high ratio
of coke formation. Similarly, the data obtained by TG indicate
a significant amount of coke in the sample CoFeSi, if
compared to the catalyst FeSi.
Conversely, if it is taken into account the reaction time that
each catalyst was submitted and the total amount of
ethylbenzene converted during this period, it is verified that
the ratio of coke deposition for the catalyst CoFeSi is similar
(or somewhat lower) to the FeSi sample.
Therefore, although the coke deposition was not suppressed,
the addition of Co can be interesting because it can be observed
Fig. 8 Thermogravimetric profile of the samples carried out under
synthetic air flow. NiFeSi and CoFeSi after the catalytic test of 24 h,
FeSi after 6 h of time on stream.
Fig. 9 Fourier-transform infrared (FTIR) spectroscopy of material
(coke) extracted from the samples, after the catalytic tests.
Table 5 Amount of coke deposited and ethylbenzene convertedduring the catalytic test
Property
Samples
CoFeSi NiFeSi FeSi
Coke/wt% 45.0 71.2 3.2Mass of coke/mg 122.72 370.83 4.95Reaction time/h 24 24 6Etbz conv./mg 569.86 417.53 77.27X 0.0089 0.0370 0.0106
Etbz conv. = total of ethylbenzene converted during the reaction test.
X=mass of coke (mg) divided by reaction time and by Etbz conv. (mg).
Dow
nloa
ded
on 2
0 Fe
brua
ry 2
013
Publ
ishe
d on
06
Sept
embe
r 20
11 o
n ht
tp://
pubs
.rsc
.org
| do
i:10.
1039
/C1C
Y00
176K
View Article Online
This journal is c The Royal Society of Chemistry 2011 Catal. Sci. Technol., 2011, 1, 1383–1392 1391
a superior ratio of ethylbenzene conversion without the
depreciation of the selectivity for styrene.
Considering the X value from Table 5, the catalytic deactivation
(Fig. 6a) could not be attributed mainly to the coke deposition, in
spite of the fact that its presence can make difficult the active site
accessibility for ethylbenzene.
The catalytic deactivation observed, however, can be
attributed mainly to the partial reduction of iron oxide, as
suggested by the TPR profile (Fig. 3). As pointed out by Fig. 6a,
a higher ratio of catalytic deactivation takes place in the first
two hours of time on stream. This behaviour corroborates well
with the XRD suggestions, which pointed out that the catalyst
samples have a high number of crystalline defects. For the
catalytic process a surface with crystalline defects may be more
active, because generally a highest surface free energy is observed
in surfaces with lower coordination surface atoms. On the other
hand, it may present a superior tendency of deactivation.
Accordingly, the XRD profile of the CoFeSi sample after
the catalytic test did not pointed out a new phase formation
due to the low crystalline diameters or the amorphous
characteristic.
4. Conclusions
In this study, cobalt and nickel ferrites dispersed in mesoporous
silicon oxide were synthesized by a polymeric precursor method
and tested as catalysts for ethylbenzene dehydrogenation in the
presence of CO2. The CoFeSi catalyst presented higher
ethylbenzene conversion and good styrene selectivity, which
were ascribed to the poor reducibility under the reaction
conditions and the existence of medium strength basic sites.
Conversely, the NiFeSi sample showed higher coke deposition,
lower ethylbenzene conversion and high benzene selectivity,
probably as a result of the lower CO2 adsorption ability and
the formation of metallic nickel during the reaction process for
this material. Furthermore, the lower stability observed for the
solid FeSi may be correlated with the formation of Fe3O4
during the ethylbenzene reaction. Therefore, in spite of the high
coke deposition, the results suggested that materials with a
spinel structure, such as ferrites of cobalt, might be particularly
useful for ethylbenzene dehydrogenation. On the other hand,
as the results suggested that ethylbenzene and CO2 contribute
to coke deposition, it is necessary to carry out studies in order
to better understand the CO2 role in the ethylbenzene
dehydrogenation with CO2.
Acknowledgements
The authors acknowledge the ‘‘Universidade Federal do
Ceara’’ (UFC), CNPq/CT-PETRO, and Dr J.M. Sasaki
(Laboratorio de Raios X) for XRD measurements. T.P.
Braga, B.M.C. Sales and A.N. Pinheiro express gratitude for
scholarships from CNPq and CAPES.
References
1 E. H. Lee, Catal. Rev.–Sci. Eng., 1973, 8, 285–305.2 V. Zhyznevskiy, R. Tsybukh and V. Gumenetskiy, React. Kinet.Catal. Lett., 2000, 71, 209–215.
3 K. Othmer, Encyclopedia of Chemical Technology, Willey,New York, 1984, p. 770.
4 M. S. Ramos, M. S. Santos, L. P. Gomes, A. Albornoz andM. C. Rangel, Appl. Catal., A, 2008, 341, 12–17.
5 A. B. Styles, in Applied Industrial Catalysis, ed. B. E. Leach,Academic Press, New York, 1983, p.137.
6 B. D. Herzog and H. F. Rase, Ind. Eng. Chem. Prod. Res. Dev.,1984, 23, 187–196.
7 N. Mimura and M. Saito, Catal. Today, 2000, 55, 173–178.8 G. Carja, Y. Kameshima and K. Okada, Microporous MesoporousMater., 2008, 115, 541–547.
9 T. P. Braga, E. Longhinotti, A. N. Pinheiro and A. Valentini, Appl.Catal., A, 2009, 362, 139–146.
10 M. Surgino, H. Shimada, T. Turuda, H. Miura, N. Ikenaga andT. Suzuki, Appl. Catal., A, 1995, 121, 125–137.
11 Y. Ohishi, T. Kawabata, T. Shishido, K. Tanaki, Q. Zhang, Y. Wangand K. Takehira, J. Mol. Catal. A: Chem., 2005, 230, 49–58.
12 T. P. Braga, A. N. Pinheiro, C. V. Teixeira and A. Valentini, Appl.Catal., A, 2009, 366, 193–200.
13 R. M. Freire, A. L. Pinheiro, A. C. Oliveira, F. F. de Sousa,A. P. Ayala, J. M. Filho, P. T. C. Freire and A. C. Oliveira, Appl.Catal., A, 2009, 359, 165–179.
14 A. Miyakoshi, A. Ueno and M. Ichikawa, Appl. Catal., A, 2001,216, 137–146.
15 N. Ballarini, F. Cavani, S. Passeri and K. Wilson, Appl. Catal., A,2009, 366, 184–192.
16 S. Kameoka, T. Tanabe and A. P. Tsai, Appl. Catal., A, 2010, 375,163–171.
17 J. Ak, T. Ghaddar, A. Ghanem and H. El-Rassy, J. Mol. Catal. A:Chem., 2009, 312, 18–22.
18 E. Manova, T. Tsoncheva, D. Paneva, J. L. Rehspringer,K. Tenchev, I. Mitov and L. Petrov, Appl. Catal., A, 2007, 317,34–42.
19 Y. Joseph, M. Wuhn, A. Niklewski, W. Ranke, W. Weiss, C. Wolland R. Schlogla, Phys. Chem. Chem. Phys., 2000, 2, 5314–5319.
20 S. M. Montemayor, L. A. Garcıa-Cerda, J. R. Torres-Lubian andO. S. Rodrıguez-Fernandez, Mater. Res. Bull., 2008, 43, 1112–1118.
21 E. Manova, T. Tsoncheva, Cl. Estournes, D. Paneva, K. Tenchev,I. Mitov and L. Petrov, Appl. Catal., A, 2006, 300, 170–180.
22 A. A. Mirzaei, A. Beig babaei, M. Galavy and A. Youssef, FuelProcess. Technol., 2010, 91, 335–347.
23 A. Valentini, N. L. V. Carreno, L. F. D. Probst, E. R. Leite andE. Longo, Microporous Mesoporous Mater., 2004, 68, 151–157.
24 A. Valentini, N. L. V. Carreno, L. F. D. Probst, A. Barison,A. G. Ferreira, E. R. Leite and E. Longo, Appl. Catal., A, 2006,310, 174–182.
25 A. Ries, A. Z. Simoes, M. Cilense, M. A. Zaghete and J. A. Varela,Mater. Charact., 2003, 50, 217–221.
26 J. C. Forti, P. Olivi and A. R. de Andrade, Electrochim. Acta, 2001,47, 913–920.
27 C. F. Windisch Jr, K. F. Ferris, G. J. Exarhos and S. K. Sharma,Thin Solid Films, 2002, 420–421, 89–99.
28 H. M. Rietveld, J. Appl. Crystallogr., 1967, 2, 65–71.29 R. A. Young, A. Sakthivel, T. S. Moss and C. O. Paiva-Santos,
J. Appl. Crystallogr., 1995, 28, 366–367.30 M. I. Mendelson, J. Am. Ceram. Soc., 1969, 52, 443–446.31 M. Gotic, G. Koscec and S. Music, J. Mol. Struct., 2009, 924–926,
347–354.32 M. Rajendran, R. C. Pullar, A. K. Bhattacharya, D. Das,
S. N. Chintalapudi and C. K. Ajumdar, J. Magn. Magn. Mater.,2001, 232, 71–83.
33 J. Jacob and M. A. Khadar, J. Appl. Phys., 2010, 107(11),114310–114310.
34 J. C. Ryu, D. H. Lee, K. S. Kang, C. S. Park, J. W. Kim andY. H. Kim, J. Ind. Eng. Chem. (Washington, D. C.), 2008, 14,252–260.
35 B. Pawelec, L. Daza, J. L. G. Fierro and J. A. Anderson, Appl.Catal., A, 1996, 145, 307–322.
36 J. Guo, Z. Hou, J. Gao and X. Zheng, Fuel, 2008, 87, 1348–1354.37 G. A. El-Shobaky, A. M. Turky, N. Y. Mostafa and
S. K. Mohamed, J. Alloys Compd., 2010, 493, 415–422.38 L. Xiancai, W. Min, L. Zhihua and H. Fei, Appl. Catal., A, 2005,
290, 81–86.39 V. R. Choudhary, S. A. R. Mulla and B. S. Uphade, Fuel, 1999, 78,
427–437.
Dow
nloa
ded
on 2
0 Fe
brua
ry 2
013
Publ
ishe
d on
06
Sept
embe
r 20
11 o
n ht
tp://
pubs
.rsc
.org
| do
i:10.
1039
/C1C
Y00
176K
View Article Online
1392 Catal. Sci. Technol., 2011, 1, 1383–1392 This journal is c The Royal Society of Chemistry 2011
40 R. Dziembaj, P. K. Strowski and L. Chmielarz, Appl. Catal., A,2003, 255, 35–43.
41 C. Cannas, D. Gatteschi, A. Musinu, G. Piccaluga andC. Sangregorio, J. Phys. Chem. B, 1998, 102, 7721–7726.
42 A. W. Chester, Ind. Eng. Chem. Res., 1987, 26, 863–869.43 H. Hattori, Chem. Rev. (Washington, DC, U. S.), 1995, 95,
537–558.44 A. Effendi, K. Hellgardt, Z.-G. Zhang and T. Yoshida, Catal.
Commun., 2003, 4, 203–207.
45 M. Guisnet and P. Magnoux, Appl. Catal., A, 2001, 212, 83–96.46 F. Cavani and F. Trifiro, Appl. Catal., A, 1995, 133, 219–239.47 Y. He and Y. He, Catal. Today, 2002, 74, 45–51.48 Y. W. Chen, Q. H. Li and W. L. Huang, Organic instrumental
analysis, Hunan University Publishing Company, Hunan, 1st edn,1987.
49 S.-H. Wang and P. R. Griffiths, Fuel, 1985, 64, 229236.50 W. Wei, J. A. Moulijn and G. Mul, J. Catal., 2009, 262, 1–8.51 T. Jiang and K. Xu, Carbon, 1995, 33, 1663–1671.
Dow
nloa
ded
on 2
0 Fe
brua
ry 2
013
Publ
ishe
d on
06
Sept
embe
r 20
11 o
n ht
tp://
pubs
.rsc
.org
| do
i:10.
1039
/C1C
Y00
176K
View Article Online