V–Al–O catalysts prepared by flame pyrolysis for the oxidative dehydrogenation of propane to...
11
V–Al–O catalysts prepared by flame pyrolysis for the oxidative dehydrogenation of propane to propylene I. Rossetti a , L. Fabbrini a , N. Ballarini b,c , C. Oliva a , F. Cavani b,c, *, A. Cericola b,c , B. Bonelli d,e , M. Piumetti d,e , E. Garrone d,e , H. Dyrbeck f , E.A. Blekkan f , L. Forni a a Dip. CFE e ISTM-CNR, Universita ` di Milano, via C.Golgi, 19 20133 Milano, Italy b Dip. di Chimica Industriale e dei Materiali, Universita ` di Bologna, V.le Risorgimento, 4 40136 Bologna, Italy c INSTM, Research Unit of Bologna, NoE Idecat partner (FP6 of EU), Italy d Dipartimento di Scienza dei Materiali ed Ingegneria Chimica, Politecnico di Torino, C.so Duca degli Abruzzi 24, I-10129 Torino, Italy e INSTM, Torino Politecnico Research Unit, Italy f Department of Chemical Engineering, Norwegian University of Science and Technology (NTNU), N-7491 Trondheim, Norway 1. Introduction Oxidative dehydrogenation (ODH) of light alkanes offers an attractive route to the corresponding alkenes, the thermodynamic constraints of non-oxidative routes being avoided. The yield of alkenes by ODH on most catalysts can be limited by parallel and consecutive reactions, mainly the combustion of reactant and products to CO and CO 2 [1], and the co-feeding of oxygen may introduce a safety concern, which however can be satisfactorily faced, together with selectivity improvement, by proper catalyst formulation and process engineering. Among the several possible active phases V oxide (VO x ) is the most investigated and, when loaded in proper amount on a suitable support, it leads to promising ethylene [1–5], propylene [1,2,6,7] and butenes [3] yields. Many different oxides have been proposed as supports, such as ZrO 2 [8,9], TiO 2 [7], V-substituted zeolites or silicalites [10], SiO 2 [4,8,11] and Al 2 O 3 , usually as the g- isomorph [1–3,5–8]. Most of these papers deal with the effect of V loading in determining the species active for the reaction and with the role of the support on V surface dispersion. Furthermore, support acidity can adversely affect catalyst selectivity when low V loading leaves uncovered Lewis acid sites, especially in the case of alumina-supported samples. However, V 2 O 5 segregation is usually observed at high V loading, sometimes accompanied by the formation of the AlVO 4 phase [12,13]. High activity is ascribed to vanadate species up to the formation of a VO x monolayer, while lower activity is usually associated with the presence of V 2 O 5 and AlVO 4 phases [13] and high selectivity can be achieved when a VO x monolayer completely covers the support. The catalysts so far described are usually prepared by impregnation of preformed commercial supports. A new procedure based on flame-pyrolysis (FP) of an organic solution of metal ion precursors has been set up recently for the preparation of different single or mixed oxides in nanoparticle powder form [14–21]. This procedure has been selected for the preparation of a set of V–Si–O catalysts for the ODH of propane, leading to interesting results Catalysis Today 141 (2009) 271–281 ARTICLE INFO Article history: Available online 7 July 2008 Keywords: Oxidative dehydrogenation of propane Flame-pyrolysis Vanadium–aluminium oxides catalysts ABSTRACT A flame pyrolysis (FP) procedure has been set up for the preparation of V/Al/O catalysts to be employed for the oxidative dehydrogenation of propane to propylene. The samples have been characterised by means of various techniques (FT-IR, Raman, EPR, ICP-MS, TGA, XRD, SEM) and their catalytic activity has been evaluated in two different operating modes, i.e. under anaerobic conditions and by co-feeding oxygen. The particle size distribution became progressively more homogeneous with increasing V concentration, due to the catalytic effect of the V ions during the FP synthesis. Some V 2 O 5 segregation was observed even at low V loading. However, higher V dispersion was attained with respect to a reference sample prepared by impregnation of the FP-prepared alumina support. The increase of V concentration always led to an improvement of propane conversion, though selectivity showed different trends depending on the operating conditions. The comparison with the sample prepared by impregnation showed similar catalytic activity, with a bit higher selectivity for the FP-prepared sample under anaerobic conditions. ß 2008 Elsevier B.V. All rights reserved. * Corresponding author. Fax: +39 051 2093680. E-mail address: [email protected] (F. Cavani). Contents lists available at ScienceDirect Catalysis Today journal homepage: www.elsevier.com/locate/cattod 0920-5861/$ – see front matter ß 2008 Elsevier B.V. All rights reserved. doi:10.1016/j.cattod.2008.05.020
-
Upload
independent -
Category
Documents
-
view
0 -
download
0
Transcript of V–Al–O catalysts prepared by flame pyrolysis for the oxidative dehydrogenation of propane to...
Catalysis Today 141 (2009) 271–281
V–Al–O catalysts prepared by flame pyrolysis for the oxidativedehydrogenation of propane to propylene
I. Rossetti a, L. Fabbrini a, N. Ballarini b,c, C. Oliva a, F. Cavani b,c,*, A. Cericola b,c, B. Bonelli d,e,M. Piumetti d,e, E. Garrone d,e, H. Dyrbeck f, E.A. Blekkan f, L. Forni a
a Dip. CFE e ISTM-CNR, Universita di Milano, via C.Golgi, 19 20133 Milano, Italyb Dip. di Chimica Industriale e dei Materiali, Universita di Bologna, V.le Risorgimento, 4 40136 Bologna, Italyc INSTM, Research Unit of Bologna, NoE Idecat partner (FP6 of EU), Italyd Dipartimento di Scienza dei Materiali ed Ingegneria Chimica, Politecnico di Torino, C.so Duca degli Abruzzi 24, I-10129 Torino, Italye INSTM, Torino Politecnico Research Unit, Italyf Department of Chemical Engineering, Norwegian University of Science and Technology (NTNU), N-7491 Trondheim, Norway
A R T I C L E I N F O
Article history:
Available online 7 July 2008
Keywords:
Oxidative dehydrogenation of propane
Flame-pyrolysis
Vanadium–aluminium oxides catalysts
A B S T R A C T
A flame pyrolysis (FP) procedure has been set up for the preparation of V/Al/O catalysts to be employed
for the oxidative dehydrogenation of propane to propylene. The samples have been characterised by
means of various techniques (FT-IR, Raman, EPR, ICP-MS, TGA, XRD, SEM) and their catalytic activity has
been evaluated in two different operating modes, i.e. under anaerobic conditions and by co-feeding
oxygen. The particle size distribution became progressively more homogeneous with increasing V
concentration, due to the catalytic effect of the V ions during the FP synthesis. Some V2O5 segregation was
observed even at low V loading. However, higher V dispersion was attained with respect to a reference
sample prepared by impregnation of the FP-prepared alumina support.
The increase of V concentration always led to an improvement of propane conversion, though
selectivity showed different trends depending on the operating conditions. The comparison with the
sample prepared by impregnation showed similar catalytic activity, with a bit higher selectivity for the
FP-prepared sample under anaerobic conditions.
� 2008 Elsevier B.V. All rights reserved.
Contents lists available at ScienceDirect
Catalysis Today
journal homepage: www.e lsev ier .com/ locate /cat tod
1. Introduction
Oxidative dehydrogenation (ODH) of light alkanes offers anattractive route to the corresponding alkenes, the thermodynamicconstraints of non-oxidative routes being avoided. The yield ofalkenes by ODH on most catalysts can be limited by parallel andconsecutive reactions, mainly the combustion of reactant andproducts to CO and CO2 [1], and the co-feeding of oxygen mayintroduce a safety concern, which however can be satisfactorilyfaced, together with selectivity improvement, by proper catalystformulation and process engineering.
Among the several possible active phases V oxide (VOx) is themost investigated and, when loaded in proper amount on asuitable support, it leads to promising ethylene [1–5], propylene[1,2,6,7] and butenes [3] yields. Many different oxides have beenproposed as supports, such as ZrO2 [8,9], TiO2 [7], V-substituted
* Corresponding author. Fax: +39 051 2093680.
E-mail address: [email protected] (F. Cavani).
0920-5861/$ – see front matter � 2008 Elsevier B.V. All rights reserved.
doi:10.1016/j.cattod.2008.05.020
zeolites or silicalites [10], SiO2 [4,8,11] and Al2O3, usually as the g-isomorph [1–3,5–8]. Most of these papers deal with the effect of Vloading in determining the species active for the reaction and withthe role of the support on V surface dispersion. Furthermore,support acidity can adversely affect catalyst selectivity when low Vloading leaves uncovered Lewis acid sites, especially in the case ofalumina-supported samples. However, V2O5 segregation is usuallyobserved at high V loading, sometimes accompanied by theformation of the AlVO4 phase [12,13]. High activity is ascribed tovanadate species up to the formation of a VOx monolayer, whilelower activity is usually associated with the presence of V2O5 andAlVO4 phases [13] and high selectivity can be achieved when a VOx
monolayer completely covers the support.The catalysts so far described are usually prepared by
impregnation of preformed commercial supports. A new procedurebased on flame-pyrolysis (FP) of an organic solution of metal ionprecursors has been set up recently for the preparation of differentsingle or mixed oxides in nanoparticle powder form [14–21]. Thisprocedure has been selected for the preparation of a set of V–Si–Ocatalysts for the ODH of propane, leading to interesting results
I. Rossetti et al. / Catalysis Today 141 (2009) 271–281272
about the effect of both the nature of Si oxide and the preparationmethod on catalyst performance [11]. The aim of the present workwas then to apply the FP method to prepare a set of nanoparticle V–Al–O catalysts, characterised by different V loading, and toevaluate their behaviour, particularly in comparison with theprevious V–Si–O samples. A sample of AlVO4 has been alsoprepared for further comparison purposes, as well as a sampleprepared by impregnation of V on a FP-prepared Al2O3 support. Allof the samples have been characterised by different physical–chemical techniques and their activity has been compared underdifferent reaction conditions, namely either by co-feeding propaneand air (aerobic oxidation) or by feeding alternatively the substrateand the oxidising agent (anaerobic oxidation).
2. Experimental
2.1. Catalysts preparation
A detailed description of the FP preparation procedure and ofthe effect of the main operating parameters on catalyst propertiescan be found elsewhere [15–18]. Briefly, proper amounts ofprecursor salts were dissolved in an organic solvent, so to obtain a0.1–0.2 M solution (concentration referred to the nominal oxidecomposition). The prepared solution (4.4 cm3/min), together with5 L/min of oxygen (SIAD, purity>99.95%), was fed to the FP burner.The main flame was ignited and supported by a ring of 12 premixedO2 + CH4 flamelets. The catalyst powder so produced was collectedby means of a 10 kV electrostatic precipitator [15,22].
Two Al precursors have been tested, the nitrate and theisopropoxide, whereas V oxi-acetyl-acetonate has been selected asV precursor. In addition, different solvents have been tested: linearalcohols (C1–C8) and (C1–C3) carboxylic acids. The preparationyield was 90–95 wt% with respect to the precursor salts for eachsample. The composition of the samples is given in Table 1. Thecomparative catalyst (V10Al-i, Table 1) was made by impregnationof the FP-prepared Al2O3 sample with a NH4VO3 solution, followedby drying and calcination at 700 8C in air.
2.2. Catalysts characterisation
Specific surface area (SSA) was measured by N2 adsorption/desorption at 77 K on a Micromeritics ASAP 2010 apparatus.Morphological analysis was done by a LEICA LEO 1430 scanningelectron microscope (SEM). XRD analysis was made by means of aPhilips PW1820 powder diffractometer, by using the Ni-filtered CuKa radiation (l = 1.5148 A). The diffractograms obtained werecompared with literature data for phase recognition [23].Thermogravimetric analysis (TGA) of the as prepared powderwas carried out in flowing air by means of a PerkinElmer TGA7apparatus. Catalyst composition has been determined by ICP-MS(PerkinElmer, ELAN5500) after microwave digestion of the samplein 10 vol.% HNO3. Electron paramagnetic resonance (EPR) spectrawere collected between 120 and 300 K with a Bruker Elexsys
Table 1Catalyst composition and specific surface area (SSA)
Sample wt% V/V + Al exp.a wt% V/V + Al nominal SSA (m2/g)
Al2O3 – – 20
Al2O3 (600 8C) – – 18
V10Al 11.2 9.6 19
V25Al 23.9 20.9 23
V50Al 38.4 34.6 27
AlVO4 69.9 65.4 21
V10Al-i n.d. 9.6 20
a Determined by ICP-MS.
instrument, equipped with a standard rectangular ER4102STcavity and operated at X band, 6.23 mW microwave power, and3 G modulating amplitude. The microwave frequency wasmeasured with a HP 5340 A frequency counter. Spectral simula-tions, when required, were done by means of the Bruker SimFoniaprogramme. Raman spectra were collected on a Micro-Raman(Renishaw) system, equipped with Ar laser (514.5 nm) source. ForFT-IR measurements, powder samples were pressed into thin, self-supporting wafers and pre-treated in high vacuum (residualpressure < 10�3 mbar) using a standard vacuum frame, in a IR cellequipped with KBr windows. Spectra were collected at 2 cm�1
resolution, on a Bruker FTIR Equinox 55 spectrophotometerequipped with MCT detector. To remove moisture and otheratmospheric contaminants wafers were outgassed for 1 h at 150,300 and 500 8C before adsorption of NH3, which has been dosed atr.t., within 0.01–23.0 mbar equilibrium pressure range. After eachexperiment an evacuation step has been performed, to investigatethe reversibility of the interaction.
2.3. Catalytic activity tests
Catalytic activity was measured by means of a continuous,quartz tubular reactor (i.d. = 7 mm). The catalyst (0.5–0.6 g, 425–600 mm particle size) was activated prior to each run in 20 cm3/min flowing air, while increasing temperature up to 600 8C thenkept for 30 min. The flow rate of the reactants mixture for the co-feeding mode tests was 11 cm3/min of C3H8 (20 mol%) + 11 cm3/min of O2 (20 mol%) + 28 cm3/min of He + 4 cm3/min of N2
(60 mol% inert gases). For the anaerobic mode flow rates were6 cm3/min of C3H8 (22 mol%) + 19 cm3/min of He + 2 cm3/min ofN2. Contact time was 1 s for the former and 2 s for the latter testingmode. The out coming gas was analysed by means of a micro-GC(Agilent 3000A), equipped with Plot-Q, OV-1 and MS-5A columnsfor full detection of the effluent products.
3. Results and discussion
3.1. Catalyst preparation and characterisation
On the basis of the solubility tests, the best solvent for the Vprecursor was found to be ethanol, which provided suitablesolubility for Al(NO3)3 as well. By contrast, Al isopropoxide showedpoor solubility in any of the solvents tried. A preliminary TGAanalysis in air of Al(NO3)3 showed a one-step decompositionmechanism, ensuring nitrate transformation into the oxide at ca.
200 8C. In order to modify the flame temperature during catalystpreparation and to achieve a less rapid evaporation of the fuel, anequal volume of 1-octanol has been added after dissolution of theprecursors into ethanol.
During the FP synthesis a complete combustion of the organicspecies (solvent and counterions) should be achieved, with thesimultaneous formation of the desired oxide phase. Nevertheless,some unburnt carbonaceous residua are usually found. Theirquantification was done by TGA analysis in flowing air and theresults are given in Table 2. At low V content the low temperature
Table 2Weight loss during TGA analysis and temperature of the main peaks observed
Sample 1st peak T (8C) 2nd peak T (8C) Total
wt% loss
2nd peak
wt% loss
V10Al – 680 4.1 0.6
V25Al – 665 4.7 0.5
V50Al 100 395 4.2 0.6
AlVO4 65 400 8.3 0.4

Fig. 1. XRD patterns of the prepared samples (a) Bare alumina and alumina-supported V samples, (b) AlVO4 samples, as prepared and calcined: (*) = V2O5 (file 009-0387);
(&) = d- or h-Al2O3 (files 046-1131 and 004-0875); (�) = AlVO4 (file 039-0276) [23].
I. Rossetti et al. / Catalysis Today 141 (2009) 271–281 273
peak (attributed to residual solvent) was always larger than thehigh temperature one. Furthermore, the latter peak attributed toresidual high C/H species or to carbonate like compounds, shiftedtowards lower temperature with increasing V loading. This is inline with the hypothesis that the presence of a catalytically activeV-based phase for oxidation reactions during catalyst preparationby FP facilitates precursor decomposition [11].
The overall crystallinity of the present samples was low, due totheir nanoparticle powder form and it progressively decreasedwith increasing V loading (Fig. 1a). Phase identification wasobtained when possible by comparison with literature data. Al2O3
[23, file 004-0875] was always accompanied by different V-containing species, even at the lowest V-loading. However,unambiguous attribution of the VOx phases was impossible, dueto peak broadening and overlapping. The most reliable comparisonhas been made with orthorhombic V2O5 [23, file 009-0387].
The reference sample of FP-prepared Al2O3 was calcined at600 8C for 24 h. TGA analysis (Table 2) showed that this samplewas cleaned up quite completely from carbonaceous residua andXRD confirmed that it was constituted by pure tetragonal d-Al2O3
[23, file 046-1131] (Fig. 1a). The as prepared sample withnominal composition AlVO4 was partly amorphous and thetypical reflections of this phase [23, file 039-0276] appeared onlyafter calcination at 600 8C for 1 h. Even in that case, however, asmall fraction of V2O5 was still present [23, file 009-0387](Fig. 1b).
It is worth noting that with the samples containing lessvanadium oxide, a post-synthesis calcination treatment did notcause any change in the XRD pattern. This suggests that the higher
amount of V (AlVO4), the longer is the residence time in the flameneeded for obtaining stable compounds, especially when preparinga mixed oxide. Due to this, the sample was pre-calcined at 600 8Cbefore catalyst testing and characterisation.
Typical SEM pictures of the present samples are collected inFig. 2. Low uniformity of particle size can be observed: very smallnanospheres seems to coalesce into much bigger particles, whosesize spreads through orders of magnitude. However, betterhomogeneity and smaller particle size were obtained withincreasing V loading. The best results were observed with theAlVO4 sample, which consisted of uniform spheroids with adiameter of ca. 100 nm.
The present results are partly due to the solvent nature. Indeed,alcohols did not provide small and homogeneous particle size alsofor different catalyst compositions [17,18]. However, the increaseof particle size uniformity with V loading seems to confirm thebeneficial effect of this element during catalyst preparation. It canbe hypothesised that its oxidation activity allows a better and moreuniform precursors decomposition at lower temperature, thusleading to a better size homogeneity.
Table 1 shows that all the samples possess a relatively low SSA,comparable with what reported elsewhere for different samplesprepared from alcohols as solvents [17,18], that typically possesssurface area of ca. 20–30 m2/g. Higher SSA is expected whencarboxylic acids are employed, due to a bit lower flametemperature, but mainly to their decomposition route. The latter,indeed, involves acids decarboxylation with formation of a low-boiling alkane, which allows further fragmentation of the formingparticles during solvent flash [24].
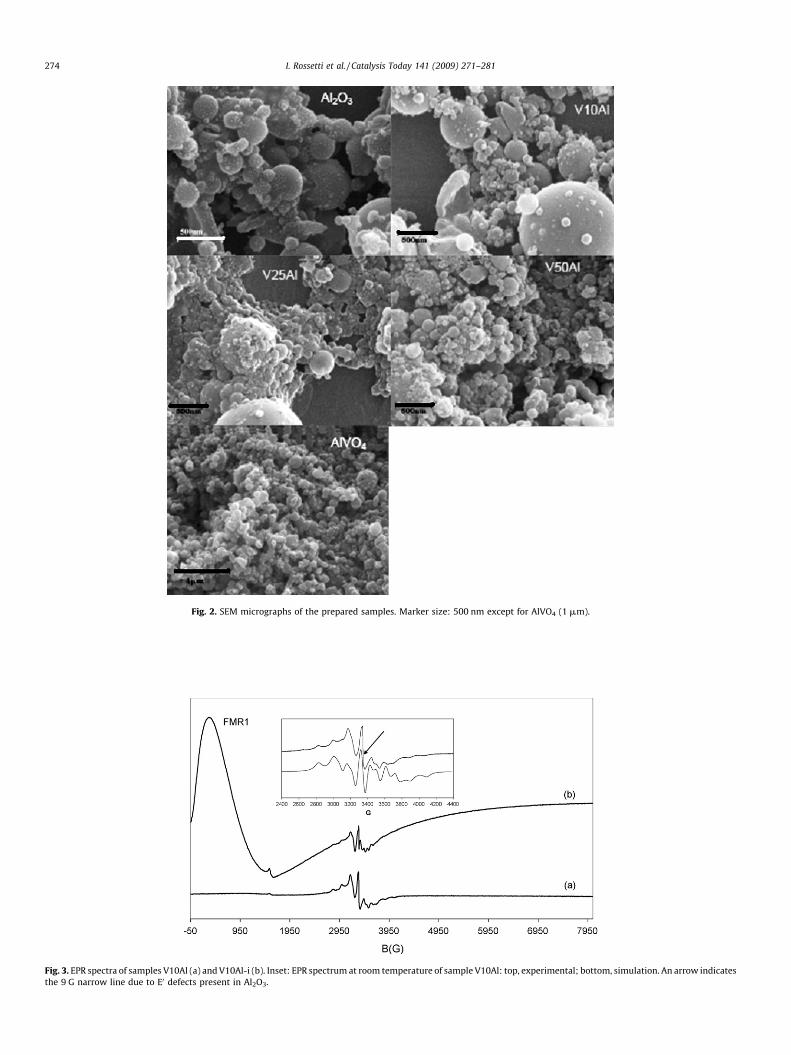
Fig. 2. SEM micrographs of the prepared samples. Marker size: 500 nm except for AlVO4 (1 mm).
Fig. 3. EPR spectra of samples V10Al (a) and V10Al-i (b). Inset: EPR spectrum at room temperature of sample V10Al: top, experimental; bottom, simulation. An arrow indicates
the 9 G narrow line due to E0 defects present in Al2O3.
I. Rossetti et al. / Catalysis Today 141 (2009) 271–281274
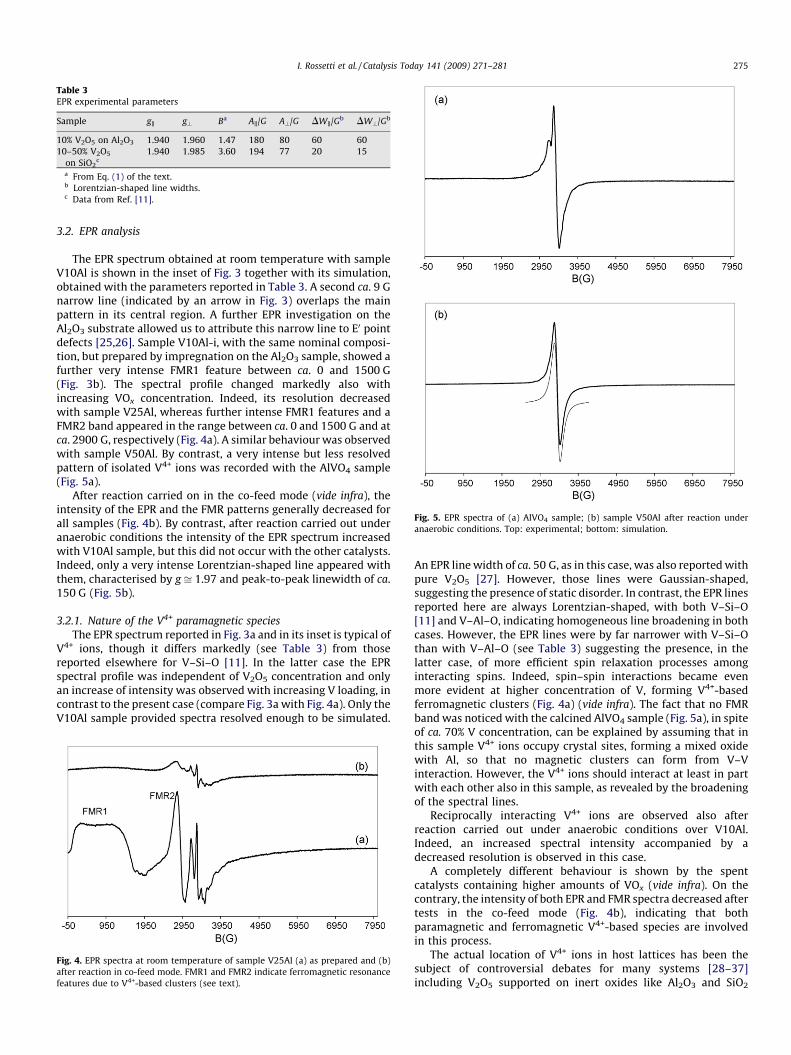
Table 3EPR experimental parameters
Sample gk g? Ba Ak/G A?/G DWk/Gb DW?/Gb
10% V2O5 on Al2O3 1.940 1.960 1.47 180 80 60 60
10–50% V2O5
on SiO2c
1.940 1.985 3.60 194 77 20 15
a From Eq. (1) of the text.b Lorentzian-shaped line widths.c Data from Ref. [11].
Fig. 5. EPR spectra of (a) AlVO4 sample; (b) sample V50Al after reaction under
anaerobic conditions. Top: experimental; bottom: simulation.
I. Rossetti et al. / Catalysis Today 141 (2009) 271–281 275
3.2. EPR analysis
The EPR spectrum obtained at room temperature with sampleV10Al is shown in the inset of Fig. 3 together with its simulation,obtained with the parameters reported in Table 3. A second ca. 9 Gnarrow line (indicated by an arrow in Fig. 3) overlaps the mainpattern in its central region. A further EPR investigation on theAl2O3 substrate allowed us to attribute this narrow line to E0 pointdefects [25,26]. Sample V10Al-i, with the same nominal composi-tion, but prepared by impregnation on the Al2O3 sample, showed afurther very intense FMR1 feature between ca. 0 and 1500 G(Fig. 3b). The spectral profile changed markedly also withincreasing VOx concentration. Indeed, its resolution decreasedwith sample V25Al, whereas further intense FMR1 features and aFMR2 band appeared in the range between ca. 0 and 1500 G and atca. 2900 G, respectively (Fig. 4a). A similar behaviour was observedwith sample V50Al. By contrast, a very intense but less resolvedpattern of isolated V4+ ions was recorded with the AlVO4 sample(Fig. 5a).
After reaction carried on in the co-feed mode (vide infra), theintensity of the EPR and the FMR patterns generally decreased forall samples (Fig. 4b). By contrast, after reaction carried out underanaerobic conditions the intensity of the EPR spectrum increasedwith V10Al sample, but this did not occur with the other catalysts.Indeed, only a very intense Lorentzian-shaped line appeared withthem, characterised by g ffi 1.97 and peak-to-peak linewidth of ca.150 G (Fig. 5b).
3.2.1. Nature of the V4+ paramagnetic species
The EPR spectrum reported in Fig. 3a and in its inset is typical ofV4+ ions, though it differs markedly (see Table 3) from thosereported elsewhere for V–Si–O [11]. In the latter case the EPRspectral profile was independent of V2O5 concentration and onlyan increase of intensity was observed with increasing V loading, incontrast to the present case (compare Fig. 3a with Fig. 4a). Only theV10Al sample provided spectra resolved enough to be simulated.
Fig. 4. EPR spectra at room temperature of sample V25Al (a) as prepared and (b)
after reaction in co-feed mode. FMR1 and FMR2 indicate ferromagnetic resonance
features due to V4+-based clusters (see text).
An EPR line width of ca. 50 G, as in this case, was also reported withpure V2O5 [27]. However, those lines were Gaussian-shaped,suggesting the presence of static disorder. In contrast, the EPR linesreported here are always Lorentzian-shaped, with both V–Si–O[11] and V–Al–O, indicating homogeneous line broadening in bothcases. However, the EPR lines were by far narrower with V–Si–Othan with V–Al–O (see Table 3) suggesting the presence, in thelatter case, of more efficient spin relaxation processes amonginteracting spins. Indeed, spin–spin interactions became evenmore evident at higher concentration of V, forming V4+-basedferromagnetic clusters (Fig. 4a) (vide infra). The fact that no FMRband was noticed with the calcined AlVO4 sample (Fig. 5a), in spiteof ca. 70% V concentration, can be explained by assuming that inthis sample V4+ ions occupy crystal sites, forming a mixed oxidewith Al, so that no magnetic clusters can form from V–Vinteraction. However, the V4+ ions should interact at least in partwith each other also in this sample, as revealed by the broadeningof the spectral lines.
Reciprocally interacting V4+ ions are observed also afterreaction carried out under anaerobic conditions over V10Al.Indeed, an increased spectral intensity accompanied by adecreased resolution is observed in this case.
A completely different behaviour is shown by the spentcatalysts containing higher amounts of VOx (vide infra). On thecontrary, the intensity of both EPR and FMR spectra decreased aftertests in the co-feed mode (Fig. 4b), indicating that bothparamagnetic and ferromagnetic V4+-based species are involvedin this process.
The actual location of V4+ ions in host lattices has been thesubject of controversial debates for many systems [28–37]including V2O5 supported on inert oxides like Al2O3 and SiO2
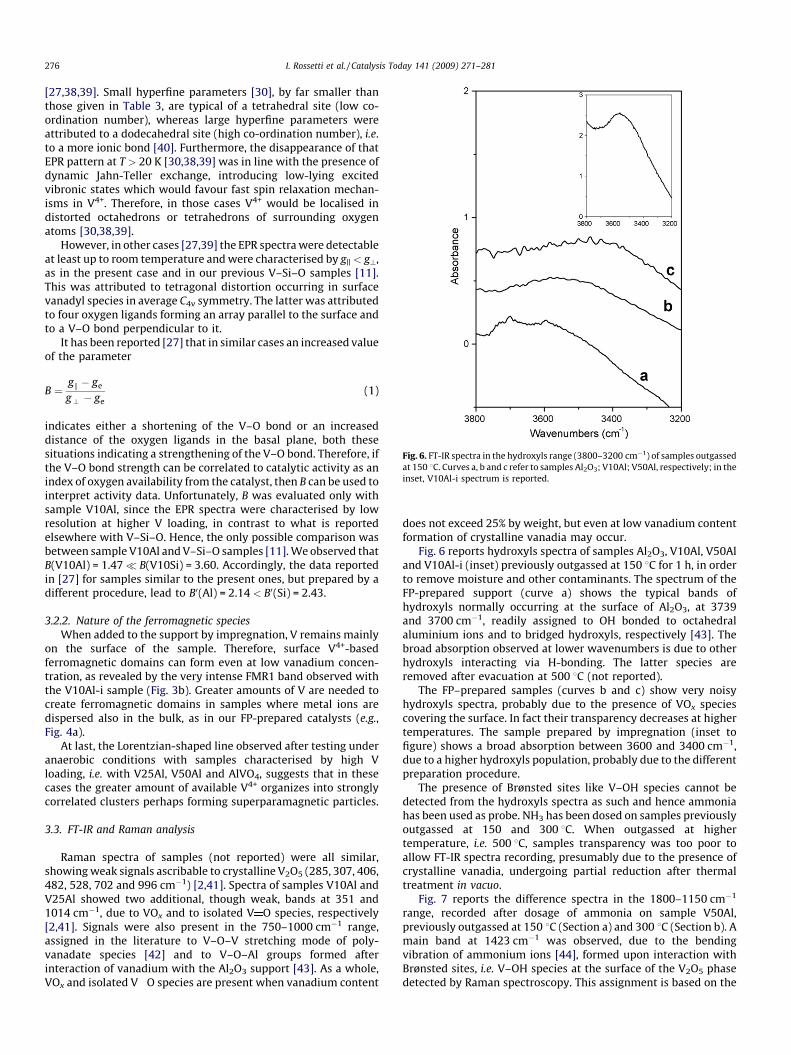
Fig. 6. FT-IR spectra in the hydroxyls range (3800–3200 cm�1) of samples outgassed
at 150 8C. Curves a, b and c refer to samples Al2O3; V10Al; V50Al, respectively; in the
inset, V10Al-i spectrum is reported.
I. Rossetti et al. / Catalysis Today 141 (2009) 271–281276
[27,38,39]. Small hyperfine parameters [30], by far smaller thanthose given in Table 3, are typical of a tetrahedral site (low co-ordination number), whereas large hyperfine parameters wereattributed to a dodecahedral site (high co-ordination number), i.e.to a more ionic bond [40]. Furthermore, the disappearance of thatEPR pattern at T > 20 K [30,38,39] was in line with the presence ofdynamic Jahn-Teller exchange, introducing low-lying excitedvibronic states which would favour fast spin relaxation mechan-isms in V4+. Therefore, in those cases V4+ would be localised indistorted octahedrons or tetrahedrons of surrounding oxygenatoms [30,38,39].
However, in other cases [27,39] the EPR spectra were detectableat least up to room temperature and were characterised by gk < g?,as in the present case and in our previous V–Si–O samples [11].This was attributed to tetragonal distortion occurring in surfacevanadyl species in average C4v symmetry. The latter was attributedto four oxygen ligands forming an array parallel to the surface andto a V–O bond perpendicular to it.
It has been reported [27] that in similar cases an increased valueof the parameter
B ¼gk � ge
g? � ge(1)
indicates either a shortening of the V–O bond or an increaseddistance of the oxygen ligands in the basal plane, both thesesituations indicating a strengthening of the V–O bond. Therefore, ifthe V–O bond strength can be correlated to catalytic activity as anindex of oxygen availability from the catalyst, then B can be used tointerpret activity data. Unfortunately, B was evaluated only withsample V10Al, since the EPR spectra were characterised by lowresolution at higher V loading, in contrast to what is reportedelsewhere with V–Si–O. Hence, the only possible comparison wasbetween sample V10Al and V–Si–O samples [11]. We observed thatB(V10Al) = 1.47� B(V10Si) = 3.60. Accordingly, the data reportedin [27] for samples similar to the present ones, but prepared by adifferent procedure, lead to B0(Al) = 2.14 < B0(Si) = 2.43.
3.2.2. Nature of the ferromagnetic species
When added to the support by impregnation, V remains mainlyon the surface of the sample. Therefore, surface V4+-basedferromagnetic domains can form even at low vanadium concen-tration, as revealed by the very intense FMR1 band observed withthe V10Al-i sample (Fig. 3b). Greater amounts of V are needed tocreate ferromagnetic domains in samples where metal ions aredispersed also in the bulk, as in our FP-prepared catalysts (e.g.,Fig. 4a).
At last, the Lorentzian-shaped line observed after testing underanaerobic conditions with samples characterised by high Vloading, i.e. with V25Al, V50Al and AlVO4, suggests that in thesecases the greater amount of available V4+ organizes into stronglycorrelated clusters perhaps forming superparamagnetic particles.
3.3. FT-IR and Raman analysis
Raman spectra of samples (not reported) were all similar,showing weak signals ascribable to crystalline V2O5 (285, 307, 406,482, 528, 702 and 996 cm�1) [2,41]. Spectra of samples V10Al andV25Al showed two additional, though weak, bands at 351 and1014 cm�1, due to VOx and to isolated V O species, respectively[2,41]. Signals were also present in the 750–1000 cm�1 range,assigned in the literature to V–O–V stretching mode of poly-vanadate species [42] and to V–O–Al groups formed afterinteraction of vanadium with the Al2O3 support [43]. As a whole,VOx and isolated V O species are present when vanadium content
does not exceed 25% by weight, but even at low vanadium contentformation of crystalline vanadia may occur.
Fig. 6 reports hydroxyls spectra of samples Al2O3, V10Al, V50Aland V10Al-i (inset) previously outgassed at 150 8C for 1 h, in orderto remove moisture and other contaminants. The spectrum of theFP-prepared support (curve a) shows the typical bands ofhydroxyls normally occurring at the surface of Al2O3, at 3739and 3700 cm�1, readily assigned to OH bonded to octahedralaluminium ions and to bridged hydroxyls, respectively [43]. Thebroad absorption observed at lower wavenumbers is due to otherhydroxyls interacting via H-bonding. The latter species areremoved after evacuation at 500 8C (not reported).
The FP–prepared samples (curves b and c) show very noisyhydroxyls spectra, probably due to the presence of VOx speciescovering the surface. In fact their transparency decreases at highertemperatures. The sample prepared by impregnation (inset tofigure) shows a broad absorption between 3600 and 3400 cm�1,due to a higher hydroxyls population, probably due to the differentpreparation procedure.
The presence of Brønsted sites like V–OH species cannot bedetected from the hydroxyls spectra as such and hence ammoniahas been used as probe. NH3 has been dosed on samples previouslyoutgassed at 150 and 300 8C. When outgassed at highertemperature, i.e. 500 8C, samples transparency was too poor toallow FT-IR spectra recording, presumably due to the presence ofcrystalline vanadia, undergoing partial reduction after thermaltreatment in vacuo.
Fig. 7 reports the difference spectra in the 1800–1150 cm�1
range, recorded after dosage of ammonia on sample V50Al,previously outgassed at 150 8C (Section a) and 300 8C (Section b). Amain band at 1423 cm�1 was observed, due to the bendingvibration of ammonium ions [44], formed upon interaction withBrønsted sites, i.e. V–OH species at the surface of the V2O5 phasedetected by Raman spectroscopy. This assignment is based on the
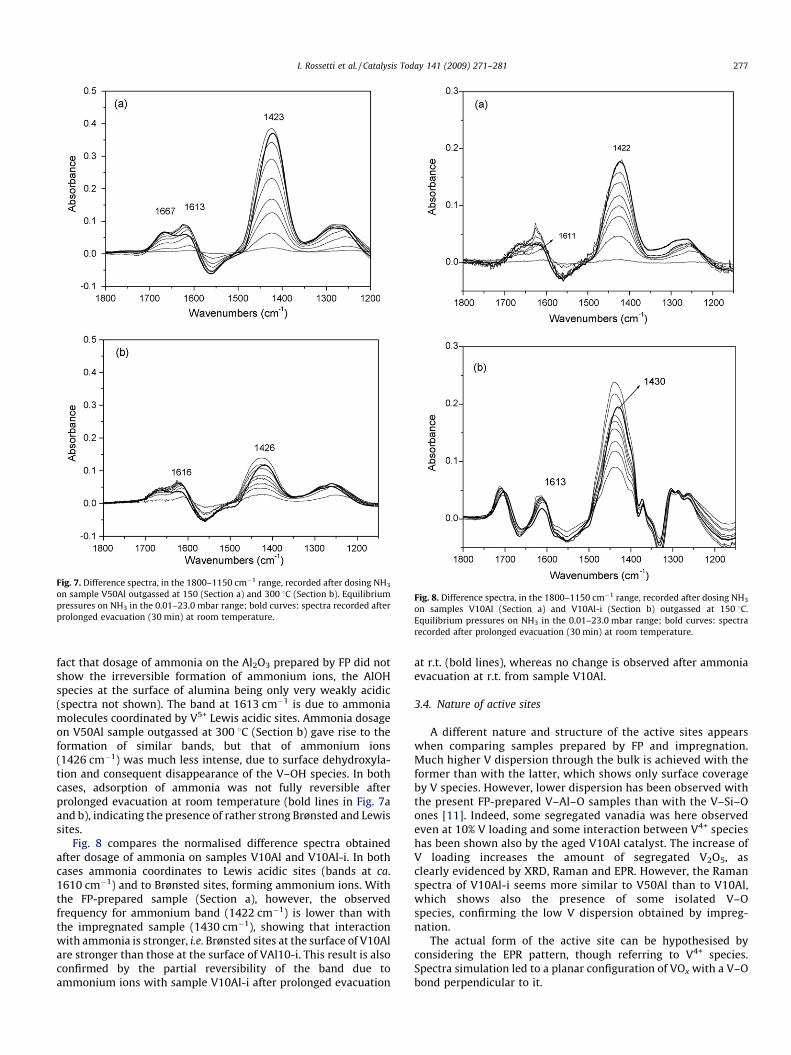
Fig. 7. Difference spectra, in the 1800–1150 cm�1 range, recorded after dosing NH3
on sample V50Al outgassed at 150 (Section a) and 300 8C (Section b). Equilibrium
pressures on NH3 in the 0.01–23.0 mbar range; bold curves: spectra recorded after
prolonged evacuation (30 min) at room temperature.
Fig. 8. Difference spectra, in the 1800–1150 cm�1 range, recorded after dosing NH3
on samples V10Al (Section a) and V10Al-i (Section b) outgassed at 150 8C.
Equilibrium pressures on NH3 in the 0.01–23.0 mbar range; bold curves: spectra
recorded after prolonged evacuation (30 min) at room temperature.
I. Rossetti et al. / Catalysis Today 141 (2009) 271–281 277
fact that dosage of ammonia on the Al2O3 prepared by FP did notshow the irreversible formation of ammonium ions, the AlOHspecies at the surface of alumina being only very weakly acidic(spectra not shown). The band at 1613 cm�1 is due to ammoniamolecules coordinated by V5+ Lewis acidic sites. Ammonia dosageon V50Al sample outgassed at 300 8C (Section b) gave rise to theformation of similar bands, but that of ammonium ions(1426 cm�1) was much less intense, due to surface dehydroxyla-tion and consequent disappearance of the V–OH species. In bothcases, adsorption of ammonia was not fully reversible afterprolonged evacuation at room temperature (bold lines in Fig. 7aand b), indicating the presence of rather strong Brønsted and Lewissites.
Fig. 8 compares the normalised difference spectra obtainedafter dosage of ammonia on samples V10Al and V10Al-i. In bothcases ammonia coordinates to Lewis acidic sites (bands at ca.1610 cm�1) and to Brønsted sites, forming ammonium ions. Withthe FP-prepared sample (Section a), however, the observedfrequency for ammonium band (1422 cm�1) is lower than withthe impregnated sample (1430 cm�1), showing that interactionwith ammonia is stronger, i.e. Brønsted sites at the surface of V10Alare stronger than those at the surface of VAl10-i. This result is alsoconfirmed by the partial reversibility of the band due toammonium ions with sample V10Al-i after prolonged evacuation
at r.t. (bold lines), whereas no change is observed after ammoniaevacuation at r.t. from sample V10Al.
3.4. Nature of active sites
A different nature and structure of the active sites appearswhen comparing samples prepared by FP and impregnation.Much higher V dispersion through the bulk is achieved with theformer than with the latter, which shows only surface coverageby V species. However, lower dispersion has been observed withthe present FP-prepared V–Al–O samples than with the V–Si–Oones [11]. Indeed, some segregated vanadia was here observedeven at 10% V loading and some interaction between V4+ specieshas been shown also by the aged V10Al catalyst. The increase ofV loading increases the amount of segregated V2O5, asclearly evidenced by XRD, Raman and EPR. However, the Ramanspectra of V10Al-i seems more similar to V50Al than to V10Al,which shows also the presence of some isolated V–Ospecies, confirming the low V dispersion obtained by impreg-nation.
The actual form of the active site can be hypothesised byconsidering the EPR pattern, though referring to V4+ species.Spectra simulation led to a planar configuration of VOx with a V–Obond perpendicular to it.
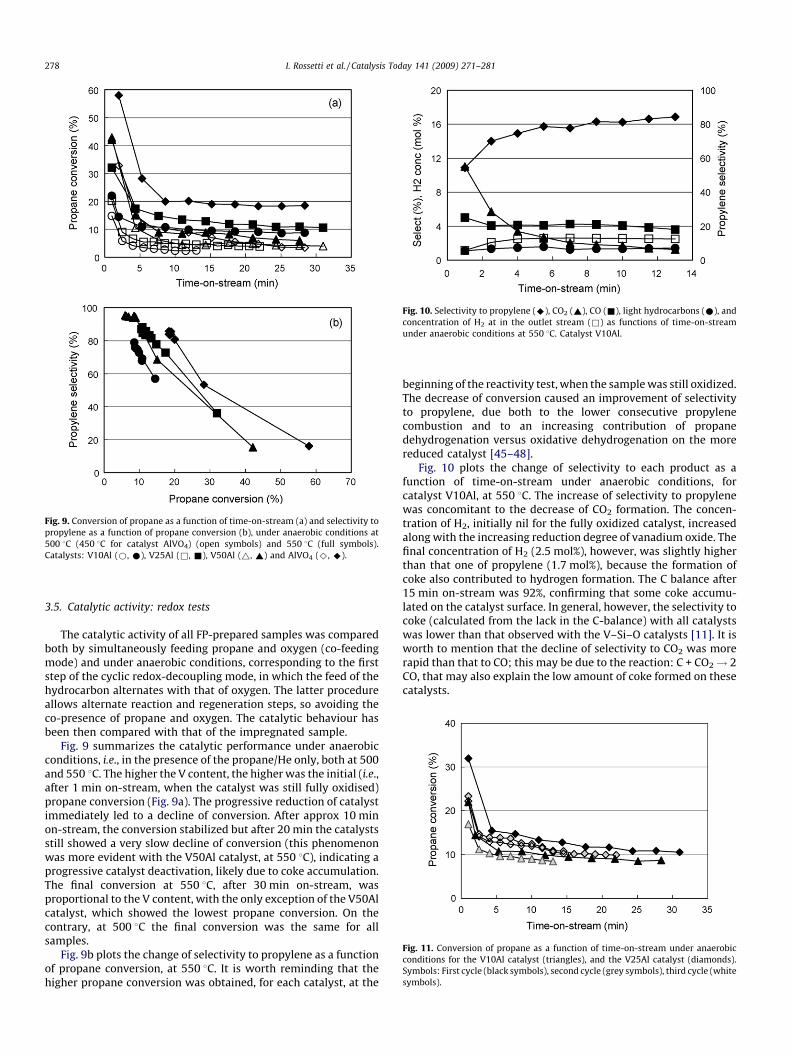
Fig. 9. Conversion of propane as a function of time-on-stream (a) and selectivity to
propylene as a function of propane conversion (b), under anaerobic conditions at
500 8C (450 8C for catalyst AlVO4) (open symbols) and 550 8C (full symbols).
Catalysts: V10Al (*, *), V25Al (&, &), V50Al (~, ~) and AlVO4 (^, ^).
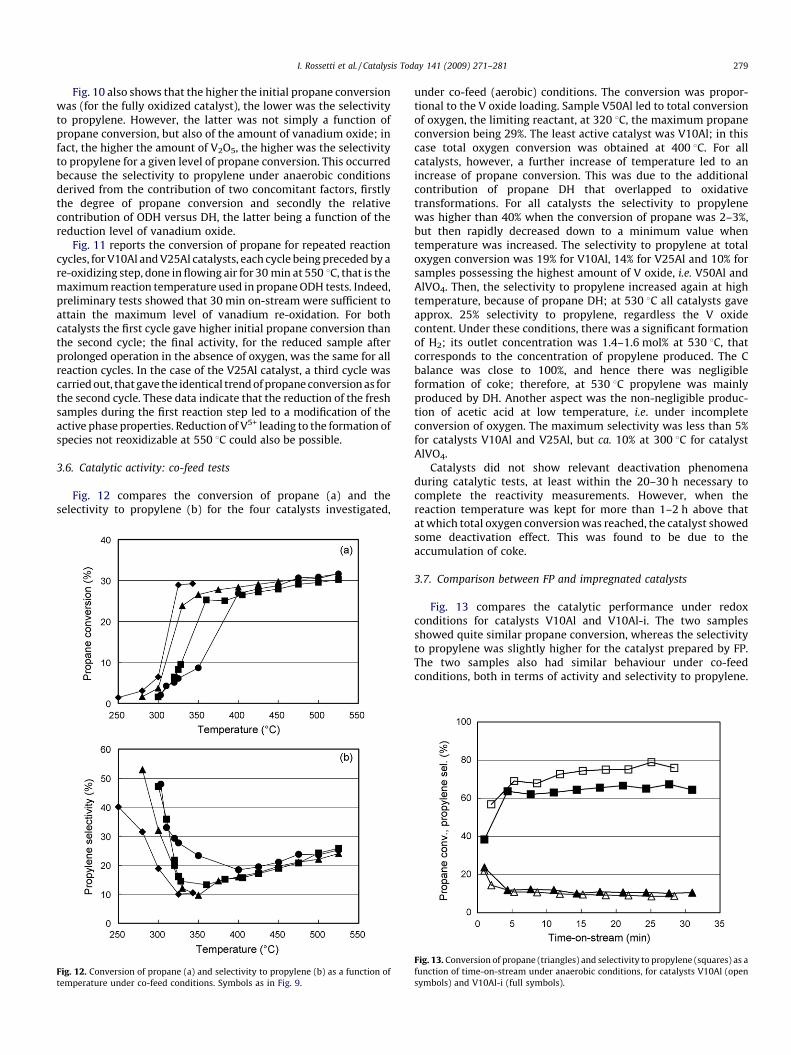
Fig. 10. Selectivity to propylene (^), CO2 (~), CO (&), light hydrocarbons (*), and
concentration of H2 at in the outlet stream (&) as functions of time-on-stream
under anaerobic conditions at 550 8C. Catalyst V10Al.
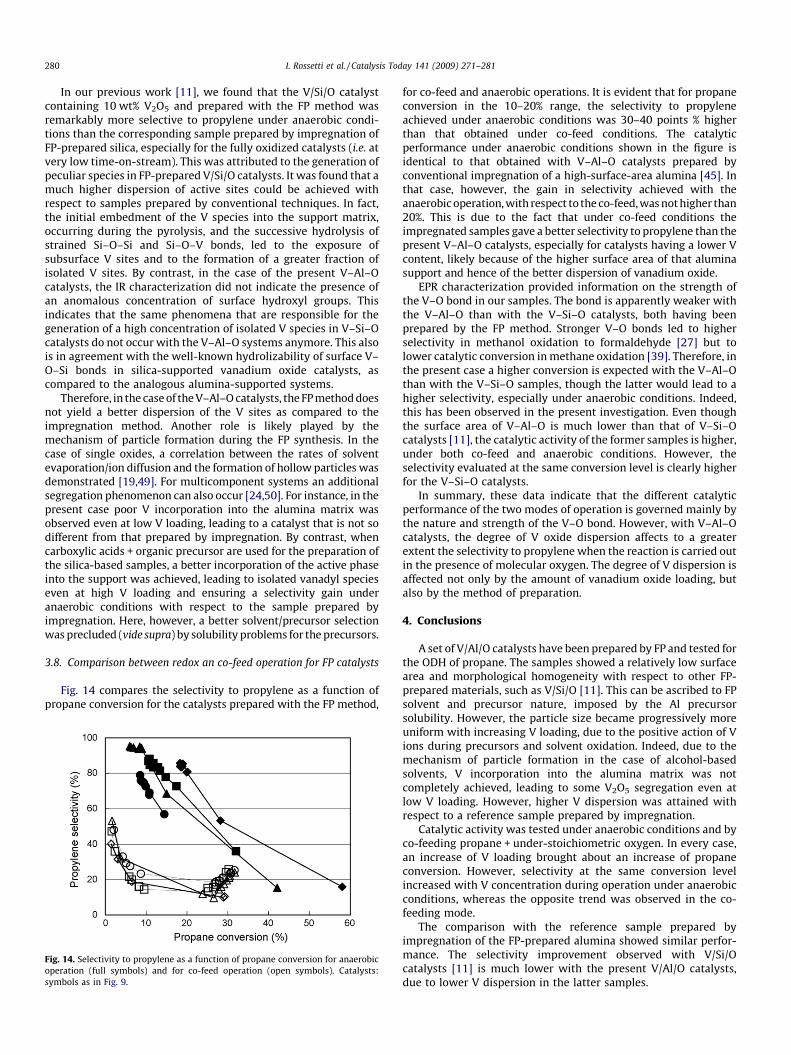
Fig. 11. Conversion of propane as a function of time-on-stream under anaerobic
conditions for the V10Al catalyst (triangles), and the V25Al catalyst (diamonds).
Symbols: First cycle (black symbols), second cycle (grey symbols), third cycle (white
symbols).
I. Rossetti et al. / Catalysis Today 141 (2009) 271–281278
3.5. Catalytic activity: redox tests
The catalytic activity of all FP-prepared samples was comparedboth by simultaneously feeding propane and oxygen (co-feedingmode) and under anaerobic conditions, corresponding to the firststep of the cyclic redox-decoupling mode, in which the feed of thehydrocarbon alternates with that of oxygen. The latter procedureallows alternate reaction and regeneration steps, so avoiding theco-presence of propane and oxygen. The catalytic behaviour hasbeen then compared with that of the impregnated sample.
Fig. 9 summarizes the catalytic performance under anaerobicconditions, i.e., in the presence of the propane/He only, both at 500and 550 8C. The higher the V content, the higher was the initial (i.e.,after 1 min on-stream, when the catalyst was still fully oxidised)propane conversion (Fig. 9a). The progressive reduction of catalystimmediately led to a decline of conversion. After approx 10 minon-stream, the conversion stabilized but after 20 min the catalystsstill showed a very slow decline of conversion (this phenomenonwas more evident with the V50Al catalyst, at 550 8C), indicating aprogressive catalyst deactivation, likely due to coke accumulation.The final conversion at 550 8C, after 30 min on-stream, wasproportional to the V content, with the only exception of the V50Alcatalyst, which showed the lowest propane conversion. On thecontrary, at 500 8C the final conversion was the same for allsamples.
Fig. 9b plots the change of selectivity to propylene as a functionof propane conversion, at 550 8C. It is worth reminding that thehigher propane conversion was obtained, for each catalyst, at the
beginning of the reactivity test, when the sample was still oxidized.The decrease of conversion caused an improvement of selectivityto propylene, due both to the lower consecutive propylenecombustion and to an increasing contribution of propanedehydrogenation versus oxidative dehydrogenation on the morereduced catalyst [45–48].
Fig. 10 plots the change of selectivity to each product as afunction of time-on-stream under anaerobic conditions, forcatalyst V10Al, at 550 8C. The increase of selectivity to propylenewas concomitant to the decrease of CO2 formation. The concen-tration of H2, initially nil for the fully oxidized catalyst, increasedalong with the increasing reduction degree of vanadium oxide. Thefinal concentration of H2 (2.5 mol%), however, was slightly higherthan that one of propylene (1.7 mol%), because the formation ofcoke also contributed to hydrogen formation. The C balance after15 min on-stream was 92%, confirming that some coke accumu-lated on the catalyst surface. In general, however, the selectivity tocoke (calculated from the lack in the C-balance) with all catalystswas lower than that observed with the V–Si–O catalysts [11]. It isworth to mention that the decline of selectivity to CO2 was morerapid than that to CO; this may be due to the reaction: C + CO2! 2CO, that may also explain the low amount of coke formed on thesecatalysts.
I. Rossetti et al. / Catalysis Today 141 (2009) 271–281 279
Fig. 10 also shows that the higher the initial propane conversionwas (for the fully oxidized catalyst), the lower was the selectivityto propylene. However, the latter was not simply a function ofpropane conversion, but also of the amount of vanadium oxide; infact, the higher the amount of V2O5, the higher was the selectivityto propylene for a given level of propane conversion. This occurredbecause the selectivity to propylene under anaerobic conditionsderived from the contribution of two concomitant factors, firstlythe degree of propane conversion and secondly the relativecontribution of ODH versus DH, the latter being a function of thereduction level of vanadium oxide.
Fig. 11 reports the conversion of propane for repeated reactioncycles, for V10Al and V25Al catalysts, each cycle being preceded by are-oxidizing step, done in flowing air for 30 min at 550 8C, that is themaximum reaction temperature used in propane ODH tests. Indeed,preliminary tests showed that 30 min on-stream were sufficient toattain the maximum level of vanadium re-oxidation. For bothcatalysts the first cycle gave higher initial propane conversion thanthe second cycle; the final activity, for the reduced sample afterprolonged operation in the absence of oxygen, was the same for allreaction cycles. In the case of the V25Al catalyst, a third cycle wascarried out, that gave the identical trend of propane conversion as forthe second cycle. These data indicate that the reduction of the freshsamples during the first reaction step led to a modification of theactive phase properties. Reduction of V5+ leading to the formation ofspecies not reoxidizable at 550 8C could also be possible.
3.6. Catalytic activity: co-feed tests
Fig. 12 compares the conversion of propane (a) and theselectivity to propylene (b) for the four catalysts investigated,
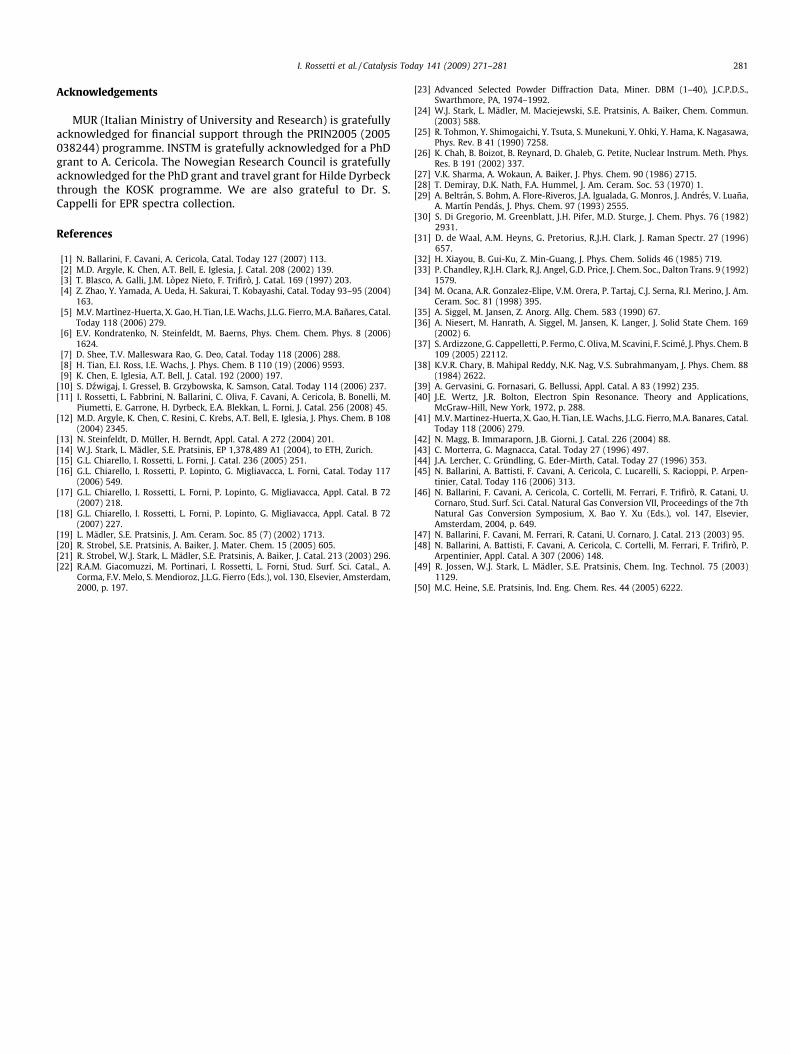
Fig. 12. Conversion of propane (a) and selectivity to propylene (b) as a function of
temperature under co-feed conditions. Symbols as in Fig. 9.
under co-feed (aerobic) conditions. The conversion was propor-tional to the V oxide loading. Sample V50Al led to total conversionof oxygen, the limiting reactant, at 320 8C, the maximum propaneconversion being 29%. The least active catalyst was V10Al; in thiscase total oxygen conversion was obtained at 400 8C. For allcatalysts, however, a further increase of temperature led to anincrease of propane conversion. This was due to the additionalcontribution of propane DH that overlapped to oxidativetransformations. For all catalysts the selectivity to propylenewas higher than 40% when the conversion of propane was 2–3%,but then rapidly decreased down to a minimum value whentemperature was increased. The selectivity to propylene at totaloxygen conversion was 19% for V10Al, 14% for V25Al and 10% forsamples possessing the highest amount of V oxide, i.e. V50Al andAlVO4. Then, the selectivity to propylene increased again at hightemperature, because of propane DH; at 530 8C all catalysts gaveapprox. 25% selectivity to propylene, regardless the V oxidecontent. Under these conditions, there was a significant formationof H2; its outlet concentration was 1.4–1.6 mol% at 530 8C, thatcorresponds to the concentration of propylene produced. The Cbalance was close to 100%, and hence there was negligibleformation of coke; therefore, at 530 8C propylene was mainlyproduced by DH. Another aspect was the non-negligible produc-tion of acetic acid at low temperature, i.e. under incompleteconversion of oxygen. The maximum selectivity was less than 5%for catalysts V10Al and V25Al, but ca. 10% at 300 8C for catalystAlVO4.
Catalysts did not show relevant deactivation phenomenaduring catalytic tests, at least within the 20–30 h necessary tocomplete the reactivity measurements. However, when thereaction temperature was kept for more than 1–2 h above thatat which total oxygen conversion was reached, the catalyst showedsome deactivation effect. This was found to be due to theaccumulation of coke.
3.7. Comparison between FP and impregnated catalysts
Fig. 13 compares the catalytic performance under redoxconditions for catalysts V10Al and V10Al-i. The two samplesshowed quite similar propane conversion, whereas the selectivityto propylene was slightly higher for the catalyst prepared by FP.The two samples also had similar behaviour under co-feedconditions, both in terms of activity and selectivity to propylene.
Fig. 13. Conversion of propane (triangles) and selectivity to propylene (squares) as a
function of time-on-stream under anaerobic conditions, for catalysts V10Al (open
symbols) and V10Al-i (full symbols).
I. Rossetti et al. / Catalysis Today 141 (2009) 271–281280
In our previous work [11], we found that the V/Si/O catalystcontaining 10 wt% V2O5 and prepared with the FP method wasremarkably more selective to propylene under anaerobic condi-tions than the corresponding sample prepared by impregnation ofFP-prepared silica, especially for the fully oxidized catalysts (i.e. atvery low time-on-stream). This was attributed to the generation ofpeculiar species in FP-prepared V/Si/O catalysts. It was found that amuch higher dispersion of active sites could be achieved withrespect to samples prepared by conventional techniques. In fact,the initial embedment of the V species into the support matrix,occurring during the pyrolysis, and the successive hydrolysis ofstrained Si–O–Si and Si–O–V bonds, led to the exposure ofsubsurface V sites and to the formation of a greater fraction ofisolated V sites. By contrast, in the case of the present V–Al–Ocatalysts, the IR characterization did not indicate the presence ofan anomalous concentration of surface hydroxyl groups. Thisindicates that the same phenomena that are responsible for thegeneration of a high concentration of isolated V species in V–Si–Ocatalysts do not occur with the V–Al–O systems anymore. This alsois in agreement with the well-known hydrolizability of surface V–O–Si bonds in silica-supported vanadium oxide catalysts, ascompared to the analogous alumina-supported systems.
Therefore, in the case of the V–Al–O catalysts, the FP method doesnot yield a better dispersion of the V sites as compared to theimpregnation method. Another role is likely played by themechanism of particle formation during the FP synthesis. In thecase of single oxides, a correlation between the rates of solventevaporation/ion diffusion and the formation of hollow particles wasdemonstrated [19,49]. For multicomponent systems an additionalsegregation phenomenon can also occur [24,50]. For instance, in thepresent case poor V incorporation into the alumina matrix wasobserved even at low V loading, leading to a catalyst that is not sodifferent from that prepared by impregnation. By contrast, whencarboxylic acids + organic precursor are used for the preparation ofthe silica-based samples, a better incorporation of the active phaseinto the support was achieved, leading to isolated vanadyl specieseven at high V loading and ensuring a selectivity gain underanaerobic conditions with respect to the sample prepared byimpregnation. Here, however, a better solvent/precursor selectionwas precluded (vide supra) by solubility problems for the precursors.
3.8. Comparison between redox an co-feed operation for FP catalysts
Fig. 14 compares the selectivity to propylene as a function ofpropane conversion for the catalysts prepared with the FP method,
Fig. 14. Selectivity to propylene as a function of propane conversion for anaerobic
operation (full symbols) and for co-feed operation (open symbols). Catalysts:
symbols as in Fig. 9.
for co-feed and anaerobic operations. It is evident that for propaneconversion in the 10–20% range, the selectivity to propyleneachieved under anaerobic conditions was 30–40 points % higherthan that obtained under co-feed conditions. The catalyticperformance under anaerobic conditions shown in the figure isidentical to that obtained with V–Al–O catalysts prepared byconventional impregnation of a high-surface-area alumina [45]. Inthat case, however, the gain in selectivity achieved with theanaerobic operation, with respect to the co-feed, was not higher than20%. This is due to the fact that under co-feed conditions theimpregnated samples gave a better selectivity to propylene than thepresent V–Al–O catalysts, especially for catalysts having a lower Vcontent, likely because of the higher surface area of that aluminasupport and hence of the better dispersion of vanadium oxide.
EPR characterization provided information on the strength ofthe V–O bond in our samples. The bond is apparently weaker withthe V–Al–O than with the V–Si–O catalysts, both having beenprepared by the FP method. Stronger V–O bonds led to higherselectivity in methanol oxidation to formaldehyde [27] but tolower catalytic conversion in methane oxidation [39]. Therefore, inthe present case a higher conversion is expected with the V–Al–Othan with the V–Si–O samples, though the latter would lead to ahigher selectivity, especially under anaerobic conditions. Indeed,this has been observed in the present investigation. Even thoughthe surface area of V–Al–O is much lower than that of V–Si–Ocatalysts [11], the catalytic activity of the former samples is higher,under both co-feed and anaerobic conditions. However, theselectivity evaluated at the same conversion level is clearly higherfor the V–Si–O catalysts.
In summary, these data indicate that the different catalyticperformance of the two modes of operation is governed mainly bythe nature and strength of the V–O bond. However, with V–Al–Ocatalysts, the degree of V oxide dispersion affects to a greaterextent the selectivity to propylene when the reaction is carried outin the presence of molecular oxygen. The degree of V dispersion isaffected not only by the amount of vanadium oxide loading, butalso by the method of preparation.
4. Conclusions
A set of V/Al/O catalysts have been prepared by FP and tested forthe ODH of propane. The samples showed a relatively low surfacearea and morphological homogeneity with respect to other FP-prepared materials, such as V/Si/O [11]. This can be ascribed to FPsolvent and precursor nature, imposed by the Al precursorsolubility. However, the particle size became progressively moreuniform with increasing V loading, due to the positive action of Vions during precursors and solvent oxidation. Indeed, due to themechanism of particle formation in the case of alcohol-basedsolvents, V incorporation into the alumina matrix was notcompletely achieved, leading to some V2O5 segregation even atlow V loading. However, higher V dispersion was attained withrespect to a reference sample prepared by impregnation.
Catalytic activity was tested under anaerobic conditions and byco-feeding propane + under-stoichiometric oxygen. In every case,an increase of V loading brought about an increase of propaneconversion. However, selectivity at the same conversion levelincreased with V concentration during operation under anaerobicconditions, whereas the opposite trend was observed in the co-feeding mode.
The comparison with the reference sample prepared byimpregnation of the FP-prepared alumina showed similar perfor-mance. The selectivity improvement observed with V/Si/Ocatalysts [11] is much lower with the present V/Al/O catalysts,due to lower V dispersion in the latter samples.
I. Rossetti et al. / Catalysis Today 141 (2009) 271–281 281
Acknowledgements
MUR (Italian Ministry of University and Research) is gratefullyacknowledged for financial support through the PRIN2005 (2005038244) programme. INSTM is gratefully acknowledged for a PhDgrant to A. Cericola. The Nowegian Research Council is gratefullyacknowledged for the PhD grant and travel grant for Hilde Dyrbeckthrough the KOSK programme. We are also grateful to Dr. S.Cappelli for EPR spectra collection.
References
[1] N. Ballarini, F. Cavani, A. Cericola, Catal. Today 127 (2007) 113.[2] M.D. Argyle, K. Chen, A.T. Bell, E. Iglesia, J. Catal. 208 (2002) 139.[3] T. Blasco, A. Galli, J.M. Lopez Nieto, F. Trifiro, J. Catal. 169 (1997) 203.[4] Z. Zhao, Y. Yamada, A. Ueda, H. Sakurai, T. Kobayashi, Catal. Today 93–95 (2004)
163.[5] M.V. Martınez-Huerta, X. Gao, H. Tian, I.E. Wachs, J.L.G. Fierro, M.A. Banares, Catal.
Today 118 (2006) 279.[6] E.V. Kondratenko, N. Steinfeldt, M. Baerns, Phys. Chem. Chem. Phys. 8 (2006)
1624.[7] D. Shee, T.V. Malleswara Rao, G. Deo, Catal. Today 118 (2006) 288.[8] H. Tian, E.I. Ross, I.E. Wachs, J. Phys. Chem. B 110 (19) (2006) 9593.[9] K. Chen, E. Iglesia, A.T. Bell, J. Catal. 192 (2000) 197.
[10] S. Dzwigaj, I. Gressel, B. Grzybowska, K. Samson, Catal. Today 114 (2006) 237.[11] I. Rossetti, L. Fabbrini, N. Ballarini, C. Oliva, F. Cavani, A. Cericola, B. Bonelli, M.
Piumetti, E. Garrone, H. Dyrbeck, E.A. Blekkan, L. Forni, J. Catal. 256 (2008) 45.[12] M.D. Argyle, K. Chen, C. Resini, C. Krebs, A.T. Bell, E. Iglesia, J. Phys. Chem. B 108
(2004) 2345.[13] N. Steinfeldt, D. Muller, H. Berndt, Appl. Catal. A 272 (2004) 201.[14] W.J. Stark, L. Madler, S.E. Pratsinis, EP 1,378,489 A1 (2004), to ETH, Zurich.[15] G.L. Chiarello, I. Rossetti, L. Forni, J. Catal. 236 (2005) 251.[16] G.L. Chiarello, I. Rossetti, P. Lopinto, G. Migliavacca, L. Forni, Catal. Today 117
(2006) 549.[17] G.L. Chiarello, I. Rossetti, L. Forni, P. Lopinto, G. Migliavacca, Appl. Catal. B 72
(2007) 218.[18] G.L. Chiarello, I. Rossetti, L. Forni, P. Lopinto, G. Migliavacca, Appl. Catal. B 72
(2007) 227.[19] L. Madler, S.E. Pratsinis, J. Am. Ceram. Soc. 85 (7) (2002) 1713.[20] R. Strobel, S.E. Pratsinis, A. Baiker, J. Mater. Chem. 15 (2005) 605.[21] R. Strobel, W.J. Stark, L. Madler, S.E. Pratsinis, A. Baiker, J. Catal. 213 (2003) 296.[22] R.A.M. Giacomuzzi, M. Portinari, I. Rossetti, L. Forni, Stud. Surf. Sci. Catal., A.
Corma, F.V. Melo, S. Mendioroz, J.L.G. Fierro (Eds.), vol. 130, Elsevier, Amsterdam,2000, p. 197.
[23] Advanced Selected Powder Diffraction Data, Miner. DBM (1–40), J.C.P.D.S.,Swarthmore, PA, 1974–1992.
[24] W.J. Stark, L. Madler, M. Maciejewski, S.E. Pratsinis, A. Baiker, Chem. Commun.(2003) 588.
[25] R. Tohmon, Y. Shimogaichi, Y. Tsuta, S. Munekuni, Y. Ohki, Y. Hama, K. Nagasawa,Phys. Rev. B 41 (1990) 7258.
[26] K. Chah, B. Boizot, B. Reynard, D. Ghaleb, G. Petite, Nuclear Instrum. Meth. Phys.Res. B 191 (2002) 337.
[27] V.K. Sharma, A. Wokaun, A. Baiker, J. Phys. Chem. 90 (1986) 2715.[28] T. Demiray, D.K. Nath, F.A. Hummel, J. Am. Ceram. Soc. 53 (1970) 1.[29] A. Beltran, S. Bohm, A. Flore-Riveros, J.A. Igualada, G. Monros, J. Andres, V. Luana,
A. Martın Pendas, J. Phys. Chem. 97 (1993) 2555.[30] S. Di Gregorio, M. Greenblatt, J.H. Pifer, M.D. Sturge, J. Chem. Phys. 76 (1982)
2931.[31] D. de Waal, A.M. Heyns, G. Pretorius, R.J.H. Clark, J. Raman Spectr. 27 (1996)
657.[32] H. Xiayou, B. Gui-Ku, Z. Min-Guang, J. Phys. Chem. Solids 46 (1985) 719.[33] P. Chandley, R.J.H. Clark, R.J. Angel, G.D. Price, J. Chem. Soc., Dalton Trans. 9 (1992)
1579.[34] M. Ocana, A.R. Gonzalez-Elipe, V.M. Orera, P. Tartaj, C.J. Serna, R.I. Merino, J. Am.
Ceram. Soc. 81 (1998) 395.[35] A. Siggel, M. Jansen, Z. Anorg. Allg. Chem. 583 (1990) 67.[36] A. Niesert, M. Hanrath, A. Siggel, M. Jansen, K. Langer, J. Solid State Chem. 169
(2002) 6.[37] S. Ardizzone, G. Cappelletti, P. Fermo, C. Oliva, M. Scavini, F. Scime, J. Phys. Chem. B
109 (2005) 22112.[38] K.V.R. Chary, B. Mahipal Reddy, N.K. Nag, V.S. Subrahmanyam, J. Phys. Chem. 88
(1984) 2622.[39] A. Gervasini, G. Fornasari, G. Bellussi, Appl. Catal. A 83 (1992) 235.[40] J.E. Wertz, J.R. Bolton, Electron Spin Resonance. Theory and Applications,
McGraw-Hill, New York, 1972, p. 288.[41] M.V. Martinez-Huerta, X. Gao, H. Tian, I.E. Wachs, J.L.G. Fierro, M.A. Banares, Catal.
Today 118 (2006) 279.[42] N. Magg, B. Immaraporn, J.B. Giorni, J. Catal. 226 (2004) 88.[43] C. Morterra, G. Magnacca, Catal. Today 27 (1996) 497.[44] J.A. Lercher, C. Grundling, G. Eder-Mirth, Catal. Today 27 (1996) 353.[45] N. Ballarini, A. Battisti, F. Cavani, A. Cericola, C. Lucarelli, S. Racioppi, P. Arpen-
tinier, Catal. Today 116 (2006) 313.[46] N. Ballarini, F. Cavani, A. Cericola, C. Cortelli, M. Ferrari, F. Trifiro, R. Catani, U.
Cornaro, Stud. Surf. Sci. Catal. Natural Gas Conversion VII, Proceedings of the 7thNatural Gas Conversion Symposium, X. Bao Y. Xu (Eds.), vol. 147, Elsevier,Amsterdam, 2004, p. 649.
[47] N. Ballarini, F. Cavani, M. Ferrari, R. Catani, U. Cornaro, J. Catal. 213 (2003) 95.[48] N. Ballarini, A. Battisti, F. Cavani, A. Cericola, C. Cortelli, M. Ferrari, F. Trifiro, P.
Arpentinier, Appl. Catal. A 307 (2006) 148.[49] R. Jossen, W.J. Stark, L. Madler, S.E. Pratsinis, Chem. Ing. Technol. 75 (2003)
1129.[50] M.C. Heine, S.E. Pratsinis, Ind. Eng. Chem. Res. 44 (2005) 6222.