Determining local-scale solute transport parameters using time domain reflectometry (TDR
Upload
unishivajiCategory
view
4download
0
PLEASE SCROLL DOWN FOR ARTICLE
This article was downloaded by: [Navarkhele, V. V.][INFLIBNET India Order]On: 14 June 2011Access details: Access Details: [subscription number 934171993]Publisher Taylor & FrancisInforma Ltd Registered in England and Wales Registered Number: 1072954 Registered office: Mortimer House, 37-41 Mortimer Street, London W1T 3JH, UK
Physics and Chemistry of LiquidsPublication details, including instructions for authors and subscription information:http://www.informaworld.com/smpp/title~content=t713646857
Dielectric relaxation study of formamide-propylene glycol using timedomain reflectometryV. V. Navarkhelea; M. K. Bhanarkarb
a Department of Physics, Dr. Babasaheb Ambedkar Marathwada University, Aurangabad 431004, Indiab Department of Electronics, Shivaji University, Kolhapur 416004, Maharashtra, India
Online publication date: 13 June 2011
To cite this Article Navarkhele, V. V. and Bhanarkar, M. K.(2011) 'Dielectric relaxation study of formamide-propyleneglycol using time domain reflectometry', Physics and Chemistry of Liquids, 49: 4, 550 — 559To link to this Article: DOI: 10.1080/00319104.2010.508041URL: http://dx.doi.org/10.1080/00319104.2010.508041
Full terms and conditions of use: http://www.informaworld.com/terms-and-conditions-of-access.pdf
This article may be used for research, teaching and private study purposes. Any substantial orsystematic reproduction, re-distribution, re-selling, loan or sub-licensing, systematic supply ordistribution in any form to anyone is expressly forbidden.
The publisher does not give any warranty express or implied or make any representation that the contentswill be complete or accurate or up to date. The accuracy of any instructions, formulae and drug dosesshould be independently verified with primary sources. The publisher shall not be liable for any loss,actions, claims, proceedings, demand or costs or damages whatsoever or howsoever caused arising directlyor indirectly in connection with or arising out of the use of this material.

Physics and Chemistry of LiquidsVol. 49, No. 4, July–August 2011, 550–559
Dielectric relaxation study of formamide–propylene glycol using
time domain reflectometry
V.V. Navarkhelea* and M.K. Bhanarkarb
aDepartment of Physics, Dr. Babasaheb Ambedkar Marathwada University,Aurangabad 431004, India; bDepartment of Electronics, Shivaji University,
Kolhapur 416004, Maharashtra, India
(Received 31 May 2010; final version received 10 July 2010)
Using picoseconds time domain reflectometry, dielectric relaxation studieshave been carried out for formamide (FMD)–propylene glycol (PLG)mixtures over the frequency range from 10MHz to 20GHz at varioustemperatures. The dielectric parameters, i.e. static dielectric constant ("0)and relaxation time (�), have been obtained by Fourier transform and leastsquares fit methods. The excess dielectric properties and Kirkwoodcorrelation factor of the mixtures have also been determined. TheKirkwood angular correlation factor is greater than one (geff4 1) inFMD-rich region and less than one (geff5 1) in PLG-rich region, whichindicates that in the mixture the dipole pairs have been formed in such away that their orientation is parallel in FMD-rich region and antiparallelin the PLG-rich region.
Keywords: dielectric constant; excess dielectric properties; Kirkwoodcorrelation factors; formamide–propylene glycol
1. Introduction
Dielectric relaxation spectroscopy [1], which measures the complex permittivity ofa ample as a function of frequency of the applied electric field, is a powerful tool forthe investigation of the behavior of conducting fluids, and it provides invaluableinsights into their dynamics and structure [2]. The dielectric relaxation studies onbinary mixtures are important for the understanding of hydrogen bonding,intermolecular interactions and dynamics of liquid mixture [3–7]. Amides andglycols have attracted the attention of a number of researchers in different fieldsbecause of high dielectric permittivity and biological applications [8–11]. The amiderepresents an important class of organic solvents due to high polarity, strongsolvating power and large liquid state range [12,13]. In this study, the dielectricrelaxation properties of formamide (FMD)–propylene glycol (PLG) mixtures over awide range of concentrations at different temperatures ranging from 20�C to 40�Cusing a time domain reflectometer (TDR) in the frequency range from 10MHz to20GHz. In this study, FMD has been considered as solution A and PLG as solutionB. The excess dielectric properties, Kirkwood correlation factor and thermodynamicproperties for the binary mixtures have been determined.
*Corresponding author. Email: [email protected]
ISSN 0031–9104 print/ISSN 1029–0451 online
� 2011 Taylor & Francis
DOI: 10.1080/00319104.2010.508041
http://www.informaworld.com
Downloaded By: [Navarkhele, V. V.][INFLIBNET India Order] At: 09:42 14 June 2011

2. Experimental
2.1. Chemicals and sample preparation
The chemicals used in this study are of spectroscopic grade with 99.9% purity andwere used without further purification. The solutions were prepared by mixing FMDwith PLG at 11 different volume percentages of PLG (0% to 100%) in steps of 10%.
2.2. Apparatus
The apparatus used in this study was Tektronix 7854 sampling oscilloscope with7512 TDR unit. In this apparatus, a fast-rising step voltage pulse of 200mVamplitude and 25 ps rise time with reflection frequency of 1KHz is generated andpropagated through a coaxial transmission line. The sample is placed at the end ofthe coaxial transmission line in a standard military application (SMA) coaxial cell.The SMA cell used for this study had 3.5mm outer diameter and 1.35mm effectivepin length. The step pulse generated by a tunnel diode and the pulse which isreflected from the sample cell were sampled by a sampling oscilloscope in the timewindow of 5 ns. The reflected pulse without sample R1(t) and with sample Rx(t) weredigitised with 1024 points in the oscilloscope memory and then transferred to a PCthrough a general purpose interface bus (GPIB) card.
The temperature controller system with water bath and a thermostat has beenused to maintain a constant temperature within the accuracy limit of ��C.The sample cell is surrounded by a heat insulating container through which watermaintained at a constant temperature using a temperature controller systemiscirculated.
3. Data analysis
The time-dependent data was processed to obtain a complex reflection coefficientspectrum �*(!) over the frequency range from 10MHz to 20GHz. Fouriertransformation was given by Shannon [14] and Samulan [15] as
��ð!Þ ¼c
ð j!d Þ� �ð!Þ=qð!Þ½ �, ð1Þ
where � (!) and q (!) are Fourier transforms of [R1(t)�Rx(t)] and [R1(t)þRx(t)],respectively, c the velocity of light, ! the angular frequency, d the effective pin lengthand j¼ � 1.
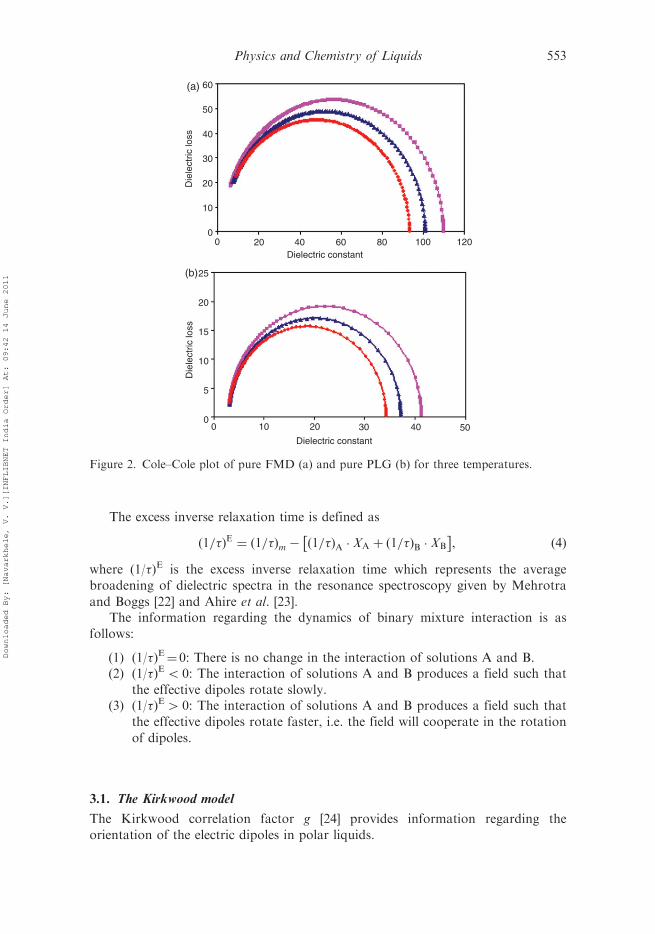
The complex permittivity spectra "*(!) were obtained from reflection coefficientspectra �*(!) by applying calibration method given by Cole et al. [16]. The examplesof complex spectra ("*(!)) of FMD–PLG solutions for three temperatures are shownin Figure 1(a) and (b), respectively. The Cole–Cole plots of pure FMD–PLGsolutions for three temperatures are shown in Figure 2(a) and (b), respectively.The experimental values of "* are fitted with Debye equation [17–19].
"�ð!Þ ¼ "1 þ"0 � "11þ ð j!�Þ½ �
, ð2Þ
where "0, "1 and � are fitting parameters. In Equation (2), "0 is the staticpermittivity, � the relaxation time and "1 the permittivity at high frequency.
Physics and Chemistry of Liquids 551
Downloaded By: [Navarkhele, V. V.][INFLIBNET India Order] At: 09:42 14 June 2011

A nonlinear least squares fit method [20] was used to determine the values
of dielectric parameters.The information related to binary mixture interaction of FMD–PLG may be
obtained by excess properties [21] like excess permittivity and excess inverse
relaxation time in the mixture. The excess permittivity is defined as
"E ¼ ð"0 � "1Þm � ð"0 � "1ÞA � XA þ ð"0 � "1ÞBXB
� �, ð3Þ
where X is the mole fraction and suffixes m, A and B represent mixture, liquid
A (FMD) and liquid B (PLG), respectively. The excess permittivity may provide
qualitative information about the formation of new structure in the mixture
as follows:
(1) "E¼ 0: Indicates that solutions A and B do not interact.(2) "E5 0: Indicates that solutions A and B interact in such a way that the
effective dipole moment gets reduced.(3) "E4 0: Indicates that solutions A and B interact in such a way that the
effective dipole moment increases.
100
120
80
60
40
20
00 5 10 15 20
Frequency in GHz
0 5 10 15 20
Frequency in GHz
50
45
40
35
30
25
20
15
10
5
0
Com
plex
per
mitt
ivity
Com
plex
per
mitt
ivity
e'
e''
e'
e''
(a)
(b)
Figure 1. Dielectric spectrum of pure FMD (a) and pure PLG (b) for three temperatures.
552 V.V. Navarkhele and M.K. Bhanarkar
Downloaded By: [Navarkhele, V. V.][INFLIBNET India Order] At: 09:42 14 June 2011
The excess inverse relaxation time is defined as
ð1=�ÞE ¼ ð1=�Þm � ð1=�ÞA � XA þ ð1=�ÞB � XB
� �, ð4Þ
where (1/�)E is the excess inverse relaxation time which represents the averagebroadening of dielectric spectra in the resonance spectroscopy given by Mehrotra
and Boggs [22] and Ahire et al. [23].The information regarding the dynamics of binary mixture interaction is as
follows:
(1) (1/�)E¼ 0: There is no change in the interaction of solutions A and B.(2) (1/�)E5 0: The interaction of solutions A and B produces a field such that
the effective dipoles rotate slowly.(3) (1/�)E4 0: The interaction of solutions A and B produces a field such that
the effective dipoles rotate faster, i.e. the field will cooperate in the rotation
of dipoles.
3.1. The Kirkwood model
The Kirkwood correlation factor g [24] provides information regarding theorientation of the electric dipoles in polar liquids.
60
50
40
30
20
10
00 20
20100
40
4030 50
60 80 100 120Dielectric constant
Dielectric constant
25
20
15
10
5
0
Die
lect
ric lo
ssD
iele
ctric
loss
(a)
(b)
Figure 2. Cole–Cole plot of pure FMD (a) and pure PLG (b) for three temperatures.
Physics and Chemistry of Liquids 553
Downloaded By: [Navarkhele, V. V.][INFLIBNET India Order] At: 09:42 14 June 2011

For a pure polar liquid, the Kirkwood correlation factor g may be obtainedby the expression
4�N�2�
9KTMg ¼ð"0 � "1Þ 2"0 þ "1ð Þ
"0ð"1 þ 2Þ2, ð5Þ
where � is the dipole moment, � the density at temperature T, M the molecularweight, K the Boltzman constant, N the Avogadro’s number, "0 the static dielectricpermittivity and "1 the dielectric permittivity at high frequency, often representedby the square of the refractive index.
Modified forms of this equation which have been used to study the orientationsof electric dipoles in the binary mixtures are given by Kumbharkhane et al. [25,26];two such equations used are as follows:
4�N
9kT
�2M�MMM
XM þ�2F�FMF
XF
� �geff ¼
"0m � "1mð Þ 2"0m þ "1mð Þ
"0mð"1m þ 2Þ2� � , ð6Þ
where geff is the Kirkwood correlation factor for a binary mixture, which variesbetween gM and gF.
4�N
9kT
�2M�MgMMM
XM þ�2F�FgFMF
XF
� �g f ¼
"0m � "1mð Þ 2"0m þ "1mð Þ
"0m "1m þ 2ð Þ2
ð7Þ
gM and gF are assumed to be affected by an amount g f in the mixture. For an idealmixture, g f
¼ 1 and deviation from unity may indicate the interaction between thetwo components of the mixture.
4. Results and discussion
Figure 3 illustrates the experimental values of static dielectric permittivity ("0) ofFMD–PLG binary mixture with increasing volume fraction of PLG for differenttemperatures. The dielectric permittivity decreases with increase in temperature aswell as increase in the volume fraction of PLG. The decreases in dielectric
120
100
80
60
40
20
0
Die
lect
ric p
erm
ittiv
ity
0 10 20 30 40 50 60 70 80 90 100
Volume percent of PLG
T=20°C
T=30°C
T=40°C
Figure 3. Experimental values of static dielectric constant for FMD–PLG binary mixtureat different temperatures.
554 V.V. Navarkhele and M.K. Bhanarkar
Downloaded By: [Navarkhele, V. V.][INFLIBNET India Order] At: 09:42 14 June 2011

permittivity with increase in temperature might be due to rapid fall in orientationpolarisation, because the increased thermal motion reduces the alignment of the
permanent dipoles [27]. The decrease in dielectric permittivity with increase in
volume fraction of PLG may be due to increase in the size and shape of the complex
molecules after h-bonding interaction. This could be attributed to the decrease in thenumber of dipoles in the complex, which may lead to decrease in the volume of
the rotating molecules [28].The experimental values of relaxation time for FMD–PLG binary mixture for
different temperatures are plotted in Figure 4. The relaxation time for FMD–PLG
binary mixture increases with increase in concentration of PLG and decreases withincrease in temperature. The increase in relaxation time of the FMD–PLG binary
mixture with increase in concentration of PLG may be due to the greater size and
shape of the solute (PLG) than that of solvent (FMD). The decrease in relaxation
time with increase in temperature may be possibly due to increase in volume, increase
in effective length of the dipole caused by increase in temperature, and partly dueto decrease in sample viscosity [29].
As seen from Figures 3 and 4, in an ideal mixture of polar liquids, if the molecules
are interacting, a nonlinear variation in dielectric permittivity and relaxation time
with concentration is expected, and the same is inferred from these figures.
This confirms that the intermolecular association is taking place in the system.The results are in agreement with the earlier results of Navarkhele and Bhanarkar
[30].The excess property related to permittivity and relaxation time provides
significant information regarding interaction between the polar–polar liquid
mixtures. The excess dielectric permittivity of the mixtures was calculated usingEquation (3) and its variation with mole fraction of PLG for the three temperatures
is plotted in Figure 5. The values of "E are negative up to 55% of mole fraction
of PLG and positive for the rest of the mole fraction of PLG in the liquid
mixtures. The negative values of "E in FMD-rich region are probably due to thecreation of a less polar structure leading to a lower macroscopic permittivity.
The positive values of "E suggest that the effective number of dipoles in the
400
350
300
250
200
150
100
50
0
Rel
axat
ion
time
0 10 20 30 40 50 60 70 80 90 100
Volume percent of P LG
T=20°C
T=30°C
T=40°C
Figure 4. Experimental values of relaxation time for FMD–PLG binary mixture at differenttemperatures.
Physics and Chemistry of Liquids 555
Downloaded By: [Navarkhele, V. V.][INFLIBNET India Order] At: 09:42 14 June 2011

mixture might be greater than the corresponding average number in the pure liquids,probably due to the creation of a new structure leading to a higher macroscopicpermittivity [6].
Figure 6 illustrates the variation in excess inverse relaxation time (1/�)E
with a mole fraction of PLG which was calculated using Equation (4) at 20�C,30�C and 40�C. The values of (1/�)E are negative up to 0.65mol fractions ofPLG and positive for the rest of the mole fractions of PLG in the liquid mixtures.The negative values of (1/�)E indicate that the addition of PLG to FMD hascreated a hindering field such that the effective dipole rotates slowly. The positivevalues of (1/�)E indicate that the PLG–FMD interaction produces a field such thatthe effective dipoles rotate faster, i.e. the field will cooperate in the rotationof dipoles.
The Kirkwood angular correlation factor (geff) and (g f ) values for variouscompositions of the mixture are represented graphically in Figure 7(a) and (b).The geff4 1 in the FMD-rich region indicates that in the mixture the dipole pairshave been formed in such a way that their orientation is parallel up to 0.3molfraction of PLG. The geff5 1, indicates that in the mixture the dipole pairs have been
20
10
0
–10
–20
–30
–40
Exc
ess
inve
rse
rela
xatio
n tim
e
0.1 0.2 0.3 0.5 0.7 0.8 0.9 1Mole fraction of PLG
T=20T=30
T=40
Figure 6. Experimental values of excess inverse relaxation time (1/�)E for FMD–PLG binarymixture at different temperatures.
80
60
40
20
–20
–40
–60
–80
–100
0
Exc
ess
perm
ittiv
ity
T=20
T=30
T=40
0.1 0.2 0.3 0.4 0.6 0.7 0.8 0.9Mole fraction of PLG
Figure 5. Experimental values of excess permittivity ("E) for FMD–PLG binary mixtureat different temperatures.
556 V.V. Navarkhele and M.K. Bhanarkar
Downloaded By: [Navarkhele, V. V.][INFLIBNET India Order] At: 09:42 14 June 2011

formed in such a way that their orientation is antiparallel in the PLG-rich region.The (g f) values are greater than one for all compositions and at all temperatures.This might indicate that the system will be oriented in such a way that the effectivedipole will be greater than corresponding values of pure liquids.
4
3.5
3
2.5
2
1.5
1
0.5
00 0.1 0.2 0.3 0.4 0.5 0.6 0.7 0.8 0.9 1
Kirk
woo
d fa
ctor
(ge
ff)K
irkw
ood
fact
or (
geff)
T=20°CT=30°C
T=40°C
T=20°C
T=30°C
T=40°C
Mole fraction of PLG
0 0.1 0.2 0.3 0.4 0.5 0.6 0.7 0.8 0.9 1
Mole fraction of PLG
1.8
1.6
1.4
1.2
1
0.8
0.6
(a)
(b)
Figure 7. Experimental values of effective angular Kirkwood correlation factor (geff) (a) andKirkwood factor (g f ) (b) for FMD–PLG binary mixture at different temperatures.
Table 1. Experimental values of enthalpy and entropy as afunction of PLG.
Volume %of PLG
Enthalpy (DH )(JKmole�1)
Entropy (DS )(Jmole�1K�1)
00 12.95(0.22) 1.97(0.00)10 14.45(0.22) 0.54(0.00)20 07.0214(0.20) 1.11(0.00)30 02.28(0.18) 0.57(0.00)40 01.74(0.18) 0.50(0.00)50 06.42(0.19) 1.50(0.00)60 11.17(0.20) 4.44(0.01)70 04.31(0.18) 0.65(0.00)80 04.21(0.18) 1.17(0.00)90 04.05(0.18) 2.66(0.00)100 03.63(0.17) 1.52(0.00)
Physics and Chemistry of Liquids 557
Downloaded By: [Navarkhele, V. V.][INFLIBNET India Order] At: 09:42 14 June 2011

5. Conclusions
. The values of static dielectric constant of the binary mixture are found to bein the range 31–110 and they decrease with the addition of PLG in FMD.
. The relaxation time (�) increases with the addition of PLG in FMD, whichmay be due to the increasing molecular size of PLG.
. The excess permittivity is negative in FMD-rich region and positive inPLG-rich region. This indicates that effective dipole moment of the mixturereduces in FMD-rich region and increases in PLG-rich region.
. The excess inverse relation time (1/�)E values are negative up to 70% molefraction for all the temperatures studied, which confirms that the dipolerotates slowly in the FMD–PLG binary mixtures and rotates fast in thePLG-rich region.
. In the mixture, the dipole pairs are formed and they orient in the paralleldirection in FMD-rich region and in antiparallel direction in PLG-richregion, which is confirmed from the (geff) values.
. The thermodynamic parameters of the system have been studied and arereported in Table 1.
Acknowledgements
The authors thank Prof. S.C. Mehrotra, Head, Department of Computer Science and IT,Dr Babasaheb Ambedkar Marathwada University, Aurangabad, for his valuable guidance.The authors also thank Dr V.P. Pawar, Maharashtra Udaygiri Mahavidyalaya, Udgir, for hishelp during the study. They also thank Dr P.W. Khirade and Head, Department of Physics,Dr Babasaheb Ambedkar Marathwada University, Aurangabad, for providing theexperimental (TDR) facility.
References
[1] R. Buchner, in Novel Approaches to the Structure and Dynamics of Liquids,
edited by J. Samios and V.A. Durov (Kluwer, Dordrecht, 2004), Vol. 133, pp. 265–288.[2] H. Weingartner, A. Knocks, W. Schrader, and U. Kaatze, J. Phys. Chem. A 105, 8646
(2001).[3] S. Mashimo, S. Kuwabara, S. Yogohara, and K.J. Higasi, Chem. Phys. 90, 3292 (1989).
[4] R.H. Cole, J.G. Berbarian, S. Mashimo, G. Chryssikos, A. Burns, and E. Tombari,
J. Appl. Phys. 66, 793 (1989).
[5] S.M. Puranik, A.C. Kumbarkhane, and S.C. Mehrotra, J. Micro. Power EM Energy 26,
196 (1991).[6] M.T. Hosamani, R.H. Fattepur, D.K. Deshpande, and S.C. Mehrotra, J. Chem. Soc.,
Faraday Trans. 91, 623 (1995).[7] S.M. Puranik, A.C. Kumbarkhane, and S.C. Mehrotra, Indian J. Chem., Sect A 32, 613
(1993).[8] W.D. Kumlar and C.W. Porter, J. Am. Chem. Soc. 56, 2549 (1934).[9] W.W. Bates and M.E. Hobbs, J. Am. Chem. Soc. 73, 2151 (1951).
[10] S.J. Bass, W.I. Nathan, R.M. Meighan, and R.H. Cole, J. Phys. Chem. 68, 509 (1964).[11] V.V. Navarkhele and M.K. Bhanarkar, Phys. Chem. Liq. 47, 231 (2009).[12] J. Barthel and H.J. Gores, in Chemistry of Non-aqueous Solutions, Current Progress,
edited by G. Mamantov and A.J. Popov (VCH, New York, 1994).
558 V.V. Navarkhele and M.K. Bhanarkar
Downloaded By: [Navarkhele, V. V.][INFLIBNET India Order] At: 09:42 14 June 2011

[13] M. Weissermel and H.J. Arpe, Industrial Organic Chemistry, 2nd ed. (VCH,
Weinheim, 1993).
[14] C.E. Shannon, Proc. IRE 37, 10 (1949).[15] H.A. Samulan, Proc. IRE 39, 175 (1935).[16] R.H. Cole, J.G. Berbarian, S. Mashimo, G. Chryssikos, A. Burns, and E. Tombari,
J. Appl. Phys. 66, 793 (1989).[17] S. Havrilliak and S. Negami, J. Polym. Sci. 14, 99 (1966).[18] K.S. Cole and R.S. Cole, J. Chem. Phys. 9, 341 (1941).
[19] D.W. Davidson and R.H. Cole, J. Chem. Phys. 18, 1484 (1950).[20] P.R. Bevington, Data Reduction and Error Analysis for the Physical Sciences (McGraw
Hill, New York, 1969).[21] M. Tabellout, P. Lanceleur, J.R. Emery, D. Hayward, and R.A. Pethrick, J. Chem. Soc.,
Faraday Trans. 86, 1493 (1990).[22] S.C. Mehrotra and J.E. Boggs, J. Chem. Phys. 66, 5306 (1977).[23] S. Ahire, A. Choudhary, M. Lokhande, and S. Mehrotra, J. Sol. Chem. 27, 993 (1998).
[24] J.G. Kirkwood, J. Chem. Phys. 7, 911 (1939).[25] A.C. Kumbharkhane, S.M. Puranik, and S.C. Mehrotra, J. Chem. Soc., Faraday Trans.
87, 1569 (1991).[26] A.C. Kumbharkhane, S.M. Puranik, and S.C. Mehrotra, J. Sol. Chem. 22, 219 (1993).[27] N.E. Hill, W.E. Vaughan, A.R. Price, and M. Davies, Dielectric Properties and Molecular
Behavior (Van Nostrand Reinhold, London, 1969).[28] K. Dharmalingam, K. Ramachandranan, P. Shivgurunathan, P.B. Undre, P.W. Khirade,
and S.C. Mehrotra, Bull. Korean Chem. Soc. 27, 300 (2007).[29] K. Dharmalingam, K. Ramachandranan, P. Shivgurunathan, P.B. Undre, P.W. Khirade,
and S.C. Mehrotra, Physica B 387, 203 (2007).[30] V.V. Navarkhele and M.K. Bhanarkar, J. Mol. Phys. 107, 1823 (2009).
Appendix
Notations
"1 dielectric permittivity at high frequency"0 static dielectric permittivity� relaxation time
� and � distribution parameters�*(!) reflection coefficient spectra
! angular frequency"*(!) complex permittivity spectra
� (!) and q(!) Fourier spectraC speed of lightd pin length
R1(t) reflected pulse without sampleRx(t) reflected pulse with sample�(!) Fourier transform of �(t)q(!) Fourier transform of q (t)�(t) subtracted pulse R1(t)�Rx(t)q(t) added pulse R1(t)þRx(t)
PLG propylene glycolFMD formamide
Physics and Chemistry of Liquids 559
Downloaded By: [Navarkhele, V. V.][INFLIBNET India Order] At: 09:42 14 June 2011
Copyright © 2022 FDOKUMEN