Absolute measurement of the thermal conductivity of propylene carbonate by the AC transient hot-wire...
10
International Journal of Thermophysics, Vol. 12, No. 5, 1991 Absolute Measurement of the Thermal Conductivity of Propylene Carbonate by the AC Transient Hot-Wire Technique M. Tuliszka, 1 F. Jaroszyk, 1 and M. Portalski 2 Received January 9, 1991 The paper describes a new apparatus for measuring the thermal conductivity of liquids based on a transient hot-wire method. The apparatus has been used to measure the thermal conductivity of propylene carbonate (C4H603). The measurements have been carried out in the temperature range 284-313 K and at saturation pressure. The accuracy of the data is within __1.5 %. KEY WORDS: propylene carbonate; thermal conductivity; toluene; transient hot-wire technique. 1. INTRODUCTION The hot-wire method is a widely used method for thermal conductivity measurements for liquids and gases [1-7]. In this work we discuss an automatic apparatus for measuring liquid thermal conductivities using an AC version of the hot-wire method. Dietz et al. [8, 9] were the first to use an alternating current hot-wire method to determine the thermal conductivity of highly polar liquids such as water and methyl alcohol, for which the constant-current method gives results inconsistent with values gained through other methods. We have used the AC method to measure the thermal conductivity of propylene carbonate in the temperature range of 284 to 313 K. Propylene carbonate is a liquid with a high dielectric constant value, e = 64.4, and a small electrical conductivity value, o- = 2 x 10⁻⁹ f2 - 1. m- 1 Department of Biophysics, Academy of Medicine, Fredry Street 10, 61-701 Poznafi, Poland. 2 Institute of Technology, Poznafi, Poland. 791 0195-928X/91/0900-0791506.50/0 1991PlenumPublishing Corporation
-
Upload
poznanmedicalsciences -
Category
Documents
-
view
0 -
download
0
Transcript of Absolute measurement of the thermal conductivity of propylene carbonate by the AC transient hot-wire...
International Journal of Thermophysics, Vol. 12, No. 5, 1991
Absolute Measurement of the Thermal Conductivity of Propylene Carbonate by the AC Transient Hot-Wire Technique
M. Tuliszka, 1 F. J a roszyk , 1 and M. P o r t a l s k i 2
Received January 9, 1991
The paper describes a new apparatus for measuring the thermal conductivity of liquids based on a transient hot-wire method. The apparatus has been used to measure the thermal conductivity of propylene carbonate (C4H603). The measurements have been carried out in the temperature range 284-313 K and at saturation pressure. The accuracy of the data is within __ 1.5 %.
KEY WORDS: propylene carbonate; thermal conductivity; toluene; transient hot-wire technique.
1. I N T R O D U C T I O N
The hot -wire m e t h o d is a widely used m e t h o d for thermal conduct iv i ty measurements for l iquids and gases [ 1 - 7 ] . In this work we discuss an a u t o m a t i c a p p a r a t u s for measur ing l iquid the rmal conduct iv i t ies using an AC vers ion of the hot -wire method .
Die tz et al. [8, 9 ] were the first to use an a l te rna t ing current hot -wire m e t h o d to de te rmine the the rmal conduc t iv i ty of highly po la r l iquids such as water and methyl a lcohol , for which the cons tan t -cur ren t m e t h o d gives results inconsis tent with values gained th rough o ther methods . We have used the AC m e t h o d to measure the the rmal conduc t iv i ty of p ropy lene ca rbona t e in the t empera tu re range of 284 to 313 K. P ropy lene ca rbona te is a l iquid with a high dielectr ic cons tan t value, e = 64.4, and a small electr ical conduc t iv i ty value, o- = 2 x 10⁻⁹ f2 - 1. m -
1 Department of Biophysics, Academy of Medicine, Fredry Street 10, 61-701 Poznafi, Poland. 2 Institute of Technology, Poznafi, Poland.
791
0195-928X/91/0900-0791506.50/0 �9 1991 Plenum Publishing Corporation
792 Tuliszka, Jaroszyk, and Portalski
2. E X P E R I M E N T A L
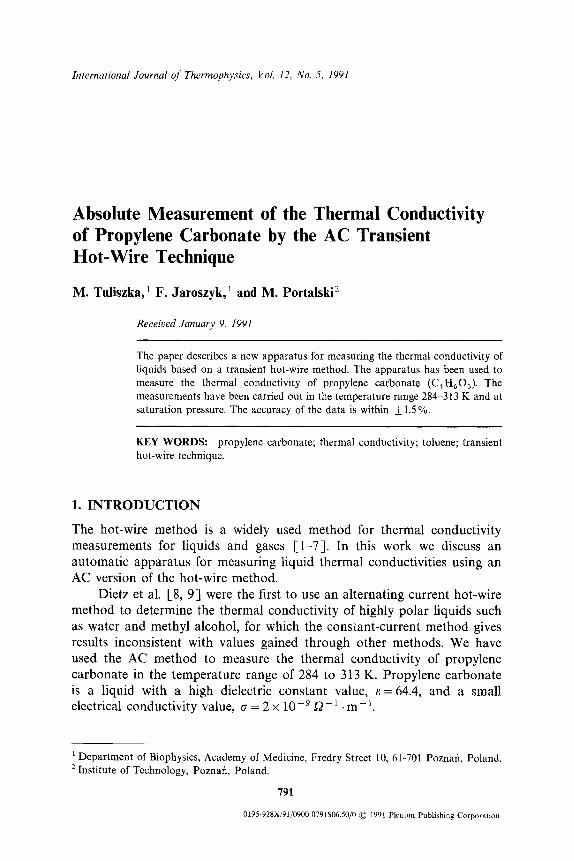
In this work, we used a bare platinum wire of 99.9 % purity 20/~m in diameter, as a heating source. In order to compensate for the end effects the system of two wires with length of 15 and 5 cm is incorporated into two neighboring arms of a measuring bridge. An alternating current of 15 kHz frequency is supplied to the bridge. The temperature changes AT are measured by unbalancing the voltage of the bridge which results from the AR changes of the resistance of the platinum wires. The thermal conductivity coefficient 2 is determined from the well-known Eq. [-2]:
q 4~ct AT= T(r, t ) - To = ~ l n
r2C OflIA (1)
where T(r, t) is the wire temperature, r the radius of the wire, t the time, To the temperature of the wire at t ~< 0, q the heat flux per unit length, x the thermal diffusivity coefficient, and C=exp(7), where 7 is Euler's constant (7 = 0.577).
[ 0 -
1 -
/1 I
13 1 2 - - iJi
Fig. 1. Diagram of measuring cell.

Thermal Conductivity of Propylene Carbonate 793
2.1. The Thermal Conductivity Cells
The two cells differing only in the length of their Pt wires are supported on racks placed inside stainless-steel cylindrical vessels (2), one of which is shown in Fig. 1. The vessels are covered with a thin layer of electric-insulation lacquer. The rack spreading the wire (1) is constructed from Teflon disks (3-6) fixed on thin glass capillaries (7) with a diameter of 0.15 cm. The thicker capillary (8) is a guide and insulates the electric lead (9), which is a thick, l-ram silver-plated copper wire. In the Teflon disks (3 and 5) silver hooks (10, 11) are fixed, of which the upper one is 0.5 mm in diameter and the lower one, acting as a spring pulling the Pt wire, is 0.19 mm in diameter. The Pt wire is fixed to the platinum hooks by being wrapped around the
m
Fig. 2. Diagram of thermostating vessel.
794 Tuliszka, Jaroszyk, and Portalski
hooks several times and flooded by tin. The Teflon disk (5) may freely shift along the glass capillary, while the wire tension can be adjusted with the aid of a screw (12) indicating the position and a lock-nut (13).
Stainless-steel vessels (1) with platinum wires (2), constituting the measuring chambers, are placed in the channels (3) of the thermostatic vessel (Fig. 2), The channels are copper tubes around which the water flows from the thermostat. Both channels are sealed by screws (4) with Teflon seals and have the feed through (5) of the electric leads (6) to the electric measuring system. The temperature of the water bath is measured with a Cu-constantan thermocouple placed in the channel (7) of the thermostatic vessel.
2.2. The Thermal Conductivity Apparatus
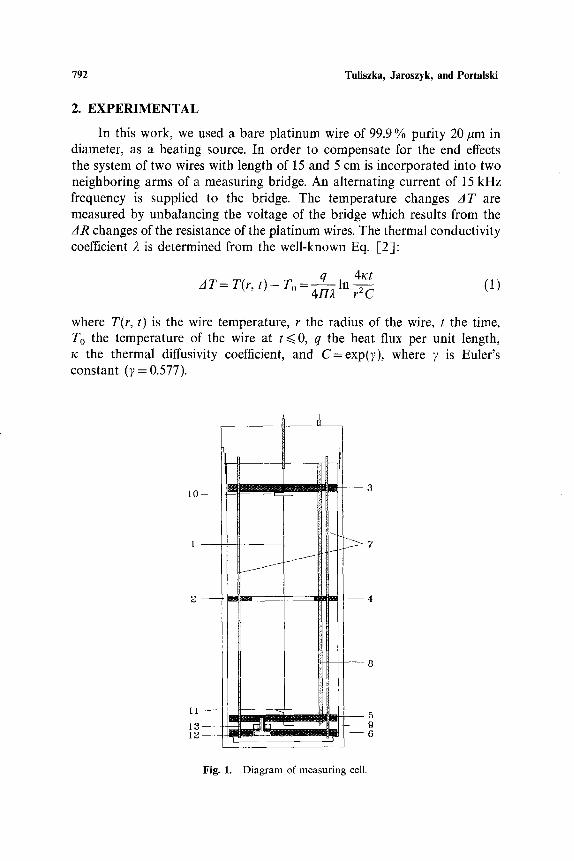
Figure 3 shows the block diagram of the measuring system. The general part of this system is held by an automatically controlled AC bridge. The main part of the bridge is shown in Fig. 4. The bridge has an inner generator of 15-kHz frequency. There is also the possibility to connect an exterior generator. The bridge-unbalancing voltage U(T) is
co L LOCK-IN
N~NOVOLTMETEE
1 1E BIT C0Ig~RTER
AND 1.2 BIT INTERFACE
!,! MICROCOMPI]TEt~
MEASURING ChIAMBER WITH TKE PT WIRES
AUTO/At~TICALL Y I CONTROLLED AC BEI])GE
I
VOLTMZTER DV1
VOLTMETER DV~ ~-
Fig, 3. Block diagram of the apparatus.
MONITOR ]
~ PRINTER ]
Thermal Conductivity of Propylene Carbonate 795
W L I
R E
S S
SI
1 73.8 !
31.8
Fig. 4.
OU 1
~ IK
82 Tr 1:2
) - ~ l
1.1nF ( 1 50
COUT I
25.264 28.5~1007pF [R ~ ] [C]
_t_
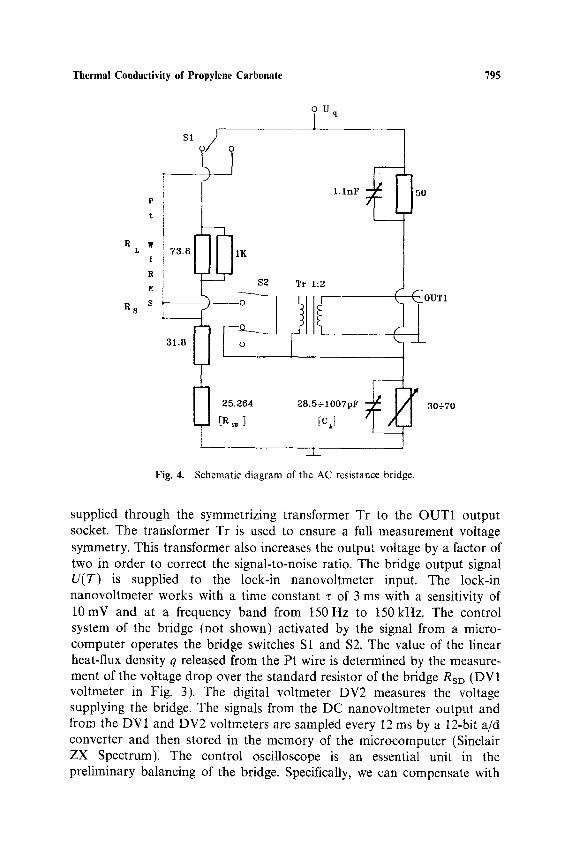
Schematic diagram of the AC resistance bridge.
30~70
supplied through the symmetrizing transformer Tr to the OUT1 output socket. The transformer Tr is used to ensure a full measurement voltage symmetry. This transformer also increases the output voltage by a factor of two in order to correct the signal-to-noise ratio. The bridge output signal U(T) is supplied to the lock-in nanovoltmeter input. The lock-in nanovoltmeter works with a time constant r of 3 ms with a sensitivity of 10mV and at a frequency band from 150Hz to 150kHz. The control system of the bridge (not shown) activated by the signal from a micro- computer operates the bridge switches S1 and $2. The value of the linear heat-flux density q released from the Pt wire is determined by the measure- ment of the voltage drop over the standard resistor of the bridge RSD (DV1 voltmeter in Fig. 3). The digital voltmeter DV2 measures the voltage supplying the bridge. The signals from the DC nanovoltmeter output and from the DV1 and DV2 voltmeters are sampled every 12 ms by a 12-bit a/d converter and then stored in the memory of the microcomputer (Sinclair ZX Spectrum). The control oscilloscope is an essential unit in the preliminary balancing of the bridge. Specifically, we can compensate with
796 Tuliszka, Jaroszyk, and Portalski
it both the active and the reactive component of the measuring chamber resistance with the platinum wires. For this purpose the output voltage from the lock-in nanovoltmeter AC output and the voltage supplying the bridge are fed, respectively, to the perpendicularly and horizontally deflecting plates of the oscilloscope. During the course of the measurement the Lissajous curve appears on the oscilloscope screen. With the aid of the capacitor CA, during the premeasurements, it is possible to compensate the capacitance component of the bridge resistance satisfactorily. However, it should be noted that the total resistance of the AC bridge cannot be compensated entirely during the transient measurement.
2.3. Determination of the Thermal Conductivity Coefficient
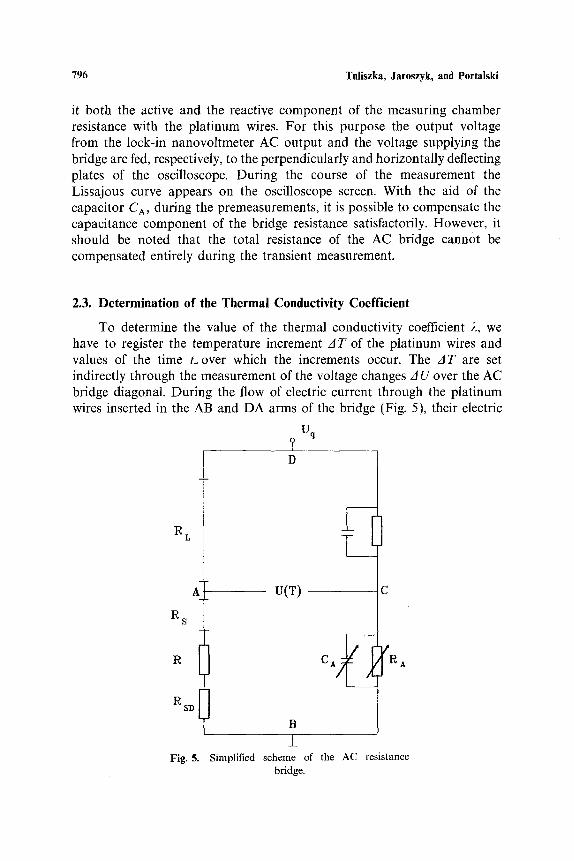
To determine the value of the thermal conductivity coefficient 4, we have to register the temperature increment AT of the platinum wires and values of the time t~over which the increments occur. The A T are set indirectly through the measurement of the voltage changes ~ U over the AC bridge diagonal. During the flow of electric current through the platinum wires inserted in the AB and DA arms of the bridge (Fig. 5), their electric
i
R L
R s
RSD i
Fig. 5.
Uq ? D
S- T
U(T)
I CA~ /RA
B
• Simplified scheme of the AC resistance
bridge.
Thermal Conductivity of Propylene Carbonate 797
resistances RL and Rs change due to the increase in the temperature T. Since the resistances RL and Rs differ, the potential V(A) of the bridge point A also changes. The potential V(C) of the bridge point C remains constant, since the current source feeding the bridge is voltage stabilized. At a given moment t and at a given temperature T, the value U(T) between bridge point A and the bridge point C may be represented by
g(r) = VA(T)- Vc = UAB(T)- UCB (2)
where UAB(T) is the voltage between bridge point A and bridge point B, T the temperature of the Pt wires, and UcB the voltage between point C and point B. UAB(T) is given by
UAB(T) = Uq- UDA(T) (3)
where Uq is the effective voltage feeding the bridge. Since in the course of the measurement the temperature of the Pt wires changes only slightly (approximately 0.3 K at Uqm5 V), the temperature dependence of their resistances may by represented as
RL(T) = RLO(1 + eT) (4)
Rs(T) = Rso(1 + eT)
where RLO and Rs0 denote the wire resistance value in 0~ It may be shown that the change A U of the voltage U(T) caused by the temperature change of the platinum wires A T from T 1 to T 2 is
AU= IDAB(T,) Rso(1 + eT1) - IDAB(T2) Rso(I + c~T2) (5)
where /DAB is the current intensity in the branches with the Pt wires. The /DAB current is given by
/DAB(T) = Uq (6) RL(T) + Rs(T ) + Rsi~ + R
where RL(T) and Rs(T) are temperature-dependent resistances of long and short platinum wires, RSD is the standard resistor, and R is a fixed resistor so that R s + R + RsD ~RL (see Fig. 5). Substituting Eq. (6) into Eq. (5) yields the fundamental working Eq. (7):
A T - A U ( R 1 + R2o~T 1 ) (7) cZUqRLoR 3 - A U Rzo~(R x + R2ccT1)
where Ta denotes the initial temperature of the wire at t = to, R1 = R2 + R3, R2 = RLO + Rso, and R3 = R + RSD.
798 Tuliszka, Jaroszyk, and Portalski
0,138
'7 0 .154
'T E: o . 1 3 o
'< o . 1 2 6
o . 1 2 2 27s 2~5 2,~5 36s 3~5 325
T,K
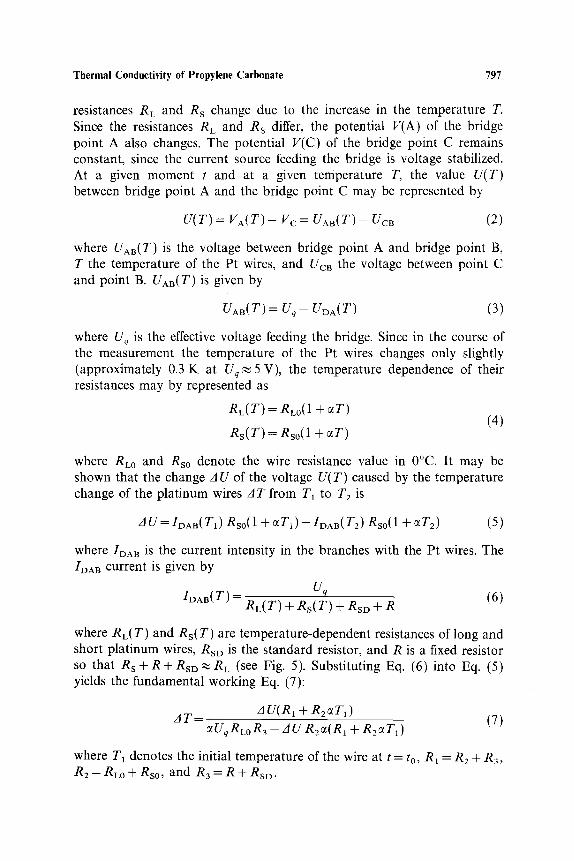
Fig. 6. The thermal conductivity data for toluene as a function of temperature: (D) our experimental data; ( + ) recommended data [10].
3. VALIDATION OF OPERATION AND ACCURACY
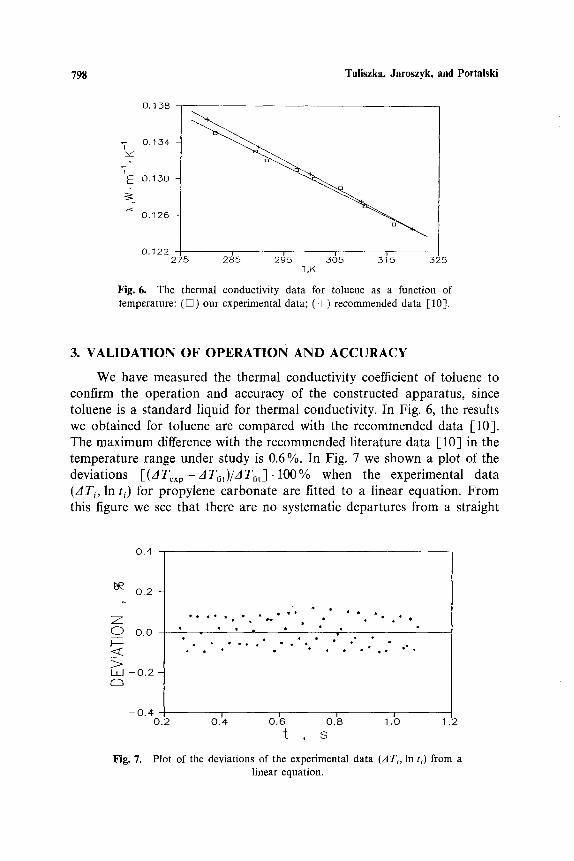
We have measured the thermal conductivity coefficient of toluene to confirm the operation and accuracy of the constructed apparatus, since toluene is a standard liquid for thermal conductivity. In Fig. 6, the results we obtained for toluene are compared with the recommended data [10]. The maximum difference with the recommended literature data I-10] in the temperature range under study is 0.6%. In Fig. 7 we shown a plot of the deviations r(zlTexp-zJTrn)/zlTr~t].[O0% when the experimental data (ATe, In t~) for propylene carbonate are fitted to a linear equation�9 From this figure we see that there are no systematic departures from a straight
0 . 4
0 .2
Z O 0 .0 I - - < (
ILl - - 0 . 2
- 0 . 4 o.2 o.~ o.~ o.~ 1.b 1.2
t , S
Fig. 7. Plot of the deviations of the experimental data (ATe, In ti) from a linear equation.
Thermal Conductivity of Propylene Carbonate
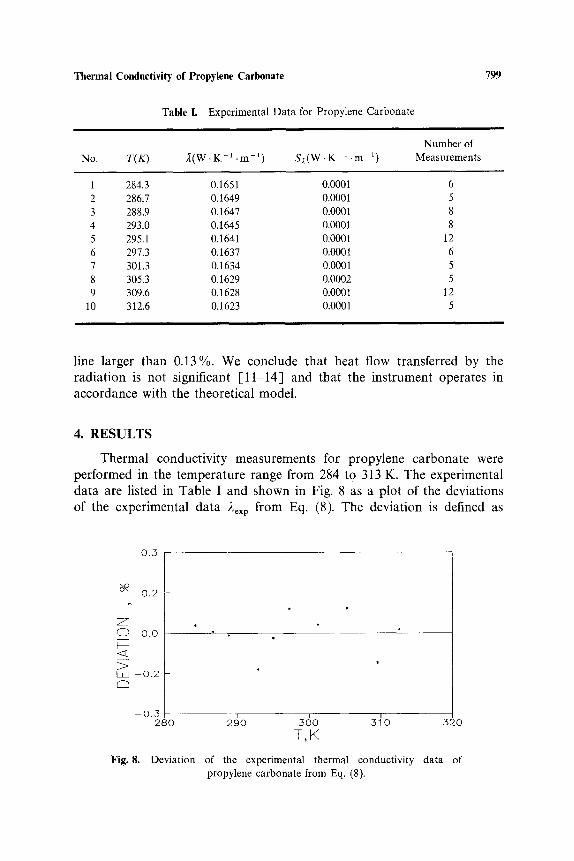
Table I. Experimental Data for Propylene Carbonate
799
Number of No. T ( K ) % ( W . K - l . m -1) S,~(W-K l -m t) Measurements
1 284.3 0.1651 0.0001 6 2 286.7 0.1649 0.0001 5 3 288.9 0.1647 0.0001 8 4 293.0 0.1645 0.0001 8 5 295.1 0.1641 0.0001 12 6 297.3 0.1637 0.0001 6 7 301.3 0.1634 0.0001 5 8 305.3 0.1629 0.0002 5 9 309.6 0.1628 0.0001 12
10 312.6 0.1623 0.0001 5
line larger than 0.13%. We conclude that heat flow transferred by the radiation is not significant [11-14] and that the instrument operates in accordance with the theoretical model.
4. RESULTS
Thermal conductivity measurements for propylene carbonate were performed in the temperature range from 284 to 313 K. The experimental data are listed in Table I and shown in Fig. 8 as a plot of the deviations of the experimental data )~exp from Eq. (8). The deviation is defined as
0.3
b2 0.2
Z 0 0.0 F-- <a:
LLd --0.2
Fig. 8.
0.3 280 2~o 360 3~o 320
T,K
Deviation of the experimental thermal conductivity data of propylene carbonate from Eq. (8).
800 Tuliszka, Jaroszyk, and Portalski
[ ( 2 e x p - - 2 . . . . )/2 . . . . ] . 1 0 0 % . T o d e t e r m i n e the t e m p e r a t u r e d e p e n d e n c e of
the t h e r m a l c o n d u c t i v i t y coeff ic ient 2, the d a t a were f i t ted to
2 . . . . ( T ) = a o + a l T (8)
w i th
a o = (0.1935___0.0024) W . m - 1 . K 1
a l = ( - 0 . 9 9 8 _ 0 .082)10 -4 W - m -1 . K 2
whe re the e r ro r s r ep re sen t 90 % con f idence intervals . In the t e m p e r a t u r e
r a n g e s tud ied the t h e r m a l c o n d u c t i v i t y exhib i t s a w e a k d e p e n d e n c e on
t e m p e r a t u r e .
A C K N O W L E D G M E N T
This w o r k was pa r t i a l ly
Fer t i l i ze r s in P u l a w y , P o l a n d .
s u p o r t e d by the Ins t i tu te of Art i f ic ia l
REFERENCES
1. J. J. de Groot, J. Kestin, and H. Sookiazian, Physica 75C:454 (1974). 2. J. J. Healy, J. J. de Groot, and J. Kestin, Physica 82C:392 (1976). 3. J. Kestin and W. A. Wakeham, Physica 92A:102 (1978). 4. J. Kestin, R. Paul, A. A. Clifford, and W. A. Wakeham, Physica 100A:349 (1980). 5. Y. Nagasaka and A. Nagashirna, J. Phys. E Sci. Instrum. 4:1435 (1981). 6. E. N. Haran and W. A. Wakeham, J. Phys. E Sci. Instrum. 15:839 (1982). 7. W. A. Wakeham and M. Zalaf, Fluid Phase Equil. 36:183 (1987). 8. F. J. Dietz, Ph.D. dissertation (Der Universit~it Fridericina Karlsruhe, 1981). 9. F. J. Dietz, J. J. de Groot, and E. U. Franck, Ber. Bunsenges. Phys. Chem. 85:1005 (1981).
10. C. A. Nieto de Castro, S. F. Li, A. Nagashia, R. D. Trengowe, and W. A. Wakeham, J. Phys. Chem. Ref Data 15:1073 (1986).
11. J. Menashe and W. A. Wakeham, Int. J. Heat Mass Transfer 25:661 (1982). 12. S. F. Y. Li, G. C. Maitland, and W. A. Wakeham, Ber. Bunsenges. Phys. Chem. 88:32
(1984). 13. C. A. Nieto de Castro, S. F. Y. Li, G. C. Maitland, and W. A. Wakeham, Int. 3..
Thermophys. 4:311 (1983). 14. C. A. Nieto de Castro and J. C. G. Calado, High Temp. High Press. 11:551 (1979).