Fracture and failure behavior of fabric-reinforced all-poly(propylene) composite (Curv
7
Fracture and failure behavior of fabric-reinforced all-poly(propylene) composite (Curv 1 ) y Ga ´ bor Romha ´ny 1 * , Tama ´s Ba ´ra ´ny 1 , Tibor Cziga ´ny 1 and Jo ´ zsef Karger-Kocsis 2 1 Department of Polymer Engineering, Faculty of Mechanical Engineering, Budapest University of Technology and Economics, Mu ˝egyetem rkp. 3, H-1111 Budapest, Hungary 2 Institut fu ¨r Verbundwerkstoffe GmbH, TU Kaiserslautern, PO Box 3049, D-67653 Kaiserslautern, Germany Received 29 June 2005; Revised 4 April 2006; Accepted 20 April 2006 The in-plane static fracture of a fabric reinforced all-poly(propylene) (all-PP, Curv 1 ) composite was studied at ambient temperature using the concept of the linear elastic fracture mechanics. The apparent fracture toughness was determined on single-edge notched tensile specimens (SEN-T) considering the maximum load. The related values did not differ much from those determined by the resistance curve (K R ) method. The crack growth, requested to construct the K R curves, was traced by the movement in the center of gravity of the cumulative amplitude of the located acoustic emission (AE) events. The quality of consolidation of the all-PP composite was reflected by the force- displacement curve (appearance of pop-in), course of the cumulative AE events during loading, extension and change of the estimated damage zone during fracture. The failure behavior was studied also by fractography and is discussed. Copyright # 2006 John Wiley & Sons, Ltd. KEYWORDS: homocomposites; poly(propylene) (PP); fracture; failure; acoustic emission INTRODUCTION In poly(propylene) (PP) homocomposites (also termed ‘‘all-PP’’ or ‘‘self-reinforced’’ composites) the reinforcing phase (highly stretched fibers, tapes and their textile architectures) are embedded in the matrix. The matrix is usually a random PP copolymer having a lower melting temperature than the reinforcement (isotactic PP homo- polymer). 1,2 The pioneering work with all-PP components was done by the group of Ward and coworkers. 3–6 Via their method, called hot compaction, a portion of the reinforcing fiber has been transformed into the matrix. The related products are now available commercially under the trade name Curv 1 (www.curvonline.com). This material is gaining acceptance in automotive applications because of its beneficial mechanical properties, ultimate recyclability and low density (0.9 g/cm 3 ). However, little information is available on the fracture mechanical and failure behavior of this composite which are the topics of the present contribution. EXPERIMENTAL Material Curv 1 composites sheets with woven fabric reinforcement (plain-wave) and having a thickness of ca. 3 mm were delivered by BP, Amoco Fabrics GmbH (Gronau, Germany). The tensile mechanical properties of the composite are listed in Table 1. The discrepancy between the nominal and measured stiffness can be attributed to the presence of less consolidated areas as shown on metallographically polished thickness sections in Fig. 1. Tests Static tensile mechanical properties were determined on dumbbells (1B, according to EN ISO 527) at room temperature and at a crosshead speed of v ¼ 2 mm/min on a Zwick 1474 universal testing machine. Single edge-notched tensile (SEN-T) specimens cut from the Curv 1 sheets were also subjected to tensile loading at a crosshead speed of v ¼ 2 mm/min. The initially sawed notch (a 0 ) was sharpened by razor blade tapping. In order to obtain information about the failure mode, the acoustic emission (AE) activity was registered in situ using one microphone (Fig. 2a). To trace the damage development, static fracture mech- anical tests were also performed on SEN-T specimens at room temperature at a crosshead speed of v ¼ 2 mm/min. Their dimensions allowed the location of the AE via a four sensors array (Fig. 2b). The notch was prepared as aforementioned. The fracture toughness values (K Q,max ) were determined by the formula cited in Ref. 7, considering the maximum load. POLYMERS FOR ADVANCED TECHNOLOGIES Polym. Adv. Technol. 2007; 18: 90–96 Published online 21 November 2006 in Wiley InterScience (www.interscience.wiley.com) DOI: 10.1002/pat.806 *Correspondence to: G. Romha ´ny, Department of Polymer Engin- eering, Faculty of Mechanical Engineering, Budapest University of Technology and Economics, Mu ˝ egyetem rkp. 3, H-1111 Budapest, Hungary. E-mail: [email protected] y Paper presented as part of an issue containing papers from the Polymeric Materials for Automotive conference held in Bratislava, May 2005. Copyright # 2006 John Wiley & Sons, Ltd.
Transcript of Fracture and failure behavior of fabric-reinforced all-poly(propylene) composite (Curv
POLYMERS FOR ADVANCED TECHNOLOGIES
Polym. Adv. Technol. 2007; 18: 90–96
terscience.wiley.com) DOI: 10.1002/pat.806
Published online 21 November 2006 in Wiley InterScience (www.inFracture and failure behavior of fabric-reinforced
all-poly(propylene) composite (Curv1)y
Gabor Romhany1*, Tamas Barany1, Tibor Czigany1 and Jozsef Karger-Kocsis2
1Department of Polymer Engineering, Faculty of Mechanical Engineering, Budapest University of Technology and Economics,
Muegyetem rkp. 3, H-1111 Budapest, Hungary2Institut fur Verbundwerkstoffe GmbH, TU Kaiserslautern, PO Box 3049, D-67653 Kaiserslautern, Germany
Received 29 June 2005; Revised 4 April 2006; Accepted 20 April 2006
*Correspoeering, Faof TechnBudapestE-mail: royPaper pthe PolymBratislava
The in-plane static fracture of a fabric reinforced all-poly(propylene) (all-PP, Curv1) composite was
studied at ambient temperature using the concept of the linear elastic fracture mechanics. The
apparent fracture toughness was determined on single-edge notched tensile specimens (SEN-T)
considering themaximum load. The related values did not differ much from those determined by the
resistance curve (KR) method. The crack growth, requested to construct the KR curves, was traced by
the movement in the center of gravity of the cumulative amplitude of the located acoustic emission
(AE) events. The quality of consolidation of the all-PP composite was reflected by the force-
displacement curve (appearance of pop-in), course of the cumulative AE events during loading,
extension and change of the estimated damage zone during fracture. The failure behavior was
studied also by fractography and is discussed. Copyright # 2006 John Wiley & Sons, Ltd.
KEYWORDS: homocomposites; poly(propylene) (PP); fracture; failure; acoustic emission
INTRODUCTION
In poly(propylene) (PP) homocomposites (also termed
‘‘all-PP’’ or ‘‘self-reinforced’’ composites) the reinforcing
phase (highly stretched fibers, tapes and their textile
architectures) are embedded in the matrix. The matrix is
usually a random PP copolymer having a lower melting
temperature than the reinforcement (isotactic PP homo-
polymer).1,2 The pioneering work with all-PP components
was done by the group of Ward and coworkers.3–6 Via their
method, called hot compaction, a portion of the reinforcing
fiber has been transformed into the matrix. The related
products are now available commercially under the trade
name Curv1 (www.curvonline.com). This material is
gaining acceptance in automotive applications because of
its beneficial mechanical properties, ultimate recyclability
and low density (�0.9 g/cm3). However, little information is
available on the fracture mechanical and failure behavior of
this composite which are the topics of the present
contribution.
EXPERIMENTAL
MaterialCurv1 composites sheets with woven fabric reinforcement
(plain-wave) and having a thickness of ca. 3 mm were
ndence to: G. Romhany, Department of Polymer Engin-culty of Mechanical Engineering, Budapest Universityology and Economics, Muegyetem rkp. 3, H-1111, [email protected]
resented as part of an issue containing papers fromeric Materials for Automotive conference held in
, May 2005.
delivered by BP, Amoco Fabrics GmbH (Gronau, Germany).
The tensile mechanical properties of the composite are listed
in Table 1. The discrepancy between the nominal and
measured stiffness can be attributed to the presence of less
consolidated areas as shown on metallographically polished
thickness sections in Fig. 1.
TestsStatic tensile mechanical properties were determined on
dumbbells (1B, according to EN ISO 527) at room
temperature and at a crosshead speed of v¼ 2 mm/min on
a Zwick 1474 universal testing machine.
Single edge-notched tensile (SEN-T) specimens cut from
the Curv1 sheets were also subjected to tensile loading at a
crosshead speed of v¼ 2 mm/min. The initially sawed notch
(a0) was sharpened by razor blade tapping. In order to obtain
information about the failure mode, the acoustic emission
(AE) activity was registered in situ using one microphone
(Fig. 2a).
To trace the damage development, static fracture mech-
anical tests were also performed on SEN-T specimens at
room temperature at a crosshead speed of v¼ 2 mm/min.
Their dimensions allowed the location of the AE via a four
sensors array (Fig. 2b). The notch was prepared as
aforementioned. The fracture toughness values (KQ,max)
were determined by the formula cited in Ref. 7, considering
the maximum load.
Copyright # 2006 John Wiley & Sons, Ltd.

Table 1. Tensile mechanical properties of the Curv1 composite
Tensile modulus (MPa) Tensile strength (MPa) Tensile strain to failure (%)
Producer’s data 4200 120 20Measured 2950 117 23
Producer’s data—based on the datasheet of the producer. Measured—according to DIN EN ISO 527 standard.
Figure 1. (a) Light (LM) and (b) scanning electron microscopy (SEM) pictures taken
from the cross-section of the all-PP composites after polishing. Note: the high
magnification picture represents a ‘‘void’’.
Figure 2. Single edge-notched tensile specimen with a width of (a) 30mm (SEN-T(A)) and (b) 70mm
(SEN-T(B)).
Fracture behavior of Curv1 91
The damage zone was estimated by location of the AE
events, collected during loading of the SEN-T(B) specimens.
The AE activity was recorded in situ by a Defektophone NEZ
220 device (AEKI, Budapest, Hungary). Wide bandwidth
(100–600 kHz) microsensors (Micro 30D of Physical Acoustic
Co., Princeton, NJ) were used as AE sensors. Localization of
the acoustic events (cf. Fig. 2b) was determined by a built-in
Copyright # 2006 John Wiley & Sons, Ltd.
algorithm of the AE device in the knowledge of the acoustic
wave speed. To estimate the size of the damage zone, a
mathematical weighing procedure, described elsewhere,8–10
was used. Briefly, the located map (Fig. 1) was scanned by a
circle of 6 mm diameter in 1 mm steps in both the x and the y
directions and for each surface point the value in the
z-direction was determined by a bell-type weighing function.
Polym. Adv. Technol. 2007; 18: 90–96
DOI: 10.1002/pat
92 G. Romhany et al.
This procedure was adopted to the cumulative amplitudes
(reported here) and cumulative AE events, as well. The
damage zone was assigned to the surface that contained 90%
of all the located AE events. The located AE events served to
trace the increase in the crack length (Da¼ ax�a0 according to
Fig. 2). This occurred by considering the movement of the
center of gravity of the cumulative AE events in subsequent
but not intersecting time intervals. The related procedure is
described in detail in the literature.8–10
The fracture surface of the SEN-T specimens was inspected
in a scanning electron microscope (Jeol JSM 5400, Japan). Prior
to scanning electron microscopy (SEM) observations the
specimen surface was sputter-coated with an Au/Pd alloy.
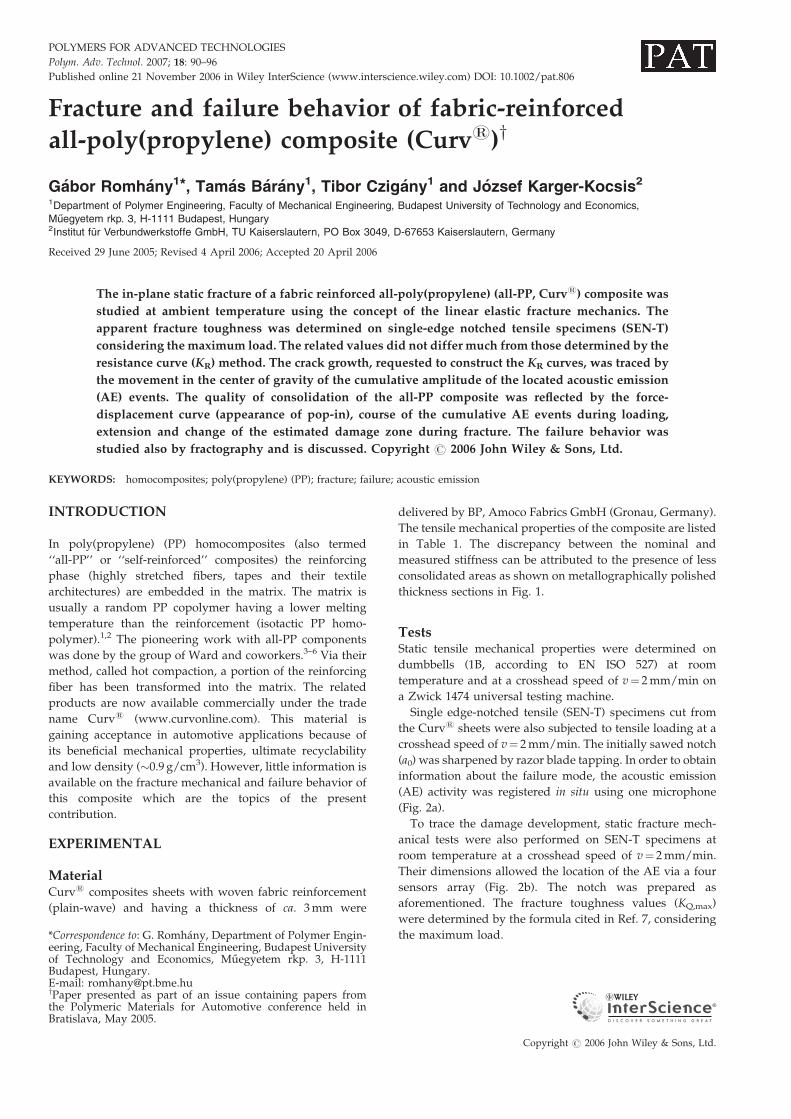
Figure 4. Cumulative AE events as a function of displace-
ment showing the quality of consolidation on SEN-T(A)
specimens.
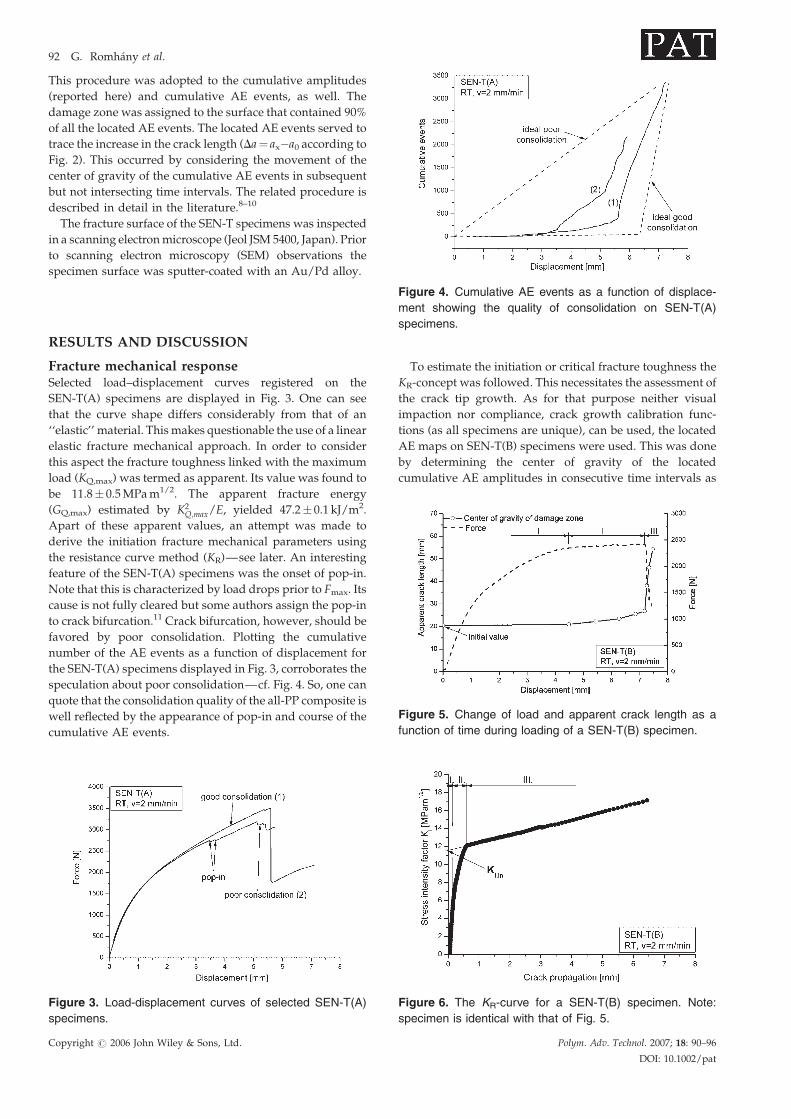
Figure 5. Change of load and apparent crack length as a
function of time during loading of a SEN-T(B) specimen.
RESULTS AND DISCUSSION
Fracture mechanical responseSelected load–displacement curves registered on the
SEN-T(A) specimens are displayed in Fig. 3. One can see
that the curve shape differs considerably from that of an
‘‘elastic’’ material. This makes questionable the use of a linear
elastic fracture mechanical approach. In order to consider
this aspect the fracture toughness linked with the maximum
load (KQ,max) was termed as apparent. Its value was found to
be 11.8� 0.5 MPa m1/2. The apparent fracture energy
(GQ,max) estimated by K2Q;max/E, yielded 47.2� 0.1 kJ/m2.
Apart of these apparent values, an attempt was made to
derive the initiation fracture mechanical parameters using
the resistance curve method (KR)—see later. An interesting
feature of the SEN-T(A) specimens was the onset of pop-in.
Note that this is characterized by load drops prior to Fmax. Its
cause is not fully cleared but some authors assign the pop-in
to crack bifurcation.11 Crack bifurcation, however, should be
favored by poor consolidation. Plotting the cumulative
number of the AE events as a function of displacement for
the SEN-T(A) specimens displayed in Fig. 3, corroborates the
speculation about poor consolidation—cf. Fig. 4. So, one can
quote that the consolidation quality of the all-PP composite is
well reflected by the appearance of pop-in and course of the
cumulative AE events.
Figure 3. Load-displacement curves of selected SEN-T(A)
specimens.
Copyright # 2006 John Wiley & Sons, Ltd.
To estimate the initiation or critical fracture toughness the
KR-concept was followed. This necessitates the assessment of
the crack tip growth. As for that purpose neither visual
impaction nor compliance, crack growth calibration func-
tions (as all specimens are unique), can be used, the located
AE maps on SEN-T(B) specimens were used. This was done
by determining the center of gravity of the located
cumulative AE amplitudes in consecutive time intervals as
Figure 6. The KR-curve for a SEN-T(B) specimen. Note:
specimen is identical with that of Fig. 5.
Polym. Adv. Technol. 2007; 18: 90–96
DOI: 10.1002/pat
Fracture behavior of Curv1 93
described in earlier studies in detail.8–10 The related points,
connected by straight lines, represent the position of the
running crack tip at a given time. The outcome of this
procedure is depicted in Fig. 5.
Note that the crack length does not increase (initial value is
ca. 20 mm—cf. Fig. 2) until the load reaches a plateau (Fig. 5,
range I). This is linked with the formation of steady
(equilibrium) damage zone. After that the slight increase
(Fig. 5, range II) in the load is associated with some increase in
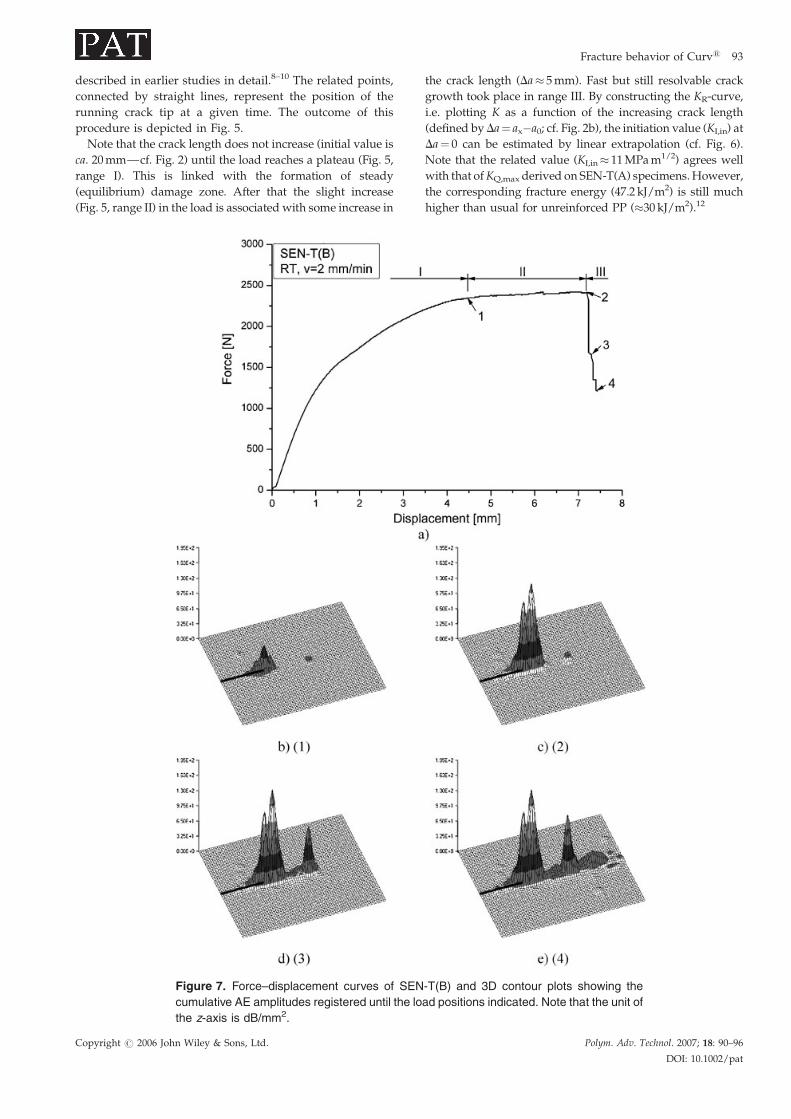
Figure 7. Force–displacement curves of SEN
cumulative AE amplitudes registered until the lo
the z-axis is dB/mm2.
Copyright # 2006 John Wiley & Sons, Ltd.
the crack length (Da� 5 mm). Fast but still resolvable crack
growth took place in range III. By constructing the KR-curve,
i.e. plotting K as a function of the increasing crack length
(defined by Da¼ ax�a0; cf. Fig. 2b), the initiation value (KI,in) at
Da¼ 0 can be estimated by linear extrapolation (cf. Fig. 6).
Note that the related value (KI,in� 11 MPa m1/2) agrees well
with that ofKQ,max derived on SEN-T(A) specimens. However,
the corresponding fracture energy (47.2 kJ/m2) is still much
higher than usual for unreinforced PP (�30 kJ/m2).12
-T(B) and 3D contour plots showing the
ad positions indicated. Note that the unit of
Polym. Adv. Technol. 2007; 18: 90–96
DOI: 10.1002/pat
94 G. Romhany et al.
Damage development and growthThe damage zone has been defined by considering the
located cumulative AE amplitudes, as described in Ref. 8.
The three-dimensional (3D) cumulative AE amplitude
contour plots in Fig. 7 show not only the crack propagation
along the free ligament of SEN-T(B) but also that the
extension of the damage zone did not change practically
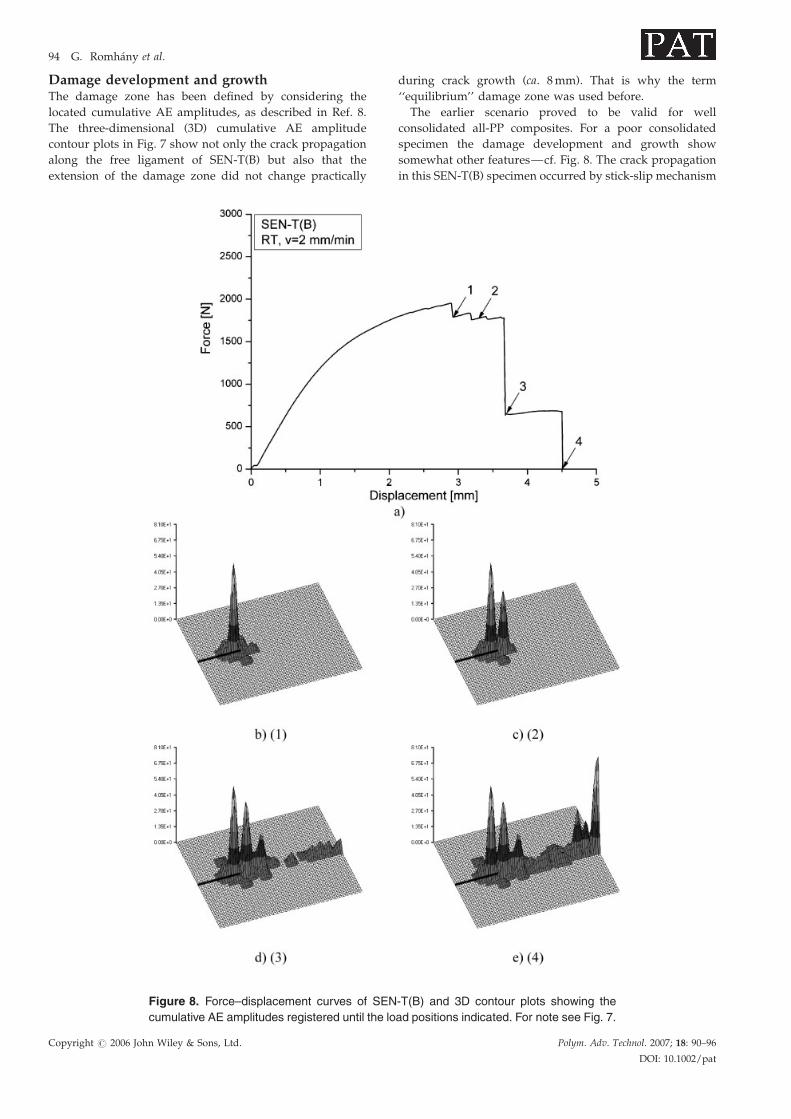
Figure 8. Force–displacement curves of SEN
cumulative AE amplitudes registered until the lo
Copyright # 2006 John Wiley & Sons, Ltd.
during crack growth (ca. 8 mm). That is why the term
‘‘equilibrium’’ damage zone was used before.
The earlier scenario proved to be valid for well
consolidated all-PP composites. For a poor consolidated
specimen the damage development and growth show
somewhat other features—cf. Fig. 8. The crack propagation
in this SEN-T(B) specimen occurred by stick-slip mechanism
-T(B) and 3D contour plots showing the
ad positions indicated. For note see Fig. 7.
Polym. Adv. Technol. 2007; 18: 90–96
DOI: 10.1002/pat

Figure 9. SEM pictures at various magnifications taken from the fracture surface of a SEN-T(B)
specimen. Note: the load–displacement and damage behavior of this specimen were shown in
Figs 5–7. Arrows show brittlely fractured rovings.
Fracture behavior of Curv1 95
(see load drops in the post-maximum range). Each load
drops resulted in a peak linked with the crack progress.
Comparing Figs 7 and 8 one can see that for the poor
consolidation specimen the apparent damage zone is some-
what larger (ca. 12 mm instead of 8 mm). This is due to
differences in the stress redistribution at the crack tip. The
large damage zone becomes, however, smaller with
increasing crack length as the time is not enough for an
efficient stress redistribution to compensate the adverse
effects of the voided areas (cf. Fig. 1).
Similar results were published on poor consolidated
glass-mat reinforced thermoplastic PP. It is worth noting
that the accuracy of the crack tip estimation by AE has been
checked by infrared thermography (IT)—cf. infrared win-
dow in Fig. 2. Between the IT (not reported here) and AE
results a good agreement was found.
Failure behaviorSEM pictures taken from the fracture surface of SEN-T(B)
specimens show that rovings aligned to the loading direction
fractured mostly brittlely. However, those laying perpen-
dicular to the loading direction underwent massive fibrilla-
tion—see Fig. 9(a). At the higher magnification (cf. Fig. 9b)
one can observe that the in fracture plane laying fibers and
their bundles were splitting from the matrix in a very ductile
manner. This is a clear hint for the good interface produced
by hot compaction. One can suppose that the good bonding
was owing to the transcrystallization phenomena (for
example, see Ref. 6) caused by the reinforcing PP fibers.
The overall failure mode shows similarities with that of
unidirectional fiber reinforced thermoplastic components
having a ductile matrix after transverse fracture.
CONCLUSION
Based on this work devoted to the study of the in-plane
fracture behavior of a fabric reinforced all-PP composite
(Curv1), the following conclusions can be drawn:
� Fracture mechanical data determined on SEN-T specimens
by considering the maximum load did not differ from that
Copyright # 2006 John Wiley & Sons, Ltd.
of those deduced by the resistance curve methods. The
crack growth can well be traced by considering the located
cumulative AE amplitudes or events (i.e. shift in their
center of gravity during the test). This has been supported
by infrared thermographic results.
� The consolidation quality is well reflected by the apparent
damage zone size and its change during loading. A small
and stable damage zone traveling through the ligament
suggests good consolidation. The onset of pop-in
phenomena during loading of SEN-T specimens was
ascribed to the presence of voids in the all-PP composite.
AcknowledgmentsThis study was supported by Hungarian Scientific Research
Fund (OTKA F60505 and NI62729) and German Science
Foundation (Ka 1202/17). T. Barany is thankful for the
funding of the Hungarian Governmental Eotvos Scholar-
ship and Janos Bolyai Research Scholarship of the Hungar-
ian Academy of Sciences.
REFERENCES
1. Houshyar S, Shanks RA, Hodzic A. Influence of differentwoven geometry in poly(propylene) woven composites.Macromol. Mater. Eng. 2005; 290: 45–52.
2. Houshyar S, Shanks RA. Tensile properties and creepresponse of polypropylene fibre composites with variationof fibre diameter. Polym. Int. 2004; 53: 1752–1759.
3. Hine PJ, Ward IM, Teckoe J. The compaction of wovenpolypropylene tapes. J. Mater. Sci. 1998; 33: 2725–2733.
4. Ward IM, Hine PJ. The science and technology of hotcompaction. Polymer 2004; 45: 1413–1427.
5. Hine PJ, Ward IM, Jordan ND, Olley R, Bassett DC. Thecompaction behaviour of woven oriented polypropylenefibers and tapes. I. Mechanical properties. Polymer 2003;44: 1117–1131.
6. Ward IM. Developments in oriented polymers. Plast. RubberCompos. 2004; 33: 189–194.
7. Anderson TL. Fracture Mechanics: Fundamentals and Appli-cations. CRC Press: Boca Raton, FL, 1995; 601–606.
8. Romhany G, Czigany T, Karger-Kocsis J. Determination ofJ-R curves of thermoplastic starch composites containingcrossed quasi-unidirectional flax fiber reinforcement. Com-pos. Sci. Technol. 2006; 66: 3179–3187.
Polym. Adv. Technol. 2007; 18: 90–96
DOI: 10.1002/pat
96 G. Romhany et al.
9. Benevolenski OE, Karger-Kocsis J. Comparative study of thefracture behavior of flow-molded GMT-PP with random andchopped-fiber mats. Compos. Sci. Technol. 2001; 61: 2413–2423.
10. Benevolenski OE, Karger-Kocsis J, Czigany T, Romhany G.Mode I fracture resistance of glass fiber mat-reinforcedpolypropylene composites at various degree of consolida-tion. Composites: Part A 2003; 34: 267–273.
Copyright # 2006 John Wiley & Sons, Ltd.
11. Karger-Kocsis J, Harmia T, Czigany T. Comparison of thefracture and failure behavior of polypropylene compositesreinforced by long glass fiber and by glass mats. Compos. Sci.Technol. 1995; 54: 287–298.
12. Karger-Kocsis J, Varga J. Effects of b-a transformation on thestatic and dynamic tensile behavior of isotactic polypropy-lene. J. Appl. Polym. Sci. 1996; 62: 291–300.
Polym. Adv. Technol. 2007; 18: 90–96
DOI: 10.1002/pat