Role of fibre properties in colour non-uniformity of dyed fabrics
Upload
khangminh22Category
view
0download
0
YARN-DYED FABRIC DEFECT DETECTION BASED ON AUTOCORRELATION FUNCTION AND GLCM
Dandan ZHU, Ruru PAN, Weidong GAO, Jie ZHANG
School of Clothing and Textile, Jiangnan University, Wuxi, 214122, China,E-mail: [email protected]
1 Introduction
Yarn-dyed fabric woven by colourful yarns, has a variety of different patterns in the surface for different layouts of coloured yarns. The yarn-dyed fabric is used widely in clothing and decoration. With the improvement of life quality, people pay more attention to the clothing aesthetic in daily life, thus the yarn-dyed fabric is favoured by many consumers for its generous and solemn style. Compared with grey fabric, the weaving process of yarn-dyed fabric is complex and the cost is generally higher. The existence of defects will seriously damage its texture and pattern, which not only affects the beautiful appearance, but reduces the profit sharply. Therefore, in order to improve the fabric quality, it is particularly important to find defects in time and deal with them. In recent years, fabric defect detection based on computer vision has become an intriguing research. However, the current research mainly focuses on the grey fabric, with less involvement of the yarn-dyed fabric.
The main methods used for inspecting fabric defects with image analysis so far can be divided into two categories, those are, frequency-domain analysis methods and time-domain analysis methods[1, 2]. Many methods have been proven effective for detecting the grey fabric defect, including grey level co-occurrence matrix, Fourier transform[3], Gabor transform[4, 5] and wavelet transform[6], but they are not available for inspecting the yarn-dyed fabric defect. Because the texture background of grey fabric is single and relatively obviously different from defects, but yarn-dyed fabric still contains colour texture, whose texture background is intricate and defects tend to hide in colour texture. Therefore, it is difficult to distinguish from each other. Grey level co-occurrence matrix, an important method for texture analysis of fabric images, is widely used
in fabric defect detection. V. Asha et al. proposed a method of defect detection on patterned fabric images based on grey level co-occurrence matrix (GLCM) and chi-square histogram distance[7]. However, when detecting fabric defect by GLCM, the detection window is random and texture features among defect-free fabrics vary obviously, which influences the accuracy of detection.
Based on the pattern period and Euclidean distance of GLCMs, a new detection algorithm for yarn-dyed fabric defects is proposed in this study. For one thing, according to the pattern period, the detection window can be determined; for another, the GLCM features provided by Haralick et al.[8] are not computed directly but GLCM is regarded as the characteristic matrix of the original image and used to compute the distance. Moreover, Euclidean distance of GLCMs between being detected images and the template image can be calculated to find the dissimilarity between two images and according to the discrimination, the defects can be detected successfully. The algorithm is not only simple in theory and easy to accomplish, but also has a high accuracy rate and strong applicability for defects recognition.
2. Materials and methods
2.1. Image acquisition
A Microtek flat is used to capture the images of yarn-dyed fabric in RGB (reg,green,blue) mode. The suitable resolution is particularly important. If it is too big, the images will contain redundant information, which increases the computing time during the image processing. On the contrary, the image quality cannot meet the processing requirements. The resolution is set
Abstract:
In this study, a new detection algorithm for yarn-dyed fabric defect based on autocorrelation function and grey level co-occurrence matrix (GLCM) is put forward. First, autocorrelation function is used to determine the pattern period of yarn-dyed fabric and according to this, the size of detection window can be obtained. Second, GLCMs are calculated with the specified parameters to characterise the original image. Third, Euclidean distances of GLCMs between being detected images and template image, which is selected from the defect-free fabric, are computed and then the threshold value is given to realise the defect detection. Experimental results show that the algorithm proposed in this study can achieve accurate detection of common defects of yarn-dyed fabric, such as the wrong weft, weft crackiness, stretched warp, oil stain and holes.
Keywords:
Autocorrelation function; defect detection; Euclidean distance; GLCM; yarn-dyed fabric
http://www.autexrj.com
AUTEX Research Journal, Vol. 15, No 3, September 2015, DOI: 10.1515/aut-2015-0001 © AUTEX
226Unauthenticated
Download Date | 2/9/16 7:59 PM
that the curves are periodic on the whole, while the curve has various peaks and valleys locally, which is determined by the fabric structure. The local peaks indicate the main centre of the yarns, and the local valleys present the interstices between the yarns. It is difficult to determine pattern period according to the original curves directly. In order to compute the period of the fabric, data smooth processing should be performed to get rid of the local peaks and valleys[12]. Locally Weighted Scatterplot Smoothing (LOWESS)[13] is used, and the window widths are 50 for both directions. The results are shown in Fig 2(b) and 2(d). After data smoothing, all the local peaks and valleys of the autocorrelation curves are filtered out and the relevant peaks and valleys are retained.
From Fig. 2(b), it can be seen that the autocorrelation curve in the weft direction is a smooth curve with several peaks and valleys. All the local minimums of the curve are located to find the pixel coordinates of each valley point. They are 77, 150, 221 and 293, respectively, and the period of the curve will be calculated through differences between adjacent points. They are 73, 71 and 72, respectively. The period can be determined by averaging all the difference. After averaging, if the period is not an integer, the result will be rounded off. The weft-directional period is given (Tx = 72). Similarly, the weft-directional period can be calculated from Fig. 2(d) (Ty = 93). The size of pattern period is 93 × 72 pixels, so detection window can be determined, and then the original image of yarn-dyed fabric is divided into small blocks of same size, as shown in Fig. 3.
2.3 Grey level co-occurrence matrix
Grey level co-occurrence matrix, one of the best promising methods for texture analysis, estimates image properties related to second-order statistics[14]. And it is the basis of analysing local pattern and the pixel arrangement rules of images[15].
A two-dimensional image can be represented as f(x, y). M and N indicate the height and the width of the image, respectively. Current pixel in the image with grey level i and neighbour pixel with grey level j form a pixel-pair as shown Fig. 4. Then the GLCM is generated by counting the occurrences of intensity pairs between the current and neighbour pixels[16]. Mathematically, the general equation of GLCM parameterised by the offset (dx, dy) is given as:
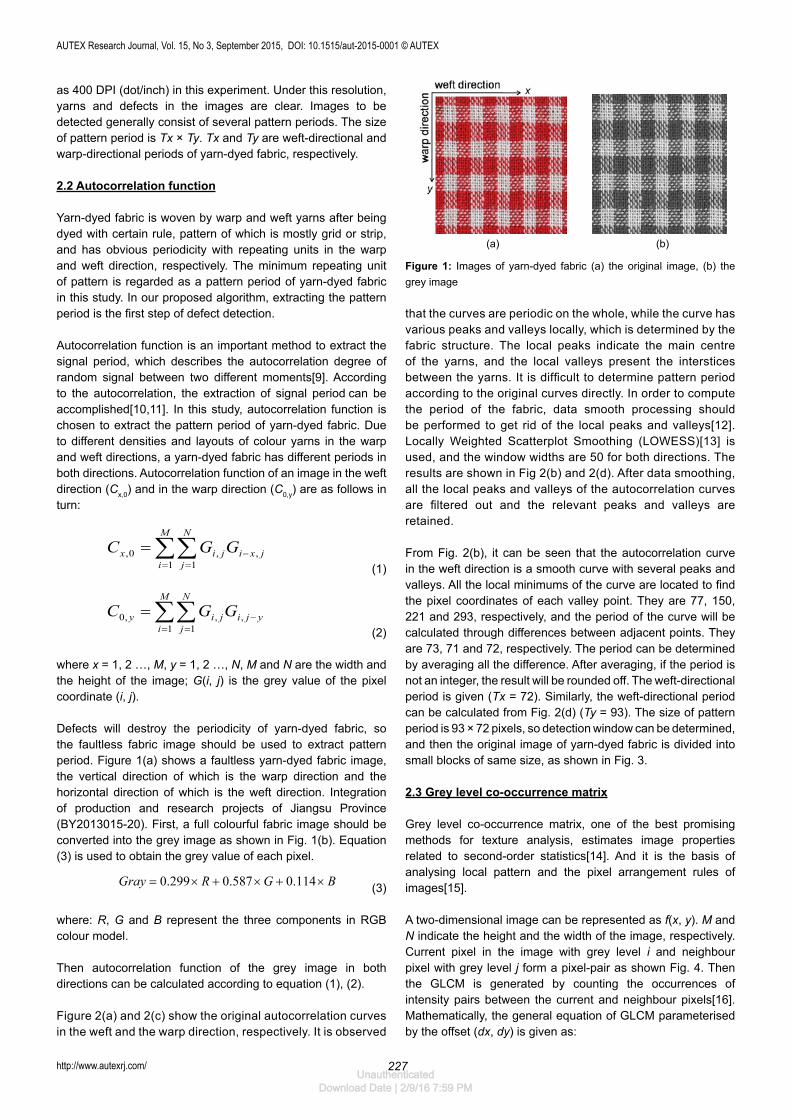
as 400 DPI (dot/inch) in this experiment. Under this resolution, yarns and defects in the images are clear. Images to be detected generally consist of several pattern periods. The size of pattern period is Tx × Ty. Tx and Ty are weft-directional and warp-directional periods of yarn-dyed fabric, respectively.
2.2 Autocorrelation function
Yarn-dyed fabric is woven by warp and weft yarns after being dyed with certain rule, pattern of which is mostly grid or strip, and has obvious periodicity with repeating units in the warp and weft direction, respectively. The minimum repeating unit of pattern is regarded as a pattern period of yarn-dyed fabric in this study. In our proposed algorithm, extracting the pattern period is the first step of defect detection.
Autocorrelation function is an important method to extract the signal period, which describes the autocorrelation degree of random signal between two different moments[9]. According to the autocorrelation, the extraction of signal period can be accomplished[10,11]. In this study, autocorrelation function is chosen to extract the pattern period of yarn-dyed fabric. Due to different densities and layouts of colour yarns in the warp and weft directions, a yarn-dyed fabric has different periods in both directions. Autocorrelation function of an image in the weft direction (Cx,0) and in the warp direction (C0,y) are as follows in turn:
∑∑
= =−=
M
i
N
jjxijix GGC
1 1,,0,
(1)
∑∑
= =−=
M
i
N
jyjijiy GGC
1 1,,,0
(2)
where x = 1, 2 …, M, y = 1, 2 …, N, M and N are the width and the height of the image; G(i, j) is the grey value of the pixel coordinate (i, j).
Defects will destroy the periodicity of yarn-dyed fabric, so the faultless fabric image should be used to extract pattern period. Figure 1(a) shows a faultless yarn-dyed fabric image, the vertical direction of which is the warp direction and the horizontal direction of which is the weft direction. Integration of production and research projects of Jiangsu Province (BY2013015-20). First, a full colourful fabric image should be converted into the grey image as shown in Fig. 1(b). Equation (3) is used to obtain the grey value of each pixel.
BGRGray ×+×+×= 114.0587.0299.0 (3)
where: R, G and B represent the three components in RGB colour model.
Then autocorrelation function of the grey image in both directions can be calculated according to equation (1), (2).
Figure 2(a) and 2(c) show the original autocorrelation curves in the weft and the warp direction, respectively. It is observed
(a) (b)
Figure 1: Images of yarn-dyed fabric (a) the original image, (b) the grey image
AUTEX Research Journal, Vol. 15, No 3, September 2015, DOI: 10.1515/aut-2015-0001 © AUTEX
http://www.autexrj.com/ 227Unauthenticated
Download Date | 2/9/16 7:59 PM

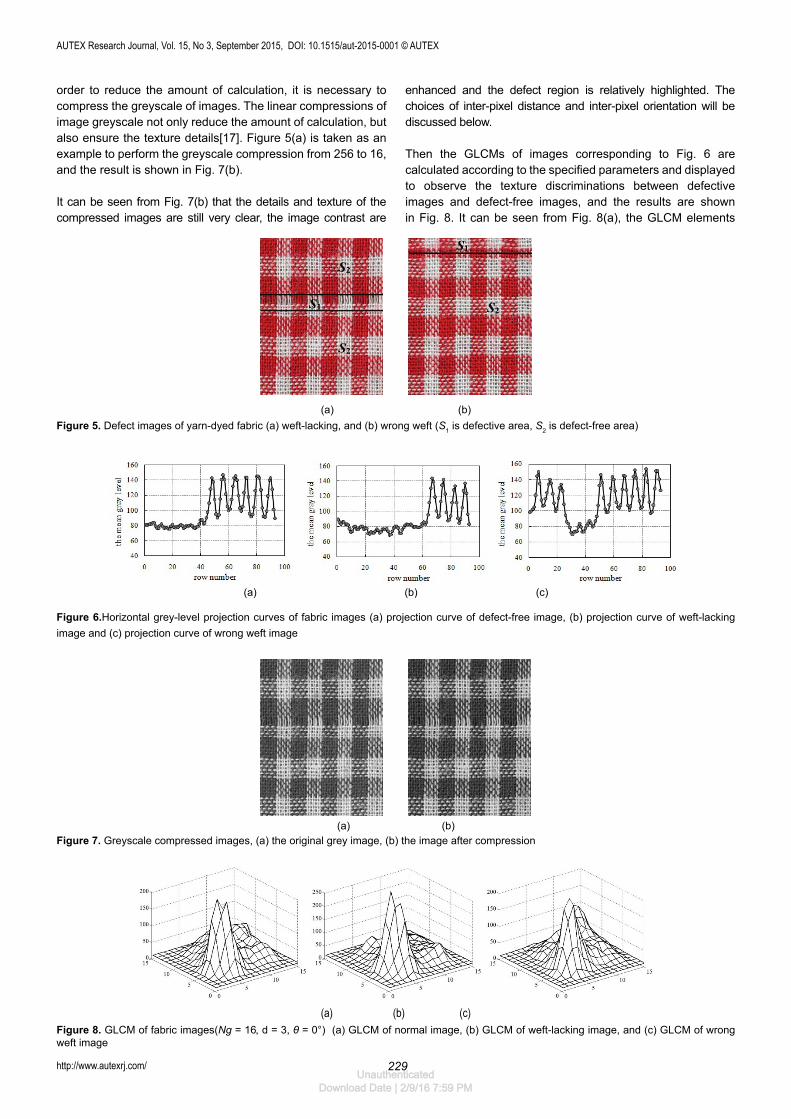
Figure 5 shows defect images of yarn-dyed fabrics. Weft-lacking belongs to structural defects as shown in Fig. 5(a). Wrong weft belongs to colour defects as shown in Fig. 5(b). They both belong to weft-directional defects, and weft-directional grey levels change largely. Figure 5 is taken as an example to observe the difference of grey levels between defective images and defect-free images. Figure 5(a) and 5(b) are segmented into 16 blocks according to the size of pattern period, respectively, including defect-free images and defective images. Grey-level projection in the horizontal direction is performed, and the projection curves are given in Fig. 6.
It can be seen from Fig. 6(b), the area of weft-lacking is grey mutation. Similarly, the grey levels at the area of wrong weft are abnormal. These local grey-level anomalies of images will cause the change of GLCM.
By the definition of GLCM, greyscale, inter-pixel distance and inter-pixel orientation are most important parameters. In
∑∑−
=
−
=
=++=
=1
0
1
0,
otherwise ,0
),( and ),( if,1),(
M
x
N
y
yxji
jdydxfiyxfdP θ
(4)
where i,j = 1, 2 …, Ng, Ng is the greyscale of the image; the offset (dx, dy) characterises the pixel displacement and the orientation; d is inter-pixel distance; θ is inter-pixel orientation, that is generally 0°, 45°, 90°, 135°.
The yarn-dyed fabric contains colour texture, besides structure texture. According to this, defects can be divided into structural type and colour type. The former is similar to that of the grey fabric, which destructs the structural texture of fabrics, including cracked ends, weft crackiness, stretched warp, holes and so on, but the latter is caused by the wrong layouts of colour yarns, which changes colour texture of fabrics. Defects will cause the change of the image greyscale distribution, no matter that their types belong to the former or the latter. GLCM can describe the change intuitively.
(a) (b)
(c) (d)
Figure 2: Autocorrelation of yarn-dyed fabric (a) weft-directional before data smoothing (b) weft-directional after data smoothing, (c) warp-directional before data smoothing, and (d) warp-directional after data smoothing
Figure 3: Fabric divided according to pattern period Figure 4. The position relationship of pixel-pairs
AUTEX Research Journal, Vol. 15, No 3, September 2015, DOI: 10.1515/aut-2015-0001 © AUTEX
http://www.autexrj.com/ 228Unauthenticated
Download Date | 2/9/16 7:59 PM
enhanced and the defect region is relatively highlighted. The choices of inter-pixel distance and inter-pixel orientation will be discussed below.
Then the GLCMs of images corresponding to Fig. 6 are calculated according to the specified parameters and displayed to observe the texture discriminations between defective images and defect-free images, and the results are shown in Fig. 8. It can be seen from Fig. 8(a), the GLCM elements
order to reduce the amount of calculation, it is necessary to compress the greyscale of images. The linear compressions of image greyscale not only reduce the amount of calculation, but also ensure the texture details[17]. Figure 5(a) is taken as an example to perform the greyscale compression from 256 to 16, and the result is shown in Fig. 7(b).
It can be seen from Fig. 7(b) that the details and texture of the compressed images are still very clear, the image contrast are
(a) (b)
Figure 5. Defect images of yarn-dyed fabric (a) weft-lacking, and (b) wrong weft (S1 is defective area, S2 is defect-free area)
(a) (b) (c)
Figure 6.Horizontal grey-level projection curves of fabric images (a) projection curve of defect-free image, (b) projection curve of weft-lacking image and (c) projection curve of wrong weft image
(a) (b)
Figure 7. Greyscale compressed images, (a) the original grey image, (b) the image after compression
(a) (b) (c)
Figure 8. GLCM of fabric images(Ng = 16, d = 3, θ = 0°) (a) GLCM of normal image, (b) GLCM of weft-lacking image, and (c) GLCM of wrong weft image
AUTEX Research Journal, Vol. 15, No 3, September 2015, DOI: 10.1515/aut-2015-0001 © AUTEX
http://www.autexrj.com/ 229Unauthenticated
Download Date | 2/9/16 7:59 PM

of the defect-free image focus on the main diagonal nearby. When the structural texture of fabric is destroyed, the GLCM elements of defect images far away from the main diagonal are increased, which shows that the texture coarseness of images changes, as shown in Fig. 8(b). When the colour texture of fabrics is destroyed, the GLCM elements are mostly near the main diagonal, which suggests that the texture coarseness of images remains unchanged, and compared to defect-free image, its distribution is relatively even, as shown in Fig. 8(c).
2.4 Euclidean distance
Euclidean distance is a commonly used definition of distance. It refers to the actual distance between two points. Euclidean distance is one of the distance measures that can be used to find the dissimilarity between two images[18,19]. There redundant information in the original images. If Euclidean distance of two images is calculated directly, there will be not only a large amount of calculations to slow down the speed, but the results are seriously affected by noises. GLCM can effectively describe the fabric texture, thus it is called as characteristic matrix, and the similarity of two fabric images is represented by Euclidean distance of their GLCMs in this study. The Euclidean distance D of GLCMs is as follows:
∑∑−
=
−
=
−=1
0
1
0
2)],(),([N
x
N
y
yxgyxfD (5)
where: f(x, y) shows GLCM of image to be detected, g(x, y) shows the GLCM of template image, and N is the greyscale of images. The less the value of D, the larger the similarity of two images. The Euclidean distance between the two same images is zero.
The size of detection window is an important parameter for fabric defect inspection, and a pattern period is chosen as detection window. Figure 5(a) is taken as an example to detect defects by using the algorithm proposed in this study. The detection procedure is carried out as following steps.
Step 1 The pattern period is determined according to the method mentioned above, and through the training, the detection template is obtained as shown in Fig. 9(a).
Step 2 The images to be detected are divided into 16 blocks according to the size of pattern period as shown in Fig. 9(b).
Step 3 The GLCMs of being detected images and the template image are calculated with specified parameters.
Step 4 The Euclidean distances between them are computed according to Formula (4).
In the process of computing GLCM, inter-pixel distance and inter-pixel orientation are two important parameters that will influence the accuracy rate of defect inspection. The optimal parameters are selected according to results of Euclidean distance in this study. First, the inter-pixel distance is selected under the condition of θ = 0°. By the characteristics of fabric texture, the distance is not too large. With d = 1, 3, 5, the GLCMs of being detected images and template image are calculated separately, and then the Euclidean distances between them are computed. The result is shown in Fig. 10(a). It can be obtained from Fig. 10(a) that the Euclidean distances between defect-free images and template image are in the range of (120, 190), and those between defective images and template image are greater than 220. When d = 1, the calculating results
(a) (b)
Figure 9.The template image and defect image (a) the template image and (b) the result of segmentation
(a) (b)
Figure 10. Euclidean distances of GLCMs under different parameters (a) Euclidean distances between GLCMs under different distances and (b) Euclidean distances between GLCMs under different orientations
AUTEX Research Journal, Vol. 15, No 3, September 2015, DOI: 10.1515/aut-2015-0001 © AUTEX
http://www.autexrj.com/ 230Unauthenticated
Download Date | 2/9/16 7:59 PM

of several defect-free images are greater than 220. When d = 5, the calculating results of some defective images are less than 190. When d = 3, the calculating results are relatively steady and have obvious boundary.
Then the inter-pixel distance is set as d = 3, and the inter-pixel orientation is selected from θ = 0°, 45°, 90°, 135°. The Euclidean distances of GLCMs between being detected images and template image are computed, and the results are shown in Fig. 10(b). It can be given from Fig. 10(b) that the Euclidean distance of GLCMs is almost not affected by directions, and the threshold of defect inspection can be set at around 190, so θ = 0° is chosen in this study.
After the parameters of GLCM are given, through training-selected samples, the threshold value of the algorithm is obtained, which is crucial to identify defects of yarn-dyed fabric accurately. It is found that the threshold value mainly depends on the size of detect window.
3 Results and Discussion
A type of yarn-dyed fabric containing two colours is selected to verify the validity and accuracy of the algorithm. Figure 11 shows common defect images of the yarn-dyed fabric, including holes, weft crackiness. When three parameters of GLCM are set as Ng = 16, d = 3, θ = 0°, and the threshold T is set to 190, the tests of yarn-dyed fabric defects inspection are performed by using the algorithm proposed in this study. When Euclidean distances of GLCMs between being detected
image and template image are greater than 190, the images to be detected are judged as defective images and marked. Otherwise, they are judged as defect-free images and not marked. The detection result is shown in Fig. 11, and the analytic result of Euclidean distance is shown in Fig. 12. It can be seen from Fig. 11 that all defective images in the experiment are recognised and marked correctly. It can be observed from Fig. 12 that the Euclidean distances between defective images and template image are all greater than the threshold T and the Euclidean distances between defect-free images and template image are all less than T, which distribute in a stable range. The results of Euclidean distance have obvious differences between defective images and defect-free image.
Another type of yarn-dyed fabric containing three colours is chosen to test the robustness of the algorithm. Figure 13 displays common defect images of the yarn-dyed fabric, including broken weft, wrong weft, holes, oil stain. First, autocorrelation function is used to determine the pattern period and the detection template selected from the defect-free fabric is obtained. Second, when three parameters of GLCM are set as Ng = 16, d = 3, θ = 0°, and the threshold T is set to 200, the experiments of yarn-dyed fabric defects inspection are performed by using the algorithm. The detection result is given in Fig. 13, and the analytic result of Euclidean distance is shown in Fig. 14. It can be seen from Fig. 13 that four types of defects in the experiment are recognised and marked successfully. It can be observed from Fig. 14 that the Euclidean distances between all defective images and their template image are greater than the threshold T. The results of wrong weft, oil stain are far greater than T and the results of holes, broken weft are
(a) (b) Figure 11: Defect images of (a) holes, and (b) weft crackiness Figure 12. The analysis of Euclidean distances
(a) (b) (c) (d)
Figure 13. Defect images of (a) broken weft, (b) wrong weft, (c) holes, and (d) oil stain
AUTEX Research Journal, Vol. 15, No 3, September 2015, DOI: 10.1515/aut-2015-0001 © AUTEX
http://www.autexrj.com/ 231Unauthenticated
Download Date | 2/9/16 7:59 PM
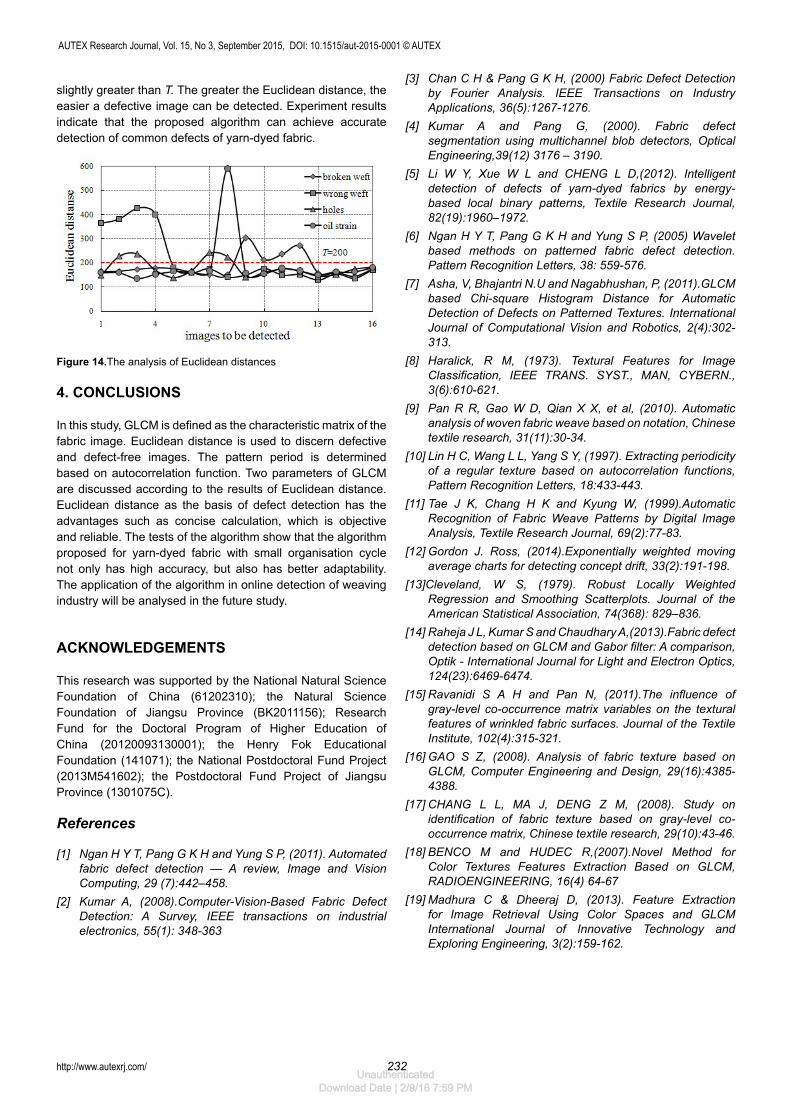
slightly greater than T. The greater the Euclidean distance, the easier a defective image can be detected. Experiment results indicate that the proposed algorithm can achieve accurate detection of common defects of yarn-dyed fabric.
Figure 14.The analysis of Euclidean distances
4. CONCLUSIONS
In this study, GLCM is defined as the characteristic matrix of the fabric image. Euclidean distance is used to discern defective and defect-free images. The pattern period is determined based on autocorrelation function. Two parameters of GLCM are discussed according to the results of Euclidean distance. Euclidean distance as the basis of defect detection has the advantages such as concise calculation, which is objective and reliable. The tests of the algorithm show that the algorithm proposed for yarn-dyed fabric with small organisation cycle not only has high accuracy, but also has better adaptability. The application of the algorithm in online detection of weaving industry will be analysed in the future study.
ACKNOWLEDGEMENTS
This research was supported by the National Natural Science Foundation of China (61202310); the Natural Science Foundation of Jiangsu Province (BK2011156); Research Fund for the Doctoral Program of Higher Education of China (20120093130001); the Henry Fok Educational Foundation (141071); the National Postdoctoral Fund Project (2013M541602); the Postdoctoral Fund Project of Jiangsu Province (1301075C).
References
[1] Ngan H Y T, Pang G K H and Yung S P, (2011). Automated fabric defect detection — A review, Image and Vision Computing, 29 (7):442–458.
[2] Kumar A, (2008).Computer-Vision-Based Fabric Defect Detection: A Survey, IEEE transactions on industrial electronics, 55(1): 348-363
[3] Chan C H & Pang G K H, (2000) Fabric Defect Detection by Fourier Analysis. IEEE Transactions on Industry Applications, 36(5):1267-1276.
[4] Kumar A and Pang G, (2000). Fabric defect segmentation using multichannel blob detectors, Optical Engineering,39(12) 3176 – 3190.
[5] Li W Y, Xue W L and CHENG L D,(2012). Intelligent detection of defects of yarn-dyed fabrics by energy-based local binary patterns, Textile Research Journal, 82(19):1960–1972.
[6] Ngan H Y T, Pang G K H and Yung S P, (2005) Wavelet based methods on patterned fabric defect detection. Pattern Recognition Letters, 38: 559-576.
[7] Asha, V, Bhajantri N.U and Nagabhushan, P, (2011).GLCM based Chi-square Histogram Distance for Automatic Detection of Defects on Patterned Textures. International Journal of Computational Vision and Robotics, 2(4):302-313.
[8] Haralick, R M, (1973). Textural Features for Image Classification, IEEE TRANS. SYST., MAN, CYBERN., 3(6):610-621.
[9] Pan R R, Gao W D, Qian X X, et al, (2010). Automatic analysis of woven fabric weave based on notation, Chinese textile research, 31(11):30-34.
[10] Lin H C, Wang L L, Yang S Y, (1997). Extracting periodicity of a regular texture based on autocorrelation functions, Pattern Recognition Letters, 18:433-443.
[11] Tae J K, Chang H K and Kyung W, (1999).Automatic Recognition of Fabric Weave Patterns by Digital Image Analysis, Textile Research Journal, 69(2):77-83.
[12] Gordon J. Ross, (2014).Exponentially weighted moving average charts for detecting concept drift, 33(2):191-198.
[13]Cleveland, W S, (1979). Robust Locally Weighted Regression and Smoothing Scatterplots. Journal of the American Statistical Association, 74(368): 829–836.
[14] Raheja J L, Kumar S and Chaudhary A,(2013).Fabric defect detection based on GLCM and Gabor filter: A comparison, Optik - International Journal for Light and Electron Optics, 124(23):6469-6474.
[15] Ravanidi S A H and Pan N, (2011).The influence of gray-level co-occurrence matrix variables on the textural features of wrinkled fabric surfaces. Journal of the Textile Institute, 102(4):315-321.
[16] GAO S Z, (2008). Analysis of fabric texture based on GLCM, Computer Engineering and Design, 29(16):4385-4388.
[17] CHANG L L, MA J, DENG Z M, (2008). Study on identification of fabric texture based on gray-level co-occurrence matrix, Chinese textile research, 29(10):43-46.
[18] BENCO M and HUDEC R,(2007).Novel Method for Color Textures Features Extraction Based on GLCM, RADIOENGINEERING, 16(4) 64-67
[19] Madhura C & Dheeraj D, (2013). Feature Extraction for Image Retrieval Using Color Spaces and GLCM International Journal of Innovative Technology and Exploring Engineering, 3(2):159-162.
AUTEX Research Journal, Vol. 15, No 3, September 2015, DOI: 10.1515/aut-2015-0001 © AUTEX
http://www.autexrj.com/ 232Unauthenticated
Download Date | 2/9/16 7:59 PM
Copyright © 2022 FDOKUMEN