Critical state parameters and peak stress envelopes for Bangkok Clays
Upload
independentCategory
view
0download
0
Applied Clay Science 91–92 (2014) 117–126
Contents lists available at ScienceDirect
Applied Clay Science
j ourna l homepage: www.e lsev ie r .com/ locate /c lay
Research paper
Simulation of fabric in sedimented clays
Suchit D. Gumaste, Kannan R. Iyer, Susmita Sharma, W. Channabasavaraj, D.N. Singh ⁎a Department of Civil Engineering, Indian Institute of Technology Bombay, Powai, Mumbai 400076, India
⁎ Corresponding author. Tel.: +91 22 2576 7340; fax: +E-mail addresses: [email protected] (S.D. Guma
[email protected] (K.R. Iyer), susmita.sharma4@[email protected] (W. Channabasavaraj), dns@civil.
0169-1317/$ – see front matter © 2014 Elsevier B.V. All rihttp://dx.doi.org/10.1016/j.clay.2014.01.011
a b s t r a c t
a r t i c l e i n f oArticle history:Received 12 March 2013Received in revised form 15 December 2013Accepted 27 January 2014Available online 18 February 2014
Keywords:Sedimentation characteristicsClay fabricElectrical conductivityFabric anisotropyLaboratory investigations
Sedimentation of clays in natural water bodies leads to the formation of sediments which exhibit different typesof fabric (i.e., the arrangement of clay platelets). As the overall engineering behavior of clays is strongly depen-dent on their fabric, the study of sedimentation of clays and parameters influencing their settling characteristicsbecomes important. With this in view, sedimentation tests were conducted in the laboratory to study settlingcharacteristics of different types of clays in aqueous suspensions of varying electrolyte concentrations. The set-tling characteristics, defined in terms of the volume of the sediments at the end of the test, were correlatedwith the ionic strength of the suspension and its zeta potential to obtain qualitative information about its fabric.Further, Impedance Spectroscopy (IS) and Mercury Intrusion Porosimetry (MIP) were conducted on these sedi-ments to quantify their fabric and the results have been compared vis-à-vis those obtained by conducting similarinvestigations on the naturally occurring clay sediments, collected from offshore locations. It has been observedthat by employing the anisotropy coefficient, which is the ratio of electrical conductivities of the specimen in thetransverse and longitudinal directions of sedimentation, the particle orientation and the fabric anisotropy of sed-iments can be quantified. This study demonstrates the utility of themethodology, based on IS andMIP in tandem,for quantifying the fabric of clay sediments.
© 2014 Elsevier B.V. All rights reserved.
1. Introduction
The sedimentation process refers to the motion of soil particles inslurries and suspensions as per gravitational and inter-particle forces(Kynch, 1952). However, the sedimentation of clay sized particles inwater (either saline or fresh) is mainly influenced by the presence ofinter-particle van derWaals attractive forces and double-layer repulsiveforces (Sridharan and Prakash, 1999). The predominance of these forcesover the forces due to gravity or self-weight (i.e., body forces) in sedi-mentation process is due to the fact that the size of the clay particles(platelets) is in colloid range (b2 μm) and they carry surface charge.The interaction between the clay particles and water (i.e., the pore-fluid) is further responsible for development of different types of fabric(i.e., the spatial arrangement of the particles) (Pusch and Yong, 2003) inclays, which ultimately governs their engineering behavior (Basmaet al., 1996; Collins, 1983; Daniel and Liljestrand, 1984; Delage andLefebvre, 1984; Diamond, 1970; Dolinar and Trauner, 2007; Griffithsand Joshi, 1989; Mitchell, 1993; Moore and Mitchell, 1974; Olson andMesri, 1970; Rajasekaran et al., 1999; Rao and Revanasiddappa, 2005;Souli et al., 2008; Wang and Xu, 2007). In this context, Griffith andJoshi (1990) have reported that deformation of clays during consolida-tion is due to reduction in inter-aggregate pores, and intra-aggregatepores do not have much influence on the consolidation process. Cetin
91 22 2576 7302.ste),gmail.com (S. Sharma),
iitb.ac.in (D.N. Singh).
ghts reserved.
(2004) has investigated the influence of external loading on orientationof soil particles, and has noted that the orientation of particles is random(i.e., flocculated fabric) before loading, but changes to dispersed fabricwhen the stress exceeds the preconsolidation pressure. Prashant andPenumadu (2007) have investigated the influence of geometric ar-rangement of clay platelets (i.e., microfabric) on mechanical behaviorof kaolinitic clay, and have reported that permanent deformation duringconsolidation ismuch lower for samples with dispersed structure whencompared to the samples with flocculated structure. Sachan andPenumadu (2007) reported the influence of microfabric on mechanicalbehavior of kaolinitic clay and concluded that microfabric strongly af-fects the shear strength and volume change properties of soils. Further,these authors have noted that normally consolidated clays, withdispersed fabric, exhibit dilation during shearing whereas volumetricreduction is observed for the clays with flocculated fabric. Pillai et al.(2011) studied themicrofabric of kaolinitic clays under static and cyclicloading conditions and reported that samples with dispersed fabricexhibit higher peak undrained strength, whereas their counterpartswith flocculated fabric offer higher resistance to cyclic loading.Romero and Simms (2008) have highlighted the importance of micro-structural studies and their relevance to engineering properties (suchas water retention, permeability and volume change behavior) of soils.Horpibulsuk et al. (2011) studied the behavior of low swelling clay inthe presence of pore-solutions of different ionic concentrations andhave noted that the fabric becomes more flocculated with increase inionic concentration, which results in enhanced water holding capacity.Further, they have proposed generalized stress state parameter, definedas the ratio of void ratio of current state of the clay to the void ratio of
Nomenclature
ε dielectric constant of the clay solutionω frequency of ACσAC AC conductivity of the sampleσDC DC conductivity of the sampleσl DC conductivities of the specimen in the vertical (longi-
tudinal) directionσt DC conductivities of the specimen in the horizontal
(transverse) directionΔVHg change in volume of the intruded mercury in the
specimenA area of the electrodesAe anisotropy coefficientci concentration of the iond pore diameterdd dominant pore diameterdm mean pore diameterDW distilled waterEC electrical conductivityEo strength of external electric fieldFSI free swell indexG specific gravityI ionic strengthIS impedance spectroscopyJCPDS joint committee on powder diffraction standardsl distance between the electrode PlatesL/S liquid to solidMIP mercury intrusion porosimetry/porosimeterR2 measure of goodness of fit of linear regressionU electrophoretic mobilityUSCS unified soil classification systemVE velocity of particle in the solutionVHgc percentage cumulative volume of mercury intruded in
the specimenVHgi incremental volume of mercury intruded in the
specimenvi ionic valencyVs normalized volume of sediments (at any instance)Vsu normalized ultimate volume of sedimentsXRD X-ray diffractionZ′ the real part of the impedanceη viscosity of the clay solutionξ zeta potential
118 S.D. Gumaste et al. / Applied Clay Science 91–92 (2014) 117–126
the clay at liquid limit, based on the properties of clay and pore water,which is useful for defining changes in permeability of the clay. This pa-rameter further helps in determination of the compression curves ofvarious clays with different pore water chemistries. From the findingsof these researches, it can be concluded that the study of sedimentationof clays, and factors affecting the settling characteristics, which influ-ence their microstructure, are important for complete understandingand interpretation of their nature and engineering behavior.
In this context, the mechanism of sedimentation process under dif-ferent environmental conditions has been studied by Imai (1980). Theeffect of initial water content and ionic concentration has been shownto yield formation of four different types of settling behaviors of theclay suspensions including: dispersed free settling, flocculated free set-tling, zone settling and consolidation settling. In addition, Sridharan andPrakash (2001) concluded that the repulsive forces between clay parti-cles (platelets) control the settling characteristics of montmorilloniticclays, whereas the attractive forces between clay particles (platelets)are responsible for the settling characteristics, in case of kaoliniteclays. In this context, based on various colloidal theories proposed and
developed by the earlier researchers (Anandarajah and Chen, 1994,1995, 1997; Anandarajah and Lu, 1991; Lu and Anandrajah, 1992),Anandarajah (1997) studied the sedimentation process of differentkaolinite suspensions and an approximatemodel for the clay particle as-sembly was proposed. The author further reported that with appropri-ate choice of values for the system variables such as dielectric constantof the fluid, intensity of surface charge, concentration and valence ofthe ions, particle length and spacing, and the angle between the parti-cles, the final void ratio of the suspensions can easily be estimated.
The above mentioned studies indicate that sedimentation of clays issignificantly influenced by various parameters such as their particle sizedistribution, liquid to solid ratio (L/S), mineralogical composition of theparticles and the pore-fluid chemistry (i.e., electrolytic concentrationand pH) and the variations in these parameters governs the type of fab-ric developed in the sediments, such as flocculated (random orientationof the particles) or dispersed (i.e., the preferred orientation of particles)(Lambe and Whiteman, 1969; Mitchell, 1993 and van Olphen, 1977).However, one of the limitations of these studies is that only two ex-treme fabrics (flocculated and dispersed) can be described, while, theintermediate settling characteristics, which may result due to variationin the abovementioned parameters, cannot be studied. These studies donot provide quantitative information about the flocculated and dis-persed fabrics. This is due to the fact that most of these studies predictthe fabric of the sediments, indirectly, based on the final sediment vol-ume, i.e., the volume corresponding to the end of the sedimentationtest, and hence, they are qualitative in nature. In addition, most of thenumerical and experimental investigations have been conducted on ka-olinite clays and hence, generalization of findings from these studies isintricate. Under these circumstances, extensive laboratory investiga-tions are required to simulate settling characteristics of different clays,in general, under varied compositions of the pore-fluid.
With this in view, tests were conducted in the laboratory to studythe fabric formed during sedimentation of different types of clays innatural water bodies. The fabric of the sediments was studied using ad-vanced instrumentation techniques such as Impedance Spectroscopy(IS), (Rao et al., 2007; Rinaldi and Francisca, 1999; Shah and Singh,2004) and Mercury Intrusion Porosimetry (MIP) (Delage and Lefebvre,1984; Griffiths and Joshi, 1989). Also, a critical analysis of the resultshas been done vis-à-vis the results obtained by Gumaste and Singh(2010) on the undisturbed samples collected from the offshoresediments.
2. Experimental investigations
For the present study, three different types of clays were selected:(1) white clay (designated as WC) comprising of about 70% kaolinite;(2) montmorillonite, (designated as MT) comprising of about 90%montmorillonite, and (3) naturally occurring marine clay (designatedasMC) obtained fromundisturbed Shelby tube samples (inner diameter76mm) collected from the eastern coast of India at depths ranging from5 to 65 m below the seabed. The clays WC and MT procured from themines of Kutch districts, Gujarat, Western India, levigated and commer-cially available and an undisturbed sample of clay MC was oven driedand pulverized for the present study. It is worth noting that the claysWC and MT were chosen as control material, they are homogeneouspowders and are integral constituents of naturally occurring clays. Onthe other hand, the naturally occurring clay, MC was chosen to studythe fabric structure formed under natural environment. As such, studieson these clays facilitate a comparison between the fabric structureformed due to the influence of physical, chemical and mineralogicalcharacteristics. The physical, chemical and mineralogical characteriza-tion of these clays was carried out and the details are described in thefollowing sections. Furthermore, sedimentation tests were conductedon these clays in different settling environments by altering the chemis-try of pore-fluid (i.e., altering the electrolyte concentration of the clay–
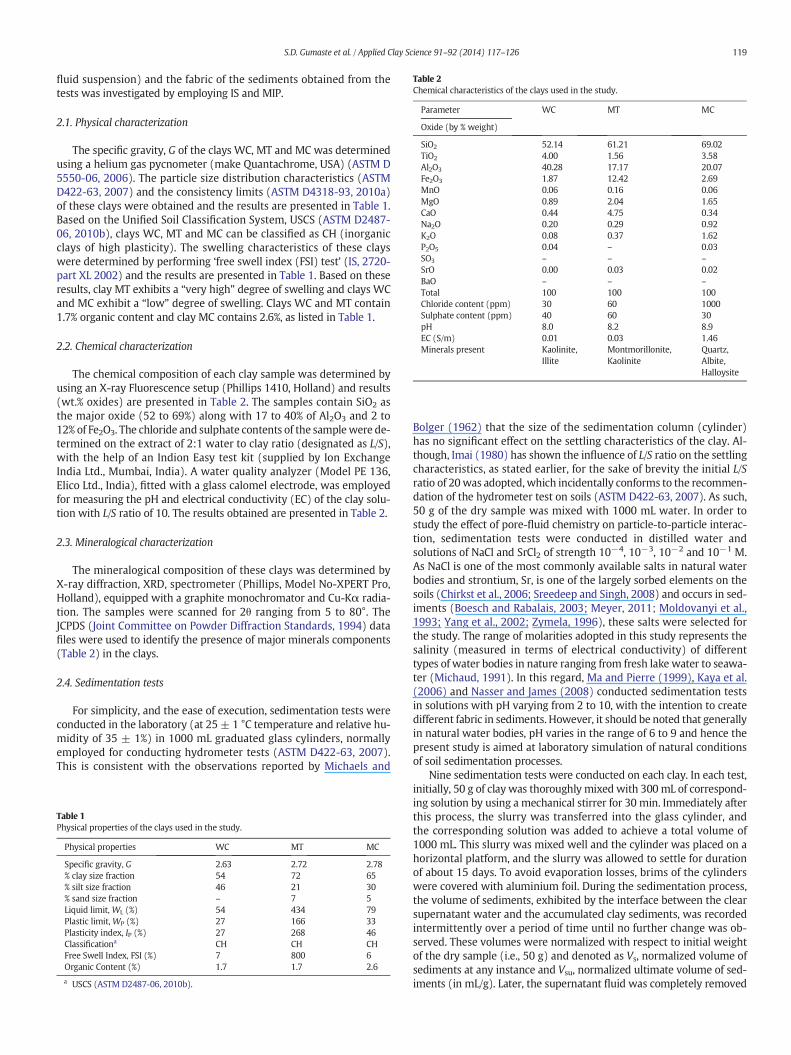
Table 2Chemical characteristics of the clays used in the study.
Parameter WC MT MC
Oxide (by % weight)
SiO2 52.14 61.21 69.02TiO2 4.00 1.56 3.58Al2O3 40.28 17.17 20.07Fe2O3 1.87 12.42 2.69MnO 0.06 0.16 0.06MgO 0.89 2.04 1.65CaO 0.44 4.75 0.34Na2O 0.20 0.29 0.92K2O 0.08 0.37 1.62P2O5 0.04 – 0.03SO3 – – –
SrO 0.00 0.03 0.02BaO – – –
Total 100 100 100Chloride content (ppm) 30 60 1000Sulphate content (ppm) 40 60 30pH 8.0 8.2 8.9EC (S/m) 0.01 0.03 1.46Minerals present Kaolinite, Montmorillonite, Quartz,
Illite Kaolinite Albite,Halloysite
119S.D. Gumaste et al. / Applied Clay Science 91–92 (2014) 117–126
fluid suspension) and the fabric of the sediments obtained from thetests was investigated by employing IS and MIP.
2.1. Physical characterization
The specific gravity, G of the clays WC, MT and MC was determinedusing a helium gas pycnometer (make Quantachrome, USA) (ASTM D5550-06, 2006). The particle size distribution characteristics (ASTMD422-63, 2007) and the consistency limits (ASTM D4318-93, 2010a)of these clays were obtained and the results are presented in Table 1.Based on the Unified Soil Classification System, USCS (ASTM D2487-06, 2010b), clays WC, MT and MC can be classified as CH (inorganicclays of high plasticity). The swelling characteristics of these clayswere determined by performing ‘free swell index (FSI) test’ (IS, 2720-part XL 2002) and the results are presented in Table 1. Based on theseresults, clay MT exhibits a “very high” degree of swelling and clays WCand MC exhibit a “low” degree of swelling. Clays WC and MT contain1.7% organic content and clay MC contains 2.6%, as listed in Table 1.
2.2. Chemical characterization
The chemical composition of each clay sample was determined byusing an X-ray Fluorescence setup (Phillips 1410, Holland) and results(wt.% oxides) are presented in Table 2. The samples contain SiO2 asthe major oxide (52 to 69%) along with 17 to 40% of Al2O3 and 2 to12% of Fe2O3. The chloride and sulphate contents of the samplewere de-termined on the extract of 2:1 water to clay ratio (designated as L/S),with the help of an Indion Easy test kit (supplied by Ion ExchangeIndia Ltd., Mumbai, India). A water quality analyzer (Model PE 136,Elico Ltd., India), fitted with a glass calomel electrode, was employedfor measuring the pH and electrical conductivity (EC) of the clay solu-tion with L/S ratio of 10. The results obtained are presented in Table 2.
2.3. Mineralogical characterization
The mineralogical composition of these clays was determined byX-ray diffraction, XRD, spectrometer (Phillips, Model No-XPERT Pro,Holland), equipped with a graphite monochromator and Cu-Kα radia-tion. The samples were scanned for 2θ ranging from 5 to 80°. TheJCPDS (Joint Committee on Powder Diffraction Standards, 1994) datafiles were used to identify the presence of major minerals components(Table 2) in the clays.
2.4. Sedimentation tests
For simplicity, and the ease of execution, sedimentation tests wereconducted in the laboratory (at 25 ± 1 °C temperature and relative hu-midity of 35 ± 1%) in 1000 mL graduated glass cylinders, normallyemployed for conducting hydrometer tests (ASTM D422-63, 2007).This is consistent with the observations reported by Michaels and
Table 1Physical properties of the clays used in the study.
Physical properties WC MT MC
Specific gravity, G 2.63 2.72 2.78% clay size fraction 54 72 65% silt size fraction 46 21 30% sand size fraction – 7 5Liquid limit, WL (%) 54 434 79Plastic limit, WP (%) 27 166 33Plasticity index, IP (%) 27 268 46Classificationa CH CH CHFree Swell Index, FSI (%) 7 800 6Organic Content (%) 1.7 1.7 2.6
a USCS (ASTM D2487-06, 2010b).
Bolger (1962) that the size of the sedimentation column (cylinder)has no significant effect on the settling characteristics of the clay. Al-though, Imai (1980) has shown the influence of L/S ratio on the settlingcharacteristics, as stated earlier, for the sake of brevity the initial L/Sratio of 20was adopted, which incidentally conforms to the recommen-dation of the hydrometer test on soils (ASTM D422-63, 2007). As such,50 g of the dry sample was mixed with 1000 mL water. In order tostudy the effect of pore-fluid chemistry on particle-to-particle interac-tion, sedimentation tests were conducted in distilled water andsolutions of NaCl and SrCl2 of strength 10−4, 10−3, 10−2 and 10−1 M.As NaCl is one of the most commonly available salts in natural waterbodies and strontium, Sr, is one of the largely sorbed elements on thesoils (Chirkst et al., 2006; Sreedeep and Singh, 2008) and occurs in sed-iments (Boesch and Rabalais, 2003; Meyer, 2011; Moldovanyi et al.,1993; Yang et al., 2002; Zymela, 1996), these salts were selected forthe study. The range of molarities adopted in this study represents thesalinity (measured in terms of electrical conductivity) of differenttypes of water bodies in nature ranging from fresh lake water to seawa-ter (Michaud, 1991). In this regard, Ma and Pierre (1999), Kaya et al.(2006) and Nasser and James (2008) conducted sedimentation testsin solutions with pH varying from 2 to 10, with the intention to createdifferent fabric in sediments. However, it should be noted that generallyin natural water bodies, pH varies in the range of 6 to 9 and hence thepresent study is aimed at laboratory simulation of natural conditionsof soil sedimentation processes.
Nine sedimentation tests were conducted on each clay. In each test,initially, 50 g of clay was thoroughly mixed with 300 mL of correspond-ing solution by using a mechanical stirrer for 30 min. Immediately afterthis process, the slurry was transferred into the glass cylinder, andthe corresponding solution was added to achieve a total volume of1000 mL. This slurry was mixed well and the cylinder was placed on ahorizontal platform, and the slurry was allowed to settle for durationof about 15 days. To avoid evaporation losses, brims of the cylinderswere covered with aluminium foil. During the sedimentation process,the volume of sediments, exhibited by the interface between the clearsupernatant water and the accumulated clay sediments, was recordedintermittently over a period of time until no further change was ob-served. These volumes were normalized with respect to initial weightof the dry sample (i.e., 50 g) and denoted as Vs, normalized volume ofsediments at any instance and Vsu, normalized ultimate volume of sed-iments (in mL/g). Later, the supernatant fluid was completely removed
20
25
30
g)
MT
120 S.D. Gumaste et al. / Applied Clay Science 91–92 (2014) 117–126
from the cylinder using a micro-pipette (Raschtech, Germany) and thesediments at the bottom of the cylinder were then allowed to desiccate.The basic intention of careful retrieving of clay sediments, withoutdisturbing its particle arrangement (i.e., fabric) substantially, was tocarry out MIP and IS tests on these sediments to identify and quantifythe fabric. Subsequently, the samples were trimmed to obtain cylindri-cal specimens for further analysis.
100 101 102 103 1040
5
10
15
Vs
(ml/
t (min.)
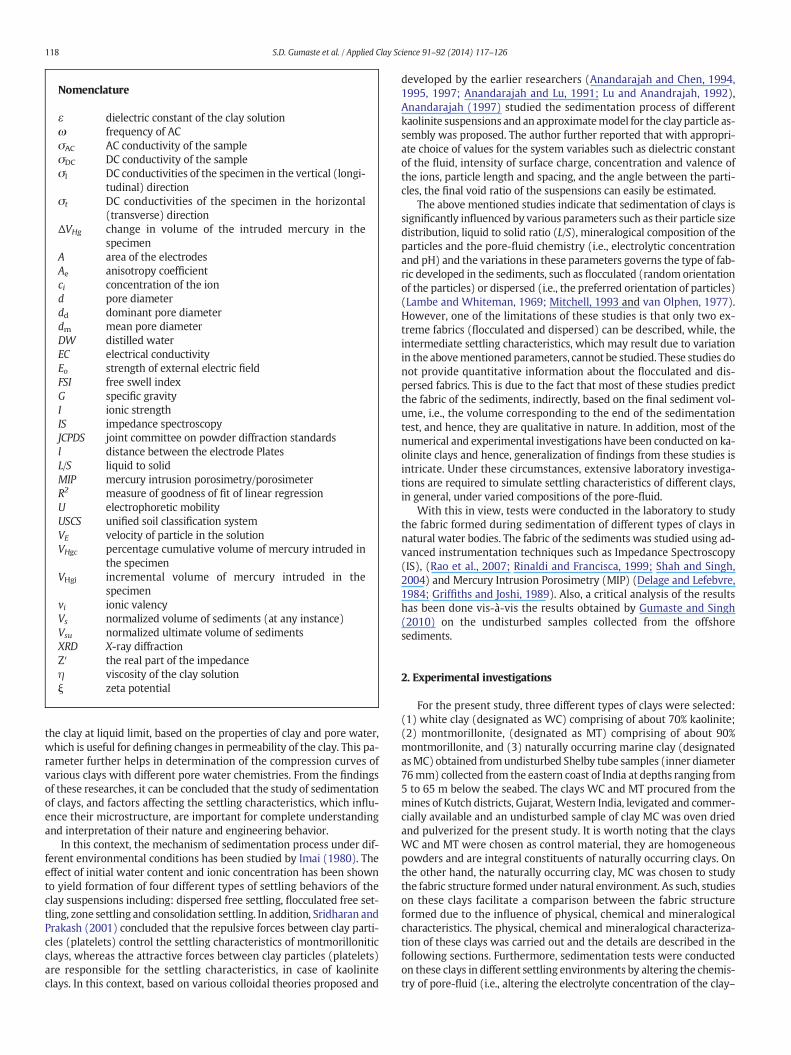
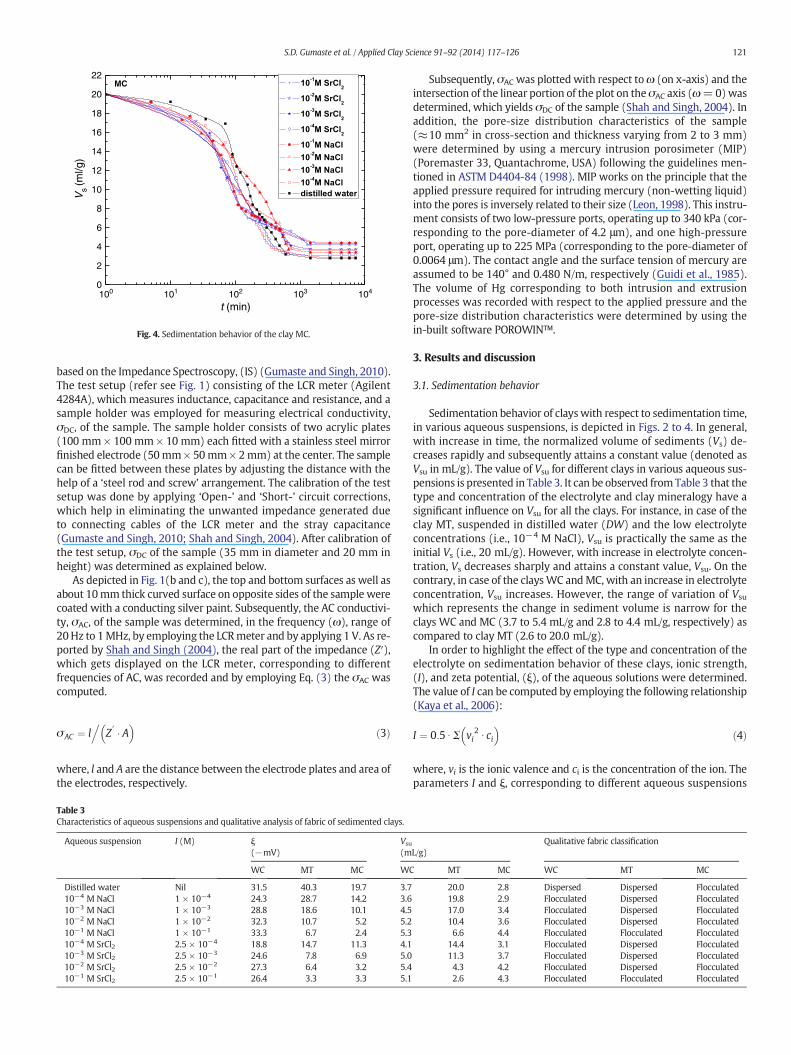
Fig. 2. Sedimentation behavior of the clay MT.
2.5. Measurement of Zeta potential of clays
In order to investigate the influence of pore-fluid (chemistry) on theparticle-to-particle interaction in clays, determination of the change inthe surface charge potential, which is indirectly measured in terms ofzeta potential, ξ, is a potential tool (Sparks, 1986; Vane and Zhang,1997; West and Stewart, 1995; Yukselen and Kaya, 2003). With this inview, ξ for different clays, in presence of different pore-fluidswas deter-mined by employing an automated electrophoresis instrument(Zetasizer-Nano Series, make Malvern instruments, United Kingdom).The measurements were done on 2 mL clay solution, of L/S = 100 (assuggested by Kaya et al., 2006), at 25 °C. This instrument works on thelight scattering technique, which determines the electrophoretic mobil-ity, U (in m/s). This mobility is the velocity, VE, of a particle in the solu-tion,which is produced by an external electric field of strength Eo (V/m).U can be used to compute the ξ by employing Helmoltz–Smoluchowski
a
b c
d
Steel rod and screw arrangement
Stainless Steel Electrode
Brass Bolt
Acrylic plates
LCR Meter
Conducting silver paint A
A
B
B
Conducting silver paint
Fig. 1. (a) Schematic diagram of the sample holder, coating on (b) Longitudinal (A-A) and(c) transverse (B-B) directions of the sample, and (d) the LCR meter.
theory, which can mathematically be expressed as follows (Kaya et al.,2003):
ξ ¼ 4πηUε
ð1Þ
where, η is the viscosity, ε is the dielectric constant of the soil solutionand U is the electrophoretic mobility.
2.6. Fabric of sedimented clays
Theparticle orientation and pore-size distribution characteristics aretwo important parameters that reveal the fabric of the clay quantitative-ly. The particle orientation in the sediments can be expressed by usingthe anisotropy coefficient, Ae, which is defined by Eq. (2) (Gumasteand Singh, 2010; McCarter et al., 2005):
Ae ¼ √ σ t=σ lð Þ ð2Þ
where, σt and σl are DC conductivities of the specimen in the horizontal(i.e., transverse to the plane of sedimentation) and vertical (i.e., longitudi-nal to the plane of sedimentation) directions, respectively.
These conductivities have been determined on cylindrical clay sam-ples (extracted as explained above) by employing the methodology
100 101 102 103 104 1050
2
4
6
8
10
12
14
16
18
20
22
Vs
(ml/g
)
t (min)
WC
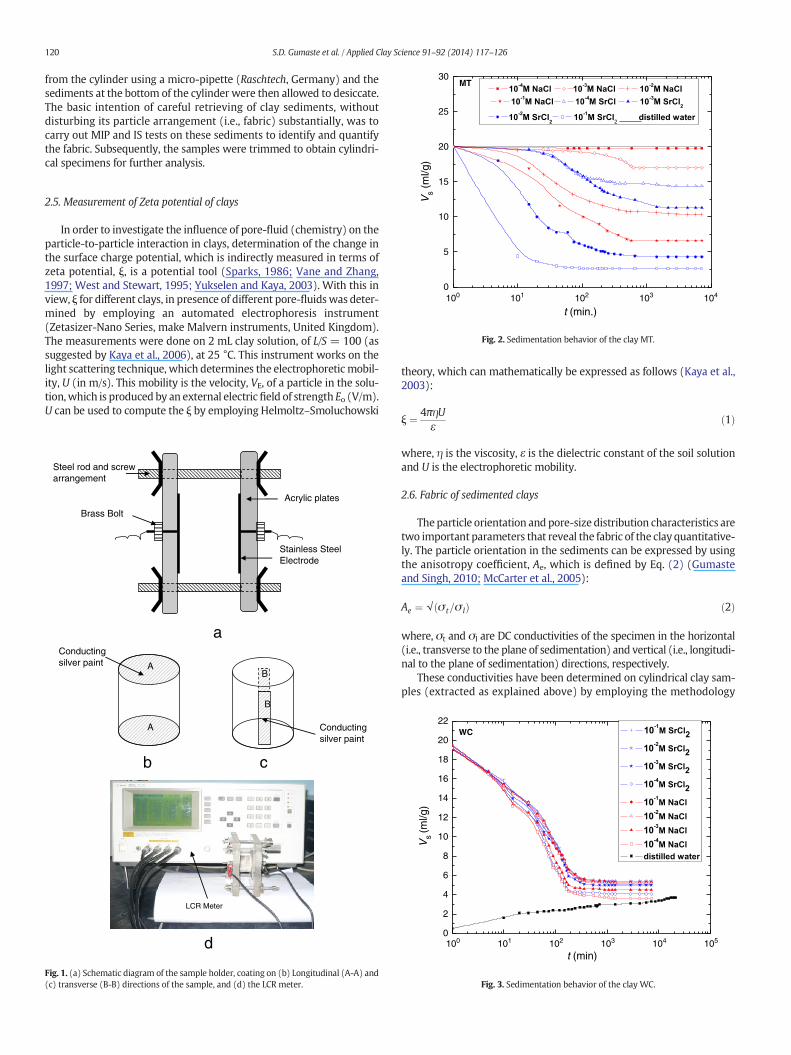
Fig. 3. Sedimentation behavior of the clay WC.
100 101 102 103 1040
2
4
6
8
10
12
14
16
18
20
22V
s (m
l/g)
t (min)
MC
Fig. 4. Sedimentation behavior of the clay MC.
121S.D. Gumaste et al. / Applied Clay Science 91–92 (2014) 117–126
based on the Impedance Spectroscopy, (IS) (Gumaste and Singh, 2010).The test setup (refer see Fig. 1) consisting of the LCR meter (Agilent4284A), which measures inductance, capacitance and resistance, and asample holder was employed for measuring electrical conductivity,σDC, of the sample. The sample holder consists of two acrylic plates(100 mm × 100 mm× 10 mm) each fitted with a stainless steel mirrorfinished electrode (50mm× 50mm× 2mm) at the center. The samplecan be fitted between these plates by adjusting the distance with thehelp of a ‘steel rod and screw’ arrangement. The calibration of the testsetup was done by applying ‘Open-’ and ‘Short-’ circuit corrections,which help in eliminating the unwanted impedance generated dueto connecting cables of the LCR meter and the stray capacitance(Gumaste and Singh, 2010; Shah and Singh, 2004). After calibration ofthe test setup, σDC of the sample (35 mm in diameter and 20 mm inheight) was determined as explained below.
As depicted in Fig. 1(b and c), the top and bottom surfaces as well asabout 10mm thick curved surface on opposite sides of the sample werecoated with a conducting silver paint. Subsequently, the AC conductivi-ty, σAC, of the sample was determined, in the frequency (ω), range of20Hz to 1MHz, by employing the LCRmeter and by applying 1 V. As re-ported by Shah and Singh (2004), the real part of the impedance (Z′),which gets displayed on the LCR meter, corresponding to differentfrequencies of AC, was recorded and by employing Eq. (3) the σAC wascomputed.
σAC ¼ l.
Z′ � A� �
ð3Þ
where, l and A are the distance between the electrode plates and area ofthe electrodes, respectively.
Table 3Characteristics of aqueous suspensions and qualitative analysis of fabric of sedimented clays.
Aqueous suspension I (M) ξ(−mV)
Vsu(m
WC MT MC WC
Distilled water Nil 31.5 40.3 19.7 3.710−4 M NaCl 1 × 10⁻⁴ 24.3 28.7 14.2 3.610−3 M NaCl 1 × 10⁻³ 28.8 18.6 10.1 4.510−2 M NaCl 1 × 10⁻² 32.3 10.7 5.2 5.210−1 M NaCl 1 × 10⁻¹ 33.3 6.7 2.4 5.310−4 M SrCl2 2.5 × 10⁻⁴ 18.8 14.7 11.3 4.110−3 M SrCl2 2.5 × 10⁻³ 24.6 7.8 6.9 5.010−2 M SrCl2 2.5 × 10⁻² 27.3 6.4 3.2 5.410−1 M SrCl2 2.5 × 10⁻¹ 26.4 3.3 3.3 5.1
Subsequently, σAC was plotted with respect toω (on x-axis) and theintersection of the linear portion of the plot on theσAC axis (ω=0)wasdetermined, which yields σDC of the sample (Shah and Singh, 2004). Inaddition, the pore-size distribution characteristics of the sample(≈10 mm2 in cross-section and thickness varying from 2 to 3 mm)were determined by using a mercury intrusion porosimeter (MIP)(Poremaster 33, Quantachrome, USA) following the guidelines men-tioned in ASTM D4404-84 (1998). MIP works on the principle that theapplied pressure required for intruding mercury (non-wetting liquid)into the pores is inversely related to their size (Leon, 1998). This instru-ment consists of two low-pressure ports, operating up to 340 kPa (cor-responding to the pore-diameter of 4.2 μm), and one high-pressureport, operating up to 225 MPa (corresponding to the pore-diameter of0.0064 μm). The contact angle and the surface tension of mercury areassumed to be 140° and 0.480 N/m, respectively (Guidi et al., 1985).The volume of Hg corresponding to both intrusion and extrusionprocesses was recorded with respect to the applied pressure and thepore-size distribution characteristics were determined by using thein-built software POROWIN™.
3. Results and discussion
3.1. Sedimentation behavior
Sedimentation behavior of clayswith respect to sedimentation time,in various aqueous suspensions, is depicted in Figs. 2 to 4. In general,with increase in time, the normalized volume of sediments (Vs) de-creases rapidly and subsequently attains a constant value (denoted asVsu in mL/g). The value of Vsu for different clays in various aqueous sus-pensions is presented in Table 3. It can be observed fromTable 3 that thetype and concentration of the electrolyte and clay mineralogy have asignificant influence on Vsu for all the clays. For instance, in case of theclay MT, suspended in distilled water (DW) and the low electrolyteconcentrations (i.e., 10−4 M NaCl), Vsu is practically the same as theinitial Vs (i.e., 20 mL/g). However, with increase in electrolyte concen-tration, Vs decreases sharply and attains a constant value, Vsu. On thecontrary, in case of the claysWC andMC, with an increase in electrolyteconcentration, Vsu increases. However, the range of variation of Vsu
which represents the change in sediment volume is narrow for theclays WC and MC (3.7 to 5.4 mL/g and 2.8 to 4.4 mL/g, respectively) ascompared to clay MT (2.6 to 20.0 mL/g).
In order to highlight the effect of the type and concentration of theelectrolyte on sedimentation behavior of these clays, ionic strength,(I), and zeta potential, (ξ), of the aqueous solutions were determined.The value of I can be computed by employing the following relationship(Kaya et al., 2006):
I ¼ 0:5 :Σ vi2 : ci
� �ð4Þ
where, vi is the ionic valence and ci is the concentration of the ion. Theparameters I and ξ, corresponding to different aqueous suspensions
L/g)Qualitative fabric classification
MT MC WC MT MC
20.0 2.8 Dispersed Dispersed Flocculated19.8 2.9 Flocculated Dispersed Flocculated17.0 3.4 Flocculated Dispersed Flocculated10.4 3.6 Flocculated Dispersed Flocculated6.6 4.4 Flocculated Flocculated Flocculated
14.4 3.1 Flocculated Dispersed Flocculated11.3 3.7 Flocculated Dispersed Flocculated4.3 4.2 Flocculated Dispersed Flocculated2.6 4.3 Flocculated Flocculated Flocculated
10-5 10-4 10-3 10-2 10-1 100
2
4
6
8
10
12
14
16
18
20
22Clay
MT WC MC
Vsu
(ml/g
)
I (M)
R2=0.92
R2=0.90
R2=0.88
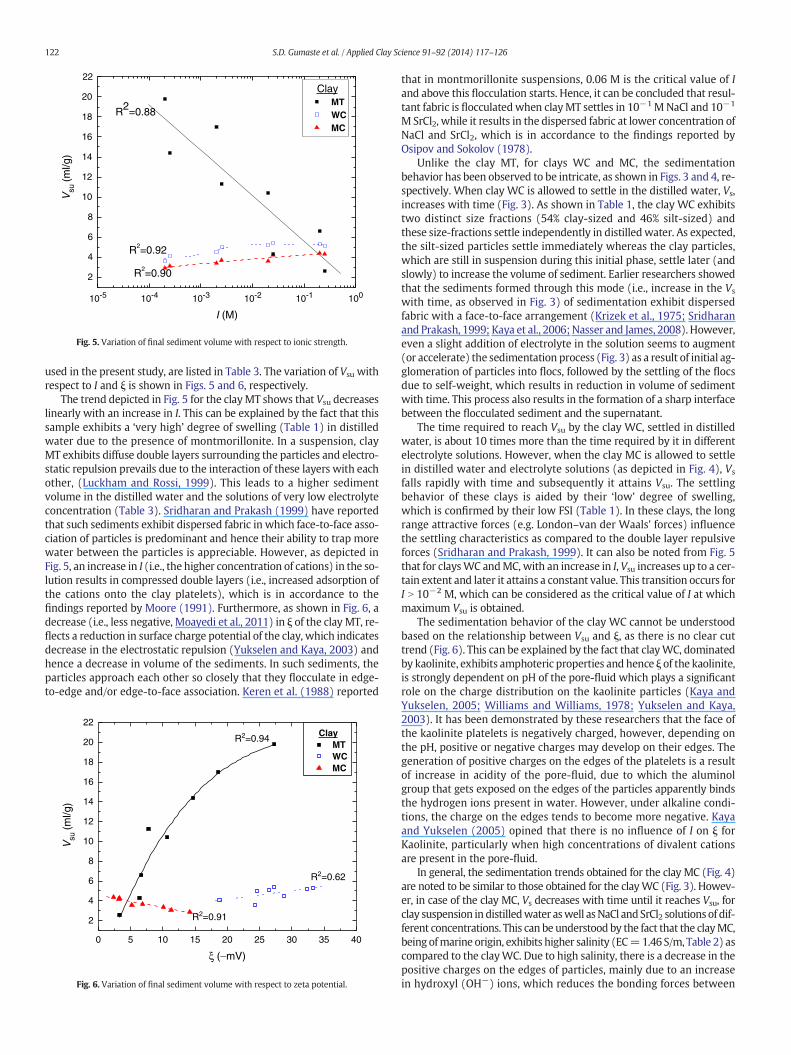
Fig. 5. Variation of final sediment volume with respect to ionic strength.
122 S.D. Gumaste et al. / Applied Clay Science 91–92 (2014) 117–126
used in the present study, are listed in Table 3. The variation of Vsu withrespect to I and ξ is shown in Figs. 5 and 6, respectively.
The trend depicted in Fig. 5 for the clayMT shows that Vsu decreaseslinearly with an increase in I. This can be explained by the fact that thissample exhibits a ‘very high’ degree of swelling (Table 1) in distilledwater due to the presence of montmorillonite. In a suspension, clayMT exhibits diffuse double layers surrounding the particles and electro-static repulsion prevails due to the interaction of these layers with eachother, (Luckham and Rossi, 1999). This leads to a higher sedimentvolume in the distilled water and the solutions of very low electrolyteconcentration (Table 3). Sridharan and Prakash (1999) have reportedthat such sediments exhibit dispersed fabric in which face-to-face asso-ciation of particles is predominant and hence their ability to trap morewater between the particles is appreciable. However, as depicted inFig. 5, an increase in I (i.e., the higher concentration of cations) in the so-lution results in compressed double layers (i.e., increased adsorption ofthe cations onto the clay platelets), which is in accordance to thefindings reported by Moore (1991). Furthermore, as shown in Fig. 6, adecrease (i.e., less negative, Moayedi et al., 2011) in ξ of the clay MT, re-flects a reduction in surface charge potential of the clay, which indicatesdecrease in the electrostatic repulsion (Yukselen and Kaya, 2003) andhence a decrease in volume of the sediments. In such sediments, theparticles approach each other so closely that they flocculate in edge-to-edge and/or edge-to-face association. Keren et al. (1988) reported
0 5 10 15 20 25 30 35 40
2
4
6
8
10
12
14
16
18
20
22
R2=0.62
R2=0.94Clay
MT WC MC
R2=0.91
Vsu
(ml/g
)
ξ (_mV)
Fig. 6. Variation of final sediment volume with respect to zeta potential.
that in montmorillonite suspensions, 0.06 M is the critical value of Iand above this flocculation starts. Hence, it can be concluded that resul-tant fabric is flocculatedwhen clayMT settles in 10−1 M NaCl and 10−1
M SrCl2, while it results in the dispersed fabric at lower concentration ofNaCl and SrCl2, which is in accordance to the findings reported byOsipov and Sokolov (1978).
Unlike the clay MT, for clays WC and MC, the sedimentationbehavior has been observed to be intricate, as shown in Figs. 3 and 4, re-spectively. When clay WC is allowed to settle in the distilled water, Vs,increases with time (Fig. 3). As shown in Table 1, the clay WC exhibitstwo distinct size fractions (54% clay-sized and 46% silt-sized) andthese size-fractions settle independently in distilledwater. As expected,the silt-sized particles settle immediately whereas the clay particles,which are still in suspension during this initial phase, settle later (andslowly) to increase the volume of sediment. Earlier researchers showedthat the sediments formed through this mode (i.e., increase in the Vs
with time, as observed in Fig. 3) of sedimentation exhibit dispersedfabric with a face-to-face arrangement (Krizek et al., 1975; Sridharanand Prakash, 1999; Kaya et al., 2006;Nasser and James, 2008). However,even a slight addition of electrolyte in the solution seems to augment(or accelerate) the sedimentation process (Fig. 3) as a result of initial ag-glomeration of particles into flocs, followed by the settling of the flocsdue to self-weight, which results in reduction in volume of sedimentwith time. This process also results in the formation of a sharp interfacebetween the flocculated sediment and the supernatant.
The time required to reach Vsu by the clay WC, settled in distilledwater, is about 10 times more than the time required by it in differentelectrolyte solutions. However, when the clay MC is allowed to settlein distilled water and electrolyte solutions (as depicted in Fig. 4), Vs
falls rapidly with time and subsequently it attains Vsu. The settlingbehavior of these clays is aided by their ‘low’ degree of swelling,which is confirmed by their low FSI (Table 1). In these clays, the longrange attractive forces (e.g. London–van der Waals' forces) influencethe settling characteristics as compared to the double layer repulsiveforces (Sridharan and Prakash, 1999). It can also be noted from Fig. 5that for claysWC andMC, with an increase in I, Vsu increases up to a cer-tain extent and later it attains a constant value. This transition occurs forI N 10−2 M, which can be considered as the critical value of I at whichmaximum Vsu is obtained.
The sedimentation behavior of the clay WC cannot be understoodbased on the relationship between Vsu and ξ, as there is no clear cuttrend (Fig. 6). This can be explained by the fact that clayWC, dominatedby kaolinite, exhibits amphoteric properties and hence ξ of the kaolinite,is strongly dependent on pH of the pore-fluid which plays a significantrole on the charge distribution on the kaolinite particles (Kaya andYukselen, 2005; Williams and Williams, 1978; Yukselen and Kaya,2003). It has been demonstrated by these researchers that the face ofthe kaolinite platelets is negatively charged, however, depending onthe pH, positive or negative charges may develop on their edges. Thegeneration of positive charges on the edges of the platelets is a resultof increase in acidity of the pore-fluid, due to which the aluminolgroup that gets exposed on the edges of the particles apparently bindsthe hydrogen ions present in water. However, under alkaline condi-tions, the charge on the edges tends to become more negative. Kayaand Yukselen (2005) opined that there is no influence of I on ξ forKaolinite, particularly when high concentrations of divalent cationsare present in the pore-fluid.
In general, the sedimentation trends obtained for the clay MC (Fig. 4)are noted to be similar to those obtained for the clayWC (Fig. 3). Howev-er, in case of the clay MC, Vs decreases with time until it reaches Vsu, forclay suspension in distilledwater aswell asNaCl andSrCl2 solutions of dif-ferent concentrations. This can be understood by the fact that the clayMC,being ofmarine origin, exhibits higher salinity (EC=1.46 S/m, Table 2) ascompared to the clayWC. Due to high salinity, there is a decrease in thepositive charges on the edges of particles, mainly due to an increasein hydroxyl (OH−) ions, which reduces the bonding forces between
0
20
40
60
80
100 distilled water
10-4M NaCl
10-3M NaCl
10-2M NaCl
10-1M NaCl
10-3 10-2 10-1 100 101 102
100 distilled water
10-4 M NaCl
10-3 M NaCl
VH
gc (%
)
(b) Clay MC
(a) Clay WC
0 2 4 6 8 101.2
1.3
1.4
1.5
1.6
1.7
1.8
1.9
R2 =0.80
Critical Ae
Flocculated Fabric
Dispersed Fabric
Data-point corresponding tothe clay WC sedimented in distilled water
Computed values
Ae
Vsu (ml/g)
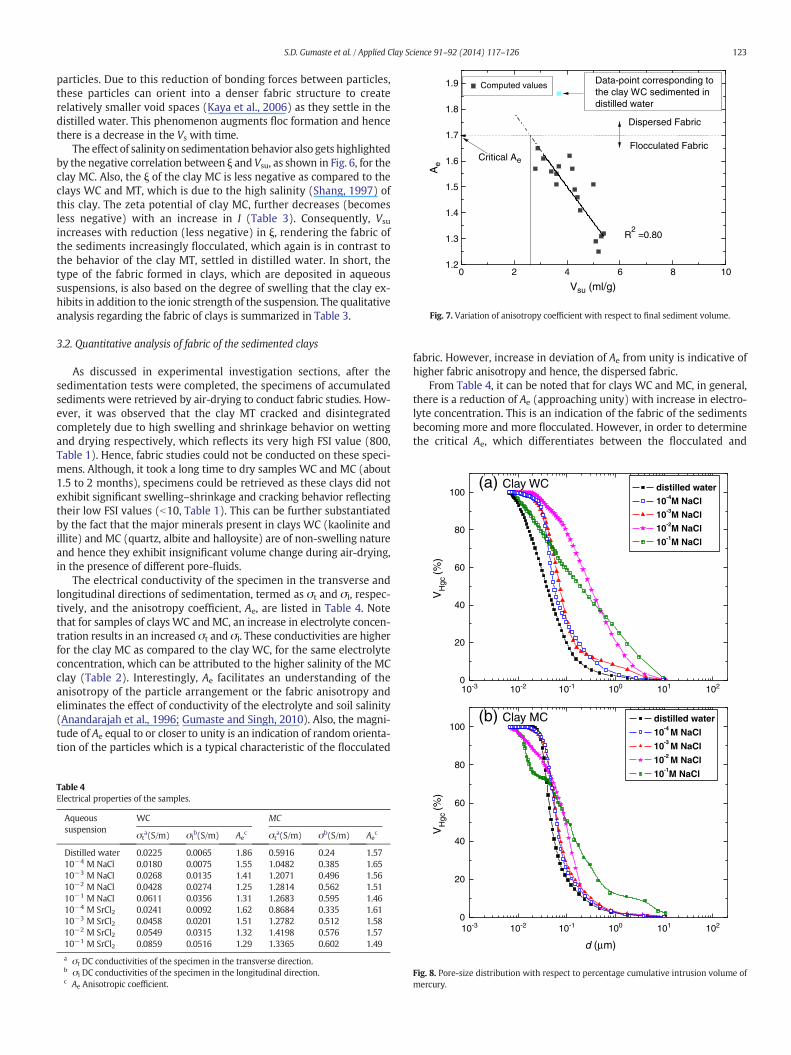
Fig. 7. Variation of anisotropy coefficient with respect to final sediment volume.
123S.D. Gumaste et al. / Applied Clay Science 91–92 (2014) 117–126
particles. Due to this reduction of bonding forces between particles,these particles can orient into a denser fabric structure to createrelatively smaller void spaces (Kaya et al., 2006) as they settle in thedistilled water. This phenomenon augments floc formation and hencethere is a decrease in the Vs with time.
The effect of salinity on sedimentation behavior also gets highlightedby the negative correlation between ξ and Vsu, as shown in Fig. 6, for theclay MC. Also, the ξ of the clay MC is less negative as compared to theclays WC and MT, which is due to the high salinity (Shang, 1997) ofthis clay. The zeta potential of clay MC, further decreases (becomesless negative) with an increase in I (Table 3). Consequently, Vsu
increases with reduction (less negative) in ξ, rendering the fabric ofthe sediments increasingly flocculated, which again is in contrast tothe behavior of the clay MT, settled in distilled water. In short, thetype of the fabric formed in clays, which are deposited in aqueoussuspensions, is also based on the degree of swelling that the clay ex-hibits in addition to the ionic strength of the suspension. The qualitativeanalysis regarding the fabric of clays is summarized in Table 3.
3.2. Quantitative analysis of fabric of the sedimented clays
As discussed in experimental investigation sections, after thesedimentation tests were completed, the specimens of accumulatedsediments were retrieved by air-drying to conduct fabric studies. How-ever, it was observed that the clay MT cracked and disintegratedcompletely due to high swelling and shrinkage behavior on wettingand drying respectively, which reflects its very high FSI value (800,Table 1). Hence, fabric studies could not be conducted on these speci-mens. Although, it took a long time to dry samples WC and MC (about1.5 to 2 months), specimens could be retrieved as these clays did notexhibit significant swelling–shrinkage and cracking behavior reflectingtheir low FSI values (b10, Table 1). This can be further substantiatedby the fact that the major minerals present in clays WC (kaolinite andillite) and MC (quartz, albite and halloysite) are of non-swelling natureand hence they exhibit insignificant volume change during air-drying,in the presence of different pore-fluids.
The electrical conductivity of the specimen in the transverse andlongitudinal directions of sedimentation, termed as σt and σl, respec-tively, and the anisotropy coefficient, Ae, are listed in Table 4. Notethat for samples of clays WC and MC, an increase in electrolyte concen-tration results in an increased σt and σl. These conductivities are higherfor the clay MC as compared to the clay WC, for the same electrolyteconcentration, which can be attributed to the higher salinity of the MCclay (Table 2). Interestingly, Ae facilitates an understanding of theanisotropy of the particle arrangement or the fabric anisotropy andeliminates the effect of conductivity of the electrolyte and soil salinity(Anandarajah et al., 1996; Gumaste and Singh, 2010). Also, the magni-tude of Ae equal to or closer to unity is an indication of random orienta-tion of the particles which is a typical characteristic of the flocculated
Table 4Electrical properties of the samples.
Aqueoussuspension
WC MC
σta(S/m) σl
b(S/m) Aec σt
a(S/m) σb(S/m) Aec
Distilled water 0.0225 0.0065 1.86 0.5916 0.24 1.5710−4 M NaCl 0.0180 0.0075 1.55 1.0482 0.385 1.6510−3 M NaCl 0.0268 0.0135 1.41 1.2071 0.496 1.5610−2 M NaCl 0.0428 0.0274 1.25 1.2814 0.562 1.5110−1 M NaCl 0.0611 0.0356 1.31 1.2683 0.595 1.4610−4 M SrCl2 0.0241 0.0092 1.62 0.8684 0.335 1.6110−3 M SrCl2 0.0458 0.0201 1.51 1.2782 0.512 1.5810−2 M SrCl2 0.0549 0.0315 1.32 1.4198 0.576 1.5710−1 M SrCl2 0.0859 0.0516 1.29 1.3365 0.602 1.49
a σt DC conductivities of the specimen in the transverse direction.b σl DC conductivities of the specimen in the longitudinal direction.c Ae Anisotropic coefficient.
fabric. However, increase in deviation of Ae from unity is indicative ofhigher fabric anisotropy and hence, the dispersed fabric.
From Table 4, it can be noted that for clays WC and MC, in general,there is a reduction of Ae (approaching unity) with increase in electro-lyte concentration. This is an indication of the fabric of the sedimentsbecoming more and more flocculated. However, in order to determinethe critical Ae, which differentiates between the flocculated and
10-3 10-2 10-1 100 101 1020
20
40
60
80 10-2 M NaCl
10-1M NaCl
VH
gc (%
)
d (μm)
Fig. 8. Pore-size distribution with respect to percentage cumulative intrusion volume ofmercury.
0.00
0.25
0.50
0.75
1.0010-1M NaCl
10-2M NaCl
10-3M NaCl
10-4M NaCldistilled water
(a) Clay WC
0.00
0.25
0.50
0.75
1.0010-1 M NaCl
10-2 M NaCl
10-3 M NaCl
10-4 M NaCl distilled water
(b) Clay MC
10-3 10-2 10-1 100 101 102
10-3 10-2 10-1 100 101 102
VH
gi (m
l/g)
VH
gi (m
l/g)
d (μm)
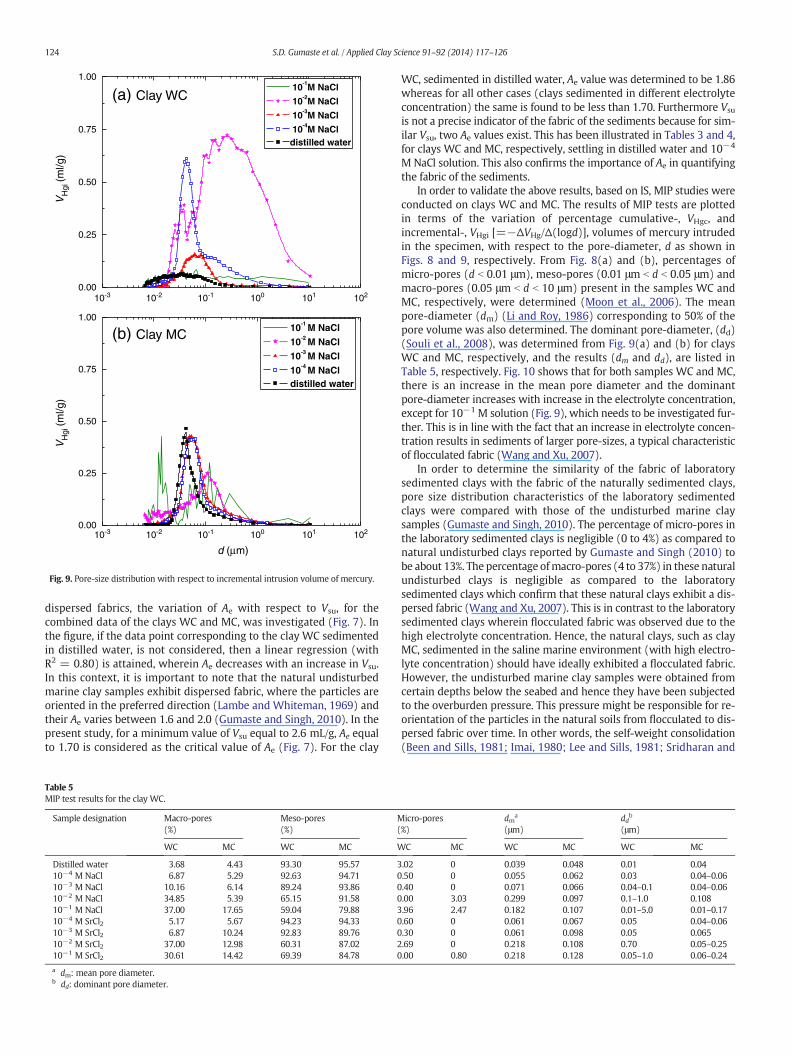
Fig. 9. Pore-size distribution with respect to incremental intrusion volume of mercury.
124 S.D. Gumaste et al. / Applied Clay Science 91–92 (2014) 117–126
dispersed fabrics, the variation of Ae with respect to Vsu, for thecombined data of the clays WC and MC, was investigated (Fig. 7). Inthe figure, if the data point corresponding to the clay WC sedimentedin distilled water, is not considered, then a linear regression (withR2 = 0.80) is attained, wherein Ae decreases with an increase in Vsu.In this context, it is important to note that the natural undisturbedmarine clay samples exhibit dispersed fabric, where the particles areoriented in the preferred direction (Lambe and Whiteman, 1969) andtheir Ae varies between 1.6 and 2.0 (Gumaste and Singh, 2010). In thepresent study, for a minimum value of Vsu equal to 2.6 mL/g, Ae equalto 1.70 is considered as the critical value of Ae (Fig. 7). For the clay
Table 5MIP test results for the clay WC.
Sample designation Macro-pores(%)
Meso-pores(%)
M(
WC MC WC MC W
Distilled water 3.68 4.43 93.30 95.57 310−4 M NaCl 6.87 5.29 92.63 94.71 010−3 M NaCl 10.16 6.14 89.24 93.86 010−2 M NaCl 34.85 5.39 65.15 91.58 010−1 M NaCl 37.00 17.65 59.04 79.88 310−4 M SrCl2 5.17 5.67 94.23 94.33 010−3 M SrCl2 6.87 10.24 92.83 89.76 010−2 M SrCl2 37.00 12.98 60.31 87.02 210−1 M SrCl2 30.61 14.42 69.39 84.78 0
a dm: mean pore diameter.b dd: dominant pore diameter.
WC, sedimented in distilled water, Ae value was determined to be 1.86whereas for all other cases (clays sedimented in different electrolyteconcentration) the same is found to be less than 1.70. Furthermore Vsuis not a precise indicator of the fabric of the sediments because for sim-ilar Vsu, two Ae values exist. This has been illustrated in Tables 3 and 4,for clays WC and MC, respectively, settling in distilled water and 10−4
M NaCl solution. This also confirms the importance of Ae in quantifyingthe fabric of the sediments.
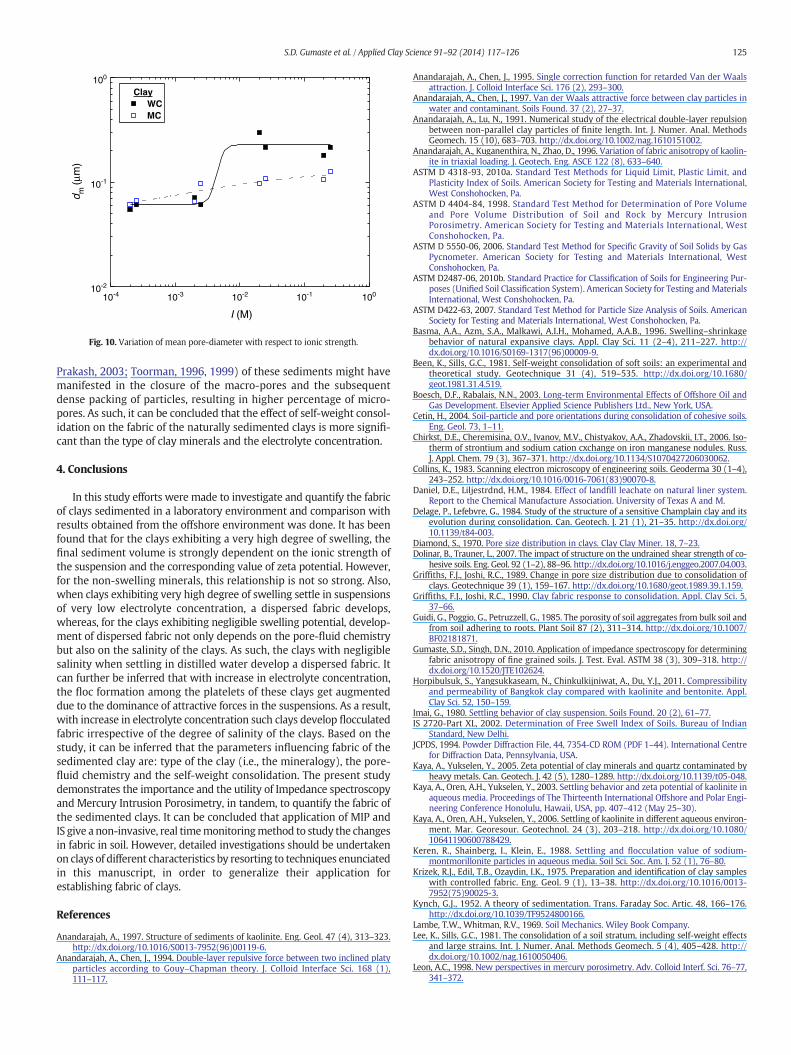
In order to validate the above results, based on IS, MIP studies wereconducted on clays WC and MC. The results of MIP tests are plottedin terms of the variation of percentage cumulative-, VHgc, andincremental-, VHgi [=−ΔVHg/Δ(logd)], volumes of mercury intrudedin the specimen, with respect to the pore-diameter, d as shown inFigs. 8 and 9, respectively. From Fig. 8(a) and (b), percentages ofmicro-pores (d b 0.01 μm), meso-pores (0.01 μm b d b 0.05 μm) andmacro-pores (0.05 μm b d b 10 μm) present in the samples WC andMC, respectively, were determined (Moon et al., 2006). The meanpore-diameter (dm) (Li and Roy, 1986) corresponding to 50% of thepore volume was also determined. The dominant pore-diameter, (dd)(Souli et al., 2008), was determined from Fig. 9(a) and (b) for claysWC and MC, respectively, and the results (dm and dd), are listed inTable 5, respectively. Fig. 10 shows that for both samples WC and MC,there is an increase in the mean pore diameter and the dominantpore-diameter increases with increase in the electrolyte concentration,except for 10−1 M solution (Fig. 9), which needs to be investigated fur-ther. This is in line with the fact that an increase in electrolyte concen-tration results in sediments of larger pore-sizes, a typical characteristicof flocculated fabric (Wang and Xu, 2007).
In order to determine the similarity of the fabric of laboratorysedimented clays with the fabric of the naturally sedimented clays,pore size distribution characteristics of the laboratory sedimentedclays were compared with those of the undisturbed marine claysamples (Gumaste and Singh, 2010). The percentage of micro-pores inthe laboratory sedimented clays is negligible (0 to 4%) as compared tonatural undisturbed clays reported by Gumaste and Singh (2010) tobe about 13%. The percentage ofmacro-pores (4 to 37%) in these naturalundisturbed clays is negligible as compared to the laboratorysedimented clays which confirm that these natural clays exhibit a dis-persed fabric (Wang and Xu, 2007). This is in contrast to the laboratorysedimented clays wherein flocculated fabric was observed due to thehigh electrolyte concentration. Hence, the natural clays, such as clayMC, sedimented in the saline marine environment (with high electro-lyte concentration) should have ideally exhibited a flocculated fabric.However, the undisturbed marine clay samples were obtained fromcertain depths below the seabed and hence they have been subjectedto the overburden pressure. This pressure might be responsible for re-orientation of the particles in the natural soils from flocculated to dis-persed fabric over time. In other words, the self-weight consolidation(Been and Sills, 1981; Imai, 1980; Lee and Sills, 1981; Sridharan and
icro-pores%)
dma
(μm)dd
b
(μm)
C MC WC MC WC MC
.02 0 0.039 0.048 0.01 0.04
.50 0 0.055 0.062 0.03 0.04–0.06
.40 0 0.071 0.066 0.04–0.1 0.04–0.06
.00 3.03 0.299 0.097 0.1–1.0 0.108
.96 2.47 0.182 0.107 0.01–5.0 0.01–0.17
.60 0 0.061 0.067 0.05 0.04–0.06
.30 0 0.061 0.098 0.05 0.065
.69 0 0.218 0.108 0.70 0.05–0.25
.00 0.80 0.218 0.128 0.05–1.0 0.06–0.24
ClayWCMC
10-4 10-3 10-1
10-1
10-210-2
100
100d m
(μm
)
I (M)
Fig. 10. Variation of mean pore-diameter with respect to ionic strength.
125S.D. Gumaste et al. / Applied Clay Science 91–92 (2014) 117–126
Prakash, 2003; Toorman, 1996, 1999) of these sediments might havemanifested in the closure of the macro-pores and the subsequentdense packing of particles, resulting in higher percentage of micro-pores. As such, it can be concluded that the effect of self-weight consol-idation on the fabric of the naturally sedimented clays is more signifi-cant than the type of clay minerals and the electrolyte concentration.
4. Conclusions
In this study efforts were made to investigate and quantify the fabricof clays sedimented in a laboratory environment and comparison withresults obtained from the offshore environment was done. It has beenfound that for the clays exhibiting a very high degree of swelling, thefinal sediment volume is strongly dependent on the ionic strength ofthe suspension and the corresponding value of zeta potential. However,for the non-swelling minerals, this relationship is not so strong. Also,when clays exhibiting very high degree of swelling settle in suspensionsof very low electrolyte concentration, a dispersed fabric develops,whereas, for the clays exhibiting negligible swelling potential, develop-ment of dispersed fabric not only depends on the pore-fluid chemistrybut also on the salinity of the clays. As such, the clays with negligiblesalinity when settling in distilled water develop a dispersed fabric. Itcan further be inferred that with increase in electrolyte concentration,the floc formation among the platelets of these clays get augmenteddue to the dominance of attractive forces in the suspensions. As a result,with increase in electrolyte concentration such clays develop flocculatedfabric irrespective of the degree of salinity of the clays. Based on thestudy, it can be inferred that the parameters influencing fabric of thesedimented clay are: type of the clay (i.e., the mineralogy), the pore-fluid chemistry and the self-weight consolidation. The present studydemonstrates the importance and the utility of Impedance spectroscopyand Mercury Intrusion Porosimetry, in tandem, to quantify the fabric ofthe sedimented clays. It can be concluded that application of MIP andIS give a non-invasive, real timemonitoringmethod to study the changesin fabric in soil. However, detailed investigations should be undertakenon clays of different characteristics by resorting to techniques enunciatedin this manuscript, in order to generalize their application forestablishing fabric of clays.
References
Anandarajah, A., 1997. Structure of sediments of kaolinite. Eng. Geol. 47 (4), 313–323.http://dx.doi.org/10.1016/S0013-7952(96)00119-6.
Anandarajah, A., Chen, J., 1994. Double-layer repulsive force between two inclined platyparticles according to Gouy–Chapman theory. J. Colloid Interface Sci. 168 (1),111–117.
Anandarajah, A., Chen, J., 1995. Single correction function for retarded Van der Waalsattraction. J. Colloid Interface Sci. 176 (2), 293–300.
Anandarajah, A., Chen, J., 1997. Van der Waals attractive force between clay particles inwater and contaminant. Soils Found. 37 (2), 27–37.
Anandarajah, A., Lu, N., 1991. Numerical study of the electrical double-layer repulsionbetween non-parallel clay particles of finite length. Int. J. Numer. Anal. MethodsGeomech. 15 (10), 683–703. http://dx.doi.org/10.1002/nag.1610151002.
Anandarajah, A., Kuganenthira, N., Zhao, D., 1996. Variation of fabric anisotropy of kaolin-ite in triaxial loading. J. Geotech. Eng. ASCE 122 (8), 633–640.
ASTM D 4318-93, 2010a. Standard Test Methods for Liquid Limit, Plastic Limit, andPlasticity Index of Soils. American Society for Testing and Materials International,West Conshohocken, Pa.
ASTM D 4404-84, 1998. Standard Test Method for Determination of Pore Volumeand Pore Volume Distribution of Soil and Rock by Mercury IntrusionPorosimetry. American Society for Testing and Materials International, WestConshohocken, Pa.
ASTM D 5550-06, 2006. Standard Test Method for Specific Gravity of Soil Solids by GasPycnometer. American Society for Testing and Materials International, WestConshohocken, Pa.
ASTM D2487-06, 2010b. Standard Practice for Classification of Soils for Engineering Pur-poses (Unified Soil Classification System). American Society for Testing and MaterialsInternational, West Conshohocken, Pa.
ASTM D422-63, 2007. Standard Test Method for Particle Size Analysis of Soils. AmericanSociety for Testing and Materials International, West Conshohocken, Pa.
Basma, A.A., Azm, S.A., Malkawi, A.I.H., Mohamed, A.A.B., 1996. Swelling–shrinkagebehavior of natural expansive clays. Appl. Clay Sci. 11 (2–4), 211–227. http://dx.doi.org/10.1016/S0169-1317(96)00009-9.
Been, K., Sills, G.C., 1981. Self-weight consolidation of soft soils: an experimental andtheoretical study. Geotechnique 31 (4), 519–535. http://dx.doi.org/10.1680/geot.1981.31.4.519.
Boesch, D.F., Rabalais, N.N., 2003. Long-term Environmental Effects of Offshore Oil andGas Development. Elsevier Applied Science Publishers Ltd., New York, USA.
Cetin, H., 2004. Soil-particle and pore orientations during consolidation of cohesive soils.Eng. Geol. 73, 1–11.
Chirkst, D.E., Cheremisina, O.V., Ivanov, M.V., Chistyakov, A.A., Zhadovskii, I.T., 2006. Iso-therm of strontium and sodium cation cxchange on iron manganese nodules. Russ.J. Appl. Chem. 79 (3), 367–371. http://dx.doi.org/10.1134/S1070427206030062.
Collins, K., 1983. Scanning electron microscopy of engineering soils. Geoderma 30 (1–4),243–252. http://dx.doi.org/10.1016/0016-7061(83)90070-8.
Daniel, D.E., Liljestrdnd, H.M., 1984. Effect of landfill leachate on natural liner system.Report to the Chemical Manufacture Association. University of Texas A and M.
Delage, P., Lefebvre, G., 1984. Study of the structure of a sensitive Champlain clay and itsevolution during consolidation. Can. Geotech. J. 21 (1), 21–35. http://dx.doi.org/10.1139/t84-003.
Diamond, S., 1970. Pore size distribution in clays. Clay Clay Miner. 18, 7–23.Dolinar, B., Trauner, L., 2007. The impact of structure on the undrained shear strength of co-
hesive soils. Eng. Geol. 92 (1–2), 88–96. http://dx.doi.org/10.1016/j.enggeo.2007.04.003.Griffiths, F.J., Joshi, R.C., 1989. Change in pore size distribution due to consolidation of
clays. Geotechnique 39 (1), 159–167. http://dx.doi.org/10.1680/geot.1989.39.1.159.Griffiths, F.J., Joshi, R.C., 1990. Clay fabric response to consolidation. Appl. Clay Sci. 5,
37–66.Guidi, G., Poggio, G., Petruzzell, G., 1985. The porosity of soil aggregates from bulk soil and
from soil adhering to roots. Plant Soil 87 (2), 311–314. http://dx.doi.org/10.1007/BF02181871.
Gumaste, S.D., Singh, D.N., 2010. Application of impedance spectroscopy for determiningfabric anisotropy of fine grained soils. J. Test. Eval. ASTM 38 (3), 309–318. http://dx.doi.org/10.1520/JTE102624.
Horpibulsuk, S., Yangsukkaseam, N., Chinkulkijniwat, A., Du, Y.J., 2011. Compressibilityand permeability of Bangkok clay compared with kaolinite and bentonite. Appl.Clay Sci. 52, 150–159.
Imai, G., 1980. Settling behavior of clay suspension. Soils Found. 20 (2), 61–77.IS 2720-Part XL, 2002. Determination of Free Swell Index of Soils. Bureau of Indian
Standard, New Delhi.JCPDS, 1994. Powder Diffraction File, 44, 7354-CD ROM (PDF 1–44). International Centre
for Diffraction Data, Pennsylvania, USA.Kaya, A., Yukselen, Y., 2005. Zeta potential of clay minerals and quartz contaminated by
heavy metals. Can. Geotech. J. 42 (5), 1280–1289. http://dx.doi.org/10.1139/t05-048.Kaya, A., Oren, A.H., Yukselen, Y., 2003. Settling behavior and zeta potential of kaolinite in
aqueous media. Proceedings of The Thirteenth International Offshore and Polar Engi-neering Conference Honolulu, Hawaii, USA, pp. 407–412 (May 25–30).
Kaya, A., Oren, A.H., Yukselen, Y., 2006. Settling of kaolinite in different aqueous environ-ment. Mar. Georesour. Geotechnol. 24 (3), 203–218. http://dx.doi.org/10.1080/10641190600788429.
Keren, R., Shainberg, I., Klein, E., 1988. Settling and flocculation value of sodium-montmorillonite particles in aqueous media. Soil Sci. Soc. Am. J. 52 (1), 76–80.
Krizek, R.J., Edil, T.B., Ozaydin, I.K., 1975. Preparation and identification of clay sampleswith controlled fabric. Eng. Geol. 9 (1), 13–38. http://dx.doi.org/10.1016/0013-7952(75)90025-3.
Kynch, G.J., 1952. A theory of sedimentation. Trans. Faraday Soc. Artic. 48, 166–176.http://dx.doi.org/10.1039/TF9524800166.
Lambe, T.W., Whitman, R.V., 1969. Soil Mechanics. Wiley Book Company.Lee, K., Sills, G.C., 1981. The consolidation of a soil stratum, including self-weight effects
and large strains. Int. J. Numer. Anal. Methods Geomech. 5 (4), 405–428. http://dx.doi.org/10.1002/nag.1610050406.
Leon, A.C., 1998. New perspectives in mercury porosimetry. Adv. Colloid Interf. Sci. 76–77,341–372.
126 S.D. Gumaste et al. / Applied Clay Science 91–92 (2014) 117–126
Li, S., Roy, D.M., 1986. Investigation of relations between porosity, pore structure, and C1−
diffusion of fly ash and blended cement pastes. Cem. Concr. Res. 16 (5), 749–759.http://dx.doi.org/10.1016/0008-8846(86)90049-9.
Lu, N., Anandarajah, A., 1992. Empirical estimation of double layer repulsive forcebetween two inclined clay particles of finite length. J. Geotech. Eng. ASCE 118 (4),628–634.
Luckham, P.F., Rossi, S., 1999. The colloidal and rheological properties of bentonite sus-pensions. Adv. Colloid Interf. Sci. 82 (13), 43–92. http://dx.doi.org/10.1016/S0001-8686(99)00005-6.
Ma, K., Pierre, A.C., 1999. Clay sediment structure formation in aqueous kaolinite suspen-sions. Clay Clay Miner. 47 (4), 522–526.
McCarter, W.J., Blewett, J., Chrisp, T.M., Starrs, G., 2005. Electrical property measurementsusing a modified hydraulic oedometer. Can. Geotech. J. 42 (2), 655–662. http://dx.doi.org/10.1139/T04-107.
Meyer, I., 2011. Grain size control on Sr–Nd isotope provenance studies and impact onpaleoclimate reconstructions: an example from deep-sea sediments offshore NWAfrica. Geochem. Geophys. Geosyst. 12 (3), 1–14. http://dx.doi.org/10.1029/2010GC003355.
Michaels, A.S., Bolger, J.C., 1962. Settling rates and sediment volumes of flocculated kaolinsuspensions. Ind. Eng. Chem. Fundam. 1 (1), 24–33.
Michaud, J.P., 1991. A Citizen's Guide to Understanding and Monitoring Lakes andStreams. Publ. #94 149. Washington State Dept. of Ecology, Publications Office,Olympia, WA, USA, pp. 407–7472 (360).
Mitchell, J.K., 1993. Fundamentals of Soil Behavior. John Wiley & Sons, New York.Moayedi, H., Asadi, A., Moayedi, F., Huat, B.B.K., 2011. Zeta potential of tropical soil in
presence of polyvinyl alcohol. Int. J. Electrochem. Sci. 6, 1294–1306.Moldovanyi, E.P., Walter, L.M., Land, L.S., 1993. Strontium, boron, oxygen, and hydrogen
isotope geochemistry of brines from basal strata of the gulf coast sedimentarybasin, USA. Geochim. Cosmochim. Acta 57, 2083–2099.
Moon, H.Y., Kim, H.S., Choi, D.S., 2006. Relationship between average pore diameter andchloride diffusivity in various concretes. Constr. Build. Mater. 20 (9), 725–732.http://dx.doi.org/10.1016/j.conbuildmat.2005.02.005.
Moore, R., 1991. The chemical and mineralogical controls upon the residual strength ofpure and natural clays. Geotechnique 41 (1), 35–47. http://dx.doi.org/10.1680/geot.1991.41.1.35.
Moore, C.A., Mitchell, J.K., 1974. Electromagnetic forces and soil strength. Geotechnique24 (4), 627–640.
Nasser, M.S., James, A.E., 2008. Degree of flocculation and viscoelastic behaviour ofkaolinite-sodium chloride dispersions. Colloids Surf. A Physicochem. Eng. Asp. 315(1–3), 165–175. http://dx.doi.org/10.1016/j.colsurfa.2007.07.030.
Olson, R.E., Mesri, G., 1970. Mechanisms controlling compressibility of clays. J. Soil Mech.Found. Eng. ASCE 96 (6), 1863–1878.
Osipov, V.I., Sokolov, V.N., 1978. Structure formation in clay sediments. Bull. Int. Assoc.Eng. Geol. 18 (1), 83–90.
Pillai, R.J., Robinson, R.G., Boominathan, A., 2011. Effect of microfabric on undrained staticand cyclic behavior of kaolin clay. J. Geotech. Geoenviron. Eng. ASCE 137 (4),421–429.
Prashant, A., Penumadu, D., 2007. Effect of microfabric on mechanical behavior of kaolinclay using cubical true triaxial testing. J. Geotech. Geoenviron. Eng. ASCE 133 (4),433–444.
Pusch, R., Yong, R.N., 2003. Water saturation and retention of hydrophilic clay buffermicrostructural aspects. Appl. Clay Sci. 23, 61–68 (Elsevier).
Rajasekaran, G., Murali, K., Srinivasaraghavan, R., 1999. Microfabric, chemical and miner-alogical study of Indian marine clays. Ocean Eng. 26 (5), 463–483. http://dx.doi.org/10.1016/S0029-8018(98)00004-3.
Rao, S.M., Revanasiddappa, K., 2005. Role of microfabric inmatrix suction of residual soils.Eng. Geol. 80 (1–2), 60–70. http://dx.doi.org/10.1016/j.enggeo.2005.04.001.
Rao, H.B., Bhat, A.M., Singh, D.N., 2007. Application of impedance spectroscopy for model-ing flow of AC in soils. Geomech. GeoEng. 2 (3), 197–206. http://dx.doi.org/10.1080/17486020701466778.
Rinaldi, V.A., Francisca, F.M., 1999. Impedance analysis of soil dielectric dispersion(1 MHz–1GHz). J. Geotech. Geoenviron. Eng. ASCE 125 (2), 111–121. http://dx.doi.org/10.1061/(ASCE)1090-0241 (125:2(111)).
Romero, E., Simms, P.H., 2008. Microstructure investigation in unsaturated soils: a reviewwith special attention to contribution of mercury intrusion porosimetry and environ-mental scanning electron microscopy. Geotech. Geol. Eng. 26 (6), 705–727.
Sachan, A., Penumadu, D., 2007. Effect of microfabric on shear behavior of kaolin clay.J. Geotech. Geoenviron. Eng. ASCE 133 (3), 306–318.
Shah, P.H., Singh, D.N., 2004. A simple methodology for determining electrical conductiv-ity of soils. J. ASTM Int. 1 (5), 1–11. http://dx.doi.org/10.1520/JAI12128.
Shang, J.Q., 1997. Zeta potential and electroosmotic permeabilityof clay soils. Can.Geotech. J. 34 (4), 627–631. http://dx.doi.org/10.1139/cgj-34-4-627.
Souli, H., Fleureau, M., Trabelsi, A.M., Besnard, M., 2008. Physicochemical analysis ofpermeability changes in the presence of zinc. Geoderma 145 (1–2), 1–7. http://dx.doi.org/10.1016/j.geoderma.2008.02.014.
Sparks, D.L., 1986. Soil Physical Chemistry. CRC Press, Boca Raton.Sreedeep, S., Singh, D.N., 2008. A novel technique for studying diffusion of contaminants
in fine-grained soils. Geomech. GeoEng. Int. J. 3 (3), 199–209. http://dx.doi.org/10.1080/17486020802221130.
Sridharan, A., Prakash, K., 1999. Influence of clay mineralogy and pore-medium chemistryon clay sediment formation. Can. Geotech. J. 36 (5), 961–966. http://dx.doi.org/10.1139/cgj-36-5-961.
Sridharan, A., Prakash, K., 2001. Settling behavior and claymineralogy. Soils Found. 41 (2),105–109.
Sridharan, A., Prakash, K., 2003. Self-weight consolidation: compressibility behavior ofsegregated and homogeneous fine-grained sediments. Mar. Georesour. Geotechnol.21 (2), 73–80. http://dx.doi.org/10.1080/716100484.
Toorman, E.A., 1996. Sedimentation and self-weight consolidation: general unifying the-ory. Geotechnique 46 (1), 101–113. http://dx.doi.org/10.1680/geot.1996.46.1.103.
Toorman, E.A., 1999. Sedimentation and self-weight consolidation: constitutive equationsand numerical modeling. Geotechnique 49 (6), 709–726. http://dx.doi.org/10.1680/geot.1999.49.6.709.
van Olphen, H., 1977. An Introduction to Clay Colloid Chemistry. John Wiley and Sons.Vane, L.M., Zhang, G.M., 1997. Effects of aqueous phase properties on clay particle zeta
potential and electro-osmotic permeability: implications for electrokinetic soil reme-diation processes. J. Hazard. Mater. 55 (1–3), 1–22. http://dx.doi.org/10.1016/S0304-3894(97)00010-1.
Wang, Y.H., Xu, D., 2007. Dual porosity and secondary consolidation. J. Geotech.Geoenviron. Eng. ASCE 133 (7), 793–801. http://dx.doi.org/10.1061/(ASCE) 1090-0241 (133:7(793).
West, L.J., Stewart, D.L., 1995. Effect of zeta potential on soil electrokinesis. In the Proceed-ings of Geoenvironment 2000, ASCE Special Publication, pp. 1535–1549.
Williams, D.J.A., Williams, K.P., 1978. Electrophoresis and zeta potential of kaolinite.J. Colloid Interface Sci. 65 (1), 79–87. http://dx.doi.org/10.1016/0021-9797(78)90260-6.
Yang, H.S., Hwang, D.W., Lee, H.P., Kim, G., 2002. Distribution of 90Sr in coastal seawater,sediments and organisms off two atomic power stations in Korea. J. Environ. Radioact.59, 105–112.
Yukselen, Y., Kaya, A., 2003. Zeta potential of kaolinite in the presence of alkali, alkalineearth and hydrolyzable metal ions. J. Water Air Soil Pollut. 145 (1–4), 155–168.http://dx.doi.org/10.1023/A:1023684213383.
Zymela, S., 1996. Carbon, oxygen and strontium isotopic composition of diagenetic calciteand siderite from the upper cretaceous cardium formation of western Alberta. Ph. Dthesis submitted to McMaster University, Canada.
Copyright © 2022 FDOKUMEN