Deep Mixing Induced Property Changes in Surrounding Sensitive Marine Clays
10
Deep Mixing Induced Property Changes in Surrounding Sensitive Marine Clays Shui-Long Shen 1 ; Jie Han, M.ASCE 2 ; and Yan-Jun Du 3 Abstract: This paper presents a field study of installation effects of deep mixed columns on properties of the sensitive Ariake marine clay. Cone penetration tests were performed in the field to evaluate the change in the strength of the surrounding clay with time. Soil samples were taken before and after column installation to evaluate variations of physical, mechanical, and chemical properties of the surrounding clay. Test results indicated that the water content of the surrounding clay decreased while the concentration of cations increased as sampling locations approached the columns. Shear strength of the surrounding clay decreased during the installation but recovered after a short period of curing. Shear strength continued to increase with time over a period of 70 days. Based on the regression results, the surrounding soil after the installation of the columns took approximately 10 days to recover to the strength value before installation. On average, the shear strength of the surrounding clay increased over the original strength by approximately 23% after 40 days and 50% after 70 days, respectively. Discussion is presented on strength changes and key influence factors including soil disturbance and fracturing, thixotropy, consolidation, and diffusion of cations from deep mixed columns to the surrounding clay. DOI: 10.1061/ASCE1090-02412008134:6845 CE Database subject headings: Soil mixing; Clays; Field tests; Soil properties; Cracking; Shear strength; Diffusion. Introduction Deep mixed DM columns are installed through mixing a chemi- cal admixture cement/lime slurry or powder with in situ soft soil using blades. Laboratory test results showed that three zones exist outside the nominal diameter of the blade: an expanded zone, a transitional zone, and a boundary layer in the soil around the DM column Shen et al. 2003a; Larsson and Kosche 2005. The ex- panded zone is formed by the injection of the admixture Shen and Miura 1999; Shen et al. 2003a,b. In the transitional zone, the shear strength of the soil increased after curing for a certain pe- riod Shen et al. 2003a; Larsson and Kosche 2005 while at the boundary layer the shear strength may decrease Larsson and Kosche 2005. Explanations on the mechanisms of forming this transitional zone are: 1 the migration of calcium ions due to molecular diffusion Rajasekaran and Rao 1997; Rogers et al. 2000; Hayashi et al. 2003; and Larsson and Kosche 2005; and 2 the hydraulic fracturing around the column induced during the installation of the column Shen and Miura 1999; Shen et al. 2003b. Shen and Miura 1999 and Shen et al. 2003c indicated that an expansion force from the injection of admixture and a shear force from the rotating blade acting on the surrounding soil during the rotation of the blade could fracture the soil. Therefore, it is inevitable that the installation of DM columns would induce lateral movement and property changes in the surrounding soil. Even without any fracturing of the surrounding soil, dissolved cations, such as calcium Ca 2+ resulted from the hydration of cement, would migrate into the surrounding soil due to diffusion during the curing period Rajasekaran and Rao 1997; Rogers et al. 2000; Hayashi et al. 2003; and Larsson and Kosche 2005. This process occurs as a result of a concentration gradient existing between the DM columns and the surrounding soil. With the pres- ence of fractures in the surrounding soil, Ca 2+ would migrate faster than that in the intact soil i.e., without any fractureRowe and Booker 1991. The transported Ca 2+ exchanges with the readily exchangeable cations like hydrogen H + , sodium Na + , and potassium K + on the surfaces of particles in the surrounding soil Mitchell 1993. This type of ion exchange would cause the floc- culation of the soil particles and cause changes in soil properties, such as the soil consistency Herrin and Mitchell 1961. The floc- culation caused by cation exchange would increase the undrained shear strength of the surrounding soil Lessard and Mitchell 1985. Shen et al. 2003a identified seven key factors which could cause property changes in the surrounding soil during and after the installation of DM columns through a laboratory study, in- cluding soil thixotropy, soil fracturing, cement penetration, ion diffusion, cementation, consolidation, and heating. DM columns gain their strengths through chemical reactions including hydra- tion, pozzolanic cementation, ion exchange, flocculation, and car- bonation between admixtures and soil particles. Because DM columns have higher strengths than their surrounding soil, in practical applications, most designs have considered the strength increase of the overall treated soft ground resulted only from the higher strengths of the DM columns for example, Kamon and 1 Professor, Dept. of Civil Engineering, School of Naval Architecture, Ocean, and Civil Engineering, Shanghai Jiao Tong Univ., 1954 Hua Shan Rd., Shanghai 200030, China corresponding author. E-mail: slshen@ sjtu.edu.cn 2 Associate Professor, Dept. of Civil, Environmental, and Architectural Engineering, Univ. of Kansas, Lawrence, KS 66045. 3 Professor, Institute of Geotechnical Engineering, Southeast Univ., Nanjing, 210096 China. Note. Discussion open until November 1, 2008. Separate discussions must be submitted for individual papers. To extend the closing date by one month, a written request must be filed with the ASCE Managing Editor. The manuscript for this paper was submitted for review and pos- sible publication on February 7, 2007; approved on September 25, 2007. This paper is part of the Journal of Geotechnical and Geoenvironmental Engineering, Vol. 134, No. 6, June 1, 2008. ©ASCE, ISSN 1090-0241/ 2008/6-845–854/$25.00. JOURNAL OF GEOTECHNICAL AND GEOENVIRONMENTAL ENGINEERING © ASCE / JUNE 2008 / 845
Transcript of Deep Mixing Induced Property Changes in Surrounding Sensitive Marine Clays

Deep Mixing Induced Property Changes in SurroundingSensitive Marine Clays
Shui-Long Shen1; Jie Han, M.ASCE2; and Yan-Jun Du3
Abstract: This paper presents a field study of installation effects of deep mixed columns on properties of the sensitive Ariake marineclay. Cone penetration tests were performed in the field to evaluate the change in the strength of the surrounding clay with time. Soilsamples were taken before and after column installation to evaluate variations of physical, mechanical, and chemical properties of thesurrounding clay. Test results indicated that the water content of the surrounding clay decreased while the concentration of cationsincreased as sampling locations approached the columns. Shear strength of the surrounding clay decreased during the installation butrecovered after a short period of curing. Shear strength continued to increase with time over a period of 70 days. Based on the regressionresults, the surrounding soil after the installation of the columns took approximately 10 days to recover to the strength value beforeinstallation. On average, the shear strength of the surrounding clay increased over the original strength by approximately 23% after40 days and 50% after 70 days, respectively. Discussion is presented on strength changes and key influence factors including soildisturbance and fracturing, thixotropy, consolidation, and diffusion of cations from deep mixed columns to the surrounding clay.
DOI: 10.1061/�ASCE�1090-0241�2008�134:6�845�
CE Database subject headings: Soil mixing; Clays; Field tests; Soil properties; Cracking; Shear strength; Diffusion.
Introduction
Deep mixed �DM� columns are installed through mixing a chemi-cal admixture �cement/lime slurry or powder� with in situ soft soilusing blades. Laboratory test results showed that three zones existoutside the nominal diameter of the blade: an expanded zone, atransitional zone, and a boundary layer in the soil around the DMcolumn �Shen et al. 2003a; Larsson and Kosche 2005�. The ex-panded zone is formed by the injection of the admixture �Shenand Miura 1999; Shen et al. 2003a,b�. In the transitional zone, theshear strength of the soil increased after curing for a certain pe-riod �Shen et al. 2003a; Larsson and Kosche 2005� while at theboundary layer the shear strength may decrease �Larsson andKosche 2005�. Explanations on the mechanisms of forming thistransitional zone are: �1� the migration of calcium ions due tomolecular diffusion �Rajasekaran and Rao 1997; Rogers et al.2000; Hayashi et al. 2003; and Larsson and Kosche 2005�; and�2� the hydraulic fracturing around the column induced during theinstallation of the column �Shen and Miura 1999; Shen et al.2003b�. Shen and Miura �1999� and Shen et al. �2003c� indicated
1Professor, Dept. of Civil Engineering, School of Naval Architecture,Ocean, and Civil Engineering, Shanghai Jiao Tong Univ., 1954 Hua ShanRd., Shanghai 200030, China �corresponding author�. E-mail: [email protected]
2Associate Professor, Dept. of Civil, Environmental, and ArchitecturalEngineering, Univ. of Kansas, Lawrence, KS 66045.
3Professor, Institute of Geotechnical Engineering, Southeast Univ.,Nanjing, 210096 China.
Note. Discussion open until November 1, 2008. Separate discussionsmust be submitted for individual papers. To extend the closing date byone month, a written request must be filed with the ASCE ManagingEditor. The manuscript for this paper was submitted for review and pos-sible publication on February 7, 2007; approved on September 25, 2007.This paper is part of the Journal of Geotechnical and GeoenvironmentalEngineering, Vol. 134, No. 6, June 1, 2008. ©ASCE, ISSN 1090-0241/
2008/6-845–854/$25.00.JOURNAL OF GEOTECHNICAL AND
that an expansion force from the injection of admixture and ashear force from the rotating blade acting on the surrounding soilduring the rotation of the blade could fracture the soil. Therefore,it is inevitable that the installation of DM columns would inducelateral movement and property changes in the surrounding soil.Even without any fracturing of the surrounding soil, dissolvedcations, such as calcium �Ca2+� resulted from the hydration ofcement, would migrate into the surrounding soil due to diffusionduring the curing period �Rajasekaran and Rao 1997; Rogers et al.2000; Hayashi et al. 2003; and Larsson and Kosche 2005�. Thisprocess occurs as a result of a concentration gradient existingbetween the DM columns and the surrounding soil. With the pres-ence of fractures in the surrounding soil, Ca2+ would migratefaster than that in the intact soil �i.e., without any fracture� �Roweand Booker 1991�. The transported Ca2+ exchanges with thereadily exchangeable cations �like hydrogen H+, sodium Na+, andpotassium K+� on the surfaces of particles in the surrounding soil�Mitchell 1993�. This type of ion exchange would cause the floc-culation of the soil particles and cause changes in soil properties,such as the soil consistency �Herrin and Mitchell 1961�. The floc-culation caused by cation exchange would increase the undrainedshear strength of the surrounding soil �Lessard and Mitchell1985�.
Shen et al. �2003a� identified seven key factors which couldcause property changes in the surrounding soil during and afterthe installation of DM columns through a laboratory study, in-cluding soil thixotropy, soil fracturing, cement penetration, iondiffusion, cementation, consolidation, and heating. DM columnsgain their strengths through chemical reactions �including hydra-tion, pozzolanic cementation, ion exchange, flocculation, and car-bonation� between admixtures and soil particles. Because DMcolumns have higher strengths than their surrounding soil, inpractical applications, most designs have considered the strengthincrease of the overall treated soft ground resulted only from the
higher strengths of the DM columns �for example, Kamon andGEOENVIRONMENTAL ENGINEERING © ASCE / JUNE 2008 / 845

Bergado 1991; Bergado et al. 1996�. In other words, no propertychanges were assumed in the surrounding soil after the installa-tion of DM columns. Although property changes in the surround-ing soil after the installation of DM columns were well observedin laboratory tests �Shen et al. 2003a; Larsson and Kosche 2005�,very limited studies have been conducted to verify these changesin the field.
The objective of this study was to investigate the deep mixinginduced property changes in the surrounding clay in the field.Field tests were conducted before and after the installation of theDM columns in the soft Ariake clay, which is typical marine claywith high sensitivity in Japan.
Descriptions of Test Site and Soil Properties
The field test site is located at Ashikari near the estuary of theRokkaku River to the Ariake Sea, the Saga Plain, Japan. This siteconsists of a marine deposit called the Ariake clay. The thicknessof this Ariake clay is approximately 10–20 m with a maximumthickness of 30 m. The Ariake clay has a low strength �the lowestundrained shear strength being approximately 10 kPa� and highsensitivity �typically ranging from 10 to 20 and with maximumvalues in excess of 100 in some locations� caused by salt leaching�Ohtsubo et al. 1995; Miura et al. 1998a�. Therefore, the Ariakeclay is one of the most problematic soils in Japan �Hong et al.2006�. A number of researchers have studied the geotechnicalproperties of this clay because of its high sensitivity �for example,Ohtsubo et al. 1995 and Miura et al. 1998a�.
Fig. 1 shows the soil profile and the geotechnical properties atthis test site. A crust layer of unsaturated clay exists near theground surface �from 0.0 to 0.6 m deep�. The underlying layerfrom a depth of 1.0 to 13.5 m is the soft Ariake clay. This clay isgrey in color and typically contains many shells and some siltcontent, especially at a depth of 3–4 m. The natural water contentof this clay layer is about 120%, which is higher than its liquidlimit. The unconfined compressive strength of this clay rangesfrom 20 to 40 kPa. A thin layer with many shells exists at a depthof 3 m, at which cone tip resistance increases significantly. Thecone penetration test �CPT� in this study stopped at a depth of7.0 m. The sensitivity of the Ariake clay in this field is very high,ranging from 10 to 25. Below the Ariake clay layer is a sandlayer.
Fig. 1 also presents the concentrations of the primary cations�Na+,K+,Mg2+ ,Ca2+ ,Fe3+� dissolved in the pore water and the
Fig. 1. Geotechnical
pH value of pore water at depths ranging from 0 to 8 m at this
846 / JOURNAL OF GEOTECHNICAL AND GEOENVIRONMENTAL ENGINE
site before the installation of DM columns. For comparison pur-poses, the chemical properties of the water samples from the es-tuary, a creek, and an open sea �Sverdrup et al. 1942� aretabulated in Table 1. The creek water represents fresh water thatwas used as the source for making cement–slurry. The sodium ionconcentration at this test site is much higher than that near theshore locations, where the sodium concentration Na+ is approxi-mately 10 meq /L �Miura et al. 1998a�. However, the sodium con-centration at this test site is lower than that in the open seawater�Sverdrup et al. 1942�. This is because the test site is near theestuary of the Rokkaku River to the Ariake Sea, where the claywas strongly influenced by both the seawater and the Rokkakuriver water during its deposition. The pH value of the pore waterat this site varies slightly with the depth and it is not much higherthan that of the seawater samples from the estuary. The highervalue of Ca2+ concentration in the pore water than that in the opensea is attributed to the gradual dissolution of calcite contained inthe Ariake clay �Otsubo et al. 1995�. Table 1 clearly shows that allcation concentrations at the test site are higher than those in thecreek water.
Installation and Monitoring Procedures
DM Column Installation Machine
A low pressure slurry mixing machine, called the slurry doublemixing �SDM� method, developed by Shinwa Techno Co. Ltd.,was used for this field study. Fig. 2 presents the composition ofthe machine and the structure of the mixing head with two blades.The details of this machine can be found in the literature �Naka-mura et al. 1997; Shen et al. 2003c�. The structure of this machine
Table 1. Composition of Water Samples
Ion
Estuary riverwatera
�meq/L�Creek water
�meq/L�Seawaterb
�meq/L�
Na+ 304.3 8.2 459
K+ 10.2 1.4 10
Mg2+ 26.2 3.2 106
Ca2+ 4.2 2.9 20
pH 7.7 7.4 —aFrom the Rokkaku River.b
s and soil properties
profileData from Sverdrup et al. �1942�.
ERING © ASCE / JUNE 2008
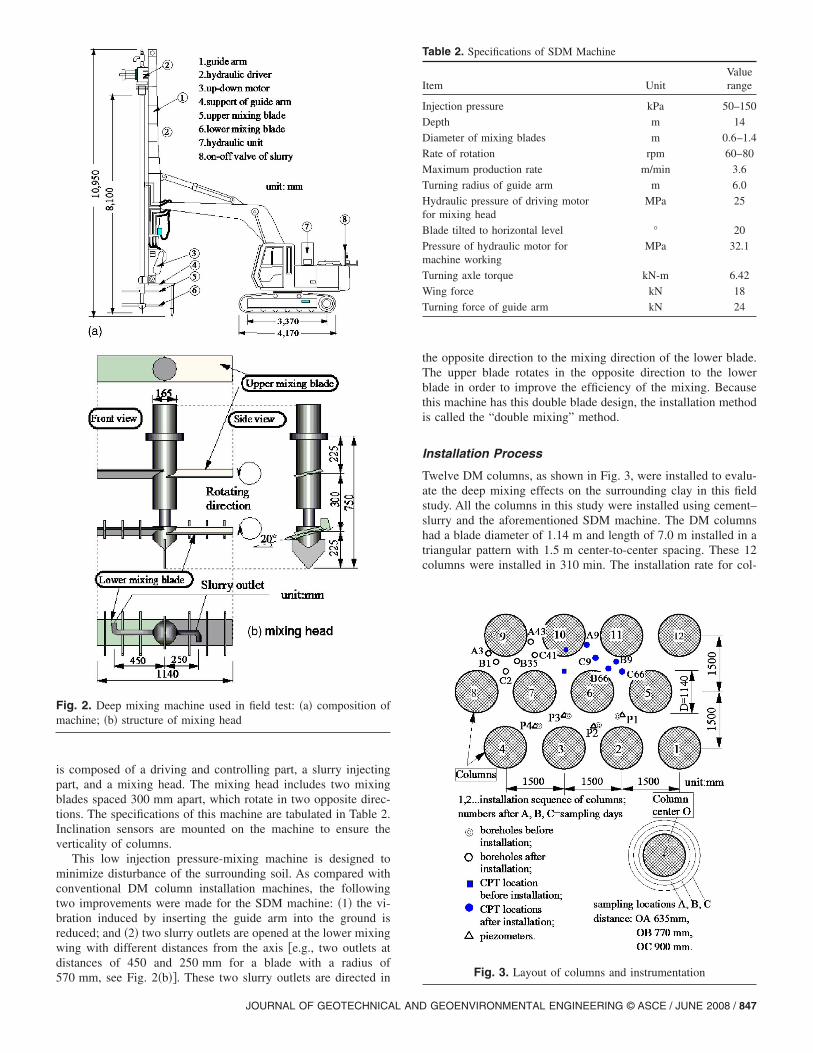
is composed of a driving and controlling part, a slurry injectingpart, and a mixing head. The mixing head includes two mixingblades spaced 300 mm apart, which rotate in two opposite direc-tions. The specifications of this machine are tabulated in Table 2.Inclination sensors are mounted on the machine to ensure theverticality of columns.
This low injection pressure-mixing machine is designed tominimize disturbance of the surrounding soil. As compared withconventional DM column installation machines, the followingtwo improvements were made for the SDM machine: �1� the vi-bration induced by inserting the guide arm into the ground isreduced; and �2� two slurry outlets are opened at the lower mixingwing with different distances from the axis �e.g., two outlets atdistances of 450 and 250 mm for a blade with a radius of
Fig. 2. Deep mixing machine used in field test: �a� composition ofmachine; �b� structure of mixing head
570 mm, see Fig. 2�b��. These two slurry outlets are directed in
JOURNAL OF GEOTECHNICAL AND
the opposite direction to the mixing direction of the lower blade.The upper blade rotates in the opposite direction to the lowerblade in order to improve the efficiency of the mixing. Becausethis machine has this double blade design, the installation methodis called the “double mixing” method.
Installation Process
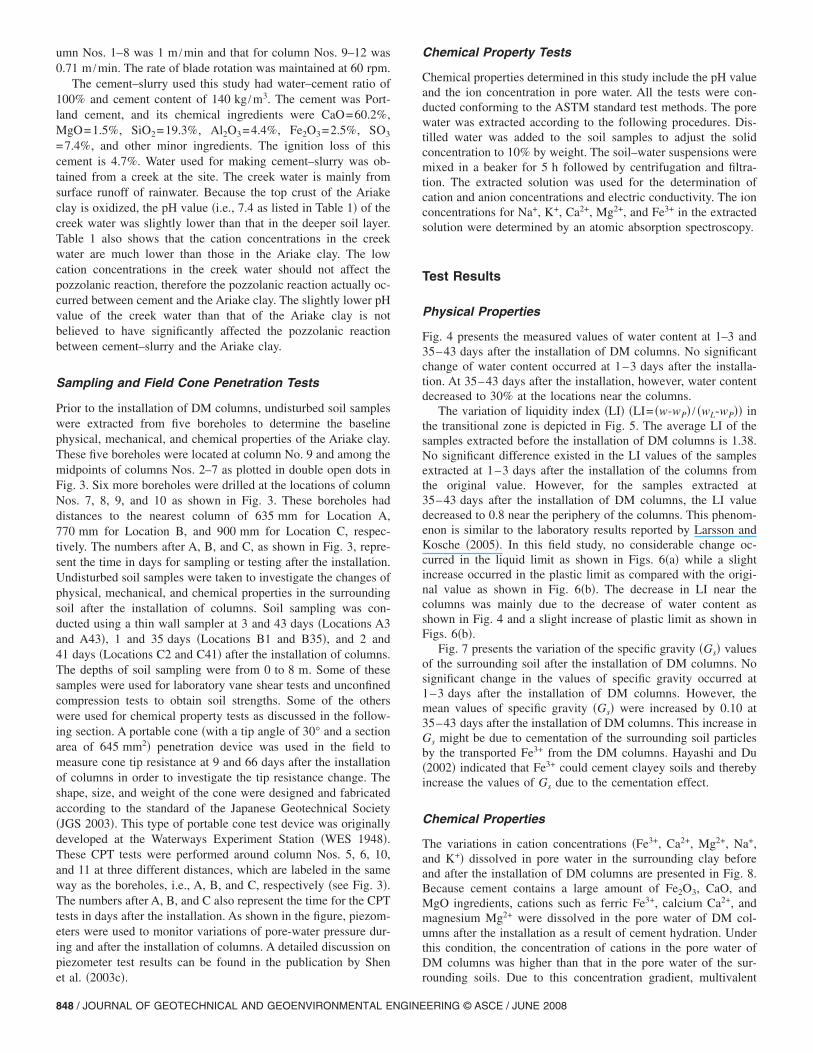
Twelve DM columns, as shown in Fig. 3, were installed to evalu-ate the deep mixing effects on the surrounding clay in this fieldstudy. All the columns in this study were installed using cement–slurry and the aforementioned SDM machine. The DM columnshad a blade diameter of 1.14 m and length of 7.0 m installed in atriangular pattern with 1.5 m center-to-center spacing. These 12columns were installed in 310 min. The installation rate for col-
Table 2. Specifications of SDM Machine
Item UnitValuerange
Injection pressure kPa 50–150
Depth m 14
Diameter of mixing blades m 0.6–1.4
Rate of rotation rpm 60–80
Maximum production rate m/min 3.6
Turning radius of guide arm m 6.0
Hydraulic pressure of driving motorfor mixing head
MPa 25
Blade tilted to horizontal level ° 20
Pressure of hydraulic motor formachine working
MPa 32.1
Turning axle torque kN-m 6.42
Wing force kN 18
Turning force of guide arm kN 24
Fig. 3. Layout of columns and instrumentation
GEOENVIRONMENTAL ENGINEERING © ASCE / JUNE 2008 / 847
umn Nos. 1–8 was 1 m /min and that for column Nos. 9–12 was0.71 m /min. The rate of blade rotation was maintained at 60 rpm.
The cement–slurry used this study had water–cement ratio of100% and cement content of 140 kg /m3. The cement was Port-land cement, and its chemical ingredients were CaO=60.2%,MgO=1.5%, SiO2=19.3%, Al2O3=4.4%, Fe2O3=2.5%, SO3
=7.4%, and other minor ingredients. The ignition loss of thiscement is 4.7%. Water used for making cement–slurry was ob-tained from a creek at the site. The creek water is mainly fromsurface runoff of rainwater. Because the top crust of the Ariakeclay is oxidized, the pH value �i.e., 7.4 as listed in Table 1� of thecreek water was slightly lower than that in the deeper soil layer.Table 1 also shows that the cation concentrations in the creekwater are much lower than those in the Ariake clay. The lowcation concentrations in the creek water should not affect thepozzolanic reaction, therefore the pozzolanic reaction actually oc-curred between cement and the Ariake clay. The slightly lower pHvalue of the creek water than that of the Ariake clay is notbelieved to have significantly affected the pozzolanic reactionbetween cement–slurry and the Ariake clay.
Sampling and Field Cone Penetration Tests
Prior to the installation of DM columns, undisturbed soil sampleswere extracted from five boreholes to determine the baselinephysical, mechanical, and chemical properties of the Ariake clay.These five boreholes were located at column No. 9 and among themidpoints of columns Nos. 2–7 as plotted in double open dots inFig. 3. Six more boreholes were drilled at the locations of columnNos. 7, 8, 9, and 10 as shown in Fig. 3. These boreholes haddistances to the nearest column of 635 mm for Location A,770 mm for Location B, and 900 mm for Location C, respec-tively. The numbers after A, B, and C, as shown in Fig. 3, repre-sent the time in days for sampling or testing after the installation.Undisturbed soil samples were taken to investigate the changes ofphysical, mechanical, and chemical properties in the surroundingsoil after the installation of columns. Soil sampling was con-ducted using a thin wall sampler at 3 and 43 days �Locations A3and A43�, 1 and 35 days �Locations B1 and B35�, and 2 and41 days �Locations C2 and C41� after the installation of columns.The depths of soil sampling were from 0 to 8 m. Some of thesesamples were used for laboratory vane shear tests and unconfinedcompression tests to obtain soil strengths. Some of the otherswere used for chemical property tests as discussed in the follow-ing section. A portable cone �with a tip angle of 30° and a sectionarea of 645 mm2� penetration device was used in the field tomeasure cone tip resistance at 9 and 66 days after the installationof columns in order to investigate the tip resistance change. Theshape, size, and weight of the cone were designed and fabricatedaccording to the standard of the Japanese Geotechnical Society�JGS 2003�. This type of portable cone test device was originallydeveloped at the Waterways Experiment Station �WES 1948�.These CPT tests were performed around column Nos. 5, 6, 10,and 11 at three different distances, which are labeled in the sameway as the boreholes, i.e., A, B, and C, respectively �see Fig. 3�.The numbers after A, B, and C also represent the time for the CPTtests in days after the installation. As shown in the figure, piezom-eters were used to monitor variations of pore-water pressure dur-ing and after the installation of columns. A detailed discussion onpiezometer test results can be found in the publication by Shen
et al. �2003c�.848 / JOURNAL OF GEOTECHNICAL AND GEOENVIRONMENTAL ENGINE
Chemical Property Tests
Chemical properties determined in this study include the pH valueand the ion concentration in pore water. All the tests were con-ducted conforming to the ASTM standard test methods. The porewater was extracted according to the following procedures. Dis-tilled water was added to the soil samples to adjust the solidconcentration to 10% by weight. The soil–water suspensions weremixed in a beaker for 5 h followed by centrifugation and filtra-tion. The extracted solution was used for the determination ofcation and anion concentrations and electric conductivity. The ionconcentrations for Na+, K+, Ca2+, Mg2+, and Fe3+ in the extractedsolution were determined by an atomic absorption spectroscopy.
Test Results
Physical Properties
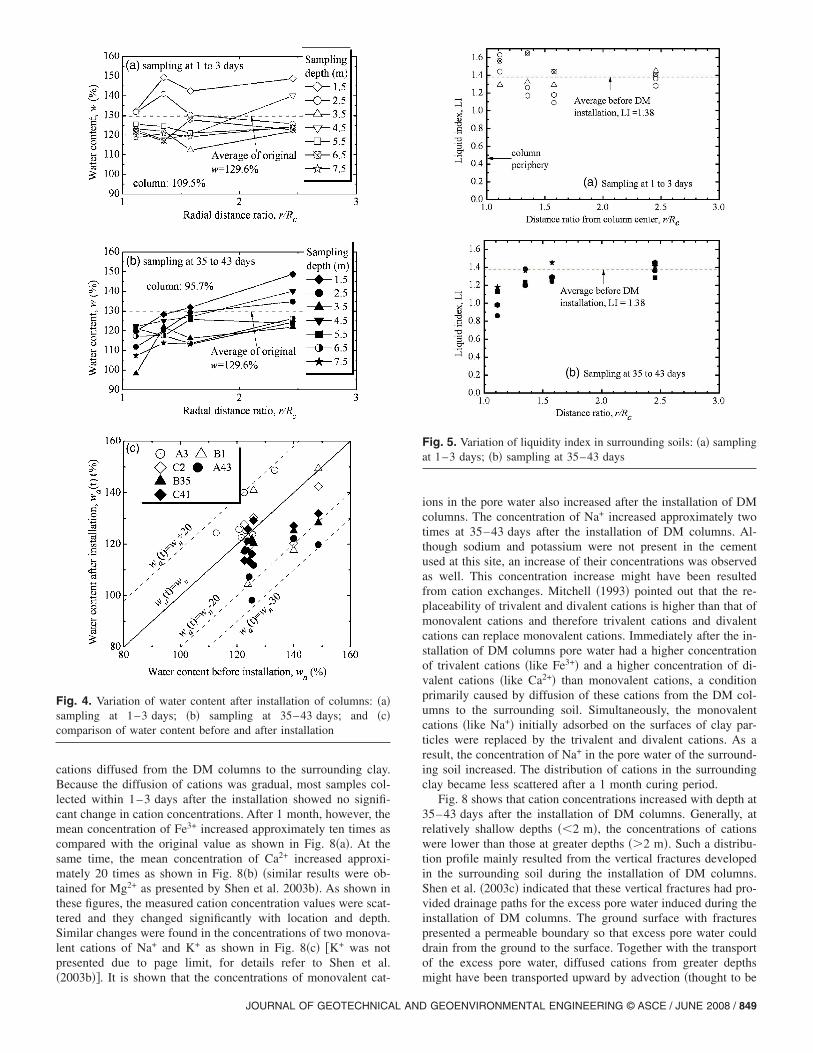
Fig. 4 presents the measured values of water content at 1–3 and35–43 days after the installation of DM columns. No significantchange of water content occurred at 1–3 days after the installa-tion. At 35–43 days after the installation, however, water contentdecreased to 30% at the locations near the columns.
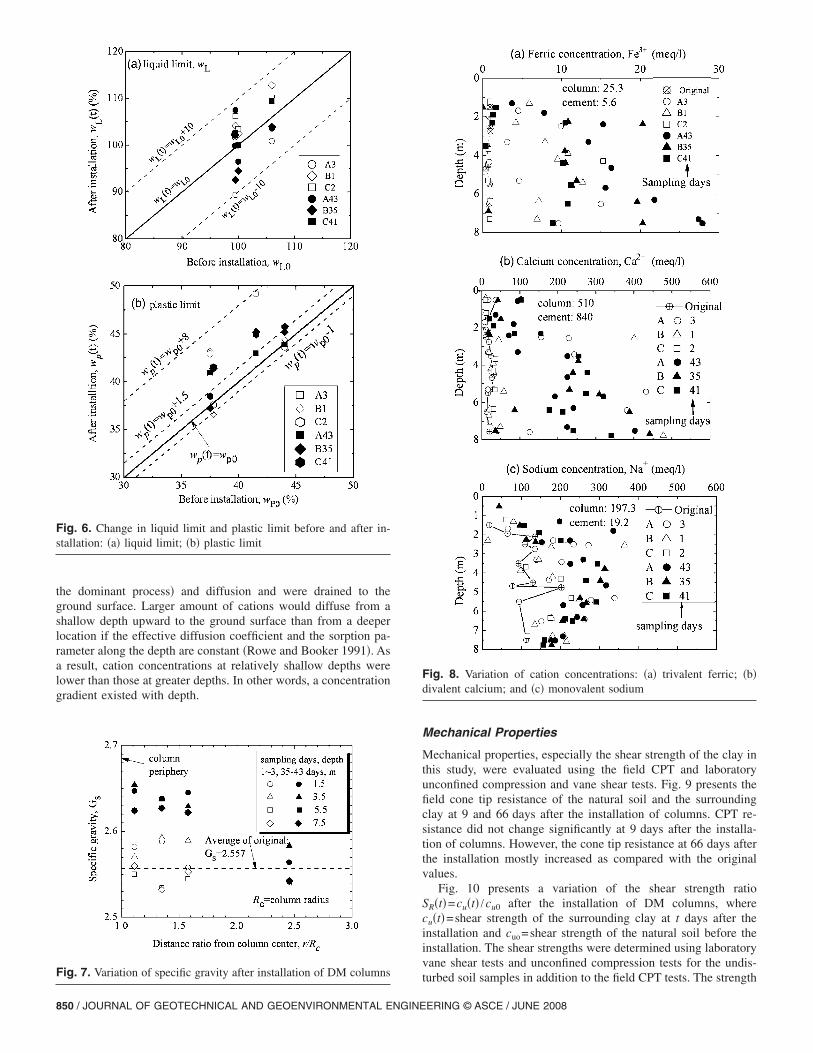
The variation of liquidity index �LI� �LI= �w-wP� / �wL-wP�� inthe transitional zone is depicted in Fig. 5. The average LI of thesamples extracted before the installation of DM columns is 1.38.No significant difference existed in the LI values of the samplesextracted at 1–3 days after the installation of the columns fromthe original value. However, for the samples extracted at35–43 days after the installation of DM columns, the LI valuedecreased to 0.8 near the periphery of the columns. This phenom-enon is similar to the laboratory results reported by Larsson andKosche �2005�. In this field study, no considerable change oc-curred in the liquid limit as shown in Figs. 6�a� while a slightincrease occurred in the plastic limit as compared with the origi-nal value as shown in Fig. 6�b�. The decrease in LI near thecolumns was mainly due to the decrease of water content asshown in Fig. 4 and a slight increase of plastic limit as shown inFigs. 6�b�.
Fig. 7 presents the variation of the specific gravity �Gs� valuesof the surrounding soil after the installation of DM columns. Nosignificant change in the values of specific gravity occurred at1–3 days after the installation of DM columns. However, themean values of specific gravity �Gs� were increased by 0.10 at35–43 days after the installation of DM columns. This increase inGs might be due to cementation of the surrounding soil particlesby the transported Fe3+ from the DM columns. Hayashi and Du�2002� indicated that Fe3+ could cement clayey soils and therebyincrease the values of Gs due to the cementation effect.
Chemical Properties
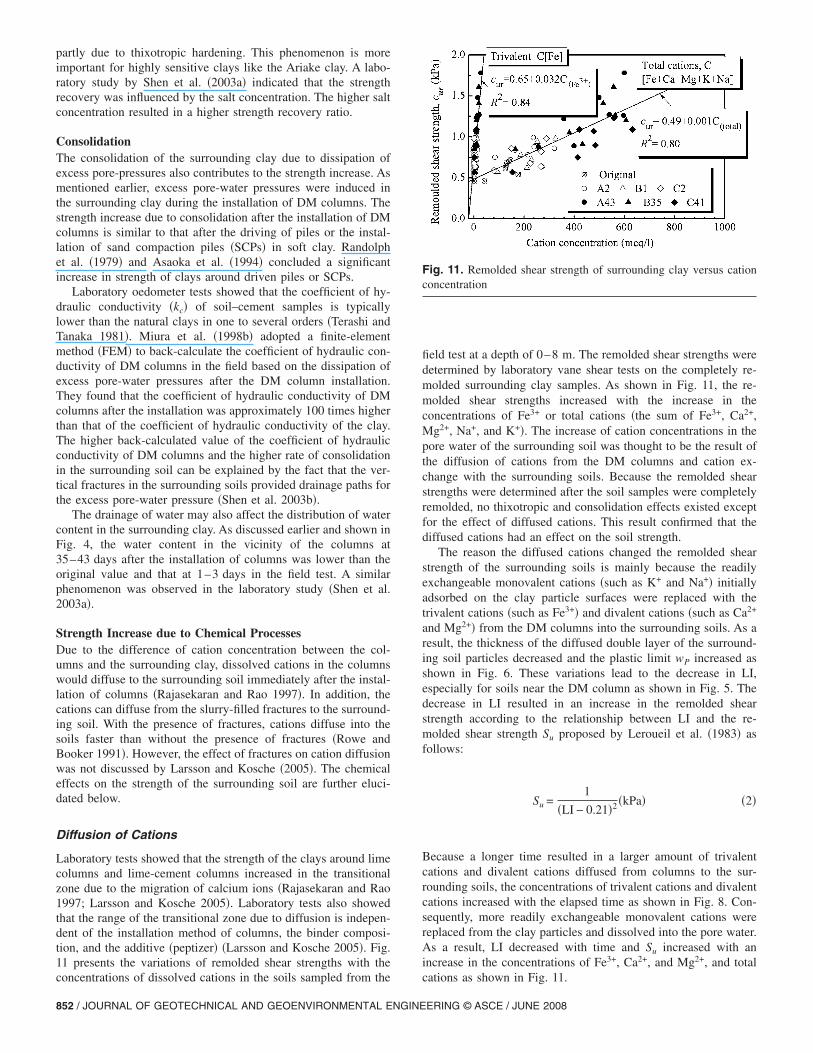
The variations in cation concentrations �Fe3+, Ca2+, Mg2+, Na+,and K+� dissolved in pore water in the surrounding clay beforeand after the installation of DM columns are presented in Fig. 8.Because cement contains a large amount of Fe2O3, CaO, andMgO ingredients, cations such as ferric Fe3+, calcium Ca2+, andmagnesium Mg2+ were dissolved in the pore water of DM col-umns after the installation as a result of cement hydration. Underthis condition, the concentration of cations in the pore water ofDM columns was higher than that in the pore water of the sur-
rounding soils. Due to this concentration gradient, multivalentERING © ASCE / JUNE 2008
cations diffused from the DM columns to the surrounding clay.Because the diffusion of cations was gradual, most samples col-lected within 1–3 days after the installation showed no signifi-cant change in cation concentrations. After 1 month, however, themean concentration of Fe3+ increased approximately ten times ascompared with the original value as shown in Fig. 8�a�. At thesame time, the mean concentration of Ca2+ increased approxi-mately 20 times as shown in Fig. 8�b� �similar results were ob-tained for Mg2+ as presented by Shen et al. 2003b�. As shown inthese figures, the measured cation concentration values were scat-tered and they changed significantly with location and depth.Similar changes were found in the concentrations of two monova-lent cations of Na+ and K+ as shown in Fig. 8�c� �K+ was notpresented due to page limit, for details refer to Shen et al.
Fig. 4. Variation of water content after installation of columns: �a�sampling at 1–3 days; �b� sampling at 35–43 days; and �c�comparison of water content before and after installation
�2003b��. It is shown that the concentrations of monovalent cat-
JOURNAL OF GEOTECHNICAL AND
ions in the pore water also increased after the installation of DMcolumns. The concentration of Na+ increased approximately twotimes at 35–43 days after the installation of DM columns. Al-though sodium and potassium were not present in the cementused at this site, an increase of their concentrations was observedas well. This concentration increase might have been resultedfrom cation exchanges. Mitchell �1993� pointed out that the re-placeability of trivalent and divalent cations is higher than that ofmonovalent cations and therefore trivalent cations and divalentcations can replace monovalent cations. Immediately after the in-stallation of DM columns pore water had a higher concentrationof trivalent cations �like Fe3+� and a higher concentration of di-valent cations �like Ca2+� than monovalent cations, a conditionprimarily caused by diffusion of these cations from the DM col-umns to the surrounding soil. Simultaneously, the monovalentcations �like Na+� initially adsorbed on the surfaces of clay par-ticles were replaced by the trivalent and divalent cations. As aresult, the concentration of Na+ in the pore water of the surround-ing soil increased. The distribution of cations in the surroundingclay became less scattered after a 1 month curing period.
Fig. 8 shows that cation concentrations increased with depth at35–43 days after the installation of DM columns. Generally, atrelatively shallow depths ��2 m�, the concentrations of cationswere lower than those at greater depths ��2 m�. Such a distribu-tion profile mainly resulted from the vertical fractures developedin the surrounding soil during the installation of DM columns.Shen et al. �2003c� indicated that these vertical fractures had pro-vided drainage paths for the excess pore water induced during theinstallation of DM columns. The ground surface with fracturespresented a permeable boundary so that excess pore water coulddrain from the ground to the surface. Together with the transportof the excess pore water, diffused cations from greater depths
Fig. 5. Variation of liquidity index in surrounding soils: �a� samplingat 1–3 days; �b� sampling at 35–43 days
might have been transported upward by advection �thought to be
GEOENVIRONMENTAL ENGINEERING © ASCE / JUNE 2008 / 849
the dominant process� and diffusion and were drained to theground surface. Larger amount of cations would diffuse from ashallow depth upward to the ground surface than from a deeperlocation if the effective diffusion coefficient and the sorption pa-rameter along the depth are constant �Rowe and Booker 1991�. Asa result, cation concentrations at relatively shallow depths werelower than those at greater depths. In other words, a concentrationgradient existed with depth.
Fig. 6. Change in liquid limit and plastic limit before and after in-stallation: �a� liquid limit; �b� plastic limit
Fig. 7. Variation of specific gravity after installation of DM columns
850 / JOURNAL OF GEOTECHNICAL AND GEOENVIRONMENTAL ENGINE
Mechanical Properties
Mechanical properties, especially the shear strength of the clay inthis study, were evaluated using the field CPT and laboratoryunconfined compression and vane shear tests. Fig. 9 presents thefield cone tip resistance of the natural soil and the surroundingclay at 9 and 66 days after the installation of columns. CPT re-sistance did not change significantly at 9 days after the installa-tion of columns. However, the cone tip resistance at 66 days afterthe installation mostly increased as compared with the originalvalues.
Fig. 10 presents a variation of the shear strength ratioSR�t�=cu�t� /cu0 after the installation of DM columns, wherecu�t�=shear strength of the surrounding clay at t days after theinstallation and cuo=shear strength of the natural soil before theinstallation. The shear strengths were determined using laboratoryvane shear tests and unconfined compression tests for the undis-
Fig. 8. Variation of cation concentrations: �a� trivalent ferric; �b�divalent calcium; and �c� monovalent sodium
turbed soil samples in addition to the field CPT tests. The strength
ERING © ASCE / JUNE 2008

ratio ranged from 0.6 to 1.08 at 1–3 days after the installation butreached 0.95–1.57 at 41–43 days and 1.10–2.5 at 66 days. Thisresult implies that there is no need to consider strength reductionin the design for this sensitive clay by deep mixing. Even more,the strength increase in the surrounding soil may be considered inthe design of deep mixing. However, the traditional design pro-cedure suggested by The Takeo Office �1996� does not considerthe shear strength change in the surrounding clay due to deepmixing. The reasons contributing to this initial strength reductionand the later strength recovery and increase during and after theinstallation of columns will be discussed in a later section“Strength Changes and Influence Factors.”
Discussion
Soil Fracturing around Columns
Shen et al. �2003c� theoretically demonstrated that fracturing inthe surrounding clay can happen during the installation of DM
Fig. 9. CPT cone tip resistance in surrounding clay
Fig. 10. Variation of strength of surrounding clay with elapsed time
JOURNAL OF GEOTECHNICAL AND
columns. The soil fracturing is caused by an expanding action ofinjecting admixtures and a shearing action of rotating blades. Thecombination of these two actions makes soil fracturing developeasily, even under a relatively low admixture injection pressure.Based on Shen et al. �2003c�, the fracturing region may developaround the column of approximately 2–4 times the column diam-eter. This region is defined as an influential zone and it is withinthe transitional zone. The size of this influence zone depends onthe type of mixing machine, the type of soil, and the admixtureinjection pressure. Based on the method proposed by Shen et al.�2003b�, it can be determined that the vertical fractures wouldoccur in the close region around the column while the horizontalfractures may not occur during the installation of a single DMcolumn.
Strength Changes and Influence Factors
Components of Strength ChangesAs presented earlier, Fig. 10 shows the variations of the strengthratio in the surrounding clay with the elapsed curing time after theinstallation of the columns. This strength ratio is defined based onthe undrained shear strength, Suv, from laboratory vane sheartests, unconfined compressive strength, qu, from unconfined com-pression tests, and the cone tip resistance, qc, from field CPTtests. The strength variation in the surrounding clay can beconsidered resulting from the following grouped factors: �1� thix-otropy �including soil disturbance, fracturing, and thixotropichardening�; �2� consolidation due to dissipation of excess porepressures; and �3� cementation due to the diffused cations and/orchemical reactions under high pH conditions. This strength varia-tion can be expressed as follows:
�cu,total�t� = �cu,thix�t� + �cu,cons�t� + �cu,chem�t� �1�
where t=number of days after the installation of columns;�cu,total�t�=total strength increment; �cu,thix�t�=strength incre-ment due to thixotropy; �cu,cons�t�=strength increment due toconsolidation; and �cu,chem�t�=strength increment due to chemi-cal processes.
Thixotropic Behavior of Surrounding ClayThe thixotropic behavior of the surrounding clay includes thestrength loss due to soil disturbance and fracturing during theinstallation and the strength recovery due to thixotropic hardeningafter the installation. The soil disturbance and fracturing aremainly induced by the shearing-expanding actions from the mix-ing blades and the slurry injection. The degree of disturbance andfracturing depends on the properties �especially the sensitivityand undrained shear strength� of the clay, the injection pressure,and the configuration of the blades. As shown in Fig. 10, the soilstrength at the maximum degradation was approximately 60% ofthe original strength at 1 day after the installation of DM col-umns. This result implies approximately 40% strength reductionnear the column periphery due to the disturbance and fracturingof the surrounding soil.
After the installation, the degraded strength recovered with theelapsed time. Even though the test data are scattered, the strengthratio can be correlated with the elapsed time at three locations asshown in Fig. 10. The linear regression analysis indicates that thedegraded strength regained after 10 days of the column installa-tion. The strength ratios at 40 and 70 days after the installationwere approximately 1.23 and 1.5, respectively, on average ac-
cording to the regression analysis. This strength recovery wasGEOENVIRONMENTAL ENGINEERING © ASCE / JUNE 2008 / 851
partly due to thixotropic hardening. This phenomenon is moreimportant for highly sensitive clays like the Ariake clay. A labo-ratory study by Shen et al. �2003a� indicated that the strengthrecovery was influenced by the salt concentration. The higher saltconcentration resulted in a higher strength recovery ratio.
ConsolidationThe consolidation of the surrounding clay due to dissipation ofexcess pore-pressures also contributes to the strength increase. Asmentioned earlier, excess pore-water pressures were induced inthe surrounding clay during the installation of DM columns. Thestrength increase due to consolidation after the installation of DMcolumns is similar to that after the driving of piles or the instal-lation of sand compaction piles �SCPs� in soft clay. Randolphet al. �1979� and Asaoka et al. �1994� concluded a significantincrease in strength of clays around driven piles or SCPs.
Laboratory oedometer tests showed that the coefficient of hy-draulic conductivity �kc� of soil–cement samples is typicallylower than the natural clays in one to several orders �Terashi andTanaka 1981�. Miura et al. �1998b� adopted a finite-elementmethod �FEM� to back-calculate the coefficient of hydraulic con-ductivity of DM columns in the field based on the dissipation ofexcess pore-water pressures after the DM column installation.They found that the coefficient of hydraulic conductivity of DMcolumns after the installation was approximately 100 times higherthan that of the coefficient of hydraulic conductivity of the clay.The higher back-calculated value of the coefficient of hydraulicconductivity of DM columns and the higher rate of consolidationin the surrounding soil can be explained by the fact that the ver-tical fractures in the surrounding soils provided drainage paths forthe excess pore-water pressure �Shen et al. 2003b�.
The drainage of water may also affect the distribution of watercontent in the surrounding clay. As discussed earlier and shown inFig. 4, the water content in the vicinity of the columns at35–43 days after the installation of columns was lower than theoriginal value and that at 1–3 days in the field test. A similarphenomenon was observed in the laboratory study �Shen et al.2003a�.
Strength Increase due to Chemical ProcessesDue to the difference of cation concentration between the col-umns and the surrounding clay, dissolved cations in the columnswould diffuse to the surrounding soil immediately after the instal-lation of columns �Rajasekaran and Rao 1997�. In addition, thecations can diffuse from the slurry-filled fractures to the surround-ing soil. With the presence of fractures, cations diffuse into thesoils faster than without the presence of fractures �Rowe andBooker 1991�. However, the effect of fractures on cation diffusionwas not discussed by Larsson and Kosche �2005�. The chemicaleffects on the strength of the surrounding soil are further eluci-dated below.
Diffusion of Cations
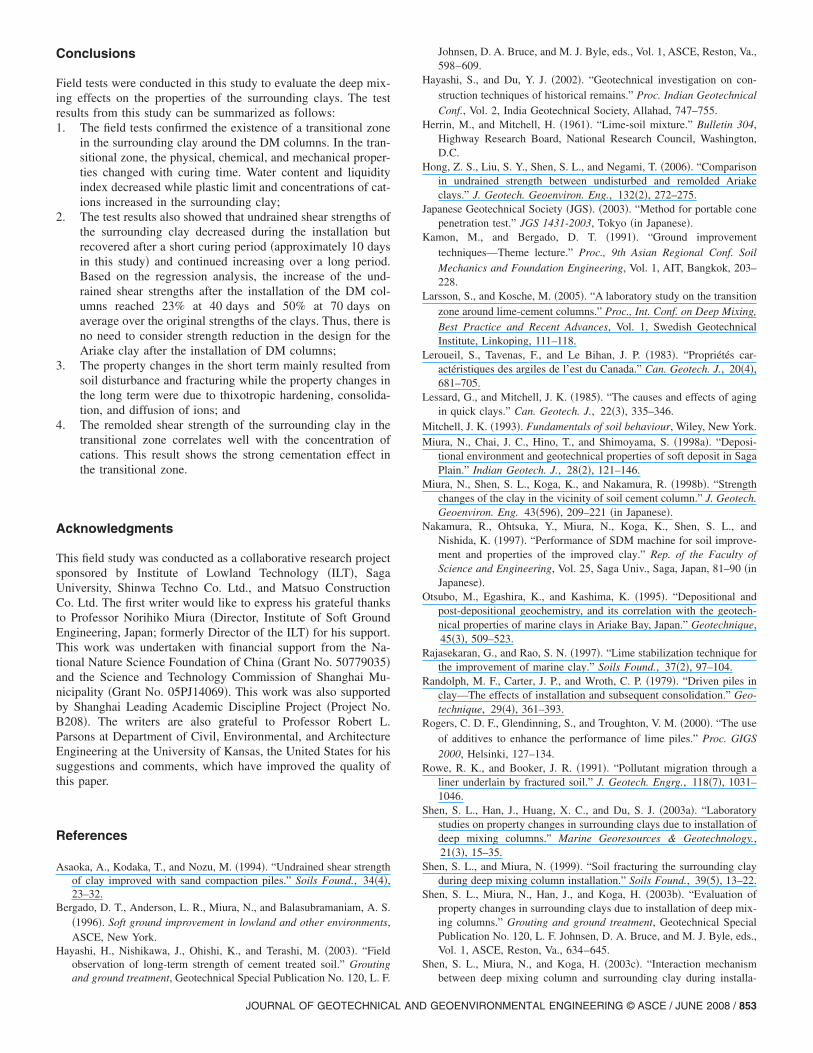
Laboratory tests showed that the strength of the clays around limecolumns and lime-cement columns increased in the transitionalzone due to the migration of calcium ions �Rajasekaran and Rao1997; Larsson and Kosche 2005�. Laboratory tests also showedthat the range of the transitional zone due to diffusion is indepen-dent of the installation method of columns, the binder composi-tion, and the additive �peptizer� �Larsson and Kosche 2005�. Fig.11 presents the variations of remolded shear strengths with the
concentrations of dissolved cations in the soils sampled from the852 / JOURNAL OF GEOTECHNICAL AND GEOENVIRONMENTAL ENGINE
field test at a depth of 0–8 m. The remolded shear strengths weredetermined by laboratory vane shear tests on the completely re-molded surrounding clay samples. As shown in Fig. 11, the re-molded shear strengths increased with the increase in theconcentrations of Fe3+ or total cations �the sum of Fe3+, Ca2+,Mg2+, Na+, and K+�. The increase of cation concentrations in thepore water of the surrounding soil was thought to be the result ofthe diffusion of cations from the DM columns and cation ex-change with the surrounding soils. Because the remolded shearstrengths were determined after the soil samples were completelyremolded, no thixotropic and consolidation effects existed exceptfor the effect of diffused cations. This result confirmed that thediffused cations had an effect on the soil strength.
The reason the diffused cations changed the remolded shearstrength of the surrounding soils is mainly because the readilyexchangeable monovalent cations �such as K+ and Na+� initiallyadsorbed on the clay particle surfaces were replaced with thetrivalent cations �such as Fe3+� and divalent cations �such as Ca2+
and Mg2+� from the DM columns into the surrounding soils. As aresult, the thickness of the diffused double layer of the surround-ing soil particles decreased and the plastic limit wP increased asshown in Fig. 6. These variations lead to the decrease in LI,especially for soils near the DM column as shown in Fig. 5. Thedecrease in LI resulted in an increase in the remolded shearstrength according to the relationship between LI and the re-molded shear strength Su proposed by Leroueil et al. �1983� asfollows:
Su =1
�LI − 0.21�2 �kPa� �2�
Because a longer time resulted in a larger amount of trivalentcations and divalent cations diffused from columns to the sur-rounding soils, the concentrations of trivalent cations and divalentcations increased with the elapsed time as shown in Fig. 8. Con-sequently, more readily exchangeable monovalent cations werereplaced from the clay particles and dissolved into the pore water.As a result, LI decreased with time and Su increased with anincrease in the concentrations of Fe3+, Ca2+, and Mg2+, and total
Fig. 11. Remolded shear strength of surrounding clay versus cationconcentration
cations as shown in Fig. 11.
ERING © ASCE / JUNE 2008
Conclusions
Field tests were conducted in this study to evaluate the deep mix-ing effects on the properties of the surrounding clays. The testresults from this study can be summarized as follows:1. The field tests confirmed the existence of a transitional zone
in the surrounding clay around the DM columns. In the tran-sitional zone, the physical, chemical, and mechanical proper-ties changed with curing time. Water content and liquidityindex decreased while plastic limit and concentrations of cat-ions increased in the surrounding clay;
2. The test results also showed that undrained shear strengths ofthe surrounding clay decreased during the installation butrecovered after a short curing period �approximately 10 daysin this study� and continued increasing over a long period.Based on the regression analysis, the increase of the und-rained shear strengths after the installation of the DM col-umns reached 23% at 40 days and 50% at 70 days onaverage over the original strengths of the clays. Thus, there isno need to consider strength reduction in the design for theAriake clay after the installation of DM columns;
3. The property changes in the short term mainly resulted fromsoil disturbance and fracturing while the property changes inthe long term were due to thixotropic hardening, consolida-tion, and diffusion of ions; and
4. The remolded shear strength of the surrounding clay in thetransitional zone correlates well with the concentration ofcations. This result shows the strong cementation effect inthe transitional zone.
Acknowledgments
This field study was conducted as a collaborative research projectsponsored by Institute of Lowland Technology �ILT�, SagaUniversity, Shinwa Techno Co. Ltd., and Matsuo ConstructionCo. Ltd. The first writer would like to express his grateful thanksto Professor Norihiko Miura �Director, Institute of Soft GroundEngineering, Japan; formerly Director of the ILT� for his support.This work was undertaken with financial support from the Na-tional Nature Science Foundation of China �Grant No. 50779035�and the Science and Technology Commission of Shanghai Mu-nicipality �Grant No. 05PJ14069�. This work was also supportedby Shanghai Leading Academic Discipline Project �Project No.B208�. The writers are also grateful to Professor Robert L.Parsons at Department of Civil, Environmental, and ArchitectureEngineering at the University of Kansas, the United States for hissuggestions and comments, which have improved the quality ofthis paper.
References
Asaoka, A., Kodaka, T., and Nozu, M. �1994�. “Undrained shear strengthof clay improved with sand compaction piles.” Soils Found., 34�4�,23–32.
Bergado, D. T., Anderson, L. R., Miura, N., and Balasubramaniam, A. S.�1996�. Soft ground improvement in lowland and other environments,ASCE, New York.
Hayashi, H., Nishikawa, J., Ohishi, K., and Terashi, M. �2003�. “Fieldobservation of long-term strength of cement treated soil.” Grouting
and ground treatment, Geotechnical Special Publication No. 120, L. F.JOURNAL OF GEOTECHNICAL AND
Johnsen, D. A. Bruce, and M. J. Byle, eds., Vol. 1, ASCE, Reston, Va.,598–609.
Hayashi, S., and Du, Y. J. �2002�. “Geotechnical investigation on con-struction techniques of historical remains.” Proc. Indian GeotechnicalConf., Vol. 2, India Geotechnical Society, Allahad, 747–755.
Herrin, M., and Mitchell, H. �1961�. “Lime-soil mixture.” Bulletin 304,Highway Research Board, National Research Council, Washington,D.C.
Hong, Z. S., Liu, S. Y., Shen, S. L., and Negami, T. �2006�. “Comparisonin undrained strength between undisturbed and remolded Ariakeclays.” J. Geotech. Geoenviron. Eng., 132�2�, 272–275.
Japanese Geotechnical Society �JGS�. �2003�. “Method for portable conepenetration test.” JGS 1431-2003, Tokyo �in Japanese�.
Kamon, M., and Bergado, D. T. �1991�. “Ground improvementtechniques—Theme lecture.” Proc., 9th Asian Regional Conf. SoilMechanics and Foundation Engineering, Vol. 1, AIT, Bangkok, 203–228.
Larsson, S., and Kosche, M. �2005�. “A laboratory study on the transitionzone around lime-cement columns.” Proc., Int. Conf. on Deep Mixing,Best Practice and Recent Advances, Vol. 1, Swedish GeotechnicalInstitute, Linkoping, 111–118.
Leroueil, S., Tavenas, F., and Le Bihan, J. P. �1983�. “Propriétés car-actéristiques des argiles de l’est du Canada.” Can. Geotech. J., 20�4�,681–705.
Lessard, G., and Mitchell, J. K. �1985�. “The causes and effects of agingin quick clays.” Can. Geotech. J., 22�3�, 335–346.
Mitchell, J. K. �1993�. Fundamentals of soil behaviour, Wiley, New York.Miura, N., Chai, J. C., Hino, T., and Shimoyama, S. �1998a�. “Deposi-
tional environment and geotechnical properties of soft deposit in SagaPlain.” Indian Geotech. J., 28�2�, 121–146.
Miura, N., Shen, S. L., Koga, K., and Nakamura, R. �1998b�. “Strengthchanges of the clay in the vicinity of soil cement column.” J. Geotech.Geoenviron. Eng. 43�596�, 209–221 �in Japanese�.
Nakamura, R., Ohtsuka, Y., Miura, N., Koga, K., Shen, S. L., andNishida, K. �1997�. “Performance of SDM machine for soil improve-ment and properties of the improved clay.” Rep. of the Faculty ofScience and Engineering, Vol. 25, Saga Univ., Saga, Japan, 81–90 �inJapanese�.
Otsubo, M., Egashira, K., and Kashima, K. �1995�. “Depositional andpost-depositional geochemistry, and its correlation with the geotech-nical properties of marine clays in Ariake Bay, Japan.” Geotechnique,45�3�, 509–523.
Rajasekaran, G., and Rao, S. N. �1997�. “Lime stabilization technique forthe improvement of marine clay.” Soils Found., 37�2�, 97–104.
Randolph, M. F., Carter, J. P., and Wroth, C. P. �1979�. “Driven piles inclay—The effects of installation and subsequent consolidation.” Geo-technique, 29�4�, 361–393.
Rogers, C. D. F., Glendinning, S., and Troughton, V. M. �2000�. “The useof additives to enhance the performance of lime piles.” Proc. GIGS2000, Helsinki, 127–134.
Rowe, R. K., and Booker, J. R. �1991�. “Pollutant migration through aliner underlain by fractured soil.” J. Geotech. Engrg., 118�7�, 1031–1046.
Shen, S. L., Han, J., Huang, X. C., and Du, S. J. �2003a�. “Laboratorystudies on property changes in surrounding clays due to installation ofdeep mixing columns.” Marine Georesources & Geotechnology.,21�3�, 15–35.
Shen, S. L., and Miura, N. �1999�. “Soil fracturing the surrounding clayduring deep mixing column installation.” Soils Found., 39�5�, 13–22.
Shen, S. L., Miura, N., Han, J., and Koga, H. �2003b�. “Evaluation ofproperty changes in surrounding clays due to installation of deep mix-ing columns.” Grouting and ground treatment, Geotechnical SpecialPublication No. 120, L. F. Johnsen, D. A. Bruce, and M. J. Byle, eds.,Vol. 1, ASCE, Reston, Va., 634–645.
Shen, S. L., Miura, N., and Koga, H. �2003c�. “Interaction mechanism
between deep mixing column and surrounding clay during installa-GEOENVIRONMENTAL ENGINEERING © ASCE / JUNE 2008 / 853

tion.” Can. Geotech. J., 40�2�, 293–307.Sverdrup, H. U., Johnson, M. W., and Fleming, R. H. �1942�. The oceans,
their physics, chemistry and general biology, Prentice-Hall, NewYork.
Takeo Office, The Ministry of Construction. �1996�. Research Rep. ofConstruction Countermeasures on Soft Clay Foundation of Raised
854 / JOURNAL OF GEOTECHNICAL AND GEOENVIRONMENTAL ENGINE
Dikes along Rokkaku River, Saga, Japan, 229 �in Japanese�.Terashi, M., and Tanaka, H. �1981�. “Ground improved by deep mixing
method.” Proc., 10th Int. Conf. Soil Mechanics and Foundation En-gineering, Vol. 2, ISSMFE, Stockholm, 777–780.
Waterways Experiment Station �WES�. �1948�. “Trafficability of soils.”Technical Memorandum No. 3-240, 1st Suppl., Vicksburg, Miss.
ERING © ASCE / JUNE 2008