Fundamentals of Spun Yarn Technology - eopcw
509
CRC PRESS Boca Raton London New York Washington, D.C. Carl A. Lawrence, Ph.D. SPUN YARN TECHNOLOGY FUNDAMENTALS of © 2003 by CRC Press LLC
-
Upload
khangminh22 -
Category
Documents
-
view
0 -
download
0
Transcript of Fundamentals of Spun Yarn Technology - eopcw

C.
.D.
Y
FUNDAMENTALS
CRC PR ESSBoca Raton London New York Washington, D.
Carl A. Lawrence, Ph
SPUN YARNTECHNOLOG
of
© 2003 by CRC Press LLC

This book contains information obtained from authentic and highly re
g
arded sources. Reprinted material
is quoted with permission, and sources are indicated.
A wide v
ariety of references are listed. Reasonable
ef
forts ha
v
e been made to publish reliable data and information, b
ut the author and the publisher cannot
assume responsibility for the v
alidity of all materials or for the consequences of their use.
The consent of CRC Press LLC does not e
xtend to cop
ying for general distrib
ution, for promotion, for
creating ne
w w
orks, or for resale. Specifi
c permission must be obtained in writing from CRC Press LLC
for such cop
ying.
Direct all inquiries to CRC Press LLC, 2000 N.W
. Corporate Blvd., Boca Raton, Florida 33431.
T
rademark Notice:
Product or corporate names may be trademarks or re
gistered trademarks, and are
used only for identifi
cation and e
xplanation, without intent to infringe.
Visit the CRC Press Web site at www.crcpress.com
© 2003 by CRC Press LLC
No claim to original U.S. Go
v
ernment w
orks
International Standard Book Number
1-56676-821-7
Library of Congress Card Number
2002034898
Printed in the United States of
America 1 2 3 4 5 6 7 8 9 0
Printed on acid-free paper
Library of Congress Cataloging-in-Publication Data
La
wrence, Carl
A.
Fundamentals of spun yarn technology / Carl
A. La
wrence.
p. cm.
Includes bibliographical references and inde
x.
ISBN
1-56676-821-7
(alk. paper)
1. Spun yarns.
2. Spun yarn industry
.
3.
T
e
xtile machinery
.
I.
T
itle.
TSI480.L39 2002
677
′
.02862—dc21
2002034898
CIP

© 2003 by CRC Press LLC
Dedication
to Mary

Preface
The fundamentals of spun-yarn technology are concerned with the production of yarns from fibers of discrete lengths and the structure-property relation of the spun yarns. Ever since humans moved from using the skins of hunted animals for clothing to farming and using farmed animal hairs and fibers from nonfood crops, and eventually to the manufacture of synthetic fibers, the spinning of yarns has been of importance to (initially) the craft and (subsequently) the science, design, and engi-neering of textiles.
This book is aimed at giving the reader a good background on the subject of the conversion of fibers into yarns, and an in-depth understanding of the principles of the various processes involved. It has become popular among some textile tech-nologists to view the subject area as yarn engineering, since there are various yarn structures that, with the blending of different fiber types, enable yarns to be con-structed to meet specific end uses. It is therefore necessary for the yarn engineer to have knowledge of the principal routes of material preparation and of the various modern spinning techniques. These topics are covered in this book. A distinction is made between the terms spinning method and spinning technique by referring to a technique as an implementation of a method, and thereby classifying the many techniques according to methods. The purpose is to try to get the reader to identify commonality between spinning systems, something that the author has found useful in carrying out research into new spinning techniques.
With any mass-produced product, one essential requirement is consistency of properties. For yarns, this starts with the chosen fiber to be spun. The yarn technol-ogist has to understand the importance of the various fiber properties used in spec-ifying raw materials, not just with regard to the relation of fiber properties to yarn properties, but especially with respect to the effect of fiber properties on processing performance and yarn quality. These aspects are given careful consideration in various chapters throughout the book. An understanding of the meaning yarn qualityis seen to be essential; therefore, some effort is devoted to explaining the factors that govern the concept of yarn quality.
Textile designers prefer to use the term yarn design rather than yarn engineering,since the emphasis is often on the aesthetics imparted to the end fabric as opposed to any technical function. Fancy or effect yarns, blends of dyed fibers of different colors, and the plying together of yarns are important topics in yarn design, and the principles and processes employed are described in this book.
The material presented is largely that delivered over many years of lecturing and is arranged to be suitable for readers who are new to the subject as well as those who are familiar with the technology and may wish to use this book as a reference source. A basic knowledge of physics and mathematics will be helpful to the reader, but is not essential, since a largely descriptive approach has been taken for the
© 2003 by CRC Press LLC

majority of the chapters. The few chapters that may be considered more mathemat-ically inclined present a more detailed consideration to a particular topic and should be easily understood by anyone who has studied physics and mathematics at the intermediate level.
Chapter 1 gives a suitable introduction to the subject area by outlining much of the basic concepts and discussing what technically constitutes a spun yarn. Chapters 2, 3, 5, 6, 7, and 9 should cover most topics studied by technology students up to graduate level, and Chapter 9 collates material that has been delivered as a module component largely to design students. Chapters 4 and 8, and some areas of Chapter 6 that deal with yarn structure-property relation, have been used as topics within a Masters-level module. Although, at the advanced level of study, programs are mainly based on current research findings, some areas of the earlier chapters may prove useful for conversion candidates.
Throughout the book, definitions are used, where appropriate, in an attempt to give the reader a snapshot of a particular technical point or topic, which is then explained in greater detail. It is said that a picture is worth a thousand words, and in dealing with technical concepts, this is a truism. The reader will find, therefore, that effort has been given to fully illustrating the substance of each chapter, and the author hopes that this makes the book a pleasant read for you.
© 2003 by CRC Press LLC

Author
Carl Lawrence, B.Sc. (Applied Physics), Ph.D., is Professor of Textile Engineering at the University of Leeds and was previously a Senior Lecturer at the University of Manchester Institute of Science and Technology. Before joining academia in 1981, he worked for 11 years in industrial R&D. Many of these years were with the former Shirley Institute, now the British Textile Technology Group (BTTG). In 2002, he was awarded The Textile Institute’s Warner Memorial Medal for his contributions to investigations in textile technology — in particular, unconventional spinning systems. He is the author of many research papers in the field of yarn manufacture and has several patents in the area of open-end spinning.
© 2003 by CRC Press LLC

Acknowledgments
I wish to express my appreciation to the many companies and individuals who gave me advice, encouragement, and assistance in completing this demanding but enjoy-able project. A special “thank you” to my research colleague and friend Dr. Moham-med Mahmoudhi for his time and effort in preparing the majority of the diagrams in this book.
The following companies provided me the opportunity to include many of the illustrations depicted, for which I am very grateful:
Andar ADM Group Ltd.Befama S.A.Crosrol Ltd.ECC Ltd.Fehrer AGFleissener GmbH & Co.Fratelli Mazoli & Co. SpA.Houget Duesberg BossonMarzoliMelliand Pneumatic Conveyors Ltd.Repco STRieter Machine Works Ltd. (Machinenfabrik Rieter)Rolando Macchine TessiliRolando-BeillaSaurer-Allma GmbHSavio Macchine Tessili SpA.Spindelfabrik SuessenThe Textile Institute (Journal of the Textile Institute)TRI (Textile Research Journal)Trutzschler GmbH & Co. KGW. Schlafhorst AG & Co.William Tatham Ltd.Zellweger UsterZinser
C. A. LawrenceUniversity of Leeds
© 2003 by CRC Press LLC

Table of ContentsChapter 1 Fundamentals of Yarns and Yarn Production1.1 Early History and Developments1.2 Yarn Classification and Structure
1.2.1 Classification of Yarns1.2.2 The Importance of Yarns in Fabrics1.2.3 A Simple Analysis of Yarn Structure
1.2.3.1 The Simple Helix Model1.3 Yarn Count Systems
1.3.1 Dimensions of a Yarn1.4 Twist and Twist Factor
1.4.1 Direction and Angle of Twist1.4.2 Twist Insertion, Real Twist, Twist Level, and False Twist
1.4.2.1 Insertion of Real Twist1.4.2.2 Twist Level1.4.2.3 Insertion of False Twist
1.4.3 Twist Multiplier/Twist Factor1.4.4 Twist Contraction/Retraction
1.5 Fiber Parallelism1.6 Principles of Yarn Production1.7 Raw Materials
1.7.1 The Global Fiber Market1.7.2 The Important Fiber Characteristics and Properties for Yarn
Production1.7.2.1 Cotton Fibers
1.7.2.1.1 Fiber Length (UHM)1.7.2.1.2 Length Uniformity Index (LUI)1.7.2.1.3 Fiber Strength1.7.2.1.4 Micronaire1.7.2.1.5 Color1.7.2.1.6 Preparation1.7.2.1.7 Leaf and Extraneous Matter (Trash)1.7.2.1.8 Stickiness1.7.2.1.9 Nep Content1.7.2.1.10 Short Fiber Content (SFC)
1.7.2.2 Wool Fibers1.7.2.2.1 Fineness1.7.2.2.2 Fiber Length Measurements1.7.2.2.3 Tensile Properties1.7.2.2.4 Color1.7.2.2.5 Vegetable Content, Grease, and Yield
© 2003 by CRC Press LLC

1.7.2.2.6 Crimp, Bulk, Lustre, Resilience1.7.2.2.7 Medullation
1.7.2.3 Speciality Hair Fibers1.7.2.3.1 Mohair1.7.2.3.2 Types of Fleeces1.7.2.3.3 Physical Properties1.7.2.3.4 Cashmere1.7.2.3.5 Physical Properties
1.7.2.4 Silk Fibers1.7.2.4.1 Waste Silk
1.7.2.5 Manufactured Fibers [Man-Made Fibers (MMFs)]1.7.2.5.1 Viscose Rayon and Lyocell1.7.2.5.2 Polyamide (Nylon)1.7.2.5.3 Polyester1.7.2.5.4 Acrylic1.7.2.5.5 Polypropylene
References
Appendix 1A Derivation of Equation for False-Twist Insertion1A.1 Twist Equation for Zone AX1A.2 Twist Equation for Zone XB
Appendix 1B Fiber Length Parameters1B.1 Staple Length1B.2 Fiber Length Distributions1B.3 CFD by Suter-Webb
Chapter 2 Materials Preparation Stage I: Opening, Cleaning, and Scouring2.1 Introduction2.2 Stage I: Opening and Cleaning
2.2.1 Mechanical Opening and Cleaning2.2.2 Striking from a Spike2.2.3 Beater and Feed Roller2.2.4 Use of Air Currents2.2.5 Estimation of the Effectiveness of Opening and Cleaning
Systems2.2.5.1 Intensity of Opening2.2.5.2 Openness Value2.2.5.3 Cleaning Efficiency
2.2.6 Wool Scouring2.2.7 Wool Carbonizing2.2.8 Tuft Blending
2.2.8.1 Basic Principles of Tuft Blending2.2.8.2 Tuft Blending Systems
2.2.9 Opening, Cleaning, and Blending SequenceReferences
© 2003 by CRC Press LLC

Appendix 2A LubricantsReference
Chapter 3 Materials Preparation Stage II: Fundamentals of the Carding Process
3.1 Introduction3.2 The Revolving Flat Card
3.2.1 The Chute Feed System3.2.2 The Taker-in Zone3.2.3 Cylinder Carding Zone3.2.4 Cylinder-Doffer Stripping Zone3.2.5 Sliver Formation3.2.6 Continuity of Fiber Mass Flow3.2.7 Drafts Equations3.2.8 Production Equation3.2.9 The Tandem Card
3.3 Worsted and Woolen Cards3.3.1 Hopper Feed3.3.2 Taker-in and Breast Section3.3.3 Intermediate Feed Section of the Woolen Card
3.3.3.1 Carding Section3.3.4 Burr Beater Cleaners and Crush Rollers3.3.5 Sliver and Slubbing Formation
3.3.5.1 Tape Condenser3.3.5.2 Ring-Doffer Condenser
3.3.6 Production Equations3.4 Sliver Quality
3.4.1 Cleaning Efficiency3.4.1.1 Short-Staple Carding3.4.1.2 Worsted and Woolen Carding
3.4.2 Nep Formation and Removal3.4.2.1 Nep Formation3.4.2.2 The Effect of Fiber Properties3.4.2.3 Effect of Machine Parameters3.4.2.4 Short Fiber Content
3.4.3 Sliver and Slubbing Regularity3.5 Autoleveling3.6 BackwashingReferencesRecommended Readings on the Measurement of Yarn Quality Parameters
Appendix 3A Card Clothing3A.1 Metallic Wires: Saw-Tooth Wire Clothing
3A.1.1 Tooth Depth3A.1.2 Tooth Angles3A.1.3 Point Density
© 2003 by CRC Press LLC

3A.1.4 Tooth Point Dimension3A.2 Front and Rear Fixed Flats3A.3 Wear of Card Clothing
Appendix 3B Condenser Tapes and Rub Aprons3B.1 Tape Threadings
3B.1.1 The Figure 8 Threading3B.1.2 Series Threading3B.1.3 Endless Threading
3B.2 Rubbing Aprons
Appendix 3C Minimum Irregularity and Index of Irregularity
Chapter 4 Carding Theory4.1 Opening of Fiber Mass
4.1.1 Taker-in Action4.1.2 Feed-Roller, Feed-Plate Systems
4.1.2.1 Feed-Roller Systems4.2 Carding Actions
4.2.1 Cylinder-Flat Action4.2.2 Swift-Worker-Stripper Action
4.3 Web Formation and Fiber Configuration4.3.1 Cylinder-Doffer Action
4.3.1.1 Fiber Configuration and Mechanism of Fiber Transfer
4.3.1.2 Effect of Machine Variables on Fiber Configuration4.3.1.3 Recycling Layer and Transfer Coefficient4.3.1.4 Factors that Determine the Transfer Coefficient, K4.3.1.5 The Importance of the Recycling Layer
4.3.2 Blending-Leveling Action4.3.2.1 Evening Actions of a Card
4.3.2.1.1 Step Change in Feed4.3.2.1.2 General or Random Irregularities4.3.2.1.3 Periodic Irregularities
4.4 Fiber Breakage4.4.1 Mechanism of Fiber Breakage4.4.2 State of Fiber Mass and Fiber Characteristics4.4.3 Effect Residual Grease and Added Lubrication4.4.4 Effect of Machine Parameters
4.4.4.1 Tooth Geometry4.4.4.2 Roller Surface Speed/Setting/Production Rate
4.4.4.2.1 The Taker-in Zone4.4.4.2.2 Effect of Cylinder-Flats and Swift-Worker
InteractionReferences
© 2003 by CRC Press LLC

Appendix 4A
Appendix 4B The Opening of a Fibrous Mass4B.1 Removal of Fibers when Both Ends are Embedded in the Fiber Mass4B.2 Behavior of a Single Fiber Struck by High-Speed Pins4B.3 Micro-Damage of Fibers Caused by the Opening ProcessReferences
Chapter 5 Materials Preparation Stage III5.1 Drawing
5.1.1 Principles of Doubling5.1.2 Principles of Roller Drafting
5.1.2.1 Ideal Drafting5.1.2.2 Actual Drafting
5.1.2.2.1 Effect of Input Material Characteristics5.1.2.2.2 Drafting Wave5.1.2.2.3 Observations of Floating Fiber Motion5.1.2.2.4 Drafting Force
5.1.2.3 Factors Influencing Drafting Wave Irregularity5.1.2.3.1 Size of Draft5.1.2.3.2 Input Count5.1.2.3.3 Doubling5.1.2.3.4 Fiber Straightness, Parallelism, Fineness,
and Length5.1.2.3.5 Roller Settings
5.1.3 Effect of Machine Defects5.1.3.1 Roller Eccentricity5.1.3.2 Roller Slip
5.1.4 The Drawing Operations5.1.4.1 The Drawframe5.1.4.2 The Gill Box
5.1.5 Production Equation5.2 Combing
5.2.1 The Principles of Rectilinear Combing5.2.1.1 Nasmith Comb
5.2.1.1.1 The Cylinder Comb5.2.1.1.2 The Feed Roller/Top and Bottom
Nipper Plates/Top Comb5.2.1.1.3 Detaching Rollers and Delivery Rollers5.2.1.1.4 The Combing Cycle
5.2.1.2 French Comb5.2.2 Production Equation5.2.3 Degrees of Combing5.2.4 Factors Affecting Noil Extraction
5.2.4.1 Comber Settings5.2.4.2 Preparation of Input Sliver
© 2003 by CRC Press LLC

5.3 Conversion of Tow to Sliver5.3.1 Cutting Converters5.3.2 Stretch-Breaking Converters5.3.3 Production Equation
5.4 Roving Production5.4.1 The Speed-Frame (Twisted Rovings)
5.4.1.1 Production Equation5.4.2 Rub Rovers (Twistless Rovings)
5.4.2.1 Production Equation5.5 Environmental Processing ConditionsReferences
Chapter 6 Yarn Formation Structure and Properties6.1 Spinning Systems
6.1.1 Ring and Traveler Spinning Systems6.1.1.1 Conventional Ring Spinning6.1.1.2 Spinning Tensions6.1.1.3 Twist Insertion and Bobbin Winding
6.1.1.3.1 Spinning End Breaks6.1.1.4 Compact Spinning and Solo Spinning6.1.1.5 Spun-Plied Spinning6.1.1.6 Key Points
6.1.1.6.1 Advantages6.1.1.6.2 Disadvantages
6.1.2 Open-End Spinning Systems6.1.2.1 OE Rotor Spinning
6.1.2.1.1 Twist Insertion6.1.2.1.2 End Breaks during Spinning
6.1.2.2 OE Friction Spinning6.1.3 Self-Twist Spinning System6.1.4 Wrap Spinning Systems
6.1.4.1 Surface Fiber Wrapping6.1.4.1.1 Dref-3 Friction Spinning6.1.4.1.2 Air-Jet Spinning6.1.4.1.3 Single- and Twin-Jet Systems: Murata
Vortex, Murata Twin Spinner, Suessen Plyfil
6.1.4.2 Filament Wrapping6.1.5 Twistless Spinning Systems
6.1.5.1 Continuous Felting: Periloc Process6.1.5.2 Adhesive Bonding: Bobtex Process
6.1.6 Core Spinning6.1.7 Doubling Principles
6.1.7.1 Down Twisting6.1.7.2 Two-for-One Twisting
6.1.8 Economic Considerations
© 2003 by CRC Press LLC

6.2 Yarn Structure and Properties6.2.1 Yarn Structure
6.2.1.1 Surface Characteristics and Geometry6.2.1.2 Fiber Migration and Helix Model of Yarn Structures
6.2.2 Formation of Spun Yarn Structures6.2.2.1 Conventional Ring-Spun Yarns
6.2.2.1.1 Mechanism of Fiber Migration6.2.2.2 Compact Ring-Spun Yarns6.2.2.3 Formation of Rotor Yarn Structure
6.2.2.3.1 Cyclic Aggregation6.2.2.3.2 Theory of Spun-in Fibers in Yarns
6.2.2.4 Formation of Friction-Spun Yarn Structures6.2.2.5 Formation of Wrap-Spun Yarn Structures
6.2.2.5.1 Air-Jet Spun Yarns6.2.2.5.2 Hollow-Spindle Wrap-Spun Yarns
6.2.3 Structure Property Relation of Yarns6.2.3.1 Compression6.2.3.2 Flexural Rigidity6.2.3.3 Tensile Properties
6.2.3.3.1 Effect of Twist6.2.3.3.2 Effect of Fiber Properties and Material
Preparation6.2.3.3.3 Fiber Blends6.2.3.3.4 Effect of Spinning Machine Variables
6.2.3.4 Irregularity Parameters6.2.3.4.1 Effect of Fiber Properties and Material
Preparation6.2.3.4.2 Effect of Spinning Machine Variables6.2.3.4.3 Yarn Blends6.2.3.4.4 The Ideal Blend
6.2.3.5 Hairiness Profile6.2.3.6 Moisture Transport6.2.3.7 Friction
6.3 Quality Criteria6.3.1 Post-Process Performance Criteria
6.3.1.1 Knitting6.3.1.2 Weaving6.3.1.3 Fabric Quality
References
Chapter 7 The Principles of Package Winding7.1 Basic Principles
7.1.1 Winding Parameters7.2 Types of Winding Machines
7.2.1 Drum-Winding Machines7.2.1.1 Wing Cam
© 2003 by CRC Press LLC

7.2.1.2 Grooved Drum7.2.1.3 Patterning/Ribboning7.2.1.4 Sloughing-Off7.2.1.5 Anti-patterning Devices
7.2.1.5.1 Variation of Traverse Frequency, Nt
7.2.1.5.2 Variation of Drum Speed, Nd
7.2.1.5.3 Lifting of Bobbin to Reduce Nb
7.2.1.5.4 Rock-and-Roll Method7.2.2 Precision Winding Machines7.2.3 Advantages and Disadvantages of the Two Methods of
Winding7.2.4 Combinational Methods for Pattern-Free Winding
7.2.4.1 Stepped Precision Winding (Digicone)7.2.4.2 Ribbon Free Random Winding
7.3 Random-Wound Cones7.3.1 Package Surface Speed7.3.2 Abrasion at the Nose of Cones7.3.3 Traverse Motions
7.4 Precision Open-Wound and Close-Wound Packages7.4.1 Theory of Close-Wound Packages7.4.2 Patterning or Ribboning7.4.3 Hard Edges7.4.4 Cobwebbing (Webbing or Stitching or Dropped Ends)7.4.5 Twist Displacement
7.5 Yarn Tensioning and Tension Control7.5.1 Characteristics of Yarn Tensioning Devices
7.5.1.1 The Dynamic Behavior of Yarns7.5.1.2 The Capstan Effect7.5.1.3 Multiplicative and Additive Effects7.5.1.4 Combination Tensioning Devices
7.6 Yarn Clearing7.7 Knotting and Splicing
7.7.1 Knotting7.7.2 Splicing
7.8 Yarn WaxingReferences
Chapter 8 Yarn Tensions and Balloon Geometry in Ring Spinning and Winding
8.1 Introduction8.1.1 Circularly Polarized Standing Waves
8.2 Yarn Tensions in Ring Spinning8.2.1 Yarn Formation Zone8.2.2 Winding Zone
8.2.2.1 Yarn Tensions in the Absence of Air Drag
© 2003 by CRC Press LLC

8.2.3 Balloon Zone8.2.3.1 Balloon Tension in the Absence of Air Drag8.2.3.2 Spinning Tension in the Absence of Air Drag
8.2.4 The Effect of Air Drag on Yarn Tensions8.3 Balloon Profiles in Ring Spinning
8.3.1 Balloon Profiles in the Absence of Air Drag8.3.2 The Balloon Profile in the Presence of Air Drag8.3.3 Determination of Ring Spinning Balloon Profiles Based on
Sinusoidal Waveforms8.3.4 Effect of Balloon Control Rings
8.4 Tensions and Balloon Profiles in the Winding Process8.4.1 Yarn Tensions during Unwinding from a Ring-Spinning
Package8.4.2 Unwinding Balloon Profiles
References
Chapter 9 Fancy Yarn Production9.1 Classification of Fancy Yarns9.2 Basic Principles9.3 Production Methods
9.3.1 Plying Techniques for the Production of Fancy Yarns9.3.1.1 The Profile Twisting Stage9.3.1.2 The Binding Stage9.3.1.3 The Plied Chenille Profile
9.3.2 Spinning Techniques for the Production of Fancy Yarns9.4 Design and Construction of the Basic Profiles
9.4.1 Spiral9.4.2 Gimp9.4.3 Loop9.4.4 Snarl9.4.5 Knop9.4.6 Cover9.4.7 Slub9.4.8 Chenille9.4.9 Combination of Profiles
9.5 Analysis of Fancy YarnsReferences
© 2003 by CRC Press LLC

Fundamentals of Yarns and Yarn Production
1.1 EARLY HISTORY AND DEVELOPMENTS
Although it has yet to be discovered precisely when man first began spinning fibers into yarns, there is much archaeological evidence to show that the skill was well practiced at least 8000 years ago. Certainly, the weaving of spun yarns was developed around 6000 B.C., when Neolithic man began to settle in permanent dwellings and to farm and domesticate animals. Both skills are known to predate pottery, which is traceable to circa 5000 B.C.
Man’s cultural history goes back about 10,000 to 12,000 years, when some tribes changed from being nomadic forager-hunters, who followed the natural migration of wild herds, to early farmers, domesticating animals and cultivating plants. It is very likely that wool was one of the first fibers to be spun, since archaeologists believe that sheep existed before Homo sapiens evolved. Sheep have been dated back to the early Pleistocene period, around 1 million years ago. The Scotch black-face and the Navajo sheep are present breeds thought to most closely resemble the primitive types. Domesticated sheep and goats date from circa 9000 B.C., grazing the uplands of north Iraq at Zam Chem Shanidar; from circa 7000 B.C., at Jarmo, in the Zagros Mountains of northwest Iran; and in Palestine and south Turkey from the seventh and sixth millennia B.C. Sheep were also kept at Bougras, in Syria, from circa 6000 B.C.
We can speculate that early man would have twisted a few fibers from a lock of wool into short lengths of yarn and then tied them together to make longer lengths. We call these staple-spun yarns, because the fibers used are generally referred to as staple fibers. Probably the yarn production would have been done by two people working together, one cleaning and spinning the wool, the other winding the yarn into a ball. As the various textile skills developed, the impetus for spinning continuous knotless lengths would have led to a stick being used, maybe first for winding up the yarn and then to twist and wind up longer lengths, thereby replacing the making of short lengths tied together and needing only one operative. This method of spinning a yarn using a dangling spindle or whorl was widely practiced for processing both animal and plant fibers. Seeds of domesticated flax (Linum usitassimum) and spindle
1
© 2003 by CRC Press LLC

whorls dating back to circa 6000 B.C. were found at Ramad, northern Syria, and also in Samarran villages (Tel-es Swan and Choga Mami) in north Iraq (dated circa 5000 B.C.). In Egypt, at Neolithic Kom, in Fayum, stone and pottery whorls of about 6000 B.C. have been discovered, while at the predynastic sites of Omari, near Cairo, and Abydos, both circa 5500 B.C., flax seeds, whorls, bone needles, cloth, and matting have been found.
Flax was probably the most common ancient plant fiber made into yarns, though hemp was also used. Although flax thread is mentioned in the Biblical records of Genesis and Exodus, its antiquity is even more ancient than the Bible. A burial couch found at Gorigion in ancient Phrygia and dated to be late eighth century B.C. contained twenty layers of linen and wool cloth, and fragments of hemp and mohair. Cotton, native to India, was utilized about 5000 years ago. Remnants of cotton fabric and string dating back to 3000 B.C. were found at archaeological sites in Indus in Sind (India). Many of these fibers were spun into yarns much finer than today’s modern machinery can produce. Egyptian mummy cloth was discovered that had 540 threads per inch in the width of the cloth. Fine-spun yarns, plied threads, and plain-weave tabby cloths and dyed garments, some showing darns, were also found in the Neolithic village of Catal Huyuk in southern Turkey.
The simple spindle continued as the only method of making yarns until around A.D. 1300, when the first spinning wheel was invented and was developed in Europe into “the great wheel” or “one-thread wheel.” The actual mechanization of spinning took place over the period 1738 to 1825 to meet the major rise in the demand for spun yarn resulting from the then-spectacular increase in weaving production rates with the invention of the flying shuttle (John Kay, 1733). Pairs of rollers were introduced to thin the fiber mass into a ribbon for twisting (Lewis Paul, 1738); spindles were grouped together to be operated by a single power source—the “water frame” (Richard Arkwright, 1769), the “spinning jenny” (James Hargreaves, 1764–1770) and the “mule” (Samuel Crompton) followed by the “self-acting mule” by Roberts (1825). In 1830, a new method of inserting twist, known as cap spinning, was invented in the U.S. by Danforth. In the early 1960s, this was superseded by the ring and traveler, or ring spinning, which, despite other subsequent later inventions, has remained the main commercial method and is now an almost fully automated process.
Today, yarn production is a highly advanced technology that facilitates the engineering of different yarn structures having specific properties for particular applications. End uses include not only garments for everyday use and household textiles and carpets but also sports clothing and fabrics for automotive interiors, aerospace, and medical and healthcare applications. A detailed understanding of how fiber properties and machine variables are employed to obtain yarn structures of appropriate properties is, therefore, an important objective in the study of spinning technology. In this chapter, we shall consider the basics for developing an under-standing of the process details described in the remaining chapters.
1.2 YARN CLASSIFICATION AND STRUCTURE
A good start to our study of staple-yarn manufacture is to consider the question, “What is a staple-spun yarn?”
© 2003 by CRC Press LLC

There are three ways of constructing an answer to this question:
• To present a classification of yarns• To look at the importance of yarns in fabrics• To analyze various yarn structures and identify their most common features
1.2.1 CLASSIFICATION OF YARNS
Table 1.1 shows that yarns may be classified into four main groups: continuous filament, staple spun, composite, and plied yarns.
These groups may be further subdivided, with the final column giving the commonly used names for particular yarns, and are based largely on the method or technique used to produce the yarn. Generally, a particular technique produces a yarn structure that differs from those of other techniques.
TABLE 1.1Yarn Classification
Group Sub-group Examples
Continuous filament yarns Untextured (flat) TwistedInterlacedTape
Textured False twistedStuffer box crimpedBi-componentAir-jet
Staple spun yarns Noneffect/plain(conventional)
Carded ring spunCombed ring spunWorstedSemi-worstedWoolen
Noneffect/plain(unconventional)
Rotor spunCompact-ring spunAir-jet spunFriction spunHollow-spindle wrap spunRepco
Fiber blend Blend of two or more fiber types comprising noneffect yarns
Effect/fancy Fancy twistedHollow-spindle fancy yarnSpun effects
Composite yarns Filament coreStaple core
Core spun (filament or staple fibers forming the core) and staple fibers as the sheath of a noneffect staple yarn
Folded/plied/doubled Filament staple Two or more yarns twisted together
© 2003 by CRC Press LLC

Continuous filament (CF) yarns are basically unbroken lengths of filaments, which include natural silk and filaments extruded from synthetic polymers (e.g., polyester, nylon, polypropylene, acrylics) and from modified natural polymers (e.g., viscose rayon). Such filaments are twisted or entangled to produce a CF yarn.
CF yarns can be subdivided into untextured (i.e., flat) and textured yarns. As Table 1.1 shows, CF textured yarns may be further separated into several types; the more commonly used are false-twist textured and air-jet textured yarns. For the former, extruded filaments are stretched, then simultaneously heated, twisted, and untwisted, and subsequently cooled to give each filament constituting the yarn a crimped shape and thereby a greater volume or bulk to the yarn (see Figure 1.1). Alternatively, groups of filaments forming the yarn can be fed at different speeds into a compressed-air stream (i.e., an air-jet), producing a profusion of entangled loops at the surface and along the yarn length. These processes are known as texturing or texturizing1,2 and form an area of technology that is outside the context of this book, so they will not be given further consideration. The actual principle of false-twisting is used in other processes and is explained in a later section.
Continuous filaments can be chopped into discrete lengths, comparable to the lengths of natural plant and animal fibers. Both manufactured fibers and natural fibers can be assembled and twisted together to form staple-spun yarns. Table 1.1 shows that this category of yarn can be subdivided into plain and fancy yarns. In terms of the quantity used, plain yarns are of more technological importance, and the chart indicates the wide range of differing types (i.e., structures) of plain yarn, and thus spinning techniques used to produce them. In the later chapters, we shall consider the production of both plain and fancy yarns. For the moment, we will confine our attention to plain yarns.
1.2.2 THE IMPORTANCE OF YARNS IN FABRICS
Textile fabrics cover a vast range of consumer and industrial products made from natural and synthetic fibers. Figure 1.2 illustrates that, to produce a fabric for a particular end use, the fiber type has first to be chosen and then spun into a yarn
Untextured False Twist Textured Air-jet Textured
(single filament)
10 m
m
FIGURE 1.1 Continuous filament yarns.
© 2003 by CRC Press LLC

structure of specified properties so that the subsequent woven or knitted structure give the desired fabric aesthetics and/or technical performance.
Textile fabrics are also made by means other than knitting and weaving, which may just involve bonding fibers or filaments together without the need of converting them into yarns. Although such nonwoven fabrics are an important area of textile manufacturing, especially for technical and industrial end uses, they have limited application in the consumer sector. It is reasonable, then, to say that, second only to fibers from which yarns are made, yarns are the basic building blocks of most textile fabrics. Many required fabric properties will, in addition to the fiber properties and the fabric structure, depend on the structure and properties of the constituent yarns. Therefore, in the study of yarn manufacture, we need to determine not only how yarns are made but also how to get the required properties for particular end uses. To achieve these two goals, we must first establish the factors that characterize a yarn.
1.2.3 A SIMPLE ANALYSIS OF YARN STRUCTURE
In Chapter 6, we will consider in detail the various yarn structures. Here, a simple analysis is given so as to answer our question, “What is a staple-spun yarn?”
BASIC SEQUENCE TO GARMENTS
Spinning
CHOICE OF FIBER
(Natural, Manmade, or Blends)Criteria: Softness, Easy Care, etc.
YARN STRUCTURE
(Plain, Fancy, Plied)
FABRIC STRUCTURE
(Weave: Plain, Twill, etc.)(Knit: Single or Double Jersey, etc.)
Finished Fabric(Cotton, Worsted, Woolen, etc.)
Fully Fashioned
GARMENT PRODUCTION
FIGURE 1.2 Production chain.
© 2003 by CRC Press LLC

Figure 1.3 shows highly magnified photographic images of a twisted filament yarn structure and a typical staple-spun yarn structure (ring-spun yarn).
The following three characteristics are evident:
1. A linear assembly of fibers. The assembly could be of any thickness2. The fibers are held together by twist. However, other means may be used
to achieve cohesion3. There is a tendency for fibers to lie in parallel along the twist spiral.
From these three characteristics, we can now answer the question, “What is a staple-spun yarn?” with the following definition:
A staple-spun yarn is a linear assembly of fibers, held together, usually by the insertion of twist, to form a continuous strand, small in cross section but of any specified length; it is used for interlacing in processes such as knitting, weaving, and sewing.
The reader should note that there are several other definitions,3,4 but these are more general, covering filament as well as staple-spun yarns.
1.2.3.1 The Simple Helix Model
Based on the three common characteristics, a simplified model can be constructed to represent yarns in which filaments or fibers are held together by twist, i.e., twisted yarns. Table 1.2 lists the assumptions that are made to construct the model.
The manner in which fibers are packed together in the yarn cross section is important to the effect of frictional contact between fibers on yarn properties. If fibers are loosely packed so that they can move about in the interstitial space, the yarn will appear bulkier and with a larger diameter than if fibers are closely packed. Two types of packing have therefore been proposed:5 close packing, which gives a hexagonal arrangement of the fibers in the yarn cross section, and open packing, where the fibers are considered to be arranged in concentric circles of increasing radii. The basic helix model assumes an open packing configuration. Figure 1.4 depicts the geometry of the model, and the equations in Table 1.2 give the relations between the model parameters.
FIGURE 1.3 Scanning electron micrograph of continuous filament and ring spun yarnstructure: polyester continuous filament yarn (above) and ring spun yarn (below).
© 2003 by CRC Press LLC

We must consider several important limitations to the basic model.
• Many fibers do not have circular cross sections. Furthermore, when fibers of circular cross sections are inclined at a helix angle of twist, they appear elliptical in the yarn cross section 90° to the yarn axis. Thus, only the circular fiber on the yarn axis strictly meets this assumption. Nevertheless, fiber diameters are sufficiently small, and generally tend sufficiently toward circular, for the model to remain useful.
• In the yarn cross section, the concentric circular layers are filled with fibers in contact with each other. Therefore, if there are N layers compris-ing the yarn, then the arithmetic sum of the number, m, of fibers in each layer should equal the total amount of fibers in the yarn cross section. This, however, is not always so, and the outer layer then becomes partially filled. The result is that the yarn radius, R, is ill defined. In practice, there are many fibers in the cross sections of yarns and correspondingly many circular layers, each only the thickness of one fiber — a few microns in diameter. Thus, a partially filled outer layer may not give too great an error.
• The model does not take into account the projection of fiber ends from the yarn surface (termed yarn hairiness) or the relative positions of fiber ends within the body of a spun yarn. The projection of fiber ends from the yarn surface suggests that fiber lengths must move across layers for their ends to become hairs. Fibers at the yarn surface must have part of their lengths within the body of the yarn; otherwise, the yarn would not
TABLE 1.2Assumptions and Geometrical Relations for Helix Yarn Model
Assumptions for helical structure with open packing of constituent fibers
Geometrical equations defining the helix model
• Yarn composed of a large number of fibers• The yarn structure consists of a central fiber lying
straight along the yarn axis and surrounded by successive, concentric cylindrical layers of fibers of increasing radii.
• The fibers in each layer are helically twisted around preceding layers.
• The helix angle of twist gradually increases with radius from 0deg. for the central fiber to α for the surface fibers.
• All fibers in a given layer have the same helix angle of twist
• By convention the yarn twist angle is α• The turns per unit length is constant throughout yarn• The fiber packing density is constant throughout the yarn• A 90-degree cross section to the yarn axis shows the
yarn and fibers to be circular and the fiber cross sections lying in filled concentric circular layers.
h = t –1 (1.1)
I2 = h2 + 4πr2 (1.2)
L2 = h2 + 4πR2 (1.3)
tan θ = (1.4)
tan α = (1.5)
R = (2n – 1)rf (1.6)
m = (1.7)
where n = nth fiber layer, m = the number of fibers in the nth layer, and the remaining parameters are defined by Fig. 1.4
2πrh
---------
2πRh
----------
180
sin 1– 12 n 1–( )--------------------
-------------------------------------
© 2003 by CRC Press LLC

hold together. The fibers of a yarn are therefore interlaced. The interlacing of fibers is called migration and is further described in Chapter 6. Migra-tion enables the frictional contact between fibers to resist fiber ends slipping past each other. When compared with Figure 1.3, the model is clearly more appropriate for continuous filament yarns. It can be assumed, however, that, under applied axial loads, where overlapping fiber ends have sufficient frictional contact because of migration and twist, such sections of a staple yarn will approximate the behavior of a continuous filament yarn, and, where insufficient, the ends will slip past each other. Hence, by introducing the idea of slippage of overlapping fiber ends, the model can be used to interpret the effect on yarn properties of important geometrical parameters such as twist.
1.3 YARN COUNT SYSTEMS
1.3.1 DIMENSIONS OF A YARN
Let us now consider in more detail the three common characteristics deduced from Figure 1.4. First, the idea of a linear assembly of fibers raises the question of how
FIGURE 1.4 Simple helix model of a yarn with open packing fiber arrangement.
© 2003 by CRC Press LLC

the dimensions of yarns are expressed. In specifying the thickness of a yarn, we could refer to its diameter or radius as in the above model. This, however, is not a straightforward parameter to measure. Clearly, we would need to assume that the yarn is circular. Then, if it were to be measured on a linear scale, we can see from Figure 1.3 that consideration must be given to whether yarn hairiness is included in the measurement.
Straightening the yarn length to measure the diameter involves tensioning the yarn, which also narrows the cross section by bringing fibers into closer contact and increasing the packing density. Although there are test methods6 for yarn diameter measurements that attempt to circumvent these difficulties, they are not appropriate for use in the commercial production of yarns. Also, in spinning yarns, there is no direct relationship between spinning variables and yarn diameter, so it is not the practice to set up a spinning machine to produce a specified yarn diameter. A more useful and practical measure that indirectly gives an indication of yarn thickness is a parameter that is termed the yarn count or yarn number.
The yarn count is a number giving a measure of the yarn linear density. The linear density is defined as the mass per unit length. In Système International (SI)units, the mass is in grams, and the unit length is meters. In textiles, a longer length is used for greater meaningful measurements, since this would average the small, random, mass variations along the length that are characteristic of spun yarns. There are two systems by which the count is expressed, as described below.
• Direct system. This expresses the count as the mass of a standard length. The mass is measured in grams, and the specific length is either 1 km or 9 km.
• Indirect system. This gives the length that weighs a standard mass. The standard mass is either 1 kg or 1 lb, and the associated length is, respec-tively, in meters or yards.
Usually, thousands of meters of a yarn are required to weigh 1 kg and, similarly, thousands of yards to weigh 1 lb. This makes measurements and calculations cum-bersome. To circumvent any such awkwardness, a standard length is used. The standard length can be 1 km, 840 yd, 560 yd, or 250 yd. The standard lengths in yards are commonly called hanks, or some cases skeins. Thus, we can now say that the indirect system gives the number of kilometers that weigh a kilogram (metric units) or the number of hanks that weigh one pound (English Imperial units). The type of hank being referred to depends on the type of yarn or, more correctly, the manufacturing route used to produce the yarn. For carded and combed ring spun yarns, an 840-yd hank is used; a 560-yd hank is associated with worsted and semi-worsted yarns, and a 256-yd hank with woolen yarns. Generally, cotton fibers are made by the carded and combed ring spun yarn routes, and synthetic fibers of similar lengths to cotton are made by the carded ring spun route, whereas wool and similar lengths synthetics are processed by the worsted, semi-worsted and woolen routes. With respect to the unconventional processes, if a fiber type spun by any of these systems can be also spun by one of the conventional systems, the hank associated with that conventional route is used. For example, the production of rotor spun yarns
© 2003 by CRC Press LLC

is usually from cotton and synthetic fibers of cotton lengths, and the 840-yd hank is therefore used. Repco yarns can be made of wool or synthetic fibers of wool lengths, and the 560-yd hank is the applicable standard length.
Table 1.3 summarizes the most commonly used units of count for the direct and indirect systems. A more comprehensive list can be found in a publication by The Textile Institute, “Textile Terms and Definitions,”4 and a number of the references cited at the end of this chapter give a brief account of the historical origins of several units of the indirect system.
Although all the units of count in Table 1.3 are used in practice, we shall use only the tex throughout the remaining chapters of this book. The table gives the conversion factors in relation to tex. A clear advantage of the tex is that we can refer to multiples and decimal fractions of the tex in terms of the base 10 scale. Thus, 1000 tex = 1 kilotex (ktex), 0.1 tex = decitex (dtex), and 0.001 tex = millitex (mtex). In this way, the tex unit can be used for fibers and yarns. Hence, if we have a yarn of 100 tex spun from fiber of 1 dtex (0.1 tex), we can estimate the number of fibers in the yarn cross section to be 1000. A 50-tex yarn should be half the size of a 100-tex, requiring only 500 fibers in its cross section. It is the practice to refer to the dtex of a fiber as the fiber fineness; the denier (den) is also used to express fiber fineness. A fiber fineness of 1.5 den is therefore equivalent to 1.7 dtex.
Two or more yarns may be twisted together to make a coarser yarn. Using the tex unit of count, the resultant yarn count would be the sum of the individual counts or, if yarns of the same count are twisted together, the product of the number yarns and the count. The process of twisting yarns together is generally known as plying, folding, or simply twisting, and the resulting yarns as plied or folded yarns. The term doubling is also used when two yarns of the same count are plied, and the
TABLE 1.3Systems for Yarn Count
Unit of count Symbol
Abbreviation for unit
Standard mass unit
Standard length unit
Equivalent tex
Direct SystemTex Tt tex gram 1 km 1Decitex dtex gram 10 km 0.1Millitex mtex gram 1000 km 0.001Kilotex ktex gram 1 m 1000Denier den gram 9 km 0.1111
Indirect SystemCotton (English) Nec cc (cotton count) 1 lb 840 yd
(1 hank)590.5
Metric Nm 1 kg 1 km 1000Worsted (English) New 1 lb 560 yd 885.8Woolen (Yorkshire, UK)
Ny 1 lb 256 yd(1 skein)
l938
© 2003 by CRC Press LLC

plied yarn is then called a doubled yarn. Assume that two 50-tex yarns are doubled; the resultant yarn count would be 100-tex yarn. However, the doubled yarn (i.e., the two-ply yarn or twofold yarn) may be written as R100/2 tex or just 2/50 tex — meaning a two-50 tex plied yarn. The R denotes resultant count, and the /2 signifies twofold. If we let N yarns of the same count, X, be plied, then the plied yarn would be written as N/X tex and termed an N ply.
Figure 1.5 illustrates the wide count range for the various end uses of filament and staple yarns. Besides the very fine yarn count range of 2 to 7.5 tex for hosiery, staple fiber and continuous filament yarns have quite similar market areas, where the fine to medium yarn counts, 7.5 to 40 tex, are largely used to make textiles for
Semiindustrial Yarns: Bags, Sport Articles, etc.
CarpetYarns
Filament Yarns
Staple Spun Yarns
Furnishing Fabrics,Terry Goods,Denim, CarpetYarns
CoarseYarns(> 40 tex)
SuperFine Yarns(7.5–2 tex)
Medium To FineYarns(40–16 tex)
Fine Yarns(16–7.5 tex)
Workwear
Leisure and Sportswear
Home Textiles and Woven Goods
Upholstery
Industrial Yarns: Tire Cords,Safety Belts, Airbags,Conveyor Belts, Ropes
Clothing: Shirts,Blouses, Leisureand Sportswear,etc.
Hosiery
Shirts/Blouses
Nightwear/Underwear
Ticking/Poplin Sewing
FIGURE 1.5 Count range of product areas for continuous filament and staple spun yarns.
© 2003 by CRC Press LLC

apparel. Spun staple yarns hold a principal position in the market for shirts, blouses, home textiles, bed linen, trousers, suits, and so on. Filament yarns are highly competitive in the carpet-yarn and sportswear sectors and in the industrial yarn area for technical textiles.
When yarn is sold to a weaver or knitter, one of the buyer’s fundamental concerns is the length of yarn that gives a specified number of grams per square meter (g/m2). The count system enables the meterage of yarns wound onto bobbins to be sold in terms of the yarn mass of the formed package.
After giving some thought to the tex unit, the reader should see that the use of count as an indication of yarn thickness does not take account of the issue of differing fiber densities when comparing the size of yarns spun from different fiber types. At times, the bulkiness (i.e., voluminosity) of the yarn is of interest, and then yarn diameter can either be measured or the equivalent diameter, dy , can be calculated.
With reference to the yarn helix model, the yarn diameter is related to the count as follows:
(1.8)
where δy = the specific volume in g/m3
Tt and δy can be measured,7 and dy can be calculated.
1.4 TWIST AND TWIST FACTOR
Let us now consider the second of the three identified common characteristics, that of twist. The following four parameters are of importance when discussing twist in yarns:
1. Direction of twist2. Twist angle3. Twist level (degree of twist)4. Twist multiplier
The terms real twist and false twist need also to be explained.
1.4.1 DIRECTION AND ANGLE OF TWIST
From the simple geometrical model of a yarn, the spiral direction and angle of the surface helix, representing the yarn surface fibers, are by convention the direction and twist angle of the yarn. In Figure 1.4, the yarn twist angle is α. Looking along the axis of the model, the helix has a clockwise direction. The spiral direction of a helix may be made counterclockwise. The diagonal of the clockwise spiral conforms to the diagonal of the letter Z, and an counterclockwise spiral to the letter S. Thus, the directions of twist are referred to as either Z or S. When making microscopic
T t1000πdy
2
4δy
---------------------=
© 2003 by CRC Press LLC

observations of yarns. Matching the inclination of the surface fibers to the center portions of the letters Z and S will determine if the yarn is S-twisted or Z-twisted, and the angle of inclination to the yarn axis would be the twist angle α. In Figure 1.3, the CF yarn is S-twisted with a twist angle α = 30°, whereas the ring-spun yarn is Z twisted and α = 20°.
1.4.2 TWIST INSERTION, REAL TWIST, TWIST LEVEL, AND FALSE TWIST
1.4.2.1 Insertion of Real Twist
The simplest way to insert twist into a strand of fibers (or filaments) is to hold one end (or part) of the strand while the strand length (or the length of the remaining part) is made to rotate on its axis. Figure 1.6a illustrates this. The strand is nipped at point A between a pair of stationary rollers while the end, B, is turned to cause rotation of the strand on its own axis. The first rotation of the strand will cause the fibers (or filaments) to adopt a helical form, and each subsequent rotation will increase the number of spirals of the helical form and the helix angle, i.e., the number of turns of twist and the twist angle. Figure 1.6b shows an alternative situation in which B is now attached to a bobbin placed on a rotating spindle, and A is still nipped by the rollers, but the length AB is made to bend through the angle β at M. The nipped point A is in line with the spindle axis of rotation. As the spindle rotates, the length BM is made to rotate with the spindle, and M circulates the spindle axis. Each rotation (circulation) of M will cause the strand to also rotate on its own axis, thereby inserting twist. The twist will initially appear in AM and, if unrestricted at M, propagate through to B. In both situations, the twist inserted
DeliveryRollers
TwistedFilamentStrand
RotatingBobbinMounted OnSpindle
(Angle Of Bend = β)
Vd
Ns
MB
A
(b)
ClockwiseRotation
ClockwiseRotation
TwistingDevice
A
B
(a)
TwistedFilamentStrand
FIGURE 1.6 Real twist insertion.
© 2003 by CRC Press LLC

will remain in the strand and is therefore called real twist. If Y is the number of rotations of M, then the twist per unit length inserted into the strand would be equal to Y divided by AB. Thus, if Y = 100 and AB = 10 cm, the twist inserted would be 10 turns per centimeter.
Consider now the dynamic situation of Figure 1.6b, when the rollers are deliv-ering the strand to the twisting zone at a delivery speed, Vd, of, say, 20 m/min. In this situation, if the bend M is made to circulate the spindle axis at a rotational speed, Ns, then the twist inserted would be given by the general formula,
where t = inserted twist (tpm)Ns = rotational speed of the twisting device (rpm)Vd = yarn delivery speed (m/min)
If the speed of M is 10,000 rpm, the twist inserted into the strand would be 500 turns per meter or 5 turns per centimeter. If Vd were to be increased to 40 m/min and the twist per unit length kept constant, then the twisting rate would have been doubled, i.e., Ns increased to 20,000 rpm.
The rotation speed of M should actually be slightly lower than that of the spindle so that the filament strand can be wound onto the bobbin at the delivery speed Vd. Some means would be also needed to make the yarn traverse up and down the length of the bobbin on the spindle during winding. This method of twist insertion combined with winding is used in a commercial process known as ring spinning, which is described in detail in Chapter 6.
1.4.2.2 Twist Level
The twist level (or degree of twist) in a yarn is the number of turns of twist per unit length. In Imperial units, we refer to the turns per inch (tpi), whereas, in metric and SI units, we speak of turns per meter (tpm), although turns per centimeter (tpcm) is also used. Turns per meter will be used throughout the remaining chapters.
1.4.2.3 Insertion of False Twist
Figure 1.7 shows a situation where a strand of filaments, nipped by two pairs of rollers at A and B, is driven at a linear speed of Vd m/min while being twisted at a rate of Ns rpm at some point X along the length spanning the distance between the two sets of rollers. If the twisting device is rotating in the direction shown, it will appear to be turning clockwise when viewed along the length AX, and counterclock-wise when viewed along BX. Thus, at the start of twisting, Z-twist will be inserted in the strand as it passes through the AX zone, and S-twist is inserted as it moves through the XB zone. As time passes, the Z-twist in the strand length passing through the AX zone will increase to a constant value of Ns/Vd. In zone XB, S-twist initially will be present in the yarn length passing through the zone; it will increase to a
t Ns/V d=
© 2003 by CRC Press LLC

maximum value and then decrease to zero. This is because each length of strand moving from zone AX into zone XB will become untwisted by the counterclockwise torque that is present as it enters zone XB. A derivation of the equations for Z and S twist as function of time is given in Appendix 1A.
The time over which the Z-twist builds up to its constant value and the S-twist increases and then decreases to zero may be termed the transient period. At the end of this period, the system is said to be in dynamic equilibrium. Z-twist will be observed in the AX zone and no twist will be seen the XB zone. This twisting action is called false-twisting because, under dynamic equilibrium, the strand, although being twisted, has no twist when it leaves the twisting device. A number of spinning systems employ the false-twisting action for producing yarns, and these are also described in Chapter 6.
1.4.3 TWIST MULTIPLIER/TWIST FACTOR
The twist angle α has an important influence on yarn properties, as is explained in Chapter 6. It can be seen from the equations defining the yarn helix model that the twist angle is related to the twist level, t, according to
(1.9)
Substituting for d from Equation 1.8,
Rearranging,
(1.10)
A
B
Z-Twist
S-TwistX
Z-Twist
S-TwistNoTwist
Time
Vd
Ns
Vd
Ns
Z-Twist =NsVd
FIGURE 1.7 False-twist insertion.
tan α πdt=
αtan tπT t4δy
1000-----------------
12---
=
TM t T t
12---
=
© 2003 by CRC Press LLC

where
and is called the twist multiple (TM), expressed in turns m–1 tex1/2.With regard to the indirect system of count, Table 1.4 gives the corresponding
equations for the Imperial and metric units. Note that, with the former, we refer to the twist factor (TF) and, for the latter, alpha metric (αM).
If there is a change of count but the twist angle, and therefore the twist multiple, is to remain unchanged, then Equation 1.10 would be used to calculate the required new level of twist. For example, with a 25-tex yarn spun at a twist multiplier of 4000 m–1 tex1/2, the twist inserted would be 800 tpm. Spinning 16-tex and 64-tex yarns with the same TM would require 1000 tpm and 500 tpm, respectively. In practice, different ranges of twist multiples are used in spinning yarns for particular end uses, and Table 1.5 gives examples of the TM range of yarns for knitting and weaving.
As indicated in the table, short fibers require a greater level of twist than longer fibers so as to hold together to form a yarn of useful strength. The level of twist in
TABLE 1.4Twist Multiples/Twist Factors
System Equation
English Imperial (twist factor, TF) TF = , where t is the twist in turns per inch (tpi)
Metric (alpha metric, αM) αM = , where t is the twist in turns per meter (tpm)
TABLE 1.5TM, TF, and αMValues for Knitting and Weaving
Spinning system End use Twist multiple (TM)
Cottons (staple length < 25mm)Blends with man-made fibers
Weaving,a warp yarnsWeaving, weft yarns
3800–48003170–3650
Cottons (staple length > 25 mm)Blends with man-made fibers
Weaving, warp yarnsHosiery
2400–28602050–2550
Wool and blends with man-made fibers Weaving, warp yarnsWeaving, weft yarnsHosieryb
2050–24001750–20501420–1750
a. Warp yarns run the length of woven cloth; weft yarns run across the warp.b. Knitted fabrics and goods made up of them.
TM αtan
π4δy/1000( )[ ]1 2⁄------------------------------------------=
t Nec⁄
t Nm⁄
© 2003 by CRC Press LLC

a yarn has a strong influence on the yarn properties — in particular, strength, hairiness, and bulk. In weaving, warp yarns require more twist than weft yarns, because they need to be of a higher strength and lower hairiness to withstand the tensions and frictional forces of shedding. The lower twist gives weft yarns greater bulk, which is imparted to the fabric. Knitted fabrics are generally required to have good bulk and softness; consequently, hosiery yarns have the lowest twist levels. A yarn with a high twist level is often referred to as lean and is not suitable for knitwear.
1.4.4 TWIST CONTRACTION/RETRACTION
The insertion of twist gives a small increase in count, referred to as twist contraction.In Figure 1.4, the simple helix model, if we compared fiber lengths within a yarn length having one turn of twist, we would find that all but the fiber length on the central axis would be longer than the yarn length. That is to say, from the figure, L> l > h. This can be viewed as contraction of the fiber lengths, where h is the contracted length compared with L and l. If we imagine cutting a length h from the yarn and then untwisting it to straighten all the fibers, then L and l would be the untwisted length. It should be clear that the count of the untwisted length will be lower than the twisted length; hence, twist contraction. As the straightened fiber lengths will vary, increasing from h at the yarn axis to L at the surface, the untwisted yarn length is taken as the mean of the straightened fiber lengths.5
Letting Lm be the mean untwisted length, we can define the magnitude of length change in two ways.
1. Contraction,
2. Retraction,
Substituting for Lm,
Thus, by determining the twist angle, the level of twist contraction can be calcu-lated.
CyMean untwisted length
Twisted yarn length-------------------------------------------------------
Lm
h------= =
RyMean untwisted length – Twisted yarn length
Twisted yarn length-------------------------------------------------------------------------------------------------------------
Lm h–h
---------------= =
Lm12---h α 1+sec[ ]=
Cy12--- α 1+sec[ ] and Ry
α 1–sec( )α 1+sec( )
--------------------------= =
© 2003 by CRC Press LLC

1.5 FIBER PARALLELISM
The third common structural feature of yarns is the tendency for fibers to lie in a parallel manner. When twist is present in the yarn, the fiber parallelism is along the twist direction (see Figure 1.3). We will see, in Chapters 5 and 6, that this orderly arrangement of fibers and therefore the level or degree of fiber parallelism varies between yarn types, some showing some significant randomness. Important to the degree of fiber parallelism is fiber shape or configuration within the yarn. Where almost all the fibers have their full lengths following the twist helix, as depicted in the Figure 1.3, there is a high degree of parallelism. The presence of looped, hooked, and folded fiber configurations and of fibers lying at different twist angles within a fiber layer would significantly reduce the degree of parallelism.
The orderly arrangement of fibers in a yarn strongly influences yarn properties and, for the majority of yarns, is dependent on the mechanical actions utilized in processing the fibers up to the point of inserting twist to form the yarn structure. It is therefore appropriate to now describe these basic mechanical actions and their influence on parallelism prior to considering, in the following chapters, the detailed operating principles of the machinery used.
1.6 PRINCIPLES OF YARN PRODUCTION
It can be reasoned that to obtain a high degree of fiber parallelism in a yarn, the fibers must be already straight and parallel in the fiber assembly presented for consolidation by twist or some other means. Figure 1.8 shows the process sequence for the manufacture of the more common types of staple-spun yarn.
When fibers are first purchased for conversion to yarns, they are usually obtained in large fiber bales. At this stage, the fibrous mass is referred to as the raw material; some raw material may be waste for recycling. In the raw material state, fibers have no definite orientation or configuration. A high proportion will be entangled and, in the case of natural fibers like cotton and wool, dirt and vegetable particles and other impurities (e.t., grease) will be present. The first stage in a yarn production process is therefore the cleaning and disentangling of the raw material. Where grease has to be removed, the material is scoured. The disentangling of the fiber mass occurs progressively using pin or saw-tooth wire-covered rollers. The earlier stages are collectively referred to as opening and cleaning, since, as the compressed fiber mass is opened up, solid impurities are released to become waste. The final stage of disentanglement is called carding, where the fiber mass is separated into individual fibers that are collected together to form a twistless rope termed a card sliver. Because of the carding process, the fiber orientation is very close to the sliver axis; therefore, carding may be considered as the start of the parallel arrangement of fibers. However, only very few fibers in a card sliver have a straightened shape.
To straighten hooked and folded fibers, and greatly improve fiber alignment along the sliver axis, the sliver is thinned by stretching; the mechanical action is called drafting, and the amount by which it is stretched is the draft. Clearly, the count of the sliver will decrease, so drafting is an attenuating action, and the draft is equal to the factor by which the sliver count is reduced. Thus, if a 6-ktex sliver
© 2003 by CRC Press LLC

is reduced by a draft of 3, a 1-m length would be stretched to 3 m, and the resulting sliver count would be 2 ktex. This means that
(1.11)
The drafting of the sliver gives rise to shear within the fiber mass; fibers slide past each other as the sliver is stretched, giving the permanent extension or elonga-tion. The friction contact between fibers during the sliding motion straightens and aligns fibers along the sliver axis. Figure 1.9 shows the situation where two pairs
BackWashing
ShrinkProofing
TopDyeing
Combing
RovingProduction
RovingProduction
Spinning
Winding
Rewinding
Plying
Plying
Spinning
SHORT STAPLESYSTEM
WORSTEDSYSTEM
SEMIWORSTEDSYSTEM
WOOLENSYSTEM
I
II
III
IV
V
Combed Ring-Spun YarnCarded Ring Spun YarnRotor Spun Yarn
I. Opening and Cleaning II. Fiber Disentangling and Cleaning III. Fiber Straightening and Parallelization (Short Fiber Removal + Additional Cleaning) IV. Fiber Straightening, Parallelization, Attenuation V. Yarn Formation
Preparation (Blowroom)Opening, Cleaning,Mixing, Blending
Carding
Drawing
Drawing
Spinning
Winding
Preparation Sorting Blending,Scouring
Carding
Gilling
Gilling
Preparation Sorting, Scouring,Carbonizing, Stock-Dyeing, Blending
StretchBreak
Carding
RebreakCombing
Gilling
FIGURE 1.8 Yarn production process sequence.
Draft stretched lengthinitial length
-------------------------------------- initial count (tex)final count (tex)
-----------------------------------------= =
© 2003 by CRC Press LLC

of rollers are used for drafting. The bottom rollers are fluted metal rollers that are driven through a set of gears by an electric motor. The flutes may be straight, as illustrated in Figure 1.9, or given a slight spiral. The top rollers are synthetic-rubber-covered rollers and are pressured down onto the bottom rollers (termed weighted down) and driven through frictional contact. The compression, referred to as the hardness, of the synthetic rubber cover can be varied to suit the fiber frictional properties. The flutes of the bottom rollers and the resilience of the top rollers are important for the nipping of fibers during drafting.
The diagram illustrates what is called a single drafting zone arrangement, and the method of drafting is termed roller drafting. There are other methods of drafting, and these are described in the later chapters wherein we consider the processes in which they are used. The basic idea of drafting is explained here, using roller drafting as an example.
The drafting zone in which the material is stretched and attenuated is the horizontal area between the nip lines of the two pairs of rollers. The material is fed into the zone at the surface speed, V1, of rollers A and pulled out of the zone by rollers B at speed V2. Thus, Equation 1.11 can be rewritten,
(1.12)
Ideally, where two fibers, x and y, are in frictional contact with the leading end of x nipped by rollers B while its trailing end is free, and the converse is true for y with roller A, then the sliding of x past y will be effective in straightening and aligning the fibers along the sliver axis. Even if we were to assume that fibers forming the card sliver were of equal lengths, there will be differing fiber shapes (i.e., configurations) giving different extents and orientations to the sliver axis. Conse-
+
+
+
+
+
Nip Line
Nip Line
Drafting Zone
xy
A
B
+V1
V2
FIGURE 1.9 Single-zone roller drafting.
Draft V 2
V 1
------ stretched lengthinitial length
-------------------------------------- initial count (tex)final count (tex)
-----------------------------------------= = =
© 2003 by CRC Press LLC

quently, on the first pass of the sliver through the drafting zone, there would be fibers that are not nipped effectively to be straightened and aligned. The use of more than one drafting zone and the passing of the material through the drafting process several times therefore would be beneficial. In practice, the process stage after carding, known as drawing, involves six or eight card slivers of the same count being drafted to the count of one sliver, and the drawing passage repeated with six or eight of the first drawn sliver. Up to three drawing passages can be used. Chapter 5 describes in more detail the drawing processes used in the production of staple yarns.
In bringing six or eight slivers together, termed a doubling of six or eight, and applying to them a draft of six or eight, the resulting sliver will comprise a sixth or an eighth of the count (and also of the number of fibers in the cross section) of each original sliver. Repeating the process further reduces the proportion to 1/36 or 1/64. There is, in effect, a blending of the original slivers, and the greater the number of drawing passages, the better the blending. This blending by doubling of slivers improves the uniformity of the final slivers and, ultimately, that of the spun yarn. Drawing is, therefore, an important stage in the sequence of preparatory processes when producing yarns from either one fiber type or a blend of two or more fiber types.
It should be evident that important factors in roller drafting are
• The distance between the nip lines (termed the roller setting) in relation to the distribution of fiber lengths within the sliver
• The applied draft (i.e., the relative roller speeds)• The number of fibers (or the input count) fed into the drafting zone
Chapter 5 gives an account of drafting theory and considers these factors in more detail.
Where the raw material has a broad distribution of fiber lengths, it is sometimes necessary, after the first passage of drawing, to remove from slivers some fibers that are much shorter than the mean length of the distribution. The process for doing so is known as combing, and, as the name implies, a pin surface is used to comb through the fiber mass of first-passage drawn slivers, removing fibers of preselected short lengths. Combing also has the added benefit of contributing to the straightening and alignment of fibers and of removing residual impurities present in the material after the opening, cleaning, and carding stages. Combed ring-spun yarns and worsted yarns are produced from combed material, making them of the highest quality in terms of yarn properties, and enabling such yarns to cover the finer end of yarn count range. Chapter 5 describes the principles of combing.
Following the final passage of drawing, the sliver produced has to be attenuated to give the required yarn count. The most common approach is to attenuate the sliver into a roving and then to attenuate the roving during spinning prior to twist insertion, or other means, to form the yarn structure. Roving production is then the last of the preparatory stages to spinning. However, the total required attenuation can be achieved directly from sliver, either with high-draft, roller drafting systems or by pin and saw-tooth-covered rollers, known as opening rollers, used in rotor and friction spinning. In Chapter 5, a detailed description is given of the roving produc-
© 2003 by CRC Press LLC

tion process, and Chapter 6 explains the operating principles of opening-roller systems.
The carding process also involves attenuation of the fiber mass to obtain the required sliver count but, as mentioned, few fibers in the card sliver are straight. This indicates that drafting during carding is not suitable for fiber straightening. From a yarn structure perspective, low fiber straightness and parallelism will sig-nificantly reduce certain important properties (e.g., strength) but increase yarn bulk-iness. This yarn characteristic is a requirement for some fabrics and other more technical end uses (e.g., water filtration packs), and a compromise is then reached between yarn strength and bulk. The woolen spinning process makes use of the fiber randomness at the card to achieve yarn bulk. In this case, the web of carded fibers is split into thin strands and consolidated to form slubbings, which are subsequently spun into yarns. High-bulked yarns are also produced by differential shrinkage of fibers that are obtained by stretch-breaking filaments. Chapter 5 describes the stretch-breaking process.
Following the ring spinning and any plying processes, yarns are usually rewound into large-size packages; these usually take the form of a parallel-sided cheese shapeor a cone shape, suitable for use in fabric production and the process of producing such packages is known as winding. Winding is important, because it provides the opportunity for removing imperfections (faults) from the yarn and thereby assists the efficiency of the subsequent processes and improve fabric quality. Yarns can also be waxed during winding to improve knitting efficiency. The point of importance, however, is that a rewound package is along continuous length of yarn, which enables a long running time of fabric production. The principles of winding are described in Chapter 7. Several spinning systems are, however, able to produce large-size waxed- and unwaxed-yarn packages of the above types, and rewinding then is not practiced.
1.7 RAW MATERIALS
The old adage among some yarn spinners, “If it has two ends, it can be spun,” is not strictly true, but it is indicative of the wide range of fiber types and lengths that are today converted into yarns. Figure 1.10 charts the broad variety of fiber types that may be converted into yarns. It is not the intention to describe the production processes or the detailed chemical properties of these fibers, since the subject of fiber technology would form a textbook in its own right, and indeed many books and scientific papers are readily available for the interested reader; several are cited at the end of this chapter.8–10 It is, however, appropriate to consider certain aspects of fiber properties relevant to the production of staple yarns involving those fibers that are used in large tonnages.
1.7.1 THE GLOBAL FIBER MARKET
The statistics for organic fiber production are regularly reported by Fibre Organon,11
ICAC,* and CIRFS†.12–13 The reader may wish, in the future, to keep an updated
* International Cotton Advisory Committee, www.icac.org.
© 2003 by CRC Press LLC

check of the production statistics from these sources. The latest figures (published in 2001) at the time of writing this book showed that textile fiber production had reached 57.2 million tons. Figure 1.11 illustrates the breakdown of the production tonnage by fiber type, and Table 1.6 lists the main producing countries, Asia and Oceania being the dominant geographical regions.
Approximately 90% of world fiber consumption is processed into yarns, 7% into nonwovens, and the remainder used for fillings, cigarette filters, etc. Since circa the 1960s, there has been a general growth in world population and an increase in disposable income in the developed economies. As a result, consumer demand for easy-care, comfortable fabrics has led to manufactured fibers, largely synthetics, assuming a significantly increased share of world fiber production, accounting for 57% of production, while natural fibers have declined to 43%. Of the synthetic fibers,
† Comité International de la Rayonne et des Fibres Synthétiques (International Rayon and Synthetic Fibres Committee), www.cirfs.org.
FIBER TYPES
INORGANICSORGANICS
NATURAL NATURALMANUFACTURED MANUFACTURED
VEGETABLE(NATURAL CELLULOSE)
PROTEIN(ANIMAL)
NATURALPOLYMERS
MANMADEPOLYMERS
Cotton
(Bast Fibers)Fax
Hemp
Ramie
Jute
(MiscellaniousVegetables)
Sisal
Banana
Pineapple
Coir (Cocanut)
Sheep wool Viscose Rayon Nylon Asbestos Glass
Silk CuprammoniumRayon
Polyester Basalt
(SpecialityHairs) Cellulose Acetate
Cellulose Triacetate
(Polyolefins)Polypropylene
Metals
Mohair
Cashmere
Camel
Llama
Alpaca
Vicuna
Angora
Polynosic Rayon
Lyocell
Alginate
Casein
(Polyethylene)
Acrylic
PVC
PTFE
PVDF
(High Performance)e.g., Kevlar, Nomex, PBI, etc.
FIGURE 1.10 Examples of the range of fiber types.
© 2003 by CRC Press LLC

TABLE 1.6Principal Producing Countries
CountrySyntheticsa
(× 1000 tons)d
Cottonb
(× 1000 tons)Woolc
(× 1000 tons)
Australia – 700 673Brazil – 569 –China 6,156 3,900 290Germany 880 – –Greece – 390 –India 1,430e 2,800 –Indonesia 1,026e – –Japan 1,460 – –Korea 2,687 – –Mexico 638 – –New Zealand – – 252Pakistan – 1,800 –Syria – 325 –Taiwan 3,066 – –Turkey 936 850 –USA 4,583 3,690 –Uzbekistan – 1,160 –Others 7,112 3,066 1,141World totals 29,974 19,250 2,356
aCourtesy of Fibre Organon, June 2000.bCourtesy of ICAC Washington, August–July 1999/2000.cCourtesy of Wool Statistics, Greasy Wools 1999/2000, Brussels, Bel-gium, International Wool Textile Organization.d1999 production.eExcluding polypropylene.
Synthetics [52.4.%]
Cellulosics [4.6%]
Cotton [33.3%]
Wool [2.3%]
Jute [5.8%]
Linen [1.1%]
Ramie [0.3%]
Silk [0.1%]
FIGURE 1.11 World production of textile fibers (57 million tons).
© 2003 by CRC Press LLC

polyester accounts for the largest tonnage (59.3%), followed by the polyolefins polypropylene + polyethylene (18.4%), polyaimde (13.1%), and acrylic (8.5%).
Manufactured cellulosic fibers have an 8% share of global production. Cotton has been the most widely used natural fiber for over 5000 years14 and is still a very popular material among consumers for many items of textiles and apparel. Cotton accounts for around 33% of total fiber production. Wool has only a 2.3% market share but, like cotton, is still an important fiber with respect to spinning technology, since many machinery developments have been directed at the worsted and woolen spinning sector. The remaining natural organic fibers, except for jute, have compar-atively much lower tonnage. Other than the bast fibers, these remaining organic fibers can be spun on either (a) the short-staple, worsted, woolen or (b) the uncon-ventional spinning systems described in this book. The bast fibers have specific process technologies for yarn production, which are more specialized areas and are described elsewhere.3,15
Only very small quantities of inorganic fibers are spun into staple yarns. Asbestos is used very little because of well reported associated health problems;16–18 glass, basalt, and metal fibers are used largely in filament form or as nonwovens, but small amounts of staple yarns are made from metal fibers on conventional spinning systems and find applications in the areas of conductive fabrics and some protective clothing.19,20
Although the inorganic fibers and the lower-tonnage organic fibers have less significance in yarn technology as compared with, say, polyester, acrylic, cotton, the regenerated cellulosics, and wool, they are of much importance with respect to textiles for medical and industrial applications, i.e., technical textiles21,22 and, in the case of silk and speciality hairs, luxury fabrics.23 The luxury fabrics market, being more exotic, will always remain relatively small, but the technical textiles sector is seen to have major growth potential.
The market drivers that influence growth in yarn production are population and general economic growth, and increasing consumer purchasing power. The world population is above 6 billion people and is predicted to grow at approximately 1.7% per annum. Around 16% of the world population currently has a per capita fiber consumption of greater than 10 kg, with the richer countries having 20 to 40 kg per capita. The remaining 84% of world population has between 3 to 10 kg per capita fiber consumption. It is reasoned that by the mid twenty-first century, the average annual per capita fiber consumption will exceed 12 kg, of which 60% will be consumption of synthetic fibers. The effect of population growth alone will provide only 40% of this projected increase; the remaining 60% is ascribed to anticipated economic growth and a rise in disposable income. This projection is equivalent to a 2.8% per annum growth rate in world fiber consumption; approximately 62% will be converted into spun yarns and 30% into filaments, and the greatest demand is likely to be for polyester fibers.
1.7.2 THE IMPORTANT FIBER CHARACTERISTICS AND PROPERTIES FOR YARN PRODUCTION
If we consider the points made earlier about what constitutes a yarn, we can make reasonable deductions as to what fiber characteristics and properties are important
© 2003 by CRC Press LLC

in yarn production. The process sequence of Figure 1.8 is a useful starting point. The actions involved in stages I and II indicate that most materials have to be cleaned and disentangled. The level of cleaning is important because, the more work done to clean the material, the greater the chances of damaging fibers. Thus, cleanliness of the material prior to its processing is an important parameter; this is mainly applicable to natural organic fibers. The processes in stages III, IV, and V involve attenuation and, as indicated in Figure 1.9, this may involve drafting zones where rollers are placed a specified distance apart. As explained in Chapter 5, this distance depends on fiber length.
With any type of natural fiber, there are different lengths of fibers in a fibrous mass. Since drafting zones must be set to avoid the breaking of the longer fibers during attenuation, very short fibers at times will be between the two drafting rollers and are not properly attenuated. Thus, as we will see in Chapters 5 and 6, very short fibers tend to cause irregularities in the drafted material and ultimately in the yarn. It is therefore important to establish the fiber length distribution of the raw material to be processed so that, where necessary, the short fibers can be removed during processing. It is also important to minimize fiber breakage in processing; therefore, the fiber strength-extension characteristic, which is indicative of the fiber toughness, can play a major role in the limitations placed on parameters of the operating machine — in particular rotational speed and the set closeness of component parts.
Fiber length, fineness, strength, and extension are also important material param-eters to the spinning process of stage V. All contribute significantly to the yarn tensile property and thereby enable the forming yarn to withstand the mean tension and the peak values of tension fluctuations during spinning and in subsequent processing. The strength of a yarn depends on how well its constituent fibers can equally share the tension induced by the load applied to the yarn. The finer the fiber, the greater is the number of fibers in a particular count of yarn to share the applied load; finer fibers therefore tend to give stronger yarns. The distribution and transfer of tension among fibers in a yarn depend on the length and frictional contact of the overlap of their ends. Longer fibers tend to give longer overlaps. The frictional contact is largely governed by the level of twist; the higher the twist, the higher the frictional contact. Also, the greater the number of fibers present, the greater is the number of frictional contact points. Thus, for adequate frictional contact, a yarn composed of fine, longer fibers will require less twist than one composed of short, coarser fibers. Fine-count yarns have fewer fibers in the yarn cross section and are therefore made from fine, longer fibers.
Fiber rigidity and cohesion are important properties in twist insertion. The intrinsic rigidity of fibers is the property that determines resistance to the twist insertion. Although there are experimental ways6 of measuring intrinsic rigidity, they are impractical commercially. An intuitive understanding is gained from the elastic modulus of the load-elongation fiber characteristics and from the general knowledge that, the finer the fiber, the easier it should be to twist. The rigidity can be strongly affected by the moisture absorbency of the fiber; the rigidity of dry wool fibers is about 15 times greater than that of wool fibers saturated with water. Thus, the moisture regain of fibers, which can be easily measured,7 is also important to spinning.
© 2003 by CRC Press LLC

Cohesion is a fiber property that aids spinning, since it is essentially the ability of fibers to hold together in a mass. Cohesion is related to the relative fiber rigidity as well as its ability to blend or mix with other fibers, and it is influenced by the surface characteristics of fibers or by the frictional resistance of fibers. Fiber friction is again a very difficult property to measure, but simple nonstandard tests can be used for evaluating fiber friction.6
For fibers to be processed without difficulty through stages I and II, they must have what is termed crimp; this is a waviness along the fiber length. Crimp enables the cohesion of fibers during carding, combing, and the drawing stages. However, a high level of crimp can be counterproductive, causing particular difficulties in disentangling the raw fiber mass.
Natural organic fibers usually retain small amounts of wax or grease on their surfaces after cleaning, which is an aid to the disentangling and the drafting actions of the subsequent processes. They also have significant moisture regain. Most fibers exposed to the atmosphere pick up some moisture; the quantity will depend on the relative humidity and temperature of the atmosphere and on the fiber chemistry.10
The percentage of moisture present, calculated on the oven-dry weight, is the mois-ture regain of the fiber.7 The moisture regain of natural fibers assists in dissipating electrostatic charges generated during processing. Electrostatic charges can cause processing difficulties such as fibers sticking to and wrapping around components, and static can also cause a lack of fiber cohesion resulting from the action of repulsion of electrostatic forces. Synthetic fibers have low moisture regain and no natural surface lubricants, so fiber manufacturers apply special surface chemicals as pro-cessing aids, commonly referred to as surface finishes.
The reader should be aware that, even with a given fiber type (such as the diverse cotton varieties and wool breeds) there are variations, and with man-made fibers, variations occur between different manufacturers’ polyester, polypropylene, etc. The sourcing of raw materials that will give the required yarn properties and process satisfactorily on the particular machines making up a process line is essential. Raw materials usually account for 50% or more of production cost and, being a major factor in processing efficiency, strongly influences the remaining 50%, referred to as conversion costs. Having outlined, in a general way, the fiber characteristics important to yarn production processes, it is useful to consider these in more detail for cotton, wool, and the manufactured fibers that are processed in sizable tonnages.
1.7.2.1 Cotton Fibers3
Although cotton is grown in more than 80 countries worldwide,24 botanically, there are three principal groups of cotton that are of commercial significance.
1. Gossypium hirsutum. This first group is native to Mexico and Central America and varies in length from about 22 to 24 mm (7/8 to l 5/16 in.). It accounts for more than 95 percent of U.S. production is commonly called American upland cotton.
2. Gossypium barbadense. This second botanical group is of early South American origin and varies in length from 32 to 40 mm (1 1/4 to
© 2003 by CRC Press LLC

1 9/16 in.). It makes up the remainder of U.S. production and is referred to as American pima, or extra-long-staple (ELS) cotton.
3. Gossypium herbaceum and Gossypium arboreum form the third group, which covers cottons of shorter lengths, 13 to 25 mm (1/2 to 1 in.), that are native to India and Eastern Asia.
A cotton fiber grows in two stages from the surface of the seed coat. During the first stage of its growth, ten days from flowering, the fiber elongates to its full length as a thin-walled tube. As it matures, during a further 35 days after flowering, the fiber wall is thickened by deposits of cellulose inside the tube, leaving a hollow area in the center. These deposits have the form of concentric layers, and each layer is made up of fibrils arranged in a helical manner (which can be seen only microscop-ically). When the growth period ends and the cotton crop is harvested, the fiber collapses and twists about its own axis. Figures 1.12a through 1.12c depict the cross section of a cotton fiber, where the collapsed central hollow is evident, as are the fibrillar structure and the typical collapsed and twisted longitudinal appearance. As illustrated, the cotton fiber may be divided into four parts. The cuticle is composed of wax and pectic substances. The primary wall consists of very small threads or fibrils of cellulose, and the secondary wall is made up of the concentric cellulosic layers. The collapsed central hollow forms the lumen. It is evident from the fiber cross sections in Figure 1.12d that the thickness of the secondary wall varies from fiber to fiber. There are fibers with thick walls and others with very thin walls. The latter are referred to as immature fibers, and there are various soil and climatic reasons for immature growth.14 Clearly, the mature fibers are stronger.
From the above descriptions, we can reason that the quality of cottons will depend on the fiber length distribution, degree of maturity, fineness, and strength. However, a number of other factors have also to be taken into account. The natural color of cottons is a light to dark cream, depending on the variety and weather and
(a) (b) (c) (d)
(a) 4 parts: –Cuticle; primary wall; secondary wall of concentric cellulosic layers; lumen (arrows). (b) –Fibrillar structure (c) –Collapsed and twisted longitudinal appearance (d) –Fibers of deifferent degrees of maturity
FIGURE 1.12 Cotton fiber morphology.
© 2003 by CRC Press LLC

soil conditions. However, climatic changes and poor farming practices can result in color discoloration [e.g., brown spots (spotted cotton), extensive brown discoloration (tinged cotton), or a mottled tan appearance (yellow-stained cotton)], which would deteriorate the final shade of a dyed yarn or fabric. Color is therefore an important factor in the cotton quality assessment.
Foreign particles, inevitably, get into the harvested crop and, although the cotton is removed from the cotton seed by saw gins for intensive cleaning, the result can be finer particle contaminants remaining in the cotton mass (referred to as lint) that is baled and sold for yarn production. The types of particle contaminant are leaf and seed fragments, sand, dirt, and dust. With intensive cleaning, fibers can be damaged, thereby increasing the amount of very short fibers present in the cleaned mass (the lint).
Batches of cotton can become sticky during processing. Such cottons may reduce processing efficiency, lower yarn quality, cause excessive wear and increased main-tenance of machinery, and (in severe instances) mill shutdown, with a thorough cleanup being required. Stickiness occurs when excessive sugars present on fibers are transferred to machinery surfaces. Cotton fibers are largely cellulose formed from sugars synthesized by the cotton plant. Sugars are therefore always present in lint, but they usually occur at levels that pose no processing difficulties. The excess sugars may be insect or plant derived. Honeydew is the main source of excess sugars that can result in sticky lint. Common cotton pests such as aphids and whiteflies ingest sucrose and then transform and excrete it as honeydew. Another source of stickiness is free plant sugars sometimes found in immature fibers. Dry, mature cotton fibers contain little free sugar, while immature cotton contains glucose, fructose, sucrose, and other sugars. Trash content and excess sugar or stickiness therefore are also factors affecting cotton quality.
When considering the quality of cottons, the practice is to refer to cotton classification standards, primarily as established for the above-described three prin-cipal groups by the United States Department of Agriculture (USDA). The USDA classification25 for cottons is based on specific test methods and standardized pro-cedures for measuring the physical characteristics of raw cotton that affect the manufacturing efficiency and/or quality of the finished product. In the past, these qualities were classified by hand-and-eye inspections by experienced classers.26
Since 1991, classification has been based on objective measurements using precision instruments called high volume instrumentation (HVI),27 the purpose being to test sizeable quantities as representative samples of a batch of cotton. Currently, cottons are graded by HVI measurements on the following parameters:
• fiber length• length uniformity• strength• micronaire• color• preparation• leaf• extraneous matter
© 2003 by CRC Press LLC

Fiber Length (UHM)There are two well known methods of assessing fiber length: the staple diagram and the fibrograph (or fibrogram). Appendix 1B gives a brief description each. The fiber length is determined from the fibrograph and is the average length of the longer half of the fiber span length distribution (i.e., the upper half mean length, or UHM length).7
Length Uniformity Index (LUI)Length uniformity is the ratio of the mean length and the UHM length of the fibrograph and is expressed as a percentage.7 If the fibers in a bale were all of equal length, the mean length and the UHM would be equal and would give a uniformity index of 100. However, because there are variations in length among cotton fibers, the length uni-formity will always be less than 100. The LUI gives an indication of short fiber content, since cottons of low length uniformity index are likely to contain a high percentage of short fibers and would be difficult to process and would produce lower yarn quality. Thus, the length uniformity index is important to yarn production efficiency as well as yarn strength and evenness. The following table illustrates the classification.
Fiber StrengthStrength measurements are made on the same beards of cotton that are used for measuring fiber length. The beard is clamped in two sets of jaws, 12.5 mm (1/8 in.) apart, and the amount of force required to break the fibers is determined. Strength measurements are reported in terms of grams per tex (g/tex). Therefore, the reported strength is the force in grams required to break a bundle of fibers one tex in count. The classification of strength values is as follows:
There is a high correlation between fiber strength and yarn strength. Also, cottons of high fiber strengths are less likely to get broken during the manufacturing processes.
MicronaireThis is a measure of fiber fineness and maturity. The miconaire of a cotton is determined by measuring the resistance to airflow of a sample of fibers of a specified mass compressed to a fixed volume.7 Low micronaire values indicate fine and/or
Degree of uniformityHVI length uniformity
index (percent)Very high >85High 83–85Intermediate 80–82Low 77–79Very low <77
Degree of strength HVI strength (g/tex)Very strong >30Strong 29–30Average 26–28Intermediate 24–25Weak <24
© 2003 by CRC Press LLC

immature fibers; high values indicate coarse and/or mature fibers. The table below can be used as a guide in interpreting micronaire measurements.
Fiber fineness affects processing performance and the quality of the end product in several ways. In the opening, cleaning, and carding processes, low-micronaire, or fine-fiber, cottons require slower processing speeds to prevent damage to the fibers. Yarns made from finer fiber result in more fibers per cross section, which in turn produces stronger yarns, although immature fibers have a negative effect. Dye absorbency and retention vary with the maturity of the fibers. The greater the maturity, the better the absorbency and retention.
Although the miconaire test enables sizable samples to be evaluated, it does not give precise indication of fiber maturity and fineness. The development of better high-volume methods is a requirement, and there is ongoing research into improved test methods.
Color
The color of cotton samples is determined from two parameters: degree of reflectance (Rd) and yellowness (+b). Degree of reflectance indicates the brightness or dullness (degree of greyness) of the sample, and +b the pigmentation level in the fibers. There are five recognized groups of color: white, grey, spotted, tinge, and yellow-stained. A three-digit color code is used. The color code is determined by locating the point at which the Rd and +b values intersect on the Nickerson-Hunter cotton colorimeter diagram for cotton variety (see Figure 1.13).
Even though USDA provides instrument measurements of color, the traditional classer’s method of color determination is still used in the industry and is included as part of the official USDA classification. For Upland cotton, there are 25 official color grades plus five categories of below-grade color, as shown in the following table. USDA maintains measured standards for 15 of the color grades. The others are descriptive standards.
Cotton range Micronaire readingPremium 3.7–4.2Base range 4.3–4.9Discount >5.0
Color Grade: Upland Cotton (1993)
White Light Spotted Spotted Tinged Yellow Stained
Good middling 11* 12 13 — —
Strict middling 21* 22 23* 24 25
Middling 31* 32 33 35* 35
Strict low middling 41* 42 43* 44* —
Low middling 51* 52 53* 54* —
Strict good ordinary 61* 62 63* — —
Good ordinary 71* — — — —
Below grade 81 82 83 84 85
*Physical standards; others are descriptive.
© 2003 by CRC Press LLC

Small quantities of cottons with intrinsic basic colors of brown, red, and green27
are commercially available. These fibers are regarded as speciality fibers and are not part of the classification.
Preparation
Preparation is a term used by classers as an indication of fiber processability in terms of how easily the cotton was ginned, i.e., smoothness or roughness. Various
DECREASING YELLOWNESS
4 5 6 7 8 9 10 11 12 13 14 15 16 17 18
80
70
60
50
11−111.221−121.3
22.1
21−4
21−211−311.4 12−1
13−1
12−213−2
13−4
13−3
22−2 23−123−2 23−323−4
24−124−3
25−1
24−2
24−4
25−2
31−1
31−3
32−133−1
33−3
34−1
34−3
35−1
31−231−4
32−233−2
33−4
34−2
34−4
36−2
41−1
41−3
42−143−1
43−3
44−1
44−3
85−185−2
44−4
44−2
43−4
43−2
42−2
41−4
41−2
51−1
51−3
52−153−1
53−354−1
54−3
85−3
53−454−2
54−485−4
53−2
52−2
51−4
51−2
61−1
61−362−1
83−183−3
84−184−2
63−4
63−2
62−2
61−4
61−2
84 −3
83 −1
71 −3
71 −1
85 −584 −4
83 −2
71 −4
71 −2 82 −1
82 −2
81 −1
83 −3
84 −5
81−2
WHITE
LT. SP.SPOTTED
TINGED
Y.S.
2SM
1QM
3M
4SLM
5LM
6SGO
7GO
INCREASING YELLOWNESSHUNTER’S + B
COLOR DIAGRAM
Based on
UNIVERSAL STANDARDS FOR GRADEOF AMERICAN UPLAND COTTON
Effective
August, 1979
USDA-AMSCOTTON DIVISION
LIG
HT
DA
RK
(% R
EFL
EC
TAN
CE
)R
d
FIGURE 1.13 USDA color classification.
© 2003 by CRC Press LLC

methods of harvesting, handling, and ginning cotton produce differences in rough-ness or smoothness of preparation.
Leaf and Extraneous Matter (Trash)Trash is a measure of the amount of nonlint material in the cotton, such as leaf and bark from the cotton plant. With HVI evaluation, the surface of the cotton sample is scanned by a video camera, and the percentage of the surface area occupied by trash particles is calculated. The image area is divided by 59,520 pixels or 248 × 240 frame lines, and areas 30% darker than cotton mass are counted as trash particles. This method, however, does not detect seed coat fragments or dust particles. Although there are other long-established methods for measuring trash by weight in the cotton mass,28,31 the HVI method is preferred for classification because of the speed of measurement. The limitation is somewhat circumvented by relating HVI classification to the traditional classer’s leaf grade as indicated below.
The classer’s leaf grade is a visual estimate of the preponderance of leaf particles in the cotton. There are seven leaf grades, designated “1” to “7.” Extraneous matter is any substance in the cotton mass other than fiber or leaf; for example, bark, grass, spindle twist, seedcoat fragments, dust, and oil are extraneous matter. The kind of extraneous matter and an indication of the amount (light or heavy) are noted by the classer on the classification document. From a yarn production viewpoint, leaf content and extraneous matter are waste, and there is a cost factor associated with their removal. Also, small particles cannot always be removed, and these particles may detract from the quality of the yarn and the finished fabric.
Although the above HVI-measurable characteristics form a baseline for raw material specification, there are three further parameters that are of major importance to yarn production efficiency and yarn quality, namely stickiness, nep content, and short fiber content.
StickinessStickiness is the tendency for the cotton mass to adhere to process machinery. The severity of a stickiness problem will depend on the type of sugar (chemically), on the amount of sugar present, and on the ambient conditions (especially humidity) during processing. Stickiness is consequently a difficult cotton characteristic to
Relationship of HVI Trash Measurement to Classer’s Leaf GradeTrash measurement (% area) Classer’s leaf grade
0.12 1
0.20 2
0.33 3
0.53 4
0.68 5
0.92 6
1.21 7
© 2003 by CRC Press LLC

measure. The chemical identity of sugars that are correlated with stickiness may be measured in several ways, each with differing usefulness. Reducing-sugar tests, based on reduction of the cupric ion, are relatively quick and inexpensive, and they may be used to screen cottons for high levels of plant sugar contamination. Using potassium ferricyanide (KFeCN) for the screen test,29 cottons with reducing sugar levels less than 0.3% usually process without difficulty. Insect sugars are nonreducing sugars. High performance liquid chromatography (HPLC) can be used to measure both reducing and nonreducing sugars.29 The main insect sugars [honeydew, treha-lulose (from whiteflies) and melezitose (from aphids)] and plant sugars (glucose, fructose, and sucrose) are easily identifiable by this test. HPLC is, however, a relatively slow test and does not indicate how a sugar-contaminated cotton may actually perform during processing.
There are three commercially available performance test instruments,30,31 the minicard (MC), the high-speed stickiness detector (H2SD), and the fiber contami-nation tester (FCT). With the MC device, a web of fibers is passed between stainless steel rollers, and the degree of stickiness is rated on a scale of 0 to 3, where 0 is no stickiness and 3 is the severe level. The test is carried out under a controlled environment of 24°C and 55%RH. The test has the major disadvantage of being slow. In addition, the rating is a subjective assessment (i.e., operative dependent), and it is unable to assess cottons usefully with high plant sugar evenly distributed along the fibers. The H2SD uses image processing to measure the number of sticking points and the point size distribution on aluminum plates between which a cotton sample has been pressed. The measurements are made for heated (54°C for 30 s) and unheated pressings. The FCT also measures sticking points, but on pressure rollers after a thin web has passed between them, and in a conditioned environment of 65% RH. A laser beam is used to scan the contaminated rollers to allow the sticking points to be counted. The H2SD and FCT are fairly rapid tests, taking 30 and 45 s per test, respectively.*
Nep Content
There are various definitions of a nep,32,33 but the following is the most informative: A nep is a small, tangled knot of fiber often caused by processing fibers. It is informative because it indicates that nep is not a fiber property but may result from passing fibers through process machinery. Thus, in ginning, neps are readily formed and are an unwanted part of the cotton mass characteristic. There is a high association between neps in the ginned cotton and neps in the resulting yarn. Neps in yarns result in spottiness of dyed or printed fabrics, which lowers the market value of the end product. Neps, consequently, not only need to be removed during yarn produc-tion processes, thereby adding to the waste, but also should be prevented from forming by these processes as is explained in Chapter 3. The neppiness of the raw
* Only the H2SD method is approved by the International Committee for Cotton Test Methods (ICCTM), but more research is required to minimize inter-laboratory variations. The purpose of the ICCTM is to establish suitable harmonized test methods for cotton. The H2SD was developed by CIRAD (Centre de Coopération Internationale en Recherche Agronomique pour le Développement) in Montpellier, France, and is sold by SDL International Ltd., in Manchester, UK, and SDL America Inc., in Charlotte, NC.
© 2003 by CRC Press LLC

cotton, following ginning, may be seen as indicative of the nepping potential of the cotton batch.
Research34 into the relationship between nep potential and fiber properties has shown that fine fibers and immature fibers have a tendency to become neps. There is a linear correlation between micronaire and the neppiness of processed fibers; the neppiness decreased with increased micronaire values, and it was observed that neppiness in yarns was significantly correlated with the amount of immature fibers in the lint.
The recommended method30,31 for nep measurement is with the Zellweger Uster Advanced Fiber Information System (AFIS). The AFIS nep tester gives the average number of neps per gram in the fiber mass and the average nep size in millimeters.
Short Fiber Content (SFC)Like nep content, SFC is usually the result of mechanical processing of the cotton lint. There are, however, a number of factors that influence the resulting amount of short fibers. Clearly, the strength of a fiber is related to its ability to withstand mechanical stresses during processing. Growing conditions affect the cotton maturity and therefore its strength, but the factors most influential to SFC are harvesting and ginning.35
Picking and stripping are the two major mechanical methods of harvesting cotton. With picking, revolving spindles are used to twist the locks of cotton from the open bolls, whereas strippers employ fingers or brushes to remove all the cotton bolls from the stalk — both mature and immature bolls. The immature cotton bolls are either not opened or only partly opened, and the picker cannot pull cottons from such bolls. Thus, harvesting with strippers results in more immature and weaker fibers, and stripped cotton contains more foreign particles. Despite these disadvan-tages, stripping has become the preferred process because of its production effi-ciency, and because the market system gives a premium for clean cotton. Since grading of cotton does not include SFC, farmers tend to promote intensive ginning. This practice results in significant levels of SFC in the ginned lint. SFC has a negative effect on the yarn production process and on the yarn quality, and therefore quan-tifying SFC is of commercial importance.
There are various methods for determining SFC, and all have one or more shortcomings with respect to variability, reliability, sample volume, and rapidity of test procedure. However, the aligned comb sorting techniques such as the Baer, Shirley, and Suter Webb, which manually produce fiber length distributions by either counting or weighing the measured lengths of the fibers in a sample, are the ones that give the best estimate of SFC.
In determining the amount of short fibers present in a batch of cotton, the absolute and the relative SFC are often considered. The later is calculated as defined by Lord28
from a fiber length distribution (i.e., staple diagram). (See Appendix 1C.) The absolute SFC is defined as the proportion of fibers shorter than a specified length. The specified length can vary from one geographical region to another but is within the range of 6 to 25 mm (~1/4 to ~1 in.).36 In the U.S., all fibers shorter than 12.7 mm (~1/2 in.) are defined as short fibers; countries employing metric units set 12 mm as the specified length.
© 2003 by CRC Press LLC

With the need for high-volume rapid sampling for commercial practicality, there is much interest in the use of automated systems. Sanderson37 and Muller38 report results of comparisons of HVI, the Almeter AL-100, and Suter Webb. It was found that, for a specified length of 17 mm, both automated test devices gave results that showed good correlations with Suter Webb values, but the Almeter had the best correlation. Other researchers37 have reported the following equations relating SFC to span length (SL) measurements:
(Preysch formula) SFC = 39.4 + (1.3 × 2.5% SL) – (4.5 × 50% SL)
(Ahmad and Kahn) SFC = 4.17 (12.5% SL) – 9.1(50% SL) + 41
1.7.2.2 Wool Fibers
Wool is an animal hair fiber that, chemically, is made of a naturally occurring protein called keratin. This is a general definition that would include the body hairs of many animals but, in common parlance, the word is used for the body hair of sheep.
Wool is a complex layered structure, as shown in Figure 1.14, largely comprising a sheath of protective overlapping scales called cuticle (or epidermis) cells; within the sheath is the bulk of the fiber, called the cortex. The cuticle cells make up 10% of the fiber, and their overlaps are always away from the fiber end nearest the skin (the base) and toward the opposite end (the tip), causing the fiber surface to have a serrated surface appearance. In the loose state during processing, the scales on fibers can catch in one another and give considerable frictional resistance. The cortex
(a) (b) (c) (d)
(a) –Overlapping scales of cuticle or epidermis cells giving serrated surface appearance
(b) –Fiber cross sections showing cortex
(c) –Longitudinal cross section showing hollow medulla
(d) –Longitudinal cross section showing medulla lattice
FIGURE 1.14 Wool fiber morphology.
© 2003 by CRC Press LLC

consists of many long, spindle shaped cells — cortical cells — that microscopically are made up of microfibrils held together by strong natural binding materials known as the para and orthocortex, each with slightly differing properties that give wool fibers their characteristic crimp, or small curls. The cortex constitutes 90% of the fiber and determines the physical properties of the fiber. In particular, it is highly moisture absorbent and is able to carry water equivalent to 30% of its dry weight before feeling damp. When wet, the proteins in the wool fibers also release heat, all of which make it a suitable fiber for garments worn next to skin. The hydrophilic core of the fiber takes up heat given off from the human body in the form of water vapor; it has a good capacity to absorb body perspiration. Static electricity in garments can cause discomfort, but, in wool fabrics, the moisture absorbency of wool reduces static charge buildup.
With some wool, usually medium and coarse wools of around 70 to 200 µm diameter, there is a central layer — a cellular marrow or medulla that forms an air-filled honeycomb-lattice-like structure within the cortical layer.
Kempy fibers are short, wavy, very coarse, and brittle, and they taper along their length toward each end. They are of a ribbon-like cross section, strongly medullated, smooth and opaque in appearance, and mainly present in mixed wools such as carpet wools.
The density of wool is one of its fundamental characteristics, which, for practical purposes, seems to be fairly constant in all varieties of the fiber. (Measurement in benzene gives a value of 1.304 g/cm3; solid keratin is 1.31 g/cm3). Medulla wools tend to have lower density — particularly kempy wool.
Wool of some variety can be found in most countries of the world, but the commercially significant wools (the parlance used is wool clips) are from Australia and New Zealand. South Africa, Uruguay, China, the former Soviet Union, Turkey, and the UK are also sizeable producers, the former two of fine wools the latter three mainly of coarser wool. (The UK is the largest producer in Europe.)
Australia dominates the world market for fine wool fiber suitable for worsted processing (mainly in the region of 17 to 25 µm diameter), having over 30% of the world’s production and around 50% of the total exported volume of greasy wool. The wool comes from Merino sheep that represent around 75% of Australia’s sheep numbers. New Zealand wools are crossbreds (crossbred sheep result from crossing Merino sheep with other types, mainly the Romney breed),39,40 accounting for 10% of world production and 20% of wool exports. This breed produces wool that is stronger, longer, and coarser than Merino wool, but it is much less crimpy and bulky. About 70% of the New Zealand wool clip is greater than 32 µm diameter (typically 33 to 35 µm) and is processed into yarns mainly by the woolen spinning route; end uses include carpets, blankets, furnishings, Shetland-style knitwear, and hand-knitted yarns.
As regarding the trade classification of wool, the available types are broadly classified as
1. Merino 2. Crossbreds (fine, medium, and coarse)3. Carpet-wool types
© 2003 by CRC Press LLC

But there are many grades of wool within these groups. Generally, merino fibers have the finest diameter and shorter lengths than carpet wools, which are known to be long and coarse.
Usually, wool is obtained by shearing the fleece off the sheep’s back once a year. A 12-month growth is required for the worsted sector, but, for lambswool products, wool is shorn from a lamb not older than 7 months, and wools (referred to as slipe or pulled wool) are also removed (pulled) from the skins of slaughtered sheep. The shorn fleece is appraised for quality and skirted by removing badly contaminated pieces of wool (e.g., paint markings, etc.) from the neck, legs, belly, and rump areas. These heavy contaminated parts (see Table 1.7) are rejected or may be grouped and sold for some woolen yarn production.
Wool fibers vary in length, diameter, and other properties from one part of the sheep to another. The fleeces are sorted by dividing the wool into various matchings based on length, waviness, and a general appearance of characteristics. Traditionally, the wool sorter’s matchings were given quality numbers, such as 70s, 64s, 60s, etc.; the higher the number, the better the quality of the wool. Thus, wool classifications with their average quality numbers typically would be
1. Merino wool, 60s and above 2. Fine crossbreds, 56s to 58s 3. Medium crossbreds, 46s to 50s 4. Low crossbreds, 44s 5. Carpet-wool types
At one time, these numbers were related to the fineness of worsted yarn count into which the fiber could be spun, but this is no longer the case. Although wool quality numbers may still be referenced, wools are sold by their measured properties, i.e., objective specifications or “sale by description.” Objective specifications may include measurement of
TABLE 1.7Wool Contaminants and Treatments
Impurity Description Cleaning process
Accretions Pigmented fibers (black) General sorting, dispensing, and scouring
Secretions Dung, etc.
Excretions Grease, sweat
Organic and mineral impurities
Parasitic insects, vegetable matter, sand and dirt particles
Carding, carbonizing for heavy contamination
Markings Paints, etc. Sorting and dispensing
Chemical treatments Dips, pesticides Scouring
© 2003 by CRC Press LLC

1. Fineness (mean fiber diameter and distribution) 2. Length and distribution 3. Tensile properties 4. Vegetable matter content5. Bulk 6. Medullation 7. Color 8. Grease content and yield 9. Moisture content
These properties are important to processing performance and to the basic charac-teristics of the end products. Properties 1, 2, and 4 are also measured during prep-aration stages in yarn production so that appropriate spinning conditions can be used to obtain optimal yarn quality. The International Wool Textile Organization (IWTO)*
has recommended test procedures for determining these properties.
FinenessThe average fineness of a wool clip is an important dimensional characteristic greatly affecting its processing value. Unlike cotton and man-made fibers, the wool fineness is traditionally expressed by the average of the measured diameters, in microns, rather than a measure of its linear density, which nevertheless can be calculated.
The mean fiber diameter can be used to estimate the finest spinnable yarn count according to minimum number of fibers required in the cross section; 40 for worsted spinning, and 100 for woolen spinning.41 The mean fiber diameter therefore influ-ences spinning efficiency and yarn quality. It also affects fabric handle, and, in the apparel market, the demand for lighter garments with the highest possible comfort has meant a low micron value being equated with quality. Worsted yarns are generally used for apparel, and fiber fineness therefore is a critical factor. Woolen yarns for carpets are seldom spun near the minimum number, so there is flexibility in selecting the mean fiber diameter. However, lambswool and Shetland woolen yarns for apparel are often spun to as fine a yarn count as possible.
Fine fibers give a soft handle and therefore greater comfort. For garments worn next to the skin, the mean fiber diameter in the spun yarn should be less than 28 µm. This is not an exact limit, but it is referred to as the itch point or comfort limit, because people generally experience discomfort if greater than 3 to 4% of the fibers in the yarn are coarser than this value.42,43
The fibers of merino wools have diameters of 10 to 30 microns. As a result, the mean of a given mass can be from 15 to 25 µm. Merino wools are suitable for garments worn next to the skin. Blends of wool incorporating coarser fibers can be made to give an average diameter of 25 µm, but the fineness range can be 15
* The International Wool Textile Organisation (or IWTO) represents the wool and wool textile industries worldwide. It links participants of the entire wool pipeline, from producers of the raw material through traders and early stage processors, and on to the late-stage spinners and weavers. Founded in 1927, IWTO membership currently includes 23 countries. IWTO provides a forum for discussion of problems that affect the wool industry internationally.
© 2003 by CRC Press LLC

to 45 µm. Thus, for comfort garments, both the mean micron value and the distribution should be as small as possible.
Although wool fineness is always given as a diameter, strictly speaking, the cross-sectional shape of wools can vary greatly; some are nearly circular, and most have varying degrees of ovality or ellipticity. A suitable way of expressing the ellipticity is by the ratio of the major to minor axis to give what may be called a contour figure (CF). Generally, fibers of CFs less than 1.22 will process acceptably well.39
Fiber Length MeasurementsThe measured parameters may be separated according to the state of wool and the processing route. For greasy wools, the staple length is measured along with the staple strength (see “Tensile Properties” below), whereas parameters associated with the fiber length distribution are determined following initial processing of the greasy wool through to combing in the worsted sequence (the wool state being referred to as combed top) or carding for semi-worsted (the card sliver state). In woolen spinning, reference may made to the length after carding, which effectively deals simultaneously with the staple length and staple strength.41
Once wool is in combed top or card sliver state, little further change in length or strength occurs, provided appropriate process conditions are used. In these mate-rial forms, the IWTO-recommended wool length measurements are the Hauteur, H, the Barbe, B, and the 30- and 40-mm short-fiber content. The Hauteur is the mean of all fiber lengths related to number of fibers in the wool sample. Yarn spinnability improves with increasing hauteur, although beyond 80 mm, the improvement is only slight.
Hauteur and the CV(H) (the coefficient of variation of the fiber lengths) can be obtained from the hauteur diagram, which is similar to the staple diagram. The hauteur diagram indicates the percentage number of fibers that exceed a stated fiber length. Thus, subtracting this percentage value from 100 gives the percentage of fibers shorter than the stated length. The optimal CV(H) for spinning purposes is between 42 and 52%.44
Barbe is the fiber weight biased mean length, and along with CV(B), it can be obtained from a fiber weight diagram. Like the hauteur diagram, every point on the fiber weight diagram indicates by what percentage of the sample weight a particular fiber length is exceeded, and the amount by which this percentage differs from 100% indicates the weight percentage of the shorter fibers in the sample. The coefficient of variation of fiber lengths, CV(B), indicates how much the individual fiber weights vary from the weight biased mean length, B. The optimum for spinning is around 30 to 33%.44
The time between successive shearings of sheep will influence fiber length values, and the longest lengths are associated with coarse fiber types for carpet yarns. Good hauteur values for worsted spinning are from 60 to 80 mm with short fiber content < 30 mm of 7 to 15%. Lambswool can have mean fiber lengths ranging from 30 to 55 mm, with CVs around 35%. The better qualities are at the higher end of the length range and can include shortened worsted grades, i.e., broken top; poor quality lambswool has mean lengths around 20 mm and CVs as high as 70% and may include carbonized wool. This is where part of the fleece that is heavily
© 2003 by CRC Press LLC

contaminated with vegetable matter is chemically and mechanically treated for cleaning. (See Chapter 2.)
Tensile Properties
In general terms, the breaking load is the force required to rupture a single fiber or group of fibers, whereas tensile strength is the breaking load normalized by the measured linear density of tested sample. There are three measures of wool tensile strength: the fiber strength, staple strength, and bundle strength. As may be expected, coarser fibers have greater breaking loads, but the material strength may be the same as finer fibers. There are natural variations along the fiber length that introduce variations in strength, and seasonal changes or poor husbandry can cause nutritional influences resulting in thin sections along fiber lengths and thereby weaker or tender fibers.45
The three measures of strength will not necessarily give identical values. The single strength is a true measure of fiber strength but, to be meaningful, many fibers have to be tested. Testing is therefore tedious, costly, and generally not suitable for commercial practice. The staple and bundle strengths, being based on a fiber group, will be influenced by how parallel the fibers are in the group. Nevertheless, these may be used in forecasting yarn quality and processing performance, i.e., predicting yarn strength and spinning performance.
A staple is a well identified bundle of fibers that is removed from a mass of greasy wool as a unit, and the strength of this bundle is usually accepted as a measure of the wool strength. Usually, the staple length is first measured, then the staple is stretched to its breaking load and the broken staple weighed. The linear density is calculated from the weighed mass and measured length, and the normalized load gives the staple strength in newtons per kilotex (N/ktex). The test is usually carried out on the automatic tester of length and strength (ATLAS) instrument, which measures the staple length by photoelectric scanning.
The results of work carried out by the Australian wool research organization CISRO46 show that H and CV(H) values of tops can be reasonably well predicted from measurements of raw wool using the following formulas.
Hauteur = 0.52 SL + 0.47 SS + 0.95 D – 0.19 M* – 0.45 VM – 3.5
CV(H) = 0.12 SL – 0.41 SS – 0.35 D + 0.20 M* + 49.9
where SL = staple lengthSS = staple strengthD = fiber diameter
M* = adjusted% middle breaksVM = vegetable matter base (see below)
Wool has useful elasticity. When slowly elongated without rupture and then subse-quently released, it will recover, initially showing a temporary set extension that is slowly lost with time; wool fibers can be elongated up to 30% and fully recover
© 2003 by CRC Press LLC

with time. This inherent elasticity is a contributory factor to the ability of wool to recover from wrinkling, particularly noticeable in lightweight fabrics.
ColorWool from most domesticated breeds of sheep is nearly always white, although the degree of whiteness may vary considerably, and some pigmented fibers can be present as contaminants. However, years of breeding have resulted in the majority of wools containing a negligible amount of such fibers. Greasy wool may be dis-colored, usually varying in shades of grey or yellow. Most of this color is removed by scouring, as it is largely caused by grease and dirt. Some stains are not scourable, in which case the fibers may be dyed a dark color.
Measuring the color of the substrate is an important part of modern dyehouse practice. Discoloration restricts the colors to which wools can be dyed, so white wools are preferred. Wool color measurements should be carried out on scoured samples. This is termed the base color or clean color. If color measurements are to be made of uncleaned wool samples the values are called as-is color. Tristimulus*
values X, Y, and Z are determined to identify the precise color. Y is associated with brightness, and Y–Z is a measure of yellowness. A bright white wool has a high Y value and a low Y–Z value. Typical values for wools of good, average and poor color are as follows:
Vegetable Content, Grease, and YieldGreasy fleece contains moisture absorbed by the fiber, wool grease (lanolin), suint (perspiration), pesticides, dirt, and vegetable matter. It is of commercial importance, therefore, to establish the actual percentage of pure dry wool in a consignment of greasy wool, i.e., the yield. The main producing countries follow a market procedure where wool bales are sampled and tested before auction so that buyers see a repre-sentative sample and full test information prior to sale.
The percentage of the impurities varies considerably in the different classes. Merino quality will contain around 45 to 55% of impurities. New Zealand wool usually contains less than 1% vegetable matter. These impurities may be categorized as indicated in Table 1.7. The table also indicates the production stages in which the impurities are removed during yarn manufacture. Importantly, the advent of pollution control measures [e.g., European Pollution Prevention and Control (IPPC) Directive 96/61/EC] means that the scouring process (see Chapter 2) has to conform to environmental best practice for scouring effluent so as to meet the stringent
* Color is determined by tristimulus values defined by Commission Internationale de l'Eclairage (CIE) publication for illuminant D65.
Tristimulus Values
Color assessment X Y Z Y–Z
Good 60.0 61.5 58.5 3.0Average 56.1 57.1 52.0 5.0
Poor 51.5 52.8 45.3 7.5
N.Z. Standard 8707:1977.
© 2003 by CRC Press LLC

regulations imposed. This, in turn, means a stronger shift to wools of low residue, particularly with respect to pesticides applied externally to sheep (ectoparasiti-cides).
Crimp, Bulk, Lustre, ResilienceCrimp, which is usually measured microscopically, occurs in the form of waves or curls along the fiber length and gives wool its natural resilience. The number of waves is closely associated with fiber fineness; finer fibers generally have more crimps per inch. Fiber crimp is a major factor affecting yarn bulk in that crimpy wool produces more bulky yarns. Loose wool bulk — an indirect measure of fiber crimp — is closely linked with yarn bulk, which is related to cover in a carpet, and in woven or knitted fabrics.
Resilience is the springiness of a fiber mass, or the ability of a fiber to come back to its original volume after compression. There is a strong correlation between compressibility, yarn bulk, and covering power. Resilience is important in wool, as it enables wool fabrics to retain shape, have good drape, and resist wrinkling. It is also a property that is highly desired in carpet wools.
Wools vary in lustre, and lustrous wools can be difficult to process, as they are less cohesive. In carpets, such wools are associated with shading effects. Lustre is inversely correlated with bulk, so measurement of bulk can advantageously be used to assess lustre where lustre is required.
MedullationThe hollow medulla cells reflect light and make medullated fibers, especially kempy fibers, appear opaque. When these fibers are dyed together with nonmedullated
TABLE 1.8Comparison of Fiber Properties for Staple-Spun Yarns
Fiber typeFineness
(dtex)Staple length
(mm)Tenncity (cN/tex)
Breaking extension
(%)Density (g/cm3)
Percentmoisture
20°C/65% RH
Cotton ~1.7 <40 34 7 1.52 7Wool 2.2–38 35–350 10b
15c
40 1.31 17
Cellulosic: Rayon Lyocell
1.3–3.3 Cut to any length required in manufacture
12–20 (8)35 (29)
25 (35)14
1.52 12–13
Polyamide <1a–18 49–38 22–45 1.14 4Polyester <1a–6 35–31 25–40 1.38 0.4Polypropylene 2.2–120 80–75 17–20 ~0.9 0Acrylic <1a–22 25–20 28–35 1.14–1.17 1–2
a. microfibers 0.5–0.9 dtex
b. single fiber
c. staple bundle wet strength
© 2003 by CRC Press LLC

fibers, they look much lighter because of the reflected light. In fine wools, the percentage of medullated fibers is very low, ~0.1%. Their presence may be detri-mental to the wool quality. They are more difficult to spin, introduce a harsh handle (feel) to fabrics, and, by their tendency to give a lighter shade, can be a cause of uneven dyeing faults in fabrics, producing a “tippy” effect.
These hollow fibers are sometimes considered to be desirable in carpets, because they impart improved resistance to compression of the pile. Their stiffness gives increased bulk to yarns and a firmer handle and resilience to carpets. Yarns become much hairier, which is desirable for Berber carpet yarns. However, with light, plain shades, medullated wool is undesirable. New Zealand Drysdale wool is a medullated fiber that is used in blends for carpet yarns.
1.7.2.3 Speciality Hair Fibers
Animal fibers, other than sheep’s wool, that are used in the production of textile fabrics are generally classified as speciality hair fibers (see Figure 1.10). They may be spun in their pure form (i.e., 100%) or as a blend component for enhanced fabric aesthetics, especially for increased fabric softness and lustre. Because of their properties giving exceptional fabric aesthetics, they are also commonly referred to as luxury fibers.
Luxury fibers, which include silk, are not produced in large quantities, but their much-desired sensual characteristics make them important raw materials in the luxury apparel and fine furnishings sectors. The more important of the speciality hair fibers are from the goat family; the Angora goat that produces mohair fibers and the Kashmir goat from which we obtain cashmere fibers.
Mohair accounts for only 0.1% of the global production of natural fibers, i.e., 15,000 tonnes (www.fao.org) compared with approximately 19 million tonnes for cotton and 1.3 million tonnes for wool. An accurate figure for cashmere fiber production is difficult to acquire. However, current estimates of global production of the fiber are within 4500 to 5000 tonnes.
Mohair
Mohair is the hair fiber that forms the long lustrous coat of the Angora goat, genus Capra, a species indigenous to Turkey but said to have originated in Tibet (although this is subject to speculation). The Angora breed is thought, however, to be around 3000 years old and to have evolved within the Anatalian Plains of Turkey, close to the modern city of Ankara (formerly Angora), from which the breed derives its name. The name for the fiber (mohair) comes from the Arabic word mukhayyar [mukhyar] meaning “best of the selected fleece.” Today, the major producers of mohair are southern Africa (South Africa and Lesotho), followed by the U.S. (Texas). Other significant but much smaller producing countries are Turkey, Argentina, Australia, and New Zealand.
Mohair is a very hard wearing and versatile fiber, which is used in its pure form and in blends for both clothing and furnishing fabrics. Mohair fibers give good comfort fabrics; besides being a desired raw material for warm winter luxury gar-ments, the fibers are also processed into suiting fabrics that are comfortable to wear in humid conditions and are popular in the Far East, particularly in Japan. About
© 2003 by CRC Press LLC

12% of total mohair production goes into furnishings, such as upholstery velours and moquettes; mohair fiber gives these fabrics good soil and pill resistance and also has useful flame resistance and high sound absorbency.
Types of Fleeces
Based on the formation of the lock, there are three primary types of fleece.
1. Tight lock (which is in ringlets along its length)2. Flat lock (which is wavy and gives a bulky fleece)3. Fluffy fleece
The preferred fleece is the tight lock, but the fiber of the flat lock has acceptable properties. The fluffy fleece is open in character, and the fiber is weak and of the lowest quality.
Fleece quality is determined by the diameter, lustre, and softness of the fibers; by the yield after scouring; and by the level of kemp fiber contamination. Grading is based primarily on fiber diameter, and the age of the goat is probably the most important factor in terms of both the quality and the quantity of mohair produced.
Fleece production increases from birth and peaks at approximately three or four years of age, averaging around 4 to 5 kg p.a. for females and 5 to 6kg p.a. for males. Kid mohair is generally from offspring less than a year old; it is the finest and softest mohair fiber and is used for high-fashion garments. The fiber from a one- to two-year-old goats is termed young goat mohair; this is longer than kid mohair and has acceptable softness and lustre. Adult mohair is the material from animals over two years old, which give the longer and coarser fibers.
The unwanted part of the fleece is the kemp fibers. These are short, very medullated, coarse fibers that have reduced dyeability and, in the dyed fabric, appear lighter in color than the finer mohair fiber. Kemp is undesirable in a fleece, and various genetic selection breeding programs are underway in producer countries, aimed at eliminating or reducing kemp fibers to negligible levels.
Physical Properties
The unscoured raw fiber has a yellowish or greyish-white color and contains 15 to 25% impurities such as sand, dust, and grease, the latter being less than 4%. After scouring, the fiber becomes lustrous, and the best qualities are clear white. On average, Angora goats grow fiber at a rate of 20 to 25 mm per month, so the staple length depends on the time of shearing. Half-year growths range from 100 to 150 mm, and a full-year’s growth is around twice the half-year length. Because of the differing ages of the kids at shearing, the length distribution is wider than for young and adult goats.
Fineness is the main factor of importance. The fiber diameter increases with the age of the goat. Kid’s fleece has an average fiber fineness of 23 to 30 µm, with a dispersion of 11 to 35 µm at the finer end and 14 to 40 µm at the coarse end. The fineness of young and adult goat fleeces may range from 30 to 60 µm, with corre-sponding dispersions of 15 to 50 µm and 35 to 90 µm.
© 2003 by CRC Press LLC

Mohair, like wool, consists of the protein keratin. Microscopically, the fiber structure is also similar to wool, but there are important differences that give it its desirable characteristics. The epidermal scales are less distinctive than wool and are only slightly overlapping, lying close to the stem. The scale length ranges from 18 to 22 µm, and there are about 5 scales per 100 µm, compared with 10 to 11 for a fine wool fiber. These differences give the mohair fiber its smooth texture and high lustre, since light rays are directly reflected, rather than scattered, from the smooth surface.
The cortical layer appears as clear striations throughout the fiber length and, with some fibers, cigar-shaped air pockets, called vacuoles, are present between the spindle-like cells of the cortical layer. These air pockets appear as black dots in the fiber cross section. The cross section has a high degree of circularity; the major–minor diameter ratio is around 1.12.
The number of medullated fibers is usually less than 1%, and the continuous medullas are the most common type, but interrupted or fragmented types can be present.
Cashmere
Called the “fiber of kings,” cashmere fiber has long been valued for its luxurious softness, and its use in Western civilization can be dated back to Roman times. The fiber comes from the Kashmir goats (Capra hucus laniger), from which the name of the fiber is derived and which originated in Tibet. These goats are farmed in the mountainous regions around the Himalayas and Central Asia, particularly the regions around the Gobi Desert (i.e., Tibet and Mongolia) and in Turkestan and the Kashmir region of Northern India. The natural color of cashmere may be white, grey, or tan, and the goats of the Gobi desert region give the much-preferred white fibers. Variants of the breed are found in Iran, Afghanistan, and, to a lesser extent, Turkey. The fiber from these goats is less desired because of its darker color and the coarseness of the fiber, which results in an end product that is not as desirable as that obtained from the white fiber.
The knitting industry is the largest user of cashmere, especially that of the United Kingdom; Scotland is one of the biggest markets outside of China. White, un-pigmented cashmere fiber is preferred, because it is the easiest to dye, giving an unblemished color, particularly pastel shades. As a consequence, 60% of the total world production of cashmere fiber comes from China, which amounts to around 3000 metric tonnes. The finest cashmere is produced north of the 40th parallel in Inner Mongolia, north of the Yangtze River, and Inner Mongolia accounts for about 70% of the Chinese production. The less desirable darker fibers are processed mainly for woven cloth.
The Kashmir goat has an outer coat of predominantly straight, coarse, and long “beard” or “guard” hairs and a smaller amount of fine downy undercoat fibers grown during the winter months under the more weather-resistant guard hair. The undercoat fiber is the material that is wanted, and it was traditionally made into shawls, called pashmina, by the villagers in the Kashmir region. During the warmer spring period, the down moults and can be removed from the coat by combing or shearing. Traditionally, the two fiber types were separated by hand, but the commercial practice is to use mechanized systems of fiber separation.
© 2003 by CRC Press LLC

Physical Properties
Cashmere undercoat fiber is composed of a cortical layer and epidermis. There are approximately 6 to 7 scales per 100 µm, which slightly project beyond the cortical layer to give the fiber a serrated appearance. The fiber length varies from around 32 to 90 mm. The fiber is effectively circular; the average fiber diameter of a sample of the undercoat is likely to be within 12.5 to 21 µm with a coefficient of variation on the order of 18 to 20%, which means the fiber is of a fairly uniform fineness. Chinese cashmere is at the finer end of the range, with an average diameter of between 12.5 and 16.0 µm, with 15 µm being a standard fiber. The length is usually greater than 32 mm, with a measured length of around 46 mm being considered a long fiber. The variants from Iran, Afghanistan, and elsewhere are usually coarser, with Mongolian cashmere being between 16 and 17 µm and the others 17 to 21 µm. Whereas Chinese cashmere is used for knitwear, the others are spun into yarns for weaving.
The guard hair is made up of the epidermis, the cortical layer, and the medulla, which forms the greater part of the fiber. Guard hairs are 38 to 130 mm long and are not only coarse but very irregular in diameter; the average diameter is around 62 µm with a spread of 30 to 150 µm.
1.7.2.4 Silk Fibers
Silk fibers are produced as continuous protein filaments by several insects. How-ever, the commercial material, cultured silk, is produced by the farmed larvae of a caterpillar, called the silkworm, which uses the silk to form its cocoon. This species of silkworm is Bombyx mori, more commonly called mulberry silkworm because the caterpillar feeds on mulberry leaves. The culture of silk originated in China and, based on Chinese myths, can be dated back to 2640 B.C. The industry gradually spread to such countries as Japan, Turkey, Spain, Italy, France, and U.S. There are also wild varieties of silkworms such as the Eri, Muga, and Tussah (Tussa or Tussur) that are mainly found in India and China and feed on castor oil plants or, in the case of Tussah, on oak trees that are kept as shrubs at a height of 1.5 to 2 m by pruning.
In producing silk, the caterpillar builds its cocoon by winding and gumming the silk thread, layer upon layer, around its body. After its transformation to a moth, the cocoon thread is degummed and unwound to obtain the raw silk of 1.9 to 4.4 dtex fineness, a process called reeling, and the resulting filament threads are then twisted together (folded or doubled) to obtain the desired count of continuous filament yarn, the process being termed silk throwing and the manufacturer a throwster. Hence, thrown silk is a plied yarn made of continuous filament silk. With respect to spun yarns, it is the discrete length silk fiber that is of interest, and waste silk forms the basic raw material.
Waste Silk
There are two primary sources of waste silk: gum waste (occurring, as the name implies, at the reeling stage) and throwster’s waste (resulting from the production of thrown silk and the subsequent processes of cloth production).
© 2003 by CRC Press LLC

The waste silk can be classified into the following four qualities, according to length:
• First quality: average length 165 mm; spread 73 to 250 mm• Second quality: average length 114; spread 60 to 152 • Third quality: average length 89; spread 50–152 • Fourth quality: the waste from the production processes used to convert
the above qualities in spun yarns
The fiber of the first three qualities is first converted into sliver by gilling and then processed into a yarn (see Chapter 2). The lowest-quality waste, termed silk noils,has many very short fibers but may be used as a blend component in the production of woolen yarns.
1.7.2.5 Manufactured Fibers [Man-Made Fibers (MMFs)]
Table 1.8 lists, alongside values for cotton and wool, the properties of man-made fibers commonly spun either in their pure form (termed 100%), in blends (e.g., 50/50%, 65/35%) with each other (e.g., polyester/cellulosic blends), or in blends with cotton or wool to develop a wide range of yarns that give many fabrics their real utility value.
There is an important distinction between cellulosic and synthetic fibers. Cellu-losic fibers (e.g., viscose, lyocell), are made from wood pulp, whereas synthetic fibers (e.g., nylon, acrylic, polyester, polypropylene) are made from chemicals frac-tionated from crude oil. The actual fiber formation process is called fiber spinning, but it is effectively extrusion of polymers through sets of very small holes termed spinnerets. In general, fibers may be produced by either a dry-spinning, wet-spinning, or melt-spinning process. In the dry-spinning process, the polymer, dissolved in a solvent solution, is extruded through the spinneret into a vertical chamber through which warm air is circulated to evaporate the solvent and congeal the polymer into filaments. For wet spinning, the solution is extruded into a bath (a coagulation bath) containing an appropriate chemical for coagulation of the polymer to occur by the action of diffusion. With melt spinning, as the term implies, the molten polymer is extruded through spinnerets in a vertical chamber where the molten filaments are cooled with circulating air. Following the spinning stage, the extruded tow of fila-ments are subjected to a high degree of stretching to align the constituent polymers and achieve the required fiber fineness and usable tensile properties. The tow may be then cut to produce fibers of a length suitable for processing by the various staple-yarn spinning routes.
The manufacturing processes can be adapted to impart specific properties to fibers so as to achieve certain functional requirements, e.g., flame retardancy, and end uses. Choice of spinneret enables different shapes of fiber cross section (round, trilobal, etc.) and fiber finenesses to be made — finer than the finest cotton (<1 dtex, microfiber). Fibers can be straight or crimped, giving a greater bulk than wool to insulate against the cold, and they can be made to transport moisture much better than natural fibers. Additives to the polymer solution prior to extrusion (e.g., delus-
© 2003 by CRC Press LLC

tring pigment) enable dull or semidull as well as bright fibers to be produced. References are given at the end of the chapter for the reader who is interested in the detailed polymer synthesis and extrusion processes for producing fibers.8,10
Viscose Rayon and LyocellThere are several man-made cellulosic fibers, but viscose rayon and lyocell are the more important ones with respect to staple-spun yarns. Both are produced by the wet extrusion process, but, whereas rayon is produced using solutions of sodium hydroxide and dilute sulfuric acid,10 lyocell is called a solvent spun cellulosic, as the production involves organic solvents that are retrieved at the end of the manu-facturing process, making it environmentally friendly (certified OEKO TEX Stan-dard 100).47
Like cotton, both fibers have good moisture absorbency and are generally com-fortable to wear. Lyocell is more absorbent than cotton but less so than rayon. Cellulosic fibers are not resilient to wrinkle, but lyocell has moderate resiliency. It does not wrinkle as easily as rayon and cotton. Lyocell is the strongest of the three cellulosic fibers in both dry and wet states. Market areas for cellulosic fibers include women’s fashion garments as well as men’s shirts and casual wear.
Polyamide (Nylon)Polyamide fibers are melt-spun. Characteristically, they are very durable and resistant to abrasion, have good strength and elasticity, are easy to wash, are quick-drying, and give fabrics with good shape retention. Primary consumer end uses are clothing (wool blends for outerwear, stockings and tights, lingerie, corsetry) as well as sports and swimwear.
PolyesterThese fibers are also produced by the melt spinning process. The process is highly developed to produce fibers suitable for a wide range of applications. Fibers can have round, oval, or angular profiles to assist in developing soft fabric handle. Polyester fibers have good tensile properties that provide fabrics with above-average wear qualities. They are particularly resistant to light and weather, have good mois-ture transport, are quick drying, and can withstand climatic effects. Fabrics of 100% polyester or polyester rich blends have good crease resistance and shape retention.
Polyester fibers are the popular choice for apparel, in particular trousers, skirts, dresses, suits, jackets, blouses, and outdoor clothing. Blends with man-made cellu-losic fibers, cotton, and virgin wool are widely used; the “classical blends” are around 65% polyester/35% man-made cellulosic fibers or cotton, and 55% polyester/45% wool.
AcrylicDry and wet spinning are employed in producing acrylic fibers. The largest propor-tion of the production is made and used as crimped staple fibers. They can be given high bulk, and they have low thermal conductivity, good shape retention, durability, and easy-care properties. Its softness of touch and bulk makes it attractive for use in the knitwear sector. These positive features of acrylic fibers are also apparent in blends with wool or other natural fibers. Hence, 75% of acrylic fibers are used in
© 2003 by CRC Press LLC

apparel, 20% in home furnishings, and 5% in industrial end uses. For apparel, these fibers are used in jumpers, waistcoats, cardigans, jackets, socks, knee-high stockings, and training and jogging suits, either pure or in blends with wool. Modacrylic fiber is a modified form of acrylic used in flame-retardant garments, in children’s and baby wear, and in doll clothes and soft toys.
PolypropyleneThese are melt-spun fibers and, although produced in significant tonnage from a yarn perspective, they are largely used in filament form. Little of the fiber is used in staple-spun yarns because of the difficulty in conventionally dyeing the fiber (generally, dye pigments are added to the molten polymer). The vast majority of the staple fiber finds applications in the nonwovens sector. Polypropylene fibers have a density less than 1.0 and, therefore, at a given decitex, are thicker than other man-made fibers and give more cover. They do not absorb moisture, which is an advantage in many technical textiles end uses. They also have a high resistance to chemical attack, and additives may be used to give the fibers resistance to UV degradation.
REFERENCES
1. Hearle, J. W. S., Hollick, L., Wilson, D. K., Yarn Texturing Technology, Textile Institute, Manchester, UK, 2001.
2. Udo Schweizer’s Texturing Pages, Int. Fiber J., 11(5), 1996.3. Oxtoby, E., Spun Yarn Technology, Butterworth-Heinemann, Woburn, MA, 1987.4. McIntyre, J. E. and Daniels, P. N., Textile Terms and Definitions, 11th ed., Textile
Institute, Manchester, UK, 1999.5. Goswami, B. C., Martindale, J. G., and Scardino, F. L., Textile Yarns: Technology,
Structure and Applications, John Wiley & Sons, New York, 1977.6. Meredith, R., and Hearle, J. W. S, Physical Methods of Investigating Textiles, Wiley
Interscience, New York, 1959.7. Saville, B. P., Physical Testing of Textiles, Woodhead Publishing Ltd., Cambridge,
UK, 1999.8. Ziabicki, A., Fundamentals of Fiber Formation, John Wiley & Sons, New York, 1976.9. Mukhopadhyay, S. K., Advances in Fibre Science, Textile Institute, Manchester, UK,
1992.10. Moncrieff, R. W., Man-Made Fibres, Butterworth-Heinemann, Woburn, MA, 1970.11. Fiber Economics Bureau, Inc., Arlington, VA, Fiber Organon, June 2000.12. Comité International de la Rayonne et des Fibres Synthétiques, 37th Annual Report,
2000.13. Koslowski, H. J, International Textile Fibre Markets are Changing, Melliand Inter-
national, 6, 170–174, 2000.14. Nickerson, R. F., History, growth and statistics of cotton, textile fibre, Matthew’s
Textile Fibres: Their Physical, Microscopical and Chemical Properties, Chapter 5, H. R. Mauersberger, Ed., 6th ed., John Wiley & Sons, Inc., New York, 1954.
15. Stout, H. P., Manual of Textile Technology: Fibre and Yarn Quality in Jute Spinning, Textile Institute, Manchester, UK, 1988.
16. http://www.epa.gov/region2/health/asbestos.htm.17. http://www.lungusa.org/air/envasbestos.html.18. http://www.hc-sc.gc.ca/english/iyh/environment/asbestos.html.
© 2003 by CRC Press LLC

19. http://www.fibretech.com/PDF/PRODUCTS/microtexauto_datasheet.pdf.20. http://www.bekaert.com/bft/BFT_HTM/300.htm.21. http://www.technical-textiles.net/pubs.htm.22. http://www.texdev.com/textiles.htm.23. Frank, R. R., Ed., Silk, Mohair, Cashmere and Other Luxury Fibres, Woodhead
Publishing Ltd., Cambridge, UK, 2000.24. http://www.ams.usda.gov/cotton/ctnord.htm.25. http://www.ams.usda.gov/standards/cvrstd6.pdf.26. Zellweger Uster, Measurement of the quality characteristics of cotton fibres, Uster
Bulletin, 38, 1991.27. Ethridge, M. D. and Cole, W. D., Examination of effects of contamination of naturally
white cotton with naturally coloured cottons, Textile Topics, Fall 1997, 1–4.28. Booth, J. E., Principles of Textile Testing, Butterworth-Heinemann, Woburn, MA,
1984.29. University of Arizona, Sticky Cotton Sources and Solutions, A Cooperative Extension
IPM Series No. 13, 1999.30. Schenek, A., Problems in testing cotton fibers, ITB Yarn and Fabric Forming, 3,
19–24, 1994.31. Schenek, A., International Harmonisation of Cotton Test Methods, ITB Yarn and
Fabric Forming, 2, 62–66, 1990.32. http://www.cottoninc.com/NonWovens/homepage.cfm?PAGE=41.33. http://www.geocities.com/vijayakumar777/cottonfiber.html.34. Ganatra, S. R., Munshi, V. G., and Srinathan, B., Nepping Potential of Cotton Blends,
Cotton Technology Research Laboratory Publication, Indian Council of Agricultural Research, Series 197, 1982.
35. Garner, W. E., Fibre Quality and Ginning Performance of Machine Picked and Stripped Cotton, USDA Report and ERS Marketing Research Report No. 852.
36. Weisser, S., A Method of Determining Short Fibre Content in the Production of Cotton Yarns, PhD Thesis, The University of Leeds, UK, 1999.
37. Sanderson, K. W. and Hunter, L., The correlations between different measures of cotton short fibre content, spinning performance and yarn properties, Melliand Tex-tilberichte, 7, E197, 1986.
38. Muller, M., Precise measurement of important fibre properties in cotton, International Textile Bulletin, Yarn Forming, 3, 73–88, 1991.
39. von Berger, W., Wool, history grades, and statistics, Matthew’s Textile Fibres: Their Physical, Microscopical and Chemical Properties, Chapter 6, H. R. Mauersberger, Ed., 6th ed., John Wiley & Sons, Inc., New York, 1954.
40. Ryder, M. L. and Stephenson, S. K., Wool Growth, Academic Press, London, 1968.41. Crawshaw, G. H., Objectively Specified wool blends: A major advance for the woollen
and worsted industries, Int. Textile Bul., Textile Leader, 2, 8–16, 1988.42. http://www3.cybex.gr/weissoutdoors/a.wool.htm.43. Phillips, D. G., Piper, L. R., Rottenbury, R. A., Bow, M. R., Hansford, K. A., Naylor,
G. R. S., The Significance of Fibre Diameter Distribution to the Wool Industry, Review of a CSIRO Workshop, CSIRO Division of Wool Technology, 27–28 Nov. 1991, Report No. G72, 1992.
44. Muller, M., Practical Application and Interpretation of Long-Staple Test Data, Int. Textile Bul., 4, 48–57, 1990.
45. Huson, M. and Turner, P., Intrinsic Strength of Wool: Effect of Transgenesis, Season and Bloodline, CSIRO Textile and Fibre Technology, http://www.tft.csiro.au.
© 2003 by CRC Press LLC

46. Lamb, P. R. and Yang, S., The Commercial Impact of Fibre Properties in Spinning, presentation at IWTO Technology and Standards Committee, Dresden, 1998, CSIRO Textile and Fibre Technology, http://www.tft.csiro.au.
47. http://www.resil.com/articles/articlewetproclyocell.htm.
© 2003 by CRC Press LLC

APPENDIX 1A
Derivation of Equation for False-Twist Insertion
where Ns = the twist insertion rate in turns per minuteVd = filament strand speed in m/min
Zone AX = L metersZone XB = K meters
L does not = K
Assumptions:
• At time t = 0, no twist is present in the strand.• When twist is inserted in each zone, it is uniformly distributed.• Twist contraction is negligible.• At time t = t1, there are x turns/m in zone AX, and y turns/m in zone XB.
1A.1 TWIST EQUATION FOR ZONE AX
At time t = t1 + dt, the number of turns in zone AX will be the sum of the following:
• The turns already present = xL.• The turns inserted by the twisting device = Ns dt.• The turns lost because of the filament length moving into zone XB =
x Vd dt.
Ns
Vd
L K
A X B
© 2003 by CRC Press LLC

Thus, the twist level in AX at t = t1 + dt = x + (Ns − x Vd) dt/L
The change in twist, dx, is
dx = (Ns − x Vd) dt/L
Rearranging,
when t = 0, x = 0, thus the result of the integral gives
1A.2 TWIST EQUATION FOR ZONE XB
Following a similar reasoning to that above, the change in twist in Zone XB is
Rearranging,
multiplying throughout by and integrating gives
(A.1)
If L = K,
(A.2)
xdNs x– V d
-----------------------∫ 1L---= dt∫
xNs
V d
------ 1 eV d– t
L---
– =
dyxV d Ns V c y+( )–[ ]dt
K------------------------------------------------------ 1
K---- Nse
V d– tL---
V d y+ dt–= =
dydt------
V d yK
-----------+Ns
K------e
V d– tL---
–=
eV d– t
L---
yNsL
V d L K–[ ]------------------------- e
V d– tL---
eV d– t
K----
– –=
yNs
K------te
V d– tK----
–=
© 2003 by CRC Press LLC

APPENDIX 1B
Fiber Length Parameters
1B.1 STAPLE LENGTH
Staple length came into use well before suitable methods for measuring fiber lengths were devised. It was used by graders, merchants, and spinners for raw fiber business transactions. It is a measured estimate of the principal length of a tuft of fibers. Cotton staples are prepared by hand-and-visual assessment (i.e., hand straightened and parallelized) and therefore influenced by personal judgement, which makes the measured estimate subjective. Accordingly, it is still possible to find individuals differing in their judgement by as much as 1 to 1.5 mm (0.04 to 0.06 in.) in extreme cases. A wool staple is usually considered to be a well identified bundle of fibers that is removed from a mass of greasy wool. However, the “well identified bundle” is a subjective one.
1B.2 FIBER LENGTH DISTRIBUTIONS
Cumulative frequency distribution (CFD). This is more commonly called the staple diagram (in short staple spinning) or diagram of Hauteur (worsted spinning). It shows, for a random sample taken from a fibrous mass, the proportion of fibers that are greater than specified lengths. It is produced by sorting, either by number or by weight, the straightened lengths of the individual fibers making the sample. The following CFD was obtained manually by the Suter-Webb method, where a sample of fibers was separated into to small class groups of known lengths, with a class interval of 3 mm (0.12 in.). The groups were weighed and the data used to determine the relative percentages (abscissa) of the fiber mass weighing greater than the specified lengths shown along the ordinate.
1B.3 CFD BY SUTER-WEBB
Percentage of fibers (%). From Figure B.1, the “effective length” proposed by Clegg (the length that gives optimum drafting roller settings for this distribution of lengths) and the short fiber content defined by Lord can be determined as illustrated in Figure B.2.
© 2003 by CRC Press LLC

• The ordinate OA is divided in half, to OQ and QA.• The horizontal through Q intersects the curve at P′.• The perpendicular through P′ intersects the abscissa at P.• OK is the first quarter of OP.• The perpendicular through K intersects the curve at K′.• The bisection of KK′ is S.• The horizontal through S intersects the curve at R′.• The perpendicular through R′ intersects the abscissa at R.• The “effective length” = LL′ corresponding to the first quarter of OR (i.e.
L%).• The short fiber content (SFC) is RB%, i.e. fibers < RR′.
The Almeter is a widely used instrument for determining a the CFD more speedily. This gives the frequency histograms as well as the CFDs of the fiber lengths determine by number and by weight. The mean fiber length (MFL) (some-times shortened to mean length (ML) or Hauteur (H), the coefficient of variation about the mean, and percentage short fibers according to specified minimum lengths.
24
20
16
12
8
4
00 10 20 30 40 50 60 70 80 90 100
Percentage of Fibers (%)
CFD BY SUTER-WEBB
Length(mm)
FIGURE B.1
A
O
Q
K
S
L P
P′
R
R′
B
K′L′
FIGURE B.2
© 2003 by CRC Press LLC

Cumulative frequency distribution of span length (CFDSL). This only applicable to short-staple spinning and is commonly called the fibrograph or fibrogram. It is based on the way fiber lengths occur in textile processes when caught by roller nips as illustrated in Figure B.3.
At any instant in time, fibers caught by the roller nips will depend on the randomness of their overlapping lengths; therefore, not all the length of a given fiber projects into draft zone. The lengths that project into the draft zone are called the span lengths, and the cumulative frequency distribution of the span length gives the fibrogram. In comparison with the staple diagram, its importance is that it gives a graphical representation of the fiber segment lengths found to influence drafting processes. (See Chapter 2.) In this respect, various parameters relating to the actual lengths of the fibers projecting into the draft zone can be determined. They are as follows (see Figure B.4):
1. Upper-half-mean length (UHM). This is defined as the mean length of the longer half (50%) of the fiber distribution by weight (ASTM-D 4604 and D 4605).
2. Upper quartile length (UQM). This is defined as the fiber length that is exceeded by 25% of the fibers by weight in the test sample based on the staple diagram method (ASTM-D 1440-90).
3. Length uniformity index (LUI). The LUI is the ratio of the mean length (ML) and the UHM expressed as a percentage (ASTM-D 4604 and D4605).
4. Length uniformity ratio (LUR). This is the ratio of 2.5% and 50% span lengths.
Fibers CaughtSomewhere AlongTheir Lengths
Span Length
Strand
Fibrogram
Rolls
Nip of Rolls
Draft Zone
FIGURE B.3 (Courtesy of Spinlab, Inc.)
© 2003 by CRC Press LLC

100%
2.5% Span Length
2.5%
Span Length0
Y
Perc
enta
ge o
f Fi
bers
X
Span Length0
X
100
2550
0
Y
Perc
enta
ge o
f Fi
bers
UHM UQM
50% Span Length
25% Span Length
FIGURE B.4
© 2003 by CRC Press LLC

Materials PreparationStage I: Opening, Cleaning, and Scouring
2.1 INTRODUCTION
In Chapter 1, it was shown that the yarn production process sequence generally hasfive stages (see Figure 1.8, in Chapter 1).
Stage I. Opening and cleaning Stage II. Disentangling and further cleaning Stage III. Fiber straightening and parallelizing (with short fiber removal and
additional cleaning)Stage IV. Additional fiber straightening, parallelizing, and attenuationStage IV. Yarn formation
We may consider the first three stages collectively as material preparation. Thischapter is concerned with the process technology of stage I.
In the conversion of baled cotton into finished yarn, the primary purpose of thepreparatory processes is to open, clean, and parallelize the fibers and then presentthe material for spinning. In doing so, these processes convert a three-dimensionalbale of compressed, entangled, matted fiber mass into an orderly arrangement offibers in a one-dimensional continuous strand length. The objective is for the con-version to be achieved with minimal fiber breakage and no fiber entanglementremaining in the strand length. A great deal of attention has been paid to, amongother factors, improving machine setting and the operating speeds of componentparts so as to attain gentle working of fibers and to avoid fiber breakage.
Fiber properties (such as length, fineness, strength, elongation, frictional char-acteristics, and the level of impurities present in the fiber mass) are of much impor-tance to machine design and development. Man-made fibers (mmfs) present littleproblem where impurities are concerned, and, compared with natural fibers, theirproperties can be more easily modified to meet process requirements. Therefore, thedevelopment of most production machines has largely focused on cotton and wool
2
© 2003 by CRC Press LLC

processing; this is particularly so in the area of material preparation. Consequently,most available information on the subject of material preparation mainly concernscotton and wool fibers, and this is reflected in the present chapter. In certain areas,machinery developments, mainly concerned with component parts, have had to takeinto account the thermal and frictional characteristics of synthetic fibers. For theconversion of mmfs into semi-worsted yarns, machines have been developed togreatly shorten the production sequence. These topics are also covered in this chapter.
Over many years, machinery developments have been directed at improving yarnquality and reducing production costs by decreasing the number of production stages,reducing maintenance and labor requirements, and increasing production rates. Duringthe last decade, the rapid growth in microelectronics, dedicated software, and infor-mation technology has contributed to major advances in automation and productionmanagement through machine monitoring and process control. Where relevant, theimportance of these developments in the material preparation stages is explained.
2.2 STAGE I: OPENING AND CLEANING
The early stages of material preparation generally involve the removal of impuritiesfrom the fiber mass by mechanical or chemical means and the blending of the massto produce a homogeneous feed to stage II. Several machines are usually arrangedin sequence to carry out the cleaning and blending of the fiber mass. The type ofmachines and the sequence used will depend on the fiber type and grade to beprocessed. We first concentrate on the rudiments of cleaning and blending, givingexamples of machines employed for such tasks, and then present an overview of atypical machine sequence for short-staple, worsted, and woolen systems.
2.2.1 M
ECHANICAL
O
PENING
AND
C
LEANING
Ideally, the way to remove dirt and trash particles from within a fiber mass is tophysically separate the fibers and allow the foreign particles to fall away or to bepulled off the fibers. If fibers have nonparticulate matter on them that needs to beremoved (such as grease, to which dirt particles may adhere), this may be removedby scouring the fiber. In situations where there is a high level of particulate impurities,a combination of chemical and mechanical cleaning may be necessary. The chemicalused should degrade the physical properties of the impurities without damaging thefiber. In this way, the impurities can be mechanically removed easily.
In an industrial context, fiber mass has to be processed at rates of hundreds ofkilograms per hour (kg/h) for manufacturing operations to be economically viable.Cleaning therefore has to be done progressively, since it is not practical to separatehundreds of kilograms per hour of a fiber mass into individual fibers. For example,cotton fiber may be supplied to a manufacturing plant in compacted bales of about226.8 kg each. The bale dimensions may be typically 1.4
×
0.53
×
0.64 m, and thebale density is 478 kg/m
3
(www.cotton.org). If the individual fibers were, say, 30 mmin length and 1.7 dtex fineness, then there would be around 45 billion fibers in eachbale. A typical production rate of an average size plant would be 500 kg/h, whichwould mean separating nearly 98 billion fibers per hour (i.e., 27 million fibers per
© 2003 by CRC Press LLC

second), which is not a practical proposition. However, it is practical to break upthe hundreds of kilograms of fiber into a collection of progressively smaller andsmaller clumps, called
tufts,
until we obtain sufficiently small tuft sizes that can bethen separated into individual fibers at the required production rate. The action ofprogressively breaking up the fiber mass into smaller clumps is referred to as
opening
.
Definition:
Opening is the breaking up of the fiber mass into tufts.
During the process of breaking up the fiber mass into initially large tufts, these largetufts into smaller tufts, and so on, fibers of one part of a tuft bundle slide past fibersof the other part. Light particles of impurities, such as dust, are freed and can beremoved by air currents. Larger particles of leaf, seed, dirt, and sand that are lodgedbetween fibers are loosened, and some are sufficiently freed to be removed by beatingthe tufts against grid bars or perforated plates. We may refer to these actions as
mechanical cleaning
actions or
simply cleaning.
Definition:
Cleaning is the removal of unwanted trash by mechanical means.
Through random variations, fibers from differing parts of the same bale, as well asbetween bales of the same batch of raw material, will differ in properties, and thedifference is more marked for natural fibers than for mmfs. It becomes necessaryto mix, as thoroughly as possible, the fiber tufts obtained from opening the variousbales to be processed. We therefore speak of
tuft blending
or simply
blending
.
Definition:
Tuft blending is the mixing of fibrous tufts from opened bales toproduce a homogenous mass for consistent yarn properties.
Tuft blending may take place from the start of removing tufts from the baled fibermass, but machines purposely designed for blending are incorporated within thesequence of opening and cleaning machines so as to use a suitable tuft size foroptimal blending. Often, different grades of a natural fiber or different fiber typesare blended for reasons of product economics, product performance, or both. Tuftblending is therefore an essential part of the early processing stage. The reader mayreason that the best level of blending would come from mixing individual fibers,but, as we have seen above, the baled fiber mass cannot be “opened up” to the levelof individual fibers in the early processing stage. Intimate blending of individualfibers can take place during stages II and III. However, for a good-quality blend tobe obtained in stages II and III, it is important that small size tufts of the differentfiber types be homogeneously distributed so that, in stage II, the fibers of one typeare individualized in close proximity to those of the other fiber types.
Each machine that opens and cleans the fiber mass may be referred to as a
cleaning point,
although some machines do not reduce tuft size but only expel dust,dirt, and trash particles from tufts. Machines are usually placed sequentially in a
cleaning line
so as to progressively intensify the degree of opening and cleaningand to blend the tufts. The fiber tufts are usually transported from one machine toanother by airflow through connected ducting. At the end of the cleaning line, 40to 50% of impurities are removed (largely heavy particles), and the opened materialis then fed into the carding process of stage II.
© 2003 by CRC Press LLC

Opening and cleaning machines employ one or more of the following actions:
• The action of opposing spikes, which is principally an opening action• The action of beater and grid bar, which gives both opening and cleaning• The action of air currents, which gives only cleaning
The Action of Opposing Spikes
This is effectively an opening action and is usually used at the start of a cleaningline, where the baled fiber mass is initially opened up into large size tufts (e.g., upto 200 g). The machines at the start of opening and cleaning lines may be referredto as
bale openers,
and the following are typical examples. Figure 2.1 Illustrates the working principle of a
mixing bale opener, bale breaker,or hopper feeder
. This is a traditional way of initially opening the fiber mass. Itcomprises an extended feed apron (a) onto which layers of the fiber mass are placed,usually manually, a bottom apron (b) within a hopper that assists in transporting thefiber mass to an inclined apron (c) that is covered in spikes and, at the top of thislattice, a spike-covered lattice (d) and a spike stripping or doffer roller (e). Thespeeds of the component parts can be varied according to production rates. However,the inclined apron (c) operates at a faster surface speed than (b), and both (d) and(e) have higher surface speeds than (c). As illustrated in the diagram, (c) pluckslarge tufts from the fiber mass fed to it by (b). The gap between (c) and (d) can beset to ensure that the tufts are reduced to a predetermined size by a portion of tuftbeing removed and returned to the fiber mass on (b), with these portions therebybecoming mixed with new layers of the incoming feed.
Once reduced in size, the tufts are stripped from (c) by (e), the faster speed of(e) giving an additional amount of opening. The components (c) and (d) are termedthe
evener apron
and
evener lattice,
as the adjusted gap between the two componentsenables a reasonably even mass flow of opened tufts at the output. In some machinedesigns, (d) may be a spike roller, i.e., an evener roller. As described later, the evenerapron/evener roller may be used for “weigh-pan blending” of opened tufts.
The mixing bale opener gives a gentle opening action and can be used for theinitial opening of man-made fibers, since little cleaning is required, and of wool
FIGURE 2.1 Mixing bale opener. (Courtesy of Marzoli.)
© 2003 by CRC Press LLC

prior to scouring. It can also be used for the feeding of cleaned wools to the cardingprocess. When clean cotton waste is to be recycled and blended with virgin cotton,the mixing bale opener may be also used as a feed for the cotton waste. For short-staple processing, the production rates can be up to 600 kg/h, and up to 3,500 kg/hfor longer staples.
The initial opening of bales of virgin cotton and short-staple man-made fibersis commonly performed by machines called a
utomatic bale openers
. Figure 2.2depicts a typical arrangement. As shown, rotating opening rollers fitted with tootheddiscs are made to traverse a line of preassembled cotton bales, the toothed discsplucking tufts from each bale as they move from bale to bale. The arrows show thepath of tufts transported by airflow. Figure 2.2c illustrates the situation for twoopening rollers traversing the bale laydown. Whatever the traverse direction, oneroller will always have its working toothed discs opposing the traverse, while theother will be with the direction. Two layers of tufts are plucked in one pass of balelaydown; the opposing toothed discs pluck the first layer, and the discs rotating withthe traverse direction penetrate at a lower level from the bale surface to pluck asecond layer of tufts. It is claimed that the toothed discs give a gentle opening toprevent, or at least minimize, fiber breakage while producing smaller tuft sizes athigher production rates than the mixing bale opener. For production rates from 400to 1400 kg/h, tuft sizes fall with the range of 30 to 80 mg and, depending on machinetype, bales can be processed at an incline so as to facilitate better tuft blending. Balelaydowns can be up to 180 bales and, as the working head tower can be made toautomatically swivel, bales can be assembled on both sides of the traversed path(see Fig. 2.2d). This facility can enable early stage blending of tufts of, for example,a three-component blend as illustrated in Fig. 2.2d.
Automatic bale opening machines have yet to be developed for wool and long-staple man-made fibers. However, the action of opposing spikes has been used forfiner opening of long-staple materials. Figure 2.3 shows a
turbo opener,
or
pneumaticopener,
which may be linked to the outlet of a mixing bale opener and utilized tofurther open the fiber mass. As shown, a rotating cone covered in spikes is fitted tothe shaft of a motor drive. The housing matches the profile of the cone, and onesection is fitted with rows of spikes or saw-toothed wire. The clearance between thehousing and cone varies, becoming progressively narrower from the inlet to theoutlet; the latter is tangential to the rotation of the cone. As the cone rotates, thegenerated airflow sucks the tufts onto the spikes of the cone. With the continuedmotion of the cones, the tufts make contact with the stationary spikes and are furtheropened and then ejected with the airflow through the outlet. It is claimed that theturbo opener can process fiber finenesses and lengths of up to 150 dtex and 200mm, and achieve production rates of 3000 kg/h, depending on fiber type and thedegree of opening required.
Action of Beater and Grid Bars
This action gives the most effective opening and cleaning of fibrous material. It istherefore utilized in the cleaning stages following the initial opening. Depending onfiber type and the level of impurities, an intermediate opening and cleaning stagemay precede a final, intensive opening and cleaning stage, with both stages employ-
© 2003 by CRC Press LLC

FIGURE 2.2 Automatic bale opener.
(a) Diagram of automatic bale opener. (1) Control unit, (2) fi-ber bales, (3), working head with tooth discs, (4) swivel tower, and (5) air duct for ma-terial transport. (Courtesy of Rieter Machine Works Ltd.)
(b) Opening of cotton bales. (Courtesy of Marzoli.)
(c) Operation of tooth discs. (Courtesy of Trutzschler Gm-bH.)
(d) Two-sides laydown. (Courtesyof Trutzschler GmbH.)
© 2003 by CRC Press LLC

ing certain beater and grid bar combinations. There are three different ways ofapplying the beater and grid bar action. Essentially, these involve striking the fibermass while it is undergoing one of the following:
• being transported by airflow• held by a spike• held by a pair of feed rollers
With the last two combinations, the beater further opens the material into smallertuft sizes. In all three, the beater throws the tufts against a set of grid bars. The gridbars are spaced sufficiently close together to prevent tufts from passing betweenthem, but they allow trash particles clinging to the tuft surfaces to be ejected to waste.
The following machines illustrate typical examples of the application of thebeater/grid bar combination.
Beater, Grid Bar, and Airflow
Figure 2.4 illustrates arrangements for ejecting trash particles from tufts carried inairflow. The system comprises one or two rotating cylinders with rods or flexiblepins projecting from its surface (i.e., the beater) and a series of grid bars positionedbelow the beater. The system is used as a first cleaning stage for cotton tufts withhigh trash content and therefore receives tufts from the automatic bale opener. Thetwo-beater Axi-Flo unit gives added opening as well as cleaning. The outlet for thetransporting the airflow is located at a higher position than the inlet so that, onentering the system, small tufts, being lighter, are retained in the airflow and passthrough the system with little contact with the beater. This keeps fiber loss to aminimum. Large tufts, which cannot get lost through the grid system, follow a spiral
FIGURE 2.3 Turbo opener.
(Courtesy of Houget Duesberg Bosson.)
© 2003 by CRC Press LLC
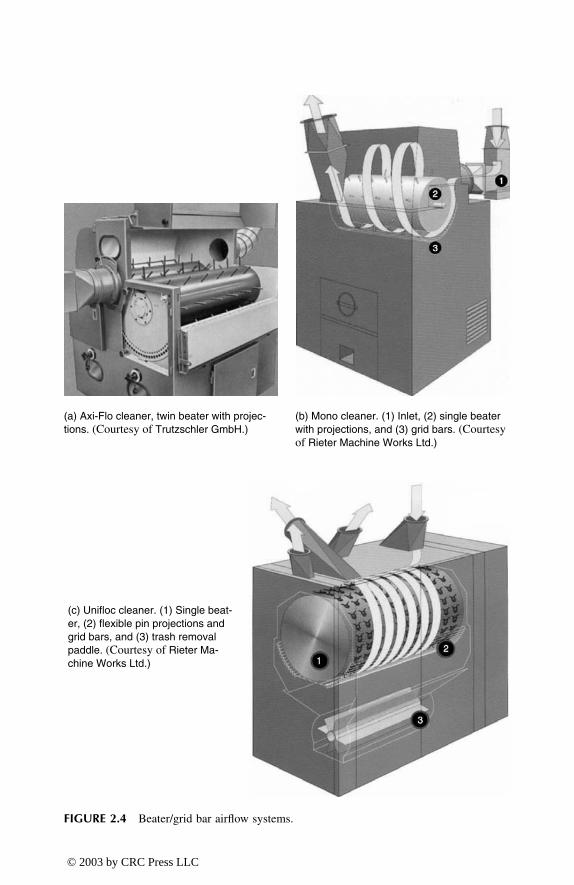
FIGURE 2.4 Beater/grid bar airflow systems.
(a) Axi-Flo cleaner, twin beater with projec-tions. (Courtesy of Trutzschler GmbH.)
(b) Mono cleaner. (1) Inlet, (2) single beater with projections, and (3) grid bars. (Courtesy of Rieter Machine Works Ltd.)
(c) Unifloc cleaner. (1) Single beat-er, (2) flexible pin projections and grid bars, and (3) trash removal paddle. (Courtesy of Rieter Ma-chine Works Ltd.)
© 2003 by CRC Press LLC

path around the beater to the outlet and, in doing so, make contact with the projec-tions on the rotating beater surface. The tufts are then flung against the grid bars toeject coarse trash particles. As these large tufts pass between the two beaters, theyare further opened by the action of opposing spikes.
The Unifloc single-beater system is a more recent development, and it takesadvantage of the small tuft size that can be produced by automatic bale openers.The pin projections from the beater surface are smaller and greater in number, andthe objective is to make contact with all tufts. It is claimed that, as well as removingthe heavy impurities of sand, dirt, and fine trash, working on small tufts enables theremoval of dust particles.
With these systems, curved plates are fitted above the beaters to control thenumber of spiral passes — usually a minimum of three times. The tufts are accel-erated, decelerated, and turned over during each pass. The angle of the grid barsand the space between them can be adjusted so as to optimize the amount ofimpurities removed and to minimize any removal of fiber. The beater speed rangeis 400–800 rpm, with a diameter of 750 mm and a working width of 1.6 m; productionrates are up to 1200 kg/h. Importantly, trash particles present in the tufts are notcrushed. This would increase the number of fine particles, thereby reducing theeffectiveness of the system and making subsequent cleaning more difficult.
2.2.2 S
TRIKING
FROM
A
S
PIKE
Machines that demonstrate this action are the multiple-beater cleaners. Figure 2.5shows one example, the inclined multiple-beater system, commonly called a
stepcleaner.
Step cleaners perform opening on large tufts by the actions of opposingspikes and with grid bars. Located below each beater is a series of points forremoving coarse trash particles. These units are used for the opening and furthercleaning of scoured wool prior to carding. The inclined multiple-beater cleaner mayhave from three to six beaters, depending on the amount of opening required and/orthe quantity of impurities to be removed from the material. Step cleaners may alsobe used in cotton cleaning lines, but, with the move toward mini-tuft size and theuse of automatic bale openers, they are no longer part of the specification for amodern cotton spinning plant.
2.2.3 B
EATER
AND
F
EED
R
OLLER
Beater-feed roller systems are intensive opening and cleaning units and are usuallyemployed as the last opening stage in a sequence. Figure 2.6 shows two simplearrangements of the beater and feed roller system for short-staple materials. Thefeed rollers move the fiber tufts toward the pin-covered surface of the rotating beateror roller, which breaks up the tufts into smaller sizes. In the case of cotton, theopening action brings trash particles to the surface of the smaller tufts, and theseparticles are then ejected by the impact of the tufts on the grid bars. For man-madefibers, the grid bars can be replaced by a stationary pin-covered surface, which wouldenable a further opening of the tufts.
The beater-feed roller system has developed into a very effective device forcleaning cottons, and, with automatic bale openers being used to produce mini-tufts,
© 2003 by CRC Press LLC

the system has the option of additional beaters to make it a
multi-roller cleaner
forintensive opening of mini-tufts, thereby dispensing with the use of step cleaners forcotton processing. As described in Chapter 1, modern harvesting and ginning ofcottons can be severe and, although a larger amount of impurities may be nowremoved during ginning, intensive ginning causes a greater quantity of fine trashfragments (referred to as
pepper trash
) and neps (i.e., small balls of entangled fibers)to be present in the baled fiber. (See Figure 2.7.)
These particles are not easily removed by the simple impact of large tufts ontogrid bars. Intensive opening of mini-tufts releases the fine trash fragments and nepsinto the boundary air layer of the beater. Replacing the grid bars with a knife-edgedslot, and applying suction at the slot, gives effective removal of these particles.Figure 2.8 illustrates a typical knife-edge suction slot device. It can be seen thatadjustment of the slot size enables the boundary air layer to expand. The knife edgeslows the airflow sufficiently for the trash particles to be ejected by the centrifugalforces acting on them; they are then sucked away. For a set beater speed, adjustment
+
+
+
+
+
+
+
+
FIGURE 2.5 Multiple spike beater rollers with undergrids.
(Courtesy of Rolando-Beilla.)
(Courtesy of Pneumatic Convey-ors Ltd.)
© 2003 by CRC Press LLC

of the slot size controls the degree of cleaning and the amount of fiber removed inthe waste. When little cleaning is needed, the slot is opened only slightly (see Figure2.8a). If the trash level to be removed is high, then the slot is widened accordingly(see Figure 2.8b and c).
Figure 2.9 depicts a multi-roller cleaner having four rollers covered with differingtypes of working surfaces. Sequentially, the first beater is a spike or needle roll, thesecond and third are a coarse and medium grade saw-tooth wire roller, and the finalroller would have a fine saw-tooth wire clothing. Knife-edged suction slots arepositioned around each beater for fine particle extraction. The system may be fittedwith two or three beaters or employed as a single beater unit.
Output
Input
Output
Input
FIGURE 2.6 Beater-feed roller systems. (Courtesy of Crosrol UK Ltd.)
FIGURE 2.7 (See color insert following page 266.) Examples of trash fragments and nepsfound in baled cotton. (Courtesy of Trutzschler GmbH & Co. KG.)
Seed coat Leaf Stalk Neps
FIGURE 2.8 Knife edge and suction slot for fine particle removal. (Courtesy of TrutzschlerGmbH & Co. KG.)
(a) (b) (c)
© 2003 by CRC Press LLC

The Picker and Fearnought Openers (Figure 2.10) are typical beater-feed rollersystems used for producing mini-tufts in the opening of wool and other fibers ofsimilar length and fineness. Whereas the Picker operates along the lines of a singlebeater unit, the Fearnought is more complex and functions similar to a cardingsystem, which is described in Chapter 3.
2.2.4 U
SE
OF
A
IR
C
URRENTS
There are two basic ways in which cleaning can be achieved with the use of aircurrents.
1. Removal of trash particles by an imbalance of centrifugal and aerody-namic forces on the particles
2. The use of a perforated screen to separate tufts from a dust-laden airflow
The knife-edged suction slot is a basic method of using an imbalance of centrifugaland aerodynamic forces, and Figure 2.8 in effect shows one example of its applica-tion. Figure 2.11 shows a more commonly used approach. Here (Figure 2.11a), asection of ducting is made with a bend of an almost 120° angle and an adjustableslot located at the bend. The tufts are pulled through the ducting by air suction, thespeed of incoming air at the slot being greater than the flow transporting the fibertufts at the inlet section of the ducting. The transporting airflow may contain trashparticles that escaped removal in a prior cleaning stage.
If the forces on the tufts and the trash particles entering the inlet are resolvedinto their x and y components as shown, then it is clear that, with the x componentbeing larger, the resultant paths are toward the slot. At the slot, forces from twoother influences come into play: that because of the faster intake of air at the slotand centrifugal forces due to the action of moving around the bend. The largersurface area and lower relative density of the tufts mean that forces due to the intake
FIGURE 2.9 (See color insert.) (Top): Multi-roller cleaner. (Left to right) needle beaterfollowed by coarse, medium, and fine saw-tooth beaters. (Courtesy of Trutzschler GmbH &Co. KG.)
© 2003 by CRC Press LLC

of air at the slot are greater than the centrifugal forces acting on the tufts, and thetufts are therefore retained in the airflow. The converse is true for the trash particles,and they are ejected from the trucking. Figure 2.11b illustrates the use of thisprinciple to aid particle separation.
To remove dust particles in transporting airflow, a perforated surface may beused to separate the tufts from the dust-laden air. Figure 2.12a illustrates the use ofa slowly rotating perforated drum as one example, often referred to as a
condenserdrum, cage condenser,
or
dust cage.
The airflow in which the tufts are conveyed isgenerated by a fan connected by ducting to the interior of the cage. As shown, thetufts are pulled onto the outer surface of the drum, the holes being sufficiently smallto prevent fiber loss, while the dust-laden air flows through the holes of the drumfor the dust to be collected as waste. To remove the tufts attached to the slowlyrotating drum, the suction is blanked off by a half-cylinder screen, which is posi-tioned where the tufts are required to leave the drum. Condenser drums are positionedat the inlet to a hopper either before or after an opening stage (see Figure 2.12b).
FIGURE 2.10 Picker and Fearnought openers. (Courtesy of Rolands Macchine Tessili.)
Picker opener
A
A
Fearnought opener
View fromA
View fromA
© 2003 by CRC Press LLC

2
3
1
4
5
FIGURE 2.11 Heavy particle separator. (Courtesy of Trutzschler GmbH & Co. KG.)
(a)
(b)1 – chamber2 – material flow3 – separator4 – open/close flap5 – waste bag
© 2003 by CRC Press LLC

Air Inlet
Condenser Cage
(Dust Cage – Perforated Sheet)
CondenserDrum
Ducting To Fan
Screen
+
(a)
(b)
CondenserDrum
StepCleaner
HopperFeeder
FiberFlow
Fine Opener – Beater/Feed
RollerCombination
FIGURE 2.12 Condenser Drum for Removal of Dust Particles. (Courtesy of TrutzschlerGmbH & Co. KG.)
© 2003 by CRC Press LLC

Clearly, the larger the area of the perforated surface, the more effective the dustremoval will be. Figure 2.13 depicts several of the newer developments, which areself-explanatory.
2.2.5 E
STIMATION
OF
THE
E
FFECTIVENESS
OF
O
PENING
AND CLEANING SYSTEMS
2.2.5.1 Intensity of Opening
To assess the opening action of a beater, we refer to its intensity of opening. Thiscan be defined as the amount of fibrous mass in milligrams per one striker of abeater for a preset production rate and beater speed.1 Thus,
(2.1)
where I = intensity of opening (mg)P = production rate (kg/h)nb = beater speed (rpm)N = number of strikers
Table 2.1 gives examples of I values for commonly used beaters. The intensityof opening is an estimate of the tuft size produced by a given beater. From the Ivalue, we can get an approximation of the number of fibers, nf , constituting a tuftproduced by a given beater.
(2.2)
where Lf = average fiber length (cm) Tf = average fiber linear density (mtex)
TABLE 2.1Examples of I Values of Beaters
Beater type Description Intensity of opening
Buckley A bladed beater that may be used in the early stages of opening. The number of blades varies from 20 to 32.
Typically, tuft sizes can be 500 to 600 mg (initial opening) or 85 to 100 mg.
Kirshner This has three arms with wooden lags, each 11 cm wide. Each lag contains 1000 pins, 10 mm long.
Tuft size: 5 mg.
Saw-tooth Usually, 1 m × 38 cm dia., with a tooth density of 2 per cm2.
Tuft size: 0.88 mg.
IP 106×
60 nb× N×----------------------------=
n fI 105×L f T f×------------------=
© 2003 by CRC Press LLC

2 41
3 5
2
3
4
1
FIGURE 2.13 Dust removal systems. (Courtesy of Trutzschler GmbH & Co. KG.)
10
11
9
8
1
2
657
43
8
1 – Material Inlet2 – Perforated Screen3 – Adjustable Flap3 – Material Exit4 – Exit of Dust-Laden Air
1 – Material Inlet2 – Perforated Screen3 – Material Exit4 – Dust Extraction
1 – Fan2 – Material Feed3 – Distributor4 – Perforated Screen5 – Suction Zone for Continued Material Flow6 – Air Inlet7 – Fan8 – Material Flow9, 10, 11 – Dust and Waste Removal
© 2003 by CRC Press LLC

An alternative to tuft size (i.e., I) is the number of blows per kilogram, Nk.
Nk = (60 × nb × N)/P (2.3)
The I or Nk value gives an indication of the degree of treatment in that the moreblows per kilogram of material, the smaller the tuft size and the more trash that islikely to be removed. However, the calculation does not take account of the effectof the space settings of the beater to the feed roller and of beater to grid, or of thegrid spacing. The mechanical removal of trash and dirt particles is always accom-panied by some loss of fiber; with cotton cleaning, the amount of fiber in the wasteis referred to as the lint content. Usually, this is composed of short lengths of brokenfibers, but poor processing can cause the loss of fibers of much longer lengths and/ora high level of fiber breakage. The objective is to optimize the machine settings (i.e.,beater speed, production rate, and gap settings of the working components) tominimize the percentage lint and usable fiber length in the waste.
2.2.5.2 Openness Value
The more effectively the material is opened, the better the chance of trash removaland the lower the fiber content of the waste. The opening action primarily does twothings. It reduces the fiber mass into small clumps (tufts), as described above, butit also loosens the tightness of packing of the fibers within each tuft, thereby reducingthe tuft density or increasing its specific volume. In common parlance, we couldrefer to the tufts being more fluffed up, which describes their visual appearance. Theopenness value (OV) is a measure of how fluffed up the fiber mass has become onpassing through a beater system, i.e., its degree of opening. Since we are concernedwith changes in tuft density and want to account for different fiber densities, OV isdefined as the product of the specific volume of the fiber mass and the specificgravity (SG) of the constituent fiber (or, for a blend of fibers, the sum of the productof their relative proportions and their SGs).1
Szaloki1 describes a simple method of measuring the specific volume, in partic-ular for cotton and short-staple mmfs. A sample of the fibrous mass is used to filla 4000-ml Pyrex® beaker. A Plexiglas® disc weighing 200 g, with air-escape holesand having a slightly smaller diameter than that of the beaker interior, is placed ontop of the sample in the beaker. After a settlement time of 15 to 20 s, the compressedvolume is noted, the sample is weighed, and the specific volume in units of cm3/gis calculated. Eight to ten measured samples are usually required for a 95% confi-dence level in the resulting data. Measured values1 show a typical OV for the fibermass in a bale of cotton at the beginning of an opening and cleaning line to bearound 51 cm3/g, while, at the end of the line, the OV can be greater 140 cm3/g.
2.2.5.3 Cleaning Efficiency
This is the percentage of the impurities removed from the fiber mass. Hence,
(2.4)CEW IN W O–( )100
W IN
--------------------------------------=
© 2003 by CRC Press LLC

where WIN and WO = respective mass values of the impurities in the fiber at the input and output to a machine or a sequence of machines
CE = cleaning efficiency
As referred to earlier, some unavoidable fiber loss occurs during mechanicalcleaning. The settings of grid spacing will evidently control the fiber content of thewaste. When considering this fiber loss, we can refer to the effective cleaning (EC)of a machine or a sequence of machines as
(2.5)
where WT = mass of wasteWF = mass fiber in the waste
2.2.6 WOOL SCOURING
It was explained in Chapter 1 that raw wool contains particulate and nonparticulateimpurities (e.g., dirt, squint, grease, soiling substances, and pesticides) that areremoved by scouring. Vegetable fragments are also present and are removed eitherchemically by wool carbonizing and/or mechanically in the carding and combingprocesses of stages II and III (Figure 1.8, Chapter 1). Pesticides are used in sheephusbandry, and residues can remain in the fleece and be released when the shornwool is scoured. Potential risks to the environment from pesticides have led to certaintypes (organochlorines and arsenic) no longer being widely used, and there is amove toward employing biodegradable chemicals that are applied in a controlledway to minimize residues.
Definition: Wool scouring may be described as a process by which a solvent ordetergent is used as a scouring agent to remove grease, sweat, minerals,and other impurities from the wool fleece.
One of two methods may be used: solvent scouring or emulsion scouring; the latteris the most widely employed. The conventional emulsion scouring process involvesa heated aqueous scouring solution, termed the liquor, in a set of two, three, or fourscouring bowls (depending on the amount of impurities to be removed), and a warmrinse bowl. These are sometimes referred to as a washing set, and the first bowl iscalled the main bowl. Placed between consecutive bowls are pairs of rotating squeezerollers. The liquor in the first bowl is at a temperature that is hot enough to melt thegrease. The scouring agent is added to emulsify the grease. The amount of scouringagent in the heated water, the water temperature, and the wash time in each bowldecrease from the first bowl, with the last bowl being just a short, warm rinse (seeFigure 2.14 and Table 2.2).
The wool is automatically fed from a hopper into the first bowl of the series.When the wool falls into the scouring liquor, the entrapped air among the fiberscauses the wool to float, so a paddle-type roller (called a rotary immersion drum, aducker, or posser) immerses the wool so it is thoroughly wetted (see Figure 2.14).
ECW T W F–( )100
W IN
------------------------------------=
© 2003 by CRC Press LLC

TABLE 2.2Scouring Conditions for Merino Wool (Conventional System) — Average Yield 50 Percent
Bowls
Parameters 1st 2nd 3rd 4th
Temperature, °C (approximate) 54 51 49 46
Soap, percent by wt. of liquor 0.5 0.5 0.2 –
Alkali, percent by wt. of liquor 0.2 0.1 – –
Time (minutes) 3 2.5 2 –
Courtesy of Brearley, A. and Iredale, J. A., The Worsted Industry, WIRA, Leeds, U.K., l980.
SqueezeRollers
Wool InMain Rake
SparyBox
Flow Back FromNext Bowl
Flow Back toPrevious Bowl
Heavy Solid
Head RakeWool Out
FIGURE 2.14 (a) Scouring blow with immersion drum and rakes (Courtesy of Andar Ltd.),and (b) schematic of scouring bowl showing liquor flow.
(a)
(b)
© 2003 by CRC Press LLC

Each bowl may be approximately one meter deep, and there is a perforated metal-sheet near the top of the bowl. This prevents the wetted-out wool from sinking tothe actual bottom of the bowl. The wetted-out wool is then moved slowly forward,toward the opposite end of the bowl, by a set of forks in a harrow system. In moremodern designs, rakes or rotating perforated “suction” drums are used. The forksor rakes move as a group so as to give the wool its forward movement, and theirmotion causes slight agitation of the wool mass. This assists the scouring action.However, excessive agitation can result in excessive fiber entanglement, i.e., felting.17
The objective is to minimize the movement of fibers relative to each other so asprevent the interlocking of the scales on their surfaces. With suction drums, the woolis held against the drum as it is washed by the liquor flow, and it then floats nearthe liquor surface between the drums. Suction drums give gentle handling of wools,which minimizes any entanglement, particularly of fine wools.
Soap and soda ash traditionally have been effective scouring agents for wool,the last bowl of the washing set being a warm-water rinse to remove the soap andalkali. Importantly, modern scouring processes ensure that wool is left with a neutralpH balance.
Various synthetic detergents (nonionic and anionic) have been developed toreplace soap. A few studies into the use of synthetic detergents have been published,3–5
but commercial information is not readily available on scouring formulations ofdetergent and “builders” [i.e., added chemicals like washing soda (sodium carbon-ate)]6 to enhance detergent performance. Reported findings show that the percentageratio of the scoured wool to the greasy-wool feed, termed the percent yield, can varywithin 48 to 50%, depending on the alkalinity of the liquor. Neutral nonionic andsoap-soda scouring gave high yields, but also high residual grease, and soap-sodawas found leave residual dirt in the soured wool. Alkaline methods gave lower yields,the effect being greater for coarse wools. This is attributed to damage of the oxidizedportion of the wool staple, i.e., near the fiber tips, by the warm alkaline liquor. Coarserwools have more open fleeces, which allows a greater length of the staple to beexposed to weathering and weakening by sunlight (photo-oxidation) than finer, denserwools (e.g., merino). Environmental considerations have led to nonionic/anionicbiodegradable detergents replacing traditional scouring agents, with the claim by thedetergent manufacturers of improved wetting and emulsification and of a gentlerscouring action that can lead to reduced felting of the wool.
The hard dirt being washed from the wool is mostly detached in the first bowlto sink through the perforations in the false bottom. It is then continuously removed.The liquor flows counter to the direction of travel of the wool, compensating for theabstraction of water by the scoured wool and for water carried away with the effluent.The idea is also for the bowl prior to rinsing to have as low a level of impurities aspossible, so released impurities should be transported back to the first bowl wherethey can be removed. The pressured rollers at the delivery end of each bowl squeezethe liquor from the wool. The liquor is filtered and recycled to the main bowl. Thisis important from the environmental viewpoint and for the process to be a continuousscouring system. When the wool is delivered from the rinse and squeezed dry, itshould be lofty and soft, with a clean smell and residual grease content no greaterthan 0.75%.
© 2003 by CRC Press LLC

Despite the use of the pressurized squeeze rollers, the wool leaving a washingset contains about 50% moisture, which must be reduced before further processing.Hot-air drying is frequently used (see Figure 2.15). The capacity for air to holdmoisture increases with temperature, so, for efficient wool drying, the temperaturemust be sufficient to enable adequate moisture removal without scorching the wool,and the airflow rate must provide a sufficient volume of air to come in contact withthe wool for effective moisture containment and transport by the air before itssaturation point is reached. To achieve this, hot air at about 82°C is made to flowwith or against the wool.
The gentle control of the wool during its passage through the bowls is importantfor minimizing fiber entanglement, which can present considerable problems in laterprocessing. Fiber entanglement makes it more difficult to open the wool and toindividualize fibers during carding. The more entangled the fibers, the greater thechance of fiber breakage and damage, resulting in considerable waste.7,8 The higherthe production speed in scouring, the greater the likelihood of fiber entanglement.9
Therefore, the finer the wool, the lower the production speed and rate will be (seeFigure 2.16). Large bowl widths, however, enable a greater mass throughput at lowspeeds and thereby facilitate higher production rates.
Research into various techniques for reduced felting during wool scouring hasled to the use of high-pressure jets4–11 and to methods for measuring fiber entangle-ment in scoured wool.12–15 Jet scouring, as it is termed, was first used as a solventscouring system;16 wool does not felt when gently agitated in anhydrous solvents.Figure 2.17 shows that, instead of moving through bowls, the wool was transportedby a traveling conveyor under jets of an organic solvent (white spirit). There weretwo solvent jet stages followed by two water jet stages for rinsing. The water jetsdisplaced the solvent from the wool and dissolved the residual suint (perspirationsalts), which is insoluble in white spirit. The sludge from the first bowls was collectedand treated to separate the solvent from the grease so that the solvent could be
FIGURE 2.15 (a) Suction drum drying machine (Courtesy of Andar Ltd.), and (b) schematicof scouring line with suction drum dryer.
© 2003 by CRC Press LLC

4000
3500
3000
2500
2000
1500
1000
500
5000
16 24 32 40
WOOL DIAMETER (Microns)
Typi
cal P
rodu
ctio
n (k
g/h
Gro
ssy
Woo
l)
3000 mm
2500 mm
2000 mm
1500 mm
FIGURE 2.16 Plant capacity for differing working widths. (http://www.austehc.unimelb.edu/tia/287.html)
JETS
Suction Applied
Perforated belt
FIGURE 2.17 CSIRO jet scouring. (Source: http://www.austehc.unimelb.edu.au/tia/287.html.)
© 2003 by CRC Press LLC

reused. This scouring system was less disturbing to the wool fibers and consequentlyresulted in lower entanglement and much reduced waste in the downstream processstages II and III (see Figure 1.8, Chapter 1). The disadvantages of using an organicsolvent were the capital cost of the solvent recovery and the potential safety risks.The solvent agent was subsequently replaced with aqueous liquor containing anonionic detergent. Jet scouring, however, has not replaced the conventional systembecause of its inferior scouring ability.17
Although freedom from entanglement is an important objective in scouring, thetreatment of waste from the process has become increasingly important, because thepollution associated with emulsion scouring can be extremely high.1 The relatedenvironmental problems have led to some renewed interest in solvent scouring.18
One example of this is Wooltech (ICI-Triwool), which is a solvent scouring systembased on trichloroethylene.18 However, the wider practice is to use some form ofeffluent treatment of the waste from the emulsion scouring process.
During scouring, a large amount of impurity is removed from the wool [up to450 kg/h (1000 lb/h)], mainly in the first bowl. The high content of organicimpurities in the raw wool often means that emulsion scouring can result in highbiological oxygen demand (BOD)19 pollution waste. The wool grease can be recov-ered from the scour liquor as lanolin for cosmetics and pharmaceuticals, and doingso can reduce the BOD by 20 to 30%. Suint also can be recovered and used fordetergent manufacture, and this extraction reduces the BOD by another 20 to30%.2,19 Continuous scouring processes operate under equilibrium conditionswherein there is a balance in the impurities entering the system from the wool, thecontamination levels in the scouring liquor, and the waste removed from the system.With systems that are not designed for continuous operation, the contamination ofthe liquors increases to a level that is too high for adequate scouring to continue.Dirt accumulation eventually requires dumping of the liquor, even if counter-currentflow is used to extend the scouring run. Published figures of average concentrationsof impurities in the main scouring bowl for a conventional scour in which soapand soda are used indicate that the concentrations, after a few hours of operation,are 0.5 to 5.0% wool grease, 1% suint, 0.15 to 0.4% soap, and 1% dirt. Themaintenance of equilibrium in the scour liquor requires the removal of the emul-sified wool grease, which, if allowed to remain, reduces the scouring effect, irre-spective of the pH. The suint from the wool that is deposited in the bowls is watersoluble and forms suint soaps, which assist in the detergent action of formingemulsified wool grease. As much dirt as possible must also be removed from thescour liquors because of the tendency for it to be redeposited onto the wool, causinga dirty scoured wool mass to be produced. Continuous scouring therefore usuallyincorporates centrifuge cleaning of the liquor for dirt removal to allow processingto continue.
Ideally, continuous process features multistage, counter-current water flow within-line facilities for wool grease and dirt removal from the scouring liquor. Severaldifferent means may be employed to remove wool grease and dirt from scourliquors,20,23 such as evaporation, acid cracking, centrifugal separation, hypochloriteprocess, calcium-ion-carbon dioxide process, froth flotation, aeration, and solventtreatment. Centrifugal separation is, however, the simplest. Since the degreased
© 2003 by CRC Press LLC

liquor from this process will still retain the suint and much of the detergent alreadyused, it offers the advantage of simpler liquor recycling to the scouring bowl and,with metered topping up of the detergent concentration, significant savings ondetergent costs (20 to 30%) can be realized.2
Centrifugal separation fractionates the wool grease into the auto-oxidized greasefrom the fiber tips, which remains emulsified in the degreased liquor, and the un-oxidized grease, which is the recovered product. The oxidized grease has a higheracidity, darker color, and is more sensitive to heat. Centrifugation, therefore, givesa good by-product. The technological principle is the mechanical separation ofparticles by centrifugal force according to density differences. Pretreatment bycoagulation or flocculation may be necessary to increase particle size and separationefficiency.
Figure 2.18 illustrates the basic arrangement of a centrifuge system. The maincomponents and ancillaries consist of rotary filter screens for each bowl (membranefiltration may be used for the rinse bowl), a settling tank (C) located underneathsqueeze rolls, and liquor-reclamation equipment employing hydrocyclones (A) andcentrifuges (B). Removal of fiber contaminants by the filter screens precedes particlesolids removal. Heavy solids removal can be by either gravity via a settling tank, inwhich a flocculate can be employed, or by hydrocyclones as depicted. Sirolan CF,developed by CSIRO, is one example of a chemical flocculation process.21 It isreported to be effective as a first-stage treatment for the heavy waste. Table 2.3shows report results of high removal efficiencies for BOD and COD. The sludgedischarge may be dewatered to the state of a spadeable solid that is suitable forcomposting or palletizing, or the slurry disposed of by incineration.
The removal of a high percentage of wool wax and particulate matter from theheavy waste facilitates further treatment of the effluent. This involves the temperatureof the resulting grease emulsion being increased to about 95°C by a heat exchangerand specially designed jacketed storage tanks where the emulsion cracks thermallyand dirt remnants and water are removed. The degreased liquor is then recycled tothe first scouring bowl after being cooled via a heat exchanger to the operatingtemperature of the bowl.
TABLE 2.3Typical Results for Sirolan CF
SS concentration (%)
BOD (mg/l)
COD (mg/l)
Feed 3.5 11000 59000
Concentrate 0.03 2800 11500
Removal efficiency (%) 95+ 75 80
SS = suspended solids (dirt, wool grease, etc.), BOD = biological oxygen demand, COD = chemicaloxygen demand.
© 2003 by CRC Press LLC

Flow of Wool
From Feed Hopper
Overflow Drain
Wool Wool Flow of Wool
To Dryer
RinseBowl
No. 2Bowl
No. 1Bowl
OverflowDrain
C
BDrain
Soap SodaAsh
Soap Soda Ash
Back Flow
Controlled
NozzleDischarge
Backflow
Controlled Fresh
Water
A – Hydrocyclone System
B – Centrifuge System
C – Settling Tank
A
No. 1Filter
Screen
No. 2Filter
Screen
No. 3Filter
Screen
FIGURE 2.18 Basic arrangement of a centrifuge system. (Courtesy of McCracken, J. R., Samson, A., and Chaikin, M., “The SystematicOptimization of the Aqueous Compression-Jet Wool Scour: Part 1 Pre-Optimization Procedures,” J. Text. Inst., 63(1), l972, 1–23.)
© 2003 by CRC Press LLC

A number of commercial wool grease recovery and effluent systems17 employtechniques that are variants of the above basic description. The well known ones arethe Wool Research Organisation of New Zealand (WRONZ) system, Siroscour,™and Sirolan Scour Waste Integrated Management System (SWIMS).21 Essentially,the WRONZ system is for coarse wool scouring operations and requires two-stagecentrifuging, whereas the other two systems are suitable for fine wool and requirethree-stage centrifuging. The trend in the design of effluent treatment plants is toward“no aqueous discharge,” with the recovered liquor being fully recycled to the scour-ing line. Sirolan SWIMS falls within this category and is seen as setting a standardfor future wool scour waste treatment systems.
2.2.7 WOOL CARBONIZING
In worsted processing, vegetable fragments such as burrs, seeds, and straw arepreferably removed by mechanical means, whereas the higher vegetable content oflower-quality wools used in woolen processing requires both chemical and mechan-ical means. The chemical treatment is called wool carbonizing and is carried out onthe scoured wool mass.
Definition: Wool carbonizing is the application of mineral acids to scoured woolto convert vegetable impurities into a black brittle hydrocellulose, makingthem more easily removable by mechanical means.
Following emulsion scouring, the loose wool is passed through bowls containingdiluted sulfuric acid (5% H2SO4) at room temperature. The wool is then squeezedand hot dried (115°C) to concentrate the acid to degrade the cellulosic contaminants.Crush rollers and shaking subsequently crush the impurities to fragments and dis-lodge them from the wool fibers. The wool is then neutralized in a bowl of alkalisolution and rinsed and dried. If severe treatment with the sulfuric acid is used todeal with, say, a sizeable amount of vegetable matter, considerable fiber damagemay result.28
Carbonizing tends to weaken fibers. Strength losses range from 15 to 40% and,owing to broken fibers, can result in increased loss of useful fiber (5 to 20% byweight) during subsequent mechanical processing. The ideal would be if the woolabsorbed no acid while the vegetable matter absorbed enough to be decomposed.Since the ideal cannot be achieved, the objective is to keep the amount taken up bythe wool to a minimum. Wool and vegetable matter can take up acid chemically(sorption by functional groups) and physically (by absorption). In the carbonizingbath, the acid pickup of vegetable matter is almost all by absorption, whereas, withwool, absorption is around the 50% level.29 At moderate temperatures, vegetablematter tends to absorb the acid liquor (acid + water) at a faster rate than wool andtherefore becomes saturated in a much shorter time. Strength loss of wool becomesof importance for absorbed acid content of 5.5% and above. Reportedly,30–34 deter-gents can be used to restrict the penetration of acid into the wool fibers withoutimpairing the acid absorption by the vegetable impurities. The actual weakening ofthe wool occurs during drying and depends on temperature rather than drying time;below 50°C, the loss in strength is negligible, but drying time will be long; muchhigher temperatures with fast drying times are therefore used.
© 2003 by CRC Press LLC

2.2.8 TUFT BLENDING
The blending of fibers is an important part of spun-yarn technology. Fibers areblended for many reasons, but in particular for one or more of the following:
• To produce a uniform product. There are usually significant variationsin fiber properties among bales of the same fiber type or grade, and fromone part of a bale to another. Such variations will be greater for naturalfibers than for man-made fibers. Blending of the fibers within and amongbales is therefore essential to obtain consistent yarns properties — espe-cially mechanical properties, minimum variation in thickness along theyarn length, and uniformity of count and optical properties with regardto color when dyed. Dyed fibers are also blended, particularly for woolenyarns, and here consistency of shade is a requirement.
• Reduce production cost. Fiber cost is usually the major contributor toyarn cost and, in an ever increasingly competitive global textile market,product cost and product quality are key factors. Technical skill is requiredto keep fiber cost as low as possible without incurring unacceptablereductions in yarn quality. Blending of different grades is often used toreduce cost, but, in choosing the percentages of the different components,an understanding is needed of the effect of fiber properties on processperformance and on yarn properties to ensure that the mixing of thedifferent grades produces a uniform product. The effects of fiber propertieson spinning performance and yarn properties are considered in the laterchapters.
• To enhance specific properties. Consumer demands for easy-care cloth-ing, improved comfort, and fashion have led to many blends of naturaland man-made fibers. Most are two-component blends, but there isincreasing interest in multicomponent blends and blends for specialeffects. In the technical textiles market sector, yarns may be spun fromblends of up to five components (e.g., Kevlar, Nomex, PANOX, Wool,and PVC), where blend percentages for certain components can be as lowas 1 to 5%. Again, the blending process must produce a uniform product.
In a well blended mass of fibers for spinning, the individual fibers of the differentblend components should be present in the required proportions and well intermin-gled throughout the fiber mass. Certain operations in the process stages I to III playa part in achieving a well blended fiber mass, and therefore blending begins in stageI with the mixing of tufts.
At the start of opening and cleaning lines, bales of fibers of different grades ortypes are arranged in a mixed laydown, and tufts are removed from the bales andblended and then assembled to provide a homogenous feed to stage II in the pro-duction sequence. This means that, at any cross section of the assembled fiber massfed to carding, the relative proportions of the different grades or types remainconsistent.
A tuft, as we learned earlier, may consist of many fibers. Therefore, to obtain ayarn of a homogenous blend of fibers, blending must also occur downstream of
© 2003 by CRC Press LLC

opening and cleaning, where the intermingling of individual fibers can be realized.However, to achieve a high degree of fiber blending, there needs to be a high degreeof tuft blending. Since blending progresses through to the spun yarn, at any crosssection of the yarn, the relative proportions of the different fibers (grades or types)should remain constant. Therefore, the yarn properties should be consistent.
Definition: Tuft blending is the mixing of fibrous tufts removed from a balelaydown to produce a homogenous stock for consistency of yarn properties.
2.2.8.1 Basic Principles of Tuft Blending
From a practical viewpoint, the required proportions for a blend are determined bymeasured mass.
Wb = w1 + w2 + w3 + … + wn (2.6)
= Σ wi (2.7)
and
p1 = w1/Wb or pi = wi/Σ wi (2.8)
where Wb = the mass of the blend, and wi , pi = the mass contributions and blend fractions of the fiber components
for i = 1 to n components
In preparing to blend different fiber types or grades, it useful to estimate theaverage fiber characteristics of the blend that will influence yarn properties andspinning performance — in particular, the mean length, fineness, and strength. Table2.4 gives the relevant equations. Lee and Kin35 and Kang and Lee36 describe howsuch equations may be used in the application of linear programming for formulatingblends of cotton and of wool.
An important point to consider is the number of bales to have in a laydown fora blend. The minimum number can be easily calculated, as it is directly related tothe number of different fiber properties and the proportions of each type to beblended.37,38 For example, if a blend of cottons were to comprise three differentmicronaire values, two grades, and two different staple lengths, all blended in equalproportions, then a minimum number of 12 bales would be required in a laydown.The best degree of tuft blend is, however, achieved with the maximum number ofbales in a laydown, which may be limited by practical constraints such as floor spaceand operational logistics.
At the start of the opening and cleaning operation, tufts are continuously removedfrom a laydown of bales. We can effectively visualize this as a layer of set thicknessbeing removed from each bale in sequence going up and down a row of bales. Therewill be a time cycle in moving from one end of the row to the other and returning.The layer thickness removed is an important factor for optimum blending as isillustrated in Figure 2.19.
© 2003 by CRC Press LLC

TABLE 2.4Formulation of Fiber Blends
Fiber characteristics Blend equation
Fineness:Diameter (µ)
Count (mtex)
dm2 = Σ pidi
2 where dm = mean of the blend, pi , and di = the proportion and mean diameter for each blend component for i = 1 to n components
fm = 100/[Σ qi / fi] where fm = mean of the blend, qi, and fi = the percentage and mean count for each blend component for i = 1 to n components
Length Lm = Σ pi Li where Lm = mean of the proportion and mean length for each blend component for i = 1 to n components
Strength Sm = Σ pi Si where Sm = mean of the blend, pi, and Si = the proportion and mean strength for each blend component for i = 1 to n components
Note: The table is not a comprehensive list of the properties accounted for in blend formulations;color is an important factor. For wools, the degree of bulk, the amount of medullation, and vegetablecontaminant (VM = vegetable matter) are also used as blend parameters.37
A
B
C
D
Four-Bale Laydown
1234
B1 D1B2 D2B3 D3B4 D4A4 C4A3 C3A2 C2A1 C1
1 - One stack-layer at a time droppedonto a moving conveyor
D1 D2 D3 D4 C4 C3 C2 C1B1 B2 B4 B4 A4 A3 A2 A1
2 - The bales now have 8 layers A to H, each half the size of the above, and with twostack-layers at a time dropped onto the moving conveyor to give:
H1 / H2 H3 / H4D1 / D2 D3 / D4
E4 / E3A4 / A3
E2 / E1A2 / A1
------------------
------------------
------------------
------------------
FIGURE 2.19 The basics of tuft blending.
© 2003 by CRC Press LLC

For ease of explanation, we will assume a four-bale laydown and that the balesare of the same density and have an equal number of fibers. The only differencebetween the bales is that the fibers are dyed different colors. Layers of fiber massare removed sequentially from the bales in the form of tufts, which are plucked fromthe bales at a fixed rate. We will also assume that the same thickness of layer isremoved from each bale and that the thickness is such that a total of four layers areremoved from a bale. These four layers are represented by the letters A, B, C, D inFigure 2.19, Four-Bale Laydown section. For the first bale, which comprises dyed-red fibers (column 1), the layers are A1, B1, C1, and D1. A similar notation is usedfor the remaining three bales (green, blue, and yellow, represented in columns 2through 4). All four A layers (A1, A2, A3, and A4) are first removed and stackedconsecutively, one on top of the other. The B layers are then stacked on top of theA layers. A new stack is then started with the C layers and finished with the D layersplaced on top. If we now remove the bottom layer of the two stacks, one on top ofthe other, we will be blending A1 and C1 tufts, and, by progressing up the stacks weeventually will be blending B1 and D1 tufts. This gives a degree of blending of tuftsfrom various parts of the same bale. Clearly, the smaller the layer thickness, the morelayers that can be removed per bale and the higher the degree of within-bale blending.
If two thin layers at a time are moved from each stack and sandwiched, blendingwill occur between, as well as within, bales 1 and 2. By reducing the layer thicknessand increasing the number of stacks, it should become evident to the reader that,subject to practical limits, blending improves with an increased number of stacksand layers per stack, and with the number of layers in each drop from a stack.
2.2.8.2 Tuft Blending Systems
Blending of tufts is carried out either gravimetrically (weight blending) or volumet-rically (volume blending). Therefore, with respect to tuft size, it is important to takeinto account the density and moisture regain of the fibers. Tufts are often transportedbetween machines of an opening line by airflow through ducting, and the uniformityof the tuft flow depends on the specific volume of the tufts. This parameter is afunction of fiber density, moisture content, and the degree of openness of the blendcomponents. Blend nonuniformity may arise as result of sizeable mass variationsoccurring after the start of the blending process. These variations can be the resultof a drift in moisture content. As a result, bales of material for blending should bebrought to the atmospheric conditions to be used in processing.
There are essentially four methods of tuft blending that follow the basic principleoutlined in Figure 2.19,
a. Stack blendingb. Hopper blendingc. Batch blendingd. Continuous blending
The first two methods are gravimetric procedures, and the last is volumetric; methodc is a combination. Continuous blending is the more advanced technique and iswidely used in short-staple mills, whereas all four systems can be found in theprocessing of longer staples. This is particularly so in woolen mills, where much
© 2003 by CRC Press LLC

smaller batches of material are often processed, and capital investment has a longerreplacement cycle. During blending, lubricants may be applied to the fiber mass asa processing aid for the downstream stages of II, III, and IV. Lubricants are usuallyapplied only to wool fibers, since, with the removal of wool grease in scouring, thefrictional characteristics of the fiber present difficulty in further processing. Cottonfibers have a wax film coating, and surface finishes are applied to man-made fibersduring their production. A short account on lubricants is given in Appendix 2A.
Stack Blending This is the simplest method for blending small amounts of fiber mass. It is carriedout manually. First, the total quantity of each blend component is weighed. Then,by removing large tufts (sometimes referred to as flocks) from the weighed material,each component is spread, one on top of the other, over a wide floor area, while apredetermined percentage of processing lubricant necessary for the carding in stageII (Chapter 1, Figure 1.8) is uniformly applied between each layer. Only a singlestack is built, so vertical slices are removed from the stack and fed to a mixing baleopener to be opened into smaller tuft sizes.
Hopper Blending or Automatic Weigh-Pan Blending This method involves a weigh-pan fitted to the exit of a mixing bale opener, describedearlier (see Figure 2.20a). The tufts removed from the spiked lattice by the stripperroller accumulate in the weigh-pan until a preset weight is reached, triggering the“closing flaps” and the opening of the weigh-pan. The accumulated tufts drop ontoa transport belt. The emptied weigh-pan closes, and the “closing flaps” reopen; thecycle is then repeated. For blending to occur, several such mixing bale openers arearranged in parallel, as shown in Figure 2.20b, to make drops on the transport belt,which moves intermittently so that a drop from one machine falls on top of the dropfrom the prior machine to form a small stack of sandwich formation at the end ofthe line. Sprays for applying lubricants can be fitted to operate synchronously withthe transport belt. The small stacks are subsequently fed to a further openingmachine.
Batch BlendingA traditional method employed in woolen mills, batch blending is basically a scaled-up version of stack blending. The process requires two opening units (e.g., Fear-nought) and two or more blending bins arranged as indicated in Figure 2.21 andlinked together by air ducting. Located at the top of the bins and connected to theair ducting is a rotating chute or spreader.
The components of the blend are fed in correct proportions into the first openingunit (A). With a Fearnought opener (see Figure 2.10), some amount of blendingmay occur in this initial stage of opening, but purposeful blending is carried outwhen the fiber mass has been sufficiently opened to give small size tufts. The tuftsare transported through the ducting to the spreader of the first blending bin (B). Asthe spreader rotates, tufts are uniformly scattered over the floor of the bin, and theybuild up to form a large single stack. A significant degree of within-bale and between-bale blending can be achieved, depending on the floor area of the bin and the massof the component layers fed from the bales. When the first bin is full, vertical slicesare removed from the stack and fed pneumatically to the rotary spreader of the
© 2003 by CRC Press LLC

4 5 6 7 8
1, 2, 3 – Feed 4 – Dust extraction 5 – Sensor 6 – Evener roller 7 – Spike lattice 8 – Doffer roller 9 – Closing flaps10 – Weigh pan11 – Trap doors12 – Drop area on conveyor
9
10
11
12
321
FIGURE 2.20 Automatic weigh-pan blending. (Courtesy of Trutzschler GmbH & Co.)
(b) Arrangement of blenders
(c) Weigh pan drop
(a)
© 2003 by CRC Press LLC

second bin (C). The second stack formed has a much higher degree of within-baleand between-bale blending. Again, vertical slices are removed but this time are fedto the second opener (D), and lubrication is applied by an automatic unit to thematerial leaving this second opener. The blended material is then ready for thecarding process of stage II.
Continuous Blending Figure 2.22 illustrates a four-stack continuous tuft blender. Tufts are pneumaticallyfed into the top of each of four vertical parallel chutes. The chutes are filledsuccessively, and the material is removed simultaneously from the bottom of all fourstacks and dropped onto a belt conveyor, thereby producing a sandwich formation.The blend then may be pneumatically conveyed to a second such stack blender and/or onto a fine opener/cleaner prior to being fed for carding. There are various designsof continuous blending units — some with up to ten stacks. Others include a speciallybuilt belt conveyor, which enables a large sandwich formation and the removal ofmaterial in vertical slices from the formation to give additional blending.
2.2.9 OPENING, CLEANING, AND BLENDING SEQUENCE
Figure 2.23 shows the stage I preparation sequence for wool fibers in worsted, semi-worsted, and woolen yarn manufacture. The main cleaning action is wool scouringbut, as illustrated, mechanical cleaning to remove some particulate matter is incor-porated prior to scouring.37 The amount of dirt entering the scouring bowls issignificantly reduced, resulting in lower volume of suspended solids and scouringeffluent. In the semi-worsted and woolen process, blending is carried out after thewet treatment. The semi-worsted production route is not widely used for 100% woolprocessing, as will be explained later. One hundred percent man-made fibers are
OilingMachine
OpeningMachine
OpeningMachine
Output to CardingMachine
Input RawMaterial
Blending Bins
A
BC
D
FIGURE 2.21 Batch blending.
© 2003 by CRC Press LLC

more frequently processed, in which case the opened fiber tufts are fed directly toblending. As explained in Chapter 1, the woolen yarns can be spun from recycledwaste, largely wool fiber waste from the downstream processes, and the materialusually is subjected to a carbonizing treatment to remove impurities.
Figure 2.24 illustrates a typical blowroom sequence for most cotton qualities.The automatic bale opener (a) produces small tufts from which dust and heavyparticles are immediately removed, preventing fragmentation of the latter duringintensive opening. A condenser drum (b) and the beater/grid-bar-airflow system (c)are used for this precleaning step. Following a multi-stack continuous blender (d),a multi-beater cleaner (e) is used for intensive opening and cleaning, and a final de-dusting step (f) carried out prior to feeding the material for carding.
In mechanical cleaning lines, control of the flow of the fiber mass from onemachine to another can have a significant effect on the overall performance of acleaning line. This matter has received much attention for short-staple blowroomprocesses and has led to the use of microcomputer control of material flow. Tradi-tionally, the pressure switches and light barriers fitted in the feed zone (i.e., a hopperor bin) of a machine were used to switch the preceding machine on and off to preventmaterial overflow. The material throughput of machines fluctuated from zero to nearmaximal production speed with a significant downtime (i.e., when a machine is notrunning). For example, if the required production rate from a machine is 400 kg/hrand the downtime is, say, 50%, then the machine needs to operate at maximum rateof 800 kg/hr. This has often meant larger than optimal tuft size for effective cleaning,resulting in lower cleaning efficiency, or a more aggressive cleaning action with theassociated increase in the fiber content of the waste. Modern blowroom machinery
FIGURE 2.22 Four-stack continuous blending. (Courtesy of Marzoli.)
© 2003 by CRC Press LLC

WoolClip
SortingBlendingMechanicalCleaning
Opening+Baling
Carbonizing + Crushing + Neutralizing + Rinsing
ToWoolenCard
To WorstedCard
Scouring+Rinsing
Drying
Opening+ Oiling
OpeningStack Blending
Mechanical Opening/Cleaning Scouring Drying
Mechanical Opening
FIGURE 2.23 Stage I wool scouring sequence. (Courtesy of Andar Ltd.)
© 2003 by CRC Press LLC

RawCotton
De-dustingAutomaticBaleOpening
Pre-Cleaning
TuftBlending
IntensiveOpening and Cleaning
(a) (b) (d) (f) Card(d)(c)
FIGURE 2.24 Example of blowroom sequence for cotton fibers. (Courtesy of Trutzschler GmbH.)
© 2003 by CRC Press LLC

now has pressure and light sensors linked to a central computer control that monitorsand regulates the pneumatic transport of material from machine to machine, therebyoptimizing machine utilization. However, even with such sophistication, the overallcleaning efficiencies of blowroom installations fall within the range of 40 to 70%,1,38
depending on fiber type.
REFERENCES
1. Szaloki, S. Z., Opening, Cleaning and Picking, Vol. I, Institute of Textile Technology,Charlottesville, Virginia, 1976, 126.
2. Brearley, A. and Iredale, J. A., The Worsted Industry, WIRA/British Textile Tech-nology Group, Leeds, U.K., 1980.
3. Anderson, C. A., Lipson, M., and Wood, G. F., Aqueous Jet Scouring of Raw Wool:part II, Studies of Laboratory-Scale Multi-stage Scouring, J. Text. Inst., 55, 1964,T586–T585.
4. Anderson, C. A., Lipson, M., and Wood, G. F., Aqueous Jet Scouring of Raw Wool:part III, Preliminary Pilot-Plant Studies, J. Text. Inst., 56, 1965, T280–T286.
5. Anderson, C. A. and Wood, G. F., Aqueous Jet Scouring of Raw Wool: part IV, Time,Temperature and Concentration Effects with Various Detergent Systems, J. Text. Inst.,57, 1966, T545–T550.
6. http://www.saltunion.com/Products_3e.html.7. www.woolgroup.co.nz. 8. Stewart, R. G., Woolscouring and Allied Technology, 3rd ed., Caxton Press,
Christchurch, New Zealand, 1985.9. http://www.austehc.unimelb.edu.au/tia/287.html.
10. McCracken, J. R., Samson, A., and Chaikin, M., The systematic optimization of theaqueous compression-jet wool scour: part 1, Pre-optimization procedures, J. Text.Inst., 63(1), 1972, 1–23.
11. McCracken, J. R., Samson, A., and Chaikin, M., The systematic optimization of theaqueous compression-jet wool scour: part II, Scouring trial for optimum productioncapacity, J. Text. Inst., 63(1), 1972, 24–25.
12. McCracken, J. R., Samson, A., and Chaikin, M., The systematic optimization of theaqueous compression-jet wool scour: part III, Trials for optimum quality of scouredwool, J. Text. Inst., 63(1), 1972, 34–50.
13. McCracken, J. R., Samson, A., and Chaikin, M., The systematic optimization of theaqueous compression-jet wool scour: part IV, The optimum conditions of liquorreclamation and the establishment of equilibrium, J. Text. Inst., 63(1), 1972, 51–64.
14. Samson, A., The flow of liquid from a jet through a compressible porous layer: part1, Analysis of methods of applying a liquid to flow through a porous layer, J. Text.Inst., 63, 1972, 375–384.
15. Samson, A., The flow of liquid from a jet through a compressible porous layer: partII, The impingement of a plane free turbulent jet onto a flat impervious surface, J.Text. Inst., 63., 1972, 502–514.
16. Samson, A., The flow of liquid from a jet through a compressible porous layer: partIII, The characteristics of liquid flow through a compressible layer of loose wool, J.Text. Inst., 63, 1972, 551–572.
17. Samson, A., The flow of liquid from a jet through a compressible porous layer: partIV, The impingement of a submerged plane free turbulent jet onto compressible porousmedium, J. Text. Inst., 63, 1972, 375–384.
© 2003 by CRC Press LLC

18. Samson, A., The measurement of fibre entanglement in scoured wool, J. Text. Inst.,63, 1972, 177–179.
19. Kruger, P. J., The measurement of fibre entanglement in scoured wool reply, J. Text.Inst., 63, 1972, 179–181.
20. Kruger, P. J., The measurement of fibre entanglement in scoured wool reply, J. Text.Inst., 62, 1972, 47.
21. www.csiro.au/news/mediarel/mr1998/mr98145.html; www.andar.co.nz/pages/Prod-ucts/effluent.htm.
22. Bremner, J., Woolscours of New Zealand: Tales of the Early Industry, Caxton Press,Christchurch, New Zealand, 1985.
23. Wood, G. F., Wool-Scouring (Textile Progress, Vol. 12, No. 1), The Textile Institute,Manchester, U.K., 3, 1982.
24. De Boos, A., Australian Wool — Competitive through Innovation, Textile and FibreTechnology, Belmont, Australia, www.tft.csiro.au ([email protected]).
25. The Textile Industry and the Environment, Technical Report No. 16, United NationsEnvironmental Programme, New York, 1993.
26. Nemerow, N. L., Industrial Water Pollution: Origins, Characteristics and Treatment,Addison-Wesley, Boston, MA, 1978.
27. www.andar.co.nz/contents.htm.28. Louis, R., Mizell, A., Davis, E., and Oliva, E.C., A critical study of wool carbonizing,
Text. Res. J., 32, 1962, 497–505.29. Pressley, T. A., Carbonizing investigations II: The uptake of sulphuric acid by wool
and by trefoil bur, Proc. International Wool Textile Research Conference, Melbourne,Australia, Vol. E, 1955, 389–397.
30. Mizell, L. R., Davis, A. E., and Oliva, E. C., A critical study of wool carbonizing,Text. Res. J., 32, 1962, 497–505.
31. Crewther, W. G. Carbonizing investigations III: A new method for protecting woolduring carbonizing, Proc. International Wool Textile Research Conference, Mel-bourne, Australia, Vol. E, 1955, 408–420.
32. Crewther, W. G. and Pressley, T. A., Carbonizing investigations part IV: Industrialcarbonizing trials to assess the protection of wool by surface active agents added tothe acid, Text. Res. J., 28, 1958, 67–72.
33. Crewther, W. G. and Pressley, T. A. Carbonizing investigations part V: The effect ofwater content on the action of sulphuric acid on wool: the significance of tests fordamage, Text. Res. J., 28, 1958, 73–77.
34. Crewther, W. G. and Pressley, T. A., Carbonizing investigations part VI: A comparisonof different types of surface-active agents in laboratory carbonising, Text. Res. J., 29,1959, 482–486.
35. Lee, J. K and Kin, Y. S., Linear programming for cotton mixing: “Computers in theworld of textiles,” The Textile Institute, Manchester, U.K., 1984, 90.
36. Kang, T. J and Lee, J. K, Application of linear programming to wool blending in thekorean textile mills, Advanced Workshop: “The application of mathematics andphysics in the wool industry”, WRONZ and The Textile Institute, Manchester, U.K.,February 9–12, 1988, 43–51.
37. Ross, D. A., Carnaby, G. A., and Lappage, L., Woollen-yarn manufacture (TextileProgress, Vol. 15, No. 1/1), The Textile Institute, Manchester, U.K., 1986.
38. www.unicom.com.pk (Google).
© 2003 by CRC Press LLC

APPENDIX 2A
Lubricants
Lubricants are applied to wool for a number of reasons associated with the frictioncharacteristics of the scoured wool, but principally to minimize fiber breakage andstatic charges resulting from frictional contact with machine components, and tofacilitate cohesion of blends containing short fibers or lustrous fibers with lowinterfiber friction. The alleviation of such problems minimizes the generation of fly(airborne fiber fragments and short fibers) and the loss of good fiber during thematerial processing. Lubricants may also be used to disperse antistatic agents in theproduction of yarns for certain end uses, e.g., carpets. It is, however, axiomatic that,once a lubricant has fulfilled its function of facilitating processing, it should be easilyremovable, preferably with a biodegradable synthetic detergent.
There are three main types of lubricants: fatty, saponifiable oils, mineral oils,and synthetic lubricants.
Fatty-based products. This is the traditional product, which is declining in use.It comprises oleine (oleic acid obtained through a chemical treatment of fats) withan emulsifying additive, oxidation stabilizers, and antistatic agents. Fatty-type lubri-cants are saponifiable (i.e., will form soap in the presence of an alkali) and are easilyremoved in soap/alkali scouring solutions.
Mineral lubricants. These are refined mineral oils blended with surfactants.Although they are not water soluble, they do produce emulsions when mixed withwater, and this ease of emulsification aids scourability.
Synthetic lubricants. These may be based on silicones, polyglycols, or syn-thetic esters and are either water soluble but grease immiscible, or water solubleand grease miscible. The latter is used when the yield has a high residual greasecontent (approx. 5%), as is usually the case for carpet yarn production.
The choice of lubricant usually dependents on the end use of the yarn, particu-larly with woolen spun yarns. Generally, the performance of fatty-based lubricantsis favored by the knitwear sector, whereas, in the carpet sector, the trend has beento mineral-oil-based products and then to water-soluble lubricants. Reported studiesof the range of lubricants on the worsted system show no preference as to lubricanttype.1
Yarns are usually sold by weight and, ultimately, the lubricant applied to fiberswill be part of the measured weight. To satisfy both the commercial implicationsand the technical requirements, the amount of lubricants applied is kept within 5 to10% of actual oil, based on weight of fiber (WOF). This may be administered tothe fiber in an emulsion form having equal amount of water. The water evaporatesduring processing, having assisted in evenly distributing the lubricant throughoutthe fiber mass. A low level of lubricant may be used for processing, referred to as
© 2003 by CRC Press LLC

dry processing, which must be carried out under high relative humidity of around75% and 18°C. The wool should have a residual grease content of 0.3%. A mixtureof 1% water-soluble lubricant and 6% water WOF is applied to the fiber blend toobtain a regain of 22%.
REFERENCE
1. Ross, D. A., Carnaby, G. A., and Lappage, L., Woollen-yarn manufacture (TextileProgress, Vol. 15, No. 1/1), The Textile Institute, Manchester, U.K., 1986.
© 2003 by CRC Press LLC

Materials Preparation Stage II: Fundamentals of the Carding Process
3.1 INTRODUCTION
From the descriptions in Chapter 2, it should be clear that opened and cleaned or scoured materials arrive at the carding stage in the form of small tufts composed of entangled fibers. We learned in Chapter 1 that the purpose of the carding stage is to disentangle these tufts into a collection of individual fibers, the collection being in the form of a web of fibers, and then to consolidate this collection into a sliveror slubbing of the required count. Cotton or wool tufts fed to the carding stage still contain impurities, which would not be the case for man-made fiber tufts. However, the disentangling of fibers facilitates removal of the impurities.
Definition: Carding is the action of reducing tufts of entangled fibers into a filmy web of individual fibers by working the tufts between closely spaced surfaces clothed with opposing sharp points.
Machines used to carry out this work are called cards, and we shall consider three types that are of importance in the processing of cotton, wool and man-made fibers:
1. revolving flat card 2. worsted card 3. woolen card
Before describing the main features and operation of these cards, certain basic principles common to all three will first be explained and then referred to subse-quently.
From the definition, it can be easily reasoned that carding is most effective with very small, well opened tufts, i.e., containing only a few tens of fibers. Although the opening and cleaning stage produces tufts on the order of a few milligrams, further opening is required to obtain a uniform feed of suitably small tufts for carding. We have seen earlier that a beater/feed roller system can be used for intensive opening. Small tufts attached to the sharp points (i.e., the saw-tooth wire) of the beater can be easily removed by a second saw-tooth wire-covered beater rotating in
3
© 2003 by CRC Press LLC

the opposite direction at a higher surface speed. The “front of the tooth” of the faster beater would be working on the “back of the tooth” of the slower beater and would “strip” the tufts from the latter. The principle is that point-of-tooth to back-of-toothgives a stripping action (Figure 3.1a). To disentangle the fibers of the tufts now attached to the faster-moving surface, a stationary or much slower moving surface, covered in sharp points, is required to be in close proximity with the faster surface. The motion of the slower surface may be in the same or opposing direction, but the sharp points would be angled to oppose those of the faster-moving surface. Thus, point-of-tooth to point-of-tooth gives the carding action (see Figure 3.1b). For individual fibers attached to the faster-moving surface, point-of-tooth to point-of-tooth may also be used as a stripping action to build a web of individual fibers. Figure 3.1c illustrates the situation of back-of-tooth to back-of-tooth, which enables the points on the faster moving surface to lift individual fibers from the base of the
Stripper
Swift(Fast) (i)
POINT-TO-POINT ACTIONS
Doffer(Slow)
Swift(Fast)
(ii)
Worker(Slow)
Stripper(Fast)
Worker
Worker(Slow)
Stripper
Swift(Faster Than
Stripper)(iii)
POINT-TO-BACK ACTIONS
Swift
(iv)
Swift
(v)
BACK-TO-BACK ACTION
Fancy(FasterThanSwift)
FIGURE 3.1 Basic carding actions. (Courtesy of Brearley, A., pub. Pitmans & Sons Ltd.)
© 2003 by CRC Press LLC

points on the slower surface. This action may be used as an aid to fiber stripping for web formation.
3.2 THE REVOLVING FLAT CARD
3.2.1 THE CHUTE FEED SYSTEM
Earlier, the value of 500 kg/h was given as an average production rate for the throughput of a short-staple (e.g., cotton) opening and cleaning line. The revolving flat card, also frequently called a cotton card, is a short-staple carding machine, and production rates are usually below 100 kg/h, depending on fiber type. In certain situations, production rates of 30 to 50 kg/h are used commercially. The reason for this concerns the opening up of the fiber feed into suitable tuft sizes for the carding action. Equation 2.1 (Chapter 2) applies to the opening part of the card, and we can see that, with all other factors remaining constant, tuft size is largely dependent on the production rate, and that a modest rate will give small tufts. To obtain small tufts at very high production rates would mean increasing the beater speed, and the number of points on the beater surface also may be increased. The difficulty is that increased beater speed may result in fiber breakage. This is, therefore, a limitation to the speed that would be suitable. Fiber breakage in carding is discussed in Chapter 4. Since the production rate of a single card cannot match the blowroom output, several cards must be used and linked to the blowroom in such a way that there is a uniform feed of the fiber mass to each card.
Figures 3.2 and 3.3 illustrate that the tufts are transported pneumatically to each card via distribution ducting. Each card has a chute feed system connected to the ducting. There are various designs of chute feeds, but their working principles are basically similar, and Figure 3.4 depicts an example of the essential features. There is an upper and lower chute separated by a feed roller and beater, and a pair of feed rollers is positioned at the end of the lower chute. Each chute has air-escape holes and a pressure sensor fitted to control a preset compacted volume of tufts in the chute. The upper chute receives tufts from the distribution ducting, and the trans-porting air is exhausted through the air-escape holes. The feed roller and beater
FIGURE 3.2 Short-staple opening, cleaning, and carding lines. (Courtesy of Rieter MachineWorks Ltd.)
© 2003 by CRC Press LLC

remove the material at a slower rate, enabling incoming tufts to build up in this top chute. As the tufts build up and cover the air-escape holes, the pressure sensor detects the associated increased air pressure in the chute, and the tuft feed is closed off. As tufts build up in the top chute, the beater reduces the tuft size and feeds the smaller tufts to the bottom chute. Here, the compaction of the tufts is by air pressure from a fan blower. The rate of removal of the compacted material by the pair of feed rollers is slower than tuft feed, and, much as with the top chute, a pressure switch controls the feed by stopping and starting the upper feed roller.
Figure 3.5 shows the principal elements of the revolving flat card, after the chute feed section, and Table 3.1 gives examples of component dimensions and relative settings. The three main rollers — the taker-in (or licker-in), the cylinder, and the doffer — have saw-tooth wire spirally wound around their cylindrical surfaces to cover the surfaces in sharp points; this is referred to as saw-tooth wire clothing.
FIGURE 3.3 Short-staple carding line. (Courtesy of Rieter Machine Works Ltd.)
FIGURE 3.4 Basic features of a short-staple chute feed system. (Courtesy of Crosrol UKLtd.)
© 2003 by CRC Press LLC

Positioned above the upper surface of the cylinder is a series of rectangular bars (80 to 116). Each bar has one flat surface, the working surface, clothed in sharp points. These components are called flats. The clothing specifications of the taker-in, cyl-inder, flats, and doffer vary with fiber type with respect to geometry and point densities. Appendix 3A discusses card clothing in greater detail.
The flats BF and FF have fixed positions, so they are motionless, with their working surfaces set very close to the cylinder clothing. We refer to these as the back fixed flats, BF, and the front fixed flats, FF; they may also be called stationary
TABLE 3.1Example of Dimensions and Relative Settings of Revolving Flat Card
ComponentDiameter
in mm [in]
Tooth densityin pp/cm2
[pp/in2] Speed Draft
Approximate settings in
µm [in]
Taker-in(licker-in)
229 [9] over wire 248 [9.75]
7–8 [40–50]
800 rpm 1000 Taker-in/cylinder 25 [0.010]
Cylinder 1270 [50] 62–100 [400–650]
300 rpm 2.08 Cylinder/flats 25 [0.010]
Flats
No. of
44.5 × 10¹⁶ [1.75 × 40]
106–110
90–100 [600–650]
101.6 mm/min
Doffer 686 [27] over wire 705 [27.75]
100 16–40 rpm 15–35 times slower than cylinder
Cylinder/doffer 12.5 [0.005]
FIGURE 3.5 Basic features of a revolving flat card.
Feed RollerFlats
Cylinder
Doffer
Taker-InTrash Box
Feed Plate
BF
FF
+
++
+
+
+
+
© 2003 by CRC Press LLC

carding elements. Incorporated in the fixed flats zone is a separator knife edge and suction unit for removing dust and trash particles. The remaining flats have their opposite ends attached to an endless chain of roller bearings so that they can be moved continuously over the upper surface of the cylinder, with around 30 to 46 flats1 at any time having their working surfaces set very close to the cylinder clothing, with opposing angles of tooth. This circuitous path of the flats results in them being called the revolving flats. The diagram shows the directions of rotation of the main cylinders and the revolving flats, and the table gives typical speeds.
3.2.2 THE TAKER-IN ZONE
The taker-in, feed roller, and feed plate combination functions as a fine opener, with the taker-in playing the role of the beater as referred to earlier. The compacted tufts moving from the chute feed are brought into contact with the taker-in, which reduces the tufts to microtuftlets and individual fibers. During opening, trash particles and neps are released. The pair of knife-edge plates, termed mote knives, that are posi-tioned close to the taker-in surface assist with retaining usable fiber while ejecting the impurities — vis-à-vis an imbalance of centrifugal and aerodynamic forces. The combination of grid bars and perforated plate, also positioned below the taker-in, enables the further removal for trash particles. However, in removing trash particles, fiber can also be removed; the aim is to keep this “lint” content of the waste to a minimum. The effectiveness of cleaning in this area has been improved in two ways. Most short-staple cards now employ two or more of what are referred to as stationary carding plates or combing segments positioned under the taker-in (see Figure 3.6a). These break up any tufts that might be the result of inadequate opening and reduces the lint content of the waste. Table 3.2 give examples of results obtained from mill trials with and without carding plates fitted to taker-in zone, and it is evident that significant reductions in lint content can be obtained with the use of carding plates. Figure 3.6b shows another development for improving the opening in the licker-in zone. This involves multiple taker-ins, carding plates with mote knifes, and suction slots. Note that, in both diagrams, the feed roller lies below the feed plate. This enables improved opening of the fiber mass, and the feed plate is also used as a sensor for detecting thickness variations in the batt feed for the long-term autolev-eling of the fiber mass.
FIGURE 3.6 Carding plates and multiple taker-ins. (Courtesy of (a) Rieter Machine WorksLtd. and (b) Trutschler GmbH & Co.)
(a) (b)
© 2003 by CRC Press LLC

3.2.3 CYLINDER CARDING ZONE
The microtuftlets and individual fibers retained on the taker-in clothing are trans-ferred to the cylinder clothing by the point-of-tooth to back-of-tooth action. The cylinder motion brings the fiber mass into contact with the back fixed flats, BF, and the microtuftlets are further opened.
As the fiber mass on the cylinder clothing is transported by the cylinder into the zone of the revolving flats, the point-of-tooth to point-of-tooth carding action takes place between the revolving flats and the cylinder clothing so that the microtuftlets become caught in the flats. Most fibers (97%), with ends projecting from the flats and held by the cylinder clothing, are removed as individual fibers. Not all fibers have their ends projecting sufficiently close to the cylinder to be pulled from the fiber mass caught in the flats. These remain in the flats and, as each flat leaves the carding zone, the retained fiber mass is stripped from the flat as waste — collectively termed flat strips.
The objective of the stationary flats section above the licker-in-transfer is to ensure that any fiber tufts transferred to the cylinder are quickly opened so that, on arriving under the flats, the fiber mass can be easily separated into individual fibers. This prevents long fibers from getting embedded into the revolving flat clothing and allows these fibers to be hooked by the cylinder clothing points for effective carding.2
Grimshaw3 reports that these flats are also a barrier to hard trash particles such as seed coatings and therefore protect the revolving flats clothing against damage by such particles, especially at high production rates. Leifeld4 claims that, at this point, the separate knife-edge and suction unit will remove even large seed fragments.
Nevertheless, the tendency is for fine trash or dust particles to remain attached to fibers, as Figure 3.7 illustrates, and consequently pass into the carding zone. Feil2
suggests that, in the carding zone, the motion of the cylinder clothing generates air
TABLE 3.2Effect of Carding Plates
Fiber Without With Difference (%)
Cotton waste • Taker-in waste, % • Lint content, % • Trash and dust content, %
4.532.601.93
3.24 1.28 1.96
–28.5–50.8 +1.6
Bleached waste • Taker-in waste, % 17.6 8.0 –54.5
Cotton: strict middling • Taker-in waste, % • Lint content, % • Trash and dust content, %
3.793.280.51
0.89 0.68 0.21
–76.5–79.3–58.8
Egyptian cotton • Taker-in waste, % • Lint content, % • Trash and dust content, %
2.752.290.46
1.61 1.16 0.45
–41.5–49.3 –2.2
© 2003 by CRC Press LLC

turbulence that, along with mechanical forces, causes the trailing ends of fibers attached to the teeth of the cylinder clothing to vibrate rapidly and shake loose trash particles and dust. The fiber mass on the revolving flats acts as a filter, and much of the impurities are deposited into it to be later removed as part of the strip. Figure 3.8 shows cotton flat strips containing trash particles and neps. In the carding of cotton fibers, revolving flats are an essential feature of the card. Since man-made fibers do not contain significant levels of impurities, stationary flats may be used in preference to revolving flats (see Figure 3.9).
FIGURE 3.7 Trash and dust particles on fiber. (Courtesy of Rieter Machine Works Ltd.)
FIGURE 3.8 Cotton flat strips.
FIGURE 3.9 Revolving and stationary flats. (Courtesy of Rieter Machine Works Ltd.)
© 2003 by CRC Press LLC

3.2.4 CYLINDER-DOFFER STRIPPING ZONE
The individual fibers attached to the cylinder clothing collectively appear as a very light web on the cylinder surface. This web moves with the cylinder rotation and first comes into contact with the front fixed flats, FFs, which further extract neps and fine trash particles and comb the fibers. It then comes into contact with the doffer clothing, which removes the fibers from the cylinder by the point-of-tooth to point-of-tooth stripping action. This cylinder-doffer area is called the transfer zone,since the objective is for fibers to be transferred from the cylinder to the doffer. Not all the fibers, however, are stripped on first contact with the doffer; some remain on the cylinder for several cylinder rotations before being removed. The cylinder under-screen controls the boundary air layer at the cylinder surface to prevent the undoffed fibers being ejected from the cylinder clothing during their motion from the dof-fer/cylinder area to the taker-in/cylinder area. Feil2 reports that there appears to be an optimal number of times fibers should go through the transfer zone before being stripped by the doffer; too short or too long a dwell time on the cylinder impairs the quality of the output material, i.e., the sliver.
3.2.5 SLIVER FORMATION
Since the surface speed of the cylinder is much faster than the doffer (see Table 3.1), there is buildup of fibers on the doffer, forming a thicker web of fibers (the doffer web) than that on the cylinder. The rotation of the doffer brings the web to the front of the card, where it is removed (as the card web) by a wire-covered stripping roller (see Figure 3.10) passed through a pair of pressure rollers before being condensed into a sliver and wound into the sliver can (see Figure 3.11). The pressure rollers are used to crush trash particles such as, with cotton, seed coat fragments that may still be present in the web attached to fibers. The crushed particles would then be removed during subsequent processing of the sliver.
3.2.6 CONTINUITY OF FIBER MASS FLOW
Despite the situation that not all fibers are removed from the cylinder on their first pass through the transfer zone, there is continuity of mass flow within a few minutes of running; i.e., rate of batt feed to the taker-in equals the sum of the rate of waste accumulation and sliver production rate.
FIGURE 3.10 Stripping of doffer web and sliver formation. D = doffer, S = stripping roller,P = pressure rollers, W = doffer web, SL = sliver. (Courtesy of Rieter Machine Works Ltd.)
© 2003 by CRC Press LLC

3.2.7 DRAFTS EQUATIONS
Let us consider surface speeds of the machine components moving the fiber mass through the card, which eventually forms the sliver that is coiled in the can. For simplicity, we can ignore the speed of the flats, because this only governs the rate of removal of the flat strips from the carding zone. Based on the above description of the operating principles,
Vf << Vt < Vc > Vd < Vs < Vcr <Vc < Vsc (3.1)
where Vf = feed rollerVt = taker-inVc = cylinderVd = dofferVs = stripping roller
Vcr = crushing rollsVca = calender rollersVsc = coiler rollers
The above are in units of meters per minute.The relation of these surface speeds shows that the fiber mass is subjected to a
sequence of drafts (see Equation 1.11, Chapter 1) as it moves through the card.
Dft = Vt/Vf; Dtc = Vc/Vt; Dcd = Vd/Vc; Dds = Vs/Vd; Dscr = Vcr/Vs;Dcrc = Vca/Vcr; Dcsc = Vsc/Vca (3.2)
All drafts are >1 except Dcd . The drafts Dds; Dscr, Dcrc, and Dcsc are sufficiently close to one to be ignored. The total draft for the card is given by
DTM = Dft · Dtc · Dcd = Vd/Vf (3.3)
It should be evident that the width of doffer web equals the width of the batt feed and that, in consolidating the doffer web into a sliver, the mass per unit length of
FIGURE 3.11 Sliver can build. (Courtesy of Rieter Machine Works Ltd.)
© 2003 by CRC Press LLC

the sliver equals the mass per unit length of the doffer web, ignoring drafts Dds, Dscr, Dcrc, and Dcsc. From Equation 1.11 (Chapter 1), we can write,
DTF = ML/SL (3.4)
where ML = the mass per unit length (in g/m) of the battSL = sliver count in ktex
Since Equation 3.3 deals only with the fiber feed and the sliver, we can relate DTM
and DTF by subtracting the percentage waste, W, from ML removed during carding. Hence,
DTM = DTF (1 – 0.01W) (3.5)
We may refer to DTM and DTF as the total mechanical draft and the total fiber draft. The carding of fibers will generate heat, which may alter the moisture content of fibers. Therefore, in determining W from measurements of ML and SL , the effect of moisture regain must be controlled by conditioning each fiber mass in a standard atmosphere.5
3.2.8 PRODUCTION EQUATION
Strictly speaking, the last pair of rollers that moves the fiber mass are the coiler rollers, which place the sliver in the sliver can. Therefore, Vsc is the production speed in meters per minute. Hence the production rate (PC) in kg/h is given by
PC = 60 · Vsc · SL · 10–3 (3.6)
3.2.9 THE TANDEM CARD
From the above description of the operation of a short-staple card, we reason that the effectiveness of the carding action is related to, among other factors, the number of points used in attempting to separate the fiber mass into individual fibers, i.e., to discretize the fiber mass. Increased point density and surface speed of the cylinder are therefore important factors. The number of points per unit area per unit time can be used to make a judgement of the available carding capacity or carding power. A higher value should enable discretization of the fiber mass to the individual fibers level and permit a high fiber mass throughput, but the fibers will be further stressed. However, the use of two cylinders in tandem, with a higher point density on the second cylinder, will also give greater carding power — but with less stressing of the fibers.
Figure 3.12 is a diagram of a Tandem card arrangement. The first cylinder system is referred to as the, breaker card, and the second, which has the closer settings of machine components, is called the finisher card. The first cylinder substantially separates the microtuftlets, and the resulting web passes through crush rollers before entering the second cylinder system. The finisher card receives the fiber mass in an
© 2003 by CRC Press LLC

ideally suitable state for completing the process of fiber separation and trash/micro-dust removal. Tandem carding gives a relatively gentle and progressive carding action, with less fiber breakage and waste than with single-cylinder cards. The cost of tandem cards is a major disadvantage; therefore, few tandem cards are in com-mercial use. These are mainly for high-quality cotton processing or where microdust presents problems in rotor spinning (see Chapter 6).
3.3 WORSTED AND WOOLEN CARDS
Figures 3.13 and 3.14 show typical examples of worsted and woolen cards. Collec-tively, these may be referred to as roller-clearer cards, and Table 3.3 gives relative dimensions.
Superficially, these cards appear to be an arrangement of large tandem cylinders with several pairs of large and small rollers positioned over each cylinder and a
FIGURE 3.12 Schematic of tandem carding system. (Courtesy of Crosrol UK Ltd.)
C. CylinderD. DofferF. Feed RollerP. Pressure/Crush RollersR. Redirection RollersT. Taker-in
123 240 110-50121200
−1440
A
12701050
1700
1200
3700
450
PR04 1900
300 210-50
FIGURE 3.13 Worsted carding set. (Courtesy of Befama Ltd.)
© 2003 by CRC Press LLC

TABLE 3.3Typical Dimensions of Roller Clearer Cards
Worsted carding set: 15-m length × 3.5-m working width
Weighing hopper Working width: 2–3.5 mWeigh-pan capacity: 0.58–0.75 m3
Bin capacity: 3.8 − 12.8 m3
Feed arrangement Two pairs of feed rollers, 86 mm dia.Taker-in roller, 500 mm dia, with worker/stripper, 215/123 mm diaTransfer roller, 500 mm dia
Breast Main cylinder, 1.27 m up to 5 workers/strippers 240/123 mm diaTransfer roller, 270 mm dia
Cleaning unit Two Morel beaters, 500 mm diaTransfer roller, 270 mm dia
Roller card Swift, 1.5m dia; up to five pairs of workers and strippers, 270/123 mm dia without fancy; four pairs with fancy, 270 mm dia
Doffer, 1.27 m dia
Woolen carding set: 18- to 25-m length × 3-m working width
Weighing hopper or volumetric feeder
(As above)
Feed Two pairs of feed roller, up to 86 mm dia.Taker-in, 500 mm diaTransfer roller, 500 mm dia
Breast (As above)
Roller cards (As above with fancy)
+ ++ +
++
++++ +
12501000
1100
FIGURE 3.14 Woolen carding set. (Courtesy of W. Tatham Ltd.)
© 2003 by CRC Press LLC

double hopper and weigh-pan feed to the card. We refer to these arrangements as carding sets. The first cylinder in the set, usually the smallest in size, is termed the breast, and each of the others a swift. Each large and small roller positioned over the breast or swift is called, respectively, a worker and a stripper. In a carding set of up to three swifts, the first is referred to as the scribbler. This is followed by either a single or two-part finisher card or carder. One or two swifts may be used as the finisher card, depending on fiber type, fineness, length, and, in case of the woolen card, slubbing count range; in worsted carding, a single swift would be used for wool containing up to 4% VM and a double swift for wool containing VM > 5%.
The component settings and point density of the clothing, respectively, become progressively closer and higher from breast to second finisher. The point clothing on the components of the carding set are very different from those on the short -staple card. Saw-tooth wire and what is termed fillet wire are fitted to the working components of worsted and woolen cards. Appendix 3A gives detailed consideration of the clothing types. As the figures show, the output material from the worsted card is in sliver form, and the woolen card produces slubbings (see Chapter 1). Production rates depend on fiber fineness. It is lowest for finer wool and can range from 120 to 150 kg/h for 19 µ wool to 270 to 350 kg/h for 30 µ wool.
At one time, the general thinking was that the shorter wools were better carded on woolen cards and longer wools on worsted cards. However, the woolen card handles a wide range of lengths and length distribution for producing yarns for a broad range of end uses, such as hosiery knitting, woven cloth or carpets, blankets, and felts. Fibers carded cover a wide range of 100% virgin wool for knitting (e.g., lambswool, Hauter 44 mm, 19 to 23 µ; Shetland wool, Hauter 56 mm, 26 to 32 µ) and luxury fibers such as mohair, vicuna, rabbit angora, or camel hair and manu-factured and recycled fibers. Worsted cards also process luxury fibers like mohair, alpaca, and cashmere; man-mades; and spun silk.
3.3.1 HOPPER FEED
The fiber is usually supplied from the blending stage into a single or double hopper by pneumatic conveyance or by manual loading into the feeder bin. The principles of operation of hopper feeders and weigh-pan feeding have been described earlier. With double hopper feed, the hoppers work in series; the first hopper supplies the second with a regular uniform rate of fiber mass. The first hopper is not usually fitted with a weigh pan but is set to fill the second hopper when activated by a optical sensor positioned to monitor the reserve bin of the second hopper. The first hopper therefore runs intermittently as required. The double-hopper system is aimed at reducing variation in the feed to the card and to introduce an extra opening. However, compared with single-hopper weigh-pan feeders, there is a significantly increased space requirement and cost. Volumetric feed hoppers may be necessary for high production rates, as the response time of weigh pan hoppers can restrict these rates. Nevertheless, regularity of feed is essential to the uniformity of the carded material, particularly with respect to the slubbings produced by the woolen card. This topic will be discussed in more detail later, when carding quality parameters and autolev-eling are considered.
© 2003 by CRC Press LLC

3.3.2 TAKER-IN AND BREAST SECTION
The taker-in and breast sections of the card are for opening the fiber mass into small tuftlets and to start the process of individualizing the fibers. Generally, fibers pro-cessed by roller-clearer cards are coarser, longer, and often of a higher crimped state than fibers processed by revolving flat cards. The batt of such fibers is likely to be of greater bulk. The rollers covered with saw-tooth wire clothing are therefore used as the feed-rollers in the taker-in zone. Two pairs of feed rollers (see Chapter 4) may be used to feed the batt fringe to the taker-in. Single or multiple taker-ins may be used depending on material throughput, vegetable matter (VM) content, and fiber type. For high throughput and/or fine fibers, a worker/stripper pair may be used with the first taker-in, and if the VM level is high, a burr beating roller with catch tray may also be fitted. The breast is also fitted with pairs of workers and strippers so as to reduce the tufts transferred from the licker-in into microtuftlets and to begin the progressive process of fiber separation. The worker/stripper units, in combination with the swift, give a carding action (see Figure 3.1) and the burr beaters a cleaning action, which are described below.
3.3.3 INTERMEDIATE FEED SECTION OF THE WOOLEN CARD
In woolen carding, the web from the scribbler is condensed into a thick sliver and cross-fed to the carder; that is to say, the sliver is laid across the feed belt of the carder. This method of transferring the material from scribbler to carder effects an additional blending of the fibers and thereby assists in evening out variations in density across the width of the web from the scribbler to produce regular slubbings.
The device used to accomplish the cross-feed is called an intermediate feed.There are different types of intermediate feeds, but the simplest of the popular ones is Scotch feed, which is a sliver plaiting (cross-laying) mechanism. As illustrated in Figure 3.15, the web of fiber is removed from the doffer of the scribbler by means of an oscillating comb and passed through crush rollers to pulverize any remnants of carbonized VM. It is then drawn through a condenser funnel and compressed by a pair of calender rollers to make a sliver. The sliver is guided by a lattice and is laid across the feed belt of the carder by a pair of rotating rollers that traverse across the feed belt. If the web of fibers is moving in the direction indicated by arrows X-X, and the cross-feed by Y, then any thickness variation across the width of the web will tend to be evened out by the cross-feed.
3.3.3.1 Carding Section
As the fibers/microtuftlets are transferred onto the swift in the finisher carding section, they are brought into contact with pairs of workers and strippers. Figure 3.1 depicts the carding action at each worker-stripper pair. The swift has the fastest surface speed, and the clothing points oppose those of the much slower-moving worker. The resulting carding action divides the tuftlets making contact with workers; parts will remain on the swift clothing and be moved forward to the next and subsequent worker stripper pairs for further separation, and then eventually into the doffer stripping zone. The clothing points of the stripping rollers are angled in the
© 2003 by CRC Press LLC

same direction as the workers but travel at a faster surface speed. The tuftlet portions on each worker move with the roller until they contact the clothing of the stripper roller, where they are removed by the stripping action. These tuftlet portions are then brought back into contact with swift, which removes them from the stripper to become mixed with other fiber/microtuftlets newly transferred from the take-in. The swift-worker-stripper combination gives both a carding and a blending action. The time taken for the portion of a tuftlet to be returned to the swift may be called the delay. The product of the swift speed and the delay would give the distance between the portion that remained on the swift and that caught by the worker and returned by the stripper. This gives a blending action along the length of the card, which is repeated at each worker-stripper pair. Similar to the revolving flats card, not all fibers reaching the cylinder/doffer zone for the first time are removed. Those that become part of the recycling layer can be, on each cycle past the doffer, repeatedly acted upon by the worker-strippers of the particular swift until they form part of the doffer web. Thus, the number of worker-stripper combinations and the cylinder-doffer influence the blending effect. It can be shown that, concurrent with this blending, there is an evening of the fiber mass flow. Chapter 4 describes the theoretical basis of the blending and evening actions of roller-cards.
3.3.4 BURR BEATER CLEANERS AND CRUSH ROLLERS
We know that wool destined for the woolen process is usually carbonized to remove vegetable impurities. Wool used in the worsted process is likely to have a much lower VM content that can be removed mechanically during carding with less chance of damage. The publication, Textile Terms and Definition, by The Textile Institute,6 refers to burry wool as wool contaminated with vegetable impurities
Thin
Thick
X
X
Doffer
Comb
LayingRollers
Lattice
Lattice Feed
CalenderRollers
WebFunnel
Y
FIGURE 3.15 Intermediate feed: Scotch feed.
© 2003 by CRC Press LLC

adhering to the fleece. In worsted carding, VM is removed by what are called burr beaters. These are small-bladed rollers for detaching VM particles from the wool and ejecting them into waste trays. Figure 3.16 shows a burr beater positioned above a special wire- covered roller called Morel roller. The bur beater may be positioned above the licker-in of the breast section, but it is also used effectively between the breast and the intermediate, and between the intermediate and the finisher section. Here, the burr beaters and Morel rollers are used. The Morel roller has specially designed wire clothing, called a Morel wire, that enables VM particles to ride on the surface of the clothing (i.e., on the top of the teeth) and fibers to lie sufficiently below the VM so that burr beaters can strike the impurities from the rollers. The burr beaters rotate in the same direction as the Morel rollers but at higher surface speeds.
Crush rollers, which pulverize any VM remnants in the card web, may be option-ally fitted to worsted card but today are rarely incorporated. As discussed in Chapter 4, wool fibers can be damaged by crushing. Crush rollers are, however, present on woolen cards, located after the scribbler and before the intermediate feed, to crush remnants of carbonized VM, which is removed by subsequent carding actions.
Morel
Burr Tray
Burr Beater
FIGURE 3.16 Burr beater and morel roller.
© 2003 by CRC Press LLC

3.3.5 SLIVER AND SLUBBING FORMATION
Fibers are removed from the swift to form the doffer web in a similar point-of-toothto point-of-tooth stripping action as described for the revolving-flats card. However, as we will see below, the wire clothing of the swift can be of such length that fibers at the base of the wire clothing need to be raised to the tips of the points for effective fiber transfer to the doffer. This is performed by the back-of-tooth to back-of-tooth action with a wire-clothed roller, called a fancy, mounted close to the surface of the swift just before the doffer. Figure 3.1 shows the location of the fancy roller in relation to the swift and the doffer.
On the worsted card, the doffer web is removed either by a high-speed oscillation comb (fly comb) or by redirecting rollers and is then consolidated into a sliver, whereas, with the woolen system, the doffer web is converted into slubbings. Slub-bings have the appearance of soft, twistless string, and they require only small amounts of attenuation before being twisted to form a yarn. To produce slubbings, the web from the finisher card is split into many strips, each of a width that will give the required slubbing count. Each strip is then rubbed to condense and consol-idate it into a soft, twistless string. The part of the carding set that converts the finisher card web into slubbings is called the condenser. There are two general types of condenser, the tape condenser and ring-doffer condenser.
3.3.5.1 Tape Condenser
This comprises a set of rollers around which is threaded a series of narrow belts (called tapes) or an endless narrow belt to form a line of tapes across the width of the machine (see Figure 3.17). Appendix 3B describes three different tape threadings used for the tape network. The tape width and the mass per unit area of the web determine the slubbing count, and card manufacturers usually recommend tape widths to cover a range of counts. The web is pulled into the network of tapes by entry rollers and, at the dividing rollers, is split into ribbons by the scissor-like action of the tapes.
Positioned after the tapes are pairs of rubbing aprons (or rub aprons); their lengths span the width of the machine. The scissor-like action between the tapes splits the web into ribbons that are then transported to the rubbing aprons. Depending on the width of the tape and of the woolen card, there may be four or six pairs of rubbing aprons placed one above the other. Each pair of rubbing aprons feeds a bobbin build unit (see Figure 3.18).
What is depicted in Figure 3.17 is a part of the tape network that is repeated across the card. For example, for a four-apron set, odd repeats would supply ribbons to rub aprons 1 and 3 in the set, and even repeats run aprons 2 and 4.
The rubbing aprons have two actions: they are driven circumferentially and simultaneously reciprocated lengthways, moving from side to side across the machine (see Appendix 3B). Each pair of rubbing aprons has the side-to-side move-ment of the aprons in opposite directions, so when one apron moves toward the left side of the machine, the other moves to the right.
On entering the rub aprons, the ribbons are consolidated by the rubbing action of the reciprocating movement of the aprons. The rubbing of the aprons rolls the
© 2003 by CRC Press LLC

ribbons into slubbings. The slubbings are simultaneously fed by the aprons onto bobbins, each of which accommodates several winding positions and is driven to wind up the slubbings.
3.3.5.2 Ring-Doffer Condenser
This is an alternative method of slubbing formation, but it is not widely used. The last swift of the carder may be fitted with two or four doffers. The point clothing of each doffer is divided into a series of bands across the card width, each band
E
H
Tape
DofferWeb
Tape
RubbingAprons
A
F
D
C
Aprons3
Aprons1
DividingRollersB
G
FIGURE 3.17 Tape condenser feed to rubbing aprons. (Photo courtesy of Befama Ltd.)
© 2003 by CRC Press LLC

being separated from the next by a narrow leather or plastic tape fixed to the doffer circumference. Thus, as fibers are transferred to the doffer, they form a series of ribbons on the doffer surface across the width of the card. The ribbons are removed from the doffer by oscillating combs and guided by separator rollers to the rubbing aprons to be condensed into slubbings.
3.3.6 PRODUCTION EQUATIONS
The draft equations for roller and clear cards can be derived along similar lines described for the short-staple card. As a worsted card produces sliver, the production rate of the card may be calculated using Equation 3.6.
The production rate, Pc, of the woolen card is determined by
Pc = 1.885 × 10⁻⁷ · C · Ndr · D · Nth (3.7)
where C = slubbing count (tex)Ndr , D = rotation speed and diameter (in mm) of condenser bobbing drive rollers
Nth = total number of threads
3.4 SLIVER QUALITY
Much research has been carried out to establish an in-depth understanding of the physical principles of carding. Consideration of the reported findings and hypotheses merits a chapter in its own right, and therefore Chapter 4 deals in more detail with the theoretical aspects of carding. Here, it is important to consider the matter of sliver and slubbing quality in relation to the effect of various process parameters.
In carding technology, the parameters that may be used as performance indicators with regard to the sliver or slubbing are the trash and dust content (i.e., the cleaning efficiency), the amount of neps and short fiber content resulting from fiber breakage, and the level of irregularity of the sliver or slubbing. As we will see in Chapter 6, yarn quality is directly related to these parameters. The reader is to referred to the list of recommended readings to become aware of the commonly used test methods for measuring these quality parameters.
FIGURE 3.18 Bank of Rub Aprons. (Courtesy of Befama Ltd.)
© 2003 by CRC Press LLC

Also of importance, with respect to yarn quality and spinning performance, are the degree of fiber individualization and the types and distribution of fiber hooks. These, however, are not easily measured characteristics, so they are not used in the general practice for monitoring quality. The quality of a yarn is determined primarily by the processes prior to spinning, and the card quality parameters are of fundamental importance to the resultant yarn quality.
3.4.1 CLEANING EFFICIENCY
The importance of cleaning efficiency solely concerns the carding of natural fibers (in particular cotton) on the short-staple system and wool in the worsted and woolen processes.
3.4.1.1 Short-Staple Carding
With cotton fibers, a low level of neps and trash particles in the sliver is a major objective,4 particularly as the impurity content of cotton slivers will increase almost linearly with carding production rate.7 As we have seen earlier, the licker-in, fixed and revolving flats, and the cylinder play important roles in the removal of trash particles and neps.
Since the trash is embedded in the tufts that constitute the batt, how well the licker-in opens the fiber mass will largely determine how effectively trash particles are removed from the flow of fibers through the card. Although there are a number of devices fitted around the surface of the taker-in to improve cleaning, the impu-rities must be removed with a minimum of fiber loss, and in this the taker-in speed is the controlling factor. Figure 3.19 and 3.20 show, for different cylinder speeds, how the impurity level in the sliver decreases, but the undercard waste increases
Cylinder Speed300
250
200
150
100
50
0800 1000 1200 1400 1600 1800
Taker-in Speed (r/min)
Tra
sh (
mg/
kg)
600 r/min
480 r/min
360 r/min
FIGURE 3.19 Trash content with increased taker-in speed.
© 2003 by CRC Press LLC

with licker-in speed. Increasing the speed above 1500 rpm gives negligible improve-ment on sliver cleanliness but can lead to fiber breakage and increased waste (see Figure 3.20).
The removal of neps and trash improves with carding intensity, so the cylinder and flats speeds are important factors. Figures 3.19 and 3.20 show that, over the range of 300 to 600 rpm, high cylinder speeds will reduce trash content by greater than 50%, depending on taker-in speed, but may also caused more fiber breakage than high taker-in speeds. Increased flats speed will reduce the sliver impurity but increases flat strip waste. Adjustment of the setting of the upper edge of the top front plate to the cylinder clothing can be used to reduce flat strip waste. A close setting reduces the amount of flat strip, and a wide setting increases the waste, but reducing the waste by this means will cause much of the impurities to be fed back into the material flow and subsequently into the card sliver. Close flat settings give more intensive cylinder-flat interaction with the tuftlets; however, Van Alphen7 found flat setting to have no significant effect on the level of impurities in the carded sliver. Front fixed flats reduces neps and fine trash particles, referred to as pepper trash.
Artzt8 used a sensor fitted to the flats to determine the forces present in carding. Reportedly, the carding force, which is indicative of the stresses on fibers, showed an increase of up to 50% over the cylinder speed range. An increase of 10 to 20% was assumed to be tolerable with respect to fiber breakage. The rate of decrease in sliver impurities with rotational speed becomes asymptotic at 500 to 600 rpm, meaning that further increase in speed gives little improvement. The fiber breakage is evidently an important quality parameter. Consequently, trash and nep count on the one hand, and fiber damage on the other, are mutually conflicting quality parameters.
The overall carding system has an efficiency of 95%, which is much higher than the 65% for the opening and cleaning lines of a well equipped blowroom. Taking
Cylinder Speed: A = 600 r/min, B = 300 r/min
Take-in Waste
Flat Strips
Car
d W
aste
(%
)
A
B
A
B
Taker-In Speed (r/min) × 100
16
14
12
10
8
6
4
2
0
100 140 160120 180 200
FIGURE 3.20 Card waste with increased taker-in and cylinder speeds.
© 2003 by CRC Press LLC

the carding zones individually, the cleaning efficiency of the licker-in on its own approximates to 30%, the carding segments give 30%, and the cylinder/flats give 90%. The cylinder/flats carding action therefore gives the highest cleaning effect. Carding efficiency is better the higher the number of points, the closer the settings, and the higher the cylinder speed; the limitation on the values used for these parameters will be fiber breakage.
3.4.1.2 Worsted and Woolen Carding
VM contamination is considered to be an important problem, especially in fine wools. The number and location of deburring points and the use of crush rollers have been studied by Townend and Russell.9 Low burr roller speeds and high Morel roller speeds were found to improve VM removal, but the waste may contain up to 60% fiber. It was also found that VM was more easily removed when the fitted card clothing was flexible fillet, as opposed to metallic wire (i.e., saw-tooth wire). See Appendix 3A. Several mechanical devices,10,11 based on taker-in developments in short-staple carding, have been developed for improving VM removal with reduced fiber loss, but these have yet to be adopted commercially. The effect of fixed flats positioned above the licker-in/cylinder transfer point on the roller and clearer was found to give much lower nep and VM content and a better fiber orientation in output material.12
3.4.2 NEP FORMATION AND REMOVAL
The formation of neps and fiber entanglements at various stages of the preparatory processes and the removal of neps particularly in carding have been well researched.13–21 The important fiber characteristics attributed to nep forming potential have been identified and, in the case of cotton, a neptometer,15,16 has been devised as a useful instrument for comparative evaluation of the nep potential of cotton blends.
Definition: A nep is one or more fibers occurring in a tangled and unorganized mass.6
While this is a useful general definition, when it comes to cotton processing there are various types of neps. Particles that have been identified as neps in the spun yarn may be classified into four categories as described in Table 3.4.13,19 Figure 3.21 shows typical figures for the relative proportions of each category determined with the use of an inspection stop fitted to the USTER® yarn irregularity tester.13 The number of neps per gram of sliver can be measured by an instrument known as the AFIS system,24,25 or the nep content of the card web counted manually or by online measurement with a digital camera as a sensor fitted to the card.4 Figure 3.22 shows that there is a high correlation between measured card web neps and yarn neps. Such measurements are therefore useful for monitoring nep levels in the card slivers.
Neps usually migrate to the yarn surface during the spinning process and result in poor yarn and fabric appearance; they prevent the uniform appearance of dyed or printed cloth, instead giving spotty looking fabrics of lower market value.22 In
© 2003 by CRC Press LLC

spinning, large neps may restrict twist propagation, which, for fine yarn counts, can result in unacceptably high end breakage rates. Thus, large neps may limit the fineness of count that can be spun. H-type neps can pose particular problems in certain spinning systems, in particular rotor spinning (see Chapter 4), where they account for up to 30% of thread breaks.19
TABLE 3.4Nep Classification for Cotton Fibers
Nep classClass
abbrev. Description
Loose fiber neps (may also be referred to as knops or burls)
L A discrete entanglement of fibers larger than 1 mm; can be disentangled
Knot fiber nep K A discrete tightly knotted or highly entangled small (less than 1 mm) group of fibers or a single fiber; cannot be disentangled
Trash nep (not applicable to man-made fibers)
T Leaf, stem, VM particle fragments at the core of an entanglement of a small group of fibers
Husk nep (only in cottons) H Seed coat fragment at core of the entanglement of a small group of fibers or with fibers attached to them
40
30
20
10
02 3 41
Key: 1 = >L2 = >K3 = >T and H4 = >Unidentifiable
Type Nep
Perc
enta
ge o
f To
tal (
%)
FIGURE 3.21 Types of neps in cotton fiber: analysis with Uster inspection stop. (Courtesyof Frey, M. and Schleth, A., Examples of data acquisition for fibres and the application inthe spinning mill, Proceedings of the 22nd International Cotton Conference, Bremen, Ger-many, 1994, 1–30.)
© 2003 by CRC Press LLC

Neps generally are more conspicuous in finer-count yarns because of the diam-eter ratios. Such counts are often used for high-quality fabrics; therefore, the level of neps in the processed fiber mass reaching the spinning stage must be kept as low as possible. To do so, it is important to ascertain how neps are formed and how they can be removed.
3.4.2.1 Nep Formation
Neps are usually formed during the mechanical opening and cleaning processes, including ginning in the case of cotton fibers. Along with remnants of dirt, husk and trash particles in the opened mass, neps should be removed by the card. However, depending on fiber properties and carding conditions (i.e., machine settings and operating speeds), neps can be formed during carding, thereby reducing the amount that is removed. In worsted and woolen systems, the number of mechanical opening and cleaning points is much lower than in short-staple processing, which, in appro-priate carding conditions, can increase the nep propensity.
Figure 3.23 shows the typical nep propensity profile for cotton processing from bale to spun yarn. L neps show a slight increase, and K neps a marked increase, during opening and mechanical cleaning, and both types decrease significantly in carding. T neps decrease at each process stage but particularly in carding. However,
2200
1900
1500
1100
700
0 8 16 24 32Card Web Neps/100 cm2
Yar
n N
eps/
1000
m
r = 0.944
FIGURE 3.22 Relation between neps propensity in cotton yarn and card web. (Courtesy ofPerkins, H. H. and Bargeron, J. D., Nep forming on a cotton card — Honeydrew —Additivesas a means to reduce air-borne dust, Melliand Textileberichte, 2, 1981, 129–131.)
© 2003 by CRC Press LLC

H shows no major change. It should be noted that the propensity profile refers to the number of particles per gram, not particle size. Generally, the revolving flat card has a cleaning efficiency of 90% or more, and this includes the extraction of the various nep classes. For example, if 1% of the mass of the material entering the card is H neps, then only 0.1% should be present in the sliver. The measured particle count, however, shows little difference between input and output values, and this suggests that, if only 0.1% by weight is present in the sliver, the particle sizes must be much smaller. It was found that the average nep size decreases from one process stage to the next, small neps increasing significantly at the carding stage.17–19 Similar findings have been reported for worsted processing.9 In effect, what is happening is that, during opening, cleaning, and carding, the closer settings used for reducing tuft sizes enable large neps to be subdivided into successively smaller sizes, thereby increasing the number of small neps. The large neps in the early process stages are a mixture of fiber entanglements with the presence of large particles of VM, trash, or seed coat. Some of the smaller neps in the later process stages contain small particles, but the majority are entirely of fibrous material. The card will remove some neps at the taker-in and via the flat strips; others are subdivided by the cylinder-flats carding action, some of these being fully separated into individual fibers. However, new neps can also be formed during carding. The objective, of course, is to optimize the carding conditions so that the formation of new neps is minimized and the subdivision and disentanglement of incoming neps is maximized to result in significant total nep reduction.
There are two possible ways by which fibers can be formed into a nep. One is when a fiber or a small group of fibers is loosely caught between two surfaces moving in opposite directions (e.g., the surfaces of two cylinders both rotating clockwise or counterclockwise) or between one stationary and one moving surface.
160
140
120
100
80
60
40
20
01 3 4 5 6
Process Stages
Part
icle
s Pe
r G
ram
Type of Nep
L
H
K
T
1. Bale 2. Blowroom 3. Card Sliver4. Comb Sliver 5. Yarn
FIGURE 3.23 Typical nep propensity for cotton fibers at process stages. (Courtesy ofLiefield, F., The importance of card sliver quality for the running behaviour and yarn qualityin unconventional spinning methods, Int. Text. Bull., Yarn Forming, 4, 1988.)
© 2003 by CRC Press LLC

The frictional contact with the two surfaces will cause the fiber length(s) to buckle and roll up into an entangled knot. To avoid this mechanism of nep formation, the setting or clearance between components must ensure that the motion of fibers is controlled so that they are not free to roll.
The second mechanism of nep formation is associated with fiber breakage. During processing, fibers are stretched and thereby get elastic energy. If the fiber is broken, the tension is suddenly released, and ends of broken lengths will recoil. In so doing, the lengths will buckle and may become entangled on themselves or around neighboring fibers. It is likely that the shorter lengths of the broken fibers entangle on themselves to form a nep. The entangled mass may disentangle or tighten into a nep with further mechanical actions. To avoid this kind of nep formation, machine component speed needs to be optimized to minimize fiber breakage.
It should be appreciated that the above mechanism can occur with all types of beater actions, not only carding. However, fundamental to nep formation, and also removal, is the degree of fiber entanglement in the mass to be separated into tufts, and, in the resulting tufts, mini- and microtuftlets. Townend9 found that the most important cause of nep formation in worsted carding of wool was the entangled nature of the scoured wool fed to the card. We can see, then, that the problem of nep formation is attributable to the fiber properties important to nep-forming poten-tial, and to the processing machinery conditions used in converting baled fiber mass into continuous strand.
3.4.2.2 The Effect of Fiber Properties
The fiber properties likely to affect the degree of fiber entanglement in a tuft, and therefore, nep formation, are
1. fineness (diameter and length, i.e., aspect ratio)2. crimp level3. impurity content of the baled mass (not strictly a fiber property but
dependent on grade)
Townend23 reports that, for a fixed diameter, longer fibers have a greater tendency to form neps in worsted carding. This is because longer fibers have a greater probability of being broken, the recoil of the shorter length causing it to become entangled into a nep. By analyzing neps, Alon and Alexander21 found that, in carding 50-mm 3.3-dtex acrylic fibers, 28% of the fibers forming neps were short, broken fibers, whereas, in the associated card sliver, only 7% of fibers could be classified as short fibers, and only 2% in the bale raw stock. Based on Alon and Alexander’s observation, we may assume that around 72% of the fibers forming neps were either the longer lengths of the broken fibers or entanglement of these with unbroken fibers. They report that the number of fibers found to constitute a nep varied from 5 in a small nep to 24 in a large one. Neps were identified as having a dense center where one or more fibers were located that initiated the nep formation. These fibers were looped or had very complex knot configurations and could be short broken lengths or longer fibers.
© 2003 by CRC Press LLC

Although the above discussion is about fiber length, we must remember that an important factor in nep formation is the buckling of the fibers, either by the effect of rolling or by the sudden release of tensile stress. Therefore, in addition to length, other important fiber characteristics are elastic modulus and fiber fineness. Alon and Alexander found that the propensity for fibers to form neps is related to a buckling coefficient,
(3.8)
(3.9)
where σ = fiber stressL = fiber length (2.5% fibrograph span length)Λ = fiber stiffness or rigidityE = elastic modulusI = fiber cross section moment of inertiad = fiber diameter
For a range of cottons, a definite linearity was found between measured neps per gram in the cotton slivers and the buckling coefficients of the cottons.21 Clearly, stiffer fibers should have a lower nep propensity. Thus, the parameters within the buckling coefficient that combine to have the greatest effect on nep formation are fiber diameter and elastic modulus. Fiber diameter also controls the number of fibers entangled in a given tuft size, i.e., mass. We learned in Chapter 1 that, within a cotton variety, fineness and maturity are represented by micronaire; the higher the micronaire, the coarser and more mature the fiber and the greater its rigidity. Figure 3.24 shows that, as the micronaire of cottons increases, the nep level of a card web decreases.15,16
Immature cotton fibers have low micronaire values, and Gulati and Ahmed26 and Pryor and Elting27 observed that neppiness was significantly correlated with the number of immature fibers in a cotton mass. Evenson28 considers the variation in fineness and maturity within a given grade to be of equal importance. Blending with higher micronaire cottons can therefore reduce nep levels. Table 3.5 shows a similar trend for wool and mmf with respect to fineness.23
Table 3.6 indicates that nep levels increase with the degree of fiber crimp. The higher the crimp level, the greater will be the entanglement within fiber tufts and the more severe the shear action required to individualize fibers causing fiber break-age and associated neps.
Aside from the properties that define the buckling coefficient, it should be evident that the frictional characteristics would have strong influence on the disentanglement of neps in carding. Therefore, surface finish and applied lubrication to the fiber stock are of importance. Townend23 also found a correlation between moisture content of the opened wool fed to the card and the neps per gram of sliver. Although not strictly a fiber characteristic, the type of particulate impurity in the baled fiber mass can
σL2/Λ
Λ EI=
I πd2
64--------=
© 2003 by CRC Press LLC

influence the nep level. Particles that are difficult to remove from tufts may require very intensive beater action and therefore cause high level nep to be generated during the mechanical opening and cleaning stages. This can lead to greater sliver neppiness.
3.4.2.3 Effect of Machine Parameters
The production rate employed in carding has a negative effect on nep removal, particularly when processing fine dtex man-made, low-micronaire cottons and low-
TABLE 3.5Effect of Fiber Fineness on Nep Levels in Card Sliver
Fiber type Mean fiber diameter (µ) Neps/g of card sliver
Australian 64s–70s 20–22 1,466Australian 58s–64s 22–26 1,135New Zealand 58s 26 640New Zealand 56s 28 410Mew Zealand 50s 31 277New Zealand 46s 34 204Nylon 3.3 dtex 57mm 19 474Nylon 5.0 dtex 57mm 23.5 381Nylon 8.8 dtex 57mm 33 100Nylon 16.5 dtex 46 16
Courtesy of Townend, P. P., Nep Formation in Carding, WIRA, Leeds, U.K., l983.
20
18
16
14
12
10
8
6
4
2.8 3.0 3.2 3.4 3.6 3.8 4.0 4.2 4.4 4.6
Micronaire Reading
Nep
s/64
5 sq
. cm
of
Car
d W
eb
Cotton A
Cotton B
FIGURE 3.24 Effect of cotton micronaire on card web nep levels. (Courtesy of Perkins,H. H. and Bargeron, J. D., Nep forming on a cotton card — Honeydrew — Additives as ameans to reduce air-borne dust, Melliand Textileberichte, 2, 1981, 129–131.)
© 2003 by CRC Press LLC

micron wools. It is likely that, with increased production speed, the higher cylinder loading results in a lower subdivision of neps entering the card and in increased fiber breakage, thereby forming new neps. However, Harrison and Bargeron16 found that the tandem carding of cottons was more effective in nep removal than single-cylinder high-production cards. Kaufmann29 reports that, with a revolving-flats card, taker-in speeds below 700 rpm have little influence on nep count at the card, but, above this value, the nep count in the card web increases significantly with speed. Harrison and Bargeron16 found that this increase with speed was applicable only to low-micronaire or immature cottons; generally, for coarser cottons, taker-in speed has no meaningful effect.
The settings and surface speeds associated with the flats-cylinder-doffer actions on short-staple cards, and likewise those for the worker-swift-fancy-doffer on roller and clear cards, have a significant effect on the nep level of the card web — so, too, the wire specifications for these components. Table 3.7 summarizes the reported findings with regard to these parameters.
TABLE 3.6Effect of Fiber Crimp on Nep Levels in Card Sliver
Fiber type Crimps/cm Neps/g of card sliver
Nylon 3.3 dtex 57mm 4.3 220
Nylon 3.3 dtex 57mm 6.3 294
Nylon 3.3 dtex 57 mm 7.9 361
Acrylic 5.0 dtex 57mm 2.0 6
Acrylic 5.0 dtex 57mm 5.5 78
Acrylic 5.0 dtex 57mm 9.5 205
Courtesy of Townend, P. P., Nep Formation in Carding, WIRA, Leeds, U.K., l983.
TABLE 3.7Effect of Machine Settings and Component Speeds on Card Web Nep Levels
Component Parameter Nep/g
Worker/cylinder/dofferFlats/cylinder/doffer
• Sharpness of tooth: increased land area of tooth• Surface speed: increasing
–ve+ve
Swift/dofferCylinder/doffer
• Working angle of tooth: greater for cylinder and swift +ve
Worker/cylinder/dofferFlats/cylinder/doffer
• Setting between components: close setting +ve
Fancy/swift • Setting: close setting• Speed: increased speed
+ve+ve
+ve = improvement in web quality; –ve = deterioration in web quality.
© 2003 by CRC Press LLC

Clearly, subject to the avoidance of fiber breakage, close settings and increased speeds reduce nep levels. This is because both parameters influence the shearing action of microtuftlets and neps entering the carding zone and any fiber agglomerates entering the cylinder-doffer zone. Townend23 reports that improved performance with respect to nep removal is obtained with closer settings of the worker to the swift. Kaufman29 claims that the cylinder-doffer transfer point is an important carding as well as stripping point, and that the intensification of the carding action here will produce a cleaner, less neppy web. A reduction in doffer surface speed increases the carding action and was found to reduce the nep level. The reason why this finding conflicts with the trend given in Table 3.7 is likely to be that increased doffer speed (at a fixed production rate) gives a lighter web, thereby dispersing neps over an effectively wider doffer surface area, which enables better contact between neps and wire points and thereby intensifies the carding action in the cylinder-doffer zone.
With regard to wire specifications, Table 3.7 indicates that the smaller the land area of tooth (i.e., the sharper the wire points), the lower the nep level, since the wire points can better penetrate neps to separate the fibers. It is also evident that reduced neppiness occurs when the working angle of the doffer is smaller than the swift or cylinder. The smaller doffer-wire angle gives a better transfer coefficient (see Chapter 4) and therefore less fiber in the recycling layer on the cylinder, resulting in a reduced cylinder load and a reduced chance of fiber breakage.
Ashdown and Townend30 have shown that the point density of a card clothing is an important factor in reducing the nep level of the card web. The point density of a card wire clothing depends on the tooth pitch and the spacing between rows of teeth, and the wider the spacing, the greater the chance for neps to become lodged between rows of teeth and escape the carding action. However, as the point density increases, the possibility of fiber breakage increases. Consequently, an optimal specification has to be reached, depending on production rate and fiber type.
Husk and trash neps are not usefully affected by the shear action during carding. However, the combination of knife-edge and applied suction at the fixed flats may remove some of these neps, and others may be caught in the flat strips. The crush rolls are also used to dislodge particles from their attachment to fibers to be subse-quently removed in downstream processes.
Although cotton stickiness in carding, i.e., honeydew, is not a nep-forming characteristic, it is a recurring problem that can have a disrupting effect on production and a degrading one on quality. Cottons contaminated with honeydew are difficult to card because of severe sticking and buildup of fiber on working components. This is particularly evident on the crush rolls, where the result is frequent breakage of the card web. Stickiness is largely associated with freshly cropped cotton and can become less problematic when the cotton is stored for three to six months.31 The cotton may then be processed by blending them with uncontaminated fiber, but a suitable blend proportion has to be determined by trial and error. Perkins and Bargeron20 found that sticky cottons can be processed with little difficulty by a tandem card, but that the stickiness problem resurfaces in the downstream stages. However, when a dust-control additive or overspray31 was applied to the stored cotton, this generally alleviated the stickiness in carding and downstream processing.
© 2003 by CRC Press LLC

The additive on the cotton continuously coats the surfaces of the working compo-nents with a thin film of lubricant to prevent the honeydew from gaining a purchase on the surfaces.
3.4.2.4 Short Fiber Content
What is meant by the short fiber content (SFC) of a fiber mass was explained in Chapter 1. In the production of short-staple, worsted, and semi-worsted yarns, SFC can present difficulties in processes downstream of carding and, as a result, lower yarn quality. It is important that, during the carding operation, fiber breakage be kept to a minimum. With woolen spinning SFC is much less of a problem, since the slubbings produced at the woolen card are subjected to only a small draft in the subsequent spinning stage, and the method of drafting is effective for nearly all fiber lengths.
We learned above that nep formation is closely linked to fiber breakage. It is not too surprising to find that, for cotton fibers, the typical SFC profile for the process stages from bale to yarn is very similar to the typical nep propensity profile. Figure 3.25 shows the changes in SFC associated with the various stages of material preparation.
Cotton bolls have very few short fibers. A significant amount of fiber breaking occurs in the harvesting and ginning of cottons, which results in the baled fiber mass having an SFC of around 10%. As is the case with nep propensity, the mechanical opening and cleaning in the blowroom increases the %SFC, but the level is reduced in carding, since most of the flat-strip waste is composed of short fibers.
In worsted processing, the lower number of mechanical opening and cleaning steps means that, similar to neps, the SFC of the card sliver is mainly dependent on the carding conditions. Hence, the factors enabling low nep levels in the card sliver
24
22
20
18
16
14
12
21 3 4 5
Process Stages
1. Bale2. Blowroom3. Card Sliver4. Combed Sliver5. Roving
Shor
t Fib
er C
onte
nt (
%)
FIGURE 3.25 Changes in SFC during material preparatory. (Courtesy of WIRA.)
© 2003 by CRC Press LLC

will also keep SFC to a minimum. Fiber-card wire friction experiments32 have shown that the lubricant viscosity is a key factor in reducing fiber breakage in worsted carding. The optimal viscosity was found to be 20 centipose, and the optimal add-on around 0.5% by weight. Appendix 2A discusses the application of lubricant to scoured wool.
3.4.3 SLIVER AND SLUBBING REGULARITY
The variation of the thickness of a yarn along its length and the measured yarn count, as we shall see in Chapter 6, are very important yarn characteristics to the quality of woven and knitted fabrics, and the variation of the sliver thickness is a contributing factor. The terms used in referring to thickness variations along the length of linear fibrous assemblies are levelness, evenness, regularity, unevenness,and irregularity. The latter will be used in this and subsequent chapters, since it conjures up the appropriate mental image of a linear assembly of fibers in which the number of fibers in the cross section is not uniform along its length.
The Basic Concepts of Irregularity
In considering the basics concepts of irregularity, what will be explained is applicable not only to card slivers but also to all linear fibrous assembles of subsequent processes, i.e., drawn and combed slivers, rovings and yarns. It is, therefore, appro-priate to use the general term linear fibrous assembly (LFA) during the following descriptions.
The variation in thickness along the length of an LFA is related to the variation of the number of fibers in the cross section throughout that length. Therefore, the variation in mass per unit length can be taken as a measure of the irregularity of the LFA. There are several ways by which the variation in mass per unit length can be determined, but the most widely used instrument for doing so is the Zellweger Uster irregularity tester.5 This is based on a capacitance method in which a sample length of the material is made to run between a parallel-plate capacitor approximately 1 to 2 cm long, depending on the type of LFA; a 2-cm capacitor would be used for slivers and a 1-cm for yarns. The changes in capacitance reflect the mass variations between successive 1- or 2-cm lengths along the sample length, and if plotted on a chart would look similar to Figure 3.26a. This shows the irregularity of a card sliver, caused by cardfeed variation, as a random waveform in which the peak values, or amplitudes, are the actual measurements. The coefficient of variation of the mea-surements, the CV%, may then be stated as the irregularity value for the sampled length of the LFA. This measure of mass variation with respect to 1 or 2 cm length is commonly called the Uster irregularity or Uster CV%.*
It is generally accepted that the most uniform arrangement of fibers that can be obtained with current process machinery is one in which fibers are randomly dis-tributed. A number of researchers have developed mathematical models for such an ideal LFA.33–35 Martindale36 has shown that, theoretically, the CV% for such an arrangement can be calculated from
* In many of the older references cited, U% values are given, representing the Uster values. The U% is the percentage mean deviation (PMD). CV% = 1.25U%.
© 2003 by CRC Press LLC

5050
4040
3030
2020
1515
1010
99
(b)
(a)
chiler, P. and H. Muller,G, 435.)
© 2003 by C
RC
Press LL
C
Count
88
77
66
55
44
33
22
1.51.580706050403020151098765432.5
tyd29*25*22*18*14*11*7*5*3*3*0.3* 0.5* 0.7* 0.9* 11* 11* 11*ten1cm 1.5 2
λ/2 λλ/4 λ/3
0%
10
20
30
40
50
50
40
30
20
10
+
100
80
80
60
60
40
40
20
20
0%
+100 25%+
25%−
20
15
10
20
15
10
5
5
0%
Cardfeed Variation
Cardfeed Variation
FIGURE 3.26 Irregularity trace and spectrograph of LFA. (Courtesy of Hattens Introduction to the Art of Quality Control in Yarn Manufacturing, Zellweger Uster A

(3.10)
where CVmin% = theoretical minimum coefficient of variation of the LFACVf % = coefficient of variation of the fiber linear density
n = average number of fibers in a cross section of the LFA
(See Appendix 3C.)By measuring the actual irregularity CVact% and calculating CVmin%, the follow-
ing ratio can be used as an index of irregularity, I:
(3.11)
Thus, the greater the value of I above unity, the more irregular the LFA will be. The index of irregularity, however, is a useful indicator of quality only if no machine faults or processing errors occur to add significantly to the measured CV%.
Because of such faults, there may be recurring particular values of amplitude within the random waveform. These values denote periodic faults, and the distance between a particular reoccurring amplitude within the random waveform gives a measure of the periodic wavelength related to the fault.
As we shall see later, steps can be taken in post-carding processes to reduce a high CV% of a card sliver. Little, however, can be done with periodic faults. Therefore, periodic faults of sizeable amplitudes are detrimental to yarn quality and are very likely to result in seconds-quality fabrics. Since periodic faults can occur at any process stage, it is essential to identify the process at which they occurred so that the problem can be rectified. A graph of the periodic amplitudes plotted against their wavelength is used to highlight significant periodic faults. This wavelength spectrum is called a spectrograph or spectrogram, and Figure 3.26b shows an example of the spectrogram relating to the irregularity chart, Figure 3.26a, for the card sliver.
The chart shows several periodic amplitudes among the random waveform, and the spectrogram depicts the associated amplitudes along the ordinate and the wave-lengths along the abscissa. The pronounced amplitudes are the significant periodic faults. Periodic faults may be classified according to their wavelength using the fiber length as a unit length.37
• 1 to 10 times the fiber length: short-term variation• 10 to 100 times the fiber length: medium-term variation• 100 to 1000 times the fiber length: long-term variation
The classification is important, since it can be used to trace the source of a periodic fault. The reader wishing detailed information on the tracing of periodic faults should consult References 38 through 42.
CV min%( )2 CV f %( )2 104+n
-------------------------------------=
ICV act%CV min%--------------------=
© 2003 by CRC Press LLC

From the chart in Figure 3.26a, it can be seen that the center line drawn through the random waveform also varies. This indicates an inconsistency in the sliver count and is attributable to variation in the feed to the card.
If a sufficiently long sample of an LFA were to be tested by the capacitor method, the measured values obtained could be divided into groups having an equal number of measurements. The sum total of each group would vary, and the product of the number of measurements and the capacitor length would give the set length on which the variation would be based. Hence, the CV% of the linear density for this set length could be calculated. Clearly, the CV% values for a range of set lengths could be determined in this way, the Uster CV% being one. The Zellweger Uster irregularity tester may be used to perform this task electronically and to plot a graph of CV% values against set lengths. The resulting graph is called a variance-length curve and is illustrated in Figure 3.27, plotted on logarithmic scales. It should be evident that, as the set length increases, the average total number of fibers constituting the length also increases. Consequently, the CV% of the fluctuations in the mass per unit length should decrease with increased set length. If the trend deviates from a straight line as shown, it signals unacceptable variations in the mass flow of the material during production. The source of the problem can be determined in a similar manner to the periodic faults described above. Variance-length curves are mainly used for yarns. With slivers and slubbings, the following alternative approach is considered more practical.
The irregularity of a sliver is determined for three types of variability: short-, medium-, and long-term changes.
Short-Term Irregularity
The Uster CV% of a sliver is a measure of the irregularity of short reference lengths along the sliver, but it is not a useful predictive indicator for the Uster CV% of the
GoodLFA
PoorLFA
Cut Length cm100001001
30
4
.5
CV
(L)%
FIGURE 3.27 Variance-length curves of LFAs. (Courtesy of Saville, B. P., Physical Testingof Textiles, The Textile Institute, Manchester, UK, Woodhead Publishing Ltd., Cambridge,UK, and CRC Press, Boca Raton, FL, 1999.)
© 2003 by CRC Press LLC

yarn.43 This is because the short-term irregularity for a yarn is more dependent on the short-term variations introduced during post-carding processes in which there is attenuation of the sliver count to obtain the yarn count. However, the yarn resulting from the further processing of a sliver is usually checked for count consistency by using100-m yarn lengths, and these would have originated from much shorter lengths of the sliver. Thus, the sliver Uster CV% is important to the measured count variation within, say, a given yarn package.
During carding, with each cylinder rotation, the doffer removes only a fraction of the fiber mass on the cylinder, and the recycled fraction gives a blending and evening effect to the mass flow while the card is running. This is of particular importance to roller-clearer cards, as is explained in Chapter 4. The effects of the evening action are reflected in the Uster CV% of the sliver.
In woolen spinning, the card web is not consolidated into a single sliver but split into a series of ribbons, and each is consolidated to make a slubbing. The slubbings are subsequently given only a small attenuation during conversion to a woolen yarn. Thus, the Uster CV% of the slubbing has importance to both the yarn Uster CV% and the measured count variation within a yarn package.
Medium- and Long-Term Irregularity.
Figure 3.28 illustrates the medium- to longer-term variability of a sliver; that is to say, the irregularity of a sliver length that comprises a full can of sliver and the variation between cans of sliver. The Uster CV% is not a measure of this variability. The CV% of sliver count measurements, made at random intervals during carding, is therefore an appropriate indicator of such variations. The importance of moni-toring and controlling medium and long-term variability can be seen from Figure 3.29.
SliverWeight
Short-Term Medium-Term
Desired Mean Level
Long-Term ‘Drift’
Zone B
Time
Zone A
Cans 1 2 3 4 5 6 7 8 Cans 1 2 3 4 5 6 7 8
FIGURE 3.28 CV% of Sliver count: short-, medium-, and long-term irregularities. (Cour-tesy of Crosrol UK Ltd.)
© 2003 by CRC Press LLC

Where there are several drawing process steps following carding; the short- and medium-term irregularities can be significantly reduced during these processes. However, these processes cannot readily correct for the long-term drift of the sliver count. The problem is particularly important for short-staple processing where a multiple of cards are needed to match the blowroom production. Long-term drift associated with each card can result in unacceptable sliver count variations. Thus, at any given moment during production, the mean sliver counts of each card may give, statistically, a widespread distribution for the carding process (see Figure 3.29). To overcome this difficulty, autolevelers are usually fitted to the cards.
In woolen carding, variation in the mass per unit area of the card web across the width of the woolen card will cause the produced slubbings to have significantly different counts as well as different Uster CV% values. One of the purposes of the intermediate feed section between the scribbler and the carder is to keep this variation to a minimum. However, long-term drift of the output from the scribbler may occur and cause a statistically wide spread distribution of the slubbing count that is unacceptable. Autoleveling is therefore also of importance in woolen carding.
3.5 AUTOLEVELING
The principles of autoleveling are based on the fundamentals of control theory, which is beyond the scope of this book. However, the reader wishing to study the theoretical aspects of autoleveling should find Reference 44 informative.
Essentially, the basis of an autoleveling system is to control the consistency of output from a process by deliberately altering the input so that a measured value of a parameter characterizing the output has minimum deviation from a preset value. Alternatively, a measured value characterizing the input may be monitored and, when deviating from a preset value, the input is deliberately changed with the
Card 1
Card 2
Card 3
Card 4
Card 5
Card 6
Card 7
FIGURE 3.29 Count variations within and between cards. (Courtesy of Crosrol UK Ltd.)
© 2003 by CRC Press LLC

intention of maintain minimum variation of the output. The first approach is referred to as closed-loop autoleveling, and the second as open-loop autoleveling. Figure 3.30 depicts the main features of these two types of control system. S and A represent the locations of the sensors and actuators, the dotted lines show the signal path, and the solid lines illustrated the material flow.
The open-loop system results in a quicker response time to the deliberate changes, since the lag time of the process is avoided. However, there is no feedback from the output to ensure that corrections made achieve minimum variation of the output characteristics. Most autoleveling systems on cards employ the closed-loop principle. The idea is for the sensor to monitor the sliver irregularity and the control unit to interpret the electronic data in terms of variations in the sliver count from the preset count required. Then, according to the size of any unacceptable differences and whether they are greater or less than the preset value, the control unit automat-ically modifies the draft of the card by slowing or increasing the feed roller speed. The time elapsed between changing the feed roller speed and its effect detected in the output sliver is the response time of the carding process or the lag time resulting from the process. Carding has a slow response time, so, when closed-loop systems are used to adjust feed roller speed, only long-term sliver irregularity can be con-trolled, and the system is called a long-term autoleveler.
Various types of sensors may be used to monitor the sliver irregularity,45 but the tongue-and-groove device is probably the most popular and is considered to be very simple and reliable. This basically consists of a grooved bottom roller through which the sliver passes while under compression by a top roller that fits the groove. Variation in the sliver thickness causes the top roller to rise and fall, thereby monitoring the sliver irregularity. The movement of the top roller is converted into an electronic signal, which is fed to the control unit. Figure 3.31 illustrates the tongue-and-groove system and also shows the use of two pairs of rollers to provide a quicker response time for the control of short-term sliver irregularity, i.e., a short-term autoleveler.The two pairs of rollers are used to apply a small draft of up to 1.5 on the output sliver. These rollers precede the tongue-and-groove sensor. The very small move-ments of the top measuring roller are amplified by a low-friction lever arrangement that, in turn, moves a hydraulic valve to vary the rate and direction of oil flow to a piston. The piston mechanically operates a speed variator that increases or decreases the speed of the draft control rollers. The speed of the coiler rollers depositing the sliver into sliver cans is also varied to avoid uncontrolled changes to the sliver count.
ProcessMachine
ProcessMachine
ControlUnit
ControlUnit
Closed Loop Control Open Loop Control
A AS S
FIGURE 3.30 Closed-loop and open-loop control systems.
© 2003 by CRC Press LLC

In woolen carding, the web leaving the last doffer is monitored for unacceptable variations. The sensor is an optical device that measures the intensity of a beam of light passing through the web. Variations in the mass per unit area of the web are detected through changes in the intensity of the transmitted light and the data received electronically by a control unit. To avoid a very slow response time caused by the size of carding set, or even that of the carder section, the control unit is made to alter the doffer speed so as to minimize variations of the mass per unit area of the web from the preset value required. The system, however, is capable of control-ling only medium- and long-term variations in the carded web.
Open-loop systems, as indicated earlier, are fitted to the feed device to the card. The sensor either monitors thickness of the batt or mass per unit area. This is done
Correction Made Here
Sliver
Web
Draft ZoneInput
DraftingControlRollers
MeasuringRollersHydraulic
Control Valve
Piston
Speed Variator
FIGURE 3.31 Tongue-and-groove device fitted for short-term closed-loop autoleveling atthe card. (Courtesy of Crosrol UK Ltd.)
© 2003 by CRC Press LLC

prior to the measured portion of the batt being fed forward by the feed roller, and the necessary change to the feed roller speed is regulated to increase or reduce the feed rate. The thickness may be monitored, as illustrated in Figure 3.32, for a short-staple card. The pressure senor is fitted at the front of feed plate, where the plate and feed roller forms a wedge to progressively compress and nip the batt; changes in the batt thickness are readily detected.
An alternative thickness monitor, known as the Servolap system (developed by the manufacturer Houget Duesberg Bosson) and fitted to roller-clearer cards, uses gamma radiation to penetrate the fiber mass and a scintillation tube to detect the ray intensity transmitted through the mass. The measured changes are used to control a chute or volumetric hopper feed to the card, so the control system is in fact a closed-loop autoleveler for the hopper feeder rather than an open-loop system for the card.
Figure 3.33 illustrates the use of a weigh plate positioned between the lattice feed and the feed-rollers on the forepart section of the woolen card. As the fiber mass passes from the chute feed or hopper feed to the feed rollers, it crosses over the weigh plate. Deviations in mass per unit area from the preset required value are then corrected by automatically adjusting the speed of the feed rollers.
Most autolevelers will correct fluctuations in the monitored fiber mass of up to ±30 percent and minimized deviations to within ±1 to ±2%, based on the mass of 5-m lengths of sliver. Closed-loop, short-term autolevelers and open-loop systems, because of their faster response time, give good levels of control over short lengths.
3.6 BACKWASHING
Traditionally, after worsted carding the wool sliver may be given a wet-cleansing treatment called backwashing. This would be done to remove soiling, which may have occurred during carding.46 Since washing and drying of the sliver disturbs the fiber arrangements, the slivers have to be lubricated and gilled in preparation for
FIGURE 3.32 Open-loop autoleveler on short-staple card. (Courtesy of Rieter Ltd.)
© 2003 by CRC Press LLC

combing. Backwashing is not always practiced today because of the prohibitive cost and because improved lubricants applied at the blending stage reduce soiling during carding.
REFERENCES
1. Klien, W., A practical guide to opening and carding, Manual of Textile Technology, Short-Staple Spinning Series, Vol. 2, The Textile Institute, Manchester, UK, 1987.
2. Feil, R. W., Fibre separation and cleaning on cotton card, Melliand Textilberichte, Eng. ed., 1207–1213, September 1980.
3. Grimshaw, K., Benefits for cotton system from the use of fixed carding flats, Con-ference Proceedings: Tomorrow’s Yarns, 166–181, June 26–28, 1984.
4. Leifeld, F., Meeting the challenge of the future: The holistic approach, International Textile Bulletin, 4, 34–38, 1997.
5. Saville, B. P., Physical Testing of Textiles, Ch. 2, The Textile Institute, Manchester, UK, Woodhead Publishing Ltd., Cambridge, UK, and CRC Press, Boca Raton, FL, 26–43, 1999.
6. Textile Terms and Definitions, 10th ed., The Textile Institute, Manchester, UK.
The Microfeed System
A. Drive UnitB. Hopper Feed SheetC. Weighing Plate
A
B
C
D
F
E
D. Load CellsE. Feed RollersF. Display Panel
++
+
++
+
+
FIGURE 3.33 Use of weigh plate in open-loop autoleveler.
© 2003 by CRC Press LLC

7. Van Alphen, W. F., The card as dedusting machine, Melliand Textileberichte, Eng. ed. 12/80, 1523–1528, 1980.
8. Artzt, P. and Jehle, V., The high-production carding process — Challenge for the new millennium, Int. Text. Bull., 1, 37–43, 2000.
9. Townend, P. P. and Russell, K. P., Vegetable Matter in Wool Processing, Wool Sci. Rev., 56, 45, 1980.
10. Oxenham, W., and Wilson, I. B., Beater for VM Removal, Textile Industries, 142(2), 45, 1978.
11. Estenbanell, J. B., GB 2,043,725A, 1980. 12. Hampshaw, E., An Evaluation of Stationary Carding Plates on a Woollen Card, Leeds
University, UK (private communications).13. Frey, M., and Schleth, A. (Zellweger Uster AG), Examples of Data Acquisition for
Fibres and the Application in the Spinning Mill, Proc. 22nd International Cotton Conference, Bremen, Germany, March 2 –5, 1–30, 1994.
14. Muller, M., Precise measurement of important fibre properties in cotton, Int. Text. Bull., Yarn Forming, 3, 73–88, 1991.
15. Ganatra, S. R., Munshi, V. G., and Srinathan, B., Nepping potential of cotton blends, Indian Text. J., 1, 1–4, 1981.
16. Harrison, R. E., and Bargeron, J. D., Comparison of several nep determination methods, Text. Res. J., February, 77–79, 1986.
17. Backer, S., Itani, W., and Park, J., On the Mechanics of Nep Formation, part 2: Nep Formation in Mill Processes, Final Report, USDA Contract No. 12-14-100-5757 (72).
18. Backer, S., El-Shiekh, A., and Ozkal, K., On the Mechanics of Nep Formation, part 3: Stability of Neps Under Shear Stresses, Final Report, USDA Contract No. 12-14-100-5757 (72).
19. Liefield, F., The importance of card sliver quality for the running behaviour and yarn quality in unconventional spinning methods, Int. Text. Bull., Yarn Forming, 4, 1988.
20. Perkins, H. H. and Bargeron, J. D., Nep forming on a cotton card—Honeydew—Additives as a means to reduce air-borne dust, Melliand Textileberichte, 2, 129–131, 1981.
21. Alon, G. and Alexander, E., Mechanism of nep formation, Melliand Textilberichte (English ed.), October, 753–756/792–795, 1978.
22. The analysis of faults in yarns, Uster News Bull., 6, 1–7, August 1965.23. Townend, P. P., Major problems in processing of wool—Neps formation in worsted
carding, Textil Praxis (English ed.), 1, 1–2, March 1957.24. Schleth, A., Uster AFIS Nep Measurement on the Way to Standardization, ITMF
International Committee on Cotton Testing Methods, Meeting of Working Group on Dust/Trash, March, 1–11, 1994.
25. Frey, Manfred (Rieter Spinning Systems), Practical experience with new cotton mea-suring methods, Proc. 20th International Cotton Conference, Bremen, Germany, March 15–17, 1–16, 1990.
26. Gulati, A. N. and Ahmed, N., Fibre Maturity in Relation to Fibre and Yarn Charac-teristics in Indian Cottons, J. Text. Inst., 26, T261, 1935.
27. Pryor, L. D and Elting, J. P, Neptometer studies, use as a mill instrument, Text. Res. J., 28, 575–579, 1958.
28. Evenson, J. P., Botanical studies in cotton quality, The Empire Cotton Growing Rev., 32, 157–167, 1955.
29. Faufmann, D., Neps and Carding, Textil Praxis (English ed.), 4, 151–156, November 1957.
© 2003 by CRC Press LLC

30. Ashdown, T. W. G and Townend, P. P., The effect of the density of card clothing on the carding process, J. Text. Inst., 52, T171, 1961.
31. Wyatt, B. G. and Ethridge, M. D., Combining the use of overspray and blending for successful processing of very sticky cotton, Textile Topics, International Textile Centre, Texas Tech. University, 2–4, 1996.
32. Henshaw, D. E., The Role of a Lubricant and Its Viscosity in Worsted Carding, J. Text. Inst., 52(12), T537–T553, 1961.
33. Murauskaite, D. B., Comparative analysis of the plotting of correlograms by the classical and marked-rule methods, Techn. Text. Ind., U.S.S.R, 2, 18–24, 1964.
34. Picard, H. C., The irregularity of slivers, III, J. Text. Inst., 44(7), T307–T316, 1953.35. Privalov, S. F. and Truevtsev, N. L., The theory of ideal (random) sliver, Techn. Text.
Ind., 3, 52–60, 1964.36. Martindale, J. G., A new method of measuring the irregularity of yarns, J. Text. Inst.,
36, T35, 1945.37. Booth, J. E., Principles of Textile Testing, Temple Press Books Ltd., London, 1964.38. Futer, R. (Zellweger Uster AG), Manual of Textile Technology, Evenness Testing in
Yarn Production, part I, The Textile Institute, Manchester, UK, 1982.39. Futer, R. (Zellweger Uster AG), Manual of Textile Technology, Evenness Testing in
Yarn Production, part II, The Textile Institute, Manchester, UK, 1982.40. Dyson, E., Some observations on yarn irregularity, J. Text. Inst., 215–217, 1973.41. Felix, E., Analyzing the irregularity of yarns, rovings and slivers by means of the
wave length spectrum, The Text. Manuf., August, 415–421, 1955.42. The Uster System of Evenness Testing, Uster News Bulletin, 28, 1–27, July 1980.43. Crosrol Technical Bulletin, Ref. T 80/02.44. Catling, H. and Davis, I., Conversation of mean level in autolevelling, Shirley Institute
Memoirs, XXXIX, 27–47, 1966.45. Szaloki, S. Z., High-Speed Carding and Continuous Card Feeding, Vol. II, The
Institute of Textile Technology, Charlottesville, VA, 152–175, 1977. 46. Brearley, A. and Iredale, J.A., The Worsted Industry, WIRA/British Textile Technology
Group, Leeds, U.K., 1980.47. Brydon, A. G., Flexible Card Clothing, The Textile Institute, Manchester, UK, 1988.
RECOMMENDED READINGS ON THE MEASUREMENT OF YARN QUALITY PARAMETERS
Booth, J. E., Principles of Textile Testing, Temple Press Books Ltd., London, 1964. Saville, B. P., Physical Testing of Textiles, The Textile Institute, Manchester, UK; Woodhead
Publishing Ltd., Cambridge, UK; and CRC Press, Boca Raton, FL, 26–43, 1999.Goswami, B. C., Martindale, J. G., Scardino, F. L., Textile Yarns: Technology, Structure and
Applications, John Wiley & Sons, New York, 1977.
© 2003 by CRC Press LLC

APPENDIX 3A
Card Clothing
Two types of card clothing are used today: flexible or fillet wires, and saw-tooth wires (commonly called metallic wires). Historically, flexible clothing was the first to be fitted to all card components. Metallic wire became prominent in the early 1960s with the increase in production rates from 5 to 20.5 kg/hr of cotton cards. Fillet wires tend to require regular cleaning (termed stripping and fettling) to remove trapped waste fibers, whereas metallic wires dispense with this requirement. The use of metallic wire rapidly spread into worsted and semi-worsted carding as eco-nomics underlined its nonfettling advantages.
Fillet wire is still widely used in woolen carding because of its advantage over metallic wire in being able to process blends of very different fiber types, color mixtures, and oil and grease content, and because it provides a gentler action for weak fibers. However, metallic wires are used on the forepart of a woolen card set, where large tufts have to be opened, with the fillet clothing being fitted to the carder section where a high point density is required for more precise separation of fibers. The focus of this appendix will be on metallic wires. The subject of flexible card clothing is well covered in a monograph by Alan. G. Brydon.47
3A.1 METALLIC WIRES: SAW-TOOTH WIRE CLOTHING
Figure 3A.1 shows the key parameters of saw-tooth wire geometry that govern the performance of metallic wire clothing, fixed flats and revolving flats. Table 3A.1 gives the range of typical values for the parameters.
3A.1.1 TOOTH DEPTH
In Figure 3A.1, ←a→ is the working depth of the tooth. This determines the fiber-carrying capacity of a tooth. Taker-in wires are required to perform the initial task of breaking down and opening up the entangled fiber mass, and as such the tooth depth should be large. Cylinders, swifts, and stripper wires should have short working depths so as to prevent high fiber loading and to keep the fiber at the tip of the tooth to maximize the shear force of the carding action. Workers and doffers should have large working depths so as to hold the fiber mass for effective carding and fiber
© 2003 by CRC Press LLC

transfer during doffer web formation. Morel wires have shorter depths, since the aim is to keep VM particles above the web of fibers and in easy striking range of the burr beater.
Measurement ←b→ is the base depth of the tooth, which is usually free of the fiber mass but is important to the aerodynamic effects generated by the rotating components. Too shallow a depth can result in pressure points and fiber blowouts, producing a patchy web.
D3 → is the tooth depth of the revolving flats. Strictly, the revolving flat wires may be either flexible, semirigid (as illustrated in the diagram), or rigid (metallic saw-tooth). Currently, flexible and semirigid are most widely used, but much research
TABLE 3A.1Revolving Flat Cards and Roller Clear Cards
Component Θ m (mm) a (mm) ppsi
Revolving flat cardsTaker-in 78–90° 1.95–760 (a + b = 5 − 6.65 27–208Cylinder 50–80° 1.30–3.0 (a + b) = 2.0 − 2.65 240–1075Doffer 60° 1.80–2.20 (a + b) = 3.70 − 4.70 298–403
Roller clear cardsTaker-in 50° 5.30–8.60 1.34–2.74 19–78Swift 70–80° 1.80–3.20 1.46–1.85 224–398Doffer 50–55° 2.50–3.10 0.95–1.25 166–272Worker 50–60° 3.00–4.15 3.00–3.43 52–215Stripper 50–75° 4.10–4.25 1.23–3.00 62–105Morel 50° 3.80–5.50 1.60 73–212
Tooth Depth
Tooth Angles
Point Population
Point Dimension
a and b
Θ and Φm / in. and n/ in.
x and y
m x y
a
bΘ Φ
n
FIGURE 3A.1 Saw-tooth wire geometric parameters.
© 2003 by CRC Press LLC

and development is being invested in increased use of rigid wires. The clothing is flexible if it deforms under temporary bending stress and then resumes its original position. Basically, this is achieved by the base of the round wire lengths being held in a laminated foundation fabric, which has suitable elastic properties. Semirigid clothing is of a similar construction, but flat wire is used for increased rigidity, and base fabric is made of denser material. Since the vital function of the tops is to provide an effective holding of tuftlets during the carding action and to retain short fibers and impurities, the tooth depth must not be shallow.
3A.1.2 TOOTH ANGLES
Front angle, θ. This determines the fiber-holding power of the tooth. For roller-clear cards running without a fancy roller, the tooth angle of the swift clothing should be near upright, i.e., ranging from 70 to 80 °, with the use of a fancy roller a shallower angle may be used, 60 to 70°. The teeth of swift clothing are required hold and carry fibers through the carding zones but enable a controlled release of fibers to the doffer. The doffer and worker clothing require more acute angles than the swift, which, combined with tooth depth, give greater fiber-holding power.
With the short-staple card, a more acute angle (60 to 66°) is necessary for cottons, since the fibers are more entangled than for man-made fibers (70 to 75°). For carding a blend of cotton and man-made fibers, cotton wire specifications are mainly used. Similar to roller-clear cards, the angle of the doffer wire is critical to the control of the fiber transfer efficiency and therefore the sliver quality. With too low a transfer efficiency, the cylinder load will be high, causing the sliver to have a high nep count. Reducing the tooth angle of the doffer should assist in rectifying the problem. However, if the transfer efficiency is too high, the card web will appear patchy with very small groups of unseparated fibers, and therefore the doffer tooth angle should be increased.
Back angle, β. This assists the holding power of the clothing in that a large angle assists fibers to become embedded in the teeth. This is an advantage for the worker and doffer clothing but not for the cylinder, swift, and stripper clothing.
Flats carding angle, α. The working angle of the flats is within the range of 75 to 80°. Low angles will too strongly resist the cylinder wire removing fibers and can result in fiber breakage. Conversely, too large an angle prevents effective carding and also results in neps.
3A.1.3 POINT DENSITY
Essentially, point density or tooth density is an important contributing factor to the carding capacity or carding power, and the amount of carding power needed to separate fibers is defined by a combination of the fiber length and fineness within fiber mass to be processed. The carding power is the number of teeth present on the working surfaces for processing the fiber mass passing through the card. Thus, the number of teeth per fiber can be determined from the equation for the intensity of opening. Carding quality improves when the number of teeth per fiber is just less than one for both the taker-in and the cylinder (or swift of the carder section). However, too low a value may increase the short-fiber and nep levels.
© 2003 by CRC Press LLC

3A.1.4 TOOTH POINT DIMENSION
The x and y dimensions are important to point penetration into tufts. When xy = 0, the teeth has a needle point. This gives the best penetration and reduces nep levels but is most susceptible to damage and is important for the cylinder wires when carding fine fibers. With roller-clear cards, the tooth point dimensions should be finer on the carder section — particularly on the swift.
3A.2 FRONT AND REAR FIXED FLATS
The metallic wires used have a simpler geometry than the other wire clothing. To withstand the impact from large particle impurities, the rear fixed flat has a high front angle, θ, a low back angle, β, and a low population. The front fixed flats have a similar geometry so as not to hold fibers but to prepare fibers for doffing in a more controlled manner.
3A.3 WEAR OF CARD CLOTHING
Although heat treatment and wear-resistant coatings are used, the performance of card clothing degrades overtime because of tooth point wear. For example, in carding cotton, the cylinder and flats clothing usually must be repeatedly reground to sharpen the teeth after 200 to 1000 tonnes of throughput, depending on production rate and cotton grade. Even though grinding improves the performance of a worn clothing, the tooth point dimension would have increased, and therefore the effectiveness is less than when the clothing was new. With successive grinding treatment, clothing will reach a stage at which nep levels are considered unacceptable, and the clothing will then need to be replaced.
© 2003 by CRC Press LLC

APPENDIX 3B
Condenser Tapes and Rub Aprons
3B.1 TAPE THREADINGS
The examples below are for a four-apron layer.
3B.1.1 THE FIGURE 8 THREADING
In this configuration (see Figure 3B.1), each tape is threaded in a figure 8 and, from one end, placed around and along the dividing rollers. Tensioning rollers A, B, C, and D are then brought into contact with the tapes. Tensioning rollers F and G are then positioned so that odd-number tapes feed the odd-number aprons (i.e., aprons 1 and 3). Similarly, rollers E and F are positioned so that even-number tapes feed even-number aprons (i.e., aprons 2 and 4). The half twists in the belts ensure that the same belt surface is always in contact with the dividing rollers, thereby trans-porting the fiber ribbons to the rubbing aprons.
G
H
A
F
D
EB
G
F
D
E
A
B
C
Aprons3
Aprons4
Aprons2
Aprons1
C
H
FIGURE 3B.1 Threading by Figure 8. This uses one tape to provide two slubbings.
© 2003 by CRC Press LLC

3B.1.2 SERIES THREADING
Series threading (Figure 3B.2) uses one tape to provide one slubbing. For a one-to-one arrangement the card web must pass between the entry rollers so that odd-number tapes are above it and even-numbers are below or visa-versa The scissors action of the tapes divides the web and ribbons are transported to the relevant rubbing aprons. Again a half-twist is put in the tape but on the return path.
3B.1.3 ENDLESS THREADING
Here, an endless tape is made to follow the two paths shown in Figure 3B.3 alternately across the card width, thereby providing the network for feeding the rubbing aprons.
3B.2 RUBBING APRONS
Figure 3B.3 shows diagrammatically the main features of one of a pair of rubbing aprons. The endless leather (or plastic-covered) apron is mounted on three rollers.
EntryRollers
DividingRollers
FIGURE 3B.2 Series threading.
© 2003 by CRC Press LLC

The whole assembly stretches the width of the card. A gear wear fitted to the shaft of one of the rollers is free to slide in a driver gear wheel (not shown). This allows the reciprocating action of the aprons to proceed without hindering the rotation of the driven shaft and thereby the circulating movement of the apron. A driven shaft with a double eccentric gives the rubbing aprons their reciprocating action. Thus, the reciprocating action consolidates the fiber ribbon while the circulating movement simultaneously feeds the formed slubbing to the package build device. The number of rubs per minute may be 200 to 600. A higher rate is needed to make finer slubbings than that required for coarse ones, and the use of two banks of rubbing aprons in tandem improves slubbing consolidation.
DrivenGearWheel
Rubber
Bearing
Strap
DrivenShaft
DoubleEccentric
Working Width of Card
FIGURE 3B.3 Rubbing aprons.
© 2003 by CRC Press LLC

APPENDIX 3C
Minimum Irregularity and Index of Irregularity
The theoretical minimum irregularity of a sliver can be derived as follows. In a sliver where fibers are randomly arranged, let the average number of fibers per cross section be n. Thus, the standard deviation of the variation is
σn =
The relative coefficient of variation or the minimum sliver irregularity resulting from variations in the number of fibers in the cross section is
This equation is applicable for any fiber length and length distribution, provided all the fibers are uniform along their length and are of the same fineness. It is therefore also the minimum CV% of the linear density. However, if the fiber linear density varies, this effect must be added to the effect of the variation of the number of fibers so as to obtain the minimum variation of the sliver linear density.
With wool, the fiber fineness is given by the measured diameter. If CVd is the coefficient of variation of the measured diameters, then
With other fibers, fineness is expressed by their linear densities, and therefore
where CVf = coefficient of variation of fineness
n
CV min%100σn
n--------------- 100
n---------= =
CV min% 100
n--------- 1 0.0004+ CV d
2( )=
CV min% 100
n--------- 1 0.0001 C+ V f
2( )=
© 2003 by CRC Press LLC

The above can be rewritten in the more general form,
where a = the fiber irregularity factor
By calculating CVmin% and measuring the actual irregularity CVact%, the follow-ing ratio can be used as an index of irregularity, I:
Thus, the greater is the value of I above unity, the more irregular the sliver or linear assembly.
CV min% 100a
n------------=
ICV act%CV min%--------------------=
© 2003 by CRC Press LLC

Carding Theory
In Chapter 3, it was explained that one of the main functions of a card is todisentangle tufts of fibers into a web of individual fibers. In this respect, importantconsiderations are the process of fiber individualization, the formation of the dofferweb, the fiber extent and configuration, and the degree of fiber damage duringcarding. This is because, in processes subsequent to carding, fiber breakage and poorfiber configuration may lead to unacceptable yarn irregularity and imperfections. Asdescribed in Chapter 5, fiber individualization and fiber hooks have a major influencein combing and drafting processes and therefore, ultimately, on the yarn quality andspinning performance.
In this chapter, we consider in greater detail the way fibers are disentangled inthe revolving-flat and roller-top cards, along with the carding actions that lead tofiber hook formation, the blending of fibers, the leveling of variations in fiber mass,and fiber breakage.
4.1 OPENING OF FIBER MASS
4.1.1 T
AKER
-
IN
A
CTION
We learned in Chapters 2 and 3 that the fiber mass fed to the card (i.e., the batt) isan assembly of tufts and that the principal objective of the taker-in is to open upthese tufts. This means beginning the process of disentangling fibers by reducingthe tufts into smaller sizes, which we called
tuftlets
. The taker-in opens tufts effec-tively when one end of a tuft is momentarily held while the teeth of the taker-inpulls individual fibers and groups of fibers from the other end.
4.1.2 F
EED
-R
OLLER
, F
EED
-P
LATE
S
YSTEMS
Figure 4.1 illustrates the way tufts are opened by the taker-in on the short-staplecard. The batt is composed of various sizes of tufts. Therefore, when opening a fibermass of a typical short-staple fiber diagram, the leading ends of tufts (i.e., the battfringe) must be positioned in such a way that the trailing ends of fibers that aremuch shorter than the mean fiber length are nipped along with longer fibers duringthe opening action. The importance of the “feed roller and feed plate” combinationis that the surface of the feed plate tends to profile the roller, enabling the nipping
4
© 2003 by CRC Press LLC

of all fibers to take place close to the taker-in teeth. Figure 4.1 illustrates how thecompression forces on the batt, resulting from the feed roller loading, increase asthe batt approaches the taker-in. The front of the feed plate facing the taker-in hasa narrow horizontal plateau and then bevels steeply toward the taker-in, making awedge space in which the batt fringe comes into contact with the taker-in teeth. Thiswedge space enables the taker-in teeth to progressively penetrate the batt thickness.The top layer is first removed, bringing the remaining fibers nearer to the teeth. Inthis way, most tufts are effectively opened.
Fiber properties such as fineness, length, friction coefficient, and elastic char-acteristics will play an important role in opening of the fiber mass. However, for a
+
Feed Roller
Licker-InSurface
Fµ
Feed Plate
V
A
Opening Forceof Licker-InF
CompressionForce on Batt
10
11
BattThickness
FIGURE 4.1 Opening of tufts by feed-roller, feed-plate taker-in combination. (Courtesy ofArtz, P. and Schreiber, O., Melliand Textilberichte, 2, 107–115, 1973.)
© 2003 by CRC Press LLC

given fiber type, the process variables that have been studied in relation to tuftletsize produced during opening by the taker-in of a revolving-flat card are
1. Basis weight of the batt (i.e., g/m
2
) 2. Feed rate 3. Taker-in speed 4. Taker-in clothing (angle of tooth and point density) 5. Setting of feed-plate to taker-in 6. Ratio of cylinder and taker-in surface speeds7. Presence of rear fixed flats
Photographs taken of the fiber mass on a taker-in
2,3
during the carding of cottonfibers showed that around 40 to 50% of the mass comprised individual fibers, andthe remainder was tuftlets of various sizes. Figure 4.2 shows a typical distributionof weighed tuft sizes before the action of the taker-in and the distribution of weighedtuftlets resulting from the licker-in action on the batt fringe. As can be seen, the tuftsizes are reduced to tuftlets, of which the vast majority are less than 3 mg. The figurealso shows examples of the superficial size (i.e., surface area base on two-dimensionalphotographs) of the tuftlets. It is evident that the constituent fibers of some tuftletsappear less compact than in other tuftlets. The reason for this can be seen in Figure4.3, which shows a batt fringe from which fibers were removed by a taker-in.
The fibers indicate a combing type action by the taker-in. Individual fibers canbe seen projecting from the fringe; the projecting lengths at the bottom of the battare longer than those at the top.
3
Also at the fringe are tufts that lie at variousorientations to the direction of feed, i.e., the machine direction. They have dissimilargeometry, size, and density. Tufts that are not in line with the machine direction arelikely to be either split into tuftlets of a few milligrams or, if already tuftlet size, tobe removed unchanged rather than separated into individual fibers.
2,3
Nittsu et. al
2
studied the effect of the first five of the seven process variableslisted above. Five classes of tuftlet size (i.e., areas) were established through mea-surements taken from photographic images of tuftlets on the taker-in surface.Figure 4.4 depicts the changes in the number per taker-in revolution of each tuftletclass with changes in processing conditions. The total number of tuftlets decreaseswith closer feed plate settings, lower feed rates, smaller angles of saw-tooth clothing,and higher taker-in speed; the decrease is for all the tuftlet classes. Since the taker-in opens the batt into tuftlets and individual fibers, a decrease in the total numberof tuftlets suggests an increase in the mass of individual fibers.
In Chapter 3, we learned that the surface speed of the cylinder is around twicethat of the taker-in. When the fiber mass is transferred onto the cylinder by the
front-of-tooth
to
back-of-tooth action
, this speed difference tends to thin the fiber mass.That part of the mass comprising individual fibers is effectively attenuated by a draftof two, and so the number of tuftlets per unit area is reduced. The tuftlets, however,are not reduced in size — they become elongated.
2
Both the individual fibers andthe tuftlets become more aligned to the machine direction.
2,4
On making contactwith the stationary flats at the back of the card, the tuftlets are reduced in size, and
© 2003 by CRC Press LLC

this facilitates better fiber disentanglement and separation by the subsequent inter-action of the revolving flats and cylinder.
4.1.2.1 Feed-Roller Systems
Figure 4.5 illustrates an example of the saw-tooth clothed, single-pair feed rollerand the triple-merelle feed-roller systems used, respectively, on woolen and worsted
35
35
30
30
25
25
20
20
15
15
10
10
5
50
Batt Tuft Size
Tuftlet Size on Taker-In
Freq
uenc
y (%
)Pe
r kg
Sam
ple
Tuft and Tuflet Size
FIGURE 4.2 Distribution of tuft and tuftlet sizes.
© 2003 by CRC Press LLC

cards. With the merelle system, the first pair of rollers are clothed with saw-toothwire, and the second pair are fluted and run at three times the surface speed of thefirst pair. The third pair are pin-rollers and have a surface speed half that of thesecond pair. The single-pair arrangement subjects fibers to a sudden step increasein speed as they make contact with the taker-in, similar to the feed-roller, feed-platearrangement for short staples. However, with longer-staple fiber (in particular wool),the objective is to achieve a gentler, less aggressive opening and thereby lower thepotential for fiber breakage resulting from the entanglement of fibers in the tufts.Fiber breakage will be discussed in more detail later. Townend et al.
5
demonstratedthat by having a series of roller trains, each pair running faster than the precedingpair, scoured wool tufts that were oriented at various angles to the mass flow would,through the small draft applied, become less entangled, more elongated, and closelyoriented to the machine direction prior to their point of contact with the taker-in.As mentioned above, the more elongated a tuft is in the machine direction, the moreeasily it is to disentangle the constituent fibers. The increase in speed toward thetaker-in provides a gentler progressive opening by the taker-in.
4.2 CARDING ACTIONS
4.2.1 C
YLINDER
-F
LAT
A
CTION
The setting of the flats to cylinder leaves too small a gap for photographic observa-tions of the way tuftlets are separated into individual fibers. Therefore, the consensusview is based on interpretation over many years of experimental data. Essentially,the very narrow gap between the flats and cylinder clothing enables tuftlets on thecylinder to be easily caught by the flats. Prior to the carding zone, air is draggedalong by the rotating cylinder and, at the carding zone, the flow is suddenly restrictedby the narrow gap. As a result, the air movement lifts the tuftlets toward the flats,assisting them in being easily caught. As explained in Chapter 3, part of the fibrouswaste from the carding process includes flat strips. Bodgan
6
and Hodgson
7
found
FIGURE 4.3 Cotton batt fringe fed to taker-in.
© 2003 by CRC Press LLC

that, as flats move in the direction of the cylinder rotation, they tend to load quicklywith tuftlets as they reach the interface with the cylinder, acquiring two-thirds oftheir final load for each working cycle of the carding action with the cylinder.
Varga
8
suggests that what is commonly called the carding action, i.e., the
point-of-tooth
to
point-of-tooth
for disentangling and separating fibers, is actually a com-bination of two sub-actions, shearing and combing. The shear action occurs first,
50-100 mm2
25-50 mm2
12-25 mm2
< 6 mm2
180
160
140
120
100
80
60
40
20
6-12 mm2
00.4 0.6 0.8 1.0 1.2 1.4 1.6 1.8 2.0 2.2
Feed Plate/Taker-In Setting (microns)
No.
of
Tuf
lets
Per
Tak
er-I
n R
evol
utio
n
Batt Feed Rate (kgh−1)
250
200
150
100
50
04 5 6 7 8 9 10
No.
of
Tuf
lets
Per
Tak
er-I
n R
evol
utio
n
250
200
150
100
50
0
No.
of
Tuf
lets
Per
Tak
er-I
n R
evol
utio
n
200 300 400 500 600 700 800
Taker-In Speed (r/min−1) Wire Clothing Tooth Angle (degrees)
75 80 85 90 95 100
280260240220
200180160140
120100806040200
No.
of
Tuf
lets
Per
Tak
er-I
n R
evol
utio
n
KEY
FIGURE 4.4 Effect of process variables on the number of tuftlets per taker-in revolution.(Courtesy of Nittsu, Y., et al., Cleaning action in the licker-in part of a cotton card, part 1:Opening action in the licker-in part., J. Text. Mach. Soc. Japan, 10, 218–228, 1964.)
© 2003 by CRC Press LLC

whereby the upper layer of a tuftlet or a loosely opened fiber group is caught andheld by a flat, while the bottom layer is sheared away by the faster-moving cylindersurface. The bottom layer comprises a much smaller number of fibers than theoriginal tuftlet and can be termed a
minituftlet
. The top layer hangs from the flatand makes contact with subsequent teeth of the cylinder clothing as they pass by.This gives rise to combing, where the teeth hook single fibers or very small groupsof fibers (microtuftlets) and comb them from the top layer. Flats downstream of theinitially caught tuftlet catch the sheared-away bottom layer on the cylinder and anyother mini- or microtuftlet, and the shear and combing actions are repeated on these.In this way tuftlets and mini- and microtuftlets are separated, i.e., carded, intoindividual fibers.
Oxley
9
showed that a tuftlet is separated, as described, into individual fibersthrough the flat-cylinder interchange of fibers taking place over the four flats thatprecede the one on which the tuftlet was initially caught. It is reasonable to assumethat the number of flats over which a tuftlet is reduced to individual fibers willdepend on the tuftlet size, the mass flow rate, and the flat setting. For a fixed cylinderspeed, the larger the tuftlet, the higher the production rate; and the closer the flatsettings, the more flats will be involved in the separation of a tuftlet.
Sengupta and et al.
10
made measurements of the shear and combing forces andfound that, in general, the separation of tuftlets was confined to the first ten workingflats in the carding zone. Thus, fiber individualization of tuftlets does not occur overthe full carding zone. The full carding zone, however, aligns and parallelizes fibersin the machine direction. Generally, as Figure 4.6 shows, fibers are most alignedafter leaving the cylinder-flat zone, and their alignment decreases during transfer tothe doffer. The figure also shows that the relative alignments are affected by increasedtaker-in speed, flat speed, doffer speed, and calender draft.
4
+
+
++
+++
Clearer Brush
Upper PorcupineRollers
Wire ClothedRollers
Lower PorcupineFFR
Licker-In
Fluted Rollers
Licker-In
Feed RollerStripper
Top FeedRoller
Bottom FeedRoller
+
+
+
Merelle System Single-Pair Feed Rollers
FIGURE 4.5 Feed-roller systems on woolen and worsted card.
© 2003 by CRC Press LLC

How well the revolving-flats card disentangles and individualizes fibers is oftenreflected in the propensity of thick and thin places in a carded-ring spun yarn. It isimportant that microtuftlets do not get caught at the base of the cylinder teeth, inparticular between the teeth of the clothing (i.e., within the spiral pitch),
becausethey then miss contact with the flats clothing and subsequently form thick places inthe yarn. Artzt and et al.
11
studied the effect of cylinder and flat clothing parametersand cylinder speed on carded ring-spun yarn strength and imperfections. Onlychanges in the imperfections were statistically significant. Their results showed acomplex interaction between fiber fineness, cylinder speed, and cylinder and flatteeth densities. Their findings can be summarized as follows:
1. Thick places in the yarn are generally microtuftlets.
2. Propensity of thick and thin places decreases with increased tooth density.
3. Coarse fibers are easier to individualize and, therefore, lower tooth den-sities are effective.
4. High tooth densities and the lower cylinder speed are as effective as lowertooth densities and high cylinder speed.
4.2.2 S
WIFT
-W
ORKER
-S
TRIPPER
A
CTION
In Chapter 3, we saw that the swift-worker-stripper combination involves
point-oftooth
to
point-of-tooth action
between swift and worker, and
point-of-tooth
to
back-of-tooth
between swift and stripper. The two actions give almost a similar shearingand combing effect as that proposed by Varga, only here tufts or tuftlets are shearedbetween the worker and swift and combing between stripper and swift. Shearing isthe dominant action and contributes most to fiber disentanglement and individual-
Flat Speed (×10 cm/min−1)
Taker-In Speed (×100 r/min−1)
Doffer Speed (r/min−1)
Calendar Draft
Independent Variable
Deg
ree
of F
iber
Ori
enta
tion
0 5 10 15 20 25
0.92
0.90
0.88
0.86
0.84
0.82
0.80
0.78
0.76
0.74
0.72
0.70
0.68
N.B. Degree of Orientation = 1Means Fully Aligned in Machine Direction
FIGURE 4.6 Fiber orientation during carding.
© 2003 by CRC Press LLC

ization. Importantly, a worker can subject the fiber mass it retains to several shearcycles. The combing effect is small, because the surface speed ratio of stripper andswift is much lower than revolving flats and cylinder.
It was stated in Chapter 3 that the swift-worker-stripper action gives a blendingof the fiber mass and a leveling of irregularities in the mass on the swift. Tounderstand how effective the swift-worker-stripper combination is at individualizingthe fibers of a tuftlet, and at blending and leveling the fiber mass, we must considerthe fraction of the material retained by the worker as a result of the shearing action.In the literature, this fraction,
p
, is called the
collecting power
, as part of the fibermass on the swift is initially collected by the worker. Alternatively, it is called the
lifting power,
since the worker lifts part of the fiber mass from the swift during theshearing action, or the
retaining power
, because part of the fiber mass is retainedon the worker after the shearing action. The latter term seems more appropriate andis used throughout the following text.
It is important to know how the retaining power is affected by carding conditions,in particular the speed and setting of workers, and by fiber type. Martindale
12
published a simple formula for the retaining power of a worker. Referring to Figure4.7, and assuming steady state running conditions, let
Q
(g/min) = the uniform rate of the fiber mass on the swift passing point A andleaving point C
m
(g) = the fiber mass on the worker (i.e., worker load)
n
(rpm) = the speed of the worker
r
= the radius of the worker
f
= the fraction of the worker surface retaining the fiber mass
θ
= the angle subtended at the center of the worker by
f
Then,
f
=
θ
/360, and the fiber mass on the worker is retained for
θ
/360
n
minutes,i.e., the time the worker takes to rotate through the angle
θ
. During this time, the
+
D
C
B
A
CardingPoint
StrippingPoint
FIGURE 4.7 Swift-worker interaction.
© 2003 by CRC Press LLC

amount of fiber reaching B from A is
Q
θ
/360
n,
and the amount laid down at B bythe stripper is
m
. Therefore, the fiber mass reaching C is [
m
+ (
Q
θ
/360
n
)]. However,the amount of fiber collected by the worker at C is
m
. Hence, the retaining poweris given by
(4.1)
Thus,
P
is the ratio of the mass per unit time being removed by the worker fromthe swift and the mass per unit time being taken into the carding zone by the swift.Practically, by stripping the worker,
m
can be determined;
f
and
n
are measuredthrough observation, and
Q
can be obtained by either the Krylov
13
or the Kaufman
14
method. With a given fiber type and fixed carding conditions, experimental mea-surements have shown that P remains reasonably consistent for each worker-stripperpair around a swift.
Consider now the case for a blend of two fiber types. As an example, take a50/50 blend of fibers A and B. If initially considered separately and then as theblend, we can see from the above equation that
(4.2)
where PA, PB, and PC are the corresponding retaining powers, and mC = m#A + m#B.
A worker will retain m#A from the 50% of fiber A contributing to Q and, similarly,m#B from the 50% of fiber B. Thus, m#A = 1/2 mA, and m#B = 1/2 mB; hence,
(4.3)
This shows that a blend of different fibers does not affect the way the workers dealwith each fiber individually. Table 4.1 gives experimental and calculated p-valuesthat confirm this.
Figure 4.8 shows p-values for a four worker-stripper pair combination over thetop of the swift on a scribbler and on an intermediate. The effect of worker speedand setting is also illustrated. It is evident that the retaining powers of the workersdiffer from each other. On both swifts, P decreases as the fiber mass moves forwardtoward the doffer, but the decrease is less rapid for the intermediate and would beeven less if a carder were included in the system. Noticeably, the p-value is greaterfor the first intermediate worker than it is for the fourth scribbler worker, and thiswould be similar for the carder. This trend of decreasing P is assumed to be common
Pm
mQo f
n----------+
--------------------------=
mA
PAQf1 PA–[ ]n
-----------------------; mB
PBQf1 PB–[ ]n
-----------------------; mC
PCQf1 PC–[ ]n
-----------------------= = =
mCPA1/2Qo f
1 PA–[ ]n------------------------
PB1/2Qo f1 PB–[ ]n
------------------------+Qo f2n
----------PA
1 PA–---------------
PB
1 PB–---------------+
= =
PC
1 PC–---------------
12---
PA
1 PA–---------------
PB
1 PB–---------------+
=
© 2003 by CRC Press LLC

to both worsted and woolen carding where one or a combination of cards in a setis used. It is attributed to the idea that the first worker on the card does most of thework. The tufts or loose fiber groups are larger prior to the first worker and aretherefore more easily caught by the first worker.
As the fiber mass on the swift moves toward the front of a card or a card set, itwill have a greater percentage of individual fibers aligned in the machine directionand progressively smaller and fewer minituftlets or microtuftlets. Therefore, the fibermass on the swift will be less easily caught by downstream workers operating withthe same machine conditions. It is also the case that, as fibers on the swift pass bysuccessive strippers, and the fibers from the worker are returned to the swift, thepressure between the swift-stripper roller surfaces causes fibers to be pushed deeperinto the swift clothing. This makes it more difficult for the downstream workers tocatch fibers. The action of the fancy before the doffer is to lift the fiber mass to thetip of the clothing to enable easier fiber transfer to the doffer. The use of a smallfancy between worker-stripper pair has also been used to increase p-values.
The significance of a high p-value is illustrated in Figure 4.9. Here, PM is thequantity of fiber removed by a worker, which is initially set to run with a p-valueof 0.4 and is then changed to operate at 0.8. M is the input fiber mass on the swift
TABLE 4.1Effect of Collecting Power of Workers for a 50/50 Wool Blend*
Scribbler PA PA/(1 − PA) PB PB/(1 − PB) PC/(1 − PC)PC
(calculated)PC
(experimental)
1st worker 0.430 0.754 0.606 1.538 1.146 0.534 0.5332nd worker 0.346 0.529 0.473 0.897 0.713 0.416 0.4183rd worker 0.304 0.437 0.414 0.706 0.572 0.364 0.3684th worker 0.253 0.339 0.375 0.600 0.470 0.320 0.318
*Schlumberger noils = 10% oil/Australian pieces = 10% oil.
+
++ +
+
++
++
+
++
+
++ +
0.7
0.6
0.5
0.4
0.3
0.2
0.1
1 2 3 4 1 2 3 4Worker
Scribbler Intermediate
T3 30 gaugeT1, 2, 4 28 gauge
P T1 20 rpm
T4 11 rpmT2 6 rpm
FIGURE 4.8 Mean p-values for workers on scribbler and intermediate. T1, T2, T3, T4, referto sequence of workers.
© 2003 by CRC Press LLC

entering zone C (see Figure 4.7) Although with each revolution of the worker anequal mass will be retained, the figure shows what happens to the first mass of fiber,0.4M, removed from the swift and then fed back to the swift within a short time bythe stripper, and a portion removed again by the worker. This cycle is shown forfive revolutions of the worker. Thus, for P = 0.4 in the first cycle, C1, 0.4 of M isremoved from the swift by the worker. This leaves 0.6M to move forward with theswift. The 0.4M is subsequently stripped from the worker and returned to the swift,and it becomes mixed with new tuftlets coming into this particular part of the cardingzone. In the second cycle, C2, the worker will again remove 0.4 of the mass enteringthe carding zone. This means 0.4 × 0.4M = 0.16M is now retained by the worker— that is to say, 0.16 of the first mass fed into the zone. At C3, 0.4 × 0.16M = 0.64Mis retained, and at C4 and C5, 0.026M and 0.010M, respectively. For P = 0.8, theretained mass per cycle is greater than for P = 0.4.
It can be seen that, with each revolution of the worker, the fraction of fiber massM, taken forward by the swift, decreases. The higher p-value results in much smallerfractions taken forward. This means that, with an increase in the p-value of a worker,the fiber mass will undergo a higher number of shear cycles and therefore better carding.
The closeness of swift-worker settings, the density and condition of the workerclothing, the card production rate, and the relative surface speeds of worker to swiftare the four principal factors controlling the p-value of a worker.15
Figure 4.10 shows that worker load varies almost exponentially with the closenessof setting; the closer the setting, the higher the p-value. This is because fiber captureby the worker depends on the height fibers project above the teeth of the swift clothing,and most fibers project only a shorter distance from the clothing. Thus, the closer theworker is to the swift, the greater the worker load and the higher the p-value.
In Chapter 3, it was explained that the worker, swift, and doffer clothing shouldbe sharp (i.e., of a small land) for effective carding and low nep levels. Having sharppoints to the worker clothing allows better penetration and retention of tuftlets andtherefore a higher p-value. However, with regard to tooth density, the fraction of theunit area occupied by the wire points is as important as the number of points perunit area. Table 4.2 shows the effect on worker load of these two factors for filletwires of different count, crown, and gauge. It can be seen that increasing the densityof points is effective only if the area occupied by the points does not decrease.
Worker
Swift
M C1 C2 C3 C4 C5
P = 0.4
Worker
Swift
M C1 C2 C3 C4 C5
P = 0.4
0.400Μ
0.600Μ
0.80Μ
0.20Μ
0.64Μ
0.16Μ
0.51Μ
0.13Μ
0.41Μ
0.10Μ
0.33Μ
0.08Μ
0.160Μ
0.240Μ
0.064Μ
0.096Μ
0.028Μ
0.038Μ
0.010Μ
0.016Μ
FIGURE 4.9 Effect of p-value on carding.
© 2003 by CRC Press LLC

As would be expected, worker load increases proportionally with productionrate; however, at wide settings, this does not hold true because of the effect of fiberprotrusion height. Generally, increased worker speed gives the greatest increase inp-values. The reason is simply because, in a given interval of time, a larger surfacearea of worker clothing points will interact with the swift and retain more fibers.Thus, the higher the production rate of the card, the more important the choice ofworker speed, as well as the worker setting, is for effective carding.
Although the carding action is the most important function of the swift-worker-stripper combination, the way in which this action occurs gives rise to two otherimportant functions, namely blending and leveling. For the moment, only a basicdescription will be given of the blending-leveling effect. A more detailed treatmentis provided in the next section, where the influence of the swift-doffer interactionis included.
TABLE 4.2Effect of Points Per Unit Area and Fraction of Area Occupied by Wire Points
Details of card clothing
Wire dia.(mm) Points/25.4 mm2
Area of wire in 25.4 mm2
Mass collectedby worker (g)
55/6/23 0.5842 132 0.055 2947
80/8/28 0.3910 256 0.045 2963
100/10/32 0.3048 400 0.045 5971
120/12/33 0.3048 576 0.065 4058
140/14/34 0.2794 784 0.075 3179
+
+
+
+
+
25
21
17
13
910 15 20 25 30 35 40 (× 25.4)
Microns
Wei
ght C
olle
cted
by
Wor
kers
(G
ram
s)
FIGURE 4.10 Effect of worker setting on p-values.
© 2003 by CRC Press LLC

The worker-stripper action (i.e., removing fibers from the swift and laying themdown again after a short time delay) blends the material being carded and levels outvariations in the feed from the hopper. The blending-leveling effect occurs in twoways: along the length of mass flow (i.e., lengthways) and by the superposition offibers as the material passes through the card. Consider Figure 4.11. This shows thatfor P = 0.5, it would take about nine revolutions of a worker for the swift to removeall the fibers in a mass M fed to point C in Figure 4.7. To identify the mass, imaginethat it was dyed red and fed among a mass of white fibers. Then, as Figure 4.11shows, successively smaller amounts of it, each separated by an interval d1, wouldappear mixed with the other fibers taken forward by the swift. It can be seen thatincreasing P reduces the size but increases the number of small amounts removedand, thereby, the lengthways blending-leveling effect. The interval d1 is the distancethe swift surface rotates in the time it takes for the fraction of the fiber mass on theworker to return to the swift-worker interface and undergo the shearing action. Theinterval d1 is therefore related to the time delay between each successive small amount,and this delay depends on the ratio of the worker and swift surface speeds. Thus, inthe figure, the ratio for (c) is greater than that of (a) and (b), and consequently .
To consider the second means of blending-leveling, i.e., by superposition, weneed to imagine now that the material on the swift entering the swift-worker-stripper
0.5M
0.25M
0.125M
0.063M0.032M
0.016M 0.008M 0.004M 0.002M
d1
d1
(a) when p = 0.5
(b) when p = 0.7
(c) when p = 0.7
0.3M0.21M
0.15M0.10M 0.07M
0.05M 0.036M 0.025M0.018M
0.3M
0.21
M0.
147M
0.07
2M0.
0504
M0.
0353
M0.
0247
M0.
0173
M0.
0121
M0.
0085
M0.
0059
M0.
0042
M0.
0029
M0.
0020
M0.
0010
M
d1
0.10
3M
(a)
(b)
(c)
FIGURE 4.11 Blending effect of retaining power of worker. Data show decreasing amountsof red fiber mass removed by the swift per worker revolution.
d1 d1′>
© 2003 by CRC Press LLC

carding zone is marked as successive blocks of fibers, A, B, C, …, G, as shown inFigure 4.12. Each block is of a different color and of length d1. If A is our red block,then, when the worker-swift action first separates this fiber mass, the portion removedby the worker will be deposited on B (say, blue fiber mass) as the swift moves Bto the point of the swift-stripper interface. If we follow this reasoning through to G(say, green fibers) and think of what the cross section of the fiber mass being takenaway by the swift from the worker would look like, the appearance should be alayered structure as illustrated in Figure 4.12. This superposition of fibers is equiv-alent to a doubling action at the drawframe or gillbox (see Chapter 5). As depicted,the higher p-value, resulting in smaller amounts of fiber mass being removed by theswift, gives a better superposition blending-leveling effect.
Although increased p-values give better blending and leveling, increased workerspeeds can militate against this in two ways. For example, if the worker speed isdoubled, the time taken to redeposit the fiber retained by the worker will be halved.This reduces the blending-leveling effect, since the amounts of the red tuftlet carriedforward by the swift, even though smaller, will now be half the distance apart.
Figure 4.13 illustrates the situation in which two worker/striper pairs are run atthe same speed. A and B are the respective fractions carried forward by the swiftand retained by the first worker and, similarly, D and C at the second worker/swiftinterface. If the distance between the two worker/stripper pairs is such that, by thetime B arrives at the second stripper, C is deposited on it, it can be seen that, when
d
A B C D E
Movement of fiber mass to swift-worker interface
F G
E
F
G
C, B, A
DCross sectionsof fiber masson swift at thepoint of swift–stripper interface D
Cross sectionfor higher p-value
C, B, A
EF
G
FIGURE 4.12 Effect of worker retaining power on blending by superposition.
+ ++
+
A
B
C
D
FIGURE 4.13 Effect of multiple worker-stripper pairs.
© 2003 by CRC Press LLC

the workers have the same surface speed, as A arrives at the stripper of the secondworker, B will be deposited on it. Since A and B are portions of the same retainedmaterial, the superposition of B on A militates against the blending and levelingactions. Worker/stripper pairs are usually mounted fairly close to each other so asto fit multiple positions over the top of a swift. It is therefore important that workerson the same swift run at different speeds.
4.3 WEB FORMATION AND FIBER CONFIGURATION
4.3.1 CYLINDER-DOFFER ACTION
In Chapter 3, it was stated that fibers on the cylinder or swift were transferred ontothe doffer and accumulated to form the doffer web as a result of the opposingdirections of the saw-tooth-wire clothing of each roller set in close proximity, i.e.,point-of-tooth to point-of-tooth action. In this section, we consider in greater detailthe mechanism of fiber transfer with reference to the many studies undertaken toelucidate the possible effect of process variables. For ease of explanation, only theterm cylinder will be used, since the swift is essentially the cylinder of the roller-clearer card.
Like the carding zone, the close cylinder-doffer setting has made it difficult touse photography to directly observe fiber transfer. However, several studies havemade useful attempts at doing so, including the use of laser-doppler anemome-try.2–4,16–18 These, along with other research, have helped to establish an understand-ing of the transfer mechanism. The referenced studies include work on the roller-clearer card, since the way fibers behave in the cylinder-doffer zone is comparablein both card types.
4.3.1.1 Fiber Configuration and Mechanism of Fiber Transfer
First, it is important to remember from Chapter 3 that, ideally, there should be onlyindividual fibers on the cylinder clothing as the cylinder surface leaves the cardingzone and approaches the doffer transfer zone. Although, when viewed on the cylin-der, these individual fibers appear to form a thin, filmy web (i.e., the cylinder web),they are transferred from the cylinder to the doffer not in the form of a web of fibersbut as individual fibers. This gives rise to the shapes fibers have in the doffer web,i.e., the fiber configurations. The work by Sengupta and Chattopadhyay19 demon-strates this point.
While carding viscose fibers, they placed specially prepared viscose fiber tuftsinto the batt feed to a revolving-flats card. The fibers in these tufts were parallelizedand had their ends dyed different colors so that they could be easily identified amongthe bulk of the fibers when observed on the cylinder surface prior to transfer, andthen in the doffer web immediately after transfer. The idea was that these tracerfibers would be representative of the shapes fibers adopt before and after transfer.The fiber shapes observed were grouped into the five classes of configuration,illustrated in Figure 4.14, and the relative frequencies of occurrence were determined.
Table 4.3 shows that, both before and after transfer, most fibers had a hookedconfiguration. Prior to transfer, the vast majority of tracer fibers observed had a
© 2003 by CRC Press LLC

leading hook configuration, i.e., hooked around the saw-teeth of the cylinder cloth-ing. Their trailing ends showing no hooked configuration. In the doffer web, thegreater proportion of the tracer fibers had trailing hooks. However, leading hookedand double-hooked fibers constituted a sizeable percentage of the observed tracerfibers, and there was a substantial drop in the number of straight fibers. A muchearlier study by Morton and Summer20 considered only the fiber configurations inthe sliver but, although the relative values for the five classes were different fromSengupta and Chattopadhyay’s data, the general trend was the same.
An important observation by Sengupta and Chattopadhyay was the mode oftransfer of fibers from the cylinder to the doffer. Table 4.4 shows that around 50%of fibers underwent reversal during transfer so that their trailing ends became leadingends. The majority did so with a change of configuration. Of the 50% that did notundergo reversal, the majority also changed configuration. In total, 73% of fiberschanged configuration. This particular observation of reversal, nonreversal, andchange and no-change of configuration indicates that fibers transfer from the cylinderto the doffer as individuals and not in the form of a web of fibers.
Figure 4.1521 shows that the cylinder-doffer region can be divided into two byan imaginary line passing through the point of closest approach of the two rollers,
TABLE 4.3Fiber Configuration Before and after Cylinder-to-Doffer Transfer
LocationTrailinghooks*
Leading hooks†
Double hooks‡
No hooks(straight) Other§ Total
Cylinder surface 61% 4.3% 4.3% 26.1% 4.3% 100%Doffer web 43.5% 19.6% 21.7% 10.9% 4.3% 100%
*Trailing ends hooked, leading ends not hooked.
† Leading ends hooked, trailing ends not hooked.
‡Both ends hooked.
§Other configurations.
GroupI
GroupII
GroupIII
GroupIV
GroupV
Other
Direction of Sliver Delivery from the Card
FIGURE 4.14 Classification of observed fiber configurations in doffer web.
© 2003 by CRC Press LLC

i.e., the cylinder-doffer setting line. The two regions may be referred to as the topand bottom cooperation arcs17 or, more simply, the top and bottom transfer zones.21
Most published studies support the idea that fiber transfer from the cylinder to thedoffer largely occurs in the top zone, leading to the formation of the five classes offiber configurations.
TABLE 4.4Mode of Fiber Transfer from Cylinder to Doffer
Configuration in doffer web
Configurations and relative frequency cylinder surface
Leading (L) (65%)
Trailing (T) (4%)
Double hooks(D) (4%)
No hooks(N–H) (27%)
L (%) 5 (R–C)5 (NR–NC)
2 (R–NC) 2 (NR–C) 3 (R–C)4 (NR–C)
T (%) 16 (R–NC)16 (NR–C)
2 (R–C) 7 (RC)5 (NR–C)
D (%) 4 (R–C)12 (NR–C)
2 (R–C) 2 (R–C)2 (NR–C)
N–H (%) 5 (R–C)2 (NR–C)
2 (R–NC)2 (NR–NC)
Change of configuration during transfer from cylinder to doffer and mode of change: R–C = reverse +change, R–NC = Reverse + no change, NR–C = no reverse + change; NR–NC = no reverse + no change.
Flat – CylinderCarding Area
Upper Zone ofCylinder – Doffer
Fiber Transfer Region
Lower Zone ofCylinder – Doffer
Fiber Transfer Region
Doffer
Cylinder
FIGURE 4.15 Upper and lower fiber transfer zones.
© 2003 by CRC Press LLC

Based on their work with woolen cards, WIRA (formerly, the Wool IndustryResearch Association, now the British Textile Technology Group, BTTG)23 reportsthat the transfer of fibers from cylinder (i.e., swift) to doffer is mainly a mechanicalaction involving the clothing of the two rollers, and that aerodynamic effects aresmall. A simple experiment was used to demonstrate this idea.
While carding an undyed fiber, a small square web of colored fibers was pressedinto the doffer clothing to fully occupy the length of each tooth within the area ofthe square. Following fiber transfer, only a few undyed fibers were found on theweb of colored fibers, even though the undyed fibers had formed a web surroundingthat of the colored fibers. The web of colored fibers had therefore shielded the dofferclothing and prevented the mechanical action of fiber transfer within the area of thesquare. In the top zone, the circumferences of the two rollers converge toward thesetting line and then diverge away from it in the bottom zone. It was assumed thatthe mechanical action of transfer would take place mainly in the top zone.
A second experiment established that, in the top zone, as fibers on the cylinderapproached the setting line, their trailing lengths were lifted from the cylinder surfaceby the action of circular motion and centrifugal forces. This lifting of the trailinglengths makes it easier for fibers to be caught by the doffer clothing.
The experimental method used was to direct a narrow, rectangular beam of lightonto the cylinder surface and take sideways photographs of the rotating surface alonga line parallel to the axis of rotation. From the photographs, measurements weremade of the distances that the fiber trailing ends lifted from the cylinder surface,i.e., the distance of projection, and Figure 4.16a shows a distribution of the measureddistances. Because the cylinder-doffer setting is smaller than the average distanceof projection, fibers will make contact with the doffer clothing over a certain lengthof the doffer circumference. Figure 4.16b and c show that this length of arc depends
Fraction of FiberProtruding from
Swift Surface
Length of Arcon Doffer
Doffer/SwiftFiber Contacts
(a)
(b)
(c)
Distance from Swift Surface
Distance from Swift Surface
Distance from Swift Surface
Potential Arcof Transfer
Surface of SwiftSurface of Doffer
Line of Centers
(Not to Scale)
A
a
a
B
A′
B′
a = Swift/Doffer Setting(i.e., narrowest gapbetween swift/doffersurfaces)
FIGURE 4.16 Cylinder-doffer transfer of fibers. (Courtesy of WIRA.)
© 2003 by CRC Press LLC

on the fiber’s distance of projection, and superimposing the two curves gives anindication where most fibers will be in contact with the doffer clothing, i.e., thepotential arc of transfer.
Morton and Summers20 suggest that, as the trailing ends of fibers lift from thecylinder surface, some become hooked around the teeth of the doffer clothing. Thesaw-tooth geometry of the doffer clothing has a steeper working angle and a longerlength than the cylinder clothing; therefore, the frictional drag of the doffer clothingeventually removes these fibers from the cylinder clothing. This mechanism of fibertransfer explains Sengupta and Chattopadhyay’s observations of fibers in the dofferweb having trailing hooks without undergoing the reversal of their leading andtrailing ends. A second mechanism for the formation of trailing hooks, attributed toModi and Joshi,22 is simply that leading-hook fibers on the cylinder undergo reversalduring transfer but without a change of configuration.
Sengupta and Chattopadhyay proposed two mechanisms for the formation ofleading hooks in the doffer web. The first is that some leading hooked fibers,particularly those near the tip of a sawtooth, slide off the cylinder clothing and landon the doffer without reversal or change of configuration. The second is that otherfibers slip from the cylinder with a reversal of trailing and leading ends. What wasthe trailing end gets buckled during landing on the slower-moving doffer surface.If, during reversal, the end sliding off the cylinder clothing becomes straightened,then a leading hook configuration will be formed. However, if the end retains itsshape, a double hook configuration occurs.
No suggestion is reported in the literature of how the nonhooked and othersconfigurations may be formed. However, we can use the above ideas to conjectureon how these shapes could occur. It is likely that, as the trailing ends of some fiberslift, they make contact with the cylinder housing just prior to the doffer. The frictionaldrag of the housing would be sufficient to pull such fibers from around the sawteethof the cylinder clothing and, in doing so, straightening the leading hooked end. Thesefibers would be entrained in the boundary air-layer moving with the cylinder rotationand would eventually land onto the doffer in a nonhooked configuration.
Although most researchers consider that fiber transfer occurs in the top zone,Simpson21 suggests that transfer can take place in both zones and that the particularzone in which transfer actually occurs influences the fiber configuration and is
FIGURE 4.17 Fiber transfer from cylinder to doffer in revolving flats card.
© 2003 by CRC Press LLC

dependent on the cylinder-doffer surface speed ratio. The majority of fibers transferin the top zone, and increasing the ratio results in an increase in the number of suchfibers and a larger number of trailing than leading hook fibers. Decreasing the ratiocauses more fibers to be the transferred in the bottom zone, and the percentage oftrailing hooks increases, whereas leading hooks decrease. Let us look, therefore, atthe possibility of fiber transfer in the bottom zone.
Consider the two points, A and B, shown in Figure 4.16 on the cylinder anddoffer surfaces, respectively.23 For a revolving-flats card, A will be moving at, say,a speed of 26 m/s and B at 1.5 m/s. After, say, 0.01 s, A will have moved 26 mmto A′ and B 1.5 mm to B′. The vertical distance between A′ and B′ will be withinthe range of a typical fiber length distribution of a Middling grade of cotton. It ispossible that the transfer of those fibers that make contact with the doffer clothingand become hooked by the clothing close to the setting line will take place in thebottom zone, having started in the top zone. It can be also reasoned that the higherthe doffer speed, the greater the chance that bottom-zone transfer will occur.
Lauber and Wulfhort17 and Dehghani and et al.,24 using laser-doppler anemom-etry and high-speed photography, studied the fiber dynamics in the bottom zone.Their analysis showed that, in this zone, air turbulence occurs between the two rollersurfaces and may disturb fibers that are not securely held by the doffer. Figure 4.17shows a typical photograph from Dehghani’s work. It can be seen that a thin layerof fibers has remained on the cylinder clothing. The outer edge of the doffer web isirregular in appearance, and fibers are caught in the air turbulence. There was alsoevidence that some fibers were initially held between the two surfaces and subse-quently pulled onto the doffer surface. These observations would seem to supportSimpson’s view that fiber transfer can occur in the bottom zone.
4.3.1.2 Effect of Machine Variables on Fiber Configuration
Ghosh and Bhaduri25 studied the effect of various machine parameters on the fiberconfiguration in the doffer web. The taker-in speed was found to have no significanteffect on the relative proportions of the five classes of configuration. Because of therelative proportion of trailing to leading hooks in the web, it has become theconvention to call the former configuration major hooks and the latter minor hooks.Table 4.5 shows that, with a constant cylinder speed and production rate, increasingthe doffer speed reduces the percentage of major hooks but increases the proportionof minor and double hooks. However, increasing the cylinder speed for a fixed dofferspeed decreased minor and double hooks without significantly affecting the propor-tion of major hooks.
It can also be seen from the table that varying the sliver count by increasingdoffer speed, while keeping a fixed cylinder to doffer speed ratio and productionrate, gave similar results. For a fixed sliver count, an increased production rate meansan increase in the doffer speed and a decrease in the cylinder-doffer speed ratio. Theassociated results show an increased number of minor hooks and a decreased numberof major hooks. Table 4.5 indicates that, irrespective of whether the cylinder ordoffer surface speed is changed, yarn imperfections increase with increasing cylin-der-to-doffer surface speed ratio. However, varying the ratio did not affect yarnstrength or yarn irregularity.
© 2003 by CRC Press LLC

Simpson26–29 used an indirect method called the cutting ratio30 for determiningmajor and minor hooks and reported similar results to Ghosh and Bhadwi. However,the effect of increasing the cylinder-doffer speed ratio on major hooks becamesmaller as the card production rate increased but was larger for minor hooks.
Using either a three-roller doffing device or a doffer comb to remove the cardweb from the doffer was found to have no effect on fiber configuration.25 However,the draft applied to the web as it is stripped from the doffer and condensed into asliver, i.e., calender draft, can alter the relative proportions of the fiber classes ofconfiguration. The tendency is to straighten fibers.20,25 Increasing the calender draftdecreases the percentages of hooked fibers and increases that of nonhooked fibers.The average fiber extent for the various configurations increased with calendar draft.The fiber extent for major hooks was found to be smaller than for minor hooks,which suggests that the former has a longer length of hook, making it more difficultto straighten by the calendar draft.
4.3.1.3 Recycling Layer and Transfer Coefficient
The presence of a fiber layer on the cylinder clothing in the bottom transfer zone,observed by Lauber and Dehghani, indicates that not all the fiber mass on the cylinderleaving the carding zone becomes part of the doffer web on first contact with the
TABLE 4.5Effect of Cylinder and Doffer Speeds, and Sliver Count of Fiber Configuration
Sliver count (ktex)
IDoffer
speed (rpm)Cylinder-doffer
surface speed ratio
Hook %Uster
imperfectionsMAJ MIN B
4.9 5.0 86.0 75 19 12 1144.4 5.6 77.1 73 19 12 1023.5 7.0 61.4 68 28 16 922.8 8.0 48.5 64 30 17 82
IICylinder
speed (rpm)
3.5 65 18.6 64 43 25 2763.5 180 51.4 75 29 18 1203.5 215 61.4 68 28 16 923.5 270 77.1 68 24 14 –3.5 315 90.0 69 21 14 87
IIICylinder
speed (rpm)Doffer
speed (rpm)
4.4 5.9 158 74 19 11 1333.2 8.3 220 79 27 18 1182.2 11.8 315 65 39 22 88
I = cylinder (rpm), 215; carding rate, 3.2 kg/h. II = doffer (rpm), 7; carding rate, 3.2 kg/h. III =cylinder–doffer surface speed ratio, 53.3; carding rate, 3.6 kg/h; MAJ = major hooks; MIN = minorhooks; B = double hooks.
© 2003 by CRC Press LLC

doffer clothing. Using the tracer fiber technique of different-colored fiber ends,Ghosh and Bhaduri22 found that fibers generally went around with the cylinder forseveral revolutions before being incorporated in the doffer web. Earlier work wascarried out by Debar and Watson31 in which radioactive tracer fibers were employedto determine the motion of fibers during carding. They found that, on first contactwith the doffer clothing, only 20% of tracer fibers became part of the doffer web;most fibers passed the doffer up to a maximum of 20 times before being incorporatedinto the doffer web. Some tracer fibers, as they made several cylinder revolutions,were caught more than once by the flats. Other researchers13,25,32 have reported figureswithin the range of 10 to 25 cylinder revolutions before fibers are transferred.Whatever the actual figure, it is clear that only a fraction of the fiber mass on thecylinder clothing leaving the carding zone is transferred to the doffer, and that arecycling layer is present on the cylinder after the transfer zone.
Krylov13 showed that the relative distribution of the fiber mass in a revolving-flats card operating under steady conditions may be depicted by Figure 4.18. Asimilar approach can be taken to illustrated the mass distribution for the roller-clearercard.
Important to an understanding of fiber transfer are the following fiber massvalues per revolution of the cylinder:
• Qo, the operational layer, i.e., the fiber mass leaving the carding zone• Q1, the mass transferred from cylinder to doffer• Q2, the mass of the recycling layer
The ratio of Q1 to Qo is termed the transfer coefficient, K, and can be measured asdescribed below.
Doffer
CardWeb
Cylinder
Q2
Q1
Qo
Flat Strips
Ns
Rd
Flats
QLC
QL
Rcnd nc
Lap
Qf
Waste
+
+
+
+
FIGURE 4.18 Representation of the fiber mass distribution within a revolving-flats card.
© 2003 by CRC Press LLC

After the card has reached a steady running state, the feed, doffer, and flats (orworkers and strippers) are stopped while the cylinder continues running. The dofferis then restarted with the feed and flats (workers and strippers) out of action. Initially,the doffer will present the part of the web that was on it when it was stopped. Thisis easily detached along a visible dividing line formed when the feed roller wasstopped. The mass of the remaining part of the web will be Qo.
Within a single revolution of the cylinder, a point on the doffer would travel adistance of
(4.4)
where Rc = the cylinder radius (m)Vc = cylinder surface speed (m/min)Vd = doffer surface speed (m/min)
If T is the sliver count in ktex, and P is the card production rate in kg/h, then
and
(4.5)
Hence, from the measurement of Qo, K can be calculated for known productionparameters. Reported values for K are within the range of 0.02–0.18,.13,22,61 Thismeans that, with each cylinder rotation, 82 to 98% of the fiber mass (Qo) remainson the cylinder as the recycling layer, Q2.
From Figure 4.18, if QL is the fiber mass on the taker-in, then this will be draftedto give the mass QLC fed to the cylinder with each cylinder revolution,
(4.6)
where Vt and Vc = the taker-in and cylinder surface speeds, respectively
The mass going into the carding zone with each revolution of the cylinder isQLC + Q2 and is called the cylinder load; that leaving the zone is
Qo = QLC + Q2 – Qf (4.7)
where Qf = the fiber mass per cylinder revolution contributing to the flat waste
Ld2πRcV d
V c
-------------------=
P 3.6V dT=
Q1 T Ld
2πRcT V d
V c
-----------------------200πRcP
3.6V c
----------------------= = =
Qo
200πRcP3.6KV c
---------------------- (in grams)=
QLC
QLV t
V c
------------=
© 2003 by CRC Press LLC

An equation for the roller-clearer card would not include Qf .Although an important parameter, Qf is much smaller than QLC + Q2. Therefore,
Qo may be taken as a practical estimation of the cylinder load for the card. Hence,from the start of carding, the buildup of cylinder load, Qo, the doffer web, Q1, andthe recycling layer, Q2, will follow the geometric progression given in Table 4.6.
When n is very large, there is continuity of fiber mass and, ignoring the flat-strap waste, the mass from the taker-in onto the cylinder, per revolution of thecylinder, equals the mass transferred to the doffer, i.e., Q1 = QLC.
4.3.1.4 Factors that Determine the Transfer Coefficient, K
There are two actions that form the recycling layer. The first is termed the retainingpower of the cylinder.23 We learned earlier that the leading ends of most fibers onthe cylinder are hooked around a tooth of the cylinder clothing. The remaining lengthof a hooked fiber is, however, longer than the tooth pitch and will make contact withseveral teeth and with other close-by fibers. The resulting frictional forces willoppose transfer of the fiber. Where such frictional forces are sufficiently large, theywill retain fibers on the cylinder. Circular and centripetal forces will try to lift fibersoff the cylinder surface to be caught by the doffer. Therefore, the retaining poweris inversely proportional to the square of cylinder surface speed and to the workingangle of tooth of the cylinder clothing, but directly proportional to the fiber-fiberand fiber-metal friction coefficients.32
The second action is the cylinder clothing taking back, from the doffer web,previously transferred fibers. It was explained earlier that most fibers are transferredonto the doffer in the top zone to form the doffer web. In forming this web, fibersbuild up to fill the doffer clothing, and some will project beyond the tooth heightof the clothing. Those fibers protruding beyond the total distance of tooth heightplus the cylinder-doffer setting will be subsequently caught by the cylinder teethmoving toward the setting line. The effect is a robbing back by the cylinder ofpreviously transferred fibers that are not securely held by the doffer clothing.DeSwann33 demonstrated that fibers are removed from the doffer by the cylinderclothing. In pulling fibers back onto the cylinder surface, the saw-tooth clothing ofthe cylinder is said to impart a combing action on the doffer web and may influencefiber configuration by straightening leading hooks.22
Based on the mechanism for fiber transfer, particularly in the top zone, thetransfer coefficient is governed by the tooth angle, tooth density, and the circularmotion and diameters of the cylinder and the doffer. These factors influence theeffectiveness of the two rollers to hold fibers onto their respective clothing, i.e., theirretaining powers and thereby determine the transfer coefficient K. Figures 4.19 and4.20 illustrate forces that control the retaining power. There are two situations toconsider. First, there is the case of fiber shedding, where fibers are thrown off thecylinder before contact with the doffer. Second, there is the opposing action of therespective clothing when they are simultaneously in contact with a fiber.
In the case of fiber shedding, for simplicity,34 we can refer to the centrifugalforce and the opposing frictional force acting on a fiber. These forces will give riseto the resultant force S. The resolved component J slides the fiber to the tip of the
© 2003 by CRC Press LLC

TABLE 4.6Buildup of Cylinder Load, Doffer Web, and Recycling
Cylinder revolution
Fiber mass feed to cylinder
Cylinder load, Qo
Fiber masstransferred to
doffer, Q1 Recycling layer, Q2
1 QLC QLC QLC K QLC[1 – K]
2 QLC QLC + QLC [1 – K] K QLC + QLC[1 – K] [1 – K] QLC + QLC[1 – K]
3 QLC QLC 1 +[1 – K] + [1 – K]2 QLC 1 + [1 – K] + [1 – K]2 [1 – K] QLC 1 + [1 – K] + [1 – K]2
nwhen n → ∞
[1 – K]n → 0 QLC
(4.8)
QLC 1 – [1 – K]n
QLC (4.9)
(4.10)
QLC1 1 K–[ ]n–
K-----------------------------------
QLC
K---------
QLC 1 K–[ ] 1 1 K–[ ]n– K
-----------------------------------
QLC1 K–[ ]
K------------------
© 2003 by CRC Press LLC

hH
P
F
QN
ββ
q
Direction of Travelof Card Clothing
S J
FIGURE 4.19 Fiber shedding forces.
Q2
P2
S2
Vd
S1V0
R
R
α2
β2
φ2
β1
α1
φ1
C
D
Vc < Vd
D = Doffer ToothC = Cylinder ToothVd = Doff Surface SpeedVc = Cylinder Surface Speed
FIGURE 4.20 Interaction of cylinder-doffer fiber transfer.
© 2003 by CRC Press LLC

tooth against the opposing forces Q and F, as shown in Figure 4.19. The fiber motionwill be affected by aerodynamic drag giving rise to force P. We may assume that Sand P are acting at the point of interaction between the tooth and the fiber. Thus,resolving along the working face of the tooth (direction q) and normal to the face,(direction h) to derive forces H, Q, F, and J, we get the equations of equilibrium,
P sin β + S cos β = N (4.11)
P cos β + µN = S sin β (4.12)
Hence, the condition for fiber shedding must be P cos β + µN < S sin β.Substituting for N,
(4.13)
Table 4.7 gives the required minimum values for S/P ratio for differing β and µ, andwe can see that fiber shedding occurs more readily at larger angles and smallercoefficients of friction. S increases with the cylinder speed more significantly thanP. Thus, the tendency for fiber shedding will increase with cylinder speed. Theopposing frictional force acting on a fiber-trailing length will be higher for longerfibers. Fiber shedding is more likely to occur with short fibers.
Figure 4.20 shows the interaction of the cylinder and doffer and the principalforces involved in the opposing action of the clothing in the transfer zones. Using thisarrangement, Baturin35 derived an equation for the transfer coefficient as a functionof the machine parameters. The angles β1 and β2 are the working angles of the clothing,and α1 and α2 are results of the curvature of the roller surfaces in relation to the tangentat the base of tooth of the roller clothing. The boundary of the bottom transfer zoneis a distance H from the setting line. If the fiber length is Lf, then the vertical distancefrom the setting line to the base of the tooth on the doffer in the bottom transfer zoneis approximately (H – Lf /3) and (H + Lf /3) for the cylinder. Hence,
and
where Rc and Rd are cylinder and doffer radii, respectively.
TABLE 4.7S/P Ratios for Differing β and µ
Fiber-Metal Friction Coefficient (µ)
Angle of Inclination (β) (Degrees) Ratio S/P
0.20 66 710.23 60 930.23 66 750.23 70 660.26 66 80
SP--- βcos µ βsin+
β µ βcos–sin--------------------------------->
α1 arc H L f /3+( )
Rc
---------------------------sin= α2 arc sin H L f /3–( )
Rd
--------------------------=
© 2003 by CRC Press LLC

The action of the teeth on the fiber sets up a tension R within the fiber. Thus,R cos[β + α] tends to push the respective fiber ends to the base of the teeth. This is,however, opposed by a component of the force S and the frictional force, µ(R sin[β+ α] + S cos[β + α]). Resolving along the working surface of the tooth for therespective clothing, we get the equations for equilibrium,
R (cos φ1 + µ sinφ1) = S1 (sinφ1 – µcos φ1) (4.14)
R (cos φ2 + µ sinφ2) = S2 (sinφ2 – µcos φ2) (4.15)
where φ = β + α
Since S tends to reduce the retaining power of the clothing, we may assume itto be inversely proportional to the retaining power. Thus, the ratio S2:S1 will berelated to the ratio of the fiber masses on the two rollers after transfer, i.e., Q1 and Q2.
Hence,
(4.16)
(The symbol indicates “proportional to.”)
The cylinder and doffer usually have differing tooth densities of clothing. Wemay assume that, if Nd and Nc are the respective densities, their ratio will beproportional to the ratio of the retained fiber masses on the two rollers.
(4.17)
Although Z1 was determined from S1 and S2, it only gives a measure of the effect ofthe working angles of the clothing. Experimental studies by Krylov13 show that theratio of the retained fiber masses on the cylinder and doffer is inversely proportionalto the cylinder surface speed.
(4.18)
Thus, the relationship between the fiber mass transferred to the doffer, Q1, and thatretained by the cylinder, i.e., recycling layer Q2, is given by
(4.19)
Q1 = Q2M (4.20)
Z1S2
S1
-----φ2 µ φ2sin+cos( ) φ1sin µ φ1cos–( )φ2sin µ φ2cos–( ) φ1cos µ φ1sin+( )
------------------------------------------------------------------------------------Q1
Q2
------∝= =
Z2
Nd
Nc
------Q1
Q2
------∝=
Z3
1.6 106× Rc
V c
---------------------------Q2
Q1
------∝=
Q1 Q2
Z1Z2
Z3
-----------=
© 2003 by CRC Press LLC

If q and q* are the fiber mass per unit length of the recycling layer and of thelayer transferred to the doffer per cylinder revolution, then q* = qM; Q2 = q 2πRc;Q1 = q*Vd/nc; and Qo = Q2 + QLC, where nc is the revolutions per minute of thecylinder, and QLC is the new fiber layer passing from the taker-in to the doffer. Understeady-state running of the card, QLC = Q1. The transfer coefficient K is thereforegiven by
(4.21)
Equation 4.21 gives the machine factors that govern the transfer coefficient.Simpson61 and Brown62 found that K is more dependent on Z1 and Z3 than on Z2,because tooth angle, roller diameter, and roller speed have a greater effect than toothdensity on the recycling layer, Q2. The greater the ratios of cylinder to doffer toothangles, diameters, and surface speeds, the lower Q2. However, a change in the rollerdiameters has less effect than changes in tooth angles.
4.3.1.5 The Importance of the Recycling Layer
Reported values show K to be small, ranging from 0.2 to 18%. This means, fromEquations 4.8 and 4.10 in Table 4.6, that the recycling layer constitutes a significantpart of the cylinder load. Q2 is therefore important in two respects.
First, because it forms part of the cylinder load, its constituent fibers will besubjected to several cycles of the carding action before permanently being incorpo-rated in the doffer web. Second, by contributing to the cylinder load, it tends toreduce irregularities in the fiber mass transferred from the taker-in to the cylinderand is said to contribute to the evening action of the card. It is therefore useful toknow what effect the recycling layer has on the carding action and to see how changesin the process parameters affect the size of the recycling layer and the evening action.
To determine the effect of Q2 on the carding action, Karasev36 used a suctionextractor to remove it while the card was in operation. He found that, without therecycling layer, the fiber mass transferred from the taker-in to the cylinder becameembedded into the empty teeth of the cylinder clothing. Only the larger tuftlets andgroups of individual fibers were then subjected to an effective carding action. Therewas a greater chance of microtuftlets and small groups of entangled fibers becomingpart of the doffer web. The recycling layer therefore acts as a support to new layersof fiber mass from the taker-in, keeping the new fiber mass at the tips of the teethof the cylinder clothing and thereby enabling better interaction of fibers with theflats (or workers) and cylinder clothing. It should be noted that Q2 is much greater
KQ1
Qo
------q*V d/nc
q*M2πRc
M------------------------- q*V d/nc+
---------------------------------------------------------= =
V dMM V c MV d+[ ]
------------------------------------=
Z3
V dZ1Z2
Z3V c Z1Z2V d+[ ]------------------------------------------=
© 2003 by CRC Press LLC

than QLC. Therefore, as both are spread over the cylinder surface entering the cardingzone, the fibers in the recycling layer will also make contact with the flats (workers)and ultimately the doffer clothing. Gupta suggests that the rotating cylinder couldbe considered as a large centrifuge that causes fibers in Q2 to migrate to the peripheryand make contact with the flats (workers) and doffer clothing.
Although the presence of a recycling layer assists the carding action, researchfindings show that a large recycling layer causes too high a cylinder load andconsequently a poor carding action. A number of researchers37–38 have appliedstochastic theory to the movement of fibers through the card. The mathematicaldetails of such studies are beyond the scope of this book, but it is nevertheless usefulto consider some results concerning the influence of the cylinder load on the effec-tiveness of the carding action. The reported work was for the revolving flat card;however, the reader should note that the trends are applicable to roller-clear cards.
The probability, Pf, of a fiber being carded between the cylinder and flats duringone cylinder revolution is given by the ratio of the fiber mass held between flats andcylinder in the carding state, QFC, to the cylinder load, Qo, i.e.,
Pf = QFC/Qo (4.22)
The inaccessibility of fibers in the carding state makes it impossible to obtain anexact measurement for QFC. However, an estimate can be made by assuming themaximum holding capacity of the flats, QFM, is the sum of the fiber mass held bythe flats in the carding state and mass of the flat strip, Qf. Hence,
QFC = QFM – Qf (4.23)
By running the card flats at the lowest possible speed and collecting the flat strip atdifferent production rates, a set of increasing values will be obtained until thesaturation point is reached. This maximum is a close approximation of QFM.
Pf is related to the total carding action, so changes in process parameters thataffect carding quality will give corresponding changes in the value of Pf. Any processparameter causing a change in the cylinder load Qo and/or QFC will either increaseor decrease Pf. Figure 4.21 shows how carded ring-spun yarn strength, irregularity,and nep content varied with Pf , and it is evident that better yarn properties areobtained with higher Pf values. The improvement in yarn strength is attributed tothe improvement in irregularity.
From the definition of Pf, we can reason that the higher the Pf value, the greaterthe percentage of the cylinder load that will be fully carded. This means that therewill be a more efficient breaking down of tuftlets into individual fibers, reducingthe opportunity for microtuftlets and entangled fibers getting into the doffer weband ultimately degrading the yarn properties. Hence, process parameters that reduceQo and increase QFC are important to efficient carding.
Referring to the Equations 4.8, 4.9, and 4.10 in Table 4.6, we can see that theeffect of decreasing QLC is to decrease Q1, Q2, and Qo. In practice, there are severalcard parameters that can be altered to change the value of QLC. Equation 4.6 showsthat the taker-in and cylinder surface speed ratio can be used to decrease QLC. Because
© 2003 by CRC Press LLC

the taker-in is required to give small tuft sizes, it is more appropriate to reduce QLC
by increasing the cylinder speed. Table 4.8 confirms that increasing only the cylinderspeed reduces Qo, Q2 (even though K increases), and Q1. In Figure 4.22, Pf is seento increase with cylinder speed, so the carding action improves with cylinder speed.
Table 4.8 shows that, although Q1 decreases, K increases with increasing cylinderspeed. A number of factors contribute to the increase in K. The mechanism for fiber
24
22
20
18
16
14
12
10
8
6
0.00 0.05 0.10 0.15 0.20 0.25 0.30 0.35
X10 Neps g−1
Single Thread Strength cN tex−1
Uster CVT %
Qua
lity
Para
met
er
Pf
FIGURE 4.21 Effect of Pf on yarn quality.
0.20
0.18
0.16
0.14
0.12
0.10
0.08
0.06
0.04
6 8 10 12 14 16 18 20 22 24 26 28 30 32
Doffer Speed
×10 Cylinder Speed
Speed, r/min
P f
FIGURE 4.22 Effect of cylinder and doffer speeds on Pf .
© 2003 by CRC Press LLC

transfer is dependent on circular motion and centripetal forces; therefore, increasingthe cylinder speed will increase K. However, we should remember that the transfercoefficient is the ratio of Q1 to Qo and consequently should be considered in relationto the cylinder load.
Given that increased cylinder speed reduces the cylinder load, the increasedspeed does in effect reduce the retaining power of the cylinder. As Q1 is also reduced,the robbing back effect of the cylinder will be less. Thus, K will increase. This showsthat the recycling layer is an important contributing factor to the cylinder load. Thismeans that having a higher transfer coefficient does not always give an increase inthe mass transferred.
Altering QL by changing the sliver count and/or the production rate will changethe value QLC. If the sliver count is kept constant, QL will increase with increasingdoffer speed, because the production rate increases. Qo increases and K decreaseswith increased doffer speed,25,29 and Figure 4.22 shows that the carding action ispoorer because Pf decreases with doffer speed. As illustrated by Figure 4.23, theweb quality deteriorates.
If we keep a constant production rate and increase the doffer speed, the slivercount will decrease. This means QLC decreases, and therefore also Q1, Q2, and Qo.It is evident from the table of results that the percentage decrease in Q2 correspondswith the decrease in Qo.
From the above discussion, we can conclude that the sliver count, productionspeed, and cylinder speed are key factors that control QLC and Q2, and thereby thecylinder load and the efficiency of the carding action. Thus, the lighter the sliverand the higher the cylinder speed, the lower will be the recycling layer and cylinderload, and the higher the transfer coefficient.
From Equation 4.22, QFC is also an important factor for efficient carding.Figure 4.24 shows that increasing the revolving-flat speed increases Pf withoutchanging Qo and K. Generally, the percentage of flat strip waste increased with flatspeed, but the loading of each flat decreases and, therefore, so does Qf. This means(see Equation 4.23) that QFC increases with flat speed and thereby also Pf.
From the above description, we can see the importance of Qo to the efficiencyof the carding action and to the improvement in properties of carded ring-spun yarns.Yarn properties are strongly influenced by the propensity of major and minor hooksin the card sliver. It is therefore useful to see how changes in Qo relate to changes
TABLE 4.8Effect of Increased Cylinder and Doffer Speed on Fiber Mass Transfer
Cylinder speed(rpm)
Qo
(reduction)(%)
Q1
(reduction)(%)
Q2
(reduction) % K (%)
180 – – – 4.90
220 17 20 17 4.92
260 41 40 41 5.76
315 52 40 52 5.82
© 2003 by CRC Press LLC

98
7
6
5
4
Sliver Count (ktex)
40
30
20
Doffer S
peed (r/
min)
15
10
5
0
50
10
Web
Qua
lity
(No.
of
Faul
ts/g
)FIGURE 4.23 (See color insert following page 266.) Effect of cylinder and doffer speedson web quality.
16
14
12
10
8
6
20 40 60 80 100 120 140 160 180
Fibe
r C
ardi
ng T
rans
fer
Para
met
er
Speed of Revolving Flats (mm/min-1)
Pf × 10-2
Qo
K
FIGURE 4.24 Effect of revolving-flat speed on fiber transfer parameters.
© 2003 by CRC Press LLC

in the percentage of such fiber configurations. We can determine this by comparingTables 4.5 and 4.8. Although the latter table is for a fixed doffer speed, the abovediscussion showed that Qo decreases with both doffer and cylinder speeds. It istherefore evident from the tables that, as the cylinder load decreases, the proportionof major to minor hooks decreases. Studies carried out by Simpson26,27 on a rangeof cotton types show similar results. It is essential that both types of hook configu-ration be straightened during drafting. As explained in Chapter 5, two passages ofdrawing (or gilling, in case of worsted card sliver) prior to drafting at the rovingand ring frames are necessary for removing hook configurations. Having a nearlyequal number of major and minor hooks offers a better chance of straightening suchconfigurations because of the even number of material reversals during the processstages that follow carding.
From the above discussion, it is apparent that, for improved card web quality,increasing K and thereby reducing Qo and Q2 without the need for a very high cylinderspeed becomes important at very high production rates. Baturin’s equation showsthat the development of the card wire clothing is a key step in achieving this.
4.3.2 BLENDING-LEVELING ACTION
4.3.2.1 Evening Actions of a Card
We have seen that the carding zone gives a leveling effect, particularly for rollerclear cards. A similar effect occurs with the cylinder–taker-in–doffer interactions.To explain this, let us ignore for the moment the leveling effect of the carding zoneand consider the distribution of the fiber mass on the cylinder, the deposition ontothe cylinder from the taker-in, and the transfer of fiber to the doffer.
Assume that Qo is always 100 g prior to fiber transfer to the doffer. Let K =10%. Then, under steady-state conditions and for each revolution of the cylinder,QLC = Q1 = 10 g and Q2 = 90 g. Let us denote the first 100 g on the cylinder as Aand subsequent QLC layers as B, C, and so on. A is the aggregate of pervious QLC.Figure 4.25 shows that the fiber mass removed from each layer to form part of thedoffer web decreases with each cylinder revolution corresponding to QLC K[1 – K]n
as n → ∞ (see Table 4.6), and the amounts would be spaced at intervals of d2 =2πRdnd /nc. If it took N cylinder revolutions for all the fibers in a layer to betransferred, this spacing of the amounts removed per cylinder revolution would bespread over Nd2. This shows a lengthways blending and leveling of the fiber layers.With each cylinder revolution, each new QLC layer will be superimposed on theprevious layers constituting the recycling mass Q2. Thus, this superimposition andthe effect described for the carding zone will combine with the lengthways blendingand leveling to reduce irregularities in the feed to the card.
The total blending-leveling effect of a card is a combination of the carding zoneeffect and the cylinder-doffer–taker-in effect, d1 + d2. Generally, nc is much greaterthan nd, so d2 will be very small compared with d1 for the carding zone involvingworker-stripper combinations, but it will be much larger than for revolving flats, sayd#1. In practice, therefore, only roller-top cards give meaningful blending-leveling
© 2003 by CRC Press LLC

actions, and our study of the evening effect of cards will now be limited to thesemachines.
The fiber batt feed to the card is generally of a fixed width. Therefore, as areference measure of the feed irregularity, we can take the variation of mass per unitlength. Over a range of different unit lengths, we may see differing mass variation.Such irregularities may be classified according to their wavelengths (see Table 4.9).It is therefore of interest to develop some means of determining the range ofwavelengths over which the evening actions of the card would be effective. To dothis, a number of researchers39–41 have likened the blending-leveling actions of cardsto an automatically self-regulating machine system and have applied control theoryto develop computer simulations of the evening effect. However, the followingsimpler approach may be used to determine the evening effect of a roller-top card.
First, we must note that we have so far assumed that, per revolution of the swift,each worker retains a constant amount of fiber and also that a constant amount istransferred to the doffer. However, in reality, the p and K values for a fixed operatingcondition will vary because of a randomness of the fiber factors affecting transferbetween the rollers, e.g., variation in fiber orientation, length, fineness, friction, andentanglement.
Q0 = 100
Q2 = 90Q1 = 10
Q0 = 10 + 90 = 100
Q2 = 9 + 81 = 90 Q1 = 1 + 9 = 10
Q0 = 10 + 9 + 81 = 100
Q2 = 9 + 8.1 + 72.9
QLC = 10
QLC = 10
First Transfer
Second Transfer
Third Transfer
Fiber Mass Input and Transfer with Each Cylinder Revolution
Progressive Reduction in Mass Transferred from of Each QLC Input Mass
Q1 = 1 + 0.9 + 8.1 = 10
d2 = 2πRd(nd/nc)
1 g0.9 g
0.81 g0.729 g
FIGURE 4.25 Lengthways blending and leveling.
© 2003 by CRC Press LLC

Therefore, the p and K values we are considering are the average values. Thismeans that intervals d1 and d2 are caused by their corresponding average time delay.We can use the average total time delay to evaluate the evening action of a card ora series of cards. This is called the delay factor, D. In very simple terms, we cansay that, under steady-state conditions, if it takes one revolution of a swift for thedoffer to remove Q1 (= QLC), then the number of swift revolutions required to removea total load, W, of fibers carried by the swift and all the workers and strippers wouldbe W/QLC, which would be the delay factor for the card.
From Equation 4.8, the load presented for transfer to the doffer per swift revo-lution
Following the derivation of Equation 4.1, the load carried by each worker and strippercombination per swift revolution
(4.24)
Hence, if there are n1 workers with similar surface speeds on a card, then thecombined load of all the workers
and the total load W
(4.25)
For a set of, say, three cards, this becomes
TABLE 4.9Classification of Irregularities According to Wavelengths
Irregularity Wavelength
Ultra-short term Less than the order of a fiber lengthShort-term Grater than fiber length but less than 0.5 mMedium-term Greater than 0.5 m up to 100 mLong-term Grater than 100 m
QLC
K---------=
QLC
K--------- p
1 p–------------
=
QLC
K---------
n1 p1
1 p1–[ ]-------------------
=
QLC
K--------- 1
n1P1
1 P1–--------------
+=
© 2003 by CRC Press LLC

and
(4.26)
So the corresponding delay factors would be
(4.27)
for one card, and
(4.28)
for three cards.Note that 1/K is the delay factor for the swift-doffer–taker-in interaction, and
1/Kn1p1/[1 – p1] and so on are delay factors for worker-stripper combinations.D can be estimated by measuring the individual parameters in the above equa-
tions or, more simply, by stopping the feed to the card and running out the fibersand weighing the collected mass. From this, the fiber mass that was on the dofferat the time the feed was stopped is subtracted to give the total load, W. Thus, D isW divided by the feed rate.
Now that the concept of the delay factor has been established, it is useful seehow it can be applied to determine the amount by which a card or a series of cardswill smooth out the irregularities in a batt feed.
Step Change in FeedWe will first consider the simplest form of irregularity, a sudden increase or stepchange in the feed rate. For ease of explanation, let us limit the consideration to theeffect of the swift-doffer–taker-in interaction. If it is assumed that the feed rate wasuniform prior to the step change, then the output from the doffer per swift revolutionwould increase according to Equation 4.9, which follows the curve shown in Figure4.26. Including the effect of worker-stripper combinations would result in the morecomplex curve shown in Figure 4.27, and this can be suitably approximated by anexponential curve given by (see Appendix 4A and Figure 4.26).
Q1 = QLC [1 – exp(–t/D)] (4.29)
Thus, the output from a step change will increase almost exponentially until againQ1 = QLC.
QLC
K---------
n1 p1
1 p1–[ ]-------------------
n2 p2
1 p2–[ ]-------------------
n3 p3
1 p3–[ ]-------------------+ +
=
WQLC
K--------- 1
n1P1
1 P1–[ ]-------------------
n2P2
1 P2–[ ]-------------------
n3P3
1 P3–[ ]-------------------+ +
+=
D1K---- 1
n1 p1
1 p1–[ ]-------------------
+=
D1K---- 1
n1 p1
1 p1–[ ]-------------------
n2 p2
1 p2–[ ]-------------------
n3 p3
1 p3–[ ]-------------------+ +
+=
© 2003 by CRC Press LLC

100
80
60
40
20
0
10 20 30 40
Mathematical ApproximationQ1 = QLC [1 − Exp (− t/D)]
Q1 = QLC [1 − (1 − K)n]
t (Swift Rev.)Theoretical Response Curves (Part with No Workers) For K = 1/10
Out
put a
s Pe
rcen
tage
of
Cha
nge
in I
nput
(I)
FIGURE 4.26 Cylinder-doffer theoretical response curve for K = 0.1. (Courtesy of WIRA.)
100
80
60
40
20
0
20 40 60 80 100
Swift, Doffer,and Four Workers
Equivalant Swiftand Doffer
Time (Swift Rev.)
Out
put a
s Pe
rcen
tage
of
Cha
nge
at I
nput
FIGURE 4.27 Cylinder-doffer–worker-stripper combination response curve. (Courtesy ofWIRA.)
© 2003 by CRC Press LLC

General or Random IrregularitiesIn Appendix 4A, the idea of the equivalent transfer coefficient F is explained. If weadopt the idea, then the description given earlier for the blending-leveling effect ofthe swift-doffer–taker-in interaction illustrates how increasing the delay factorreduces general irregularities.
Periodic IrregularitiesAgain, using the idea of the equivalent transfer coefficient, we can adopt the input-output performance of a simple resistance-capacitance (RC) filter as an analogy forthe input-output response of a roller-top card, where the time constant of the filteris equivalent to the delay factor of the card. Similar to the card’s response, a stepchange in the input voltage of an RC filter results in an exponential change in itsoutput voltage. This equivalence is useful, because there are well known techniques23
for calculating the response of RC filters to periodically varying voltage inputs. Themost elementary form of such an input is a sinewave. The output is a sinewave ofthe same frequency as the input, but the amplitude is reduced. The ratio of the outputand input amplitudes is called the gain, G, at that the particular frequency and isgiven by the equation
(4.30)
where ω = frequency τ = time delay
Thus, the card equivalent would be
(4.31)
where H = frequencyD = delay factor
Figure 4.28 shows a graph of G versus H plotted on logarithmic scales. For asimple prediction of the evening effect of the card, the curve can be approximatedby its asymptotes shown by the broken lines. The predicted range of frequencies orwavelengths for which amplitudes will be modified can be obtained as follows. Thelongest wavelength or minimum frequency, Hb, termed the break frequency, is at thepoint of intersection of the asymptotes. Here, G = 1. It is evident that using theasymptotes for predictions will result in a minimum frequency higher than the truevalue, since, on the actual curve, G = 0.71 at Hb. Nevertheless, the error is on theright side of caution, because the actual output irregularity will always be less thanthe prediction. An important characteristic of the asymptotic shape is the slope PS.It shows that, at N Hb, the gain is 1/N, where N is any number, e.g., 1, 1.5, 2, 2.3,3, …, 10, and so on. Thus, if we know the minimum gain, we can determine the
GOutput amplitudeInput amplitude
------------------------------------------ 1
1 2πωτ( )+[ ]2---------------------------------------= =
G1
1 2πHD( )+[ ]2-----------------------------------------=
© 2003 by CRC Press LLC

upper frequency limit and complete the asymptotic form. An equation for the min-imum gain can be obtained by the following reasoning. If a given mass of fibers Qin
were to be transferred to the swift, passed straight through to the doffer, and totallyremoved by the doffer, then Qin = Qout and G = 1. However, when the mass makescontact with n workers, each with a retaining power of p, then only Qin (1 – p)n
passes straight through to the doffer. With a doffer transfer efficiency of K, Qout =K Qin (1 – p)n; hence, the minimum gain, Gmin, = K(1 – p)n = 1/N, and the upperfrequency = Hb/[K(1 – p)n]. Knowing the delay factor D, Hb can be calculated andthe asymptotic form drawn.
For a series of cards, the overall gain is the product of the gains for each card.For example, say the irregularity entering the card has a frequency of 1.43 Hb. Then,G = 0.7 and, for a series of three cards, G = 0.7 3 = 0.34. Similarly, if the minimumgain for a card = 0.1, then, for three cards, Gmin = 0.001, and the upper frequency= 1000 Hb. Such a figure, however, is of little practical significance, since the carditself would generate irregularities of this frequency.
4.4 FIBER BREAKAGE
4.4.1 MECHANISM OF FIBER BREAKAGE
It is clearly essential that, during carding, any breakage of fibers be kept to aminimum. In discussing how fiber breakage can occur, we must consider the dynam-ics of the following sequence of events:
1. A saw-tooth or pin of a roller clothing entering the fiber mass2. Fibers being caught by the tooth or pin3. Fibers being removed by the tooth or pin
1415
12
110 1
10Hb Hb 2Hb 3Hb 4Hb 5Hb 10Hb
Frequency
P
S
Gai
n
1
1
FIGURE 4.28 Filter gain-frequency curve. (Courtesy of WIRA.)
© 2003 by CRC Press LLC

Figure 4.29 illustrates the general situation in which a fiber mass is held as a toothon a rotating roller enters the mass to remove fibers. In the case of the short-staplecard, the fiber mass may be the fringe of the batt held between the feed roller andfeed plate or the fiber load caught in a flat. For roller-top cards, it may be the massat the taker-in or on the stripping roller at the point of contact with the swift, or themass on the swift at the point of contact with the worker. As the tooth enters themass, it may hit a fiber at any location along its length. The impulsive force, FT,will cause the fiber to become hooked by the tooth. Fibers that are hooked may dragothers that are not in direct contact with a tooth. Once a fiber is caught by a tooth,the pulling force will give rise to increasing tension and strain in the fiber. Peaktension and strain are reached, at which point
1. If the trailing end remains caught, the peak strain equals the fiber breakingstrain, and the fiber breaks.
2. If the end is released before the breaking strain is reached, the fiber iswithdrawn.
3. If, while the end remains caught, the tension overcomes the frictionalresistance of the hooked length around the tooth, the tooth slips from thefiber, along the hooked length.
A given fiber may have both ends embedded within a mass of fibers or one endwithin the mass and the other free. Appendix 4B provides a theoretical treatment ofboth situations, which explains much of the practical observations. Here, we willfocus on the practical observations of the effect of how process parameters affectfiber breakage. The parameters of importance are
• State of the fiber mass and fiber characteristics (i.e., degree of entangle-ment, mass per unit area, regain, bulk, friction, and tensile properties)
• Tooth geometry
α
∆α
FT2
FT1
FT
(a)
(b)
N µ
FIGURE 4.29 Forced generated with fiber-pin interaction.
© 2003 by CRC Press LLC

• Roller surface speed• Production rate• Card component settings
4.4.2 STATE OF FIBER MASS AND FIBER CHARACTERISTICS
The fact that an impact force and then a withdrawal force is applied to fibers duringopening indicates that, to prevent breakage, the breaking strain of fibers under highrates of extension must be greater than the strain induced by these forces. Figure 4.30illustrates the tension profiles observed for cotton, wool, and polyester when groupsof fibers are pulled from different shape tufts; i.e., the tensile property of tufts. Onpulling a fiber, any slack or crimp in the freed length is first removed, and fibertension then occurs. The induced tension increases and peaks at the point where thefiber is fully released from its entanglement with other fibers. The tension decreasesas the fiber slips past other fibers, reaching zero as its trailing end leaves the tuft.If the fiber breaking strain was lower than the strain at peak tension, the fiber wouldhave broken, and the fall-off would be more immediate. Work by Li et al.42 showedthat the withdrawal forces needed to separate an entangled fiber mass were largelydependent on the density of the mass and the contact angle fibers made with thewire clothing.
With respect to Figure 4.30, the elongated tufts had the lower density and fibersmore aligned to the direction of the applied pulling force. The fibers would thereforehave a lower degree of entanglement. The smaller, rounded tufts were more densewith fibers more entangled. The latter, consequently, required a greater withdrawalforce. Because of their surface scales and longer length, the wool fibers had greaterentanglement and interfiber frictional contact than the other fibers, resulting in ahigher withdrawal force.
Townend and Spiegel studied the effect of alterations in the state of wool onfiber breakage in worsted carding.5 They found that the main cause of fiber breakagewas the entangled state of the scoured wool fed to the card. Bownass43 found that,if there is a high degree of entanglement, then even removing fibers by hand forstaple length measurements can result in breakage, although the utmost care mayhave been taken. In woolen spinning, stock-dyeing can be result in substantialreduction in fiber length at the card, as a result of fiber entanglement, particularlywith the use of high dye-liquor circulation pressures. In general, however, lessbreakage occurs when wool is carded at regains greater than 20%. The fibers aremore extensible at high regains, which lowers the chance of breakage as they aredisentangled during carding.
4.4.3 EFFECT RESIDUAL GREASE AND ADDED LUBRICATION
With a highly entangled state of scoured wool, progressive loosening of entangle-ments is of benefit. This would require a value of fiber-pin friction that enables fibersto be easily caught by the pin or saw-tooth clothing yet allows fibers to slip fromthe pin if the entangled parts are insufficiently loose for the fiber to be released beforeits breaking strain is reached. Bownass,43 Henshaw,45 and Eley and Harrowfield46
© 2003 by CRC Press LLC

5000
4500
4000
3500
3000
2500
2000
1500
1000
500
0
−500−10 0 10 20 30 40 50 60 70 80 90 100 110 120
Elongation (mm)
50000
45000
40000
35000
30000
25000
20000
15000
10000
5000
0
−5000−10 0 10 20 30 40 50 60 70 80 90 100 110 120
Elongation (mm)
Polyester: Tuft from Lap 590 g/mWool: Tuft from Lap 480 g/m
TuftTuft
Elongation (mm)
Cotton: Tuft from Lap 495 g/m
Tuft
Bre
akin
g Fo
rce
(gf)
/Tuf
t Wei
ght (
g)
30000
27500
25500
22500
20000
17500
15000
12500
10000
7500
5000
2500
−2500
0
100 20 30 40 50
Gange Length 40 mmEffiective Tuft Weight 0.0252 gGange Length 30 mmEffective Tuft Weight 0.0169 gGange Length 20 mmEffective Tuft Weight 0.0101 gGange Length 10 mmEffective Tuft Weight 0.0067 gPolyester Fiber
Gange Length 10 mmEffiective Tuft Weight 0.0054 gGange Length 20 mmEffective Tuft Weight 0.0086 gGange Length 30 mmEffective Tuft Weight 0.0094 gGange Length 40 mmEffective Tuft Weight 0.0136 gFine Woolfiber
Gange Length 10 mmEffiective Tuft Weight 0.0048 gGange Length 20 mmEffective Tuft Weight 0.0069 gGange Length 30 mmEffective Tuft Weight 0.0089 gGange Length 40 mmEffective Tuft Weight 0.0136 gCotton Fiber
FIGURE 4.30 Fiber pull-out tension profiles.
© 2003 by CRC Press LLC

report the benefit of residual grease content and added lubrication to reduce woolfiber-metal friction in carding. In worsted carding, keeping fiber breakage to aminimum is an essential requirement and, in practice, besides card sliver fiber-lengthcharacteristics, the mean fiber length or hauteur of the resulting combed top, the tear,and the percentage noil are often used as indicators of “good” or “bad” carding.Doubts have been expressed5 over whether combing is sensitive enough to facilitatea precise measure of fiber breakage in carding, but there is sufficiently close corre-lation for the stated parameters to be used.
General findings tend to show that, with a residual grease content ranging from0.3 to 0.9%, and added lubrication of 0.3 to 0.6%, wools of low residual greasecontent suffer the most breakage. However, higher grease content tends to be asso-ciated with poor color and may be unsuitable for dry-combed tops, as backwashingdoes not readily reduce the grease content. The addition of lubrication very notice-ably reduces fiber breakage, especially at low residual grease levels, with the furtheradvantage that added lubrication can usually be removed in backwashing. Increasingcard production rate increases fiber breakage and percentage noil, but added lubri-cation can reduced this effect. There is agreement in the literature that about 0.5%on weight of fiber is about the optimal level.
The viscosity of the lubricant is also of importance. While fiber-fiber friction isindependent of lubricant viscosity, fiber-pin friction increases with viscosity. There-fore, the work done in sliding a fiber around pin surfaces also increases. Too higha lubricant viscosity causes surface tension forces to militate against a fiber easilysliding from around a tooth, and this can result in increased fiber breakage. Exper-imental findings have led to the conclusions that the optimal viscosity for wool isaround 20 centipoise.44
4.4.4 EFFECT OF MACHINE PARAMETERS
4.4.4.1 Tooth Geometry
With wool fibers, saw-tooth clothing is more damaging than pin clothing, but saw-tooth wire has a low fiber breakage when the card clothing is sharp and smooth.5
Gharehaghaji et al.,46–50 studying the damage caused to wool fibers by saw-toothand pin clothing, found that in addition to actual fiber breakage, micro-damage alsooccurs, which can subsequently lead to rupture. The damage by saw-tooth clothingwas more severe. Appendix 4B.3 gives a brief review of the type micro-damagefound.
4.4.4.2 Roller Surface Speed/Setting/Production Rate
Yan and Johnson51,52 found that, if the surface speed of the roller is very high, fiberscan be damaged and broken by the impulsive force (see Appendix 4B). Generally,fiber breakage is dependent on the interaction of roller speed and production rate.
The Taker-in ZoneThe equation for the degree of opening indicates that high taker-in speeds give betterfiber opening, and the trend (described earlier) of a decreased number of tuftlets and
© 2003 by CRC Press LLC

increased amount of individual fibers with increased taker-in speed agrees with theequation. There is, however, the practical limitation of fiber damage, which restrictsthe maximum taker-in speed that can be used.
Fibers hooked by the taker-in teeth while their trailing lengths are either heldin the nip of the feed system or entangled in the batt mass will be stretched at a rateequal to the surface speed of the taker-in. The fibers will break if their trailing endsare not released or if their hooked lengths do not slip from the taker-in teeth beforethey reach their breaking extensions (see Appendix 4B). Since fiber entanglementis likely to be greater in tufts fed to the taker-in than in tuftlets fed to the cylinder,it may be reasoned that significant fiber breakage can occur at the taker-in zone. Itis also reasonable to assume that, with a given feed roller speed, the higher the taker-in speed, the greater the chance of fiber breakage because of the increased rate ofextension. Honold et al.53, Krylov,13 and Artzt et al.54 found that, when processingcotton fibers, increasing the taker-in speed up to 1,380 rpm did not significantlyincrease fiber shortening. This may be attributed to hooked lengths slipping fromthe taker-in teeth. However, the level of breakage is also dependent on productionrate and the setting of batt fringe to the taker-in.
The effect of speed depended on production rate. Figure 4.31 shows that, withhigh production rates achieved by increased sliver counts and constant output speed,fiber breakage increases with taker-in speed. It was also found that, because of theshorter distance to contact with the taker-in clothing, fibers on the upper surface ofthe batt fringe were more easily broken as compared with those at the bottom surface.Townend and Spiegel5 and Townend55 report that, in worsted carding with a single-pair roller feed to the taker-in, the greatest amount of fiber breakage occurred at thetaker-in due largely to the entangled state of scoured wool. Increases in the produc-tion rate and taker-in speed lead to significant increases in fiber breakage.
This interaction of taker-in speed and production rate on fiber breakage is afurther illustration of the effect of fiber entanglement. The increased production rate
70
69
68
67
66
65
64
63
62
0 200 400 600 800 1000 1200 1400 1600 1800
Taker-In Speed (r/min)
200−200 400 600 800 1000 1200 1400 1600 1800
Taker-In Speed (r/min)
CV
% o
f L
engt
h D
istr
ibut
ion
0
21
22
23
Mea
n Fi
ber
Len
gth
by W
eigh
t [m
m]
3.7 ktex
4.8 ktex
6.7 ktex
FIGURE 4.31 Effect of taker-in speed and sliver count on fiber length.
© 2003 by CRC Press LLC

was achieved by increased mass per unit area of the batt feed. This results in greaterwithdrawal forces and fiber extensions and hence a greater chance of fiber breakage.Eley and Harrowfield45 found that, for fixed batt density, fiber breakage was inde-pendent of production speed. Thus, if increased production speed is required, it islikely to be less damaging to fibers if the material is processed, within practicallimits, at a lower batt mass and higher feed rates than the converse. Haigh andHarrowfield60 found that, with the triple–merelle feed to the worsted card, changesin taker-in speed and setting had only a negligible effect on hauteur and percentagenoil. The triple-merelle feed presents a more opened, less entangled fiber mass tothe taker-in. Eley and Harrowfield’s work supports the view that, with triple feedrollers, fiber breakage in worsted carding is more likely to occur at the swift-workerinteraction. Their findings suggest that the forepart (i.e., taker-in and breast section)and morels have a much smaller effect on fiber breakage than the swift-doffer section.
Effect of Cylinder-Flats and Swift-Worker Interaction
Van Alphen56 reports that, in revolving flat cards, increased cylinder speed causedmore fiber breakage than increased taker-in speed and that this is reflected in yarnstrength. Rotor yarn tenacity was reduced by up to 5% with increasing cylinderspeeds between 480 and 600 rpm, whereas ring spun yarns showed a 5% reductionfor speeds between 260 and 380 rpm and 10% at 600 rpm. The higher sensitivityof ring spun yarns to fiber breakage is attributable to the negative effect of shortfibers during roller drafting. Krylov13 found no evidence of fiber shortening at speedsup to 380 rpm, which suggests the influence of other factors such as flat-setting.Force elongation profiles from experiments simulating the shearing action betweenflats and cylinder clothing have been reported by several authors.57–59,63 It was foundthat the tension induced on fibers increased with speed but that the rate of increasewas much greater for close flat settings. The closer the setting, the higher the pressureon the fiber mass between the cylinder and flats, and the more compact the masswill be, including the entangled areas. A greater withdrawal force is then needed,and therefore there is a greater the chance of fiber breakage.
Similar to the cylinder-flat combination, fiber breakage increases with close-ness of swift-worker settings,5 depending on how well opened is the fiber massfed to the swift. Closer settings, however, improve the individualization of fibers,and this leads to less breakage in combing and a reduction in the percentage noil.Usually, the worker setting decreases as we move toward the doffer; therefore, thesetting of the final worker is the most critical. For a given final worker setting,Haigh and Harrowfield60 found that, in worsted carding, increasing the number ofworkers on the swift-doffer section reduced the percentage noil and increased fiberlength. This indicates that a progressive increase in carding action is beneficial.Townend’s work in woolen carding showed similar findings in that more gentlecarding was obtained as the number of working points increased. Unlike thecylinder-flat combination, the effect of swift-worker speed ratio is complex. Wesaw earlier that the retaining power, p, of a worker increases with worker speedand more work ill be done on the fiber mass. Despite the increased work, fiberbreakage and noil were observed to decrease with worker speed up to an optimalspeed ratio of between 40 and 80.
© 2003 by CRC Press LLC

REFERENCES
1. Artz, P. and Schreiber, O., Fiber strain in high efficiency cards due to the licker-inat production rates above 30 kg/hr, Melliand Textilberichte, Eng. ed., 2, 107–115,1973.
2. Dehghani, A., Lawrence, C. A., Mahmoudi, M., Greenwood, B., and Iype, C., Fibredynamics in a revolving-flats card: An assessment of changes in the state of fibremass during the early stages of the carding process, J. Text. Inst., 91, 359, 2000.
3. Niitsu,Y., Nazaki, C., Mineo, Y., Ando, K., Hasegawa, S., and Kimura, H., Cleaningaction in the licker-in part of a cotton card, part 1: Opening action in the licker-inpart., J. Text. Mach. Soc. Japan, 10, 218–228, 1964.
4. Fujino, K. and Itani, W., Effects of carding on fibre orientation, J. Text. Mach. Soc.Japan, 8(1), 1–8, 1962.
5. Townend, P. P. and Spiegel, E., Fibre breakage in worsted carding, J. Text. Inst., 37,T58.–76, 1946.
6. Bogdan, J. F., The control of carding waste, Text. Res. J., 25, 377, 1955.7. Hodgson, R., Cotton carding: A preliminary study, Shirley Inst. Memoirs, Series A,
III(7), 1934.8. Varga, V., Varga, M. J., and Cripps, H., A theory of carding, Crosrol UK Ltd., 1995,
1–20.9. Oxley, A. E., The mechanism of the carding engine and the results obtained with
simplified cards in various mills, Shirley Inst. Memoirs, August, 24–27, 1989.10. Sengupta A. K., Vijayaraghavan N., and Singh A., Studies on carding force between
cylinder and flat in a card: part 1: Effect of machine variables on carding force, IndianJ. Text. Inst., 8, 59–63, September 1983.
11. Artzt, P., Textiling, E. B., and Maidel, H., Influence of various card clothing param-eters on the results obtained in high-speed carding of cotton, Melliand Textilberichte,Eng. ed., 789–796/707–713, October 1985.
12. Martindale, J. G., The distribution and movement of wool on woollen cards, J. Text.Inst. (transactions), T213–T227, 1945.
13. Krylov, V. V., Some theoretical and experimental data concerning the design of high-speed cotton cards, Technol. of Text. Ind., USSR, 2, 47–53, 1962.
14. Kaufman, D., Studies on the revolving-flat card, Textil Praxis, 16(3), 1073–1096,1193–1199, 1961; 17(4), 13–19, 111–117, 1962; 17(4), 1962, 326–336; 17(5), 1962,437–443; 17(6), 1962, 539–546; 17(7), 1962, 646–656; 17(8), 1962, 760–769; 17(10),1962, 982–989; 18(11), 1962, 1094–1100; 17(12), 1962, 1207–1212.
15. Townend, P. P., Some factors governing the transfer of material to a worker from aswift, J. Text. Inst. (transactions), T385–T393, December 1948.
16. Kamogawa, H., Kanda, E., and Imai, H., A study on card by means of high speedmotion pictures, J. Text. Mach. Soc. Japan, Eng. ed., 8(4), 19–27, 1962.
17. Lauber, M. and Wulfhorst, B., Non-contact gauging of the fibre flow during cardingand drafting of cotton, Melliand Texilberichte, 5, E77–E78/294–298, 1995.
18. Viellier, P. and Drean, J. Y., Carding action in a modern short-staple card, Text. PraxisInternational, Eng. ed., I–IV, 1063–1067, October 1989.
19. Sengupta, A. K., and Chattopadhyay, R., Change in configuration of fibres duringtransfer from cylinder to doffer in a card, Text. Res. J., 52, 178, 1982.
20. Morton, W. E. and Summers, R. J., Fibre arrangement in card slivers, J. Text. Inst.,40, 106, 1949.
21. Simpson, J., Relation between minority hooks and neps in card web, Text. Res. J.,42(10), 590–591, 1972.
© 2003 by CRC Press LLC

22. Ghosh, G. C. and Bhaduri, S. N., Transfer of fibres from cylinder to doffer duringcotton staple-fibre carding, Text. Res. J., 39(4), 390–392, 1969.
23. Woollen Carding, WIRA/British Textile Technology Group, Leeds, U.K., 1968.24. Dehghani, A. A., Lawrence, C. A., and Mahmoudi, M., Fibre transfer in short-staple
carding (in press).25. Ghosh, G. C. and Bhaduri, S. N., Studies on hook formation and cylinder loading
on the cotton card, Text. Res. J., May, 535–543, 1966.26. Simpson, J. and Fiori, A. L, Effect of mixing cottons differing in micronaire reading
and carding variables on cotton sliver quality, yarn properties, and end breakage, Text.Res. J., 44(5), 327–331, 1974.
27. Simpson, J. and Fiori A. L, Some relationships of cotton micronaire reading andcarding parameters to card loading, sliver quality, and processing performance, Text.Res. J., August, 691–696, 1971.
28. Simpson, J., DeLuca, L. B., and Fiori A. L, Effect of carding rate and cylinder speedon fibre hooks and spinning performance for irrigated acala cotton, Text. Res. J., 37,504–509, 1967.
29. Simpson, J., Fiori, A. L, Castillion, A. V., and Little, H. W., Effects of blends ofmedium-staple low and high micronaire reading cottons, sliver weight, and cardingrate on card loading, sliver quality, and processing performance, Text. Res. J., Novem-ber, 661–666, 1972.
30. Simpson, J., and Patureau, M. A., A method and instrument for measuring fibre hooksand parallelisation, Text. Res. J., 40, 956–957, 1970.
31. De Barr, A. E. and Watson, K. J., Some experiments with radioactive tracer fibres ina flat card, J. Text. Inst., 49, 588–607, 1958.
32. Baturin, Y. A., The effect of the number of passes in carding on web quality, Technol.of Text. Ind., USSR, 5, 50–55, 1964.
33. De Swaan, A., The function of the doffer in carding, J. Text. Inst., 42, 209–212, 1951.34. Emmanuel, M. V. and Katser, B. M., Fibre shedding from the card cylinder, Technol.
of Text. Ind., USSR, 2, 44–48, 1964.35. Baturin, Y. A., The load of the carding surfaces and the proportion of fibre transferred
between the surfaces, Technol. of Text. Ind., USSR, 4, 37–43, 1964.36. Karasev, G. I., On the efficient utilization of the cylinder clothing of the card, Technol.
of Text. Ind., USSR, 3, 159–162, 1964.37. Singh, A. and Swani, N. M., A quantitative analysis of the carding action by the flats
and doffer in a revolving-flat card, J. Text. Inst., 64, 115–123, 1973.38. Singh, A. and Swani, N. M., The carding action in a revolving-flat card–reply, J. Text.
Inst., 64, 329, 1973.39. Borzunov, I. G., Analysis of the accumulating action of the card, Technol. of Text.
Ind., USSR, 2, 39–43, 1968.40. Buturovich, I. K. H., Analysis of the equalising action of the flat card from the
frequency characteristics, Technol. of Text. Ind., USSR, 1, 38–43, 1968.41. Cherkassy, A., Analysis of the smoothing effect of the card cylinder using simulation,
Text. Res. J., 65(12), 723–730, 1995.42. Li, B., Johnson, N. A. G., and Wang, X., The measurement of fibre-withdrawal forces
in simulated high-speed carding, J. Text. Inst., 2(87), 311–320, 1996.43. Bownass, R., Fibre breakage in early worsted processing, Proc. Int. Wool Text. Res.
Conf., Australia, E, 203–215, 1955.44. Henshaw, D. E., The role of a lubricant and its viscosity in worsted carding, J. Text.
Inst. (transactions), December, T537–553, 1961.
© 2003 by CRC Press LLC

45. Eley, J. R. and Harrowfield, B. V., Reduced fibre breakage in continental worstedcarding as a result of wool lubrication, J. Text. Inst., 4, 274–281, 1986.
46. Gharehaghaji, A. A. and Johnson, N. A. G., Wool-fibre micro-damage caused byopening process; part I: Sliver opening, J. Text. Inst., 3(84), 336–347, 1993.
47. Gharehaghaji, A. A. and Johnson, N. A. G., Wool-fibre micro-damage caused byopening process, part II: A study of the contact between opening elements and woolfibre in controlled extension, J. Text. Inst., 3(86), 402–414, 1995.
48. Gharehaghaji, A. A. and Johnson, N. A. G., Wool-fibre micro-damage caused byopening process, part III: In-situ studies on the tensile failure of damaged-inducedfibres, J. Text. Inst., 1(90), 1–22, 1999.
49. Gharehaghaji, A. A. and Johnson, N. A. G., Wool-fibre micro-damage caused byopening process, part IV: In-situ SEM studies on the compressive micro-damage andfailure of wool fibres looped around opening elements, J. Text. Inst., 1(90), 23–34,1999.
50. Gharehaghaji, A. A. and Johnson, N. A. G., Wool-fibre micro-damage caused byopening process, part V: The effect of compressive damage on fibre strength, J. Text.Inst., 1(90), 34–46, 1999.
51. Yan, Y. and Johnson, N. A. G., The behaviour of fibres struck by high-speed pins,part I: Theory, J. Text. Inst., 1(83), 1–14, 1992.
52. Yan, Y. and Johnson, N. A. G., The behaviour of fibres struck by high-speed pins,part II: Experiment, J. Text. Inst., 1(83), 15–23, 1992.
53. Honold, E. and Brown, R. S., Text. Bull., 12, 93, 25, 1967.54. Arzt, P., and Schreiber, O., Fibre strain in high efficiency cards, due to the licker-in
at production rates above 30 kg/h, Melliand Texilberichte, Eng. ed., February, 94–101,1973.
55. Townend, P. P., Emulsion oiling of merino wool, J. Text. Inst. (transactions), March,T31– T36, 1940.
56. Van Alphen, W. F., The card as a dedusting machine, Melliand Textilberichte, Eng.ed., 12, 1523, 1980.
57. Grosberg, P., Strength of twistless sliver, J. Text. Inst., 54, T223 –T233, 1963.58. Taylor, D. S., Measurement of fibre friction and its application to drafting force and
fibre control calculations, J. Text. Inst., 46, P59–P81, 1955.59. Wood, E. J., Stanley-Boden, P., and Carnaby, G. A., Fibre breakage during carding,
part II: Evaluation, Text. Res. J., 54, 419–424, 1984.60. Haigh, M. G. and Harrowfield, B. V, The effect of settings and speeds throughout
the worsted card on combing performance, J. Text. Inst., 81(3), 227–240, 1980.61. Simpson, J., Observations for improving cotton carding, Text. Res. J., January,
103–104, 1968.62. Brown, R. S., Rhodes, P. L., and Miller, A. L., The effect of production rate on card
loading, Text. Bull., 92(11), 30–32, 1966.63. Kato, M., Sakaoku, K., and Yoshida, K., Measuring the degree of
opening of a tuft, J. Text. Mach. Soc. Japan, December, 35–38, 1960.
© 2003 by CRC Press LLC

APPENDIX 4A
Consider the simple case of only the swift-doffer–licker-in interaction. Then, therate of increase of the output, Q1, at time, t revolutions, after the input change willbe proportional to the difference between the input, QLC, and output, the constantof proportionality being K. Thus,
The solution is Q1 = QLC 1 – exp (–Kt).To obtain an approximation for the effect of having workers present, we can
assume that F is the swift-doffer transfer coefficient of a card or series of cardswithout workers, which results in the equivalent delay factor when workers arepresent. That is, for example, for three cards,
F is termed the equivalent transfer coefficient.
dQ1
dt--------- K QLC Q1–[ ]=
Q1 QLC 1 Ft–( )exp– =
1F--- D
1K---- 1
n1 p1
1 p1–[ ]-------------------
n2 p2
1 p2–[ ]-------------------
n3 p3
1 p3–[ ]-------------------+ +
+= =
© 2003 by CRC Press LLC

APPENDIX 4B
The Opening of a Fibrous Mass
4B.1 REMOVAL OF FIBERS WHEN BOTH ENDS ARE EMBEDDED IN THE FIBER MASS
The impulsive force, FN, of the tooth acts on the fiber mass in the direction tangen-tially to the arc I and can be resolved into the components FP and FT. The formeris a result of the penetration of the tooth into the fiber mass, and the latter is theforce that pulls fibers from the mass (see Figure 4B.1). As the tooth begins to removefibers, there is a resisting force, FR, from the cohesiveness of the fiber mass. Thisis attributable to fiber entanglement, interfiber friction, and the elastic compressiveand tensile properties of the fiber mass. As illustrated in the diagram, a componentof FR causes fibers to slide along the tooth and become held by it. This occursprovided that
FIGURE 4B.1 Forces present during fiber removal from tufts.
VL
FP
FR cos β
FR
I
FT
FN
ϕ
β
FR sin β
θ
FR βsin µFR βcos>
© 2003 by CRC Press LLC

Hence,
where µ = coefficient of fiber friction against a toothφ = friction angle
To initially hold fibers within the fiber mass, the working angle of the tooth theo-retically must be
Once the tooth catches fibers, they are accelerated from the surface speed, VF,of the machine component holding the fiber mass to the surface speed of the rollerfrom which the tooth projects, VL. It is during this acceleration that fibers can bebroken, depending on the distance from the holding point to the contact point withthe tooth, their orientation relative to direction of VL, and also depending on themagnitude of FR and VL.
Fibers in tufts or tuftlets have various configurations and are likely to be inclinedat an angle to the direction at which the fiber mass moves through the card, i.e., themachine direction. Figure 4.29 shows what may occur when a tooth makes contactwith a fiber inclined laterally at an angle, α. When the tooth moves from position(a) to (b) in the figure, the contact point is accelerated to reach the surface speed ofthe taker-in. The tooth will deflect the fiber length between the contact and nippoints, Ls, to cause an angular change of, say, ∆α per unit time. In deflecting thefiber, components FT1 and FT2 of force FN have to overcome the components of theresisting force FR (not shown) caused by contact with other fibers. FT1 is responsiblefor the fiber wrapping around the tooth. A normal force, N = f(FR), will develop atthe front of the tooth. The friction force, µN, will resist the fiber slipping from thegrip of the tooth. If the fiber is still nipped, the tooth will stretch the length Ls at arate equal to VL cosec (α + ∆α). The increasing tension in the fiber length increasesthe component force FT2. If FT1 exceeds µN, the fiber will slip from around the toothand remain in the fringe to be processed by another tooth until ultimately removed.It should be noted that, if a fiber undergoes numerous stretch-and-slip cycles thatinduce permanent fiber strain, the fiber may break before being removed from thefringe.
If FT1 is less than µN, and the contact is made near the holding point, then theincrease in α per unit time will be high, and Ls will undergo large extension per unittime and reach its breaking extension before slipping from the tooth.
4B.2 BEHAVIOR OF A SINGLE FIBER STRUCK BY HIGH-SPEED PINS
Figure 4B.2 shows a fiber with its trailing end held and its leading end free, beingstruck at angle α by a pin (or sawtooth) projecting from a rotating roller and travelingat a speed of VL.
βtan φtan>
θ β ϕ φ ϕ+>+=
© 2003 by CRC Press LLC

L L LVL
V
VL
t = 0
TransverseWave Front
TensionStrain Front
TransverseWave Front
A′
B′
C′
B
A
C
O
α
α α α
C−
A−
Time
(a) (b) (c) (d)
FIGURE 4B.2 Force elongation profiles.
© 2003 by CRC Press LLC

From experimental observations,1 it can be assumed that, at very short timeintervals after impact, the fiber-pin interaction causes the fiber to adopt the config-urations (a) through (d) shown. Figure 4B.2 also shows a tension curve for (a), whichillustrates the suddenly induced tension in the trailing length with pin impact. Sincestrain is a function of tension, ε = f (σA), a similar shape strain curves would thereforeapply for (b) to (d) as the fiber continues to be strained.
• On impact, the fiber is deformed into a V shape with the apex at theimpact point and with both sides of the V shape straight. Air resistancehas no significant effect.2–5 The radius of curvature, R, subsequentlyformed by A, B, C will depend on the fiber stiffness according to
where E = Young’s modulus
I = moment of inertia
EI = flexural rigidity
M = bending moment
• At the deformation, the fiber is strained
• This axial strain, resulting from the impact, propagates along the fibertoward both ends with a velocity6
where E = Young’s modulus of the fiber for high strain ratesρ = fiber density
• After a time, the pin travels from B to B′, and the distance traveled bythe strain front is ν1∆t. A moves to A′, and C moves to C′. The fiberstretches to accommodate the increased distance traveled by the pin.Therefore, more of the fiber length outside the impact zone becomesstrained so that, behind the strain front, all parts of the fiber stretch at thespeed ν0, and the level of strain between the pin and the strain front is ε.Thus, ε = νο∆t/ν1∆t = νο/ν1.
• Since , there must be a limiting pin speed at which ε = εb
the fiber breaking strain. At this pin speed, the fiber breaks immediatelyat the point of impact.
R EI /M=
εoABCAC
------------ 1–=
ν1 E/ρ[ ]=
νo f V L( )=
© 2003 by CRC Press LLC

• In addition to the strain wave, the motion of the pin produces a transversewave that spreads to both ends of the fiber. The general equation for thespeed of transverse propagation is
where T = tension = σΑµ = fiber linear densityA = fiber cross-sectional areaρ = µ/A
• The ratio , so the strain front reaches the fiber ends wellbefore the transverse wavefront, and this causes the length between thetransverse wavefront and free fiber end to move up pass the pin beforethe transverse wave reaches the fiber end. Therefore, the fiber becomeshooked around the pin.
4B.3 MICRO-DAMAGE OF FIBERS CAUSED BY THE OPENING PROCESS
During the separation of a fiber mass into smaller groups or individual fibers, theforces resulting from contact between the metal clothing and the fibers can causelocalized complex stress patterns inside fibers that result in microdamage. Thedamage is more severe with saw-tooth than pin-type clothing.
For example, the types of damage observed with wool fibers included8–11
1. Transverse and longitudinal cracks. These are attributed to the presenceof micro-defects reducing the local elastic properties of the fiber.
2. Rupture and partial rupture of scales, resulting from the sliding action ofpins or sawteeth along the lengths of fibers. Repeated sliding action causessurface abrasion, and this would take place where a fiber mass is held andthe clothing of the opening device repeatedly combs through fringe at ahigh speed to remove individual or groups of fibers. Fibers that areremoved after repeated combing show surface abrasion.
3. Puncture holes, giving a honeycomb appearance. These are caused by thepoints of the clothing and, therefore, are more frequently found with pinrather than saw-tooth clothing.
4. Small flattened areas. These are due to compressive stresses over thecontact area. This suggests a similar action to Hertzian contact stresstheory.12
Figure 4B.3 gives examples of some micro-damage seen in wool fibers. Woolfibers are especially prone to damage because of their unique composite structure.8
Such micro-damage can lower the breaking load of fibers and lead to prematurebreakage in subsequent process stages.
νt T /µ( ) σ/ρ( ) Eεo= = =
νt/ν1 1/√εo=
© 2003 by CRC Press LLC

REFERENCES
1. Yan, Y. and Johnson. N. A. G., The behaviour of fibers struck by high-speed pins,part II: Experiment, J. Text. Inst., 83(1), 15, 1992.
2. Yan, Y. and Johnson. N. A. G., The behaviour of fibers struck by high-speed pins,part I: Theory, J. Text. Inst., 83(1), 1, 1992.
3. Li, B., Johnson, N. A. G., and Wang, X., The measurement of fibre-withdrawal forcesin simulated high-speed carding, J. Text. Inst., 87(2), 1996.
4. Petterson, D. R., Stewart, G. M., Odell, F. A. and Maheux, R. C., Dynamic distributionof strain in textile materials under high speed impact, part I: Experimental methodsand preliminary results on single yarns, Text. Res. J., 30, 411, 1960.
5. Jameson, J. W., Stewart, G.M., Petterson, D.R., and Odell, F. A., Dynamic distributionof strain in textile materials under high speed impact, part III: Strain-time positionhistory in yarns, Text. Res. J., 32, 858, 1962.
FIGURE 4B.3 Examples of wood fiber damage during carding.
© 2003 by CRC Press LLC

6. Smith, J. C., Fenstermaker, C.A., and Shouse, P. J., Stress-strain relationship in yarnssubjected to rapid impact loading, part XI: Strain distribution resulting from riflebullet impact, Text. Res. J., 35, 743, 1965.
7. Lyons, W. J., Impact phenomena in textiles, MIT Press, Cambridge, MA, l962.8. Gharhaghaji, A. A. and N. A. G. Johnson, Wool-fiber micro-damage caused by
opening processes, part I: Sliver opening, J. Text. Inst., 84(3), 33, 1993.9. Gharhaghaji, A. A. and Johnson, N. A. G., Wool-fiber micro-damaged caused by
opening processes, part II: A study of the contact between elements and wool fiberin controlled extension, J. Text. Inst., 86(3), 403, 1995.
10. Gharhaghaji, A. A. and Johnson, N. A. G., Wool-fiber micro-damage caused byopening processes, part III: In-situ studies on the tensile failure of damaged-inducedfibers, J. Text. Inst., part 1, 90(1), 1, 1999.
11. Gharhaghaji, A. A. and Johnson, N. A. G., Wool-fiber micro-damaged caused byopening processes, part IV: In-situ studies on the compressive micro-damage andfailure of wool fibers loped around opening elements, J. Text. Inst., part 1, 90(1), 22,1999.
12. Timoshenko, S. P., Theory of elasticity, 3rd ed., McGraw-Hill, New York, l970.
© 2003 by CRC Press LLC

Materials Preparation Stage III: Drawing, Combing, Tow-Top Conversion, Roving Production
In Chapter 3, a card sliver was described as a thick, untwisted rope of fairly randomlyoriented fibers of various configurations. Depending on the fiber fineness, a cardsliver of, say, 4 to 6 ktex may have of the order of 20,000 to 30,000 fibers at eachcross section throughout its length. In comparison, yarns of 5 to 200 tex may havearound 50 to 500 fibers in their cross sections. To produce yarns of such counts andwith acceptable properties, fibers in a card sliver have to be straightened, aligned,and parallelized so that the sliver count can be appropriately reduced to obtain therequired yarn count during spinning. The processes within stage III are the usualsteps employed in preparing the carded material for spinning.
5.1 DRAWING
Definition: Drawing is the term applied to the operation involving the doublingand roller drafting of slivers.
Definition: Doubling is the combination of several slivers that are then attenuatedby a draft equal in number to the slivers combined, thereby resulting inone sliver of a similar count.
Definition: Roller drafting is the process of attenuating the count of a materialusing a combination of pairs of rollers.
Before describing the basic features of drawing machines, it useful to consider theprinciples of doubling and roller drafting, particularly as the latter is also applicableto roving production (which is one of the stage III processes) and to several of thespinning processes described in Chapter 6.
5
© 2003 by CRC Press LLC

5.1.1 PRINCIPLES OF DOUBLING
This involves placing several slivers in parallel (usually 6 or 8) and roller draftingthe combination using a draft equal to the number of juxtaposed slivers. Doublingserves two purposes. It enables the reduction of sliver irregularity and improves theblend or mix of the fibers.
The effect on sliver irregularity can be explained by a simple example. Assumethe measured average counts of cotton slivers from a set of six cards are 4.85,4.95, 5.25, 5.42, 5.05, and 5.13 ktex with the cards being set to give a (calculated)count of 5 ktex. Although some of the sliver counts are close to the set count, thespread may be outside the required limits. If these slivers are combined andattenuated by a draft of six, the resulting sliver count would be 5.1 ktex. The sumtotal length of the original six slivers would therefore be much closer to set count.We refer to the 5-ktex sliver as the outcome of a doubling of 6. Let the followingbe the sliver counts of five lots of six slivers resulting from five similar doublingsof 6: 5.15, 5.09, 5.05, 4.95, and 5.12 ktex. Then, doubling these along with the5.1 ktex sliver would result in a sliver count of 5.08 ktex. This would be theoutcome of a doubling of 36 of the original slivers. A third repeat would give adoubling of (6 × 6 × 6) = 216. In general terms, the number of doublings is givenby the expression SR where S is the number of juxtaposed slivers and R is thenumber of repeats. Theoretically, the limiting value of R will be where no furtherreduction in the irregularity can be obtained. In practice R = 2 or 3 is usuallyaccepted as sufficient.
Since the measured sliver counts are based on 1- to 5-m lengths, then the aboveillustrates the effectiveness of doubling in reducing the medium- to long-term rangeof sliver irregularity. With respect to short-term irregularity, we will need to considerthe effect of doubling on what is termed drafting waves. This is dealt with in thenext section, on the principles of roller drafting.
To appreciate the blending effect of doubling, the physical meaning of SR willbe explained. Referring to our example of when S = 6 R = 1, if three of the six inputslivers were black in color and the remainder white, and the side-by-side combinationwas of alternating colors, then the output sliver would consist of six fiber ribbonsof alternating colors. Each ribbon would be one-sixth of the count of its originalsliver. The second repeat of doubling, when R = 2, would result in the output slivercomprising 36 fiber ribbons of alternating colors, each 1/36 of the count of its originalsliver. As fewer and fewer fibers of the same color are grouped together withsuccessive doublings, the general color of the output sliver turns grey. Figure 5.1illustrates visually the blending achieved by this procedure, and it can be seen thatR = 3 gives a reasonable blend. When considering a larger number of colors, thechosen values S and R will need careful consideration.1
5.1.2 PRINCIPLES OF ROLLER DRAFTING
The basic principles of roller drafting concern short-term irregularities, although (aswe will see later), in the early stages of applying roller drafting, autoleveling is usedto minimize medium- and long-term irregularities.
© 2003 by CRC Press LLC

In discussing the irregularity of textile materials, such as card slivers through toyarns, much of what is explained about the drafting of one material state is applicableto drafting of the others. It is therefore useful to explain the basic principles ofdrafting by referring to these different material forms in a general way, calling themlinear fibrous assemblies. The irregularity of an untwisted or twisted linear fibrousassembly is recognized by variations in its linear density or count and by variationin the thickness along its length. The latter is often visually conspicuous in yarns.
5.1.2.1 Ideal Drafting
In Chapter 1, it was explained that drafting involves reducing the linear density ofslivers and rovings through attenuation whereby fibers are made to slide past oneanother. It was also explained that drafting increases the irregularity of the material.The increase in irregularity is associated with the way in which fibers move throughthe drafting zone during their sliding action. To gain an understanding of this, it isuseful to consider first the case in which no increase in the irregularity should occur.This situation may be called ideal drafting.2
Figure 5.2 depicts a single-zone drafting arrangement. The material entering isreduced in thickness as it passes through the drafting zone. For ease of explanation,let us assume that the front rollers B run at three times the surface speed of the backrollers A. Let the fibers in the material be of the same mass Mf (in g) and length Lf
(= 3 cm), and let there be N fibers in a length L1 (in cm) of the material. Thus, theinput count of the material is
(5.1)
Figure 5.3 shows a section of sliver in which it is assumed that the fibers arearranged end to end in the material with a lateral spacing of a. Let us consider the
FIGURE 5.1 (See color insert following page 266.) Drawframe passages with eight-sliverfeed and a draft of eight. Example of blending by doubling and drafting: drawframe blending.
T inM f N105
L1
---------------------=
© 2003 by CRC Press LLC

movements of the fibers numbered 1 through 6. Successive pairs have their leadingends staggered by 1 cm. That is to say, the fiber pairs are equally spaced. This sizespacing is not realistic, but using it should help to make the description more easilyunderstood. When 1 and 3 reach the nip line BB′, 2 and 5 and 4 and 6 will be,respectively, 1 and 2 cm behind. On reaching the nip line BB′, 1 and 3 will beaccelerated to the surface speed of roller pair B. Since these rollers are three timesfaster than the roller pair A, then by the time fibers 2 and 5 reach BB′, 1 and 3 will
+
+
+
+
+
Nip Line
Nip Line
Wou
t
Win
LD, Drafting Zone
xy
+V1
V2A
B
FIGURE 5.2 Single-zone drafting arrangement.
L1
1 cm
WinWout
A´
A´
A´
B´
B´
B´
1
1
2
2
3
3
4
4
5
5
6
6
LDA
A
A
B
B
B
Win = Wout
Lf = 3 cm
x = 0.3 Lf
Draft 3 =V2V1
Drafted Length, L2 = 3 L1
FIGURE 5.3 Representation of perfect drafting.
© 2003 by CRC Press LLC

be leaving this nip line. However, 2 and 5 will be accelerated to the same speed as1 and 3 and will leave the nip line just as 4 and 6 arrive. Note that, when 4 and 6leave BB′ with the same speed as the previous fiber pairs, the distance between theleading ends of successive pairs has increased three times. This means that thedrafted sliver length L2 = 3L1. The number of fibers in L2 will still be N and themass of the drafted length NMf. Thus, the count has changed to
(5.2)
Although the input and output widths of the material are the same, the verticalinterfiber spacing has increased, indicating that the output must be lighter than theinput. However, the output retains the irregularity of the input, because the leadingends of the fiber pairs remain equally spaced.
The equal spacing between the fiber pairs is retained with drafting, because thefiber speed changes from that of the back rollers only when, simultaneously, thefiber leading ends are nipped by the front rollers A, and their trailing ends releasedby the back rollers, B. This is ideal drafting, and it does not cause an addedcomponent to the input irregularity. The effect of the perfect draft is to increase thedistance between the leading ends of fibers by the multiple of the draft. Therefore,any variations in the fiber distribution along the length of the input material merelyreoccur in the drafted length.
Thus far, we have considered the ideal drafting action from the view point thatthe total number of fibers in the length L1 must be present after drafting in L2. If thenumber of fibers in the cross sections of L1 and L2 are, respectively,
then
, or
where D = the applied draft
Figure 5.4 illustrates the changes in the number of fibers in the cross-sectionalong the drafting zone from the back to the front-roller nip lines. The length insidethe drafting zone of the fibers moving at the back roller speed will be equal to thosemoving at the front roller speed. These fiber groups are referred to as the back andfront beards. It follows that the total surface area of fibers moving with the backroller speed will be D times greater than the total surface area of fibers moving atthe front roller speed. The interfiber friction relating to the two surface areas accountfor the drafting force associated with the attenuation of the material.
T outM f N105
L2
---------------------T in
3-------= =
n1M f N105
L1
---------------------L f 10 5–
M f
---------------- and⋅= n2M f N105
3L1
---------------------L f 10 5–
M f
----------------⋅=
n2n1
3-----= n2
n1
D-----=
© 2003 by CRC Press LLC

Based on the concept of perfect drafting, El-Sharkawy et al.,3 used the followingassumptions to derive a simple relationship between the drafting force, F, the numberof fibers in the cross section of the input material, n1, the fiber length inside thedrafting zone, Lz , and the draft, D.
Two assumptions are made.
1. The drafting force is dependent on the level of interfiber contact betweenthe back and front beards.
2. The fiber arrangement in the input material conforms with the requirementfor perfect drafting, with n1 and the fiber-to-fiber contact being constantthroughout the length of the material.
From Figure 5.4, the taper of the back and front beards, respectively, are given by4
and
F will be proportional to the number of contact points between the two beards,which in turn are proportional to the sum of the areas A1 and A2.
AA′ BB′
Y′ Y
X
n1
n1/D
A1 A2
eLz
Lz
LD
Lz
FIGURE 5.4 Changes in the number fibers in the cross section from AA′ to BB′.
Y′ n1 1 xLz
-----– (from x 0 to Lz)= =
Y n1x eLz–( )
DLz
--------------------- (from x eLz to Lz)= =
A1n1Lz
2---------- D 1 e–( )2
D 1+( )2-----------------------= A2
n1Lz
2---------- 1 e–( )2
D 1+( )2--------------------=
© 2003 by CRC Press LLC

Hence,
(5.3)
where K = a constant of proportionality
5.1.2.2 Actual Drafting
During actual drafting, irregularities attributable to the characteristics of the fiberbeing processed and to machine defects are superimposed on that of the inputmaterial, thus making the drafted output of a higher unevenness.
Effect of Input Material CharacteristicsWe saw that, for perfect drafting, fibers in the input materials are assumed to bestraight and parallel. All are of the same length, with their leading ends equallyspaced, and those on the same horizontal line are placed with the leading end ofone following the trailing end of another. This may be consider the ideal fiberassembly for drafting. (Rao5 reports a mathematical model for the ideal sliver andits application to the theory of roller drafting, to which the reader may wish to refer.)In reality, we are aware that there is a distribution of fiber lengths in a card sliverand that these lengths are not straight, and not all are parallel. Owing to the lack ofstraightness and parallelism, it is more useful to consider the term fiber extent,illustrated in Figure 5.5.
Definition. Fiber extent is the distance between two planes that just encloses afiber without intercepting it, the planes being perpendicular to the generaldirection or axis line of the linear assembly of the fibers.6
Instead of the spacing between fiber leading ends, we can consider the spacingbetween leading ends of fiber extents, noting that, for a straight fiber, both are thesame. Figure 5.6 shows that the fiber configurations in card slivers observed byMorton and Summers7 and Sengupta and Chattopadhyay8 have differing fiber extents.Thus, there is unlikely to be equal spacing between leading ends of fiber extents inthe card sliver.
If the drafting zone length is set less than the longest fiber extent, then, in draftingthe card sliver, as the leading ends of these fiber extents are caught by the front
F Kn1Lz1 e–( )2
D 1+( )------------------=
Fiber Extent
FIGURE 5.5 Fiber extent.
© 2003 by CRC Press LLC

rollers, their trailing ends would still be held by the back rollers. Such fibers willbe stretched, with some reaching their breaking extension, but the result generallywill be groups of undrafted fibers in the output from the front drafting rollers. Thecombination of the front-roller speed and the recovery from stretch of longest extendfibers gives the effect of material spewing out from the front rollers.
Drafting Wave
If the drafting zone setting is such that the trailing ends of the longer extents arereleased just as their leading ends are nipped, then spewing does not take place.However, there will be fiber extents that are not nipped by either back or frontrollers. These may be called floating fibers. On being released from the back-roller nip, these floating fibers will initially travel at the back roller speed, buttheir subsequent speed of movement to the front rollers will depend on frictionalcontact with the surrounding fibers. The surrounding fibers that are nipped by thefront rollers will try to accelerate the floating fibers while the surrounding fibersnipped by the back rollers will tend to slow the floating fibers. Those floatingfibers that are in closer contact with the fibers nipped by the front rollers will bepulled as a group from those held back by the fibers nipped by the back rollers,and they will reach the front rollers earlier than in the ideal case. The front rollerstherefore accelerate a thicker group of fibers, leaving a thin length momentarilybehind. The fibers in the thin length subsequently reach the front-roller nip andare accelerated to leave momentarily a thicker length behind, and so the processis repeated.
Many floating fibers move prematurely with the speed of the front rollers, eitherby cohering or entangling with fibers that are positively gripped by the front rollers.The process is cumulative; the greater the number of fibers moving forward withthe speed of the front rollers, the more floating fibers are likely to be drawn forwardprematurely by interfiber cohesion. In this way, a comparatively large number offloating fibers will be drawn forward at one time to give a thick place in the issuingsliver, and this will be followed by a corresponding thin place that is a result of theloss of fibers by premature movement. The cycle will give rise to a periodic succes-sion of thick and thin places along the length of the material.
GroupI
GroupII
GroupIII
GroupIV
GroupV
Other
Direction of Sliver Delivery from the Card
FIGURE 5.6 Fiber configurations in doffer web and card sliver.
© 2003 by CRC Press LLC

Observations of Floating Fiber Motion
Several techniques9–13 have been used to study the motion of fibers in the draftingzone. Figure 5.7 illustrates the general findings. The figure depicts two things. First,the profile of the number of fibers in the cross section at intervals along the lengthof the material within the drafting zone AA′ to BB′. When compared with Figure5.4, a significant difference between the fiber distributions can be seen. This differ-ence is caused by the presence of floating fibers. Second, Figure 5.7 also shows thetypical change in speed of a floating fiber as it leaves the control of the back rollerpair, at time tb, and moves to the front rollers, where it is accelerated to the front-roller surface speed in a time tf. It can be seen that, between moments where a fiberleaves the back rollers and is directly accelerated by the front rollers, its average
CalculatedDraft = 5
FrontBeard
BackBeard
FloatingFibers
Frac
tion
of th
e To
tal N
umbe
r of
Fib
ers
in C
ross
Sec
tion
1.0
.4
.6
.8
.2
tbtf
Q
P
L D
V 2
V f
V 1
X
AA´ BB´
Time (t)
Vf = floating fiber speed
FIGURE 5.7 Changes in the number of fiber in the cross section within the drafting zonefrom AA′ to BB′.
© 2003 by CRC Press LLC

speed differs considerably from both roller pairs. This speed is not constant. Thisis because the fiber will depend on its contact with neighboring fibers, and there aremoments when forces from friction contact with the front beard cause the fiber toaccelerate and when the larger size back beard slows the fiber to near the back-rollerspeed. It was found that, although the speed limits P and Q in the drafting zone varyfrom fiber to fiber, the frequency distribution of the mean speeds over this regionof a large number of fiber observations had a narrow spread. This indicated theaverage speed to be similar for the majority of fibers.
The effect of floating fibers is to produce a succession of thick and thin placesin the output length where some fiber extents have been drafted in the ideal manner.The thick and thin variation has a sinusoidal waveform and is therefore called thedrafting wave.14 The drafting wave gives an irregularity additional to that of theinput irregularity.
Many studies have been made to develop quantitative explanations of draftingwave irregularity as a rigorous approach to drafting theory, from the viewpoint ofeither a mechanical process14,15 or the statistical nature of fiber movement15–20 basedon the assumption that the speed of floating fibers changes from back- to front-rollerspeed at some nonfixed point in the drafting zone. In this moving boundary concept,the movement of the change-point causes the irregularity. Several works haveinvolved using mathematical models in computer simulations of the drafting pro-cess.20–23 Both practical and theoretical studies have investigated wavelength andamplitude with regard to their dependence on such factors as size of draft, fibercharacteristics, and roller settings.
In practice, the amplitude and wavelength may be determined from Uster irreg-ularity measurements. However, both are very variable because of the irregularmotion of the floating fibers, and so it is simpler for the Uster CV% of the inputand output to be measured and compared. The difference between the squares ofthe CV% indicates the added irregularity attributable to the drafting wave, providedthat no irregularities resulting from machine faults (see below) are also present. Weshall take this approach in considering factors influencing the irregularity caused bythe drafting wave.
Drafting Force
Various sliver draftometers have been described in the literature for measuringdrafting forces.24–29 Some use sensors to monitor movement of the drafting rollers,which are mounted on pivots or a flexible plate. Others use transducers to measurethe power demand of the rollers during drafting. Generally, it was found that thedrafting force has a wave-like variation of a similar wavelength and amplitude tothe irregularity associated with the drafting wave. The mean drafting force decreaseswith the openness of the input material and the degree of parallelism and straightnessof the constituent fibers. Fiber crimp is an important parameter; the drafting forceincreases exponentially with crimp level. With respect to the drafting of card sliver,the force is greater when the majority of hooks are trailing rather than leading. Thisdirectional effect persists throughout subsequent repeated drawing operations. Withworsted card slivers, up to 1% add-on of most lubricants rapidly reduces the draftingforce; 100 cp silicone oil was found to be very effective.28
© 2003 by CRC Press LLC

Drafting force increases by only a small amount with throughput speed but isdependent on the static and kinetic friction of the fibers, increasing as these increase.When the roller setting is less than or close in value to the maximum fiber length,the drafting force is high; it decreases as the roller setting is increased.
According to Equation 5.3, the drafting force should decrease with increasingdraft. However, observations have shown that, initially, the drafting force increasesto a peak value at a very low draft (< 2) before decreasing hyperbolically withincreased draft. See Figure 5.8.26 However, the product of the drafting force andthe set draft is always a constant, referred to as the drafting constant. The initialrise in the drafting force is likely to be present at the start of drafting, irrespectiveof the set size of draft. If the draft is >2, the peak value is reached momentarilybefore the drafting force falls off to a steady-state value. The peak value is attributedto the force needed for straightening and aligning hooked and crimped fibers andto overcome the interfiber frictional resistance to the movement of fibers past oneanother. The force decreases once the nipped fibers start sliding past those underthe influence of the back rollers. When the set draft is <2, the steady-state valueof F is near the peak value. Therefore, as the set draft is increased, the tendencyis for the steady-state value to initially equal the peak value of the transient state.It then decreases with further increases in the set draft.
Equation 5.3 shows that the drafting force is proportional to the mean fiberlength (Lz is proportional Lf) and fineness (in respect of n1), and therefore it isproportional to the total length of fibers (or the number of fibers) nipped by the frontrollers and accelerated to the front roller speed. Hence, the reason given for the forcedecreasing with set draft is that the front rollers at higher drafts accelerate fewerfibers, and the resistance to their acceleration is lower, requiring a lower force toovercome it. Increasing the number nipped by the front rollers by increasing thecount of the input material will cause the drafting force to increase disproportionatelyto the increase in count. This is because the greater compactness of the input materialwill increase the interfiber frictional contact.
F
1 DDo
FIGURE 5.8 Relationship between drafting force and set draft.
© 2003 by CRC Press LLC

In Figure 5.8, DO is the set draft corresponding to the peak force. Up to thisvalue, there is no fiber slippage — just a simple straightening out of fibers andextension of the input material by DO – 1. To allow for this, Equation 5.3 becomes
(5.4)
This draft DO raises the issue of the relationship between the set draft and the actualdraft applied to the input material.3 If, as indicated in Figure 5.3, L2 = D L1, then theincrease in length because of fibers slipping past one another is L1 (D – 1), as it isassumed that the structure (the fiber arrangement) of the input material is inexten-sible. Thus, D = 1 + ε, where ε is the permanent strain. However, because real fibrousstructures show elastic properties at low drafts, the actual draft, DA, that causespermanent strain will be less than D and is given by DA = 1 + (ε – E), where E isthe limit of elastic strain for the input material. Waggett43 describes a method fordetermining the elastic properties of card and drawframe slivers. As mentionedabove, the elasticity of input materials is governed by fiber entanglement as well asthe fiber characteristics. Therefore, with repeated drafting of sliver, DA should getcloser in value to D. Figure 5.9 shows that DA /D varies with increasing set draft D,as expected.
It is the accepted view that the initial extension of the input material by thedrafting force generates drafting irregularities.30–42 This factor has been included inderivations to predict the irregularity spectrum for various mathematical models ofinput material.33,37 The reduced elasticity of a material being drafted has been foundto result in a lower output irregularity.30,31
FKn1Lz DO e–( )2
D DO 1+( )–--------------------------------------=
96
95
94
93
92
91
90
89
88
1 2 3 4 5 6Set Draft (D)
Rat
io o
f Act
ual D
raft
to S
et D
raft
(D
A / D
)
Card Sliver
First Drawframe Sliver
Fourth Drawframe Sliver
FIGURE 5.9 Relationship between DA/D and D.
© 2003 by CRC Press LLC

5.1.2.3 Factors Influencing Drafting Wave Irregularity
The factors determining the single zone drafting wave irregularity are
• The size of draft
• The count of the input material
• Multiple inputs or doubling
• Roller or drafting zone setting
• The degree of parallelism, length, and fineness of fibers in the inputmaterial
Size of Draft
It can be reasoned that the higher the single zone draft, the fewer the number offibers in the cross section that will be drafted in the ideal way and therefore themore pronounced the thick and thin places and the greater the irregularity of draftedmaterial. Figure 5.1080 shows, as an example, that the square of the relative varianceof irregularity increases linearly with applied draft such that
(5.5)
where CVO, CVIN = relative variances of irregularity of the output and inputmaterial, respectively
a = slope of the lineD = applied draft
Thus, the coefficient of variation attributed to the drafting wave is .
350
300
250
200
150
100
50
0 1 2 3 4 5 6 7 8 9Set Draft D
Rel
ativ
e V
aria
nce
CV
2 T
FIGURE 5.10 Relative variance as a function of set draft.
CV O2 CV IN
2 a D 1–( )+=
a D 1–( )
© 2003 by CRC Press LLC

Input Count The slope a can be seen to decrease with the count of the input material. Strictly,the equation should have a third squared relative coefficient of variation. This resultsfrom a small tension draft of 1.2 applied to the material just before it entered thedrafting zone. The effect of this draft is not evident in the coarsest count inputmaterial where a sizable number of fibers are present. The higher is the number offibers present, the smaller are the values of a and the coefficient of variation of thedrafting wave. The simple reason for this is that, with more fibers present, morefibers will be drafted in the ideal way. There also will be a greater number of floatingfibers, but the spacing between successively leading ends of floating fiber extents islikely to be more random. This will lead to strips of the heavier count, and thereforethicker input material, having effectively their own drafting wave. These sub-draftingwaves will tend to be out of phase, making thick parts in the strips become staggeredand come alongside the staggered thin parts as illustrated in Figure 5.11.56
DoublingA multiple input feed gives the action of doubling. This has the advantage of reducingthe irregularity, CVIN, entering the drafting zone such that
(5.6)
where N is the number of inputs each with a coefficient of variation of CV. In addition to reducing the combined irregularity of the input, doubling implicitly
has the effect of increasing count. Thus, during drafting, the drafting waves in theindividual inputs tend to form separately from one another; the thick parts do notcoincide but become staggered to juxtapose the thinner parts, as described earlier.Therefore, the equation for reduced irregularity by doubling also applies to thedrafting wave. Thus, with N inputs each and with CV coefficients of variation,
(5.7)
FIGURE 5.11 Drafting waves in slivers.
CV INCV
N--------=
CV AO2 CV O
2
N-----------
CV IN2 a D 1–( )+
N-----------------------------------------= =
© 2003 by CRC Press LLC

(5.8)
where the subscript AO means “actual output.”That is to say, with the doubling action, the output irregularity, CVO, that would
be obtained from a single input feed is now reduced by the product of the reciprocalsquare root of the number of doublings. This assumes, again, the absence of varia-tions resulting from machine faults.
Fiber Straightness, Parallelism, Fineness, and LengthFibers usually have some degree of interlacing when they are not straight and parallelin the input material. The greater the amount of interlacing, the more the resistanceto the sliding of fibers past one another, and the tendency for fibers to be pulledtoward the front roller pair in clumps. This obviates the positive effect associatedwith increased count. The finer the fibers, the greater the number present in the crosssection of the input material, and the more difficult it then is to deal with theinterlacing. However, in the drafted material, there will be more fibers in the thinnerparts and, consequently, the drafting wave will be less pronounced. From theirobservations of the drafting of card slivers, Grover and Lord44 suggest that theaverage length of floating fiber groups is likely to decrease with repeated draftingbecause of a progressive reduction in the amount of interlacing.
During drafting, the interfiber friction tends to straighten and align fibers as theyslide past each other. Merchant45,46 explains that, in the straightening and alignmentof fibers entering the drafting zone, the drafting action removes trailing hookspreferentially to leading hooks. The reason for this is that the trailing hook of a fiberis in frictional contact with a large number (n1) of fibers in the back beard, whichexert a drag on the hook as the leading end of the fiber is accelerated to the frontroller speed. The leading hook of a fiber, with its trailing end nipped by the backroller, will have much fewer (n2 = n1/DA) fibers in the front beard trying to straightenthe hooked length as they slide by. For similar reasons, fiber hook removal increaseswith increased count of the input material47 and with increased set draft.48,49
Thus, in repeated drafting stages where fiber hooks are in a trailing directionentering the drafting zone, more and more fibers will be straightened with their fiberextents becoming equal to their full lengths. The associated drafting wave with eachrepeat stage will be smaller, and, if doubling is used at each repeat stage, the outputCV will show a decreasing trend.
Irrespective of the positive effect of fiber straightening, the drafting wave willdepend on the fiber length or span length distribution and on, in particular, the shortfiber content of the distribution, since short fibers will always be floating fibers. Forcotton, measured data from a digital fibrograph (see Appendix) have been used inthe following expression to obtain calculated estimates of the percentage of fiberslikely to become floating fibers:50,51
Percent floating fibers (%FF) = (S/L – 0.975)100 (5.9)
where S = 2.5% span length L = 12.5% span length
CV AOCV O
N-----------=
© 2003 by CRC Press LLC

Depending on fiber grade and process conditions in opening and cleaning andcarding, reported figures for %FF range from 10 to 70%.50 Fiber breakage in thepreparation processes is therefore of significance to the drafting wave irregularity.For man-made fibers, fiber breakage also has a negative effect, since such fibers areusually supplied with a square distribution.
By analyzing the thin and thick places in drafted lengths, Waggett22 has shownthat the bulk of floating fibers during drafting are likely to be short fibers, sincelonger fibers have sufficient cohesion between themselves and other neighboringfibers in the back and front beards to reduce any irregular motion. However, a worstedstaple diagram can include very long fibers so that, when the drafting rollers are setto prevent spewing, the remaining fibers behave as floating fibers. Generally, it maybe said that the irregularity of a drafted material is strongly linked to the irregularityof the constituent fiber distribution.
Roller SettingsFigure 5.12 is a typical example of how the coefficient of variation changes withroller setting. It is evident that the minimum irregularity was obtained at setting lessthan the maximum fiber length. At greater settings, a rapid increase in irregularityoccurs, because longer fibers as well as short fibers become floating fibers, and thedistance over which short fibers float increases, both factors giving a more pro-nounced drafting wave.
The reason why spewing does not present a problem at the setting for minimumirregularity is that the number of maximum length fibers is usually small (<<5%),so only a few fibers would be nipped by both roller pairs. However, to ensure againstspewing, a setting slightly wider than that corresponding to the minimum CVT% is
10.6
10.4
10.2
10.0
9.8
9.6
9.4
9.2
9.0
0.80 0.85 0.90 0.95 1.00 1.05 1.10 1.15 1.20 1.25 1.30
Setting w.r.tEffectiveFiber Length
Setting w.r.tMaximum Fiber Length
Roller Setting Relative to Fiber Length Parameter
Irre
gula
rity
of
Dra
fted
Mat
eria
l, C
VT%
FIGURE 5.12 Effect of roller settings on irregularity.
© 2003 by CRC Press LLC

commonly used. As described in Chapter 1, the effective fiber length or (for short-staple) the 2.5% span length may be used for drafting zone settings. When there islikely to be low fiber parallelism and straightness, careful consideration has to begiven to the optimal setting with regard to the fiber extent distribution.53
5.1.3 EFFECT OF MACHINE DEFECTS
The irregularities that may be caused by machine defects are usually independentof those caused by the material characteristics. However, irregularities caused byuncontrolled stretching of the input or output material may be influenced by fiberproperties and parallelism. Although modern machines are well designed and con-structed, wear can lead to mechanical defects and the following three types are ofimportance.
5.1.3.1 Roller Eccentricity
As Figure 5.13 shows, roller eccentricity essentially means that the actual centre ofa roller, in this case the top roller, is offset from the axis of rotation, and this causesthe radius of rotation to vary during each revolution of the roller. Consequently,roller eccentricity causes the nip of a roller pair to fluctuate, and this alternativelyincreases and shortens the drafting zones. Usually, the effect of such movement ofthe back-roller nip line is negligible, but it is of much significance with the front-roller pair.
In the case of the front rollers, the number of fiber-leading ends nipped by therollers will vary in a regularly repeated manner, resulting in thick and thin placesin the drafted material. The forward movement of the nip line increases the spacing
Center ofRotation A
Range of NipMovement
True RollerCenter B
C D
FIGURE 5.13 Eccentric top roller causing periodic roller nip movement.
© 2003 by CRC Press LLC

between fiber ends to produce the thin places, and the backward movement producesthe opposite. This gives a periodic variation, with a wavelength equal to the rollercircumference. The amplitude of the periodic variation will depend on the amountof nip movement, which is likely to be small. Importantly, therefore, the irregularityvalue (i.e., CV%) of the drafted material may not be greatly affected and, unwittingly,may seem to be low, particularly if steps have been taken to minimize the effectsof the material characteristics discussed above.
The Uster spectrogram will, however, indicate the periodic fault.54 Such a faultthat occurs in one drafting action will also be present in the output material ofsubsequent roller drafting(s), which may not be affected by machine faults. Similarto other irregularities, the wavelength of the periodic fault would then increase bythe multiple of the draft(s) and is identifiable in the corresponding Uster spectrogram.
The eccentricity of a bottom roller is more severe than that of a top roller. Thisis because the bottom roller is directly driven so that, as well as introducing the nipmovement, the varying radius of rotation would also cause the roller surface speedto fluctuate regularly. The result would be a larger amplitude of periodic fault ascompared with that caused by an eccentric top roller.
5.1.3.2 Roller Slip
Roller slip may occur either at the back or front roller pair. Since the bottom rollersare directly driven, it is these that are likely to slip. The bottom rollers drive thefiber beards and top rollers. If there is insufficient pressure at a roller nip, the bottomroller slips by and does not impart the correct surface speed to the fiber bread andthe top roller. Changes to the top roller surface speed caused by bottom roller slipwill introduce irregularities into the output material. Clearly, the thicker the fiberbeard between the rollers, the greater is the chance of bottom roller slip. Roller slipis therefore usually associated with inputs of high linear densities.
Periodic changes in the speed of bottom rollers, causing periodic variations, canresult from faults in the drive system and from worn bearings.54
5.1.4 THE DRAWING OPERATIONS
Having reviewed the basic principles of drafting, we can now consider how they areapplied to drawing operations in the short-staple, the worsted, and semi-worstedpreparation processes.
The drawing operations are primarily concerned with converting card sliversinto drawn slivers in which fibers have been straightened and aligned with a highdegree of parallelism. It is essential that the short-, medium-, and long-term irreg-ularities of drawn slivers are as low as possible, with no periodic variation present.To minimize the drafting wave, the motion of potential floating fibers must becontrolled, and, to ensure minimum long-term irregularities, autolevelers are alsoemployed.
Effective control of floating fibers can be achieved by increasing the interfiberfriction. Although it is possible to apply suitable additives to fibers to increase thisfriction, the preferred alternative is to do so mechanically, as this is a simpler
© 2003 by CRC Press LLC

approach that gives more predictable control. There are four basic means of mechan-ical control: directly applied pressure or tension; the use of pins; twist; and acombination of applied pressure and twist. In sliver drawing operations, use is madeof applied pressure or of pin control. The other two means of control are used inthe follow-on process stages and will be considered later. For effective pin control,the drafting zone has to be of a length suitable for a pin device to fit between theback and front roller pairs. This means that pin control is used for the worsted andsemi-worsted processes, and direct pressure is used for short-staple processing.
The machines used for drawing are called either frames or boxes. In short-stapleprocessing, we refer to the drawframe, whereas, in the worsted or semi-worstedprocess, drawing is performed on a gill box.
5.1.4.1 The Drawframe
In the explanation given of the principles of drafting, only a single-zone draftingarrangement was considered. This is because, when more than one zone is used, theprinciples still apply to each individual zone. However, the application of multiplezones can enable the control of the effects of material characteristics on draftingirregularities described above.
Figure 5.14 depicts the essential features of a drawframe with a two-zone draftingarrangement and shows a modern machine with a six-sliver input and automatic canchanging at the output. The use of six or eight doublings depends on fiber lengthand size of draft. The shorter cotton lengths are found to process better from theuse of six doublings with a draft of six; eight doublings may be used for longerstaples.55 Table 5.1 gives typical performance figures. Drawframes have much higherproduction speeds than revolving flat cards. Therefore, only a few machines areneeded to achieve a process balance with card sliver production.
With three roller pairs defining the geometry of the system shown in the figure,it is common to refer to the arrangement as a 3-over-3 system. Several other arrange-ments are used or have been in used,56,57 the more traditional being the 4-over-4system, but this arrangement is considered to be unnecessary where less than ten ofdraft is to be applied to the input slivers. Essentially, whatever the geometry, the
TABLE 5.1Typical Performance Figures for Drawframes
Features Specification
Number of deliveries Usually 1 or 2Drafting systems 3-over-3 with or without pressure bar
4-over-4Other combinations
Number of doublings for feed to drafting system Usually 8, ranges 6–10Max. input feed (g/m) Up to 50Max. delivery speed (m/min) Up to 1000Autoleveler regulating range (±%) Commonly 25
© 2003 by CRC Press LLC

drafting system should be capable of processing a variety of fiber types and staplelengths (typically, 22 to 80 mm) over a wide range of delivery speeds.
Generally, the back zone draft of all drafting systems is of the order of 1.25to 2.0. This draft is termed the break draft, since it assists in minimizing the negativeeffect of sliver extension in the subsequent higher draft zone(s). The drafting forcewas shown to peak at such low drafts. Therefore, the roller weighting of the secondtop roller is of critical importance to avoid roller slip. As Figure 5.14 shows, apressure bar is fitted in the front drafting zone. This deflects the fibers from astraight-line path, and the resulting tension reduces the effect of the materialextension and assists in restraining the pulling forward of what would be floatingfibers. However, it is essential that fibers enter the nip line of the front rollersdirectly from the pressure bar; otherwise, their path will be disturbed by the surfaceof the bottom front roller, and this will increase the irregularity caused by thedrafting wave.
In the processing of cotton, the drawframe acts as a further cleaning point.Figure 3.7 (see Chapter 3) shows that dust particles, by Coulombic forces, can clingto fiber surfaces. As these fibers slide past one another during drafting, the fiber-to-fiber friction liberates the dust and any coarse trash caught between the fibers. Theseseparated particles can then be removed with applied suction.
Path Of Fibers
Pressure Bar
FIGURE 5.14 Main features of a drawframe. (Courtesy of Rieter Machine Works Ltd.)
© 2003 by CRC Press LLC

Open-loop autoleveling control is the most widely used on drawframes. Atongue-and-groove sensor, similar to the card system, is used to determine thevariation of the combined silver feed. The sensor is sited prior to the inlet rollers ofthe drafting system. The measured values are stored until the measured portion ofthe combined sliver feed is within the drafting system, and the size of draft is thenadjusted to correct for deviations. An important advantage of the open loop is that,because the combined sliver feed moves at a sixth or an eighth the speed of theoutput sliver, the sensor can respond more accurately to the material variations ascompared with closed-loop positioning of the sensor.
We have seen in Chapter 3 that autolevelers are also fitted to revolving-flats cards.Usually, these give longer-term correction (i.e., variations between cans of slivers)and are referred to as long-term autolevelers. Drawframe autolevelers give correctionto the sliver lengths within cans and may be considered medium-term devices. Short-term autolevelers also can be fitted to both machine types. The question, therefore,is which to use and when. The key factor to consider is the consistency of the countof the spun yarn. The expectation is that a yarn count should have a CV% ofapproximately 2, based on about 20 measurements (yarn package to yarn package)of 100-m samples. Yarn counts having a CV% = 3 have resulted in unacceptablevisible faults in woven fabrics.55 A CV% of 1.2 to 1.4 can be achieved with autolev-eling at the drawframe. Generally, when two drawframe passages are used, andtherefore a doubling of 36 or 64, long-term autoleveling at the card or medium-termautoleveling at only the first passage drawframe will give similar results. When onedrawframe passage is required, the choice of which machine stage should haveautolevelers fitted may come down to one of economics. The spinning of coarse countyarns by certain spinning methods (see Chapter 6) often only requires either the directfeed of a card sliver or a single passage drawframe sliver, in which case a short-termautoleveler should be used on the respective machines according to sliver type.58
5.1.4.2 The Gill Box
Whereas a drawframe is used in the straightening and parallelizing of cotton andother short fibers, a gill box is used for processing wool and other longer fibers.Instead of employing a multiple-zone, roller-drafting system with pressure rollersto minimize the effects of sliver extension and the floating-fiber drafting wave, gillboxes are commonly single-zone, or 2-over-2, roller systems in which pins are usedto control the effects of material characteristics on the drafting. Figure 5.15 illustratesthe main components of the drafting system of an intersecting gill box.
The fallers are metal bars with steel pins projecting from their working surfacesand equally spaced along the length of the bars. The pins may be round or flat;round pins are more robust, but flat pins give better fiber control since, for the samenumber per unit length, they have a larger free space within which a greater numberof fibers can be held.59 The faller lengths are parallel to the nip line of the rollerpairs, and, when in contact with the sliver, the pins penetrate vertically, slightlybeyond the line of the sliver axis.
The length of the drafting zone is often called the total ratchet. The shortestdistance of a line of pins from the back nip line is therefore called the back ratchet,
© 2003 by CRC Press LLC

and the front ratchet is the closest distance of approach of a line of pins to the frontnip line. The back roller pair is usually adjusted so that the back ratchet is smallerthan the lengths of the short fibers. The group of fallers penetrating the sliver betweenthe back and front rollers may be referred to as a bed of fallers. The total ratchet isset so that the longest fiber in the back beard does not extend beyond half the distanceof the faller bed.
During the drafting action, each faller moves from the back to the front rollersat a speed 5% faster than the back-roller surface speed. Consequently, the pins gentlycomb through the back beard, and this assists in minimizing the effects of sliverextension, the removal of hooks leading into the faller bed, and in the generalstraightening and aligning of the fibers. Studies60 have shown that the combing actionof the fallers gives a small amount of straightening, but mainly of longer fibers.Fibers released by the back rollers are transported by the fallers to the front nip linewhere, once nipped, the material is fully drafted. The significant difference betweenthe front-roller speed and the faller speed is very effective in the straightening andremoval of fiber hooks that are trailing rather than leading within the front beard.Pulling fibers from between the pins gives far more straightening than does combingthe fibers with pins.
Although the back-ratchet draft gives only a small amount of straightening, itis nevertheless of importance. If it is too high, the combing action of the faller pinsmay result in fiber breakage, and irregularities occur because of the uncontrolledmotion of the short lengths of broken fibers. Too low a value, and fibers may notbe suitably extended to remove their natural crimp. The drafting force in the front-ratchet zone then reaches a level to break fibers, owing to the greater frictionresistance caused by the retained crimp.
On reaching the closest distance to the front roller, each faller then drops fromthe faller bed and is returned to repeat the fiber control part of the cycle. The fallershave their ends supported on metal saddles, and they may be chain driven (chain-driven intersectors). Alternatively, rotating screw threads may be used to propelthem during their forward and return paths, with cams lifting them in and out of the
Feed Rollers Top Fallers Delivery Rollers
Gill SliverOut
SliversIn
Control RollerBottom Fallers
Fallers Bed
Ratchet
Vc >> Vb > Va
Va
Vc
VbVb
FIGURE 5.15 Features of intersecting gill box.
© 2003 by CRC Press LLC

faller bed (screw-driven intersectors). As with the drawframe, an autoleveler maybe employed to ensure sliver count consistency.
With pin-control, fibers that are released by the back rollers are compressedbetween lines of adjacent pins and thereby become constrained to move at thefaller speed until nipped and accelerated by the front rollers. However, as fallersmove within reach of the front rollers, the presence of the front ratchet reducespin control, and the front beard is then able to pull some unnipped fibers forward.Furthermore, as the front most faller is removed from the faller bed, it may disturbthe motion of fiber ends and may cause a periodic fault known as faller-bar marksin the drafted output sliver. Two explanations have been given for the formationof faller-bar marks. Taylor11 attributes them to the tendency of the dropping fallersto cause an intermittent pulling of the sliver out of the steady flow path to thefront-roller nip. This periodically alters the number of fiber ends being nipped andthereby results in thick places occurring at the locations in the sliver correspondingto the withdrawal of the fallers. Grossberg and Yang,61,62 having found that theforces involved were too small to produce significant periodic pulling, gave thealternative explanation that, in close proximity to the front rollers, the interfiberpressure on the fiber mass held between adjacent pins decreases suddenly to aminimum as the faller drops from the bed. The associated decrease in the draftingforce enables elastic recovery to take place in the front ratchet zone, and somefibers therefore retract from the nip, initially causing a thin place, followed by athick place, to be formed. It is possible that a combination of the two mechanismsactually occurs.
The wavelength of the periodic irregularity present in the sliver equals theproduct of the draft and distance between successive lines of faller pins (the pitchof the fallers). The amplitude of faller-bar markings increases with short fibercontent, the front ratchet size, and, particularly, the level of draft. Taylor63 has shownexperimentally that at a draft of 5, faller-bar marks were scarcely detectable butbecame very conspicuous, even to the eye, when a draft of 12 was applied. Theeffect of faller-bar markings on yarn quality is diminished when a repeat draftingpassage is used (i.e., two gillings), the associated reverse feed of the processed sliverlength being beneficial.
It should be evident from the above that the fiber-pin interaction strongly influ-ences the quality of the drafted sliver. As a general rule, the distribution of the fibermass between the pins must be as uniform as possible, maintaining consistent frictionand drafting forces. The cleanliness and the irregularity of the input sliver aretherefore important factors. Impurities and thick and thin places in the feed sliverwill alter the fiber packing densities between pins, which, if too high, can causefiber breakage and, if too low, a pronounced drafting wave. Finer fibers should beprocessed with narrower pin spacing, which prevents the entry of impurities. Theoptimal input count of the doubled slivers is directly related to fiber fineness, i.e.,fineness in microns = count in ktex, 19 µm = 19 ktex.64
5.1.5 PRODUCTION EQUATION
The production rate, PR (kg/h), is given by
© 2003 by CRC Press LLC

(5.10)
where Vd = delivery of sliver (m/min)Tt = sliver count (ktex) E = machine efficiency (%)N = number of deliveries per machine
5.2 COMBING
We have learned from the basic principles of drafting that, assuming the draftingsystem is appropriately set, drafting waves are attributable to the short fibers in theinput material and that the amplitude and wavelength of the drafting wave increaseswith draft. In drawing, we have seen the use of two means of controlling the shortfibers when moderate drafts are applied. At high drafts, control of all fiber lengthsis important and, when the drafted material is to be of a fine count, the draftingwave amplitude can be suitably minimized if very short fibers are removed from theinput material. Worsted yarns generally, and cotton yarns that are produced withinthe finer count range (i.e., 25 to 5 tex) on spinning systems that employ rollerdrafting, require very short fibers to be removed during the material preparation. Itis important also that the quantity of neps and remnant fragments of impurity areminimized, as they can severely degrade the quality of such yarns. The process usedto remove the short fiber and remnant impurities is called combing.
Definition: Combing is a process by which the quantity of short fibers andremnant fragments of impurities present in a carded or drawn sliver areminimized to give a clean sliver, having more of a rectangular staplediagram, with the vast majority of the constituent fibers in a straightenedand parallel state.
Combing, therefore, makes possible the spinning of yarns of fine counts with lowirregularities and a cleaner appearance. As we will be explained in Chapter 6,combing also results in stronger, smoother, and more lustrous yarns.
5.2.1 THE PRINCIPLES OF RECTILINEAR COMBING
Historically, a number of combing methods date back to around the mid nineteenthcentury, but the rectilinear method has become the most widely utilized. The prin-ciple was devised in 1846 by Josué Heilmann, of Alsace, France, to be used for thecombing of cottons. It was also found to be effective for wools. For cotton processing,the method was developed by Nasmith, an Englishman, in 1902 to 1903, into thesystem on which modern cotton combing machines are based, known as the Nasmithcomber (or comb). The machines developed for wool have become known by thealternative names of French or Schlumberger combs.
Essentially, rectilinear combing involves a sequence of five steps, termed thecombing cycle, which is repeated continuously while the machine is operating. Thesteps are as follows:
PR V d T t 60 E 10 2– N×××××=
© 2003 by CRC Press LLC

1. Feeding a fringe of several slivers to a rotating cylinder or drum coveredwith pins.
2. Removing, with the pins on the rotating cylinder, the impurities and fibersnot held within a nip line.
3. Releasing the remaining fibers in the nip and simultaneously inserting arow of pins across the width of fringe.
4. Pulling the longer fibers through the row of pins and piecing them to thepreviously detached group to form a new length of combed sliver.
5. Removing the impurities and extracted fibers from the rotating cylinder,making it ready for the next cycle.
Although both the Nasmith and the French comb use the same operating principles,there are important differences between components of the systems that make itappropriate to give separate descriptions of each in relation to the combing cycle.
5.2.1.1 Nasmith Comb
Figure 5.16 depicts a sideways view of the main components of a Nasmith comband their related actions during a combing cycle.
The Cylinder CombThis is a driven cylinder, with its length positioned across the width of the machine.The section of circumferential surface that does the combing is called the half-lap
Removing ofShort Fiber
From Fiber Mass
Piecing of Newly
Combed Fiber
Uncombed FiberMass
Revolving Cylinder Comb
Short FiberRemoved
Combed FiberMass
Removal of NewlyCombed Material
Top Comb
FIGURE 5.16 Main features of the Nasmith comb.
© 2003 by CRC Press LLC

and consists of about 17 rows of pins, with their points projecting from the cylindersurface. The cylinder comb rotates independently of all other parts, and its mainfunction is to remove the unnipped fibers, neps, and impurities from a fringe ofslivers while straightening out any hooked or curled fibers in the fringe, with thefiber trailing ends being held at a nip line. The collection of fiber, dirt, and trashremoved is called noil or comber waste. The half-lap is arranged so that the fringeis combed first by a row of widely spaced coarse pins and then by progressivelymore narrowly spaced and finer rows. Up to 28 slivers, each having had one passageof drawing, are preassembled in the form of a lap — a sliver lap65 — in which theslivers lie parallel to each other with their ends making the sliver fringe that spansacross the width of the machine. The reason why a drawn sliver rather than a cardsliver feed is used will be explained later.
The Feed Roller/Top and Bottom Nipper Plates/Top CombThe feed roller is made to supply, intermittently, a preset length of fringe ready forcombing. The nipper plates separate and then come together (open and close) so asto give passage to the feeding forward of the fringe and then to nip the fringe readyfor combing. The top comb is a single bar having fixed across the length of oneedge equally spaced pins with their point projecting down toward to the sliver fringe.The top comb has an up-and-down vertical movement.
All four components have their lengths across the machine width, and they moveas a unit, initially away from and then toward the detaching rollers.
Detaching Rollers and Delivery RollersSimilar to other roller-set arrangements for gripping fibers, the bottom rollers aredriven, fluted metal rollers, and the top are synthetic rubber-covered rollers. Theroller pairs initially rotate counterclockwise so that a previously combed lengthforms an overlap onto which the next group of fibers to be detached will be pieced.They then rotate clockwise to remove the newly combed group of longer fibers fromthe fringe. To make this overlap and remove fibers from the fringe, the nip line ofthe detaching rollers has to move toward the fringe. To do so, the top-detachingroller is made to shift to a foremost position ready for detaching; this action isreferred to as the top roller rocking over the bottom roller. When the top roller is inits detaching position, the nipper plates are at their closest distance to the detachingrollers. It is this preset distance (the detachment setting) that governs the fiber lengthsremoved from the fringe. Detachment occurs when the rollers rotate clockwise while,simultaneously, the top-detaching roller rocks back to its original position.
The Combing CycleThe combing cycle begins with the nipper plates in their backmost position (farthestposition from the detaching rollers) and closed so as to nip the sliver fringe. As shownin the figure, the feed roller is stationary, and the top comb is in the up position,clear of the fringe. During the early stages of the cycle, the pins projecting from thecylinder comb enter the sliver fringe and subsequently remove impurities and fibersnot held by the nipper plates. As the pins leave the fringe, the nipper-plate unit beginsmoving toward the detaching rollers. The nipper plates start opening, the top combdrops into the fringe just in front of the nipper plates and, as the latter becomes fully
© 2003 by CRC Press LLC

opened, the feed roller pushes forward a short length of fringe. By the time the nipperplates reach the detachment setting, the detaching rollers will have formed an overlapand begun their clockwise rotation. The leading ends of fibers spanning the detach-ment setting will then be caught, and these fibers are pulled through the interspacesof the top comb. The top comb prevents neps, impurities, and fibers not spanningthe preset distance from being dragged out of the sliver fringe by those beingdetached. It effectively combs and straightens the trailing ends of fibers beingdetached. In the following cycle, the cylinder removes, along with any neps andimpurities, fibers retained in the sliver fringe that are not held by the nipper plates.
Once detachment has taken place, the nipper-plate unit returns to its backmostposition and, in so doing, the newly formed length of fringe is nipped and ready forcombing. The top comb will have returned to its up position. The combing cycle isthen repeated. Since, in each cycle, the nipper plates have to be closed for the cylinderto extract the noil, a cycle may be referred to as a nip. The combing frequency istherefore the number of nips per minute, which is normally stated as the combingspeed.
The detachment and piecing of fibers from the sliver fringe results in a thin webof straight and parallel fibers being issued from the delivery rollers. The combedweb is then consolidated to make a sliver, which is pulled along a table alongsideslivers from other combing heads on the same machines (usually six or eight heads),and the set of doubled slivers are drawn to form a single sliver, termed a combedsliver, by a drafting system at end of the machine. The sliver is then wound into asliver can, ready for the next process. Figure 5.16 shows a modern cotton combingmachine with the sliver-lap feed and the feed table to the drafting system with theslivers from each combing head. The combing process is very effective in removingvery short fibers, and, as an example of this, Figure 5.17 compares the staplediagrams for the sliver lap feed, the combed sliver, and the extracted noil. It can beseen that, by reducing the short fiber content from 28 to 9%, the staple diagrambecomes more rectangular.
It should be clear to the reader that overlap piecings will produce a periodicfault in the sliver from each combing head. The doubling and drafting at the machinewill assist in reducing the amplitude of the periodic wave. However, a furtherdrawframe passage is usually required after combing.
Blends of combed cotton with man-made fibers are widely used for the produc-tion of fine-count yarns. A common practice is to carry out such blending aftercombing, in which case two drawframe passages are employed, the man-made sliverhaving had one drawing prior to blending.
5.2.1.2 French Comb
Figure 5.18 is a typical side elevation diagram of the main working parts of a Frenchcomb. The main points of difference between this and the Nasmith comb are
• The sliver feed. A feed gill is used to control 24 to 32 gilled, wool slivers(at least one passage of gilling). This is composed of three metal platesthat move as a unit forward and backward, toward and away from the
© 2003 by CRC Press LLC

detaching rollers. The slivers lay juxtaposed on the bottom, grooved platewith a slotted plate placed on top of them. Eight rows of pins attached tothe top plate project through the slotted plate, penetrate the slivers, andenter the groove of the bottom plate, thereby firmly holding the slivers.When the nipper plates open, the feed gill moves forward to supply apreset length of sliver fringe through the nipper plates. When the nipperplates are closed, the top plate of the feed gill withdraws the pins fromthe sliver, and the feed gill unit returns to its initial position, ready torepeat the feed. The nipped sliver fringe is then combed by the 17 or 18rows of pins on the cylinder comb.
• Detaching unit. This consists of a spirally fluted roller and an endlessapron. When the pins leave the sliver fringe, the detaching unit movesforward and grips the fiber ends. Simultaneously, the pins of the top combpenetrate the fringe so that only fibers of lengths greater than the detachingdistance are extracted.
Figure 5.18 shows that the French comb is a single-head machine. The sliversare supplied to the machine in balls rather than cans so as to reduce floor space andprovide ease of handling. Table 5.2 gives a general comparison of specifications forthe two types of combing machine.
Effective Length(mm)
% Short Fiber
Fiber Parameter Sliver Lap Combed Sliver Waste(17% Extraction)
37
28
38
9 66
23
Sliver Lap
Combed Sliver
Combed Waste
FIGURE 5.17 Staple diagram for combed Sudan cotton.
© 2003 by CRC Press LLC

Similar to cotton combing, the combed wool slivers, called combed top, arepassed through a drawing (i.e., gilling) operation. They normally undergo twopassages of gilling, which are referred to as top finishing. The first gilling involvesautoleveling, and the number of doublings may be up to 30 but with no greater than10 of a draft. The second gilling would utilize a doubling of four or five and a similardraft, without autoleveling.
TABLE 5.2Typical Performance Data
Parameter Nasmith (cotton) comb French comb
Nips/min Up to 350 200–230
Number of heads Commonly 8 Commonly 1
Feed count (ktex) Up to 80 Up to 600
FIGURE 5.18 Operation of a French comb.
© 2003 by CRC Press LLC

In contrast to the short-staple sector, it is common in the worsted industry tohave the process steps of scouring through top finishing as one manufacturingoperation, separate from the spinning mill. The sliver in top finishing is usually of20 to 25 ktex and is packaged in approximately 20- to 25-kg lots for easy handlingand transportation.
5.2.2 PRODUCTION EQUATION
The production rate of a comber depends on the following:
• The total sliver feed mass per unit length L, grams• Combing speed n, nips per minute• Feed rate f, mm per nip• Noil W%• Running efficiency E%• Number of heads NH
The production rate PR (kg/h) is then given by
PR = (100 – W) L n f E NH 60 × 10–10 (5.11)
5.2.3 DEGREES OF COMBING
The percentage waste extraction during combing depends on the short-fiber contentof the raw material, the final end use of the yarn, and the economics with respectto the effect of material cost on yarn cost. There are, particularly for cotton, fourdegrees of combing.
• Scratch combing, where up to 5% noil is removed. This gives no greatimprovement in average yarn properties but has the benefit or reducingend breakage rates in spinning and winding.
• Half-combing, which involves around 9% waste, resulting in reduced yarnirregularity and improved spinning performance.
• Ordinary combing, involving between 10 to 18% noil, which is necessaryfor spinning yarns in the finer end of the count range.
• Full combing, resulting in greater than 18% noil. This often means doublecombing to obtain the highest quality yarns — 18% removed in the firstcombing and 7% in the second.
For short-staple spinning, cottons greater than about 27 mm staple length arecommonly combed; those greater than 30 mm are used for finer counts, and generallyall are combed. Usually, 13 to 5% is considered sufficient to meet high-qualityrequirements. In worsted processing, the ratio of top and noil is called the tear andis often used as a measure of the degree of combing. With 60s quality wool, the tearis within 8 to 11, and for 64s/70s quality, it is around 8. With 64s quality wool, thenoil extract can be around 4 to 8%. When tops are dyed,66 they are either gilled orgilled and recombed, followed by two additional gillings.
© 2003 by CRC Press LLC

5.2.4 FACTORS AFFECTING NOIL EXTRACTION
5.2.4.1 Comber Settings
In the first place, the machine settings should give control of the percentage of wasteextracted. From the descriptions of the machine operations, it should be clear that thedetachment setting is a main factor. However, if the detachment setting is to be basedon the short-fiber content of a staple diagram, then the effect of the difference betweennumber-length and weight-length distributions on the estimated noil percentageshould be considered.67 As Figure 5.1967 illustrates, a number length distribution givesa more accurate estimate of the short fiber content in the material to be combed.
The position of the top comb relative to the nipper plates will influence theamount of waste extracted. If the top comb is set well in advance of the nipperplates, it will more effectively prevent the fibers being pulled by the detaching rollersfrom dragging through any impurities and short fibers, and the waste extraction willbe high. Setting the top comb close to the nippers will reduce the amount of extractedwaste, but this means higher levels of neps, impurities, and short-fibers in outputsliver. Inefficient penetration of the top comb may also result in this.
5.2.4.2 Preparation of Input Sliver
The objective here is to ensure that the configurations of fibers longer than thedetachment settings do not result in these fibers becoming part of the noil. Thiscould happen either because of fiber breakage during combing or because the fiberextents fall short of the detachment setting. Figure 5.20 illustrates the latter point.Several fibers of differing lengths, with trailing hook configuration, are shown to beheld at the nip line N. The distance FN is equivalent to the length of sliver ribbonmoved forward by the feed mechanism, when the nipper plates are fully opened.Therefore, FD equals the detachment setting. Consequently, when the nipper plates
Number %
Weight %
Length (x 2.2 mm)
Perc
ent
30
20
10
00 5 9 13 17 21
FIGURE 5.19 Number- and weight-based fiber length distributions.
© 2003 by CRC Press LLC

reach their foremost position only fiber a will be detached. The other fibers will beretained in the ribbon fringe by the top comb. During the next cycle, the cylindercomb will remove them as part of the noil. It can be easily reasoned that, if thesefibers had their hooks leading rather than trailing, the cylinder comb would havestraightened them prior to the detaching action, and the longer ones would haveformed part of the combed sliver. Drawn or gilled slivers should comprise mostlystraightened fibers, but remaining hooked fibers must enter combing with theirhooked ends leading. The majority of hooks in the output sliver from a card aretailing (see Chapters 3 and 4). Therefore, to reposition these to be leading whenpresented to the cylinder comb, there should be an even number of reversing pro-cesses between the card and the comb, as depicted in Figure 5.20.68–71
Consider the configuration of fiber b in the figure. If the looped end becameleading, it is likely that the actual fiber ends would be held by the nipper platesduring the combing action of the cylinder comb, and if a projecting pin movedthrough the loop, the fiber would break. Similar breakages may occur to fibers withother unfavorable configurations in the sliver feed, in particular to fibers interlacedwith neighboring ones. Fiber breakage in combing is strongly related to the degreeof fiber parallelism in a sliver fringe. Therefore, it is important that appropriatedrawing or gilling be used in the preparation of the sliver input to combing. For
Doffer
Card SliverCan
Drawing Lap Forming
Combing
D N F
Detaching NipLine
NipperPlateNip Line
FeedLine
b
a
FIGURE 5.20 Fiber configuration in relation to detachment.
© 2003 by CRC Press LLC

cotton fibers, the use of fixed flats in carding, followed by drawing, was found tohave a significant effect on comber waste. Mill trials72 have shown that, for the samemachine settings, the percentage comber waste was reduced from 16.4 to 14.2%,and the resulting yarn properties were improved.
The fiber-pin interaction in combing has been studied by a number of research-ers,73,74 and various techniques have been used to obtain an indication of likely pinforces present during combing. It was found that, generally, when a pin enters asliver fringe, the force required for the pin to move through the fringe rises to apeak value and then decays to zero as the pin passes through the fringe.74 This isan indication of the resistance to pin movement. If the lengths of the nipped fibersin the fringe lie parallel to the motion of the pin, then the initial resistance to pinmovement is largely the friction force arising from the sliding contacts with thefibers. On meeting impurities, neps, and short fibers to be removed, the resistanceincreases, as the pin then has to push these obstructions along its path until they aredislodged from the fringe. If these obstructions are not firmly held by other fibers,the increase in force will be negligible, and the peak pin force will be small. If,however, fringe fibers are not parallel, and interlaced fibers or doubled fibers areheld at the nip-line (as would be expected in a card sliver fringe), then the peak pin-force reaches a high level at which these fibers will either have disentangled or beenextended to reach their breaking strain, resulting in increased noil. The reportedfindings showed that peak pin force increased with (a) fringe density, because ofincreased interfiber friction; (b) fringe length, owing to the presence of more impu-rities, neps, and short fibers to dislodge from the fringe; and (c) a reduced numberof drawing passages.
The top comb pin force has also been studied during detachment and found tobe greater than forces associated with the front ratchet zone in gilling. It is acontributing factor to fiber breakage. Increasing the number of gilling passages,however, reduces the size of the top comb pin force. Belin and Taylor75 found thatthe back-ratchet draft in gilling has a significant effect on the quantity of noil removedin combing. A moderate draft should not cause breakage in gilling but can reducethe size of the pin force at the cylinder and top combs developed during combing.
Although lubricants [combing oils of 106 centistokes (cS) viscosity] are addedafter scouring to reduce breakage, a small amount of residual grease on wool fibersdoes assist in keeping noil levels to a minimum. Sinclair and Wood76 relate increasednoil in wool combing to an entanglement factor, which is a complex functionindirectly involving the residual grease content. They found that noil increases withresidual grease content above 1%. Belin83 reports 0.8% (measured by Soxhlet etherextraction) to be the optimal level of residual grease. At higher levels, the tendencyis for fibers to stick together, and lubrication is impaired at lower levels.
5.3 CONVERSION OF TOW TO SLIVER
A tow is a collection of approximately 300,000 continuous man-made fiber filamentskept in a parallel, untwisted form. To convert tows into a sliver, the individualfilaments must be cut or broken collectively into staple fibers of a specified length.Conventionally, the tow is chopped to the required staple length and baled ready for
© 2003 by CRC Press LLC

opening, blending, carding, and drawing/gilling so as to be made into a sliver byany of the particular process routes for material preparation. A much shorter processroute, called tow-to-top, is to cut or break the filaments while retaining them in theirstraight, parallel state, thereby producing a linear assembly of staple fibers that iscomparable to a drawn/gilled sliver. Besides the commercial advantages, there aretechnical benefits, since the fibers avoid impact forces of, in particular, opening andcarding that cause neps and the unwanted very short fibers. In converting the tow,the ends of the resulting staple fibers obviously must not coincide so that slivercohesion is obtained, and longer staples will give better cohesion for handing of thesliver. Tow-to-top conversion is therefore mainly utilized in worsted/semi-worstedyarn production, and then largely for viscose, polyester, and acrylic fibers. Two typesof machine are used; cutting converters and stretch-breaking converters.
5.3.1 CUTTING CONVERTERS
A cutter converter basically comprises a feed creel, a cutting unit, a sliver-formingsection, a crimping unit, and a sliver can delivery. As supplied by the fiber manu-facturer, the tows are within the range of 10 to 60 ktex, depending on fiber type,and are packaged in plaited form into boxes. In the feed creel, the tows are tensionedover a series of bars, which straightens and spreads the filaments evenly across thewidth of the input to the cutter. The input count to the machine may be up to 200ktex. Figure 5.21 shows the basic cutting technique. A helical-blade cutting rolleris pressured onto the tows as they pass over a hard, smooth, stainless steel roller.The helical shape provides overlapping of the cut lengths for cohesion, and the pitchof the helix provides the staple length. The gaps between cutting edges of the helicalblade have a rubber-covered surface that prevents filament misalignment, whichcould result in undersized lengths caused by double cutting of filaments.77 The cutlengths are then consolidated and gilled to form the sliver. To impart crimp to thefibers for improved cohesion, the sliver is passed through a stuffer box before beingcoiled into a sliver can. Dull cutters can result in partially cut lengths or cause fusingof cut ends. The slivers from converters, therefore, usually undergo two furthergilling passages, which separate individual fiber lengths possibly fused together atone of their cut ends.
5.3.2 STRETCH-BREAKING CONVERTERS
These converters use the idea of extending, in a controlled manner, synthetic fila-ments to their breaking strain, polyester and acrylic tow being the principal rawmaterials. When heat treated, the broken lengths of stretched filaments can be madeto readily shrink to produce a highly bulked yarn. The process has therefore becomepopularly used in the material preparation for the production of high-bulk acrylicyarns.
The main features of a stretch-breaking converter are shown in Figure 5.21 andcomprise four stretching zones: an initial tensioning zone, followed by a heated-and a cooling zone, and finally the filament breaking zone. The resulting silver isthen stuffer-box crimped and further cooled before being coiled into a sliver can.
© 2003 by CRC Press LLC

Filament tows, making a total linear density of around 70 ktex for polyester or120 ktex for acrylic, are fed to the stretch breaker via a creel spreader. The tows areinitially tension between rollers (A) and (B). Rollers (B) and (C) stretch the towswith a draft (or draw ratio) of within 1.4 to 1.8, while they are heated to a temperaturewithin the range of 120 to 170°C. At a set draw ratio, the filament tenacity increases,and its potential shrinkage decreases with temperature. Within a suitable operatingrange of draw ratios, when the heater temperature is constant, both tenacity andpotential shrinkage increase with increased draw ratio. It is reported78 that, in thestretch breaking of nylon 6.6 tows, depending on temperature and draw ratio, thetenacity of the broken filaments may be increased by 20 to 40%, extension 36 to78%, and initial modulus 85 to 144%. The chosen settings will depend on therequired shrinkage and the ease of breaking filaments. For the production of non-bulked, regular yarns, heating is unnecessary.
The filament must be well cooled before reaching the third stretching zone,which is between roller sets (C) and (D). To achieve this, air cooling and water-cooled rollers (C) are used. The final stretching of the tow to the breaking point ofthe constituent filaments is performed by the rollers (E), which are spaced to givethe required mean fiber length. Ideally, a random distribution of filament breakswould be anticipated, resulting in a narrow distribution of fiber lengths. In practice,however, variations in filament alignment,84 tensile properties, and fineness cause awider distribution than the ideal.
Cutting Rollerwith ProjectingHelical Blades
Cut StapleFibers
Smooth AnvilRoller
ContinuousFilament
Tow
ContinuousFilamentTow In
TensioningZone
Cooling(Air Flow and Water Cooled) Breaking Zone
Heater
Stretching Zone
StapleOut
C D
EA B
FIGURE 5.21 Tow-to-top converters.
© 2003 by CRC Press LLC

5.3.3 PRODUCTION EQUATION
The production rate, PR (kg/h), is given by:
(5.12)
where Vd = delivery of sliver (m/min)Tt = sliver count (ktex)E = machine efficiency (%)
5.4 ROVING PRODUCTION
For certain spinning processes, the drawn sliver count must be reduced in two stepsso that, ultimately, an acceptable yarn quality is achieved. Equation 5.5 shows that,with roller drafting, the output irregularity increases as the draft increases, owing tothe more pronounced effect of the drafting wave. Therefore, one benefit of a two-stage drafting operation is that the reversal of the material length at the second stageprovides, effectively, a reversal in the drafting direction of the fibers, and this tendsto reduce the amount of bunching of short fibers to give a less pronounced draftingwave. If, for example, we wished to spin a yarn of 30 tex from 1.5-dtex fibers, andthe drawn sliver count is 3 ktex, then the required draft of 100 would best be appliedin two steps, typically 5 and 20. It is necessary for the first step draft to be lowbecause then only a low twist is needed to hold the fibers together. There would be,on average, approximately 20,000 fibers in the 3-ktex sliver cross section. The draftof 5 would reduce this to 4000 fibers in the cross section, and a small amount twistwould be needed to give the attenuated length sufficient cohesion for suitable han-dling. Increasing the draft would require increasing the twist. However, the insertedtwist must not cause problems in the second drafting step by developing a highdrafting force. Since the drafted material of the second stage is to be substantialtwisted to form a yarn, the greater draft should be applied in that spinning stage.
The first drafting step forms the final part of the sequence for preparing fibersfor spinning. The intermediate product is called a roving and is made either on twistinserting machines, known as roving-frames, speed-frames, or flyer-frames, or onmachines, called rub-rovers, that employ a rubbing action instead of twist insertionto consolidate the attenuated fiber mass. This latter system is suitable only for fiberlengths applicable to the worsted process, since sufficient cohesion is required forhandling.
Definition: A roving is a continuous fibrous strand drafted from a sliver andgiven cohesion by either inserting a small amount of twist or compactingthe fibers with an oscillating apron. It is drafted and twisted to be spuninto a yarn.
In the production of a roving, a 3-over-3 roller drafting system is commonlyused to attenuate the sliver. Unlike the drawing operation, the slivers are drafted
PR V d T t 60 E 10 2–××××=
© 2003 by CRC Press LLC

separately and, since there are now fewer fibers in the cross section, alternativemeans to a pressure bar or pins are used for control of floating fibers.79–81 The mostcommonly used is the double apron drafting method, illustrated in Figure 5.22. Asshown, this is a two-zone drafting arrangement in which a pair of endless aprons ispositioned in the high-draft front zone and made to move at the surface speed ofthe middle-roller pair. As fibers enter the high-draft front zone, the aprons will holdthem and assist in keeping them moving at the surface speed of the middle rollers,while preventing the short-fibers being dragged forward by those fibers nipped andaccelerated by the front rollers. By comparing the speed profiles of the floatingfibers, it can be seen that the distance over which the motion of the short-fibers isuncontrolled has been reduced, thereby minimizing the prominence of the draftingwave.9
Back Rollers
Apron
Apron
Front Rollers
tbtf
(y)
tb tf
(y)
DraftingZone
DraftingZone
RollerDraftingSystem
ApronDraftingSystem
Time (t)
Time (t)
FIGURE 5.22 Apron drafting control of floating fibers.
© 2003 by CRC Press LLC

5.4.1 THE SPEED-FRAME (TWISTED ROVINGS)
Figure 5.23 shows a sideways illustration of a speed-frame, and Figure 5.24 showsan example of a commercial machine. The main operating features are a 3-over-3apron drafting system and a combined twist insertion and bobbin build mechanism.The function of the apron drafting system has already been explained. The operationof the twist-and-bobbin build device can be described with reference to the figure.As shown, the device has a central spindle that passes through a second, but hollow,spindle. Both are driven independently and pass freely through the rail, whichtraverses up and down a set distance along the length of the hollow spindle. A bobbintube, onto which the roving is wound, sheaths the hollow spindle and rests on amount (bobbin mount) fitted to the rail. The motion of the rail moves the bobbin upand down the hollow spindle length. Mounted on the top end of the central spindleis a component known as the flyer. This has a hollow leg through which the rovingtravels to the bobbing. Located at the exit is a presser arm and paddle around whichthe roving slides along to the bobbin. The arm is attached to a support rod, and,during rotation of the flyer, this rod is moved outward by centrifugal forces andthereby swivels the presser arm inward to guide the roving onto the bobbin tube.The opposite leg of the flyer is solid and gives dynamic balance during spindlerotation.
As the flyer rotates with the centre spindle, twist is inserted into the draftedribbon issuing from the front rollers of the drafting system, thereby forming theroving. The contact between the roving and the rim of the flyer inlet imparts anadded false twist (see Chapter 1), which strengths the roving length between theflyer and front drafting rollers, permitting a low value of real twist to be used. Theroving, which is threaded through the hollow of the fly and around the presser arm,is pulled and wound onto the bobbin by the rotation of the hollow spindle. To doso, the hollow spindle rotates at a higher speed than the center spindle, and the raillifts and lowers the bobbin past the presser arm to build successive layers of rovingcoils and make a full bobbin. This is often referred to as winding-up by bobbin lead.If the bobbin rotates at speed Nb, and the spindle at Ns, then the speed, Vw, at whichthe roving would be wound onto the bobbin tube is given by
Vw = π Db (Nb – Ns) (5.13)
where Db = the bobbin tube diameter (in meters) at the instant of winding
In the equation, Nb and Ns are in units of rpm, and Vw is in m/min.Clearly, if the roving is not to break during winding, there must be a balance
between the winding-up speed, Vw, and the delivery speed, Vd (m/min), at whichthe drafted ribbon leaves the front drafting rollers. Therefore, as Db increaseswith the number of roving layers wound onto the bobbin, Nb must decrease, sinceNs must be kept constant to ensure a constant twist level. Two or three wraps ofthe roving around the pressure arm increases the winding-on tension. This, inturn, contracts the roving diameter to enable more roving to be wound onto thebobbin.
© 2003 by CRC Press LLC

+
+
Spindle Drive
Fly
Bobbin
Support Rod
Twisted Roving
Presser Foot
Bobbin Rail
Bobbin Supportwith Bearing
Bobbin Drive
Movement ofBobbin Rail
Track to Aid RailMovement
Collar
Brass Bush
Spindle
++
+ ++
++
+
+
+
+
Drafting System
Twisted Rowing
Direction of Twist
SpindleCollar
Flyer
Drive to Collar
Drive to Spindle
Sliver
FIGURE 5.23 Basic features of a roving frame.
© 2003 by CRC Press LLC

It can be seen in Figures 5.23 and 5.24 that speed-frames are fitted with tworows of the flyer twisting device. The level of false twist inserted by the flyer inletis dependent on the contact angle of the roving length between the flyer and thefront drafting rollers; the smaller the angle, the higher the false twist. The back rowof flyers is nearer the drafting rollers and therefore has the greater contact angle.The lower false twist does not give sufficient cohesion to the roving length to preventinduced tensions reducing the roving count slightly. In some cases, this differencecan be significant and result in a difference in the yarn count produced from frontand back rows of roving bobbins. To prevent this, modern speed-frames have theback row flyer fitted with a raised false-twister attachment (see Figure 5.25) bringingthe contact angles of the two row to almost similar values.
5.4.1.1 Production Equation
The production rate of a speed-frame is dependent on the spindle speed of the fly,the number of spindles per machine, the production efficiency, the roving count, andthe twist multiplier used. The following equation gives the calculated production rate.
FIGURE 5.24 Basic roving frame.
© 2003 by CRC Press LLC

(5.14)
where PR = production rate (kg/h)TM = twist multiple (turn m/tex)
E = machine efficiency (%)n = number of spindle per machine
Approach Anglewithout Raised FlyerAttachment
Approach Angle withRaised Flyer Attachment
FIGURE 5.25 Flyer attachment to counter count differences. (Courtesy of Zinser Ltd.)
FIGURE 5.26 Basic features of twistless roving frame.
PR60 10 9– E n Ns T t r–
3××××TM
---------------------------------------------------------------------=
© 2003 by CRC Press LLC

Ns = spindle speed (rpm)Tt – r = roving count (tex)
5.4.2 RUB ROVERS (TWISTLESS ROVINGS)
The principle used to produce twistless rovings is similar to the production of woolenslubbings (see Figure 5.26). The drafted ribbon of fibers issuing from the double-apron drafting system is threaded between a pair of oscillating aprons that roll andcompress the ribbon of fibers into a round, consolidated, more cohesive, continuouslength. The twistless rovings are then wound with minimum tension onto a tube.With the absence of twist the production rate becomes as shown below.
5.4.2.1 Production Equation
PR = 60 × 10–5 × Vd × n × Tt – r × E (5.15)
5.5 ENVIRONMENTAL PROCESSING CONDITIONS
Figure 1.8 (Chapter 1) gives a flowchart of process routes for the production ofcarded and combed ring-spun yarns, rotor yarns, worsted and semi-worsted yarns,and woolen yarns. Although some routes are relatively short, it is nevertheless trueto say that fibers undergo a great amount of sliding contact between themselves andwith machine surfaces. The associated friction generates static charges and, beingbasically nonconducting, fibers retain and accumulate the charges and tend to clingto nonmetallic parts of machines, resulting in processing difficulties and faults inthe output material.82 The heat developed during process operations will tend toreduce the moisture content of hygroscopic fibers, and, since moisture is an importantmeans of conducting away static charges, the problem of static can increase withthe number of processes. There is also the risk that fibers will become more sus-ceptible to breakage.
To minimize static problems, it is necessary to maintain the environmentalconditions, in terms of percent relative humidity (%RH) and temperature, at levelsthat will retain adequate moisture in hygroscopic fibers. Certain finishes are usuallyapplied to man-made fibers as lubricants and to reduce the tendency for static chargebuildup. Nevertheless, it is still found necessary to have controlled %RH and tem-perature. If, however, the humidity is kept too high, fibers may stick to metallic andnonmetallic surfaces. Table 5.3 gives quoted values of %RH according to fiber typeand process stage.
Wool is more hygroscopic than other fibers, so higher levels of relative humidityare used. The moisture content is influenced by the condition of the wool (i.e., thepresence of wool fats and oils, acids, and alkalies; the degree of compactness; andstructural changes the fiber may undergo during processing, particularly scouring).However, within 70 to 80% RH and 21°C, the environment will keep the moisturein wool at between 15 and 18% regain, making it suitable for mechanical working.Cellulose fibers develop much less static that protein fibers, so lower %RH levels(45 to 55%) but higher temperatures (up to 27°C) are used, particularly in the
© 2003 by CRC Press LLC

preparatory process stages, as this also increases the elasticity of the fiber. Forsynthetics, 35 to 60% RH and temperatures up to 27°C cover most levels used, withnylons being at the lower end of the %RH range, acrylic around the middle, andpolyester at the higher end.
REFERENCES
1. Cox, D. R. and Ingham, J., Some causes of irregularity in worsted drawing andspinning, J. Text. Inst., 41, 376, 1950.
2. Grishin, P. F., A theory of drafting and its practical applications, J. Text. Inst., 45,T167 –T271, 1954.
3. El-Sharkawy, A. F. and Audivert, R., The relation between the theoretical and actualdraft in the roller-drafting of staple-fiber slivers, J. Text. Inst., 65(8), 449, 1974.
4. Cox, D. R. and Ingham, J., Some causes of irregularity in worsted drawing andspinning, J. Text. Inst., 41, P376, 1950.
5. Rao, J. S., A mathematical model for ideal sliver and its application to the theory ofroller drafting, J. Text. Inst., 52(12), T571, 1961.
6. Textile Terms and Definitions, 10th ed., The Textile Institute, Manchester, UK, 1995.7. Morton, W.E., and Summers, R.J, Fibre Arrangement in Card Slivers, J. Text. Inst.,
40, 106, 1949.8. Sengupta, A. K. and Chattopadhyay, R., Change in configuration of fibres during
transfer from cylinder to doffer in a card, Text. Res. J., 52, 178, 1982.9. McVittie, J. and De Barr, A. E., Fibre motion in roller and apron drafting, Shirley
Inst. Memoirs, 32, 105, 1959.10. Taylor, D. S., Some observations on the movement of fibres during drafting, J. Text.
Inst., 45, T310, 1954.11. Taylor, D. S., The motion of floating fibres during drafting of worsted slivers, J. Text.
Inst., 46, T284, 1955.12. Taylor, D. S., The velocity of floating fibres during drafting of worsted slivers, J. Text.
Inst., 50, T233, 1959.13. Grover, G. and Lord, P. R., The measurement of sliver properties on the drawframe,
J. Text. Inst., 83(4), 560–572, 1992.14. Hannah, M., The theory of high drafting, J. Text. Inst., 41(3), T57–T123, 1950.
TABLE 5.3Process Environmental Conditions for Fiber Types
Process Cotton/regenerated cellulose Synthetics Protein fibersoC %RH oC %RH oC %RH
Opening 23 55 27 40 18–23 66–80Carding 23 50–55 27 40 18–23 65–80Combing 27 42 27 – 18–23 65–80Drawing 25 48–50 27 45–65 18–23 70–80Roving 25 48–50 27 40–45 18–23 50–60Spinning 27 48–50 27 35–40 18–23 50–60
Courtesy of P. R. Lord, Economics, Science & Technology, 1981, 172.
© 2003 by CRC Press LLC

15. Foster, G. A. R, Fibre motion in roller drafting, Shirley Inst. Memoirs, 25, 51–90,1951.
16. Cox, D. R., Theory of drafting wool sliver I, Proc. of The Royal Society, A, 197, 28,1949.
17. Cox, D. R. and Ingham, J., Some causes of irregularity in worsted drawing andspinning J. Text. Inst., 41, P376, 1950.
18. Burnett, D., A theory of roller drafting, J. Text. Inst., 50, T297, 1959.19. Johnson, N. A. G., A computer simulation of drafting, J. Text. Inst., 2, 69–79, 1981.20. Wegener, W. and Ehrier, P., Idealised drafting, Textil-Praxis, 23, 595, 1968.21. Arano, A., Some features of random slivers, J. Text. Inst., 47, P781, 1956.22. Wegener, W. and Ehrier, P., Idealised drafting, Textil-Praxis, 25, 282, 346, 1970. 23. Lamb, P. R., The effect of spinning draft on irregularity and faults, part I: Theory
and simulation, J. Text. Inst., 78(2), 88–100, 1987 and part II: Experimental studies,J. Text. Inst., 78(2), 101–111, 1987.
24. DeLuca, L. B., Hebert, J. J., and Simpson, J. A., A method for automating the westpoint cohesion tester, Text. Res. J., 35, 467–477, 1965.
25. Martindale, J. G., Cotton sliver or roving: Measurement of drafting force, J. Text.Inst., 38, T151, 1947.
26. Plonsker, H. R. and Backer, S., The dynamics of roller drafting, part 1: Drafting forcemeasurement, Text. Res. J., 37, 673–687, 1967.
27. Taylor, D. S., The measurement of fibre friction and its application to drafting forceand fibre control calculations, J. Text. Inst., 46, 59–83, 1955.
28. Olsen, J. S., Measurement of sliver drafting forces, Text. Res. J., 852–835, 1974.29. Cavaney, B. and Foster, G. A. R., Some observations on the drafting forces of cotton
and rayon-staple slivers, Shirley Inst. Memoirs, XXVII, 37–51, 1954.30. Bastawisy, A. D., Onions, W. J., and Townend, P. P., Some relationships between the
properties of fibres and their behaviour in spinning using the Ambler super-draftmethod, J. Text. Inst., 52, T1, 1961.
31. Turpie, D. W. F., SAWTRI, Technical Report No. 400, 1978.32. Green, J. and Ingham, J., Technique for visualising the position of staple fibres in
sliver and its application to drafting problems, J. Text. Inst., 43, T473, 1952.33. Postle, L. J. R., Ph.D. thesis, Some measurements relating to the fibre friction forces
acting during drafting, University of Leeds, UK, 1955.34. Grosberg, P. A., The short-term irregularity of roller-drafted yarns and slivers, J. Text.
Inst., 49, T493, 1958.35. Grosberg, P. A., Cause of irregularity in roller drafting, J. Text. Inst., 52, T91, 1961.36. Grosberg, P. A., Cause of irregularity in roller drafting, J. Text. Inst., 53, T533, 1962.37. Balasubramanian, H., Ph.D. thesis, A study of the short-term irregularities in roller-
drafted materials using measurements of the variations in fibre-end density, Universityof Leeds, UK, 1964.
38. Grosberg, P., J. Text. Inst., 76, 296, 1966.39. Dutta, B. and Grosberg, P., The dynamic response of drafting tension to sinusoidal
variations in draft ratio under conditions of sliver elasticity in short-staple drafting,J. Text. Inst., 64, 534, 1973.
40. Grosberg, P. and Yang, W.L., The Cause of Sliver Irregularity in Gilling, J. Text. Inst.,65, 20, 1974.
41. Burte, H. M., The properties of apparel wools, VII: The mechanical behaviour ofroving, Text. Res. J., 24, 726, 1954.
42. Dutta, B., Ph.D. Thesis, Dynamic response and automatic control of short stapledrafting, University of Leeds, UK, 1970.
© 2003 by CRC Press LLC

43. Waggett, G., The tensile properties of card and drawframe slivers, J. Text. Inst., 43,T380–395, 1952.
44. Grover, G. and Lord, P. R., The measurement of sliver properties on the drawframe,J. Text. Inst., 83(4), 560–572, 1992.
45. Merchant, V. B., Theoretical aspects of hook removal at drafting operations, Text.Res. J., 31, 925–930, 1961.
46. Merchant, V. B., Theoretical aspects of hook removal at drafting operations, part II:The influence of changes in draft distribution on the removal of trailing and leadinghooks, Text. Res. J., 32, 805–810, 1962.
47. Simpson, J. and De Luca, L., Effect of sliver weight entering drawing on fibre hookremoval, Text. Res. J., 35, 675–676, 1965.
48. Nutter, W., Removal of fibre hooks by roller drafting, Text. Res. J., 32, 430–431, 1962.49. Ghosh, G. C. and Bhaduri, S. N., Dependence of hook removal at drawing on some
drafting parameters, Text. Res. J., 32, 864–866, 1962.50. Hertel, K. L and Craven, C. J. J., Determination of floating fibres, Textile Industries,
124, 103–107, 1960.51. Prakash, J., Estimation of floating fibre percentage using the digital fibrograph, Text.
Res. J., 62, 244–245, 1962.52. Waggett, G., The tensile properties of card and drawframe slivers, J. Text. Inst., 43,
T380–395, 1952.53. Fibrograph Determination of Draft Roll Space Settings, Spinlab Utility Instrumen-
tation, Inc., Knoxville, TN.54. Hattenschwiler, P. and Eberle, H., Quality in staple fibre spinning: Practical examples,
Melliand Textilberichte, 1987.55. King, E., The Role of the Modern Drawframe, Int. Text. Bull., Yarn Forming, 1, 35–45,
1991.56. Foster, G. A. R., Manual of cotton spinning: Drawframes, combers, and speedframes,
Chap. 2, The Textile Institute, Manchester, UK, 1958.57. Klien, W., Manual of Textile Technology — Short-Staple Spinning Series: A Practical
Guide to Combing and Drawing, Vol. 3, Chap. 2, The Textile Institute, Manchester,UK, 1987.
58. Quality assurance with various spinning systems, Uster News Bulletin, 32, 1–31, 1984.59. Tautenhahn, K. and Schmauser, E. M, Basic principles for determining the pinning
of faller bars on gill boxes, Int. Text. Bull. Yarn Forming, 1(66), 1984.60. Belin, R. E., Hooked fibres in carding and gilling, J. Text. Inst., 64, 659–664, 1973.61. Grosberg, P. and Yand, W. L., The cause of sliver irregularity in gilling, J. Text. Inst.,
65, 20–26, 1974.62. Yang, W. L, An Investigation into the Causes of Sliver Irregularity in the Gill Boxes,
Ph.D. thesis, University of Leeds, UK, 1970.63. Taylor, D. S., The motion of floating fibres during drafting of worsted slivers, J. Text.
Inst., 46, T284, 1955.64. Tautenhahn, K. and Schmauser, E. M, Basic principles for determining the pinning
of faller bars on gill boxes, Int. Text. Bull. Yarn Forming, 1(66), 1984.65. Gruarin, R., Inter-linking of lap preparation, combing and drawing — A modern
logistical solution, Int. Text. Bull., 3, 28–34, 1994.66. Bird, C. L., The Theory and Practice of Wool Dyeing, 4th ed., Society of Dyers and
Colourists, Bradford, UK, 1972.67. Wakeham, H., Cotton fibre length distribution — An important quality factor, Text.
Res. J., 25, 422–429, 1955.
© 2003 by CRC Press LLC

68. Belin, R. E. and Taylor, D. S., Directional effects in worsted rectilinear combing, J.Text. Inst., 58, 145–157, 1967.
69. Wankankar, V. A. and Bhaduri, S. N., The effect of fibre configuration in feed oncomber waste, Text. Res. J., 32, 641–651, 1962.
70. Leont’eva, L. S., Problem of fibre straightening during sliver preparation, Technologyof Textile Industry, USSR, 2, 57–63, 1964.
71. Simpson, J., Comparison of the combing and cutting ratios as an indication of fibrearrangement, Text. Res. J., 32, 614–615, 1962.
72. Grimshaw, K., Benefits for cotton system from the use of fixed carding flats, Con-ference Proc.: Tomorrow’s Yarns, 26–28 June, 166–181, 1984.
73. Kruger, P. J., Withdrawal forces in the processing of wool slivers, part I: The deter-mination of withdrawal force, J. Text. Inst., 59, 463–471, 1967; part II: The influenceof variations in gilling on the withdrawal force, J. Text. Inst., 59, 472–477, 1967; andpart III: The influence of pin-density variations, J. Text. Inst., 59, 478–486, 1967.
74. Johnson, N. A. G. and Wang, X., Investigation of combing forces, part I: Fibre tension,J. Text. Inst., 82(3), 399 –408, 1991, and part II: Pin forces, J. Text. Inst., 82(3),120–126, 1992.
75. Belin, R. E. and Taylor, D. S, The effect of backdraft applied at the first gillingoperating after worsted carding, J. Text. Inst., 60, 132–139, 1969.
76. Sinclair, J. F. and Wood, G. F., An apparatus for measuring fibre entanglement inscoured wool and some applications in scouring investigations, J. Text. Inst., 56,T274–T279, 1965.
77. Wagget, G., The relation between the orientation of filaments in a rayon tow andsome characteristics of tops made from tow, J. Text. Inst., 45, T81–T91, 1954.
78. Watt, J. D., Some changes in filament and fibre load-extension characteristics whichresult from stretch-breaking Nylon 6.6 on a Seydel machine, J. Text. Inst., 52(7),T303–T308, 1961.
79. Oxtoby, E., Spun Yarn Technology, Chap. 5, Butterworth-Heinemann, Boston, MA,1987, 58–61.
80. Balasubramanian, N., Upgrading by apron drafting, Text. Res. J., 32, 957–958, 1962.81. Fujino, K., Shimotsuma, Y., and Fujii, T., A study of apron-drafting, part I: Experi-
mental studies, J. Text. Inst., 2, 50–59, 1977, and part II: A theoretical analysis offloating fibre control, J. Text. Inst., 2, 60–68, 1977.
82. Pillay, K. P. R., Effect of ambient atmospheric conditions during spinning on yarnproperties and spinning efficiency, Text. Res. J., 41(1), 11–15, 1971.
83. Belin, R. E., Residual grease in the gilling and rectilinear combing of merino wool,J. Text. Inst., 58, 169–174, 1967.
84. Wagget, G., The relation between the orientation of filaments in a rayon tow andsome characteristics of tops made from tow, J. Text. Inst., 45, T81–T91, 1954.
© 2003 by CRC Press LLC

Yarn Formation Structure and Properties
6.1 SPINNING SYSTEMS
There is an extensive range of different spinning systems, not all of which are in wide commercial use; many are still experimental or, having reached the commercial stage, have been withdrawn from the market. A classification of the better known spinning systems is given Table 6.1, in which the various techniques are grouped according to five basic methods. In the first section of this chapter, we will consider the fundamental principles of these listed spinning systems. In the sections that follow, we will deal with the yarn structure and properties of only those that still have commercial significance. Often, two or more yarns are twisted together to improve yarn properties or to overcome subsequent processing difficulties in, for example, weaving and knitting. The operating principles of the more common plying systems will also be described in this section.
The conventional ring spinning technique is currently the most widely used, accounting for an estimated 90% of the world market for spinning machines. The remaining systems in Table 6.1 are often referred to as unconventional spinning processes and, of these, rotor spinning has the largest market share. The more knowledgeable reader will notice that mule and cap spinning have been omitted. Although in commercial use, these two processes are very dated traditional systems, limited to a very small market segment and well described elsewhere.1,2
Important aspects of any spinning system are the fiber types that can be spun, the count range, the economics of the process, and — very importantly — the suitability of the resulting yarn structure to a wide range of end uses. Except for the twistless-felting technique, all of the systems listed in Table 6.1 will spin man-made fibers, but because of processing difficulties and/or economic factors, the commercial spinning of 100% cotton yarns is mainly performed on ring and rotor spinning. Wool is principally ring spun, the main reason being that the yarn structure gives the desired fabric properties, although a number of unconventional systems are used to produce wool yarns. With regard to process economics, the number of stages required to prepare the raw material for spinning, the production speed, the package size, and the degree of automation are key factors in determining the cost per kilogram of yarn, i.e., the unit cost.
Figures 6.1 and 6.2 show that, although ring spinning has the widest spinnable count range, it has comparatively a very low production speed and therefore, even
6
© 2003 by CRC Press LLC

© 2003 by C
RC
Press LL
C
TABLE 6.1
Classifi
cation of Spinning System
Spinning
methods
Common featur
e
T
echnique
Type of twisting
action during
spinning
Type of yarn structure produced
for fiber consolidationTrade
names
Ring spinning
Ring and tra
veler Single strand twistingDouble-strand ply twisting
RealReal
Twisted: S or ZTwisted: S or Z
VariousSirospun/Duospun
OE spinning Break in the fiber mass flow to the twist insertion zone
Rotor spinningFriction spinning
RealReal
Twisted: Z + wrappedTwisted: Z + wrapped
VariousDref II
Self-twist spinning Alternative S and Z folding twist False twisting of two fibrous strands positioned to self-ply
False S and Z twisted Repco
Wrap spinning Wrap of fibrous core by either (a) filament yarn (b) staple fibers
Alternating S and Z twist plus filament wrapping
Hollow spindle wrappingAir-jet fasciated wrapping
False
FalseFalse
S and Z + filament wrapped
WrapWrapped + twisted
Selfil
Parafil(Dref III, MJS, Plyfil)
Twistless Coherence of the yarn constituents achieved by adhesive bonding or felting
Water-based adhesiveResin-based Liquid felting
FalseFalseZero
BondedBondedFelted
TwiloBobtexPeriloc

with automation, does not always offer the best process economics. The key to its dominance of world markets is the suitability of the ring-spun yarn structure and properties to a wide range of fabric end uses.
Before explaining the operating principles of the listed spinning systems, it is useful to consider the technological equations applicable to all of them. All spinning systems have the three basic actions shown below for producing staple yarns:
Ring Spinning
Rotor Spinning
MJS (Air-Jet)
Dref
Hollow Spindle
Siro-Duo Spinning
Repco
Claimed Economic Count Range (Tex)
300 5
25 10100
15 7
5K 100 33II III
2K 16 5
100 (2 × 50’s) 20 (2 × 10’s)
FIGURE 6.1 Economic count range of spinning systems.
Rin
g
Rot
or
MJS
/Air
Jet
Spi
nnin
g
Dre
f II
I/Fr
ictio
n Sp
inni
ng
Dre
f II
/Fri
ctio
n Sp
inni
ng
Hol
low
Spi
ndle
Rep
co
Siro
-Duo
Spi
nnin
g
Bob
Tex
Short StapleProcesses 25 mm – 50 mm
Long StapleProcesses 51 mm – 215 mm
Spinning Methods
Prod
uctio
n Sp
eed
(m/m
in-1
)
700
600
500
400
300
200
100
0
FIGURE 6.2 Production speeds of spinning systems.
© 2003 by CRC Press LLC

It was explained in Chapter 1 that to spin a yarn from a given fiber type, certain specifications are required, such as the yarn count and, in particular, the level of twist. The concept of twist factor was also explained. These parameters are key variables in the technological equations that give us the production rate of any spinning system.
With respect to the yarn count, the required level of attenuation or total draft, DT , of the system should allow for twist contraction as described in Chapter 1. To do so in practice, a sample of yarn is spun to the required twist level, the resulting increase in count is determined, and the total draft is readjusted to give the specified count. Similar to the drafting considerations in Chapters 1 and 2, the total draft is calculated as the ratio of the count of the feed material to the spinning machine and the count of the yarn. This value is then used to set the relative speeds of the drafting components of the machine.
If NI is the rotation speed of the twisting device used in spinning the yarn, then, as we saw in Chapter 1, the twist factor, TF, the yarn count, CY , the level of twist, t, and NI have the relation
(6.1)
(6.2)
Assuming that a machine has NM number of spinning positions, commonly referred to as the number of spindles, and an operating efficiency of ε%, then the production per spindle, PS, in kg/h–1 is
(6.3)
and the production per machine, PM (again, in kg/h–1) is
Attenuation of the feed material to the required count
Insertion of twist into the attenuated fiber mass to bind the fibers together
Winding of the spun yarn onto a bobbin to produce a suitable package
Basic Actions in Spinning Yarns
DTSliver texYarn tex-----------------------
Delivery roller surface speed V d( )Feed roller surface speed V f( )
---------------------------------------------------------------------------------= =
TF tCy1 2⁄=
tN I
V d
------=
PSV dCY 60
106-------------------=
PMV dCY 60N Mε
108-------------------------------=
© 2003 by CRC Press LLC

Substituting for Vd (Equations 6.1 and 6.2),
(6.4)
The above equations are applicable to any spinning system. However, with some systems, the rotational speed of the yarn cannot be readily determined. It then may be estimated from twist (or some similar parameter, e.g., twist angle) and delivery speed measurements using Equation 6.2.
6.1.1 RING AND TRAVELER SPINNING SYSTEMS
Definition: The ring and traveler spinning method is a process that utilizes roller drafting for fiber mass attenuation and the motion of a guide, called a traveler, freely circulating around a ring to insert twist and simultaneously wind the formed yarn onto a bobbin.
The ring and traveler combination is effectively a twisting and winding mechanism.
6.1.1.1 Conventional Ring Spinning
Figure 6.3 illustrates a typical arrangement of the ring spinning system. The drafting system is a 3-over-3 apron-drafting unit. The fibrous material to be spun is fed to the drafting system, usually in the form of a roving. Similar to the roving frame, the back zone draft is small, on the order of 1.25, and the front zone draft is much higher, around 30 to 40. The aprons are used to control fibers as they pass through the front zone to the nip of the front rollers. Chapter 5 describes the principles of roller drafting. It is nevertheless important to note here that apron drafting systems are suitable for use only where the fiber length distribution of the material to be processed is not wide (i.e., not a significant amount of very short and very long fibers). When the standard distribution is higher, the material is more commonly drafted with a false-twister, which essentially replaces the drafting apron as depicted in Figure 6.4. This is typical of the ring spinning system for producing woolen yarns in which the slubbings from the woolen card are fed through the false-twister to the front rollers of the drafting system.
As Figure 6.3 shows, a yarn guide, called a lappet, is positioned below the front pair of drafting rollers. The ring, with the spindle located at its center, is situated below the lappet. Importantly, the lappet, the ring, and the spindle are coaxial. The traveler resembles a C-shaped metal clip, which is clipped onto the ring. A tubular-shaped bobbin is made to sheath the spindle so as to rotate with the spindle. The ring rail is geared to move up and down the length of the spindle; its purpose is to position the ring so that the yarn is wound onto the bobbin in successive layers, thereby building a full package, which is fractionally smaller in diameter than the ring. The yarn path is therefore from the nip of the front rollers of the drafting system, through the eye of the lappet and the loop of the traveler, and onto the bobbin.
PMN ICY
3 2⁄ 60N MεTF 108
----------------------------------=
© 2003 by CRC Press LLC

Essentially, the drafting system reduces the roving or slubbing count to an appropriate value so that, on twisting, the drafted mass of the required yarn count is obtained. As the front rollers push the drafted material forward, twist torque propagates up the yarn length (i.e., from c to a) and twists the fibers together to form a new length of yarn. The tensions and twist torque cause the fibers to come together to form a triangular shape between the nip line of the front drafting rollers and the twist insertion point at a. This shape is called the spinning triangle. The differing tensions between the fibers in the spinning triangle are considered to be responsible for an intertwining of the fibers during twisting, termed migration. The degree of migration strongly influences the properties of the spun yarn, and this feature of the yarn will be discussed in the later section.
++
++
++
Roving
DraftingSystem
Lappet YarnGuide
Nip Line
Twist InsertionPoint At "a"
Bobbin(Or Cop)
Vien PackageBalloonDiameter
LbYarn
BalloonLength
= bc
Traveller
RingRail
Spindle
Ring
C
D
θ
Ts
Ts
Ts
σ
a
b
FIGURE 6.3 (See color insert following page 266.) Example of ring spinning system.(Courtesy of Spindelfabrik Suessen Ltd.)
© 2003 by CRC Press LLC

6.1.1.2 Spinning Tensions
The bobbin rotates with the spindle and, because the yarn passes through the traveler and onto the bobbin, the traveler will be pulled around the ring and the yarn pulled through the traveler and wound onto the bobbin. As the traveler circulates the ring, it carries with it the yarn length, Lb (= bc), extending from the lappet to the traveler. While Lb circulates the ring, the circular motion causes it to arc outward away from the bobbin. Air drag and the inertia of Lb result in the arc length having a slight spiral as it circulates with the traveler (see Chapter 8). The rotational speed of the spindle can be up to 25,000 rpm. The three-dimensional visual impression given by the circular motion of Lb is of an inflated balloon, termed the spinning balloon or yarn balloon. Hence, Lb is called the balloon length,H is the balloon height (the vertical distance from the plane of the ring to the plane of the lappet), and D is the balloon diameter. The forces generated by the motion of the traveler and the pulling of the yarn through the traveler result in yarn tensions that govern the actual shape of the spinning balloon. Chapter 8 discusses in more detail yarn tensions and spinning balloons in relation to the physical parameters of spinning.
Cheese Of Slubbing
Slubbing
Back Rollers
False TwisterDevice
Front Rollers
Cop of Yarn
Back Rolls
Slubbing
False Twist
Front Rolls
Real Twist
Twist Runs to Nip ofBack Rollers andControls Fiber Flow
FIGURE 6.4 False-twist drafting of woolen slubbing. (Courtesy of Lord, P. R., Economics,Science & Technology of Yarn Production, North Carolina State University, 1981.)
© 2003 by CRC Press LLC

The tensions generated in the yarn are indicated in Figure 6.3 and are related according to the following equations:
TO = TS eKθ (6.5)
TW = TR ePα (6.6)
where TS = the spinning tensionTO, TR = the tensions in the balloon length at the lappet guide and at the
ring and traveler, respectivelyTW = the winding tensionK = the yarn-lappet coefficient of friction
θ and α = the angles shown in the figureP = yarn-traveler coefficient of friction
TO and TR are related by (see Chapter 8)
TO = TR + mR2ω2 (6.7)
where m = mass per unit length
These tensions are important to twist insertion and the winding of the yarn onto the bobbin, and also to end breaks during spinning.
Consider first the winding action. As the traveler is pulled around the ring, the centrifugal force, C, on the traveler will lead to a friction drag, F, where
F = µ C (6.8)
C = MRRω2 (6.9)
where M = traveler massRR = ring radiusω = angular velocity of the traveler (= 2π Nt)
The yarn must be wound onto the bobbin at the same linear speed, VF , as the front drafting rollers are delivering fibers to be twisted. This means that F must be sufficient to make the traveler’s rotational speed lag that of the spindle. Hence, if DB is the bobbin diameter, then
(6.10)
where Ns = spindle speed (rpm)Nt = traveler speed (rpm)
The wind-up speed is therefore the difference between the spindle and traveler speed. It is evident that, as the bobbin diameter increases with the buildup of the yarn, the traveler speed increases. The traveler speed will also change with the movement of
Ns Nt–V F
πDB
----------=
© 2003 by CRC Press LLC

the ring rail to form successive yarn layers on the bobbin. The common way of layering the yarn on the bobbin is known as a cop build in which each layer is wound in a conical form onto the package. The top of the cone is called the noseand the bottom the shoulder. In practice, it is found that the conical shape gives easy unwinding of the yarn without interference between layers, as the yarn length is pulled from the nose over the end of the bobbin. To make a cop build, the ring rail cycles up and down over a short length of the bobbin, with a slow upward and a fast downward motion. This increases the size of the shoulder more quickly than the nose. This cycling action of the ring rail progresses up the bobbin length in steps, each step taken when the shoulder size reaches almost the ring diameter.
6.1.1.3 Twist Insertion and Bobbin Winding
Let us consider now the action of twist insertion. From the definition, it is clear that one revolution of the traveler around the ring inserts one turn of twist into the forming yarn. However, for a fuller understanding of the twist insertion, we need to consider where the twist originates, the twist propagation, and twist variation caused by the cop build action.
Imagine two yarns of contrasting colors passed through the nip of the front drafting rollers and threaded along the yarn path to the bobbin. With the front drafting rollers and the ring rail stationary, and only the spindle driven, using high-speed photography, we would see that, within the first few rotations of the traveler, the twisting of the two yarns together originates in the balloon length between the lappet guide and the traveler.4 The action of twisting the two yarns together is called plyingor doubling, so no ply twist would be seen in the length between the traveler and the spindle or between the lappet guide and the front drafting rollers. It should be clear from Equation 6.10 that no yarn would be wound onto the bobbin and that the rotational speed of the traveler would be equal to the spindle speed.
If the above experiment is repeated, but this time with the front drafting rollers and the ring rail operating, then the following would be observed. The initial length wound onto the bobbin will be of the two yarns in parallel and not twisted together. As above, the ply twist originates in the balloon length and, as it builds up in the balloon length, it propagates toward the delivery rollers. The frictional resistance at the lappet opposes the twist torque propagation, reducing the amount of twist passing the guide. The forces acting at the point of contact of the yarn and traveler prevent the twist torque propagating past the traveler toward the bobbin. However, as sections of the yarn leave the region of the balloon length and are pulled through the traveler and wound onto the bobbin, they retain the nominal twist given by Equation 6.2. Hence, under steady running conditions, the twist level in the balloon length will be greater than in the length above the lappet and slightly larger than in the length wound onto the bobbin.
The up-and-down movement of the ring rail gives a cyclic change in the balloon length during spinning. The length is shortest when the ring rail forms the nose of the cop build and longest at the shoulder. As the ring rail moves from the shoulder to the nose, the difference in length has to be quickly wound onto the bobbin. The velocity, VR, of the ring rail should be therefore included in Equation 6.10.
© 2003 by CRC Press LLC

Hence,
Ns – Nt = [VF – VR]/π DB (6.11)
when the ring rail moves up toward the nose of the cop, and
Ns – Nt = [VF + VR]/π DB (6.12)
when moving downward toward the shoulder. It is evident then that Nt will vary cyclically with the movement of the ring rail. The increase in the bobbin diameter as the yarn is wound onto the bobbin will increase Nt , and this will be superimposed on the ring rail effect. Clearly, then, there will be some variation in the twist per unit length along the yarn length wound onto a bobbin. In practice, the variation is small and often falls within the random variation of measurements. Furthermore, the difference between Ns and Nt is also small, and therefore, for practical purposes, Ns is used in calculating the nominal or machine twist.
From the above discussion, it should be evident to the reader that the size of the ring diameter limits the diameter of the yarn package that can be built in ring spinning. Package size is an important factor in machine efficiency, since each time a package is changed, the spinning process is disrupted, adding to the stoppage or downtime of the spindles. In modern high-speed weaving (i.e., shuttle-less looms) and knitting processes, yarn package sizes of approximately 2.5 to 3 kg are required; therefore, the yarn packages from ring and traveler processes have to be rewound to make larger packages. Chapter 7 describes the principles involved in the rewinding of spun yarns. However, here, it is important to point out that, when many ring-spun yarn packages are involved in making a full rewound package for subsequent pro-cesses, the quality of the fabric can be affected. This is because yarns from different spindles on a machine may vary in properties, owing to small differences in the machine elements from one spinning position to another. More detrimentally, there unknowingly may be a few incorrectly functioning spinning positions, i.e., rogue spindles. When the yarns from the different spindles are pieced together, they provide a continuous length on a large rewound package, and the variations in this continual length will eventually be incorporated into the fabric. If yarn from the rogue spindle is part of the pieced length, it may lead to a degrading fault in fabric. The larger the ring-yarn packages, the fewer for rewinding onto larger packages. There is also an advantage for the rewinding process, as there would be few piecings and less stoppage time to replace empty ring bobbins with full ones.
Increasing the ring diameter to produce larger cops has its limitations and disadvantages. We can see from Equations 6.8 and 6.9 that the frictional drag of the ring on the traveler increases with the square of the rotational speed of the traveler and with increased radius of the ring. Travelers are available in various forms (i.e., shape, base material and weight), but steel travelers are probably the most widely used. The frictional drag by a steel ring on a steel traveler during spinning will generate heat at the ring-traveler interface. In spite of high average temperatures (up to 300°C) being reached, the surrounding air removes only 10 to 20% of the total frictional heat by cooling; most of the heat needs to be conducted away through the
© 2003 by CRC Press LLC

ring.5 With the small contact area between the C-shaped traveler and ring, the heat can build up locally to much higher temperatures. Increased spindle speed and/or ring diameter, and thereby traveler speed, may then lead to a situation in which localized melting of the traveler occurs, and the traveler can no longer be effectively used for spinning. This is usually referred to as traveler burn, because, visually, the place on the traveler that makes contact with the ring becomes the blue-black color of heated metal.
In addition to the factor of traveler burn, there is the aspect of wear on both traveler and ring. The faster the traveler speed, the shorter the traveler life. The cautious spinner tends to quote a maximum practical speed for steel travelers to be within 35 to 40 m/s. However, research and development work by ring and traveler manufacturers, aimed at either reducing frictional wear and improving conduction of the heat generated at the ring-traveler interface, has resulted in new designs of the ring and traveler combination,6 the use of carbon rich steels, lubricated rings (oil impregnated sintered),7 and, in some cases, ceramic rings8 and special finishes. Certain developments have involved slowly rotating the ring while retaining the relative speed of the traveler. This process is called the living ring.9
Claims have been made for maximum traveler speed of 50 to 60 m/s.10,11
Figure 6.5 shows an example of an improved design, compared with the conven-tional ring-traveler geometry, and it can seen the greater surface contact would be beneficial.
We can reason from the above that increasing the yarn package size by using large diameter rings may mean reducing spindle speed and thereby production speed. Another means of increasing package size is by using a longer package length over which the yarn is wound. This is called the lift, and it inevitably means that the spinning position has a longer balloon height and balloon length. Two main factors, however, control the maximum balloon height: (1) balloon collapse caused by the
F.RF.R
H
LF
LS
FTK
FIGURE 6.5 Orbital ring and traveler: conventional T-flange system. (Courtesy of RieterMachine Works.)
© 2003 by CRC Press LLC

formation of a node in the yarn balloon during spinning and (2) increased yarn tension and thereby increased interruptions of the spinning by yarn breaks (i.e., end breaks) resulting in a lower machine efficiency, ε%.
From the simple theory of a vibrating string, it can be shown that the balloon height, H, balloon tension, TB, the spindle speed, NS, and the yarn count, CY , are related by
(6.13)
where C = the constant of proportionality
For a given yarn count and spindle speed, there must be a minimum balloon tension below which the balloon length, Lb, has the tendency to form a nodal point between the lappet and the traveler, resulting in balloon collapses. If we therefore wish to increase the balloon height for a given count and spindle speed, the balloon tension must be increased. However, as was stated earlier, too high a tension could result in increased end breaks and low machine efficiency. Since the traveler is pulled around the ring circumference by the yarn, the drag of the traveler mass, M, influ-ences the tension in the yarn. Also, if H is large, the required M could result in a spinning tension greater than the strength of the yarn being spun. To circumvent the use of too heavy a traveler, balloon control rings (see Figure 6.3) are used to prevent a nodal point from forming in the balloon profile (see Chapter 8). The lightest traveler mass, M, for a given balloon height, yarn count, and ring diameter DR is given by
(6.14)
where K = the constant of proportionality
With medium to coarse count yarns, say 40 to 100 tex, building sizeable packages requires the use of a balloon control ring. For very coarse counts, such as in the area of carpet yarns, it becomes necessary to spin with a collapsed balloon in order to produce a useful size spinning package for rewinding. See Figure 6.6. As the figure shows, the yarn balloon length partially wraps around the spindle, but such coarse yarns have sufficient strength to overcome the frictional drag of the spindle without breaking. The frictional contact with the spindle will resist the twist prop-agation toward the front drafting rollers, this is additional to the effect of the lappet. A false-twisting device fitted on the end of the spindle is therefore used to prevent spinning beaks because of low twist reaching the spinning triangle.
6.1.1.3.1 Spinning End BreaksThe weakest part of a forming yarn will be at the point of twist insertion. In ring spinning, this is the spinning triangle, just below the front drafting rollers (see Figure 6.3). During ring spinning, most end breakages will occur here. Three factors are
H CT B
CY NS2( )
------------------
12---
=
MKH2CY
DR
------------------=
© 2003 by CRC Press LLC

therefore of importance: (1) the number of fibers in the triangle and the variation of this number, (2) the propagation of twist to the apex of the triangle, and (3) the mean tension and tension fluctuation.
Clearly, the greater the number of fibers in the cross section of the forming yarn, the stronger the yarn will be to withstand the spinning tension and tension fluctua-tions, provided that the mean spinning tension is kept well below the breaking load of the yarn (typically 30% below mean yarn strength). End breakage problems will arise when the number of fibers in the cross section of the fiber ribbon varies significantly and/or the peak value of tension fluctuation is too high.
The variation of the number of fibers in the cross section causes thin and thick places in the fiber ribbon. As these pass through the twist insertion point at the apex of the spinning triangle, the thin places are more easily twisted than thick places; thin parts of the ribbon will tend to have more twist than thicker parts. A very thin part of the ribbon will become over twisted and weak (see ), and this will make the yarn susceptible to peak tension fluctuations.
From Equation 6.5, it is evident that the friction µ and the angle θ are important factors to the mean spinning tension, TS, and the fluctuation of this tension. It can
FIGURE 6.6 Examples of collapse balloon spinning. (Courtesy of Rieter Machine WorksLtd.)
© 2003 by CRC Press LLC

be seen from Figure 6.3 that θ will vary as the balloon length, H, rotates with the traveler. The spinning geometry therefore must ensure that fluctuation in TS is kept small.
TS is also dependent on the winding tension. Consequently, it is directly propor-tional to the mass of the traveler and inversely proportional to the bobbin radius; the spinning tension is usually high at the start winding and decreases as the package builds up. The appropriate traveler mass must be used in accordance with the yarn count (i.e., number of fiber in the yarn cross section), and the bobbin radius must not be smaller than 40% the ring radius (see Chapter 8).
6.1.1.4 Compact Spinning and Solo Spinning
These two systems are essentially modifications to the conventional ring spinning process with the aim of altering the geometry of the spinning triangle (see Figure 6.7) so as to improve the structure of the ring-spun yarn by more effective binding-in of surface fibers into the body of the yarn. This reduces yarn hairiness, and in the case of Solo spinning, makes single worsted/semi-worsted yarns suitable for use as warps in weaving and therefore dispensing with ply twisting.
As the name implies, with compact spinning (also called condensed spinning), the fibers leaving the front drafting roller nip are tightly compacted, making any
Conventional Compact Solo
To Ring andTraveler
Nip Line
Wy
TsTs Ts Ts
W2W1
Edgefibers
FIGURE 6.7 Compact and Solo spinning. (Courtesy of Rieter Machine Works and Prins,M., Lamb, P., and Finn, N., Solospun: The long staple weavable singles yarn, Proc. TextileInstitute 61st World Conference, Melbourne, Australia, April 2001, 1–13.)
© 2003 by CRC Press LLC

sign of a spinning triangle at the twist insertion point virtually imperceptible. The importance of compaction can be explained with reference to Figure 6.7. In the conventional system, the fibers are fed at width W1 into the zone of twist insertion. This width is the result of the attenuation by roller drafting and is dependent on such factors as the count of the in put material to the drafting system, i.e., of sliver or roving, the twist level in the roving feed, and the level of draft. The first two factors govern the width of the material fed into the drafting system, and W1 is directly proportional to this width. The level of drafting has a strong effect in that the higher the draft, the wider W1.13 The acuity of angle of the spinning triangle in the twist insertion zone is directly proportional to W1, twist level, and the spinning tension TS, but it is inversely proportional the yarn count. That is to say, these factors govern the difference between W1 and the yarn diameter, WY , at the apex of the spinning triangle. Because of this difference, the leading ends of fibers at the edges of the ribbon are not adequately controlled and twisted into the yarn structure. The result is that these fibers either have a substantial part of their length projecting from yarn surface as hairs, and thereby contributing little to the yarn strength, or they escape twisting all together as fly waste. In Chapter 1, we saw that yarn hairiness can be a problem in downstream processes and to fabric appearance.
Reducing W1 to W2 greatly improves the control and twisting into the yarn structure of the edge fibers. It should also be noted that, with the problem of incorporating edge fibers into the forming yarn and the resistance to twist propa-gation from the yarn balloon zone, the strength at the apex of the spinning triangle is generally only one-third of the yarn strength. This makes the spinning triangle a potential weak spot at which breaks occur during spinning. The reason is that the tension induced into fibers by the spinning tension is very small at the center of the spinning triangle as compared with at the edges. Therefore, when spinning fine yarns or yarns with low twist levels, the loss or the poor incorporation into the yarn of edge fibers means insufficient strength to withstand the spinning tension, and breaks occur. By greatly narrowing the width of the spinning triangle, compact spinning should improve both spinning efficiency and the structure and properties of ring-spun yarn. The structure-property relation of yarns is discussed in Section 6.2.
In Solo spinning, the drafted ribbon, instead of being compacted, is divided into sub-ribbons or strands that form the spinning triangle. At the apex of the triangle, the strands are twisted together, similar to plying of several yarns. This confers better integration of the edge fibers as fibers are trapped within and between strands.
Table 6.2 lists the basic features of the four techniques currently used to compact the spinning triangle. All utilize air suction and are essentially either a modification or an attachment to the front of a conventional type drafting system.
With the ComforSpin process (Figure 6.8), a perforated drum (A) replaces the conventional grooved bottom-front roller of a 3-over-3, double-apron (DA) drafting unit. A second top-front roller (C) makes a second nip line with the perforated drum, below which the compacted spinning triangle is formed. The nip line of the front drafting zone is made by the contact of the top-front roller (B) with the drum, enabling the fiber mass to be attenuated in the normal way, producing ribbon width
© 2003 by CRC Press LLC

W1 (see Figure 6.7). Suction is applied from within the drum through a slotted tubular screen (S) so that, as the perforated drum rotates, the screen enables a controlled airflow through the perforations passing over the slot to firmly hold the drafted fiber ribbon to the drum surface, leaving the nip line at roller B. The slot is specially shaped for the drafted ribbon to become compacted from width W1 to W2 by the
TABLE 6.2The Compacting Systems in Ring Spinning
Manufacturer Trade names Basic features
Rieter Machine Works Ltd.
Com4Spin orComforSpin
4-over-3 double apron drafting system with perforated bottom front roller and two top rollers; drafted ribbon compacted by air suction through bottom front roller
Spindelfabrik Suessen
EliTe 3-over-3 double drafting system with addition roller and special lattice apron, moving around slotted, air suction tube (tubular profile) for compaction of drafted ribbon
Zinser Textilmaschinen GmbH
Air-Com-Tex700
4-over-4 double apron drafting system with perforated apron circulating around top front roller; drafted ribbon in front zone compacted by suction through perforated apron
Maschinen-und Anlagenbau Leisnig GmbH
P4 4-over-4 double apron drafting system with perforated apron circulating around bottom front rollers; drafted ribbon in front zone compacted by suction through perforated apron
W1
W2
C A
BDA
FIGURE 6.8 ComforSpin compacting system. (Courtesy of Stalder, H., and Rusch, A.,Successful compact spinning process, Int. Text. Bull., 1, 42–43, 2002.)
© 2003 by CRC Press LLC

time it reaches the final nip line at roller C. Beyond this, twist is inserted as in conventional ring spinning.
In the Elite system, the basic drafting rollers are retained with an additional unit fitted at the front (see Figure 6.9). The added unit consists of a transport apron of lattice weave — 3,00 pores/cm2, which passes closely over the surface of a specially shaped, slotted, suction tube — tubular profile. Suction occurs at the interstices of the apron moving across the slot of the tubular profile. The plan view shows that the slot can be inclined at 30° to the center line of the apron, which thereby causes the motion of the apron to effect a rolling of the drafted ribbon as the ribbon is being compacted. This is useful when spinning uncombed cotton, i.e., carded cotton, as the very short fibers become more embedded in the final yarn. The additional top roller is geared to the top front drafting roller at a slightly higher surface speed. The additional top roller drives the transport apron via friction contact at the nip line. The drafted ribbon is therefore under tension, straightening fibers, during compaction.
The Air-Com-Tex 700 and CSM units use an alternative apron arrangement to the Elite unit for compaction, but, similar to the latter, compacting occurs after the front drafting rollers. The alternative arrangement is simply an added conventional
FIGURE 6.9 (See color insert.) The Elite compacting system; SD = staple diagram showingcontrol of short fibers. (Courtesy of Spindelfabrik Suessen.)
© 2003 by CRC Press LLC

apron-drafting zone with a line of perforations down the middle of the apron width through which suction is applied. The Air-Com-Tex 700 has only a perforated bottom apron, whereas the CSM has double aprons, of which only the top one is perforated.
Figure 6.10 shows the attachment at the front pair of drafting rollers used for the Solo spinning process. This consists of an addition roller (F), the Solospun roller, mounted via a bracket clip (C) onto the top front-drafting roller shaft (E) of the drafting arm. The Solospun roller has a series of circumferential grooves along its length, and it forms a nip line with the bottom front-drafting roller. It is the presence of the grooves in the Solospun roller that results in the drafted ribbon being divided into a number of strands that are twisted together to form the Solospun yarn.
6.1.1.5 Spun-Plied Spinning
A singles conventional ring-spun yarn of low twist will be hairy and have low abrasion resistance but, if woven or knitted, would give the fabric a soft feel. The above Solo and compact ring spinning systems produce singles yarns with much lower hairiness than conventional ring-spun yarns; however, these systems have yet to become widely used. To weave or knit low twisted conventional ring-spun yarns, it becomes necessary to trap the surface fibers by producing a twofold yarn. The conventional way of producing a twofold yarn is to ply together two single yarns using one of various techniques to be described later. There are economic advantages to be obtained if spinning and plying can be achieved as one process, and Figure 6.11 shows how this may be done.
Figure 6.11 shows two strands of roving passing through the same drafting unit but separated so that they emerge from the front drafting rollers a fixed distance apart. They then converge to a point at which the twist torque propagating from the
AF
FIGURE 6.10 Solo spinning system: A = yarn, B = bottom front rollers, C = clip, D = topfront roller, E = top roller shaft, F = Solo roller. (Courtesy of Prins, M., Lamb, P., and Finn,N., Solospun: The long staple weavable singles yarn, Proc. Text. Inst. 61st World Conference,Melbourne, Australia, April 2001, 1–13.)
© 2003 by CRC Press LLC

yarn ballooning region inserts twist into the separate strands and plies the twisted strands together to form the twofold yarn. The strand twists propagate to form two very small, almost imperceptible, spinning triangles at the front drafting rollers. The strand and ply twists are of the same twist direction (see Figure 6.12). In case one of the strands breaks during spinning, the yarn guide below the front rollers has the function of breaking the remaining strand, and the suction tube (termed a pneumafil) is positioned near the front roller to collect the fibers that would still be issuing from the front rollers. Figure 6.13 shows a variation of the spun-plied arrangement, called Duospun,14 where a specially designed suction nozzle replaces the yarn guide and pneumafil.
It is important to note that twist must be present in the individual strands if the surface fibers are to be suitably held in the twofold yarn structure. With only ply twist to hold fibers into the yarn structure, there will still be many fibers having much of their length projecting from the plied structure. With strand and ply twist, the fibers are more effectively trapped by every turn of ply twist, and for twist to be inserted into the strands, they must be spaced apart.
As fibers leave the front drafting rollers, they are incorporated into the strands in a similar way to conventional ring spinning. Therefore, unless the strand twist is high, there will be some fiber lengths projecting from the strands. The propagation of strand twist toward the nip of the front rollers means that a given projecting length will be rotating about the axis of the strand into which the remaining length of the fiber is twisted. Owing to the geometrical arrangement of the strands, as they converge, many of the projecting lengths will eventually strike the neighboring stand,
FIGURE 6.11 Sirospun system. (Courtesy of Morgan, W. V., Sirospun on long-staple spin-ning, I. W. S. Text. Eng. and Process. Tech. Inf. Lett., 2, 1–10, 1981.)
© 2003 by CRC Press LLC

which prevents them from rotating further. As the strands become plied, these fiber lengths are trapped between the two strands. This mechanism of trapping is called yarn-formation trapping. However, most surface fibers will have their lengths twisted into a strand prior to being trapped by the ply twist. This mode of trapping is called strand-twist migration trapping.
There is a balance of tensions at the convergence point, where the strand twist angle will almost coincide with the ply twist angle. Better trapping of the fibers occurs with greater differences between the twist angles. By varying the spinning tension, the twist propagating into the strands will vary, and so will the twist angle.
Variations in spinning tension occur with the cyclic up-and-down motion of the ring rail. When the convergence point is in its top position, the twist in the strand is at a maximum. As the tension in the plied yarn increases with the downward movement of the ring rail, the frictional contact between the strands at the conver-gence point increases, decreasing the amount of twist propagating into each strand and the strand twist angle. There is a resulting decrease in twist contraction of the strands, and the convergence point moves downward with the associated increase in strand lengths.
With the upward movement of the ring rail, the tension in the plied yarn decreases, enabling the strand twist and twist angle to increase; the strand lengths shorten with twist contraction, and the convergence point moves upward. The cyclic motion of the ring rail causes the convergence point to also cycle up and down and effects better trapping of fibers in the spun-plied structure.
FIGURE 6.12 Strand and ply twist. (Courtesy of Zinser Ltd.)
© 2003 by CRC Press LLC

This tension fluctuation causes only small imbalances in the tensions at the convergence point and gives only up to 20 turns per meter of strand twist level.15,16
Deliberate cyclic perturbation of the convergence point17 can be done with a pair of rollers profiled to nip and then release the plied yarn just below the convergence point. When the plied part of the yarn is nipped, the ply twist and the strand twist above the nip point will decrease, and the strand lengths increase. The ply twist below the nip point increases to a higher than normal value. When the nip is released, the converse occurs, and the flow of twist in the strand is then higher than the normal value. Deliberate cyclic perturbation gives more extreme twist variation, where the strand twist levels then can be up to 60 to 100 turns per meter. At the higher strand twist levels, there are few fiber lengths projecting from the strands. Therefore, strand-twist migration trapping becomes the dominant mode. Without deliberate cyclic perturbation, yarn formation trapping is the dominant mode.
The length of the individual strands above the convergence point increases with stand spacing, and the amount of twist that is available for trapping as strand twist also increases. Thus, at low strand spacing, trapping of fiber ends by the yarn-formation mode is dominant.
Yarn abrasion resistance, low hairiness, and adequate strength are important factors affecting weavability. The yarn hairiness decreases, and abrasion resistance increases, with stand spacing.
FIGURE 6.13 Duospun spun-plied unit. (Courtesy of Berkol Unicomb.)
© 2003 by CRC Press LLC

6.1.1.6 Key Points
Generally, ring and traveler systems have the following technical advantages and disadvantages.
6.1.1.6.1 Advantages
• They offer a wide spinning count range, e.g., 5 to 300 tex.• They provide the ability to process most natural and man-made fibers and
fiber blends.• They produce staple yarns of tensile strength and handling aesthetics suit-
able for the majority of fabric end uses. The properties of ring-spun yarns are therefore used as a standard against which new yarns are compared.
6.1.1.6.2 Disadvantages
• Even in the ideal situation of no end breaks, spinning is still discontinuous, because it has to be interrupted for doffing.
• To attain high twisting rates and thereby high production speed, the yarn package must be reduced in size, resulting in frequent stoppages for doffing.
• The maximum mechanical speed is restricted by the frictional contact of ring and traveler and yarn tension.
• Bobbin size is restricted by the ring diameter.• Yarn has to be rewound to produce larger size packages (see Chapter 8).• Usually, the preparatory processes have to include roving production;
spinning from sliver would be more economical.
It is important to note that the first four of the above limitations arise because, in ring spinning, twisting and winding of the yarn onto a bobbin are combined in the one action of the traveler being pulled around the ring.
The alternative spinning methods listed in Table 6.1 enable twisting and package building to occur as separate, simultaneous actions. Some of these methods retain twist in the spun yarn. With others, the twisting action is a temporary means of imparting integrity to the attenuated fiber mass forming the yarn bulk while this mass is either helically wrapped with a filament or staple fibers or bonded chemically or mechanically to obtained final integrity and strength. By separating twisting from package building, larger size packages can be made but, importantly, higher twisting rates also can be achieved to give faster production speeds as Figure 6.2 shows.
6.1.2 OPEN-END SPINNING SYSTEMS
With the open-end (OE) spinning method, twisting and package building are sepa-rated by employing the false-twist principle (see Chapter 1). Real twist is, however, achieved in the yarn by forming a break in the attenuated mass at the point of twist insertion. The break is obtained by drafting the fiber mass to the point of individual fiber separation (see Figure 6.14). An alternative description is that the free end of the yarn (i.e., the open end) is rotated while individual fibers are collected and twisted
© 2003 by CRC Press LLC

onto the end to increase the yarn length. Hence, the term open-end spinning or, based on the first description, break spinning.
Definition: Open-end spinning or break spinning is a process in which fibrous material is highly drafted, ideally to the individual fiber state, creating a break in the continuum of the fiber mass. The individual fibers are subse-quently collected onto the open end of a yarn that is rotated to twist the fibers into the yarn structure to form a continuous yarn length. The length of yarn spun is then wound to form a package. Thus, the twisting action occurs simultaneously but separately from winding.
This definition outlines the basic requirements for any OE spinning system. Such a system would comprise the following:
1. A device for drafting the fibrous mass into individual fibers2. A means of transporting the fibers and depositing the fibers onto the yarn
end3. A device for collecting the separated fibers onto the yarn end in a manner
that enables the correct yarn count to be obtained4. A device for rotating the yarn end to insert twist into the collected fibers5. A means of winding the yarn into a package
A number of spinning techniques exploit the OE method,18 but only two have achieved commercial success: rotor spinning and friction spinning. Of the two, rotor spinning is the more widely used commercially, because a wider range of yarn counts can be spun with suitable yarn properties.
Drafting toIndividualFiberSeparation
Open End: Twistof Fibers into YarnStructure
PackageWinding
Open-End SpinningRing Spinning
FIGURE 6.14 Comparison of ring spinning and open-end spinning principles. (Courtesyof Rohlena, V., Open-End Spinning, Chap. 7, Elsevier Science, New York, 1975.)
© 2003 by CRC Press LLC

6.1.2.1 OE Rotor Spinning
Figure 6.15 illustrates the essential features of a rotor spinning system. These are
• The feed roller and feed plate• A saw-tooth or pin covered roller called an opening roller• A tapered tube termed the fiber transport channel• A shallow cup, called a rotor (A groove is cut into the circumference at
the maximum internal radius of the rotor and is referred to as the rotor groove.)
• A flanged tube facing the rotor base and coaxial to the rotor, termed the doffing tube
• A pair of delivery rollers that feed the spun yarn to the package build device
The opening in the opening roller housing enables trash particles to be ejected from the process into a trash box, thereby providing additional cleaning of the fiber mass. In practice, most of the rotor unit components can be varied to alter the properties of the yarns and/or increase production speed. This aspect will be con-sidered later, in Section 6.2, where the effect of machine variables on yarn properties will be described in detail. Here, a general description of the principle is given.
Fibers are presented to the rotor system in the form of a sliver. The feed roller and feed plate push the sliver into contact with the opening roller. The opening roller
TrashEjection
FiberTransportChannelOpen End
Yarn
FeedRoller
Sliver Feed
Feed Plate
Doffing tube
Rotor
OpeningRoller
FIGURE 6.15 (See color insert.) Main features of a rotor spinning system. (Courtesy ofW. Schlafhorst AG & Co.)
© 2003 by CRC Press LLC

rotates much faster than the feed roller. This means fibers in the sliver are hooked by the sawteeth or pins and separated under a high draft ratio into individual fibers by the opening roller. The separated fibers are removed from the opening roller clothing by air suction flowing down the transport channel and into the rotor; the suction is generated externally to the rotor. The rotor is therefore under a partial vacuum.
The separated fibers are further drafted during their transportation in the airflow to the rotor. The fibers are individually deposited onto the internal wall of the rotating rotor and slide down the wall and into the rotor groove. Here, they accumulate to form a ribbon of fibers. To initiate spinning, the tail end of a yarn length (seed length) already wound onto the package by the package build device is threaded through the nip of the delivery rollers and into the doffing tube. The partial vacuum in the rotor sucks the tail end of the yarn into the rotor. The rotation of the rotor develops air drag and centrifugal forces on the yarn, pulling the yarn end into contact with the collected fiber ribbon. Simultaneously, the tail end is twisted with each revolution of the rotor. This twist propagates toward the tail end of the yarn and binds the ribbon onto the yarn end. Once the yarn tail enters the rotor, the delivery rollers are set in motion to pull the tail out of the rotor. The pulling action on the tail results in the peeling of the fiber ribbon from the rotor groove. The degree of twist that is inserted into the tail will propagate into each length of ribbon peeled from the groove, thus forming the next length of yarn. The process is continuous because of the conservation of mass flow; i.e., the following rates of mass flow are equal:
• Sliver feed rate• Buildup of the fiber ribbon to give the required yarn count• Rate at which the ribbon is peeled from the groove and twisted to form
the yarn• Rate at which the formed yarn is pulled from the rotor and wound onto
the package
In Section 6.2, a detailed description is given of the buildup of the fiber mass into a ribbon of fibers and the conversion of the fiber ribbon into the rotor yarn structure. Here, we will consider more fully the insertion of twist into the fiber ribbon.
6.1.2.1.1 Twist InsertionFigure 6.16a and b shows the side elevation and plan view of the yarn path in the rotor. The point at which the ribbon is pulled from the rotor groove is called the peel-off point, P. Since the ribbon is pulled at the delivery roller speed, Vd, the peel-off point circulates the circumference of the rotor at a rotational speed of Vd /πDR, where DR is the rotor diameter. This means that, relative to the doffing tube, the peel-off point rotates faster than the rotor such that
NP = NR + Vd /πDR (6.15)
where NP and NR = the peel-off point and the rotor rotational speeds
To insert twist into the fiber ribbon to produce the yarn, sufficient twist torque must be present at point P in Figure 6.16. This keeps the forming yarn from breaking
© 2003 by CRC Press LLC

at P as a result of the high tension induced in AP by centrifugal forces. The rotor generates the twist torque as it carries the yarn tail AP through each revolution; QAP is, therefore, similar to a crank. The cranking action induces twist in the length QA. The twist torque builds up and propagates to P. In doing so, it has to overcome the barrier, at A, of the doffing tube and that caused by the narrowness of the rotor groove (See Figure 6.16d). The spinning tension and the doffing tube geometry are therefore important factors. Surmounting the twist barriers requires a higher machine twist setting than is used in ring spinning. However, the central area at A, termed the doffing tube navel, can be altered to assist in reducing the twist level required to spin. There are many differing types of doffing tube navels that may be used (see Figure 6.17). The most contrasting effect is obtained between the smooth and the grooved navels. Essentially, the grooved navel gives a false-twist effect at A in Figure 6.16. Thus, if the yarn is being spun with Z twist, say Z1, then the grooved navel will give additional Z twist, say Z2, in the yarn tail AP. As this yarn length with Z1 + Z2 twist subsequently passes A and becomes AQ, the Z2 twist is removed by S2 twist, leaving only the nominal Z1 twist in the yarn. The additional Z2 twist enables twist propagation into a small but important part of the fiber ribbon length within the rotor groove. With the use of the smooth doffing tube, the twist stops at the peel-off point, P. Because of fluctuations in spinning tension, this is therefore a point most likely to break with peak tensions. The grooved doffing tube inserts twist up to 10 mm in the fiber ribbon length beyond the peel-off point, P; that is to say, the twist insertion and peel-off points do not coincide; there is a twist insertion point beyond the peel-off point. This
Rotor
Air Drag
CoriolisForce
Yarn TailA
P
PA
Yarn Tail
Q
Rotor GrooveTwist Zone
Spinning Tension
P
(a)
(c)
(b)
(d)
=Vector Groove Angle
FIGURE 6.16 Yarn tail inside the rotor. (Courtesy of Zhu, R. and Ethridge, M. D., A Methodfor estimating the spinning-potential yarn number for cotton spun on the rotor-spinning system,J. Text. Inst., 89(2), 275–280, 1998.)
© 2003 by CRC Press LLC

extended twisted length in the rotor groove is referred to as the peripheral twist extent(see Figure 6.16c). It strengthens the peel-off point and enables spinning at lower machine twist settings. Figure 6.17 shows what is termed a torque stop. If this is positioned to contact the yarn length AQ, then the twist flow along AQ will be restricted, causing a build up of twist at A and thereby increasing the twist level in AP.
Even though the above developments improve twist flow along the yarn tail, AP, a minimum of 100 fibers in the yarn cross section is required to efficiently spin on the open-end rotor system. This gives a physical limit to the fineness of count that can be rotor spun.19 Except for very short fibers (e.g., comber waste and blends), which would have to be spun at coarse counts, the minimum figure is almost independent of fiber length. For ring spinning, because twist usually flows readily to the spinning triangle, the minimum figure is within 40 to 90, depending on fiber length, strength, and twist level. In ring spinning long-staple fibers, the forming yarn is more able to withstand tension fluctuations than is the case for spinning short-staple fibers. Therefore, for a given fiber fineness, the longer the fiber, the smaller the minimum number of fibers required in the yarn cross section for ring spinning.
6.1.2.1.2 End Breaks during SpinningFrom the above explanation of the twist insertion, it can be seen that fluctuation in the rotor spinning tension and variation of the number of fibers in the cross section at the peel–off point, P, are very important to a low-end breakage rate during spinning. However, a more critical factor is the buildup of impurities in the rotor groove, as these block the twist flow into the fiber ribbon. Since the occurrence of rotor deposits is related to fiber deposition, the topic is deferred to Section 6.2.3.4.
6.1.2.2 OE Friction Spinning
The fundamental difference between open-end friction spinning and open-end rotor spinning is the way in which fibers are collected and twisted onto the tail end of the seed yarn. In friction spinning, the fibers are not collected to form a fiber ribbon that is then twisted. Instead, the fibers are individually collected and twisted onto the yarn. Two rotating, perforated, cylindrical rollers insert the twist by frictional rolling of the yarn tail while simultaneously twisting fibers onto the yarn tail. The
Doffing Tube Navels Torque Stop
SmoothGrooved
FIGURE 6.17 (See color insert.) Examples of doffing tube navels and twist block device.(Courtesy of W. Schlafhorst AG & Co.)
© 2003 by CRC Press LLC

rollers are often referred to as the spinning drums or friction drums. Figure 6.18 illustrates the commercial process known as Dref-2.
Commonly, two pairs of feed rollers feed four or five slivers in parallel to an opening roller. The objective is to process a wide range of staple lengths, i.e., up to 120 mm. Therefore, for simplicity, a feed plate is not incorporated, the opening roller is much larger than in rotor spinning, and the fibers are blown off the saw-tooth clothing of the opening roller and into the collecting zone for twisting.
The collecting zone is formed by the close positioning of the two spinning drums. This effectively gives a V-shaped groove parallel to the rotation axes of the drums. A rotating disc with projections around its circumference may be used to assist in
+ +
++
1. Card Drum2. Inlet System3. Air Current4. Spinning Drum5. Parallelizer6. Outlet Roller7. Winding Device
FIGURE 6.18 (See color insert.) Dref-2 open-end friction spinning system. (Courtesy ofFehrer AG.)
© 2003 by CRC Press LLC

aligning fibers parallel to the groove axis just before their deposition. Its purpose is to get the full fiber lengths contributing to yarn length and to attain a parallel assembly of fibers in the spun yarn, as these two factors are critical to yarn strength. As the drums rotate, suction is applied through the holes at the V-shaped groove, enabling compaction of the fibers as the yarn structure is formed. The tail end of the yarn being spun is held in the groove by the suction force. The drums have the same directions of rotation. Hence, as well as being compacted, the depositing fibers are twisted onto the tail end by frictional contact with the drums. As the yarn length is spun, it is pulled along the groove by the delivery rollers and, finally, wound onto a bobbin to make a yarn package.
The Dref-2 system can be used to advantage in the spinning of core spun yarns. The deposition and twist of fibers onto the yarn tail provide the opportunity for the yarn tail to be replaced by a filament core, which would then become fully covered by a staple sheath as fibers are deposited and twisted onto the filament. In this situation, the continuous filament yarn would pass from a filament package, through a thread tensioning guide, along the V-shaped grooved formed by the spinning drums, and via delivery rollers to the package build device. (See Figure 6.18.)
The fiber deposition in the Dref-2 system does not result in a straight and parallel arrangement of the fibers in the spun yarn (see Section 6.2). As a result, the Dref-2 is only suitable for spinning very coarse count yarns (see Figure 6.1). The aspect of fiber straightening during deposition in OE spinning systems has been a focus of much research over the years, particularly with regard to OE friction spinning of finer yarn counts. However, no suitable fine-count OE friction system has yet reached commercial success. An alternative to OE friction spinning is friction wrap spinning, which has enabled the spinning of yarns within the coarse- to medium-count range. This system is described in Section 6.1.4.
The technological equations for total draft and twist factor are applicable to the friction spinning process. However, the equation for computing machine twist, t, must account for the relative diameters of the yarn and the spinning drum and the factors controlling the friction mechanism of twist insertion. Thus, it would be given by
(6.16)
where K = a twist efficiency factor (<<1) that is indicative of the frictional contact between yarn and drums
D, d = drum and yarn diameters, respectivelyND = rotational speed of the drumsVd = yarn delivery speed
It is evident that fiber-metal friction and fiber torsional rigidity will significantly influence K. Generally, it is not often practicable to alter these properties, particularly if processing natural fibers. With continuous operation, the running machine tem-perature rises, and components can expand and alter settings. The size of the V-shaped groove, and also the fiber-metal friction, may change. Experimental studies have shown that, as a result of such changes, friction slippage can occur as illustrated
tKDN D
dV d
----------------=
© 2003 by CRC Press LLC

in Figure 6.19. Because of slippage, K can be as low as 0.1 to 0.3. Suitably designed components can minimize the problem of altered settings with running time, and appropriate suction can be used to reduce the effect of twist slippage resulting from changes in fiber-metal friction. The suction applied can be measured as negative pressure in millimeters of water. Figure 6.19 also shows that twist slippage decreases linearly with negative pressure over the available range for Dref-2 system.20 However, as the figure also shows, the yarn count, the drum speed, and the delivery speed also influence twist slippage. In practice, the equation of t is of little use, and twist setting of the machine is usually set by yarn measurement and experience.
Figure 6.2 shows that, compared with other spinning processes, OE friction spinning is one of the fastest production systems. However, as stated previously, the process is currently suitable only for spinning yarns at the coarse end of the yarn count range. Much research and development work has been carried out in trying to commercialize machines for the medium to fine end of the count range — so far without success. The principal reason for the lack of success has been the poor yarn properties as compared to ring- and rotor-spun yarns.
6.1.3 SELF-TWIST SPINNING SYSTEM
Definition: Self-twist spinning is a process in which two fibrous strands are separately false-twisted to give alternating S and Z twist along their lengths. Both strands are then brought together in frictional contact for the untwist-ing torque of the S–Z twist to ply the strands, producing an alternating Z and S twisted twofold yarn.
The alternating S-Z twist in each strand is obtained by false-twisting the strands up to the point on an S-Z false-twist curve at which the near-maximal twist value is obtained for both twist directions. Figure 6.20 illustrates this. For a continuous
+
+
++
++
++
+
+++
+80
78
76
74
72
70100 15050
55 110 165 220Take-Up Speed (m/min)
Negative Pressure (mm H2O)
NegativePressure
Take-UpSpeed
1 Fan2 Fan
Ave
rage
Slip
(%
)
Ave
rage
Slip
(%
)
84
80
76
72
68
641000 2000 3000
150 Tex
Friction Drum Speed (rpm)
600 Tex300 Tex
FIGURE 6.19 Friction slippage in Dref-2 spinning.
© 2003 by CRC Press LLC

twisting process, the twisting device would have to be repeatedly rotated clockwise then counterclockwise, the change in direction being made when the maximal twist value is reached.
We can see from the figure that each S-Z twisted strand can be related to a sinusoidal wave plotted on Cartesian axes, where the twist level and directions are along the y-axis and the twisted length along the x-axis. Thus, λ represents the wavelength, and in terms of the yarn length is called the cycle length, X. Making the sinusoidal wave analogy allows us to consider the relative positions of lengths in the strands with the same twist direction in terms of the phasing of waves. Let us consider the two extremes of phasing. As shown in the figure, two strands having their S and Z lengths and no-twist zones coincident are in phase or are zero-degree phased. If the lengths are displaced such that the S lengths coincide with the Z lengths (i.e., a1 now faces b2), then the strands would be 180° out of phase or 180° phased. When the twisted strands are phased by 180°, they have opposing untwisting torque, the self-twist action cannot take place, and no yarn will be formed. Theo-retically, the optimal phasing is 90°, because this should give the maximal yarn strength. Figure 6.21 illustrates the 0 and 90° phased yarns. It can be seen that the former has the no-twist zones of the strands and the ply coming together at the same place in the yarn, whereas the latter has the no-twist zones coinciding with the Z-twist (and S-twist) regions of one or the other strand.
Various false-twisting arrangements can be used to produce self-twist (ST) yarns.21 However, the commercial process known as Repco spinning utilizes friction twisting by a pair of reciprocating rollers. Figure 6.22 illustrates the Repco ST
Point of DynamicEquilibrium
S
Z
S
NT NTD
Z
a1 a2
b1 b2
X axis
λ X
In Phaseor
0° Phased(Plying Action)
180° Phased(No Plying Action)
a1 a2 - S Twist Zoneb1 b2 - Z Twist ZoneNT - No Twist Zoneλ - Wave LengthX - Cycle Length
FIGURE 6.20 Principle of self-twisting.
© 2003 by CRC Press LLC

system. Since two rovings have to be fed to each spinning position, the apron drafting system is designed to attenuate eight separately spaced rovings. The reciprocating rollers are placed immediately after the front drafting rollers. As well as reciprocat-ing, these rollers move the alternating S-Z twisted strand to the phasing zone. The region between the front drafting roller and the reciprocating rollers is termed zone I. Zone II is the region from the reciprocating rollers to the phasing zone, zone III. At any instant in time, the strand lengths in zone I will have the opposite twist direction to the lengths in zone II.
In zone III, there are a pair of guides at each spinning position, which enables the phasing and self-twisting of the strands. From Figure 6.23, it can be seen that phasing is achieved by one strand, S2, moving through a slightly longer path (d–e–f) than the other, S1, c–f. Phasing therefore occurs through the corresponding lengths of the strands, with the same twist directions being displaced by the distance, e–f, i.e., the separation distance of the guide. If y is the separation distance and X the cycle-length corresponding to 360°, then the phasing, θ, can be obtained from the expression
Zero PhaseST – Yarn
Twist ChangeOver Zone
S – TwistPly
Z – TwistStrand
Z – TwistPly
S – TwistStrand
90° PhaseST – Yarn
FIGURE 6.21 Self-twist yarns of 0 and 90° phasing.
© 2003 by CRC Press LLC

For the Repco system X = 22 cm, and y = 1.85 cm. Therefore, the strands have a 30° phasing. A major disadvantage in using displacement to phase the alternately twisted strands is that they will begin untwisting before coming together. The twist loss will be greater with a higher degree of phasing and, consequently, so will the strength of the ST yarn. Thus, 30° phasing is the optimum for maximum strength of Repco ST yarns.
+
+
+ + +
+ ++
7.5 cm
Stro
ke
ST Yarn
ST YarnPackage
ConvergencePoint
Alternately TwistedStrand
Front Rollers OfDrafting System
Apron RollersRoving
Grooved WindingDrum
AlternatelyTwistedStrand Twisting Rollers
Reciprocate On Air BearingsAnd Individually Driven By
Cycloidal Pots
Mg
B
C
D
E
FIGURE 6.22 (See color insert.) Repco ST spinning system. A. Roving feed, bottomdrafting rollers, and apron. B. Top rear, drafting roller. C. Top apron of drafting system.D. Special grooved top, front drafting roller. E. Reciprocating friction rollers.
yX---- θ
360---------=
© 2003 by CRC Press LLC

The combined action of the twist-inserting rollers of reciprocation and feeding the strands to the phasing zone is achieved with a cycloidal drive arrangement.21
The twist inserted by the reciprocating rollers is dependent on the applied normal load, N, to the reciprocating or ST rollers; the stroke length; the effective strand diameter; the surface friction coefficient, µ, between fiber and ST roller; and the oscillating frequency. The number of twists per cycle of oscillation is given by
(6.17)
where Ω = a twist efficiency factor dependent on µ and NL = the stroke length = 7.6 cm for the Repco systemd = the effective diameter of the strands
Using the sinusoidal wave analogy, it can be shown theoretically21 that the total number of twist in the strand length in zone I is
(6.18)
Nip Line OfTwisting Rollers
ConvergenceGuides
Alternately TwistedStrands
S1 S2
c d
f e
FIGURE 6.23 Self-twist yarn phasing on Repco system.
Turns per oscillation Ω2Ld
-----------=
Y uLu sin 2πx/X( ) α–[ ]
d X2 4π2u2+[ ]---------------------------------------------------=
© 2003 by CRC Press LLC

And, in zone II is
(6.19)
where u, v = the respective lengths of zones I and II
α = 2πu/X and γ = tan [X2 – 4π2uv]/[2πX(u + v)]
With alternating twist, it is more convenient to consider twist per half cycle (i.e., half-cycle length) than total twist or twist per unit length. If ƒ is the oscillation (or reciprocating) frequency, and V is the speed at which the strands are fed to the phasing zone, then the cycle length, X, is given by
X = V/f
and the twist per half cycle is given by
The twist factor (TF) is then
(6.20)
In practice, values for Ω and d are not easily obtained for predicting t(1/2), so the strand and plied twists are measured. Figure 6.24 shows a graph of t(1/2) vs. Tt
–1/2
for various values of L.21 As would be expected, t(1/2) increases with L. However, importantly, for a fixed X, TF remains constant for all yarn counts without the need to alter the rate of twisting as is required in ring and rotor spinning when differing counts are needed to be spun with the same twist factor.
6.1.4 WRAP SPINNING SYSTEMS
Definition: Wrap spinning is a process whereby a drafted ribbon of parallel fibers that constitutes the bulk of the spun yarn is wrapped by either surface fibers protruding from the ribbon or by a continuous filament or filaments so as to impart coherence and strength to the resulting yarn.
Table 6.1 indicates that there are two systems that utilize surface fiber wrapping, and two that employ filament wrapping.
Y v2πuvXL 2πx/X( ) γ–[ ]sin
d X2 4π2u2+[ ] X2 4π2v2+[ ]---------------------------------------------------------------------------=
t 1 2⁄( )4ΩLdX
----------- 4ΩLfdV
--------------= =
TF2t 1 2⁄( )T t
1 2⁄–
X-----------------------------=
© 2003 by CRC Press LLC

6.1.4.1 Surface Fiber Wrapping
6.1.4.1.1 Dref-3 Friction SpinningThe Dref-3 spinning system22 is a friction spinning process that is effectively based on the core-yarn spinning technique of the Dref-2 system. Figure 6.25 shows that a staple fiber ribbon is fed from a roller drafting unit (drafting unit I) into the V-shaped groove formed by the spinning drums (spinning unit). Fibers traveling from the opening rollers (drafting unit II) are deposited onto the drafted ribbon of fibers. Twin opening rollers are used to obtain a high degree of fiber separation. The drums generate false twist into the fiber ribbon while wrapping the deposited individual fibers around the fiber ribbon.
6.1.4.1.2 Air-Jet Spinning
Tandem Jet SystemA second technique of surface fiber wrapping is generally known as fasciated yarn spinning,23,24 and the commercial process, which used to produce 100% polyester and polyester-cotton/polyester-viscose blends, is widely referred to as air-jet spinning or Murata jet spinning (MJS, named after the machine manufacturer, Murata Co.).25,26
This spinning system consists of a 3-over-3 high-speed roller drafting unit, two compressed-air twisting jets arranged in tandem, a pair of take-up rollers, and a yarn package build unit (see Figure 6.26). The basic design of a jet (not a commercial
+
++ +
++++
++++
++
0
50
100
150
200
250
300
0.1 0.2 0.3
Stra
nd T
wis
t/1/2
Cyc
le
A
B
C
D
FIGURE 6.24 Strand twist per half cycle vs. reciprocal strand count.
© 2003 by CRC Press LLC

design) is illustrated in Figure 6.27. As shown, there is a central tubular channel (the spinning channel) through which the ribbon issuing from the front roller of the drafting unit passes.
Inclined to the spinning channel axis, but tangential to the circumference, are four nozzles through which compressed air is injected into the channel to create a vortex flow. Each compressed air jet entering and expanding into the channel has two velocity components of airflow: V1, a circular motion of the air around the channel circum-ference, and V2, the movement of the air to the channel outlet. The suction at the jet inlet created by V2 gives automatic threading up of the spinning process. Provided the drafted ribbon is not taut within the channel, the V1 component of flow rotates it, inducing a false-twist action and a spinning balloon (i.e., a rotating standing wave-form) while V2 assists movement of the twisted ribbon through the channel.
Referring to Figure 6.26, the surface speed ratio of take-up rollers to front drafting rollers is within 0.9 to 1.0. A counterclockwise vortex is set up in jet 1 to give a Z-S false-twisting action, and a clockwise vortex in jet 2 gives an S-Z action. The pressures applied to the jets are such that P2 >> P1; i.e., jet 2 has the higher twisting vortex.
Although the jets impart false twist, while doing so they do not have a positive hold on the ribbon being twisted. High-speed photographic studies27,28 have shown that the absence of a positive hold enables S twist from jet 2 to propagate along the
FIGURE 6.25 (See color insert.) Dref-3 friction (wrap) spinning system. (Courtesy ofFehrer AG.)
© 2003 by CRC Press LLC

Yarn Package
Air Jet Spinning
Air Jet 2
Air Jet 1
Winding Unit
Sliver
+
+
+
+
+
+
++
+
Take-Up Rollers
+
Middle
Roller
Back
Roller
Front
Roller
Front Roller
First Nozzle N1
Second Nozzle N2
N2
N2
Spinning Tension
T
H B
FIGURE 6.26 Murata air-jet spinning system. (Courtesy of Murata Co.)
© 2003 by CRC Press LLC

twisted ribbon and null the Z twist of jet 1, leaving some S-twist to travel toward the nip line of the front rollers. As in ring spinning, a spinning triangle will form just below the nip line of the front roller. The ballooning of the thread line tends to keep the edge fibers of the spinning triangle from being twisted together with the main bulk of fibers that subsequently form the yarn core. Consequently, the leading ends of the edge fibers are not controlled by the S-twist propagating from jet 2, and they are free to move with the vortex of jet 1, in the opposite direction (Z-direction) to the twist in the core. The vortex of jet 1 is therefore able to wrap the edge fibers around the twisted core of fibers.
Figure 6.28 illustrates the twist and wrap actions. The solid lines represent the false-twisting actions of the jets, and the dotted and dashed lines show the twist in the core and the helical wraps of the edge fibers. We can see that, at the front drafting rollers, the twist in the core would be the difference of S2 and Z1. As the core moves through jet 1 and into jet 2, its twist increases to S2 until it enters the Z-twist zone of jet 2. Here, the S2 twist in the core is removed by the opposing twist Z2, leaving an untwisted core of parallel fibers. The helical wrap of the edge fibers around the core is initially equal to Z1 and, in the S-twist zone, it is reduced to –a before increasing to Z2.
To obtain effective wrapping, the width of the fiber ribbon entering the front drafting rollers is made to be as wide as possible without adversely affecting drafting. This is because air currents moving with the front drafting rollers can then suitably position the fibers at the ribbon edge for wrapping the core fibers.
When the boundary air layer moving with the front drafting rollers reaches the nip line of the rollers, the airflow has to move sideways and outward from the middle
SpinningBalloonand FalseTwist inFormingYarn
SpinningChannel
Z – Twist
S – Twist
SuctionInlet
JetNozzle
OutletSpinningChannel
JetNozzle
Cross-SectionAA
A
V1
V
V1
V2
V1
FIGURE 6.27 Basic design features of a twisting jet.
© 2003 by CRC Press LLC

of the rollers. Compared with the more central part of the ribbon, fibers at the ribbon edge have insufficient neighboring fibers to support them against the sideways drag of the airflow. Therefore, they tend to move away from the bulk of fibers as they approach the nip line of the front drafting rollers. At the output side of the rollers, the airflow moves inward. Hence, the resulting velocity of the edge fibers is such that these fibers become inclined to the axis of the twisted core of fibers just before entering jet 1.
Figure 6.26 depicts how the edge fibers under the twisting actions of jet 1 forms the wrap-spun structure. For ease of explanation, the twisting and wrapping of the fiber ribbon is shown along a straight line in the figure, but its actual path is indicated by the dotted line, which denotes the spinning balloon. “F” is the width of fiber ribbon during drafting, which is separated by the airflow into “C” core and “W” edge fibers.
6.1.4.1.3 Single- and Twin-Jet Systems: Murata Vortex, Murata Twin Spinner, Suessen Plyfil
As a comparison with the above-described wrapping mechanism with tandem jets, it is useful to consider the effectiveness of wrapping with only one jet. In this situation, the Z–twisting action of the jet is not nullified, and the core is therefore Z–twisted. The edge fibers will, as described above, wrap the core with a Z–direc-tional helix. Being that the core twisting is now in the same direction as the wrapping action, some edge fiber may become caught and twisted into the core, thereby
Z
Z1
S1
S2
Z2
Twist In Core
Helical Wrapping of Edge Fibera = S2 – Z1
S
a
a
− a
Jet 1 Jet 2S – Twist
ZoneZ – Twist
ZoneS – Twist
Zone
Z – TwistZone
FIGURE 6.28 Illustration of twist distribution in thread line.
© 2003 by CRC Press LLC

reducing the number of them available to wrap the core. Because of the inclination of the approach of the free edge fibers to the axis of the core fibers, the angle of the wrap helix will be greater than the core twist angle. Since the S–twisting action of the single jet is equal in magnitude to its Z–twisting action, the core twist is removed as the forming yarn leaves the jet, but the angle of wrap is only reduced. Clearly, then, a single-jet system will not give as high a degree of wrapping as a tandem jet system unless a greater number of wrapper fibers can be generated.
One approach to increasing the number of edge fibers is to increase the length of the spinning triangle so that the twist insertion point is farther from the nip line of the front rollers. This results in edge fibers having to travel farther toward the twist insertion point at the apex of the spinning triangle. The effect of doing this can be demonstrated in conventional ring spinning by partially restricting the twist flow toward the nip line of the front drafting rollers. The result is an increase in edge fibers escaping twist insertion and becoming fly.
Figure 6.29 is a diagram of the single-jet design of the Murata Vortex system, which is a single air-jet spinning system. Compared with the tandem jet system, it incorporates a modified jet inlet. Little technical information is available on the working principle. Much independent research has yet to be done to gain a detailed understanding of the wrapping mechanism of the Vortex system. However, it is possible that a partial blocking of the twist flow may occur above the jet nozzles to enable the formation of an extended spinning triangle and thereby increase the generation of edge fibers.
The lower degree of wrapping that may be obtained from a single jet has the advantage of producing softly wrapped yarns. Two softly wrapped yarns can be subsequently plied to give a twofold wrap-spun yarn as a replacement for conven-tional plied yarns. The Murata Twin Spinner and the Suessen Plyfil are commercial twin-air-jet systems used for producing twofold wrap-spun yarns. The spun yarns from two single jets placed in parallel are wound simultaneously (in parallel) onto
Drafted FiberRibbon
ExtendedSpinning Triangle
Jet Nozzles andVortex Chamber
FIGURE 6.29 Murata Vortex single-jet design. (Source: US Patent: 5,528,895.)
© 2003 by CRC Press LLC

one bobbin so as to form an assembly-wound package. The two yarns are subse-quently unwound as one thread and plied, producing a twofold, air-jet wrap-spun yarn.
6.1.4.2 Filament Wrapping
Two commercial techniques are used for wrapping a filament around a core of staple fibers to produce a yarn. One uses the Repco system, replacing, at each spinning position, one of the alternately twisted strands with an alternately twisted filament (or filaments). The filament and strand subsequently ply together. Since the filament is finer than the strand, the effect is for the filament to wrap the strand in an alternating Z and S helix. This is called Selfil,21 but it is not a widely practiced process.
By far the more common technique of filament wrapping is called hollow-spindle wrap spinning.29 The basic principle of the process is illustrated in Figure 6.30. The essential features of the system are a roller drafting unit, a hollow spindle on which is mounted a pirn of filament, a pair of delivery rollers, and a package build unit. The spindle has an integral false-twister located at the bottom of the spindle, as shown in the diagram. This is a simple pin-type false-twister. There are other hollow-spindle systems with the false-twister located at the spindle top.
The drafted fiber ribbon issuing from the drafting system passes down the center of the hollow spindle and is threaded up to be false-twisted by the twisting device. The twist, which propagates to the nip of the front drafting rollers, prevents any uncontrolled drafting of the length of the twisted ribbon within the hollow spindle. The filament is also made to pass down the hollow spindle and around the pin twister. However, since the pirn rotates with the spindle, the filament is not false-twisted.
The effect of threading the filament around the pin twister is to cause the filament to wrap the drafted fiber ribbon as the ribbon is untwisted below the pin twister and thereby form the wrap-spun yarn. As the figure illustrates, the wrapping occurs below the false-twister, where filament and ribbon are held together between the twister and the delivery rollers. As the ribbon is untwisted, the rotation of the pin false-twister plies the ribbon and filament together, and, since the filament is the finer of the two counts, it wraps the untwisted fiber ribbon.
6.1.5 TWISTLESS SPINNING SYSTEMS
Definition: This is a system for yarn formation involving either continuous felting or the permanent or temporary adhesive bonding of fibers together to form a continuous length.
6.1.5.1 Continuous Felting: Periloc Process
The felting of linear fiber assemblies is fiber specific in that it concerns wool and wool blends. The underlying mechanism for wool felting is well reported30,33 and is primarily the result of the differential frictional effect caused by the scale structure of wool fibers. Under the influence of mechanical force, wool will move unidirec-tionally, and the resistance to movement against the wool scale results in fiber entanglement, which is a useful means of consolidating an assembly of fibers into
© 2003 by CRC Press LLC

+
Twisted Ribbon from Front Rollers
Effect Yarn
Binder Yarn
Binder Yarn Package
Hollow Spindle
False-Twist Unit
Final (Composite) Yarn
To Delivery Rollers
PackageBuild
DeliveryRollers
Hollow SpindleUnit
DraftingSystem
SliverFeed
R1
R2
R3
R4
FIGURE 6.30 Hollow-spindle wrap spinning system.
© 2003 by CRC Press LLC

the form of a yarn. Felting readily occurs when wool fibers are mechanically agitated in a suitable liquid medium and, besides the fiber properties, is dependent the on structure of the fiber assembly and the degree to which the liquid medium reduces the wool fiber modulus and acts as a lubricant. The felting of yarns has been carried out for many years,34 as felted yarns are particularly desirable in the carpet field, where they are found to give reduced fiber shedding and to greatly improve tuft definition. Two continuous processes have been developed whereby not only can yarns be felted, but sliver and rovings can be converted into felted yarns.
Figure 6.31 shows a diagram of the Periloc process. The sliver or roving is fed without tension into a flexible tube along with hot water. The tube is mechanically agitated by a set of rollers mounted to a rotating circular plate; the rollers also rotate on their axes to enhance the mechanical treatment. The agitation consolidates the sliver into twistless felted yarn, which subsequently is passed through a line dryer. An alternative technique to the Periloc process is referred to as rub-felting,35 which is analogous to the rubbing apron mechanism of a woolen card.
6.1.5.2 Adhesive Bonding: Bobtex Process
Although restricted to a limited market area within the technical textiles sector, the Bobtex process is nevertheless interesting as a concept because of its simplicity.36,38
Figure 6.32 shows the system to consist of (A) a polymer extruder; (B) guides for a sliver feed to (C) two opening rollers; (D) a rotating, fiber-condensing drum, which is perforated around its peripheral surface and at which a suction is applied; (E) a false-twister and (F) a yarn wind-up; and (G) a package-build unit.
An untwisted filament yarn is passed through the extruder and across the surface of the fiber-condensing drum, then through the false-twister and onto the yarn package. A thermoplastic resin is extruded onto the filament yarn surface before the filament yarn reaches the fiber-condensing drum. On reaching the drum, separated fibers from the sliver feed are sucked onto the surface of the drum, and twist running up the filament yarn embeds the fiber into the molten resin on the filament yarn surface. As the resin cools, the fibers remain locked into the resin. The figure shows a cross section of the spun yarn, and the filaments can be seen locked into the yarn core.
The lack of any movement of the core filaments gives the yarn a high bending rigidity and restricts its use to high-strength technical applications. Glass, polypro-pylene, nylon, and polyester are the main filaments used, with a polypropylene resin binder. The filament usually constitutes 30 to 40% of the mass of the composite yarn, with the resin accounting for 10 to 20%, and the staple fibers having a proportion of 30 to 60%.
6.1.6 CORE SPINNING
Definition: This is a process by which fibers are twisted around an existing yarn, either filament or staple-spun yarn, to produce a sheath-core structure in which the already formed yarn is the core.
Core yarns are usually two-component structures, one forming the yarn core and the other the covering. Generally, a continuous filament yarn is used for the
© 2003 by CRC Press LLC

core and staple fibers as the sheath covering. Core yarns are usually used to enhance functional properties of fabrics, such as strength, durability, and, in the case of an elasticated core, “stretch-comfort.”
As Figure 6.33 illustrates, the ring-spinning method can be easily adapted for production of core yarns.39,47 The filament is introduced into the center of the drafted
Yarn Out
Take-Up(Squeeze)Rollers
Sliver orRoving Feed
FeltingMedium
FeltingTube
RotatingRollers
LubricatingSpray
+
FIGURE 6.31 Periloc yarn felting system. (A) Felting tubes, (B) felting liquid medium,(C) false-twister, and (D) sliver. (Courtesy of Anon., Wool Sci. Rev., 3(3), 1949.)
© 2003 by CRC Press LLC

fiber ribbon, at the nip of the front drafting rollers. It is usually pre-tensioned to an extension of around 5% for flat continuous filament yarns, about 30% for textured yarns, and up to 400% for an elastomeric core. If insufficiently tensioned, the filament will either periodically appear at the yarn surface, referred to as grin through, or become wrapped around the fiber ribbon as the ribbon is being twisted. The amount of twist, and the ratio of sheath to core employed, will depend on end use and particularly on preventing the sheath covering sliding along the core.
The unconventional processes that can be adapted readily for the spinning of core yarns are Dref friction spinning, Repco, air-jet, and hollow-spindle wrap spin-ning.
Filament
Entruder (A)
Inlet forPolymer
Chips
StapleFiber Staple
Fiber
Filament With Resin Coat
OpeningRoller
OpeningRoller
CondensingRoller
FalseTwister
CompositeYarn
YarnPackage
(C) (D) (C)
(E)
(F)(G)
FIGURE 6.32 The Bobtex composite yarn system (continues).
© 2003 by CRC Press LLC

6.1.7 DOUBLING PRINCIPLES
Definition: This is the process of combining two or more yarns by twisting them together.
Before describing the structure-property relation of single yarns, it is desirable that a short reference be made to the operation known as doubling, plying, or twisting.
The basic objective of doubling is to attain a particular physical characteristic that cannot be obtained with a singles yarn of similar count to the plied yarn. Doubling is also used for the production of designed effects in yarns, but this involves a specialist type of doubling to produce what are called fancy yarns, which is the subject of Chapter 9.
FIGURE 6.32 (continued)
© 2003 by CRC Press LLC

With regard to the physical characteristics of a yarn, these are altered by changing the direction and the amount of twist. An important parameter, therefore, is the folded twist to singles twist ratio (F/S ratio). We have seen in Chapter 1 that, with singles yarns, an essential feature is that fibers are assembled around the yarn axis, in most cases through the use of twist. In doubling, two or more singles yarns are assembled together and then twisted around each other, making a new yarn of a quite different character. With respect to this latter point, both the direction of the ply twist and the level of twist are of importance.
The ply twist direction is usually opposite to that of the singles yarn (i.e., twist against twist) but, for special applications, the same direction (twist-on-twist) may be required. In most cases, the singles twist will be in the Z direction, so plying with S-on-Z is a common practice. With Z-on-Z, the fibers in singles yarns will eventually come to lie at a steeper twist angle, and both the single and the folded yarn will be compacted to a smaller diameter than if the conventional S-on-Z step were to be followed. Generally, Z-on-Z plied yarns are usually assessed as hard to the touch and as having a strong tendency to form snarls* because they are twist lively.
Plying with the S-on-Z twist produces a doubled or plied yarn in which the fibers in the constituent singles appear to lie approximately parallel to the plied yarn axis. This gives the plied yarn a more smooth and lustrous appearance than a singles yarn or a Z-on-Z folded yarn. The S ply twist, instead of augmenting the Z singles
* Snarly yarn has a strong tendency to twist around itself if held in a untensioned state.
PolyesterFilament
CottonRoving
Tension Disk
Guide
Core Yarn
FIGURE 6.33 Conventional ring spinning of core yarns.
© 2003 by CRC Press LLC

twist, balances it, and a suitable F/S ratio (usually 2/3) can be used to make the plied yarn twist stable.
One of the most desirable features of plied yarns is their very low irregularity as compared with a singles yarn of the same count. This is brought about by thick places in one singles component tending, on average, to offset thin places in the other.
Regarding yarn strength, it is universally agreed that a plied yarn will be stronger than a singles of the same fiber type and yarn count. This is because, with a plied yarn, there are initially fewer fiber lengths projecting as hairs from the singles and, when plied, many of the hairs are bound into the plied structure. More importantly, thin places are weak places and, as noted earlier, the two singles compensate for each other’s irregularity. What is not necessarily the case is that the strength of a plied yarn is twice that of its constituent singles, and this is because the singles do not fully compensate for their differences in irregularity.
Plied yarns are generally considerably more expensive than singles of the same count, not only because at least one extra process is required, but also because the two singles, being finer than a yarn of the resultant count, are more costly to produce.
For certain special purposes, a third twisting operation may be needed, involving a combination of two or more plied yarns. The process is then known as cabling. An example is with some sewing threads in which the structure is required to have the maximum strength combined with the minimum irregularity, liveliness, and stretch.
There are three basic doubling methods: up-twisting, down-twisting, and two-for-one twisting, the latter two being widely used for staple yarns and illustrated in Figure 6.34. A more modern development is three-for-one twisting, which is essen-tially the combination of two-for-one and up-twisting.
6.1.7.1 Down Twisting
As shown in Figure 6.34, the yarns are withdrawn from the supply packages (A) by the feed rollers (B) and wound on the double-flanged bobbin (D) by the traveler (C) running on the ring (R). Twist is inserted by the rotation of the take-up package. Two bobbins of twisted singles yarn are therefore down twisted with S-on-Z, and the plied yarn wound onto a final bobbin.
It is important that the tensions in all the singles yarns are very similar during twisting. Otherwise, if yarns are not relaxed prior to doubling, their tendency to snarl will lead to faults in plied yarn. In addition, if two singles are not at the same tension, then, instead of plying, the lower-tension component will spiral around the higher-tension component.
6.1.7.2 Two-for-One Twisting
As also shown in Figure 6.34, the yarns are withdrawn from a stationary supply (A), which can either be an assembly-wound package or two separate packages, and passed through the center of the package(s). They are then ballooned around the supply package(s) by a rapidly rotating spindle (E) and wound up onto the take-up package (K). The yarns are ply twisted once between the package (A) and the spindle
© 2003 by CRC Press LLC

(E), and a further turn is inserted between (E) and the take-up rollers (J) so that two turns of twist are inserted for every turn of the spindle (E).
6.1.8 ECONOMIC CONSIDERATIONS
In discussing the economic aspects of spinning systems, it must be borne in mind that, for many and various reasons, yarn production costs can differ significantly from country to country and, at times, political issues can alter what may often be
Down Twisting D
DA
B
CD DR R
Two-for-One
A
K
J
E
FIGURE 6.34 Doubling processes. (Courtesy of Savio Ltd.)
© 2003 by CRC Press LLC

considered advantageous circumstances. It is therefore appropriate to discuss here only the technically based factors, which are significant when making investment decisions for spinning plants.48 From this viewpoint, comparisons made between spinning processes principally include the following:
• Investment cost, relating to capital investment for machinery, buildings, depreciation and the interest on loans.
• Conversion cost, which involves the production rates of machinery, the efficiency of the process machines in handing the raw material, waste generated, direct labor, and power consumption. Fixed costs, such as insur-ance, indirect labor, maintenance, and so on, may or may not be included.
• Raw material cost. The quality factor of the raw material is at times a debatable point. Raw material cost usually accounts for around 50% or more of the production cost, and the debate is whether certain spinning systems enable cheaper material to be used. The other side of this idea of the use of cheaper material is what may be seen as another indeter-minable, product value. To circumvent such sometimes indefinable param-eters, the assumption may be made that the same raw materials would be processed except where there are established technical reasons why a particular spinning system cannot spin certain materials.
From the above points, comparisons may be made according to four key factors: labor, space, power, and capital.
It was stated at the beginning of Section 6.1 that ring spinning was the dominant spinning process, and this is in spite of its much lower production speed, as shown in Figure 6.2. Ring spinning is therefore generally taken as a comparator for both process economics and product quality.
It is useful to have a general view of the cost structure of a typical ring-spinning production, and Table 6.3 gives the data for the production of 30 tex ring-spun 100% carded cotton yarns with respect to the above four cost factors. These figures illustrate what is well known — that roving production, spinning, and winding account for over 80% of the conversion cost. Much has been done in the way of automation and machine integration. Examples include automatic doffing of ring bobbins at the ring spinning machine and, where appropriate, linking the spinning machine with the winding machine,49,56 plus auto-doffing at the roving frame with automatic transport of the roving bobbins to the ring frame. However, the ring spinning process is unlikely to overcome the inherent disadvantage of low production speed. This is because of the limitation of twisting and winding occurring through one action — the circulation of the traveler around the ring.
There is little publicly available data that allows us to present a comparison of the various systems described in the preceding subsections. However, being the most widely adopted of the alternative spinning systems, rotor spinning is often used to illustrate how high-production systems compare with ring spinning, even though many of the systems are restricted to the production of coarser yarn counts.57,63 Figure 6.35 gives a comparison for the two systems based on the four key factors.
© 2003 by CRC Press LLC

It can be seen that, in all cases except for power consumption, rotor spinning has significant cost advantages. This is because there are fewer process stages, since sliver is fed to the rotor machine, and the automation of rotor machines64,66 includes doffing, yarn-end piecing, and cleaning. Importantly, rotor packages do not need rewinding. It is, however, important to note that all the advantages shown for the four key factors are mainly in the count range of around 20 tex and coarser.
TABLE 6.3Production Cost Structure
Stages Labor (%) Space (%) Power (%) Capital (%) Total (%)
BR 2 8 4 5 4C 1 7 8 8 6D 1 3 1 1 1D 1 3 1 1 1
RP 19 15 8 10 13RS 23 46 62 51 44W 53 19 16 24 31
Total 100 100 100 100 100
BR = opening and cleaning, C = carding, D = drawing, RP = roving production, RS = ring spinning, W = winding
48
40
32
24
16
8
60 30 20 15
60 30 20 15
60 30 20 15
60 30 20 15
Investment Costs
Space Power
Labor
Cos
t/kg
Cos
t/kg
Cos
t/kg
Cos
t/kg
Yarn Count – Tex
Yarn Count – Tex Yarn Count – Tex
Yarn Count – Tex
12
10
8
6
4
2
6
5
4
3
2
1
25
20
15
10
5
Ring
Rotor
FIGURE 6.35 Comparison of key factors, ring and rotor.
© 2003 by CRC Press LLC

At the finer end of the count range shown, ring spinning is not far removed from the rotor costs (except for labor) and, projecting to finer counts, the indication is that the difference in cost becomes negligible and eventually in favor of ring spinning. This is because the finer the yarn count, the more difficult it is to produce satisfactory rotor yarns with low twist. As explained earlier, there are a number of changes that can be made to rotor parameters to improve twist insertion and thereby increase production speed for fine counts — in particular, smaller rotor diameters and faster rotor speeds. However, similar to many of the other alternative systems to ring spin-ning, the yarn structure and related properties often become the all-important factor. Table 6.4 gives as an example the range of reported end uses of the yarns for most of the systems described above. It is evident that the ring-spun yarn’s product value is one reason for its continued importance. The structure-property relation of ring-spun yarns is a an important factor in the yarn’s acceptance for a wide range of end uses, and the following section deals with the topic of yarn structure and properties.
6.2 YARN STRUCTURE AND PROPERTIES
The primary purpose of a staple yarn structure is to provide the means of utilizing the properties of fibers of discrete lengths (in particular, elastic properties) sufficient for the yarn to sustain spinning and subsequent manufacturing processes, and for
TABLE 6.4Product Applications
End products of yarns produced by different spinning systems
End use RotorOpen-end
Dref 2 Dref 3
Wrap spinningair-Jet
fasciatedHollowspindle
Ringspinning Repco
Shirting X XBedding X XOuterwear X X X XSportswear X X XToweling X XDomesticTextiles X X X X XBlankets X X XKnittedGoods X X XStretchGarments X XDecorativeFabrics X XCarpeting X X X XIndustrialTextiles X X X
Courtesy of Krause, H. W., Staple-fibre spinning systems, J. Text. Inst., 3, 185–195, 1985.
© 2003 by CRC Press LLC

the ultimate textile fabric to have the visual and tactile aesthetics and elastic prop-erties required for specific end uses.
Yarns encounter differing kinds and levels of deformation during spinning, subsequent processing, conversion into fabrics, and in fabric end uses. For example, yarns may pass over guide rollers, tensioning devices, and other machine elements during spinning and post-spinning operations; they are also subjected to complex deformation forces in winding, sizing,* weaving, knitting, sewing, and intermediate processes.
In daily use, yarns, in the form of knitted and woven fabrics, are subjected to deformation resulting from tension, compression, and bending. Garments are required to give the consumer tactile and thermal comfort. For tactile comfort, the fabric must have a pleasant handle or feel against the skin. The accommodation of body movement is by fabric slippage over the skin as well as by fabric stretching and folding or buckling. Thermal comfort requires a warm, dry microclimate next to the skin obtained through trapped layers of air for insulation. The fabric is required to maintain body heat with minimal restriction to perspiration vapor flow during sedentary body states and good moisture transfer by wicking for active states. Thus, although a first requirement for comfort is a low scratchiness68 (exhibited by fibers of low bending rigidity and friction), with regard to fabric, the yarn structure-property relation is as important as the fabric structure-property relation to the overall per-formance of the end product.
With respect to yarn structure and properties, we will consider only single yarns, since most fabrics are made from single yarns; particularly yarns produced by the more commercially used spinning systems, namely ring, rotor, air-jet, hollow-spin-dle, and Dref friction spinning.
6.2.1 YARN STRUCTURE
In Chapter 1, the simple helix model was described as a simple means of representing a yarn in which twist is used to bind fibers that are assembled with their lengths straight and parallel prior to twist insertion. We noted that, because the model did not include the discontinuities in the helices representing the twisted fibers, it is a more suitable representation of continuous filament yarns than of staple yarns, which are made from fibers of discrete lengths. The helix model, however, has been used over many years to gain an understanding of the importance of structural parameters of staple yarns. From knowing the model’s limitations, key features of staple-yarn structures have been identified and subsequently used to devise more sophisticated models in the attempt to theoretically derive predictive equations for yarn properties in relation to fiber properties. These newer models do not, however, give any further insight into what has already been established from theoretical studies of the simple helix model and from experimental observations of real yarn structures. In our consideration of staple yarn structures, we shall therefore use the helix model as a reference for comparative observations with real yarn structures and, where appro-
* Sizing is a process in which short-staple yarns to be used as warps in weaving are impregnated with a gelatinous substance, such a starch, to improve their abrasion resistance and strength and to reduce friction.
© 2003 by CRC Press LLC

priate, refer to the predictive models. As the simple helix model relates best to a continuous-filament yarn structure than to a staple-yarn structure, it will be useful at times to refer to the filament yarn structure for comparative purposes.
6.2.1.1 Surface Characteristics and Geometry
Figures 1.3 (Chapter 1) and 6.36 (below) depict the surface structures of a continuous filament yarn and of ring-, rotor-, friction-, and air-jet spun yarns. Although the yarns shown are not of the same count or fiber type, the figure serves the purpose of comparing the typical structural features of the different yarns. It can be seen that, whereas the filament yarn has no filaments projecting from it surface, the staple yarns, because of the discontinuities of the fiber helices, have fiber ends and loops jutting out from the body of the yarn to give the yarns a hairiness profile. The fibers forming the hairs have part of their lengths caught within the body of the yarn and part extending from the yarn surface. We shall consider later the difference in hairiness between the various yarn structures.
Looking closely at the conventional ring spun-yarn structure, we can see that the fibers, which form the body of the yarn, lie parallel along the helix of twist. With the rotor yarn structure, the vast majority of fibers appear to lie almost parallel to each other with the same helix angle of twist. Around these are wrapper fibers with varying angles of wrap; some show almost a 90° wrapping angle. Rotor yarns are basically two-zone structures comprising a core of fibers that are aligned with the helix of the inserted twist and form the bulk of the yarn, then an outer zone of wrapper fibers, which occurs irregularly along the core length. A detailed study of the surface structure of rotor yarns69 shows that the variation of surface appearance along the yarn length may be classified as indicated in Figure 6.37 and Table 6.5.
From the description of the spinning process, the Dref-3 yarn (not shown) is also a two-zone structure, whereas the Dref-2 (shown) is a layered structure. Both friction-spun yarn structures have a uniform surface appearance of fibers lying along the helix angle of twist. This, however, is not case with air-jet spun yarns. These are two-zone structures, where the central core of fibers has no twist and is wrapped by an outer zone of fibers, which, similar to rotor yarns, occurs irregularly along the core length. Figure 6.38 and Table 6.6 give a simple classification of the surface appearance of air-jet yarns.70,71 Although these structural classes are distributed at random relatively to each other, depending on the process conditions and on fiber properties, their distribution along the yarn length can follow a pattern.72
Hollow-spindle, wrap-spun yarns (HS yarns) are basically two-component yarns comprising a twistless core component of parallel staple fibers, of any length, and a filament component, which normally constitutes 2 to 5% of the yarn mass as a wrap binder on the outside (see Figure 6.36). Because of the arrangement of the core fibers, HS-yarns are also referred to as parallel yarns. The filament essentially effects the necessary cohesion of the staple fiber core by exerting radial pressures along its helix of wrap and thereby increasing the frictional contact between the core fibers. The number of filament wraps per unit length in basic HS yarns is approximately the same as the level of twist in a similar count conventional ring-spun yarn. During processing, HS yarns appear lean and smooth. This is the result
© 2003 by CRC Press LLC

of the constrictive effect of the wrapping filament under tension, and it accounts for the low hairiness of the yarns. When not under tension, the contraction of the filament gives the yarn its bulky, crimped appearance.
6.2.1.2 Fiber Migration and Helix Model of Yarn Structures
From the above descriptions, it is evident that the simple helix model does not fully explain how fibers of discrete lengths can be held together to form a yarn. Such a
FIGURE 6.36 Spun yarn structures.
© 2003 by CRC Press LLC

simple structure formed from staple fibers would be incapable of withstanding tensile loads and surface abrasion. Furthermore, a staple-yarn structure based on the simple helix could not be made by known spinning methods. This is because, with each turn of twist, the paths followed by fibers in the yarn vary in length according to their distance from the axis. To achieve this, each fiber would have to be delivered for twisting at a rate appropriate to the position it would occupy in the yarn, and this is not practicable.73
FIGURE 6.37 Observed surface structure along rotor-spun yarns. (Courtesy of Lawrence,C. A. and Finikopulos, E., Factors effecting changes in the structure and properties of open-end rotor yarns, Indian J. Fibre and Text. Res., 17(12), 201–208, 1992.)
© 2003 by CRC Press LLC

TABLE 6.5Classification of Rotor–Spun Yarn Surface Structure
Class of surface structure Description
Class I – Ordered There are no wrapper fibers; has the appearance of uniformly twisted core fibers.
Class II – Loosely wrapped Loose wrapping of fibers around the core. Wrapping angles differ from the twist angle of core fibers.
Class III – Hairy Surface fibers are loosely attached to the yarn and appear entangled.
Class IV – Multiple wraps Part of the wrapping fibers bind the core with a high wrap angle, and part at a lower angle having direction opposite to that of the core twist.
Class V – Opposingly wrapped Wrapper fibers have a wrap helix in opposite direction to the core twist.
Class VI – Tightly wrapped These sections of yarn appear uniformly wrapped and have few protruding fiber ends or loops. The angle of wrap is approximately 90°.
Class VII – Belts Fibers are wrapped very tightly around the core at 90° in a narrow length on the order of 1 mm.
TABLE 6.6Classification of Air-Jet Spun Yarn Surface Structure
Class of surface structure Description
Class I – Ribbon wrapped A thin ribbon of fibers uniformly wrapped around the twistless core; the angle of wrap ranges from 40° to 45°.
Class II – Randomly wrapped Fibers wrapping the twistless core at varying angles; although most wrappers have the same helix direction, some are in the opposing direction. The Class II substructure may be further divided into four groups.71
Class III – Unwrapped Sections of yarn with no apparent wrapper fibers, in which the core appears twisted or twistless.
FIGURE 6.38 Air-jet spun yarn surface structure.
© 2003 by CRC Press LLC

The idea that staple yarns have self-locking structures is attributed to Peirce74
and Morton.73 Essentially, a self-locking structure is achieved by fiber lengths mean-dering from the outer to the inner regions of a yarn, throughout the yarn length, as they are twisted to lie along the helix angle. In this way, fibers become interlaced to give the spun yarn cohesion. This action is called fiber migration. Migration also occurs in twisted filament yarns.75
Definition: Fiber migration is the cyclic change in the distance of elements of a fiber or filament (along its length) from the axis of a yarn, which occurs during production of the yarn.76
The simple helix model may be modified to depict the cyclic path migration of the fibers moving from one cylindrical layer to another (see Figure 6.39). Hearle75 used the variable (r/R)2 as a relative measure of the radial positions of points along the length of a fiber within the yarn, with respect to the yarn axis (z). A plot of (r/R)2
against the corresponding distances along z gives what is termed the migration envelope, and the degree of migration may be quantified by the parameters given in Table 6.7.
Grishanov77 reports a more rigorous and elaborate approach for mathematical modeling of fiber migration in a staple yarn. This method employs the Markov process to model the path of individual fibers through the yarn. It thereby incorpo-rates the main features of a yarn structure, such as irregularities in the number of
TABLE 6.7Fiber Migration Parameters
Migration parameter Migration equation
Mean fiber position
where n is the number of measured positions over a yarn length Zn
Root mean squared (rms) deviation
Mean migration intensity (the rate of migration given by the slope of the migration envelope)
Equivalent migration frequency
Y m1Zn
----- Y zd∫=
Yn---∑=
D 1Zn
----- Y Y m–( )2 zd∫12---
=
Y Y m–( )2∑n
------------------------------
12---
=
I 1Zn
----- Ydzd
------ 2
zd∫12---
=
© 2003 by CRC Press LLC

fibers in the cross section, variation in yarn diameter, and hairiness. The migration is developed as a probability matrix, called a transition matrix, of fiber lengths moving between radial distances. The migration characteristics of mean fiber posi-tion, root-mean-square deviation, and mean migration intensity are expressed in terms of the transition matrix. The transition matrix is then used to establish a finite element representation of the yarn structure.
It the earlier descriptions of the basic principles of the spinning processes, the details of the formation of the different yarn structures were not considered. It is, therefore, appropriate now to describe how the above yarn structures are formed, taking into account fiber migration.
6.2.2 FORMATION OF SPUN YARN STRUCTURES
6.2.2.1 Conventional Ring-Spun Yarns
In ring spinning, the spinning triangle is the yarn formation zone. It is here that the individual fibers or groups of fibers are twisted and consolidated to form the ring-spun yarn structure. During the formation of the conventional ring-spun yarn struc-ture, fibers in the spinning triangle will be in one of the following four situations:77
1. The leading end of a fiber is caught in the convergence point (i.e., twist insertion point), but its trailing end is free.
2. The leading end is free while the trailing length is still under the control of the front drafting rollers and subsequently becomes caught among other fibers being twisted at the convergence point.
3. Both leading and trailing ends are free.4. The leading end is caught in the convergence point while its trailing length
is still under the control of the front drafting rollers.
In the first situation, the trailing end of the fiber will project from the surface to become a hair. Case 2 results in the leading end projecting as a hair. For 3, the fiber may wrap around the yarn as a wild hair or, more likely, escape to become fly and eventually be collected as waste. With case 4, the fiber gets bound into the yarn structure through the mechanism of migration and twist. The vast majority of the fibers are in this situation, and they are therefore the ones that give the yarn its cohesion and mechanical properties. Accordingly, we will now consider the mech-anism of fiber migration.
FIGURE 6.39 Tracer fiber showing migration path in conventional ring-spun yarn structure.
© 2003 by CRC Press LLC

6.2.2.1.1 Mechanism of Fiber Migration73
At the spinning triangle, the fibers in the edge zones follow a longer path than those closer to the center line of the triangle, coincident with the yarn axis. Assuming the length issuing from the front rollers to be the same for all fibers, then the spinning tension and twisting action will induce the highest tensions in the edge fibers. The fiber tensions become progressively lower to reach a minimum at the center line of the triangle. The fibers at the edge zones therefore have the largest of the tension compo-nents directed sideways toward the central line of the triangle. Consequently, the edge fiber lengths issuing from the front rollers will move to toward the central line of the triangle, i.e., the regions that will become the inner zones (or inner cylindrical layers) of the yarn, displacing sideways the lower tensioned fibers in their path. The latter may become buckled. As the edge fibers move toward the center, their path lengths momen-tarily decrease, and their tensions also decrease. Those fibers that are displaced outward toward the edge of the triangle will increase in tension and start to move back to the axis. Some fibers may block the movement of others inward or outward from the axis. The result is that a given fiber length, as it is issuing from the front rollers, traverses to and from its initial position in a region near the apex of the spinning triangle and thereby intermingles with other fiber lengths doing the same thing. The intermingling occurs just before the point of twist insertion. Thus, the relative positions of the fibers at that point become locked into the forming yarn structure.
Hearle describes the type of twisting that occurs to the drafting ribbon of fibers at the point of convergence as a wrapped form.75 This is where the twisting torque tends to fold the ribbon width around the central line of the triangle. The relative position of fibers in the spinning triangle is therefore also important to the formation of yarn hairs. For example, if Z twist is being inserted, then, in the spinning triangle, the right-hand-edge fibers will fold over toward the left at the twist insertion point. It is likely to be during folding that fiber migration occurs so that, when twisted into the yarn structure, fibers have a helical path with an alternately increasing and decreasing radius due to the migration.
Because of the yarn thread angle from the front rollers to the lappet guide, the bottom rollers obstruct the left-hand-edge fibers of the spinning triangle from similarly folding under toward the right. The result is that migration of these fibers is restricted, and most of their lengths are present in the outer zones. The left-hand-edge fiber would then tend to form surface hairs. By including around 0.1% of a colored fiber in the raw stock, the migration paths of fibers in a spun yarn can be observed. The yarn is immersed into a liquid of a suitable refractive index to make the uncolored fibers almost invisible, and the dyed fibers are visible through a microscope (see Figure 6.39). This is procedure is commonly called a tracer fiber technique.75
With fairly simple image analysis, the cyclical variation of the fibers can be characterized by the migration parameters. Table 6.8 gives migration parameters for a conventional ring-spun yarn produced from viscose rayon fibers.
As can be seen, the degree of migration increases with twist. Hearle75 has shown theoretically that, for ideal migration, where a fiber migrates regularly and uniformly through the yarn thereby giving a uniform packing density of the fibers, Ym = 0.5, and D = 0.29. However, it can be see from the figures in Table 6.8 that, even at high twist levels, ideal migration is not achieved.
© 2003 by CRC Press LLC

It is assumed that, in the helix model, ideal migration occurs to give a uniform packing density throughout the yarn. Consequently, the total length of fibers in each cylindrical zone must be proportional to the volume of each zone and therefore should increase linearly with zone radius. Figure 6.40 shows the zonal distribution of fiber lengths. The dotted line represents the situation for ideal migration, and the solid line shows that, in real yarns, this is not achieved — but that the packing density decreases sharply near the surface, which is characteristic of most yarns.
The fiber migration frequency varies with twist (see Table 6.8), and this shows that the migration is not a random process. If it were simply a random criss-crossing of fibers as they emerge from the front rollers, then the frequency of reversal (the fiber migration frequency) would be independent of the twist level. Since increased twist will increase tension, then the change in frequency with twist supports the mechanism for migration
Once the yarn is formed, the interfiber friction will tend to hold the fibers in their positions, but applied stresses may cause fiber lengths to shift position. An example of this is pilling. Pilling is where small balls of entangled fibers, called
TABLE 6.8Migration Characteristics for a Conventional Ring–Spun Yarn
Migration parameters
Yarn twist multiplier (tex1/2/cm)
210 300 600
Ym (CV%) 0.33 (39) 0.36 (32) 0.38 (22)D (CV%) 0.17 (28) 0.16 (20) 0.21 (12)I (CV%) 0.12 (32) 0.17 (24) 0.49 (22)Equivalent migration frequency [per cm] (CV%) 0.10 (25) 0.16 (23) 0.34 (19)
Courtesy of Hearle, J. W. S., Grosberg, P., and Backer, S., Structural Mechanics of Fibres, Yarns, and Fabrics, Vol. 1, Wiley Interscience, Chap. 3, 1969, p. 148.
40
20
00 RRadial Zones
% FiberLength
FIGURE 6.40 Mean zonal distributions. (Courtesy of Morton, W. E., The arrangement offibres in single yarns, Text. Res. J., 4, 325–331, 1956.)
© 2003 by CRC Press LLC

pills, cling to the fabric surface of a garment, giving the garment an unsightly appearance. The pills are formed during wash and wear as stresses, rubbing actions, and reduced interfiber friction cause some fibers to migrate and protrude from the surface of the constituent yarns of the fabric. These fibers entangle and form pills, which become a problem if fibers are too strong for the pills to easily break away.
6.2.2.2 Compact Ring-Spun Yarns
We saw in Section 6.1.1.4 that, with appropriately applied suction, the width of the spinning triangle can be considerably reduced. This means that the leading ends of virtually all fibers will be caught at the twist insertion point and, although some fibers may fall into situation 1, described above (Section 6.2.2.1), the vast majority will be in situation 4 and thereby have their lengths integrated into the yarn. The yarn structure is therefore considerably less hairy than conventional ring-spun yarns, as can be seen from Figure 6.41. It may be reasoned that, with a very small spinning triangle, only a low level of fiber migration may take place. However, as we shall see later, this is not a disadvantage to yarn tensile properties.
6.2.2.3 Formation of Rotor Yarn Structure
Section 6.2.1 briefly explained that the rotor yarn is formed by individual or small groups of fibers accumulating within the rotor groove, around the inner rotor cir-cumference, to form a ribbon of fibers that is progressively peeled from the groove and simultaneously twisted to produce the yarn. To gain a fuller understanding of how the rotor yarn structure is made, we need to consider in greater detail the buildup of fibers in the rotor groove to form the ribbon of fibers, referred to as cyclic aggregation, and the insertion of twist into this ribbon.
6.2.2.3.1 Cyclic AggregationAt the start-up of spinning, when the tail end of a seed yarn enters the rotor and becomes attached to the ribbon of fibers in the groove, the count of the ribbon is
FIGURE 6.41 Conventional ring-spun yarn and compact ring-spun yarn structures. (Cour-tesy of Rieter Machine Works Ltd.)
© 2003 by CRC Press LLC

not necessarily the required count for the yarn. The required yarn count is obtained when this initial deposited fiber ribbon is removed, i.e., after a yarn length equal to the circumference of the rotor is produced. Let us begin by considering the removal of this first ribbon layer. For the sake of simplicity, we will ignore the effects of twist contraction and assume that, at the moment the tail end of the seed yarn contacts the initial deposited fiber ribbon, the peel-off point, P, coincides with the point at which fibers are entering the rotor groove. Section 6.1.2.1 explained that fibers leave the exit of the transport channel, are deposited on the rotor wall, and slide down the rotor wall into the rotor groove. The point of entry into the rotor groove is likely to be only a short distance from the transport channel exit. We shall therefore take the channel exit as the point of coincidence. Let A be a mark on the rotor at that point. Figure 6.42 then depicts a plan view of inside the rotor the instant the tail end of the seed yarn begins to peel the fiber ribbon from the rotor groove and insert twist into it. A smooth doffing tube navel is being used, so the peel-off point and the twist insertion point are the same, as shown in Figure 6.43.
Consider now the first rotation of the rotor. The numbers 1, 2, 3, and 4 are reference points external around the rotor circumference and are separated sequen-tially by 1/4 rotor circumference spacing. The rotor rotates in the counterclockwise direction and, as A and P move away from 1 toward 2, a gap, Y, will appear between P and A. This is because the ribbon is being peeled from the groove. The peeling speed is approximately equal to the yarn delivery speed, Vd. As Equation 6.15 indicates, this makes NP greater than NR. The mark A also indicates the tail end of the fiber ribbon. With the rotor moving in the counterclockwise direction, fibers leaving the transport channel are entering the rotor groove and forming, in the counterclockwise direction, a new fiber layer on top of the existing fiber ribbon.
If t minutes is the time taken for A to reach reference point 2, then the gap length is Y = t Vd , and a new layer of fibers of about 1/4 the rotor circumference would have been deposited onto the ribbon in the counterclockwise direction. As P and A move on to 3 and then to 4, Y increases, and the length of the new layer being deposited would have increased first to 1/2 and then to 3/4 of the rotor circumference.
2
4
3
F
P
A1 1 1
2
4
3
P
A
2
4
3
P
AOld Gap 'Y'
Being Covered
New Gap
Y
Y
A plan view inside the rotor the instant the seedyarn makes contact with the fibers accumulated.
NB fiber deposit is in the reversedirection to the rotor rotation.
Consider the First Rotation of the Rotor
Rotor
FiberRibbon
Tail ofSeed Yarn
FIGURE 6.42 Peeling and twisting of fiber ribbon during rotor rotation.
© 2003 by CRC Press LLC

With P and A moving on from 4 to 1, Y becomes a maximum value, Ymax, when P reaches 1. Since Ymax is obtained with one revolution of P,
Ymax = (6.21)
The new layer being deposited in the counterclockwise direction meets the peel-off point when P reaches 1. The depositing fibers go across the peel-off point and then subsequently into the gap Ymax. The ribbon (along with the newly deposited layer) continues to be peeled from the groove and twisted into the yarn. Thus, a new gap begins at the crossover of the newly depositing fiber layer at P. When A reaches 1, this newly depositing layer will have covered Ymax , and a second layer will have started. This means a new tail end of the fiber ribbon would have formed a distance Ymax from the first tail end at A. During the second rotor rotation, the deposition continues as in the first rotor rotation and the new gap increases to Ymax . However, this time, when A reaches 1, a new tail end would have formed a distance 2 Ymax
from A, and a third fiber layer will have started. The process is cyclical, and the fiber layers aggregate with each rotor rotation, hence the term cyclic aggregation.
After a time, tr = πDR/Vd minutes, the original fiber ribbon plus the fiber layers deposited on top of it would be peeled from the rotor groove. The peel-off point, P, the exit of the transport channel, and the mark A on the rotor will once again coincide. The gap behind the peel-off point will be Ymax; there will be NL = tr Np (= πDR/Ymax) number of fiber layers accumulated at A, and if there are XF fibers of Tf fineness (dtex) in each layer, then the product NL XF Tf × 10–1 should equal the yarn count being spun. The thickness of the newly formed fiber ribbon will taper linearly around the rotor circumference from the peel-off point to the tail end. As the ribbon continues to be peeled from the groove, the accumulation of the depositing fiber layer will always result in there being the correct number of layers at P to produce the required yarn count.
FIGURE 6.43 Twist insertion with smooth doffing tube navel.
V d
NP
-------
© 2003 by CRC Press LLC

From Equation 6.21, it can be shown that, for commonly used twist factors, Ymax, on average, is of the order of 1 mm. This means that, when the depositing layer crosses over P, individual or groups of fibers will bridge the gap behind the peel-off point. For the gap to be maintained, the twist torque must be sufficient to bind these fibers onto the surface of the forming yarn. Since the main body or core of the yarn is already formed from the fiber ribbon, these bridging fibers wrap around the yarn body and become the wrapper fibers depicted in Figures 6.44 and 6.45. In Section 6.1.2.1, it was explained that, to overcome the resistance by frictional barriers in the spinning thread line to twist flow to rotor groove, the doffing tube navel can be designed to give a false-twist effect. This results in the peripheral twist extent or tying-in zone in the rotor groove and the separation of the peel-off point and the twist insertion point. The ribbon is therefore now partially twisted prior to being peeled from the rotor groove. Although this reduces spinning end breaks and the level of twist required to spin, the disadvantage is that, when the depositing layer now crosses the tying-in zone and the peel-off point, more fibers will be incorporated onto the forming yarn as wrapper fibers.
Figure 6.44 shows a bridging fiber that has landed with the leading length caught in the tying–in zone while its trailing length lies across the gap Ymax and into the tail
TwistTorque
RotorWall Counterclockwise
Rotation
BridgingFiber
Vd
β
α
1
1
(a)
(b) Case for fiber
length L1
(c) Case for fiber length
L2 where L2 > L1
FIGURE 6.44 Wrapper fiber formation. (Courtesy of Nield, R., Open-End Spinning, mono-graph No. 1, The Textile Institute, Manchester, UK, 1975.)
© 2003 by CRC Press LLC

end of the fiber ribbon (not shown). The twisting torque is in the direction for inserting S-twist into the fiber ribbon; the surface fibers of the body of the yarn subsequently having a twist angle α (see Figure 6.44a.) As a fiber slides down the rotor wall and into the rotor groove to become a bridging fiber, its leading end will be caught by the twist insertion point, become partially embedded in the forming yarn, and rotate in the twist direction. This causes the length landing on the peripheral twist extent to become wrapped in the Z-twist direction around the yarn. When this short, twisted length is peeled from the rotor groove, the bridging fiber length becomes folded, and its trailing length is lifted from the gap and the tail end of the fiber ribbon to form a catenary (Figure 6.44b and c). The twist torque wraps the trailing length around the yarn initially at almost 90° to the yarn axis, giving a “belt-wrap” appearance, and then the remaining length is wrapped in the S-twist direction; the angle of S-wrap varies as the yarn moves toward the doffing tube. Fibers of differing lengths will have different caternary suspensions and therefore differing S-wrap angles. Figure 6.45 shows the fiber caternary suspensions during rotor spinning of cotton fibers.
When the yarn length reaches the doffing tube, the reverse twisting (i.e., the Z-twisting) of the false twist removes S-twist not only from the yarn core but also from what was the trailing length of the wrapper fiber. However, what was the leading length of the wrapper fiber receives further Z-twist and binds tighter onto the yarn. Figure 6.46 depicts the Z-wrap, belt-wrap, and S-wrap of wrapper fibers in cotton and viscose rotor-spun yarns. The tracer fibers in (a) and (d) show the Z and S wrap directions, (b) and (c) show the belt wraps, and a fold can be seen in (e).
Microscopic studies78,79 have shown that the frequency of occurrence of belts along the yarn follows a Poissonian type distribution. This suggests that wrappers
FIGURE 6.45 Wrapper fiber formation.
© 2003 by CRC Press LLC

may be considered as “defects” in the rotor yarn structure. The belt wraps in particular are known to register as neps in Uster irregularity yarn testers.80
Figure 6.47 shows the front and back of a denim fabric in which the warp yarns were Indigo dyed. What appear as blue neps in the back of the fabric are wrapper fibers on the warp yarns; similarly, the white neps in the front of the fabric are wrapper fibers on the weft yarn. The neppiness is very low, and the fabric was considered of acceptable quality.
Several factors will influence the degree of wrapping, the frequency of belts, and the Z- and S-wrap angles of the wrapper fibers.80,82 The strongest influence is the level of false twist generated by the doffing tube navel. The higher the level of false twist, the longer the tying-in zone. This reduces the end breaks and gives spinning stability, but it increases the number of wrapper fibers and the level of Z-wraps. Increased frictional drag by the rotor and ribbon tail on the trailing length
FIGURE 6.46 Wrapper fiber configurations.
© 2003 by CRC Press LLC

of the bridging fiber will increase the level of S-wraps; longer fibers also increase S-wraps. With respect to the five classes of rotor surface structure shown in Figure 6.37, it can be seen from Figure 6.48 that the yarn consists largely of classes I, II, and III. It is also evident that steel doffing tubes with groove navels result in more wrapper fibers and surface hairs (classes II and III)
Ideally, in rotor spinning, the individual fibers are subjected to continuous acceleration on being removed from the opening roller by the air suction, transported by the airflow to the rotor, and then sliding down the rotor wall into the rotor groove. The ideal case means that the fibers are straightened during transport to the rotor groove and lie together in a parallel state to form the ribbon of fibers. It should be noted that, when the ribbon of fibers is peeled from the groove, the fibers are being removed from their trailing ends. In reality, there will be some fibers that are straight within the ribbon, but the vast majority are not. Several studies83,85 have looked at how fiber straightening can be achieved, particularly with regard to the spinning of fine-count rotor yarns. The removal of fibers from the opening roller, their transit in the airflow, and landing on the rotor groove have still to be fully optimized for the highest percentage of fibers in the fiber ribbon to be straight. Thus, although these fibers conform to the twist helix of the yarn, their configurations within the rotor yarn is very different from fibers within ring-spun yarn structures; the fibers in rotor yarns are largely hooked and buckled and of a lower fiber extent than in ring-spun yarns. In ring spinning, a flat ribbon of fibers issues from the front drafting rollers to be twisted; in contrast, the fiber ribbon in the rotor groove is compacted by centrifugal force and consequently twisting is akin to a twisted cylindrical form rather than a twisted ribbon or a wrapped ribbon form.75 The differences in tension between fibers at the point of twist insertion are small, and therefore the level of fiber migration is low.
With low fiber migration and hooked and buckled fiber configurations, the mean-ingfulness of migration parameters for rotor yarns becomes questionable, since these parameters do not show a distinction between complex fiber shapes being twisted into
FIGURE 6.47 (See color insert.) Denim fabric woven from rotor-spun yarns.
© 2003 by CRC Press LLC

a yarn structure and the meandering and interlacing of fiber lengths resulting from tension differences. Kasparek’s theory of spun-in fiber in yarns86 gives an alternative approach for studying the integration of fiber lengths within a yarn structure.
6.2.2.3.2 Theory of Spun-in Fibers in YarnsFigure 6.49 gives a diagram of a fiber within a yarn structure. The probability, P, of the fiber being incorporated into the yarn, i.e., spun into the yarn structure, depends on the ratio of the sum of the elemental lengths ∆li to actual fiber length LF , so
P = (6.22)
Thus, if Σ∆li = LF , P = 1, and the full length of the fiber will be spun in. If Σ∆li = 0, P = 0, and the fiber resides on the yarn surface, e.g., totally as a wrapper fiber or hair. If part of the fiber length is spun in and the rest protrudes from the yarn or forms a wrapper, then Σ∆li < LF , and 1 > P > 0.
Instead of taking tracer fiber measurements along the meandering and complex fiber configuration to determine LF , it is more convenient to use the projected
30
25
20
15
10
5
0I II III IV V VI VII
Structure Classes
Rel
ativ
e Fr
eque
ncy,
%
MaximumMinimun
30
25
20
15
10
5
0I II III IV V VI VII
Structure Classes
Rel
ativ
e Fr
eque
ncy,
%
CeramicSteel
30
25
20
15
10
5
0I II III
Structure Classes
Rel
ativ
e F
requ
ency
, %
Smooth6-Grooves
4-Grooves
FIGURE 6.48 Distribution of rotor yarn surface structures. (Courtesy of Lawrence, C. A.and Finikopulos, E., Factors effecting changes in the structure and properties of open-endrotor yarns, Indian J. Fibre and Text. Res., 17(12), 201–208, 1992.)
Σ∆li
LF
----------
© 2003 by CRC Press LLC

elemental length and fiber extent, L, and refer to the probability ratio as the spun-in coefficient, KFi. For the yarn length Li in the diagram
Li = Σ∆li cos αi (6.23)
where α = the angle between the elemental length and the yarn axis, as shown
This can be repeated for Lj, Lm, and so forth., so
KFi = (6.24)
where n = i, j, m, etc.
= (6.25)
where = the fiber lengths projecting out of the yarn body
Kasparek has classified typical fiber configurations observed for differing ring yarn and rotor yarn structures into the nine classes with associated KFi values depicted in Figure 6.50.
It follows from the above that the mean spinning-in coefficient of a yarn is
where Ni /N is the relative frequency of the nine classes among N observations of tracer fiber configurations.
Table 6.9 gives KF values for conventional ring-spun and rotor-spun yarns, and it can be seen that the mean spun-in lengths for the former are significantly greater.
Li xi xjιj ιm
Lo
a
b
αi
∆ιi
dιι
c
d
Vector
FIGURE 6.49 Elemental lengths of a spun-in fiber. (Courtesy of Rohlena, V., Open-EndSpinning, Chap. 7, Elsevier Science, New York, 1975.)
ΣLn
L---------
LO Σ xn–L
-----------------------
Σ xn
KF Σ KFiNi
N-----
for i 1 to N= =
© 2003 by CRC Press LLC

Several other researchers87 have used the mean fiber extent coefficient Kp (= LO /L = the arithmetic mean of observed fiber extents/mean fiber length) as a shorter means to quantify the fiber length utilization of yarn structure. This approach does not take account of elemental lengths on, or projecting from, the yarn surface. However, such work has shown that machine settings (e.g., opening roller speed,
TABLE 6.9KF Values for Conventional Ring-Spun and Rotor-Spun Yarns
Yarn structureMean spun-incoefficient, KF
Standard error (%)
Coefficient of variation (%)
Combed ring-spun (conventional) 0.757 1.78 29.44
Combed ring-spun (conventional) 0.760 1.62 26.34
Carded ring-spun (conventional) 0.659 2.11 35.20
Carded ring-spun (conventional) 0.686 1.97 32.01
Carded ring-spun (conventional) 0.661 2.29 36.95
Rotor-spun 0.512 2.58 42.82
Rotor-spun 0.504 2.66 43.41
Rotor-spun 0.482 2.71 45.89
Courtesy of Rohlena, V., Open-End Spinning, Chap. 7, Elsevier Science, New York, 1975.
0
1
j KF
2
3
4
5
6
7
8
9
1
0,95
0,90
0,80
0,63
0,40
0,20
0,08
0,02
0
j = Class of configurationKF = Spun-in coefficient
FIGURE 6.50 Classification of fiber configuration in yarns and KFi values. (Courtesy ofRohlena, V., Open-End Spinning, Chap. 7, Elsevier Science, New York, 1975.)
© 2003 by CRC Press LLC

rotor diameter, rotor speed, and air-suction) affect fiber length utilization (see Table 6.10) and that there is good correlation between fiber length utilization and yarn strength (see Figure 6.51). As Kp increases, yarn tenacity increases.
6.2.2.4 Formation of Friction-Spun Yarn Structures
As Figure 6.52 illustrates, the friction drums are longer than the width of the fiber feed. The yarn formation therefore occurs along two parts of the friction drums,88
first in zone 1, the fiber supply zone, and second in zone 2, where the forming yarn
TABLE 6.10Effect of Rotor Spinning Parameters on Mean Fiber Extent
ORS MFE RS MFE AS MFE RD MFE
5000 23.07 30,000 20.78 8 18.21 46 20.786500 20.78 50,000 20.85 32 20.65 56 21.578500 17.18 70,000 19.70 57 21.30 – –
ORS = opening roller speed (rpm), RS = rotor speed (rpm), AS = air suction (cm water gage pressure difference), RD = rotor diameter, MFE = mean fiber extent (mm).
Courtesy of Chandraray, S. and Dutta, B., Mean Fibre Extent of Rotor-Spun Yarn, Indian J. Text. Res., 12(6), 133–138, 1987.
10.4
10.2
10.0
9.8
9.6
9.4
9.2
9.0
8.8
8.60.50 0.55 0.60 0.65 0.70 0.75
Mean Fiber Extent Coefficient
Yar
n T
enac
ity (
cN/te
x)
FIGURE 6.51 Effect of mean fiber extent coefficient on rotor-spun yarn tenacity. (Courtesyof Chandraray, S. and Dutta, B., Mean Fibre Extent of Rotor-Spun Yarn, Indian J. Text. Res.,12(6), 133–138, 1987.)
© 2003 by CRC Press LLC

Spinning Drum
Take-Up Direction
12
34
1 2 3 4
Sliver Feed
1 2 43
Zone I Zone II
FIGURE 6.52 Dref-2 yarn structure formation.
(a)
(b)
© 2003 by CRC Press LLC

receives no more fibers. The fibers landing onto the friction drums in zone 1 form a conical yarn end or tail between the drums. Figure 6.53a shows the fibers traveling from the opening roller to the friction drums, and Figure 6.53b shows the fibers landing and being twisted to form the yarn. The fibers are individually twisted onto the conical yarn tail during their deposition. The formation of the Dref-2 yarn structure is therefore a buildup of fiber layers from the sliver feed.
As the forming yarn length moves in the direction of take-up, the separated fibers from each consecutive sliver are deposited onto the previous layer. Thereby, fibers present in a particular sliver become integrated into the corresponding con-centric layer of the yarn; the fibers from the first sliver farthest from the delivery rollers forming the center region of the yarn. The yarn cross section shown in Figure 6.52 was obtained with sliver (1) composed of black colored fibers, sliver (2) of red colored fibers, and slivers (3) and (4) of white fibers. It is therefore possible to produce yarns with each concentric layer being composed of a different fiber type.
It is evident that any migration between layers is very small and that the yarn is much more compact in the region of the core. Since spinning tension is low, it is unlikely that this compaction is caused by any applied axial tension on the fibers (as is the case for ring spinning) and is therefore more likely to be the result of a higher twist level at the yarn core. In zone I, the twist level is low, and centrifugal forces cause the yarn tail to swell. The twist in zone II is much greater, and the yarn diameter decreases. As the yarn leaves the friction drum, the amount of twist in each radial position will depend on the length of time fibers in that position stayed within the two zones. This is because the twist gained is cumulative between the point where a fiber lands and the end of the friction drums. This means that fibers forming the yarn core are the most highly twisted.
In Dref-2 spinning, the individual fibers are blown off the opening roller and, during transport to the friction drums or rollers, they become buckled. On landing, and during twisting (see Figure 6.53), fibers have hooked, folded, entangled, and looped configurations. Figures 6.54 and 6.55 show the results of observed tracer fiber configurations in the second and fourth layers of a Dref-2, 270-tex yarn spun from 3.3-dtex, 50-mm acrylic fibers. It can be see that the fiber configurations fall within classes 4 through 9, the surface layer of the yarn having the greater amount of folded configurations and therefore a much lower KF value. The folded configu-ration is sizeable within the second layer and, consequently, the KF is much lower than for ring and rotor yarns, even though all the fiber length is within the yarn. Nevertheless, there is an indication of a trend that inner layers have the better fiber configuration and mean spun-in coefficient.
Table 6.11 shows that, similar to rotor spinning, machine settings influence fiber length utilization in Dref-2 yarns, and Figure 6.56 shows the relation between KF
and yarn tensile properties.Dref-3 yarn structure is formed by a drafted ribbon of parallel fibers lying within
the nip of the friction drums and being false-twisted, while simultaneously fibers from the opening roller are twisted onto the false-twisted ribbon. Core fibers in Dref-III yarn have, therefore, entrapped false twist.88 The lower the core count, the higher is the entrapped twist. Under identical spinning conditions, the twist in the Dref-II yarn structure is greater than the sheath fiber twist in the Dref-III structure. It can
© 2003 by CRC Press LLC

be reasoned that the fiber configurations in the central region of the Dref-III yarn will be of classes 1, 2, and 3 (see Figure 6.50), whereas the sheath fibers will have similar configurations to those of Dref-2 yarns.
It is evident from the KF values for the Dref-2 yarns, as compared with those for ring and rotor yarns, that significant improvement in fiber straightening is needed if finer yarn counts are to be produced by the open-end friction spinning technique. To improve fiber straightening, it is necessary for the fibers in flight to approach the
FIGURE 6.53 Transportation, deposition, and twisting of fiber in Dref-2 spinning.
(a)
(b)
© 2003 by CRC Press LLC

forming yarn at a shallower angle than in the Dref-2 system (see Figure 6.58a). Suction rather than blowing is preferable for the transport of fibers, so that some degree of fiber straightening occurs prior to fibers being incorporated into the yarn structure. Much research89,93 has been carried out into the development of open-end friction spinning for the production of finer count yarns that have a more ring-spun like structure. A comparison of Figure 6.36 and 6.57 shows that the finer yarn still has fiber loops rather than fiber ends projecting from its surface, but the general
Inner Layer
Outer Layer30
25
20
15
10
5
0543 6 7 8 9
% R
elat
ive
Freq
uenc
y
Class of Fiber Configuration
FIGURE 6.54 Relative frequency of fiber configurations in inner and outer layers of Dref-2 yarn.
25
20
15
10
5
0
3 4 5 6 7 8 9Class of Fiber Configuration
Cum
ulat
ive
Spun
-In
Len
gth
Coe
ffic
ient
Inner Layer
Outer Layer
FIGURE 6.55 Spun-in length coefficient KF for Dref-2 yarn.
© 2003 by CRC Press LLC

structure is more akin to the conventional ring spun than to the Dref-2 yarn. Although the various prototype systems producing this type of friction-spun yarn have yet to reach, successfully, the commercial stage, the mechanism by which fibers are inte-grated into the yarn structure is fundamentally different from the Dref-2 system and is therefore of technical interest.
TABLE 6.11Effect of Spun-In Length Coefficient of Dref–2 Yarn Properties
ORS KF FDS KF AS KF YD KF
3000 0.21/0.12 800 0.15/0.1 90 0.15/0.10 80 0.22/0.124000 0.10/0.05 3200 0.09/0.05 165 0.15/0.08 226 0.15/0.07
ORS = opening roller speed (rpm), FDS = friction drum speed (rpm), AS = air suction (mm H20),YD = yarn delivery rate (m/min).
4.5
4.0
3.5
3.0
2.5
2.0
1.5
1.0
0.5
0.0
0.08 0.10 0.12 0.14 0.16 0.16 0.20 0.22 0.24Spun-In Length Coefficient, KF
Yar
n T
enac
ity c
N/T
ex
FIGURE 6.56 Effect of spun-in length on Dref-2 yarn strength.
FIGURE 6.57 Structure of friction-spun yarn produced with inclined fiber channel.
© 2003 by CRC Press LLC

FIGURE 6.58 Yarn formation in fine-count OE friction spinning. (Courtesy of [top] Lord,P. R., and Rust, J. P., Fibre assembly in friction spinning, J. Text. Inst., 4(82), 465–478, 1991,and [bottom] Stalder, H. and Soliman, H. A., A study of the yarn formation process duringfriction spinning, Melliand [Eng. ed.], 2, E44–46, 99–103, 1989.)
© 2003 by CRC Press LLC

Stalder,89,90 Lord,91 and others92–94 have established that, when fibers are delivered (usually from a single sliver feed) in an airflow down a channel inclined acutely to the yarn length between the friction drums, the fibers are deposited to form a sleeve, lofty in structure, around the conical end of the yarn (see Figure 6.58). The sleeve is usually squashed within the nip of the friction drums. Importantly, it is the fiber sleeve that rotates by frictional contact with the drum, and it does so without moving along the nip line of the drums. The yarn tail is formed within the sleeve, but it does not rotate;89 the forming yarn length is only pulled away with the velocity of the delivery rollers.
The fibers are individually twisted onto the sleeve during their deposition. The fibers may be deposited, preferably, at the interface of the sleeve and the drum surface (Figure 6.58b) or directly onto the fiber sleeve (Figure 6.58c). The hypothesis is that the leading end of a fiber makes first contact with the friction drum surface, and the momentum of the trailing end causes the fiber length to fillip over its leading end as the fiber is being twisted into the rotating sleeve. This fillip-over action tends to give some degree of fiber straightening and results in the sleeve fibers having an S-twist helix. The preferred state of fiber deposition at the sleeve-drum interface is obtained by employing only one perforated drum with applied suction, the other drum (friction drum) being a solid surface, and by positioning the exit of the fiber transport channel close to the interface (see Figure 6.59).
Fiber ends projecting from the rotating sleeve provide the means of capturing the leading ends of the depositing fibers for the latter to be twisted onto the sleeve. Fibers may also be captured as illustrated in Figure 6.60. At (a), the fiber approaches and is pulled into the interface of the sleeve and the first drum surface. The sleeve rotates at a surface velocity Vy < VR1. It is, however, likely that the torsion resistance of the sleeve is sufficiently small that slippage between itself and drum is negligible in comparison with the Dref-2 system.53 At (b), the fiber contacts the second drum surface, or is entangled in the sleeve, and moves toward the second interface. In positions (c) and (d), the fiber becomes twisted onto the sleeve.
Figure 6.61 depicts how fibers forming the sleeve are subsequently twisted onto the conical tail of the yarn. The leading ends of fibers in the rotating sleeve become attached to the yarn tail (Figure 6.61a) and, as the yarn length is pulled away by the delivery rollers, the attached fibers are Z-twisted onto the tail (Figure 6.61b). The figure shows a fiber with S-helix angle γ being twisted with Z-helix angle β onto the yarn tail at a point where, locally, the diameter is indicated as “d” (Figure 6.61c). From the geometrical parameters given in the diagram, (Figure 6.61c and d) the following equation can be derived for the yarn twist:89,90
(6.26)
where DR = fiber sleeve diameterTAV = average yarn twist
Y = ratio of drum surface speed to yarn speeddG = average yarn diameter
1 πDRT AV /Y( )–
1 2πdGT AV /3( )2+[ ]----------------------------------------------------- cos γ sin γ /Y( )+=
© 2003 by CRC Press LLC

The yarn twist decreases with increasing diameter. Hence, because of the conical tail, fibers are twisted onto a variable diameter, “d” (see figure), which results in the twist in friction-spun yarns being higher at the center than the surface. For a given Y, coarser yarns will therefore have a lower average twist than finer yarns. As may be expected with regard to the ratio of drum to sleeve diameter, the yarn twist decreases with increasing sleeve diameter. If γ is too small an angle, then the pulling of yarn length by the delivery rollers may cause slippage between the fibers in the sleeve and the yarn tail.
6.2.2.5 Formation of Wrap-Spun Yarn Structures
6.2.2.5.1 Air-Jet Spun YarnsThe occurrence of the three subclasses of air-jet wrap-spun yarn structure shown in Figure 6.38 may be explained from further consideration95 of the mechanism of edge fiber wrapping described in Section 6.1.4.1.2. As the drafted ribbon of fibers issues from the front drafting rollers, similar to conditions in ring spinning, the bulk of the fibers become twisted to form the bulk or core of the yarn, the twist angle being, say, αK. Not all of the fibers will be caught by the twist triangle. The
Fibers
FrictionDrum
FiberSleeve
PerforatedDrum
Air
Yarn
FIGURE 6.59 Fiber deposition at the sleeve-friction drum interface. (Courtesy of Krause,H. W., Soliman, H. A., and Stalder, H., The yarn formation in friction spinning, Int.Text. Bull.,Yarn Forming, 4, 31–42, 1989.)
© 2003 by CRC Press LLC

Vf1
Vf2
VR1 VR2Vy
(a)
VR1 VR2
(c)
VR1 VR2
(d)
Vf
VR1 VR2Vy
(b)
FIGURE 6.60 Fiber capture by rotating sleeve. (Courtesy of Lord, P. R. and Rust, J. P.,Fibre assembly in friction spinning, J. Text. Inst., 4(82), 465–478, 1991.)
Rotating Sleeve of Fibers
S-Twist Z-TwistP, S At Time tP′,S′, At Time t + ∆t
[VG + VPa] ∆t
ωP, ∆tωs, ∆t
VPa, ∆t
VG, ∆t
LF
β
P, S
S′P′
vG
vG
vG
dG
vSD
LE
P, S ωs
D
d
γ
γ
γ
nS
nS γ
D
d
ωp ∆td2
(a)(c)
(b) (d)
Rotating Sleeve ofFibers
Part of FiberLength in Sleeve
Part of FiberLength Twistedonto Yarn Tail
Yarn Tail
FIGURE 6.61 Twisting of fibers onto yarn tail. (Courtesy of Stalder, H. and Soliman, H.A., A study of the yarn formation process during friction spinning, Melliand [Eng. ed.], 2,E44–46, 99–103, 1989.)
© 2003 by CRC Press LLC

free fibers, which are mainly edge fibers, subsequently come into contact with the rotating body of fibers and wrap around it; if the wrap angle of an edge fiber is αR, then αK > αR.
The aim is to secure sufficient edge fibers for wrapping so as to obtain useful yarn strength.96 To do so, the edge fibers must not get pulled into the twist insertion point but, instead, wrap the balloon length of the forming yarn core well below the twist insertion point. If the spinning conditions are such that the ballooning core has a large circularly polarized amplitude (see Chapter 8) and a high rotating speed, then the airflow generated by the balloon, near the front drafting rollers, will push edge fibers away from the twist insertion point while the suction of the first jet pulls the edge fibers into contact with the balloon below the twist insertion point. The amplitude and rotating speed of the balloon are governed by the jet-nozzle angles, jet pressures, ribbon width, production speed, and thread-line tension, i.e., overfeed ratio. The second-jet angle and applied pressure determine the twist level at the twist insertion point. A low level of twist assists in preventing edge fibers being twisted into the core. More edge fibers are formed with a wide ribbon issuing from the front rollers. Usually, only 6% of all fibers are used for wrapping.97
As Figure 6.62 illustrates, the class of substructure wrapper that a fiber eventually forms is governed by the size and direction of the wrap angle the edge fibers have
Twister Twister Twister
CoreFibers
EdgeFibers
CoreFibers
WrappingFibers
αK
αK
αK
− αR
αU αU αU
αR
αR − αR
αR = 0
αK − αR
(a) (b) (c)
FIGURE 6.62 Edge fiber wrapping before and after air-jet twisting device.
© 2003 by CRC Press LLC

when they are first wrapped onto the core fibers.95 If αR is in the same direction as αK (say, Z) then the resulting substructure will be Class I (Figure 6.62a). The resulting wrap angle is αU.
For the case where αR corresponds to an S-wrap, a Class II type substructure will result (Figure 6.62c); when αR = 0, a Class III substructure is formed (Figure 6.62b). A Class I corkscrew formation occurs when αK >> αR. In such circumstances, the untwisting of the core gives a sizeable increase in length but also a sizeable contraction in the length of the wrapping helix, which buckles the core length.
The simple helix model may be modified to basically represent the air-jet structure. For Class I, only the wrapper fibers would collectively adopt the yarn helix angle α < 90; the remaining fibers would from the twistless core of the yarn. Class II would have a twistless core of fibers similar to Class I, but each fiber in a group of wrapper fibers would have differing values of αU. With Class III, the surface (i.e., wrapper) fibers would give the yarn a twisted appearance, αU = –αK. As each class length is much shorter than a fiber length, parts of a wrapper fiber length will be among the core fibers so that, when a load is applied to the yarn, tension is induced in the wrapper fibers and thereby radial pressure is applied to the core fibers. The resulting interfiber friction prevents slippage.
6.2.2.5.2 Hollow-Spindle Wrap-Spun Yarns
In the formation of hollow-spindle (HS) yarns, the manner of wrapping is an important factor, since wrapping coils must be distributed as uniformly as possible along the yarn. Wrapping takes place at the point where the filament makes contact with the staple fiber core and is done with or without the use of a false-twister. The simplest and most effective is with a false-twister. Based on the description of the process, given in Section 6.1.4.2, Figure 6.63 shows that the location of yarn for-mation may be divided into three zones. The tension during twisting is much lower than in ring spinning, and therefore fiber migration is negligible, and the formation of hairs is relatively low. Fiber lengths that do project from the core are subsequently bound onto the core by filament wrapper.
As shown, there are two ways by which wrapping can occur using the false-twist spindle technique, depending on the threading of the false-twister. With Case A, positive threading, wrapping occurs within the hollow spindle, giving a low level of S-wraps per unit length. But this increases to the preset value below the false-twister, where there is a much shorter yarn length between the false-twister and the delivery rollers. Note that spindle rotation is clockwise. For Case B, wrapping occurs only below the false-twister, with the S-wraps per unit length generally equalling the preset value. It is found that Case B gives the better yarn properties, as lower core tension occurs (see Figure 6.64).
The HS wrap-spun structure may be spun with a parallel or crimped profile, depending on the relative tensions of the filament and the core, when twisted. As Figure 6.65 illustrates, if the tension, Fs, of a staple core, when twisted, is greater than the filament tension, Ff, during wrapping, then the core will not be crimped when untwisted; the converse gives the crimped profiles shown in the figure. The tension of the core is controlled by the difference in surface speed between the front drafting rollers, Vs, and the delivery roller, Vd. The percentage ratio [Vs /Vd] 100 is
© 2003 by CRC Press LLC

Case A
NIP Line of Drafting Rollers
Case B Zone I
Zone II
Zone III
FilamentWrapper
StapleCore
FilamentPirn
HollowSpindle
False Twister
CoreTwist
Core Twist NoWrapsorCore Twist andLow Wraps
Set WrapsNo Core Twist
ToDeliveryRollers
FIGURE 6.63 Hollow-spindle wrap-spun yarn formation. (Courtesy of Srinivasan, K. V.,A Study of Hollow Spindle Yarns, M.Sc. thesis, U.M.I.S.T, 1984.)
© 2003 by CRC Press LLC

referred to as the overfeed. If it is less than or equal to unity, a parallel profile can be obtained; if greater than unity, the crimp profile occurs, the amount of crimp being dependent on the overfeed. This facility for structuring the profile makes the HS yarn process suitable for producing fancy yarns (see Chapter 9).
In principle, all staple fibers can be combined with any type of continuous filament. However, monofilament wraps the staple core in such a way that the filament becomes almost imperceptible among the bulk of the yarn, whereas mul-tifilament appears as a ribbon spirally wound around the yarn.
6.2.3 STRUCTURE PROPERTY RELATION OF YARNS
Yarn properties are usually evaluated from two perspectives:
• The likely performance of the yarn in subsequent fabric manufacturing processes
• The fabric surface appearance and mechanical properties, often of impor-tance to the visual and tactile aesthetics of end products
In weaving and knitting, tensile properties give an indication of the work rupture to withstand cyclic tensioning, the coefficient of variation of breaking load giving a measure of the weak places. Yarn surface friction, compression, and hairiness are also important to the yarn running behavior with respect to peak tensions that may result in yarn breaks and the liberation of fiber fragments from the yarn surface. Although not commonly measured, the bending rigidity and compression are linked to the ease of deforming the yarn around thread guides and in attaining precise fabric geometry.
Of prime importance to fabric appearance are yarn irregularity, the absence of periodic faults, neps, conspicuous thick and thin places, and hairiness. All of these
No False Twister
Positive
Negative
12
10
8
6
4
2
200 300 400
Cor
e Te
nsio
n (c
N)
Wrap m–1
FIGURE 6.64 Spinning tension for Case A and Case B.
© 2003 by CRC Press LLC

Ff > Fs Fs > Ff
Vf = V Vs = V
FIGURE 6.65 HS wrapped profiles.
© 2003 by CRC Press LLC

are usually measured to quantify the quality of a yarn. The degree of parallelism of the surface fibers of the yarn strongly influences the light reflectance from a fabric. Even though neither is measured, it is well appreciated that, subject to the effect of the optical properties of the fiber, the higher the degree of parallelism and the lower the hairiness, the more lustrous the yarn will appear in, say, a woven fabric. A more random surface arrangement gives a matt look to the cloth.
Fabric mechanical and surface properties, which may be determined by objective methods,* have been correlated with fabric handle.† These fabric properties are dependent on fabric structure but also on the constituent fiber and yarn mechanical properties. The most basic types of fabric deformation are in-plane extension and shear, bending in a perpendicular plane, and out-of-plane buckling.75 In the daily use of fabrics, the deformation that occurs is likely to involve a combination of the basic types. However, it is useful to consider, as a simple example, the part that a yarn plays in the deformation of a plain woven fabric under tensile loading in either warp or weft direction, as this may help to illustrate the importance of some of the properties considered later in this section.
When a plain-woven fabric is subjected to tensile stress in one of the principal weave directions, it is useful to know the physical changes occurring in both direc-tions of the structure.
Figure 6.66 shows a diagrammatic cross section of a plain weave fabric. Since Peirce’s99 geometrical model of plain cloths, a number of modifications have been made to take account of flattening of the constituent yarns.75 We can see that flattening of the yarns is important because this gives the fabric a better cover factor,‡ but it also reduces the fabric crimp§ and thickness. The flattening of the yarns will give more frictional contact at their crossover points and this, along with bending rigidity of the yarns, is important to fabric mechanical properties, particularly at low fabric extensions.
Figure 6.67 shows a typical load-extension curve for a plain weave fabric which can be divided into three distinct zones. 0–I is a high initial modulus zone. This
* Kawabata and FAST Systems.† Defined (in the Textile Institute’s Terms and Definitions) as the quality of a fabric or yarn assessed by the reaction obtained from the sense of touch, i.e., with regard to roughness, smoothness, harshness, pliability, thickness, etc.‡ The area of a fabric covered by the constituent yarns.§ The waviness or distortion of a yarn that is a result of interlacing in the fabric (as defined in the Textile Institute’s Terms and Definitions).
a
P
bT
T = Fabric ThicknessP = Yarn Spacing
FIGURE 6.66 Diagrammatic cross of plain-weave fabric.
© 2003 by CRC Press LLC

high resistance to extension is largely caused by the initial bending modulus of both warp and weft yarns as a result of interfiber frictional resistance. I–II is the yarn decrimping zone. Once the load exceeds the frictional resistance to yarn bending, increasing extension occurs at much lower increases in load. The increases in load is required for the following:
1. Decrimping, by unbending, the yarns in the direction of the applied load2. Increasing the crimp of the orthogonal yarns3. Increasing the compression at the crossover points
The reduction in crimp in the applied load direction will increase the fabric length, and the increase in crimp in the orthogonal direction will reduce fabric width. The increase in pressure at the crossover points will tend to prevent fiber slippage. This effect is termed fabric assistance.
When the crimp has been considerably reduced, further extension causes the fabric modulus to rise (Zones II–III–IV). The compression at the crossover points enables yarn and fiber extension to take place. Beyond point III, the tensile modulus is almost comparable to the fiber modulus and remains constant until the fiber yield point. Beyond the yield point, the modulus decreases rapidly, and the fabric breaks at the point of fiber rupture.
The tensile properties of the fabric within the region III–V and during the process of yielding are largely governed by the fiber and yarn properties rather than the fabric structural properties. However, fabric assistance increases the strength of the fabric, so the fabric strength is greater than the sum of the strengths of the individual threads in the direction of applied stress.
From the above discussion, we can infer that the yarn properties listed in Table 6.12 are important to both post-spinning processing and fabric properties.
Load
III
II
I
ExtensionMO
IV
V
Forces at Crossover Points:
T1, T2 – Tension in YarnF – Normal Force
T1 T2
F
FIGURE 6.67 Load-extension curve of plain-weave fabric.
© 2003 by CRC Press LLC

Therefore, they are the ones we shall now consider in terms of yarn structure-property relation. The various methods for measuring these properties will not be described in this book. The reader unfamiliar with textile testing is advised to study in parallel with the remainder of this chapter the relevant text in the books listed in the Recommended Readings section of Chapter 3.
6.2.3.1 Compression
Yarn compression is considered in terms of the changes in yarn diameter, or thick-ness, with compressive load. There are several definitions100,103 of yarn compression, but essentially most take the form
Compression% = (6.27)
where dO = yarn diameter at minimum load (1 g/cm2)
dW = yarn diameter at w g/cm2
Figure 6.68 illustrates how yarn diameter varies nonlinearly under compressive loading. The percentage ratio of the work done in recovery (i.e., area under the curve EC) to that for compression (i.e., area under the curve FC) is referred to as the resilience104 and may be defined as the ability of the material to recover from compressive loading,105 or the net recoverable energy.
Much research has been done, primarily on conventional ring-spun yarns, aimed at establishing an understanding of the factors governing yarn compression and deriving general equations for compression and recovery curves. Theoretical studies102,106,107 have been based on the simple helix model, assuming that yarn compression may be related to the bending and twisting of the fiber helices (the compressive resistance being the resistance of the individual fiber helix to undergoing deformation into a flattened shape). The strain energy of individual helices are then determined, and the strain energy of the yarn is then the sum of the strain energies of the individual units. Figure 6.68 shows that close approximations have been obtained for the general form.102 The difference between the theoretical and experi-
TABLE 6.12Yarn Properties Influencing Post-Processing and Fabric Properties
Yarn properties
• Compression• Bending rigidity• Tensile• Irregularity• Hairiness• Moisture transport
100dO dw–( )
dO
----------------------
© 2003 by CRC Press LLC

mental results is attributed to, among other factors, the departures of real yarns from the simple helix model. Empirically derived equations show differences, probably a result of differences in test methods. However, it was generally found that spinning twist and fiber crimp were the most important factors; the compression resistance increased as these increased. Fiber length and cross-sectional shape have less effect.
The word bulk is another commonly used term relating to the compression characteristics of textile materials, particularly in relation to the handle, which, as
2R0 2R1
P
P
P
Limit2
1
1.0Compression Curves1 - Experiment2 - Theoretical
R/R0Load
Load
1
C
E
F
2
0
1 - Compression2 - Recovery
Diameter
FIGURE 6.68 Idealized yarn compression and recovery curves. (Courtesy of Goktepe, F.,The Effect of Yarn Structure of the Deformation of the Yarn Cross-Section, Ph.D. thesis,University of Leeds, 1997.)
© 2003 by CRC Press LLC

an aesthetic property, has a subjective element. However, the bulkiness of a yarn may be considered in terms of the volume occupied by the constituent fibers or more simply the yarn’s specific volume, which is related to the yarn count, Tt, by
Tt = πR2 y (6.28)
where R = yarn radius (cm)vy = specific volume (cm3/g)
Yarn specific volume is an indication of the fiber packing in a yarn. Ignoring the effects of irregularities, we can consider the fiber packing density, Φd, of a yarn to be the number of fibers per unit area perpendicular to the helix angle, in which case
Φd = πR2 (6.29)
where Tf = fiber fineness
Alternatively, the degree of fiber packing may be given by the fiber packing fraction, Φf, of the yarn, which is the proportion of the yarn cross-sectional area, perpendicular to the yarn axis, occupied by the constituent fibers. If νf is the fiber specific volume, then the fiber packing fraction is
(6.30)
In Chapter 1, the helix model was illustrated with fibers in what is termed an open packing arrangement. Another idealized packing arrangement of fibers is called hexagonal close packing, which is depicted in Figure 6.69 along with open packing. Hexagonal packing involves a single or a multiple fiber core around which layers of fibers may be packed to give a hexagonal outline. However, for a large number
105
vy
--------
T t
T f
------
Φ fv f
vy
-----=
FIGURE 6.69 Hexagonal close packing and open packing.
© 2003 by CRC Press LLC

of fibers typical of real yarns, hexagonal packing can approximate a circular shape.75
Real yarns deviate from the above idealized form75 because of factors such as differing fiber cross sections, compaction caused by twist, the actual number of fibers in the yarn cross section not precisely filling an exact number of layers, and the effects of migration and wrapper fibers. The net effect is that the packing density of yarns is not uniform over the cross section.
Figure 6.70 shows the cross section for several differing yarn structures spun from polyester fibers/filaments to similar counts and twist, and the deviations with respect to completion of the outer layers is evident. The concentric circles with black dots indicate locations of fibers in the yarn cross sections. It is evident that packing density varies across the yarn cross sections. Figure 6.71 shows that packing density of the filament and ring-spun yarns are fairly similar except at the high-twist levels. However, in both cases, the decrease in Φd from the yarn center to the periphery is initially small until the outer zone, where there is a significant decrease. With the rotor-spun structure, Φd decreases almost linearly from the center to the outer region of the yarn. It is fairly clear from the microphotograph that the HS yarn has a uniformly low Φd over the cross section. It may be expected that, with rotor yarns
FIGURE 6.70 Cross section of differing yarn structures. (Courtesy of Goktepe, F., TheEffect of Yarn Structure of the Deformation of the Yarn Cross-Section, Ph.D. thesis, Universityof Leeds, 1997.)
© 2003 by CRC Press LLC

1.0
0.9
0.8
0.7
0.6
0.5
0.4
0.3
0.2
0.1
0.00.2 0.4 0.6 0.8 1.0
r / R
r / R
r / R
Ave
rage
Pac
king
Den
sity
Ave
rage
Pac
king
Den
sity
1.0
0.9
0.8
0.7
0.6
0.5
0.4
0.3
0.2
0.1
0.00.2 0.4 0.6 0.8 1.0
Ave
rage
Pac
king
Den
sity
Filament Yarn
394 tpm551 tpm709 tpm
1.0
0.8
0.6
0.2
0.0
0.4
0.0 0.2 0.4 0.6 0.8 1.0
Ring Spun Yarn
394 tpm551 tpm709 tpm
Rotor Spun Yarn
394 tpm551 tpm709 tpm
FIGURE 6.71 Packing density according to yarn types. (Courtesy of Goktepe, F., The Effectof Yarn Structure of the Deformation of the Yarn Cross-Section, Ph.D. thesis, University ofLeeds, 1997.)
© 2003 by CRC Press LLC

being of a lower density than ring-spun yarns, they would flatten more easily at crossover points in a woven fabric. However, because of the presence of wrapper fibers, this not the case, and the effect of the wrapper fibers is also apparent in the flexural characteristics of the yarn.
From observations of yarn cross sections,109 the following relationship was found to suitably represent the fiber distribution in the cross section:
(6.31)
In the equation, a1, a2, and a3 are constants determined from observations of the yarn cross section.
A simplified form of the parabolic equation is
−f(u) = fo(1 – u2) (6.32)
where u = normalized radius u = r/Rfo = packing density at the yarn central zone, which is related to the packing
density fo = 2Φ
It is claimed74 that this model for fiber distribution in a yarn cross section can be fitted to any yarn by estimating the yarn radius and the yarn average packing density.
6.2.3.2 Flexural Rigidity
The minimum stiffness of a yarn should be the sum of the bending rigidities of the constituent fibers. However, for a closer approximation to real yarns, the effect of twist and yarn structures must be considered, i.e., the obliquity of the fibers and interfiber friction. If we assume that fibers in a yarn are sufficiently elastic to closely follow a linear relationship between the bending moment applied to them and their curvature of deformation, then, in the absence of the effects of twist and yarn structure, the yarn should also show a linear relationship given by M = B/r, where M is the bending moment, 1/r is the curvature, and B is the bending rigidity of yarn. Deviations from this linear relation should indicate the effect of twist and yarn structure.
Figure 6.72 shows a typical bending characteristic curve for yarns. For a yarn to bend, the constituent fibers must be free to move (i.e., to slip past each other). At the start of bending, interfiber friction at fiber contact points, as well as fiber stiffness, resists bending, and a rapid rise in M occurs for small changes in 1/r. Bis therefore greater than the theoretical minimum. Once the friction is overcome and the fibers are free to slip at their contact points, M becomes closer to the theoretical minimum, provided there are no further friction effects with increase 1/r, and the fibers remain free to bend. Reversing the bending moment gives the hysteresis loop. A similarly shaped hysteresis curve is applicable to fabrics but with the added effect of yarn crimp. As indicated in Figure 6.72, the characteristic parameters of curve are MO (the coercive couple or bending moment required to overcome the initial
f r( )– a1 a2 a3r2+ +=
© 2003 by CRC Press LLC

frictional resistance), the residual curvature, the percent bending recovery, the initial modulus E, and the bending rigidity B.
Using the comparison of a steel spring, the helix of twist should reduce the bending rigidity. However, fiber migration, fiber configuration, and other yarn struc-tural features will have counterbalancing effects. Table 6.13 shows the effect of twist on a 28-tex, 48-filament polyester yarn, a 60-tex, 54s-quality worsted yarn, and a 59-tex rotor-spun cotton yarn. The yarns were steam set to prevent snarling. It is evident that twist had no effect on the bending rigidity of the filament or cotton yarn, but the rigidity of the worsted yarn decreases with twist.
Theoretically, B should decrease with twist, as seen with the worsted yarn. In the case of the filament yarn, any reduction due to the twist helix angle is counterbalanced by the increase caused by increased packing density of the filaments and radial compression. With staple yarns, the discontinuities at the fiber ends cause the torsional stresses in the fiber to be lower than in continuous filament yarns. Therefore, for the worsted yarn, this factor, along with the lower packing density resulting from the wool fiber crimp, obviates any significant counterbalance to the effect of the helix angle of twist. This is not the case with the rotor-spun cotton yarn. Here, the coun-terbalance effect may be attributed to the wrapper fibers, which increase with twist.
The effect of wrapper fibers in the rotor-yarn structure is applicable to air-jet yarns but not to HS yarns, where the packing density of the yarn is very low. Figure 6.73 shows B and MO values for friction, rotor and air-jet polyester/cotton yarns of similar counts, and the resultant woven fabrics. The values are normalized with respect to ring-spun yarns, and it is evident that these structures are stiffer than the ring-spun structure. Since Table 6.13 indicates that the effect of the helix angle of twist in rotor yarns is negligible, it is likely that the difference in values between the air-jet and rotor is attributable to the frequency, length, and tightness of the wraps as well as the number of fibers wrapping a given point. The values for the friction-spun yarn are shown to be greater than rotor-spun yarn, and this may be the result of fiber compaction in the central region of the yarn caused by the characteristically highly twisted core.
M(mNmm)
Mo = ef/2(Coercive Couple)
E = Mo/B(Initial Modulus)
Kr = bc/2(Residual Curvature)
B = (HL + Η′L′)/(LJ + L′J′)(Bending Rigidity)
BR% = (ab + cd) + 100/ad(% Bending Recovery)
(1/mm) K
L
a
J
b
f
e
cd
L′
H′
J′
H
FIGURE 6.72 Yarn bending characteristic curve.
© 2003 by CRC Press LLC

TABLE 6.13Effect of Twist and Yarn Structure on Yarn Flexural Rigidity
Twist factor(tex1/2/cm)
Rigidity, B(mN/mm2)
Coercive moment, Mo
(mN/mm2) × 10−2Residual curvature
(mm–1 × 10⁻²)Mo/B
(mm–1 × 10⁻²)
Polyester filament (28-tex/48 fil) yarn
10 7.2 6.2 1.1 0.9
20 7.1 10.4 1.9 1.5
30 6.8 29.8 4.5 4.4
40 7.3 46.7 6.5 6.4
50 7.2 51.8 7.1 7.2
60 8.5 76.6 8.7 9.0
Worsted (60-tex, 54s-quality wool, conventional ring-spun) yarn
16 11.4 16.5 1.5 1.5
28 10.8 20.0 1.8 1.9
40 10.4 21.5 1.8 2.1
51 9.6 12.1 1.3 1.3
62 8.4 8.8 1.3 1.0
Rotor spun cotton (59-tex) yarn
43.1 15.0 12.8 8.5 –
52.6 16.2 15.4 9.5 –
62.2 16.0 19.3 11.4 –
Normalized Values
Friction Rotor Air-Jet
Fabric
0
0.2
0.4
0.6
0.8
1.2
1.4
1
Rigidity
Normalized Values2
1.5
0.5
0
1
Friction Rotor Air-Jet
Yarn
Coercive Moment
FIGURE 6.73 Effect of yarn structure on coercive moment and bending rigidity. (Courtesyof Looney, F. S., E. I. Du Pont de Nemours & Co., Wilmington, DE, private communication,1989.)
© 2003 by CRC Press LLC

Usually, with conventional ring-spun yarns, a finer fiber gives lower bending rigidity for a given count. However, Figure 6.74 shows that this is not necessarily the case for rotor and air-jet yarn; for both yarns, B and MO increase with increased fineness. Figure 6.75 illustrates the results of various steps taken to modify the stiffness of the air-jet yarn, which included replacing a singles yarn with a two-ply yarn, applying a softening agent to the singles, and twisting the singles yarn in the opposite direction to the wrap helix. As may be expected, reverse twisting to loosen
Coercive Moment RigidityFiber Titre (dtex)
Normalized Values2
1.5 1.5
0.5
01.1 1.3 1.67 1.1 1.3 1.67
1
Rotor
Normalized Values2
1.6
0.5
0
1
Air-Jet
FIGURE 6.74 Effect of fiber fineness and yarn structure on bending characteristics. (Cour-tesy of Looney, F. S., E. I. Du Pont de Nemours & Co., Wilmington, DE, private communi-cation, 1989.)
Normalized Values
20 Tex Reverse Twisted 2 Ply 10 Tex Softened
Rigidity Coercive Moment
FIGURE 6.75 Effect of modifications to air-jet yarn. (Courtesy of Looney, F. S., E. I. DuPont de Nemours & Co., Wilmington, DE, private communication, 1989.)
© 2003 by CRC Press LLC

wraps confirms the effect of the wrapper fibers on the bending characteristics of the yarn.
6.2.3.3 Tensile Properties
The strength and extension of spun yarns are two very frequently measured prop-erties, since they govern the processability of a yarn.108 Much of the understanding of the tensile characteristics and failure mechanism of yarns has resulted from attempts to develop theoretical models simulating yarn behavior. An extensive amount of work has been published on yarn mechanics,75,110–114 which primarily consists of theoretical models of yarn structure and application of these models to predict yarn tensile properties based on the properties of the constituent fibers, generally one type of fiber. Because of the complexity of staple yarn structures, no theoretical model for predicting the staple yarn properties has yet reached the position where it is widely accepted to be of practical use. Empirical models115,116
have also been reported but have the limitation of being applicable to specific yarn types, usually over a narrow range of conditions. The theoretical and empirical studies have nevertheless given useful insight into the relationship between yarn structure and properties and the effect of processing conditions.
With respect to yarn tensile properties, the failure mechanism of staple yarns containing twist is generally explained in relation to their nonlinear tensile behavior, typified by Figure 6.76. When load is applied to a yarn, tension is induced in each fiber through shear forces between the fibers. The amount of tension induced in a given fiber will depend on the load distribution over the yarn cross section in relation to the fiber position in the yarn, the yarn twist level, and, importantly, the spun-in length of fiber. Figure 6.77 illustrates that relative shear stress is greatest at the fiber ends and that tension builds up from the fiber ends. It can be seen that low twist levels, because of low fiber packing, do not facilitate a good transfer of the load applied to a yarn. It should also be evident that low KF values and short fiber length do not enable effective utilization of fiber strength.
As a proportion of load pulls on a fiber end, the fiber helix extends until it tightens onto the other fibers around which it is twisted, compressing these fibers together. As the load increases, the fiber itself starts to extend, simultaneously increasing the compression. The relative changes in yarn cross section and length, i.e., the Poison’s ratio for the yarn, σy , is given by
where R and L = the yarn radius and lengthdR and dL = changes in the parameters with tensile load
Considering the simple helix model and the geometry for one turn of twist, it is evident that the actual extension of a filament will be greater as the filament is closer to the yarn axis; a filament on the yarn axis will begin extending with the onset of loading, i.e.,
σydR/RdL/L-------------=
© 2003 by CRC Press LLC

10
9
8
7
6
5
4
3
2
1
00 4 8 1612 20 24 32
Elongation (%)
Bre
akin
g Fo
rce
(cN
/Tex
)
C
B
A
FIGURE 6.76 Example of tenacity-extension characteristics of a twisted yarn.
1
0.8
0.6
0.4
0.2
T
Relative Stress Relative Shear
Fiber Length Fiber Length
T – Increased Twist levels
FIGURE 6.77 Stress induced in fiber with applied load to yarn.
© 2003 by CRC Press LLC

εf = (6.33)
εf = dLf /Lf = filament extension/fiber filament length
εy = dLf /Lf = yarn extension/yarn length
where εf = filament strainεy = yarn strainθ = the helix angle of the filament at a given radial distance from the axis
(see Figure 1.4, Chapter 1)
For the case of staple yarns, Hearle40 has modify the above equation to give
(1 + ε) 2 = (1 + εy)2 cos2 α + (1 – σy εy2) sin2 α (6.34)
where εf , εy , σy , α are the parameters relating to staple yarns.
All fibers in the spun yarn will be performing the above task and, by doing so, resist slipping past each other. The tensions induced in the fibers have radial and axial components. The twist inserted into the yarn causes residual stress in the fibers. This also has radial and axial components, and therefore the induced tension adds to it. The relative size of the tension components will depend on the changed helix angle corresponding to the applied load. The inward pressure from the radial com-ponent increases with fiber extension as the load increases; consequently, the inter-fiber friction increases.
The initial part of the curve in Figure 6.76 (region A) denotes a linear behavior where the increasing inter fiber friction prevents fiber slippage when small stress is initially applied. With increased stress, fibers begin to slip (region B) as the helix begins to extend and then locks, and the structure tightens to take further loading. From here on (region C), the load increases with a combination of fiber slippage and fiber breakage that eventually result in the yarn break. To increase the proportion of fiber breakage to slippage and thereby the yarn strength, the twist may be increased so that the induced tension on fibers has a larger radial component.
With a higher level of inserted twist, the helix angle is greater, and the effect of resisting fiber slippage under yarn loading should increase. With the helix model, however, it can be shown that, at low yarn strains, the obliquity of the helix reduces the contribution of filament modulus, Ef, to yarn modulus, Ey, i.e.,
Ey = Ef cos2 α (6.35)
Thus, as the tenacity is given by Sy = Ey εy , the yarn strength should decrease with increased twist. Therefore, in staple yarns, there are two opposing effects of twist: the resistance to fiber slippage and the reduced contribution of fiber modulus. Hearle75 has modified Equation 6.35 for the case of staple yarns to take into account the effect of migration and discontinuities.
εy cos2θ σy sin2θ–[ ]
© 2003 by CRC Press LLC

(6.36)
(6.37)
where Lf = fiber lengthrf = fiber radiusµ = coefficient of interfiber frictionQ = length of fiber in one migration cycle
6.2.3.3.1 Effect of TwistBased on the modified equation, Figure 6.78 shows the modulus for staple yarns should increase with twist to a maximum value and then decrease with further increases in twist, whereas, for filament yarn, the modulus decreases with twist. A plot of staple yarn strength against twist or twist multiple gives a similar character-istic curve. Figure 6.79 shows examples for various staple yarn structures. In the case of the Dref-2 and air-jet yarns, the twist and wrap measurements were difficult to obtain; the yarn strength values are therefore plotted against friction drum speed and air-jet pressure, since these parameters are directly related to the degree of twist and level of wraps.
With regard to the ring-, rotor-, and Dref-2 yarns, their strengths initially increase with twist up to a maximum, the corresponding twist or twist-multiple being the optimal twist (top) or twist multiple (TMop). This part of the curve is attributed to the interfiber frictional resistance to fiber slippage and is called the coherence region. Yarn breaks are usually the result of a combination of a proportion of the constituent
Ey E f cos2α 1 k–( )cosecα[ ]=
k2 r f Q( )/µ[ ]1 2⁄
3L f
----------------------------------=
1.0
0.8
0.6
0.4
0.2
00 20° 30° 40° 50°10°
Yarn ModulusFiber Modulus
Yar
n M
odul
usFi
ber
Mod
ulus
α
k = 0.01
k = 0.1
k = 0.01
k = 0.1
(1 − k cosec α)
cos2 α
FIGURE 6.78 Effect of twist helix angle on yarn modulus.75
© 2003 by CRC Press LLC

fibers breaking and the rest slipping; the greater the amount breaking, the stronger the yarn. At low twist, yarn failure will be mainly the result of fiber slippage. With increasing twist, yarn diameter decreases, while fiber packing and frictional contact increase, thereby enabling an increasing number of fibers to be extended to break. It is reported that about 60% of fibers break at the peak yarn strength.117 Beyond the optimal twist, the strength decreases with twist resulting from a reducing con-tribution of the fiber modulus to the yarn modulus as the fiber helix angle becomes more oblique. Physically, this means that more of the yarn extension is being used to extend the helical shape of the fiber rather than the fiber itself. Therefore, the contribution of fiber modulus to yarn modulus decreases.110 This latter part of the curve is termed the obliquity region. It is likely that from TMop onward, increasing the twist increases the residual strain in some fibers, particularly those in the outer zone of the yarn, to the point at which their breaking strain is now reached at lower applied loads.117 Thus, added factors to the obliquity effect may be (1) reduced radial pressures, i.e., lower than that at optimal twist, and (2) an associated increase in slippage as more and more fiber lengths reach their breaking strain at lower applied loads as result of further increases in twist. TMop may therefore be seen as the twist multiple at which fibers begin to break because of twist.
10.010.210.410.610.811.011.211.411.611.812.012.212.412.612.813.013.213.413.613.814.0
3.6 3.8 4.0 4.2 4.4 4.6 4.8 5.0 5.2 5.4 2.8 3.0 3.2 3.4 3.6 3.8 4.0 4.2 4.4 4.6 4.8
6.9
6.8
6.7
6.6
6.5
6.4
6.3
6.2
6.1
6.0
7.2
7.0
6.8
6.6
6.4
6.2
6.0
5.8
5.8
5.4
2.0 2.5 3.0 3.5 4.0 4.5 1 2 3 4 5 6
Wraps Per Meter × 100 First Jet Pressure (Bar)
12
10
8
6
4
Tena
city
(cN
\Tex
)
Tena
city
(cN
\Tex
)
Tena
city
(cN
\Tex
)
Tena
city
(cN
\Tex
)
Twist Multiple (TM) × 100 Friction Drum Speed (r/min) × 100
25 tex Cotton Yarns 200 tex Acrylic 3.3 dtex 60 mm yarn
Ring Spun
Rotor Spun
Dref-2 Friction Spun
Vd = 110 m/mm
200 tex 64's Wool 15 tex Cotton/Polyester Yarn
72 dtex
Filament Binder
H-S
Wrap SpunAir-Jet
Wrap-Spun
FIGURE 6.79 Effect of increasing twist on yarn strength.
© 2003 by CRC Press LLC

Rotor and Dref yarns are, respectively, 21 and 25% weaker than conventional ring-spun yarns of similar counts. The much lower strengths of these yarns are largely the result of their much lower KF values; both open-end yarns have lower packing densities than ring-spun yarns, and this is therefore a further reason for their lower strengths. Compact ring-spun yarns can be up to 10% stronger than conventional ring-spun yarns.
The above effects of increased fiber helix angle are applicable to wrap-spun yarns. For air-jet yarns, the initial increases in strength with jet pressure suggest increased wrap angles and levels of wrap, and associated increases in cohesion between the parallel fibers of the yarn core. From the peak strength onward, a combination of the breaking of wrapping fibers at lower applied loads, along with fiber slippage and breaking within the core, causes the decreases in yarn strength with further increases in jet pressure. Hollow-spindle yarns are normally spun at the low wrap levels shown in the graph, which are much below the equivalent TMop. However, it can be seen that the coherence trend is present with increased wraps.
For ring-spun yarns, the elongation at break increases continually with twist, initially at a rapid rate, until TMop is reached, after which the increase is at a much-reduced rate (see Figure 6.80). As the figure shows, this is also the general trend for the other yarn structures.88,118,119 Like the coherence-obliquity curves, the initial
9
8
7
6
5
4
31 2 3 4 5 6 2.8 3.0 3.2 3.4 3.6 3.8 4.0 4.2 4.4 4.6
25 tex Cotton Yarns(Middling)
Ring Spun
Rotor Spun
% E
long
atio
n
% E
long
atio
n
Twist Multiple (TM) × 100
21.2
Dref-2 Friction Spun:300 tex Acrylic 3.3 dtex,60 mmVd = 110 m/min
Friction Drum Speed (r/min) × 1000
9.0
8.5
8.0
7.5
7.0
6.51.5 2.0 2.5 3.0 3.5 4.0
Air-Jet Spun: 12.8 texPolyester 1.3 dtex
% E
long
atio
n
% E
long
atio
n
First Jet Pressure (Bar)
21.0
21.4
21.6
21.8
22.0
22.2
30
2928
272625
242322
21
2.0 2.5 3.0 3.5 4.0 4.5 5.0 5.5 6.0Wraps Per Meter × 100
H-s Wrap Spun64's Wool 72 dtex Filament Binder
FIGURE 6.80 Effect of twist on yarn elongation at break.
© 2003 by CRC Press LLC

rise in extension is the result of increased interfiber friction; as slippage between fibers decreases, and more and more fibers undergo extension. As fiber breakage, attributed to the effects of increased twist, begin at TMop, the corresponding reduction in radial pressures lead to increased fiber slippage and, consequently, the rate of increase in yarn extension becomes much lower.
The coherence-obliquity curves for yarn strength and elongation follow the same trend for all yarn counts. However, whereas the strength of twisted yarns increases with count, the converse occurs for wrap yarns. In twisted yarns, each fiber helix contributes to the radial pressures that give frictional resistance to fiber slippage; so, at a set twist level, the greater the number of fibers in the yarn cross section, the stronger the yarn. With wrap-spun yarns, only the surface fibers or the wrapping filament impart the radial pressures to give coherence to the core of parallel fibers. Therefore, for the same material and wrap level, as the count increases, the relative proportion of binder and core is insufficient to increase or maintain the yarn strength.
The TMop for a given fiber and yarn structure is not always used in practice. TM values used for spinning twisted yarns in particular largely depend on the end use and fiber type. Table 6.14 gives examples of typical twist multiples used in the spinning of short- and long-staple yarns.3 Because of the difference in required aesthetics and wear, yarns for knitting (knitting yarns) are of lower twist levels, and, generally, wool and wool blends have lower twist that cotton and cotton blends. The latter, being the much shorter fiber, requires greater twist to effect stress transfer through relative shear (see Figure 6.77).
Yarn irregularity essentially consists of the variations of the number of fibers in the yarn cross section, and such variations will have a greater reducing effect on the mean yarn strength of fine-count yarns. This is particularly true with twisted yarns, because the inserted twist concentrates in the thinner areas of the yarn. Although irregularity is a contributing factor to the yarn count-strength relationship, the influ-ence of radial pressure is fundamental.
Commonly, spinning systems employing opening rollers for drafting the material feed produce yarns of lower irregularity than those using roller drafting. This dif-ference is reflected in a comparison of the yarn-strength distributions, as is illustrated in Figure 6.81 for ring- and rotor-spun yarns. Even though the mean strength of the rotor yarn is generally lower, it has the better strength variation. The narrower distribution means fewer weak places in the rotor yarn, and this can be an advantage
TABLE 6.14Typical Twist Multipliers
Cotton and blends
Wool and blends End useShort cottons Long cottons
3600–4800 3170–3650 2050–2400 Weaving (warp)2170–3650 2400–2860 1750–2050 Weaving (weft)
2050–2550 1420–1750 Knitting
TM values based on the yarn tex count system.
© 2003 by CRC Press LLC

in post-spinning processes where fluctuation in the tension of a running yarn during the process may cause tension peaks to break the yarn. With the appropriate setting of mean tension, there should be fewer peak-tension breaks for rotor yarns than for ring yarns. As explained latter, the rotor yarn irregularity can become greater than ring yarns at the very high production rates possible in rotor spinning. However, for a given count, rotor yarns are the most consistent in strength (CV% 5.1 to 10.8), followed by Dref (CV% 4.36 to 17.5), and then ring (CV% 7.22 to 20.95). This is because rotor-spun and DREF yarns, being made from sliver and with opening roller drafting, are not as affected by roller drafting waves as are ring yarns. For Dref-3 yarns, the CV% increases with count, possibly because of an uneven distribution in the wrapping of fibers around the core. But a staple-fiber core will give a lower CV% than filament core, suggesting that there is good cohesion between the staple-fiber core and the wrapper fiber sheath.120
6.2.3.3.2 Effect of Fiber Properties and Material Preparation
From the above discussion, we can reason that, in addition to the obvious properties of strength and elongation, the fiber parameters important to yarn strength are fineness, length, and length distribution. Generally, the finer and the longer the fiber, the stronger the yarn.
Although fiber strength is an obvious principal property, the utilization of the fiber strength is the key factor. In this regard, we can infer from Figure 6.77 that the ratio of the surface area to volume of a fiber has importance in that, with adequate surface frictional properties, long and fine fibers will enable, through relative shear, more efficient transfer between fibers of any load applied to the yarn. Thus, for a given fiber type, the finer and longer the fibers, the stronger the yarn should be.
10
20
30
40
50
6010 – 2
Open End
Ring
12
Yarn Strength, gf/tex5 10 15
Freq
uenc
y, %
FIGURE 6.81 Yarn strength distribution.
© 2003 by CRC Press LLC

The efficiency of load transfer is a function of the cohesion of the fibers facil-itated by the yarn structure. In essence, this is represented by k in Equations 6.36 and 6.37. However, in more qualitative terms, we may write124
(6.38)
where → = proportional to the parameters listedµ = fiber/fiber coefficient of friction
NY = number fibers in yarn cross sectionP = a yarn structure factor, which enables the occurrence of radial pressures
for interfiber friction to come into effect
Thus, for the case of the twisted yarn structures,
P → sin α × Ef × εf (6.39)
and for wrap-yarns
P → NF × sin α × Ef × εf (6.40)
where NF = number of fasciating fibers or filamentsα = mean twist or wrap angleEf = fiber modulusεf = fiber strain
It can be seen from the above expressions of proportionality that, the finer the fiber, with regard to NY and NF , the better the cohesion and, hence, the yarn strength. This is illustrated in Figure 6.82. These figures are not strictly representative of commercial values, since a 20-tex yarn count is not within the favorable count range for air-jet yarns (see Figure 6.1); the figures are presented only to illustrate the point being made.
With filament wrap-spun yarns, the load-elongation characteristics of the fila-ment play a significant part in the P factor with respect to the effect changes in Ef , with increasing extension, have on yarn strength. Figure 6.83 illustrates this by showing the load-elongation characteristics of two polyester filaments of different modulus and that of the resultant yarns. The figure also shows the difference in the strength and elongation of the two yarns with increasing wraps per meter. It is clear that the filament with the lower extension but higher breaking load gave the stronger, more extensible yarns. Monofilament and multifilament yarns of similar load-elon-gation characteristics gave wrap-spun yarns of equivalent tensile properties.
With respect to length, the importance of having the extent of a fiber approxi-mately equal to its full length when twisted into the yarn (see Figures 6.51 and 6.56) has led to the direct association of fiber length utilization, LU, with fiber strength utilization, nL where
Cohesion µ NY L f P×××→
© 2003 by CRC Press LLC

where n = the number of fibers in the yarn cross section
and
3433323130
29282726252423222120191817
1.2 1.3 1.4 1.5 1.6 1.7
Fiber Fineness (dtex)
Ring-Spun
O.E. Rotor-Spun
Air-Jet Wrap-Spun
Yar
n Te
naci
ty (
cN/T
ex)
100% Polyester20 Tex Yarns
1.2 1.3 1.4 1.5 1.6 1.7Fiber Fineness (dtex)
Ring-Spun
O.E. Rotor-SpunAir-Jet Wrap-Spun
Yar
n Te
naci
ty (
cN/T
ex)
22.021.521.020.520.019.519.018.518.017.517.016.516.015.515.014.514.013.5
65/35 Polyester/Cotton20 Tex Yarns
FIGURE 6.82 The effect of fiber fineness on yarn tenacity.
nLActual yarn tenacity
n single-fiber tenacity×---------------------------------------------------------=
LUMean fiber extentMean fiber length-------------------------------------------=
© 2003 by CRC Press LLC

If lengths equal to 50 to 60% of the staple length were cut from different yarn types (e.g., ring and rotor yarns) and the fibers in the cut lengths of each yarn type straightened and aligned to give comb-sorter diagrams, then the diagrams obtained would be similar to Figure 6.84.125
If all the fibers lengths were fully utilized (i.e., fiber extent approximately equal to fiber length), the ideal length distribution would be obtained. The shaded section would be short lengths due to overlapping of the fiber lengths in the yarn. In practice, the ideal distribution is never achieved, but we have seen that material preparation has a major effect on the fiber extent in yarns, particularly ring-spun yarns; combing gives the most straightened fibers in the feed sliver and this is reflected in the yarn.
400
300
200
100
0
0 10 20 30 40 50 60 70
A2
A1
B2
Loa
d (c
N)
Load-Extension Curve for PET Filament of DifferingModuli and Their Corresponding Wrapped Spun Yarns
A1, B1 = FilamentsA2, B2 = Corresponding Yarns of 200 Tex
B1
Extension @ Break (%)
Tenacity (cN/Tex)
Wraps Per Meter
Yar
n Te
nsile
Pro
pert
y
Monofilament
Monofilament
Multifilament
Multifilament
16
14
12
10
8
6
4
2200 220 240 260 280 300
FIGURE 6.83 The effect of filament characteristics on the tensile properties of hollow-spindle wrap-spun yarn.
© 2003 by CRC Press LLC

Hence, with (b), (c), and (d) in Figure 6.84 showing departures from the ideal length distribution for combed and carded ring-spun yarns, and for OE rotor yarns, it can be seen that combed yarns give the better length utilization. If we ignore the shaded section, C, of the diagram, then the departure from the ideal length utilization can be quantified by what is termed a parallel factor, Pπ , given by the formula,
Pπ = 1 – E/N (6.41)
where E and N are as shown in the Figure. 6.84.As may be anticipated, Pπ values follow a similar trend to KF values, i.e., spun-
in length coefficient, for the three yarn types. However, importantly, Figure 6.85shows a linear relationship between fiber strength utilization and Pπ , the correlation coefficient being 0.959 ± 0.023. The linear relationship is given by the equation
nL = 1.32 Pπ – 0.59 (6.42)
Pπ and KF will follow similar trends with regard to yarn structure. It therefore may be expected that spinning systems employing drafting roller units for fiber mass attenuation will produce stronger yarns when fiber lengths are increased. With an opening-roller system, possible fiber breakage with increased length and the buckling of fibers during deposition on to collecting surfaces may tend to limit the beneficial effect of increased fiber length, and this would largely explain the contradicting findings reported in the literature.
CombedFiberRing SpunYarn
Carded FiberRing SpunYarn
Carded FiberO.E. Rotor
N(d)
E
(c)
(b)
15 m
m
Ideal
(a)
C
FIGURE 6.84 Fiber parallelism in yarn structure.125
© 2003 by CRC Press LLC

Vaughn and Rhodes126 found that increased fiber length contributed to increased strengths of rotor yarns. Solhotra127 concluded from his work with viscose fibers that there should be an optimal staple length for obtaining the maximum strength in OE rotor yarns. Stalder128 found that rotor yarn strength initially increases with staple length up to 40 mm and then remains constant, although, with coarse fibers (>1.7 dtex), instead of a leveling out, there is a slight increase up to 60 mm. Bancroft and Lawrence129 worked with polyester, nylon, acrylic, and polyolefin fibers and found that the best yarn properties were obtained with a near-rectangular staple diagram for staples lengths between 32 and 38 mm. Srinathan et al. claims that, for viscose fibers spun from 38-mm, 44-mm, and 51-mm fibers, the strongest yarn was obtained with the 38-mm fiber length. In contrast to these findings, London and Jordon130 found little change in that rotor yarn strength when the mean fiber length was increased from 32 mm to 38 mm or even when 50 mm was tried. For these studies, a 45-mm rotor diameter was used with the shorter lengths and a 55-mm diameter with the 50-mm and 51-mm lengths. In general, the consensus view would appear to be that 38 mm is the optimal fiber length for rotor spinning.
Regarding length distribution, it follows from the discussion in Chapter 5, on the principles of roller drafting, that combed ring yarns are stronger than carded ring-spun yarns, not only because of improved fiber length utilization but also as a result
70%
60%
50%
40%
30%0.7 0.8 0.9 1.0
S++S
+S
+Bc
+B
+K
+K+K
B+
Bb+
C+
C+
C – Combed Fiber Ring-Spun YarnK – Carded Fiber Ring-Spun YarnB & S – O.E. Rotor-Spun Yarn
% F
iber
Bun
dle
Stre
ngth
n L
Fiber Parallelism Factor
FIGURE 6.85 The effect of fiber parallelism in yarns on fiber strength utilization.125
© 2003 by CRC Press LLC

of the removal of short fibers. Short fiber lengths do not enable a high relative stress to be induced in the short fiber as a result of slippage at the fiber ends. Also, importantly, the associated drafting waves would mean weak places within the yarn. However, owing to the cyclic aggregation of the fibers in rotor spinning and the low KF of the longer fibers, short fibers have a less detrimental effect on rotor yarn strength.
It then follows that yarns produced from combed material (see Chapter 2) are stronger, as the short fibers removed in combing would contribute little to yarn strength and much to yarn irregularity. Figure 6.86 shows the effect of combing on ring and rotor yarns, and it is clear that the benefit seen with the conventional ring-spun yarns is not as evident with rotor yarns. The improvement in irregularity for the rotor yarn is not fully transferred to its strength because of the KF factor. The benefit for the conventional ring-spun yarn would be greater for case of compact ring-spun yarn.
In general, combing makes it possible to spin more uniform and stronger yarns and is therefore widely used for production of fine-count short-staple yarns, including rotor-spun121,122,123 and worsted yarns. The importance of the number of drawing passages in preparing the material for spinning is illustrated in Figure 6.87. The yarn strength increases because of the improved straightening of fibers, i.e., the associated increase in KF , and the fiber length utilization. The figure also shows the advantage gained by feeding the prepared material to the spinning process so that any remaining hooked fibers have their hooked ends trailing (T) rather than leading (L) during drafting.
The points made above in relation to ring- and rotor-spun yarns are applicable to the other yarn types, particularly air-jet and HS yarns, where the core fibers are required to be straight and parallel to obtain maximum yarn strength.
In Section 6.1.4.1, it was explained that short-staple air-jet yarns are generally made from 100% polyester or polyester-cotton blends. We can reason from the above discussion that, for the spinning of air-jet yarns, it is necessary to have a well combed
18
16
14
12
10
8
6
5 10 15 20 25 30 35% Waste Extraction
Carded RingSpun
CardedRotor Spun
CombedRing Spun
Combed Rotor
Sudan Cotton:35mm
Tena
city
(cN
/Tex
)
FIGURE 6.86 Effect of combing on yarn strength.
© 2003 by CRC Press LLC

cotton component in the blend and a suitable number of drawing passages so as to utilize as much as possible of the fiber length in wrapping.
6.2.3.3.3 Fiber Blends
The blending of fibers is carried out to either reduce the cost of a product or, more often, enhance the product’s aesthetics or performance. The influence of fiber prop-erties on yarn tensile properties makes knowledge of the effect of blend ratio an important issue in the production of yarn blends.
There are three possibilities of mixing textile fibers.
1. Mixing of yarns in a fabric2. Doubling of different singles yarns3. Raw fiber blending as discussed in Chapters 2 and 5
From the position of yarn manufacturing, we will concern ourselves only with items 2 and 3.
The strength of a doubled yarn will depend on the tensile characteristics of the constituent yarns. However, the folded yarn produced from, say, two yarns, each spun from a different fiber (i.e., 100% of fiber A and 100% of fiber B) will not be as strong as a folded yarn produced from yarns of the blended fibers.
In blending two different fiber types, the length and fineness of the fibers are important to the irregularity of the yarn, as will be explained below, and therefore are also of importance to yarn strength variation. Nevertheless, the mean strength of a yarn spun from a blend of fibers will always be less than the yarns of equivalent count spun from 100% of each component, as Figure 6.88 illustrates for a range of
SudanCotton: 35mm;20 Tex Yarn
Combed Ring Spun
Combed Rotor Spun
L
L
T
T
Number of Drawframe Passages
Tena
city
(cN
\Tex
)
22
20
18
16
14
12
10
8
6
4
2
00 1 2 3 4 5
FIGURE 6.87 Effect of drawframe passages and direction of fiber presentation on yarnstrength.
© 2003 by CRC Press LLC

cotton/rayon blend ratios of ring-spun yarns in the wet and dry states. This is largely the result of the difference in tensile properties of the component fibers. The induced stress in the fibers will differ between the blend components. On loading the yarn to break, the component fibers of the lower extensibility will take greater load and are likely to break before the more extensible fiber. To circumvent a premature yarn break, the load-elongation characteristics of the fibers should be similar. It is the difference between the extensibility of the fibers that accounts for yarns spun from blends being weaker than the 100% spun components.
6.2.3.3.4 Effect of Spinning Machine Variables
When describing the properties of the differing yarn structures, it is important to consider the effect of machine parameters, particularly of the open-end and wrap-spinning systems, which have been the focus of much research. The results of most factorial experiments carried out show no substantial interactions between the prin-cipal variables, so, for the sake of simplicity, only the main effects will be considered.
As mentioned earlier, opening-roller drafting provides for lower yarn irregularity than roller drafting systems. The factors of importance in opening-roller drafting are the opening roller saw-tooth or pin type clothing, the point density of the clothing, and the opening-roller speed. Similar to carding, different types of clothing are used, based on manufacturers’ experiences in spinning a wide range of fiber types. Not surprisingly, then, with several machine and ancillary component manufacturers within the market, there are differences in specifications. But, basically, there are three types of opening rollers, and Table 6.15 gives a typical example of their specifications. Several studies have been published on the effect of opening-roller clothing in rotor spinning.131,133 The main findings relate to the required angle of tooth and point density to obtain effective fiber separation with minimal fiber break-
14
12
10
00%
2020
404060
6080
80100%
100ViscoseCotton
050%
1060
207030
8040
9050%
100ViscoseCotton
Bre
akin
g L
engt
h (K
m)
9
8
7
6
Bre
akin
g L
engt
h (K
m)
FIGURE 6.88 Effect of blend ratio on viscose rayon/cotton yarn strength.
Note: Breaking length is the calculated length at which, theoretically, the yarn should break under its own weight.
© 2003 by CRC Press LLC

age. The point densities and tooth angles listed in the table are within the range found for optimal performance with regard to the particular fiber types indicated.
Figure 6.89 shows the effect of opening roller speed on yarn tenacity. As the speed increases, the degree of fiber separation improves. However, above the peak value, fibers can be broken, and fiber configuration during removal from the roller is not favorable to KF . Studies into the straightening of fibers during rotor spinning134,137
have shown the importance of the ratio of the airflow speed to surface speed of the opening roller, and also of rotor surface speed to the airflow speed at the exit of the transport channel. For improved fiber straightening, these ratios must be greater than unity.
In contrast to friction-drum surface speed, rotor surface speed has a deteriorating effect on yarn tensile properties.138,139 Two factors govern rotor surface speed: the rotor rotational speed and the rotor diameter. The effect of increasing the rotational speed of the rotor is illustrated in Figure 6.90. There is a slight decrease in strength with increasing speed but a sizeable decline in the extension at break.In the published data from which the graphs were obtained, the opening-roller speed and machine twist level were kept constant. The production speed increases with increasing rotor
TABLE 6.15Examples of Opening Roller Types
Type Clothing details
Suitable cotton and viscose, saw-tooth type 80° rake, 120 teeth per 2.54 cm2
Suitable for synthetics, saw-tooth type 90° rake, 60 teeth per 2.54 cm2
Suitable for cotton and man-made fibers, pin type 85° rake, 100 teeth per 2.54 cm2
10
9
8
7
6
3.0 3.5 4.0 4.5 5.0 5.5 6.0 6.5 7.0 7.5 8.0 8.5 9.0Opening Roller Speed (r/min) × 1000
Tena
city
(cN
\Tex
)
Rotor SpunCotton 30 Tex
Dref-2 Friction SpunAcrylic 300 Tex
FIGURE 6.89 Effect of opening-roller speed on yarn strength.
© 2003 by CRC Press LLC

speed, and this means a greater mass flow rate to the opening roller. The degree of fiber separation will therefore decline with increased rotor speed, resulting in reduced yarn strength. Increasing the opening roller should improve the result but, if the increase required is high, any advantage gained may be offset by fiber breakage. The breaking elongation decreases with increased rotor speed because of the increased spinning tension, which causes a permanent strain in the yarn.
To spin at high rotor speed, it is necessary to use a small rotor diameter and narrow rotor groove, which enables tighter packing of the fibers in the yarn. An example of the effect of tightness of the rotor groove is shown in Figure 6.91 and Table 6.16, and it evident that the tighter rotor groove gives stronger, more extensible yarn. However, the tabulated values show a deterioration in other yarn properties, which will be discussed later.
With respect to the yarn tension within the rotor, it is recommended that this should not exceed 10 to 20% of the yarn breaking load.138 The tension in the yarn is largely the result of centrifugal forces and is therefore proportional to the square of the product of the rotor speed and diameter. Reportedly,138 a rotor speed and rotor diameter of 70,000 rpm and 40 mm, respectively, give optimal tension. To maintain a optimal tension with increased rotor speed, the following relationship may be used (see Figure 6.92):
n = 3.2 × 10⁶/D (6.43)
where n = rotor speed (rpm)D = rotor diameter
With ring spinning, the spinning tension increases as a quadratic function of the spindle speed (see Chapter 8). Therefore, similar to rotor spinning, elongation
22
21
20
19
18
17
16
15
14
13
12
11
10
925 30 35 40 45 50 55 60 65 70 75
Rotor Speed (r/min) × 1000
Tena
city
(cN
\Tex
) [%
Ext
ensi
on]
Extensionat Break
Yarn Strength
30 Tex Cotton
50 Tex Acrylic1.7 dtex 40 mm
FIGURE 6.90 Effect of rotor speed on yarn strength and elongation at break.
© 2003 by CRC Press LLC

FIGURE 6.91 The rotor groove profiles and corresponding yarn cross sections.
RotorSpeed
150
120
80
50
5040302010 60 70
Rotor Diameter
nmin−1
3.2 ⋅ 106 mmD
=
Dmm
r.p.m
1000
FIGURE 6.92 Relation between rotor speed and rotor diameter for optimal yarn tensileproperties. (Courtesy of W. Schlafhorst AG & Co.)
© 2003 by CRC Press LLC

decreases with spindle speed.140 In air-jet spinning, increased jet pressures, as we have seen, improve yarn tenacity owing to the increased wraps. The spinning tension is also influenced by the ratio of the speed of the front drafting rollers to the yarn take-up speed. Yarn strength improves as this ratio increases from 0.9 to 1.00; above unity, the tension in the yarn restricts the ballooning of the yarn and therefore the optimal initial wrapping by the edge fibers below the twist insertion point. Figure 6.64 shows that, for H-S wrap spinning, the increase in spinning tension with wraps per meter is the result of increased spindle speed, and, as stated earlier, Case B results in the better yarn because of the lower tension.
6.2.3.4 Irregularity Parameters
The concept of irregularity with respect to a linear fiber assembly (LFA) has been explained in Chapter 5. It should be understood that, as an LFA, the random and periodic variations along a given sample length of yarn can be determined by the capacitive method as well as by other methods referred to in Chapter 5. That is to say, we can determine the percentage coefficient of variation of overall mass per unit length (CVT%, or percentage variation in thickness) along the sample length. We can also derive an irregularity spectrograph to identify periodic variations and, if required, determine a variance-length curve. Usually, the practice is to obtain the former two measurements by the capacitive method and to determine the yarn count variation, i.e., CV%100m.
The variations in the yarn length that contribute to CVT% irregularity of the yarn, commonly called the Uster CV, include sizeable thin and thick places and some very sizable thin and thick places; the very sizeable ones may be termed objectionable faults. It is important to know their size and frequency of occurrence. Besides these sizeable thick and thin faults, there are other faults (e.g., manual thread
TABLE 6.16Effect of Rotor Groove Profile of Yarn Properties
Yarn parameter
50/50 CentralAfrican/Pakistanicotton, 100 tex
Polyester,1.7 dtex, 38 mm
Rotor type A B A C
Strength (cN/tex) 12.3 10.9 8.7 8.4
Percent extension at break 7.7 6.0 17.9 14.1
Irregularity (CV%) 113.4 10.1 13.7 14.0
Thin places 8 8
Thick places 48 8
Neps 320 8
Hairs/m 256 340 175 196
Rotor speed = 60,000 rpm, rotor diameter = 40 mm, opening roller type and speed = optimal for fiber type.
© 2003 by CRC Press LLC

piecings) that are referred to as special faults; these are less attributable to the spinning process and more to the working practice.
Both Chapters 4 and 5 discuss the issue of neps and nep removal. Of all yarn defects, neps are considered to be the most serious. If neps are not removed prior to spinning, they can appear on the yarn surface and become a degrading fault in the yarn and in the final fabric. Neps are likely to have a different uptake of dye from that of the main fibers in the yarn. Consequently, they may give a spotty appearance to the fabric, so the frequency of occurrence of neps is another irregu-larity parameter to consider. Actual neps are more of a problem with twisted yarns spun on systems using roller drafting (e.g., ring spinning) as opposed to opening-roller drafting (e.g., rotor spinning), since with the latter, the separation of the fiber mass feed into individual fibers gives the opportunity to eject trash and neps from yarn formation. With ring-spun cotton yarns, seed coat fragments with fibrous attachments are a main cause of neps, because the attached fibers can become twisted in the yarn (see Figure 6.93). Although these particles can be removed during the finishing treatments of the final fabric, they leave behind fibrous clusters that were attached to the particles, and these show up as specks.141–143
FIGURE 6.93 Example of seed fragment nep in ring-spun yarn. (Courtesy of ZellwegerUster.)
© 2003 by CRC Press LLC

Table 6.17 gives a summary of the above irregularities with regard to size and frequency. Two points must be remembered with respect to the table. First, the numbers 1 through 4 are for convenience labeling and have no significance in terms of value or order. Second, no attempt is being made here to distinguish which among these types of irregularities constitutes a fault, in the statistical sense. The practical stand is taken that all are faults, because they are unwanted and therefore should be minimized. Where feasible, they should be removed from the yarn, provided the piecing is less conspicuous than the fault it replaces.
This latter point is only applicable to Class 4 faults, called objectionable faults because they are more conspicuous in a fabric. Were the worst of these faults to pass through into the fabric, corrective measures144 would have to be taken to prevent the resulting garment being down graded, and doing so becomes costly. The fre-quency of Class 4 faults is sufficiently low for it to be more practical to remove the most pronounced of them at the yarn stage. This is an action called clearing and is carried out during winding.145 (See Chapter 7.)
TABLE 6.17Summary of Types of Yarn Irregularities
Type of irregularity No. Frequency Size* Measured parameter
General random cross-sectional variations along the yarn length
1 Very frequent Variable thickness; lengths ≤ shorter fiber lengths
CVT% and CV100m%
Periodic variations 2 Frequent (As above) Wavelength, determined from irregularity spectrogram
Thin places (a) thin places, (b) thick places, (c) neps
3 Frequent: up to 5000 per 1000 m
(a) –40 to –70%†
(b) +40 to +100%**
(c) +140 to +400%‡
Number per 1000 m
Objectionable faults; slubs, very thin places
4 Seldom: 50 per 100,000 m
† Number per 100,000 m
*Range of variation given with regard to mean yarn cross section
†Lengths ≤ shorter fiber lengths
‡Lengths ≤ 1 mm
Courtesy of the Uster system for yarn fault control, Uster News Bulletin, 29, November l981; The Uster automatic electronic yarn clearing installation, Uster News Bulletin, 22, 1–28, July l974; The source and frequency of yarn faults, Uster News Bulletin, 21, 1–20, November l973; Uster statistics, Uster News Bulletin, 15, 1–28, January l971.
© 2003 by CRC Press LLC

Before any Class 4 faults are removed, it is necessary to determine the propensity and size of those present in the yarn. This can be done by the capacitive method and in relation to a visual reference chart, shown in Figure 6.94, known as the Uster Classimat System, by Zellweger Uster Ltd.144 The Classimat system uses a 23-grade classification of objectionable faults, based on the thickness and length of a fault. Figure 6.94 shows 16 of the main types. For cotton yarns, the cause of the smaller types of faults, such as Class A and B, have been traced to seed fragments that were not removed in the fiber preparatory stages.141 The larger slub-like faults are generally associated with insufficient opening of fiber tufts that largely comprise short fiber clusters and with “poor housekeeping practices,” e.g., fiber accumulations on machines, bad manual piecings, and so on.146 Once the number of each type of fault is known, a decision can be made regarding how many of which types are to be cleared from the spun yarns, bearing in mind the effect on the efficiency of the winding machine.
With regard to irregularity types 1 through 3, their frequency of occurrence makes it impracticable to remove them from the yarn. Quality standards have therefore to be agreed upon by the producer and the buyer. A set of data sheets is published every five to seven years by Zellweger Uster, based on measurements from a wide sample of commercially produced yarns from nearly all geographical locations of the world in which sizeable spinning installations are located. For a range of yarn counts spun from the most commonly used fiber types and blends, the data sheets give, for each irregularity type, a typical range of values, called experienced values, for the best 5, 25, 50, 75, and 95%, the best 5% meaning the lowest 5% of values. Collectively types 3a, b, and c are referred to as imperfectionsand denoted by IPI (sometimes called the IPI values).
In the hope that the reader may gain an appreciation of the importance of the effect the yarn CVT% irregularity (Uster CV%) has on fabric appearance, Figure 6.95 gives a comparison of what may be considered acceptable, seconds quality, and unacceptable for ring-spun cotton yarns in woven and knitted fabrics. The effect seen is caused by effects of drafting waves (see Chapter 5), which looks like short flacks and give the fabric a cloudy appearance as the CVT% increases. Table 6.18is a summary of the effect of CVT% and imperfection values in relation to fabric appearance.147
A similar set of data sheets is produced for Classimat values and yarn tensile properties, including CV% of strength. The collected data sheets are commonly known as the Uster Statistics. Table 6.19 gives an example of a yarn quality speci-fication based on the 25% Uster values for 100% combed cotton yarns.
6.2.3.4.1 Effect of Fiber Properties and Material Preparation
Chapters 3 and 5 discussed, generally, the factors affecting the irregularity of linear fiber assemblies, particularly in relation to roller drafting. With regard to the effect of fiber properties, it is the number of fibers in the yarn cross section and the effect of fiber length distribution on drafting waves, and therefore the short fiber content, that are of importance to yarn irregularity. However, as explained earlier, short-fiber content has less detrimental effect with opening roller attenuation.
© 2003 by CRC Press LLC

For a given yarn count, the finer the fiber, the higher the number of fibers in the yarn cross section and the lower the yarn irregularity should be (see Equation 3.10, Chapter 3). Thus, as Figure 6.96 shows, yarn irregularity decreases with fiber fine-ness, irrespective yarn type.
Many yarn faults stem from inadequate material preparation, particularly at carding, where (as shown in Figure 6.97) increased production speed can increase yarn irregularities. If faults are already present in the prepared material feed to the spinning process, they will become prominent yarn faults.
A particular example of the importance of carding on yarn irregularity is shown in Figure 6.98 with respect to the production of woolen slubbing. As we learned in Chapters 3 and 4, the swift/doffer surface speed ratio influences the fiber transfer coefficient. With too high a transfer coefficient, the improved separation of microtuftlets obtained with the recycling layer is diminished. On the other hand, too low a transfer coefficient results in a high cylinder load to also give poor fiber separation and increased thick places within the slubbing and, ultimately, in increased Classimat yarn faults (Figure 6.99). Generally, the finer the fiber, the more important is the issue of fiber separation.
The following expression indicates, qualitatively, that the carding force, FC, required to separate a single fiber from a tuft is dependent on the interfiber frictional forces and fiber entanglement:
(6.44)
Cotton Ne 10 (8–15)Baumwolle Nm 17 (12–25)Coton Tex 60 (40–75)
A4 B4
B3
B2
B1
C4
C3
C2
C1
D4
D3
D2
D1
A3
A2
A1
+%400
250
150
100
120
80
140
170
200
220
300
350
approx. 0,1 cm (1/16−) 1 cm (3/8−) 2 cm (3/4−) 4 cm (15/8−)
Grades
FIGURE 6.94 Uster Classimat (cotton: 16 of 23 grades). (Courtesy of The Uster automaticelectronic yarn clearing installation, Uster News Bull., 22, 1–28, 1974.)
FC
µ L f M×× T
E f I T×-----------------------------→
© 2003 by CRC Press LLC

See Figure 6.100.
The interfiber frictional force is governed by the fiber friction, µ, the staple length, Lf , the rigidity of the fiber, EI (see Equation 3.8, Chapter 3), and by the number of fibers contact points in the tuft, which is directly proportional to the mass of the tuft, MT , and inversely proportional to fiber fineness, T. The bending rigidity varies to fourth power of the fiber diameter. Therefore, it may be reasoned that fine fibers should have a low-friction finish and a high modulus, E, to be easily separated and to avoid nep formation during carding, thick places in the card web and, ultimately, high yarn irregularity values. Figure 6.101 shows, with ring- and rotor-
FIGURE 6.95 Effect of irregularity CVT% on fabric appearance. (Courtesy of Uster Sta-tistics, Uster News Bull., 15, 1–28, 1971.)
© 2003 by CRC Press LLC

spun yarns as examples, that, as the fiber modulus increases, the yarn irregularity and imperfections decrease.
What is effective for carding is not necessarily applicable to opening-roller drafting. However, the advantage of high modulus and low friction for fine fibers is also applicable to roller drafting.
Figure 6.100 illustrates the forces present in the front drafting zone during roller drafting. N, the normal force on the fiber ribbon, is generated by the drafting aprons, and FD is the drafting force.
Drafting occurs when the fibers nipped by the front rollers are extended by an amount that, as a result of the fibers’ load-elongation characteristics, generates tension in the fiber to overcome the frictional restraint on the trailing ends of the fibers. The drafting force, FD, may be represented by
FD = Ef εf (6.45)
The fiber elongation, εf, would be dependent on the front-roller surface speed and short duration of time, t, the fiber was under strain, so that
εf = t V2 (6.46)
TABLE 6.18Uster Statistics in Relation to Yarn Quality
Parameter Result Guideline
Effect of CV%
High CVT% → Stripiness, streakiness, Barré, cloudiness
• >75% line of Uster Statistics→ unacceptable
• ≤50% line → average appearance• <25% line → good quality fabric
Periodic variations: wavelength on spectrogram
→ Patterning, e.g., diamond barring103
CVT% only a useful indicator if no periodicity present in yarn
Count CV% → Patterning, e.g., bars
IPI (Imperfections)
Thin places, thick places
→ Distorted fabric structure, damage machine components (e.g., knitting needles), downgraded fabric (e.g., needle lines in knitted fabrics)
• > 75% line of Uster Statistics → unacceptable
• < 50% line acceptable for most fabrics
Neps → Missed stitches and consequential holes in fabric, damaged machine components, downgraded fabric appearance, differential dye uptake
(As above)
Note: Useful further reading: Hattenschwiler and Eberle, H., Quality in Staple Fibre Spinning,Melliand Textilberichte GmbH, l987.
© 2003 by CRC Press LLC

Irregularity occurs in the drafting if the time, t, required to develop the force, FD, to initiate fiber movement is long enough for the rear drafting rollers to advance more fibers into the drafting zone before those under strain are accelerated, so that the actual separated distance between sequential trailing and leading ends of fibers in the drafted ribbon is less than the intended value. Fine fibers will have greater frictional restraints on their trailing lengths, owing to the larger total surface area. Therefore, to ameliorate any deleterious effect from this, fine fibers should have a high-modulus and/or a low-friction finish.
6.2.3.4.2 Effect of Spinning Machine Variables
The CVT% of yarns is largely dependent on the effectiveness of attenuation of the fiber mass. From the descriptions in the early part of this chapter, it should have been realized that the vast majority of modern spinning systems employ either roller drafting or an opening roller unit to draft either sliver or roving to the count required for the final yarn, bearing in mind the effect of twist contraction. Much of what has
TABLE 6.19Yarn Specification Based on Uster Statistics
Cotton qualityDescription 100% white american cottonGrade Strict middlingMean staple length 28 mm
Yarn, cotton spun, fully combedCount 17.5 tex CV100m% = 2.5 based on mean of 10 × 100mmTwist multiple (twist level) 350 tex1/2/cmTwist direction: Z
PerformanceYarn strength Minimum 13 cN/texElongation at break 7%CVT 15%Imperfection (IPI) per 1000 m
Thin places, a maximum of 30 (i.e., –50%)Thick places, a maximum of 70 (i.e., +50%)Neps, a maximum of 110
Classimat values Total number of grade 1 faults per 100,000 m should with 150 and 300 (i.e., A1 + B1 + C1 +D1)
Maximum total number of grade 2 faults per 100,000 m < 18Other grades unacceptable
Notes
• Percent comber noil: minimum 18• Yarn cleared and waxed on cone (spliced piecings — see Chapter 8)• Yarn conditioned to maximum 8.5% regain
Courtesy of a well known retailer.
© 2003 by CRC Press LLC

been written in Chapter 5 on the principles of roller drafting is applicable to roller-drafting systems used in spinning. However, of particular practical interest is the work of Anderson and Foster,151 and subsequently by Ratnam and his co-workers,152
the main points of which will be considered here. Following this, the key findings in opening-roller drafting will be described, based on the many studies cited in the reference on open-end spinning, mainly rotor spinning.
In Chapter 5, it was explained that roller drafting usually introduces an additional CV% of irregularity to that of the input material. Therefore, roller drafting systems that are used in, say, air-jet spinning and hollow-spindle wrap spinning to attenuate slivers to the required yarn count will impart an additional increase to the irregularity of the input sliver. The drafts used in spinning from drawn sliver are generally high,
17.5
17.0
16.5
16.0
15.5
15.0
14.5
14.0
13.5
13.0
12.512.0
1.2 1.3 1.4 1.5 1.6 1.7Fiber Fineness (dtex)
Ring-SpunO.E. Rotor Spun
Air-Jet Wrap-Spun
Polyester Fiber20 Tex Yarns
Yar
n Ir
regu
lari
ty (
CV
%)
Ring-SpunO.E. Rotor SpunAir-Jet Wrap-Spun
Fiber Fineness (dtex)
65/35 Polyester/Cotton20 Tex Yarns
18.418.218.017.817.617.417.217.016.816.616.416.216.015.815.615.415.215.014.8
1.2 1.3 1.4 1.5 1.6 1.7
Yar
n Ir
regu
lari
ty
FIGURE 6.96 Effect of fiber fineness on yarn irregularity.
© 2003 by CRC Press LLC

6
6
8
4
4
2
2
102
101
10 20 30 40 50 60
10
11
12
13
14
15
16
17
U%
Thick Places
Thin Places
Neps
U%
Card Production kg/h
Faul
ts /
1,00
0 m
FIGURE 6.97 Effect of carding rate of irregularity values. (Courtesy of Quality control andsupervision of yarn faults in the spinning mill, Uster News Bull., 17, 1–15, 1971.)
23
22
21
20
19
18
17
16
15
14
13
1215 20 25 30 35 40 45 50 55
Swift-Doffer Surface Speed Ratio
Irre
gula
rity
(C
V%
)
SlubbingSingles Yarn
FIGURE 6.98 Effect of swift-doffer surface speed ratio on slubbing and yarn irregularity.(Courtesy of WIRA.)
© 2003 by CRC Press LLC

and therefore the short-term irregularity of a sliver becomes the longer-term irreg-ularity of the spun yarn, which, in practical terms means the variation in the yarn count (CV%100m). It is the short-term irregularity of the yarn that is added by the roller drafting system employed at the spinning stage. In ring spinning processes, where the card sliver is first reduced to a roving and then the roving attenuated in spinning the yarn, there will be two additional increases to the sliver CV% of irregularity. In other words, the roller drafting at the spinning stage will introduce an added CV% of irregularity to that of the roving. Drafts used in attenuating rovings during spinning are much lower than for slivers; therefore, the short-term irregularity of a roving becomes the medium-term irregularity of the yarn.
Anderson and Foster151 found that the relation between the spinning draft and the added CV% of irregularity is given b:
(CV%T–yarn)2 – (CV%T–input)2 = A (D – 1) (6.47)
where CV%T–yarn = total yarn irregularityCV%T–input = irregularity of sliver or roving
D = draft employed at spinningA = a factor of proportionality
The factor of proportionality, A, has been found by Ratnam152 to be dependent on fiber properties, the count of the input material, and the proper functioning of the machine (i.e., the good order of the machine). Thus, Equation 6.47 may be rewritten as
(CV%T–yarn)2 – (CV%T–input)2 = [KTinput + z] (D – 1) (6.48)
where K = constant for a given fiberTinput = count of the input material (sliver or roving)
z = constant for a given spinning machine
2400
2200
2000
1800
1600
1400
1200
1000
800
600
400
20015 20 25 30 35 40 45 50 55
Swift-Doffer Surface Speed Ratio
Class A
Class BClass CClass D
Num
ber
of F
aults
Per
100
km
FIGURE 6.99 Effect of swift-doffer surface speed ratio on yarn Classimat values. (Courtesyof Zellweger Uster.)
© 2003 by CRC Press LLC

The constant z enlarges the effect of the draft on the yarn irregularity, so its effect is greater as the count of the input material increases. Since fiber control in drafting systems may be expected to be less efficient with heavy input counts, zmaybe viewed as a measure of the lack of fiber control by the drafting system, which can be an indication of the proper functioning of the system. In ring spinning, a lack of fiber control may be also caused by increases in the tension on the spinning triangle.117 This is associated with increased spindle speed and results in an increas-ing number of thin places with increased speed. As mentioned earlier, twist concen-trates in thin places. It not only affects yarn strength variation but also gives, visually, a pronounced difference between the cross-sectional areas of the thick and thin places.117
The fiber constant K, is dependent on the fiber state of the input material and the fiber properties, principally the fiber fineness and length. For cottons, K = 29.4[F/L],2 where F is the ratio of fineness to maturity coefficient and L is the 50% span length. The ratio F/L can be taken as a measure of drafting quality of a given fiber with regard to yarn irregularity. For example, Ratnam151 found that, with ring-spun yarns produced from Indian cottons, 60% of the yarn irregularity was due to
V1V2
N
ND
F
ε
Forces Exerted on Fiber in Drafting
Forces Acting on Fibers in Carding
F
FIGURE 6.100 Forces in carding and roller drafting.
© 2003 by CRC Press LLC

cotton quality, 25% the condition of ring frame, and 15% roving irregularity (the latter value having a cotton quality contribution). The 50% span length was found have a larger effect on yarn irregularity than fineness/maturity ratio. The 50% span length by definition is the product of the 2.5% span length and the uniformity ratio (see Chapter 1) and is indicative of the short-fiber content, which is detrimental to effective drafting. Combing is therefore an important preparatory stage for greatly reducing the irregularity and the nep content of the yarn (see Table 6.20) and is essential in spinning fine yarn counts. In short-staple spinning, carded cotton yarns are usually within the count range of 20 to 100 tex, whereas combed cotton yarns are of 5 to 25 tex, the upper limit being one of economics.
From the above discussion, it can be seen that Equation 6.48 could be used as a practical tool to assist in assessing the drafting performance of the spinning process, including material quality. The reason for this is that the equation includes the known factors that influence yarn irregularity.
140
120
100
80
60
40
2015 20 25 30 35 40 45
Fiber Modulus at 10% Elongation (cN/Tex)
1.4 dtex Polyester Fibers20 Tex Yarns
O.E. Rotor-SpunRing-Spun
Yar
n Im
perf
ectio
ns P
er 1
000m
14.5
14.0
13.5
13.0
12.5
15 20 25 30 35 40 45Fiber Modulus at 10% Elongation (cN/Tex)
1.4 dtex Polyester Fibers20 Tex Yarns
O.E. Rotor-SpunRing-Spun
Yar
n Ir
regu
lari
ty (
CV
%)
FIGURE 6.101 Effect of fiber modulus on yarn irregularity and imperfections.
© 2003 by CRC Press LLC

In theory, opening-roller systems provide the means for drafting the input mate-rial at the individual fiber level and thereby circumventing the problem of drafting waves (see Chapter 5). Periodic irregularities, however, will still be present. The effect of the separation of fibers is only a part of the action needed for achieving the required yarn count. As we have seen from the rotor and Dref friction spinning techniques, the separated fibers should be reassembled so as to keep any added irregularity to a minimum.
In Dref friction spinning, the parallel feeding of multiple slivers provides the doubling effect described in Chapter 5, and this reduces the longer-term yarn irreg-ularity caused by the short-term irregularity of the sliver. However, as we may infer from Figures 6.51 and 6.53, the fiber transportation in the airflow and deposition on the friction drums result in a low KF , and bulked and folded fiber configurations will cause variations in the number of fibers in the cross section along a given yarn length, thereby adding a short-term to longer-term irregularity to increase the CV%.
Rotor spinning has the advantage of cyclic aggregation, which is essentially a doubling effect of the deposited layers accumulating to form the ribbon of fibers within the rotor groove. From the description given in Section 6.2.2.3 of the cyclic aggregation process, it can be seen that the number of doublings, B, is usually very high and can be approximated by
B = TπDR – 1 (6.49)
where DR = rotor diameterT = level of twist
The KF value for rotor yarns is significantly higher than for Dref-2 friction yarns (see Tables 6.9 and 6.11). Therefore, the factor of fiber configuration is not as severe. Hence, the overall irregularity (the total CVT–yarn%) of rotor yarns (12.1 to 15.2) is lower than for Dref yarn (13.3 to 19.0), and both are lower than for conventional ring-spun yarns (13.6 to 22.5) of similar counts spun from rovings.120 The lower irregularity for rotor yarns is dependent on rotor speed, as will be explained below. The fact that the evening out effect of B only involves successive lengths of πDR
indicates that the longer-term irregularity corresponding to the sliver CV% is not
TABLE 6.20Example of the Effect of Combing on Yarn Quality
Yarn propertiesCombed cotton
yarnCarded cotton
yarn Percent difference
Count (tex) 20 20CV% yarn irregularity 12 15.5 –23% (less irregular)Strength (cN/tex) 18 12.0 +50% (stronger)CV% (strength) 9 12.5 +28% (fewer weak places)Percent extension at break 7 7Thin places per 100 m 15 100Thick places per 100 m 100 500Neps per 100 m 80 500
© 2003 by CRC Press LLC

effectively reduced in rotor spinning.153 Hence, CV% of yarn count is lower for Dref yarns (0.1 to 2.2) than for rotor yarns (0.8 to 2.5), but the values for both are much lower than for ring yarns (1.82 to 3.5).20
Since configuration of deposited fibers is an important factor with opening-roller drafting systems, it not surprising that many process parameters affect the resulting yarn irregularity. This aspect has been extensively studied for rotor spinning.134–137
Rotor yarn irregularity decreases with opening roller speed. This is because of the improved fiber separation with increasing speed, but a point can be reached at which the ratio of the airflow and the opening roller linear velocities is too low to give effective stripping of fibers from the opening roller. Also, high opening-roller speed increases the probability of fiber breakage. Increased rotor speed can lead to increased yarn irregularity. In particular, with the use of high rotor speeds for spinning fine rotor yarns, the yarn irregularity can become greater than that for ring-spun yarns. There are two reasons for this.
First, increased rotor speed is usually used to obtain higher production rates, and this means a high feed rate to the opening roller. If the opening-roller speed is not increased, the degree of fiber separation will be lowered, and the yarn may become more irregular, with increases in the number of thick and thin places. Second, increased rotor speed will result in more wrapper fibers per unit length, and, if the degree of separation is lowered, there will be a higher number of fibers wrapping at a given point on the yarn. As stated before, the belt-type wrapper fibers are detected as neps by the more commonly used yarn irregularity testing instruments. Conse-quently, the nep level of a yarn increases with increased rotor speed, even though actual neps may be removed by the opening roller or become buried within the fiber ribbon and subsequently in the inner zones of the yarn.
The prepared sliver for rotor spinning is a very important factor with respect to the overall quality parameters of rotor yarns, but especially the irregularity param-eters. It is self-evident that the more straight and parallel the fibers are within the sliver, the more effective the opening roller is in separating the fibers. Generally, one or two passages of drawing, with autoleveling, are used except when very short fibers (which may be a blend involving comber waste) permit direct spinning from an autoleveled card sliver; drawing in this case would give a high sliver irregularity.
The trash content of the sliver is of a critical importance and has been a well researched topic.154–170 Trash particles in sliver have been classified as shown in Table 6.21. Neild154 has reported how dust and microdust particles get into the rotor groove during the deposition of fibers and build up to a level where a ring of these impurities are formed in the rotor groove. During fiber deposition, the majority of the impurities land onto the ribbon of fibers; these particles cannot penetrate the thickness of the ribbon and so are twisted into the yarn structure. Impurities landing at the gap, Y, behind the peel-off point will enter the rotor groove and, as the ribbon of fibers is removed, will build up over time to form sizeable ring of deposit in the grooved circumference of the rotor.
From the various studies cited above, it is known that, as the impurities build up, they prevent the required close packing of fibers within the rotor groove and deteriorate the fiber configuration. The result is a constant decrease in yarn tensile properties and an increase in irregularity, until the yarn strength is too weak to
© 2003 by CRC Press LLC

withstand the spinning tension, and the yarn breaks. A slow rate of build may occur, in which case the impurities may form one or more clusters well before reaching the level at which the yarn breaks. It may also happen that a sizeable sizable trash particle gets stuck within the groove. Such occurrences would cause periodic spots of twist concentration in the yarn, which become periodic faults with a wavelength of the order of πDR. This type of periodic fault would have little effect on the CVT–yarn% of the yarn but would be seen in the irregularity spectrogram and, if undetected, would produce the fabric fault termed the Moiré effect (see Figure 6.102). A sizeable-length of yarn (20 m or more) may be wound around a card of black background to visually detect this type of yarn fault.
A further detrimental effect of impurities getting into the rotor groove is the wear of the rotor wall and the rotor groove. The high speed of the particles results in a sandblasting effect on the wall, and the twisting action of the yarn length in the groove (i.e., the peripheral twist extent) causes the particulate impurities to grind away at the rotor. Wear on opening roller clothing can also occur. This has led to special wear-resistant coatings being applied to the rotor surfaces and hardening treatments of opening roller clothing.
Modern rotor spinning machines have been automated to periodically stop and clean rotors well before the yarn properties deteriorate to an unacceptable level, and then to restart spinning. However, it is also necessary for the impurity levels in the feed sliver to be as low as possible. In the spinning of fine-count rotor yarns, combing is therefore a necessary part of the sliver preparation.121–123
6.2.3.4.3 Yarn BlendsThe blending of fibers that have different properties has become an established practice to produce fabrics for diverse applications that are not obtainable by using only one type of fiber. Therefore, the blend irregularity can be as important as the mass irregularity of the yarn. A low blend irregularity is desirable not only for consistency of physical properties of the yarn, but also so that unwanted shade variations do not appear in the finished cloth. Shade variations can arise from the differential dye absorption by different fibers but can be particularly acute in mixtures of spun-dyed fibers or cross-dyed mixtures. Any shade variations along the length of the yarn can cause bars or streaks in the finished cloth. It is thus very important, in processing blends of fibers, to avoid irregularities in the distribution of the component fibers.
TABLE 6.21Classification and Composition of Rotor Deposits
Coarse trash >500 µ, husk, stalk leaf and seed fragmentsDust particles <500 µ, fine seed fragments, leaf and fiber fragmentsMicrodust particles <50 µ, microscopic fragments of fiber, leaf and seed coat
Courtesy of Heap, S. A., Some Problems and Opportunities for Cotton Spinners, Technical and Economic Aspects, Dyson, E., Ed., Textile Trade Press, The Textile Institute, Manchester, UK, l975; and Gilbert, D. K., Chemical Composition of Cotton Dust, Text. Res. J., 50, 96–102, 1980.
© 2003 by CRC Press LLC

There are three kinds of irregularities that can arise from inadequate blending of, for example, two blend components.173–82
1. Irregularity due to an uneven arrangement of blend components in the cross section of the yarn
2. Irregularity caused by variations in the relative numbers of each blend component in the cross section of the yarn (related to the CV% of the short-term linear density of the yarn)
3. Very long-term irregularity
The first kind of irregularity is one in which the distribution of the blend components in the yarn cross section deviates from that referred to as the perfect cross-sectional blend, even though the number of each blend component matches the total blend proportions. The second concerns the deviations of blend proportions between yarn
1 cm 10 cm 10 m 100 m1 m5 550 50
1 cm 10 cm 10 m 100 m1 m5 550 50
πD
FIGURE 6.102 Effect of rotor deposits. (Courtesy of [a] Lord, P. R., J. Text. Inst., 4, 1980and [b] Uster News Bulletin, 34, February 1987.)
(a)
(b)
© 2003 by CRC Press LLC

cross sections. This is the irregularity of blending along the yarn length. The final irregularity concerns the blend consistency from batch to batch and is just a matter of accurate weighing of the feed to the opening line.
6.2.3.4.4 The Ideal BlendNo process machine as yet can put together, say, black and white fibers in an orderly three-dimensional structure. The best that can be obtained is a random distribution of the single fibers of each component along the axis of a yarn. Apart from changes in the composition of the blend over a long period of time (long-term variation), blend irregularities are mainly concerned with separation of fiber groups of each component into individual fibers and the intermixing of them.
The intimacy of a blend may be obtained by determining, microscopically, the relative distribution of the blend components and the size of the aggregates of each component in representative samples of the yarn cross sections. Based on this approach, the ideal blend or most intimate blend would be one in which single fiber units are distributed at random throughout a yarn cross section.
There are various methods for quantifying the irregularity of a blended yarn.173–182 One of the simplest and most practical, which will be described here, is that proposed by De Barr.182 It is based on a general understanding of the widely practiced technique of blending the fiber components in drawing during material preparation (see Chapter 5).
Imagine white and black slivers having the same number of fibers randomly arranged in the sliver cross section. The fiber types are of the same dimensions and properties. The slivers are then mixed or blended together with a total number of Ndoubling. Assume the yarn is ring spun and is formed by ideal drafting of the sliver to a ribbon, which is then twisted. Consequently, the fibers in any cross section of the yarn are likely to be in black and white groups, the number of groups corre-sponding to the number of doublings. If a substantial length of the yarn were to be untwisted, the ribbon of fibers would be composed of a number of thinner sub-ribbons corresponding to the number of doublings N. This means that there is no lateral mixing. However, if the doubling, and thereby its associated drafting, is sufficient to reduce each group to a single fiber, the fibers in the cross section would give the appearance of lateral mixing, but the untwisted yarn would reveal a ribbon composed of sequential black and white parallel lines across the ribbon width, each line extending the ribbon length.
If a group of, let’s say, white fibers is defined as a set of one or more adjacent white fibers with a black fiber at each side of the set, then if Q is the number of such groups in the yarn cross section and Qp the average number of individual white fibers that should be in the cross section, the degree of blending may represented by
γ% = (6.50)
Inadequate blending will give small values of γ%, whereas very thorough blending will give values approaching 100%. Only if the fibers are randomly distributed in the cross section will γ% = 100.
QQp
------ 100
© 2003 by CRC Press LLC

Qp can be determined from calculating the number of fibers in the yarn cross section and from knowing the blend proportions. Q is measured from yarn cross sections. Thus, γ% can be used to determine the effect of various process parameters.
Figure 6.103 compares the effect of blend ratio and the number of doubling for 10-tex and 100-tex ring-spun yarn. It can be seen that, irrespective of the blend ratio, the fibers in the cross section approach, at a decreasing rate, the state of completely random distribution as the number of doublings increases. It is also evident that, with fewer fibers in the cross section (i.e., finer counts), fewer doublings are needed to achieve a satisfactory degree of blending. Independent of the blend ratio and yarn count, if the number of doublings exceeds the mean number of fibers in the yarn cross section, the degree of blend will be greater than 95% of an ideal cross-sectional mixing.
The above is applicable to all spinning methods employing roller-drafting sys-tems. Spinning methods utilizing opening-roller drafting have the added benefit that the individual fiber separation facilitates lateral mixing, and the doubling action within rotor spinning is therefore effective in achieving a lower blend irregularity than the other spinning systems.
1.00
0.90
0.80
0.70
0.60
0.50
10 100 1000 10,000Number of Doublings (Ω)
Deg
ree
of M
ixin
g (γ
)
Nominally70 Fibers/Section
Nominally700 Fibers/Section
Nominal 80 – 20 blendNominal 50 – 50 blend
,, , …
, …
FIGURE 6.103 Relation between the degree of blending, blend ratio, yarn count, and thenumber of doublings.
© 2003 by CRC Press LLC

With conventional ring-spun yarns, fiber migration can influence the blend intimacy in the yarn. Therefore, factors controlling migration are of importance to blend irregularity. Since tension variation between the component fibers is the principal cause of fiber migration, then significant differences in length or fineness between the blend components will result in the definite tendency for the longer or finer fibers to migrate to the core region of the yarn. This we can call preferential migration.
The width of the drafted strand can be used to control the tension differences. A compact strand reduces the tendency of fiber toward preferential migration. An increased width gives pronounced preferential migration, since there are fewer neighboring fibers to hinder migration. However, the level of preferential migration that takes place in a previously well blended feed to the ring frame, although affecting color shades, does not appreciably affect the yarn tensile properties.
For satisfactory blending of fibers that are to appear in different colors in the finished woven fabric, emphasis must be placed on ideal cross-sectional mixing because of the fiber arrangement along the yarn length. It is then necessary in such cases to blend before carding. The card intermixes the fibers so as to produce a blend of single fiber elements. With woolen spinning, blending has to be done prior to carding but, for the other processes, blending can be done in drawing. Where the appearance of the blend is not critical, e.g., hosiery or light shade wovens, two or three drawframe or gilling passages are used.
6.2.3.5 Hairiness Profile
There are various techniques for measuring yarn hairiness183–188 with which the reader may wish to become familiar. However, from Figure 6.104, we can see that, by using a suitable optical arrangement, transmitted light may be employed to measure, per unit length of yarn, the number of fiber lengths projecting beyond set distances from the body of a yarn (e.g., 1 to 10 mm, in 1-mm increments), thereby gaining a useful indication of a yarn’s hairiness profile.
In general, all other factors being equal, conventional short-staple ring-spun yarns will have the greatest number of hairs per unit length compared with other yarn structures. Looking at the other structures (Figures 6.36 and 6.41), it can be seen that compact ring-spun yarns, as a result of the very narrow spinning triangle, have the vast majority of surface fibers bound into the twisted structure. Rotor-spun, air-jet spun, and HS yarns have surface fibers or filaments wrapping the remaining fibers that form the bulk of the yarn, thereby restricting the number and the actual projected length of hairs. It is easily appreciated, then, that compact ring-spun, rotor-spun, and wrap-spun yarns have much lower hairiness values than conventional ring-spun yarns. The Dref-2 structure does not have wrapper fibers and, although the structure is highly twisted, the hairiness is comparable to conventional ring-spun yarn of similar coarseness of count. The surface structure of Dref-3 yarns (not shown) is similar in appearance to that of Dref-2.
Although the above is given as the general case, there are fiber and process variables that may be used to greatly alter the hairiness of these structures. For a given yarn count, the longer the fibers, the fewer the number per unit length of a
© 2003 by CRC Press LLC

given yarn count, and this is reflected in the yarn hairiness. Consequently, the removing of short fibers by combing results in combed yarns being much less hairy than carded yarns of equivalent count. For a similar reason, worsted yarns are significantly less hairy than short-staple ring-spun yarns.
Based on the number of ends per unit length being an important factor, it might be expected that, for the same fiber length, finer fibers should give more hairy yarns. In fact, coarser fibers give the more hairy yarns. The torsional and flexural rigidities of a fiber are directly proportional to the square of the fiber fineness.187 Therefore, coarser fibers, being more rigid, have a greater resistance to the binding action by the inserted twist, and the fiber ends readily project from the yarn.
The arrangement of the fibers in the material to be twisted also has a strong effect on yarn hairiness. In woolen slubbings, fiber lengths are hooked and disorderly, similar to the card web from which they are formed. Consequently, the resulting woolen ring-spun yarns are hairier than, say, the equivalent count semi-worsted yarn, where the fibers would have been given a much more orderly arrangement by gilling and apron drafting prior to being twisted to form the yarn.
For particular end uses, e.g., filtration cartridges, a yarn may be required to be hairy, but the hairiness may need to be reduced for most applications. In the case of conventional ring-spun cotton yarns, singeing, also referred to as gassing, can be employed. In this process, a flame or heated element is used to remove the unwanted
FIGURE 6.104 Yarn structure observed with transmitted light.
© 2003 by CRC Press LLC

projecting fiber lengths. The singed (or gassed) yarn has approximately a 10% reduction in hairiness. This order of reduction is relatively moderate; therefore, it is of interest to identify the spinning parameters, as well as the fiber properties, that influence yarn hairiness.
An important problem attributed to yarn hairiness is the tendency for yarns to shed fly (i.e., the propensity for fibers to be released from the yarn during post spinning processes, particularly in weft knitting.)190 Much has been reported188,191–194
on the effect of fiber properties and spinning variables on fly generation. Although reported results are mainly for studies involving conventional ring-spun yarns, they are applicable to the other yarn structures and therefore are of general interest.
Table 6.22 summarizes the findings by using what is termed the mean logarith-mic fly decrement, FD,195 calculated for each variable, to rank the order of importance of primary spinning variables. Negative values of FD indicate a reduction in the amount of fly for changes in a particular variable; the positive values refer to an increases in fly.
The importance of increased fiber length was previously explained. Twist level is important, because fiber lengths become more tightly bound to the yarn. Most studies have concluded that increasing twist reduces yarn hairiness.190 However, increased twist means reduced production speed and causes changes to other yarn properties, not all of which are desirable with respect to fabric properties. Since coarser count yarns contain more fiber ends per unit yarn length, it can be appreciated that hairiness and fly generation will increase with yarn count. The effect of the remaining variables concerns the locking of fibers within the yarn structure. For an explanation of this, we must first consider the ways by which fly is generated.
The fibers constituting fly may be pulled out from the yarn or fragments of the fiber length sheared from the yarn as the yarn runs at high speed (>100 m/min) over metal or ceramic guide surfaces of a machine. In the weft knitting of cotton yarns,
TABLE 6.22Ranked Order of Fiber and Spinning Variables on Fly Generation
Variable of influence FDMean fiber length –0.36Yarn twist –0.29Yarn linear density +0.04Yarn moisture content (cotton) –0.03Yarn tension +0.03Yarn coefficient of friction +0.02
where F1 – Fo = change in the amount of fly corresponding to the change fly from the minimum (Po ) to the maximum (P1) value of a particular variable
K = constant = 1 g/kg for short-staple yarns194
P = mean value of fly for changes in the particular variable
FDF1log Folog–[ ]/ Klog
P1 Po–[ ]/P------------------------------------------------------=
© 2003 by CRC Press LLC

rupture of hair lengths resulting from shear is a very significant factor, since up to 90% of the fly collected are shorter than 10 mm. With hydrophilic fiber, moisture results in fiber swelling, which in turn gives a higher frictional contact between fibers to resist pullout of that part of a fiber length caught within the yarn body. Increased mean fiber length and twist also contribute to increased interfiber frictional contact. Reduced surface friction reduces the pullout force and shear rupture of the projecting fiber lengths. A wax coating applied to the yarn surface (see Chapter 7) can reduce the yarn coefficient of friction by up to 44% and fly generation by 11%. Increased twist is also effective in reducing friction. As the yarn twist increases, the surface fibers, because of their helical orientation to the yarn axis, act as a series of ridges inclined at an increasing angle of steepness to the principal direction of movement of the yarn over the machine surfaces. The yarn is in effect supported by these ridges and hence has only a small area of contact with the machine surfaces. This reduces the friction forces acting at the interface of yarn and machine surfaces and, consequently, reduces fly generation. It can be reasoned from this that a surface structure that has wrapper fibers, as well as reducing yarn hairiness, should also be effective in preventing fiber pullout and shear fracture. An example of this is that, for the same count and twist level, rotor yarns tend to shed up to 20% less fly than ring-spun yarns. However, it should be noted that groove doffing tube navels signif-icantly increase the hairiness of rotor yarns.184
6.2.3.6 Moisture Transport
An important factor in clothing comfort is the translocation of moisture caused by perspiration, as this prevents the sensation of clamminess.196 The spontaneous move-ment of a liquid though a porous structure such as a yarn, by surface tension forces, is a phenomenon referred to as wicking, and it is generally interpreted as hydrody-namic flow through capillaries.197–199
To initiate wicking, it is important to have a wettable surface. When there is contact between water and any solid surface, an attraction between the two takes place. However, the difference between a wettable and nonwettable or hydrophobic surface is that the former causes water to spread over it in a continuous film whereas, with the latter, the water stands in a droplet covering only a small area of the surface (see Figure 6.105). With the droplet, there is a common boundary line between the liquid, solid, and surrounding air. From any point on this boundary line, the tangent to the curved surface of the liquid makes angle, θ, known as the contact angle. It has a specific value for different solid-liquid combinations. If the contact angle were to be θ = 0°, the surface would be completely wetted. It would be nonwettable if
Vapor
Liquid
Solid
γLG
γSGγSLθ
FIGURE 6.105 Interfacial forces at solid, liquid, gas boundaries.
© 2003 by CRC Press LLC

θ = 180°. With contact angles between θ = 0 and 180° the surface will be partially wetted, with the degree of wettability decreasing as θ increases.
Wettability occurs when the attraction between solid and liquid is at least as great as the liquid-liquid attraction. In elementary physics, the surface free energy of the liquid (γ LG), the solid (γ SG), and the interfacial free energy (γ SL) are known to have the relationship defined by Young’s equation,
γ SG – γSL = γ LG cos θ (6.51)
If the surface of the solid is textured, then a surface area factor, ξ, can be defined as
ξ =
With the textured surface, there will be an apparent contact, ϕ, so that
ξ(γ SG – γ SL) = γ LG cos ϕ (6.52)
and
cos ϕ = ξ cos θ (6.53)
Thus, the texture of the surface has increased the contact angle. The textured surface of a yarn will be its hairiness. Assuming that the surface of the fibers constituting the yarn are not treated to be hydrophobic, then, for a liquid to enter the yarn structure spontaneously, the apparent contact angle, ϕ, of the yarn must be less than 90°.
From the laws of hydrodynamic flow through capillaries formed by fibers of a yarn structure, it can be shown that197,198
(6.54)
where S = advanced by the liquidγ = liquid surface tensionη = liquid viscosityt = time
re = the effective capillary radiusk = wicking rate
From our early consideration of yarn structure, it is evident that filament yarns would have low ξ factors. At the other end of the scale, conventional ring-spun yarns have higher ξ with respect to yarn hairiness. As a result, a rotor yarn (which has a dense core, an open outer area, and the wrapper fibers surface structure) wets and wicks more quickly than a conventional ring-spun yarn. Twist and fiber crimp, however, play an important part in the wicking mechanism. Table 6.23 shows apparent angles
Actual surface areaNominal surface area---------------------------------------------------
S2 γ ϕ re t
2η------cos kt= =
© 2003 by CRC Press LLC

for a range of fibers and their corresponding ring-spun yarns. All fibers have contact angles of <90°; however, wool yarn, because of the level of crimp, has a fairly hairy surface and discontinuities in the interfiber capillary channels, resulting in an appar-ent contact angle of >90° for the yarn. Figure 6.106 shows effect of twist on wicking rate for 100% nylon, 70% wool/30% nylon, and 100% wool ring-spun yarns. The curves demonstrate again the effect of the capillary discontinuity caused by the wool fiber crimp giving low wicking rates.
The trend of the curves is for the wicking rates to increase with increasing twist, reaching a maximum before declining with further twist. There is a critical interfiber spacing (approximately 0.1 to 0.2 times the fiber diameter) below which the capillary forces will cause liquid to flow along an interfiber channel. At low twist levels, and therefore lower packing densities, the distribution of the interfiber distances will contain a small percentage below the critical value. This number increases with twist until twist choking of the capillaries occurs to reduce the liquid transport rate.
Moisture migration in fabric is dependent on several mechanisms, in particular the holding capacity of a fabric and speed of liquid transport through the fabric structure. For many applications, the former factor is given prominence, since it is mostly required that the liquid be distributed over as wide as possible an area of the fabric. However, in the early stages, it is the latter that dominates, and this is largely dependent on yarn structure.
6.2.3.7 Friction
Yarn friction is an important property with respect to the running behavior of a yarn in post-spinning processes and in the effect of yarn surface structure on fabric properties. It was explained earlier that yarn friction influences the mechanical properties of fabrics through the factor of fabric assistance.200 The surface friction is also related to the tactile character of a fabric.201 From both perspectives, rotor-spun yarns and air-jet yarns give a crisp fabric handle as compared with the other
TABLE 6.23Comparison of Fiber and Yarn Contact Angles
Material Form Apparent contact angle, θo
Polyethylene FiberYarn
86 25
Nylon FiberYarn
83 55
Wool FiberYarn
85108
Cotton FiberYarn
33 33
Courtesy of Booth, J. E., Principles of Textile Testing, Heywood-Temple Press Books, Ltd., l964, 444–450.
© 2003 by CRC Press LLC

structures. This comparison does not include the Dref-2 yarn, as it is rarely used for general garments.
With respect to the performance of a running threadline, the static and kinetic yarn frictions are usually measured for a particular reference surface — often ceramic or steel.202
Figure 6.107 shows the general pattern observed in friction/yarn speed plots for ring and rotor-spun yarns produced from the same cotton and of similar counts.
0.30
0.25
0.20
0.15
0.10
0.05
0.000 2 4 6 8 10 12
Twist (× 254) Per Meter
Wat
er T
rans
port
Rat
e, K
, (sq
.cm
per
sec
)100% Nylon
70% Wool/30% Nylon
100% Wool
FIGURE 6.106 Effect of twist on wicking rate of yarns.
0.2750.2700.2650.2600.2550.2500.2450.2400.2350.2300.2250.220
0.2150.210
−20 0 20 40 60 80 100 120 140 160Linear Yarn Speed (mm/s)
Fric
tion
Coe
ffic
ient
Ring-Spun Yarn
Rotor-Spun Yarn
B
BA
A
FIGURE 6.107 Friction profile of ring- and rotor-spun yarns.
© 2003 by CRC Press LLC

Initially, as the thread line speed increases, the friction decreases because the pro-truding yarn hairs prevent full contact between yarn and metal surface. With ring-spun yarns, stick slip is observed at low speed. The first flat region, A, of the curve, seen as the speed increases, is caused by the resilience of longer surface hairs. Rotor yarns are less hairy, but the wrapper fibers prevent the yarn from flattening and spreading, and they more effectively separate the body of the yarn from full contact with the metal surface. The curve for the rotor yarn is therefore much lower, irrespective of speed.
At higher speeds, shear forces bend the hairs down, increasing the area of contact and thereby the friction. At still higher speeds, the shorter hairs come into effect, giving the second flat region, B.
The friction values of the curves will increase with linear density because of the increased area of contact, initially because of the increased number of hairs and subsequently owing to the actual contact area of the yarn. Spun-yarn/metal friction values will depend on yarn lubrication. As would be expected, waxing reduces friction, but only for low speeds. The friction pattern changes in that there is no initial decrease with speed; instead, the second phase of the curve occurs, starting at a lower friction value and increasing with speed, reaching a friction value equal to that of a nonwaxed yarn. Different types of lubricant give different initial friction values but similar trends.
6.3 QUALITY CRITERIA
The quality criteria of a spun yarn are the specified properties of the yarn that indicate its ability to be efficiently converted into, say, a woven or knitted fabric. They enable the resulting finished cloth to be imparted with the visual and tactile aesthetics required by the customer, i.e., customer acceptability. This means that there two aspects to yarn quality requirements: post-process performance and fabric quality.
6.3.1 POST-PROCESS PERFORMANCE CRITERIA
6.3.1.1 Knitting
A yarn’s knittability first depends on how well it unwinds from the yarn package (see Chapter 7) and second on its frictional properties (i.e., yarn-yarn friction and yarn metal friction with regard to the knitting needles and generation of fly). For knitting yarns, a strength of approximately 10 cN/tex and as high as possible a breaking extension are normally required.123 These factors, along with the bending and elastic moduli, affect the yarn tension during knitting. When a yarn contacts the needle, it takes up a large curvature. The bending moment is therefore of importance.
6.3.1.2 Weaving
In weaving preparation, beaming machines operate at high draw-off speeds of more than 1000 m/min. The end breaks in beaming are often used as an indication of yarn quality. With cotton yarns, for instance, end breaks greater than one per million
© 2003 by CRC Press LLC

meters of running yarn are viewed as indicating a poor-quality yarn. The tensile strength (cN/tex), variation in strength [CV% (strength)], the breaking strain (ε%) are the important properties in weaving; less strength is required for weft (9 to 12 cN/tex) than for warp (12 to 16cN/tex), and the minimum extension should be around 6.5 to 8.0%.
The weaving performance of a yarn is judged in terms of weaving costs, particularly as a result of downtime. On average, 20 to 30% of stoppages in cotton weaving result from yarn breaks, 30 to 40% are due to faults during warping sizing, and 30 to 40% are loom related.202 With short-staple yarns, the processing behavior of the sized warp yarns is critically dependent on the properties of the sizing agent and the degree of sizing. However, the yarn structure is also a key factor, and loom types have specific requirements regarding the characteristic profile of warp yarns.
Over the years, weaving rates (picks per minute or meters per minute) have significantly increased with continuous improvement in shuttle-less looms. The efficiency in weaving is now highly dependent on downtimes for beam changes and tying in new warps, repair time delays, and, importantly, downtimes caused by short stops caused by warp or weft breaks. The short stops constitute a very important quality factor since, in many instances, greater than two per 100 km of yarn would be seen as below average.
The number of warp stoppages is highly dependent on the abrasion resistance of the warp yarn and a low level of hairiness, since hairs can cause adjacent yarns in a warp to cling together (snag) and hinder the passage of the weft yarn through the shed. Warps for air-jet looms generally need to have high abrasion resistance. A low degree of hairiness is particularly important in air-jet weaving. For projectile and rapier looms, warp yarns are subject to less abrasion during weaving, but the important requirement is a reduced snagging tendency (i.e., a low force needed to separate the threads during shedding). In rapier looms, hairy weft yarns can prevent the efficient transfer of a yarn between grippers. Generally, ring-spun yarns have higher snagging tendency and lower abrasion than rotor yarns.
There is a direct relationship between yarn tension during weaving and weft insertion rates. Hence, for weft insertion rates above 1200 m/min, the CV% of yarn strength is an important quality factor. Particularly important for a weaving yarn is the number of “weak places.” These are the short lengths usually identified by the Uster Classimat system and are of the order of 50 cm with breaking strengths less than 30% of the mean yarn strength. When these weak places are placed under peak tension in the warp or weft, they break.
6.3.1.3 Fabric Quality
The count variation or CV%100m affects fabric appearance. For woven fabric, depend-ing on weave structure, variations in count within and between weft packages can cause stripiness that is discernible to the human eye. With knitted fabrics, the quality characteristics that are particularly important in the evaluation of yarns are elongation at break, Classimat values, and the Uster CV. As seen in Figure 6.95, a high Uster CV% will give knitted fabrics a patchy appearance.
© 2003 by CRC Press LLC

The ideal yarn has been defined as “being the one that is spun from the finest fiber with the least twist, the fullest volume, the best evenness, and the most consistent strength.”203 Although the perfect yarn will always be the quest of textile technologists, agreements have to be reached between the yarn manufacturer and customer on quality criteria, and these are best based on “as good as necessary” quality specifications rather than “as good as possible.” Whatever the agreed specifications, the yarn man-ufacturer has to take steps to ensure that every wound package delivered to the customer conforms to the specified requirements, i.e., quality must be assured.
REFERENCES
1. Brearley, A. and Iredale, J. A, The Woollen Industry, WIRA/British Textile Technology Group, Leeds, UK, 1977.
2. Oxtoby, E., Spun Yarn Technology, Butterworth-Heineman, Boston, MA, 1987.3. Lord, P. R., Economics, Science and Technology of Yarn Production, North Carolina
State University, 1981.4. De Barr, A. E. and Catling, H., Twist insertion in ring spinning and doubling, J. Text.
Inst., 50, T239, 1950.5. Grosberg, P., McNamara, A. B., and Molgaard, J., The performance of ring travellers,
J. Text. Inst., 2, T24–T37, 1965.6. Stalder, H., A new ring and traveller system as the key to more production from the
ring spinning machine, Rieter Machine Works, Ltd.7. Fuchs, H., Rings and travellers in spinning and twisting, part 2, Int. Text. Bull.,
Spinning, 3, 235–254, 1973.8. Oxenham, W., Developments in short staple yarn manufacture, Textile Progress, The
Textile Institute, ITMA ’99 Review, 1–67.9. Bowen, D. A., Living ring finds new believers, Text. Ind., February, 77–79, 1980.
10. Sonntag, E. and Artzt, P., Spinning ring diameter productivity, Int. Text. Bull., Yarn and Fabric Forming, 2, 29–34, 1994.
11. Prosino, C. A., Possible speeds of ring spinning frames, Int. Text. Bull., Yarn Forming, 3, 69–83, 1989.
12. Prins, M., Lamb, P, and Finn, N., Solospun: The long staple weavable singles yarn, Proc. Text. Inst. 61st World Conference, Melbourne, Australia, April 1–13, 2001, www.tft.csiro.au.
13. Stalder, H. and Rusch, A., Successful compact spinning process, Int. Text. Bull., 1, 42–43, 2002.
14. Weiss, A., Duospun, a viable alternative in worsted spinning, ChemieFasern/Textilin-dustrie, 33(85), E5–E6, 1983.
15. An alternative approach to two-fold weaving yarn, part II: Theoretical model, J. Text. Inst., 3, 107–116, 1983, and part V: The properties of two-strand yarns, 3, J. Text. Inst., 1983.
16. Morgan, W. V., Sirospun on long-staple spinning, I.W.S. Text. Eng. and Process. Tech. Inf. Lett., 2, 1–10, 1981.
17. Egbers, G., Lehmann, K. H., Singh, H., Investigations into the production of spun-twisted yarns, Melliand Textilberichte (English ed.), 769–777, 1219–1226, 1980.
18. Shirley Institute Report, Break Spinning, 1968.19. Brandis, C., Physical limits to spinning, Int. Text. Bull., Spinning, 2, 260–265, 1975.
© 2003 by CRC Press LLC

20. Susutoglu, Y. A. M. and Cusick, G. E., Friction spinning: The effect of fibre delivery parameters on the geometry of fibre deposition in the yarn, Lenzinger Berichte, 4(60), 52–54, 1983.
21. Henshaw, D. E., Self-Twist Yarn, Merrow, Newcastle, UK, 1971.22. Lunnenschloss, J. and Brockmanns, K. J., Mechanisms of OE-friction spinning, Int.
Text. Bull., 3, 29–57, 1985.23. Atkinson, K. R. and Henshaw, D. E., A study in spinning fasciated yarn, J. Text. Inst.,
3, 95–102, 1977.24. Du Pont, Fasciated yarn combines the best characteristics of spun filaments, Textile
World, 134–135, 1974.25. Parate, D. M., Air-jet spinning technology — An overview, Man-Made Textiles in
India, March, 106–109, 1999.26. Murata Kikai Kabushiki Kaisha, US patent specification 412658 (1978); UK speci-
fication 1,579,560, 1980.27. Miao, M., Air-Jet Spinning, Ph.D. thesis, University of Leeds, UK 1986.28. Baqui, M, Air-Jet Spinning, Ph.D. thesis, University of Manchester Institute of Sci-
ence and Technology, UK, 1987.29. Taub, E., Coverspun: A new yarn formation process, Canadian Text. J., March, 49–56,
1980.30. Anon., The mechanism of felting, Wool Sci. Rev., 3, 3, 1949.31. Anon., Shrink resist process part 1, the factors that affect felting shrinkage, Wool Sci.
Rev., 17, 16, 1957.32. Markinson, A., The role of the scales of wood fibres in felting and shrink proofing,
Wool Sci. Rev., 24, 34, 42, 1964; and 2, 1972.33. Lewis, J., Superwash wool I, review of the development of superwash technology,
Wool Sci. Rev., 54, 2, 1977.34. Pitts, J. M. D., Felted wool yarns, Wool and Woollens of India, January–March, 45–61,
1962.35. Lappage, J., Crook, D., Bedford, J., and Ross, D., Processing wool on a rub-felting
machine, J. Text. Inst., 4, 298–310, 1984.36. Lord, P. R., Three-component bobtex yarns raise cost questions, Text. Month, Sep-
tember, 85–89, 1973.37. Bobkowicz, E. and Bobkowicz, A. J., The bobtex yarn making technology: Its future
and implications, Text. Res. J., September, 773–777, 1971.38. Bobtex ICS, Bobtex ICS turns out multi-component composite spun yarns at 2,000
fpm, Textile World, April, 126–132l, 1974.39. Ruppenicker, G. F., Harper, R. J., Sawhney, A. P., and Robert, K. Q., Comparison of
cotton/polyester core and staple blend yarns and fabrics, Text. Res. J., January, 12–16, 1989.
40. Jou, G. T., East, G. C., Lawrence, C. A., and Oxenham, W., The physical properties of composite yarns produced by electrostatic filament-charring method, part 1, J. Text. Inst., 76, 78–96, 1996.
41. Balasubramanian, N. and Bhatnagar, V. K., The effect of spinning conditions on the tensile properties of core-spun yarns., J. Text. Inst., 61, 534–544, 1970.
42. Tarafder, N. and Chatterjee, S. M., Influence of controlled pretension of the core on the hairiness of cotton nylon core-spun yarns, Ind. J. Text. Res., 14, 155–159, 1989.
43. Sawhney, A. P. S., Ruppenicker, G. F., Kimmel, L. B., Salaun, H. L., and Robert, K. Q., New technique to produce a cotton/polyester blend yarn with improved strength, Text. Res. J., 58, 601–604, 1988.
© 2003 by CRC Press LLC

44. Sawhney, A. P. S., Robert, K. Q, Ruppenicker, G. F., and Kimmel, L. B., Comparison of filament-core spun yarns produced by new and conventional methods, Text. Res. J., 62, 67–73, 1992.
45. Sawhney, A. P. S., Robert, K. Q., Ruppenicker, G. F., and Kimmel, L. B, Improved method of producing a cotton covered/polyester staple-core yarn on a ring spinning frame, Text. Res. J., 62, 21–25, 1992.
46. Sawhney, A. P. S., Robert, K. Q., and Ruppenicker, G. F., Device for producing staple-core/cotton-wrap ring spun yarns, Text. Res. J., 59, 519–524, 1989.
47. Coban, J. C., A New spinning process for worsted yarns, Text. Res. J., 49, 146–150, 1979.
48. Bachmann, H., Spinning investment — The decisive factors, Text. Month, November, 6–8, 1985.
49. Klein, W., Ring spinning machines for short staple spinning: A supplier’s overview, Int. Text. Bull., Yarn and fabric forming, 1, 21–27, 1997.
50. Wolf, B., Machine linking in the spinning area, Int. Text. Bull., Yarn Forming, 4, 4–9, 1988.
51. Wolf, B., Machine linking in the spinning plant, part 2, Int. Text. Bull., Yarn Forming,1, 44–47, 1989.
52. CIM in the spinning mill — Utopia or reality? Text. Horiz., March, 22–26, 1991.53. Roder, K., Economic Aspects of the Link System Ring Spinning Machine/Winder,
Rieter Machine Works Ltd., December, 1–7, 1986.54. Wolf, B., Spinning automation — Potential and actual, Int. Text. Bull., Yarn Forming,
4, 9–11, 1984.55. Rohner, J., Possibilities of reducing spinning costs in short staple spinning, First
International Colloquium About New Textile Technologies, October 15–17, Mul-house, France, Zinser Textilmaschinen GmbH, October 1–15, 1986.
56. Siegenthaler, M., Automation in spinning plant, Int. Text. Bull., Yarn Forming, 3, 32–42, 1991.
57. Stalder, H., The influence of various boundary conditions on the economy, flexibility, and technological textile suitability of the rotor spinning process, Melliand Textilber-ichte (English ed.), December, 1060–1068, 1977.
58. Wakankar, V. A., Phatak, R. J., and Churi, R.Y., Some techno economic considerations while developing open end spinning machine for India, Wool & Woollens of India, January-March, 33–52, 1981.
59. Bayer, H., The economics of break spinning as affected by certain variables, Int. Text. Bull., Spinning, 1, 75–88, 1974.
60. Neuhaus, L., Present Situation of the New Spinning Technique and Development Tendencies, First International Colloquium about New Textile Technologies, 15–17 October, Mulhouse, France, 1–18, 1986.
61. Lord, P. R., Labour required in spinning, J. Text. Inst., 3, 135–37, 1982.62. Krause, H. W. and Soliman, H. A., Energy consumption of rotor type OE-spinning
machine as compared to ring spinning frame, Int. Text. Bull., Spinning, 3, 285–304, 1982.
63. Wulfhorst, B., Influence exerted by rpm and diameter of the rotor on the technology and economics of rotor spinning, Melliand Textilberichte (English ed.), December, 994–998/983–987, 1978.
64. Ripken, J., Connections between machine price, degree of automation, and rotor speed, and the economics in the production of fine rotor spun yarns, Melliand Textil-berichte (English ed.), February, 213–220/117–124, 1980.
© 2003 by CRC Press LLC

65. Schumann, F., Automation of open end spinning machines, Melliand Textilberichte (English ed.), January, 13–18/17–24, 1978.
66. Derichs, J., Automation of the rotor spinning machine, Melliand Textilberichte (English ed.), July, 526–533/532–538, 1979.
67. Krause, H. W., Staple-fibre spinning systems, J. Text. Inst., 3, 185–195, 1985.68. Mehrtens, D. G and McAlister, K. C, Fibre properties responsible for garment com-
fort, Text. Res. J., 8, 658–665, 1962.69. Lawrence, C. A. and Finikopulos, E., Factors effecting changes in the structure and
properties of open-end rotor yarns, Indian J. Fibre and Text. Res., 17(12), 201–208, 1992.
70. Lawrence, C. A. and Baqui, A., Effects of machine variables on the structure and properties of air-jet fasciated yarns, Text. Res. J., 61, 123–130, 1991.
71. Chasmawala, R. J., Hansen, S. M., and Jayaraman, S., Structure and properties of air-jet spun yarns, Text. Res. J., 61–69, 1990.
72. Rajamanickam, K., Hansen, S., and Jayaraman, S., Studies on fibre-process-structure-property relationships in air-jet spinning, part 1: The effect of process and material parameters on the structure of microdenier polyester-fibre/cotton blended yarns, J. Text. Inst., 89(2), 214–241, 1998; part II: Model development, J. Text. Inst., 89(2), 243–265, 1998.
73. Morton, W. E., The arrangement of fibres in single yarns, Text. Res. J., 4, 325–331, 1956.
74. Peirce, F. T, Self locking of single yarn structures, Text. Res. J., 17, 123, 1947.75. Hearle, J. W. S, Grosberg, P., and Backer, S., Structural Mechanics of Fibres, Yarns,
and Fabrics, Vol. 1, Chap. 3, Wiley-Interscience, New York, 148, 1969.76. Wang, X., Hung, W., and Huang, X. B, A study of the formation of yarn hairiness,
J. Text. Inst., 90(4), 555–569, 1999.77. Grishanov, S. A., Harwood, R. J., and Bradshaw, M. S., A model of fibre migration
in staple-fibre yarn, J. Text. Inst., 90(3), 298–320, 1990.78. Nield, R., Open-End Spinning, monograph No.1, The Textile Institute, Manchester,
UK, 1975.79. Barrela, A., Tura, J. M., and Vigo, J., Belts in open-end yarns: Influence of rotor
diameter and statistical distribution, Text. Res. J., 6, 389–393, 1977.80. Bradis, C., Physical limits to spinning, Int. Text. Bull., 2, 260–265, 1975.81. Lunenschloss, J. and Kampen, W., How fibre length and coefficient of fibre friction
affect the formation of wrappers, Melliand Textilberitche (English ed.), March, 181–202, 1978.
82. Kampen, K., Lunenschloss, J., Phoa, T. T., Influencing the structure of OE rotor yarns — Possibilities and limits, Int. Text. Bull., 3, 373–385, 1979.
83. Simpson, J. and Murray, M. F., Effects of combing-roll wire design and rotor speed on open-end spinning and cotton yarn properties, Text. Res. J., 9, 506–512, 1979.
84. Vigo, J. P. and Barella, A., Influence of opening roller type on properties of open-end polyester-viscose yarns, Text. Res. J., 1, 34–39, 1981.
85. Kong, L., X., Platfoot, R., and Wang, X., Effects of fibre opening on the uniformity of rotor spun yarns, Text. Res. J., 60(1), 30–36, 1996.
86. Rohlena, V., Open-End Spinning, Chap. 7, Elsevier Science, New York, 1975.87. Chandraray, S. and Dutta, B., Mean fibre extent of rotor-spun yarn, Indian J. Text.
Res., 12(6), 133–138, 1987.88. Cusick, G. E and Susutoglu, Y. A. M, Dref-2 method of spinning, Proc. Int. Text.
Symp. in Honour of 100th Anniversary of Ataturk, Izmir, Turkey, 2–4 November, 1981, 29–47.
© 2003 by CRC Press LLC

89. Stalder, H. and Soliman, H. A., A study of the yarn formation process during friction spinning, Melliand Textilberitche (English ed.), 2, E44–46, 99–103, 1989.
90. Krause, H. W., Soliman, H. A., and Stalder, H., The yarn formation in friction spinning, Int. Text. Bull., Yarn Forming, 4, 31–42, 1989.
91. Lord, P. R. and Rust, J. P., Fibre assembly in friction spinning, J. Text. Inst., 4(82), 465–478, 1991.
92. Lunnenschloss, J. and Brockmanns, K. J., Review of open-end friction spinning, Melliand Textilberichte, 3, 174–180, 1982.
93. Lunenschloss, K. B., Review of open-end friction spinning, Melliand Textilberichte, 63(3), 175–161, 1982; 63(4), 261–263.
94. Salhotra, K. R., Chattopadhyay, R., Kaushil, R. C. D., and Dhamija, S., Twist structure of friction spun yarns, J. Text. Inst., 90(4), 637–642, 1999.
95. Soliman, H. A., Structural limits in false-twist spinning, Swiss Rev. Text. Sci. and Techn., Swiss Federal Institute of Technology, 1, 6–11, 1996.
96. Grosberg, P., Oxenham, W, and Miao, M., The insertion of twist into yarns by means of air-jets, part 1: An experimental study of air-jet spinning, J. Text. Inst. 3, 189–203, 1987.
97. Artzt, P., Steinbach, G., and Stix, C., Influence of fibre fineness and fibre length on the processing performance and yarn quality in air-jet spinning of polyester/cotton yarns, Int. Text. Bull., 2, 5–14, 1992.
98. Srinivasan, K. V., A Study of Hollow Spindle Yarns, M.Sc. thesis, University of Manchester Institute of Science and Technology, UK, 1984.
99. Peirce, F. T., The geometry of cloth structure, J. Text. Inst., 28, T45, 1937.100. Baser, G., The Transverse Compression of Helices with Special Reference to the
Compression of Yarns, Ph.D. thesis, University of Leeds, UK, 1965.101. Mahmoudi, M. R., Improvements in Bulk of Worsted Spun Yarns, Ph.D. thesis, Uni-
versity of Leeds, UK, 1991.102. Oxenham, W., The Thickness and Compression of Yarns, Ph.D. thesis, University of
Leeds, UK, 1974.103. Oxtoby, E., Factors Affecting the Thickness and Compressibility of Worsted-Spun
Yarns, M.Sc. thesis, University of Leeds, UK, 1966.104. Hambuger, W. J., Mechanistic of elastic performance of textile materials, Text. Res.
J., 18, 102–113, 1984.105. Rees, H., The overall specific volume, compressibility and resilience of fibrous mate-
rials, J. Text. Inst., 39, 131–147, 1984.106. Tandon, S. K., Deformations of Helical Fibres Under Uniformly and Non-uniformly
Distributed Compressive Forces, Ph.D.tThesis, University of Leeds, UK, 1988.107. Goktepe, F., The Effect of Yarn Structure o the Deformation of the Yarn Cross-Section,
Ph.D.tThesis, University of Leeds, UK, 1997.108. Chattopadhyay, R., The influence of the strain rate on the characteristics of the load-
elongation curves of ring-spun and air-jet-spun yarns, J. Text. Inst., 90(2), 268–271, 1999.
109. Driscoll, R. H., Modelling the distribution of fibres in a yarn, J. Text. Inst., 1, 140–142, 1988.
110. Morris, P. J., Merkin, J. H., and Rennell, R. W., Modelling of yarn properties from fibre properties, J. Text. Inst., 3(90), 322–335, 1990.
111. Luijk, C. J., Carr, A. J., and Carnaby, G. A., Finite-element analysis of yarns, part 1: Yarn model and energy formulation, J. Text. Inst., 5, 342–353, 1984; part 2: Stress analysis, 5, 354–362, 1984.
© 2003 by CRC Press LLC

112. Pan, N., Development of a constitutive theory for short fibre yarns: Mechanics of staple yarn without slippage effect, Text. Res. J., 62(12), 749–765, 1992.
113. Seo, M. H., Realiff, M. L., Pan, N., Boyce, M., Schwartz, P., and Backer, S., Mechan-ical properties of fabric woven from yarns produced by different spinning technologies: Yarn failure in woven fabric, Text. Res. J., 63(3), 123–134, 1993.
114. Onder, E., A comprehensive stress and breakage analysis of staple fibre yarns, part 1: Stress analysis of a staple yarn based on yarn geometry of conical helix fibre paths, Text. Res. J., 66(9), 562–575, 1996.
115. Drean, J., Antonio, C. S., and Maria, E. C. S., Relationship Between Mechanical Properties of Fibres and Mechanical Properties of Yarns, EEC Comett Program, 1991.
116. Lamb, P., Textile and Fibre Technology: Wool Quality for Spinners, Commonwealth Scientific & Industrial Research Organisation, Clayton, Australia, August, 1997, www.tft.csiro.au.
117. Sreenivasan, K. and Shankaranarayana, K. S., Twist and tension as factors in yarn characteristics, Text. Res. J., 8, 746–753, 1961.
118. Berktin, R., Wrapped Spinning of Plain Yarns, M.Sc. thesis, University of Manchester Institute of Science and Technology, UK, 1983.
119. Rajamanickam, R., Hansen, S. M., and Jayaraman, S., Studies of fibre-process- structure-property relationships in air-jet spinning, part I: The effect of process and material parameters on the structure of microdenier polyester-fibre/cotton blended yarns, J. Text. Inst., 2(89), 214–242, 1998; part II: Model development, J. Text. Inst., 2(89), 243–265, 1998.
120. Padmanabhan, A. R., A comparative study of the properties of cotton yarns spun on the DREF-3 and ring- and rotor-spinning systems, J. Text. Inst., 80(4), 555–562, 1989.
121. Landwehrkamp, H., Ricofil Rotor Yarns from Combed Cotton, Ricofil First Sympo-sium, Rieter Machine Works Ltd., May 3–20, 1990.
122. Soliman, H. A., and Hellwig, A. H., Influence of combing on open-end rotor spinning parameters, Int. Text. Bull., Yarn and Fabric Forming, 2, 39–44, 1996.
123. Landwehrkamp, H., New findings with OE-rotor yarns from combed cotton, Int. Text. Bull., Yarn and Fabric Forming, 2, 3–7, 1990.
124. Looney, F. S., E. I. Du Pont de Nemours & Co., Wilmington, DE, private communi-cation, 1989.
125. Kasparel, J. V., Spinning in the 70’s: Yarns Made on the BD 200 Machine, Lord, P. R., Ed., Merrow Publishing Co., UK, 1970, 211–222.
126. Vaughn, E. A. and Rhodes, J. A. Right process fibre length improves OE, Text. World,127, 75, 1977.
127. Salhotra, K. R. and Alaiban, T. S., Optimisation of fibre length in relation to rotor diameter, Indian J. Text. Res., 9, 1, 1984.
128. Stalder, H., Spinning fine yarn counts on OE rotor machine M1/1, Int. Text. Bull., Spinning, 1, 155, 1979.
129. Bancroft, F. and Lawrence, C. A., Progress in OE spinning: world literature survey, 1968–1974, Shirley Institute Publication, S126, 1975.
130. London, J. F. and Jordan, G. B, Knitting Times, 43(15), 44, 1974.131. Kong, L. X., PlatFoot, R.A., and Wang, X., Effects of fibre opening on the uniformity
of rotor spun yarns, Text. Res. J., 66(1), 30–36, 1996.132. Simpson, J. and Murray, M., Effects of combing-roll wire design and rotor speed on
open-end spinning and cotton yarn properties, Text. Res. J., 506–512, 1979.133. Vigo, J. P. and Barella, A., Influence of opening roller type on properties of open-
end polyester-viscose yarns, Text. Res. J., 34–39, 1981.
© 2003 by CRC Press LLC

134. Lawrence, C. A. and K. Z. Chen, High speed photographic studies of fibre configu-ration during transfer from the opening roller of a rotor-spinning unit, J. Text. Inst., 77(3), 201–211, 1986.
135. Lawrence, C. A. and K. Z. Chen, A Study of the fibre transfer channel design in rotor-spinning, part 2, J. Text. Inst., 79(3), 393–408, 1988.
136. Lawrence, C. A. and K. Z. Chen, A further study of the fibre transfer channel design in rotor spinning, J. Text Inst., 81(3), 319, 1990.
137. Kong, L. X. and Platfoot, R. A., Two-dimensional simulation of air flow in the transfer channel of open-end rotor spinning machines, Text. Res. J., 66(10), 641–650, 1996.
138. Derichs, J., Theoretical and Practical Limits of Rotor Spinning in the Production of Fine Yarns, Schlafhorst documentation, No. 16, a141e-3.86. 1–9, 1986.
139. Lenzing, A. G., and Schlafhorst Co., Rotor spinning — Fine yarns, fine deniers, high speeds, Int. Text. Bull., Yarn Forming, 3, 69–84, 1967.
140. Stalder, H., Increasing Spindle Speed at Ring Spinning, Taking into Consideration the Yarn Quality and Running Conditions, Lecture at Zellweger Uster AG, SVT-Meeting, Uster, 28 January 2–7, Rieter Machine Works Ltd., 1994.
141. Gupta, A. K. and Vijayshankar, M. N., Seed-coat fragments in cotton as sources of blemishes in ring-spun yarns, J. Text. Inst., 76(6), 393–401, 1985.
142. Neps in spun yarns, Uster News Bull., 7, 1–8, 1965.143. The analysis of faults in yarns, Uster News Bull., 6, 1–8, 1965. 144. The uster system for yarn fault control, Uster News Bull., 29, November, 1981.145. The Uster automatic electronic yarn clearing installation, Uster News Bull., 22, 1–28,
1974.146. The source and frequency of yarn faults, Uster News Bull., 21, 1–20, 1973.147. Uster statistics, Uster News Bull., 15, 1–28, 1971.148. Quality control and supervision of yarn faults in the spinning mill, Uster News Bull.,
17, 1–15, 1971.149. Booth, J. E., Principles of Textile Testing, Heywood-Temple Press Books, Ltd.,
444–450, 1964.150. Hattenschwiler and Eberle, H., Quality in staple fibre spinning, Melliand Textilber-
ichte, 1987.151. Foster, G. A. R., Manual of Cotton Spinning: The Principles of Roller Drafting and
the Irregularity of Drafted Materials, The Textile Institute, Manchester, UK, 1958.152. Ratnam, T. V., Seshan, K. N., and Govindarjulu, K., Some factors affecting yarn
irregularity, J. Text. Inst., 65(2), 61–67, 1974.153. Lord, P. R., Yarn evenness in open-end spinning, Text. Res. J., 6, 512–515, 1974.154. Nield, R., The formation of rotor deposits in rotor spinning, parts 1 and II, J. Text.
Inst., 70, 275–286, 1979.155. Simpson, J., The effect of rotor groove on trash accumulation, end breakage and yarn
properties, Text. Res. J., 52–59, 1982.156. Heap, S. A, Some Problems and Opportunities for Cotton Spinners, Technical and
Economic Aspects, Dyson, E., Ed., Textile Trade Press, The Textile Institute, Manchester, UK, 1975.
157. Gilbert, D. K., Chemical composition of cotton dust, Text. Res. J., 50, 96–102, 1980.158. Bevilacqua, L., The dust problem in cotton spinning, Int. Text. Bull., Spinning, 3,
237–303, 1982.159. Tortosa, L. C., Effects of impurities in the feed sliver on O.E.-rotor spinning, Int.
Text. Bull., Spinning, 1, 29–41, 134–35, 1978.160. Barella, A. and Vigo, J. P., Introduction to the influence of rotor cleanliness on the
properties of open-end yarns, Text. Res. J., 612–619, 1974.
© 2003 by CRC Press LLC

161. Lord, P. R., The effects of rotor deposits in open-end spinning, J. Text. Inst., 4, 221–223, 1980.
162. Hersh, P., Effect of cotton grade variety and gravity location on dust in a model card room, Text. Res. J., 530, 1980.
163. Simpson, J., The effect of cleaning in the opening room and at the card on rotor residue for open-end machines, Text. Res. J., 507–512, 1980.
164. Supanekar, S. D., Effect of carding conditions on trash release in open-end spinning, Text. Res. J., 1, 26–27, 1979.
165. Naarding, B. J., Micro-dust elimination from cotton, Textilberichte, 5, 1978.166. Krischner, E., Opportunities for using low-grade cotton in rotor spinning, Melliand
Textilberichte, 5, 1978.167. Measures taken in preparation operations to control the formation of rotor deposits,
Melliand Textilberichte, 1, 1980.168. Van Alphen, W. F., The card as a dedusting machine, Melliand Textilberichte, 12,
1980.169. Towery, J. D., Improving gin-to-lint cleaning for the removal of OE spinning micro-
dust, Text. Res. J., 127, 1979.170. The influence of opening cotton tufts on cleaning in the blowroom, Textil Praxis, 20,
983–989, 1965, and 21, 107, 77–87, 172–179, 1966.171. Product quality assurance at automatic rotor spinning machines, User News Bull., 34,
1–30, 1987.172. Viswanathan, G. Munshi, V. G., Ukidive, A. V., and Srinathan, B., Hairiness of
synthetic/cotton blended yarns, Man-Made Text. in India, 6, 298–302, 1988.173. Cox, D. R., Some statistical aspects of mixing and blending, J. Text. Inst., 45(1),
T113–T121, 1954.174. Lund, G. V., The blending of viscose rayon and other fibres with particular reference
to the cotton system of processing, J. Text. Inst., 43, 375–391, 1952.175. Zurek, W., Krucinska, I., and Adrian, H., Distribution of component fibres on the
surface of a blended yarn, Text. Res. J., 6, 473–478, 1982.176. Cox, D. R., Some statistical aspects of mixing and blending, J. Text. Inst., 45(1),
T113–T121, 1954.177. Scardino, F. L. and Lyons, W. J., Preferential radial migration of fibres in the pro-
cessing of blends, Text. Res. J., 6, 573–574, 1970.178. Hamilton, J. B., The radial distribution of fibres in blended yarns, part 1: Character-
isation by a migration index, J. Text. Inst., 49(9), T411–T423, 1958.179. Balasubramanian, N., Effect of processing factors and fibre properties on the arrange-
ment of fibres in blended yarns, Text. Res. J., 2, 129–141, 1970.180. Lund, G. V, Fibre blending, Text. Res. J., 24(1), 759–764, 1954.181. Nuding, H., Fibre blends: The influence of the properties of fibres, J. Text. Inst.,
43(8), P352–P364B, 1952.182. De Barr, A. E. and Walker, P. G., A Measure of Fibre Distribution in Blended Yarns
and Its Application to the Determination of the Degree of Mixing Achieved in Different Processes, Shirley Institute Memoirs, Vol. XXX, 1957, 63–73.
183. Wang, X., Huang, W., and Hunag, X. B., A study on the formation of yarn hairiness, J. Text. Inst., 90(4), 555–568, 1999.
184. Manich, A. M., Barella, A., and Castellar, M. D., A contribution to the study of the influence of the design of the yarn-withdrawal tube on the diameter and hairiness of open-end spun acrylic-fibre yarns, J. Text. Inst., 6, 403–415, 1986.
© 2003 by CRC Press LLC

185. Barella, A. and Manich, A. M., The influence of the spinning process, yarn linear density, and fibre properties on hairiness of ring-spun and rotor-spun cotton yarns, J. Text. Inst., 79(2), 189–190, 1988.
186. The third generation of evenness testers: New possibilities of analysing yarn hairiness, Uster News Bull., 35, 24–41, 1988.
187. Barella, A., Alvarez-Vega, P. A., Castro, L., Yarn attrition by abrasion: A comparison of polyester-fibre/cotton blended-fibre yarns spun by different spinning processes, J. Text. Inst., 80(4), 599–603, 1989.
188. Barella, A. and Vigo, J. P., Application of a new hairiness meter to the study of sources of yarn hairiness, Text. Res. J., 41, 126–133, 1971.
189. Morton, W. E. and Hearle, J. W. S., Physical Properties of Textile Fibres, Chap. 17, The Textile Institute, Manchester, UK/Butterworth Heineman, Boston, MA, 364, 383.
190. Goswami, B. C., The hairiness of cotton yarns, Text. Res. J., 39, 234–240, 1969.191. Lawrence, C. A. and Mohamed, S. A., Yarn knitting parameters affecting fly during
weft knitting of staple yarns, Text. Res. J., 66(11), 694–704, 1996.192. Brown, P., A preliminary study of the fibre length distribution in fly produced during
the weft knitting of cotton yarns, Text. Res. J., 48, 162–164, 1978.193. Lee, J. R. and Ruppenicker, G. F., Effect of processing variables on the properties of
cotton knitting yarns, Text. Res. J., 48, 27–33, 1978.194. Ruppenicker, G. F. and Lofton, J. T., Factors affecting the lint shedding of cotton
knitting yarns, Text. Res. J., 49, 681–686, 1979.195. Buchler, G., Rieder, O., and Haussler, W., The origins of fibre fly on knitting machines
and ideas for reducing their harmful effects upon knitting efficiency, Knitting Technol., 10, 163–165, 1988.
196. Harnett, P., Functions and properties of thermal underwear, Wool Sci. Rev., 60(3), 3–20, 1984.
197. Hollis, N. R. S., Kaessinger, M. M., and Bogaty, H., Water transport mechanism in textile materials, part I: The role of yarn roughness in capillary type penetration, Text. Res. J., 11, 829–835, 1956; part II: Capillary-type penetration in yarns and fabrics, Text. Res. J., 1, 8–13, 1957.
198. Minor, F. W. and Schwartz, A. M., The migration of liquids in textile assemblies, part II: The Wicking of Liquids in Yarns, Text. Res. J., 12, 931–939, 1959.
199. Lord, P. R., A comparison of the performance of open end and ring-spun yarns in terry towelling, Text. Res. J., 6, 516–522, 1974.
200. Seo, M. H., Realff, M. L., Pan, N., Boyce, M., Schwartz, P., and Backer, S., Mechan-ical properties of fabric woven from yarns produced by different spinning technologies: Yarn failure in woven fabric, Text. Res. J., 63(3), 123–134, 1993.
201. Lord, P. R, Radhakrishnaiah, P., and Grove, G., Assessment of the tactile properties of woven fabrics made from various types of staple-fibre yarn, J. Text. Inst., 1, 32–52, 1988.
202. Kalyanaraman, A. R., Yarn-friction studies with the SITRA friction-measuring device, J. Text. Inst., 1, 147–151, 1988.
203. Spira, G., Knitting Int., 90(6), 151, 1983.204. Tetzlaff, G. and Wulfhorst, B. Production and use of open-end rotor yarns in the
medium and coarse count range, Int. Text. Bull., Yarn Forming, 1, 16–29, 1992.205. Schlafhorst Documentation No. 29, The Necessary Optimisation Measures and Set-
ting Modifications for Processing Rotor Yarns in Warp Preparation and Weaving.206. Weissenberger, W., The importance of yarn quality in high-performance weaving,
Rieter Link, 1, 27–29, 1999.207. Zhu, R. and Ethridge, M. D., A method for estimating the spinning-potential yarn number
for cotton spun on the rotor-spinning system, J. Text. Inst., 89(2), 275–280, 1998.
© 2003 by CRC Press LLC

The Principles of Package Winding
The principal objective of winding is to assemble many meters of yarn into packageform suitable for use in subsequent operations such as weaving and knitting. Asuitable package is one that can be easily unwound at high speed. Faults like verythick and very thin places in the yarn length should be removed, but the number ofjoint ends (i.e., piecings) must be kept to a minimum and, when required, a lubricant(wax) should be applied to the yarn surface. The yarn on packages for high-speedweft knitting is usually waxed. The removal of faults from the yarn is known asclearing and, in practice, clearing and waxing are important aspects of winding.
In the case of most unconventional spinning systems, the yarn is cleared, waxed,and wound into a suitable package during spinning. As an example, Figure 7.1illustrates the situation for rotor spinning. With ring-spinning systems, there is
7
FIGURE 7.1 (See color insert following page 266.) Typical integrated spinning, yarnclearing, and winding on rotor machines. (Courtesy of W. Schlafhorst AG & Co.)
© 2003 by CRC Press LLC

insufficient yarn length on the ring-spinning package. The yarn is therefore removedfrom a number of such packages and rewound into a suitable one. Figure 7.2 depictsthe typical arrangement for the rewinding of ring-spun yarns. As the yarn is removedfrom the ring bobbin,* it will balloon (see Chapter 8), which can increase the yarnhairiness. The yarn therefore passes through a balloon controller, then via severaltension control devices, followed by the yarn clearer, which cuts sizeable faults fromthe yarn. A piecing device joins the cut ends, and the yarn then travels via a waxingunit before being wound into a package.
The text of this chapter focuses mainly on the rewind of yarns from ring-spinningpackages to larger-size packages. The basic underlying principles are, however,applicable to the unconventional systems. Therefore, where appropriate, commentsand descriptions relating to unconventional systems are given. Five important aspectsare considered: package formation, thread-line dynamics and tensioning, yarn clear-ing, the piecing of yarn ends, and waxing.
7.1 BASIC PRINCIPLES
In Chapter 1, it was stated that, in the winding process, the two commonly woundpackage types are the parallel-sided cheese and the cone shown in Figure 7.3alongside a ring-spinning package. Two basic actions are required when producingeither package type (see Figure 7.4). A bobbin forming the core of the package mustbe rotated so that the yarn, while under tension, can be wrapped around the bobbincircumference. Simultaneously, the point at which the yarn is wound must be tra-versed along the bobbin length. Control of the yarn position can therefore be achievedby regulation of the traverse in relation to the package rotation. In this way, concentricyarn layers can be made to build up to form the package.
Bobbins may be made of card or plastic, the latter being perforated if the yarnis to be package dyed. Parallel-sided cheeses have tubular bobbins. For cones, thebobbin is of a conical form, i.e., a truncated cone; the angle of taper — the semi-vertical angle — depends on the end use for the resulting package. Table 7.1 listsfour common tapers. The wound cone package may have a fixed taper, which givesit flat ends, in which case the package is referred to as straight-ended. Cones mayalso have an accelerated taper, where the taper of the package is greater than thebobbin, resulting in a concave end at the top (the nose) and a convex end at thebottom (the base) of the package. These are called dished ends.
7.1.1 WINDING PARAMETERS
The bobbin length over which yarn is wound is termed the traverse length. Thenumber of wraps (or coils) of yarn wound within a traverse length is called the wind,and the traverse ratio (TR) equals twice the wind, which is equal to the number ofbobbin rotations in one traverse cycle. For the sake of simplicity, we will firstconsider parallel wound packages and discuss cones later on.
* The ring bobbin is a slightly tapered cylindrical tube onto which a yarn is wound during ring spinning.It also may be called a ring tube, yarn bobbin, or spinning bobbin.
© 2003 by CRC Press LLC

Yarn Guide Drum
Main DriveShaft
Reversing Shaft
Detector Wire
Slub Catcher
Gatet Feeler
Tension Device
Pre-Clearer
Unwinding Accelerator
Package Cradle
+
FIGURE 7.2 Typical arrangement of winding unit. (Courtesy of W. Schlafhorst AG & Co.)
© 2003 by CRC Press LLC

TABLE 7.1Common Tapers for Random-Wound Cones
Cone taper(semivertical angle) End uses
3°30' General purposes4°2' Wet processing (e.g., dyeing)5°5' Weft knitting: at final diameter taper may increase to 10°9°1' Weft knitting: at final diameter taper may be 14° to 18°
FIGURE 7.3 Ring-spinning package and rewound yarns of cheese and cone packages.
FIGURE 7.4 Basic winding actions.
© 2003 by CRC Press LLC

The angle θ between the inclined yarn (the yarn lay) on the package and a planeperpendicular to the bobbin axis is called the wind angle and can be calculatedaccording to
(7.1)
where Vts = the traverse speed (m/min), assumed to be constant even at the pointsof reversal
r = radius (m) of the layer being woundNb = bobbin rotational speed (rpm)
It is often found that the greater the wind angle, the more stable the package. Themaximum limit to the wind angle is the value that, if exceeded, allows the yarn, onreaching the end of a layer during traverse reversals, to slip over the end of the layerbeneath.
The coil angle, φ, is the angle between the direction of the yarn on the packageand the direction of the traverse length. Therefore, φ + θ = 90°. Throughout theremaining sections, the coil angle will be used in preference to the wind angle.
The winding speed of the yarn is the resultant speed of the bobbin surface andtraverse speeds. It can be calculated from
(7.2)
where Vbs and Vts = the bobbin surface and traverse speeds, given by
Vbs = 2π r Nb (7.3)
Vts = 2LNt (7.4)
where L = traverse lengthNt = traverse frequency
The winding speed is also given by
Vwy = Vbs cosec φ (7.5)
Yarn reversal at the traverse ends cannot occur instantaneously. Therefore, unlesssteps are taken, more coils occur in the region of the package ends than in the restof the traverse length. The package density is then higher at the ends, forming whatis termed hard package ends. This is considered to give poor package formation andwould be unacceptable for package dyeing of yarns. As explained later, a uniformpackage density can be obtained by slightly displacing the traverse of each layerlaterally in one direction and then the other by 3 to 5 mm.
θtan V ts 2πrNb⁄=
V wy V bs2 V ts
2+=
© 2003 by CRC Press LLC

7.2 TYPES OF WINDING MACHINES
There are two widely used types of winding machine: drum winders (used to windstaple-spun yarns into random-wound packages) and precision winders (for windingfilament yarns into precision-wound packages). Throughout this book, we are con-cerned only with staple spun yarns, but it is useful to have a basic understanding ofthe differences between the two types of winding, so both are discussed in thischapter.
7.2.1 DRUM-WINDING MACHINES
Drum-winding machines rotate the forming package through surface contact with acylindrical drum, and the yarn is traversed either by an independent traverse, typicallya wing cam, or by grooves in the drum. Figure 7.5 illustrates the two types of traversesystems.
7.2.1.1 Wing Cam
There are several different independent traverse systems, but the simplicity of thewing cam makes it a useful example to describe. As shown, the end, A, of a yarnguide bar moves the yarn while the other, B, is made to move around the peripheryof the cam, traveling one circuit of the periphery per revolution of the camshaft. AsB makes one circuit of the cam, A reciprocates, moving the yarn through a returntraverse (i.e., double traverse) along the length of the bobbin. The reciprocating yarnguide limits the winding speed because of the inertia on reversals. A very high rateof traverse is impeded by the mechanics of the guide system, since forces of 16 to64 times the weight of the yarn guide can be present during the reciprocating action.The reciprocating guide can be replaced by a spirally grooved traverse roller, which
Independent Carry Traverse
Grooved Drum Traverse
A
B
FIGURE 7.5 Winding traverse motion.
© 2003 by CRC Press LLC

moves the yarn along the traverse length. In this case, only the yarn undergoesreversal as it is held in the traversing groove of the rotating roller, and speeds inexcess of 1500 m/min can be achieved. A further advantage of the grooved traverseroller is that, as a result of tension, the yarn being wound enters the groove withoutthe need for threading up as is required with the independent traverse system.
7.2.1.2 Grooved Drum
With the grooved drum system, the surface speed of the drum, and the traverse speedare kept constant. A continuous helical groove (i.e., interconnected clockwise andcounterclockwise helical grooves) around the drum circumference guides the yarnalong the traverse length as the yarn is wound onto the bobbin. A continuous helixhas points of crossover of the clockwise and counterclockwise helices. To retain theyarn in the correct groove during its traverse, particularly at the intersections, onegroove is made deeper than the other, and the shallower groove is slightly angled.
For both types of traverse, we can refer to a drum constant, k, as the number ofturns corresponding to a double traverse of the yarn on the bobbin. This is similarto the wind.
k = (7.6)
where Nd = the drum rotational speed
A wing cam traverse provides one double traverse (i.e., a traverse cycle) forevery turn of the camshaft. There are therefore Nt traverse cycles per minute (i.e.,the traverse frequency). The constant k is purely a ratio that can be, but usually isnot, a whole number. With groove drums, the continuous spiral is such that k isalways a whole number. The k value of a groove drum is easily found by inspection.It is twice the number of crossings of the spirals, e.g., a 2.5 crossing drum has k =5. However, a drum with k = 1 is called a split drum, not a 1/2-crossing drum.
From Equations 7.4 and 7.6,
Vts = 2L (7.7)
And the transverse ratio, TR, is
TR = k (7.8)
where Dd and Db = respective diameters of the drum and bobbin
The reader should note that the above equation for TR is applicable only tocylindrical packages. As we shall see later, with cone-shaped packages, it is conve-nient to refer to the mean diameter, dm. Thus, for cones, TR = k Dd/dm.
Nd
Nt
------
Nd
k------
Dd
Db
------
© 2003 by CRC Press LLC

As the package diameter increases, its rotational speed decreases, and so doesthe wind and the transverse ratio, but the coil angle, φ, remains unchanged. To makestable packages in which the coils retain their position and do not drift toward themiddle or the ends of the package, φ should be within the range of 68° to 81°.
The decrease in the traverse ratio with increasing package diameter presents aproblem in the winding process.
7.2.1.3 Patterning/Ribboning
As the traverse ratio decreases, it passes through a series of integer values. Howlong it remains at any particular integer value depends on the rate of change of thepackage diameter as winding proceeds. At small diameters, the rate of increase ofDb is too high for patterning to persist. However, when the transverse ratio corre-sponds to a whole number, the yarn coils of successive traverse will follow exactlythe same path of wind. The coils of successive winds are therefore formed on topof each other, producing a raised honeycomb pattern on the bobbin surface.
As the package builds up, we can see from Equation 7.8 that, with Db increas-ing, TR decreases and ceases to become an integer. The action of patterning isthen disrupted. Nevertheless, a number of patterning zones can exist in a package,because patterning can also occur when TR has certain nonintegral values thatresult in the yarn returning to its starting point after a small number of doubletraverses (e.g., TR = interger + 1/2, or 1/3, 2/3, 1/4, 3/4, 1/5, 2/5, 3/5, 4/5).Patterning is an objectionable fault, as it causes an uneven package density. Ifpackage dyeing is carried out, this may result in uneven dyeing of the yarn.
7.2.1.4 Sloughing-Off
As coils in a patterning zone lie exactly on top of each other, two or three suchoverlaying coils can be inadvertently pulled off together during the unwinding ofthe yarn from the bobbin. This leads to an entanglement of the coils, which thenhas to be cut away. This is a fault known as sloughing-off. Clearly, sloughing-offcauses machine stoppages in warping and in weaving where the package is used asa weft supply. In weft knitting, the effect can be more severe, causing needlebreakage. Beside sloughing-off, the coils in the patterning zone can cause snaggingand thereby high-tension variations.
7.2.1.5 Anti-patterning Devices
Patterning must be avoided, and drum-winding machines are equipped with anti-patterning devices. They can be one of four types, as described below.
Variation of Traverse Frequency, Nt
For cam-operated traverse machines, a small sinusoidal variation is made to thenormal running speed of the camshaft. The lay of yarn coils is therefore not constantbut varies slightly from one double traverse to another (see Equation 7.1), and thereis also a slight variation in TR (see Equations 7.6 and 7.8). Thus, the start of eachdouble traverse will sometimes be before, and sometimes behind, the previous one.This approach to pattern breaking is a very effective one.
© 2003 by CRC Press LLC

Variation of Drum Speed, Nd
For rotary traverse machines (grooved drums), small reductions and increases aremade automatically to the speed of the drum 20 to 30 times per minute. The changesin speed slow and then speed up the package but, as the drum accelerates, there isa small slippage between the package and the drum until frictional contact betweenthe two brings the package up to the increased drum speed. The slipping of thepackage causes a change in the lay of the coils being wound-on at the time and inTR; patterning is thereby prevented.
Lifting of Bobbin to Reduce Nb
An alternative way of introducing slip is to rapidly raise (1 mm) and then lower theforming package off and onto the drum 20 to 30 times per minute.
Rock-and-Roll MethodThis method is confined to cone winding, which will be discussed later. It involvesintermittently tilting the package from the drum so that the base of the cone-shapedpackage being formed remains in contact with the drum while the nose rises amillimeter or so. This occurs several times per minute.
7.2.2 PRECISION WINDING MACHINES
We can see from the above description that drum-winding systems involve significantfrictional contact between the yarn and the package-forming device. Yarns that canbe easily damaged by friction, in particular filament yarns, are wound into packagesusing precision winders.
With precision winders, the package is mounted onto a drive spindle, and areciprocating yarn guide, driven by a cylindrical cam coupled to the spindle drive,is used to move the yarn along the traverse length. The reciprocating yarn guidelimits the winding speed because of the inertia on reversals.
The term precision refers to the control of positioning each layer of yarn as itis wound onto the bobbin. There is a precise ratio of spindle to traverse speed.Therefore, as the package diameter increases, the wind and TR are kept constant.Thus, for precision winders, Equation 7.8 becomes
TR = (7.9)
The coil angle is given by
(7.10)
Hence, as Db increases the coil angle, φ, increases, and the angle of wind, θ,decreases. Continuous filament yarns are prone to slip at reversal points; therefore,in contrast to the drum winding of spun yarns, the precision winding of filamentyarns requires φ to be within the range of 70° to 80°. Importantly, the packagediameter should not allow φ to exceed 80°, which can mean a small package size
Nb
Nt
------
φtanπDbNb
V ts
-----------------πDbNb
2LNt
-----------------πDbTR
2L-----------------= = =
© 2003 by CRC Press LLC

when using a constant spindle speed. But note that, although precision winding isessentially for continuous filament yarns, it can be used for very fine spun yarns.
Provided that the machine is arranged such that TR is not an integer or a multipleof 0.5, patterning will not occur with precision winding, so no pattern-breakingdevices are needed. With Nb constant, the surface speed of the forming packageincreases with Db, as does the yarn tension. Increasing yarn tension can causeincreased package density in the outer layers. All yarns have a limiting speed atwhich they can be wound into packages economically so, once the package surfacespeed equals the limiting speed for the yarn, the package will have reached maximumdiameter. The limiting speed is governed by the situation in which the mean tensionand the variation about the mean are at such a level that peak tension values reachthe yarn breaking load. Then, an excessive number of yarn breaks occur duringwinding, resulting in a low production efficiency, a low production rate, and poor-quality packages with a high number of piecings.
Precision winders may have a constant or variable spindle speed, constant orvariable surface speed, or a combination of these. A constant spindle speed requiresminimal tension fluctuations. A variable spindle speed provides a constant meanwinding tension; a device (a tension-compensator) is used to monitor any change inthe mean tension, and it slows or increases the spindle speed to maintain a constanttension. For constant surface speed, the spindle speed has to decrease as the packagediameter builds up. When a combination approach is used, the spindle speed firstincreases to give the required production rate, after which surface speed is keptconstant.
The advantage of a combination system, as compared with constant spindlespeed, can be illustrated by the following numerical example of building a parallel-sided cheese package. Knowing the traverse length, L, and traverse ratio, TR, theoptimal bobbin diameter, or package core diameter, Db(min), and the maximum pack-age diameter, Db(max), can be calculated by applying the coil angle restrictions. Thus,from Equation 7.10,
(7.11)
Let L = 20 cm and TR = 5. Then, for φ = 70° and 80°, respectively, Db (min) = 7 cm,and Db(max) = 14.44 cm.
If the limiting winding speed for the yarn is 600 m/min, then, for the constantspindle speed system, the actual spindle speed will be the value that enables thesurface speed of the package to reach the limiting winding speed at a packagediameter that equals Db(max). This will require a traverse frequency or cam speed of
(7.12)
and Nt = 264.5 cycles per minute (or revolutions per minute of the wing cam shaft),which must not exceed the maximum available on the machine, say 350 rpm.
Db2L φtan
πTR------------------=
600πDb max( )Nb
100---------------------------
πDb max( )TRNt
100----------------------------------= =
© 2003 by CRC Press LLC

The surface speed of the bobbin or package core will be
(7.13)
For combination systems, winding during the earlier stage of package build canoccur at the fastest possible spindle speed until the package surface speed equalsthe limiting speed for the yarn. Then, the spindle speed is controlled to maintainthis surface speed as the package diameter increases. Thus, the change of windingmode would occur when the bobbin diameter reaches a value given by
(7.14)
so Db = 10.91 cm and, at this diameter, the coil angle is 76.9° (see Equation 7.10).In the second stage of winding, the package builds up at 600 m/min until the
diameter reaches 14.44 cm (φ = 80). Based on these calculations, Figure 7.6 showsa graph comparing the two modes, and it is evident that the combination mode willalways give a higher production rate than can be obtained with a constant spindlespeed.
It should also be clear that, if a constant surface speed system were used to buildthe package at the limiting speed of 600 m/min so as to obtain an even higher
πDb min( )TRNt
100--------------------------------- 290.8 m/min=
πDbTR350100
--------------------------- 600 m/min=
600
550
500
450
400
350
300
2506 7 8 9 1110 12 13 14 15
Cheese Diameter
Constant Spindle Speed
Constant SurfaceSpeed
ConstantSpindle Speed
Surf
ace
Spee
d (m
/min
)
Case For Variable Spindle Speed
Case For Constant Spindle Speed
FIGURE 7.6 Package building at constant and variable spindle speed modes.
© 2003 by CRC Press LLC

production rate, the disadvantage would be less yarn length wound on the package.This is because the bobbin diameter, Db(min), would need to be 10.91 cm rather than7 cm as used for the combined and constant spindle speed systems.
7.2.3 ADVANTAGES AND DISADVANTAGES OF THE TWO METHODS OF WINDING
Advantages and disadvantages of the two winding methods are shown below.
7.2.4 COMBINATIONAL METHODS FOR PATTERN-FREE WINDING
With the application of microprocessor control techniques, winding machines havebeen developed with the objective of combining the positive features of the twobasic winding methods. These newer methods are known as stepped precisionwinding, which produces a wound package referred to as digicone, and ribbon freerandom winding.
7.2.4.1 Stepped Precision Winding (Digicone)
The aim is to combine the advantage of the constant wind angle of random windingand the advantage of the constant traverse ratio, TR, of precision winding to producea pattern-free package with a near-constant coil angle, φ. Figure 7.7 illustrates thearrangement used. The drum is driven to give a constant winding speed, and the motoralso drives a variable ratio-drive unit, V, which controls the traverse drum speed.
Figure 7.7a shows a plot of winding ratio and coil angle, φ, during packagebuild. Precision winding is characterized by the horizontal line, P, because of itsconstant TR, whereas random winding is represented by a hyperbolic curve for aconstant φ. With precision winding, there is a precisely constant TR, but with randomwinding, φ is not precisely constant. This is because of the required anti-patterning
Advantages and Disadvantages of the Two Methods of WindingCharacteristics Precision winding Random winding
Patterning + No patterning – Inherent patterning, anti-patterning device necessary to prevent pattern zones
Package density – Not constant + ConstantDensity of wind + High package density – Low package densityGeometry of yarn lays + Precise yarn laying – Irregular yarn laying form layer to
layerUnwinding performance + Good winding
performance– Problem of pattern zones
Technical system – Complex systems,expensive machines
+ Simple system, lower-cost machines
+ = advantages, – = disadvantages
Courtesy of Durur, G., Cross Winding of Yarn Packages, Ph.D. Thesis, University of Leeds, July, 2000.
© 2003 by CRC Press LLC

action. Random winding therefore involves a very narrow range of φ values. It iswithin this range that stepped precision winding simulates the basic principles ofprecision winding.
At the start of winding (See Figure 7.7c), the TR is set at a high value (W1)that provides the required gain, and φ = A1. As winding proceeds, TR remains at(W1), but φ increases to A2, the maximum allowable value. This point is determinedfrom shaft encoders connected to the spindles, and the ratio of the coupling is alteredto a lower TR of (W2) so as to reset φ to A1 and retain the gain but to avoid aninteger value. The procedure is repeated throughout the build of the package. Eachresulting yarn layer will be wound with a different TR, but φ will be nearly constant.
7.2.4.2 Ribbon Free Random Winding
This method is similar to the basic random winding method, but steps are taken toensure that the TR does not reach integer values. The control system is arranged in
Package
Drum Traverse
Drum
Con
trol
Uni
t
M VnDT
1110
987654321
50 100 150 200 250Package Diameter (mm)
Tra
vers
e R
atio
(T
R)
607080Varying
Coll Angle (Degrees)
V – Variable ratio drive
W1
W2
W3
W4
A2
A1
A–Wind Angle
Package Diameter (d) Package Diameter (d)
Tra
vers
e R
atio
(W
)
W1W2
W3
W4
Tra
vers
e R
atio
(W
)
W5
A2
A1
npac/nDT2
npac/nDT1
(a) (b)
(c) (d)
FIGURE 7.7 Stepped precision and ribbon free random windings. (Courtesy of Durur, G.,Cross Winding of Yarn Packages, Ph.D. Thesis, University of Leeds, July, 2000.)
© 2003 by CRC Press LLC

a similar way to the digicone process, but the difference is in the variable drivecontrol (V) of the traverse cam speed. Instead of varying the speed to achieve step-constant TRs, the speed is varied to obtain step-constant φs.
Figure 7.7d shows that two traverse cam speeds are involved, nDT1 and nDT2; thusthere are two set φ values relating to the ratio of the package speed, npac, and the camspeed (see Equations 7.9 and 7.10). Winding begins with φ set at A2 and, as the packagediameter increases, TR nears the critical value W2, at which stage the yarn traversespeed is changed by the control unit to reduce TR to W3 and φ to A1. The packagenow continues to build in diameter until TR nears W4, when the yarn traverse speedchanges again to increase TR to W5 and φ back to A2. This reversal of φ at criticalvalues of TR proceeds to the full package size. In contrast to digicone, the ribbon freerandom-wound package has layers that are wound at two very distinct φ values.
7.3 RANDOM-WOUND CONES
The above discussion was largely about the winding of parallel-sided cheese-typepackages. Although the underlying principles apply to the winding of conical pack-ages, there are important differences in producing random wound cones, as in thiscase the forming package is surface driven. These differences are therefore notapplicable to the precision winding of cones.
7.3.1 PACKAGE SURFACE SPEED
The principal difference between cheese winding and cone winding on drum-drivensystems is concerned with the package surface speed. A cone in contact with arotating cylindrical drum may have a rotational speed of Nb, but the surface speedwill vary along the traverse length, the lowest value being at the nose and increasingto the highest value at the base. In contrast, a parallel-sided cheese has the samesurface speed at all points along its traverse length. With a cone, there can be onlyone point on the traverse length that has a surface speed equal to that of the rotatingdrum, and this is therefore the point of drive of the cone by the drum (see Figure7.8). Since, at every other point along the traverse length, there is a differencebetween the surface speeds of the cone and the drum, slippage will occur at allsurface-contact points except the point of drive.
The distance along the traverse from the cone base to the point of drive is calledthe drive length, indicated as “y” in the diagram, which remains constant duringwinding of the package. There is initially some variation in y when the cone is small,but this is negligible. Thus, for a fixed drive length, Figure 7.8 also illustrates, inrelation to the drum surface speed, the changes in the cone surface speed at pointsalong the traverse length as the cone builds up. N1–B1 represents the surface speedof the cone from nose to base at the start of winding. It can be seen that the nosespeed is much smaller than the point of drive speed, but the base speed exceeds thepoint of drive speed. As the nose and base diameters increase, the cone rotationalspeed decreases. Therefore, the surface speed of the nose increases while the basespeed decreases, both moving toward but never achieving the drum speed, as indi-cated by lines N2–B2 and N3–B3.
© 2003 by CRC Press LLC

The production speed of winding is the mean surface speed and not the speedat the point of drive. The mean surface speed can be calculated from the drumdiameter, Dd, and the drum surface speed, Nd. Thus, the rotational speed of the cone,Nb is given by
(7.15)
where dd = the diameter at the drive point of the cone, a distance y from the cone base
If α = the cone angle and dd = cone base diameter, then,
dd = db – 2y sin α
550
500
450
400
350
300
250
2000 2 4 6 8 10 12 14 16 18
Traverse Length
Surf
ace
Spee
d (m
/min
)
Drum Surface Speed
N3
N2
N1
B3
B2
B1
Dd
Nb
Nd
A BC
Y
(a)
(b)
Pointof Drive
FIGURE 7.8 Random-wound cones.
NbNdDd
dd
-------------=
© 2003 by CRC Press LLC

The mean surface speed, Vm, of the cone then becomes
(7.16)
Figure 7.9 illustrates how Vm increases asymptotically toward the drum surface speedas the mean cone diameter increases. It is clearly beneficial to use as large as possiblea mean core diameter, but doing so must enable adequate yarn length to be woundinto a cone package with the required taper.
7.3.2 ABRASION AT THE NOSE OF CONES
The difference in surface speed that occurs between the nose region of the cone anddrum can result in yarn abrasion, and yarns sensitive to friction can be affectedadversely by the heat produced. For example, polyester/cotton blend can showlocalized fusion of the polyester. To alleviate such effects, cam-operated traversesystems have what is termed split drums. One part of the drum is solid and drivesthe bobbin, while a second, shorter part (a loose shell) is free to rotate and supportsthe rotating nose of the cone. With drum traverse systems, the cylindrical drum isreplaced by a slightly tapered one, thereby reducing the speed difference betweenthe nose of the cone and the drum.
V mNbπ db dn+( )
2--------------------------------=
πNdDd db dn+( )2 db 2y αsin–[ ]---------------------------------------=
450
400
350
3002 4 6 8 10 12 14 16 18 20 22
Mean Cone Diameter
Mea
n Su
rfac
e Sp
eed
(m/m
in)
FIGURE 7.9 Mean surface speed with package build.
© 2003 by CRC Press LLC

7.3.3 TRAVERSE MOTIONS
It should be evident to the reader that, with a cone package, the surface area isgreater at the base of the cone and decreases toward the nose. Therefore, to build apackage of uniform density, it is necessary to ensure that the yarn length wound perunit surface area is a constant value. More yarn then needs to be wound in the regionof the base than in the region of the nose, and this is achieved by an acceleratedtraverse motion in contrast to a constant traverse motion used for cheeses. The yarnguide or winding point moves more rapidly across the traverse near the nose thanit does near the base. In this manner, more coils per unit length are wound at thebase region.
The accelerated traverse motion is obtained with a cam system by a change incam profile, whereas, for drum traverse systems, the grooves are widely spaced inthe nose region, and the spacing decreases rapidly toward the base region.
7.4 PRECISION OPEN-WOUND AND CLOSE-WOUND PACKAGES
Precision-wound packages may be either cheeses or small-taper cones. As shown inFigure 7.10, the packages can have straight ends or, by varying the traverse length,cone ends that give a pineapple shape to the package.
Pineapple packages reduce the chances of yarn coils slipping over the packageends and causing problems during unwinding in subsequent processes. With cones,it is not common practice to wind continuous filament yarn on to taper bobbinsgreater than 4°20'. Precision-wound cones of 4°20' are used for dyeing and, for thispurpose, are open wound. In precision open-wound packages, the traverse rate isset to enable succeeding yarn lengths per traverse to be positioned with a regularadvance or spacing along the package surface. The positionings of the yarn lengthsare not very close, but a dense package is made, and this type of package is widelyused in the winding of synthetic filament yarns and of yarns that are to be packagedyed. In producing very dense packages for processes in which having the maximumamount of yarn in package form is a requirement, the packages are close wound.
In precision close winding, by appropriate selection of the traverse ratio or wind,each coil of yarn can be made to lie side by side with the preceding coil. Precision-
Cheese Pineapple Tapered Cone Rounded Tapered Cone
FIGURE 7.10 Precision close-wound and open-wound packages.
© 2003 by CRC Press LLC

wound packages are consequently very firm; they will hold more yarn than any otherpackage of the same size, are more resistant to handling, and will easily unwind.
7.4.1 THEORY OF CLOSE-WOUND PACKAGES
We saw earlier that, when the return of a double traverse ends at its starting point,the next double traverse will lay coils on top of the preceding coil, resulting inpatterning. If the wind or TR is an integral number or an integer + 0.5 (i.e., a multipleof 0.5), then, at each double traverse, succeeding yarn layers will be laid on top ofone another. If the is wind made to be slightly greater (or less) than an integer, then,as Figure 7.11 illustrates, yarn coils will lie in contact beside each other, producinga precision close-wound package.
We can see that the reversal points of the double traverses being laid precedeone another in sequence 1, 2, 3, 4, …, n counterclockwise around the bobbincircumference, with n being the maximum number that can be contained in thecircumference. The n + 1 reversal point starts the repeat of the sequence but, incomparison to the first sequence, because the bobbin diameter has increased, thenumber of reversal points in the second sequence will be greater than n. It shouldbe noted from the figure that coils 2, 3, 4, and so forth, on the return traverse, crossover coil 1. The same occurs for each succeeding coil. Consequently, each cycle ofthe reversal point sequence gives a double layer of the yarn.
The amount by which a coil is displaced relative to the preceding one is termedthe gain. Therefore, the concept of yarn gain is employed to produce close-woundpackages. The traverse ratio, or the wind, is adjusted to a value slightly greater orless than a whole number to prevent yarn length in succeeding layers from lyingalong the same path on top of one another.
Consider two adjacent coils on the first double layer of a close-wound package.The circumferential displacement, uc, subtends the angle β at the bobbin axis. Hence,
β (in radians) = (7.17)
FIGURE 7.11 Close-wound layer.
2uc
Db
--------
© 2003 by CRC Press LLC

From the approximate right-angled triangle shown,
x/uc = cos ϕ
Thus,
(7.18)
And, dividing by 2π,
(7.19)
which is the angular displacement of the two coils per revolutions of the bobbin.This is the yarn gain, and it may be defined as angular displacement of the reversalpoints around the circumference of the package ends. It follows from our earlierdiscussion that, if TR(nominal) is the integer value or a multiple of 0.5, then a precisionclose-wound package would be obtained with TR = TR(nominal) + β or TR(nominal) +0.5β. Put in general terms, if patterning occurs for TR(nominal) = multiples of n, wheren ≤ 1, then anti-patterning is effective for TR = TR(nominal) + nβ. When x = dy, theyarn diameter, and β = dy/π [Db cos ϕ], then the anti-patterning becomes precisionclose winding.
Usually, the gain is set by a gearing arrangement and does not alter as thepackage builds up. This means that, since β remains constant, uc will increase, andwith small-diameter bobbins having large yarn carry capacity, the reversal pointswill become more widely spaced as the diameter increases (as compared to larger-diameter bobbins having less yarn capacity).
A close-wound package, produced with appropriate “2gain,” has a diamondpattern appearance at the package surface, and the winding is sometimes referredto as a diamond wind. An open-wound package has no characteristic surface patternappearance. Many faults can be encountered in the winding, but the ones describedbelow are the most important.
7.4.2 PATTERNING OR RIBBONING
This major fault can occur in improperly made random-wound packages. We havealready discussed this fault in detail, along with measures taken to prevent itsoccurrence. Therefore, we will move on to consider other possible faults.
7.4.3 HARD EDGES
Generally, cross-wound packages tend to have hard edges, and these become aproblem when yarn is to be wet processed (e.g., dyed or bleached) in package form.The cause of the problem is that the yarn traverse speed decreases to zero withinthe proximity of the reversal points for the change of direction and then accelerates
β 2 xDb ϕcos-------------------=
β xπ Db ϕcos( )---------------------------=
© 2003 by CRC Press LLC

to the set speed. Although this occurs in a fraction of a second, more yarn is laidon the forming package at the location of reversal points. As illustrated in Figure7.12, rather than the ideal sharp reversal point, there is a curvature. The net effectis that the packing density along the traverse length varies, and this can cause unevenflow of, say, the dye liquor into the package layers. Softer edges and a more uniformpackage density can be obtained by a lateral oscillation of approximately 30 cyclesper minute of the drum or of the forming package. This displaces the traverse length,enabling the reversals to be spread over a width of 3 to 5 mm (see Figure 7.12).
7.4.4 COBWEBBING (WEBBING OR STITCHING OR DROPPED ENDS)
Cobwebbing is a result of some coils slipping over the forming edge of the packageduring the action of reversal. In subsequent processing, unwinding of the packagebecomes problematic in that, when the fault is at the package base, the increasedunwinding tension often breaks the yarn. The fault may occur because of severalreasons such as insufficient tensioning, too large a coil angle, or (on independenttraverse machines) an incorrect setting of the yarn guide from the package. The faultis usually corrected by adjustment of the machine settings.
7.4.5 TWIST DISPLACEMENT
Twist displacement can occur with rotary traverse drums. The large contact area ofthe grooves causes twist displacement, which if periodic can lead to fabric faults.Machines therefore are usually designed to have a ‘scrambling effect’ on the twistdisplacement to avoid periodicity. When winding low twist yarns the disturbance ofthe twist may often lead to excessive yarn breaks. The cam and guide arrangementdoes not cause any appreciable twist displacement and it is therefore preferable towind low twist yarns on such machines.
7.5 YARN TENSIONING AND TENSION CONTROL
The over-end withdrawal during the unwinding of a yarn from a ring-spinningpackage causes ballooning, as described in detail in Chapter 8, and marked fluctu-ations occur in the yarn tension.2 In unwinding the coils from the top to the bottomlayer of the ring-spinning package, the mean tension and the fluctuation in tensionabout the mean increase with time as the layers are removed. The fluctuation intension can be minimized or eliminated by tension devices applied to the tread lineas indicated in Figure 7.2, but these will increase the mean tension, which eventually
IdealReversals
ActualReversals
ModifiedReversals
FIGURE 7.12 Hard and soft edges.
© 2003 by CRC Press LLC

becomes the tension at which the yarn is wound into cheeses or cones, i.e., thewinding tension. Thus, the greater the mean unwinding tension, the higher the meanwinding tension.
When unwinding yarn from the ring-spinning package, little control of the meanwinding tension is possible except by changing the winding (or unwinding) speed.Hence, the rise in tension during about the last fifth of a ring-spinning package canbe a major factor in determining the take-up speed used throughout winding. Themore advanced machines tend to accelerate to a higher unwinding speed whileunwinding the first fifth of the package. They maintain this speed before reducingit over the last fifth of the package, thereby gaining a higher production rate. Evenwith this approach, it is desirable to control the mean tension and fluctuation intension, as the wound cheese or cone would have a uniform density, and the yarnwould subsequently then be easily unwound. Also, because a number of yarn prop-erties are dependent of the stress history of the yarn, the yarn length on the cheeseor cone is likely to have more consistent properties.
For example, controlling the tension within set limits permits very weak placesin the running length to break and to be repaired more cost effectively than wouldbe the case in subsequent processes. Tension on a yarn can enable fiber ends nearthe yarn surface to slip from the constraining frictional tact with other fibers andproject from the yarn surface. Therefore, tension variation during winding can leadto variation in hairiness along the yarn.
In controlling the unwinding of yarns from the ring-spinning package, variousmeans of applying tension are available, and it is therefore useful to consider thediffering features of tension devices.
7.5.1 CHARACTERISTICS OF YARN TENSIONING DEVICES
7.5.1.1 The Dynamic Behavior of Yarns
As the running yarn from a ring-spinning package passes through a tensioningdevice, the increased tension further stretches the yarn. Assuming that the breakingextension is not reached, some permanent strain could occur, depending on the yarnelastic properties. Other yarn properties susceptible to the applied tension would becount, diameter, degree of twist, bulkiness, and hairiness, as indicated above. It istherefore desirable for the tension device to
1. Give output tensions between known limits2. Avoid introducing tension fluctuations or magnifying those already
present in the tread line3. Avoid changing the yarn twist distribution
7.5.1.2 The Capstan Effect
Tension devices work by frictional contact between the yarn and solid surfaces. Acommon feature is that of the yarn passing around a curved or cylindrically shapedsurface. To consider the general case of such a situation, it must first be pointed out3
© 2003 by CRC Press LLC

that Amonton’s classical law of frictional contact between solid bodies is not appli-cable to fibers and yarns in its simple well known form of
F = µR (7.20)
where µ is the coefficient of friction and R is the reaction to the normal force.From a number of studies on the frictional behavior of textile materials,4 it has
become generally accepted that the relationship between F and R takes the form
F = a Rn (7.21)
where a changes with the surface characteristics of the materials in contact and nchanges with their elastic properties. The value of n approximates to 0.67 for twoperfectly elastic solids and increases to 1.0 for two surfaces having an area deter-mined by purely plastic conditions. Clearly, when n = 1, a = µ, and Amontan’s lawsapply.
Equation 7.21 can therefore be used to determine theoretical behavior of yarnpassing around a curved surface. Figure 7.13 shows such a situation and indicatesthe tension forces at the two ends of a small section, ds, of the yarn length in contactwith the curved surface.
The angle subtended by ds is dθ. Let R be the reaction (per unit length of theyarn) to the normal force caused by the yarn tension. Then, under static conditions,when dT = 0 and the yarn is stationary,
2T sin (dθ/2) = Rds
or, for dθ being very small
T dθ = Rds (7.22)
T
ds
RdS
ρ
T + δT
dθ
FIGURE 7.13 Tensions in yarn element around cylindrical radius.
© 2003 by CRC Press LLC

Under dynamic conditions, when the yarn is running at a constant speed,
Fds = dT (7.23)
where F is given by Equation 7.21.Taking the ratio of Equations 7.23 and 7.22 and substituting for F,
dT/T = aRn–1 dθ (7.24)
If ρ is the radius of curvature, then from Equation 7.22, T dθ = Rρdθ or T =Rρ, and Equation 7.24 becomes
or
(7.25)
The integral of Equation 7.25 between the limits of input, Ti, and output, TO, tensions,from θ = 0 to φ, gives
(7.26)
where X = Bφ/k B = a(ρ/Ti)k
k = 1/[1 – n]
The binomial expansion of [1 + X]k has the form eBφ. Therefore, Equation 7.26becomes
When n → 1 k → ∞, Amonton’s law applies, so a = µ. Thus, in the general case,the change in tension as a yarn passes around a curved surface can be represented by
(7.27)
where µ = [a(ρ/TO)1–n]
dTT
------- aT n 1– dθρn 1–
---------------------=
dT
T n------- aρ1 n–=
T O
T i
------ 1 X+( )k=
T O
T i
------ eBφ a ρT O
------ 1 n–
φ
exp= =
T O
T i
------ eµφ=
© 2003 by CRC Press LLC

7.5.1.3 Multiplicative and Additive Effects
Tension devices can increase the yarn tension by multiples of the capstan effect, byan additional frictional factor, or by a combination of both. The multiplying actioncan be exploited in the capstan series shown in Figure 7.14a, where the tread lineis deflected around a set of pins to establish the desired output tension, TO.
TO = Ti eµΣφ (7.28)
where Σφ = φ1 + φ 2 + φ 3 … + φn
As we saw earlier, the input tension fluctuates during unwinding, and capstanseries devices increase the magnitude of these fluctuations. The friction coefficient,µ, is also subject to changes resulting from variations in twist and yarn speed varyingthe yarn and solid surface contact. The effects from the variations in µ will bemagnified because of the exponential relationship. For these reasons, tensioningdevices are rarely based on just the multiplicative principle.
Figure 7.14b illustrates a plate tensioner, which is an additive tensioning device,increasing the yarn tension according to
TO = Ti + µR (7.29)
The output tension now only varies linearly with µ rather than exponentially, allow-ing the output tension to be more easily adjusted to the required value.
1
1
2
2
3
3
57
46
Ti
Ti
(a)
(b)
(c)
(d)
To
To
To
Ti
Ti
To F
Mg
(e)
Damping
Movable Fingers
Stationary Fingers
Yarn – Ti
Yarn – To
FIGURE 7.14 Tension devices.
© 2003 by CRC Press LLC

7.5.1.4 Combination Tensioning Devices
The disc tensioner (see Figure 7.14c), which is widely used, combines multiplicativeand additive effects. Thus, the output tension is
TO = Ti eµ2β + µ1R(1 + eµ2β) (7.30)
where µ1 and µ2 are the respective friction coefficients of the disc surface and thecurved surface. A purely additive effect can be obtained if the thread line is notdeflected by the curved surface.
The pulley or whorl-type tensioner shown in Figure 7.14d also gives a combinedeffect. The yarn is wrapped around the pulley, which rotates against the resistanceof magnetic breaking force, F. The additive component is therefore the force of thecouple needed to overcome the magnetic resistance.
The above-described tensioners may provide the required output tension but donot reduce or damp tension fluctuation. The gate tensioner, illustrated in Figure7.14e, can be used to smooth or eliminate such fluctuations. The yarn passes througha series of intersecting pins or posts that are arranged so that one set is weightedbut free to move back and forth, thereby varying the contact angle with the yarn tocompensate for fluctuations in the input tension. The output tension can be derived5 as
(7.31)
where n = number of postsβ = angle of wrap
W = the applied weight
The gate tension device has a low natural frequency that can amplify tension fluc-tuations of the same frequency. A damping dashpot, as shown in the figure, is usedto eliminate this.
7.6 YARN CLEARING
Spun yarns often have “objectionable faults” such as very thick or very thin places.The thick places, called slubs, can be the result of a group of badly drafted fiberstwisted together to form a relatively short length in the yarn, several times the yarndiameter. Poor piecing of yarn breaks during spinning, the twisting in of loose air-borne fibers, and the defective operation of machinery can also result in slubs andthin places. Ineffective opening and cleaning and/or contamination of raw materialcan cause unsightly foreign matter in the yarn. Chapter 6 describes typical yarnfaults that can arise during processing and that have degrading effects on fabricquality. In ring-spun yarn production, such faults are removed at the winding stageof the production sequence. In unconventional spinning systems, such as rotor andair-jet spinning, the clearing of faults occurs at the automated machines.
T OW 1 e2µβ–[ ]
1 e2 n 1–[ ]πβ–( ) βsin---------------------------------------------=
© 2003 by CRC Press LLC

There are various types of clearing device, principally mechanical, dielectric(capacitance), and photoelectric (optical). The mechanical clearers are the mostbasic and essentially consist of an adjustable slot or conical tube through which theyarn passes. The slot or tube traps only thick places that are greater than the setconstriction. The device incorporates a cutting edge that breaks the yarn at the fault.Mechanical clearers cannot remove thin places or unsightly impurities or evendiscriminate between the lengths of thick places. Slubs of elliptical cross section(torpedo-shaped) usually slip past. Because of such limitations, mechanical clearersare rarely used.
The capacitance and photoelectric scanning devices6–8 are the widely used sys-tems. The capacitance system monitors the mass per unit length and generates avoltage that is compared with a set reference value for the mean yarn thickness.When the voltage difference exceeds a given maximum value, the yarn is automat-ically cut and the fault removed, and the yarn ends are pieced together for windingto continue. With photoelectric scanning, a beam is projected from a light sourcelaterally across the yarn, and a photocell measures the intensity of the light passingby the yarn. In this way, variations in the yarn thickness can be monitored. Whenthe change in intensity is greater than a set level, the fault is removed and the yarnends pieced. Yarn silhouette can be viewed with optical clearers, the electronicsignals are generated from several angles so as to ensure that torpedo-shaped slubsare detected.
7.7 KNOTTING AND SPLICING
When a detected fault is cut from a yarn, the resulting yarn ends are pieced together,either by knotting or splicing them using an automatic piecing device.
7.7.1 KNOTTING
Among the various types of knot, the weaver’s knot and the fisherman’s knot,illustrated in Figure 7.15, are the two types that may be used. The latter is suitablefor most yarns. The weaver’s knot is more appropriate for short-staple yarns, as itis a smaller knot, but it slips more easily when under tension.
The advantage of a knot is that its strength will be several times that of the yarnstrength so, if properly tied, it gives reliability to the piecing. However, the knot hasmany disadvantages for the end user of the yarn and may be seen as “one faultreplacing a worst fault.” Its main drawback is size, i.e., its thickness and tails. Theweaver’s knot is two to three times the yarn thickness; the fisherman’s knot is threeto four times as large. Often, therefore, it may be preferable to accept a thick placein the yarn as a compromise on the final fabric quality, even if it is of comparablethickness, since no tail ends will be present and, as it is less firm than the knot, itcould be less visible in the fabric. In processes subsequent to winding, knots can beproblematic. When passing at high speed through a tension device (e.g., a disctensioner), a knot can give rise to a sudden high peak tension, causing a yarn break.Although smaller and hence preferable for finer yarns, the weaver’s knot is suscep-tible to untying when tensioned. In weaving, then, the alternating stresses on the
© 2003 by CRC Press LLC

warp yarn can cause slipped knots, especially with plied yarns. With densely wovenfabrics, knots and tails can rub neighboring warp ends, hampering shedding andcausing yarn breaks. The size of the knot can disturb weft insertion on air-jet looms,leading to fabric faults, and, in knitting, difficulty in passing a knot through needlescan cause holes in the fabric because of dropped stitches or needle breaks.
The development of the splice has made a major reduction in the size of piecedends and has therefore eliminated many of the processing difficulties mentionedabove and greatly improved fabric quality. Consequently, splicing is seen as theindustry standard and, although not all spun yarns can be spliced, the great majorityof winding machines are fitted with automatic splicers.
7.7.2 SPLICING
There are various methods of producing a knot-free yarn joint (e.g., gluing, wrapping,and welding)9 but, with spun yarn, only the splice has proved to be a suitablereplacement for the knot. The principle for splicing two yarn ends is to untwist ashort length at the ends and then intermingle and retwist together the fibers of thetwo ends. Electrostatic and mechanical techniques have been used for splicing butwere unsuccessful because of the complexity of the devices, the time required tomake the splice, and, importantly, the very low strength of the joint.
Commercial splicing devices currently employ air jets to untwist, intermingle,and retwist the fibers. Figure 7.16 illustrates the basic actions of the splicing process.The device has two untwisting tubes (A, B) and a twisting chamber (C). The twoyarn lengths to be joined are held on opposite sides of the twisting chamber at N1
and N2, while their free ends L1 and L2 are placed respectively into the tubes B andA. The lengths lie parallel to each other within the respective twisting chambers.This is the arrangement for untwisting the yarn ends by the air vortices generatedby a pulse of compressed air injected through nozzles into A and B. The lengths L1
and L2 are then drawn back until there is a certain length of overlap of the untwisted
Fisherman’s Knot
Weaver’s Knot
FIGURE 7.15 Fisherman’s and weaver’s knots.
© 2003 by CRC Press LLC

ends within the splicing chamber. A pulse of compressed air is then injected throughother nozzles into the chamber, and the resulting vortex entangles and twists togetherthe fibers of the overlapping ends to form a spliced piecing. Winding of the yarnthen continues.
To obtain a suitable splice in terms of size, a compromise may need to be reachedbetween splice strength and appearance. A well spliced joint has a diameter 20 to30% greater than the yarn over a length of approximately 15 to 20 mm, and anaverage strength of around 80% of the yarn strength with a low CV% of strength.9
Some splicers are equipped to thin the thickness of the yarn ends during untwist-ing by removing an appropriate amount of fibers. However, in general, splicers haveinterchangeable splicing chambers of differing geometry as well as adjustable set-
Clamp
Yarn Guide Lever
Scissors
Scissors
Clamp Untwisting Nozzlewith L1 and L2
Yarn Holding Lever
Splicing Nozzle
A A A
BB BC
C C
N1
L1L2
N2
FIGURE 7.16 Yarn splicing.
© 2003 by CRC Press LLC

tings so as to optimize tail length overlap and the duration of the compressed-airpulses for untwisting and retwisting. A suitable choice of settings will depend onfiber type and the surface structure, count, and twist of the yarn.
Machine downtimes caused by yarn breaks are expensive, particularly if theentire machine has to be stopped to repair the break. Comparing the cost of repairingyarn breaks in winding with the costs for subsequent processes, we would find thatthe latter are many times greater: for example, 700× for warping, 2100× for sizing,and 490× for weaving. Steps therefore must be taken in winding to ensure a yarnpackage quality that will enable high efficiency in later processing. Table 7.2 outlinesmany of the claimed advantages of replacing the knot with a splice.
TABLE 7.2Benefits of Knot-Free (Spliced) Yarns
Fabric Production End Product Benefits
Weaving Denim (83-tex cotton yarns) • 60% reduced yarn breaks• 2% increased efficiency• 15% reduced production cost• 40% reduction in second quality fabrics
Poplin shirting • 50–60% reduced yarn breaks• 10% reduced production cost (warping and
weaving)• 40% reduction in second quality fabrics
Bed sheeting (29-tex cottonyarns)
• 50% reduced yarn breaks• 10–12% reduced production cost• 40–50% reduction in second quality fabrics
Worsted serge (29/2-tex polyester/wool, 55%/45%, yarns)
• Fewer stoppages in assembly winding, twisting and weaving
• 60–70% reduction in burling and mending*
Worsted cotele (23/2-tex wool yarns)
• 30% reduced yarn breaks• 50% reduction in burling and mending*
Knitting Outerwear (28-tex worsted yarns)
• 30–40% reduced stoppages• 60–70% reduced number of holes• 50% reduction in second quality fabrics
Underwear (17–20-tex cotton yarns)
• 40–60% reduced stoppages• 50–70% reduced number of holes, press-offs
and dropped stitches• 70% reduction in second quality fabrics
*Manually removing faults from the back of a fabric; e.g., opening knots, cutting tails, etc.
Courtesy of W. Schlafhorst AG & Co.
© 2003 by CRC Press LLC

7.8 YARN WAXING
It is common practice to wax staple-spun yarns for knitting applications, given theproblems of friction associated with the many thread line deflection points of thethread guides and the knitting needles on knitting machines. For optimal running ofyarns during knitting, there needs to be a uniform wax distribution along yarns anda minimum of wax rub-off.
The amount of wax deposited on the yarn has a marked influence on the dynamicfrictional characteristics of the yarn. Figure 7.17a shows that, at a given runningspeed, the yarn coefficient of friction decreases to a minimum with increasing waxdeposited and then increases with further yarn waxing. Of the three zones indicated,clearly, Zone II is the preferred range of deposition, usually 0.5 to 1.0 g/kg of yarn.
Wax grades vary according to melting point, oil content, microstructure, andhardness. Little has been published in the way of selecting a wax grade for optimalrunning performance. However, it would seem that selection depends on manyfactors such as fiber type; yarn structure, count, and moisture content; as well asroom temperature and humidity in the winding area and during storage andshipment.
The preference with the commonly used wax disc is for a coarse microcrystallinestructure, which allows small wax particles to be removed and held onto the yarnsurface as shown in Figure 7.17b, as this should enable a uniform distribution ofdeposition. Steaming or high-humidity conditioning of wax yarns can result in anincreased friction coefficient. Steaming will melt the wax particles and also give apartial penetration of wax into the yarn. If the yarn has to be relaxed in this way,then the deposition should be increased to offset the effect.
FIGURE 7.17 Yarn thread line friction with increased wax take-up. (Courtesy of W. Schlaf-horst AG & Co.)
© 2003 by CRC Press LLC

REFERENCES
1. Durur, G., Cross Winding of Yarn Packages, Ph.D. thesis, University of Leeds, July2000.
2. Brunnschweiler, D. and Mohammadain, I. S., J. Text. Inst., 50, 74, 1959.3. Howell, H. G., The General case of friction of a string round a cylinder, J. Text. Inst.
(transactions), 8/9, T359–T362, 1953.4. Morton, W. E. and Hearle, J. W. S., Physical Properties of Textile Fibres, Butterworth-
Heinemann, Boston, 1962.5. Dyer, faw and beard, Text. Res. J., 22(7), 487, 1962.6. Product quality assurance at automatic rotor spinning machines: Uster Polyguard,
Uster News Bull., 34, 1–30, 1987.7. The Uster automatic electronic yarn clearing installation, Uster News Bull., 22, 1–27,
1974.8. The Uster system of yarn fault control, Uster News Bull., 29, 1–27, 1981.9. W. Schlafhorst & Co. Information, April, 1–12, 1982.
© 2003 by CRC Press LLC

Yarn Tensions and Balloon Geometry in Ring Spinning and Winding
8.1 INTRODUCTION
The basic principles of ring spinning were described in Chapter 6, and it wasexplained that, as the traveler circulates the ring, it pulls with it the yarn lengthbetween the pigtail lappet guide and the traveler. This length circulates the axiscommon to the spindle, ring, and lappet guide. In doing so, the yarn length balloons,and the tension, air-drag, and the inertial, central, and Coriolis forces acting on theyarn length govern the balloon geometry.
In winding, discussed in Chapter 7, over-end withdrawal is used to pull the yarnoff the ring spinning bobbin in the direction of the bobbin axis, and the yarn passesthrough a pigtail guide on the axis. At withdrawal speeds of up to, say 25 m/min,the yarn tends to follow a direct path from the unwinding point on the package tothe guide. In this situation, the yarn tension is almost entirely the result of frictionaldrag on the package surface. Winding speeds are very much higher than 25 m/min.At these higher speeds, the yarn balloons and, similar to ring spinning, the balloongeometry is determined by the equilibrium of the above-mentioned forces.
Yarn ballooning is a physical phenomenon of practical interest. It sets the min-imum distance of separation that must occur between spindle positions on a ring-spinning machine so as to prevent adjacent balloons from colliding. Stable ballooningis essential for reduced machine stoppages. Balloon stability governs the balloonheight/ring diameter relationship and thereby the package size. These factors, in turn,influence the production rate, energy cost, and (in certain cases) fabric quality.
In this chapter, we consider the main physical factors that determine yarntensions and balloon geometry in ring spinning and winding. The study of yarnballoons was first reported in the literature in 1883 by Escher.
1
Since then, variousother studies have been published; some qualitative, others mathematical, severalinvolving fairly complex mathematics employing numerical methods and computersoftware to obtain exact predictions. Several investigators, however, have madesimplifying assumptions to circumvent the mathematical difficulties of the morerigorous approach. Although analyses based on simplifying assumptions give lessexact solutions, they are nevertheless useful for gaining a general understanding ofthe physics of yarn balloons. The justification for this is that such treatments are
8
© 2003 by CRC Press LLC

easier to understand, yet they readily explain the essential physical phenomenainvolved and generally lead to results that are in good agreement with observations.Importantly, the results obtained were found to be a useful practical guide forpredicting balloon performance. Although reference is made to the more complexsolutions, including a number of the latest reported models, the descriptions givenin this chapter will therefore follow the semiquantitative approach of some of thereported work, based on simplified assumptions. In particular, it is assumed that theforces acting on the yarn are sufficiently large for the effect of yarn stiffness to benegligible. Also, we assume that the yarn tensions do not cause any appreciable yarnextension. The yarn therefore can be viewed as an inextensible string.
8.1.1 C
IRCULARLY
P
OLARIZED
S
TANDING
W
AVES
Consider a rotating string as shown in Figure 8.1.
17
The sideways appearance wouldbe similar to that of the string vibrating in the vertical plane to form a standing waveor stationary wave.
2
In the case of the rotating string, we can refer to the waveformas a
circularly polarized standing wave.
Depending on the length, frequency ofrotation, and tension of the string, there may be one or more nodal points.
In spinning and winding, yarn balloons are essentially circularly polarized trans-verse vibrations of a string. Thus, we can apply the basic equations for the velocity,
c
, of propagation of transverse waves along a string.
c = (8.1)
and
Standing Wave on a Vibrating String
Circularly Polarized Standing Wave on a Rotating String
1/2 λ 1/2 λ
λ
FIGURE 8.1 Circularly polarized standing waves.
T a
m-----
12---
© 2003 by CRC Press LLC

λ
= (8.2)
where
T
a
= tension in the string
m
= mass per unit length
λ
= wavelength
f
= vibration frequency
The tension in the string is an important factor in balloon dynamics, and we willtherefore first consider how tension arises in the yarn during ring spinning, followedby the balloon dynamics of this spinning system, and then extend the discussion tothe winding process.
8.2 YARN TENSIONS IN RING SPINNING
In ring spinning, tension develops in the yarn mainly because, to move the travelerand the balloon length,
L
b
, around the common axis, and to wind the yarn onto thespinning bobbin, work must be done against the frictional force of the ring on thetraveler and of the traveler on the yarn, as well as against the air drag on the travelerand on the balloon length. This work is additional to that needed to overcome thefriction of the spindle bearings and the air drag on the forming yarn package.
The tensions in the yarn during ring spinning may be considered with respectto three zones: the winding zone, the balloon zone, and the yarn formation zone.The winding zone is the area in which the yarn length from traveler to formingpackage develops a winding tension,
T
w
. In the balloon zone, tension occurs in theyarn length between the traveler and lappet guide (often referred to as the
balloontension
). This tension, at a given point on the balloon length, varies with amplitude(i.e., the radius of the point) measured from the common axis. At the ring andtraveler, the balloon tension is provided by
T
R
and is related to
T
w
by Equation 6.6,given in Chapter 6.
In the yarn formation zone (i.e., the zone between the pigtail lappet guide andthe front rollers of the drafting system), the yarn tension is termed the
spinningtension,
T
S
, and is related to the balloon tension at the lappet guide,
T
O
, by Equation6.5 in Chapter 6. To avoid confusion with symbols used later in this chapter,Equations 6.5 and 6.6 may be rewritten as
T
S
=
T
O
e
–
ηθ
(8.3)
T
R
=
T
W
e
–
υα
(8.4)
To understand the physical causes of these tensions in the yarn, we need to considerthe forces acting on the yarn in the three zones.
8.2.1 Y
ARN
F
ORMATION
Z
ONE
Although the yarn rotates around the inner circumference of the lappet guide atalmost the same speed as the traveler, the radius of the lappet guide is sufficiently
cf---
© 2003 by CRC Press LLC

small for any central forces generated to be ignored. The motion of the yarn betweenthe lappet and front drafting rollers is therefore principally related to the velocityalong its length (i.e., the thread line velocity). Consequently, the forces of interestare the air drag along its length, the tension at the lappet guide, and the resistanceto bending around the guide. The air drag is proportional to the square of the threadline velocity, but this velocity is usually small as compared with the rotational velocityof the yarn. Thus, the force caused by the air drag along the yarn length is assumedto be negligible. The bending resistance due to the flexural rigidity of the yarn ismany times smaller than
T
O
and can also be omitted from further consideration.
T
O
is therefore the only effective force governing
T
S
and, as a result, analysis of theforces present in ring spinning is usually concerned with the remaining two zones.
8.2.2 W
INDING
Z
ONE
In steady running conditions, the traveler presses against the bottom of the internalflange of the ring, as illustrated in Figure 8.2.
17
The forces acting on the traveler atthe point of contact with the ring are also depicted.
Strictly,
T
W
is not the true winding tension. This is because centripetal, Coriolis,and air-drag forces act on the mass of the yarn length from the traveler to the ringbobbin. It can be reasoned that the latter two effects negate each other and thereforecan be neglected. The effect of the centripetal force is to change the path of the yarnfrom that of a tangent from the package to the traveler, to one of a curve. The change,however, is small and, for the sake of simplicity, this centripetal force is alsoneglected.
Z-AxisTR
Y-Axis
X-Axis
TW
θ1θ2
θ3
θ4
P
Mg
Yarn
Traveler
Ring
To Bobbin
µP
φ
FIGURE 8.2 Forces acting on traveler during steady running conditions.
© 2003 by CRC Press LLC

The simplified approach to relating the tensions of Equations 8.3 and 8.4 to thephysical parameters of spinning is to first consider the forces acting on the yarn inthe absence of air drag and then to introduce the effects of the drag component.
8.2.2.1 Yarn Tensions in the Absence of Air Drag
Let us first consider tensions
T
R
and
T
W
and the other forces acting on the travelerduring steady running conditions (i.e., dynamic equilibrium). Resolving the forcesshown in Figure 8.2 into their vertical and horizontal components gives
C
=
T
W
cos
φ
+
P
cos
θ
4
– T
R
cos
θ
1
(8.5)
T
W
sin
φ
=
µ
P
+
T
R
cos
θ
2
(8.6)
T
R
cos
θ
3
=
P
sin
θ
4
+
Mg
(8.7)
where
θ
1
…
θ
4
and
φ
= angles indicatedC = centripetal force
MR
ω
2
needed to keep the traveler cir-culating around the ring
P
= reaction force of the ring and traveler
R
= ring radius
Mg
= weight of the traveler
µ
= friction coefficient between ring and traveler
From Equations 8.4, 8.5, and 8.6,
T
R
=
χµ
C
/sin
φ
cos
θ
4
+
µ
cos
φ
–
χ
[
µ
cos
θ
1
+ cos
θ
4
cos θ2] (8.8)
and
χ = e–υα
Equations 8.4, 8.6, and 8.7 give
(8.9)
To simply the above equations and obtain an estimate for TR, we can assume thatthe weight of the traveler, Mg, is negligible in comparison to TR so that Mg can beremoved from the equations. From practical observation, it is also reasonable toassume that θ3 is such that cos θ3 = 1. In the absence of air-drag, θ2 → 90°, so cosθ2
→ 0 (with → indicating “approximates to”). Hence, cos θ1 → 0, and χ µ cos θ1 canbe removed the equations. Based on these assumptions, Equations 8.8 and 8.9 become
TR = χµ C/sin φ cos θ4 + µ cos φ (8.10)
(8.11)
θ4sinχµ T R θ3cos Mg–[ ]T R φsin χ θ2cos–[ ]-----------------------------------------------=
θ4sin χµφsin
-----------=
© 2003 by CRC Press LLC

From 8.11, cos θ4 = [sin2φ − (χµ)2]1/2/sin φ. Equation 8.10 then becomes
(8.12)
From deriving TR, we can now determine the winding tension from Equations 8.4and 8.12.
(8.13)
From the above equation, we can deduce certain important general informationabout the ring spinning system. Equations 8.6, 8.12, and 8.13 show that the yarntensions TR and TW and the frictional drag of the ring on the traveler (µP) are directlyproportional to the mass of the traveler, the ring diameter, and the traveler speed orspindle speed.
It can be seen from Equations 8.12 and 8.13 that, when µ is small, such thatsin θ4 → 0, and cos θ4 → 1, then TR → χµC/sin φ and TW → µC/sin φ. We can see,too, that frictional drag of the ring on the traveler is dependent on φ; µP = TW sin φ.In general, then, as the package builds up, the winding tension will decrease withthe lead angle φ determined by the frictional drag of the ring on the traveler, andalso of the traveler on the yarn, as the latter passes through the former to the package.During a typical bobbin build, sin φ can vary from between 0.45 and 0.5 (empty) tobetween 0.9 and 0.95 (full), so TW can almost halve in size during the package build.The variation of TW during the package build will therefore give a nonuniformpackage hardness, decreasing in hardness from the inside to outer layers. With agiven ring diameter, this governs the amount of yarn that can be wound onto a bobbin.
For a fixed spindle speed and ring diameter, altering the traveler friction andmass will provide a particular winding tension, say, for a package of requiredhardness. For example, if µ is small, a heavier traveler will be needed than when µis large. If µ is fixed, the tension becomes governed by the traveler mass. Thus, theselection of the traveler will depend on the maximum tension that the yarn willwithstand when winding on an empty bobbin.
Figure 8.3 shows two possible running positions for the traveler. The normalrunning position is of the traveler contacting the inside of the ring. However, if toolight a traveler is used, TW cos θ4 becomes greater than the centripetal force, C, andthe traveler runs on the outside of the ring; this is termed outside tracking.
Consider now Equation 8.10. With regular running, θ4 < 90° and cos θ4 ispositive. With outside tracking, θ4 > 90° and cos θ4 is negative. However, TR and TW
would still be positive, and spinning would still occur if µ cos φ > sin φ cos θ4. Thismeans that, at low winding angles, a minimum µ is necessary: µ > tan φ cos θ4 or,substituting for cos θ4, µ > sin φ/[(χ2 + cos2 φ]1/2. The mean winding tension, TW, isgreater for outside tracking than for regular running, and abnormally high tensionfluctuations occur, making the situation unstable.
T RχµC
sin2φ χµ( )2–[ ]1 2⁄ µ φcos+ ------------------------------------------------------------------------=
T WµC
sin2φ χµ( )2–[ ]1 2⁄ µ φcos+ ------------------------------------------------------------------------=
© 2003 by CRC Press LLC

The coefficient of friction, µ, is speed dependent, decreasing with increasingspeed. Outside tracking can therefore occur at low spindle speeds. Figure 8.417
illustrates the condition for outside tracking for a traveler mass of 40.3 mg.8 Thefigure shows how winding tension, TW, varies with µ and ν. The dotted parts of thecurves indicate the conditions for outside tracking. The curve υ = 0.5 shows thatthere is also a limiting value of µ below which spinning cannot occur. This situationcan be reasoned from Equation 8.11. Since sin θ4 cannot be greater than unity, theremust be a minimum value of φ, for a given µ and χ, below which the traveler will
TR
Yarn Yarn
TWTW
Traveler Traveler
RingRing
S
Pθ4θ θ4
(A) θ4 < 90° (B) θ4 < 90°
TR
FIGURE 8.3 Normal running and outside tracking of traveler.
140
120
80
40
0
Number on CurvesAre Values of vTraveler Weight = 0.0403 gm
0.2 0.4 0.6Effect of Friction (µ)
0.20.30.5
0.1
0
Bal
loon
Ten
sion
(gm
)
FIGURE 8.4 Relation between balloon tension, TR, and friction coefficients, P and µ.
© 2003 by CRC Press LLC

not operate. This is given by sin φ = µ χ. The situation is readily seen if attemptsare made to spin on empty bobbins of too small a diameter in relation to the ringdiameter. This gives too small a φ value for the traveler to run. As wide as possiblea winding angle is always beneficial and, as a general rule of thumb, the practiceis for the empty bobbin to be at least half the ring diameter.
8.2.3 BALLOON ZONE
Let Figure 8.5 represent the balloon length in three-dimensional space as describedin Chapter 6. Point o is the first nodal point of the balloon, and the origin of theaxes z, x, y, which rotates with the spindle; z is essentially the spindle axis, and x= R is the ring radius.
To gain an understanding of the causes of tension in the balloon zone, we haveto consider the forces acting on each elemental length, where r denotes the distanceof an element of length from the z-axis. The forces present are as follows:
y
o x
xpyp
Zp
1 2
34
T
z
Ringω
ω
P
r
−P
FIGURE 8.5 Three-dimensional representation of balloon length.
© 2003 by CRC Press LLC

• Centripetal and Coriolis forces associated with the yarn motion• Air drag forces opposing the yarn motion• The weight of the element acting vertically downward• The resistance to bending resulting from the flexural rigidity of the element
Let us look at these forces in a little more detail.There are two components of centripetal force to consider. As an element, dl,
of yarn moves from the lappet to the ring and traveler, a component of centripetalforce acts on it to make it move through the curved path of the tread line. The sizeof this component of centripetal force mainly depends on the thread line velocityand is therefore considered to be negligible. The second component of centripetalforce acting on the element keeps it rotating around the z-axis. As the angular velocityis high, this component is highly significant.
There are also two components of Coriolis force to consider. As the element ofyarn rotates, it actually spirals from one radius to another due to the velocity of theyarn along its length, which gives the production speed. This velocity has threecomponents: a radial velocity, a velocity tangential to the circumference of rotation,and a vertical velocity in the direction toward the ring and traveler. When movingfrom a smaller to a larger radius, the element’s kinetic energy of rotation increases(KE = 1/2 mdlr2ω2) and decreases if the converse. The force acting on the elementto cause the increase in KE is the component of Coriolis force associated with theradial velocity.
When KE increases, this component of force is in the direction of rotation butacts in the opposing direction for decreases in energy. Thus, as the element movesfrom the lappet guide toward the maximum balloon radius, assuming that this isgreater than the ring radius, R, this component of force is in the same direction ofrotation as the element. It is in the opposite direction when the element moves fromthe maximum radius to R. A second component of Coriolis force acts radially inwardand is associated with the tangential velocity moving in the direction of rotation.These forces are of magnitudes 2mvr ω and 2mvtω ,where vr and vt are the radial andtangential components of the thread line velocity. In ring spinning, because the threadline velocity is usually small by comparison with the rotational velocities, the twocomponents of Coriolis force are neglected.
Similar to the above, there are two components of the air drag force present:the drag along the yarn length, which can be discounted for the reason given earlier,and the resistance of the air to the rotation of the element. The latter drag forcecomponent is regarded as being proportional to the square of the rotational velocityof the element relative to the air (VN
2 = [rω]2), which makes it important. Thisrelation is probably not exact, since the power appears to be 1.7 as reported byWIRA.3 However, the square law assumption is generally taken as a reasonableapproximation. The velocity concerned is the component normal to the yarn surface.Hence, the air-drag force per unit length can be written as
AD = 1/2 ρAξd VN2 (8.14)
where ρA = density of air
© 2003 by CRC Press LLC

ξ = drag coefficientd = yarn diameter
VN = normal velocity component of the element dl as it passes through the air
Drag coefficient ξ is a function of the relative velocity, yarn diameter, and thekinematic viscosity of the air. However, in many calculated approximations for AD,ξ is assumed to be constant. Yarn diameter d is the diameter of a smooth cylinderwith equivalent air drag. This may be termed the effective diameter. Mack and Smart4
found that, because of yarn hairiness, d varied with balloon speed. However, for thewidest range of speeds, d did not greatly differ from the microscopic measured value.
The remaining two forces, weight of element and resistance to bending, may beassumed negligible in comparison with the other forces present.
8.2.3.1 Balloon Tension in the Absence of Air Drag
Since the balloon tension changes from one given point in the balloon length toanother, to obtain an equation for the balloon tension at a point, we consider theforces acting on any element of the yarn balloon in the absence of air drag (seeFigure 8.617). The figure shows that, in this situation, the curve of the balloon lengthis in the x–z plane. Since the yarn axis lies within this plane, we can call it the axialplane.
Let dl be the element of length under consideration. If m is the mass per unitlength of the yarn, then forces acting will be the centripetal force, C = mdlxω2; thetension at both ends of dl, T, and T + ∆T; the weight of the element acting verticallydownward, w = mdlg; and the Coriolis force.
To y
xTT
dl
T + ∆T
ϕ
ψ
x
R
H
z
FIGURE 8.6 Yarn balloon in the absence of air drag.
© 2003 by CRC Press LLC

In ring spinning, the rotational velocities are much higher than the velocity ofthe yarn along the thread line, so the Coriolis force can be neglected. It can also beassumed that the weight of the element is negligible as compared with the otherforces present. For steady balloon shape, we can equate the resolved componentsof the remaining forces.
[T sin ϕ +d(T sin ϕ)] – T sin ϕ = 0
or
d(T sin ϕ) = 0 (8.15)
T cos ϕ – [T cos ϕ + d(T cos ϕ)] = mdlxω2
or
d(T cos ϕ) = –mdlxω2 (8.16)
Also,
cos ϕ = (8.17)
Using and , the equations become
i.e.,
dϕ/tanϕ = –dT/T (8.18)
and
T sin ϕ dϕ – cos ϕ dT = mdlxω2 (8.19)
From Equation 8.18, substituting for dϕ in 8.19,
–dT/cos ϕ = mdlxω2
dxdl------
d UV( )dϕ
----------------- VdVdϕ------- U
dVdϕ-------+= d
dl-----
dϕdl------ d
dϕ------⋅=
ϕsindTdϕ------- T ϕcos+ 0=
ϕcosdTdl------- T ϕsin
dϕdl------– mxω2–=
© 2003 by CRC Press LLC

and from Equation 8.17,
–dT = m ω2 x dx
Integrating, we get
T = TO – mx2ω2 (8.20)
Integrating Equation 8.18,
log sin ϕ + constant = –log T + constant, or
sin ϕ/sin ϕ0 = (8.21)
where ϕ0 = the angle of yarn element just below the lappet guide
Equations 8.20 and 8.21 describe the tension variation along the balloon lengthin the absence of air drag. The tension is a maximum at the thread guide and aminimum at the maximum balloon radius. It should be noted that the high tensionat the guide is a disadvantage, because it restricts the twist propagation to the frontrollers of the drafting system. The yarn length from the guide to the front rollers istherefore susceptible to peak tension fluctuations, particularly if the mean value ofTO, and thereby TS, is high.
8.2.3.2 Spinning Tension in the Absence of Air Drag
We see from Figure 8.6 that, in basic ring spinning, the balloon shape is approxi-mately half a cycle, i.e., H = 1/2 λ. Referring to Equations 8.1 and 8.2, Ta = TO (inunits of newtons), the tension in the yarn balloon at the lappet guide, m, is mass perunit length (in units of kg/m), ƒ = Nt (in units of s–1).
Thus, TO can be obtained from rearranging the equations to give
λ = π P (8.22)
where
P = (8.23)
and
ω = 2 πNt (8.24)
Hence,
H = π P (8.25)
12---
T O
T------
12---
T O ω2m⁄[ ]12---
© 2003 by CRC Press LLC

Equation 8.23 can be rewritten in terms of yarn count, Tt, in tex to give
where K is an appropriate constant. Knowing TO, the spinning tension, TS can befound from Equation 8.3.
Figure 8.6 and Equation 8.20 show that, when x = R,
TR = TO – mR2ω2 (8.26)
Hence, Equations 8.12 and 8.26 give
(8.27)
This equation shows how TO, and thereby TS, is also dependent on the winding angle,the traveler mass and angular velocity, and the coefficients of friction of the ringand traveler and the yarn and traveler.
Figure 8.7 depicts how, theoretically, the ratio TR /C ≅ TO /C varies with φ, µ, andχ.17 It is evident that all the tensions decrease similarly with these parameters. Thedashed curve depicts the deviation of experimental values, which is attributed to theeffect of air drag neglected in the analysis.
8.2.4 THE EFFECT OF AIR DRAG ON YARN TENSIONS
In the absence of air drag, the balloon length lies in the x–z plane, i.e., the verticalor axial plane. With the presence of air drag, the yarn becomes inclined to the axialplane in such a way that, moving from the lappet guide to the ring, each succeedingelement of length is more inclined. We therefore have to consider the balloon lengthin three-dimensional space as shown in Figure 8.5, where r instead of x now denotesthe distance of each element of length from the z-axis.
A rigorous analysis of the effect of air drag on the yarn tensions involvesdetermining how the angles θ1 through θ4 in Figure 8.2 vary as φ changes duringwinding. This involves complex mathematics, which may be circumvented by a verysimplified approach.2
We saw that, in the absence of air drag, there was effectively only a verticalcomponent of tension in the balloon length, which corresponded to the windingtension needed to overcome the ring-traveler friction. Since air drag inclines theballoon length, its effect is to introduce a horizontal component of tension, causinga corresponding increase in the winding tension. Essentially, then, we can assumethat the presence of air drag introduces a tension component in the balloon length,which is added to the frictional drag of ring on traveler to resist the traveler motion.If D is this added resisting force, Equation 8.8 can be modified to give
P KT O
Nt2T t
------------
12---
=
12---
T OχµC
sin2φ χµ( )2–( )[ ]12---
µ φcos+ -------------------------------------------------------------------------
12---mR2ω2+=
© 2003 by CRC Press LLC

(8.28)
To derive D, we to consider the tension components in an element of balloon lengthdl at distance r (see Figure 8.8). The air-drag force is given by Equation 8.14 and,from Figure 8.8, VN = rω cos α.
The mechanical power to overcome the air drag on dl is
1/2 ρAξd r3ω3 dl cos2 α
For the full balloon length, we integrate from 0 to Lb
1.2
1.0
0.8
0.8
0.6
0.6
0.4
0.4
0.2
0.2
0
0 1
0 20° 40° 60° 80°
Package Radius/Ring Radius
µ − 0.6, χ = 1
µ − 0.4, χ = 1
µ − 0.5, χ = 0.3
µ − 0.2, χ = 1
µ − 0.4, χ = 0.3
µ − 0.2, χ = 0.3
TRC
Winding Angle
FIGURE 8.7 Yarn tension as a function of winding angle φ and friction coefficients.
T Rχ µC D θ4cos+( )
φsin θ4cos µ φcos χ µ θ1cos θ4cos θ2cos+[ ]–+ --------------------------------------------------------------------------------------------------------------------------=
1 2⁄ ρAξdω3 r3
0
Lb
∫ cos2α dl
© 2003 by CRC Press LLC

Now, if TRA is the tension in the balloon length at the position of the ring, causedby air drag, the above expression will be equal to TRA cos θ2 R ω. Thus,
(8.29)
All the parameters of the integral depend on the balloon shape and therefore on TRA.For a simplified solution to the integral, we may assume that the balloon is sinuso-idal,2 so r = rmax sin(2πz/λ), and also that the air-drag force acts in the horizontalplane, so α = 0.
Using dl2 = dr2 + dz2 and H = λ/2, then, substituting for dl and r, Equation 8.29can be now be rewritten as
and on integrating,
(8.30)
Assuming that θ1 = 90° and θ3 = 90 − θ2, which closely approximates the practicalsituation, Equation 8.28 becomes
(8.31)
where D = as given by Equation 8.30
r
α
ωVN
FIGURE 8.8 Relationship between air drag force and normal component of air velocity.
T RA θ2cosρAξdω2
2R------------------- r3cos2α[ ] ld
0
Lb
∫=
T RA θ2cosρAξdω2
2R------------------- rmax
3 sin3 2πz/λ( )2H 14π2rmax
2
λ2------------------cos2 2πz/λ( )+
1 2⁄
dz/λ( )0
Lb
∫=
T RA θ2cosρAξdω2Hrmax
3
4R---------------------------------- D= =
T R θ2cosχ µC D θ4cos+( )
φ θ4cossin µ φcos+----------------------------------------------- D= = =
© 2003 by CRC Press LLC

The yarn tensions, TW , TO, and TS can be therefore calculated with Equations8.3, 8.4, 8.26, and 8.28.
8.3 BALLOON PROFILES IN RING SPINNING
The importance of predicting the balloon shape from set parameters of the spinninggeometry was explained at the start of this chapter. With respect to balloondynamics, the important parameters of the spinning geometry are the balloonheight, H, the ring radius, R, the spindle rotational speed (more correctly, thetraveler speed), ω, and the spinning tension, which is largely governed by thetraveler mass.
The objective is to choose these parameters so that we can obtain an acceptablespinning package size without incurring increased unit cost of production or reducedyarn quality. It is therefore useful to have some means of determining if certaincombinations of the spinning geometry parameters will give a stable balloon (i.e.,H ≈ 1/2λ). One approach would be to theoretically derive a relationship where theradius, r, of any element of the ballooning yarn length is given as function of thedistance, z, along the common axis from the origin, which is the lappet guide. Forgiven spinning parameters, such an equation would enable graphs to be plotted ofspinning balloons.
Mack5 developed the set of differential Equations 8.32 to 8.35, given inTable 8.1, for the three-dimensional motion of an element, dl, of ballooning yarnlength l, based on the forces discussed above acting on the element during spinning.The variables x, y, z refer to the Cartesian coordinates. Mack’s equations do notaccount for movement along the thread line and so effectively assume the circulatingballoon length to be a constant length between the lappet and the traveler. This maybe called a tied-balloon model. A more recent model, proposed by Lisini et al.,6
uses partial differential equations to take account of the effect of ring rail motionand variations in traveler speed. However, the simplifying assumptions that applyto the tied-balloon model facilitate an easier and more practical understanding ofthe spinning balloon.
These equations can only be solved directly by numerical integration, for exam-ple, using the Runge–Kutta method.8,9 By carrying out the following multiplicationand addition: (8.32)(dx/dl) + (8.33)(dy/dl) + (8.34)(dz/dl), we get dT/dl + mω2 (xdx/dl+ ydy/dl) = 0, and this can be integrated to give T = TO – 1/2 mω2 [x2 + y2]. Usingthis and dividing x, y, and z by P from Equation 8.23, we get the nondimensionalforms X = x/P, Y = y/P and Z = z/P, λ = KP/m. Similarly, L = l/P and R = r/P, wherel refers to the balloon length and r the radius of any point on the balloon from theaxis z. Thus, Equations 8.32 to 8.35 can be converted to the simpler form ofEquations 8.36 to 8.38 using X = R cosδ and Y = R sin δ, where δ is the angle ofdeviation of the balloon element from x–z plane. These equations enable analyticalsolutions to be made that can be used to make adequate predictions of balloonstability. The approach that is used is to first establish predicted balloon shapes orprofiles in the absence of air drag and then to modify these for the presence of airdrag.
© 2003 by CRC Press LLC

8.3.1 BALLOON PROFILES IN THE ABSENCE OF AIR DRAG
We saw that, when considering balloon tensions, for the situation of no air drag, theballoon length may be assumed to be within the axial plane (see Figure 8.6). Theangle δ = 0, λ = 0, and Equation 8.36 becomes
d/dL [1 – 1/2 R2] dR/dL + R = 0 (8.39)
TABLE 8.1Differential Equations of Motion of a Ballooning Yarn Element5
(8.32)
(8.33)
(8.34)
(8.35)
TABLE 8.2Converted Equations of Motion of a Ballooning Yarn Element5
(8.36)
(8.37)
(8.38)
ddl----- Tdx/dl( ) mxω2 Kω2 x2 y2 x dy/dl ydx/dl–( )2–+ + +
1 2⁄
ydxdl------ xdy/dl( ) ydx/dl–+ 0=
ddl----- Tdy/dl( ) myω2 Kω2 x2 y2 x dy/dl y dx/dl–( )2–+ + +
1 2⁄
x–dydl------ xdy/dl ydx/dl–( )+ 0=
ddl----- Tdz/dl( ) 0 Kω2 x2 y2 x dy/dl y dx/dl–( )2–+ 1 2⁄
+ +
dzdl----- xdy/dl ydx/dl–( ) 0=
dx/dl( )2 dy/dl( )2 dz/dl( )2+ + 1=
ddL------ 1 R2/2–( )dR/dL R 1 R2 2⁄–( )– R dδ/dL( )2+
+λR3dRdL------- dδ
dL------ 1 R2 dδ/dl( )2– 1 2⁄⋅ 0=
ddL------ R2 R4/2–( )dδ/dL λR3 1 R2–( ) dδ/dL( )2 3 2⁄
– 0=
dR/dL( )2 R2 dδ/dL( )2dz/dL( )2+ + 1=
© 2003 by CRC Press LLC

Using d(UV)/dx = UdV/dx + VdU/dx, we get
–R(dR/dL)2 + (1 – R2)d2R/dL2 + R = 0 (8.40)
Multiply Equation 8.40 by (1 – R2) and, using the relationship
we can integrate Equation 8.40 with respect to R, and since dR/dL = sin ψ when R= 0 (where ψ is the angle of the tangent to the balloon at lappet guide), then
R2 – R4/4 + [1 – R2/2]2(dR/dL)2 – sin2 ψ = 0
or
(8.41)
When δ = 0, Equation 8.38 gives
If the coordinates R and Z are used in preference to X and Z, then
R = 2 sin ψ sin ζ
and
which, on integrating, in the usual notation for elliptic integrals, gives
Z cos ( ψ) = cos ψ F tan( ψ), ζ (8.42)
For most situations, ψ < 65°, and an approximate solution to 8.42 for a plot ofR against Z is of a sinusoidal wave,
12---
12---
d2R/dL2 12---
d dR/dL( )2
dR--------------------------=
dRdL-------
2 sin2ψ R2 R4/4+–
1 R2/2–[ ]2-------------------------------------------=
dZdL-------
2
1 dR/dL( )2– cos2ψ1 R2/2–[ ]2
----------------------------= =
12---
dZdζ-------
dZdL-------
dLdR-------
dRdζ------- cosψ
cos12---ψ
1 tan2–12---ψ
sin2ζ------------------------------------------------------------------------= =
12--- 1
2---
© 2003 by CRC Press LLC

R = 2 sin( ψ) sin[Z cos ( ψ) ƒ(ψ)]/cos ψ (8.43)
where ƒ(ψ) = F(tan( ψ), π), for which values are given below.
The above solution is attributed by Mack,5 and Figure 8.917 shows a set of balloonprofiles obtained from this solution. Gregory and Smart10 have confirmed the validityof the solution for the case of negligible air drag.
Various approximate solutions of the balloon equation have been reported, mostof which circumvent dealing with the elliptic integral. We shall now consider severalof these, as they help us to further understand the nature of spinning balloons.
Lindner11 assumed spinning balloons, in the absence of air drag, to be long andnarrow so that dl is not much greater than dz. Then, referring to Figure 8.6, T sin ϕ= constant = Tb, the tension at maximum balloon radius. Also, d(Tb cos ϕ) = mω2
r dz, and cos ϕ = dr/dz. Thus, . This is a differential equationof simple harmonic motion that has the solution
ψo 0 5 10 15 20 25 30 35 40
ƒ(ψ) 1.000 1.000 1.002 1.004 1.008 1.013 1.019 1.026 1.034
ψo 45 50 55 60 65 70 75 80 85
ƒ(ψ) 1.048 1.062 1.081 1.104 1.134 1.175 1.234 1.325 1.501
12--- 1
2---
2π--- 1
2--- 1
2---
0 0.4 R 0.8 1
ψ = 10 15 2025 30 3540
45 5055 60
6570
FIGURE 8.9 Balloon profiles based on Mack’s solution.
d2r dz2⁄ mω2r T b⁄–=
© 2003 by CRC Press LLC

(8.44)
This solution is also reported by Crank,7–9 Grishim,12 and Honneger and Fehr13 andis claimed to give agreement with measurements of photographic images of balloons.
Bracewell and Greenhalgh14 reported the case of long-lift, large-package spin-ning. They assumed that the associated balloons can be modeled by the Cartesianequation for a catenary. The result obtained was in good agreement with observationsof balloon profiles for long-lift, large-package, ring-spinning systems.
De Barr15 assumes balloon profiles to be sinusoidal and then develops the conceptof the balloon profile being a standing wave system identical to circularly polarized,transverse vibrations of a string. De Barr’s approach merits full consideration, as itis much less mathematical and gives comparable results to Mack’s5 more rigoroustreatment.
First, the concept of circularly polarized, transverse vibrations should be furtherexplained. When a string fixed at both ends is vibrated in, for example, the x–zplane, it will form a standing wave (a plane-polarized vibration) if its length equalsan integral number of half-wavelengths. This is a classical experiment demonstratedby Melde in which one end of a string was attached to a vibrating tuning fork whilethe other was fixed. If the string is made to vibrate simultaneously with the samefrequency in y–z plane, the string will move according to the resulting superpositionof the two component vibrations. Thus, the movement of each point on the stringwill be the sum of two simple harmonic vibrations at right angles. If the amplitudesof the vibrations are equal and out of phase by 90°, then the motion of each pointin the string will be circular about a central axis. We now have a circularly polarizedstanding wave instead of a plane-polarized one. The radius of the circle at pointsalong the string, i.e., from the z-axis, will vary sinusoidally.
Since the idea is to use circularly polarized standing waves to represent thespinning balloon, Equations 8.1 and 8.2 can be used in relation to the balloon. Anapproximation of a balloon shape can be obtained once the amplitude and wavelengthare known. For a given frequency, the speed of propagation, c, and thereby thewavelength, λ, of a vibrating string decrease with increased amplitude. De Barrapplied Rayleigh’s principle16 (that the mean kinetic and potential energies of avibrating system are equal) to obtain Figure 8.10,17 showing the decrease in wave-length with increasing amplitude. Thus, for a range of arbitrary chosen λ values,various balloon profiles can be plotted from the following equation:
r = A sin(2πz/λ)
or, nondimensionally,
r/P = A sin(2πz/Pλ) (8.45)
where r = balloon radiusA = amplitudez = distance along the common axis of spindle, ring, and spinning balloon
r A sinmω2
T b
----------
12---
z=
© 2003 by CRC Press LLC

An alternative approach is to use Equations 8.20 and 8.21. Noting that, in theabsence of air drag, r = x, these equations can be combined to give
sin ϕ (TO – 1/2 mr2ω2) = TO sin ϕ0 (8.46)
Equation 8.46 gives the inclination of the balloon length at any radius and thereforeenables the balloon shapes to be determined. At the maximum radius, ϕ = 90° andhence, from Equations 8.21 and 8.46,
T = TO sin ϕ0 (8.47)
and
r2max = 2 TO (1 – sin ϕ0)/mω2 (8.48)
De Barr found that using Equations 8.46, 8. 47, and 8.48 gave balloon shapessimilar to Mack’s solutions. The balloon shapes calculated from these equationsdiffer slightly from the sinewave Equation 8.45, as illustrated in Figure 8.11.17
However, observations have shown that Equation 8.45 gives a better representationof actual balloons shapes, and this is attributed to effects of air drag.15
8.3.2 THE BALLOON PROFILE IN THE PRESENCE OF AIR DRAG
We must remember that the purpose of determining the balloon shape is to ascertainthe spinning conditions that would result in balloon collapse, i.e., the tendency fora half-wavelength balloon profile to change to a profile with a second nodal point.If the balloon collapses onto the spindle, spinning cannot continue. Before describing
8P
6P
4P
2P
2πP
00 0.2 0.3 0.4 0.50.1
AmplitudeWavelength (λ)
Wav
elen
gth
(λ)
FIGURE 8.10 Decrease in wavelength with increasing amplitude.
© 2003 by CRC Press LLC

how the optimal conditions to prevent balloon collapse can be ascertained from agraph of a series of balloon profiles, it is useful to address the effect of air drag onballoon profiles.
When simplifying the differential equations of balloon motion, given inTable 8.2, δ was referred to as the angle of deviation of a balloon element, dl, fromthe x–z plane. In discussing the effect of air drag on balloon tension, it was explainedthat the effect of the air was to introduce a tangential tension component in eachyarn element. It is this tension that causes the angle of deviation. The componentof tension is greater for yarn elements closer to the ring and traveler. Therefore, asFig 8.1217 illustrates, the angle of deviation, δ, of the balloon length increases towardthe ring and traveler.16
Equation 8.14 shows that resistance of the air to the rotation of the balloon isproportional to the square of the normal component of yarn velocity relative to theair. However, if the tension in the yarn attributed to the ring and traveler is high, thetangential component induced by the air drag will be low, and δ will be small.
Dividing Equation 8.14 by P/m gives the nondimensional form for the air drag,
γ = mAD /P = 1/2 ρAξd mVN2/P (8.49)
Figure 8.13 shows the projections onto the axial plane (i.e., z–x or z–r plane,when x = r) of several balloon profiles for various values of γ.17 Comparing the
0
1
2
3
xP
0.2 0.4 0.6rp
FIGURE 8.11 Decrease in wavelength with increasing amplitude.
© 2003 by CRC Press LLC

(A) No Air Drag (B) Air Drag Present
FIGURE 8.12 Shape of yarn balloon in absence of air-drag and the effect of air drag.
0
1
2
3
4 0 0.1 0.2 0.3Balloon Radius r p
Bal
loon
Hei
ghtz
p
Bal
loon
Hei
ghtz
p
Balloon H
eight xp
Balloon Radius rp
Balloon Radiusr p
0
1
1 10
1 10
2
3
4
5
6
0
1
2
3
4
5
6
Rmax
Effect ofAir Drag onNodal Point
FIGURE 8.13 Projections of balloon profiles on to axial plane.
© 2003 by CRC Press LLC

profiles for γ = 0 (no air drag) with the other values, it becomes evident that, whilethe air drag is small, the balloon profiles are little affected by the air drag exceptnear the nodes. In particular, the maximum balloon radius seems unaffected by airdrag. De Barr17 found that, to a first approximation, the maximum balloon radiusdepends only on the yarn count and the ring radius.
It can be seen from Figure 8.13 that, instead of a nodal point, the air drag causesthe balloon profile to narrow to a minimum radius referred to as a neck. One wayof explaining the reason for this is that, at any element of the balloon length, workis required per revolution to overcome the air drag on the yarn length from the lappetguide to the element. This work is equal to the product of the tangential componentand the circumference of the circular path described by that element. Hence, wherea nodal point would occur, there has to be a minimum radius. The neck is, however,smaller than the ring bobbin radius, and contact between the two causes the balloonto collapse.
It is evident from Figure 8.13 that, in causing a neck to be formed, the air dragextends the wavelength, i.e., the value of z/P that equals 1/2 λ. This would tend tosupport De Barr’s proposition that the sinusoidal waveform of Equation 8.45 givesa better representation of spinning balloons or, more correctly, their projections ontothe axial plane.
8.3.3 DETERMINATION OF RING SPINNING BALLOON PROFILES BASED ON SINUSOIDAL WAVEFORMS
Figure 8.14 shows a range of sinewaves obtained by De Barr’s simplified approach,from which the profile of a stable balloon can be determined for known values ofballoon height, H, and ring radius, R.17 Using the nondimensional form, the balloonshape is given by that curve on which the point H/P (= z/P), R/P (= r/P) lies. Asindicated, R and H define the angle β (tanβ = R/H) between the common axis andthe line linking the apex (the lappet guide) and the point H/P, R/P. The importanceof β is that it indicates the possible range of balloon profiles for a particular spinninggeometry. Balloon profiles predicted by De Barr’s approach are shown in Figure8.15 along with observed values of maximum radii, and there is sufficiently goodagreement to make this method of practical use.17
From Equation 8.23, P is dependent on the spinning tension, the traveler speed,and yarn count, and changes in these parameters will lead to a change of positionof the point H/P, R/P along the line tan β. The actual balloon size will depend onP; the smaller this value, the greater the maximum radius. For any combination ofH and R, there is a minimum P below which a neck is formed.
Since P will fluctuate as the parameters of Equation 8.23 fluctuate, it is importantthat the point H/P, R/P be carefully chosen. It can be seen from Figure 8.14 that, inthe region just below the maximum radii, the profiles come close together. In thisregion, quite small changes in P can result in significant changes in the balloonprofile and maximum diameter. To produce the largest possible package for a givenring radius, yarn count, and tension, the point H/P, R/P would be chosen close tothe boundary for a necked balloon formation. However, allowance should be givenfor fluctuation that would reduce P and thereby cause balloon collapse.
© 2003 by CRC Press LLC

8.3.4 EFFECT OF BALLOON CONTROL RINGS
It can be seen from Figure 8.14 that, with a given spindle speed, yarn count, andR, for balloon collapse to be avoided with increased H, P must be increased tomaintain a constant H/P. This means increasing tension TO. For any yarn, there willbe a limit beyond which end breaks occur. In Chapter 6, it was explained that theuse of balloon control rings to divide the balloon length into two or more partsenables H to be increased without excessively increasing TO. Thereby, larger ring-spinning packages can be made. For optimal effectiveness, control rings are ofequal internal diameter to that of the ring, and they must be suitably positioned tokeep balloon collapse from still occurring. The simple example is of a single controlring positioned such that two half-wavelengths of equal maximum radius areobtained (see Figure 8.1617).
The increased balloon length resulting from the use of control rings, and thefriction between the length and the rings, result in an increased winding tension.This means that, to obtain a specific level of winding tension for a firm package, alighter traveler can be used, which reduces the frictional drag of ring on travelerand, consequently, the spinning tension, TS. A further advantage of control rings isthat they damp tension fluctuations reaching the spinning zone, and such fluctuationscould cause end breaks.
rp
0
1
2
3
0.4 0.4 0.6 0.8 10.2 0.20
x p
β
FIGURE 8.14 Determination of balloon shapes in ring spinning.
© 2003 by CRC Press LLC
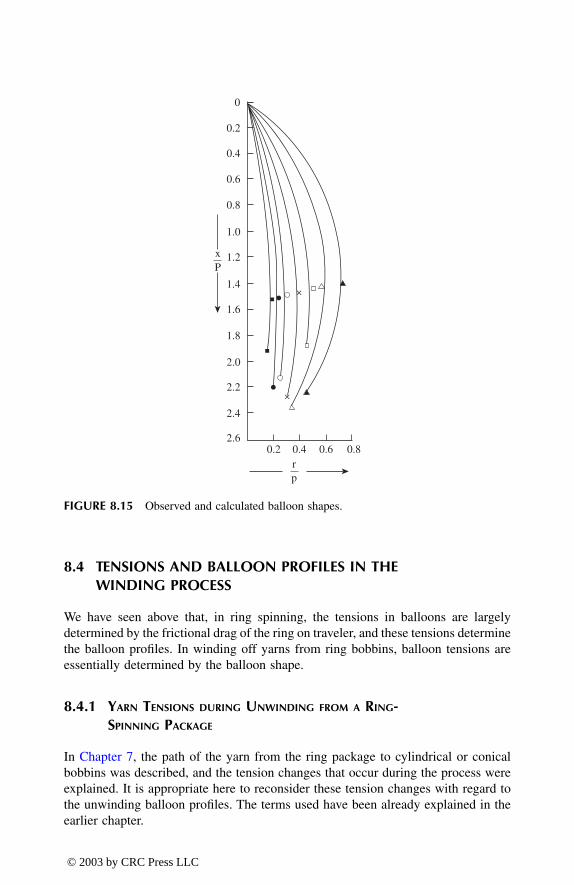
8.4 TENSIONS AND BALLOON PROFILES IN THE WINDING PROCESS
We have seen above that, in ring spinning, the tensions in balloons are largelydetermined by the frictional drag of the ring on traveler, and these tensions determinethe balloon profiles. In winding off yarns from ring bobbins, balloon tensions areessentially determined by the balloon shape.
8.4.1 YARN TENSIONS DURING UNWINDING FROM A RING-SPINNING PACKAGE
In Chapter 7, the path of the yarn from the ring package to cylindrical or conicalbobbins was described, and the tension changes that occur during the process wereexplained. It is appropriate here to reconsider these tension changes with regard tothe unwinding balloon profiles. The terms used have been already explained in theearlier chapter.
0
0.2
0.4
0.6
0.8
1.0
1.2
1.4
1.6
1.8
2.0
2.2
2.4
2.60.2 0.4 0.6 0.8
xP
+
+
rp
FIGURE 8.15 Observed and calculated balloon shapes.
© 2003 by CRC Press LLC

Figure 8.17 depicts the instantaneous profile of the balloon at the start of over-end unwinding. The point of unwinding is the contact point of the balloon with thepackage. In the early stages of unwinding from a cop-build ring package, the yarnlength between the point of unwinding and the thread guide will form either a single-node or a multiple-necked balloon. The number of necks formed will depend on thespeed of unwinding, the height of the tread guide above the package (i.e., H), theballoon height, the yarn count, and the package radius, RP . Whereas the amplitudeof the waveform is constant, the radius of the neck decreases toward the threadguide. As explained earlier for ring spinning, it is the tangential component of tensioninduced in the yarn by air drag that is responsible for a neck forming rather than atrue node. This component of tension increases with distance from the thread guidedown to the package. Consequently, the radius of each neck becomes greater thanthe preceding one when moving down the thread line toward the package. Mack5
has shown that the radius of the nth neck is n times the radius of the first. Figure 8.18illustrates the situation for a typical three-neck profile.
YarnBalloon
Ring AndTraveler
BalloonControlRing
RingSpindle
60
30
0
60
30
0
0 2 4 6 8 10Time (Minutes)
Yarn Tension During Spinning
Free Balloon
Restraining Ring
Ten
FIGURE 8.16 Effect of balloon control rings.
© 2003 by CRC Press LLC

UnwindingPoint
ThreadGuide
Initial Shape of Yarn
Shoulder
Nose
Balloon
Ring SpinningPackage
FIGURE 8.17 Balloon profile at the start of unwinding from ring-spun yarn package.
Single Neck Balloon Treble Neck Balloon
Neck Pointsof Balloon
FIGURE 8.18 Treble-neck balloon profile.
© 2003 by CRC Press LLC

The mean unwinding point of the cop-build package moves down the packagelength, from (a) to (f), etc., as the removal of the yarn proceeds, and this increasesH (see Figure 8.19). A point will be reached where the neck nearest the bobbinpackage (i.e., the package core) coincides with the bobbin diameter, and a two-neckprofile results. With further yarn withdrawal, the unwinding point moves within thebase region of the bobbin, and a single-node balloon is formed.
Figure 8.20 indicates the changes in the unwinding tension, TU, measured abovethe thread guide. If TO is the tension at the thread guide during the yarn withdrawal,Equation 8.3 applies, with TU replacing TS. The mean tension and the variation intension are of importance. The high-frequency or short-term variation at the start ofunwinding comes from fluctuations in H associated with the unwinding point tra-versing the short length from nose to shoulder of the package. The change from athree- to a two-neck profile corresponds a substantial increase in the balloon wave-length and causes the step increase ∆TO1 in the mean tension. The subsequent changeto a single-node balloon causes the second step increase ∆TO2. It is clear that, betweenthe step changes, the mean tension increases continuously, but the rate of increaseafter ∆TO1 is higher, and the size of the fluctuations is much greater. Following thechanges in the balloon profile, the contact point of the balloon length with thepackage is no longer also the unwinding point. The yarn length being uncoiled isnow dragged over a section of the cleared bobbin surface prior to becoming part ofthe balloon length. The mean unwinding tension increases because of the frictionaldrag of the yarn on the bobbin surface.
The increased intension limits the maximum unwinding speed because of a highfrequency of end breaks. Figure 8.20 also illustrates the use of computer controldrive system, the Autospeed, which uses an optical sensor unit to determine the
(a) (d) (e) (f)(b) (c)
FIGURE 8.19 Changes in balloon profile during unwinding.
© 2003 by CRC Press LLC

amount of yarn on individual yarn packages and then adjusts the speed profile toprevent the step increase in tension toward the end of package unwinding. As shown,significantly higher unwinding speeds can be achieved.
Figure 8.21 illustrates the path taken by the yarn as it slides over the bobbinsurface.17 There is a gradual change in direction of the path on the bobbin to thedirection in which a yarn element becomes part of the balloon. At the point of contactof balloon and bobbin, the angle of inclination, ϑ, of the yarn path on the bobbinsurface to the tangent of the bobbin radius is therefore the same as that at the startof unwinding. The friction between yarn and bobbin maintains this equilibrium.Padfield18,19 showed that the tension in the balloon at this contact point is largelydue to this friction and is given by
TF = 2 (TO – mv2) sin2 ϑ (8.50)
where v = the linear unwinding velocity of the yarn
In ring spinning, TR is the tension in the yarn balloon at a similar position. In makinga comparison with ring spinning, tension TF and the tension resulting from the balloonprofile have importance in how they relate to TO and thereby TU. It is therefore appro-priate to consider now the tension due to the balloon profile and the associated forces.
150014001300120011001000900800700600500400300200100
150014001300120011001000900800700600500400300200100
00 1 2 3 min
00 1 2 3 min
100
8060
40
20
0
m min−1
Unwinding Speed
∆T 01∆T 02
AutoconerAutospeed
cN
100
8060
40
20
0
cN
FIGURE 8.20 Changes in unwinding tension. (Courtesy of W. Schlafhorst AG & Co.)
32--- 1
2---
© 2003 by CRC Press LLC

When an element of yarn is pulled from the yarn package through the threadguide, its rotational and translational kinetic energies change along the path. Thesechanges are caused by forces that give rise to the yarn tension.
The early part of this chapter explained that, in moving from one radius toanother, the change in kinetic energy of rotation is caused by Coriolis forces. Withthe high linear yarn velocities used in the winding process, the Coriolis forces aremuch greater than in ring spinning and now are not negligible. The balloon profilein winding depends, then, on the relative magnitudes of the air drag and Coriolisforces. For any yarn element of the balloon, the component of Coriolis force asso-ciated with the tangential component of velocity is greater than the air-drag force.However, the air-drag forces are cumulative from one end of the balloon to the other,whereas the Coriolis forces above and below the maximum radii are of oppositesigns. At the package, therefore, the tangential component of tension is effectivelythe total air drag on the balloon. Near the thread guide, the Coriolis forces will begreater than the air-drag forces, and each yarn element of the balloon will lag behindthe element above it. The reverse occurs near the package, where air-drag forcesdominate (see Figure 8.21).
The kinetic energy of rotation of the yarn is zero on the package and, effectively,also at the thread guide. Therefore, there is no change in this kinetic energy in theprocess, so Coriolis forces do not contribute to TO , even though they influence thetension in any considered yarn element of the balloon.
The translational kinetic energy results from the force required to accelerateeach yarn element from its stationary position on the package to the linear velocity,v, along its length as it leaves the package. This force is provided by a componentof tension in the yarn of magnitude 1/2 mv2 sec , m being the mass of the element,and is constant over the length of the yarn.
FIGURE 8.21 Yarn path on bobbin surface.
ϑ
© 2003 by CRC Press LLC

With respect to the above points, we can say that the pulling of the yarn throughthe thread guide causes work to be done to
• Accelerate the yarn to the unwinding velocity (i.e., the linear velocity v)• Overcome the frictional drag of the package on the yarn• Overcome air-drag on the balloon length
The rate at which the work is done is given by vTO. The work rate against air drag is
(8.51)
where L = total length of yarn in the balloonr = radius of rotation of the element dl
Since v = RPω, the air drag contributing to the yarn tension is
(8.52)
The tension at the thread guide To is the sum of the contributions of friction anddrag (Equation 8.50), air drag TA, and the acceleration of the yarn, 1/2 mv2 sec .Thus,
(8.53)
8.4.2 UNWINDING BALLOON PROFILES
The description given earlier of the three-neck balloon profile was a specific example.To determine the balloon profile of the unwinding yarn by performing a rigorousanalysis of the acting forces requires the inclusion of the parameters for Coriolisforces in the differential equations of motion given in Table 8.1, and then withboundary conditions specific to the case of over-end unwinding, solving the equa-tions numerically. A less exact but much simplified alternative is to use De Barr’sapproach18 of the approximation of the sinusoidal projection on to the axial plane(z–r plane). In this case, the balloon profile for unwinding will correspond to thelargest profile associated with given values of RP/P and H/P.
REFERENCES
1. Escher, R., Theory of the ring spindle, Der Civiingineur, 1883, 29, 448.2. De Barr, A. E., A descriptive account of yarn tensions and balloon shapes in ring
spinning, J. Text. Inst., 49, T58–T88, 1985.
1 2⁄ ρAξ r3d ω3 ld0
L
∫
T A
mv2ρAξd
2mRP3
---------------------- r3
0
L
∫ dl=
ϑ
T O mv2 ϑρAξd
2mRP3
-------------- r3
0
L
∫ dl 2 T O 3 2⁄ mv2–( )sin21 2⁄ ϑ 1 2⁄+ +
sec=
© 2003 by CRC Press LLC

3. Wool Research, Vol. 6, WIRA/British Textile Technology Group, Leeds, U.K.4. Mack, C. and Smart, E. J. L., J. Text. Inst., 45, T348, 1954.5. Mack, C., Theoretical study of ring and cap spinning balloon curves (with and without
air-drag), J. Text. Inst., 44(11), T483–T498, 1953.6. Lisini, G. G., Toni, P., Quilghini, D., and Campedelli, V. L. D., A comparison of
stationary and non-stationary mathematical models for the ring-spinning process, J.Text. Inst., 4(83), 550–559, 1992.
7. Crank, J., A theoretical investigation of cap and ring spinning systems, Text. Res. J.,23, T266, 1953.
8. Crank, J. and Whitmore, D. D., The influence of friction and traveller weight in ringspinning, Text. Res. J., 24, T1006, 1954.
9. Crank, J. and Whitmore, D. D., Balloon diameter and thread tensions calculated fordifferent cap spinning conditions, Text. Res. J., 23, T657, 1953.
10. Gregory, J. and Smart, E. J. L., The ballooning thread apparatus, J. Text. Inst., 46,T606, 1955.
11. Lindner, G., Leipziger Monatscherft fur Textil Industrie, 213, 1910.12. Grishin, P. F., Platt’s Bulletin, 8, 161, 240, and 333.13. Honneger, E. and Fehr, A., Effect of accessory influences on ring spinning of cotton
and spun rayon, J. Text. Inst., 38, 353, l947.14. Bracewell, G. M. and Greenhalgh, K., Dynamical analysis of spinning balloon, J.
Text. Inst., 44, T266, 1953.15. De Barr, A. E., The physics of yarn tensions and balloon shapes in spinning, winding
and similar processes, J. Text Inst., 51, T17, 1960.16. De Barr, A.E., The role of air drag in ring spinning, J. Text Inst., 49, T58, 1958.17. De Barr, A. E., A descriptive account of yarn tension and balloon shapes in ring
spinning, J. Text. Inst., 49, T58–T88, 1958.18. Padfield, D. G., A note on friction between yarn and package, J. Text. Inst., 46, T71,
1955.19. Padfield, D. G., The motion and tension of an unwinding thread, I, Proc. Royal Soc.,
A245, 382, 1958.
© 2003 by CRC Press LLC

Fancy Yarn Production
The earlier chapters dealt with the production of yarns where the objective is to provide as regular and as parallel as possible an arrangement of fibers twisted together to form a continuous length of uniform thickness. Slubs, neps, thin places, and so on are noted as faults and imperfections and are viewed as degrading features of yarn quality. A great deal of care and effort is taken to minimize their occurrence by preventing or removing these features wherever possible. In fancy yarn production, these features are deliberately introduced into the yarn, along with color, to give visually and tex-turally attractive differences to fabrics. Some yarns that might be called fancy yarns have only color changes as distinctive features, obtained by a number of techniques such as twisting together different colored yarns, spinning irregularly blended dyed fibers or printed slivers, and irregularly printing already spun yarns. The production of such yarns will not be considered here, since the processes described in Chapters 2 and 3 are generally used to make them. In this chapter, the fancy yarns that are of interest are the ones that may be said to have, besides color changes, a specially structured profile and therefore conform to the following definition:
Definition: A fancy yarn is a yarn that is made with a distinctive irregular profile or a construction that differs from basic single and folded yarns, the objective of which is to enhance the aesthetics of the end product with respect to visual and textural properties.
Fancy yarns essentially give fashion touches to a fabric, and they have therefore a broad range of end uses — although not as wide as basic yarns. A significant market segment for fancy yarns is ladies’ outwear. Occasionally, they are used in men’s jackets, knitwear, and ties. Hand knitting is a popular end use, mainly for ladies’ and children’s knitwear. Fashion designers use fancy yarns as a means to diversify style. Therefore, furnishing is also an important market area, particularly in curtains and blinds, wall coverings, and upholstery.
Technically, producing fancy yarns is about creating distinctive features and combinations of these features. With the depth of available technology, the range is restricted only by imagination and commercial acceptance. This chapter gives a classification of the various structured effects and a description of the basic principles for producing such yarn features, as well as of the production machines employed.
9.1 CLASSIFICATION OF FANCY YARNS
Figure 9.1 gives examples of the many fancy yarn types that are commercially used. The list is not comprehensive, but it shows some of the more popular effects.
9
© 2003 by CRC Press LLC

FIGURE 9.1 (See color insert following page 266.) Examples of effect twist fancy yarns.(Courtesy of Saurer–Allma GmbH.)
© 2003 by CRC Press LLC

Various names are used to describe the different yarn effects. However, a careful study would show that many of the effects are variations on the eight basic profiles given in Table 9.1. These yarn effects can be made by plying a number of yarns together or, with modified spinning techniques, most can be spun from sliver or roving.
Several classifications for fancy yarns have been attempted.1–3 The one given here is a further development of these and is based on the different types of yarn features, termed effects, and on the methods of their manufacture.
Table 9.2 gives a classification for fancy yarns, which also indicates the two production methods employed. Yarn-produced effects are based on twisting or dou-bling yarns together to create the fancy yarn effect from already spun yarns. This is the conventional method for producing fancy yarns. Spun-effect yarns are fancy yarns spun directly from fibers fed to the spinning system.
TABLE 9.1Fancy Yarn Effects
Basic yarn profile Effect variations
Spiral Mock spiral, mouliné, jaspéGimp Frisé, caterpillar, ondéSlub Ground slub, injected slub, injected flame (also called tear-off flame)Knop Knot, nep, noppé, button, reverse caterpillar, flakeLoop Bouclé, frotté, prong, mock-spun chenilleCover Twisted flameChenille Woven chenille, plied chenilleSnarl
TABLE 9.2Classification of Fancy Yarns
Fancy yarn classification
Yarn (produced) effects Spun yarn effects
Regular effectsControlled
discontinuous effects Regular effectsControlled
discontinuous effects
Spiral Reverse caterpillar Spiral ButtonMouliné Neps Mouliné SlubLoop Knots Loop CaterpillarBouclé Knop Bouclé CombinationsFrotté Slub GimpGimp OndéOndé ChenilleSnarlCoverChenille
© 2003 by CRC Press LLC

As shown in the table, fancy yarns may be divided into regular and randomized effects. Regular effects are where the features appear uniformly along the yarn length. Some features, if made to appear at regular intervals along the yarn length, would cause pattern faults in the end fabric. Therefore, they have to be randomly spaced and are termed randomized effects. Both methods of yarn production can be used for regular and randomized effects.
9.2 BASIC PRINCIPLES
Let us now consider the basic principles for producing structured effects, with regard to the conventional method. The spun-effects method is based on similar principles. A suitable way to start is to refer to the general structure of a fancy yarn. Most consist of two or more of the following components as illustrated in Figure 9.2:
• A ground or core component• An effect component• A binder
The names of the components indicate the purpose of each in the final yarn structure. It is evident from Figure 9.2 that, to obtain a structured effect, a longer length of effect component, relative to ground components, must be present to form the required feature or effect. The buckling and twisting of the effect component onto ground components produce the aesthetic effect, and the twisting of the binder around the assembly locks the feature in place. The basic principle is therefore to feed the ground and effect components at different speeds into a twisting element, with the latter having the higher rate of feed, and then to reverse-twist the assembly with a binding component. The percentage ratio of the speeds of the effect component to the ground component is called the overfeed and, as we shall see later, this is an important factor in constructing various effects.
Binder
Effect
Core or Ground
FIGURE 9.2 Basic components of a twist effect or spun fancy yarn.
© 2003 by CRC Press LLC

The exceptions to the above general structure for fancy yarns are spiral yarns and ground slub, flake, and nep spun yarns. For the spiral effect, the basic principle is to feed two yarns of significantly differing counts and twist levels to a ply-twisting device so that, when twisted together, the finer yarn appears to spiral around the coarser yarn. The yarns are usually of different twist directions, and the ply twist direction is the same as the finer yarn. Although the ply twist is of a much lower level than the component yarns, the action of plying will remove some twist from the coarser yarn, thereby increasing its bulk to give a greater contrast with the finer yarn.
The basic principle of producing ground slub effects is based on roller drafting. The ground slub, as the term implies, is part of the base yarn. As the sliver or roving is being drafted to produce the count of the base yarn, the drafting process is deliberately and randomly interrupted to cause the appearance of short, thick places at random intervals in the final yarn. Flake and nep spun effects are also produced as part of the base yarn. In Chapters 2 and 3, the occurrence of neps in the preparatory processes was discussed. Carding was presented as an important stage in the process sequence at which neps could be removed or produced. For the production of flake and nep effects, tightly entangled minituftlets are deliberately scattered, during carding, onto the swift of a woolen card.4–5 They may be of different colors to obtain a distinctive contrast with the host fiber. If deposited onto the swift between the licker-in and the carding zone, the minituftlets will be partially opened to appear as flakes. If introduced after the carding zone but before the cylinder/doffer setting line, the minituftlets are rolled tighter to form neps. The resulting slubbings are then spun in the conventional way.
9.3 PRODUCTION METHODS
As indicated in Table 9.2, fancy yarns that conform to the general structure are produced either by plying techniques, where the various components are in the form of yarns, or by spinning, where the effect component can be a ribbon of fibers, a yarn, or a combination of both.
It should be evident from the description of the basic principles of constructing fancy yarn profiles that different ply-twisting and spinning techniques can be used. Figure 9.3 gives a list of available production methods. For completeness, the brush-ing process is included. Essentially, this is where a staple yarn is brought into contact with a rotating cylinder fitted with flexible card clothing, and the direction of rotation enables a “back-of-tooth” action to partially pull out fibers and provide a hairy yarn surface. Since the purpose is only to produce hairy yarns and not to construct definite features, no further consideration will be given to the brushing technique.
9.3.1 PLYING TECHNIQUES FOR THE PRODUCTION OF FANCY YARNS
Plying is the conventional method for producing fancy yarns. There are two stages to the process.
1. The profile twisting stage, involving the ground and effect components2. The binding stage, where the binder is introduced to stabilize the profile
© 2003 by CRC Press LLC

9.3.1.1 The Profile Twisting Stage
Specially made ring twisting machines are employed, particularly for the first stage, where threading of the component yarns is important to obtaining the required profile. Figure 9.4 shows that the yarns are fed to the ring and traveler twisting device by a minimum of two sets of rollers. The back rollers, G, control the rate of feed of the ground components, and the front rollers, E, control the effect component. The production rate and twist insertion are calculated using the surface speed of G. The E rollers must not interfere with the controlled running of the ground yarns. To ensure this, either a substantially higher count of yarn is used, its thickness preventing nipping of the ground yarns by E, or grooves are cut into the periphery of the top E roller. As explained earlier, the length of effect yarn needed to form a desired profile is obtained by the percentage overfeed; therefore, the speed of E must be greater than G. When producing regular effect yarns, both sets of rollers run at constant speeds. The rollers are usually computer controlled so that, to produce randomized-effect yarns, the E rollers can be rapidly slowed to the same speed as G and then accelerated to their original speed to give random intervals between repeats of the profile. Speed control of the rollers also enables construction of a yarn with different profiles.
The threading arrangement illustrated in Figure 9.4 can be used for most of the basic eight profiles, with the exception of the knop, cover, and chenille effects. Figure 9.5 shows threading arrangements needed for the knop and cover profiles. One of the two may be used to form, for example, a knop profile and, in both cases, only one ground component is necessary; both yarns are fed forward at the same
Fancy
Yarn
Systems
Twisting Process
• Fancy Twisting or Doubling Frame: Plying of Noneffect or of EffectiveYarns
Spinning Processes
Brushing Process
• Production of Hairy Yarns by Light Brushing
• Ring Spinning• Hollow Spindle Spinning• Dref Friction Spinning• Repco Spinning• Siro Spinning• Continuous Felting: Wool and Blends
FIGURE 9.3 Fancy yarn manufacturing systems.
© 2003 by CRC Press LLC

speed. The G rollers can be then made to stop for a very short period at irregular intervals while the E rollers are still feeding the effect yarn into the twisting zone. At the last twist point where the yarns cross, the extra length of the effect yarn will wrap tightly around the ground yarn to produce the knop profile. It is important that, when wrapping occurs, the effect yarn meets the ground yarn at a steep angle (i.e.,
Grooved
Effect Yarn
Core Yarn
Twist Propagation
GE
FIGURE 9.4 Threading arrangement for profile twisting stage.
StationaryOscillating Bar
Core Yarn
Effect Yarn
Case for RegularRoller and
Oscillation of Bar
Knop
FIGURE 9.5 Threading arrangement for single or two–color knop.
© 2003 by CRC Press LLC

at almost a right angle). To assist this occurrence, a rectangular metal bar — termed a spacer bar — is positioned to separate the two yarns. When both yarns are running, the ply twist propagates up to the spacer bar, the last twist point being just below the bar. When the ground yarn stops and twisting continues, the effect yarn will be forced to meet the ground yarn at a steep angle for wrapping.
The second approach in forming the knop profile is to have both yarns constantly running with a small overfeed of the effect component. The spacer bar is made to oscillate up and down to continuously alter the distance of travel of the effect component. When in the up position, the extra length of the effect component, caused by the overfeed, is accommodated by the increased path length. As the oscillating bar moves to the down position, this length becomes tightly wrapped around the ground component to form the knop.
9.3.1.2 The Binding Stage
This is a reverse-twist stage. If the profile twist is of Z direction, the binding twist is usually S direction so as to obtain a balanced yarn (see Chapter 6). The profile yarn is commonly twisted with a filament yarn, the latter having a slight overfeed of 102 to 105%. The filament yarn, therefore, wraps or binds the profile yarn; hence the reference to it as the binding component.
9.3.1.3 The Plied Chenille Profile
The plying process used for constructing the chenille profile is a special case and has to be considered separately from the above descriptions of plied effect yarns. Imitation chenille can be produced by the wrap spinning method but with respect to plied chenille; Figure 9.6 illustrates the plying process.
As shown, rotating steel belts guide two ground yarns through a wrapping zone. There, four small bobbins on which the profile yarns are wound circulate around the steel belts and thereby wrap the profile yarns around the belts. The belts are spaced a small distance apart — sufficient for a sharp blade to be located between them. The motion of the steel belts causes the wrapping layers of the profile yarns to be cut by the blade. Two binding yarns are brought into contact with the cut yarn sections and are plied with the ground yarns. The ply twist locks the cut sections between the ground and the binding yarns, forming two fancy yarns in which the cut yarns appear as a cut pile. The two fancy yarns are termed cut-chenille yarns.
9.3.2 SPINNING TECHNIQUES FOR THE PRODUCTION OF FANCY YARNS
The spinning techniques listed in Figure 9.3 have already been described in Chapter 6. Here, we will consider how they are utilized in the production of fancy yarns.
It should be clear from the general principles that ground slub profiles can be made on a conventional ring-spinning system if the drafting system is modified to cause random thick places. Computer control of the drafting rollers is one option, which also has the added benefit that slub sizes can be varied. Cheaper alternatives
© 2003 by CRC Press LLC

are modification to the mechanical drives of the drafting system and the presence of a high percentage of short fibers in the material being spun.
From the descriptions given in Chapter 6, it can be seen that, by feeding either different colored fibers or different fiber types, or by including a filament yarn and using differential dyeing, the Siro and Repco systems may be employed to produce mock spiral yarns.
Flak and nep yarns can be spun from appropriately carded slubbings using the woolen spinning or the continuous felting process. However, if slivers rather than slubbings are made, using, say, a semi-worsted card, then the Dref-2 friction spinning system can be used to produce flake- and nep-effect yarns. Similar yarns have been produced with salvage waste from weaving fed along side normal carded sliver to the Dref-2 machine.6 Loop profiles (largely bouclé) can be also produced with this spinning system. The ground and profile yarns are made to run along the nip line of the friction rollers with only the ground yarns kept under tension. The suction at the nip line causes the profile yarn to buckle into a sinusoidal shape along its length. The friction rollers twist the components together, causing the undulations of the profile yarn to further deform and become small loops. Individual fibers from a light feed to the opening roller are simultaneously being deposited onto the friction rollers and twisted around the ground and profile components, thereby binding the loops in place.
A slub-injection device can be mounted above the friction rollers, as shown in Figure 9.7, to introduce color effects in the yarn, producing an injected flame yarn. Basically, the device consists of two pairs of drafting rollers with a tapered tube
Core YarnsGuide Wire onDrive Pulley
Binder YarnFrom Bobbin
Binder Yarnfrom Bobbin
Guide Wireon Drive Pulley
Knife Edge(Blade)
Ring and Traveler
Cut Effect Yarnto Form Chenille
LappetGuide
GroovedDisks
Effect Yarns(four spools)
Rotor Disk
GuideWire
FIGURE 9.6 Production of chenille effect fancy yarn by yarn plying process.
© 2003 by CRC Press LLC

fitted at the exit of drafting unit. Compressed air passing through the tube removes small tufts from the fiber ribbon leaving the front drafting rollers and injects them into the nip line of the rollers during friction spinning.
The above spinning processes are restricted in the range of fancy yarns they can produce and are therefore rarely used in the fancy market area. The most popular spinning technique that has been specially developed for the production of fancy yarns is hollow-spindle wrap spinning (see Chapter 6).
As Figure 9.8 shows, the basic system for plain yarns can be modified to have a main drafting unit with a grooved top-front roller, an added pair of feed rollers for controlling the speed of the ground component yarns, and two additional drafting units to produce multicolor slub injection or mock cover yarns. Similar to the plying system, the tread line of the ground component yarns passes from feed rollers and through the grooves of the top-front drafting roller. The profile component is usually in the form of a drafted fiber ribbon attenuated from a sliver or roving to the required count by the main drafting system and fed into the twisting zone at the percentage overfeed necessary for the desired profile. Yarns can be also used as the profile component, in which case they are fed only through the nip of the drafting-system front rollers. Both the profile and ground components are threaded together down the hollow spindle, around the false-twist device, and through the nip of the delivery rollers to the package-winding unit. As in the plain-yarn system, a filament from a pirn mounted on the hollow spindle is also threaded around the false twister. The false twist action of the rotating spindle twists the two components together to form the profile, and simultaneously the filament wraps the yarns to hold the profile in place.
To produce slub effects, a sliver or roving can be fed to the nip of the front drafting rollers. The injection unit consists of a pair of roller-driven aprons, which guide the sliver or roving into the front drafting zone of the main effect component just behind the front rollers. The control system is programmed to stop the aprons
FIGURE 9.7 (See color insert.) Dref spinning of injected slub–effect yarns. (Courtesy ofFehrer AG.).
© 2003 by CRC Press LLC

when the front rollers nip the injected fibers, with the result that fiber tufts are pulled into the main effect component and spun into the final yarn.
Figure 9.8 also shows that the hollow spindle, without the false twister, can be combined with a ring and traveler to produce yarns that look very similar to the conventional process but are produced more economically. The false-twist action is replaced by real twist from the ring and traveler.
Core YarnTension Rollers
Front DraftRollers
Rear Draft Rollers
Rear Draft Rollers
Rear Draft Rollers
Hollow SpindleWith Binder
False Twister
Delivery Rollers
Final YarnPackage
Silver Feed
AdjustableDelivery Roller
Effect FormationArea
Hollow Spindle
Flanged Bobbin
StableSpindle Bearing
StableSpindle Bearing
Tangential Belt
Tangential Belt
Central Tip-UpThread Guide
Large Cop
Anti-BalloonRing
Twist RingWith CentralOil SupplyHigh
TravelerSpeed
Gentle Deflectionof Yarn
Lower Yarn Tension
ReducedYarn Balloon
FIGURE 9.8 (See color insert.) Hollow-spindle fancy yarn-spinning system.
© 2003 by CRC Press LLC

Using the hollow spindle/false-twister technique, the effect component in the final yarn has no twist. Hence, the fancy yarn is bulky and also may be hairy. The profile is therefore not as well defined as a conventionally made profile, where the constituent yarns are pretwisted. By combining the hollow spindle with the ring and traveler, real twist propagates through to the front drafting rollers, and the effect component becomes twisted and has a well defined profile.
Like the Dref-2 process, the hollow-spindle technique combines the profile twisting and binding stages into one process and. as explained in Chapter 6, the separation of twisting and winding actions enables faster production speeds and larger package sizes to be wound. Therefore, there are obvious economic advan-tages over the conventional plying process. In contrast to the friction spinning technique, hollow-spindle wrap spinning has the flexibility to produce most of the eight profiles of Table 6.1.
9.4 DESIGN AND CONSTRUCTION OF THE BASIC PROFILES
Our consideration of the design and construction of the eight basic profiles will be restricted to the plying and hollow-spindle spinning techniques, as these are the most commonly used processes. From the above descriptions of these techniques, it can be seen that threading up of the various components is critical to construction of the basic profile. The following factors are also of importance and should be given careful consideration in the design and construction of the profiles:
• Fiber fineness and length. Essentially, it is the bending rigidity of the fiber that is strictly of importance. Coarse, long fibers tend to give the best loop definition but, for bouclé or small loops, finer fibers are more effective.
• Count and twist level and direction of component yarns. Count and twistare principal factors influencing yarn bulk, which in turn can enhance any contrast of color differences between the various components of a fancy yarn.
9.4.1 SPIRAL
This is usually made with the plying technique. Typically, two single yarns of appreciably differing thickness and twist level and direction are plied together with a slight overfeed of the coarser yarn. Typically, a bulky woolen yarn of around 300 tex with 120-t/m Z-twist would be ply twisted with a 47-tex, 600 to 800 t/m S-twisted cotton yarn, dyed a darker color (see Figure 9.9). The ply twist would be in the S direction and may be a quarter to a third the twist level of the woolen yarn, depending on the required visual contrast and handle.
A mock spiral can be produced in which both yarns have the same twist direction but are plied with the reverse direction of twist. The spiral effect is much less pronounced, because twist is removed from both yarns during the plying action, and the surface fibers of the finer yarn become slightly intermingled with the coarser yarn, thereby diminishing the visual contrast.
© 2003 by CRC Press LLC

9.4.2 GIMP
Both the plying technique and the hollow-spindle process can be used to make this yarn (see Figure 9.10). It is produced in a wide range of yarn counts and fiber types, and, with the plying technique, most yarn types (i.e., woolen, worsted, carded ring-spun, filament, etc.) can be used.
Using the hollow-spindle process will require two ground yarns on which the drafted ribbon can be made to buckle into the form of a wavy shape, e.g., a sinewave, using an overfeed within the range of 120 to 200%. The greater the overfeed, the larger the amplitude of the waveform. The propagation of twist from the false-twist device plies the ground yarns around the undulations to retain the profile, which is then locked by a wrapping filament yarn. Typically, two 2/50-tex semi-worsted acrylic yarns may be used for the ground component. The profile component would be an acrylic sliver of 60 mm 3.3-dtex fibers drafted to a count of up to 300, and the binder a 20-dtex multifilament yarn. The binding twist would be within the range of 200 to 300 t/m.
Woolen Yarn
Cotton Yarn
FIGURE 9.9 Illustration of spiral yarn structure.
Effect YarnZ – Twist Base
Core YarnZ – Twist Base
S – TwistPly
Binding YarnZ – Twist BaseZ – Twist Ply
FIGURE 9.10 Structure of gimp effect yarn.
© 2003 by CRC Press LLC

With the conventional technique, yarns of similar counts to the above or finer may be used. The profile component could be a woolen spun wool yarn with an overfeed of 120 to 150%, and the ground components could be two worsted yarns. These would be plied together with 400 to 500 t/m S-twist. For the reverse twisting stage, a single 2/40-tex worsted yarn would act as the binder and 180 to 200 t/m Z-twist used as the binding twist.
9.4.3 LOOP
The threading arrangement of the component yarns to form loops is similar to that for the gimp. Three other factors, however, must also be given careful consideration when constructing loop profiles. They are (1) the type of fiber or yarn used to form the loop, (2) the level twist applied in forming the loop, and (3) the percentage of overfeed employed at the profile stage.
To construct a series of loops, the profile component must have suitable stiffness to deform into a circular shape during overfeeding and twisting with the two ground yarns. The stiffness is also important in retaining the loop shape after the binding twist stage. In spinning, it is the fiber rigidity and staple length that are of importance. In the plying process, in addition to fiber rigidity and length, the twist of the profile component yarn is a key factor. The longer the fiber, the better the loop formation when the profile is made by spinning. In the case of the plying process, longer fibers and a suitable level of twist produce a profile yarn component with low hairiness but high lustre, and this combination aids the visual definition of the loop. The twist of the profile component yarn, however, must not be at a level that will cause snarling during a high-percentage overfeed. The usual practice is to have just sufficient twist to enable the yarn to withstand the tensions involved in the threading arrangement and to unwind from the supply package, typically 240 to 320 t/m, depending on count — the coarser the count, the lower the twist.
Mohair is a popular fiber used for the profile component in the spinning process. With the plying technique, Z-twisted, wool worsted yarns and mohair yarns, typically of 70 to 100 tex, are often used. The ground and binding components may be 40- to 50-tex worsted, semi-worsted, or short staple yarns of natural or synthetic fibers.
At the profile stage, the overfeed is within the range of 150 to 300%, and the applied twist is within 100 to 1000 t/m in the S-direction. A high overfeed (250 to 300%) and low twist level (150 to 500 t/m) will produce large loops (see Figure 9.11), whereas an overfeed of 150 to 250% with twist levels of 500 to 1000 t/m will produce a profusion of small loops to give a bouclé yarn (see Figure 9.1).
9.4.4 SNARL
This type of fancy yarn is generally produced with the plying process. The profile component has to be a highly twisted yarn; typically, it is a short staple cotton or synthetic fiber singles yarn of 25 tex with 25% greater twist level than normally used for a conventional singles yarn. The percentage overfeed is similar for the loop profile. The ground and binding components would be of a coarser count yarn, around 2/40 to 2/50 tex. The ground and profile components should have opposite
© 2003 by CRC Press LLC

twist directions, the former S and the latter Z. At the profile stage, S-twist of 500 to 600 t/m would then be used in plying the yarns together; this adds further twist to the ground component so that the snarl shape is conspicuous against the ground yarns (see Figure 9.12). The binding twist is usually on the order of 320 t/m.
9.4.5 KNOP
The knop (see Figure 9.13) can be constructed by the spinning or the plying system using an overfeed of 150 to 200%, but the profile is visually not as well defined in the spinning as in the plying process, because a drafted fiber ribbon is used as the profile component. The earlier description of how a knop can be formed in the plying
Loop YarnLoop Yarn
Core YarnsBinding Yarn
FIGURE 9.11 Effect loop yarn structure.
Snarl in EffectYarn
Two-PlyCore Yarn
Binding Yarn
FIGURE 9.12 Structure of snarl effect yarn.
Effect ComponentKnop
Binding Yarn
Binding Yarn
FIGURE 9.13 Effect knop yarn structure.
© 2003 by CRC Press LLC

process concerns a single-color knop. Alternately stopping and overfeeding the two yarns would produce a two-color knop, and the addition of another pair of rollers could be used to produce a three-colored knop. Generally, with a single knop, the profile component is of a coarser count, e.g., 150 tex compared with 2/50 tex for the ground component and 80 tex for the binder. If two- and three-color knops are to be constructed, the yarns are of similar counts. In the plying technique, S-twist of around 700 to 1000 t/m may be used with binding twists of 200 to 250 t/m; if higher twist levels are used, the binding component can be omitted. With spinning, the wrap levels used are equivalent to the lower end of the quoted twist range.
9.4.6 COVER
Strictly cover yarns are made by the plying process. The threading arrangement is identical to the knop, where the two pairs rollers controlling the yarns are made to stop and start as required. However, instead of stopping, each pair of rollers will, in turn, slow to a speed that allows the other yarn to wrap around that fed by the slowed rollers. The wrapping coils bunch closely to completely cover a length of the slowly moving yarn. The level of twist required is usually high, of the order of 1600 t/m. This wrapping action is made to alternate between the two yarns, which are of different colors. As illustrated in Figure 9.14, the resulting fancy yarn would have alternating sections of color. The length of each colored section should vary so as to avoid patterning defects in the end fabric. The overfeed of the yarns can be within 200 to 250%; each yarn may have different values of percentage overfeed. The yarns are normally of similar count, e.g., 80 to 100 tex, and the binder is of a finer count — 50 tex. The binding twist is within 300–400 t/m.
A mock cover yarn can be produced with the hollow-spindle system. Here, the two- or three-roller drafting systems can intermittently feed different-colored drafted ribbons onto the ground yarns to produce a repeating sequence of two or three different color lengths having a small gimp profile.
9.4.7 SLUB
The production of ground and injected slub yarns was considered earlier. The emphasis was mainly on modification of the conventional ring-spinning system for
Alternating Effect
Alternating Core
Binding Yarn
FIGURE 9.14 Structure of cover effect yarn.
© 2003 by CRC Press LLC

producing ground slub yarns or on the hollow-spindle system for both ground and injected slubs where single- and multi-drafting units are used. Injected slub yarns (see Figure 9.15) can be made, however, with the plying process. In this case, a roving replaces a yarn as the profile component, and the rollers feeding the roving periodically stop and start according to required slub length and spacing. The slub thickness is determined by the roving count. As an example, a 600-tex roving of 1.7-dtex acrylic fibers may be fed without overfeed onto two 2/30-tex ground yarns made from the same fiber but dyed a different color. The slub lengths formed by periodic stopping of the roving feed would be twisted with the ground yarns using 650 t/m; the opposite twist direction to that of the ground yarns (i.e., the ply twist) is used, as this would enable the slub to be better embedded between the ground yarns. A singles 34-tex acrylic yarn may be then applied as the binder with a twist level of 250 t/m.
9.4.8 CHENILLE
The chenille profile was originally made by leno weaving (see Figure 9.16), where typically cotton yarns of 60 tex would be used as warp and the staple spun rayon yarns of 150 tex as weft. Two weft yarns (two picks) are placed between each
Slub (Loosely Twisted Thick Spot)
Core Yarn
FIGURE 9.15 Structure of injected slub-effect yarn.
Warp
Weft
FIGURE 9.16 Traditional chenille-effect yarn structure.
© 2003 by CRC Press LLC

crossing of the warp yarns. After weaving, the weft length extending between the warp yarns is cut to produce the pile effect. This process is clearly time consuming and has been replaced by the spinning process described earlier for cut chenille yarns.
A mock chenille effect can be obtained with either the hollow-spindle or the plying process using settings for the production of a profusion of very small loops. Two such loop yarns are then wrapped or plied together, giving a mock chenille profile.
9.4.9 COMBINATION OF PROFILES
Computer control of the drafting rollers or the rollers feeding the profile yarn enables the superposition of most of the eight to be achieved, giving added fancy effects. The profiles unlikely to form combinations in this way are the snarl, cover, and chenille. However, plying together a number of fancy yarns also makes many combinations, and this approach covers all profiles.
9.5 ANALYSIS OF FANCY YARNS
Although yarn CAD systems have been a subject of study7 for use in fancy yarn design and production, a still common practice is to analyze a fancy yarn design to determine how it was made, i.e., reverse engineering. Generally, it can be readily determined if a fancy yarn has been spun on a hollow-spindle system or produced by the conventional plying technique, since the former will show the binding com-ponent wrapped around the profile and ground components, whereas the latter would show a twisted configuration. Fancy yarns produced on the Dref-2 system will have staple fibers as the binding components, wrapped around the other components. A cut chenille yarn can also be easily identified from the appearance of the pile and the way it is attached to the ground and binding components. Detailed analysis is usually required only with plied fancy yarns, although, with obvious modification, the steps taken are applicable to spun yarns.
As an example of the analysis of plied fancy yarn, let us consider the simple case of a loop profile. We would wish to determine levels of twist and overfeed used at profile and binding stages, and then the fiber type, yarn structure, count and twist levels used to make each component yarn. Ultimately, we will require the mass of the constituent yarns per kilogram of the loop yarn.
After measuring the count of the loop yarn, Cf , a number of 10-cm lengths are untwisted to obtain the following calculated average values per meter of loop yarn: the binding twist Tb, the profile twist, Tp, and the lengths of each component; Lb
(binder), Lp (profile yarn), and Lg (ground yarns). Lpg is the measured length of yarn after the binder is removed and represents the plied yarn from the profile twisting stage. Subsequently, the twist in each component can be measured and the structure determined by looking at each yarn under a microscope (see Chapter 6). From measuring the mass of component lengths, the respective counts in tex can be calculated: Cb (count of binder), Cp (profile yarn), and Cg (ground yarns).
The number of kilometers per kilogram of loop yarn will given by 103/Cf. Thus, the number of kilometers of each component in a kilogram of loop yarn would be
© 2003 by CRC Press LLC

Lb103/Cf, Lp103/Cf, and Lg103/Cf. The mass fraction of each component contributing to a kilogram of the loop yarn would be Cb Lb/Cf , Cp Lp/Cf , and 2Cg Lg/Cf . The percentage overfeed at the profile and binding stages are given by Lp /Lg and Lb /Lpg. Once these values are known, the machine settings for the respective feed rollers and the ring spindle speeds can be made to produce the loop yarn.
REFERENCES
1. Weisser, H. and Czapay, M., Fancy yarns — market and production, Textil Praxis Int., 1228–1234, November 1981.
2. Graiger, L., Fancy twists and their classification, Textil Prax. Int., 1054–1064 E XI–XII, September 1978.
3. Bellwood, L., Novelty yarns: The external search for something different, Text. Indust., 19–39, March l977.
4. Bellwood, L., Novelty yarns for speciality fabrics, Text. Indust., 63–68, January 1978.5. CAIPO, Producing slub yarns, Int.Text. Bull., Spinning, 1, 53, 19746. PEO Teknokonsult AB, Different ways of producing effect yarns, Textil Betrieb, 9,
1–5, September 1981.7. Testore, F. and Minero, G., A study of the fundamental parameters of some fancy
yarns, J. Text. Inst., 4(79), 606–619, 1988.
© 2003 by CRC Press LLC