3D Experimental Quantification of Fabric and Fabric Evolution ...
Upload
khangminh22Category
view
6download
0
HP StorageWorks
Fabric OS 5.x Fabric Watch administrator guide
Part number: AA-RVJ0B-TESecond edition: September 2005

Legal and notice information
©Copyright 2005 Hewlett-Packard Development Company, L.P.
©Copyright2005BrocadeCommunicationsSystems,Incorporated.
Hewlett-Packard Company makes no warranty of any kind with regard to this material, including, but not limited to, the implied warranties of merchantability and fitness for a particular purpose. Hewlett-Packard shall not be liable for errors contained herein or for incidental or consequential damages in connection with the furnishing, performance, or use of this material.
This document contains proprietary information, which is protected by copyright. No part of this document may be photocopied, reproduced, or translated into another language without the prior written consent of Hewlett-Packard. The information is provided “as is” without warranty of any kind and is subject to change without notice. The only warranties for HP products and services are set forth in the express warranty statements accompanying such products and services. Nothing herein should be construed as constituting an additional warranty. HP shall not be liable for technical or editorial errors or omissions contained herein.
Microsoft, Windows, Windows NT, and Windows XP are U.S. registered trademarks of Microsoft Corporation.
UNIX® is a registered trademark of The Open Group.
Fabric OS 5.x Fabric Watch administrator guide

Fabric OS 5.x Fabric Watch administrator guide 3
About this guide. . . . . . . . . . . . . . . . . . . . . . . . . . . . . . . . . . . . . . . . . . . . . . . . . . . . . 7Intended audience . . . . . . . . . . . . . . . . . . . . . . . . . . . . . . . . . . . . . . . . . . . . . . . . . . . . . . . . . . . . . . . 7Related documentation . . . . . . . . . . . . . . . . . . . . . . . . . . . . . . . . . . . . . . . . . . . . . . . . . . . . . . . . . . . . 7Document conventions and symbols . . . . . . . . . . . . . . . . . . . . . . . . . . . . . . . . . . . . . . . . . . . . . . . . . . . 8HP technical support . . . . . . . . . . . . . . . . . . . . . . . . . . . . . . . . . . . . . . . . . . . . . . . . . . . . . . . . . . . . . . 9
HP-authorized reseller. . . . . . . . . . . . . . . . . . . . . . . . . . . . . . . . . . . . . . . . . . . . . . . . . . . . . . . . . . . 9Helpful web sites . . . . . . . . . . . . . . . . . . . . . . . . . . . . . . . . . . . . . . . . . . . . . . . . . . . . . . . . . . . . . . 9
1 An introduction to Fabric Watch . . . . . . . . . . . . . . . . . . . . . . . . . . . . . . . . . . . . . . . . 11Fabric Watch overview . . . . . . . . . . . . . . . . . . . . . . . . . . . . . . . . . . . . . . . . . . . . . . . . . . . . . . . . . . . 11Introduction to fabric health . . . . . . . . . . . . . . . . . . . . . . . . . . . . . . . . . . . . . . . . . . . . . . . . . . . . . . . . 12
2 Fabric Watch concepts . . . . . . . . . . . . . . . . . . . . . . . . . . . . . . . . . . . . . . . . . . . . . . . 13Fabric watch components . . . . . . . . . . . . . . . . . . . . . . . . . . . . . . . . . . . . . . . . . . . . . . . . . . . . . . . . . 13
Classes. . . . . . . . . . . . . . . . . . . . . . . . . . . . . . . . . . . . . . . . . . . . . . . . . . . . . . . . . . . . . . . . . . . . 13Areas . . . . . . . . . . . . . . . . . . . . . . . . . . . . . . . . . . . . . . . . . . . . . . . . . . . . . . . . . . . . . . . . . . . . . 14
Environment class areas. . . . . . . . . . . . . . . . . . . . . . . . . . . . . . . . . . . . . . . . . . . . . . . . . . . . . . 14Fabric class areas . . . . . . . . . . . . . . . . . . . . . . . . . . . . . . . . . . . . . . . . . . . . . . . . . . . . . . . . . . 15FRU class areas . . . . . . . . . . . . . . . . . . . . . . . . . . . . . . . . . . . . . . . . . . . . . . . . . . . . . . . . . . . 15Performance monitor class areas. . . . . . . . . . . . . . . . . . . . . . . . . . . . . . . . . . . . . . . . . . . . . . . . 16Port class areas . . . . . . . . . . . . . . . . . . . . . . . . . . . . . . . . . . . . . . . . . . . . . . . . . . . . . . . . . . . 16Resource class area. . . . . . . . . . . . . . . . . . . . . . . . . . . . . . . . . . . . . . . . . . . . . . . . . . . . . . . . . 17Security class areas. . . . . . . . . . . . . . . . . . . . . . . . . . . . . . . . . . . . . . . . . . . . . . . . . . . . . . . . . 17SFP class areas. . . . . . . . . . . . . . . . . . . . . . . . . . . . . . . . . . . . . . . . . . . . . . . . . . . . . . . . . . . . 18
Elements . . . . . . . . . . . . . . . . . . . . . . . . . . . . . . . . . . . . . . . . . . . . . . . . . . . . . . . . . . . . . . . . . . . 19Configuring events . . . . . . . . . . . . . . . . . . . . . . . . . . . . . . . . . . . . . . . . . . . . . . . . . . . . . . . . . . . . . . 19
Event behavior types . . . . . . . . . . . . . . . . . . . . . . . . . . . . . . . . . . . . . . . . . . . . . . . . . . . . . . . . . . 19Continuous event behavior . . . . . . . . . . . . . . . . . . . . . . . . . . . . . . . . . . . . . . . . . . . . . . . . . . . . 19Triggered event behavior . . . . . . . . . . . . . . . . . . . . . . . . . . . . . . . . . . . . . . . . . . . . . . . . . . . . . 20
Data values. . . . . . . . . . . . . . . . . . . . . . . . . . . . . . . . . . . . . . . . . . . . . . . . . . . . . . . . . . . . . . . . . 20Threshold values . . . . . . . . . . . . . . . . . . . . . . . . . . . . . . . . . . . . . . . . . . . . . . . . . . . . . . . . . . . . . 20
High and low thresholds . . . . . . . . . . . . . . . . . . . . . . . . . . . . . . . . . . . . . . . . . . . . . . . . . . . . . 20Buffer values. . . . . . . . . . . . . . . . . . . . . . . . . . . . . . . . . . . . . . . . . . . . . . . . . . . . . . . . . . . . . . 20
Time bases . . . . . . . . . . . . . . . . . . . . . . . . . . . . . . . . . . . . . . . . . . . . . . . . . . . . . . . . . . . . . . . . . 21Setting time base to none. . . . . . . . . . . . . . . . . . . . . . . . . . . . . . . . . . . . . . . . . . . . . . . . . . . . . 21Specifying a time base . . . . . . . . . . . . . . . . . . . . . . . . . . . . . . . . . . . . . . . . . . . . . . . . . . . . . . 22
Event settings. . . . . . . . . . . . . . . . . . . . . . . . . . . . . . . . . . . . . . . . . . . . . . . . . . . . . . . . . . . . . . . . 23Above event triggers . . . . . . . . . . . . . . . . . . . . . . . . . . . . . . . . . . . . . . . . . . . . . . . . . . . . . . . . 23Below event trigger . . . . . . . . . . . . . . . . . . . . . . . . . . . . . . . . . . . . . . . . . . . . . . . . . . . . . . . . . 24Changed event trigger. . . . . . . . . . . . . . . . . . . . . . . . . . . . . . . . . . . . . . . . . . . . . . . . . . . . . . . 24In-Between triggers . . . . . . . . . . . . . . . . . . . . . . . . . . . . . . . . . . . . . . . . . . . . . . . . . . . . . . . . . 24
Port persistence . . . . . . . . . . . . . . . . . . . . . . . . . . . . . . . . . . . . . . . . . . . . . . . . . . . . . . . . . . . . . . . . 25Notification methods . . . . . . . . . . . . . . . . . . . . . . . . . . . . . . . . . . . . . . . . . . . . . . . . . . . . . . . . . . . . . 25
Switch event (error) log entry . . . . . . . . . . . . . . . . . . . . . . . . . . . . . . . . . . . . . . . . . . . . . . . . . . 25SNMP trap. . . . . . . . . . . . . . . . . . . . . . . . . . . . . . . . . . . . . . . . . . . . . . . . . . . . . . . . . . . . . . . 25RAPITrap . . . . . . . . . . . . . . . . . . . . . . . . . . . . . . . . . . . . . . . . . . . . . . . . . . . . . . . . . . . . . . . . 26Port log lock . . . . . . . . . . . . . . . . . . . . . . . . . . . . . . . . . . . . . . . . . . . . . . . . . . . . . . . . . . . . . . 26Email alert . . . . . . . . . . . . . . . . . . . . . . . . . . . . . . . . . . . . . . . . . . . . . . . . . . . . . . . . . . . . . . . 26Assigning notification methods . . . . . . . . . . . . . . . . . . . . . . . . . . . . . . . . . . . . . . . . . . . . . . . . . 26
Switch policies . . . . . . . . . . . . . . . . . . . . . . . . . . . . . . . . . . . . . . . . . . . . . . . . . . . . . . . . . . . . . . . . . 27Interpreting event messages . . . . . . . . . . . . . . . . . . . . . . . . . . . . . . . . . . . . . . . . . . . . . . . . . . . . . . . . 27
Contents

4
3 Activating and accessing Fabric Watch . . . . . . . . . . . . . . . . . . . . . . . . . . . . . . . . . . . 29Activating Fabric Watch . . . . . . . . . . . . . . . . . . . . . . . . . . . . . . . . . . . . . . . . . . . . . . . . . . . . . . . . . . 29
Activating with telnet . . . . . . . . . . . . . . . . . . . . . . . . . . . . . . . . . . . . . . . . . . . . . . . . . . . . . . . . . . 29Activating with Advanced Web Tools. . . . . . . . . . . . . . . . . . . . . . . . . . . . . . . . . . . . . . . . . . . . . . . 29
Accessing Fabric Watch . . . . . . . . . . . . . . . . . . . . . . . . . . . . . . . . . . . . . . . . . . . . . . . . . . . . . . . . . . 29Telnet . . . . . . . . . . . . . . . . . . . . . . . . . . . . . . . . . . . . . . . . . . . . . . . . . . . . . . . . . . . . . . . . . . . . . 30Advanced Web Tools . . . . . . . . . . . . . . . . . . . . . . . . . . . . . . . . . . . . . . . . . . . . . . . . . . . . . . . . . 30SNMP-Based enterprise managers . . . . . . . . . . . . . . . . . . . . . . . . . . . . . . . . . . . . . . . . . . . . . . . . . 30Configuration file. . . . . . . . . . . . . . . . . . . . . . . . . . . . . . . . . . . . . . . . . . . . . . . . . . . . . . . . . . . . . 32
4 Configuring Fabric Watch . . . . . . . . . . . . . . . . . . . . . . . . . . . . . . . . . . . . . . . . . . . . 33Configuring Fabric Watch thresholds . . . . . . . . . . . . . . . . . . . . . . . . . . . . . . . . . . . . . . . . . . . . . . . . . 33
Step 1: Select the class and area to configure . . . . . . . . . . . . . . . . . . . . . . . . . . . . . . . . . . . . . . . . . 33 Step 2: Configure thresholds . . . . . . . . . . . . . . . . . . . . . . . . . . . . . . . . . . . . . . . . . . . . . . . . . . . . 35Step 3: Configure alarms . . . . . . . . . . . . . . . . . . . . . . . . . . . . . . . . . . . . . . . . . . . . . . . . . . . . . . . 41
How to calculate values for alarms . . . . . . . . . . . . . . . . . . . . . . . . . . . . . . . . . . . . . . . . . . . . . . 41Step 4: Disable and enable thresholds by port (optional) . . . . . . . . . . . . . . . . . . . . . . . . . . . . . . . . . 45
Configuring notifications . . . . . . . . . . . . . . . . . . . . . . . . . . . . . . . . . . . . . . . . . . . . . . . . . . . . . . . . . . 46Configuring alarm notifications . . . . . . . . . . . . . . . . . . . . . . . . . . . . . . . . . . . . . . . . . . . . . . . . . . . 46Configuring SNMP notifications. . . . . . . . . . . . . . . . . . . . . . . . . . . . . . . . . . . . . . . . . . . . . . . . . . . 46Configuring port log lock actions . . . . . . . . . . . . . . . . . . . . . . . . . . . . . . . . . . . . . . . . . . . . . . . . . . 47Configuring email notifications . . . . . . . . . . . . . . . . . . . . . . . . . . . . . . . . . . . . . . . . . . . . . . . . . . . 47
1: Show Mail configuration information. . . . . . . . . . . . . . . . . . . . . . . . . . . . . . . . . . . . . . . . . . . 47Configuring switch status policy . . . . . . . . . . . . . . . . . . . . . . . . . . . . . . . . . . . . . . . . . . . . . . . . . . . . . 49
Step 1: Plan and define your switch status policy. . . . . . . . . . . . . . . . . . . . . . . . . . . . . . . . . . . . . . . 49Step 2: Implement your switch status policy. . . . . . . . . . . . . . . . . . . . . . . . . . . . . . . . . . . . . . . . . . . 50Step 3: View your switch status policy . . . . . . . . . . . . . . . . . . . . . . . . . . . . . . . . . . . . . . . . . . . . . . 50
Configuring FRUs . . . . . . . . . . . . . . . . . . . . . . . . . . . . . . . . . . . . . . . . . . . . . . . . . . . . . . . . . . . . . . . 51Configuring Fabric Watch using Web Tools . . . . . . . . . . . . . . . . . . . . . . . . . . . . . . . . . . . . . . . . . . . . 51Configuring Fabric Watch using SNMP. . . . . . . . . . . . . . . . . . . . . . . . . . . . . . . . . . . . . . . . . . . . . . . . 52
A Default threshold values . . . . . . . . . . . . . . . . . . . . . . . . . . . . . . . . . . . . . . . . . . . . . . 57Environment class . . . . . . . . . . . . . . . . . . . . . . . . . . . . . . . . . . . . . . . . . . . . . . . . . . . . . . . . . . . . . . . 57Fabric class . . . . . . . . . . . . . . . . . . . . . . . . . . . . . . . . . . . . . . . . . . . . . . . . . . . . . . . . . . . . . . . . . . . 60Performance monitor class . . . . . . . . . . . . . . . . . . . . . . . . . . . . . . . . . . . . . . . . . . . . . . . . . . . . . . . . . 61Port class . . . . . . . . . . . . . . . . . . . . . . . . . . . . . . . . . . . . . . . . . . . . . . . . . . . . . . . . . . . . . . . . . . . . . 62Resource class . . . . . . . . . . . . . . . . . . . . . . . . . . . . . . . . . . . . . . . . . . . . . . . . . . . . . . . . . . . . . . . . . 65Security class . . . . . . . . . . . . . . . . . . . . . . . . . . . . . . . . . . . . . . . . . . . . . . . . . . . . . . . . . . . . . . . . . . 66SFP class . . . . . . . . . . . . . . . . . . . . . . . . . . . . . . . . . . . . . . . . . . . . . . . . . . . . . . . . . . . . . . . . . . . . . 68
B Basic Fabric Watch configuration guidelines . . . . . . . . . . . . . . . . . . . . . . . . . . . . . . . 69
C Using Fabric Watch with configuration files . . . . . . . . . . . . . . . . . . . . . . . . . . . . . . . . 71Configuration files . . . . . . . . . . . . . . . . . . . . . . . . . . . . . . . . . . . . . . . . . . . . . . . . . . . . . . . . . . . . . . 71Profiles . . . . . . . . . . . . . . . . . . . . . . . . . . . . . . . . . . . . . . . . . . . . . . . . . . . . . . . . . . . . . . . . . . . . . . 71
Figures1 Threshold monitoring . . . . . . . . . . . . . . . . . . . . . . . . . . . . . . . . . . . . . . . . . . . . . . . . . . . . . . . . . 232 A buffered data region. . . . . . . . . . . . . . . . . . . . . . . . . . . . . . . . . . . . . . . . . . . . . . . . . . . . . . . . 233 Time base set to none. . . . . . . . . . . . . . . . . . . . . . . . . . . . . . . . . . . . . . . . . . . . . . . . . . . . . . . . . 234 Event trigger . . . . . . . . . . . . . . . . . . . . . . . . . . . . . . . . . . . . . . . . . . . . . . . . . . . . . . . . . . . . . . . 245 Example without an event . . . . . . . . . . . . . . . . . . . . . . . . . . . . . . . . . . . . . . . . . . . . . . . . . . . . . . 256 Above event trigger with buffer zone . . . . . . . . . . . . . . . . . . . . . . . . . . . . . . . . . . . . . . . . . . . . . . 257 Changed threshold . . . . . . . . . . . . . . . . . . . . . . . . . . . . . . . . . . . . . . . . . . . . . . . . . . . . . . . . . . 268 In-Between trigger . . . . . . . . . . . . . . . . . . . . . . . . . . . . . . . . . . . . . . . . . . . . . . . . . . . . . . . . . . . 269 Disabling a threshold . . . . . . . . . . . . . . . . . . . . . . . . . . . . . . . . . . . . . . . . . . . . . . . . . . . . . . . . . 3810 Changing the threshold alarm level . . . . . . . . . . . . . . . . . . . . . . . . . . . . . . . . . . . . . . . . . . . . . . . 4511 Applying threshold alarm changes. . . . . . . . . . . . . . . . . . . . . . . . . . . . . . . . . . . . . . . . . . . . . . . . 4512 fwMailcfg Menu . . . . . . . . . . . . . . . . . . . . . . . . . . . . . . . . . . . . . . . . . . . . . . . . . . . . . . . . . . . . 5013 Config show menu. . . . . . . . . . . . . . . . . . . . . . . . . . . . . . . . . . . . . . . . . . . . . . . . . . . . . . . . . . . 50

Fabric OS 5.x Fabric Watch administrator guide 5
14 fwFruCfg configuration . . . . . . . . . . . . . . . . . . . . . . . . . . . . . . . . . . . . . . . . . . . . . . . . . . . . . . . . 5415 Configuring Fabric Watch using SNMP . . . . . . . . . . . . . . . . . . . . . . . . . . . . . . . . . . . . . . . . . . . . 5516 Enabling Fabric Watch Traps in SNMP . . . . . . . . . . . . . . . . . . . . . . . . . . . . . . . . . . . . . . . . . . . . 5517 Configuring SNMP management host IP address . . . . . . . . . . . . . . . . . . . . . . . . . . . . . . . . . . . . . . 5618 Example OID tree . . . . . . . . . . . . . . . . . . . . . . . . . . . . . . . . . . . . . . . . . . . . . . . . . . . . . . . . . . . 5719 Example swFwName screen . . . . . . . . . . . . . . . . . . . . . . . . . . . . . . . . . . . . . . . . . . . . . . . . . . . . 57
Tables1 Document conventions . . . . . . . . . . . . . . . . . . . . . . . . . . . . . . . . . . . . . . . . . . . . . . . . . . . . . . . . . . 82 Document conventions . . . . . . . . . . . . . . . . . . . . . . . . . . . . . . . . . . . . . . . . . . . . . . . . . . . . . . . . . 103 Fabric Watch classes . . . . . . . . . . . . . . . . . . . . . . . . . . . . . . . . . . . . . . . . . . . . . . . . . . . . . . . . . . 154 Environment class areas . . . . . . . . . . . . . . . . . . . . . . . . . . . . . . . . . . . . . . . . . . . . . . . . . . . . . . . . 165 Fabric class sreas . . . . . . . . . . . . . . . . . . . . . . . . . . . . . . . . . . . . . . . . . . . . . . . . . . . . . . . . . . . . 176 FRU class areas . . . . . . . . . . . . . . . . . . . . . . . . . . . . . . . . . . . . . . . . . . . . . . . . . . . . . . . . . . . . . . 177 Performance monitor class areas . . . . . . . . . . . . . . . . . . . . . . . . . . . . . . . . . . . . . . . . . . . . . . . . . . 188 Port class areas . . . . . . . . . . . . . . . . . . . . . . . . . . . . . . . . . . . . . . . . . . . . . . . . . . . . . . . . . . . . . . 189 Resource class area . . . . . . . . . . . . . . . . . . . . . . . . . . . . . . . . . . . . . . . . . . . . . . . . . . . . . . . . . . . 1910 Security class areas . . . . . . . . . . . . . . . . . . . . . . . . . . . . . . . . . . . . . . . . . . . . . . . . . . . . . . . . . . . 1911 SFP class areas . . . . . . . . . . . . . . . . . . . . . . . . . . . . . . . . . . . . . . . . . . . . . . . . . . . . . . . . . . . . . . 2012 Numerical values of notification methods . . . . . . . . . . . . . . . . . . . . . . . . . . . . . . . . . . . . . . . . . . . . 2813 Element listing information - RXPerformance area menu . . . . . . . . . . . . . . . . . . . . . . . . . . . . . . . . . . 3614 Element listing information - Advanced Configuration Menu . . . . . . . . . . . . . . . . . . . . . . . . . . . . . . . 4015 Element listing information - threshold boundary menu . . . . . . . . . . . . . . . . . . . . . . . . . . . . . . . . . . . 4216 Advanced configuration options . . . . . . . . . . . . . . . . . . . . . . . . . . . . . . . . . . . . . . . . . . . . . . . . . . 4717 Switch status policy monitor health factors . . . . . . . . . . . . . . . . . . . . . . . . . . . . . . . . . . . . . . . . . . . 5218 Environment class threshold defaults. . . . . . . . . . . . . . . . . . . . . . . . . . . . . . . . . . . . . . . . . . . . . . . . 6019 Fabric Class threshold defaults . . . . . . . . . . . . . . . . . . . . . . . . . . . . . . . . . . . . . . . . . . . . . . . . . . . 6220 AL_PA performance monitor class threshold defaults. . . . . . . . . . . . . . . . . . . . . . . . . . . . . . . . . . . . . 6321 Customer-Defined performance monitor class threshold defaults . . . . . . . . . . . . . . . . . . . . . . . . . . . . . 6322 End-to-End performance monitor class threshold defaults . . . . . . . . . . . . . . . . . . . . . . . . . . . . . . . . . . 6423 Port Class threshold defaults . . . . . . . . . . . . . . . . . . . . . . . . . . . . . . . . . . . . . . . . . . . . . . . . . . . . . 6424 E-Port class threshold defaults . . . . . . . . . . . . . . . . . . . . . . . . . . . . . . . . . . . . . . . . . . . . . . . . . . . . 6525 F/FL-Port class threshold defaults . . . . . . . . . . . . . . . . . . . . . . . . . . . . . . . . . . . . . . . . . . . . . . . . . . 6626 Resource class threshold defaults . . . . . . . . . . . . . . . . . . . . . . . . . . . . . . . . . . . . . . . . . . . . . . . . . . 6727 Security class threshold defaults . . . . . . . . . . . . . . . . . . . . . . . . . . . . . . . . . . . . . . . . . . . . . . . . . . . 6828 SFP Class Threshold Defaults . . . . . . . . . . . . . . . . . . . . . . . . . . . . . . . . . . . . . . . . . . . . . . . . . . . . . 70

6

Fabric OS 5.x Fabric Watch administrator guide 7
About this guideThis administrator guide provides information about:
• Setting up HP StorageWorks Fabric Watch software• Managing your SAN via HP StorageWorks Fabric Watch software
Intended audienceThis guide is intended for:
• system administrators responsible for setting up HP StorageWorks Fibre Channel Storage Area Network (SAN) switches
• technicians responsible for maintaining the Fabric Operating System (OS)
Related documentationDocumentation, including white papers and best practices documents, is available on the HP web site:
http://www.hp.com/country/us/eng/prodserv/storage.html
To access current Fabric OS 5.x related documents:
1. Locate the IT storage Products section of the web page.2. Under Networked storage, click SAN Infrastructure.3. From the SAN Infrastructure web page, locate the SAN Infrastucture products section.4. Click Fibre Channel Switches.5. Locate the B-Series-Fabric-Enterprise Class section.6. To access Fabric OS 5.x documents (such as this document), click 4/256 SAN Director and 4/256 SAN
Director power pack. The switch overview page displays.
7. Go to the Product Information section, located on the right side of the web page.8. Click Technical documents.9. Follow the onscreen instructions to download the applicable documents.

8
Document conventions and symbols
WARNING! Indicates that failure to follow directions could result in bodily harm or death.
CAUTION: Indicates that failure to follow directions could result in damage to equipment or data.
IMPORTANT: Provides clarifying information or specific instructions.
NOTE: Provides additional information.
TIP: Provides helpful hints and shortcuts.
Table 1 Document conventions
Convention Element
Medium blue text: Figure 1 Cross-reference links and e-mail addresses
Medium blue, underlined text (http://www.hp.com)
Web site addresses
Bold font • Key names
• Text typed into a GUI element, such as into a box
• GUI elements that are clicked or selected, such as menu and list items, buttons, and check boxes
Italics font Text emphasis
Monospace font • File and directory names
• System output
• Code
• Text typed at the command-line
Monospace, italic font • Code variables
• Command-line variables
Monospace, bold font Emphasis of file and directory names, system output, code, and text typed at the command line

Fabric OS 5.x Fabric Watch administrator guide 9
HP technical supportTelephone numbers for worldwide technical support are listed on the HP support web site: http://www.hp.com/support/.
Collect the following information before calling:
• Technical support registration number (if applicable)• Product serial numbers• Product model names and numbers• Applicable error messages• Operating system type and revision level• Detailed, specific questions
For continuous quality improvement, calls may be recorded or monitored.
HP strongly recommends that customers sign up online using the Subscriber's choice web site: http://www.hp.com/go/e-updates.
• Subscribing to this service provides you with e-mail updates on the latest product enhancements, newest versions of drivers, and firmware documentation updates as well as instant access to numerous other product resources.
• After signing up, you can quickly locate your products by selecting Business support and then Storage under Product Category.
HP-authorized resellerFor the name of your nearest HP-authorized reseller:
• In the United States, call 1-800-282-6672.• Elsewhere, visit the HP web site: http://www.hp.com. Then click Contact HP to find locations and
telephone numbers.
Helpful web sitesFor other product information, see the following HP web sites:
• http://www.hp.com • http://www.hp.com/go/storage • http://www.hp.com/support/ • http://www.docs.hp.com

10

Fabric OS 5.x Fabric Watch administrator guide 11
1 An introduction to Fabric WatchThis chapter contains the following information:
• Fabric Watch overview, page 11• Introduction to fabric health, page 12
Fabric Watch overviewFabric Watch is an optional Storage Area Network (SAN) monitoring software for B-Series HP StorageWorks switches running Fabric OS 2.2 or higher. It enables each switch to constantly watch its SAN fabric for potential faults and to automatically alert you to problems long before they become costly failures.
Fabric Watch tracks a variety of SAN fabric elements, events, and counters. Monitoring fabric-wide events, ports, GBICs, and environmental parameters enables early fault detection and isolation as well as performance measurement. You can select custom fabric elements and alert thresholds or choose from a selection of preconfigured settings. You can also easily integrate Fabric Watch with enterprise systems management solutions.
By implementing Fabric Watch, you can rapidly improve SAN availability and performance without installing new software or system administration tools.
For a growing number of organizations, SAN fabrics are a mission-critical part of their systems architecture. These fabrics can include hundreds of elements, such as hosts, storage devices, switches, and inter-switch links (ISLs). An instrumentation solution for SANs delivers optimal value by tracking a wide spectrum of fabric events. For instance, Fabric Watch monitors:
• Fabric resources, including fabric reconfigurations, zoning changes, and new logins.• Switch environmental functions such as temperature, power supply, and fan status, along with security
violations.• Port state transitions, errors, and traffic information for multiple port classes as well as operational
values for supported models of “Smart” GBICs/SFPs.• Performance information for AL_PA, end-to-end, and SCSI command metrics.
Fabric Watch lets you define notification thresholds. Whenever fabric elements exceed these thresholds, Fabric Watch automatically provides notification using several methods, including email messages, SNMP traps, and log entries.
Fabric Watch provides the following two types of automatic notifications:
• A continuous alarm provides a warning message whenever a threshold is breached; it continues to send alerts until the condition is corrected. For example, if a switch exceeds its temperature threshold, Fabric Watch activates an alarm at every measurement interval until the temperature returns to an acceptable level.
• A triggered alarm generates the first warning when a threshold condition is reached and a second alarm when the threshold condition is cleared.
Fabric Watch provides event notifications in several different formats to ensure that event details are accessible from all platforms and operating systems. In response to an event, Fabric Watch can record event data as any (or all) of the following:
• Simple Network Management Protocol (SNMP) trapFollowing an event, Fabric Watch transmits critical event data as an SNMP trap. Support for SNMP makes Fabric Watch readily compatible with both network and enterprise management solutions.
• Event log entryFollowing an event, Fabric Watch adds an entry to the internal Event Log for an individual switch, which stores up to 1024 error messages.
• Lock port log

12 An introduction to Fabric Watch
Following an event, Fabric Watch adds an entry to the internal port log for an individual switch and freezes the log to ensure that detail-level information is available.
• RapiTrapFollowing an event, Fabric Watch forwards event information to a proxy switch, which then forwards the information to a server to notify you.
• Email notificationFollowing an event, Fabric Watch creates and sends an Informational email to a designated recipient.
Fabric Watch is designed for rapid deployment. Simply enabling Fabric Watch permits immediate fabric monitoring. Fabric Watch is also designed for rapid custom configuration. You can easily create and modify configuration files using a text editor and then distribute configurations to all the switches in the SAN through the Fabric OS configuration management utility. Fabric Watch also comes with preconfigured profiles for rapid implementation.
Introduction to fabric healthFabric health refers to the capability of the fabric to support data to be routed through it. A healthy fabric enables effective data transmission between networked devices.
Although the concept of fabric health initially seems fairly simple, it can be a deep and complex topic due to the number of factors that are involved. One of the more obvious criteria for fabric health is the condition of the network hardware. A switch or port failure could easily prevent data packets from reaching their destination. Network traffic can also influence fabric health.
If the number of packets routed through a port exceeds the port bandwidth, it causes network delays and packet losses. Even environmental factors can become issues, as network hardware can fail to function properly when stored in locations that do not meet the environmental conditions for the device. For example, switches can fail when stored in rooms that are too hot.
Because of the varied and complex factors in determining fabric health, you need fabric monitoring software such as Fabric Watch to help you to quickly detect, identify, and resolve fabric health issues by continuously monitoring possible issues and reporting any potential concerns. Fabric Watch automatically provides detailed reports on detected issues and helps you correct failures.
Fabric Watch provides customizable monitoring thresholds. You can configure Fabric Watch to provide notification before problems arise, such as reporting when network traffic through a port is approaching the bandwidth limit. This information enables you to perform preemptive network maintenance such as trunking or zoning and avoid potential network failures.

Fabric OS 5.x Fabric Watch administrator guide 13
2 Fabric Watch conceptsThis chapter contains the following sections:
• Fabric watch components, page 13• Configuring events, page 19• Port persistence, page 25• Notification methods, page 25• Switch policies, page 27• Interpreting event messages, page 27
Fabric watch componentsFabric Watch uses a hierarchical organization to track the network device information it monitors. There is a class, area, and element associated with every monitored behavior. Classes are the highest level in the system, subdivided into one or more areas. Areas contain one or more elements.
The following sections explain this hierarchy and its application within Fabric Watch.
ClassesClasses are high-level categories of elements. Classes are intentionally wide groupings of similar fabric devices or fabric data.
Examples of classes include Port (which includes all physical ports on a switch), Security (which includes information related to unauthorized login attempts), and Environment (which contains information related to the room temperature, supplied power and fan assemblies).
In some cases, classes are divided into subclasses. This additional level in the hierarchy increases the flexibility of setting monitoring thresholds. You can use subclasses to add additional event monitoring to fabric objects that meet the requirements of a subclass.
For example, ports connected to another switch can be monitored using both the Port class and E_Port subclass. You can configure general port monitoring using the Port class and monitoring specific to a type of port using the E_Port class. Ports connected to another switch can trigger events based on either of these configurations. Ports that are not connected to another switch are not affected by the additional monitoring configured into the E_Port class.
Table 2 describes the classes into which Fabric Watch groups all switch and fabric elements.
Table 2 Fabric Watch classes
Class Description
Environment Includes information about the physical environment in which the switch resides and the internal environment of the switch. For example, an Environment-class alarm alerts you to problems or potential problems with temperature and power.
Fabric Groups areas of potential problems arising between devices, including interswitch link (ISL) details, zoning, and traffic. A Fabric-class alarm alerts you to problems or potential problems with interconnectivity.
Field Replaceable Unit (FRU)
Monitors the status of FRUs and provides an alert when a part replacement is needed. This class monitors states, not thresholds.

14 Fabric Watch concepts
AreasWhile classes represent large groupings of information, areas represent the information that Fabric Watch monitors. For example, switch temperature, one of the values tracked by Fabric Watch, is an area within the class Environment.
The tables in this section describe all of the areas monitored by Fabric Watch, organized by their associated classes.
Environment class areasTable 3 lists and describes the Fabric Watch areas in the Environment class.
Performance Monitor Serves as a tuning tool. Performance Monitor classes group areas that track the source and destination of traffic. Use the Performance Monitor class thresholds and alarms to determine traffic load and flow and to reallocate resources appropriately.
The Performance Monitor class is divided into the areas AL_PA Performance Monitor, EE (end-to-end) Performance Monitor, and Filter Performance Monitor.
Port Enables you to set additional thresholds, specific to different types of ports.
The Port class is divided into separate classes:
E_Port class—Represents ports connected to another switch.
F/FL_Port class —Represents fabric or fabric loop ports that are made of copper or optical fiber.
Resource Monitors flash memory. It calculates the amount of flash space consumed and compares it to a defined threshold.
Security Monitors all attempts to breach your SAN security, helping you fine-tune your security measures.
SFP Groups areas that monitor the physical aspects of SFPs. An SFP class alarm alerts you to a SFP malfunction fault.
Table 2 Fabric Watch classes (continued)
Class Description
Table 3 Environment class areas
Area Description
Fan Refers to the speed of the fans inside the switch, in revolutions per minute. It is important that the fans spin quickly enough to keep the ambient temperature from rising to levels at which switch damage might occur.
Power Supply Monitors whether power supplies within the switch are on, off, present, or absent. Fabric Watch monitors power supplies to be sure that power is always available to a switch.
Temperature Refers to the ambient temperature inside the switch, in degrees Celsius. Temperature sensors monitor the switch in case the temperature rises to levels at which damage to the switch might occur.

Fabric OS 5.x Fabric Watch administrator guide 15
Fabric class areasTable 4 lists Fabric Watch areas in the Fabric class and describes each area.
FRU class areasTable 5 lists Fabric Watch areas in the FRU class and describes each area. Possible states for all FRU-class areas are absent, faulty, inserted, on, off, ready, and up.
Supported FRU areas depend on your particular HP switch model. The Slot and WWN areas are not supported for the following switches:
Table 4 Fabric class sreas
Area Description
Domain ID Changes Monitors forcible domain ID changes. Forcible domain ID changes occur when there is a conflict of domain IDs in a single fabric and the principal switch has to assign another domain ID to a switch.
Fabric Logins Occurs when ports and devices initialize with the fabric.
Fabric Reconfiguration
Tracks the number of reconfigurations of the fabric. Fabric reconfiguration occurs when:
• Two fabrics with the same domain ID are connected.• Two fabrics are joined.• An E_Port has gone offline.• A principal link has segmented from the fabric.
Loss of E_Port Tracks the number of times that an E_Port goes down. E_Ports go down each time you remove a cable or an SFP (where there are SFP failures or transient errors).
Segmentation Changes
Tracks the cumulative number of segmentation changes. Segmentation changes occur due to:
• Zone conflicts.• Incompatible link parameters. During E_Port initialization, ports
exchange link parameters, and incompatible parameters result in segmentation. This is a rare event.
• Domain conflicts.• Segmentation of the principal link between two switches.
SFP State Changes Indicates whether the state of the SFP is normal or faulty, on or off. A faulty or off state means that you must reinsert, turn on, or replace the SFP. Fabric Watch monitors only Digital Diagnostic SFP.
Zoning Changes Tracks the number of zone changes. Because zoning is a security provision, frequent zone changes might indicate a security breach or weakness. Zone change messages occur whenever there is a change in zone configurations.
Table 5 FRU class areas
Area Indicates
Slot State of a slot has changed.
Power Supply State of a power supply has changed.
Fan State of a fan has changed.
WWN State of a WWN card has changed.

16 Fabric Watch concepts
• HP StorageWorks SAN Switch 2/8V, 2/16V and 2/16N• HP StorageWorks SAN Switch 2/32• HP StorageWorks SAN Switch 4/32
Performance monitor class areasTable 6 lists Fabric Watch areas in the Performance Monitor class and describes each area.
Port class areasTable 7 lists and describes the Fabric Watch areas in the port class.
Table 6 Performance monitor class areas
Area Indicates
Customer Define Relies on performance monitor telnet commands. For more information on this area, refer to the HP StorageWorks Fabric OS 5.x command reference guide.
Invalid CRC Errors have been detected in the Fibre Channel frame. Invalid CRC messages occur when the number of CRC errors in Fibre Channel frames for specific source ID (S_ID) and destination ID (D_ID) pairs change. These messages can also be caused by dirty or aging equipment and temperature fluctuations.
Receive Performance The percentage of word frames traveling from the configured S_ID to the D_ID exceeds the configured thresholds.
Transmit Performance The percentage of word frames traveling from the configured S_ID to the D_ID; user configuration triggers these messages, so you can use the Transmit Performance area to tune your network.
Table 7 Port class areas
Area Indicates
Invalid Cyclic Redundancy Checks (CRCs)
A frame is invalid and cannot be transmitted. Invalid CRCs can represent noise on the network. Such frames are recoverable by retransmission. Invalid CRCs indicate a potential hardware problem. These errors occur mostly in aging fabrics.
Invalid Transmission Word
A word did not transmit successfully. Invalid word messages usually indicate a hardware problem.
Link Failure Count A link loses signal. Both physical and hardware problems can cause link failures. Link failures frequently occur due to a loss of synchronization. Check for concurrent loss of synchronization errors and, if applicable, troubleshoot those errors. Link failures also occur due to hardware failures.
Loss of Signal Count The number of times that a signal loss occurs in a port. Signal loss indicates that no data is moving through the port. A loss of signal usually indicates a hardware problem.
Loss of Synchronization (Sync) Count
Two devices failed to communicate at the same speed. Synchronization losses are always accompanied by link failure. Loss of synchronization errors frequently occur due to a faulty SFP or cable.
Primitive Sequence Protocol Error
A CRC sum disparity. Occasionally, these errors occur due to software glitches. Persistent errors occur due to hardware problems.

Fabric OS 5.x Fabric Watch administrator guide 17
Resource class areaTable 8 describes the Fabric Watch resource class area.
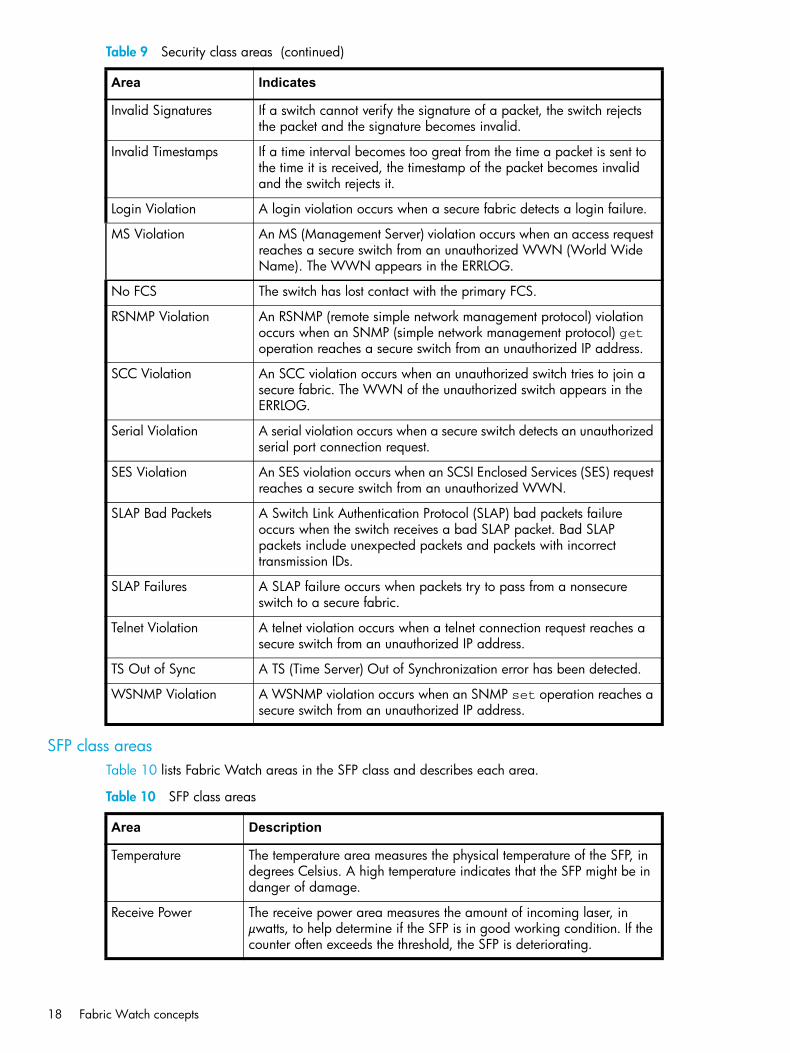
Security class areasTable 9 lists Fabric Watch areas in the security class and describes what each area indicates. For details on each area, refer to the HP StorageWorks Fabric OS 5.x secure fabric administrator guide.
Receive (RX) Performance The percentage of maximum bandwidth consumed in packet receipts.
State Changes The state of the port has changed for one of the following reasons:
• The port has gone offline.• The port has come online.• The port is testing.• The port is faulty.• The port has become an E_Port.• The port has become an F/FL_Port.• The port has segmented.• The port has become a trunk port.
Transmit (TX) Performance The percentage of maximum bandwidth consumed in packet transmissions.
Table 7 Port class areas (continued)
Area Indicates
Table 8 Resource class area
Area Description
Flash Monitor Monitors the compact flash space available by calculating the percentage of flash space consumed and comparing it with the configured high threshold value.
Table 9 Security class areas
Area Indicates
API Violation An API access request reaches a secure switch from an unauthorized IP address.
DCC Violation An unauthorized device attempts to log in to a secure fabric.
Front Panel Violation A secure switch detects unauthorized front panel access.
HTTP Violation A browser access request reaches a secure switch from an unauthorized IP address.
Illegal Command Commands permitted only to the primary Fibre Channel Switch (FCS) are executed on another switch.
Incompatible DB Secure switches with different version stamps have been detected.
Invalid Certificates The primary FCS sends a certificate to all switches in the secure fabric before it sends configuration data. Receiving switches accept only packets with the correct certificate; any other certificates are invalid and represent an attempted security breach.
18 Fabric Watch concepts
SFP class areasTable 10 lists Fabric Watch areas in the SFP class and describes each area.
Invalid Signatures If a switch cannot verify the signature of a packet, the switch rejects the packet and the signature becomes invalid.
Invalid Timestamps If a time interval becomes too great from the time a packet is sent to the time it is received, the timestamp of the packet becomes invalid and the switch rejects it.
Login Violation A login violation occurs when a secure fabric detects a login failure.
MS Violation An MS (Management Server) violation occurs when an access request reaches a secure switch from an unauthorized WWN (World Wide Name). The WWN appears in the ERRLOG.
No FCS The switch has lost contact with the primary FCS.
RSNMP Violation An RSNMP (remote simple network management protocol) violation occurs when an SNMP (simple network management protocol) get operation reaches a secure switch from an unauthorized IP address.
SCC Violation An SCC violation occurs when an unauthorized switch tries to join a secure fabric. The WWN of the unauthorized switch appears in the ERRLOG.
Serial Violation A serial violation occurs when a secure switch detects an unauthorized serial port connection request.
SES Violation An SES violation occurs when an SCSI Enclosed Services (SES) request reaches a secure switch from an unauthorized WWN.
SLAP Bad Packets A Switch Link Authentication Protocol (SLAP) bad packets failure occurs when the switch receives a bad SLAP packet. Bad SLAP packets include unexpected packets and packets with incorrect transmission IDs.
SLAP Failures A SLAP failure occurs when packets try to pass from a nonsecure switch to a secure fabric.
Telnet Violation A telnet violation occurs when a telnet connection request reaches a secure switch from an unauthorized IP address.
TS Out of Sync A TS (Time Server) Out of Synchronization error has been detected.
WSNMP Violation A WSNMP violation occurs when an SNMP set operation reaches a secure switch from an unauthorized IP address.
Table 9 Security class areas (continued)
Area Indicates
Table 10 SFP class areas
Area Description
Temperature The temperature area measures the physical temperature of the SFP, in degrees Celsius. A high temperature indicates that the SFP might be in danger of damage.
Receive Power The receive power area measures the amount of incoming laser, in µwatts, to help determine if the SFP is in good working condition. If the counter often exceeds the threshold, the SFP is deteriorating.

Fabric OS 5.x Fabric Watch administrator guide 19
ElementsFabric Watch defines an element as any fabric or switch component that the software monitors. Within each area, there are a number of elements equivalent to the number of components being monitored. For instance, in the Core Switch 2/64, each area of the Port class will include 64 elements.
Each element contains information pertaining to the description suggested by the area. To continue the Ports example, each element in the Invalid word area of Ports would contain exactly 64 ports, each of which would contain the number of times invalid words had been received by the port over the last time interval. Each of these elements maps to an index number, so that all elements can be identified in terms of class, area, and index number. As an example, the monitoring of the temperature sensor with an index of one may be viewed by accessing the first temperature sensor within the temperature area of the environment class.
Subclasses are a minor exception to the above rule. Subclasses, such as E_Ports, contain areas with elements equivalent to the number of valid entries. Within the same example used thus far in this section, in a 64-port switch in which eight ports are connected to another switch, each area within the E_Port class would contain eight elements.
Each area of a subclass with defined thresholds will act in addition to the settings applied to the element through the parent class. Assignment of elements to subclasses does not need to be performed by a network administrator. These assignments are seamlessly made through automated detection algorithms.
Configuring eventsThe following area attributes are used to define and detect events in Fabric Watch:
• ”Event behavior types” on page 19• ”Data values” on page 20• ”Threshold values” on page 20• ”Time bases” on page 21• ”Event settings” on page 23
You can customize the information reported by Fabric Watch by configuring event behavior types, threshold values, time bases, and event settings. You cannot change data values; these represent switch behavior that is updated by the software.
Event behavior typesBased on the number of notifications delivered for events there are two categories of event behavior types:
• ”Continuous event behavior” on page 19• ”Triggered event behavior” on page 20
Continuous event behaviorAreas with event behavior types set to continuous trigger events in every sample period until the fabric no longer meets the criteria defined for the event.
For example, you can configure Fabric Watch to notify you during every sample period that a port is at full utilization. This information can help you plan network upgrades.
Transmit Power The transmit power area measures the amount of outgoing laser, in µwatts. Use this to determine the condition of the SFP. If the counter often exceeds the threshold, the SFP is deteriorating.
Current The current area measures the amount of supplied current to the SFP transceiver. Current area events indicate hardware failures.
Supply Voltage The supply voltage area measures the amount of voltage supplied to the SFP. If this value exceeds the threshold, the SFP is deteriorating.
Table 10 SFP class areas (continued)
Area Description

20 Fabric Watch concepts
Triggered event behaviorIf you do not want notification during each sample period from the port hardware failure to the time of its repair, you can define the event behavior as triggered.
When an event behavior is defined as triggered, Fabric Watch sends only one event notification when the fabric meets the criteria for the event. It does not send out any more notifications.
For example, when a port fails, Fabric Watch sends you a notification of the failure. After you repair the port, Fabric Watch detects the repair. At this time, Fabric Watch determines that the fabric no longer meets the event criteria, and watches for the error again. The next time the port fails, it sends you another notification.
Data valuesA data value represents an aspect of a fabric in three ways: counter value, measured value or state value. Data values are updated by Fabric Watch approximately every six seconds. You cannot change them.
Counter value is the total number of times that a given event has occurred. For each monitored event during the time period, the value is incremented.
Measured value is the current, measurable value of a fabric or fabric element, such as environmental temperature or fan speed.
State value, which is the only qualitative data value, provides information on the overall state of a fabric component, such as the physical health of a fan. Instead of numerical data, state values contain information on whether components are faulty, active, or in another state.
Fabric Watch compares counter values and measured values to a set of configurable limits to determine whether fabric monitoring has occurred and whether to notify you. You must set appropriate threshold boundaries to trigger an event.
State values are handled differently, as Fabric Watch monitors state values for certain states, which you can select. When a state value transitions to one of the monitored states, an event is triggered.
Threshold valuesThreshold values are of the following types:
• ”High and low thresholds” on page 20• ”Buffer values” on page 20
High and low thresholdsHigh and low threshold values are the values at which potential problems might occur. For example, in configuring a temperature threshold, you can select the temperatures at which a potential problem can occur due to both overheating and freezing.
You can compare high and low thresholds with a data value. The units of measurement are the same as that of the associated data.
Buffer valuesYou can use buffer values to reduce the occurrence of events due to data fluctuation. When you assign a buffer value, it is used to create a zone in which events cannot occur both above the high threshold and below the low threshold.

Fabric OS 5.x Fabric Watch administrator guide 21
Figure shows an example in which each time a signal crosses the high limit, an event occurs. The blue arrows indicate the area where the event criteria is met. In this case, there is a great deal of fluctuation. Even when the monitor is set to triggered, a number of messages are sent.
Figure 1 Threshold monitoring
Figure shows how to limit the number of event notifications using a buffer. When you specify a buffer, events cannot occur both above the high threshold and below the low threshold. Event notification occurs only where the arrow indicates. The event criteria is continued to be met until the data sensed falls below the high threshold value.
Figure 2 A buffered data region
Time basesTime bases are time periods within Fabric Watch. This configurable field impacts the comparison of sensor-based data with user-defined threshold values.
Setting time base to noneIf you set a time base to none, Fabric Watch compares a data value against a threshold boundary level. When the absolute value of the measuring counter exceeds the threshold boundary, an event is triggered.
Figure shows a high limit of 65 degrees Celsius placed on a counter measuring temperature. During each sample period, Fabric Watch measures the temperature is measured and compares it against the high threshold. If the measured temperature exceeds the high threshold, it triggers an event.
Figure 3 Time base set to none

22 Fabric Watch concepts
Specifying a time baseIf you specify a time base value other than none (seconds, minute, hour, or day), Fabric Watch does not use the current data value. Instead, it calculates the difference between the current data value and the data value as it existed one time base ago. It compares this difference to the threshold boundary limit.
For example, if you specify the time base minute, Fabric Watch calculates the counter value difference between two samples a minute apart. It then compares the difference (current data value – data value one minute ago) against the preset threshold boundary.
When you set a time base to a value other than none, there are two main points to remember when configuring events:
• Fabric Watch triggers an event only if the difference in the data value exceeds the preset threshold boundary limit.
• Even if the current data value exceeds the threshold, Fabric Watch does not trigger an event if the rate of change is below the threshold limit.
The following examples illustrate each point.
Example1: Triggering an Event
Figure shows a sample graph of data obtained by Fabric Watch (the type of data is irrelevant to the example). A high threshold of 2 is specified to trigger an event. A time base of minute is defined. An event occurs only if the rate of change in the specific interval (one minute in this example) is across the threshold boundary. It should be either higher than the high threshold limit or lower than the low threshold limit. As illustrated on the tenth sample, the counter value changes from 0 to 1; hence calculated rate of change is 1 per minute. At the thirteenth sample, the rate of change is 2 per minute. The rate of change must be at least 3 per minute to exceed the event-triggering requirement of 2, which is met on the eighteenth sample.
Figure 4 Event trigger
Example 2: Not Triggering an Event
Figure uses the same data to illustrate a case in which a threshold is exceeded without triggering an event. In this case, the calculated rate of change in the data value is always less than or equal to the high threshold of 2. At the tenth sample, the rate of change is one per minute. At the fourteenth, twenty-first, and twenty-fifth sample, the rate of change remains equal to the high threshold of 2. In this case, Fabric Watch

Fabric OS 5.x Fabric Watch administrator guide 23
does not trigger an event even though the absolute value of the counter reaches 4, which is well above the high threshold.
Figure 5 Example without an event
Event settingsThis section describes how Fabric Watch compares a fabric element’s data value against a threshold value to determine whether or not to trigger an event. It describes how a specified buffer zone impacts event triggering.
Fabric Watch monitors data values for one of the following conditions:
• ”Above event triggers” on page 23• ”Below event trigger” on page 24• ”Changed event trigger” on page 24• ”In-Between triggers” on page 24
For Fabric Watch to monitor these conditions, the alarm setting must be set to a non-zero value.
Above event triggersUse the Above event trigger for an element that requires only high threshold monitoring. In the Above event trigger, Fabric Watch triggers an event immediately after the data value becomes greater than the high threshold.
Define a buffer zone within the operational limit of an area to suppress multiple events when the counter value fluctuates above the high threshold and buffer zone. Figure shows an Above event trigger with a buffer zone.When a buffer is used, the data value must be greater than the sum of the high threshold and the buffer value (event 1 in Figure ). When the data value becomes less than the high threshold again, Fabric Watch triggers a second event (event 2) to indicate that it has returned to normal operation.
Figure 6 Above event trigger with buffer zone

24 Fabric Watch concepts
Below event triggerThe Below event trigger generates an event when a data value becomes less than the low threshold boundary.
When a buffer is defined, the data value must be below the buffer value and the low threshold.
Changed event triggerUse the Changed event trigger for an element that requires “rate of change” monitoring. When Fabric Watch detects a change in the counter value between two sample periods (defined by the time base), it triggers an event regardless of high or low threshold settings. Figure shows events generated when the data value changes. Each arrow in the figure indicates a generated event.
Figure 7 Changed threshold
Use Changed event triggers with discretion. They are most useful when a change in value is expected to be rare. Monitoring a fabric element that is subject to frequent change generates so many events that it can render it virtually useless. For example, this trigger type is appropriate for FRU failures. It is not appropriate for temperature monitoring.
In-Between triggersFabric Watch event triggers are usually set to notify the user of a warning or failure condition, but there is an exception. You can define the In-Between trigger to receive a notification of fault recovery. For example, when measuring port performance, crossing the high threshold triggers an Above threshold event, which displays a warning message. The threshold might be crossed for a period so brief that is not a true cause for an alarm. An In-Between trigger indicates that the port performance has returned to the acceptable range.
Use the In-Between trigger to:
• Verify a successful recovery from a faulty condition.• Reset the counter value for the next event.• Identify an element that is consistently operating under marginal condition.
Figure illustrates event notification using an In-Between trigger. The arrow marked with one indicates the point at which event notification occurs.
Figure 8 In-Between trigger

Fabric OS 5.x Fabric Watch administrator guide 25
Port persistenceIn the case of port monitoring, there is an additional factor to consider. The data collected in port monitoring can vary a lot over short time periods. Therefore, the port can become a source of frequent event messages (the data can exceed the threshold range and return to a value within the threshold range).
Fabric Watch uses port persistence for a port event that requires the transition of the port into a marginal status. Fabric Watch does not record any event until the event persists for a length of time equal to the port persistence time. If the port returns to normal boundaries before the port persistence time elapses, Fabric Watch does not record any event.
The port persistence time is measured in seconds, and can be configured. Configuring the port persistence time to zero disables this feature.
Notification methodsThere are five notification methods available through Fabric Watch, but not all notification methods can be applied to all of the classes. Valid notification methods are represented through the valid alarm matrix.
Fabric Watch provides the following notification methods:
• ”Switch event (error) log entry” on page 25• ”SNMP trap” on page 25• ”RAPITrap” on page 26• ”Port log lock” on page 26• ”Email alert” on page 26
To enable event settings, you must set the associated attribute to a nonzero value between one and thirty one. The exact value you specify determines which event notification method Fabric Watch uses if the event setting criteria is met.
For details about valid notification methods in the alarm matrix, see ”Assigning notification methods” on page 26.
Switch event (error) log entryThe switch event (error) log holds up to 1024 entries. This error log stores event information but does not actively send alerts. Use the ErrShow command to view the log.
Log entries can also trigger SNMP traps if the SNMP agent is configured. When the SNMP agent is configured to a specific error message level, then error messages at that level triggers SNMP traps. For information on configuring the SNMP agent using the agtCfgSet command, see the HP StorageWorks Fabric OS 5.x command reference guide.
SNMP trapThe Simple Network Management Protocol (SNMP) performs an operation called a trap that notifies a management station (a workstation that runs network management applications using SNMP protocol) when events occur.
You must configure the software to receive trap information from the network device. You must also configure the SNMP agent on the switch to send the trap to the management station using the agtCfgSet command. For more information on this command, refer to theHP StorageWorks Fabric OS 5.x command reference guide.
An SNMP trap forwards the following information to an SNMP management station:
• Name of the element whose counter registered an event• Class, area, and index number of the threshold that the counter crossed• Event type• Value of the counter that exceeded the threshold• State of the element that triggered the alarm• Source of the trap

26 Fabric Watch concepts
The trap stores event information but does not actively send alerts. Port changes do not generate SNMP traps.
RAPITrapRAPITrap is a Fabric Watch alarm that actively alerts you to events. After you enable RAPITrap, Fabric Watch forwards all event information to a designated proxy switch. The host API automatically configures the proxy switch, based on firmware version. The switch forwards the information to a server and alerts the SAN manager to event activity.
Third-party applications that use the Brocade API determine the manner that RAPITrap presents alarms to the user.
Port log lockThe port log locks to retain detailed information about an event preventing the information from being overwritten as the log becomes full. This alarm stores event information but does not actively send alerts, which is done automatically when some thresholds are exceeded and an alert is triggered.
NOTE: tFor more information about locking, unlocking, and clearing the port log, refer to the HP StorageWorks Fabric OS 5.x command reference guide.
Email alertEmail alert sends information about a switch event to a specified email address. Email alert can send information about any error from any element, area, and class.
The email specifies the threshold and describes the event, much like an error message. Use the fwMailCfg command to configure email alerts.
NOTE: To send email alerts, the switch must be connected to a DNS server.
Assigning notification methodsSpecify the particular notification method that you want Fabric Watch to use by assigning it a value. Table 11 shows the numerical values for each notification method.
To determine the value for the event setting attribute that enables all desired notification methods, add the values assigned to each method. For example, to enable SNMP trap, RapiTrap and email notification, use the value 22, which is equal to the sum of 2, 4, and 16.
Not all notification methods are valid for all areas. Every area has an associated valid alarm matrix, which is the sum of all valid notification methods for that area. For example, an area with a valid alarm matrix of 25 allows the error log entry (1), port log lock (8) and e-mail notification (16) methods, but does not allow the SNMP trap (2) or RapiTrap (4) methods.
An area with a valid alarm matrix of 31 allows all of the notification types.
Table 11 Numerical values of notification methods
Notification method Assigned value
Error Log Entry 1
SNMP Trap 2
RapiTrap 4
Port Log Lock 8
E-mail Notification 16

Fabric OS 5.x Fabric Watch administrator guide 27
Switch policiesSwitch policies are a series of rules that define specific states for the overall switch. Fabric OS interacts with Fabric Watch using these policies. Each rule defines the number of types of errors that transitions the overall switch state into a state that is not healthy. For example, you can specify a switch policy so that if a switch has two port failures, it is considered to be in a marginal state; if it has four failures, it is in a down state.
You can define these rules for a number of classes and field replaceable units, including ports, power supplies, flash memory and fans.
NOTE: See Chapter 5, to view the current switch policies using the switch policy report.
Interpreting event messagesFor information on specific error messages generated by Fabric Watch, refer to the HP StorageWorks Fabric OS 5.x diagnostic and system error messages reference guide..

28 Fabric Watch concepts

Fabric OS 5.x Fabric Watch administrator guide 29
3 Activating and accessing Fabric WatchThis chapter contains the following sections:
• Activating Fabric Watch, page 29• Accessing Fabric Watch, page 29
Activating Fabric WatchFabric Watch must be activated on each switch individually before use. Use telnet or Brocade Advanced Web Tools to activate Fabric Watch, as described next. Web Tools offers a user-friendly graphical interface that most users find convenient.
After it is activated, configure Fabric Watch to monitor your system and its health, as described later in this document.
Activating with telnetTo activate Fabric Watch using telnet commands:
1. Log in as admin.2. Enter licenseShow at the prompt to view a list of activated licenses.
If the Fabric Watch license does not appear in the list, continue to step 3; otherwise, you are ready to use Fabric Watch.
3. Type licenseAdd “key”, where key is the Fabric Watch license key. License keys are case-sensitive, so type the license key exactly as it appears.
4. To verify successful activation, enter licenseShow. If the license does not appear, verify that you typed the key correctly; if you did not, then repeat step 3. If you still do not see the license, verify that the entered key is valid, and that the license key is correct before repeating step 3.
5. Enter fwClassinit to initialize the Fabric Watch classes.
Activating with Advanced Web ToolsTo activate Fabric Watch using Web Tools:
1. Launch your Web browser, enter the switch name or the IP address of the switch in the Address field (for example, http://111.222.33.1), and press Enter.
This launches Web Tools and displays the Fabric view.
2. Click the Admin View button on the relevant switch panel. The login window appears.3. Log in as admin.4. Click the License Admin tab.5. Enter the license key in the License Key: field and click Add License. This activates Fabric Watch.
Accessing Fabric WatchThis section provides a brief overview of the available user interfaces. Further details about Fabric Watch operations for each interface are provided later in this guide. User interfaces include:
swd21:admin> licenseshowSedQyzdQbdTfeRzZ: Web license Zoning licensebedR9dyyzzcfeSAW: Fabric licenseScy9SbRQd9VdzATb: Fabric Watch license
switch:admin> licenseadd "R9cQ9RcbddUAdRAX"

30 Activating and accessing Fabric Watch
• ”Telnet” on page 30• ”Advanced Web Tools” on page 30• ”SNMP-Based enterprise managers” on page 30• ”Configuration file” on page 32
TelnetUse a telnet session to:
• Observe the current monitors on a switch with the fwShow command.• Query and modify threshold and alarm configurations (whether default or customized) with the
fwConfigure command.• View and configure the FRU module with the fwFruCfg command.• View and configure the e-mail addresses to which event messages are sent with the fwMailCfg
command.
To establish a telnet session, use the following command, where switch represents the name or IP address of the switch:
telnet switch
When this command is executed, you are prompted for a username and password. To use Fabric Watch, connect using an account with administrative privileges.
Advanced Web ToolsUse Web Tools to:
• View fabric and switch events.• View and modify threshold and alarm configurations with the Fabric Watch View.• Upload and download the configuration file with the Config Admin tab.• View and configure the FRU module.• View and configure the e-mail addresses to which event messages are sent.
To create a connection to Fabric Watch using Web Tools:
1. Open a Web browser.2. Enter the IP address of the switch into the address field of the Web browser.
The Web browser should display a screen that includes a window similar to the following:
3. To access Fabric Watch View, click the Watch button in this portion of the screen, which appears:
4. When the login window appears, log in as admin.
SNMP-Based enterprise managersUse SNMP-based enterprise managers to:
• Query the MIB variable for individual fabric and switch elements.• Query and modify threshold and alarm configurations.

Fabric OS 5.x Fabric Watch administrator guide 31
• Receive alarm notification via SNMP traps.• View and configure the mail database.
NOTE: The following instructions apply to the AdvantNet MIB browser. There may be some variation in the procedures when other MIB browsers are used.
To configure Fabric Watch with an SNMP-based enterprise manager, begin by connecting to the switch using a MIB browser:
1. Open a MIB browser.2. If not already done, load the appropriate MIB files. First load the Brocade common MIB file, followed
by the Brocade software MIB file. The system should respond with a screen similar to the following:
The MIB browser has populated the left side of the screen with a MIB tree that you can navigate.
3. Begin a telnet session with the switch and issue the agtCfgSet command.
Information on the agtCfgSet command may be found in the HP StorageWorks Fabric OS 5.x command reference guide.
4. Enter the IP address for the switch into the Host field. Enter the community into the Community field. Enter the write community into the Write Community field, if you want to perform set operations.

32 Activating and accessing Fabric Watch
5. Locate the Fabric Watch OID information per the following screen:
Configuration fileUse a configuration file to:
• Upload a configuration file, make changes in a text editor, and download the file to all switches. • Upload and download the configuration file through a telnet session or with Web Tools. Uploading
and downloading a configuration file to multiple switches efficiently populates your SAN with consistent Fabric Watch settings.
For details about configuration file usage, see Appendix C.

Fabric OS 5.x Fabric Watch administrator guide 33
4 Configuring Fabric WatchThis chapter describes the procedures used to configure Fabric Watch and contains the following sections:
• Configuring Fabric Watch thresholds, page 33• Configuring notifications, page 46• Configuring switch status policy, page 49• Configuring FRUs, page 51• Configuring Fabric Watch using Web Tools, page 51• Configuring Fabric Watch using SNMP, page 52
Configuring Fabric Watch thresholdsAfter it is activated, Fabric Watch starts using a set of default factory settings that might vary from system to system, depending on the software version and the switch hardware. You can create custom threshold configurations to suit to your unique environment.
Both the factory default and user-customized Fabric Watch settings are individually maintained. You cannot change the default values. During Fabric Watch configuration, you can select whether Fabric Watch should use the default or custom settings for monitoring.
Configuring Fabric Watch thresholds enables you to define your own unique event conditions (such as threshold traits, alarms, and email configuration). For example, it is unlikely that you would need to change the default values for Environment class because the hardware has been tested so extensively. However, if you anticipate a need for additional notifications, or you need to better gauge performance because of noticeable congestion on certain ports, you might want to configure the values for some thresholds.
The steps to configure Fabric Watch Thresholds include:
Step 1: Select the class and area to configure, page 33
Step 2: Configure thresholds, page 35
Step 3: Configure alarms, page 41
Step 4: Disable and enable thresholds by port (optional), page 45
Step 1: Select the class and area to configureDuring your planning activities, you should determine exactly what elements or monitors you want to configure, and in which class they reside. After you have made this decision, you need to identify the classes.
To navigate to a specific class and area, use the fwConfigure command from a telnet prompt:
1. Log in to the switch as the administrator.2. Enter fwConfigure at the command prompt.3. The fwConfigure menu appears.
swd77:admin> fwconfigure
1 : Environment class2 : SFP class3 : Port class4 : Fabric class5 : E-Port class6 : F/FL Port (Optical) class7 : Alpa Performance Monitor class8 : EE Performance Monitor class9 : Filter Performance Monitor class10 : Security class11 : Resource class12 : QuitSelect a class => : (1..12) [12] 5

34 Configuring Fabric Watch
The fwConfigure menu contains 12 menu items. The first 11 items correspond to the classes available for configuration. Item 12, which is the default, exits the fwConfigure application.
4. From the list displayed, enter the number corresponding to the class that you want to configure. For example, if you enter 5, the menu corresponding to the E-Port class appears.
For each class that you select, Fabric Watch provides a list of the areas of the class available for configuration. The final item in the list, which is always the default, returns you to the previous selection screen.
5. Enter the number corresponding to the area that you want to configure, such as 7 for RXPerformance. Fabric Watch displays a list of monitored elements in this area:
Table 12 describes the column headers in the RXPerformance menu (shown in Table 5.
1 : Link loss2 : Sync loss3 : Signal loss4 : Protocol error5 : Invalid words6 : Invalid CRCS7 : RXPerformance8 : TXPerformance9 : State Changes10 : return to previous pageSelect an area => : (1..10) [10] 7
Index ThresholdName Port CurVal Status LastEvent LasteventTime LastVal LastState=====================================================================================8 eportRXPerf008 8 0 Percentage(%)/min enabled inBetween Wed Aug 25 01:01:05 2004 0 Percentage(%)/min Informative17 eportRXPerf017 17 0 Percentage(%)/min enabled inBetween Wed Aug 25 01:01:05 2004 0 Percentage(%)/min Informative26 eportRXPerf026 26 0 Percentage(%)/min enabled inBetween Wed Aug 25 01:01:11 2004 0 Percentage(%)/min Informative27 eportRXPerf027 27 0 Percentage(%)/min enabled inBetween Wed Aug 25 01:01:11 2004 0 Percentage(%)/min Informative28 eportRXPerf028 28 0 Percentage(%)/min enabled inBetween Wed Aug 25 01:01:11 2004 0 Percentage(%)/min Informative29 eportRXPerf029 29 0 Percentage(%)/min enabled inBetween Wed Aug 25 01:01:11 2004 0 Percentage(%)/min Informative
1 : refresh2 : disable a threshold3 : enable a threshold4 : advanced configuration5 : return to previous pageSelect choice => : (1..5) [5]
Table 12 Element listing information - RXPerformance area menu
Heading Meaning
Index A numeric identifier assigned to the element
ThresholdName A string identifier assigned to the element
Port The user port number
CurVal The current data value contained by the element
Status Monitoring status, either enabled or disabled
LastEvent The last event setting that triggered an event.
LasteventTime The timestamp of the last triggered event for the element

Fabric OS 5.x Fabric Watch administrator guide 35
See ”Fabric watch components” on page 13 for more details about classes and areas.
Step 2: Configure thresholdsAfter you’ve identified and selected the appropriate class and areas, you can configure thresholds for those classes and areas. If you want a basic configuration, accept the default configuration settings. Unless you want to accept the basic (default) configuration, or first disable, enable, or refresh all existing thresholds, proceed to option 4, advanced configuration.
NOTE: For example, you might have ten E-Ports to monitor, but you want to monitor only 8 of them because the remaining 2 are experiencing performance problems. If you disable monitoring for an element, Fabric Watch does not display this information for it.
The RXPerformance area menu displays the following five options, described in the following sections:
1. refreshThe refresh option redraws the screen with the most recently updated monitoring information. After the screen refreshes, the same five options appear.
2. disable a thresholdTo stop monitoring a selected option, use the disable a threshold option, as follows:
1. Enter 2 at the command prompt.
The system generates similar output to the following:
2. Enter the index number of the element for which Fabric Watch should disable monitoring.
LastVal The data value of the element at the time of the last event
LastState The last detected state of the element
Table 12 Element listing information - RXPerformance area menu
Heading Meaning
1 : refresh2 : disable a threshold3 : enable a threshold4 : advanced configuration5 : return to previous page
1 : refresh2 : disable a threshold3 : enable a threshold4 : advanced configuration5 : return to previous pageSelect choice => : (1..5) [5] 2

36 Configuring Fabric Watch
Fabric Watch redraws the element table with the selected element disabled. The second row of information about the selected element does not appear any more, and the status of the element is set to disabled, as follows:
Figure 9 Disabling a threshold
3. enable a thresholdTo start monitoring a selected element, use the enable a threshold option as follows:
1. Enter 3 at the command prompt.
The system generates output similar to the following screen. The output you see varies based on the class and area you selected.
The numerical values shown in between the brackets (in this case, 8-29) correspond to the index numbers of the elements within the area. The first element is always selected by default.
2. Enter the index number of the element for which Fabric Watch should enable monitoring.
Fabric Watch redraws the element table with the selected element enabled. A second row of information about the selected element appears, and the status of the element is set to enabled.
Select threshold index => : (8..29) [8] 8
Index ThresholdName Port CurVal Status LastEvent LasteventTime LastVal LastState================================================================================8 eportRXPerf008 8 0 Percentage(%)/min disabled inBetween Wed Aug 25 01:01:05 2004 0 Percentage(%)/min Informative17 eportRXPerf017 17 0 Percentage(%)/min enabled inBetween Wed Aug 25 01:01:05 2004 0 Percentage(%)/min Informative26 eportRXPerf026 26 0 Percentage(%)/min enabled inBetween Wed Aug 25 01:01:11 2004 0 Percentage(%)/min Informative27 eportRXPerf027 27 0 Percentage(%)/min enabled inBetween Wed Aug 25 01:01:11 2004 0 Percentage(%)/min Informative28 eportRXPerf028 28 0 Percentage(%)/min enabled inBetween Wed Aug 25 01:01:11 2004 0 Percentage(%)/min Informative29 eportRXPerf029 29 0 Percentage(%)/min enabled inBetween Wed Aug 25 01:01:11 2004 0 Percentage(%)/min Informative
1 : refresh2 : disable a threshold3 : enable a threshold4 : advanced configuration5 : return to previous pageSelect choice => : (1..5) 3
Select threshold index => : (8..29) [8] 8
Index ThresholdName Port CurVal Status LastEvent LasteventTime LastVal LastState================================================================================8 eportRXPerf008 8 0 Percentage(%)/min enabled inBetween Wed Aug 25 01:01:05 2004 0 Percentage(%)/min Informative17 eportRXPerf017 7 0 Percentage(%)/min enabled inBetween Wed Aug 25 01:01:05 2004 0 Percentage(%)/min Informative26 eportRXPerf026 26 0 Percentage(%)/min enabled inBetween Wed Aug 25 01:01:11 2004 0 Percentage(%)/min Informative27 eportRXPerf027 27 0 Percentage(%)/min enabled inBetween Wed Aug 25 01:01:11 2004 0 Percentage(%)/min Informative28 eportRXPerf028 28 0 Percentage(%)/min enabled inBetween Wed Aug 25 01:01:11 2004 0 Percentage(%)/min Informative29 eportRXPerf029 29 0 Percentage(%)/min enabled inBetween Wed Aug 25 01:01:11 2004 0 Percentage(%)/min Informative

Fabric OS 5.x Fabric Watch administrator guide 37
4. advanced configurationTo customize Fabric Watch monitoring to suit to your environment, use the advanced configuration option as follows:
1. Enter 4 at the command prompt.
The system generates output similar to the following screen. The output you see varies based on the class and area you select. In the Advanced Configuration menu shown here, the output is based on the E-Port class and RXPerformance area.
NOTE: To ensure that your threshold setting configuration takes effect, remember to change the threshold boundary level to Custom using option 3, and then apply the threshold boundary level settings using option 16.
Table 13 describes the event behavior of each element in the Advanced Configuration menu.
1 : refresh2 : disable a threshold3 : enable a threshold4 : advanced configuration5 : return to previous pageSelect choice => : (1..5) [5] 4
Index ThresholdName BehaviorType BehaviorInt 8 eportRXPerf008 Triggered 1 17 eportRXPerf017 Triggered 1 26 eportRXPerf026 Triggered 1 27 eportRXPerf027 Triggered 1 28 eportRXPerf028 Triggered 1 29 eportRXPerf029 Triggered 1
Threshold boundary level is set at : Default
Default Custom Unit Percentage(%) Percentage(%) Time base minute minute Low 0 0 High 100 0 BufSize 0 0
Threshold alarm level is set at : Default
Errlog-1, SnmpTrap-2, PortLogLock-4RapiTrap-8, EmailAlert-16
Valid alarm matrix is 31
Default Custom Changed 0 0 Below 0 0 Above 0 0 InBetween 0 0
1 : change behavior type 11 : change threshold alarm level2 : change behavior interval 12 : change changed alarm3 : change threshold boundary level 13 : change below alarm4 : change custom unit 14 : change above alarm5 : change custom time base 15 : change inBetween alarm6 : change custom low 16 : apply threshold alarm changes7 : change custom high 17 : cancel threshold alarm changes8 : change custom buffer 18 : return to previous page9 : apply threshold boundary changes10 : cancel threshold boundary changesSelect choice => : (1..18) [18]

38 Configuring Fabric Watch
Table 13 Element listing information - Advanced Configuration Menu
The threshold boundary section of the Advanced Configuration menu includes the threshold information for the selected area. It contains two columns, Default (the default settings column) and Custom (the custom settings column), and indicates the current setting.
Heading Meaning
Index A numeric identifier assigned to the element
ThresholdName A string identifier assigned to the element
BehaviorType Frequency of alarm notifications
BehaviorInt The element behavior interval, in seconds

Fabric OS 5.x Fabric Watch administrator guide 39
Fabric Watch displays the units of measurement (Unit), time base (Time base), low threshold (Low), high threshold (High) and buffer size (BufSize) for each column. See the following screen.
In this example, a value of 80% is chosen as the custom high value for RXPerformance. The default value is 10.
The next two screens show how to change the threshold boundary level to custom so that the new custom value of 80 is the new trigger point. This example shows how to apply the custom value; unless you apply
1 : change behavior type 11 : change threshold alarm level2 : change behavior interval 12 : change changed alarm3 : change threshold boundary level 13 : change below alarm4 : change custom unit 14 : change above alarm5 : change custom time base 15 : change inBetween alarm6 : change custom low 16 : apply threshold alarm changes7 : change custom high 17 : cancel threshold alarm changes8 : change custom buffer 18 : return to previous page9 : apply threshold boundary changes10 : cancel threshold boundary changesSelect choice => : (1..18) [18] 7Enter high threshold => : (0..100) [0] 80
Index ThresholdName BehaviorType BehaviorInt 8 eportRXPerf008 Triggered 1 17 eportRXPerf017 Triggered 1 26 eportRXPerf026 Triggered 1 27 eportRXPerf027 Triggered 1 28 eportRXPerf028 Triggered 1 29 eportRXPerf029 Triggered 1
Threshold boundary level is set at : Default
Default Custom Unit Percentage(%) Percentage(%) Time base minute minute Low 0 0 High 100 80 BufSize 0 0
.
.
.

40 Configuring Fabric Watch
the value, it does not take effect.
NOTE: To ensure that your threshold setting configuration takes effect, remember to apply the threshold boundary changes, and then change the threshold boundary level to Custom.
Table 14 describes the event behavior of each element in the Threshold Boundary menu.
Table 14 Element listing information - threshold boundary menu
See ”Fabric watch components” on page 19 for more details about the event setting table and notification methods for each of the possible event settings.
For details about advanced configuration menu options, see Table 15.
1 : change behavior type 11 : change threshold alarm level2 : change behavior interval 12 : change changed alarm3 : change threshold boundary level 13 : change below alarm4 : change custom unit 14 : change above alarm5 : change custom time base 15 : change inBetween alarm6 : change custom low 16 : apply threshold alarm changes7 : change custom high 17 : cancel threshold alarm changes8 : change custom buffer 18 : return to previous page9 : apply threshold boundary changes10 : cancel threshold boundary changesSelect choice => : (1..18) [18] 31 : Default2 : customEnter boundary level type => : (1..2) [1] 2
Index ThresholdName BehaviorType BehaviorInt 8 eportRXPerf008 Triggered 1 17 eportRXPerf017 Triggered 1 26 eportRXPerf026 Triggered 1 27 eportRXPerf027 Triggered 1 28 eportRXPerf028 Triggered 1 29 eportRXPerf029 Triggered 1
Threshold boundary level is set at : Custom...
1 : change behavior type 11 : change threshold alarm level2 : change behavior interval 12 : change changed alarm3 : change threshold boundary level 13 : change below alarm4 : change custom unit 14 : change above alarm5 : change custom time base 15 : change inBetween alarm6 : change custom low 16 : apply threshold alarm changes7 : change custom high 17 : cancel threshold alarm changes8 : change custom buffer 18 : return to previous page9 : apply threshold boundary changes10 : cancel threshold boundary changesSelect choice => : (1..18) [18] 9...
Heading Meaning
Default The Fabric OS default settings
Custom User-defined settings

Fabric OS 5.x Fabric Watch administrator guide 41
Step 3: Configure alarmsAlarms act as a signal or alert that notifies you when a threshold has been crossed. You can configure the following types of notification settings for Fabric Watch:
• TriggeredA triggered behavior type signals you once, after a threshold has been crossed. Triggered is the default behavior type signal for all class areas.
• ContinuousA continuous behavior type signals you continuously after a threshold has been crossed.
To set an alarm, choose the type of event about which you want to receive notifications:
• ChangedTriggers an alarm every time the value of what you are monitoring is changed.
• BelowTriggers an alarm every time the value of what you are monitoring goes below the low boundary.
• AboveTriggers an alarm every time the value of what you are monitoring goes above the high boundary.
• In-BetweenTriggers an alarm every time the value of what you are monitoring goes in between your low and high threshold boundary.
How to calculate values for alarmsThe following sections show how to change the above alarm for the RXPerformance class. Here, a value of 19 is specified. The value is the sum of the alarm matrix values: in this case EmailAlert-16, SnmpTrap-2, and Errlog-1 (16+2+1=19).
To calculate the values to specify in your alarms:
1. Add the numbers beside each state (for the states you want to include). The values for the states are:• Errlog - 1• SnmpTrap - 2• PortLogLock - 4• RapiTrap - 8• EmailAlert -16

42 Configuring Fabric Watch
2. Enter the total at the prompt. See the following example:
1 : change behavior type 11 : change threshold alarm level2 : change behavior interval 12 : change changed alarm3 : change threshold boundary level 13 : change below alarm4 : change custom unit 14 : change above alarm5 : change custom time base 15 : change inBetween alarm6 : change custom low 16 : apply threshold alarm changes7 : change custom high 17 : cancel threshold alarm changes8 : change custom buffer 18 : return to previous page9 : apply threshold boundary changes10 : cancel threshold boundary changesSelect choice => : (1..18) [18] 14
Errlog-1, SnmpTrap-2, PortLogLock-4RapiTrap-8, EmailAlert-16
Valid alarm matrix is 31Enter above alarm matrix => : (0..31) [0] 19
Index ThresholdName BehaviorType BehaviorInt 8 eportRXPerf008 Triggered 1 17 eportRXPerf017 Triggered 1 26 eportRXPerf026 Triggered 1 27 eportRXPerf027 Triggered 1 28 eportRXPerf028 Triggered 1 29 eportRXPerf029 Triggered 1
Threshold boundary level is set at : Custom
Default Custom Unit Percentage(%) Percentage(%) Time base minute minute Low 0 0 High 100 80 BufSize 0 0
Threshold alarm level is set at : Default
Errlog-1, SnmpTrap-2, PortLogLock-4RapiTrap-8, EmailAlert-16
Valid alarm matrix is 31
Default Custom Changed 0 0 Below 0 0 Above 0 19

Fabric OS 5.x Fabric Watch administrator guide 43
Figure shows how to select the custom settings for the threshold alarm level for the RXPerformance area. The options are either to accept the default settings or provide custom settings.
Figure 10 Changing the threshold alarm level
Figure shows how to apply the custom value for the threshold alarm changes; unless you apply the value, it does not take effect.
Figure 11 Applying threshold alarm changes
NOTE: To ensure that your alarm setting configuration is in effect, remember to change the alarm level to Custom and then apply the alarm settings.
1 : change behavior type 11 : change threshold alarm level2 : change behavior interval 12 : change changed alarm3 : change threshold boundary level 13 : change below alarm4 : change custom unit 14 : change above alarm5 : change custom time base 15 : change inBetween alarm6 : change custom low 16 : apply threshold alarm changes7 : change custom high 17 : cancel threshold alarm changes8 : change custom buffer 18 : return to previous page9 : apply threshold boundary changes10 : cancel threshold boundary changesSelect choice => : (1..18) [18] 111 : Default2 : customEnter alarm level type => : (1..2) [1] 2
Index ThresholdName BehaviorType BehaviorInt 8 eportRXPerf008 Triggered 1 17 eportRXPerf017 Triggered 1 26 eportRXPerf026 Triggered 1 27 eportRXPerf027 Triggered 1 28 eportRXPerf028 Triggered 1 29 eportRXPerf029 Triggered 1
Threshold boundary level is set at : Custom
Default Custom Unit Percentage(%) Percentage(%) Time base minute minute Low 0 0 High 100 80 BufSize 0 0
Threshold alarm level is set at : Custom...
1 : change behavior type 11 : change threshold alarm level2 : change behavior interval 12 : change changed alarm3 : change threshold boundary level 13 : change below alarm4 : change custom unit 14 : change above alarm5 : change custom time base 15 : change inBetween alarm6 : change custom low 16 : apply threshold alarm changes7 : change custom high 17 : cancel threshold alarm changes8 : change custom buffer 18 : return to previous page9 : apply threshold boundary changes10 : cancel threshold boundary changesSelect choice => : (1..18) [18] 16...

44 Configuring Fabric Watch
Table 15 describes the 18 customization options displayed at the end of the Advanced Configuration menu. Table 15 Advanced configuration options
Option Effect Input information
change behavior type Changes the behavior type of a single element to either Triggered or Continuous. The change is volatile because this option is not saved to flash memory. Every time the switch is rebooted, this option is reset.
The element index and the required behavior type
change behavior interval Changes the behavior interval for a single element. The change is volatile because this option is not saved to flash memory. Every time the switch is rebooted, this option is reset.
The element index and the required behavior interval, in seconds
change threshold boundary level
Changes between the factory default and custom threshold information.
The required threshold column
change custom unit Changes the measurement unit assigned to the monitored data values, but only affects the custom column.
The required measurement unit, as a string
change custom time base Changes the time base for the area, but only affects the custom column.
The required time base
change custom low Changes the low setting for the threshold, but only affects the custom column.
The required low threshold, in the units defined by the area
change custom high Changes the high setting for the threshold, but only affects the custom column.
The required high threshold, in the units defined by the area
change custom buffer Changes the buffer size for the threshold, but only affects the custom column.
The required buffer size, in the units defined by the area
apply threshold boundary changes
Confirms the changes made to the threshold information. This must be done to retain the changes made.
None
cancel threshold boundary changes
Returns the boundary information to the last confirmed state.
None
change threshold alarm level
Changes between the factory default and custom event settings for the area.
The required event setting column

Fabric OS 5.x Fabric Watch administrator guide 45
NOTE: Not all areas allow for the customization of all fields. If you attempt an illegal modification, Fabric Watch displays an error message. Ensure that all changes to the threshold and event setting areas of the screen are confirmed before leaving advanced configuration, or the changes are lost.
Step 4: Disable and enable thresholds by port (optional) On certain occasions, you might want to disable all port thresholds at once. For example, during an event such as an upgrade of a device or server, you might elect not to receive error messages for particular ports. When the upgrade is complete, you can show and enable disabled port thresholds.
To disable all the thresholds for a port, at the command prompt enter:
When you are ready to enable the disabled port thresholds, you can first view all previously disabled ports using the following command:
change changed alarm Changes the notification method for changed event occurrences for this method, but only affects the custom column.
The required notification methods
change above alarm Changes the notification method for above event occurrences for this method, but only affects the custom column.
The required notification methods
change below alarm Changes the notification method for below event occurrences for this method, but only affects the custom column.
The required notification methods
change inBetween alarm Changes the notification method for inBetween event occurrences for this method, but only affects the custom column.
The required notification methods
apply threshold alarm changes
Confirms the changes made to the event setting information. This must be done to retain the changes made.
None
cancel threshold alarm changes
Returns the event setting information to the last confirmed state.
None
Table 15 Advanced configuration options (continued)
Option Effect Input information
swd77:admin> fwConfigure --disable --port 9
swd77:admin> fwshow --disable --port
Port Threshold Status========================= 9 disabled

46 Configuring Fabric Watch
A port is not considered disabled if one of the port thresholds is still enabled.
To enable all the thresholds for a port, at the command prompt enter:
Configuring notificationsYou can be notified of an alarm condition through a notification. The tasks for configuring notifications using Fabric Watch are:
• ”Configuring alarm notifications” on page 46• ”Configuring SNMP notifications” on page 46• ”Configuring port log lock actions” on page 47• ”Configuring port log lock actions” on page 47• ”Configuring email notifications” on page 47
Configuring alarm notificationsWhen you use alarm notifications, error messages are sent to designated locations such as an error log, SNMP trap view, or email. With an error log, you can log in to a particular switch to view the error messages that have been captured for that particular switch. You can parse the log file to make error message searches quicker and easier.
To ensure that notifications appear in the error log, use the following command:
The option 1 turns on the alarm notification.
If you decide not to have notifications sent, use the following command:
The option 0 turns the alarm notification off.
All alarms are suppressed when alarm notifications are turned off, except for the Environment class and Resource class.
To verify or view your current alarm notifications, use the fwAlarmsFilterShow command.
Configuring SNMP notificationsIn environments in which you have a high number of messages (for example, hundreds per day) coming from a variety of switches, you might want to receive them in a single location and view them using a graphical user interface (GUI). In this type of scenario, SNMP notifications might be the most efficient notification method. You can avoid having to log on to each switch individually as you would have to do for error log notifications.
SNMP notifications are configured using snmpMibCapSet, and within Fabric Watch, using alarms.
See ”Step 3: Configure alarms” on page 41for details about setting alarms.
For details about SNMP configuration, including traps, see the agtCfgSet cand snmpConFig commands in the HP StorageWorks Fabric OS 5.x command reference guide.
Configuring port log lock actionsPort Log Lock freezes in time the port log dump output if an event is triggered. See ”Step 3: Configure alarms” on page 41 for details about configuring port log lock actions.
See ”Fabric watch components” on page 19 for more details about port log lock.
swd77:admin> fwconfigure --enable --port 9
swd77:admin> fwAlarmsFilterSet 1
swd77:admin> fwAlarmsFilterSet 0
swd77:admin> fwalarmsfiltershowFW: Alarms are enabled
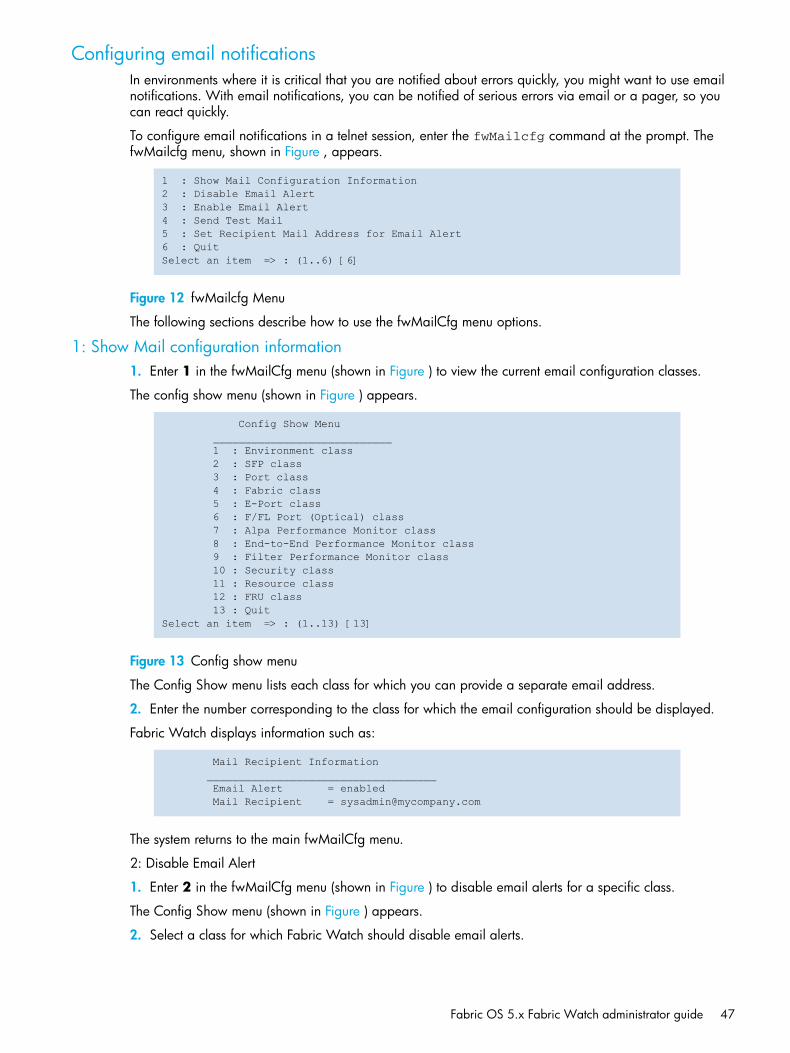
Fabric OS 5.x Fabric Watch administrator guide 47
Configuring email notificationsIn environments where it is critical that you are notified about errors quickly, you might want to use email notifications. With email notifications, you can be notified of serious errors via email or a pager, so you can react quickly.
To configure email notifications in a telnet session, enter the fwMailcfg command at the prompt. The fwMailcfg menu, shown in Figure , appears.
Figure 12 fwMailcfg Menu
The following sections describe how to use the fwMailCfg menu options.
1: Show Mail configuration information1. Enter 1 in the fwMailCfg menu (shown in Figure ) to view the current email configuration classes.
The config show menu (shown in Figure ) appears.
Figure 13 Config show menu
The Config Show menu lists each class for which you can provide a separate email address.
2. Enter the number corresponding to the class for which the email configuration should be displayed.
Fabric Watch displays information such as:
The system returns to the main fwMailCfg menu.
2: Disable Email Alert
1. Enter 2 in the fwMailCfg menu (shown in Figure ) to disable email alerts for a specific class.
The Config Show menu (shown in Figure ) appears.
2. Select a class for which Fabric Watch should disable email alerts.
1 : Show Mail Configuration Information2 : Disable Email Alert3 : Enable Email Alert4 : Send Test Mail5 : Set Recipient Mail Address for Email Alert6 : QuitSelect an item => : (1..6) [6]
Config Show Menu ____________________________ 1 : Environment class 2 : SFP class 3 : Port class 4 : Fabric class 5 : E-Port class 6 : F/FL Port (Optical) class 7 : Alpa Performance Monitor class 8 : End-to-End Performance Monitor class 9 : Filter Performance Monitor class 10 : Security class 11 : Resource class 12 : FRU class 13 : QuitSelect an item => : (1..13) [13]
Mail Recipient Information ____________________________________ Email Alert = enabled Mail Recipient = [email protected]

48 Configuring Fabric Watch
The following confirmation message appears:
The system returns to the main fwMailCfg menu.
3: Enable Email Alert
1. Enter 3 in the fwMailCfg menu (shown in Figure ) to enable email alert for a specific class.
The Config Show menu (shown in Figure ) appears.
2. Select a class for which Fabric Watch should enable email alerts.
The following confirmation message appears:
If the class does not have an email configuration (there is no email address assigned to the class), the following error message appears:
The system returns to the main fwMailCfg menu.
NOTE: To ensure that the mail server address and domain name are configured correctly, use the dnsConfig command. For more details, see the HP StorageWorks Fabric OS 5.x command reference guide.
4: Send Test Mail
1. Enter 4 in the fwMailCfg menu (shown in Figure ) to test the mail configuration for a specific class.
The Config Show menu (shown in Figure ) appears.
2. Select a class to test.
If the email configuration for the class is complete, the following confirmation message appears:
If the email configuration for the class is not complete, the following error message appears:
The email address specified in the mail configuration receives a test email message.
The system returns to the main fwMailCfg menu.
5: Set Recipient Mail Address for Email Alert
1. Enter 5 in the fwMailCfg menu (shown in Figure ) to specify the recipient to whom Fabric Watch should send the email alert for a class.
The Config Show menu (shown in Figure ) appears.
2. Select a class.
The following prompt appears:
Email Alert is disabled!
Email Alert is enabled!
Mail configuration for class Environment is not done.Email Alert is not enabled!
Email has been sent
Email has not been sent.Check Mail configuration for Environment class!
Mail To: [NONE]

Fabric OS 5.x Fabric Watch administrator guide 49
Enter the email address of the person responsible for the specific class of alerts.
Fabric Watch uses the default value, located between the brackets in the prompt, as the current email address for the class. A value of NONE indicates that no email address has been provided.
NOTE: Email addresses must not exceed 128 characters.
The system displays a confirmation message and returns to the main fwMailCfg menu.
6: Quit
Enter 6 in the fwMailCfg menu (shown in Figure ) to exit the menu.
Configuring switch status policyThe tasks for configuring a switch status policy are:
• ”Step 1: Plan and define your switch status policy” on page 49• ”Step 2: Implement your switch status policy” on page 50• ”Step 3: View your switch status policy” on page 50
Your switch status policy monitors the overall status of a switch based on several contributing parameters. The policy parameter values determine how many failed or faulty units of each contributor are allowed before triggering a status change in the switch from Healthy to Marginal or Down. While some users find that the default settings suit their needs, others need to configure a switch status policy due to unpredictable power outages, temperature changes, or redundancy requirements, among other conditions.
You can configure your switch status policy to define the health of your switch. Generally speaking, Fabric Watch defines the health of your switch using the following terms:
• HealthyEvery contributor is working and therefore healthy.
• MarginalOne or more components are triggering a Warning alarm.
• DownOne or more contributors have failed.
Status events are integrated into Advanced Web Tools and the Fabric Manager option so that if the overall status of your switch is Healthy, the switch color is green. If the overall switch status is Marginal, then the switch color is yellow. Finally, if the overall switch status is Down, the switch color is red. The overall status is calculated based on the most severe status of all contributors.
See the HP StorageWorks Fabric OS 5.x advanced web tools administrator guide for more details about configuring status events using Web Tools.
Step 1: Plan and define your switch status policyBefore entering the switchStatusPolicySet command, plan your switch status policy. How many fans must fail before you consider a switch Marginal? Look at the needs of your system along with the factors that affect its monitors. Table 16 lists the monitors in a switch and identifies the factors that affect their health. Note that not all switches use the monitors listed in Table 16.
Table 16 Switch status policy monitor health factors
Monitor Health factors
Power Supplies Power supply thresholds, absent or failed power supply. For the SAN Director 2/128, can also occur when Power Supplies are not in the correct slot for redundancy.
Temperatures Temperature thresholds, faulty temperature sensors.
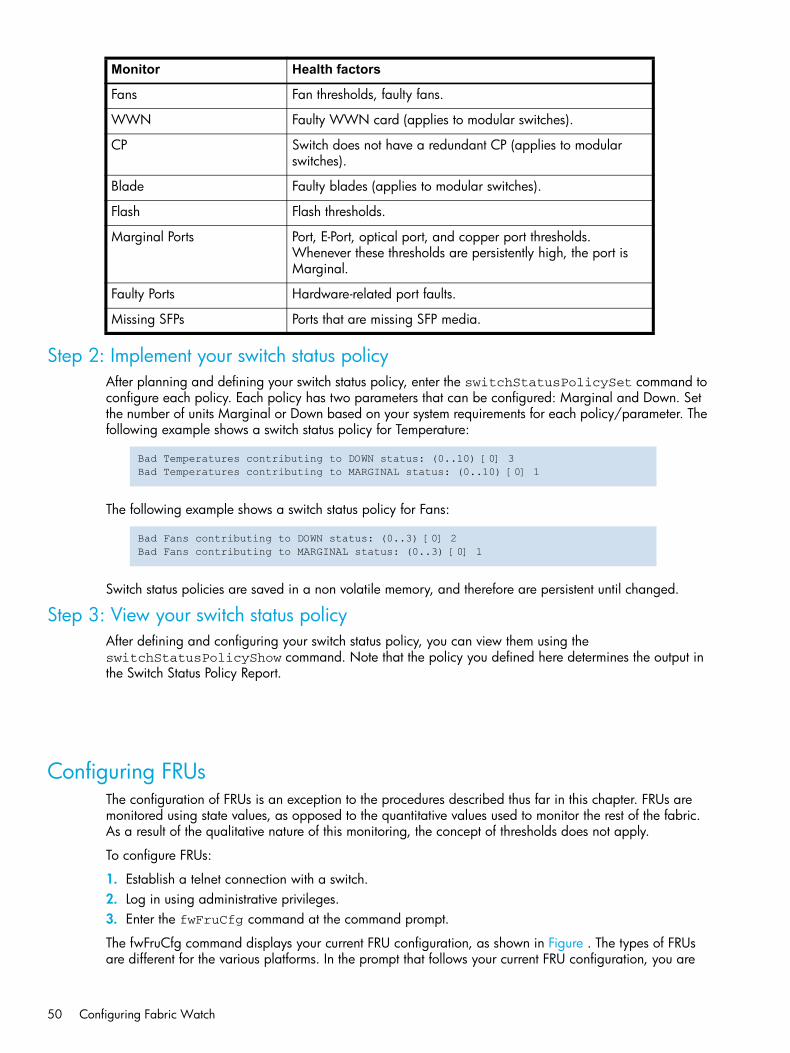
50 Configuring Fabric Watch
Step 2: Implement your switch status policyAfter planning and defining your switch status policy, enter the switchStatusPolicySet command to configure each policy. Each policy has two parameters that can be configured: Marginal and Down. Set the number of units Marginal or Down based on your system requirements for each policy/parameter. The following example shows a switch status policy for Temperature:
The following example shows a switch status policy for Fans:
Switch status policies are saved in a non volatile memory, and therefore are persistent until changed.
Step 3: View your switch status policyAfter defining and configuring your switch status policy, you can view them using the switchStatusPolicyShow command. Note that the policy you defined here determines the output in the Switch Status Policy Report.
Configuring FRUsThe configuration of FRUs is an exception to the procedures described thus far in this chapter. FRUs are monitored using state values, as opposed to the quantitative values used to monitor the rest of the fabric. As a result of the qualitative nature of this monitoring, the concept of thresholds does not apply.
To configure FRUs:
1. Establish a telnet connection with a switch. 2. Log in using administrative privileges.3. Enter the fwFruCfg command at the command prompt.
The fwFruCfg command displays your current FRU configuration, as shown in Figure . The types of FRUs are different for the various platforms. In the prompt that follows your current FRU configuration, you are
Fans Fan thresholds, faulty fans.
WWN Faulty WWN card (applies to modular switches).
CP Switch does not have a redundant CP (applies to modular switches).
Blade Faulty blades (applies to modular switches).
Flash Flash thresholds.
Marginal Ports Port, E-Port, optical port, and copper port thresholds. Whenever these thresholds are persistently high, the port is Marginal.
Faulty Ports Hardware-related port faults.
Missing SFPs Ports that are missing SFP media.
Monitor Health factors
Bad Temperatures contributing to DOWN status: (0..10) [0] 3Bad Temperatures contributing to MARGINAL status: (0..10) [0] 1
Bad Fans contributing to DOWN status: (0..3) [0] 2Bad Fans contributing to MARGINAL status: (0..3) [0] 1
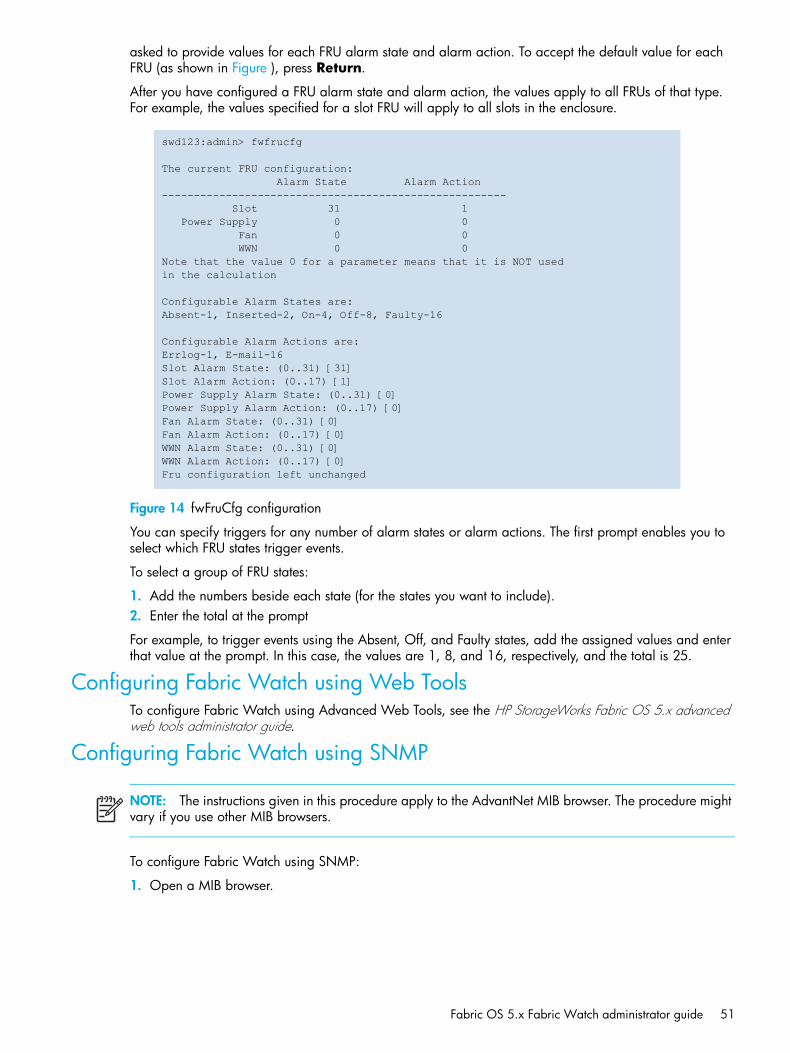
Fabric OS 5.x Fabric Watch administrator guide 51
asked to provide values for each FRU alarm state and alarm action. To accept the default value for each FRU (as shown in Figure ), press Return.
After you have configured a FRU alarm state and alarm action, the values apply to all FRUs of that type. For example, the values specified for a slot FRU will apply to all slots in the enclosure.
Figure 14 fwFruCfg configuration
You can specify triggers for any number of alarm states or alarm actions. The first prompt enables you to select which FRU states trigger events.
To select a group of FRU states:
1. Add the numbers beside each state (for the states you want to include).2. Enter the total at the prompt
For example, to trigger events using the Absent, Off, and Faulty states, add the assigned values and enter that value at the prompt. In this case, the values are 1, 8, and 16, respectively, and the total is 25.
Configuring Fabric Watch using Web ToolsTo configure Fabric Watch using Advanced Web Tools, see the HP StorageWorks Fabric OS 5.x advanced web tools administrator guide.
Configuring Fabric Watch using SNMP
NOTE: The instructions given in this procedure apply to the AdvantNet MIB browser. The procedure might vary if you use other MIB browsers.
To configure Fabric Watch using SNMP:
1. Open a MIB browser.
swd123:admin> fwfrucfg
The current FRU configuration: Alarm State Alarm Action------------------------------------------------------ Slot 31 1 Power Supply 0 0 Fan 0 0 WWN 0 0Note that the value 0 for a parameter means that it is NOT usedin the calculation
Configurable Alarm States are:Absent-1, Inserted-2, On-4, Off-8, Faulty-16
Configurable Alarm Actions are:Errlog-1, E-mail-16Slot Alarm State: (0..31) [31]Slot Alarm Action: (0..17) [1]Power Supply Alarm State: (0..31) [0]Power Supply Alarm Action: (0..17) [0]Fan Alarm State: (0..31) [0]Fan Alarm Action: (0..17) [0]WWN Alarm State: (0..31) [0]WWN Alarm Action: (0..17) [0]Fru configuration left unchanged

52 Configuring Fabric Watch
2. Load the appropriate MIB files. First, load the Brocade common MIB file (BRCD_v5_0.mib), followed by the Brocade software MIB file (SW_v5_2.mib). If this is successful, the system displays a screen similar to Figure 2.
Figure 15 Configuring Fabric Watch using SNMP
In Figure 2, the MIB browser has populated the left side of the screen with a MIB tree that can be navigated.
3. Start a telnet session with the switch, and enter the snmpMibCapSet command at the prompt; this enables you to send Fabric Watch traps to an SNMP management station (see Figure 3). Then enter the agtCfgSet command to configure the SNMP management host IP address (see Figure ).
Figure 16 Enabling Fabric Watch Traps in SNMP
swd77:admin> snmpmibcapsetThe SNMP Mib/Trap Capability has been set to supportFE-MIBSW-MIBFA-MIBSW-TRAPFA-TRAPFA-MIB (yes, y, no, n): [yes] FICON-MIB (yes, y, no, n): [no] HA-MIB (yes, y, no, n): [no] SW-TRAP (yes, y, no, n): [yes] yes swFCPortScn (yes, y, no, n): [no] swEventTrap (yes, y, no, n): [no] swFabricWatchTrap (yes, y, no, n): [no] yes swTrackChangesTrap (yes, y, no, n): [no] FA-TRAP (yes, y, no, n): [yes] connUnitStatusChange (yes, y, no, n): [no] connUnitEventTrap (yes, y, no, n): [no] connUnitSensorStatusChange (yes, y, no, n): [no] connUnitPortStatusChange (yes, y, no, n): [no] SW-EXTTRAP (yes, y, no, n): [no] swd77:admin>

Fabric OS 5.x Fabric Watch administrator guide 53
Figure 17 Configuring SNMP management host IP address
4. Enter the IP address for the switch in the Host field. Enter the community string in the Community field. To perform set operations, enter the write community into the Write Community field.
5. Expand the tree on the left to find the Fabric Watch OID information. To find the OID, use the following hierarchy: SW-MIB, bcsi, commDev, fibrechannel, fcSwitch, sw, swFwSystem.
swd77:admin> agtcfgset
Customizing MIB-II system variables ...
At each prompt, do one of the following: o <Return> to accept current value, o enter the appropriate new value, o <Control-D> to skip the rest of configuration, or o <Control-C> to cancel any change.
To correct any input mistake:<Backspace> erases the previous character,<Control-U> erases the whole line,sysDescr: [Fibre Channel Switch.] sysLocation: [End User Premise.] sysContact: [Field Support.] authTrapsEnabled (true, t, false, f): [false]
SNMP community and trap recipient configuration:Community (rw): [Secret C0de] Trap Recipient's IP address in dot notation: [0.0.0.0] Community (rw): [OrigEquipMfr] Trap Recipient's IP address in dot notation: [0.0.0.0] Community (rw): [private] Trap Recipient's IP address in dot notation: [0.0.0.0] Community (ro): [public] Trap Recipient's IP address in dot notation: [0.0.0.0] 192.168.2.2Trap recipient Severity level : (0..5) [0] Community (ro): [common] Trap Recipient's IP address in dot notation: [0.0.0.0] Community (ro): [FibreChannel] Trap Recipient's IP address in dot notation: [0.0.0.0]
SNMP access list configuration:Access host subnet area in dot notation: [0.0.0.0] Read/Write? (true, t, false, f): [true] Access host subnet area in dot notation: [0.0.0.0] Read/Write? (true, t, false, f): [true] Access host subnet area in dot notation: [0.0.0.0] Read/Write? (true, t, false, f): [true] Access host subnet area in dot notation: [0.0.0.0] Read/Write? (true, t, false, f): [true] Access host subnet area in dot notation: [0.0.0.0] Read/Write? (true, t, false, f): [true] Access host subnet area in dot notation: [0.0.0.0] Read/Write? (true, t, false, f): [true] ...Committing configuration...done.swd77:admin>

54 Configuring Fabric Watch
Fabric Watch displays a screen similar to the one shown in Figure .
Figure 18 Example OID tree
6. Obtain the specific identifier for the element that will be modified. To get the identifier, click the swFwThresholdTable and swFwThresholdEntry directory, and run a get operation on swFwName. A list of elements appears in which each element is preceded by an identifier. Remember the numeric portion of the identifier, which appears before the “==>” symbol. You can scroll through the list to find the numeric identifier for the element in which you are interested.
Figure shows a sample screen.
For detailed descriptions of the SNMP fields in both telnet and Web Tools, see the HP StorageWorks Fabric OS 5.x mib reference guide.
Figure 19 Example swFwName screen

Fabric OS 5.x Fabric Watch administrator guide 55
In this example, 83.1 is numeric identifier for the element referenced as resFlash000.
7. Traverse the fields beneath swFwClassAreaTable and swFwThresholdTable, appending the numeric identifier from the previous step to each field before performing a get or write operation. For example, to get and modify information specific to the resFlash000 element, select one of the fields and append “83.1” in the Object ID field on the right side of the screen.To modify information, you must define a write community. To modify an entry:a. Select a field.b. Append the numeric identifier to the Object ID.c. Enter the new value into the Set Value field.d. Select Set from the Operations menu.

56 Configuring Fabric Watch
Fabric OS 5.x Fabric Watch administrator guide 57
A Default threshold valuesThis appendix lists Fabric Watch default threshold values for all classes except the FRU class, which has none.
The following tables list all of the default values used for the default Fabric Watch configuration settings when running Fabric OS v5.x.
Environment classTable 17 provides default settings for areas in the Environment class. These defaults are hardware-dependent. Check the appropriate switch installation guide for differences in environmental requirements.

58 Default threshold values
NOTE: For the 4/32 SAN Switch, there is no fan default threshold because the fans are not monitored by Fabric Watch. You can use fanShow to view the 4/32 SAN Switch fan status (OK or NOT OK). However, you cannot use fwConfigure to manipulate the threshold or alarm actions against any fans.
Table 17 Environment class threshold defaults
Area Description Default threshold settings
Default alarm settings
Threshold state
Fan Monitors switch fan speed in RPMs
Unit: RPM Time Base: noneHP StorageWorks SAN Switch 2/8V, 2/16V, 2/16N Low: 4500 High: 11000 Buffer: 3
HP StorageWorks SAN Switch 2/32 Low: 2600 High: 10000 Buffer: 3
HP StorageWorks SAN Switch 4/32Low: 3000High: 12000Buffer: 3
HP StorageWorks Core Switch 2/64Low: 2000 High: 3400 Buffer: 3
HP StorageWorks SAN Director 2/128Low: 1600High: 3400Buffer: 3
Changed: 0Above: 3Below: 3In-Between: 1
InformativeOut_of_rangeOut_of_rangeIn_range
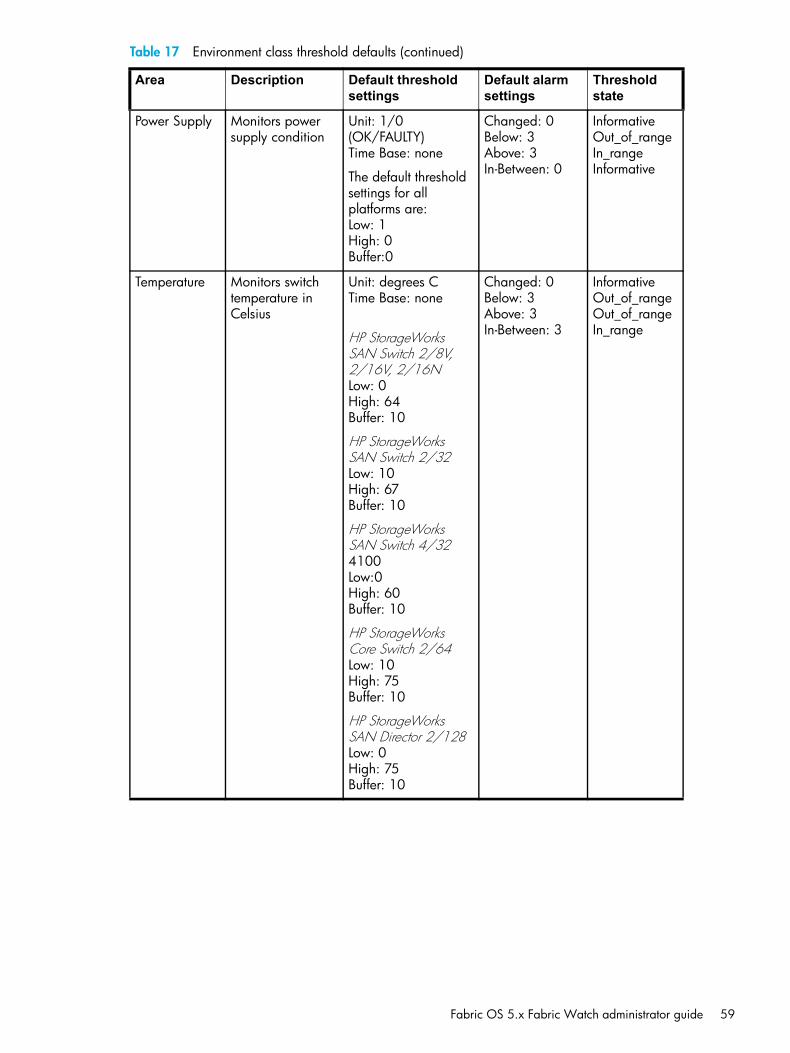
Fabric OS 5.x Fabric Watch administrator guide 59
Power Supply Monitors power supply condition
Unit: 1/0 (OK/FAULTY)Time Base: none
The default threshold settings for all platforms are:Low: 1 High: 0Buffer:0
Changed: 0Below: 3Above: 3In-Between: 0
InformativeOut_of_rangeIn_rangeInformative
Temperature Monitors switch temperature in Celsius
Unit: degrees CTime Base: none
HP StorageWorks SAN Switch 2/8V, 2/16V, 2/16NLow: 0 High: 64Buffer: 10
HP StorageWorks SAN Switch 2/32Low: 10 High: 67Buffer: 10
HP StorageWorks SAN Switch 4/32 4100Low:0High: 60Buffer: 10
HP StorageWorks Core Switch 2/64Low: 10 High: 75 Buffer: 10
HP StorageWorks SAN Director 2/128Low: 0 High: 75 Buffer: 10
Changed: 0Below: 3Above: 3In-Between: 3
InformativeOut_of_rangeOut_of_rangeIn_range
Table 17 Environment class threshold defaults (continued)
Area Description Default threshold settings
Default alarm settings
Threshold state

60 Default threshold values
Fabric classTable 18 provides default settings for areas in the Fabric class. These defaults are hardware-dependent.
Table 18 Fabric Class threshold defaults
Area Description Default threshold settings
Default alarm settings
Threshold state
Domain ID Changes
Monitors forcible DOMAIN ID changes
Unit: D_ID Change(s)Time Base: noneLow: 0High: 0Buffer: 0
Changed: 0Below: 0Above: 0In-Between: 0
InformativeInformativeInformativeInformative
GBIC Change Monitors the insertion and removal of GBIC
Unit: change(s)Time Base: noneLow: 0High: 0Buffer: 0
Changed: 0Below: 0Above: 0In-Between: 0
InformativeInformativeInformativeInformative
Loss of E_Port Monitors E_Port status
Unit: down(s)Time Base: noneLow: 0High: 0Buffer: 0
Changed: 0Below: 0Above: 0In-Between: 0
InformativeInformativeInformativeInformative
Fabric Logins Monitors host device fabric logins
Unit: login(s)Time Base: noneLow: 0High: 0Buffer: 0
Changed: 0Below: 0Above: 0In-Between: 0
InformativeInformativeInformativeInformative
Fabric to Quick Loop Changes
Monitors changes from Fabric to Quick, Loop, or Quick and Loop to Fabric
Unit: change(s)Time Base: noneLow: 0High: 0Buffer: 0
Changed: 0Below: 0Above: 0In-Between: 0
InformativeInformativeInformativeInformative
Fabric Reconfiguration
Monitors configuration changes
Unit: reconfig(s)Time Base: noneLow: 0High: 0Buffer: 0
Changed: 0Below: 0Above: 0In-Between: 0
InformativeInformativeInformativeInformative
Segmentation Changes
Monitors segmentation changes
Unit: segmentation(s)Time Base: noneLow: 0High: 0Buffer: 0
Changed: 0Below: 0Above: 0In-Between: 0
InformativeInformativeInformativeInformative

Fabric OS 5.x Fabric Watch administrator guide 61
Performance monitor classTable 19 provides default settings for areas in the AL_PA Performance Monitor class.
NOTE: End-to-end and AL_PA CRC counters are not supported on the HP StorageWorks SAN Switch 4/32.
Table 20 provides default settings for areas in the Customer-Defined Performance Monitor class.
Zoning Changes Monitors changes to currently enabled zoning configurations
Unit: zone change(s)Time Base: noneLow: 0High: 0Buffer: 0
Changed: 0Below: 0Above: 0In-Between: 0
InformativeInformativeInformativeInformative
SFP State Changes
Monitors SFP state changes
Unit: Change(s)Time Base:Low: 0High: 0Buffer: 0
Changed: 0Exceeded: 0Below: 0Above: 0In-between: 0
InformativeInformativeInformativeInformativeInformative
Table 18 Fabric Class threshold defaults (continued)
Area Description Default threshold settings
Default alarm settings
Threshold state
Table 19 AL_PA performance monitor class threshold defaults
Area Description Default Threshold Settings
Default Alarm Settings
Threshold State
AL_PA Invalid CRCs
Monitors the number of arbitrated loop physical address CRC errors
Unit: error(s)Time Base: minuteLow: 0High: 60Buffer: 0
Changed: 0Below: 0Above: 0In-Between: 0
InformativeInformativeOut_of_rangeIn_range
Table 20 Customer-Defined performance monitor class threshold defaults
Area Description Default threshold settings
Default alarm settings
Threshold state
Customer-Defined Filter
Monitors the number of frames that are filtered out by the port
Unit: frame(s)Time Base: noneLow: 0High: 0Buffer: 0
Changed: 0Below: 0Above: 0In-Between: 0
InformativeInformativeInformativeInformative

62 Default threshold values
Table 21 provides default settings for areas in the End-to-End Performance Monitor class.
Port classTable 22 provides default settings for areas in the Port class.
Table 21 End-to-End performance monitor class threshold defaults
Area Description Default threshold settings
Default alarm settings
Threshold state
End-to-End Invalid CRC Count
Monitors the number of CRC errors between a SID_DID pair in a port
Unit: errorsTime Base: noneLow: 1High: 10Buffer: 0
Changed: 0Below: 0Above: 0In-Between: 0
InformativeInformativeOut_of_rangeIn_range
End-to-End Receive Performance
Monitors the receiving traffic between a SID_DID pair in a port
Unit: KB/secTime Base: noneLow: 0High: 0Buffer: 0
Changed: 0Below: 0Above: 0In-Between: 0
InformativeInformativeInformativeInformative
End-to-End Transmit Performance
Monitors the transmit traffic between a SID_DID pair in a port
Unit: KB/secTime Base: noneLow: 0High: 0Buffer: 0
Changed: 0Below: 0Above: 0In-Between: 0
InformativeInformativeInformativeInformative
Table 22 Port Class threshold defaults
Area Description Default threshold settings
Default alarm settings
Threshold state
Invalid CRC Count
Monitors the number of CRC errors
Unit: error(s)Time Base: minuteLow: 1High: 5Buffer: 0
Changed: 0Below: 0Above: 0In-Between: 0
InformativeInformativeOut_of_rangeIn_range
Invalid Transmission Word
Monitors the number of invalid words transmitted
Unit: error(s)Time Base: minuteLow: 0High: 5Buffer: 0
Changed: 0Below: 0Above: 0In-Between: 0
InformativeInformativeOut_of_rangeIn_range
Link Failure Count Monitors the number of link failures
Unit: error(s)Time Base: minuteLow: 1High: 5 Buffer: 0
Changed: 0Below: 0Above: 0In-Between: 0
InformativeInformativeOut_of_rangeIn_range
Loss of Signal Count
Monitors the number of signal loss errors
Unit: error(s)Time Base: minuteLow: 0High: 5Buffer: 0
Changed: 0Below: 0Above: 0In-Between: 0
InformativeInformativeOut_of_rangeIn_range
Loss of Synchronization Count
Monitors the number of loss of synchronization errors
Unit: error(s)Time Base: minuteLow: 0High: 5Buffer: 0
Changed: 0Below: 0Above: 0In-Between: 0
InformativeInformativeOut_of_rangeIn_range

Fabric OS 5.x Fabric Watch administrator guide 63
Table 23 provides default settings for areas in the E-Port class.
Primitive Sequence Protocol Error
Monitors the number of primitive sequence errors
Unit: error(s)Time Base: minuteLow: 0High: 5Buffer: 0
Changed: 0Below: 0Above: 0In-Between: 0
InformativeInformativeOut_of_rangeIn_range
Receive Performance
Monitors receive rate, by percentage
Unit: percentageTime Base: minuteLow: 0High: 100Buffer: 0
Changed: 0Below: 0Above: 0In-Between: 0
InformativeInformativeInformativeInformative
State Changes Monitors state changes
Unit: error(s)Time Base: minuteLow:0High: 5Buffer: 0
Changed: 0Below: 0Above: 0In-Between: 0
InformativeInformativeOut_of_rangeIn_range
Transmit Performance
Monitors transmission rate, by percentage
Unit: percentageTime Base: minuteLow: 0High: 100Buffer: 0
Changed: 0Below: 0Above: 0In-Between: 0
InformativeInformativeInformativeInformative
Table 23 E-Port class threshold defaults
Area Description Default threshold settings
Default alarm settings
Threshold state
Invalid CRC Count
Monitors the number of CRC errors
Unit: error(s)Time Base: minuteLow: 0High: 5Buffer: 0
Changed: 0Below: 0Above: 0In-Between: 0
InformativeInformativeOut_of_rangeIn_range
Invalid Transmission Word
Monitors the number of invalid words transmitted
Unit: error(s)Time Base: minuteLow: 0High: 5Buffer: 0
Changed: 0Below: 0Above: 0In-Between: 0
InformativeInformativeOut_of_rangeIn_range
Link Failure Count
Monitors the number of link failures
Unit: error(s)Time Base: minuteLow: 0High: 5Buffer: 0
Changed: 0Below: 0Above: 0In-Between: 0
InformativeInformativeOut_of_rangeIn_range
Loss of Signal Count
Monitors the number of signal loss errors
Unit: error(s)Time Base: minuteLow: 0High: 5Buffer: 0
Changed: 0Below: 0Above: 0In-Between: 0
InformativeInformativeOut_of_rangeIn_range
Table 22 Port Class threshold defaults (continued)
Area Description Default threshold settings
Default alarm settings
Threshold state
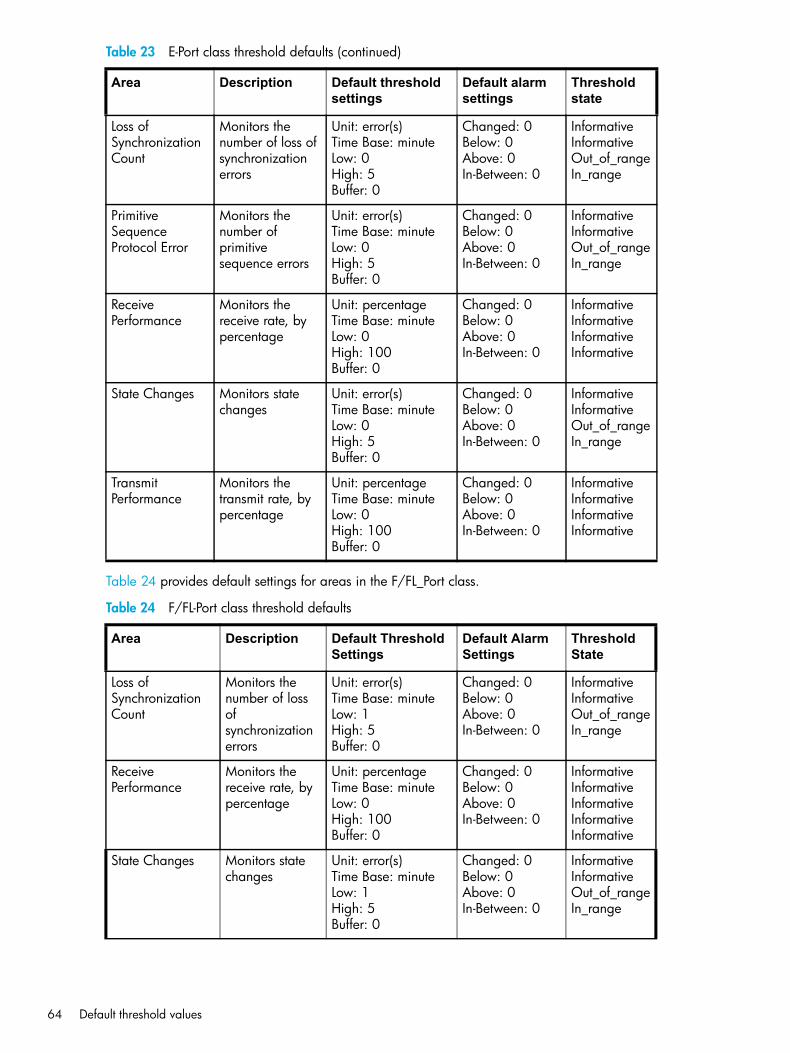
64 Default threshold values
Table 24 provides default settings for areas in the F/FL_Port class.
Loss of Synchronization Count
Monitors the number of loss of synchronization errors
Unit: error(s)Time Base: minuteLow: 0High: 5Buffer: 0
Changed: 0Below: 0Above: 0In-Between: 0
InformativeInformativeOut_of_rangeIn_range
Primitive Sequence Protocol Error
Monitors the number of primitive sequence errors
Unit: error(s)Time Base: minuteLow: 0High: 5Buffer: 0
Changed: 0Below: 0Above: 0In-Between: 0
InformativeInformativeOut_of_rangeIn_range
Receive Performance
Monitors the receive rate, by percentage
Unit: percentageTime Base: minuteLow: 0High: 100Buffer: 0
Changed: 0Below: 0Above: 0In-Between: 0
InformativeInformativeInformativeInformative
State Changes Monitors state changes
Unit: error(s)Time Base: minuteLow: 0High: 5Buffer: 0
Changed: 0Below: 0Above: 0In-Between: 0
InformativeInformativeOut_of_rangeIn_range
Transmit Performance
Monitors the transmit rate, by percentage
Unit: percentageTime Base: minuteLow: 0 High: 100Buffer: 0
Changed: 0Below: 0Above: 0In-Between: 0
InformativeInformativeInformativeInformative
Table 24 F/FL-Port class threshold defaults
Area Description Default Threshold Settings
Default Alarm Settings
Threshold State
Loss of Synchronization Count
Monitors the number of loss of synchronization errors
Unit: error(s)Time Base: minuteLow: 1High: 5Buffer: 0
Changed: 0Below: 0Above: 0In-Between: 0
InformativeInformativeOut_of_rangeIn_range
Receive Performance
Monitors the receive rate, by percentage
Unit: percentageTime Base: minuteLow: 0High: 100Buffer: 0
Changed: 0Below: 0Above: 0In-Between: 0
InformativeInformativeInformativeInformativeInformative
State Changes Monitors state changes
Unit: error(s)Time Base: minuteLow: 1High: 5Buffer: 0
Changed: 0Below: 0Above: 0In-Between: 0
InformativeInformativeOut_of_rangeIn_range
Table 23 E-Port class threshold defaults (continued)
Area Description Default threshold settings
Default alarm settings
Threshold state

Fabric OS 5.x Fabric Watch administrator guide 65
Resource classTable 25 provides default settings for areas in the Resource class.
Transmit Performance
Monitors the transmit rate, by percentage
Unit: percentageTime Base: minuteLow: 0High: 100Buffer: 0
Changed: 0Below: 0Above: 0In-Between: 0
InformativeInformativeInformativeInformativeInformative
Invalid CRC Count
Monitors the number of CRC errors
Unit: error(s)Time Base: minuteLow: 1High: 5Buffer: 0
Changed: 0Below: 0Above: 0In-Between: 0
InformativeInformativeOut_of_rangeIn_range
Invalid Transmission Word
Monitors the number of invalid words transmitted
Unit: error(s)Time Base: minuteLow: 1High: 5Buffer: 0
Changed: 0Below: 0Above: 0In-Between: 0
InformativeInformativeOut_of_rangeIn_range
Link Failure Count Monitors the number of link failures
Unit: error(s)Time Base: minuteLow: 1High: 5Buffer: 0
Changed: 0Below: 0Above: 0In-Between: 0
InformativeInformativeOut_of_rangeIn_range
Loss of Signal Count
Monitors the number of signal loss errors
Unit: error(s)Time Base: minuteLow: 1High: 5Buffer: 0
Changed: 0Below: 0Above: 0In-Between: 0
InformativeInformativeOut_of_rangeIn_range
Primitive Sequence Protocol Error
Monitors the number of primitive sequence errors
Unit: error(s)Time Base: minuteLow: 1High: 5Buffer: 0
Changed: 0Below: 0Above: 0In-Between: 0
InformativeInformativeOut_of_rangeIn_range
Table 24 F/FL-Port class threshold defaults (continued)
Area Description Default Threshold Settings
Default Alarm Settings
Threshold State
Table 25 Resource class threshold defaults
Area Description Default threshold settings
Default alarm settings
Threshold state
Flash Monitors the percentage of compact flash used
Unit: percentageTime base: noneLow: 0High: 85Buffer: 0
Changed: 0Below: 0Above: 1In-Between: 0
InformativeInformativeOut_of_rangeIn_range

66 Default threshold values
Security classTable 26 provides default settings for areas in the Security class.
Table 26 Security class threshold defaults
Area Description Default threshold settings
Default alarm settings
Threshold state
API Violations Monitors API violations
Unit: violation(s)Time Base: minuteLow: 1High: 2Buffer: 0
Changed: 0Below: 0Above: 3In-Between: 0
InformativeInformativeOut_of_rangeIn_range
DCC Violations Monitors DCC violations
Unit: violation(s)Time Base: minuteLow: 1High: 4Buffer: 0
Changed: 0Below: 0Above: 3In-Between: 0
InformativeInformativeOut_of_rangeIn_range
Front Panel Violations
Monitors front panel violations
Unit: violation(s)Time Base: minute Low: 1High: 2Buffer: 0
Changed: 0Below: 0Above: 3In-Between: 0
InformativeInformativeOut_of_rangeIn_range
HTTP Violations Monitors HTTP violations
Unit: violation(s)Time Base: minuteLow: 1High: 2Buffer: 0
Changed: 0Below: 0Above: 3In-Between: 0
InformativeInformativeOut_of_rangeIn_range
Illegal Commands Monitors illegal commands
Unit: violation(s)Time Base: minuteLow: 1High: 2Buffer: 0
Changed: 0Below: 0Above: 3In-Between: 0
InformativeInformativeOut_of_rangeIn_range
Incompatible Security DB
Monitors incompatible security databases
Unit: violation(s)Time Base: minuteLow: 1High: 2Buffer: 0
Changed: 0Below: 0Above: 3In-Between: 0
InformativeInformativeOut_of_rangeIn_range
Invalid Certificates Monitors invalid certificates
Unit: violation(s)Time Base: minuteLow: 1High: 2Buffer: 0
Changed: 0Below: 0Above: 3In-Between: 0
InformativeInformativeOut_of_rangeIn_range
Invalid Signatures Monitors invalid signatures
Unit: violation(s)Time Base: minuteLow: 1High: 2Buffer: 0
Changed: 0Below: 0Above: 3In-Between: 0
InformativeInformativeOut_of_rangeIn_range
Invalid Timestamp Monitors invalid timestamps
Unit: violation(s)Time Base: minuteLow: 1High: 2Buffer: 0
Changed: 0Below: 0Above: 3In-Between: 0
InformativeInformativeOut_of_rangeIn_range

Fabric OS 5.x Fabric Watch administrator guide 67
Login Violations Monitors login violations
Unit: violation(s)Time Base: minuteLow: 1High: 2Buffer: 0
Changed: 0Below: 0Above: 3In-Between: 0
InformativeInformativeOut_of_rangeIn_range
MS Violations Monitors MS violations
Unit: violation(s)Time Base: minuteLow: 1High: 2Buffer: 0
Changed: 0Below: 0Above: 3In-Between: 0
InformativeInformativeOut_of_rangeIn_range
No FCS Violations Monitors No FCS Unit: violation(s)Time Base: minuteLow: 1High: 2Buffer: 0
Changed: 0Below: 0Above: 3In-Between: 0
InformativeInformativeOut_of_rangeIn_range
RSNMP Violations Monitors RSNMP violations
Unit: violation(s)Time Base: minuteLow: 1High: 2Buffer: 0
Changed: 0Below: 0Above: 3In-Between: 0
InformativeInformativeOut_of_rangeIn_range
SCC Violations Monitors SCC violations
Unit: violation(s)Time Base: minuteLow: 1High: 2Buffer: 0
Changed: 0Below: 0Above: 3In-Between: 0
InformativeInformativeOut_of_rangeIn_range
Serial Violations Monitors serial violations
Unit: violation(s)Time Base: minuteLow: 1High: 2Buffer: 0
Changed: 0Below: 0Above: 3In-Between: 0
InformativeInformativeOut_of_rangeIn_range
SES Violations Monitors SES violations
Unit: violation(s)Time Base: minuteLow: 1High: 2Buffer: 0
Changed: 0Below: 0Above: 3In-Between: 0
InformativeInformativeOut_of_rangeIn_range
SLAP Bad Packets Monitors SLAP bad packets
Unit: violation(s)Time Base: minuteLow: 1High: 2Buffer: 0
Changed: 0Below: 0Above: 3In-Between: 0
InformativeInformativeOut_of_rangeIn_range
SLAP Failures Monitors SLAP failures
Unit: violation(s)Time Base: minuteLow: 1High: 2Buffer: 0
Changed: 0Below: 0Above: 3In-Between: 0
InformativeInformativeOut_of_rangeIn_range
Table 26 Security class threshold defaults (continued)
Area Description Default threshold settings
Default alarm settings
Threshold state

68 Default threshold values
SFP classTable 27 provides default settings for areas in the SFP class.
Telnet Violations Monitors telnet violations
Unit: violation(s)Time Base: minuteLow: 1High: 2Buffer: 0
Changed: 0Below: 0Above: 3In-Between: 0
InformativeInformativeOut_of_rangeIn_range
TS Out of Sync Monitors instances in which the timestamp is out of sync
Unit: violation(s)Time Base: minuteLow: 1High: 2Buffer: 0
Changed: 0Below: 0Above: 3In-Between: 0
InformativeInformativeOut_of_rangeIn_range
WSNMP Violations
Monitors WSNMP violations
Unit: violation(s)Time Base: minuteLow: 1High: 2Buffer: 0
Changed: 0Below: 0Above: 3In-Between: 0
InformativeInformativeOut_of_rangeIn_range
Table 26 Security class threshold defaults (continued)
Area Description Default threshold settings
Default alarm settings
Threshold state
Table 27 SFP Class Threshold Defaults
Area Description Default Threshold Settings
Default Alarm Settings
Threshold State
Current Monitors SFP current
Unit: mATime Base: noneLow: 0High: 50Buffer: 1
Changed: 0Below: 1Above: 1In-Between: 0
Informative Out_of_rangeOut_of_rangeInformative
Receive Power Monitors receive power in µWatts
Unit: µWattsTime Base: noneLow: 0High: 5000Buffer: 25
Changed: 0Below: 1Above: 1In-Between: 0
InformativeOut_of_rangeOut_of_rangeInformative
Supply Voltage
Monitors SFP electrical force in volt(s)
Unit: mVTime Base: noneLow: 3150High: 3600Buffer: 10
Changed: 0Below: 1Above: 1In-Between: 0
InformativeOut_of_rangeOut_of_rangeInformative
Temperature Monitors SFP Temperature
Unit: degrees CTime Base: noneLow: -10 High: 85 Buffer: 3
Changed: 0Below: 1Above: 1In-Between: 1
InformativeOut_of_rangeOut_of_rangeNormal
Transmit Power
Monitors transmit power in µWatts
Unit: µWattsTime Base: noneLow: 0 High: 5000Buffer: 25
Changed: 0Below: 1Above: 1In-Between: 0
InformativeOut_of_rangeOut_of_rangeNormal

Fabric OS 5.x Fabric Watch administrator guide 69
B Basic Fabric Watch configuration guidelinesA default Fabric Watch configuration is available for the purpose of saving setup time. As you gain familiarity with Advanced Fabric Watch features, they can be tailored to suit the fabric environment. The custom settings available in Fabric Watch provide an advanced user much needed flexibility of redefining boundary thresholds and alarm notification methods. The basic concept of Fabric Watch is to monitor the health of an element by sampling the status, comparing the sample data, and if found outside the threshold limits notify the user of the event using one or more selected methods. Since Fabric Watch monitors a variety of classes and class elements, each element with a unique trait must be evaluated prior to defining custom thresholds to meet a specific objective. This section discusses some of the changes that one should consider implementing to improve the overall efficiency of Fabric Watch.
Customization is recommended to achieve the following objectives.
• Selecting appropriate message delivery method for critical and non–critical events.• Selecting appropriate thresholds and alarm levels relevant to each class element.• Defining the appropriate Time Base event triggering based on the class element traits.• Eliminating message delivery that has little or no practical value to the SAN administrator.• Consolidating multiple messages, generated from a single event.
When Fabric Watch is improperly configured, a large number of error messages can be sent over a short period of time, making it difficult to find those messages that are actually meaningful. If this happens, there are a few simple ways to improve the configuration.
When a large number of messages are sent that are not of importance, the source of the messages can be identified from the error message. Examining error messages for the source can identify those classes which need to be reconfigured.
When the messages are not desired or not of importance, consider the following options for reconfiguration.
Recheck the threshold settings. If the current thresholds are not realistic for the class and area, messages may be sent frequently without need. For example, a high threshold for temperature monitoring set to less than room temperature is probably incorrectly configured.
If the event setting is continuous, consider switching to triggered. A continuos event setting will cause error messages to be sent repeatedly as long as the event conditions are met. While each message may be meaningful, a high volume of these messages could cause other important messages to be missed.
Examine the notification settings. If you are not interested in receiving messages under certain conditions, ensure that the notification setting for that event is set to zero. For example, you may not be interested in knowing when the sensed temperature is between your high and low temperature settings, so setting the InBetween notification setting to zero for this area will eliminate messages generated in this situation.

70 Basic Fabric Watch configuration guidelines

Fabric OS 5.x Fabric Watch administrator guide 71
C Using Fabric Watch with configuration filesWhen you activate Fabric Watch, the software starts, using the default settings described in Chapter 5. You cannot alter these default settings; if the default values do not suit your specific needs, configure Fabric Watch to use more appropriate settings.
When you configure the new settings for Fabric Watch, your switch stores the settings in the configuration file. If you change or add settings directly into the configuration file, those settings become your custom configuration.
This chapter discusses the two methods for configuration file usage:
• ”Configuration files”• ”Profiles”
Configuration filesYou can manually edit the configurations files to ensure that the settings meet your needs.
To custom configure Fabric Watch with the configuration file:
1. Type configUpload to upload your configuration file to your host.2. Use a text editor to edit the Fabric Watch values for the elements you want to change.3. Type configDownload to download the updated configuration to your switch.4. Type fwConfigReload to reload the Fabric Watch configuration.
NOTE: This process is disruptive, as a switch reboot will be required.
ProfilesHP provides partial configuration files, or profiles, that help you configure Fabric Watch in a way that is most appropriate to your particular SAN needs.
IMPORTANT: Fabric Watch configuration settings or profiles, reside on the HP StorageWorks SAN Switch Software 5.x CD that shipped with your switch.
To configure Fabric Watch with a profile:
1. Upload the configuration file to the host by typing configUpload.2. Retrieve the Fabric Watch profiles from the HP StorageWorks SAN Switch Software 5.x CD that shipped
with your switch. Open your configuration file in a text editor.3. Copy the contents of the profile and append that information to the [Configuration] section of the
configuration file. The contents of the profile overwrite any duplicate information earlier in the configuration.
4. To download your updated configuration to your switch, enter the configDownload command.
!

72 Using Fabric Watch with configuration files
Fabric OS 5.x Fabric Watch administrator guide 73
Aabove event triggers 23activating
with advanced web tool 29with telnet 29
activating Fabric Watch 29Admin View 29advanced configuration
options 44alarms
configuring 41notifications 46
areas 14assigning notification methods 26audience 7authorized reseller, HP 9
Bbelow event trigger 24buffer values 20
Cchanged event trigger 24classes 13commands
configdownload 71configupload 71fwclassinit 29fwconfigreload 71fwconfigure 30fwfrucfg 30fwmailcfg 30
configdownload 71configupload 71configuration
advanced 37configuration file
capabilities 32configuring events 19continuous event behavior 19conventions
document 8text symbols 8
Ddata values 20default threshold values 57document
conventions 8related documentation 7
Eelements 19
email alert 26environment class areas 14event behavior types 19event settings 23
Ffabric class areas 15Fabric Watch components 13FRU class areas 15fsconfigure 30fwclassinit 29fwconfigreload 71fwfrusfg 30fwmailcfg 30
Hhelp, obtaining 9high and low thresholds 20HP
authorized reseller 9storage web site 9Subscriber’s choice web site 9technical support 9
Iin-between triggers 24installing Fabric Watch 11interface types 29interpreting event messages 27
LLicense Admin 29licenseAdd 29licenseShow 29
MMIBS 71
Nnotification methods 25notifications
email 47SNMP 46
Pperformance monitor class areas 16port class areas 16port log lock 26, 47port persistence 25prerequisites 29
Index

74
Rrack stability, warning 9RapiTrap 26related documentation 7resource class area 17
Ssecurity class areas 17setting time base to none 21SFP class areas 18SNMP
capabilities 30SNMP trap 25specifying a time base 22Subscriber’s choice, HP 9switch event (error) log entry 25switch policies 27switch status policy 49symbols in text 8system requirements 29
TTable 16, 17technical support, HP 9telnet
capabilities 30text symbols 8threshold
values 57threshold values 20thresholds
configuring 35disable by port 45disabling 36enable by port 46enabling 36
time bases 21triggered event behavior 20
Uuser interfaces 29using Fabric Watch
configuration file 71
Vvalues, default 57
Wwarning
rack stability 9web sites
HP storage 9HP Subscriber’s choice 9
Web Toolscapabilities 30
Copyright © 2022 FDOKUMEN