Molecular dynamics — simulations of the fracture toughness of sapphire
Upload
independentCategory
view
0download
0
1
Department of Mechanical, Materials and Aerospace Engineering
MMAE419 – Tuesdays Group A
Fracture Toughness of Materials - Laboratory 6
7 October 2015
Abstract
This report describes the tensile test experiment procedures realized in the MMAE 419 – Mechanical lab 6 – Fracture toughness of materials. The methods used to prepare the specimen, the treatment of the data and analysis are fully discussed throughout. Load-
2
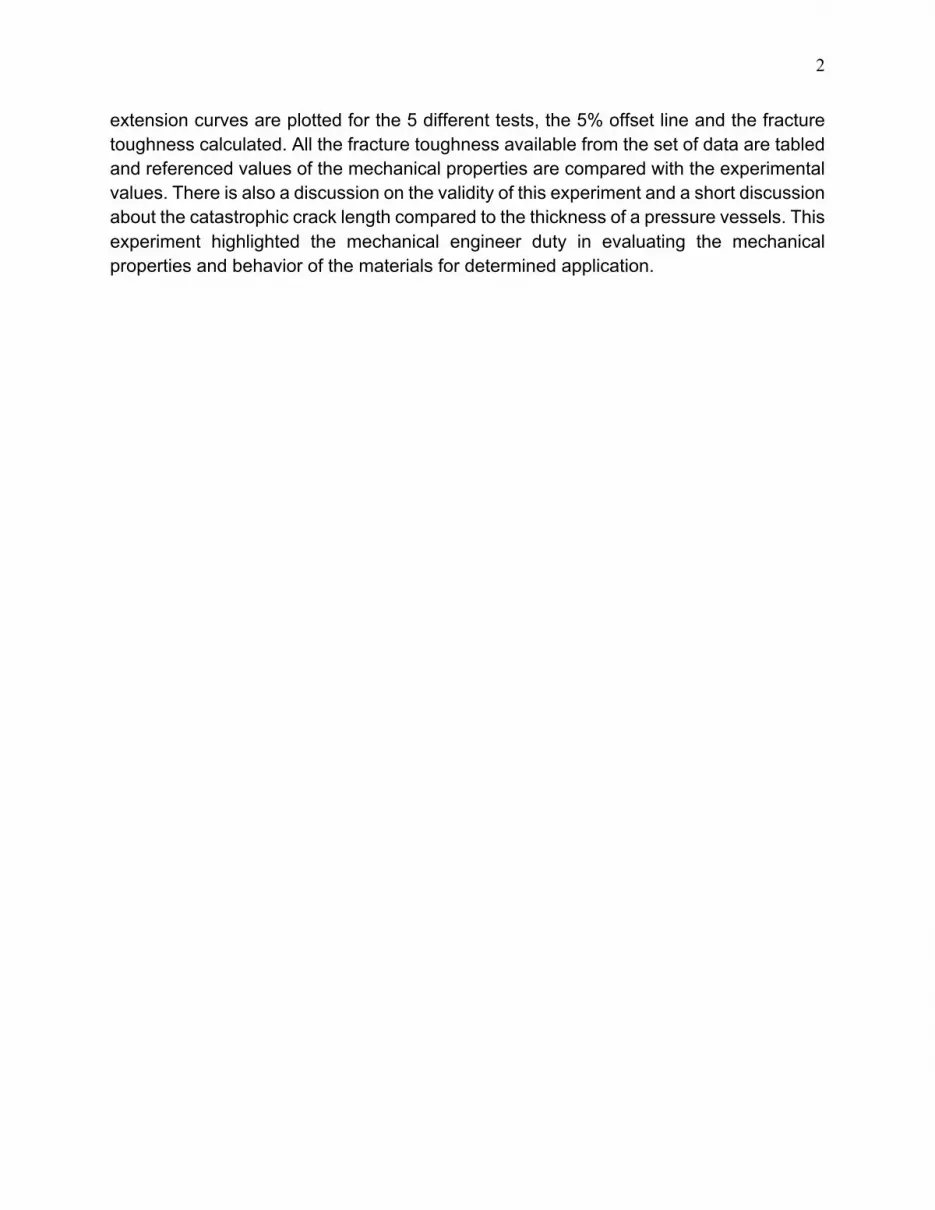
extension curves are plotted for the 5 different tests, the 5% offset line and the fracture toughness calculated. All the fracture toughness available from the set of data are tabled and referenced values of the mechanical properties are compared with the experimental values. There is also a discussion on the validity of this experiment and a short discussion about the catastrophic crack length compared to the thickness of a pressure vessels. This experiment highlighted the mechanical engineer duty in evaluating the mechanical properties and behavior of the materials for determined application.

3
Introduction
The presence of a crack in a component of a machine, vehicle, or structure may weaken it so that it fails by fracturing into two or more pieces. This can occur at stresses below the material’s yield strength, where failure would not normally be expected [1]. The fracture toughness experiment described in this report is a method of quantifying this behavior. Steel and aluminum specimens were evaluated in this test series. They were machined to fracture mechanics specimens designated as Compact Tension (CT) by the ASTM committee and tested as outlined in the ASTM standard E399 [2]. The load, displacement and crack length data were used to determine the value of "Fracture Toughness" (designated for the plane strain case as KIC) and a discussion of the validity of these results is presented in the results section. The equations 1 and 2 were used to disscuss the validity of the experiment.
𝑎𝑎𝑛𝑑𝐵 > 2.5 *+,-.
/ (1)
𝐾1 = (2 +
𝑎𝑊)0.886 + 4.64 𝑎
𝑊 − 13.32 𝑎𝑊
/+ 14.72 𝑎
𝑊?− 5.6 𝑎
𝑊@
1 − 𝑎𝑊
?//
PQ𝐵 𝑊
(2)

4
Procedure
The specimens were fatigue pre-cracked to a particular crack location given by the ratio of crack length, a, to specimen width, W (a/W). In this test series, the two fatigue pre-cracked specimens are to be pulled to fracture in the Instron 4507 testing machine. Figure 1 shows the experimental set up gripping arrangement for the fracture test. The following list summarizes the preparation of the specimen for the test:
• Measurement of the specimen dimensions B,W,c,d. Each dimension was measured at least 4 times and the average value calculated.
• The B (width value) was measured looking for its minimum value within the specimen.
• The surface where the mouth crack was polished and a device glued in order to allow the extensometer attachment.
• Specimen fixed in the Instron 4507 testing machine • Test performed and data saved.
Figure 1 – Experimental setup

5
Data Analysis
Figures 2 to 6 present the raw data from the fracture toughness experiment.
Figure 2- Raw data Al 2024
Figure 3 - Raw data Al 2024 (2)
0
500
1000
1500
2000
2500
3000
3500
4000
4500
- 0 . 0 5 0 0 . 0 5 0 . 1 0 . 1 5 0 . 2
LOA
D (L
BF)
EXTENSOMETER (IN)
0
500
1000
1500
2000
2500
3000
3500
4000
4500
5000
- 0 . 0 2 0 0 . 0 2 0 . 0 4 0 . 0 6 0 . 0 8 0 . 1
LOA
D (L
BF)
EXTENSOMETER (IN)

6
Figure 4 - Raw data Al 6061
Figure 5- Raw data Al 7075
0
500
1000
1500
2000
2500
3000
3500
4000
4500
5000
- 0 . 0 5 0 0 . 0 5 0 . 1 0 . 1 5 0 . 2 0 . 2 5
LOA
D (L
BF)
EXTENSOMETER (IN)
0
1000
2000
3000
4000
5000
6000
7000
- 0 . 0 2 0 0 . 0 2 0 . 0 4 0 . 0 6 0 . 0 8 0 . 1
LOA
D (L
BF)
EXTENSOMETER (IN)

7
Figure 6 - Raw data Steel 1018SD
Based on the Figure 7 the Fracture appearance geometry for each test will be
classified:
Figure 7 – Common types of Fracture appearance
0
2000
4000
6000
8000
10000
12000
14000
- 0 . 0 0 5 0 0 . 0 0 5 0 . 0 1 0 . 0 1 5 0 . 0 2 0 . 0 2 5 0 . 0 3
LOA
D (L
BF)
EXTENSOMETER (IN)

8
Al 2024 test presented a fracture with a fraction oblique geometry as shown in Figure 8:
Figure 8 – Al 2024 Fracture appearance geometry
Al 2024 (2) test presented a fracture with a fraction oblique geometry as shown in Figure 9:
Figure 9 – Al 2024 (2) Fracture appearance geometry
Al 6061 test presented a fracture predominant oblique geometry as shown in Figure 10,
Al 7075 test presented a fracture with a fraction oblique geometry as shown in Figure 11
and Steel 1018 test also presented a fracture with a fraction oblique geometry as shown
in Figure 12.

9
Figure 10 – Al 6061 Fracture appearance geometry
Figure 11– Al 7075 Fracture appearance geometry
Figure 12– Steel 1018 Fracture appearance geometry

10
Results The first criteria observed to assure the validity of the experiment and the fracture toughness discussed is that the central crack length variations be less than 10% of the average crack length value. Table 1 show the value for average crack length, the measurements and the maximum variation.
Table 1– Difference between measurements and average crack length (in) Al2024 Al2024(2) Al6061 Al7075 St1018CD
aaverage 1.0030 1.0241 0.9756 1.4509 0.9674a1 0.9646 0.9580 0.9446 1.3981 0.9462a2 1.0247 1.0643 0.9944 1.4786 0.9765a3 1.0408 1.0880 1.0035 1.4972 0.9765a4 1.0152 1.0698 0.9928 1.4757 0.9831a5 0.9698 0.9402 0.9426 1.4047 0.9546max
variation(%)
3.83 8.19 3.38 3.64 2.19
Table 2 summarizes all the results and values of KIC when available. Those values are compared with reference values in the conclusion section.
Table 2– Summary of Results Al2024 Al2024(2) Al6061 Al7075 St1018CDm(lbf/in) 167971.000 173495.000 177784.000 283440.000 525877.000m95(lbf/in) 159572.450 164820.250 168894.800 269268.000 499583.150PQ(lbf) 4169.620 4322.410 3859.690 6197.976 xxPmax(lbf) 4267.872 4459.359 4599.103 6197.976 12837.802Pmax/Pq 1.024 1.032 1.192 1.000 xx2.5(Kq/Sy)ˆ2 0.922 1.024 0.397 0.213 xxf(a/W) 9.685 9.924 9.283 9.174 9.073Kq(psisqrt(in)) 28538.326 30084.283 25213.031 21293.736 xxa/W 0.501 0.509 0.487 0.483 0.479a(in) 1.003 1.024 0.976 1.451 0.967B(in) 1.000 1.005 1.004 1.506 1.005P5 PQ PQ PQ 6058.530 xxKIC(ksisqrt(in)) 28.50 30.08 NOTKQ 21.30 xx
11
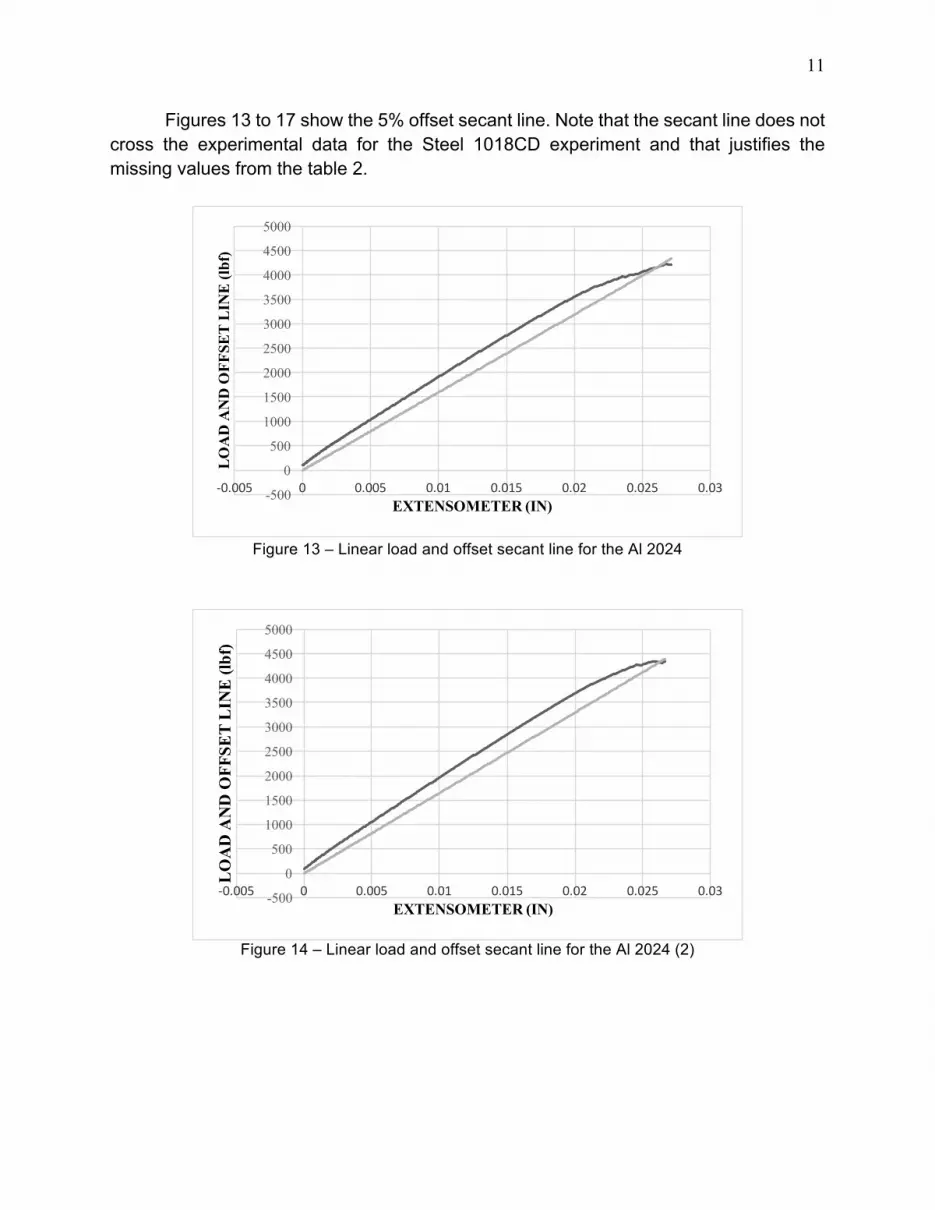
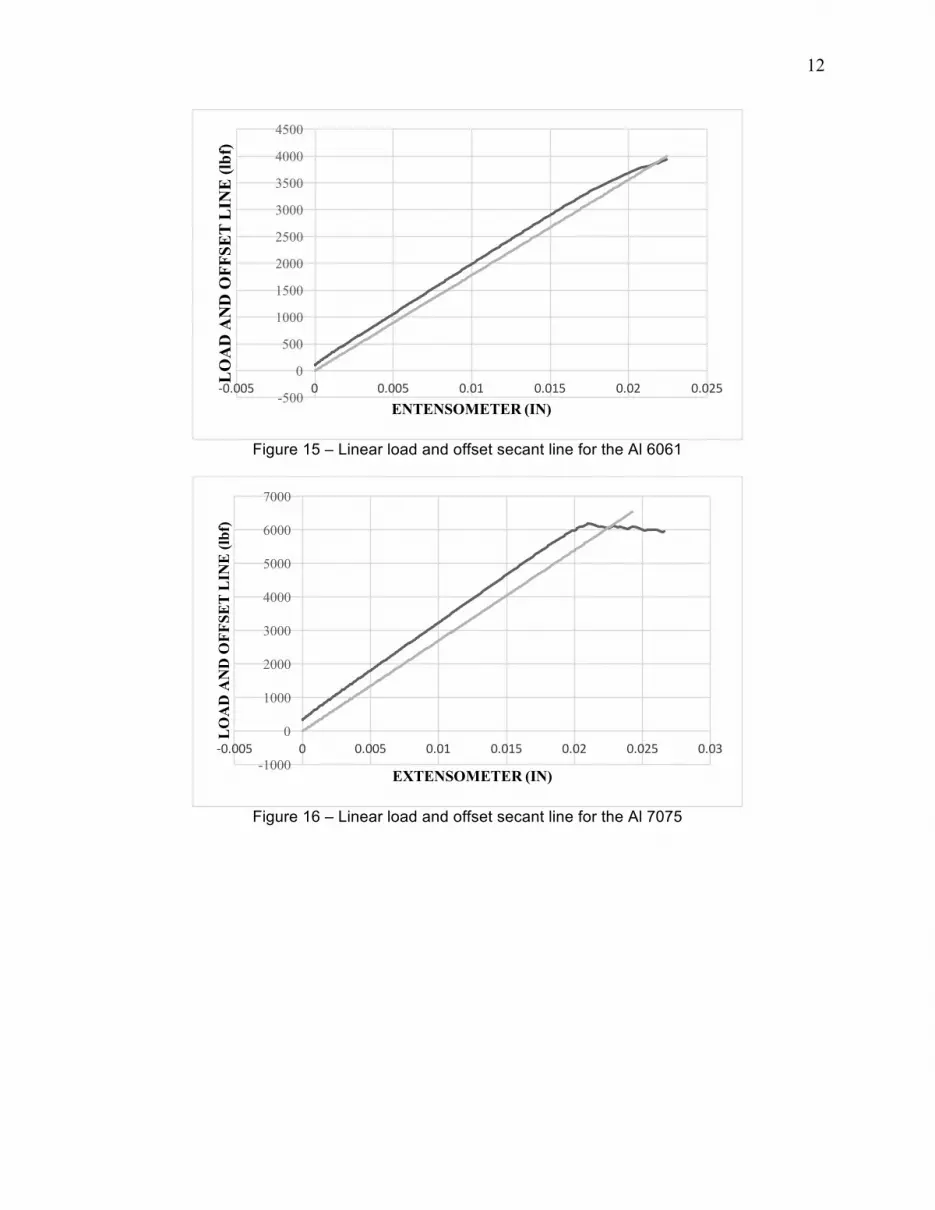
Figures 13 to 17 show the 5% offset secant line. Note that the secant line does not cross the experimental data for the Steel 1018CD experiment and that justifies the missing values from the table 2.
Figure 13 – Linear load and offset secant line for the Al 2024
Figure 14 – Linear load and offset secant line for the Al 2024 (2)
-500
0
500
1000
1500
2000
2500
3000
3500
4000
4500
5000
-0.005 0 0.005 0.01 0.015 0.02 0.025 0.03
LO
AD
AN
D O
FFSE
T L
INE
(lbf
)
EXTENSOMETER (IN)
-500
0
500
1000
1500
2000
2500
3000
3500
4000
4500
5000
-0.005 0 0.005 0.01 0.015 0.02 0.025 0.03
LO
AD
AN
D O
FFSE
T L
INE
(lbf
)
EXTENSOMETER (IN)
12
Figure 15 – Linear load and offset secant line for the Al 6061
Figure 16 – Linear load and offset secant line for the Al 7075
-500
0
500
1000
1500
2000
2500
3000
3500
4000
4500
-0.005 0 0.005 0.01 0.015 0.02 0.025
LO
AD
AN
D O
FFSE
T L
INE
(lbf
)
ENTENSOMETER (IN)
-1000
0
1000
2000
3000
4000
5000
6000
7000
-0.005 0 0.005 0.01 0.015 0.02 0.025 0.03
LO
AD
AN
D O
FFSE
T L
INE
(lbf
)
EXTENSOMETER (IN)

13
Figure 17 – Linear load and offset secant line for the Steel 1018CD
One can calculate the catastrophic crack length for a stress design of 50 ksi with help of the Equation 3: 𝐾DE = 𝜎GHI 𝜋𝑎 (3)
Table 3 – Catastrophic crack length
Al2024 Al2024(2) Al6061 Al7075 St1018CD
KIC 28.54 30.08 xx 21.29 xx
Ac(in) 0.10 0.12 xx 0.06 xx In the conclusion section the relative size of the catastrophic crack length will be compared to actual values of thickness from Figure 18:
Figure 18 - Thickness chart for pressure vessels [3]
-2000
0
2000
4000
6000
8000
10000
12000
14000
-0.005 0 0.005 0.01 0.015 0.02 0.025 0.03
LO
AD
AN
D O
FFSE
T L
INE
(lbf
)
EXTENSOMETER (IN)

14
Conclusion
• Most of the specimen had an oblique fracture appearance geometry, with the Al 6061 being the only predominant oblique appearance.
• None of the materials presented more than 10% variation in the crack length. The maximum variation was in the Al 2024 (2) with 8.19%.
• Because the difference between Pmax and Pq in the Al 6061 test, one cannot affirm that the value KQ is equal to Kic. That is why there was not presented a value for the catastrophic crack length for this material.
• Because the 5% secant offset line in the Steel 1018 does not cross the data, the value of PQ, P5, KQ and Kic are not defined. That is why there was not presented a value for the catastrophic crack length for this material.
• The Al 6061 test was the only one where the offset secant line cross the data at a load less than the maximum and because of that there are values different for P5 and PQ.
• From Figure one can see that the thickness recommended for pressure vessels thickness vary considerably. For example, for a vessel operation at 300 psi with an inside diameter of 12 inches its wall should be at least 1 ¼ inches thick. Comparing that value to a .12 inch (for the Al 2024 (2) test) one can see that the crack length can be close to 10% of the thickness without causing a catastrophic effect. Surely those are only estimations and a real life operation must have much tighter values for admissible length of cracks.
• Finally a real measure of the validity of the experiment reported here is the comparison of the fracture toughness values establish with reference values from specialized literature ([1]): Table 4 – Comparison between experimental and reference values
Al2024 Al2024(2) Al6061 Al7075 St1018CDKIC(T) 28.54 30.08 xx 21.29 xxKIC(R) 31.00 31.00 xx 26.00 xxDiff(%) 7.94 2.95 xx 18.1 xx
• We can see from Table that the most difference is for the Al 7075 test: 18%. Taking into account that there are many variables in these experiments (temperature, humidity, preparation of the specimen and experimental setup, etc.) that there is no information about in the reference source, no further investigation can be made to explain this difference. Nevertheless, the Al 2024 (2) test showed less than 3% difference from the reference showing that the procedure followed were good.

15
References
1- Dowling, Norman E. Mechanical Behavior of Materials. Pearson, 2012. 2- Vural, Murat. Fracture Toughness experiment handout. Illinois Institute of Technology, MMAE 2015 3- Pressure Vessels : ASME Code Simplified, Eighth Edition. 2005
Copyright © 2022 FDOKUMEN