Mental Toughness Development via Military-Style Training in ...
This article appeared in a journal published by Elsevier. The attachedcopy is furnished to the author for internal non-commercial researchand education use, including for instruction at the authors institution
and sharing with colleagues.
Other uses, including reproduction and distribution, or selling orlicensing copies, or posting to personal, institutional or third party
websites are prohibited.
In most cases authors are permitted to post their version of thearticle (e.g. in Word or Tex form) to their personal website orinstitutional repository. Authors requiring further information
regarding Elsevier’s archiving and manuscript policies areencouraged to visit:
http://www.elsevier.com/authorsrights
Author's personal copy
Short communication: Material properties
A comparison between dynamic and static fracture toughnessof polyurethane foams
Liviu Marsavina a,*, Emanoil Linul a, Tudor Voiconi a, Tomasz Sadowski b
a POLITEHNICA University of Timisoara, Department Mechanics and Strength of Materials, Blvd. M. Viteazu, Nr.1, Timisoara 300222,Romaniab Lublin University of Technology, Faculty of Civil and Sanitary Engineering, 20-618 Lublin, Nadbystrzycka 40 Str., Poland
a r t i c l e i n f o
Article history:Received 29 January 2013Accepted 9 March 2013
Keywords:Polyurethane foamStatic fracture toughnessDynamic fracture toughness
a b s t r a c t
The paper presents a correlation between dynamic and static fracture toughness ofpolyurethane rigid foams. Static three point bend tests and instrumented impact testswere performed using single edge notch specimens. The obtained results show that for allfoam densities the dynamic fracture toughness is higher than the static toughness. Densityappears to have the main influence on both static and dynamic fracture toughness. A quasibrittle fracture without plastic deformations and cushioning was observed for all foamdensities.
� 2013 Elsevier Ltd. All rights reserved.
1. Introduction
Polyurethane (PUR) foams are made of interconnectednetworks of solid struts and cell walls incorporating voidswith entrapped gas. The main characteristics of PUR foamsare light weight, high porosity, high crushability and goodenergy absorption capacity [1]. Taking into account theseproperties, PUR foams arewidely used as cores in sandwichcomposites, for packing and cushioning. It is well knownthat the foam crushes in compression, Fig. 1a, while intension it fails by propagation of a single crack, Fig. 1b. Mostof the rigid polymer foams have a linear elastic behavior intension up to fracture, and a brittle fracture, so they can beassessed based on Linear Elastic Fracture Mechanics(LEFM) [2]. Consequently, the fracture toughness of PURfoams represents an important property.
Many efforts have been carried out in recent years todetermine the fracture toughness of different types offoams under static loadings [3–9]. Most of these studies
were experimental tests, but micromechanical analyticalmodels were also considered.
The first correlation between fracture toughness ofPUR foams and density (<200 kg/m3) was proposed byMcIntyre and Anderson [3] in a linear form. The samebehaviour was observed by Danielsson [4] on PVCDivinycell foams and Viana and Carlsson on Diab H foams[5]. A correlation between the static fracture toughnessand relative density r/rs was proposed in [1] in the form:KIc ¼ Csfs
ffiffiffiffiffipl
pðr=rsÞm, where sfs is the tensile strength of
the cell wall solid material in bending, l is the celldimension, C represents a constant of proportionality andm an exponent (equal to 3/2 for open cells). The fracturetoughness of rigid polyurethane foams was expressed byGIc and was determined using Double Cantilever Beam(DCB) specimens, Fowlkes [10].
Up to now, there are only few results for dynamic fracturetoughness of plastic foams reported in the literature. Kabiret al. [6] investigated the Mode I dynamic fracture toughnessof 260 kg/m3 density PVC foam and obtained a maximumvalue of 2.74 MPa m0.5, which is approximately 3.75 timeshigher than the static fracture toughness of the same foam.Mills and Kang [11] used a falling mass on a polystyrene (PS)
* Corresponding author. Tel.: þ40 726397635; Fax: þ40 256403523.E-mail addresses: [email protected], [email protected] (L.
Marsavina).
Contents lists available at SciVerse ScienceDirect
Polymer Testing
journal homepage: www.elsevier .com/locate/polytest
0142-9418/$ – see front matter � 2013 Elsevier Ltd. All rights reserved.http://dx.doi.org/10.1016/j.polymertesting.2013.03.013
Polymer Testing 32 (2013) 673–680
Author's personal copy
compact tension specimen made in order to determine thedynamic fracture toughness, and Mills [12] also proposed acorrelation between the dynamic fracture toughness andfoam density. The effect of an impregnation layer on fracturetoughness of polyurethane rigid foams was investigated byMarsavina and Sadowski [13].
This paper presents comparatively the static and dy-namic fracture toughness results for closed cells poly-urethane rigid foams. The experiments were carried outusing Single Edge Notched Bend (SENB) specimens.
Fig. 1. Degradation of plastic foams in compression (a.) and bending (b.).
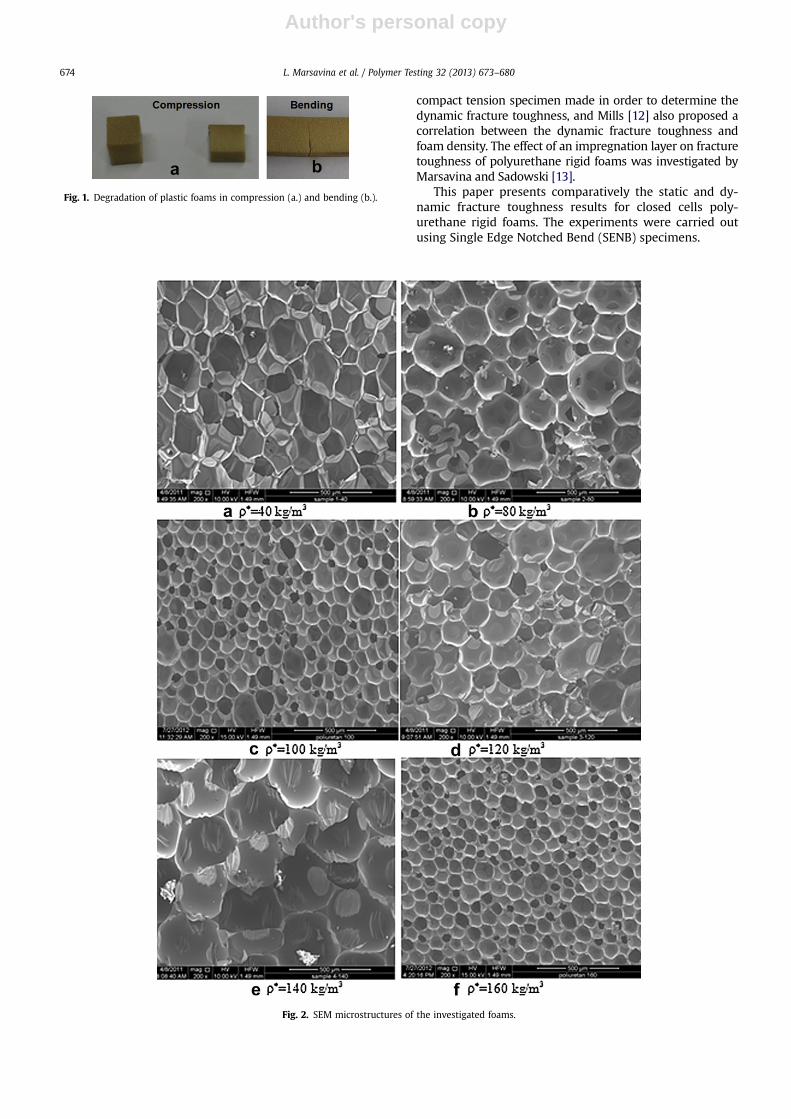
Fig. 2. SEM microstructures of the investigated foams.
L. Marsavina et al. / Polymer Testing 32 (2013) 673–680674
Author's personal copy
2. Test methodology
2.1. Materials
Investigations were performed on rigid polyurethane(PUR) foams of different densities 40, 80, 100, 120, 140 and160 kg/m3. SEM images, obtained with QUANTA FEG 250,showa close cell configurationwith approximately uniformdistribution: hexagonal for 40 kg/m3 density and sphericalfor the other densities, Fig. 2.
Table 1 presents the compression properties of thefoams under static (loading rate 2mm/min for all densities)and dynamic loading (1.28 m/s for 80, 120 and 140 kg/m3
densities, respectively 0.94 m/s for 40, 100 and 160 kg/m3
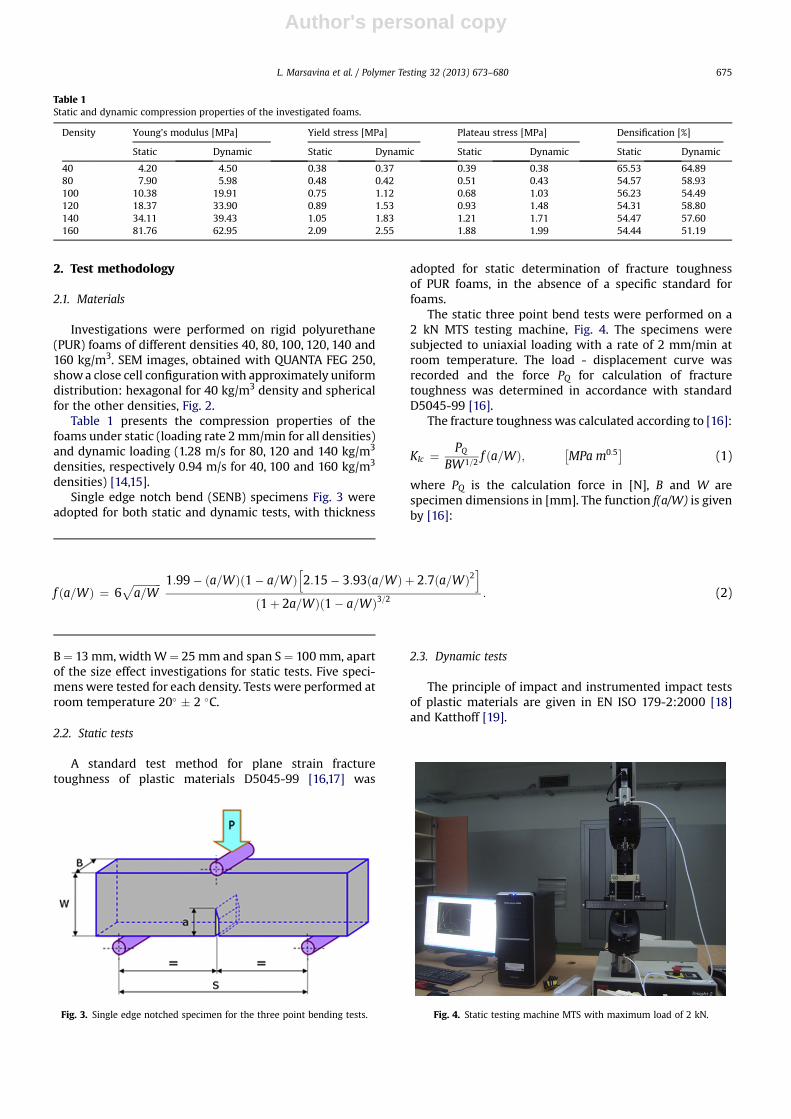
densities) [14,15].Single edge notch bend (SENB) specimens Fig. 3 were
adopted for both static and dynamic tests, with thickness
B¼ 13 mm, widthW¼ 25 mm and span S ¼ 100 mm, apartof the size effect investigations for static tests. Five speci-mens were tested for each density. Tests were performed atroom temperature 20� � 2 �C.
2.2. Static tests
A standard test method for plane strain fracturetoughness of plastic materials D5045-99 [16,17] was
adopted for static determination of fracture toughnessof PUR foams, in the absence of a specific standard forfoams.
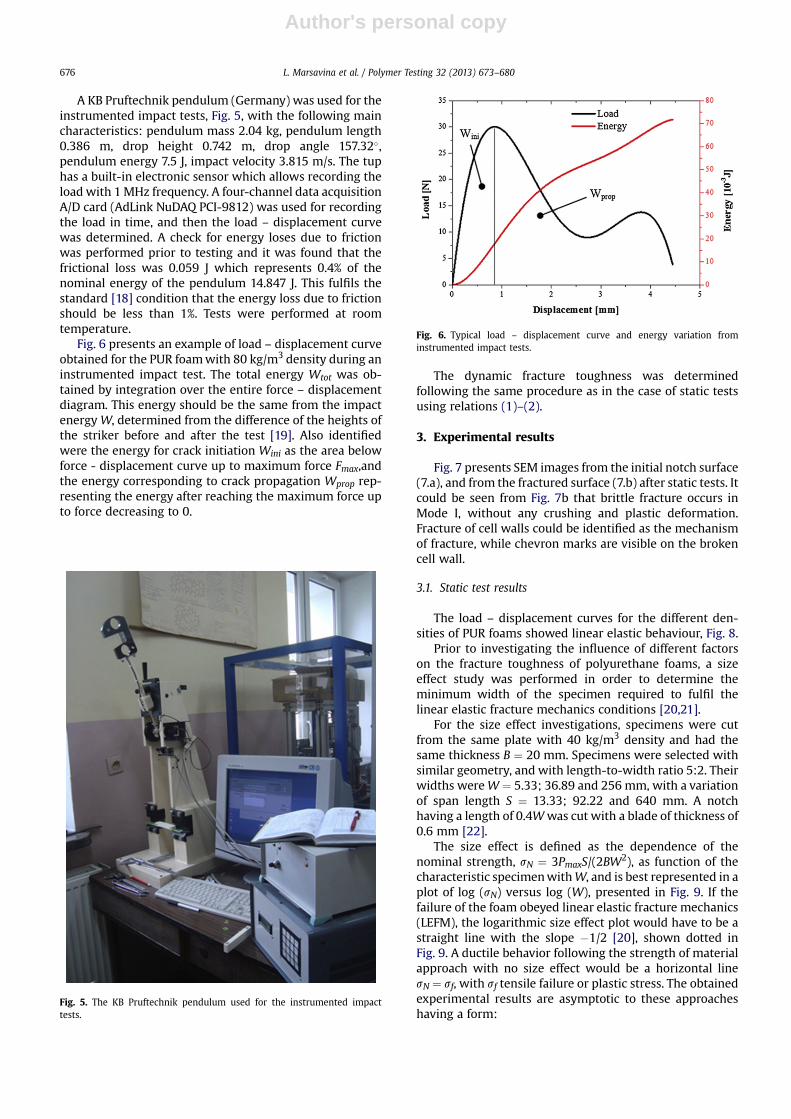
The static three point bend tests were performed on a2 kN MTS testing machine, Fig. 4. The specimens weresubjected to uniaxial loading with a rate of 2 mm/min atroom temperature. The load - displacement curve wasrecorded and the force PQ for calculation of fracturetoughness was determined in accordance with standardD5045-99 [16].
The fracture toughness was calculated according to [16]:
KIc ¼ PQBW1=2 f ða=WÞ; �
MPa m0:5� (1)
where PQ is the calculation force in [N], B and W arespecimen dimensions in [mm]. The function f(a/W) is givenby [16]:
2.3. Dynamic tests
The principle of impact and instrumented impact testsof plastic materials are given in EN ISO 179-2:2000 [18]and Katthoff [19].
Table 1Static and dynamic compression properties of the investigated foams.
Density Young’s modulus [MPa] Yield stress [MPa] Plateau stress [MPa] Densification [%]
Static Dynamic Static Dynamic Static Dynamic Static Dynamic
40 4.20 4.50 0.38 0.37 0.39 0.38 65.53 64.8980 7.90 5.98 0.48 0.42 0.51 0.43 54.57 58.93100 10.38 19.91 0.75 1.12 0.68 1.03 56.23 54.49120 18.37 33.90 0.89 1.53 0.93 1.48 54.31 58.80140 34.11 39.43 1.05 1.83 1.21 1.71 54.47 57.60160 81.76 62.95 2.09 2.55 1.88 1.99 54.44 51.19
Fig. 3. Single edge notched specimen for the three point bending tests.
f ða=WÞ ¼ 6ffiffiffiffiffiffiffiffiffiffiffia=W
p 1:99� ða=WÞð1� a=WÞh2:15� 3:93ða=WÞ þ 2:7ða=WÞ2
i
ð1þ 2a=WÞð1� a=WÞ3=2: (2)
Fig. 4. Static testing machine MTS with maximum load of 2 kN.
L. Marsavina et al. / Polymer Testing 32 (2013) 673–680 675
Author's personal copy
A KB Pruftechnik pendulum (Germany) was used for theinstrumented impact tests, Fig. 5, with the following maincharacteristics: pendulum mass 2.04 kg, pendulum length0.386 m, drop height 0.742 m, drop angle 157.32�,pendulum energy 7.5 J, impact velocity 3.815 m/s. The tuphas a built-in electronic sensor which allows recording theload with 1MHz frequency. A four-channel data acquisitionA/D card (AdLink NuDAQ PCI-9812) was used for recordingthe load in time, and then the load – displacement curvewas determined. A check for energy loses due to frictionwas performed prior to testing and it was found that thefrictional loss was 0.059 J which represents 0.4% of thenominal energy of the pendulum 14.847 J. This fulfils thestandard [18] condition that the energy loss due to frictionshould be less than 1%. Tests were performed at roomtemperature.
Fig. 6 presents an example of load – displacement curveobtained for the PUR foamwith 80 kg/m3 density during aninstrumented impact test. The total energy Wtot was ob-tained by integration over the entire force – displacementdiagram. This energy should be the same from the impactenergyW, determined from the difference of the heights ofthe striker before and after the test [19]. Also identifiedwere the energy for crack initiation Wini as the area belowforce - displacement curve up to maximum force Fmax,andthe energy corresponding to crack propagation Wprop rep-resenting the energy after reaching the maximum force upto force decreasing to 0.
The dynamic fracture toughness was determinedfollowing the same procedure as in the case of static testsusing relations (1)–(2).
3. Experimental results
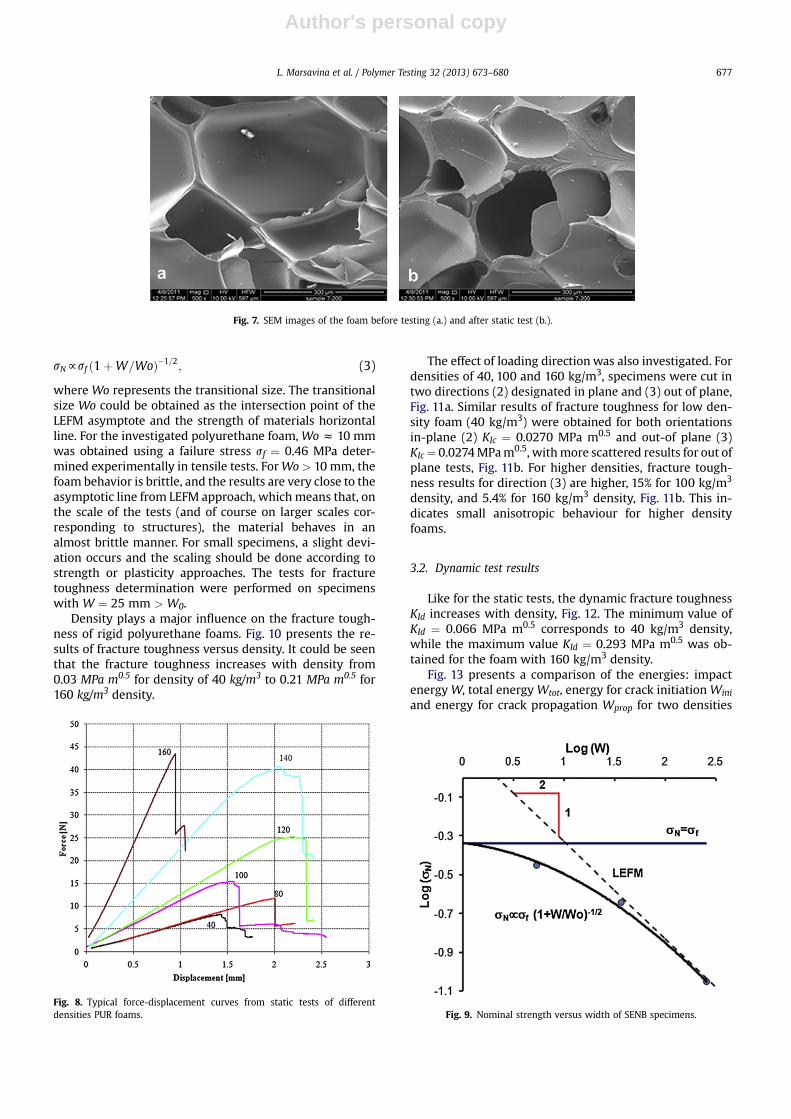
Fig. 7 presents SEM images from the initial notch surface(7.a), and from the fractured surface (7.b) after static tests. Itcould be seen from Fig. 7b that brittle fracture occurs inMode I, without any crushing and plastic deformation.Fracture of cell walls could be identified as the mechanismof fracture, while chevron marks are visible on the brokencell wall.
3.1. Static test results
The load – displacement curves for the different den-sities of PUR foams showed linear elastic behaviour, Fig. 8.
Prior to investigating the influence of different factorson the fracture toughness of polyurethane foams, a sizeeffect study was performed in order to determine theminimum width of the specimen required to fulfil thelinear elastic fracture mechanics conditions [20,21].
For the size effect investigations, specimens were cutfrom the same plate with 40 kg/m3 density and had thesame thickness B ¼ 20 mm. Specimens were selected withsimilar geometry, and with length-to-width ratio 5:2. Theirwidths wereW ¼ 5.33; 36.89 and 256 mm, with a variationof span length S ¼ 13.33; 92.22 and 640 mm. A notchhaving a length of 0.4Wwas cut with a blade of thickness of0.6 mm [22].
The size effect is defined as the dependence of thenominal strength, sN ¼ 3PmaxS/(2BW2), as function of thecharacteristic specimenwithW, and is best represented in aplot of log (sN) versus log (W), presented in Fig. 9. If thefailure of the foam obeyed linear elastic fracture mechanics(LEFM), the logarithmic size effect plot would have to be astraight line with the slope �1/2 [20], shown dotted inFig. 9. A ductile behavior following the strength of materialapproach with no size effect would be a horizontal linesN ¼ sf, with sf tensile failure or plastic stress. The obtainedexperimental results are asymptotic to these approacheshaving a form:
Fig. 5. The KB Pruftechnik pendulum used for the instrumented impacttests.
Fig. 6. Typical load – displacement curve and energy variation frominstrumented impact tests.
L. Marsavina et al. / Polymer Testing 32 (2013) 673–680676
Author's personal copy
sNfsf ð1þW=WoÞ�1=2; (3)
where Wo represents the transitional size. The transitionalsize Wo could be obtained as the intersection point of theLEFM asymptote and the strength of materials horizontalline. For the investigated polyurethane foam, Woz 10 mmwas obtained using a failure stress sf ¼ 0.46 MPa deter-mined experimentally in tensile tests. ForWo> 10 mm, thefoam behavior is brittle, and the results are very close to theasymptotic line from LEFM approach, which means that, onthe scale of the tests (and of course on larger scales cor-responding to structures), the material behaves in analmost brittle manner. For small specimens, a slight devi-ation occurs and the scaling should be done according tostrength or plasticity approaches. The tests for fracturetoughness determination were performed on specimenswith W ¼ 25 mm > W0.
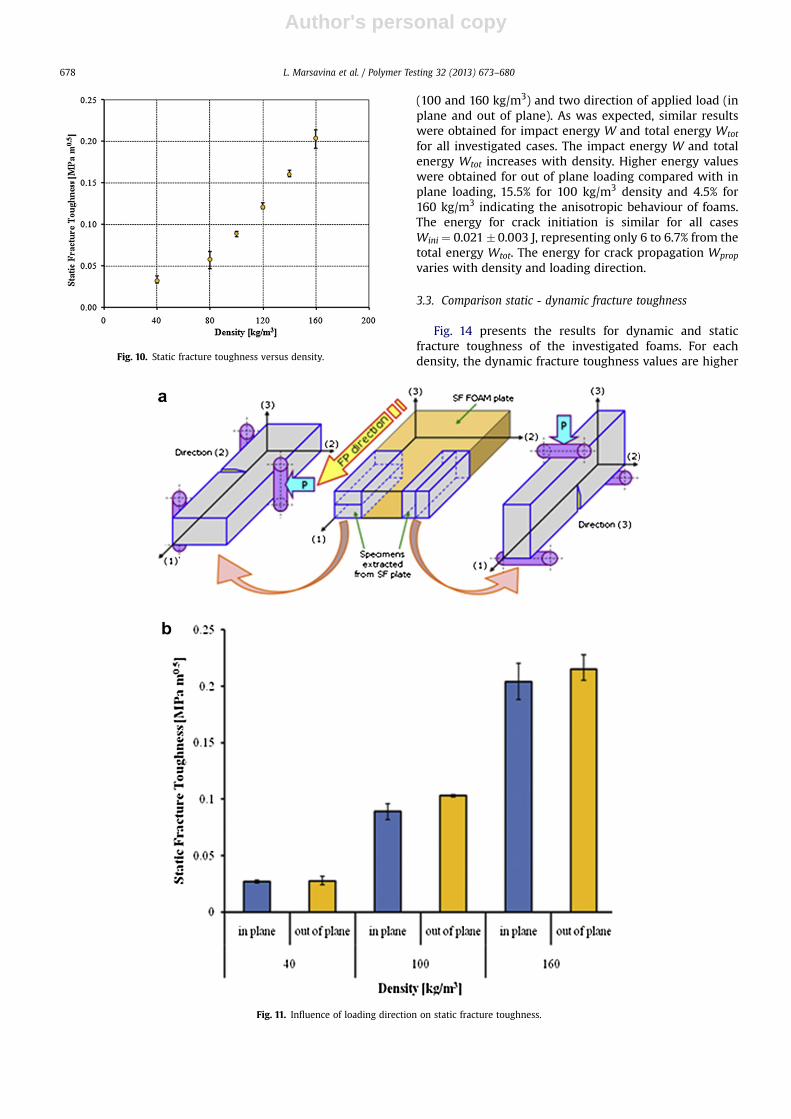
Density plays a major influence on the fracture tough-ness of rigid polyurethane foams. Fig. 10 presents the re-sults of fracture toughness versus density. It could be seenthat the fracture toughness increases with density from0.03 MPa m0.5 for density of 40 kg/m3 to 0.21 MPa m0.5 for160 kg/m3 density.
The effect of loading direction was also investigated. Fordensities of 40, 100 and 160 kg/m3, specimens were cut intwo directions (2) designated in plane and (3) out of plane,Fig. 11a. Similar results of fracture toughness for low den-sity foam (40 kg/m3) were obtained for both orientationsin-plane (2) KIc ¼ 0.0270 MPa m0.5 and out-of plane (3)KIc¼ 0.0274MPam0.5, withmore scattered results for out ofplane tests, Fig. 11b. For higher densities, fracture tough-ness results for direction (3) are higher, 15% for 100 kg/m3
density, and 5.4% for 160 kg/m3 density, Fig. 11b. This in-dicates small anisotropic behaviour for higher densityfoams.
3.2. Dynamic test results
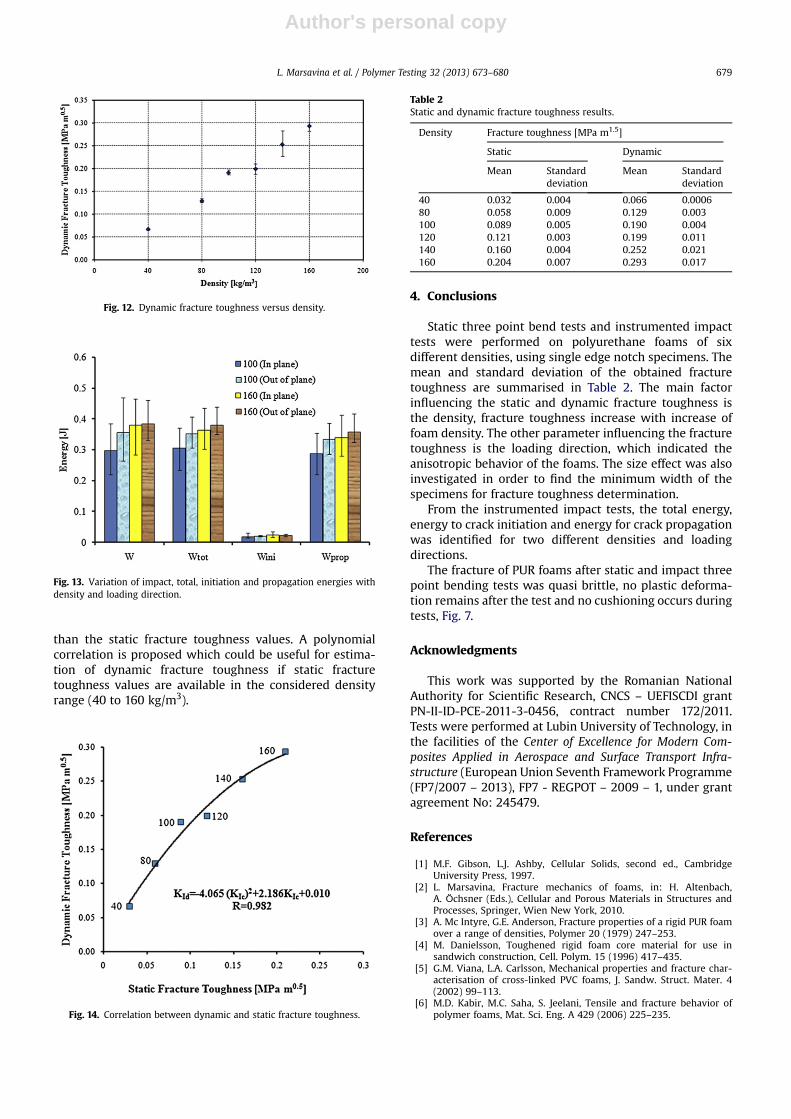
Like for the static tests, the dynamic fracture toughnessKId increases with density, Fig. 12. The minimum value ofKId ¼ 0.066 MPa m0.5 corresponds to 40 kg/m3 density,while the maximum value KId ¼ 0.293 MPa m0.5 was ob-tained for the foam with 160 kg/m3 density.
Fig. 13 presents a comparison of the energies: impactenergy W, total energy Wtot, energy for crack initiation Wini
and energy for crack propagation Wprop for two densities
Fig. 7. SEM images of the foam before testing (a.) and after static test (b.).
Fig. 8. Typical force-displacement curves from static tests of differentdensities PUR foams. Fig. 9. Nominal strength versus width of SENB specimens.
L. Marsavina et al. / Polymer Testing 32 (2013) 673–680 677
Author's personal copy
(100 and 160 kg/m3) and two direction of applied load (inplane and out of plane). As was expected, similar resultswere obtained for impact energy W and total energy Wtot
for all investigated cases. The impact energy W and totalenergy Wtot increases with density. Higher energy valueswere obtained for out of plane loading compared with inplane loading, 15.5% for 100 kg/m3 density and 4.5% for160 kg/m3 indicating the anisotropic behaviour of foams.The energy for crack initiation is similar for all casesWini ¼ 0.021 � 0.003 J, representing only 6 to 6.7% from thetotal energy Wtot. The energy for crack propagation Wprop
varies with density and loading direction.
3.3. Comparison static - dynamic fracture toughness
Fig. 14 presents the results for dynamic and staticfracture toughness of the investigated foams. For eachdensity, the dynamic fracture toughness values are higherFig. 10. Static fracture toughness versus density.
Fig. 11. Influence of loading direction on static fracture toughness.
L. Marsavina et al. / Polymer Testing 32 (2013) 673–680678
Author's personal copy
than the static fracture toughness values. A polynomialcorrelation is proposed which could be useful for estima-tion of dynamic fracture toughness if static fracturetoughness values are available in the considered densityrange (40 to 160 kg/m3).
4. Conclusions
Static three point bend tests and instrumented impacttests were performed on polyurethane foams of sixdifferent densities, using single edge notch specimens. Themean and standard deviation of the obtained fracturetoughness are summarised in Table 2. The main factorinfluencing the static and dynamic fracture toughness isthe density, fracture toughness increase with increase offoam density. The other parameter influencing the fracturetoughness is the loading direction, which indicated theanisotropic behavior of the foams. The size effect was alsoinvestigated in order to find the minimum width of thespecimens for fracture toughness determination.
From the instrumented impact tests, the total energy,energy to crack initiation and energy for crack propagationwas identified for two different densities and loadingdirections.
The fracture of PUR foams after static and impact threepoint bending tests was quasi brittle, no plastic deforma-tion remains after the test and no cushioning occurs duringtests, Fig. 7.
Acknowledgments
This work was supported by the Romanian NationalAuthority for Scientific Research, CNCS – UEFISCDI grantPN-II-ID-PCE-2011-3-0456, contract number 172/2011.Tests were performed at Lubin University of Technology, inthe facilities of the Center of Excellence for Modern Com-posites Applied in Aerospace and Surface Transport Infra-structure (European Union Seventh Framework Programme(FP7/2007 – 2013), FP7 - REGPOT – 2009 – 1, under grantagreement No: 245479.
References
[1] M.F. Gibson, L.J. Ashby, Cellular Solids, second ed., CambridgeUniversity Press, 1997.
[2] L. Marsavina, Fracture mechanics of foams, in: H. Altenbach,A. Ӧchsner (Eds.), Cellular and Porous Materials in Structures andProcesses, Springer, Wien New York, 2010.
[3] A. Mc Intyre, G.E. Anderson, Fracture properties of a rigid PUR foamover a range of densities, Polymer 20 (1979) 247–253.
[4] M. Danielsson, Toughened rigid foam core material for use insandwich construction, Cell. Polym. 15 (1996) 417–435.
[5] G.M. Viana, L.A. Carlsson, Mechanical properties and fracture char-acterisation of cross-linked PVC foams, J. Sandw. Struct. Mater. 4(2002) 99–113.
[6] M.D. Kabir, M.C. Saha, S. Jeelani, Tensile and fracture behavior ofpolymer foams, Mat. Sci. Eng. A 429 (2006) 225–235.
Fig. 12. Dynamic fracture toughness versus density.
Fig. 13. Variation of impact, total, initiation and propagation energies withdensity and loading direction.
Fig. 14. Correlation between dynamic and static fracture toughness.
Table 2Static and dynamic fracture toughness results.
Density Fracture toughness [MPa m1.5]
Static Dynamic
Mean Standarddeviation
Mean Standarddeviation
40 0.032 0.004 0.066 0.000680 0.058 0.009 0.129 0.003100 0.089 0.005 0.190 0.004120 0.121 0.003 0.199 0.011140 0.160 0.004 0.252 0.021160 0.204 0.007 0.293 0.017
L. Marsavina et al. / Polymer Testing 32 (2013) 673–680 679
Author's personal copy
[7] S. Choi, B.V. Sankar, Fracture toughness of carbon foam, J. Compos.Mater. 37 (23) (2003) 2101–2116.
[8] N.K. Arakere, E.C. Knudsen, D. Wells, P. McGill, G.R. Swanson,Determination of mixed-mode stress intensity factors, fracturetoughness, and crack turning angle for anisotropic foam material,Int. J. Solids Struct. 45 (2008) 4936–4951.
[9] J.K. Stewart, H. Mahfuz, L.A. Carlsson, Enhancing mechanical andfracture properties of sandwich composites using nanoparticlereinforcement, J. Mat. Sci. 45 (13) (2010) 3490–3496.
[10] C.W. Fowlkes, Fracture toughness of a rigid polyurethane foam, Int.J. Fract. 10 (1) (1974) 99–108.
[11] N.J. Mills, P. Kang, The effect of water immersion on the fracturetoughness of polystyrene bead foams, J. Cell. Plast. 30 (1994)196–222.
[12] N.J. Mills, Polymer FoamsHandbook, Butterworth-Heinemann, 2007.[13] L. Marsavina, T. Sadowski, Dynamic fracture toughness of poly-
urethane foams, Polym. Test. 27 (8) (2008) 941–944.[14] L. Marsavina, T. Sadowski, D.M. Constantinescu, R. Negru, Failure of
polyurethane foams under different loading conditions, Key Eng.Mater. 385 – 387 (2008) 205–208.
[15] L. Marsavina, T. Sadowski, D.M. Constantinescu, R. Negru,Polyurethane foams behavior. Experiments versus modeling, KeyEng. Mater. 399 (2009) 123–130.
[16] ASTM D5045-99. Standard Test Methods for Plane-Strain FractureToughness and Strain Energy Release Rate of Plastic Materials.
[17] R. Brown, Handbook of Polymer Testing, Rapra Technology Limited,Shawbury, 2002.
[18] EN ISO 179–2:2000. Plastics – Determination of Charpy impactproperties. Part 2: instrumented impact test.
[19] J.F. Kalthoff, Characterization of the dynamic failure behaviour of aglass-fiber/vinyl-seter at different temperatures by means of instru-mented Charpy impact testing, Comp. Part. B 35 (2004) 657–663.
[20] Z.P. Ba�zant, Scaling of Structural Strength, Hermes-Penton, London,2002.
[21] P. Zdenek, Z.P. Ba�zant, Z. Yong, Z. Goangseup, M.D. Isaac, Size effectand asymptotic matching analysis of fracture of closed-cell poly-meric foam, Int. J. Sol. Struc. 40 (2003) 7197–7217.
[22] E. Linul, L. Marsavina, T. Sadowski, M. Knec, Size effect on fracturetoughness of rigid polyurethane foams, Solid State Phenom. 188(2012) 205–210.
L. Marsavina et al. / Polymer Testing 32 (2013) 673–680680
Copyright © 2022 FDOKUMEN