Dynamic fracture parameters and constraint effects in functionally graded syntactic epoxy foams
Upload
independentCategory
view
0download
0
C A R B O N 4 7 ( 2 0 0 9 ) 1 4 8 0 – 1 4 9 2
. sc iencedi rec t .com
ava i lab le at wwwjournal homepage: www.elsevier .com/ locate /carbon
Tannin-based carbon foams
G. Tondia, V. Fierrob, A. Pizzia, A. Celzardb,c,*
aLERMAB – ENSTIB, 27 rue du Merle Blanc, BP 1041, 88051 Epinal Cedex 9, FrancebInstitut Jean Lamour – UMR CNRS 7198, CNRS – Nancy-Universite – UPV-Metz, Departement Chimie et Physique des Solides et des Surfaces,
BP 239, 54506 Vandoeuvre-les-Nancy Cedex, FrancecInstitut Jean Lamour – UMR CNRS 7198, CNRS – Nancy-Universite – UPV-Metz, Departement Chimie et Physique des Solides et des Surfaces,
ENSTIB, 27 rue de Merle Blanc, BP 1041, 88051 Epinal Cedex 9, France
A R T I C L E I N F O
Article history:
Received 25 September 2008
Accepted 24 January 2009
Available online 3 February 2009
0008-6223/$ - see front matter � 2009 Elsevidoi:10.1016/j.carbon.2009.01.041
* Corresponding author: Address: LCSM – UME-mail address: [email protected]
A B S T R A C T
An easily-prepared self-blowing system based on low-cost precursors, mainly tannin and
furfuryl alcohol, was pyrolysed at 900 �C. Extremely low-density glass-like carbon foam
was obtained, with very high porosity (96.4%, of which 94% is open) and low surface area
(below 1 m2 g�1). The material presents slightly anisotropic properties. The linear cell den-
sity is 100 and 190 ppi along two orthogonal directions, and the major physical properties
were examined according to these same directions: electrical and thermal conductivities,
mechanical strength and elastic modulus, coefficient of thermal expansion, permeability
and fire resistance. Since most of these properties compare very correctly with available
data from the literature, such a cheap material like the one reported here can compete with
commercial vitreous carbon foams, which are all produced from more expensive, non-
renewable, resources.
� 2009 Elsevier Ltd. All rights reserved.
1. Introduction
In the recent years, a number of ultra-lightweight porous car-
bons were reported in the literature: carbon xerogels [1] and
aerogels [2], and carbon foams [3]. While xerogels and aero-
gels are obtained by pyrolysis of an organic gel, whose solvent
was evacuated in normal and supercritical conditions,
respectively, foams are usually prepared through the foaming
of a polymer subsequently carbonised in inert atmosphere.
Note that the term ‘‘foam’’ was also sometimes improperly
used for designating feebly compacted exfoliated graphite
([4] and references therein). In the present work, carbon foam
means a carbonaceous solid which precursor was expanded
because of the evolution of a gas, leaving more or less spher-
ical bubbles of macroscopic size. According to the preparation
protocol, the nature of the precursor and that of the foaming
agent, the size and the connectivity of the pores can be con-
trolled; the structure of the resultant carbon also strongly de-
er Ltd. All rights reserved
R CNRS 7555, BP 239, 545nancy.fr (A. Celzard).
pends both on the chemical composition of the precursor and
on the temperature of pyrolysis.
When oxygen-rich precursors, e.g., standard polymers like
polyurethane, furfural, resorcinol–formaldehyde or phenol–
formaldehyde resins, are foamed, the corresponding carbon
is called reticulated vitreous carbon (RVC). Such a carbon
form can indeed never be graphitized, whatever the pyrolysis
conditions, and its typical pore structure is a connected net-
work of struts (reticulated means resembling or forming a
net or a network) [5,6]. By contrast, precursors such as meso-
phase pitch or coal extracts, can be converted into graphite at
sufficiently high temperature; the pore structure is rather dif-
ferent than that of RVC, since based on well-formed, intercon-
nected, bubbles [3,7]. All these materials have extremely high
porosities, as high as 98%, usually also very high gas perme-
ability and sometimes surprisingly high mechanical strength.
Because of these very interesting intrinsic properties, carbon
foams may find applications as (see, for example, [3,8,9] and
.
06 Vandoeuvre-les-Nancy Cedex, France.
C A R B O N 4 7 ( 2 0 0 9 ) 1 4 8 0 – 1 4 9 2 1481
references therein) porous electrodes, catalyst supports,
adsorbent materials for liquid or gas purification, filters for
molten metals and corrosive chemicals, templates for metal
and ceramic foams, impact, energy or acoustic absorbers.
Additional applications could be resistance to thermal shock,
electromagnetic interference (EMI) shielding, vibration damp-
ing, ablation in space programs for protection of re-entry
vehicles, or composite reinforcement.
Most of the carbon foams’ properties are very sensitive to
microstructural parameters such as density, number of cells
per inch, cell wall thickness, and topology (connectivity) of
the porous structure, but also depend on the intrinsic charac-
teristics of the solid of which the foam is made. The impor-
tance of such new engineering, multifunctional, materials is
increasingly growing, with an expected average growth rate
as high as 21% (see [5] and references therein). Whether the
carbon from which they are made is graphitic or not, the
transport properties may be very different. Especially, nearly
thermally insulating foams are expected with glass-like car-
bon, whereas graphite foams are best suitable for applications
as heat exchangers, heat sinks, evaporative cooling and phase
change devices, and may also be relevant to high temperature
friction and nuclear applications.
In this paper, new tannin-based carbon foam is described.
Tannin extracts are commercial materials of vegetable
origins. They are composed of between 75% and 85% of poly-
flavonoids, the balance being mainly composed of carbohy-
drate monomers and oligomers. Polyflavonoids present
reactive phenolic nuclei, so they are able to undergo the same
reaction as that of phenol with formaldehyde. In 1994, Mei-
kleham and Pizzi [10] presented the preparation of rigid,
chemically self-blowing, foams based on tannin, formalde-
hyde, and an exothermic system capable of vaporizing a
low boiling point solvent (i.e., the foaming agent). Since then,
a number of progresses were achieved in the preparation of
such foams [11,12] and in the insights in the chemical mech-
anisms occurring during carbonisation [13–15]. The properties
of a carbon foam derived from one possible (among many
other ones) tannin–formaldehyde system, which detailed
composition is described in the following section, are re-
ported here for the first time. It is shown that such a very
inexpensive material can compete with commercial vitreous
carbon foams, which are all produced from more expensive,
non-renewable, chemicals.
2. Experimental
2.1. Materials
Commercial Mimosa (Acacia mearnsii, formerly mollissima, de
Wildt) bark tannin extract from Brazil, containing 84% pheno-
lic material, was used for the preparation of the foam. About
5.2 g of furfuryl alcohol (having a strengthening role, tannin–
formaldehyde polycondensates being generally very brittle),
3.7 g of formaldehyde 37% water solution (cross-linking
agent), and 3.0 g of water (solvent) were mixed with 15 g of
Mimosa tannin extract, strongly stirring the bulk. When the
agglomerate was homogeneous, 1.5 g of diethylether (foam-
ing agent) and then 6.0 g of 65% toluene-4-sulphonic acid (cat-
alyst) were added and sufficiently mixed for 10 s before
discharging into a lined box for foaming. The box in which
the polymer solution was cast being not swallow enough for
allowing unrestricted rise, elongated cell structures were pos-
sible. The resin foamed within 2 min of mixing with a temper-
ature rise to about 40 �C to yield black foam of density
between 0.05 and 0.08 g cm�3. The foam was left to harden
and age for a few days.
The external parts of the organic foam (over a thickness of a
few millimetres beneath the skin) were systematically elimi-
nated. Cubic or parallelepipedic pieces (a few centimetres
long) were cut off with a knife for pyrolysis and subsequent
measurements of physical properties. Carbonisation of the
samples was carried out inside a quartz boat, itself installed
in the middle of a quartz tube continuously flushed with
high-purity nitrogen. The tube was heated by an electric fur-
nace from room temperature up to 900 �C at 5 �C/min. Such a
rather fast heating rate was chosen after it was observed that
the quality of the samples (aspect, weight and friability) was
not lower than that of materials heat-treated at a few �C/min
only. Once reached, the final temperature was held for 2 h,
then the furnace was switched off, and the samples were al-
lowed to cool down to room temperature under nitrogen flow.
2.2. Measurements
From the as-prepared organic foam, two main directions
could be identified before carbonisation: one along the verti-
cal axis of the foam and referred to as z in the following,
the other one corresponding to the orthogonal plane, repre-
sented by xy. The bubbles were indeed seen to be prolate ellip-
soids rather than spheres, due to a higher swelling in the
vertical direction. Such a shape was maintained after pyroly-
sis, the major axis of the ellipsoidal cells always being along
the z-direction. The corresponding physical properties were
thus expected to be slightly anisotropic and, each time it
was possible, were indeed measured according to the two
aforementioned directions.
The main intrinsic characteristics of the carbon foam: cell
structure, bulk and skeletal density, and carbon structure,
were evaluated by SEM observation (Hitachi S 4800), volume
and weight measurements together with helium pycnometry
(lab-made apparatus) and X-ray densitometry (Hamammatsu
L9181-02, X-ray source equipped with a Varian Paxscan 4030R
detector), and X-ray diffraction (Philips X’Pert PRO diffractom-
eter equipped with a copper anticathode (Cu Ka: k =
0.1542 nm), respectively. Note that bulk density is defined as
the mass of material divided by the total volume it occupies,
whereas skeletal density, sometimes called true density, is
that of the solid from which the considered material is made.
Weight loss and density change on carbonisation were
measured with a Setaram 92-16.18 instrument in argon
atmosphere.
Measured physical properties were: surface area (through
nitrogen adsorption at 77 K using a Micromeritics Asap 2020
automatic adsorption apparatus and application of the BET
method), strain–stress characteristics (Instron 4206 table
model), dynamic elastic modulus (acoustic method, see
details in [16,17]), thermal conductivity (lab-made guarded
heat flow (hot plate) method, see [18] and references therein
1482 C A R B O N 4 7 ( 2 0 0 9 ) 1 4 8 0 – 1 4 9 2
for details), spectral transmittance and reflectance (Bruker
IFS66v/s FTIR spectrophotometer equipped with a reflectome-
ter/transmissometer device), electrical conductivity (four-
probes dc method using a Keithley 237 source – measure unit,
and copper wires glued with silver paint to the opposite faces
of the samples), permeability (lab-made permeametre using a
liquid as the flowing fluid, see [19] for details), and coefficient
of thermal expansion (Netzsch DIL 402C).
3. Results and discussion
3.1. Intrinsic characteristics of the carbon foam
3.1.1. Weight and volume changes on carbonisationCellular structures may be characterised by their porosity (or
relative density), average pore size, pore shape and orienta-
tion, and degree of pore interconnectivity (open-cell versus
closed-cell foams). Following the experimental preparation
protocol described in the previous section, the obtained raw,
organic, foam has a density very close to 0.067 g cm�3 prior
to carbonisation. Such a value, close to that of another
glass-like carbon foam [6,20] but up to 10 times lower than
that of graphite foams [21–23], was obtained by weighing
and measuring the dimensions of 19 perfectly parallelepipe-
dic samples having initial volumes ranging from 3 to
200 cm3. The first remarkable finding concerning the carboni-
sation of the tannin-based foam is that its density hardly
changes during pyrolysis. It indeed appears that, on average,
the volume is roughly divided by a factor two, as well as the
mass, and consequently the density is almost maintained.
Fig. 1 presents the TG and DTG curves of one sample heat-
treated at 2 �C/min up to 1050 �C under argon. The weight loss
at 900 �C is 54.8%, in good agreement with the average ob-
tained on the 19 samples: 56.8%. The corresponding, aver-
aged, volume shrinkage is 56.9%. Therefore, the bulk density
of the carbonised foam, qc, reads:
qc ¼ qr
1� jDm=m0j1� jDV=V0j
ð1Þ
where qr is the bulk density of the raw, organic, foam, and Dm/
m0 and DV/V0 are the relativeweight and volume losses, respec-
tively. Using the average data given above for Dm/m0 and DV/V0,
-60
-50
-40
-30
-20
-10
0
10
-0.5
-0.4
-0.3
-0.2
-0.1
0
0.1
0.2
0 200 400 600 800 1000 1200
TG
DTG
Temperature (°C)
Wei
ght l
oss
(TG
, %)
Differential w
eight loss (DTG
, % K
-1)
Fig. 1 – TG and DTG analysis of tannin-based foam.
one finds that the bulk density only increased by 0.23% after
carbonisation. Given the scattering of the density measure-
ments, such a change may be considered as negligible.
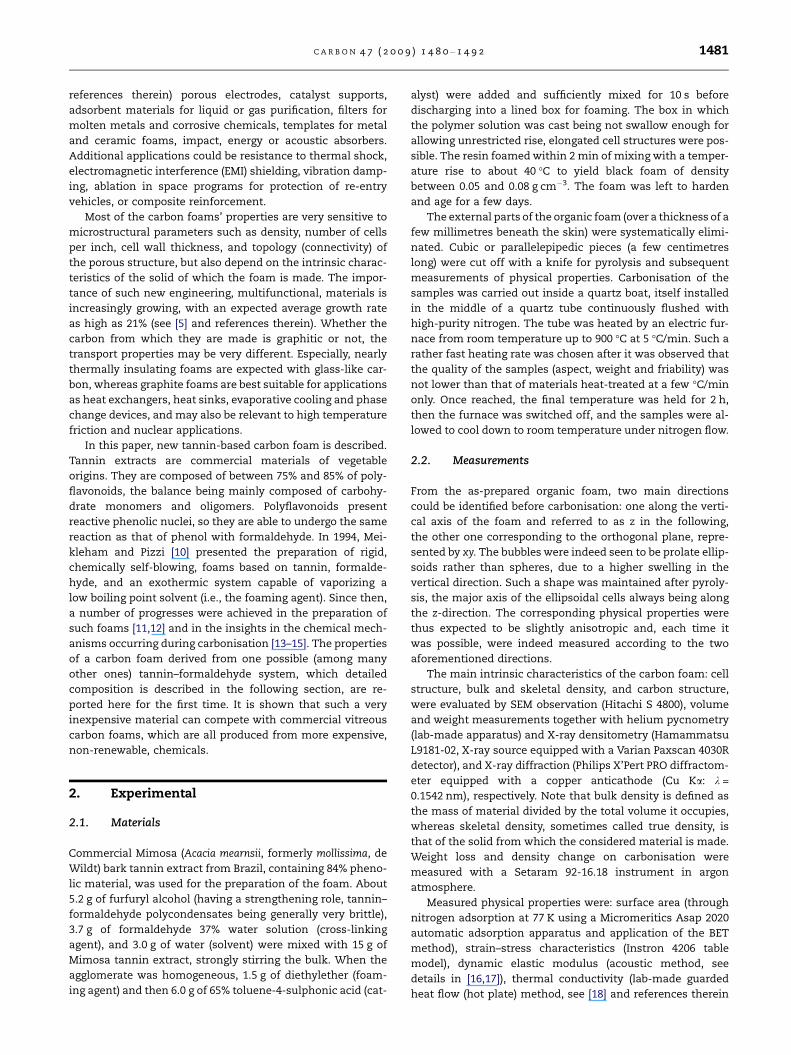
3.1.2. Structure of the carbon foamMeasuring the three-dimensions of each samples evidenced
that the foam experienced isotropic shrinkage during
pyrolysis, each side shortening on average by 25%. Surpris-
ingly, the high resultant volume shrinkage, though similar
to that reported for vitreous carbon made from polyurethane
Fig. 2 – SEM pictures of tannin-based carbon foam at various
magnifications. The material is seen along the z-direction.
Open-cells having a linear density of ca 100 ppi are seen. (a),
(b) and (c) correspond to magnifications of 30·, 100· and
300·, respectively.
C A R B O N 4 7 ( 2 0 0 9 ) 1 4 8 0 – 1 4 9 2 1483
foam [9], did not produce any crack in the final carbon foam.
Fig. 2, presenting the carbon foam at different magnifications
along the z-direction, indeed shows partially open, well-
formed, cells, without visible stress-induced failure. The pore
structure is intermediate between two extreme ones, usually
reported for microcellular metals. High-porosity open-celled
metal foams indeed have long thin struts (ligaments) con-
necting at nodes, whereas closed-cell ones possess spherical
non-connected bubbles. In the present case, cells being
pierced by small holes (also called windows) are evidenced,
being separated with each other by extremely thin, somewhat
translucent, walls. At higher magnification, the cell edge
struts appear to have a triangular, varying, cross-section,
and are not hollow. Besides, each hemispherical portion of
the observed cells shows more than two windows; an average
of six windows by hemispherical cell can be seen. Since ran-
dom sections of the material were observed, leaving only half
cells at the surface, the mean coordination number is ex-
pected to be two times higher, i.e., 12, just like in a compact
structure made of close-packed spheres.
The foam cell size is relatively uniform with size around
200–300 lm in the z-direction. Using the same terminology
of most works dealing with foams, the linear cell density, or
number of pores per inch (ppi), is close to 100. The number
of ppi is defined as the number of pores crossed by a 1 in. long
segment on a flat section of the foam. About 100 ppi thus cor-
responds to an average cell diameter of 250 lm.
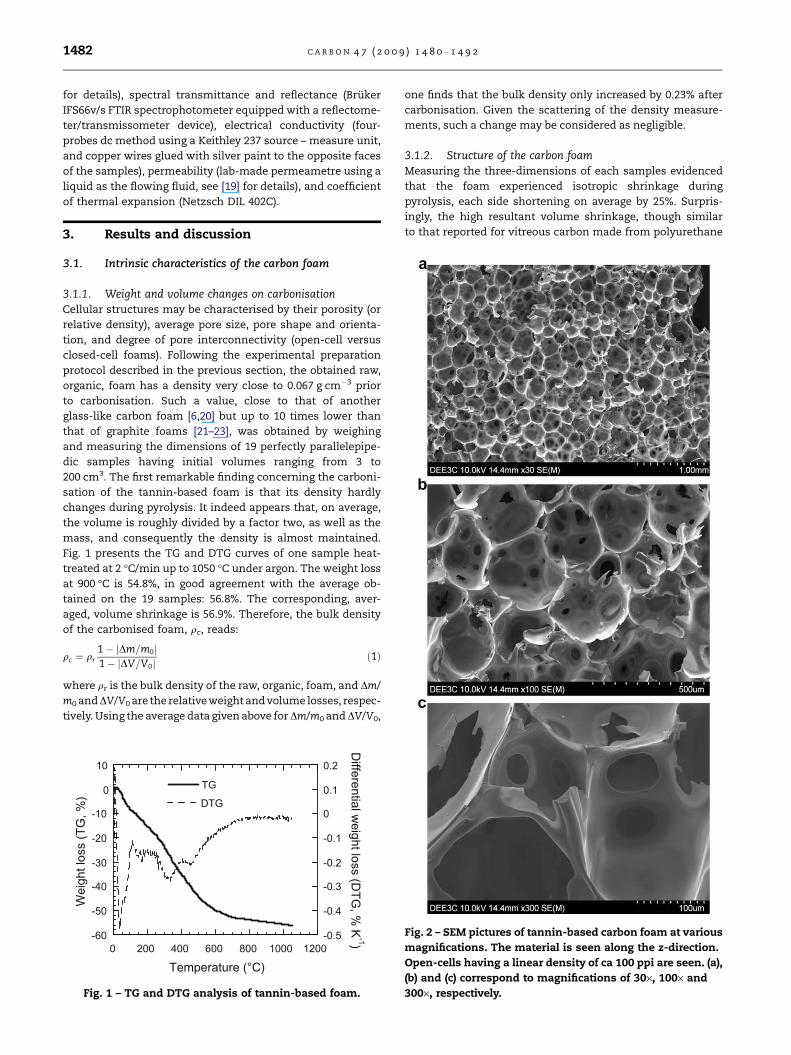
The foam exhibits fairly uniform pore shapes, with an
apparently narrow pore size distribution. Pore size distribu-
tions were established from the study of ca 100 cells, which
sizes were measured along the three orthogonal axes (one
being parallel to the direction of growth). For that purpose,
an optical microscope equipped with a graduated reticule
was used. The results are presented in Fig. 3. It can be seen
that the cells are identical, on average, along the two orthog-
onal axes both perpendicular to the direction of rising, justi-
fying the definition of the so-called xy-direction. The
distributions of sizes are rather narrow, and the correspond-
0 10 20 30 40 5020-5050-80
80-110110-140140-170170-200200-230230-260260-290290-320320-350350-380380-410410-440440-470470-500
xyz
Fraction of pores (%)
Pore
siz
e (µ
m)
Fig. 3 – Pore size distributions of the cells as seen by optical
microscopy, along three orthogonal directions x, y and z, z
corresponding to the vertical (growth) axis.
ing mean diameter is close to 135 lm. In the z-direction, both
the distribution and the cells are broader, with an average
diameter of 250 lm. Fig. 2 thus corresponds to a section of
the (anisotropic) material along the z-axis, and the carbon
foam should thus be characterised by two linear cell densi-
ties: 100 and 190 ppi along the z- and xy-direction,
respectively.
3.1.3. Bulk and skeletal density, and carbon structureHelium pycnometry carried out on several samples led to an
average density of 1.86 g cm�3. Once the material was
crushed in a mortar, the true skeletal density was found to
be 1.98 g cm�3. The fraction of open-cells could thus be de-
duced according to the following formula:
% Open-cell ¼ Skeletal density of the foamSkeletal density of the pulverized foam
� 100
ð2Þ
The data given above thus suggest that near 94% of the cells
are open on one hand, and that the carbon from which the
foam is made is far from being graphitic on the other hand.
Such a rather low value of skeletal density is indeed typical
of disordered carbon.
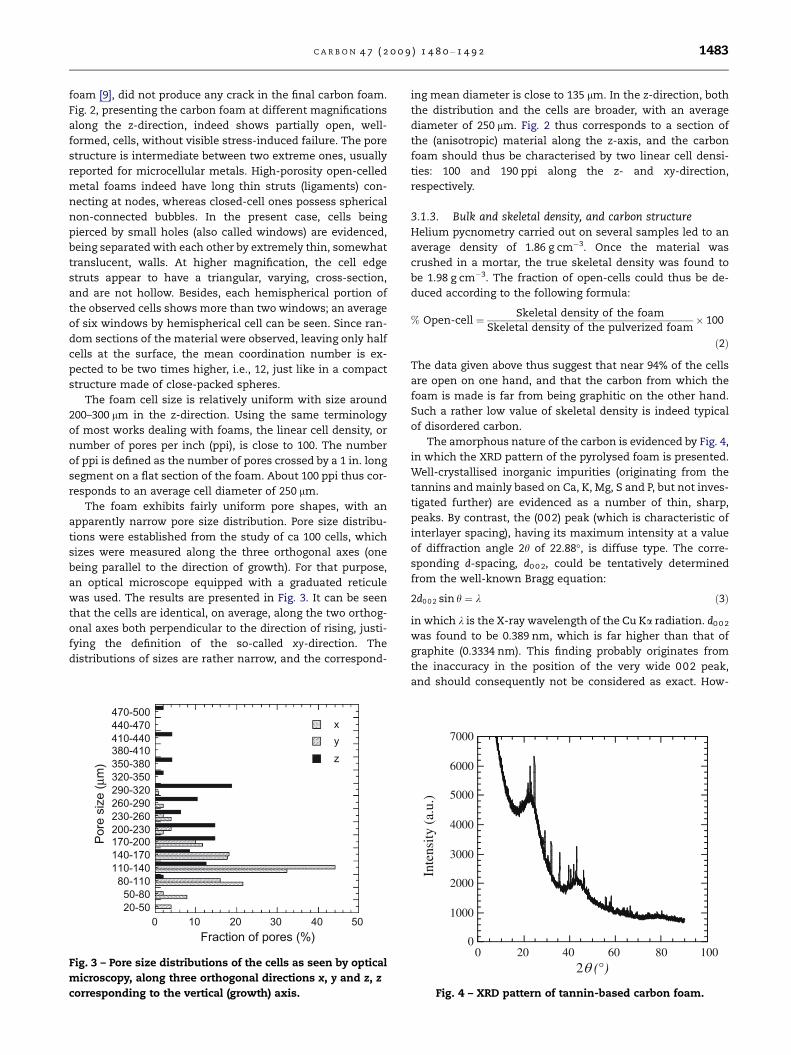
The amorphous nature of the carbon is evidenced by Fig. 4,
in which the XRD pattern of the pyrolysed foam is presented.
Well-crystallised inorganic impurities (originating from the
tannins and mainly based on Ca, K, Mg, S and P, but not inves-
tigated further) are evidenced as a number of thin, sharp,
peaks. By contrast, the (002) peak (which is characteristic of
interlayer spacing), having its maximum intensity at a value
of diffraction angle 2h of 22.88�, is diffuse type. The corre-
sponding d-spacing, d0 0 2, could be tentatively determined
from the well-known Bragg equation:
2d0 0 2 sin h ¼ k ð3Þ
in which k is the X-ray wavelength of the Cu Ka radiation. d0 0 2
was found to be 0.389 nm, which is far higher than that of
graphite (0.3334 nm). This finding probably originates from
the inaccuracy in the position of the very wide 002 peak,
and should consequently not be considered as exact. How-
0
1000
2000
3000
4000
5000
6000
7000
0 20 40 60 80 1002θ (°)
Inte
nsity
(a.
u.)
Fig. 4 – XRD pattern of tannin-based carbon foam.
Pressure (MPa)
Cum
ulat
ive
intru
sion
(mm
3 g-1)
10 0
10 1
10 2
10 3
0.01 0.1 1 10 100 1000
Pressure upPressure down
« Pore » diameter (m)
Incr
emen
tal i
ntru
sion
(mm
3 g-1 M
Pa-1)
10 -1
10 0
10 1
10 2
10 3
10 4
10 -9 10 -8 10 -7 10 -6 10 -5 10 -4
Pressure upPressure down
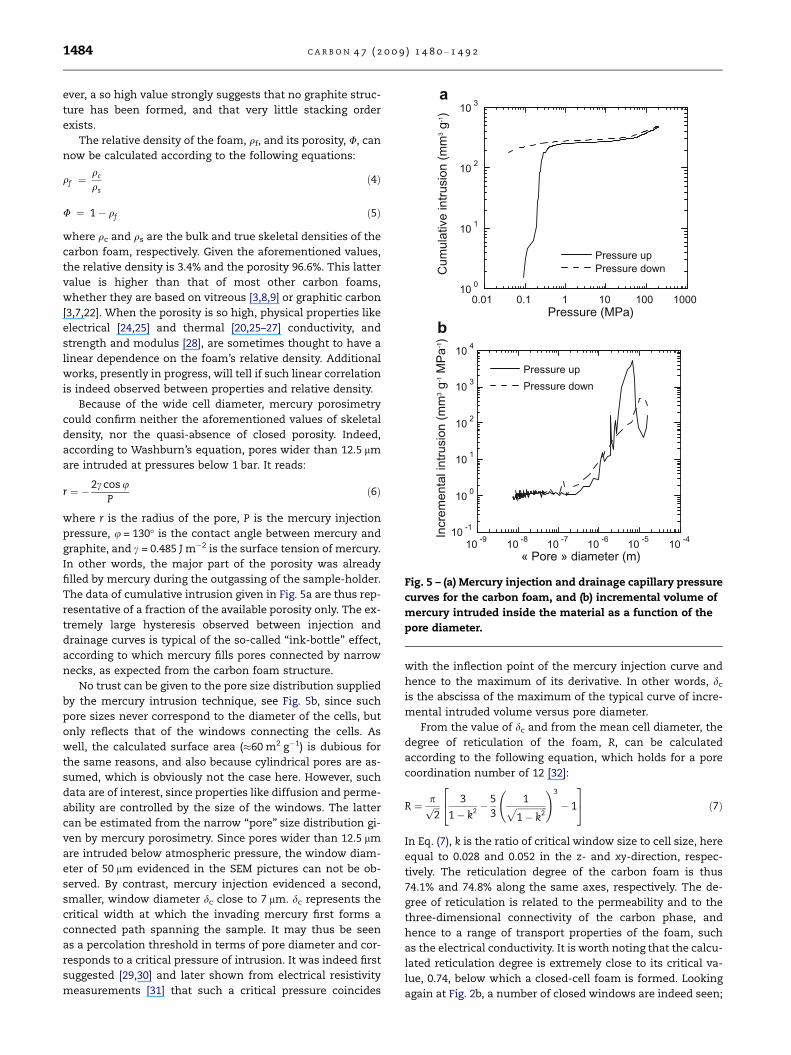
Fig. 5 – (a) Mercury injection and drainage capillary pressure
curves for the carbon foam, and (b) incremental volume of
mercury intruded inside the material as a function of the
pore diameter.
1484 C A R B O N 4 7 ( 2 0 0 9 ) 1 4 8 0 – 1 4 9 2
ever, a so high value strongly suggests that no graphite struc-
ture has been formed, and that very little stacking order
exists.
The relative density of the foam, qf, and its porosity, U, can
now be calculated according to the following equations:
qf ¼qc
qs
ð4Þ
U ¼ 1� qf ð5Þ
where qc and qs are the bulk and true skeletal densities of the
carbon foam, respectively. Given the aforementioned values,
the relative density is 3.4% and the porosity 96.6%. This latter
value is higher than that of most other carbon foams,
whether they are based on vitreous [3,8,9] or graphitic carbon
[3,7,22]. When the porosity is so high, physical properties like
electrical [24,25] and thermal [20,25–27] conductivity, and
strength and modulus [28], are sometimes thought to have a
linear dependence on the foam’s relative density. Additional
works, presently in progress, will tell if such linear correlation
is indeed observed between properties and relative density.
Because of the wide cell diameter, mercury porosimetry
could confirm neither the aforementioned values of skeletal
density, nor the quasi-absence of closed porosity. Indeed,
according to Washburn’s equation, pores wider than 12.5 lm
are intruded at pressures below 1 bar. It reads:
r ¼ �2c cos uP
ð6Þ
where r is the radius of the pore, P is the mercury injection
pressure, u = 130� is the contact angle between mercury and
graphite, and c = 0.485 J m�2 is the surface tension of mercury.
In other words, the major part of the porosity was already
filled by mercury during the outgassing of the sample-holder.
The data of cumulative intrusion given in Fig. 5a are thus rep-
resentative of a fraction of the available porosity only. The ex-
tremely large hysteresis observed between injection and
drainage curves is typical of the so-called ‘‘ink-bottle’’ effect,
according to which mercury fills pores connected by narrow
necks, as expected from the carbon foam structure.
No trust can be given to the pore size distribution supplied
by the mercury intrusion technique, see Fig. 5b, since such
pore sizes never correspond to the diameter of the cells, but
only reflects that of the windows connecting the cells. As
well, the calculated surface area (�60 m2 g�1) is dubious for
the same reasons, and also because cylindrical pores are as-
sumed, which is obviously not the case here. However, such
data are of interest, since properties like diffusion and perme-
ability are controlled by the size of the windows. The latter
can be estimated from the narrow ‘‘pore’’ size distribution gi-
ven by mercury porosimetry. Since pores wider than 12.5 lm
are intruded below atmospheric pressure, the window diam-
eter of 50 lm evidenced in the SEM pictures can not be ob-
served. By contrast, mercury injection evidenced a second,
smaller, window diameter dc close to 7 lm. dc represents the
critical width at which the invading mercury first forms a
connected path spanning the sample. It may thus be seen
as a percolation threshold in terms of pore diameter and cor-
responds to a critical pressure of intrusion. It was indeed first
suggested [29,30] and later shown from electrical resistivity
measurements [31] that such a critical pressure coincides
with the inflection point of the mercury injection curve and
hence to the maximum of its derivative. In other words, dc
is the abscissa of the maximum of the typical curve of incre-
mental intruded volume versus pore diameter.
From the value of dc and from the mean cell diameter, the
degree of reticulation of the foam, R, can be calculated
according to the following equation, which holds for a pore
coordination number of 12 [32]:
R ¼ pffiffiffi2p 3
1� k2 �5
3
1ffiffiffiffiffiffiffiffiffiffiffiffiffiffi1� k2
p !3
� 1
24
35 ð7Þ
In Eq. (7), k is the ratio of critical window size to cell size, here
equal to 0.028 and 0.052 in the z- and xy-direction, respec-
tively. The reticulation degree of the carbon foam is thus
74.1% and 74.8% along the same axes, respectively. The de-
gree of reticulation is related to the permeability and to the
three-dimensional connectivity of the carbon phase, and
hence to a range of transport properties of the foam, such
as the electrical conductivity. It is worth noting that the calcu-
lated reticulation degree is extremely close to its critical va-
lue, 0.74, below which a closed-cell foam is formed. Looking
again at Fig. 2b, a number of closed windows are indeed seen;
C A R B O N 4 7 ( 2 0 0 9 ) 1 4 8 0 – 1 4 9 2 1485
smaller windows would readily have led to a fraction of
closed-cells much higher than the 6% experimentally found.
An additional finding supporting that point is the extremely
long time required for degassing the foam, which was noticed
both in the electron microscope and in the automatic adsorp-
tion apparatus. Given that the value of R is lower along the xy-
direction, a correspondingly better permeability is expected.
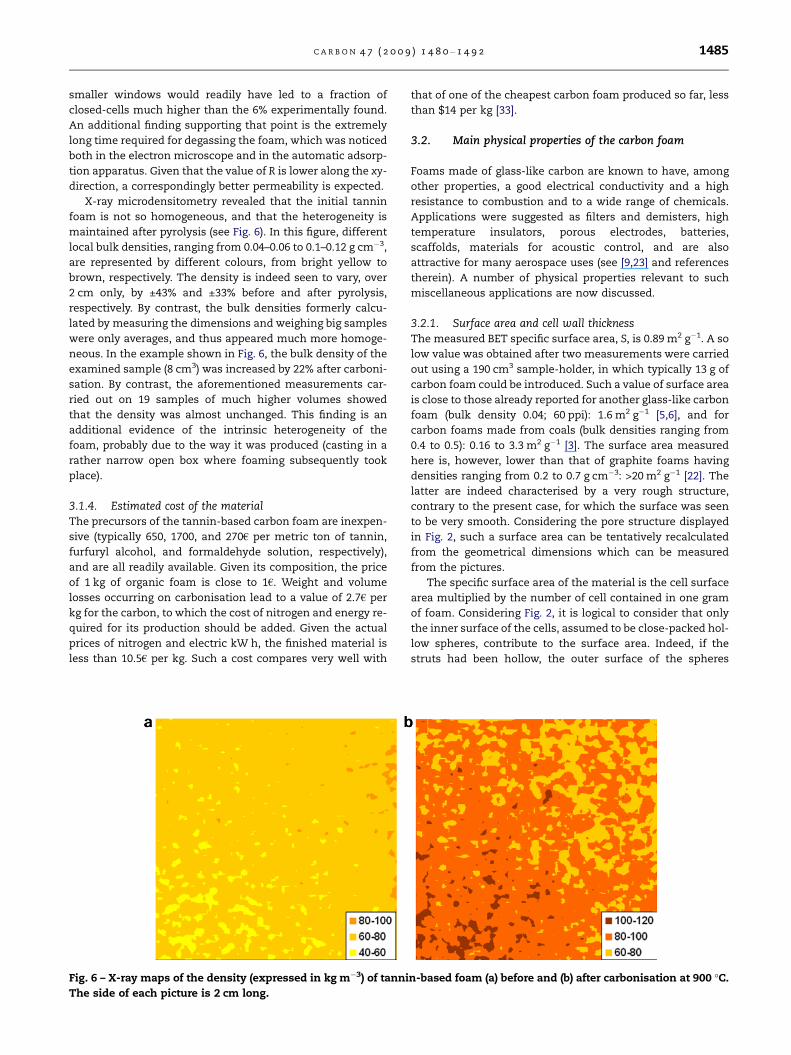
X-ray microdensitometry revealed that the initial tannin
foam is not so homogeneous, and that the heterogeneity is
maintained after pyrolysis (see Fig. 6). In this figure, different
local bulk densities, ranging from 0.04–0.06 to 0.1–0.12 g cm�3,
are represented by different colours, from bright yellow to
brown, respectively. The density is indeed seen to vary, over
2 cm only, by ±43% and ±33% before and after pyrolysis,
respectively. By contrast, the bulk densities formerly calcu-
lated by measuring the dimensions and weighing big samples
were only averages, and thus appeared much more homoge-
neous. In the example shown in Fig. 6, the bulk density of the
examined sample (8 cm3) was increased by 22% after carboni-
sation. By contrast, the aforementioned measurements car-
ried out on 19 samples of much higher volumes showed
that the density was almost unchanged. This finding is an
additional evidence of the intrinsic heterogeneity of the
foam, probably due to the way it was produced (casting in a
rather narrow open box where foaming subsequently took
place).
3.1.4. Estimated cost of the materialThe precursors of the tannin-based carbon foam are inexpen-
sive (typically 650, 1700, and 270€ per metric ton of tannin,
furfuryl alcohol, and formaldehyde solution, respectively),
and are all readily available. Given its composition, the price
of 1 kg of organic foam is close to 1€. Weight and volume
losses occurring on carbonisation lead to a value of 2.7€ per
kg for the carbon, to which the cost of nitrogen and energy re-
quired for its production should be added. Given the actual
prices of nitrogen and electric kW h, the finished material is
less than 10.5€ per kg. Such a cost compares very well with
Fig. 6 – X-ray maps of the density (expressed in kg m�3) of tanni
The side of each picture is 2 cm long.
that of one of the cheapest carbon foam produced so far, less
than $14 per kg [33].
3.2. Main physical properties of the carbon foam
Foams made of glass-like carbon are known to have, among
other properties, a good electrical conductivity and a high
resistance to combustion and to a wide range of chemicals.
Applications were suggested as filters and demisters, high
temperature insulators, porous electrodes, batteries,
scaffolds, materials for acoustic control, and are also
attractive for many aerospace uses (see [9,23] and references
therein). A number of physical properties relevant to such
miscellaneous applications are now discussed.
3.2.1. Surface area and cell wall thicknessThe measured BET specific surface area, S, is 0.89 m2 g�1. A so
low value was obtained after two measurements were carried
out using a 190 cm3 sample-holder, in which typically 13 g of
carbon foam could be introduced. Such a value of surface area
is close to those already reported for another glass-like carbon
foam (bulk density 0.04; 60 ppi): 1.6 m2 g�1 [5,6], and for
carbon foams made from coals (bulk densities ranging from
0.4 to 0.5): 0.16 to 3.3 m2 g�1 [3]. The surface area measured
here is, however, lower than that of graphite foams having
densities ranging from 0.2 to 0.7 g cm�3: >20 m2 g�1 [22]. The
latter are indeed characterised by a very rough structure,
contrary to the present case, for which the surface was seen
to be very smooth. Considering the pore structure displayed
in Fig. 2, such a surface area can be tentatively recalculated
from the geometrical dimensions which can be measured
from the pictures.
The specific surface area of the material is the cell surface
area multiplied by the number of cell contained in one gram
of foam. Considering Fig. 2, it is logical to consider that only
the inner surface of the cells, assumed to be close-packed hol-
low spheres, contribute to the surface area. Indeed, if the
struts had been hollow, the outer surface of the spheres
n-based foam (a) before and (b) after carbonisation at 900 �C.
Strain (%)
Stre
ss (M
Pa)
0.19
0.2
0.21
0.22
28 32 36 40
0
0.1
0.2
0.3
0.4
0.5
0.6
0.7
0 25 50 75 100
Strain (%)
Stre
ss (M
Pa)
0.45
0.475
0.5
0.525
0.55
28 32 36 40
0
0.5
1
1.5
2
2.5
0 25 50 75 100
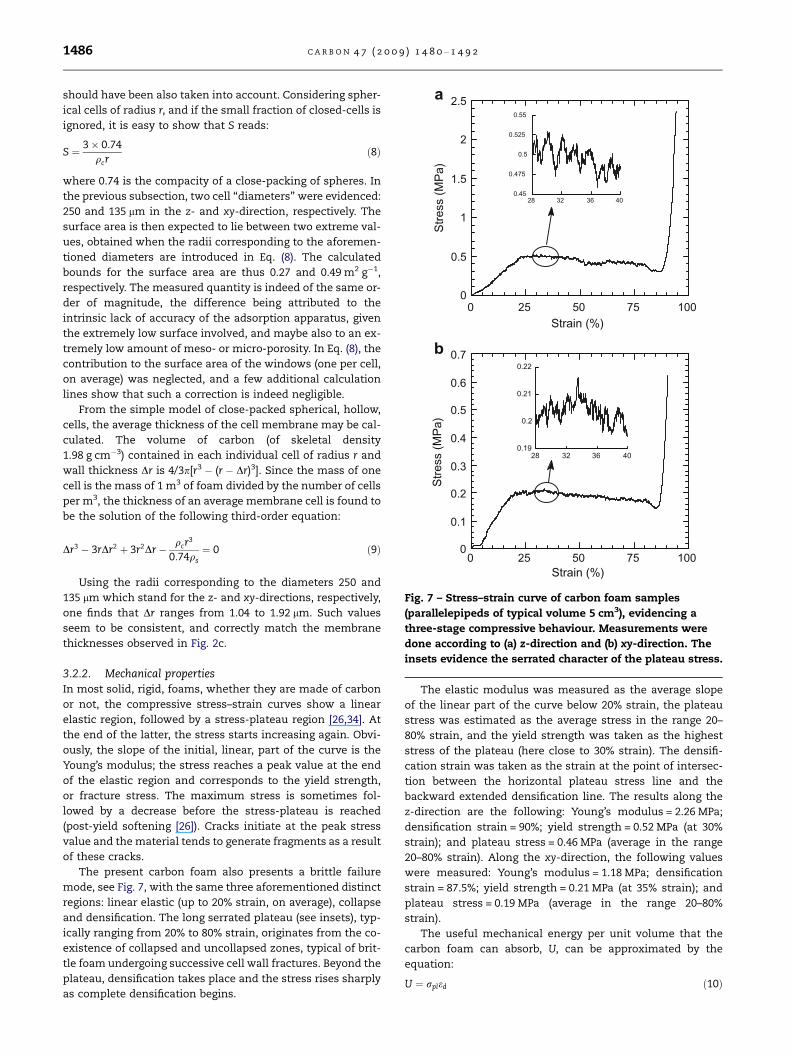
Fig. 7 – Stress–strain curve of carbon foam samples
(parallelepipeds of typical volume 5 cm3), evidencing a
three-stage compressive behaviour. Measurements were
done according to (a) z-direction and (b) xy-direction. The
insets evidence the serrated character of the plateau stress.
1486 C A R B O N 4 7 ( 2 0 0 9 ) 1 4 8 0 – 1 4 9 2
should have been also taken into account. Considering spher-
ical cells of radius r, and if the small fraction of closed-cells is
ignored, it is easy to show that S reads:
S ¼ 3� 0:74qcr
ð8Þ
where 0.74 is the compacity of a close-packing of spheres. In
the previous subsection, two cell ‘‘diameters’’ were evidenced:
250 and 135 lm in the z- and xy-direction, respectively. The
surface area is then expected to lie between two extreme val-
ues, obtained when the radii corresponding to the aforemen-
tioned diameters are introduced in Eq. (8). The calculated
bounds for the surface area are thus 0.27 and 0.49 m2 g�1,
respectively. The measured quantity is indeed of the same or-
der of magnitude, the difference being attributed to the
intrinsic lack of accuracy of the adsorption apparatus, given
the extremely low surface involved, and maybe also to an ex-
tremely low amount of meso- or micro-porosity. In Eq. (8), the
contribution to the surface area of the windows (one per cell,
on average) was neglected, and a few additional calculation
lines show that such a correction is indeed negligible.
From the simple model of close-packed spherical, hollow,
cells, the average thickness of the cell membrane may be cal-
culated. The volume of carbon (of skeletal density
1.98 g cm�3) contained in each individual cell of radius r and
wall thickness Dr is 4/3p[r3 � (r � Dr)3]. Since the mass of one
cell is the mass of 1 m3 of foam divided by the number of cells
per m3, the thickness of an average membrane cell is found to
be the solution of the following third-order equation:
Dr3 � 3rDr2 þ 3r2Dr� qcr3
0:74qs
¼ 0 ð9Þ
Using the radii corresponding to the diameters 250 and
135 lm which stand for the z- and xy-directions, respectively,
one finds that Dr ranges from 1.04 to 1.92 lm. Such values
seem to be consistent, and correctly match the membrane
thicknesses observed in Fig. 2c.
3.2.2. Mechanical propertiesIn most solid, rigid, foams, whether they are made of carbon
or not, the compressive stress–strain curves show a linear
elastic region, followed by a stress-plateau region [26,34]. At
the end of the latter, the stress starts increasing again. Obvi-
ously, the slope of the initial, linear, part of the curve is the
Young’s modulus; the stress reaches a peak value at the end
of the elastic region and corresponds to the yield strength,
or fracture stress. The maximum stress is sometimes fol-
lowed by a decrease before the stress-plateau is reached
(post-yield softening [26]). Cracks initiate at the peak stress
value and the material tends to generate fragments as a result
of these cracks.
The present carbon foam also presents a brittle failure
mode, see Fig. 7, with the same three aforementioned distinct
regions: linear elastic (up to 20% strain, on average), collapse
and densification. The long serrated plateau (see insets), typ-
ically ranging from 20% to 80% strain, originates from the co-
existence of collapsed and uncollapsed zones, typical of brit-
tle foam undergoing successive cell wall fractures. Beyond the
plateau, densification takes place and the stress rises sharply
as complete densification begins.
The elastic modulus was measured as the average slope
of the linear part of the curve below 20% strain, the plateau
stress was estimated as the average stress in the range 20–
80% strain, and the yield strength was taken as the highest
stress of the plateau (here close to 30% strain). The densifi-
cation strain was taken as the strain at the point of intersec-
tion between the horizontal plateau stress line and the
backward extended densification line. The results along the
z-direction are the following: Young’s modulus = 2.26 MPa;
densification strain = 90%; yield strength = 0.52 MPa (at 30%
strain); and plateau stress = 0.46 MPa (average in the range
20–80% strain). Along the xy-direction, the following values
were measured: Young’s modulus = 1.18 MPa; densification
strain = 87.5%; yield strength = 0.21 MPa (at 35% strain); and
plateau stress = 0.19 MPa (average in the range 20–80%
strain).
The useful mechanical energy per unit volume that the
carbon foam can absorb, U, can be approximated by the
equation:
U ¼ rpled ð10Þ
C A R B O N 4 7 ( 2 0 0 9 ) 1 4 8 0 – 1 4 9 2 1487
where rpl and ed are the average plateau stress and the densi-
fication strain, respectively [26]. From the aforementioned
values, it can be calculated that the carbon foam may absorb
414 and 166 kJ m�3, along the z- and xy-directions, respec-
tively. Using an average value of 250 kJ m�3, it may be calcu-
lated that 50 L of carbon foam (e.g., a plate of surface 1 m2
and thickness 5 cm) can absorb the impact of a 100 kg object,
either falling from a height of 13 m, or hitting at a speed close
to 60 km h�1.
The compression yield strength measured here is lower
than that of Al–Ni foam of close density (0.061 g cm�3):
6.32 MPa [35], but compare well with that of other carbon
foams: RVC Ultramet RVC (density 0.04 g cm�3): 0.16–
0.763 MPa [5,6]; ERG Corporation RVC of unknown (probably
low) density: 0.28–0.48 MPa [23]. Obviously, carbon foams of
higher density present a much higher compression yield
strength, but the corresponding values should not be com-
pared with those of the present carbon foam, which density
is extremely low, e.g.: 2.5–18.7 MPa for various carbon foams
having densities ranging from 0.25 to 0.67 g cm�3 [3]; 15.2–
20.7 MPa for Touchstone foam (density 0.16–0.50 g cm�3) [23];
1.7–7.0 MPa for MER foam (density 0.016–0.62 g cm�3) [23];
and 1.0–3.5 MPa for ORNL graphite foam (density 0.25–
0.65 g cm�3).
The values of elastic modulus estimated here, ca 1.2–
2.3 MPa, seem to be rather low. Indeed, due to effects of
clamping and plastic deformation of very thin cell walls at
low stress levels, measuring the elastic modulus from the
slope of the stress–strain curve may be questionable. It was
indeed reported, in the case of aluminium foams, that
unloading curves show a much higher slope (i.e., elastic mod-
ulus) than the initial loading curves. This indicates that local
yielding occurs almost immediately on loading (see [36] and
references therein). The use of an additional technique, based
on the determination of the velocity of a longitudinal wave of
frequency 100 kHz crossing the sample, was thus carried out.
In this method, the dynamic elastic modulus, E, is calculated
according to the following equation [37]:
E ¼ qcv2 ð11Þ
in which v is the ultrasonic velocity. It may be useful for the
reader to recall that, for a viscoelastic material, the Young’s
modulus is a complex number which reads:
E ¼ ER þ iEI ð12Þ
where ER and EI are the so-called real and imaginary Young’s
modulus, respectively. Both are functions of frequency when
the viscoelastic material is subjected to a sinusoidal stress. At
very high frequencies, ER becomes the so-called dynamic
Young’s modulus, here referred to as E in Eq. (11). At lower fre-
quencies, ER represents a static Young’s modulus. The moduli
measured according to the two techniques: strain–stress
curve and acoustic method, are thus not strictly equivalent;
E = ER for a purely elastic material only.
The measurements were performed for both raw and car-
bonised foam, and the results are the following. Ez = 169 and
638 MPa before and after carbonisation, respectively, and
Exy = 42 and 246 MPa before and after carbonisation, respec-
tively. The values of Exy were calculated as the average of Ex
and Ey, whose values are 37 and 47 before carbonisation,
respectively, and 226 and 266 after carbonisation, respectively.
Given the likeness of Ex and Ey, and the strong difference with
Ez, considering the carbon foam as an orthotropic material
having an anisotropy ratio of Ez/Exy = 2.6 seems reasonable.
Carbonisation made the elastic moduli increase by a factor
of ca four and six parallel and perpendicular to the direction
of cell growth, respectively. Pyrolysing the tannin foam at
900 �C thus appears to be a good way of increasing its
mechanical properties, given that the density and the pore
structure is not altered by such a heat-treatment.
The measured dynamic elastic moduli are significantly
higher than those of compressed expanded graphite of iden-
tical porosity: approximately 20 and 80 MPa in the z- and xy-
directions, respectively [17]. They are higher than the Young’s
modulus of a RVC foam of density 0.04 g cm�3 and 60 ppi:
12.7 MPa [6], and near that of graphite foam having densities
ranging from 0.25 to 0.65 g cm�3: 50–350 MPa [22]. The carbon
from which the present foam is made thus appears to be very
tough.
The anisotropy of mechanical properties is close to, or
higher than, two. It will be seen below that the anisotropy
of transport properties (electrical and thermal conductivities)
is much lower, suggesting that different parts of the carbon
backbone are involved. The mechanical behaviour is indeed
expected to be controlled by the weakest struts, whereas cur-
rent and heat may flow throughout both struts and cell walls.
3.2.3. Thermal conductivityThe measured thermal conductivities are 0.44 and 0.35
W m�1 K�1 in the z- and xy-direction, respectively. Such values
are, just like other representative reticulated glassy carbons,
less than 1 W m�1 K�1 [34,38], symptomatic of a thermally
insulating behaviour. They are typically 10 times higher than
those reported at 100 �C for a RVC foam having a much lower
density of 0.04 g cm�3 (in [5]). Finding a thermal conductivity
slightly higher than 0.25 W m�1 K�1, a value which is usually
considered to be the limit for insulating materials, suggests
that the present carbon foam might not have potential
application in thermal insulation, especially at high tempera-
ture. However, new tannin-based compositions, leading to
carbon foams having even lower relative density and
closed-cells, will be prepared and measured in the next fu-
ture. It is interesting to know that, for the non carbonised
foam, the thermal conductivity was 0.3 W m�1 K�1 along the
z-axis (very close to that of polyurethane foam at 90% poros-
ity), so the carbonisation induced an increase of 47% for this
physical property. Such an unavoidable rise of thermal con-
ductivity should be only due to the carbonaceous nature,
although strongly disordered, of the solid backbone of the
foam. Indeed, other mechanisms of thermal radiation should
not be effective in the actual experimental conditions; neither
radiation across the cells at the measurement temperature
(below 100 �C), nor convection in the gas phase when the cell
size is roughly below 1 mm [34], are expected. Moreover, the
thermal conductivity of dry air at room temperature:
0.025 W m�1 K�1, is much lower, so the conduction through
the gas contained in the cells can be neglected, and the mea-
sured values are really representative of the solid material.
The measured values are in-between that of RVC foam
(0.04 g cm�3, 60 ppi): 0.085 W m�1 K�1 (in [23]), and that of
Wavenumber (cm-1)
Spec
tral r
efle
ctan
ce
0
0.1
0.2
0.3
0.4
0.5
0 2000 4000 6000 8000
Organic foamCarbonized foam
Wavenumber (cm-1)
Spec
tral t
rans
mitt
ance
0
0.02
0.04
0.06
0.08
0.1
0.12
0.14
0 2000 4000 6000 8000
Organic foamCarbonized foam
400
600
800
1000
1200
1400
0 2 4 6 8 10 12 14Wavelength (µm)
Extin
ctio
n co
effic
ient
(m-1)
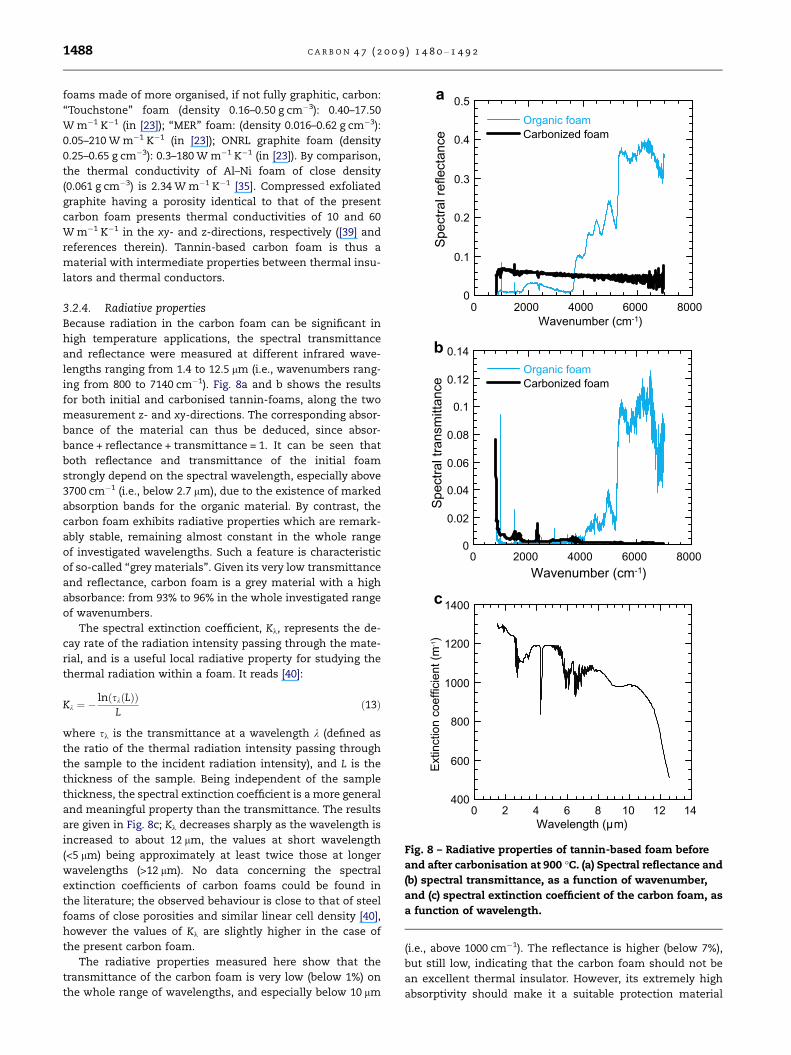
Fig. 8 – Radiative properties of tannin-based foam before
and after carbonisation at 900 �C. (a) Spectral reflectance and
(b) spectral transmittance, as a function of wavenumber,
and (c) spectral extinction coefficient of the carbon foam, as
a function of wavelength.
1488 C A R B O N 4 7 ( 2 0 0 9 ) 1 4 8 0 – 1 4 9 2
foams made of more organised, if not fully graphitic, carbon:
‘‘Touchstone’’ foam (density 0.16–0.50 g cm�3): 0.40–17.50
W m�1 K�1 (in [23]); ‘‘MER’’ foam: (density 0.016–0.62 g cm�3):
0.05–210 W m�1 K�1 (in [23]); ONRL graphite foam (density
0.25–0.65 g cm�3): 0.3–180 W m�1 K�1 (in [23]). By comparison,
the thermal conductivity of Al–Ni foam of close density
(0.061 g cm�3) is 2.34 W m�1 K�1 [35]. Compressed exfoliated
graphite having a porosity identical to that of the present
carbon foam presents thermal conductivities of 10 and 60
W m�1 K�1 in the xy- and z-directions, respectively ([39] and
references therein). Tannin-based carbon foam is thus a
material with intermediate properties between thermal insu-
lators and thermal conductors.
3.2.4. Radiative propertiesBecause radiation in the carbon foam can be significant in
high temperature applications, the spectral transmittance
and reflectance were measured at different infrared wave-
lengths ranging from 1.4 to 12.5 lm (i.e., wavenumbers rang-
ing from 800 to 7140 cm�1). Fig. 8a and b shows the results
for both initial and carbonised tannin-foams, along the two
measurement z- and xy-directions. The corresponding absor-
bance of the material can thus be deduced, since absor-
bance + reflectance + transmittance = 1. It can be seen that
both reflectance and transmittance of the initial foam
strongly depend on the spectral wavelength, especially above
3700 cm�1 (i.e., below 2.7 lm), due to the existence of marked
absorption bands for the organic material. By contrast, the
carbon foam exhibits radiative properties which are remark-
ably stable, remaining almost constant in the whole range
of investigated wavelengths. Such a feature is characteristic
of so-called ‘‘grey materials’’. Given its very low transmittance
and reflectance, carbon foam is a grey material with a high
absorbance: from 93% to 96% in the whole investigated range
of wavenumbers.
The spectral extinction coefficient, Kk, represents the de-
cay rate of the radiation intensity passing through the mate-
rial, and is a useful local radiative property for studying the
thermal radiation within a foam. It reads [40]:
Kk ¼ �lnðskðLÞÞ
Lð13Þ
where sk is the transmittance at a wavelength k (defined as
the ratio of the thermal radiation intensity passing through
the sample to the incident radiation intensity), and L is the
thickness of the sample. Being independent of the sample
thickness, the spectral extinction coefficient is a more general
and meaningful property than the transmittance. The results
are given in Fig. 8c; Kk decreases sharply as the wavelength is
increased to about 12 lm, the values at short wavelength
(<5 lm) being approximately at least twice those at longer
wavelengths (>12 lm). No data concerning the spectral
extinction coefficients of carbon foams could be found in
the literature; the observed behaviour is close to that of steel
foams of close porosities and similar linear cell density [40],
however the values of Kk are slightly higher in the case of
the present carbon foam.
The radiative properties measured here show that the
transmittance of the carbon foam is very low (below 1%) on
the whole range of wavelengths, and especially below 10 lm
(i.e., above 1000 cm�1). The reflectance is higher (below 7%),
but still low, indicating that the carbon foam should not be
an excellent thermal insulator. However, its extremely high
absorptivity should make it a suitable protection material
0
0.04
0.08
0.12
0.16
0 100 200 300 400
zxy
Temperature (°C)
Rel
ativ
e di
lata
tion
(%)
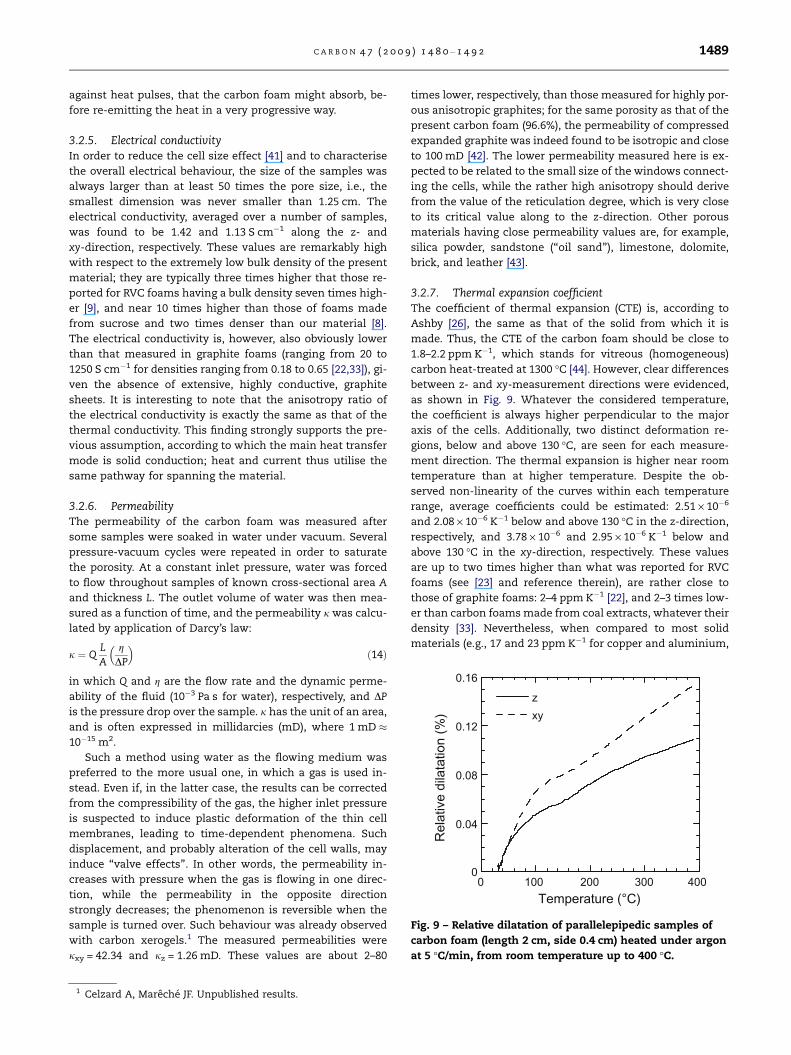
Fig. 9 – Relative dilatation of parallelepipedic samples of
carbon foam (length 2 cm, side 0.4 cm) heated under argon
at 5 �C/min, from room temperature up to 400 �C.
C A R B O N 4 7 ( 2 0 0 9 ) 1 4 8 0 – 1 4 9 2 1489
against heat pulses, that the carbon foam might absorb, be-
fore re-emitting the heat in a very progressive way.
3.2.5. Electrical conductivityIn order to reduce the cell size effect [41] and to characterise
the overall electrical behaviour, the size of the samples was
always larger than at least 50 times the pore size, i.e., the
smallest dimension was never smaller than 1.25 cm. The
electrical conductivity, averaged over a number of samples,
was found to be 1.42 and 1.13 S cm�1 along the z- and
xy-direction, respectively. These values are remarkably high
with respect to the extremely low bulk density of the present
material; they are typically three times higher that those re-
ported for RVC foams having a bulk density seven times high-
er [9], and near 10 times higher than those of foams made
from sucrose and two times denser than our material [8].
The electrical conductivity is, however, also obviously lower
than that measured in graphite foams (ranging from 20 to
1250 S cm�1 for densities ranging from 0.18 to 0.65 [22,33]), gi-
ven the absence of extensive, highly conductive, graphite
sheets. It is interesting to note that the anisotropy ratio of
the electrical conductivity is exactly the same as that of the
thermal conductivity. This finding strongly supports the pre-
vious assumption, according to which the main heat transfer
mode is solid conduction; heat and current thus utilise the
same pathway for spanning the material.
3.2.6. PermeabilityThe permeability of the carbon foam was measured after
some samples were soaked in water under vacuum. Several
pressure-vacuum cycles were repeated in order to saturate
the porosity. At a constant inlet pressure, water was forced
to flow throughout samples of known cross-sectional area A
and thickness L. The outlet volume of water was then mea-
sured as a function of time, and the permeability j was calcu-
lated by application of Darcy’s law:
j ¼ QLA
gDP
� �ð14Þ
in which Q and g are the flow rate and the dynamic perme-
ability of the fluid (10�3 Pa s for water), respectively, and DP
is the pressure drop over the sample. j has the unit of an area,
and is often expressed in millidarcies (mD), where 1 mD �10�15 m2.
Such a method using water as the flowing medium was
preferred to the more usual one, in which a gas is used in-
stead. Even if, in the latter case, the results can be corrected
from the compressibility of the gas, the higher inlet pressure
is suspected to induce plastic deformation of the thin cell
membranes, leading to time-dependent phenomena. Such
displacement, and probably alteration of the cell walls, may
induce ‘‘valve effects’’. In other words, the permeability in-
creases with pressure when the gas is flowing in one direc-
tion, while the permeability in the opposite direction
strongly decreases; the phenomenon is reversible when the
sample is turned over. Such behaviour was already observed
with carbon xerogels.1 The measured permeabilities were
jxy = 42.34 and jz = 1.26 mD. These values are about 2–80
1 Celzard A, Mareche JF. Unpublished results.
times lower, respectively, than those measured for highly por-
ous anisotropic graphites; for the same porosity as that of the
present carbon foam (96.6%), the permeability of compressed
expanded graphite was indeed found to be isotropic and close
to 100 mD [42]. The lower permeability measured here is ex-
pected to be related to the small size of the windows connect-
ing the cells, while the rather high anisotropy should derive
from the value of the reticulation degree, which is very close
to its critical value along to the z-direction. Other porous
materials having close permeability values are, for example,
silica powder, sandstone (‘‘oil sand’’), limestone, dolomite,
brick, and leather [43].
3.2.7. Thermal expansion coefficientThe coefficient of thermal expansion (CTE) is, according to
Ashby [26], the same as that of the solid from which it is
made. Thus, the CTE of the carbon foam should be close to
1.8–2.2 ppm K�1, which stands for vitreous (homogeneous)
carbon heat-treated at 1300 �C [44]. However, clear differences
between z- and xy-measurement directions were evidenced,
as shown in Fig. 9. Whatever the considered temperature,
the coefficient is always higher perpendicular to the major
axis of the cells. Additionally, two distinct deformation re-
gions, below and above 130 �C, are seen for each measure-
ment direction. The thermal expansion is higher near room
temperature than at higher temperature. Despite the ob-
served non-linearity of the curves within each temperature
range, average coefficients could be estimated: 2.51 · 10�6
and 2.08 · 10�6 K�1 below and above 130 �C in the z-direction,
respectively, and 3.78 · 10�6 and 2.95 · 10�6 K�1 below and
above 130 �C in the xy-direction, respectively. These values
are up to two times higher than what was reported for RVC
foams (see [23] and reference therein), are rather close to
those of graphite foams: 2–4 ppm K�1 [22], and 2–3 times low-
er than carbon foams made from coal extracts, whatever their
density [33]. Nevertheless, when compared to most solid
materials (e.g., 17 and 23 ppm K�1 for copper and aluminium,
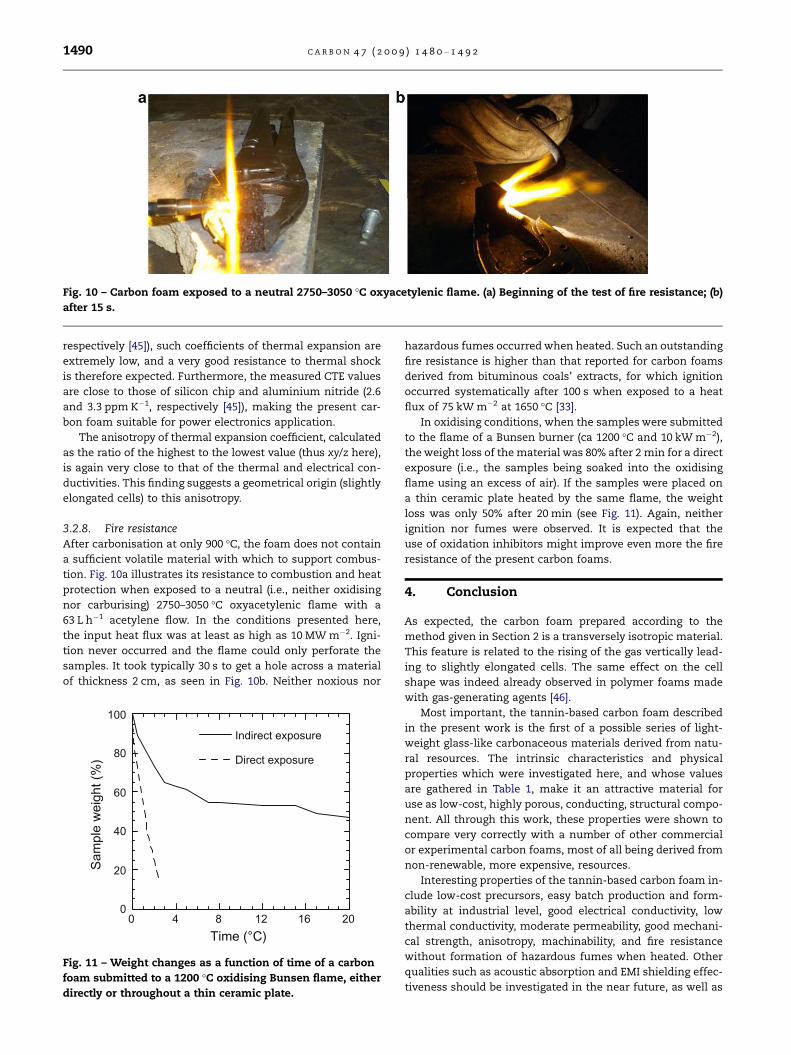
Fig. 10 – Carbon foam exposed to a neutral 2750–3050 �C oxyacetylenic flame. (a) Beginning of the test of fire resistance; (b)
after 15 s.
1490 C A R B O N 4 7 ( 2 0 0 9 ) 1 4 8 0 – 1 4 9 2
respectively [45]), such coefficients of thermal expansion are
extremely low, and a very good resistance to thermal shock
is therefore expected. Furthermore, the measured CTE values
are close to those of silicon chip and aluminium nitride (2.6
and 3.3 ppm K�1, respectively [45]), making the present car-
bon foam suitable for power electronics application.
The anisotropy of thermal expansion coefficient, calculated
as the ratio of the highest to the lowest value (thus xy/z here),
is again very close to that of the thermal and electrical con-
ductivities. This finding suggests a geometrical origin (slightly
elongated cells) to this anisotropy.
3.2.8. Fire resistanceAfter carbonisation at only 900 �C, the foam does not contain
a sufficient volatile material with which to support combus-
tion. Fig. 10a illustrates its resistance to combustion and heat
protection when exposed to a neutral (i.e., neither oxidising
nor carburising) 2750–3050 �C oxyacetylenic flame with a
63 L h�1 acetylene flow. In the conditions presented here,
the input heat flux was at least as high as 10 MW m�2. Igni-
tion never occurred and the flame could only perforate the
samples. It took typically 30 s to get a hole across a material
of thickness 2 cm, as seen in Fig. 10b. Neither noxious nor
0
20
40
60
80
100
0 4 8 12 16 20
Indirect exposure
Direct exposure
Time (°C)
Sam
ple
wei
ght (
%)
Fig. 11 – Weight changes as a function of time of a carbon
foam submitted to a 1200 �C oxidising Bunsen flame, either
directly or throughout a thin ceramic plate.
hazardous fumes occurred when heated. Such an outstanding
fire resistance is higher than that reported for carbon foams
derived from bituminous coals’ extracts, for which ignition
occurred systematically after 100 s when exposed to a heat
flux of 75 kW m�2 at 1650 �C [33].
In oxidising conditions, when the samples were submitted
to the flame of a Bunsen burner (ca 1200 �C and 10 kW m�2),
the weight loss of the material was 80% after 2 min for a direct
exposure (i.e., the samples being soaked into the oxidising
flame using an excess of air). If the samples were placed on
a thin ceramic plate heated by the same flame, the weight
loss was only 50% after 20 min (see Fig. 11). Again, neither
ignition nor fumes were observed. It is expected that the
use of oxidation inhibitors might improve even more the fire
resistance of the present carbon foams.
4. Conclusion
As expected, the carbon foam prepared according to the
method given in Section 2 is a transversely isotropic material.
This feature is related to the rising of the gas vertically lead-
ing to slightly elongated cells. The same effect on the cell
shape was indeed already observed in polymer foams made
with gas-generating agents [46].
Most important, the tannin-based carbon foam described
in the present work is the first of a possible series of light-
weight glass-like carbonaceous materials derived from natu-
ral resources. The intrinsic characteristics and physical
properties which were investigated here, and whose values
are gathered in Table 1, make it an attractive material for
use as low-cost, highly porous, conducting, structural compo-
nent. All through this work, these properties were shown to
compare very correctly with a number of other commercial
or experimental carbon foams, most of all being derived from
non-renewable, more expensive, resources.
Interesting properties of the tannin-based carbon foam in-
clude low-cost precursors, easy batch production and form-
ability at industrial level, good electrical conductivity, low
thermal conductivity, moderate permeability, good mechani-
cal strength, anisotropy, machinability, and fire resistance
without formation of hazardous fumes when heated. Other
qualities such as acoustic absorption and EMI shielding effec-
tiveness should be investigated in the near future, as well as
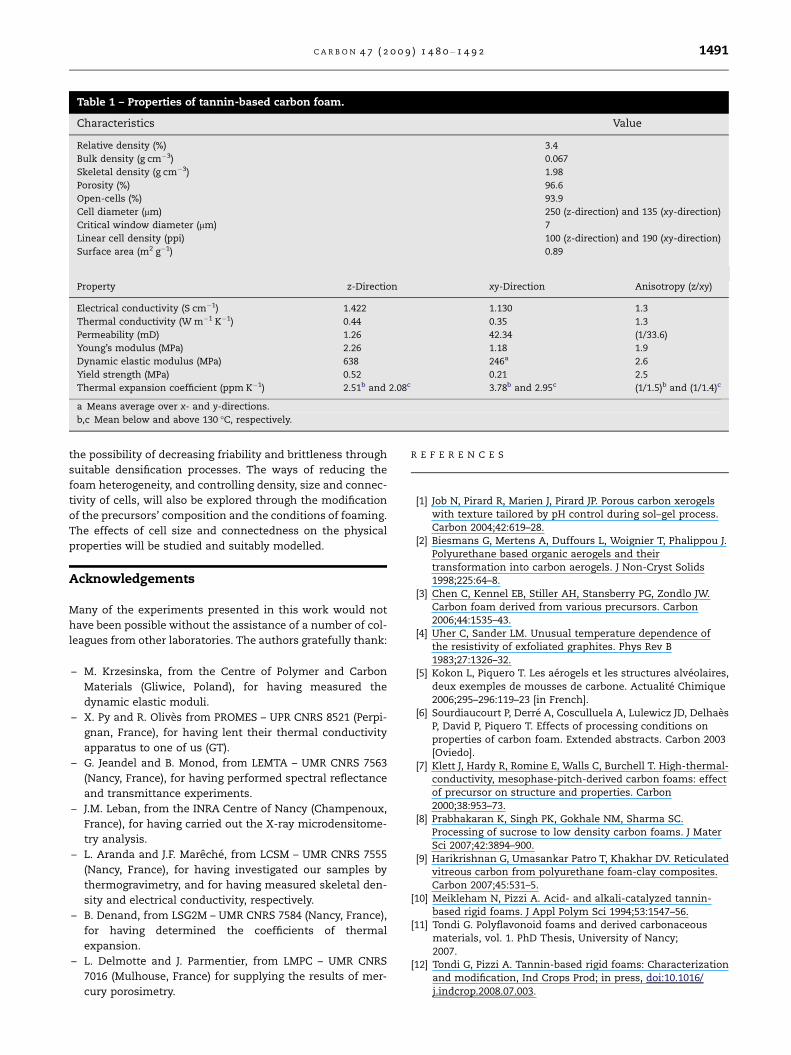
Table 1 – Properties of tannin-based carbon foam.
Characteristics Value
Relative density (%) 3.4
Bulk density (g cm�3) 0.067
Skeletal density (g cm�3) 1.98
Porosity (%) 96.6
Open-cells (%) 93.9
Cell diameter (lm) 250 (z-direction) and 135 (xy-direction)
Critical window diameter (lm) 7
Linear cell density (ppi) 100 (z-direction) and 190 (xy-direction)
Surface area (m2 g�1) 0.89
Property z-Direction xy-Direction Anisotropy (z/xy)
Electrical conductivity (S cm�1) 1.422 1.130 1.3
Thermal conductivity (W m�1 K�1) 0.44 0.35 1.3
Permeability (mD) 1.26 42.34 (1/33.6)
Young’s modulus (MPa) 2.26 1.18 1.9
Dynamic elastic modulus (MPa) 638 246a 2.6
Yield strength (MPa) 0.52 0.21 2.5
Thermal expansion coefficient (ppm K�1) 2.51b and 2.08c 3.78b and 2.95c (1/1.5)b and (1/1.4)c
a Means average over x- and y-directions.
b,c Mean below and above 130 �C, respectively.
C A R B O N 4 7 ( 2 0 0 9 ) 1 4 8 0 – 1 4 9 2 1491
the possibility of decreasing friability and brittleness through
suitable densification processes. The ways of reducing the
foam heterogeneity, and controlling density, size and connec-
tivity of cells, will also be explored through the modification
of the precursors’ composition and the conditions of foaming.
The effects of cell size and connectedness on the physical
properties will be studied and suitably modelled.
Acknowledgements
Many of the experiments presented in this work would not
have been possible without the assistance of a number of col-
leagues from other laboratories. The authors gratefully thank:
– M. Krzesinska, from the Centre of Polymer and Carbon
Materials (Gliwice, Poland), for having measured the
dynamic elastic moduli.
– X. Py and R. Olives from PROMES – UPR CNRS 8521 (Perpi-
gnan, France), for having lent their thermal conductivity
apparatus to one of us (GT).
– G. Jeandel and B. Monod, from LEMTA – UMR CNRS 7563
(Nancy, France), for having performed spectral reflectance
and transmittance experiments.
– J.M. Leban, from the INRA Centre of Nancy (Champenoux,
France), for having carried out the X-ray microdensitome-
try analysis.
– L. Aranda and J.F. Mareche, from LCSM – UMR CNRS 7555
(Nancy, France), for having investigated our samples by
thermogravimetry, and for having measured skeletal den-
sity and electrical conductivity, respectively.
– B. Denand, from LSG2M – UMR CNRS 7584 (Nancy, France),
for having determined the coefficients of thermal
expansion.
– L. Delmotte and J. Parmentier, from LMPC – UMR CNRS
7016 (Mulhouse, France) for supplying the results of mer-
cury porosimetry.
R E F E R E N C E S
[1] Job N, Pirard R, Marien J, Pirard JP. Porous carbon xerogelswith texture tailored by pH control during sol–gel process.Carbon 2004;42:619–28.
[2] Biesmans G, Mertens A, Duffours L, Woignier T, Phalippou J.Polyurethane based organic aerogels and theirtransformation into carbon aerogels. J Non-Cryst Solids1998;225:64–8.
[3] Chen C, Kennel EB, Stiller AH, Stansberry PG, Zondlo JW.Carbon foam derived from various precursors. Carbon2006;44:1535–43.
[4] Uher C, Sander LM. Unusual temperature dependence ofthe resistivity of exfoliated graphites. Phys Rev B1983;27:1326–32.
[5] Kokon L, Piquero T. Les aerogels et les structures alveolaires,deux exemples de mousses de carbone. Actualite Chimique2006;295–296:119–23 [in French].
[6] Sourdiaucourt P, Derre A, Cosculluela A, Lulewicz JD, DelhaesP, David P, Piquero T. Effects of processing conditions onproperties of carbon foam. Extended abstracts. Carbon 2003[Oviedo].
[7] Klett J, Hardy R, Romine E, Walls C, Burchell T. High-thermal-conductivity, mesophase-pitch-derived carbon foams: effectof precursor on structure and properties. Carbon2000;38:953–73.
[8] Prabhakaran K, Singh PK, Gokhale NM, Sharma SC.Processing of sucrose to low density carbon foams. J MaterSci 2007;42:3894–900.
[9] Harikrishnan G, Umasankar Patro T, Khakhar DV. Reticulatedvitreous carbon from polyurethane foam-clay composites.Carbon 2007;45:531–5.
[10] Meikleham N, Pizzi A. Acid- and alkali-catalyzed tannin-based rigid foams. J Appl Polym Sci 1994;53:1547–56.
[11] Tondi G. Polyflavonoid foams and derived carbonaceousmaterials, vol. 1. PhD Thesis, University of Nancy;2007.
[12] Tondi G, Pizzi A. Tannin-based rigid foams: Characterizationand modification, Ind Crops Prod; in press, doi:10.1016/j.indcrop.2008.07.003.
1492 C A R B O N 4 7 ( 2 0 0 9 ) 1 4 8 0 – 1 4 9 2
[13] Tondi G, Pizzi A, Pasch H, Celzard A. Structure degradation,conservation and rearrangement in the carbonisation ofpolyflavonoid tannin/furanic rigid foams – a MALDI-ToFinvestigation. Polym Degrad Stab 2008;93:968–75.
[14] Tondi G, Pizzi A, Pasch H, Celzard A, Rode K. MALDI-ToFinvestigation of furanic polymer foams before and aftercarbonization: aromatic rearrangement and survivingfuranic structures. Eur Polym J 2008;44:2938–43.
[15] Tondi G, Pizzi A, Masson E, Celzard A. Analysis of gasesemitted during carbonization of polyflavonoid tannin/furanicrigid foams. Polym Deg Stab 2008;93:1539–43.
[16] Krzesinska M, Celzard A, Grzyb B, Mareche JF. Elasticproperties and electrical conductivity of mica/expandedgraphite nanocomposites. Mater Chem Phys 2006;97:173–81.
[17] Krzesinska M, Celzard A, Mareche JF, Puricelli S. Elasticproperties of anisotropic monolithic samples of compressedexpanded graphite studied with ultrasounds. J Mater Res2001;16:606–14.
[18] Py X, Olives R, Mauran S. Parrafin/porous–graphite-matrixcomposite as a high and constant power thermal storagematerial. J Heat Mass Transfer 2001;44:2727–37.
[19] Celzard A, Collas F, Mareche JF, Furdin G, Rey I. Porouselectrodes-based double-layer supercapacitors: porestructure versus series resistance. J Power Sources2002;108:153–62.
[20] Ahern A, Verbist G, Weaire D, Phelan R, Fleurent H. Theconductivity of foams: a generalisation of the electrical to thethermal case. Coll Surf A: Physicochem Eng Aspects2005;263:275–9.
[21] Klett J, Klett L, Hardy R, Burchell T, Walls C. Graphitic foamthermal management materials for electronic packaging.Extended abstracts. Soc Automotive Eng Future CarCongress, Crystal City, Washington DC, April 2–6; 2000.
[22] Poco graphite, Inc., 1601 South State Street, Decatur, TX76234, USA. Poco foams datasheet.
[23] Gallego NC, Klett JW. Carbon foams for thermalmanagement. Carbon 2003;41:1461–6.
[24] Dharmasena KP, Wadley HNG. Electrical conductivity ofopen-cell metal foams. J Mater Res 2002;17:625–31.
[25] Babcsan N, Meszaros I, Hegman N. Thermal and electricalconductivity measurements on aluminium foams.Materialwiss Werkstofftech 2003;34:391–4.
[26] Ashby MF. The properties of foams and lattices. Phil Trans RSoc A 2006;364:15–30.
[27] Klett J, McMillan A, Gallego N, Walls C. The role of structureon the thermal properties of graphitic foams. J Mater Sci2004;39:3659–76.
[28] Gupta N, Priya S, Islam R, Ricci W. Characterization ofmechanical and electrical properties of epoxy-glassmicroballoon syntactic composites. Ferroelectrics2006;345:1–12.
[29] De Gennes PG, Guyon E. Lois generales pour l’injection d’un fluide dans un milieu poreux aleatoire. J Mec1978;17:403–32.
[30] Chatzis I, Dullien FAL. Modelling pore structure by 2-D and3-D networks with applications to sandstones. J Can PetrolTechnol 1977;16:97–108.
[31] Thompson AH, Katz AJ, Rashke RA. Mercury injection inporous media: A resistance devil’s staircase with percolationgeometry. Phys Rev Lett 1987;58:29–32.
[32] Peng HX, Fan Z, Evans JRG, Busfield JJC. Microstructure ofceramic foams. J Eur Ceram Soc 2000;20:807–13.
[33] Rogers DK, Plucinski J. Low-cost carbon foams for thermalprotection and reinforcement applications. Extendedabstracts. In 45th international SAMPE symposium, May21–25; 2000.
[34] Gibson LJ, Ashby MF. Cellular solids: structure and properties.2nd ed. Cambridge Solid State Press, Cambridge UniversityPress; 1997.
[35] El-Baradie EM, Shoeib MA, Maamoun MA. Pore-size effect onthe properties of open-cell Al–Ni foam. Mater ResInnovations 2005;9:19–20.
[36] Kim A, Hasan MA, Nahma SH, Cho SS. Evaluationof compressive mechanical properties of Al-foamsusing electrical conductivity. Compos Struct2005;71:191–8.
[37] Stein RS, Wilkes GL. Physico-chemical approaches to themeasurement of anisotropy. In: Ward IM, editor. Structureand properties of oriented polymers. London: AppliedScience Publishers Ltd.; 1975.
[38] Doermann D, Sacadura JF. Heat transfer in open-cell foaminsulation. J Heat Transfer 1996;118:88–93.
[39] Celzard A, Mareche JF, Furdin G. Describing the properties ofcompressed expanded graphite through power laws. J PhysCondens Matter 2003;15:7213–26.
[40] Zhao CY, Lu TJ, Hodson HP. Thermal radiation in ultralightmetal foams with open cells. Int J Heat Mass Transfer2004;47:2927–39.
[41] Gibson LJ. Mechanical behavior of metallic foams. Ann RevMater 2000;30:191–227.
[42] Celzard A, Mareche JF. Fluid flow in highly porous anisotropicgraphites. J Phys Condens Matter 2002;14:1119–29.
[43] Scheidegger AE. The physics of flow through porous media.3rd ed. University of Toronto Press; 1974. p. 91.
[44] Bastick M, Chiche P, Rappeneau J. La texture des carbones.Groupe Francais d’Etude des Carbones. Les Carbones, vol.2. Paris: Masson et Cie; 1965. p. 208 [in French].
[45] Tummala R, Rymaszewski E, Klopfenstein A.Microelectronics packaging handbook. Book I: technologydrivers. Van Nostrand Reinhold; 1997.
[46] Huber AT, Gibson LJ. Anisotropy of foams. J Mater Sci1988;23:3031–4.
Copyright © 2022 FDOKUMEN