
Electrospun poly(epsilon-caprolactone)/gelatin nanofibrous scaffolds for nerve tissue engineering
Upload
khangminh22Category
view
0download
0
�����������������
Citation: Osetrov, K.; Uspenskaya,
M.; Sitnikova, V. The Influence of
Oxidant on Gelatin–Tannin Hydrogel
Properties and Structure for Potential
Biomedical Application. Polymers
2022, 14, 150. https://doi.org/
10.3390/polym14010150
Academic Editors: Ignazio Blanco
and Lorenzo Antonio Picos Corrales
Received: 13 December 2021
Accepted: 29 December 2021
Published: 31 December 2021
Publisher’s Note: MDPI stays neutral
with regard to jurisdictional claims in
published maps and institutional affil-
iations.
Copyright: © 2021 by the authors.
Licensee MDPI, Basel, Switzerland.
This article is an open access article
distributed under the terms and
conditions of the Creative Commons
Attribution (CC BY) license (https://
creativecommons.org/licenses/by/
4.0/).
polymers
Article
The Influence of Oxidant on Gelatin–Tannin HydrogelProperties and Structure for Potential Biomedical ApplicationKonstantin Osetrov * , Mayya Uspenskaya and Vera Sitnikova
Bioengineering Institute, ITMO University, 197101 Saint-Petersburg, Russia; [email protected] (M.U.);[email protected] (V.S.)* Correspondence: [email protected]
Abstract: Nowadays, there is a widespread usage of sodium periodate as an oxidant for synthesizinggelatin–tannin hydrogels. The impact of iodine compounds could have a harmful effect on humanhealth. The study focuses on the proposal of alternative oxidizing systems for tannin oxidation.Gelatin–tannin hydrogels were obtained based on the usage of H2O2/DMSO/KMnO4/KIO4 oxidantsand characterized with sorption, thermal (TGA, DTG, DSC), mechanical, FTIR and other methods.The sorption experiments were carried out in a phosphate buffer (pH = 5.8/7.4/9) and distilled waterand were investigated with Fick’s law and pseudosecond order equation. The pH dependence ofmaterials in acid media indicates the possibility of further usage as stimuli-responsive systems fordrug delivery. Thermal transitions demonstrate the variation of structure with melting (306 ÷ 319 ◦C)and glass transition temperatures (261 ÷ 301 ◦C). The activation energy of water evaporation wascalculated by isoconversional methods (Kissinger–Akahira–Sunose, Flynn–Wall–Ozawa) rangingfrom 4 ÷ 18 to 14 ÷ 38 kJ/mole and model-fitting (Coats–Redfern, Kennedy–Clark) methods at24.7 ÷ 45.3 kJ/mole, indicating the smooth growth of values with extent of conversion. The networkparameters of the hydrogels were established by modified Flory–Rehner and rubber elasticity theories,which demonstrated differences in values (5.96 ÷ 21.27·10−3 mol/cm3), suggesting the limitationsof theories. The sorption capacity, tensile strength and permeability for water/oxygen indicate thatthese materials may find their application in field of biomaterials.
Keywords: hydrogel; tannin; gelatin; thermal analysis; sorption; crosslinking density
1. Introduction
Hydrogels are one of the perspective classes among all biomaterials. These are poly-meric structures, which have properties similar to soft human tissues [1]. They are highlyhydrated, elastically deformable and water and oxygen permeable [2]. These propertiescould represent a skin-like structure, allowing them to be a functional analogue of skingrafting [3]. Severities considering the negative sides of hydrogels include their poorphysico-mechanical properties, the potential toxicity of crosslinking agents, inability toprovide antibacterial activity and allergic rejection by the human body [4,5]. The mainstructural element of hydrogels is monomers. The crosslinking of monomers providesnetwork formation. There are several mechanisms of crosslinking.
Chemical crosslinking provides mechanical strength but potentially uses compoundsthat may be toxic. Some of them may have a potential harmful effect on humans, so theyregarded to be washed from hydrogel network. Widespread crosslinkers include glutaralaldehyde [6], glyoxal [7], genipin [8], etc. Although many of them have a considerabletoxic impact on human cells, one of the biggest challenges for a researcher is to choose theappropriate one [9]. Others appear to be non-toxic, but their usage is limited to economicalpurposes or synthesis difficulties [10].
Among the promising crosslinking agents is tannin, a group of plant-derived polyphe-nolic components, which are recognized to be safe and appear to offer protection from
Polymers 2022, 14, 150. https://doi.org/10.3390/polym14010150 https://www.mdpi.com/journal/polymers
Polymers 2022, 14, 150 2 of 22
some bacterial cultures [11,12]. Gelatin has a relative structure as the main componentof human skin (collagen). It has a similar amino-acid composition and can form closeconformations [13]. Furthermore, gelatin for medical purposes, apart from collagen, issterile, which allowed its usage to expand to wound dressings. Tannin forms precipitateswith peptide molecules if mixed directly in a solution without adjusting the pH level [14].The pH of tannin solution can be increased from an acidic to moderate basic level (from4.5 ÷ 5.5 to 9 ÷ 10) to prevent this effect. Furthermore, it provides a medium for easiertannin oxidation and causes the ionization of oxidizer molecules. The formation of a chemi-cally crosslinked polymer network, based on tannin and gelatin, requires the preliminaryoxidation of tannin molecules.
Periodate compounds are commonly used for the oxidation of functional groups [15]and could be used for the selective oxidation of vicinal diols to aldehyde groups [16].Usage of those oxidizers is well known for obtaining hydrogels, linking tannin in theirnetwork [17–19]. Additionally, increasing the pH in oxidation reactions with periodate-containing substances is another important thing to mention. The formation of an ethercomplex under iodate prevents the cleavage of C–C bonds and may cause elementary iodefrom forming [20]. This could be toxic for some biomedical applications.
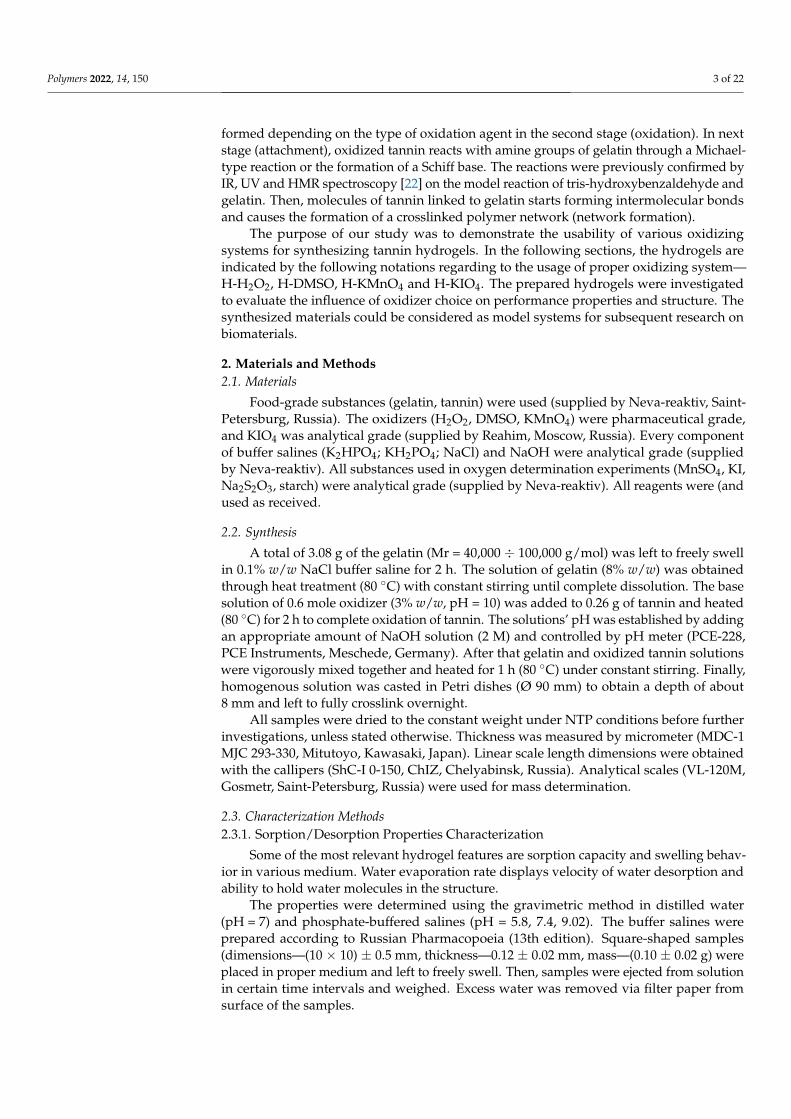
In our study, we present alternative oxidizing systems for the synthesis of gelatin–tannin hydrogels. Large and hard tannin molecules contain a significant number of hard-to-reach hydroxyl groups. These can be less accessible for wide-radius molecules of oxidizers,which are blocked by a high-density net of hydrogen bonds [21]. Additionally, it is impor-tant to note the existence of hard molecule substrates and the sterically hindered effectsrelated to them. In this way, relatively small and more flexible oxidative agents (DMSO andH2O2) could have better potential for the effective oxidation of tannin molecules comparedto KIO4 and KMnO4. The formation of the hydrogel network is followed by a complexreaction (Figure 1), according to [22]:
Polymers 2022, 14, x FOR PEER REVIEW 2 of 23
Among the promising crosslinking agents is tannin, a group of plant-derived poly-phenolic components, which are recognized to be safe and appear to offer protection from some bacterial cultures [11,12]. Gelatin has a relative structure as the main component of human skin (collagen). It has a similar amino-acid composition and can form close con-formations [13]. Furthermore, gelatin for medical purposes, apart from collagen, is sterile, which allowed its usage to expand to wound dressings. Tannin forms precipitates with peptide molecules if mixed directly in a solution without adjusting the pH level [14]. The pH of tannin solution can be increased from an acidic to moderate basic level (from 4.5 ÷ 5.5 to 9 ÷ 10) to prevent this effect. Furthermore, it provides a medium for easier tannin oxidation and causes the ionization of oxidizer molecules. The formation of a chemically crosslinked polymer network, based on tannin and gelatin, requires the preliminary oxi-dation of tannin molecules.
Periodate compounds are commonly used for the oxidation of functional groups [15] and could be used for the selective oxidation of vicinal diols to aldehyde groups [16]. Us-age of those oxidizers is well known for obtaining hydrogels, linking tannin in their net-work [17–19]. Additionally, increasing the pH in oxidation reactions with periodate-con-taining substances is another important thing to mention. The formation of an ether com-plex under iodate prevents the cleavage of C–C bonds and may cause elementary iode from forming [20]. This could be toxic for some biomedical applications.
In our study, we present alternative oxidizing systems for the synthesis of gelatin–tannin hydrogels. Large and hard tannin molecules contain a significant number of hard-to-reach hydroxyl groups. These can be less accessible for wide-radius molecules of oxi-dizers, which are blocked by a high-density net of hydrogen bonds [21]. Additionally, it is important to note the existence of hard molecule substrates and the sterically hindered effects related to them. In this way, relatively small and more flexible oxidative agents (DMSO and H2O2) could have better potential for the effective oxidation of tannin mole-cules compared to KIO4 and KMnO4. The formation of the hydrogel network is followed by a complex reaction (Figure 1), according to [22]:
Figure 1. Scheme of the reactions.
In the first stage (ionization), the deprotonation of tannin causes the formation of accessible sites for electron donor molecules of oxidizers. The constants of equilibrium in
Figure 1. Scheme of the reactions.
In the first stage (ionization), the deprotonation of tannin causes the formation ofaccessible sites for electron donor molecules of oxidizers. The constants of equilibriumin water media (25 ◦C) are 11.65 for H2O2, 35.1 for DMSO and 1.64 for HIO4 [23]. Thisresults in different capacities for forming ionizable substrates and the efficacy of the furtherconversion of hydroxyl groups to aldehyde. Various functionality products of tannin are
Polymers 2022, 14, 150 3 of 22
formed depending on the type of oxidation agent in the second stage (oxidation). In nextstage (attachment), oxidized tannin reacts with amine groups of gelatin through a Michael-type reaction or the formation of a Schiff base. The reactions were previously confirmed byIR, UV and HMR spectroscopy [22] on the model reaction of tris-hydroxybenzaldehyde andgelatin. Then, molecules of tannin linked to gelatin starts forming intermolecular bondsand causes the formation of a crosslinked polymer network (network formation).
The purpose of our study was to demonstrate the usability of various oxidizingsystems for synthesizing tannin hydrogels. In the following sections, the hydrogels areindicated by the following notations regarding to the usage of proper oxidizing system—H-H2O2, H-DMSO, H-KMnO4 and H-KIO4. The prepared hydrogels were investigatedto evaluate the influence of oxidizer choice on performance properties and structure. Thesynthesized materials could be considered as model systems for subsequent research onbiomaterials.
2. Materials and Methods2.1. Materials
Food-grade substances (gelatin, tannin) were used (supplied by Neva-reaktiv, Saint-Petersburg, Russia). The oxidizers (H2O2, DMSO, KMnO4) were pharmaceutical grade,and KIO4 was analytical grade (supplied by Reahim, Moscow, Russia). Every componentof buffer salines (K2HPO4; KH2PO4; NaCl) and NaOH were analytical grade (suppliedby Neva-reaktiv). All substances used in oxygen determination experiments (MnSO4, KI,Na2S2O3, starch) were analytical grade (supplied by Neva-reaktiv). All reagents were (andused as received.
2.2. Synthesis
A total of 3.08 g of the gelatin (Mr = 40,000 ÷ 100,000 g/mol) was left to freely swellin 0.1% w/w NaCl buffer saline for 2 h. The solution of gelatin (8% w/w) was obtainedthrough heat treatment (80 ◦C) with constant stirring until complete dissolution. The basesolution of 0.6 mole oxidizer (3% w/w, pH = 10) was added to 0.26 g of tannin and heated(80 ◦C) for 2 h to complete oxidation of tannin. The solutions’ pH was established by addingan appropriate amount of NaOH solution (2 M) and controlled by pH meter (PCE-228,PCE Instruments, Meschede, Germany). After that gelatin and oxidized tannin solutionswere vigorously mixed together and heated for 1 h (80 ◦C) under constant stirring. Finally,homogenous solution was casted in Petri dishes (Ø 90 mm) to obtain a depth of about8 mm and left to fully crosslink overnight.
All samples were dried to the constant weight under NTP conditions before furtherinvestigations, unless stated otherwise. Thickness was measured by micrometer (MDC-1MJC 293-330, Mitutoyo, Kawasaki, Japan). Linear scale length dimensions were obtainedwith the callipers (ShC-I 0-150, ChIZ, Chelyabinsk, Russia). Analytical scales (VL-120M,Gosmetr, Saint-Petersburg, Russia) were used for mass determination.
2.3. Characterization Methods2.3.1. Sorption/Desorption Properties Characterization
Some of the most relevant hydrogel features are sorption capacity and swelling behav-ior in various medium. Water evaporation rate displays velocity of water desorption andability to hold water molecules in the structure.
The properties were determined using the gravimetric method in distilled water(pH = 7) and phosphate-buffered salines (pH = 5.8, 7.4, 9.02). The buffer salines wereprepared according to Russian Pharmacopoeia (13th edition). Square-shaped samples(dimensions—(10 × 10) ± 0.5 mm, thickness—0.12 ± 0.02 mm, mass—(0.10 ± 0.02 g) wereplaced in proper medium and left to freely swell. Then, samples were ejected from solutionin certain time intervals and weighed. Excess water was removed via filter paper fromsurface of the samples.

Polymers 2022, 14, 150 4 of 22
Swelling value was calculated according to Equation (1):
Q =(mmax −m0·(1− γ))
m0·(1− γ)(1)
where mmax—mass of a swelled sample, g; m0—initial mass, g; γ—moisture content(entrapped water determined by TGA).
Analysis of desorption and sorption properties was carried out by diffusion Fick’s law(Equation (2)) and pseudosecond order equations [24] (Equation (3)).
k·tn = Qt/Qmax (2)
where Qmax—maximum swelling value, g/g k2—constant of swelling velocity in pseudosecond order equation, Qt—swelling at time, g/g, t—time, min.
dQtdt
= k2·(Qmax −Qt)2 (3)
where k—constant of swelling velocity in Fick’s law, n—diffusion degree.Well-correlated results (R > 0.99) and good fitting with the lines were obtained by
applying these equations to experimental data. Constants of these equations displayvelocity of swelling. Fick’s law was applied for the first period of swelling (until Qt = 0.6Qmax), while pseudosecond order equation was applied for all periods of the research. Thediffusion degree (n) shows type of diffusion.
2.3.2. Crosslinking Density/Mesh Size Determination
Crosslinking density was calculated according to the Peppas–Barr–Howell equa-tion [25] in water medium (pH = 7). Derived from the classical Flory–Rehner theory,this equation uses a macromolecular crosslinker in a significantly high concentration andproduces more precise results than the original one.
Firstly, the volume fraction of the polymer after crosslinking in equilibrium with theswollen gel (ϕ2) was calculated (Equation (4)):
ϕ2 =
1ρ2
Qmaxρ1
+ 1ρ2
(4)
where ρ1—water density, (1 g/cm3), ρ2—gelatin density, (1.35 g/cm3 [26]).This allows us to determine the volume fraction of the solvent (ϕ1) (Equation (5)).
ϕ1 = 1−ϕ2 (5)
The average molecular weight between crosslinks (Mc1) represents average molecularweight of the primary polymer chains before crosslinking (Equation (6)).
1Mc1
=2
Mn−
(υV1
)·(ln(1−ϕ2) +ϕ2 + χ·ϕ2)
ϕ21/3 − ϕ22
(6)
where χ—the Flory−Huggins polymer−solvent interaction parameter (0.49 [27]), ν—thespecific volume of the polymer (0.71 [28]), V1—molar volume of the swelling solvent,cm3/mole (18), Mn—the average molecular weight of the linear polymer before crosslink-ing, g/mole (114.8 g/mole, calculated according to amino acid content in gelatin [29]).
The gel degree of crosslinking (Xn1) is defined as ratio of crosslinks to repeating units(Equation (7)). This parameter represents crosslink density of network by numerical value.
Xn1 =ρ2
Mc1(7)
Polymers 2022, 14, 150 5 of 22
The mesh size (ε1) or the network correlation length defines the maximum moleculediameter, which can be entrapped in polymer network (Equation (8)).
ε1 = ϕ−1/32 ·(Cn·η·Mc1
Mn)
1/2·l (8)
where η—number of links per repeat unit (2 were used for calculation), l—the averagelength of a bond, A◦ (1.44 [30]), Cn—Flory characteristic ratio (8.26 [30]).
2.3.3. Gel Content Determination
Gel content of hydrogels (Xg) was determined by drying them under NTP conditions,reaching equilibrium after the hydrogel samples swelled in water medium (Equation(9)). This number describes the total number of monomers, which take part in networkformation.
Xg =ma
m0·100 (9)
where ma—mass of a sample after drying, g.
2.3.4. Porosity
The porosity of the hydrogels (Xp) was determined by liquid displacement method [31](Equation (10)). Briefly, the samples were weighed, and their volumes were measured.Then, the samples were immersed in ethanol until fully saturated and weighed. It displayedrelative pore volume accessible for alcohol penetration.
Xp =me −m0
ρ3·V2·100% (10)
where me—mass of a sample after immersion in ethanol, g, ρ3—density of ethanol (0.79 [32]),g/cm3, V2—volume of a sample, cm3.
2.3.5. Physico-Mechanical Analysis
Hydrogels need to correspond with operational conditions and have proper me-chanical stability. Uniaxial stretch was used to find the tensile properties and approveapplicability as functional material. Tensile strength and elongation at break were deter-mined on a universal test frame (Instron 5966, Instron, Norwood, MA, USA) with followingconditions: crosshead speed—10 mm/min, rectangular samples—30 × 8 × 8 mm). Thesamples were cut from equilibrium-swelled (water medium) films and placed with the ini-tial distance of 10 mm between pneumatic tensile clamps. The hydrogels had insignificantdeformation in the grip zone during mechanical experiments, and the destruction of thematerial was not visually defined. The geometry of the samples and experimental designwas defined experimentally to provide best reproducibility.
For further calculation of hydrogel crosslinking density, the rubber elasticity theorywas used [33]. First, linear region according to the elastic deformation theory force propor-tional to the deformation was found. The elastic modulus (G) can be computed from theslope of the line (Equation (11)):
F = G·(α− 1
α2
)(11)
where F—the force applied to sample depending on its area, Pa, α—the elongation ratio, %.The elastic modulus of an equilibrium-swelled hydrogel is inversely proportional to
the molecular weight between crosslinks (Mc2) (Equation (12)):
G =ρ2
Mc2·R·T·ϕ1/3
2 ·ϕ2/33 (12)
Polymers 2022, 14, 150 6 of 22
where R—universal gas constant, J/(mole·K) (8.314), T—temperature, K (298), φ3—volumefraction of polymer after crosslinking before swelling.
The crosslinking density (Xn2) can be obtained by Equation (13):
Xn2 =ρ2
Mc2(13)
The mesh size (ε2) can be calculated by Equation (14):
e2 = ϕ1/32 ·
(Cn·
2Mc2
Mn
)1/2·l (14)
2.3.6. Study of the Thermal Properties
The thermal properties were obtained using a thermal analyser (SDT Q-600, TA instru-ments, New Castle, DE, USA) with the following conditions: nitrogen purge (40 mL/min),temperature 25 ÷ 600 ◦C, heating rates 5, 7.5, 10 K/min, mass of film samples 10 ± 2 mg,open alumina sample pans (100 µL). The samples were represented by disks cut from driedfilms.
Thermogravimetric analysis (TGA) was used for determination of thermal behavior.The temperatures of melting (Tm) and glass transition (Tg) were determined on differentialscanning calorimetry (DSC) traces with 5 K/min heating rate as peak maximum and atmidpoint, respectively. The initiation and the end of the step was determined by derivativethermogravimetry (DTG).
For further investigation of structure, the first step of thermal decomposition kineticswas studied. The extent of conversion (α) was determined as ratio of difference betweeninitial mass and mass loss at a certain time to difference between initial mass and mass lossat the end of the step (Equation (15)).
α =m0 −mT
m0 −mf(15)
where mT—mass at time, g, mf—mass at the end of the step, g.The kinetic of thermal decomposition is usually described by Equation (16):
ßdαdt
= k(T)·f(α) (16)
where β—heating rate, K/min, T—temperature, K, k(T)—reaction rate depended on T,f(α)—reaction model.
The rate constant (k(T)) obeys Arrhenius expression (Equation (17)):
k(T) = A· exp(− Ea
RT
)(17)
where A—pre-exponential factor, Ea—activation energy, kJ/mole, R—universal gas con-stant, J/(mole·K).
Equation (16) is usually transformed into the integral form (g(α)) for further calcula-tions (Equation (18)).
g(α) =∫ α
0
dαf(α)
(18)
Substituting the reaction model allows for the calculation of kinetic parameters fromthe slope of the plot of g(α) against T. The list of models used in this work (r) is presentedin Table 1 [34].
Polymers 2022, 14, 150 7 of 22
Table 1. Reaction models.
No Reaction Model (r) f(α) g(α)
1 Power law 4α0.75 α0.25
2 Power law 3α0.66 α0.33
3 Power law 2α0.5 α0.5
4 Power law 0.66α−0.5 α1.5
5 Zero-order (Polany–Wingerequation) 1 α
6Phase boundary-controlledreaction (contracting area, i.e.,bidimensional shape)
2(1 − α)0.5 1 − (1 − α)0.5
7Phase boundary-controlledreaction (contracting area, i.e.,tridimensional shape)
3(1 − α)0.66 1 − (1 − α)0.33
8 First-order (Mampel) (1 − α) −ln(1 − α)9 Three-halves order (1 − α)1.5 2((1 − α)−0.5 − 1)10 Second-order (1 − α)2 (1 − α)−1 − 111 Third-order (1 − α)3 0.5((1 − α)−2 − 1)12 Avrami–Erofeev (n = 1.5) 1.5(1 − α)(−ln(1 − α))0.33 −ln(1 − α)0.66
13 Avrami–Erofeev (n = 2) 2(1 − α)(−ln(1 − α))0.5 −ln(1 − α)0.5
14 Avrami–Erofeev (n = 3) 3(1 − α)(−ln(1 − α))0.66 −ln(1 − α)0.33
15 Avrami–Erofeev (n = 4) 4(1 − α)(−ln(1 − α))0.75 −ln(1 − α)0.25
16 One-dimensional diffusion 0.5α α2
17Two-dimensional diffusion(bidimensional shape), Valensiequation
1/(−ln(1 − α)) (1 − α)ln(1 − α) + α
18Three-dimensional diffusion(tridimensional shape), Janderequation
3(1 − α)0.33/(2(1 − α)−0.33 − 1) (1 − (1 − α)0.33)2
19Three-dimensional diffusion(tridimensional shape),Ginstling–Brounstein equation
1.5((1 − α)−0.33 − 1) (1 − 0.66α) − (1 − α)0.66
There are several non-isothermal model-fitting methods that use approximations ofEquation (18). The one used in this work is the Coats and Redfern (CR) method [35](Equation (19)).
lng(α)
T2 = ln(A·Rß·Ea
(1−
(2RTEa
))− Ea
RT(19)
The other is the Kennedy and Clark (KC) method [35] (Equation (20)). In this way,fitting the left side of Equations (19) and (20) to 1/T was used to determine Ea from theslope.
ln(
ß·g(α)T− T0
)= ln(A)− Ea
RT(20)
Another widespread group of methods is isoconversional. These methods are basedon the concept of the reaction model independence from the temperature. Two of modelswere used, the Kissinger–Akahira–Sunose (KAS, Equation (21)) and Flynn–Wall–Ozawa(FWO, Equation (22)) models, which provide ways to calculate the activation energieswithout the knowledge of a certain reaction mechanism [36].
lnßT2 = ln
A·REα·g(α)
− EαR·T (21)
log ß = logA·Ea
R·g(α) − 2.315− 0.4567 (22)
2.3.7. Water Vapor Transmission Rate
The test was carried out according to ASTM E96/E96M—10 [37]. The experimentswere performed using a thermostat (CM 60-150/250-TBX, SM-Climate, Russia) at a tem-perature of (20 ± 1) ◦C and relative humidity of (40 ± 5)%. The water method was used.Firstly, polypropylene containers were filled with distilled water to mark 5 ± 1 mm from
Polymers 2022, 14, 150 8 of 22
the neck. Hydrogel films (with a thickness of 0.12 ± 0.02 mm) were placed on the top ofthe containers with a surface effective area of 63.6 ± 0.05 cm2 and fixed on it. Edges of thefilms were sealed with foil to prevent oxygen transmittance bypass film. In addition, twocontrol probes were made—one tightly closed with a cup and the other fully open. Then,samples were weighed with equipment and exposed in climate chamber with a controlledatmosphere for 24 h. After a defined time interval they were removed from the chamber,weighted and returned again. The water vapor transmission rate was calculated usingEquation (23):
WVTR =G
t·A (23)
where G/t—weight change by time (calculated from the slope of line), g/hour, A—testarea, m2.
2.3.8. Oxygen Permeability
Oxygen content in water samples was analyzed using a modified Winkler’s method [38].Briefly, experiments were established as follows. The flat-bottomed flasks were filled with200 mL of distilled water. The hydrogel films were placed on the top of the flasks with a testarea of 9.6 ± 0.3 cm2 and sealed with foil to prevent oxygen penetration into water media.Two control probes without hydrogel samples (tightly closed and open flask) were usedfor comparison. Bottles were placed under NTP conditions for 24 h. After that all sampleswere removed, and the flasks were tightly closed to prevent further oxygen penetration.Then, using a syringe through a hole in a plug, 0.8 mL of manganese sulphate solution (50%w/w) and 2 mL of potassium iodide solution (15% w/w KI, 85% w/w KOH (10 M)) wasadded to each probe, preventing oxygen gaining from air. The flake-like brown precipitate(Mn(OH)3) appeared immediately.
4 Mn(OH)2 + O2 + 2 H2O→ 4 Mn(OH3)
A total of 3.7 mL of sulphuric acid (50% w/w) was added for elementary iode forming.The precipitate dissolved, and dark red-violet solution was formed.
2 Mn(OH)3 + 6 H+ + 2 I− → 2 Mn2+ + I2 + 6 H2O
Finally, the probe was titrated by sodium thiosulfate solution (0.5% w/w), using starch(0.1% w/w) as an indicator of equivalence point. This was determined by full discolorationof solution.
2 S2O32− + I2 → S4O6
2− + 2 I−
The oxygen content is quantified in terms of mole equivalent to iodine. 10 mL burettewas used graduated every 0.05 mL.
2.3.9. IR Spectroscopy Analysis
Fourier transform infrared (FT-IR) spectroscopy was applied to investigate obtainedmaterials and display the differences of oxidant influence on chemical structures. IRspectras were found via spectrometer (Tensor 37, Bruker, Bremen, Germany) with anATR attachment (diamond crystal, angle of incidence—45◦, sample refractive index—1.4,number of reflections—3) in wavenumbers from 400 to 4000 cm−1 (resolution—2 cm−1,number of scans—1024). Data handling was carried out on Origin software v.9.6 (OriginLab,Northampton, MA, USA).
2.3.10. Statistical Analysis
The results of experiments are displayed as arithmetic average value ± standarddeviation of at least 3 samples used in the experiment. The t-test was used for compar-ing statistical significance of two groups. A value of p < 0.05 is considered statisticallymeaningful.

Polymers 2022, 14, 150 9 of 22
3. Results and Discussion3.1. Performance Properties3.1.1. Sorption Studies
It is well known that hydrogels have a greater swelling capacity in clean water than inbuffer saline [39]. This depends not only on the presence of salt ions in the water, but onthe differences between the pH of various mediums as well. The experimental results showthat the obtained materials follow the rule (Figure 2a).
The highest equivalent swelling values of all solutions were demonstrated whenusing hydrogen peroxide as an oxidizer. This might be an index of oxidizer efficacy inthe formation of more polar and accessible structure for solution molecules. Moreover,there is clear dependence of swelling behavior on factors apart the oxidizer used. Swellingcapacity decreased in the case of alternating the pH level from the neutral level, as well aswhen more salt was added. It was observed only for the samples obtained with hydrogenperoxide, except for DMSO-based hydrogels in acidic pH.
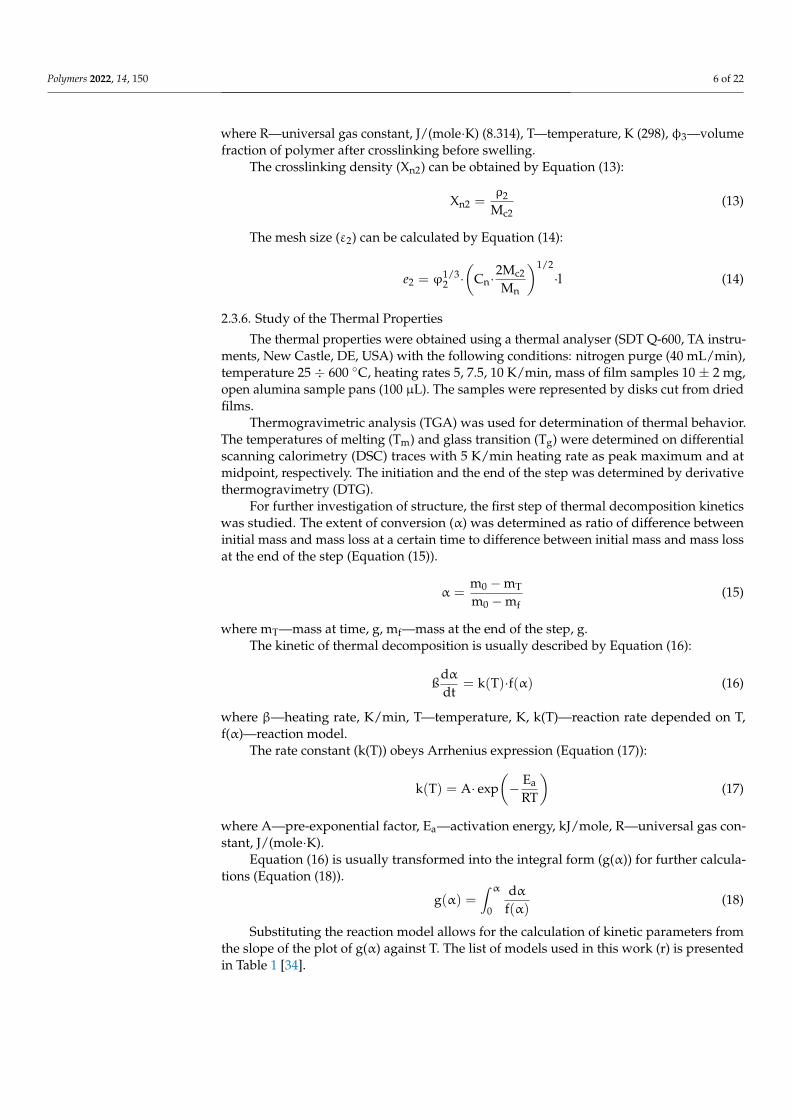
The analysis of sorption behavior in the early stage of swelling demonstrated theadherence of all samples in all mediums to Fick’s law [40] (n = (0.4 ÷ 0.6) ± 0.05). The rateof diffusion is much lower than the rate of relaxation and process controlled by diffusion.Additionally, the velocity of swelling is much less significant for the usage of small particleoxidizers (H2O2, DMSO) than large oxidizers (KMnO4, KIO4) (Figure 2b).
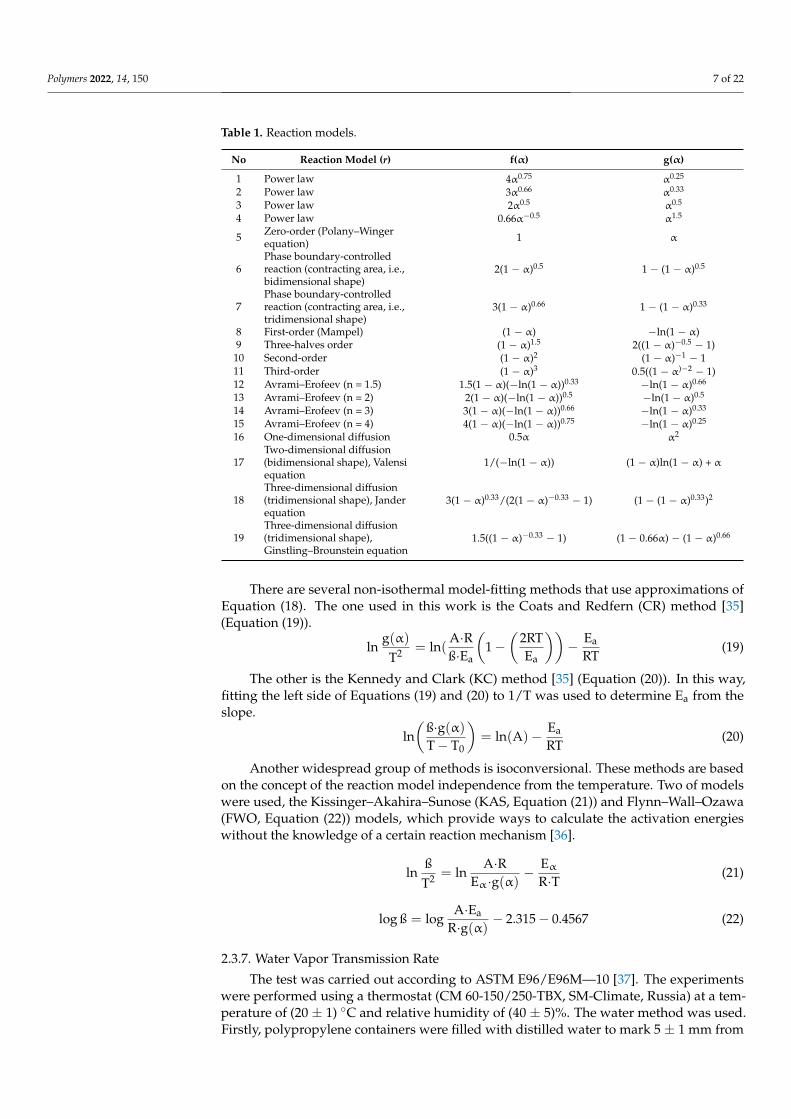
It should be mentioned that materials were more available in acid saline apart fromthe neutral and basic media for analysis in all time intervals (Figure 2c). The same-time,permanganate-based (compared with periodate hydrogels) sorption process slows downthat moment. The gap in the diffusion rate among hydrogels obtained with small oxidizersis much less obvious compared to that of large molecules than in the first considered period.
It seems diffusion limits the relaxation of materials after 72 h, the rapid sorption ofmost formulation changes to prolonged sorption aiming to equilibrize swelling. The mostaccessible for solute penetration hydrogels were in acid pH media, which was approved byconstants of both the pseudosecond order and Fick’s equation. That could be caused bythe folding of gelatin molecules and providing solute easier access to negatively chargedcarboxylic groups [13]. Additionally, also of note is that in first stage of sorption, H-KIO4and H kmnO4 demonstrated far higher velocity.
The previously highlighted behavior of hydrogels and sufficient sorption capacitymight lead to a preference of their usage as pH-dependent materials [40].
Polymers 2022, 14, x FOR PEER REVIEW 9 of 23
number of reflections—3) in wavenumbers from 400 to 4000 cm−1 (resolution—2 cm−1, number of scans—1024). Data handling was carried out on Origin software v.9.6 (OriginLab, Northampton, MA, USA).
2.3.10. Statistical Analysis The results of experiments are displayed as arithmetic average value ± standard de-
viation of at least 3 samples used in the experiment. The t-test was used for comparing statistical significance of two groups. A value of p < 0.05 is considered statistically mean-ingful.
3. Results and Discussion 3.1. Performance Properties 3.1.1. Sorption Studies
It is well known that hydrogels have a greater swelling capacity in clean water than in buffer saline [39]. This depends not only on the presence of salt ions in the water, but on the differences between the pH of various mediums as well. The experimental results show that the obtained materials follow the rule (Figure 2a).
The highest equivalent swelling values of all solutions were demonstrated when us-ing hydrogen peroxide as an oxidizer. This might be an index of oxidizer efficacy in the formation of more polar and accessible structure for solution molecules. Moreover, there is clear dependence of swelling behavior on factors apart the oxidizer used. Swelling ca-pacity decreased in the case of alternating the pH level from the neutral level, as well as when more salt was added. It was observed only for the samples obtained with hydrogen peroxide, except for DMSO-based hydrogels in acidic pH.
The analysis of sorption behavior in the early stage of swelling demonstrated the ad-herence of all samples in all mediums to Fick’s law [40] (n = (0.4 ÷ 0.6) ± 0.05). The rate of diffusion is much lower than the rate of relaxation and process controlled by diffusion. Additionally, the velocity of swelling is much less significant for the usage of small parti-cle oxidizers (H2O2, DMSO) than large oxidizers (KMnO4, KIO4) (Figure 2b).
It should be mentioned that materials were more available in acid saline apart from the neutral and basic media for analysis in all time intervals (Figure 2c). The same-time, permanganate-based (compared with periodate hydrogels) sorption process slows down that moment. The gap in the diffusion rate among hydrogels obtained with small oxidiz-ers is much less obvious compared to that of large molecules than in the first considered period.
Figure 2. Cont.
Polymers 2022, 14, 150 10 of 22Polymers 2022, 14, x FOR PEER REVIEW 10 of 23
Figure 2. Sorption properties of hydrogels depending on medium pH and type of oxidizer: (a) swell-ing degree after 72 h; (b) values of constants in Fick’s law; (c) values of constants in pseudosecond order equation.
It seems diffusion limits the relaxation of materials after 72 h, the rapid sorption of most formulation changes to prolonged sorption aiming to equilibrize swelling. The most accessible for solute penetration hydrogels were in acid pH media, which was approved by constants of both the pseudosecond order and Fick’s equation. That could be caused by the folding of gelatin molecules and providing solute easier access to negatively charged carboxylic groups [13]. Additionally, also of note is that in first stage of sorption, H-KIO4 and H kmnO4 demonstrated far higher velocity.
The previously highlighted behavior of hydrogels and sufficient sorption capacity might lead to a preference of their usage as pH-dependent materials [40].
3.1.2. Water Evaporation Rate The water evaporation rate displays the ability of polymer networks to retain water
and exude it. The similar patterns of dehydration kinetic curves were observed in the case of the usage of various oxidizing systems (Figure 3).
Figure 2. Sorption properties of hydrogels depending on medium pH and type of oxidizer:(a) swelling degree after 72 h; (b) values of constants in Fick’s law; (c) values of constants in pseu-dosecond order equation.
3.1.2. Water Evaporation Rate
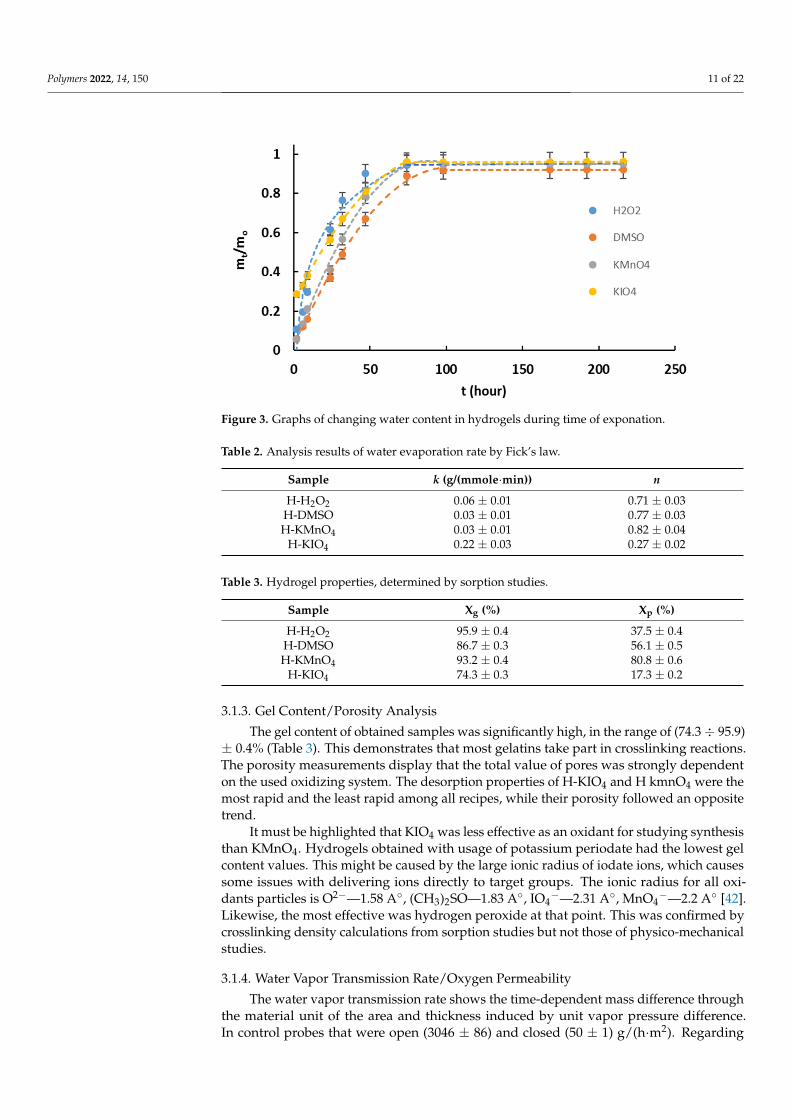
The water evaporation rate displays the ability of polymer networks to retain waterand exude it. The similar patterns of dehydration kinetic curves were observed in the caseof the usage of various oxidizing systems (Figure 3).
Analysis of the first desorption period (≤0.6 mt/mo) showed that H-KIO4 had asignificant mass loss in the first two hours (~30%), causing a major influence on Fick’s lawdegree value (Table 2). The gel content might have an impact on the first desorption period(Table 3), and a similar behavior was demonstrated by H-H2O2. Apart from that othersamples were following an anomalous mechanism of diffusion (n > 0.5), as is characteristicfor other hydrogels [41]. The most available material for water diffusion from the inside ofthe hydrogels was H-H2O2, while the least available was H-DMSO.
Polymers 2022, 14, 150 11 of 22Polymers 2022, 14, x FOR PEER REVIEW 11 of 23
Figure 3. Graphs of changing water content in hydrogels during time of exponation.
Analysis of the first desorption period (≤0.6 mt/mo) showed that H-KIO4 had a signif-icant mass loss in the first two hours (~30%), causing a major influence on Fick’s law de-gree value (Table 2). The gel content might have an impact on the first desorption period (Table 3), and a similar behavior was demonstrated by H-H2O2. Apart from that other samples were following an anomalous mechanism of diffusion (n > 0.5), as is characteristic for other hydrogels [41]. The most available material for water diffusion from the inside of the hydrogels was H-H2O2, while the least available was H-DMSO.
Table 2. Analysis results of water evaporation rate by Fick’s law.
Sample k (g/(mmole·min)) n H-H2O2 0.06 ± 0.01 0.71 ± 0.03
H-DMSO 0.03 ± 0.01 0.77 ± 0.03 H-KMnO4 0.03 ± 0.01 0.82 ± 0.04
H-KIO4 0.22 ± 0.03 0.27 ± 0.02
3.1.3. Gel Content/Porosity Analysis The gel content of obtained samples was significantly high, in the range of (74.3 ÷
95.9) ± 0.4% (Table 3). This demonstrates that most gelatins take part in crosslinking reac-tions. The porosity measurements display that the total value of pores was strongly de-pendent on the used oxidizing system. The desorption properties of H-KIO4 and H kmnO4 were the most rapid and the least rapid among all recipes, while their porosity followed an opposite trend.
Table 3. Hydrogel properties, determined by sorption studies.
Sample Xg (%) Xp (%) H-H2O2 95.9 ± 0.4 37.5 ± 0.4
H-DMSO 86.7 ± 0.3 56.1 ± 0.5 H-KMnO4 93.2 ± 0.4 80.8 ± 0.6
H-KIO4 74.3 ± 0.3 17.3 ± 0.2
It must be highlighted that KIO4 was less effective as an oxidant for studying synthe-sis than KMnO4. Hydrogels obtained with usage of potassium periodate had the lowest gel content values. This might be caused by the large ionic radius of iodate ions, which
Figure 3. Graphs of changing water content in hydrogels during time of exponation.
Table 2. Analysis results of water evaporation rate by Fick’s law.
Sample k (g/(mmole·min)) n
H-H2O2 0.06 ± 0.01 0.71 ± 0.03H-DMSO 0.03 ± 0.01 0.77 ± 0.03H-KMnO4 0.03 ± 0.01 0.82 ± 0.04
H-KIO4 0.22 ± 0.03 0.27 ± 0.02
Table 3. Hydrogel properties, determined by sorption studies.
Sample Xg (%) Xp (%)
H-H2O2 95.9 ± 0.4 37.5 ± 0.4H-DMSO 86.7 ± 0.3 56.1 ± 0.5H-KMnO4 93.2 ± 0.4 80.8 ± 0.6
H-KIO4 74.3 ± 0.3 17.3 ± 0.2
3.1.3. Gel Content/Porosity Analysis
The gel content of obtained samples was significantly high, in the range of (74.3÷ 95.9)± 0.4% (Table 3). This demonstrates that most gelatins take part in crosslinking reactions.The porosity measurements display that the total value of pores was strongly dependenton the used oxidizing system. The desorption properties of H-KIO4 and H kmnO4 were themost rapid and the least rapid among all recipes, while their porosity followed an oppositetrend.
It must be highlighted that KIO4 was less effective as an oxidant for studying synthesisthan KMnO4. Hydrogels obtained with usage of potassium periodate had the lowest gelcontent values. This might be caused by the large ionic radius of iodate ions, which causessome issues with delivering ions directly to target groups. The ionic radius for all oxi-dants particles is O2−—1.58 A◦, (CH3)2SO—1.83 A◦, IO4
−—2.31 A◦, MnO4−—2.2 A◦ [42].
Likewise, the most effective was hydrogen peroxide at that point. This was confirmed bycrosslinking density calculations from sorption studies but not those of physico-mechanicalstudies.
3.1.4. Water Vapor Transmission Rate/Oxygen Permeability
The water vapor transmission rate shows the time-dependent mass difference throughthe material unit of the area and thickness induced by unit vapor pressure difference.In control probes that were open (3046 ± 86) and closed (50 ± 1) g/(h·m2). Regarding

Polymers 2022, 14, 150 12 of 22
water vapor, the most permeable samples were obtained by using hydrogen peroxide asan oxidizer, and the least permeable samples were determined to be those obtained usingpotassium periodate (Table 4).
Table 4. Results of permeability properties of polymer films.
Sample WWTR, (g/(h·m2)) OP (mg/L)
H-H2O2 1848 ± 54 7.82 ± 0.04H-DMSO 1729 ± 50 8.94 ± 0.04H-KMnO4 1793 ± 52 9.29 ± 0.05
H-KIO4 1542 ± 45 8.38 ± 0.05
Oxygen permeability displays the concentration of dissolved oxygen in water. Thecontrol probes results were (7.19 ± 0.03) and (9.68 ± 0.05) mg/L (for closed and openprobes, respectively). This opinion was formed through a comparison of the results. Theoxygen content in water usually ranges from 0 to 15 mg/L [43]. The least permeable washydrogen peroxide, while the most permeable was potassium periodate in synthesizedsamples.
The results correlate with values from other studies proposing wound dressing appli-cation [44,45].
3.1.5. Physico-Mechanical Tests
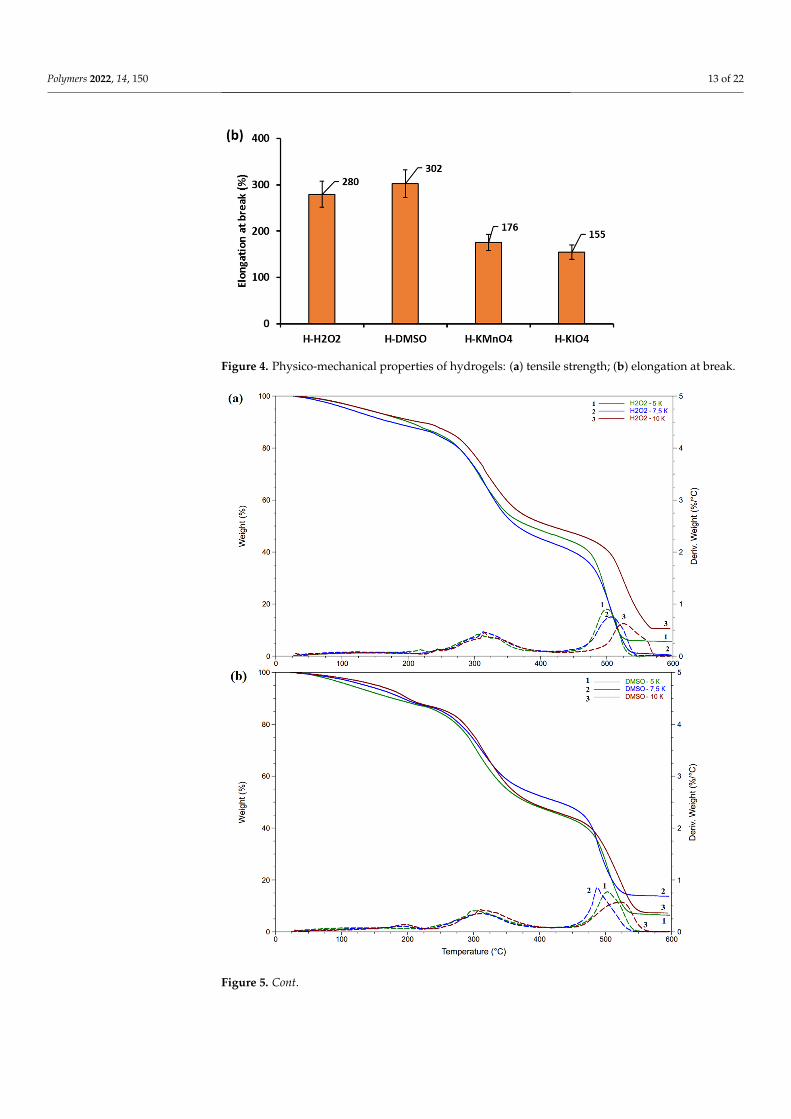
Fully hydrated hydrogels display sufficiently high tensile properties to find appropri-ate application (Figure 4). The tensile strength of the hydrogels was higher for H kmnO4and H-KIO4 than for H-H2O2 and H-DMSO. All of the considered hydrogels display typicalelastomer behavior. The value of elongation at break varied from 150 to 300%, dependingon the oxidizer used. The obtained results show quite similar values for fully hydratedhydrogels [46,47].
3.2. Structure Characterisation3.2.1. Thermal Analysis
The TG and DTG curves obtained for different heating rates are presented in Figure 5.All curves for different heating rates correlated with one type samples and shifted to highertemperatures with a rising heating rate. Three steps can be seen and related to the evapora-tion of bounded water (25 ÷ 250) ◦C—I, degradation of the gelatin (250 ÷ 350) ◦C—II anddecomposition of the residues (450 ÷ 550) ◦C—III, similar to native gelatin [48].
Polymers 2022, 14, x FOR PEER REVIEW 12 of 23
causes some issues with delivering ions directly to target groups. The ionic radius for all oxidants particles is O2−—1.58 A°, (CH3)2SO—1.83 A°, IO4−—2.31 A°, MnO4−—2.2 A° [42]. Likewise, the most effective was hydrogen peroxide at that point. This was confirmed by crosslinking density calculations from sorption studies but not those of physico-mechan-ical studies.
3.1.4. Water Vapor Transmission Rate/Oxygen Permeability The water vapor transmission rate shows the time-dependent mass difference
through the material unit of the area and thickness induced by unit vapor pressure differ-ence. In control probes that were open (3046 ± 86) and closed (50 ± 1) g/(hour·m2). Regard-ing water vapor, the most permeable samples were obtained by using hydrogen peroxide as an oxidizer, and the least permeable samples were determined to be those obtained using potassium periodate (Table 4).
Oxygen permeability displays the concentration of dissolved oxygen in water. The control probes results were (7.19 ± 0.03) and (9.68 ± 0.05) mg/L (for closed and open probes, respectively). This opinion was formed through a comparison of the results. The oxygen content in water usually ranges from 0 to 15 mg/L [43]. The least permeable was hydrogen peroxide, while the most permeable was potassium periodate in synthesized samples.
The results correlate with values from other studies proposing wound dressing ap-plication [44,45].
Table 4. Results of permeability properties of polymer films.
Sample WWTR, (g/(hour·m2)) OP (mg/L) H-H2O2 1848 ± 54 7.82 ± 0.04
H-DMSO 1729 ± 50 8.94 ± 0.04 H-KMnO4 1793 ± 52 9.29 ± 0.05
H-KIO4 1542 ± 45 8.38 ± 0.05
3.1.5. Physico-Mechanical Tests Fully hydrated hydrogels display sufficiently high tensile properties to find appro-
priate application (Figure 4)). The tensile strength of the hydrogels was higher for H kmnO4 and H-KIO4 than for H-H2O2 and H-DMSO. All of the considered hydrogels dis-play typical elastomer behavior. The value of elongation at break varied from 150 to 300%, depending on the oxidizer used. The obtained results show quite similar values for fully hydrated hydrogels [46,47].
Figure 4. Cont.
Polymers 2022, 14, 150 13 of 22Polymers 2022, 14, x FOR PEER REVIEW 13 of 23
.
Figure 4. Physico-mechanical properties of hydrogels: (a) tensile strength; (b) elongation at break.
3.2. Structure Characterisation 3.2.1. Thermal Analysis
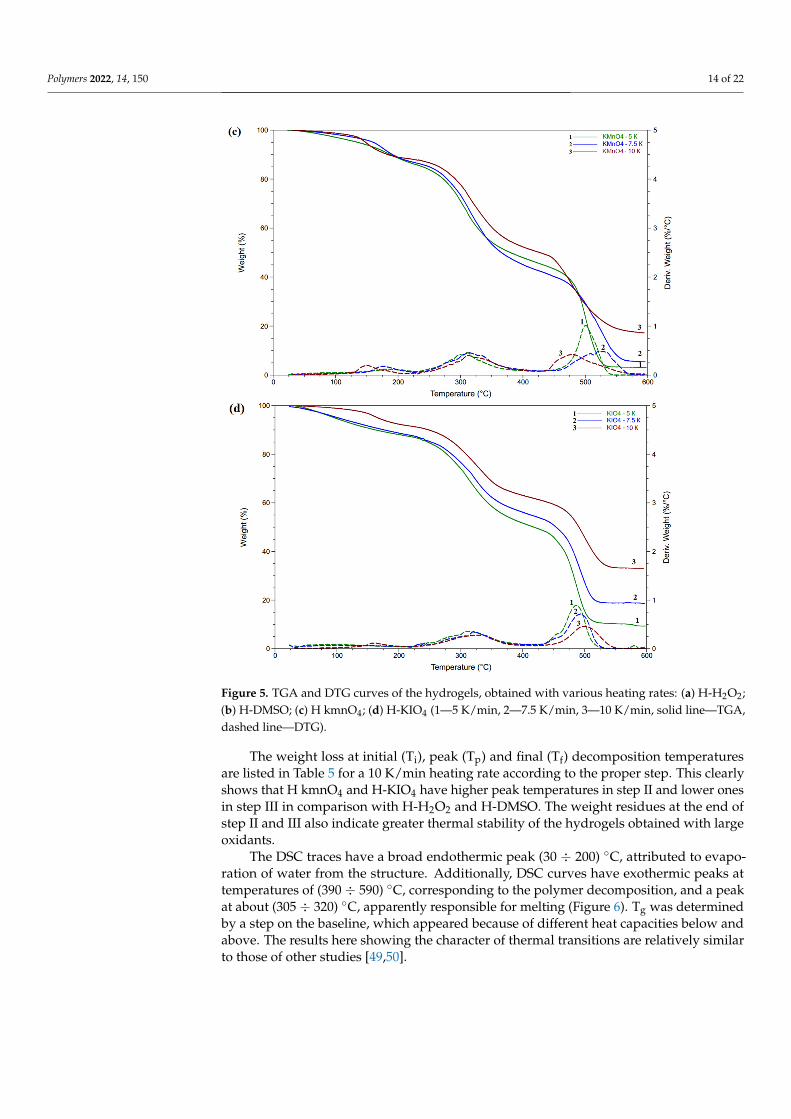
The TG and DTG curves obtained for different heating rates are presented in Figure 5. All curves for different heating rates correlated with one type samples and shifted to higher temperatures with a rising heating rate. Three steps can be seen and related to the evaporation of bounded water (25 ÷ 250) °C—I, degradation of the gelatin (250 ÷ 350) °C—II and decomposition of the residues (450 ÷ 550) °C—III, similar to native gelatin [48].
The weight loss at initial (Ti), peak (Tp) and final (Tf) decomposition temperatures are listed in Table 5 for a 10 K/min heating rate according to the proper step. This clearly shows that H kmnO4 and H-KIO4 have higher peak temperatures in step II and lower ones in step III in comparison with H-H2O2 and H-DMSO. The weight residues at the end of step II and III also indicate greater thermal stability of the hydrogels obtained with large oxidants.
Table 5. TGA results.
Sample Step Ti (°C) Tp (°C) Tf (°C) Weight at Tf
(%)
H-H2O2 I 37 ± 1 133 ± 1 223 ± 1 89.7 ± 0.2 II 227 ± 1 316 ± 1 424 ± 1 48.6 ± 0.1 III 448 ± 1 525 ± 1 579 ± 1 10.6 ± 0.1
H-DMSO I 37 ± 1 197 ± 1 232 ± 1 88.6 ± 0.2 II 240 ± 1 311 ± 1 418 ± 1 47.9 ± 0.1 III 443 ± 1 523 ± 1 578 ± 1 7.3 ± 0.1
H-KMnO4 I 39 ± 1 184 ± 1 232 ± 1 87.1 ± 0.2 II 236 ± 1 325 ± 1 391 ± 1 61.9 ± 0.2 III 396 ± 1 514 ± 1 590 ± 1 36.5 ± 0.1
H-KIO4 I 38 ± 1 159 ± 1 220 ± 1 88.2 ± 0.2 II 225 ± 1 324 ± 1 402 ± 1 63.2 ± 0.2 III 435 ± 1 500 ± 1 566 ± 1 33.2 ± 0.1
Figure 4. Physico-mechanical properties of hydrogels: (a) tensile strength; (b) elongation at break.Polymers 2022, 14, x FOR PEER REVIEW 14 of 23
Figure 5. Cont.
Polymers 2022, 14, 150 14 of 22Polymers 2022, 14, x FOR PEER REVIEW 15 of 23
Figure 5. TGA and DTG curves of the hydrogels, obtained with various heating rates: (a) H-H2O2; (b) H-DMSO; (c) H kmnO4; (d) H-KIO4 (1—5 K/min, 2—7.5 K/min, 3—10 K/min, solid line—TGA, dashed line—DTG).
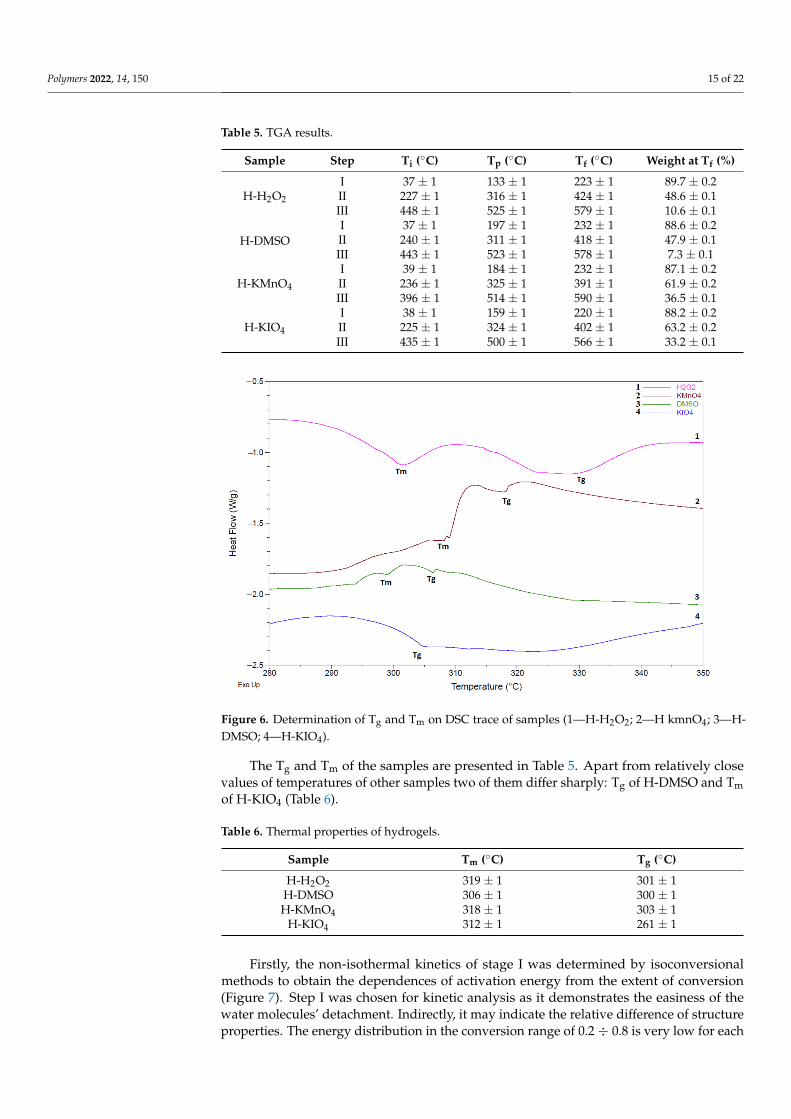
The DSC traces have a broad endothermic peak (30 ÷ 200) °C, attributed to evapora-tion of water from the structure. Additionally, DSC curves have exothermic peaks at tem-peratures of (390 ÷ 590) °C, corresponding to the polymer decomposition, and a peak at about (305 ÷ 320) °C, apparently responsible for melting (Figure 6). Tg was determined by a step on the baseline, which appeared because of different heat capacities below and above. The results here showing the character of thermal transitions are relatively similar to those of other studies [49,50].
Figure 5. TGA and DTG curves of the hydrogels, obtained with various heating rates: (a) H-H2O2;(b) H-DMSO; (c) H kmnO4; (d) H-KIO4 (1—5 K/min, 2—7.5 K/min, 3—10 K/min, solid line—TGA,dashed line—DTG).
The weight loss at initial (Ti), peak (Tp) and final (Tf) decomposition temperaturesare listed in Table 5 for a 10 K/min heating rate according to the proper step. This clearlyshows that H kmnO4 and H-KIO4 have higher peak temperatures in step II and lower onesin step III in comparison with H-H2O2 and H-DMSO. The weight residues at the end ofstep II and III also indicate greater thermal stability of the hydrogels obtained with largeoxidants.
The DSC traces have a broad endothermic peak (30 ÷ 200) ◦C, attributed to evapo-ration of water from the structure. Additionally, DSC curves have exothermic peaks attemperatures of (390 ÷ 590) ◦C, corresponding to the polymer decomposition, and a peakat about (305 ÷ 320) ◦C, apparently responsible for melting (Figure 6). Tg was determinedby a step on the baseline, which appeared because of different heat capacities below andabove. The results here showing the character of thermal transitions are relatively similarto those of other studies [49,50].
Polymers 2022, 14, 150 15 of 22
Table 5. TGA results.
Sample Step Ti (◦C) Tp (◦C) Tf (◦C) Weight at Tf (%)
H-H2O2
I 37 ± 1 133 ± 1 223 ± 1 89.7 ± 0.2II 227 ± 1 316 ± 1 424 ± 1 48.6 ± 0.1III 448 ± 1 525 ± 1 579 ± 1 10.6 ± 0.1
H-DMSOI 37 ± 1 197 ± 1 232 ± 1 88.6 ± 0.2II 240 ± 1 311 ± 1 418 ± 1 47.9 ± 0.1III 443 ± 1 523 ± 1 578 ± 1 7.3 ± 0.1
H-KMnO4
I 39 ± 1 184 ± 1 232 ± 1 87.1 ± 0.2II 236 ± 1 325 ± 1 391 ± 1 61.9 ± 0.2III 396 ± 1 514 ± 1 590 ± 1 36.5 ± 0.1
H-KIO4
I 38 ± 1 159 ± 1 220 ± 1 88.2 ± 0.2II 225 ± 1 324 ± 1 402 ± 1 63.2 ± 0.2III 435 ± 1 500 ± 1 566 ± 1 33.2 ± 0.1
Polymers 2022, 14, x FOR PEER REVIEW 16 of 23
Figure 6. Determination of Tg and Tm on DSC trace of samples (1—H-H2O2; 2—H kmnO4; 3—H-DMSO; 4—H-KIO4).
The Tg and Tm of the samples are presented in Table 5. Apart from relatively close values of temperatures of other samples two of them differ sharply: Tg of H-DMSO and Tm of H-KIO4 (Table 6).
Table 6. Thermal properties of hydrogels.
Sample Tm (°C) Tg (°C) H-H2O2 319 ± 1 301 ± 1
H-DMSO 306 ± 1 300 ± 1 H-KMnO4 318 ± 1 303 ± 1
H-KIO4 312 ± 1 261 ± 1 Firstly, the non-isothermal kinetics of stage I was determined by isoconversional
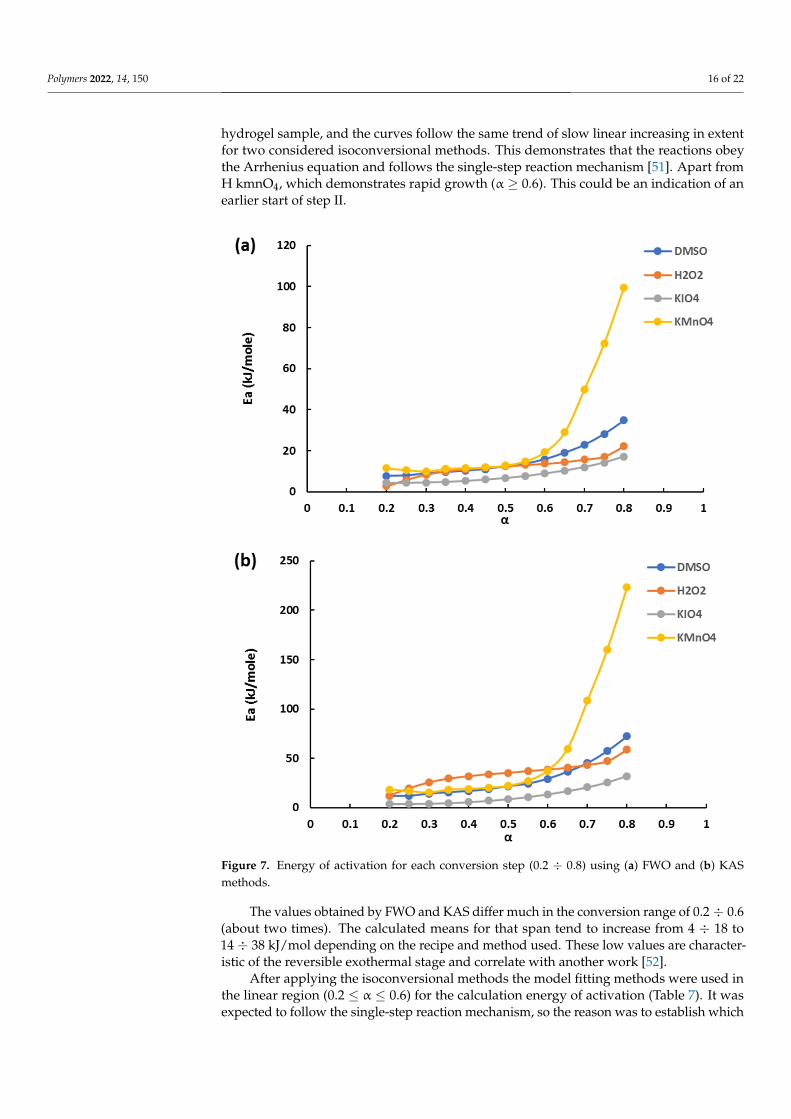
methods to obtain the dependences of activation energy from the extent of conversion (Figure 7). Step I was chosen for kinetic analysis as it demonstrates the easiness of the water molecules’ detachment. Indirectly, it may indicate the relative difference of struc-ture properties. The energy distribution in the conversion range of 0.2 ÷ 0.8 is very low for each hydrogel sample, and the curves follow the same trend of slow linear increasing in extent for two considered isoconversional methods. This demonstrates that the reactions obey the Arrhenius equation and follows the single-step reaction mechanism [51]. Apart from H kmnO4, which demonstrates rapid growth (α ≥ 0.6). This could be an indication of an earlier start of step II.
The values obtained by FWO and KAS differ much in the conversion range of 0.2 ÷ 0.6 (about two times). The calculated means for that span tend to increase from 4 ÷ 18 to 14 ÷ 38 kJ/mol depending on the recipe and method used. These low values are character-istic of the reversible exothermal stage and correlate with another work [52].
Figure 6. Determination of Tg and Tm on DSC trace of samples (1—H-H2O2; 2—H kmnO4; 3—H-DMSO; 4—H-KIO4).
The Tg and Tm of the samples are presented in Table 5. Apart from relatively closevalues of temperatures of other samples two of them differ sharply: Tg of H-DMSO and Tmof H-KIO4 (Table 6).
Table 6. Thermal properties of hydrogels.
Sample Tm (◦C) Tg (◦C)
H-H2O2 319 ± 1 301 ± 1H-DMSO 306 ± 1 300 ± 1H-KMnO4 318 ± 1 303 ± 1
H-KIO4 312 ± 1 261 ± 1
Firstly, the non-isothermal kinetics of stage I was determined by isoconversionalmethods to obtain the dependences of activation energy from the extent of conversion(Figure 7). Step I was chosen for kinetic analysis as it demonstrates the easiness of thewater molecules’ detachment. Indirectly, it may indicate the relative difference of structureproperties. The energy distribution in the conversion range of 0.2 ÷ 0.8 is very low for each
Polymers 2022, 14, 150 16 of 22
hydrogel sample, and the curves follow the same trend of slow linear increasing in extentfor two considered isoconversional methods. This demonstrates that the reactions obeythe Arrhenius equation and follows the single-step reaction mechanism [51]. Apart fromH kmnO4, which demonstrates rapid growth (α ≥ 0.6). This could be an indication of anearlier start of step II.
Polymers 2022, 14, x FOR PEER REVIEW 17 of 23
Figure 7. Energy of activation for each conversion step (0.2 ÷ 0.8) using (a) FWO and (b) KAS meth-ods.
After applying the isoconversional methods the model fitting methods were used in the linear region (0.2 ≤ α ≤ 0.6) for the calculation energy of activation (Table 7). It was expected to follow the single-step reaction mechanism, so the reason was to establish which reaction model (Table 1) gives the best coefficient of correlation. After fitting mod-els to TGA data one model (r) was chosen for each heating rate and recipe.
Table 7. Comparison of activation energy obtained by model-fitting methods.
Heating Rate
(K/min)
Coats-Redfern Method Kennedy-Clark Method
H-H2O2 H-DMSO H-KMnO4 H-
KIO4 H-H2O2 H-
DMSO H-KMnO4 H-
KIO4 r 17 18 18 19 19 7 16 7
5 R2 0.9999 0.9998 1.0000 0.9999 0.9997 0.9998 0.9976 0.9999 Eα 33.1 39.2 34.2 35.4 30.5 24.7 30.5 16.4
Figure 7. Energy of activation for each conversion step (0.2 ÷ 0.8) using (a) FWO and (b) KASmethods.
The values obtained by FWO and KAS differ much in the conversion range of 0.2 ÷ 0.6(about two times). The calculated means for that span tend to increase from 4 ÷ 18 to14 ÷ 38 kJ/mol depending on the recipe and method used. These low values are character-istic of the reversible exothermal stage and correlate with another work [52].
After applying the isoconversional methods the model fitting methods were used inthe linear region (0.2 ≤ α ≤ 0.6) for the calculation energy of activation (Table 7). It wasexpected to follow the single-step reaction mechanism, so the reason was to establish which
Polymers 2022, 14, 150 17 of 22
reaction model (Table 1) gives the best coefficient of correlation. After fitting models toTGA data one model (r) was chosen for each heating rate and recipe.
Table 7. Comparison of activation energy obtained by model-fitting methods.
Heating Rate(K/min)
Coats-Redfern Method Kennedy-Clark Method
H-H2O2 H-DMSO H-KMnO4 H-KIO4 H-H2O2 H-DMSO H-KMnO4 H-KIO4
r 17 18 18 19 19 7 16 75 R2 0.9999 0.9998 1.0000 0.9999 0.9997 0.9998 0.9976 0.9999
Eα 33.1 39.2 34.2 35.4 30.5 24.7 30.5 16.4
r 18 18 18 18 18 16 5 187.5 R2 0.9994 0.9998 0.9997 0.9993 0.9998 0.9997 0.9976 0.9996
Eα 37.6 38.4 40.7 36.8 31.6 28.9 28.1 25.1
r 18 18 18 18 19 16 18 1210 R2 0.9992 0.9994 1.0000 0.9994 0.9986 0.9997 0.9917 0.9981
Eα 41.8 40.6 40.8 45.3 31.9 30.7 32.3 26.7
The values of the average activation energy were in good agreement with thoseobtained by model fitting methods. Only by applying Coats–Redfern method for H-KIO4was significant variation found with Kennedy–Clark and isoconversional methods [36].According to that H-KIO4 had the lowest activation energy for the three calculation methods.With increasing heating rate activation energy also increases. Most of the models appliedfor the CR method were well correlated with three-dimensional diffusion models (18 and19). The values obtained by the CR method were greater than those obtained by the KCmethod [34].
3.2.2. Crosslinking Density
The crosslinking density and mesh size evaluated by the sorption method demonstratenarrow distribution in the case of the usage of different oxidizing systems (Table 8). How-ever, analysis through the rubber elasticity theory clearly shows that the more significantlycrosslinked network was synthesized with more powerful oxidizers, such as potassiumpermanganate and periodate.
Table 8. Comparison of hydrogel crosslinking density obtained by various methods.
SampleSorption Analysis Physico-Mechanical Analysis
Mc1(g/mol)
Xn1·103
(mol/cm3)ε1 (A◦) Mc2
(g/mol)Xn2·103
(mol/cm3)ε2 (A◦)
H-H2O2 66.7 20.24 12.5 226.4 5.96 23.4H-DMSO 67.7 19.95 12.1 197.0 6.85 20.9H-KMnO4 68.5 19.70 11.7 80.0 16.88 12.9
H-KIO4 68.1 19.83 11.9 63.5 21.27 11.7
The differences between crosslinking density values obtained from sorption andphysico-mechanical data can be explained by the limitations of the rubber elasticity theory.The rubber elasticity theory, similarly to the Flory–Rehner theory of polymer networkswelling, used an approach of following narrow Gaussian distribution by polymer network.The hydrogels synthesized with bimodal chain length distribution create a more durablenetwork [53]. Moreover, the rubber elasticity theory must consider factors such as chainlength and flexibility of the network. This strongly affects the values of crosslinking density.The bulky sidechains and chain complexity of a polymer network contributes to entropicchain energy. This provides more deviation from the ideal network model proposed foruniaxial isotropic elasticity [54], while sorption obtained crosslinking density values takes
Polymers 2022, 14, 150 18 of 22
into account for both elastically deformable and nondeformable nature of crosslinkedsegments.
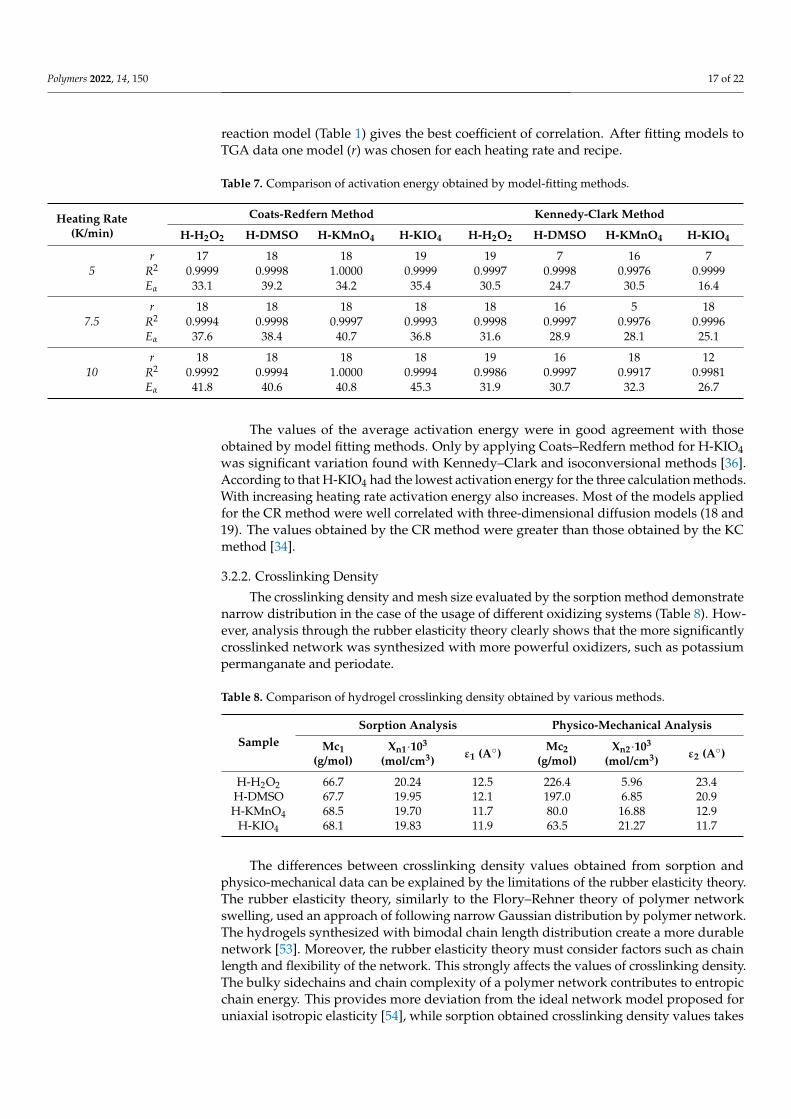
3.2.3. IR Spectroscopy Analysis
Intensive peaks around 1654, 1552 and 1238 cm−1 were attributed to amide I, II andIII exactly, which are widespread in peptides (Figure 8). The high band around 1654 cm−1
corresponds with C=O valent vibration connected with N-H deformation oscillation in anamide group. Amide II is responsible for the deformation oscillation of N–H correlatedwith valent vibrations of C–N. Amide I and II bands of hydrogels have less wavenumbersthan those in native gelatin. This may be the cause of binding tannin and gelatin. Moreover,the spectral band of Schiff’s base matches amide I. Differences of peak position at about1631 cm−1 might be a consequence of the gelatin and tannin reaction by the Schiff baseformation mechanism.
Polymers 2022, 14, x FOR PEER REVIEW 19 of 23
Moreover, the spectral band of Schiff’s base matches amide I. Differences of peak position at about 1631 cm−1 might be a consequence of the gelatin and tannin reaction by the Schiff base formation mechanism.
The bands of carbon bonds (–CH3 and –CH2) with 2922 and 2855 cm−1 wavenumbers have more intensity in hydrogels than in native gelatin. The same trend is observed for carboxylic groups at around 1740 cm−1.
The intensity of the absorption band around 1450 cm−1 shows an increase with the crosslinking of hydrogels in addition to the above-mentioned peaks. This band is associ-ated with CH=N group vibrations [55]. The alteration of color also follows the same ten-dency. This occurs due to brighter native gelatin and hydrogels obtained with the usage of DMSO and H2O2 and darker hydrogels obtained by using KMnO4 and KIO4.
Increasing intensity of absorption near 1027 cm−1 (C–OH) indicates the existence of tannin in hydrogels. The formation of new peaks around 928 and 865 cm−1 illustrate the presence of –CH from tannin benzene rings in crosslinked hydrogels. This might be caused by the establishment of new bonds between gelatin amino groups and tannin mol-ecules [12].
Another argument for the amino groups’ reaction with tannin is wavenumber shift of amid A band from 3320 (for native gelatin) to 3290 cm−1 (for crosslinked hydrogels).
Figure 8. IR spectras of hydrogels, obtained by using 1—DMSO, 2—KIO4, 3—KMnO4, 4—H2O2, and spectras of 5—native gelatin and 6—tannin.
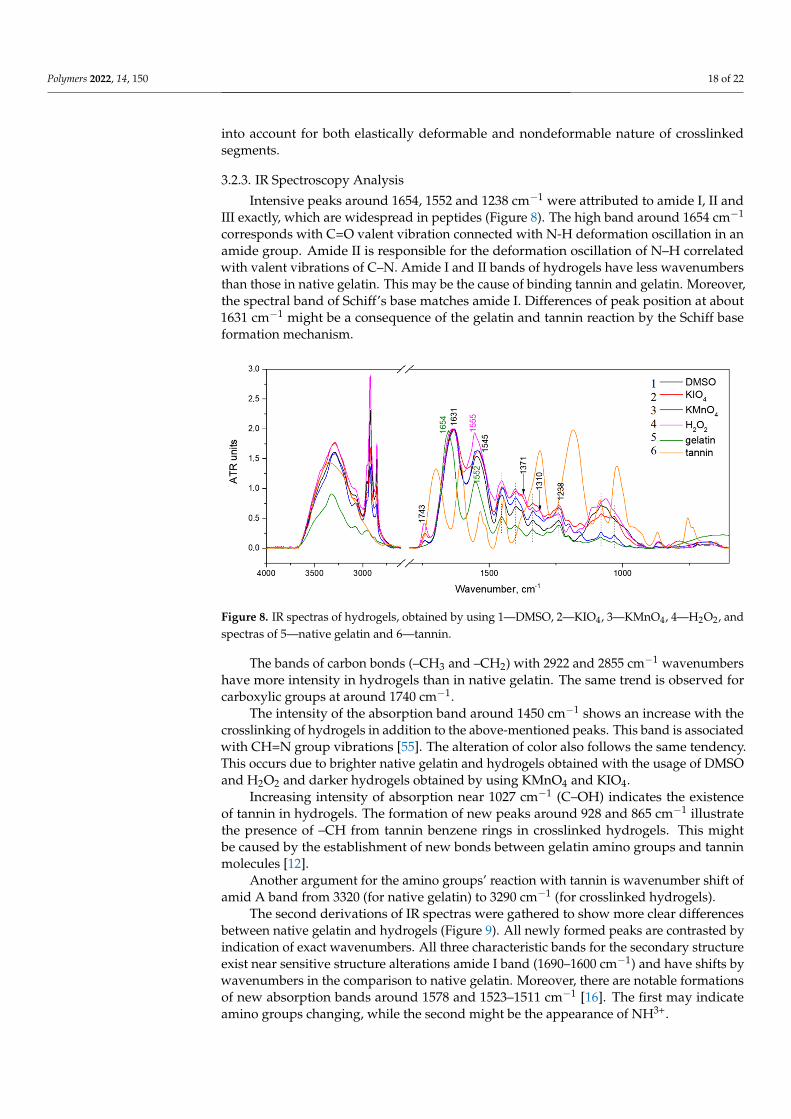
The second derivations of IR spectras were gathered to show more clear differences between native gelatin and hydrogels (Figure 9). All newly formed peaks are contrasted by indication of exact wavenumbers. All three characteristic bands for the secondary structure exist near sensitive structure alterations amide I band (1690–1600 cm−1) and have shifts by wavenumbers in the comparison to native gelatin. Moreover, there are notable formations of new absorption bands around 1578 and 1523–1511 cm−1 [16]. The first may indicate amino groups changing, while the second might be the appearance of NH3+.
Figure 8. IR spectras of hydrogels, obtained by using 1—DMSO, 2—KIO4, 3—KMnO4, 4—H2O2, andspectras of 5—native gelatin and 6—tannin.
The bands of carbon bonds (–CH3 and –CH2) with 2922 and 2855 cm−1 wavenumbershave more intensity in hydrogels than in native gelatin. The same trend is observed forcarboxylic groups at around 1740 cm−1.
The intensity of the absorption band around 1450 cm−1 shows an increase with thecrosslinking of hydrogels in addition to the above-mentioned peaks. This band is associatedwith CH=N group vibrations [55]. The alteration of color also follows the same tendency.This occurs due to brighter native gelatin and hydrogels obtained with the usage of DMSOand H2O2 and darker hydrogels obtained by using KMnO4 and KIO4.
Increasing intensity of absorption near 1027 cm−1 (C–OH) indicates the existenceof tannin in hydrogels. The formation of new peaks around 928 and 865 cm−1 illustratethe presence of –CH from tannin benzene rings in crosslinked hydrogels. This mightbe caused by the establishment of new bonds between gelatin amino groups and tanninmolecules [12].
Another argument for the amino groups’ reaction with tannin is wavenumber shift ofamid A band from 3320 (for native gelatin) to 3290 cm−1 (for crosslinked hydrogels).
The second derivations of IR spectras were gathered to show more clear differencesbetween native gelatin and hydrogels (Figure 9). All newly formed peaks are contrasted byindication of exact wavenumbers. All three characteristic bands for the secondary structureexist near sensitive structure alterations amide I band (1690–1600 cm−1) and have shifts bywavenumbers in the comparison to native gelatin. Moreover, there are notable formationsof new absorption bands around 1578 and 1523–1511 cm−1 [16]. The first may indicateamino groups changing, while the second might be the appearance of NH3+.
Polymers 2022, 14, 150 19 of 22Polymers 2022, 14, x FOR PEER REVIEW 20 of 23
Figure 9. Second derivations of IR spectras: (a) 1800 ÷ 1350 cm−1, (b) 1400 ÷ 900 cm−1; 1—gelatin and hydrogels obtained by usage different oxidizers: 2—DMSO, 3—KIO4, 4—KMnO4, 5—H2O2 and 6 –tannin.
The occurrence of new bands around 1467, 1377 and 1366 cm−1 (typical for defor-mation vibrations of C–H groups) might be caused by a benzene ring embedding in the hydrogel structure. The bands near 1027 and 990 cm−1 demonstrate the inclusion of tannin in the hydrogel structure [21].
4. Conclusions The usage of the oxidizing systems for synthesizing gelatin–tannin hydrogels was
performed. The study shows the possibility of using hydrogen peroxide, dimethylsulfox-ide, potassium permanganate and periodate in that role. The influence of oxidants on functional and structure properties was significant. The forming of hydrogel structures was confirmed by IR-spectroscopy. The hydrogels have water/oxygen permeability and fine mechanical properties appropriate for wound dressing application. The crosslinking density of materials supports the stiffness of hydrogels, obtained by using small oxidants (H-H2O2, H-DMSO). Thermal properties and decomposition represent that the variation of structure changes with the type of oxidizing system. Kinetic of water residues evapo-ration clearly shows that materials allow free diffusion of water molecules in all dimen-sions. The pH-dependent behavior in acid media make them suitable for drug delivery application. The most perspective oxidizing system was that based on hydrogen peroxide regarding the functional properties of obtained materials. These materials are still under investigation for synthesizing scaffolds in order to discover future useful medicine appli-cations.
Figure 9. Second derivations of IR spectras: (a) 1800 ÷ 1350 cm−1, (b) 1400 ÷ 900 cm−1; 1—gelatinand hydrogels obtained by usage different oxidizers: 2—DMSO, 3—KIO4, 4—KMnO4, 5—H2O2 and6 –tannin.
The occurrence of new bands around 1467, 1377 and 1366 cm−1 (typical for defor-mation vibrations of C–H groups) might be caused by a benzene ring embedding in thehydrogel structure. The bands near 1027 and 990 cm−1 demonstrate the inclusion of tanninin the hydrogel structure [21].
4. Conclusions
The usage of the oxidizing systems for synthesizing gelatin–tannin hydrogels wasperformed. The study shows the possibility of using hydrogen peroxide, dimethylsulfox-ide, potassium permanganate and periodate in that role. The influence of oxidants onfunctional and structure properties was significant. The forming of hydrogel structureswas confirmed by IR-spectroscopy. The hydrogels have water/oxygen permeability andfine mechanical properties appropriate for wound dressing application. The crosslinkingdensity of materials supports the stiffness of hydrogels, obtained by using small oxidants(H-H2O2, H-DMSO). Thermal properties and decomposition represent that the variation ofstructure changes with the type of oxidizing system. Kinetic of water residues evaporationclearly shows that materials allow free diffusion of water molecules in all dimensions. ThepH-dependent behavior in acid media make them suitable for drug delivery application.The most perspective oxidizing system was that based on hydrogen peroxide regarding thefunctional properties of obtained materials. These materials are still under investigation forsynthesizing scaffolds in order to discover future useful medicine applications.
Polymers 2022, 14, 150 20 of 22
Author Contributions: Conceptualization, K.O. and M.U.; methodology, K.O.; software, K.O. andV.S.; validation, K.O. and V.S.; formal analysis, M.U.; investigation, K.O. and V.S.; resources, K.O.;writing—original draft preparation, K.O.; writing—review and editing, M.U.; visualization, K.O.;supervision, M.U.; project administration, M.U.; funding acquisition, K.O. and M.U. All authors haveread and agreed to the published version of the manuscript.
Funding: The work was carried out with the support of the Ministry of Science and Higher Educationof the Russian Federation (agreement No 075-15-2021-1349).
Institutional Review Board Statement: Not applicable.
Informed Consent Statement: Not applicable.
Data Availability Statement: The authors confirm that the data supporting the findings of this studyare available within the article.
Conflicts of Interest: The authors declare no conflict of interest.
References1. Park, S.-B.; Lih, E.; Park, K.S.; Joung, Y.K.; Han, D.K. Biopolymer-based functional composites for medical applications. Prog.
Polym. Sci. 2017, 68, 77–105. [CrossRef]2. Buwalda, S.J.; Vermonden, T.; Hennink, W.E. Hydrogels for Therapeutic Delivery: Current Developments and Future Directions.
Biomacromolecules 2017, 18, 316–330. [CrossRef]3. Mogosanu, G.D.; Grumezescu, A.M. Natural and synthetic polymers for wounds and burns dressing. Int. J. Pharm. 2014, 463,
127–136. [CrossRef] [PubMed]4. Sun, G.; Shen, Y.I.; Harmon, J.W. Engineering Pro-Regenerative Hydrogels for Scarless Wound Healing. Adv. Healthc. Mater. 2018,
7, 1800016. [CrossRef] [PubMed]5. Uspenskaya, M.V. Swelling of hydrogels formed by copolymers of acrylic and 3-chloro-1,3-butadien-2-phosphinic acids. Russ. J.
Appl. Chem. 1998, 3, 521–529.6. Ajovalasit, A.; Sabatino, M.A.; Todaro, S.; Alessi, S.; Giacomazza, D.; Picone, P.; Di Carlo, M.; Dispenza, C. Xyloglucan-based
hydrogel films for wound dressing: Structure-property relationships. Carbohydr. Polym. 2018, 179, 262–272. [CrossRef]7. Wang, L.; Stegemann, J.P. Glyoxal crosslinking of cell-seeded chitosan/collagen hydrogels for bone regeneration. Acta Biomater.
2011, 7, 2410–2417. [CrossRef]8. Song, F.; Zhang, L.M.; Yang, C.; Yan, L. Genipin-crosslinked casein hydrogels for controlled drug delivery. Int. J. Pharm. 2009, 373,
41–47. [CrossRef]9. Boonkaew, B.; Suwanpreuksa, P.; Cuttle, L.; Barber, P.M.; Supaphol, P. Hydrogels containing silver nanoparticles for burn wounds
show antimicrobial activity without cytotoxicity. J. Appl. Polym. Sci. 2014, 131, 1–10. [CrossRef]10. Yesilyurt, V.; Ayoob, A.M.; Appel, E.A.; Borenstein, J.T.; Langer, R.; Anderson, D.G. Mixed Reversible Covalent Crosslink Kinetics
Enable Precise, Hierarchical Mechanical Tuning of Hydrogel Networks. Adv. Mater. 2017, 29, 1605947. [CrossRef]11. Ma, M.; Zhong, Y.; Jiang, X. Thermosensitive and pH-responsive tannin-containing hydroxypropyl chitin hydrogel with long-
lasting antibacterial activity for wound healing. Carbohydr. Polym. 2020, 236, 116096. [CrossRef]12. Sahiner, N.; Sagbas, S.; Sahiner, M.; Silan, C.; Aktas, N.; Turk, M. Biocompatible and biodegradable poly(Tannic Acid) hydrogel
with antimicrobial and antioxidant properties. Int. J. Biol. Macromol. 2016, 82, 150–159. [CrossRef]13. Sorushanova, A.; Delgado, L.M.; Wu, Z.; Shologu, N.; Kshirsagar, A.; Raghunath, R.; Mullen, A.M.; Bayon, Y.; Pandit, A.;
Raghunath, M.; et al. The Collagen Suprafamily: From Biosynthesis to Advanced Biomaterial Development. Adv. Mater. 2019, 31,1801651. [CrossRef] [PubMed]
14. Adamczyk, B.; Simon, J.; Kitunen, V.; Adamczyk, S.; Smolander, A. Tannins and Their Complex Interaction with Different OrganicNitrogen Compounds and Enzymes: Old Paradigms versus Recent Advances. ChemistryOpen 2017, 6, 610–614. [CrossRef]
15. Sudalai, A.; Khenkin, A.; Neumann, R. Sodium periodate mediated oxidative transformations in organic synthesis. Org. Biomol.Chem. 2015, 13, 4374–4394. [CrossRef]
16. Poncet-Legrand, C.; Cabane, B.; Bautista-Ortín, A.B.; Carrillo, S.; Fulcrand, H.; Pérez, J.; Vernhet, A. Tannin oxidation: Intra-versusintermolecular reactions. Biomacromolecules 2010, 11, 2376–2386. [CrossRef]
17. Chen, C.; Geng, X.W.; Pan, Y.H.; Ma, Y.N.; Ma, Y.X.; Gao, S.Z.; Huang, X.J. Synthesis and characterization of tannic acid-PEGhydrogel: Via Mitsunobu polymerization. RSC Adv. 2020, 10, 1724–1732. [CrossRef]
18. Bai, Z.; Wang, T.; Zheng, X.; Huang, Y.; Chen, Y.; Dan, W. High strength and bioactivity polyvinyl alcohol/collagen compositehydrogel with tannic acid as cross-linker. Polym. Eng. Sci. 2021, 61, 278–287. [CrossRef]
19. Szymanska, E.; Orłowski, P.; Winnicka, K.; Tomaszewska, E.; Baska, P.; Celichowski, G.; Grobełny, J.; Basa, A.; Krzyzowska, M.Multifunctional tannic acid/silver nanoparticle-based mucoadhesive hydrogel for improved local treatment of HSV infection:In vitro and in vivo studies. Int. J. Mol. Sci. 2018, 19, 387. [CrossRef] [PubMed]
20. Dryhurst, G.; Periodate Oxidation of Diol and Other Functional Groups. Analytical and Structural Applications; Pergamon: Oxford,UK, 1970; p. 196. [CrossRef]
Polymers 2022, 14, 150 21 of 22
21. Zhao, Q.; Mu, S.; Long, Y.; Zhou, J.; Chen, W.; Astruc, D.; Gaidau, C.; Gu, H. Tannin-Tethered Gelatin Hydrogels with ConsiderableSelf-Healing and Adhesive Performances. Macromol. Mater. Eng. 2019, 304, 1800664. [CrossRef]
22. John, A.D. Lange’s Handbook of Chemistry, 15th ed.; McGraw-Hill: New York, NY, USA, 1999; p. 1291.23. Ahmed, J.; Rahman, M.S.; Roos, Y.H. Glass Transition and Phase Transitions in Food; Wiley-Blackwell: Hoboken, NJ, USA, 2017;
p. 470.24. Plazinski, W.; Rudzinski, W.; Plazinska, A. Theoretical models of sorption kinetics including a surface reaction mechanism: A
review. Adv. Colloid Interface Sci. 2009, 152, 2–13. [CrossRef] [PubMed]25. Borges, F.T.P.; Papavasiliou, G.; Teymour, F. Characterizing the Molecular Architecture of Hydrogels and Crosslinked Polymer
Networks beyond Flory-Rehner-I. Theory. Biomacromolecules 2020, 21, 5104–5118. [CrossRef]26. James, E.M. Polymer Data Handbook, 3rd ed.; Oxford Press: Oxford, UK, 1998; p. 1102.27. Bohidar, H.B. Hydrodynamic properties of gelatin in dilute solutions. Int. J. Biol. Macromol. 1998, 23, 1–6. [CrossRef]28. Brandrup, J.; Immergut, E.H.; Grulke, E.A. Polymer Handbook, 4th ed.; A Wiley-Interscience Publication: Hoboken, NJ, USA, 1999;
p. 2336.29. Kumbar, S.G.; Laurencin, C.T.; Deng, M. Natural and Synthetic Biomedical Polymers, 1st ed.; Elsevier: Amsterdam, The Netherlands,
2014; p. 402.30. Ma, S.; Natoli, M.; Liu, X.; Neubauer, M.P.; Watt, F.M.; Fery, A.; Huck, W.T.S. Monodisperse collagen-gelatin beads as potential
platforms for 3D cell culturing. J. Mater. Chem. B 2013, 38, 5128–5136. [CrossRef]31. Yom-Tov, O.; Neufeld, L.; Seliktar, D.; Bianco-Peled, H. A novel design of injectable porous hydrogels with in situ pore formation.
Acta Biomater. 2014, 10, 4236–4246. [CrossRef] [PubMed]32. National Center for Biotechnology Information. PubChem Compound Summary for CID 702, Ethanol. Available online:
https://pubchem.ncbi.nlm.nih.gov/compound/Ethanol (accessed on 9 September 2021).33. Hayrabolulu, H.; Demeter, M.; Cutrubinis, M.; Sen, M. Radiation synthesis and characterization of xanthan gum hydrogels.
Radiat. Phys. Chem. 2021, 188, 109613. [CrossRef]34. Vyazovkin, S.; Burnham, A.K.; Criado, J.M.; Pérez-Maqueda, L.A.; Popescu, C.; Sbirrazzuoli, N. ICTAC Kinetics Committee
recommendations for performing kinetic computations on thermal analysis data. Thermochim. Acta 2011, 520, 1–19. [CrossRef]35. Jankovic, B.; Adnadevic, B.; Jovanovic, J. Non-isothermal kinetics of dehydration of equilibrium swollen poly(acrylic acid)
hydrogel. J. Therm. Anal. Calorim. 2005, 82, 7–13. [CrossRef]36. Jankovic, B.; Adnadevic, B.; Jovanovic, J. Application of model-fitting and model-free kinetics to the study of non-isothermal
dehydration of equilibrium swollen poly (acrylic acid) hydrogel: Thermogravimetric analysis. Thermochim. Acta 2007, 452,106–115. [CrossRef]
37. ASTM E96/E96M-16; Standard Test Methods for Water Vapor Transmission of Materials; ASTM International: West Conshohocken,PA, USA, 2016.
38. Singh, B.; Pal, L. Sterculia crosslinked PVA and PVA-poly (AAm) hydrogel wound dressings for slow drug delivery: Mechanical,mucoadhesive, biocompatible and permeability properties. J. Mech. Behav. Biomed. Mater. 2012, 9, 9–21. [CrossRef] [PubMed]
39. Okay, O. General Properties of Hydrogels; Springer: Berlin/Heidelberg, Germany, 2009; pp. 1–14. [CrossRef]40. Karoyo, A.H.; Wilson, L.D. A review on the design and hydration properties of natural polymer-based hydrogels. Materials 2021,
14, 1095. [CrossRef] [PubMed]41. Sirousazar, M.; Kokabi, M.; Hassan, Z.M.; Bahramian, A.R. Dehydration kinetics of polyvinyl alcohol nanocomposite hydrogels
containing Na-montmorillonite nanoclay. Sci. Iran. 2011, 18, 780–784. [CrossRef]42. Simoes, M.C.; Hughes, K.J.; Ingham, D.B.; Ma, L.; Pourkashanian, M. Estimation of the Thermochemical Radii and Ionic Volumes
of Complex Ions. Inorg. Chem. 2017, 56, 7566–7573. [CrossRef]43. Kaiho, K. Benthic foraminiferal dissolved-oxygen index and dissolved-oxygen levels in the modern ocean. Geology 1994, 22,
719–722. [CrossRef]44. Zhang, D.; Zhou, W.; Wei, B.; Wang, X.; Tang, R.; Nie, J.; Wang, J. Carboxyl-modified poly(vinyl alcohol)-crosslinked chitosan
hydrogel films for potential wound dressing. Carbohydr. Polym. 2015, 125, 189–199. [CrossRef] [PubMed]45. Jiang, Q.; Zhou, W.; Wang, J.; Tang, R.; Zhang, D.; Wang, X. Hypromellose succinate-crosslinked chitosan hydrogel films for
potential wound dressing. Int. J. Biol. Macromol. 2016, 91, 85–91. [CrossRef]46. Han, L.; Liu, K.; Wang, M.; Wang, K.; Fang, L.; Chen, H.; Zhou, J.; Lu, X. Mussel-Inspired Adhesive and Conductive Hydrogel
with Long-Lasting Moisture and Extreme Temperature Tolerance. Adv. Funct. Mater. 2018, 28, 170419. [CrossRef]47. Song, M.; Yu, H.; Zhu, J.; Ouyang, Z.; Abdalkarim, S.Y.H.; Tam, K.C.; Li, Y. Constructing stimuli-free self-healing, robust and
ultrasensitive biocompatible hydrogel sensors with conductive cellulose nanocrystals. Chem. Eng. J. 2020, 398, 125547. [CrossRef]48. López-Angulo, D.; Bittante, A.M.Q.B.; Luciano, C.G.; Ayala-Valencia, G.; Flaker, C.H.C.; Djabourov, M.; José do Amaral Sobral, P.
Effect of Laponite® on the structure, thermal stability and barrier properties of nanocomposite gelatin films. Food Biosci. 2020, 35,100596. [CrossRef]
49. Fakirov, S.; Sarac, Z.; Anbar, T.; Boz, B.; Bahar, I.; Evstatiev, M.; Apostolov, A.A.; Mark, J.E.; Kloczkowski, A. Mechanical propertiesand transition temperatures of crosslinked-oriented gelatin. Colloid Polym. Sci. 1997, 275, 307–314. [CrossRef]
50. Peña, C.; de la Caba, K.; Eceiza, A.; Ruseckaite, R.; Mondragon, I. Enhancing water repellence and mechanical properties ofgelatin films by tannin addition. Bioresour. Technol. 2010, 101, 6836–6842. [CrossRef] [PubMed]

Polymers 2022, 14, 150 22 of 22
51. Stankovic, B.; Jovanovic, J.; Ostojic, S.; Adnadjevic, B. Kinetic analysis of non-isothermal dehydration of poly(acrylic acid)-g-gelatin hydrogel using distributed activation energy model. J. Therm. Anal. Calorim. 2017, 129, 541–551. [CrossRef]
52. Potkonjak, B.; Jovanovic, J.; Stankovic, B.; Ostojic, S.; Adnadjevic, B. Comparative analyses on isothermal kinetics of waterevaporation and hydrogel dehydration by a novel nucleation kinetics model. Chem. Eng. Res. Des. 2015, 100, 323–330. [CrossRef]
53. Richbourg, N.R.; Peppas, N.A. The swollen polymer network hypothesis: Quantitative models of hydrogel swelling, stiffness,and solute transport. Prog. Polym. Sci. 2020, 105, 101243. [CrossRef]
54. Oyen, M.L. Mechanical characterisation of hydrogel materials. Int. Mater. Rev. 2014, 59, 44–59. [CrossRef]55. Vahedi, M.; Barzin, J.; Shokrolahi, F.; Shokrollahi, P. Self-Healing, Injectable Gelatin Hydrogels Cross-Linked by Dynamic Schiff
Base Linkages Support Cell Adhesion and Sustained Release of Antibacterial Drugs. Macromol. Mater. Eng. 2018, 303, 1800200.[CrossRef]
Copyright © 2022 FDOKUMEN