Directed endothelial cell morphogenesis in micropatterned gelatin methacrylate hydrogels

This article appeared in a journal published by Elsevier. The attachedcopy is furnished to the author for internal non-commercial researchand education use, including for instruction at the authors institution
and sharing with colleagues.
Other uses, including reproduction and distribution, or selling orlicensing copies, or posting to personal, institutional or third party
websites are prohibited.
In most cases authors are permitted to post their version of thearticle (e.g. in Word or Tex form) to their personal website orinstitutional repository. Authors requiring further information
regarding Elsevier’s archiving and manuscript policies areencouraged to visit:
http://www.elsevier.com/authorsrights
Author's personal copy
Smart porous microparticles based on gelatin/sodium alginatepolyelectrolyte complex
Nirmala Devi ⇑, Dilip Kumar KakatiDepartment of Chemistry, Gauhati University, Guwahati 781 014, India
a r t i c l e i n f o
Article history:Received 23 November 2012Received in revised form 7 February 2013Accepted 10 February 2013Available online 26 February 2013
Keywords:BiopolymersCrosslinkingElectron microscopyMicroparticlesSwelling
a b s t r a c t
Porous microparticles of different sizes were prepared by polyelectrolyte complexation of biopolymersgelatine A and sodium alginate for microencapsulation of food bioactives. The optimum pH and ratiobetween the polymers sodium alginate and gelatine for maximum complexation was found as 3.7 and1:3.5 respectively. Effect of various factors like amount of surfactant, concentration of polymer and cross-linker on the formation, size and porous/nonporous nature of the microparticles were investigated. Theparticles’ diameter on swelling at pH = 7.4 was twice that at pH = 1.2 indicating the pH responsiveness.These microparticles were used as carrier for ascorbic acid. The surface morphology and sizes of themicroparticles were investigated by scanning electron microscope (SEM). Fourier transform infraredspectroscopy (FTIR) study indicated the formation of polyelectrolyte complex between gelatine andsodium alginate and successful encapsulation of ascorbic acid into the microparticles. The microparticleswere further characterized by thermogravimetric analysis (TGA), differential scanning calorimetry (DSC)and X-ray diffraction (XRD) study.
� 2013 Elsevier Ltd. All rights reserved.
1. Introduction
Microencapsulation technology as a prominent multidisciplinaryarea has its wide impact in many fields including pharmaceutical,agriculture, biotechnology, cosmetic, food and flavour industry.Thereby, the dimensions cover the range from millimetres to submi-crometer scale, and the functionality ranges from simple storagedevices to intelligent systems responding reproducibly to the envi-ronment (Mahou and Wandrey, 2010). Microencapsulation allowssensitive ingredients to be physically enveloped in a protectivematrix or wall material in order to protect the ingredients or corematerials from adverse reactions, loss or against light, heat and pro-longed contact with air (Duclairoir et al., 2002). Wall materials mustretain and protect the encapsulated core material from loss andchemical damage during manufacture, storage, handling and mustsubsequently release them into the final product during its manu-facture or consumption (Kim et al., 2006). This technology has beenextensively adopted for the practical applications for encapsulationof drugs, fertilizers, pesticides, repellents, vitamins, enzymes, fra-grances, food and flavour (Devi and Maji, 2009a, 2010; Heris et al.,2012; Vaida et al., 2010), etc. The use of microparticles for eitherin the form of microsphere or microcapsules for controlled releaseof food bioactives such as vitamins, probiotics, bioactive peptidesand antioxidants is a prospective field of interest in food, and some
attempts have been made to fabricate microparticles for such appli-cation (Lee et al., 2009). For instance, Prasertmanakit et al. preparedethyl cellulose microcapsules for protecting and controlled releaseof folic acid in foods and supplements (Prasertmanakit et al.,2009). Microencapsulation of haemoglobin in chitosan coated algi-nate microspheres was carried out to control the release of haemo-globin (Silva et al., 2006). Gliadin naoparticles were prepared andreported as suitable a-Tocopherol or Vitamin E drug release carrier(Duclairoir et al., 2002).
Ascorbic acid is a water-soluble vitamin, which is regarded as avitamin supplement to reinforce dietary intake of vitamin C. Vita-min C is one of the most important antioxidants that may reducethe risk of cancer using various mechanisms (Esposito et al.,2002; Jacobs et al., 2001). However, environmental factors, suchas temperature, pH value, oxygen, metal ion, UV and X-ray affectthe stability of ascorbic acid (Alishahi et al., 2011; Kirby et al.,1991; Liao and Seib, 1988; Uddin et al., 2001). Moreover, acidscan cause problems in conjunction with other food ingredients,such as decrease in flavour, undesirable odours and prematurechanges in pH (Trindade and Grosso, 2000). Microencapsulationtechnique has recently been utilized to reduce these problems(Desai and Park, 2005; Desai et al., 2006).
One of the most promising approaches to create food-grademicroparticles is to use biopolymers, such as proteins and polysac-charides, as building blocks. Gelatin is biocompatible, biodegrad-able, edible and soluble at the body temperature and therefore it isan ideal material for food and pharmaceutical applications (Rokhade
0260-8774/$ - see front matter � 2013 Elsevier Ltd. All rights reserved.http://dx.doi.org/10.1016/j.jfoodeng.2013.02.018
⇑ Corresponding author. Tel.: +91 9435654166.E-mail address: [email protected] (N. Devi).
Journal of Food Engineering 117 (2013) 193–204
Contents lists available at SciVerse ScienceDirect
Journal of Food Engineering
journal homepage: www.elsevier .com/ locate / j foodeng

Author's personal copy
et al., 2006). It is positively charged below its isoeletric point and isexpected to form polyelectrolyte complex with sodium alginate,which will have negative charges at lower pH (Almeida and Almeida,2004; Saravanan and Rao, 2010; Shinde and Nagarsenker, 2009).Thus, gelatin–alginate complex microparticles were prepared bywater-in-oil (w/o) emulsification crosslinking method.
The objective of this study was to prepare and evaluate thepolyelectrolyte complex of gelatin-A and sodium alginate as newmicroencapsulating material using genipin as crosslinker andascorbic acid as model active agent. Genipin is a natural crosslinkerwhich is less cytotoxic, biocompatibile and feasible (Sung et al.,1999). Besides, to avoid the use of any toxic organic solvents aswell as the most popularly used paraffin oil (Kumbar et al., 2002;Lucinda-Silva and Evangelista, 2003), this process involved wateras a solvent and a vegetable oil (sunflower oil) as emulsion med-ium. Another purpose of this study was to investigate the optimalconditions for the formation of microparticles of desired size,porosity and hence the dependence of release rate of active agenton the reaction conditions.
2. Materials and methods
2.1. Chemicals
Gelatin type A (Sigma–Aldrich Inc., USA), sodium alginate(Himedia Laboratories, India), ascorbic acid (Himedia Laboratories,India), glacial acetic acid (E. Merck, India), tween 80 (E. Merck,India) and genipin (Mol. wt. 226.22) (Challenge Bioproducts Co.Ltd., Taiwan) were purchased and used as received. Edible graderefined sunflower oil was purchased from local market. Doubledistilled water was used throughout the study. Other reagents usedwere of analytical grade.
2.2. Polyelectrolyte complexation, microparticle preparation andmicroencapsulation
Polyelectrolyte complexes may result on mixing oppositelycharged polyelectrolyte in aqueous solution. The electrostatic inter-action is a driving force to form a complex between the polycationand polyanion. The polyelectrolyte complex formation is dependenton many factors, among others molecular weights, polymer concen-tration, ratio of the two interacting polyelectrolytes, ionic strengthand pH of the solution, and temperature. The optimal conditions(sodium alginate:gelatin = 1.0:3.5 and pH = 3.75) for the formationof polyelectrolyte complex of gelatin/sodium alginate were evalu-ated by determining the turbidity and relative viscosity at variousratio of sodium alginate to gelatin and at various pH.
In order to optimize the ratio of gelatin (type-A) and sodium algi-nate, the measurements of turbidity and viscosity are essential. Themixing of gelatin and sodium alginate in different ratios would pro-duce solutions of different turbidity. The optimal ratio at whichcomplete phase separation occurred between gelatin and sodiumalgiante was the point where the solution would have the maximumturbidity. The change in absorbance due to turbidity was monitoredat a particular wavelength employing UV spectrophotometer (Mod-el UV-2001, Hitachi). The viscosity of the supernatant solution wasmeasured by using an ubbelohde viscometer at 30 �C. Polymer inthe supernatant solution would be either negligible or absent whenthe interaction between sodium algiante and gelatin would be max-imum. At this stage, the viscosity of the supernatant would be closeor similar to the solvent viscosity. All the successive experimentswere performed at this optimal pH and polymer ratio. The optimumratio of sodium alginate to gelatin and pH at which maximumcomplexation occurred were 1.0: 3.5 and 3.75 respectively.
Polyelectrolyte complexation for microparticle preparation wascarried out by a water-in-oil (w/o) emulsification and crosslinking
method in a beaker fitted with a mechanical stirrer (Eltek, Elektro-crafts India). To the beaker containing a known amount of (180 ml)sunflower oil, 15 ml of gelatin-A solution (0.437–7.0%w/v) wasadded, under stirring condition (200–1800 rpm) at 60 ± 1 �C toform an emulsion. Tween 80 (0–1.0 g) was dissolved in water(10 ml) separately and was added to the beaker to stabilize theemulsion. A known amount of (15 ml) sodium alginate solutionof concentration 0.125–2.0% (w/v) was added to the beaker dropwise to attain complete phase separation. However, the weight ra-tio of sodium alginate to gelatin was maintained at 1.0:3.5 duringall the experiments. The pH of the mixture was then brought downto 3.7 by adding 5% (v/v) of the glacial acetic acid solution. The bea-ker containing the microparticles was left to rest at this tempera-ture for approximately 15 min. The system was then cooled to 5–10 �C to harden the microparticles. The cross linking of the polymermicroparticles was achieved by slow addition of certain amount ofgenipin (0.5225%) solution. The temperature of the beaker wasthen raised to 45 �C and stirring was continued for another 3 h tocomplete the crosslinking reaction. The microparticles were fil-tered through 300-mesh nylon cloth and washed with water. Themicroparticles were further washed with acetone to remove oil,if any, adhered to the surface of microparticles and freeze-dried.The dried microparticles were then dipped in ascorbic acid(0.5–10%, w/v) in phosphate buffer of pH 7.4 for different times(0.5–24 h) in a nitrogen environment and in absence of light, fil-tered through 300-mesh nylon cloth, and quickly washed withwater to remove the surface adhered ascorbic acid. The ascorbicacid-encapsulated microparticles were again freeze-dried andstored in a glass bottle in refrigerator. The flow chart for the fabri-cation of microparticles is illustrated in Fig. 1.
2.3. Calibration curve of ascorbic acid
A calibration curve is required for the determination of encap-sulation efficiency and release rates of the microparticles. A knownconcentration of ascorbic acid in double distilled water wasscanned in the range of 200–500 nm by using UV visible spectro-photometer. For ascorbic acid having concentration in the range0.0001–0.001 g/100 ml, a prominent peak at 265 nm was noticed.The absorbance values at 265 nm obtained with the respectiveconcentrations were recorded and plotted. From the calibrationcurve, the unknown concentration of ascorbic acid was obtainedby knowing the absorbance value.
2.4. Loading efficiency
A known amount of accurately weighed ascorbic acid loadedmicroparticles were grounded in a mortar, transferred with pre-caution to a volumetric flask containing 100 ml of water (havingpH = 7.4, maintained by phosphate buffer solution) and kept forovernight with continuous stirring to dissolve the ascorbic acidin the microparticles. The solution was collected and the ascorbicacid inside the microparticles was determined employing UV spec-trophotometer. The loading efficiency (%), was calculated by usingthe calibration curve and the following formulae (Devi and Maji,2009b).
Loading efficiency ð%Þ ¼ w1=w2 � 100
where w1 = amount of ascorbic acid encapsulated in a knownamount of microparticles, and w2 = weight of microparticles.
2.5. Ascorbic acid release studies
Ascorbic acid release studies from the ascorbic acid encapsulatedmicroparticles were carried out by using UV–visible spectropho-tometer (Model UV-2001, Hitachi). A known quantity of ascorbic
194 N. Devi, D.K. Kakati / Journal of Food Engineering 117 (2013) 193–204

Author's personal copy
acid loaded microparticles was taken into a known volume (100 ml)of water having different pH (pH = 1.2 and 7.4). This pH was main-tained by using HCl and phosphate buffer solution. The contentwas shaken from time to time and the temperature maintainedthroughout was 30 �C (room temperature). An aliquot sample ofknown volume (5 ml) was removed at appropriate time intervals,filtered and assayed spectrophotometrically at 265 nm for the deter-mination of cumulative amount of ascorbic acid release up to a timet. The experiments were performed in triplicate. To maintain a con-stant volume, 5 ml of the solution having same pH was returned tothe container.
2.6. Water uptake study
The swelling behaviour of sodium alginate–gelatin microparti-cles were carried out at pH 1.2, 6.6 and 7.4 using 0.1N HCl andphosphate buffer. The pre-weighed microparticles were immersedin either 0.1N HCl (pH 1.2) or phosphate buffer at different pH (pH6.6 and 7.4). The swollen microparticles were weighed for 48 h.Every time, the weighing of the swollen microparticles was carriedout after their surfaces were dried with filter paper to removedroplets on the surface. The swelling behaviour was determinedby measuring the change of the weight of the microparticles.Swelling index for each sample determined at time t wascalculated using the following equation (Khan et al., 2010).
Swelling index ð%Þ ¼ ðWs �W0Þ=W0 � 100
where Ws is the weight of the swollen microparticles after allowingto swell for a time (t) and W0 initial weight of the microparticles be-fore swelling. The experiments were performed in triplicate and theswelling index values reported here are the average ones.
2.7. Scanning electron microscopy study
The samples were deposited on a brass holder and sputteredwith platinum. The detailed morphology and sizes of the micropar-ticles were studied at room temperature using scanning electronmicroscope (Model JSM-6360, JEOL) at an accelerated voltage of20 kV.
2.8. Optical microscopy study
The morphology and swelling behaviour of microparticles wereobserved using optical microscope (Model Carl Zeiss Micromaging,GmbH). Dry and swelled microparticles were placed onto a glassslide, observed under microscope and captured.
2.9. Fourier transform infrared (FTIR) study
FTIR spectra were recorded using KBr pellet in a FTIR spectro-photometer (Model Impact-410, Nicholet). Gelatin A, sodium algi-nate, polyelectrolyte complex of gelatin A and sodium alginate,ascorbic acid and ascorbic acid loaded microparticles were eachseparately finely grounded with KBr and FTIR spectra wererecorded in the range of 4000–400 cm�1.
2.10. X-ray diffraction study
X-ray powder diffractograms of sodium alginate, gelatin A,microparticles, ascorbic acid and ascorbic acid encapsulated micro-particles were recorded on an X-ray diffractometer (Model Mini-flex, Rigaku). The samples were scanned between 2h = 3� and 60�at the scan rate of 4�/min.
2.11. Thermal property study
Thermal properties of the samples were studied by employingthermogravymetric analyser (TGA) and differential scanning calo-rimeter (DSC). TGA thermograms of sodium alginate, gelatin,gelatin–sodium alginate microparticles, ascorbic acid and ascorbicacid loaded microparticles were recorded by employing a thermo-gravymetric analyzer (Model TGA-50, Shimadzu) in the tempera-ture range of 30–600 �C at a heating rate of 10 �C/min in anitrogen atmosphere. DSC study was carried out in a differentialscanning calorimeter (Model DSC-60, Shimadzu) at a heating rateof 10 �C/min up to 300 �C. The investigations were done undernitrogen atmosphere.
3. Results and discussion
3.1. Behaviour of the system as a function of pH, polymer ratio andtemperature
The interaction between gelatin A and sodium alginate isexpected to be electrostatic in nature. Indeed, because the pHinfluences the ionization of the protein charges, electrostatic com-plexes would be formed in the pH window where gelatine and so-dium alginate are oppositely charged. Furthermore, ratio betweenthe two biopolymers is obviously of importance in electrostaticcomplex formation. At a certain pH, there exists a specific ratiobetween the polymers, at which electroneutrality of the complexis found (Schmitt et al., 1998; Weinbreck et al., 2004). Here, the ra-tio between the sodium alginate and gelatin (1:3.5) was optimizedby measuring the turbidity and viscosity of the supernatant. Solu-tions of gelatin A (0.5% w/v) and sodium alginate (0.5% w/v) wereprepared in acetic acid/sodium acetate buffer (pH 3.5). Bothsolutions were mixed in different proportions by adding gelatine
Fig. 1. Flow chart for the fabrication of ascorbic acid loaded microparticles.
N. Devi, D.K. Kakati / Journal of Food Engineering 117 (2013) 193–204 195
Author's personal copy
solution slowly to sodium alginate solution to make the totalvolume of 45 ml. The mixtures were incubated at 40 �C for 24 h.The formation of complexes was monitored by turbidity measure-ment as a function of the different polymer ratios. The supernatantsolution was separated and viscosity of the supernatant wasmeasured. Each measurement was done in triplicate and the re-sults reported were the average values.
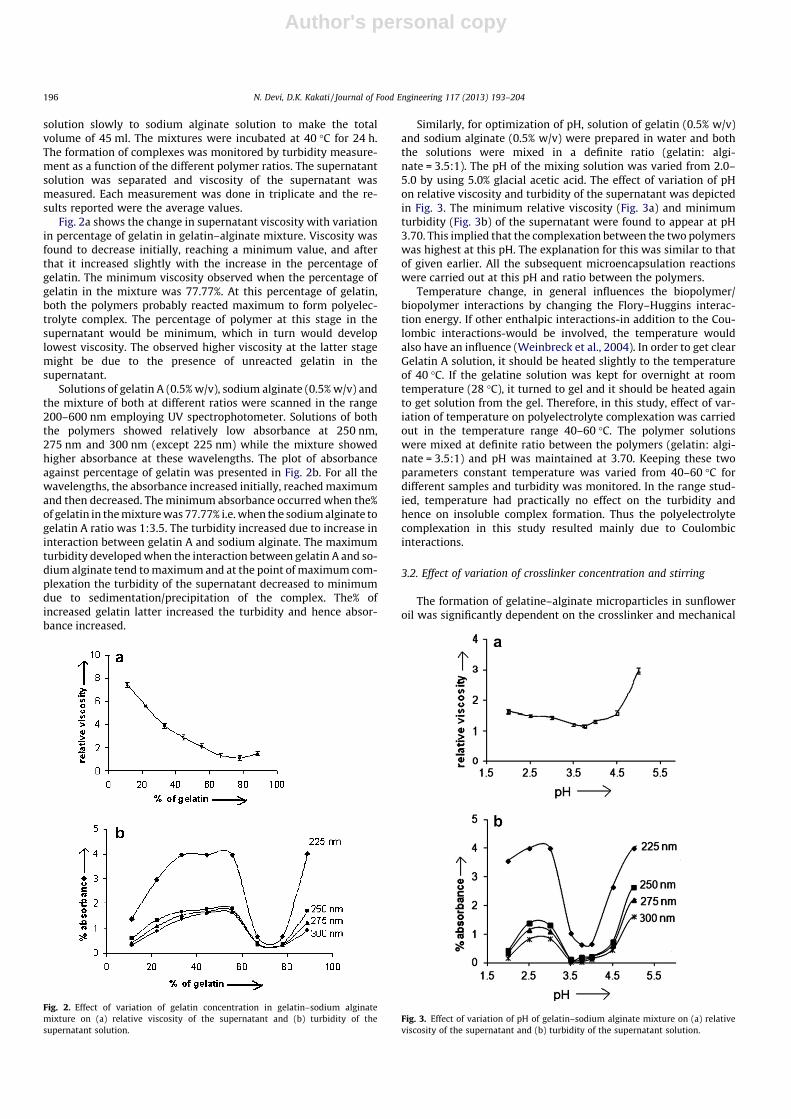
Fig. 2a shows the change in supernatant viscosity with variationin percentage of gelatin in gelatin–alginate mixture. Viscosity wasfound to decrease initially, reaching a minimum value, and afterthat it increased slightly with the increase in the percentage ofgelatin. The minimum viscosity observed when the percentage ofgelatin in the mixture was 77.77%. At this percentage of gelatin,both the polymers probably reacted maximum to form polyelec-trolyte complex. The percentage of polymer at this stage in thesupernatant would be minimum, which in turn would developlowest viscosity. The observed higher viscosity at the latter stagemight be due to the presence of unreacted gelatin in thesupernatant.
Solutions of gelatin A (0.5% w/v), sodium alginate (0.5% w/v) andthe mixture of both at different ratios were scanned in the range200–600 nm employing UV spectrophotometer. Solutions of boththe polymers showed relatively low absorbance at 250 nm,275 nm and 300 nm (except 225 nm) while the mixture showedhigher absorbance at these wavelengths. The plot of absorbanceagainst percentage of gelatin was presented in Fig. 2b. For all thewavelengths, the absorbance increased initially, reached maximumand then decreased. The minimum absorbance occurred when the%of gelatin in the mixture was 77.77% i.e. when the sodium alginate togelatin A ratio was 1:3.5. The turbidity increased due to increase ininteraction between gelatin A and sodium alginate. The maximumturbidity developed when the interaction between gelatin A and so-dium alginate tend to maximum and at the point of maximum com-plexation the turbidity of the supernatant decreased to minimumdue to sedimentation/precipitation of the complex. The% ofincreased gelatin latter increased the turbidity and hence absor-bance increased.
Similarly, for optimization of pH, solution of gelatin (0.5% w/v)and sodium alginate (0.5% w/v) were prepared in water and boththe solutions were mixed in a definite ratio (gelatin: algi-nate = 3.5:1). The pH of the mixing solution was varied from 2.0–5.0 by using 5.0% glacial acetic acid. The effect of variation of pHon relative viscosity and turbidity of the supernatant was depictedin Fig. 3. The minimum relative viscosity (Fig. 3a) and minimumturbidity (Fig. 3b) of the supernatant were found to appear at pH3.70. This implied that the complexation between the two polymerswas highest at this pH. The explanation for this was similar to thatof given earlier. All the subsequent microencapsulation reactionswere carried out at this pH and ratio between the polymers.
Temperature change, in general influences the biopolymer/biopolymer interactions by changing the Flory–Huggins interac-tion energy. If other enthalpic interactions-in addition to the Cou-lombic interactions-would be involved, the temperature wouldalso have an influence (Weinbreck et al., 2004). In order to get clearGelatin A solution, it should be heated slightly to the temperatureof 40 �C. If the gelatine solution was kept for overnight at roomtemperature (28 �C), it turned to gel and it should be heated againto get solution from the gel. Therefore, in this study, effect of var-iation of temperature on polyelectrolyte complexation was carriedout in the temperature range 40–60 �C. The polymer solutionswere mixed at definite ratio between the polymers (gelatin: algi-nate = 3.5:1) and pH was maintained at 3.70. Keeping these twoparameters constant temperature was varied from 40–60 �C fordifferent samples and turbidity was monitored. In the range stud-ied, temperature had practically no effect on the turbidity andhence on insoluble complex formation. Thus the polyelectrolytecomplexation in this study resulted mainly due to Coulombicinteractions.
3.2. Effect of variation of crosslinker concentration and stirring
The formation of gelatine–alginate microparticles in sunfloweroil was significantly dependent on the crosslinker and mechanical
Fig. 2. Effect of variation of gelatin concentration in gelatin–sodium alginatemixture on (a) relative viscosity of the supernatant and (b) turbidity of thesupernatant solution.
Fig. 3. Effect of variation of pH of gelatin–sodium alginate mixture on (a) relativeviscosity of the supernatant and (b) turbidity of the supernatant solution.
196 N. Devi, D.K. Kakati / Journal of Food Engineering 117 (2013) 193–204

Author's personal copy
stirring (Devi and Maji, 2009b). SEM micrographs of microparticlesprepared by using different amount of crosslinker, genipin wereshown in Fig. 4. Without the addition of crosslinker, no micropar-ticles were formed. Instead, the whole polymer became a lump likeproduct (Fig. 4a). Thus crosslinking was necessary to harden thesoft aqueous phase microparticles formed within the oil phase.Without proper crosslinking there was always chance of aggrega-tion of the soft microparticles to produce polymer lump. Withthe increasing of the amount of crosslinker, the microparticles pro-gressively developed proper shape from aggregated (Fig. 4b) to rel-atively less aggregated (Fig. 4c) and to free-flowing sphericalmicroparticles (Fig. 4d). Similarly, stirring speed also affected thenature. At low stirrer speed (200 rpm), the agglomeration of parti-cles was more compared to those of particles produced at higherstirrer speed (1800 rpm) (figure not shown). Improper mixing ofpolymers at low stirrer speed might be responsible for theobserved agglomeration. Zhuo et al. reported similar observationsduring studying the particle size of polyurea microcapsules byinterfacial polymerization of polyisocyanates (Zhuo et al., 2004).
3.3. Effect of variation of amount of surfactant
The effect of surfactant on the morphology of the preparedgelatine–alginate microparticles was profound in two ways- themicroparticle size and the porosity of the microparticles. The for-mation and particle size of each microparticle depends on the sizeof the dispersed droplet, which is determined by the surfactant(tween 80) used and the emulsifying conditions. Surfactanttween-80 had important role in stabilizing the microparticles ofgelatine–alginate complex formed in sunflower oil. A matrix gellike product was formed if surfactant was not added. But differentsizes of microparticles were formed on addition of varying amount
of surfactant. SEM photographs of the microparticles were shownin Fig. 5. With the increase of amount of tween-80 from 0.037 gto 0.740 g/g of polymer, the sizes of the microparticles decreasedas shown in Fig. 5a–f. At higher concentration of surfactant, theaqueous phase is easily dispersed into finer droplets, owing tothe higher activity of the surfactant, which would result in a lowerfree energy of the system, and lead to a smaller particle size (Deviand Maji, 2009b).
Moreover, it is well known that when the concentration of thesurfactant increases to critical micelle concentration, surfactantmolecules will get together and form micelles. When the aqueousphase containing micelles was dispersed in the continuous oilphase to form small water droplets, the micelles would absorboil from the oil phase. Therefore, when the aqueous phase of poly-mer formed microparticles, some oil was also remained absorbed.In the subsequent crosslinking and hardening some of theabsorbed oil would leak out and form porous microparticles. Thisporosity was enhanced further in washing step of the microparti-cles with acetone to remove surface adhered oil. This was the rea-son behind the increasing porosity of the microparticles onincreasing the amount of surfactant (Fig. 5a–f). The inset pictures(Fig. 5ai and ei) were the enlarged SEM micrographs of surface ofthe microparticles (Fig. 5a and e respectively). Microparticles pre-pared with less amount of tween 80 possessed nonporous surface(Fig. 5ai) whereas microparticles with relatively higher amount oftween 80 had porous surface (Fig. 5ei). Similar types of observa-tions were reported by Zhou et al. (2007).
3.4. Effect of variation of polymer concentration
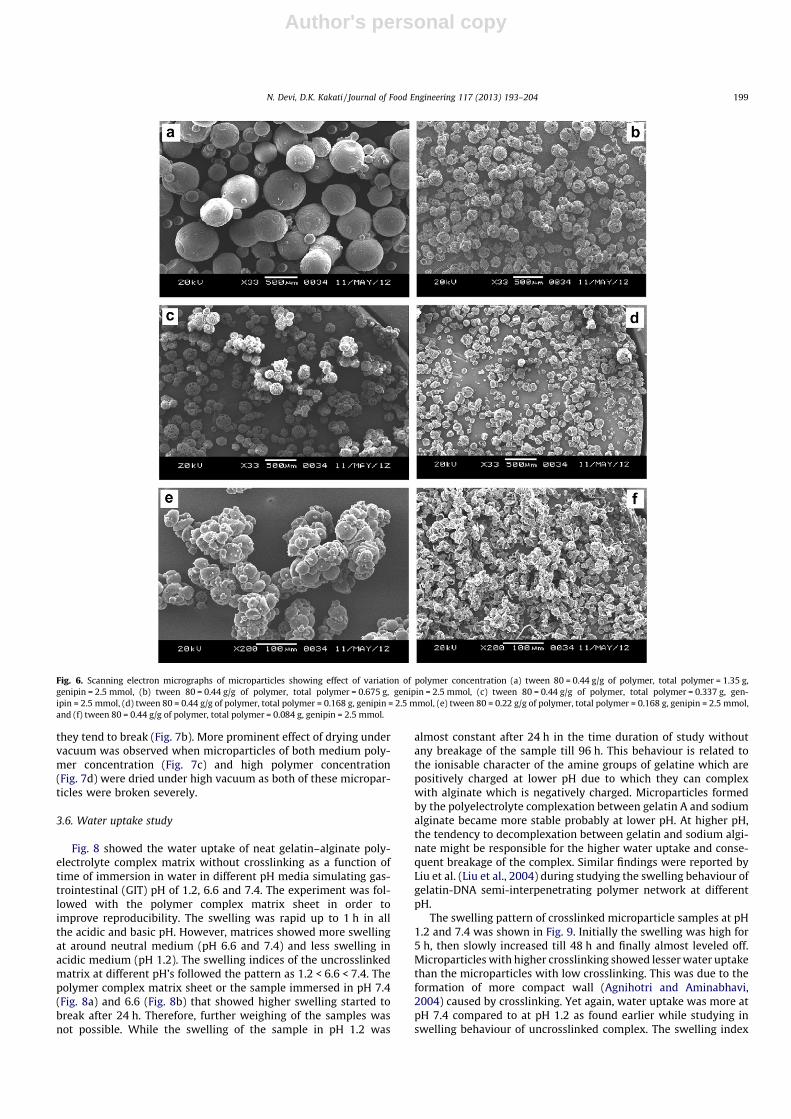
The effect of variation of polymer concentration on the surfacemorphology and size of the microparticles was shown in Fig. 6.
Fig. 4. Scanning electron micrographs of microparticles (a) without genipin, (b) tween 80 = 0.518 g/g of polymer, total polymer = 1.35 g, genipin = 0.05 mmol, (c) tween80 = 0.518 g/g of polymer, total polymer = 1.35 g, genipin = 0.1 mmol, and (d) tween 80 = 0.518 g/g of polymer, total polymer = 1.35 g, genipin = 2.5 mmol.
N. Devi, D.K. Kakati / Journal of Food Engineering 117 (2013) 193–204 197

Author's personal copy
With decrease of amount of polymer from 1.35 g to 0.168 g, a de-crease in the size of the microparticles was observed (Fig. 6a–d).In the presence of higher amount of polymer, the surfactant pres-ent might not be capable of covering all the surfaces of the micro-particles properly. This resulted in the coalescence of some of themicroparticles and led to the formation of larger microparticles.Besides this, the dispersive force of the stirrer became less efficientin presence of higher amount of polymer and as a result largermicroparticles formed (Fig. 6a–d).
On decreasing the amount of polymer or increasing the dilutionof the polymer solution, the porosity of the microparticles in-creased (Fig. 6a–d) and this might be due to the evaporation ofwater from the thin polymer surface of microparticles formed fromdilute polymer solution. Further, it could be expected that thehighly concentrated polymer solution increased not only the initialviscosity of the polymer phase, but also the rate of polymer solid-ification. Apparently, rapid solvent removal resulted in a homoge-neous viscous polymer layer at the microparticle droplet interface.As a consequence, the surface layer of polymer was solidified in anonporous morphology (Crotts and Park, 1995) (Fig. 6a) forincreased concentration of polymer. On further dilution of polymer
solution from 0.168 g (Fig. 6d) to 0.084 g, breaking of particlesoccurred (Fig. 6f) which might be due to the excess increase of poresize/or porosity and insufficient amount of polymer to form micro-particles. However, 0.168 g of polymer could produce relativelysmaller and less porous microparticles on decreasing the amountof tween 80 (Fig. 6e).
3.5. Effect of washing and drying
Washing step and type of drying had strong impact on the sur-face morphology of the microparticles as shown in Fig. 7. Indeed,during the washing of microparticles with water and acetone, thesurface adhered and some of the trapped oil droplets, the unre-acted crosslinker and some of the uncomplexed polymers, if anyare extracted from the particles, giving rise to the porous structureof the microparticles (Fig. 7a). Thus, the trapped oil domains in thesurface behave as true porogens leading to the formation of porousstructure. Peniche et al. reported similar type of observations whilestudying the porous microspheres of acrylic acid in the presence ofchitosan (Peniche et al., 2003). These were freeze-dried particles.The porous particles if, on the otherhand, dried under low vacuum;
Fig. 5. Scanning electron micrographs of microparticles showing effect of variation of tween 80 (a) tween 80 = 0.037 g/g of polymer, total polymer = 1.35 g, genipin = 2.5 mmol,(b) tween 80 = 0.074 g/g of polymer, total polymer = 1.35 g, genipin = 2.5 mmol, (c) tween 80 = 0.148 g/g of polymer, total polymer = 1.35 g, genipin = 2.5 mmol, (d) tween80 = 0.22 g/g of polymer, total polymer = 1.35 g, genipin = 2.5 mmol, (e) tween 80 = 0.370 g/g of polymer, total polymer = 1.35 g, genipin = 2.5 mmol, and (f) tween 80 = 0.74 g/gof polymer, total polymer = 1.35 g, genipin = 2.5 mmol.
198 N. Devi, D.K. Kakati / Journal of Food Engineering 117 (2013) 193–204
Author's personal copy
they tend to break (Fig. 7b). More prominent effect of drying undervacuum was observed when microparticles of both medium poly-mer concentration (Fig. 7c) and high polymer concentration(Fig. 7d) were dried under high vacuum as both of these micropar-ticles were broken severely.
3.6. Water uptake study
Fig. 8 showed the water uptake of neat gelatin–alginate poly-electrolyte complex matrix without crosslinking as a function oftime of immersion in water in different pH media simulating gas-trointestinal (GIT) pH of 1.2, 6.6 and 7.4. The experiment was fol-lowed with the polymer complex matrix sheet in order toimprove reproducibility. The swelling was rapid up to 1 h in allthe acidic and basic pH. However, matrices showed more swellingat around neutral medium (pH 6.6 and 7.4) and less swelling inacidic medium (pH 1.2). The swelling indices of the uncrosslinkedmatrix at different pH’s followed the pattern as 1.2 < 6.6 < 7.4. Thepolymer complex matrix sheet or the sample immersed in pH 7.4(Fig. 8a) and 6.6 (Fig. 8b) that showed higher swelling started tobreak after 24 h. Therefore, further weighing of the samples wasnot possible. While the swelling of the sample in pH 1.2 was
almost constant after 24 h in the time duration of study withoutany breakage of the sample till 96 h. This behaviour is related tothe ionisable character of the amine groups of gelatine which arepositively charged at lower pH due to which they can complexwith alginate which is negatively charged. Microparticles formedby the polyelectrolyte complexation between gelatin A and sodiumalginate became more stable probably at lower pH. At higher pH,the tendency to decomplexation between gelatin and sodium algi-nate might be responsible for the higher water uptake and conse-quent breakage of the complex. Similar findings were reported byLiu et al. (Liu et al., 2004) during studying the swelling behaviour ofgelatin-DNA semi-interpenetrating polymer network at differentpH.
The swelling pattern of crosslinked microparticle samples at pH1.2 and 7.4 was shown in Fig. 9. Initially the swelling was high for5 h, then slowly increased till 48 h and finally almost leveled off.Microparticles with higher crosslinking showed lesser water uptakethan the microparticles with low crosslinking. This was due to theformation of more compact wall (Agnihotri and Aminabhavi,2004) caused by crosslinking. Yet again, water uptake was more atpH 7.4 compared to at pH 1.2 as found earlier while studying inswelling behaviour of uncrosslinked complex. The swelling index
Fig. 6. Scanning electron micrographs of microparticles showing effect of variation of polymer concentration (a) tween 80 = 0.44 g/g of polymer, total polymer = 1.35 g,genipin = 2.5 mmol, (b) tween 80 = 0.44 g/g of polymer, total polymer = 0.675 g, genipin = 2.5 mmol, (c) tween 80 = 0.44 g/g of polymer, total polymer = 0.337 g, gen-ipin = 2.5 mmol, (d) tween 80 = 0.44 g/g of polymer, total polymer = 0.168 g, genipin = 2.5 mmol, (e) tween 80 = 0.22 g/g of polymer, total polymer = 0.168 g, genipin = 2.5 mmol,and (f) tween 80 = 0.44 g/g of polymer, total polymer = 0.084 g, genipin = 2.5 mmol.
N. Devi, D.K. Kakati / Journal of Food Engineering 117 (2013) 193–204 199

Author's personal copy
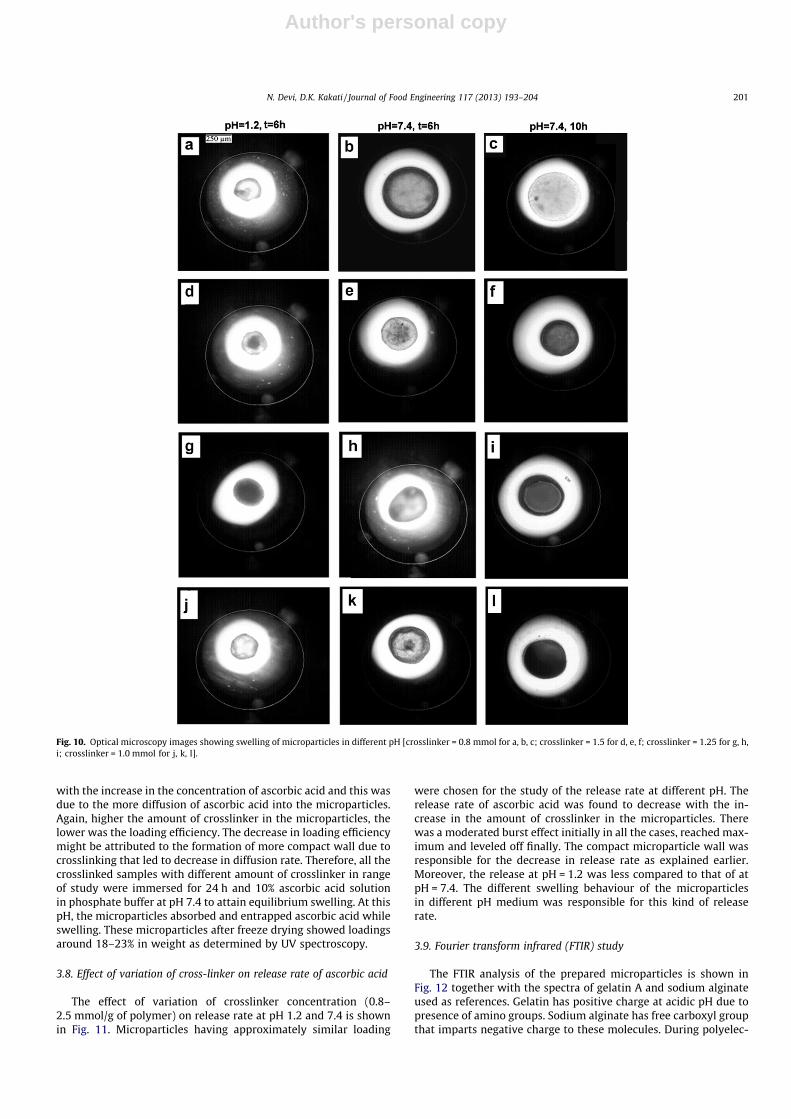
at pH 7.4 was almost twice than that at pH 1.2. That was alsoconfirmed by allowing some randomly chosen microparticle toswell at pH 1.2 and 7.4 and studied under optical microscope(Fig. 10). The microparticle’s diameter after 6 h of swelling at pH7.4 was more than twice that at pH 1.2 for low crosslinked particle(Fig. 10a–c) but for relatively high crosslinked the particle diameterwas almost twice under same conditions of study. This behaviourmakes the particles attractive in applications where inhibition ofthe release in gastric environment (low pH values) is desired. Be-sides, the pH responsive behaviour of the particles might be suitablefor smart drug delivery.
3.7. Effect of variation of crosslinker and ascorbic acid concentrationon loading efficiency
The effect of variation of concentration of ascorbic acid andimmersion time of microparticles on loading efficiency wasstudied. For all these experiments, the microparticles preparedby using same amount of surfactant and polymer were taken. Someinitial experiment revealed that loading efficiency increased withthe increase in immersion time till 5 h but above that immersiontime had no distinct effect on loading efficiency. Moreover, forfixed immersion time, the loading efficiency was found to increase
Fig. 7. Scanning electron micrographs of microparticles showing effect of variation of drying (a) tween 80 = 0.88 g/g of polymer, total polymer = 0.675 g, genipin = 2.5 mmoland freeze dried, (b) tween 80 = 0.88 g/g of polymer, total polymer = 0.675 g, genipin = 2.5 mmol and dried under low vacuum, (c) tween 80 = 0.88 g/g of polymer, totalpolymer = 0.675 g, genipin = 2.5 mmol and dried under high vacuum, and (d) tween 80 = 0.88 g/g of polymer, total polymer = 1.35 g, genipin = 2.5 mmol and dried under highvacuum.
Fig. 8. Swelling behaviour of uncrosslinked complex at different pH (a) poly-mer = 1.35 g, pH = 7.4, (b) polymer = 1.35 g, pH = 6.6, and (c) polymer = 1.35 g,pH = 1.2.
Fig. 9. Swelling behaviour of crosslinked microparticles at different pH (a)polymer = 1.35 g, crosslinker = 1.25 mmol, pH = 7.4, (b) polymer = 1.35 g, cross-linker = 2.5 mmol, pH = 7.4, (c) polymer = 1.35 g, crosslinker = 1.25 mmol, pH = 1.2,and (d) polymer = 1.35 g, crosslinker = 2.5 mmol, pH = 1.2.
200 N. Devi, D.K. Kakati / Journal of Food Engineering 117 (2013) 193–204
Author's personal copy
with the increase in the concentration of ascorbic acid and this wasdue to the more diffusion of ascorbic acid into the microparticles.Again, higher the amount of crosslinker in the microparticles, thelower was the loading efficiency. The decrease in loading efficiencymight be attributed to the formation of more compact wall due tocrosslinking that led to decrease in diffusion rate. Therefore, all thecrosslinked samples with different amount of crosslinker in rangeof study were immersed for 24 h and 10% ascorbic acid solutionin phosphate buffer at pH 7.4 to attain equilibrium swelling. At thispH, the microparticles absorbed and entrapped ascorbic acid whileswelling. These microparticles after freeze drying showed loadingsaround 18–23% in weight as determined by UV spectroscopy.
3.8. Effect of variation of cross-linker on release rate of ascorbic acid
The effect of variation of crosslinker concentration (0.8–2.5 mmol/g of polymer) on release rate at pH 1.2 and 7.4 is shownin Fig. 11. Microparticles having approximately similar loading
were chosen for the study of the release rate at different pH. Therelease rate of ascorbic acid was found to decrease with the in-crease in the amount of crosslinker in the microparticles. Therewas a moderated burst effect initially in all the cases, reached max-imum and leveled off finally. The compact microparticle wall wasresponsible for the decrease in release rate as explained earlier.Moreover, the release at pH = 1.2 was less compared to that of atpH = 7.4. The different swelling behaviour of the microparticlesin different pH medium was responsible for this kind of releaserate.
3.9. Fourier transform infrared (FTIR) study
The FTIR analysis of the prepared microparticles is shown inFig. 12 together with the spectra of gelatin A and sodium alginateused as references. Gelatin has positive charge at acidic pH due topresence of amino groups. Sodium alginate has free carboxyl groupthat imparts negative charge to these molecules. During polyelec-
Fig. 10. Optical microscopy images showing swelling of microparticles in different pH [crosslinker = 0.8 mmol for a, b, c; crosslinker = 1.5 for d, e, f; crosslinker = 1.25 for g, h,i; crosslinker = 1.0 mmol for j, k, l].
N. Devi, D.K. Kakati / Journal of Food Engineering 117 (2013) 193–204 201

Author's personal copy
trolyte complexation carboxyl groups in polysaccharides interactwith amino groups in protein to form a complex that contains amidelinkages (Saravanan and Rao, 2010). Formation of amide due tointeraction of free carboxyl and amino groups present in alginateand gelatin respectively can be studied using FTIR spectra. FTIR spec-trum of gelatin (Fig. 12a) revealed the presence of characteristicfunctional group at 3443 cm�1 for amino group. In the spectrum ofgelatin the other notable peaks observed were at 2917 cm�1 (CAHstretching of alkenes), 2823 cm�1 (CAH stretching of alkanes) and1612 cm�1 ((amide-I, CO and CN stretching). Other peaks observedwere at 1152 cm�1, 1030 cm�1 due to, CAO stretching of carboxylicacid and CAN stretching of amines respectively. In the spectrum ofsodium alginate (Fig. 12b) the following peaks were observed at3452 cm�1, 1603 cm�1, 1096 cm�1, 1021 cm�1, which were as-signed due to alcoholic OAH stretching, carboxylate salt asymmetricstretch and CAO stretching of ether respectively. The peaks of freeamino groups that present in gelatin broadened and showed de-creased intensity in gelatin–alginate complex microparticles
(Fig. 12c). A characteristic peak for amide in the region of 1500–1650 cm�1 appeared in the complex (1593 cm�1 due to C@O stretch-ing for amide) and confirmed formation of complex due to reactionbetween amino group of gelatin and carboxylic group of alginate.Moreover, the shift of the peak of amide I from 1612 cm�1 to1593 cm�1 observed in the complex microparticles of gelatin and so-dium alginate also indicated that the negatively groups of alginatemight associate with positively charged gelatin. Furthermore,clearly explaining, the carbonyl area split into three clear peaks at1744 cm�1, 1593 cm�1, 1501 cm�1, which could be assigned to theC@O stretching vibration, and to the NHþ3 and COO� groupscharacteristics of the interpolyelectrolyte complex as it was broadlydescribed in the literature (Muyona et al., 2004; Peniche et al., 2003;Pranoto et al., 2007). The FTIR spectrum of ascorbic acid (Fig. 12d)showed the following characteristic peaks at 3525 cm�1,3414 cm�1, 1755 cm�1, 1681 cm�1, 1319 cm�1, 1149 cm�1,1121 cm�1 and 1026 cm�1. The peaks at 1149 cm�1, 1319 cm�1
and 1681 cm�1 were assigned due to stretching and bending vibra-tion of C@O and OH groups present on ascorbic acid. The FTIR spec-trum of the ascorbic acid loaded microcapsules (Fig. 12e) showedthese characteristic peaks (shown by arrows) but comparativelybroader peaks at 3425 cm�1, 1755 cm�1, 1651 cm�1, 1149 cm�1,1121 cm�1, 1026 cm�1, which resulted in the appearance of super-imposed peaks of ascorbic acid and gelatine–alginate microparticlesat these regions. This confirmed successful encapsulation of ascorbicacid with retained stability after encapsulation as well as absence ofany significant interaction between ascorbic acid and polymer.
3.10. Thermal property study
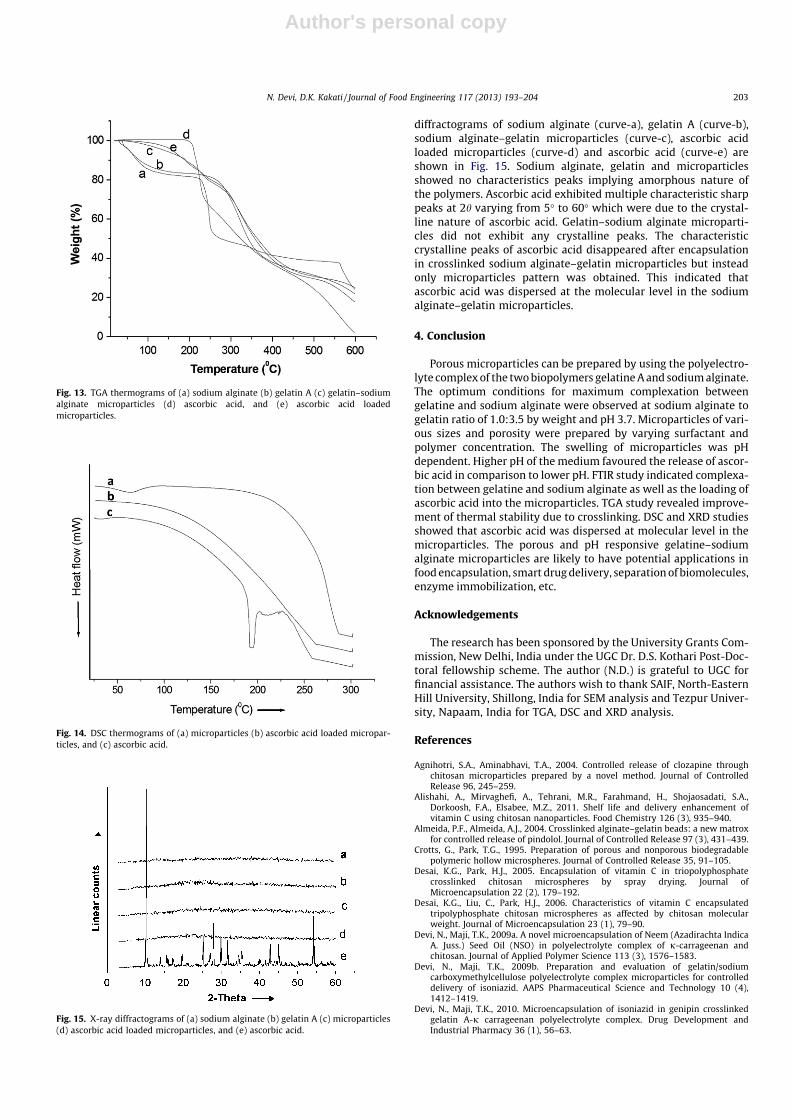
TGA thermograms of sodium alginate (curve-a), gelatin A(curve-b), microparticles of polyelectrolyte complex of both thepolymers (curve-c), ascorbic acid (curve-d) and microparticlesloaded with ascorbic acid (curve-e) are shown in Fig. 13. Thedecomposition temperature of neat sodium alginate and gelatinA was lower than that of crosslinked microparticles. However,sodium alginate showed lower thermal stability than gelatin A.Both sodium alginate and gelatin A showed similar type of weightloss pattern before decomposition but sodium alginate showedlower weight loss than gelatin after decomposition. Ascorbic aciddecomposed after melt showing sharp decomposition and higheras well as almost complete weight loss. But it showed no weightloss before decomposition. The TGA thermograms of both thecrossslinked microparticles and ascorbic acid loaded crosslinkedmicroparticles showed similar type of decomposition and weightloss pattern. However, both showed higher thermal stability thanthe neat gelatin A and sodium alginate. The higher thermal stabil-ity of crosslinked microparticles might be due to the lower chanceof elimination of small molecules like CO2, and CO. with the forma-tion of crosslinking, which acted as an infusible support andprovided thermal resistance to the microparticles.
DSC thermograms of crosslinked sodium alginate–gelatin com-plex microparticles (curve-a), ascorbic acid (curve-b) and ascorbicacid loaded microparticles (curve-c) are shown in Fig. 14. The ther-mogram of ascorbic acid showed an endothermic peak at around192 �C due to melting. There was no characteristic peak of ascorbicacid in the thermogram of ascorbic acid loaded microparticles.These results indicated that ascorbic acid was dispersed in themicroparticles. Similar observation was reported by Patil andSawant during DSC analysis of carvedilol drug encapsulated withinalginate microspheres (Patil and Sawant, 2009).
3.11. X-ray diffraction (XRD) study
The XRD study facilitates to realize the crystalline or amorphousnature of core material in the polymeric matrix. The X-ray
Fig. 11. Effect of variation of crosslinker concentration and pH on release profile (a)polymer = 1.35 g, crosslinker = 0.8 mmol, pH = 7.4, (b) polymer = 1.35 g, cross-linker = 2.5 mmol, pH = 7.4 (c) polymer = 1.35 g, crosslinker = 0.8 mmol, pH = 1.2,and (d) polymer = 1.35 g, crosslinker = 2.5 mmol, pH = 1.2.
Fig. 12. FTIR spectra of (a) gelatin A (b) sodium alginate (c) gelatin–alginatecomplex microparticles (d) ascorbic acid, and (e) ascorbic acid loadedmicroparticles.
202 N. Devi, D.K. Kakati / Journal of Food Engineering 117 (2013) 193–204
Author's personal copy
diffractograms of sodium alginate (curve-a), gelatin A (curve-b),sodium alginate–gelatin microparticles (curve-c), ascorbic acidloaded microparticles (curve-d) and ascorbic acid (curve-e) areshown in Fig. 15. Sodium alginate, gelatin and microparticlesshowed no characteristics peaks implying amorphous nature ofthe polymers. Ascorbic acid exhibited multiple characteristic sharppeaks at 2h varying from 5� to 60� which were due to the crystal-line nature of ascorbic acid. Gelatin–sodium alginate microparti-cles did not exhibit any crystalline peaks. The characteristiccrystalline peaks of ascorbic acid disappeared after encapsulationin crosslinked sodium alginate–gelatin microparticles but insteadonly microparticles pattern was obtained. This indicated thatascorbic acid was dispersed at the molecular level in the sodiumalginate–gelatin microparticles.
4. Conclusion
Porous microparticles can be prepared by using the polyelectro-lyte complex of the two biopolymers gelatine A and sodium alginate.The optimum conditions for maximum complexation betweengelatine and sodium alginate were observed at sodium alginate togelatin ratio of 1.0:3.5 by weight and pH 3.7. Microparticles of vari-ous sizes and porosity were prepared by varying surfactant andpolymer concentration. The swelling of microparticles was pHdependent. Higher pH of the medium favoured the release of ascor-bic acid in comparison to lower pH. FTIR study indicated complexa-tion between gelatine and sodium alginate as well as the loading ofascorbic acid into the microparticles. TGA study revealed improve-ment of thermal stability due to crosslinking. DSC and XRD studiesshowed that ascorbic acid was dispersed at molecular level in themicroparticles. The porous and pH responsive gelatine–sodiumalginate microparticles are likely to have potential applications infood encapsulation, smart drug delivery, separation of biomolecules,enzyme immobilization, etc.
Acknowledgements
The research has been sponsored by the University Grants Com-mission, New Delhi, India under the UGC Dr. D.S. Kothari Post-Doc-toral fellowship scheme. The author (N.D.) is grateful to UGC forfinancial assistance. The authors wish to thank SAIF, North-EasternHill University, Shillong, India for SEM analysis and Tezpur Univer-sity, Napaam, India for TGA, DSC and XRD analysis.
References
Agnihotri, S.A., Aminabhavi, T.A., 2004. Controlled release of clozapine throughchitosan microparticles prepared by a novel method. Journal of ControlledRelease 96, 245–259.
Alishahi, A., Mirvaghefi, A., Tehrani, M.R., Farahmand, H., Shojaosadati, S.A.,Dorkoosh, F.A., Elsabee, M.Z., 2011. Shelf life and delivery enhancement ofvitamin C using chitosan nanoparticles. Food Chemistry 126 (3), 935–940.
Almeida, P.F., Almeida, A.J., 2004. Crosslinked alginate–gelatin beads: a new matroxfor controlled release of pindolol. Journal of Controlled Release 97 (3), 431–439.
Crotts, G., Park, T.G., 1995. Preparation of porous and nonporous biodegradablepolymeric hollow microspheres. Journal of Controlled Release 35, 91–105.
Desai, K.G., Park, H.J., 2005. Encapsulation of vitamin C in triopolyphosphatecrosslinked chitosan microspheres by spray drying. Journal ofMicroencapsulation 22 (2), 179–192.
Desai, K.G., Liu, C., Park, H.J., 2006. Characteristics of vitamin C encapsulatedtripolyphosphate chitosan microspheres as affected by chitosan molecularweight. Journal of Microencapsulation 23 (1), 79–90.
Devi, N., Maji, T.K., 2009a. A novel microencapsulation of Neem (Azadirachta IndicaA. Juss.) Seed Oil (NSO) in polyelectrolyte complex of j-carrageenan andchitosan. Journal of Applied Polymer Science 113 (3), 1576–1583.
Devi, N., Maji, T.K., 2009b. Preparation and evaluation of gelatin/sodiumcarboxymethylcellulose polyelectrolyte complex microparticles for controlleddelivery of isoniazid. AAPS Pharmaceutical Science and Technology 10 (4),1412–1419.
Devi, N., Maji, T.K., 2010. Microencapsulation of isoniazid in genipin crosslinkedgelatin A-j carrageenan polyelectrolyte complex. Drug Development andIndustrial Pharmacy 36 (1), 56–63.
Fig. 13. TGA thermograms of (a) sodium alginate (b) gelatin A (c) gelatin–sodiumalginate microparticles (d) ascorbic acid, and (e) ascorbic acid loadedmicroparticles.
Fig. 14. DSC thermograms of (a) microparticles (b) ascorbic acid loaded micropar-ticles, and (c) ascorbic acid.
Fig. 15. X-ray diffractograms of (a) sodium alginate (b) gelatin A (c) microparticles(d) ascorbic acid loaded microparticles, and (e) ascorbic acid.
N. Devi, D.K. Kakati / Journal of Food Engineering 117 (2013) 193–204 203

Author's personal copy
Duclairoir, C., Orecchioni, A.M., Depraetere, P., Nakache, E., 2002. a-Tocopherolencapsulation and in vitro release from wheat gliadin nanoparticles. Journal ofMicroencapsulation 19 (1), 53–60.
Esposito, E., Cervellati, F., Menegatti, E., Nastruzzi, C., Cortesi, R., 2002. Spray driedeudragit microparticles as encapsulation devices for vitamin C. InternationalJournal of Pharmaceutics 2002 (242), 329–334.
Heris, H.K., Rahmat, M., Mongeau, L., 2012. Characterization of a hierarchicalnetwork of hyaluronic acid/gelatin composite for use as a smart injectablebiomaterial. Macromolecular Bioscience 12 (2), 202–210.
Jacobs, E.J., Connell, C.J., Patel, A.V., Chao, A., Rodrigeuz, C., Seymour, J., McCullough,M.L., Calle, E.E., Thun, M.J., 2001. Vitamin C and vitamin E supplement use andcolorectal cancer mortality in a large American Cancer Society Cohort. CancerEpidemiology Biomarkers and Prevention 10, 17–23.
Khan, M.S., Sridhar, B.K., Srinatha, A., 2010. Development and evaluation of pH-dependent microbeads for colon targeting. Indian Journal of PharmaceuticalSciences 72 (1), 18–23.
Kim, J.C., Lee, H.Y., Kim, M.H., Lee, H.J., Kang, H.Y., Kim, S.M., 2006. Preparation andcharacterization of chitosan/gelatin microcapsules containing triclosan.Colloids and Surfaces B: Biointerfaces 52 (1), 52–56.
Kirby, C.J., Whittle, C.J., Rigby, N., Coxon, D.T., Law, B.A., 1991. Stabilization ofascorbic acid by microencapsulation in liposomes. International Journal of FoodScience and Technology 26, 437–449.
Kumbar, S.G., Kulkarni, A.R., Aminabhavi, T.M., 2002. Crosslinked chitosanmicrospheres for encapsulation of diclofenac sodium: effect of crosslinkingagent. Journal of Microencapsulation 19 (2), 173–180.
Lee, B.Z., Wang, L.J., Li, D., Bhandari, B., Li, S.J., Lan, Y., Chen, X.D., Mao, Z.H., 2009.Fabrication of starch-based microparticles by an emulsification crosslinkingmethod. Journal of Food Engineering 92, 250–254.
Liao, M.L., Seib, P.A., 1988. Chemistry of L-ascorbic acid related to foods. FoodChemistry 30 (4), 289–312.
Liu, W.G., Li, X.W., Ye, G.X., Sun, S.J., Zhu, D., Yao, K.D., 2004. A novel pH-sensitivegelatin-DNA semi-interpenetrating polymer network hydrogel. PolymerInternational 53 (6), 675–680.
Lucinda-Silva, R.M., Evangelista, R.C., 2003. Microspheres of alginate–chitosancontaining isoniazid. Journal of Microencapsulation 20 (2), 145–152.
Mahou, R., Wandrey, C., 2010. Alginate-poly(ethylene glycol) hybrid microsphereswith adjustable physical properties. Macromolecules 43, 1371–1378.
Muyona, J.H., Cole, C.G.B., Duodu, K.G., 2004. Fourier transform infrared (FTIR)spectroscopic study of acid soluble collagen and gelatin from skins and bones ofyoung and adult Nile perch (Lates niloticus). Food Chemistry 86 (3), 325–332.
Patil, S.B., Sawant, K.K., 2009. Development, optimization and in vitro evaluation ofalginate mucoadhesive microspheres of carvedilol for nasal delivery. Journal ofMicroencapsulation 26 (5), 432–443.
Peniche, C., Fernandez, M., Gallardo, A., Lopez-Bravo, A., Roman, J.S., 2003. Drugdelivery systems based on porous chitosan/polyacrylic acid microspheres.Macromolecular Bioscience 3, 540–545.
Pranoto, Y., Lee, M.C., Park, H.J., 2007. Characterizations of fish gelatin films addedwith gellan and k-carrageenan. LWT-Food Science and Technology 40, 766–774.
Prasertmanakit, S., Praphairaksit, N., Chiangthong, W., Muangsin, N., 2009. Ethylcellulose microcapsules for protecting and controlled release of folic acid. AAPSPharmaceutical Science and Technology 10 (4), 1104–1112.
Rokhade, A.P., Agnihotri, S.A., Patil, S.A., Mallikarjuna, N.N., Kulkarni, P.V.,Aminabhavi, T.M., 2006. Semi-interpenetrating polymer networkmicrospheres of gelatin and sodium carboxymethyl cellulose for controlledrelease of ketorolac tromethamine. Carbohydrate Polymers 65 (3), 243–252.
Saravanan, M.K., Rao, P., 2010. Pectin–gelatin and alginate–gelatin complexcoacervation for controlled drug delivery: Influence of anionicpolysaccharides and drugs being encapsulated on physicochemical propertiesof microcapsules. Carbohydrate Polymers 80 (3), 808–816.
Schmitt, C., Sanchez, C., Desobry-Banon, S., Hardy, J., 1998. Structure andtechnofunctional properties of protein-polysaccharide complexes: a review.Critical Reviews in Food Science and Nutrition 38 (8), 689–753.
Shinde, U.A., Nagarsenker, M.S., 2009. Characterization of gelatin–sodium alginatecomplex coacervation system. Indian Journal of Pharmaceutical Sciences 71 (3),313–317.
Silva, C.M., Ribeiro, A.J., Figueiredo, M., Ferreira, D., Veiga, F., 2006.Microencapsulation of hemoglobin in chitosan coated alginate microspheresprepared by emulsification/internal gelation. The AAPS Journal 7 (4), E903–E913.
Sung, H.W., Huang, L.L.H., Tsai, C.C., 1999. In vitro evaluation of cytotoxicity of anaturally occurring crosslinking reagent for biological tissue fixation. Journal ofBiomaterials Science, Polymer Edition 10, 63–78.
Trindade, M.A., Grosso, C.R.F., 2000. The stability of ascorbic acid microencapsulatedin granules of rice starch and in gum Arabic. Journal of Microencapsulation 17(2), 169–176.
Uddin, M.S., Hawlader, M.n.A., Zhu, H.J., 2001. Microencapsulation of ascorbic acid:effect of process variables on product characteristics. Journal ofMicroencapsulation 18 (2), 199–209.
Vaida, C., Mela, P., Kunna, K., Sternberg, K., Keul, H., Moller, M., 2010. Microparticlesfor drug delivery based on functional polycaprolactones with enhanceddegradability: loading of hydrophilic and hydrophobic active compounds.Macromolecular Bioscience 10 (8), 925–933.
Weinbreck, F., Nieuwenhuijse, H., Robijn, G.W., Kriuf, C.G.D., 2004. Complexation ofwhey proteins with carrageenan. Journal of Agricultural and Food Chemistry 52,3550–3555.
Zhuo, L., Shuilin, C., Shizhou, Z., 2004. Factors affecting the particle size and sizedistribution of polyurea microcapsules by interfacial polymerization ofpolyisocyanates. International Journal of Polymeric Materials 53, 21–31.
Zhou, W.Q., Gu, T.Y., Su, Z.G., Ma, G.H., 2007. Synthesis of macroporous poly(glycidylmethacrylate) microspheres by surfactant reverse micelles swelling method.European Polymer Journal 43 (10), 4493–4502.
204 N. Devi, D.K. Kakati / Journal of Food Engineering 117 (2013) 193–204
Copyright © 2022 FDOKUMEN