Porous polyurethane foams based on recycled poly (ethylene terephthalate) for oil sorption
11
116 Research Article Received: 14 March 2012 Revised: 25 June 2012 Accepted: 26 June 2012 Published online in Wiley Online Library: 6 September 2012 (wileyonlinelibrary.com) DOI 10.1002/pi.4325 Porous polyurethane foams based on recycled poly(ethylene terephthalate) for oil sorption Ayman M. Atta, a,b∗ Witold Brostow, b,c Tea Datashvili, b Rasha A. El-Ghazawy, a Haley E. Hagg Lobland, b Abdul-Raheim M. Hasan a,b and Jose M. Perez c Abstract In using recycled poly(ethylene terephthalate) (PET) as a petroleum sorbent we tried to achieve two important objectives simultaneously. PET waste was glycolized using trimethylolpropane (TMp) or pentaerytheritol (PEr) to produce suitable polyol oligomers for polyurethane (PU) foams. The glycolysis was carried out in the presence of manganese acetate as a catalyst under normal pressure in m-cresol at 220 ◦ C. Producing polyols, PEr degraded PET into lower molecular weights than TMp. So prepared oligomers were reacted with 2,4-toluene diisocyanate providing several types of PU foam. The effect of various variables (polyol reactivity, water content, type of catalyst, isocyanate amount and surfactant) on the foam structure and properties were analyzed. Porosity of the PU foams was examined using environmental scanning electron microscopy. Foams based on glycolized TMp contain small uniform cells whereas other foams form less uniform cells with varying sizes including closed cells. Dynamic mechanical analysis gives much lower storage moduli for TMp-based PUs that for those based on PEr, an effect of dangling ethylene chains in the former case. The glass transition temperatures T g are higher when PEr rather than TMp is used. Our PU foams show good sorption properties and sufficient reusability. c 2012 Society of Chemical Industry Keywords: petroleum absorption; polyurethane foams; polymer swelling; dynamic mechanical analysis INTRODUCTION Despite efforts to create electric cars, cars running on gasoline are with us and will remain so in the foreseeable future. The current batteries with their weight and efficiency will not provide us with electric airplanes any time soon. While gasoline is obtained from petroleum, petroleum has another application of comparable or perhaps greater importance: as a raw material for synthesis of polymers. With a population of the globe that has exceeded 7 billion and keeps growing, the demand for petroleum will continue to increase – and along with it the danger of oil spills. 1–3 We read about oil spills around Usinsk, Russia: 3 ‘Oil spills in Russia are less dramatic than disasters in the Gulf of Mexico or the North Sea, more the result of a drip-drip of leaked crude than a sudden explosion. But they’re more numerous than in any other oil-producing nation including insurgency-hit Nigeria, and combined they spill far more than anywhere else in the world, scientists say.’ The Economic Development Ministry of Russia in a 2010 report estimated spills in that country as up to 20 million tons per year. 3 Clearly materials that can absorb spilled oil have a large potential worldwide. Pertinent in this context are reports on the interaction of liquid propane, 4 longer alkanes 5–7 and/or crude oil 8 with polymers. Another environmental problem – in principle less toxic but much more prevalent – is waste of polymer-based materials after service. City dumps are growing in size but so is the waste accumulated in them. In contrast to metals that degrade fairly rapidly, polymer degradation is slow – hence recycling is important. 9,10 Among polymers manufactured in large quantities fairly prominent is poly(ethylene terephthalate) (PET). 11 Millions of 2 L soft drink bottles sold in the USA are made of PET, and of course not only with this specific size and not only bottles. The situation in Egypt is not much different, with the population of the city of Cairo not far from 10 million and the population of the country estimated at 79 million. One assumes that PET does not create a direct hazard to the environment but, due to its substantial fraction by volume in the waste stream and its high resistance to atmospheric and biological agents, it is seen as a noxious material. 12 Therefore, recycling of PET does not only provide a partial solution to the solid waste problem but also contributes to the conservation of raw petrochemical products and energy. Among the different recycling techniques, the only one acceptable according to the principles of sustainable development is chemical recycling, since it leads to the formation of the raw materials from which the polymer is made, as well as of other secondary value-added ∗ Correspondence to: Ayman M. Atta, Surfactant Research Chair, Chemistry Department, College of Science, King Saud University, P.O.Box 2455, Riyadh 11451, Kingdom of Saudi Arabia. E-mail: khaled [email protected]; [email protected] a Petroleum Applications Department, Egyptian Petroleum Research Institute, Ahmed El-Zomor St, Nasr City, 11727 Cairo, Egypt b Laboratory of Advanced Polymers and Optimized Materials, Department of Materials Science and Engineering and Center for Advanced Research and Technology, University of North Texas, 3940 North Elm Street, Denton, TX 76207, USA c Department of Physics, University of North Texas, Denton, TX 76203, USA Polym Int 2013; 62: 116–126 www.soci.org c 2012 Society of Chemical Industry
Transcript of Porous polyurethane foams based on recycled poly (ethylene terephthalate) for oil sorption
11
6
Research ArticleReceived: 14 March 2012 Revised: 25 June 2012 Accepted: 26 June 2012 Published online in Wiley Online Library: 6 September 2012
(wileyonlinelibrary.com) DOI 10.1002/pi.4325
Porous polyurethane foams based on recycledpoly(ethylene terephthalate) for oil sorptionAyman M. Atta,a,b∗ Witold Brostow,b,c Tea Datashvili,b
Rasha A. El-Ghazawy,a Haley E. Hagg Lobland,b Abdul-Raheim M. Hasana,b
and Jose M. Perezc
Abstract
In using recycled poly(ethylene terephthalate) (PET) as a petroleum sorbent we tried to achieve two important objectivessimultaneously. PET waste was glycolized using trimethylolpropane (TMp) or pentaerytheritol (PEr) to produce suitable polyololigomers for polyurethane (PU) foams. The glycolysis was carried out in the presence of manganese acetate as a catalystunder normal pressure in m-cresol at 220 ◦C. Producing polyols, PEr degraded PET into lower molecular weights than TMp.So prepared oligomers were reacted with 2,4-toluene diisocyanate providing several types of PU foam. The effect of variousvariables (polyol reactivity, water content, type of catalyst, isocyanate amount and surfactant) on the foam structure andproperties were analyzed. Porosity of the PU foams was examined using environmental scanning electron microscopy. Foamsbased on glycolized TMp contain small uniform cells whereas other foams form less uniform cells with varying sizes includingclosed cells. Dynamic mechanical analysis gives much lower storage moduli for TMp-based PUs that for those based on PEr, aneffect of dangling ethylene chains in the former case. The glass transition temperatures Tg are higher when PEr rather than TMpis used. Our PU foams show good sorption properties and sufficient reusability.c© 2012 Society of Chemical Industry
Keywords: petroleum absorption; polyurethane foams; polymer swelling; dynamic mechanical analysis
INTRODUCTIONDespite efforts to create electric cars, cars running on gasoline arewith us and will remain so in the foreseeable future. The currentbatteries with their weight and efficiency will not provide us withelectric airplanes any time soon. While gasoline is obtained frompetroleum, petroleum has another application of comparable orperhaps greater importance: as a raw material for synthesis ofpolymers. With a population of the globe that has exceeded7 billion and keeps growing, the demand for petroleum willcontinue to increase – and along with it the danger of oil spills.1 – 3
We read about oil spills around Usinsk, Russia:3 ‘Oil spills inRussia are less dramatic than disasters in the Gulf of Mexico orthe North Sea, more the result of a drip-drip of leaked crudethan a sudden explosion. But they’re more numerous than in anyother oil-producing nation including insurgency-hit Nigeria, andcombined they spill far more than anywhere else in the world,scientists say.’ The Economic Development Ministry of Russia ina 2010 report estimated spills in that country as up to 20 milliontons per year.3 Clearly materials that can absorb spilled oil have alarge potential worldwide. Pertinent in this context are reports onthe interaction of liquid propane,4 longer alkanes5 – 7 and/or crudeoil8 with polymers.
Another environmental problem – in principle less toxic butmuch more prevalent – is waste of polymer-based materialsafter service. City dumps are growing in size but so is thewaste accumulated in them. In contrast to metals that degradefairly rapidly, polymer degradation is slow – hence recycling isimportant.9,10 Among polymers manufactured in large quantitiesfairly prominent is poly(ethylene terephthalate) (PET).11 Millions of
2 L soft drink bottles sold in the USA are made of PET, and of coursenot only with this specific size and not only bottles. The situation inEgypt is not much different, with the population of the city of Caironot far from 10 million and the population of the country estimatedat 79 million. One assumes that PET does not create a direct hazardto the environment but, due to its substantial fraction by volumein the waste stream and its high resistance to atmospheric andbiological agents, it is seen as a noxious material.12 Therefore,recycling of PET does not only provide a partial solution to thesolid waste problem but also contributes to the conservation ofraw petrochemical products and energy. Among the differentrecycling techniques, the only one acceptable according to theprinciples of sustainable development is chemical recycling, sinceit leads to the formation of the raw materials from which thepolymer is made, as well as of other secondary value-added
∗ Correspondence to: Ayman M. Atta, Surfactant Research Chair, ChemistryDepartment, College of Science, King Saud University, P.O.Box 2455, Riyadh11451, Kingdom of Saudi Arabia.E-mail: khaled [email protected]; [email protected]
a Petroleum Applications Department, Egyptian Petroleum Research Institute,Ahmed El-Zomor St, Nasr City, 11727 Cairo, Egypt
b Laboratory of Advanced Polymers and Optimized Materials, Department ofMaterials Science and Engineering and Center for Advanced Research andTechnology, University of North Texas, 3940 North Elm Street, Denton, TX76207, USA
c Department of Physics, University of North Texas, Denton, TX 76203, USA
Polym Int 2013; 62: 116–126 www.soci.org c© 2012 Society of Chemical Industry

11
7
Polyurethane foams for oil sorption www.soci.org
products.13 A successful recycling program not only depends onpost-consumer waste collection, but also on whether the productsmade out of collected, reclaimed and recycled material respond toconsumer needs – in other words if recycled products are actuallybought. Recently, a growing interest has been observed in the useof PET wastes for the production of specialized products such asunsaturated polyesters, epoxies, polyurethane foams and polymerconcrete.9,10,12 – 22
In this situation we have decided to deal with the twoproblems outlined above together: to develop new petroleumspill sorbers from polymers including recycled PET. One candidateclass of polymers is polyurethanes (PUs) which have a variety ofchemical structures23 – 28 – which provides us with maneuvrabilityof properties. However, Sefton and Mann studied benzeneabsorption in PU foams.29 They concluded that mass transferwas surprisingly slow, even when porosity is quite high. Diffusionin pores and matrix determines the rate of absorption in bothopen and closed cell foams, while bulk flow is less important. Thus,when going from PET to a petroleum-absorbing PU, we had to gothrough a different route. The results are reported below.
EXPERIMENTALMaterialsThe PET utilized was collected from beverage bottles, whichwere cut into pieces with approximately 5 mm2 surface area.Each sample was then washed with acetone and dried at100 ◦C for 8 h. Pentaerytheritol (C(CH2OH)4, PEr), trimethyloyl-propane (CH3CH2C(CH2OH)3, TMp), m-cresol, ethylene glycol(HO–CH2CH2 –OH) and butylhydroxytin oxide (Bu(OH)SnO) werefrom Aldrich Chemical Co (Munich, Germany). A silicone surfactantpolysiloxane–polyalkylene block copolymer (viscosity at 25 ◦C1350 mPa s, density 1.02 g cm−3) was from Degussa. Stannousoctoate (density 1.25 g cm−3, viscosity 270–430 mPa s, tin con-tent 28.0%–29.3%) was also from Aldrich. Amine catalyst (33%triethylenediamine in dipropylene glycol) was from Degussa. 2,4-Tolylene diisocyanate (2,4-diisocyanatotoluene, TDI), dibutyl tindilaurate, triethyl amine and toluene were from Aldrich. Man-ganese acetate, methylene chloride and poly(ethylene glycol)(PEG) with average molecular weight ca 600 were supplied byAdweic Chem. Co., Egypt. Methylene chloride used as a physicalexpansion agent was from Dow Chemical; demineralized waterwas used as a blowing agent.
Asphaltenic marine Belayium (Petrobel Co., Egypt) crude oil wasused for oil sorption measurement; its characteristics are listed inTable 1.
Table 1. Characteristics of the crude petroleum used
Test Method Value
Specific gravity at 60 ◦F IP 160/87 0.875
API gravity Calculated 21.7
Pour point (◦C) IP 15/67(86) 14.0
Kinematic viscosity (60 ◦F) (cSt) IP 71 763
Wax content (wt%) UOP 46/64 2.45
Asphaltene content (wt%) IP 143/84 8.80
TechniquesPreparation of GPEr and GTMpThe reaction of PET with PEr or TMp was discussed in a previousarticle.14 Depolymerization of PET (1 mol) was performed with PEr(1.1 mol) using a conventional four-neck glass reactor, equippedwith stirrer, thermometer, nitrogen inlet and reflux system, usingm-cresol as a solvent (total weight concentration of the reactantsin m-cresol was 85%). The reaction mixture was kept at 170–190 ◦Cfor 4 h and at 200–220 ◦C for 3 h. Then the reaction temperaturewas lowered to 100 ◦C for 1 h and finally the mixture wasallowed to cool at room temperature. Purification was performedthrough extraction of depolymerized oligomers by hot water.After completion of the glycolysis, the product was cooled toroom temperature, dissolved in a suitable quantity of methylenechloride and shaken vigorously with an equal volume of 5%aqueous sodium chloride solution to remove any unreacted PErand residual catalyst. The organic layer was collected and washedseveral times with water. The glycolized PET products with PEr aredesignated GPEr-1, GPEr-2 and GPEr-3 for PEr/PET molar ratios 1.1,2.0 and 3.0, respectively.
The same procedure of glycolysis and purification was repeatedwith different molar ratios of TMp/PET and designated GTMp-1,GTMp-2 and GTMp-3 for TMp/PET molar ratios 1.1, 2.0 and 3.0,respectively. The GPEr and GTMp oligomers were characterized byacid value and hydroxyl value determinations.
Preparation of PU foamAll oligomers were used as the polyol ingredients of foamformulation. They were mixed with PEG as a soft segment of the PUstructure, TDI, dibutyl tin dilaurate and triethyl amine as catalysts,methylene chloride as a fire retardant and silicone surfactant asa cell stabilizer. The foams were produced in batches at roomtemperature according to the procedure outlined in Table 2. Theroute for making foams was as follows: (i) mechanical stirring ofthe GPEr or GTMp with water, silicone, catalyst and stannousoctoate at 850 rpm for 1 min; (ii) addition of toluene diisocyanateand methylene chloride to the polyol mixture; (iii) stirring for 5 sand immediate casting into a 27 × 17.5 × 17.5 cm3 mold in whichthe material expanded. The mixing had to cease before creamtime (discussed below). Then the skin layer of each foam wasremoved and the foam was treated with chloroform for 24 h andwith 5 wt% potassium hydroxide aqueous solution to removeunreacted material and to increase the oil uptake.
Table 2. Making PU based on a GTMp/TDI ratio of 1.1
Ingredient Weight parts Remarks
Glycolyzed PET 10
Silicone oil 0.24 Cell-disruptingagent
Polyethylene glycol (molecularweight ca 600)
4
Demineralized water 0.2
PMEA, N,N,N∗ ,N∗ ,N9-penthanemethyl ethylene triamine
0.3 Blowing catalyst
Dibutyl tin dilaurate 0.24
DABCO-33LV, 33% triethylenediamine in dipropylene glycol
0.1 Gelation catalyst
PMDI, polymeric 4,4∗-diphenylmethanediisocyanate
14
Polym Int 2013; 62: 116–126 c© 2012 Society of Chemical Industry wileyonlinelibrary.com/journal/pi
11
8
www.soci.org AM Atta et al.
CharacterizationThe hydroxyl value of the oligomers was determined by aconventional acetic anhydride + pyridine method.20
The number-average molecular weights Mn of GPEr and GTMpoligomers were calculated according to end-group analysis bydetermination of the acid numbers (A) and hydroxyl values (B) (mgKOH (g sample)−1). With n as the number of hydroxyl groups permolecule, we have30
Mn = 56.1n × 1000/(A + B) (1)
The molecular weight of the graft was measured by gel per-meation chromatography (GPC) or SEC (Waters model 510) usingtetrahydrofuran (HPLC grade) as eluent and Ultrastyragel 500,1000, 10 000 and 100 000 Å as the columns. GPC measurementswere completed using polystyrene molecular weight standards.Viscosity was determined using a rheo-test apparatus model LTVfrom Brookfield.
Dynamic mechanical analysis (DMA) of purified PU foamspecimens with rectangular shape and dimensions of 5×5×10 mmwas carried out using a Perkin Elmer model DMA 8000 from–30 ◦Cto +100 ◦C at a heating rate of 5 ◦C min−1, 1.0 Hz sinusoidalfrequency with the measuring system in the compressionconfiguration.
The cell structure of our foams was observed by environmentalscanning electron microscopy (ESEM) (GSM-5900L, ElectronicCorp., Japan).
Oil absorption measurementsThe soluble fraction (SF) was determined after soaking PU foamin chloroform for 24 h followed by rinsing in 5 wt% aqueous KOHsolution for 24 h. SF was calculated as
SF/% = (w1 − w2)/w1 (2)
where w1 is the dry weight before and w2 the dry weight afterextraction.
The volume fraction φ of the polymer in the swollen sample wascalculated as
φ = (w2/ρ2)/[(W − w2)ρ + (w2/ρ2)] (3)
Here W , ρ2 and ρ are the weight of swelled foam with toluene,the density of toluene at 25 ◦C and the foam density, respectively.
The fluid and oil used for the oil absorption experiment weretoluene and marine Belayium crude oil. PU foam samples of 1 cmdiameter and 5 cm length were cut using a sharp-edged steeldie. Each sample was weighed before being immersed in oil ortoluene at 25 ◦C. For the first 30 min the samples were removedfrom the test bottle every 5 min and reweighed quickly. After that,removal intervals were 30 min. Also, the procedure was continuedfor 10 days and samples were reweighed every day until each PUfoam sample reached a constant weight. Oil sorption capacities Q
COCH2CH2OC
O O
m
COHO-CH2-C
C=O
O
OH
OH m = 0, 1, 2, 3
O
COCH2CH2COOC
O O
n
HO H + C
CH2OH
CH2OH
CH2OHHOCH2
PEr
(1)CH2
CH2
CH2
C CH2RRCH2
CH2
CH2R
R=OH or HOCOPh COOCH2CH2O
I
I + PEr-H2O
-C6H4-COOCH2-C-CH2OCH2-C-CH2OH
CH2R
CH2OH CH2OH
CH2OH
(2)
I + H2O -C6H4COOH + PEr (3)
Scheme 1. PET depolymerization with PEr.
wileyonlinelibrary.com/journal/pi c© 2012 Society of Chemical Industry Polym Int 2013; 62: 116–126
11
9
Polyurethane foams for oil sorption www.soci.org
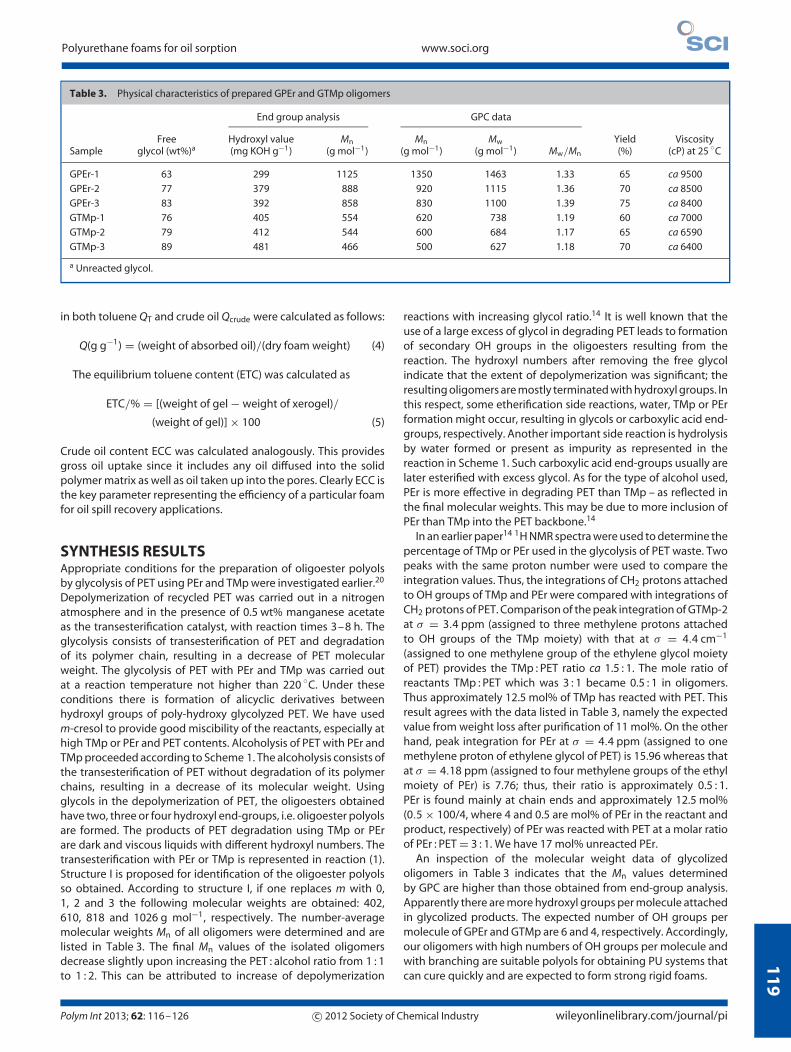
Table 3. Physical characteristics of prepared GPEr and GTMp oligomers
End group analysis GPC data
SampleFree
glycol (wt%)aHydroxyl value(mg KOH g−1)
Mn(g mol−1)
Mn(g mol−1)
Mw(g mol−1) Mw/Mn
Yield(%)
Viscosity(cP) at 25 ◦C
GPEr-1 63 299 1125 1350 1463 1.33 65 ca 9500
GPEr-2 77 379 888 920 1115 1.36 70 ca 8500
GPEr-3 83 392 858 830 1100 1.39 75 ca 8400
GTMp-1 76 405 554 620 738 1.19 60 ca 7000
GTMp-2 79 412 544 600 684 1.17 65 ca 6590
GTMp-3 89 481 466 500 627 1.18 70 ca 6400
a Unreacted glycol.
in both toluene QT and crude oil Qcrude were calculated as follows:
Q(g g−1) = (weight of absorbed oil)/(dry foam weight) (4)
The equilibrium toluene content (ETC) was calculated as
ETC/% = [(weight of gel − weight of xerogel)/
(weight of gel)] × 100 (5)
Crude oil content ECC was calculated analogously. This providesgross oil uptake since it includes any oil diffused into the solidpolymer matrix as well as oil taken up into the pores. Clearly ECC isthe key parameter representing the efficiency of a particular foamfor oil spill recovery applications.
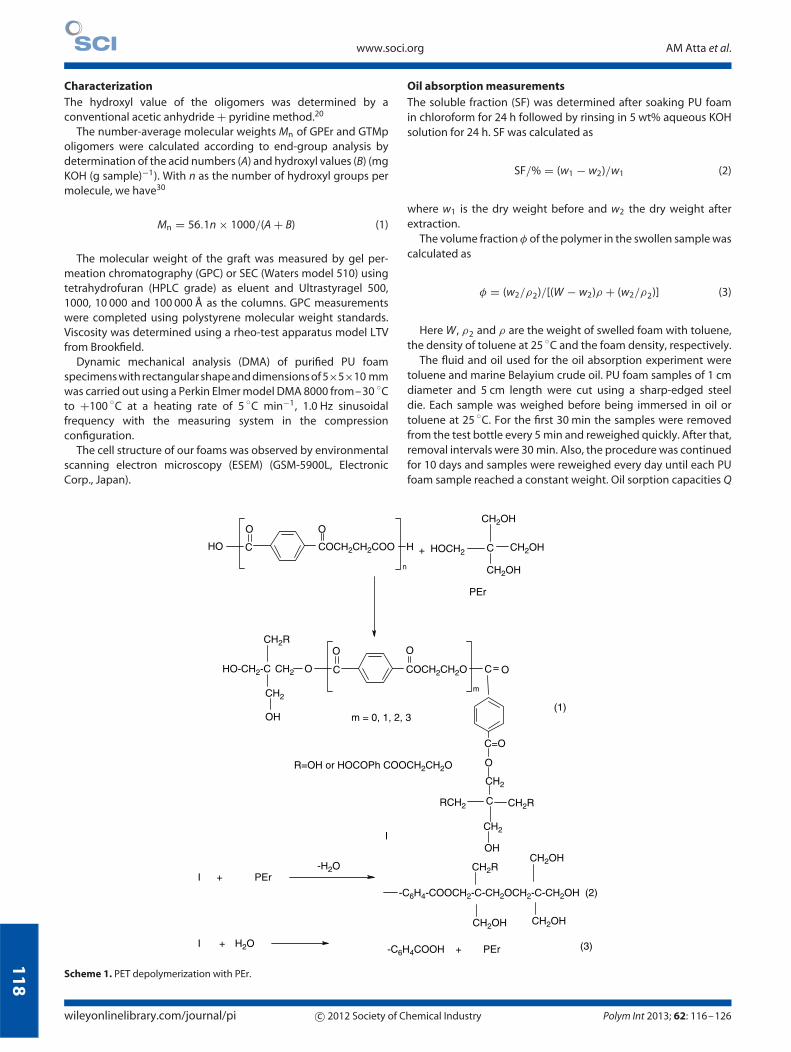
SYNTHESIS RESULTSAppropriate conditions for the preparation of oligoester polyolsby glycolysis of PET using PEr and TMp were investigated earlier.20
Depolymerization of recycled PET was carried out in a nitrogenatmosphere and in the presence of 0.5 wt% manganese acetateas the transesterification catalyst, with reaction times 3–8 h. Theglycolysis consists of transesterification of PET and degradationof its polymer chain, resulting in a decrease of PET molecularweight. The glycolysis of PET with PEr and TMp was carried outat a reaction temperature not higher than 220 ◦C. Under theseconditions there is formation of alicyclic derivatives betweenhydroxyl groups of poly-hydroxy glycolyzed PET. We have usedm-cresol to provide good miscibility of the reactants, especially athigh TMp or PEr and PET contents. Alcoholysis of PET with PEr andTMp proceeded according to Scheme 1. The alcoholysis consists ofthe transesterification of PET without degradation of its polymerchains, resulting in a decrease of its molecular weight. Usingglycols in the depolymerization of PET, the oligoesters obtainedhave two, three or four hydroxyl end-groups, i.e. oligoester polyolsare formed. The products of PET degradation using TMp or PErare dark and viscous liquids with different hydroxyl numbers. Thetransesterification with PEr or TMp is represented in reaction (1).Structure I is proposed for identification of the oligoester polyolsso obtained. According to structure I, if one replaces m with 0,1, 2 and 3 the following molecular weights are obtained: 402,610, 818 and 1026 g mol−1, respectively. The number-averagemolecular weights Mn of all oligomers were determined and arelisted in Table 3. The final Mn values of the isolated oligomersdecrease slightly upon increasing the PET : alcohol ratio from 1 : 1to 1 : 2. This can be attributed to increase of depolymerization
reactions with increasing glycol ratio.14 It is well known that theuse of a large excess of glycol in degrading PET leads to formationof secondary OH groups in the oligoesters resulting from thereaction. The hydroxyl numbers after removing the free glycolindicate that the extent of depolymerization was significant; theresulting oligomers are mostly terminated with hydroxyl groups. Inthis respect, some etherification side reactions, water, TMp or PErformation might occur, resulting in glycols or carboxylic acid end-groups, respectively. Another important side reaction is hydrolysisby water formed or present as impurity as represented in thereaction in Scheme 1. Such carboxylic acid end-groups usually arelater esterified with excess glycol. As for the type of alcohol used,PEr is more effective in degrading PET than TMp – as reflected inthe final molecular weights. This may be due to more inclusion ofPEr than TMp into the PET backbone.14
In an earlier paper14 1H NMR spectra were used to determine thepercentage of TMp or PEr used in the glycolysis of PET waste. Twopeaks with the same proton number were used to compare theintegration values. Thus, the integrations of CH2 protons attachedto OH groups of TMp and PEr were compared with integrations ofCH2 protons of PET. Comparison of the peak integration of GTMp-2at σ = 3.4 ppm (assigned to three methylene protons attachedto OH groups of the TMp moiety) with that at σ = 4.4 cm−1
(assigned to one methylene group of the ethylene glycol moietyof PET) provides the TMp : PET ratio ca 1.5 : 1. The mole ratio ofreactants TMp : PET which was 3 : 1 became 0.5 : 1 in oligomers.Thus approximately 12.5 mol% of TMp has reacted with PET. Thisresult agrees with the data listed in Table 3, namely the expectedvalue from weight loss after purification of 11 mol%. On the otherhand, peak integration for PEr at σ = 4.4 ppm (assigned to onemethylene proton of ethylene glycol of PET) is 15.96 whereas thatat σ = 4.18 ppm (assigned to four methylene groups of the ethylmoiety of PEr) is 7.76; thus, their ratio is approximately 0.5 : 1.PEr is found mainly at chain ends and approximately 12.5 mol%(0.5 × 100/4, where 4 and 0.5 are mol% of PEr in the reactant andproduct, respectively) of PEr was reacted with PET at a molar ratioof PEr : PET = 3 : 1. We have 17 mol% unreacted PEr.
An inspection of the molecular weight data of glycolizedoligomers in Table 3 indicates that the Mn values determinedby GPC are higher than those obtained from end-group analysis.Apparently there are more hydroxyl groups per molecule attachedin glycolized products. The expected number of OH groups permolecule of GPEr and GTMp are 6 and 4, respectively. Accordingly,our oligomers with high numbers of OH groups per molecule andwith branching are suitable polyols for obtaining PU systems thatcan cure quickly and are expected to form strong rigid foams.
Polym Int 2013; 62: 116–126 c© 2012 Society of Chemical Industry wileyonlinelibrary.com/journal/pi

12
0
www.soci.org AM Atta et al.
Table 4. Curing conditions of PU foam based on TMp and PEr oligomers
PU-GTMp-1GTMp/TDI(wt ratio)
PU-GTMp-2GTMp/TDI(wt ratio)
PU-GTMp-3GTMp/TDI(wt ratio)
PU-GPEr-2GPEr/TDI(wt ratio)
PU-GPEr-3GPEr/TDI(wt ratio)
Properties 1.1 1.2 1.3 1.1 1.2 1.3 1.1 1.2 1.3 1.1 1.2 1.3 1.1 1.2 1.3
Mix time (s) 8 10 15 10 15 20 15 20 25 5 8 10 3 5 7
Cream time (s) 12 16 20 15 20 22 20 25 30 8 10 13 5 7 10
Gel time (s) 35 50 55 40 50 53 45 60 65 20 22 25 13 15 17
Rise time (s) 50 60 65 55 75 80 60 80 85 40 43 45 35 38 42
Free rise density (kg m−3) 75 70 90 70 65 88 65 61 78 90 85 105 110 100 135
(a) (b)
(c) (d)
Figure 1. ESEM micrographs of (a) PU-GPEr-2 (1.1), (b) PU-GPEr-2 (1.2), (c) PU-GPEr-3 (1.2) and (d) PU-GPEr-3 (1.3).
POLYURETHANE FOAMS BASED ON GPEr ANDGTMp OLIGOMERSAs already noted, we have used both GPEr and GTMp oligomersas polyols to react with TDI to produce PU foams. The effect ofthe GPEr and GTMp oligomer mass ratio on the foam structurewas evaluated. We have prepared materials with a mass ratiobetween polyol oligomers (GTMp-1, GTMp-2, GTMp-3, GPEr-2 or
GPEr-3) and TDI of 1.1, 1.2 and 1.3. The GPEr-1 oligomer was not
used in making PU foams because of its relatively high viscosity.
The structures of PU foams are highly dependent on the relative
rates of the two reactions involved in the use of isocyanate in the
cellular foaming process (reaction (2)). If the first reaction is faster,
the polymer may cure before the foam is fully expanded by the
slower CO2 reaction and the final foam will have a higher density
wileyonlinelibrary.com/journal/pi c© 2012 Society of Chemical Industry Polym Int 2013; 62: 116–126
12
1
Polyurethane foams for oil sorption www.soci.org
(a) (b)
(c) (d)
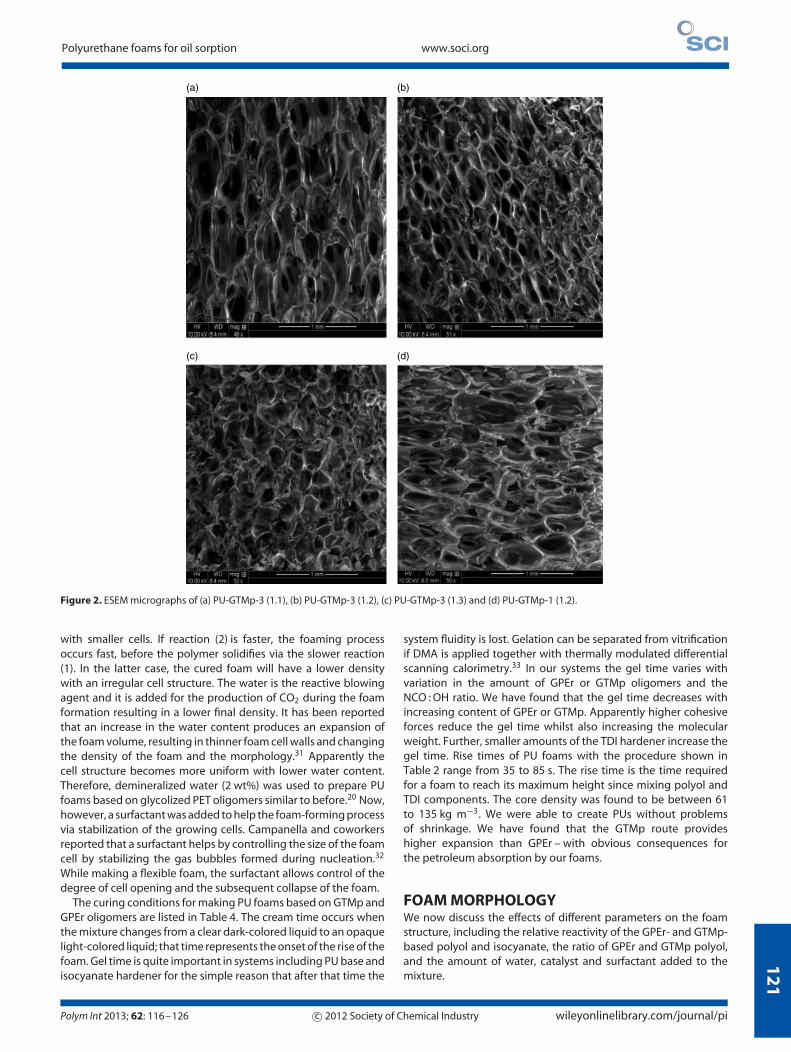
Figure 2. ESEM micrographs of (a) PU-GTMp-3 (1.1), (b) PU-GTMp-3 (1.2), (c) PU-GTMp-3 (1.3) and (d) PU-GTMp-1 (1.2).
with smaller cells. If reaction (2) is faster, the foaming processoccurs fast, before the polymer solidifies via the slower reaction(1). In the latter case, the cured foam will have a lower densitywith an irregular cell structure. The water is the reactive blowingagent and it is added for the production of CO2 during the foamformation resulting in a lower final density. It has been reportedthat an increase in the water content produces an expansion ofthe foam volume, resulting in thinner foam cell walls and changingthe density of the foam and the morphology.31 Apparently thecell structure becomes more uniform with lower water content.Therefore, demineralized water (2 wt%) was used to prepare PUfoams based on glycolized PET oligomers similar to before.20 Now,however, a surfactant was added to help the foam-forming processvia stabilization of the growing cells. Campanella and coworkersreported that a surfactant helps by controlling the size of the foamcell by stabilizing the gas bubbles formed during nucleation.32
While making a flexible foam, the surfactant allows control of thedegree of cell opening and the subsequent collapse of the foam.
The curing conditions for making PU foams based on GTMp andGPEr oligomers are listed in Table 4. The cream time occurs whenthe mixture changes from a clear dark-colored liquid to an opaquelight-colored liquid; that time represents the onset of the rise of thefoam. Gel time is quite important in systems including PU base andisocyanate hardener for the simple reason that after that time the
system fluidity is lost. Gelation can be separated from vitrificationif DMA is applied together with thermally modulated differentialscanning calorimetry.33 In our systems the gel time varies withvariation in the amount of GPEr or GTMp oligomers and theNCO : OH ratio. We have found that the gel time decreases withincreasing content of GPEr or GTMp. Apparently higher cohesiveforces reduce the gel time whilst also increasing the molecularweight. Further, smaller amounts of the TDI hardener increase thegel time. Rise times of PU foams with the procedure shown inTable 2 range from 35 to 85 s. The rise time is the time requiredfor a foam to reach its maximum height since mixing polyol andTDI components. The core density was found to be between 61to 135 kg m−3. We were able to create PUs without problemsof shrinkage. We have found that the GTMp route provideshigher expansion than GPEr – with obvious consequences forthe petroleum absorption by our foams.
FOAM MORPHOLOGYWe now discuss the effects of different parameters on the foamstructure, including the relative reactivity of the GPEr- and GTMp-based polyol and isocyanate, the ratio of GPEr and GTMp polyol,and the amount of water, catalyst and surfactant added to themixture.
Polym Int 2013; 62: 116–126 c© 2012 Society of Chemical Industry wileyonlinelibrary.com/journal/pi
12
2
www.soci.org AM Atta et al.
(a) (b)
(c) (d)
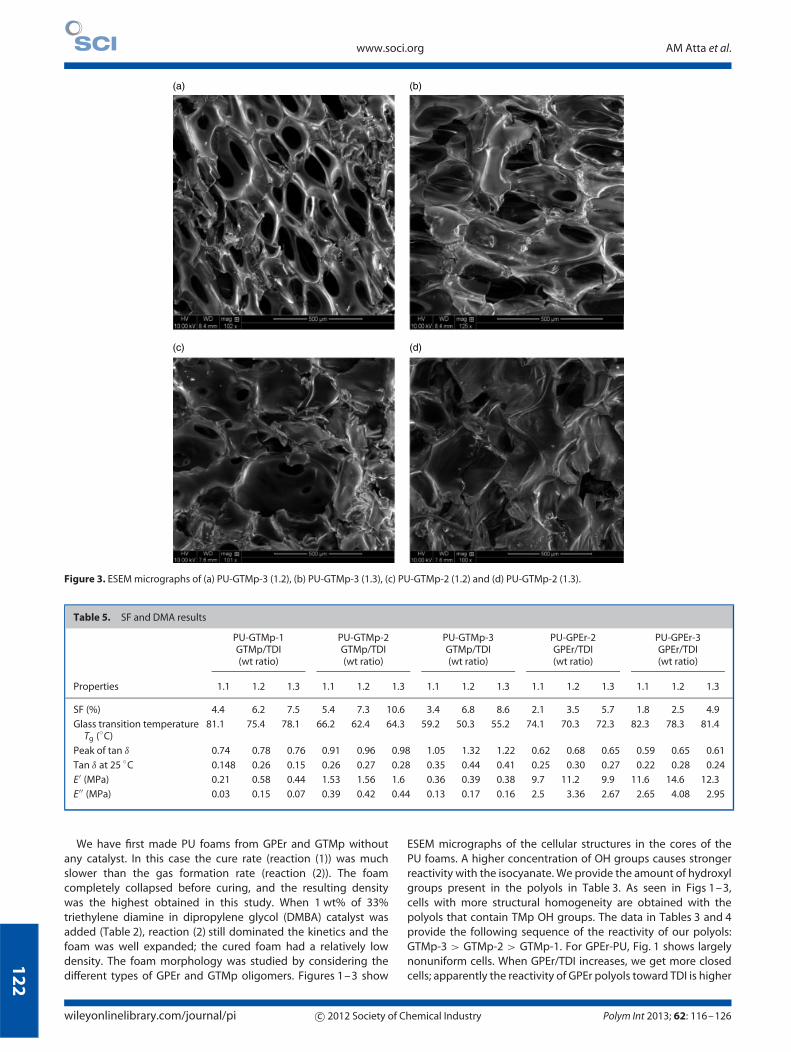
Figure 3. ESEM micrographs of (a) PU-GTMp-3 (1.2), (b) PU-GTMp-3 (1.3), (c) PU-GTMp-2 (1.2) and (d) PU-GTMp-2 (1.3).
Table 5. SF and DMA results
PU-GTMp-1GTMp/TDI(wt ratio)
PU-GTMp-2GTMp/TDI(wt ratio)
PU-GTMp-3GTMp/TDI(wt ratio)
PU-GPEr-2GPEr/TDI(wt ratio)
PU-GPEr-3GPEr/TDI(wt ratio)
Properties 1.1 1.2 1.3 1.1 1.2 1.3 1.1 1.2 1.3 1.1 1.2 1.3 1.1 1.2 1.3
SF (%) 4.4 6.2 7.5 5.4 7.3 10.6 3.4 6.8 8.6 2.1 3.5 5.7 1.8 2.5 4.9
Glass transition temperatureTg (◦C)
81.1 75.4 78.1 66.2 62.4 64.3 59.2 50.3 55.2 74.1 70.3 72.3 82.3 78.3 81.4
Peak of tan δ 0.74 0.78 0.76 0.91 0.96 0.98 1.05 1.32 1.22 0.62 0.68 0.65 0.59 0.65 0.61
Tan δ at 25 ◦C 0.148 0.26 0.15 0.26 0.27 0.28 0.35 0.44 0.41 0.25 0.30 0.27 0.22 0.28 0.24
E′ (MPa) 0.21 0.58 0.44 1.53 1.56 1.6 0.36 0.39 0.38 9.7 11.2 9.9 11.6 14.6 12.3
E′′ (MPa) 0.03 0.15 0.07 0.39 0.42 0.44 0.13 0.17 0.16 2.5 3.36 2.67 2.65 4.08 2.95
We have first made PU foams from GPEr and GTMp withoutany catalyst. In this case the cure rate (reaction (1)) was muchslower than the gas formation rate (reaction (2)). The foamcompletely collapsed before curing, and the resulting densitywas the highest obtained in this study. When 1 wt% of 33%triethylene diamine in dipropylene glycol (DMBA) catalyst wasadded (Table 2), reaction (2) still dominated the kinetics and thefoam was well expanded; the cured foam had a relatively lowdensity. The foam morphology was studied by considering thedifferent types of GPEr and GTMp oligomers. Figures 1–3 show
ESEM micrographs of the cellular structures in the cores of thePU foams. A higher concentration of OH groups causes strongerreactivity with the isocyanate. We provide the amount of hydroxylgroups present in the polyols in Table 3. As seen in Figs 1–3,cells with more structural homogeneity are obtained with thepolyols that contain TMp OH groups. The data in Tables 3 and 4provide the following sequence of the reactivity of our polyols:GTMp-3 > GTMp-2 > GTMp-1. For GPEr-PU, Fig. 1 shows largelynonuniform cells. When GPEr/TDI increases, we get more closedcells; apparently the reactivity of GPEr polyols toward TDI is higher
wileyonlinelibrary.com/journal/pi c© 2012 Society of Chemical Industry Polym Int 2013; 62: 116–126
12
3
Polyurethane foams for oil sorption www.soci.org
-[-CONH-R-NHCOOR-O]- (1)
2H2O + OCN-R-NCO (2)
OH-R--OH + OCN-R-NCO
H2N-R-NH2 + 2CO2
Scheme 2. Reaction between polyol or water and diisocyanate.
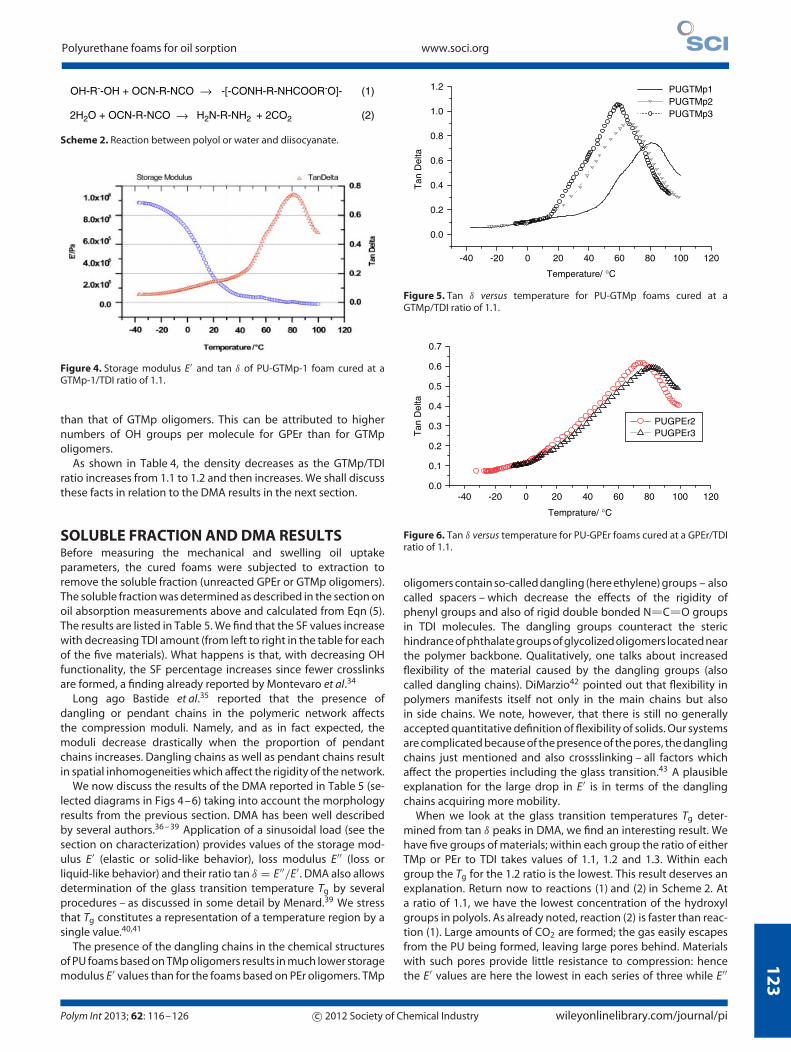
Figure 4. Storage modulus E′ and tan δ of PU-GTMp-1 foam cured at aGTMp-1/TDI ratio of 1.1.
than that of GTMp oligomers. This can be attributed to highernumbers of OH groups per molecule for GPEr than for GTMpoligomers.
As shown in Table 4, the density decreases as the GTMp/TDIratio increases from 1.1 to 1.2 and then increases. We shall discussthese facts in relation to the DMA results in the next section.
SOLUBLE FRACTION AND DMA RESULTSBefore measuring the mechanical and swelling oil uptakeparameters, the cured foams were subjected to extraction toremove the soluble fraction (unreacted GPEr or GTMp oligomers).The soluble fraction was determined as described in the section onoil absorption measurements above and calculated from Eqn (5).The results are listed in Table 5. We find that the SF values increasewith decreasing TDI amount (from left to right in the table for eachof the five materials). What happens is that, with decreasing OHfunctionality, the SF percentage increases since fewer crosslinksare formed, a finding already reported by Montevaro et al.34
Long ago Bastide et al.35 reported that the presence ofdangling or pendant chains in the polymeric network affectsthe compression moduli. Namely, and as in fact expected, themoduli decrease drastically when the proportion of pendantchains increases. Dangling chains as well as pendant chains resultin spatial inhomogeneities which affect the rigidity of the network.
We now discuss the results of the DMA reported in Table 5 (se-lected diagrams in Figs 4–6) taking into account the morphologyresults from the previous section. DMA has been well describedby several authors.36 – 39 Application of a sinusoidal load (see thesection on characterization) provides values of the storage mod-ulus E′ (elastic or solid-like behavior), loss modulus E′′ (loss orliquid-like behavior) and their ratio tan δ = E′′/E′. DMA also allowsdetermination of the glass transition temperature Tg by severalprocedures – as discussed in some detail by Menard.39 We stressthat Tg constitutes a representation of a temperature region by asingle value.40,41
The presence of the dangling chains in the chemical structuresof PU foams based on TMp oligomers results in much lower storagemodulus E′ values than for the foams based on PEr oligomers. TMp
-40 -20 0 20 40 60 80 100 120
0.0
0.2
0.4
0.6
0.8
1.0
1.2 PUGTMp1PUGTMp2PUGTMp3
Tan
Del
ta
Temperature/ °C
Figure 5. Tan δ versus temperature for PU-GTMp foams cured at aGTMp/TDI ratio of 1.1.
-40 -20 0 20 40 60 80 100 1200.0
0.1
0.2
0.3
0.4
0.5
0.6
0.7
PUGPEr2PUGPEr3T
an D
elta
Temprature/ °C
Figure 6. Tan δ versus temperature for PU-GPEr foams cured at a GPEr/TDIratio of 1.1.
oligomers contain so-called dangling (here ethylene) groups – alsocalled spacers – which decrease the effects of the rigidity ofphenyl groups and also of rigid double bonded N C O groupsin TDI molecules. The dangling groups counteract the sterichindrance of phthalate groups of glycolized oligomers located nearthe polymer backbone. Qualitatively, one talks about increasedflexibility of the material caused by the dangling groups (alsocalled dangling chains). DiMarzio42 pointed out that flexibility inpolymers manifests itself not only in the main chains but alsoin side chains. We note, however, that there is still no generallyaccepted quantitative definition of flexibility of solids. Our systemsare complicated because of the presence of the pores, the danglingchains just mentioned and also crossslinking – all factors whichaffect the properties including the glass transition.43 A plausibleexplanation for the large drop in E′ is in terms of the danglingchains acquiring more mobility.
When we look at the glass transition temperatures Tg deter-mined from tan δ peaks in DMA, we find an interesting result. Wehave five groups of materials; within each group the ratio of eitherTMp or PEr to TDI takes values of 1.1, 1.2 and 1.3. Within eachgroup the Tg for the 1.2 ratio is the lowest. This result deserves anexplanation. Return now to reactions (1) and (2) in Scheme 2. Ata ratio of 1.1, we have the lowest concentration of the hydroxylgroups in polyols. As already noted, reaction (2) is faster than reac-tion (1). Large amounts of CO2 are formed; the gas easily escapesfrom the PU being formed, leaving large pores behind. Materialswith such pores provide little resistance to compression: hencethe E′ values are here the lowest in each series of three while E′′
Polym Int 2013; 62: 116–126 c© 2012 Society of Chemical Industry wileyonlinelibrary.com/journal/pi
12
4
www.soci.org AM Atta et al.
Table 6. Swelling parameters of PU foams based on GTMp and GPEr oligomers at 25 ◦C
PU-GTMp-1GTMp/TDI(wt ratio)
PU-GTMp-2GTMp/TDI(wt ratio)
PU-GTMp-3GTMp/TDI(wt ratio)
PU-GPEr-2GPEr/TDI(wt ratio)
PU-GPEr-3GPEr/TDI(wt ratio)
Properties 1.1 1.2 1.3 1.1 1.2 1.3 1.1 1.2 1.3 1.1 1.2 1.3 1.1 1.2 1.3
Volume fraction ofthe polymer intoluene (φT)
0.43 0.39 0.64 0.40 0.37 0.60 0.37 0.35 0.56 0.42 0.37 0.50 0.46 0.52 0.68
Volume fraction ofthe polymer incrude oil (φC)
0.38 0.34 0.76 0.34 0.28 0.66 0.28 0.27 0.61 0.33 0.32 0.58 0.36 0.38 0.76
QT (g g−1) 16 20 6 19 22 8 22 28 10 14 18 9 10 8 4
Qcrude (g g−1) 20 25 4 25 35 6 35 40 8 20 22 7 15 15 3
ETC (%) 93.7 95.0 83.3 94.7 95.4 87.5 95.4 96.4 90 92.8 94.4 88.8 90 87.5 75.0
ECC (%) 95.0 96.0 75.0 96.0 97.1 83.3 97.1 97.5 87.5 95.0 95.5 85.7 93.3 93.3 66.6
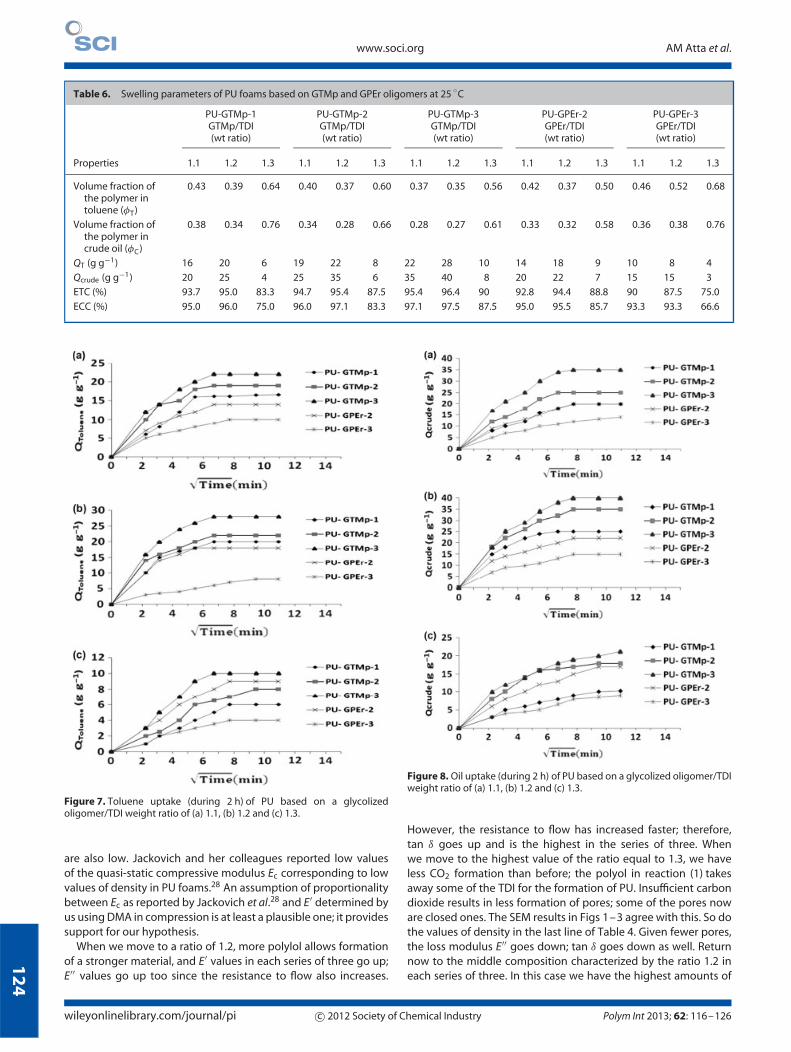
Figure 7. Toluene uptake (during 2 h) of PU based on a glycolizedoligomer/TDI weight ratio of (a) 1.1, (b) 1.2 and (c) 1.3.
are also low. Jackovich and her colleagues reported low valuesof the quasi-static compressive modulus Ec corresponding to lowvalues of density in PU foams.28 An assumption of proportionalitybetween Ec as reported by Jackovich et al.28 and E′ determined byus using DMA in compression is at least a plausible one; it providessupport for our hypothesis.
When we move to a ratio of 1.2, more polylol allows formationof a stronger material, and E′ values in each series of three go up;E′′ values go up too since the resistance to flow also increases.
Figure 8. Oil uptake (during 2 h) of PU based on a glycolized oligomer/TDIweight ratio of (a) 1.1, (b) 1.2 and (c) 1.3.
However, the resistance to flow has increased faster; therefore,tan δ goes up and is the highest in the series of three. Whenwe move to the highest value of the ratio equal to 1.3, we haveless CO2 formation than before; the polyol in reaction (1) takesaway some of the TDI for the formation of PU. Insufficient carbondioxide results in less formation of pores; some of the pores noware closed ones. The SEM results in Figs 1–3 agree with this. So dothe values of density in the last line of Table 4. Given fewer pores,the loss modulus E′′ goes down; tan δ goes down as well. Returnnow to the middle composition characterized by the ratio 1.2 ineach series of three. In this case we have the highest amounts of
wileyonlinelibrary.com/journal/pi c© 2012 Society of Chemical Industry Polym Int 2013; 62: 116–126
12
5
Polyurethane foams for oil sorption www.soci.org
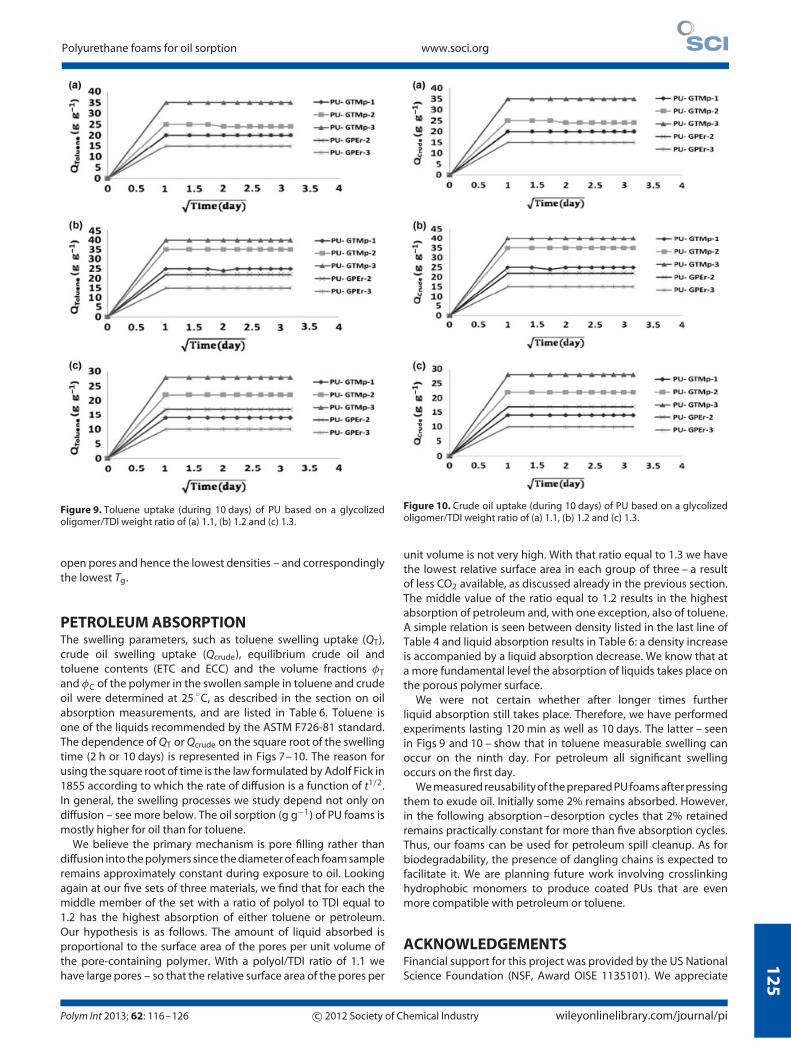
Figure 9. Toluene uptake (during 10 days) of PU based on a glycolizedoligomer/TDI weight ratio of (a) 1.1, (b) 1.2 and (c) 1.3.
open pores and hence the lowest densities – and correspondinglythe lowest Tg.
PETROLEUM ABSORPTIONThe swelling parameters, such as toluene swelling uptake (QT),crude oil swelling uptake (Qcrude), equilibrium crude oil andtoluene contents (ETC and ECC) and the volume fractions φT
and φC of the polymer in the swollen sample in toluene and crudeoil were determined at 25 ◦C, as described in the section on oilabsorption measurements, and are listed in Table 6. Toluene isone of the liquids recommended by the ASTM F726-81 standard.The dependence of QT or Qcrude on the square root of the swellingtime (2 h or 10 days) is represented in Figs 7–10. The reason forusing the square root of time is the law formulated by Adolf Fick in1855 according to which the rate of diffusion is a function of t1/2.In general, the swelling processes we study depend not only ondiffusion – see more below. The oil sorption (g g−1) of PU foams ismostly higher for oil than for toluene.
We believe the primary mechanism is pore filling rather thandiffusion into the polymers since the diameter of each foam sampleremains approximately constant during exposure to oil. Lookingagain at our five sets of three materials, we find that for each themiddle member of the set with a ratio of polyol to TDI equal to1.2 has the highest absorption of either toluene or petroleum.Our hypothesis is as follows. The amount of liquid absorbed isproportional to the surface area of the pores per unit volume ofthe pore-containing polymer. With a polyol/TDI ratio of 1.1 wehave large pores – so that the relative surface area of the pores per
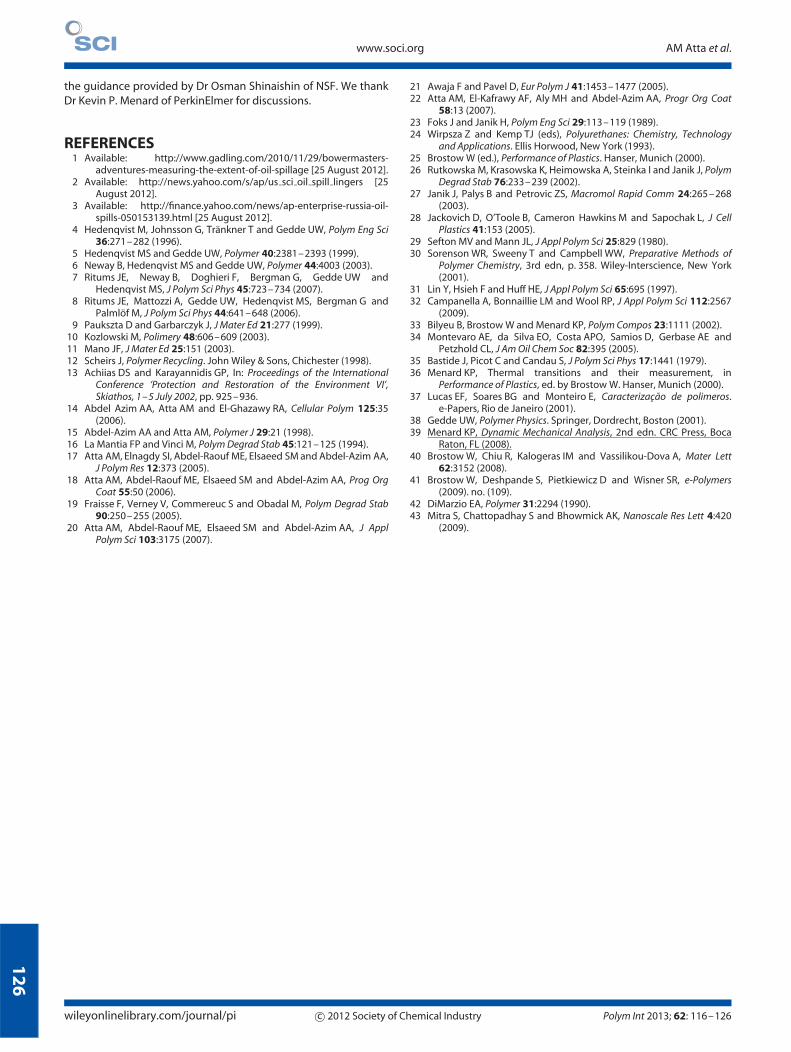
Figure 10. Crude oil uptake (during 10 days) of PU based on a glycolizedoligomer/TDI weight ratio of (a) 1.1, (b) 1.2 and (c) 1.3.
unit volume is not very high. With that ratio equal to 1.3 we havethe lowest relative surface area in each group of three – a resultof less CO2 available, as discussed already in the previous section.The middle value of the ratio equal to 1.2 results in the highestabsorption of petroleum and, with one exception, also of toluene.A simple relation is seen between density listed in the last line ofTable 4 and liquid absorption results in Table 6: a density increaseis accompanied by a liquid absorption decrease. We know that ata more fundamental level the absorption of liquids takes place onthe porous polymer surface.
We were not certain whether after longer times furtherliquid absorption still takes place. Therefore, we have performedexperiments lasting 120 min as well as 10 days. The latter – seenin Figs 9 and 10 – show that in toluene measurable swelling canoccur on the ninth day. For petroleum all significant swellingoccurs on the first day.
We measured reusability of the prepared PU foams after pressingthem to exude oil. Initially some 2% remains absorbed. However,in the following absorption–desorption cycles that 2% retainedremains practically constant for more than five absorption cycles.Thus, our foams can be used for petroleum spill cleanup. As forbiodegradability, the presence of dangling chains is expected tofacilitate it. We are planning future work involving crosslinkinghydrophobic monomers to produce coated PUs that are evenmore compatible with petroleum or toluene.
ACKNOWLEDGEMENTSFinancial support for this project was provided by the US NationalScience Foundation (NSF, Award OISE 1135101). We appreciate
Polym Int 2013; 62: 116–126 c© 2012 Society of Chemical Industry wileyonlinelibrary.com/journal/pi
12
6
www.soci.org AM Atta et al.
the guidance provided by Dr Osman Shinaishin of NSF. We thankDr Kevin P. Menard of PerkinElmer for discussions.
REFERENCES1 Available: http://www.gadling.com/2010/11/29/bowermasters-
adventures-measuring-the-extent-of-oil-spillage [25 August 2012].2 Available: http://news.yahoo.com/s/ap/us sci oil spill lingers [25
August 2012].3 Available: http://finance.yahoo.com/news/ap-enterprise-russia-oil-
spills-050153139.html [25 August 2012].4 Hedenqvist M, Johnsson G, Trankner T and Gedde UW, Polym Eng Sci
36:271–282 (1996).5 Hedenqvist MS and Gedde UW, Polymer 40:2381–2393 (1999).6 Neway B, Hedenqvist MS and Gedde UW, Polymer 44:4003 (2003).7 Ritums JE, Neway B, Doghieri F, Bergman G, Gedde UW and
Hedenqvist MS, J Polym Sci Phys 45:723–734 (2007).8 Ritums JE, Mattozzi A, Gedde UW, Hedenqvist MS, Bergman G and
Palmlof M, J Polym Sci Phys 44:641–648 (2006).9 Paukszta D and Garbarczyk J, J Mater Ed 21:277 (1999).
10 Kozlowski M, Polimery 48:606–609 (2003).11 Mano JF, J Mater Ed 25:151 (2003).12 Scheirs J, Polymer Recycling. John Wiley & Sons, Chichester (1998).13 Achiias DS and Karayannidis GP, In: Proceedings of the International
Conference ‘Protection and Restoration of the Environment VI’,Skiathos, 1–5 July 2002, pp. 925–936.
14 Abdel Azim AA, Atta AM and El-Ghazawy RA, Cellular Polym 125:35(2006).
15 Abdel-Azim AA and Atta AM, Polymer J 29:21 (1998).16 La Mantia FP and Vinci M, Polym Degrad Stab 45:121–125 (1994).17 Atta AM, Elnagdy SI, Abdel-Raouf ME, Elsaeed SM and Abdel-Azim AA,
J Polym Res 12:373 (2005).18 Atta AM, Abdel-Raouf ME, Elsaeed SM and Abdel-Azim AA, Prog Org
Coat 55:50 (2006).19 Fraisse F, Verney V, Commereuc S and Obadal M, Polym Degrad Stab
90:250–255 (2005).20 Atta AM, Abdel-Raouf ME, Elsaeed SM and Abdel-Azim AA, J Appl
Polym Sci 103:3175 (2007).
21 Awaja F and Pavel D, Eur Polym J 41:1453–1477 (2005).22 Atta AM, El-Kafrawy AF, Aly MH and Abdel-Azim AA, Progr Org Coat
58:13 (2007).23 Foks J and Janik H, Polym Eng Sci 29:113–119 (1989).24 Wirpsza Z and Kemp TJ (eds), Polyurethanes: Chemistry, Technology
and Applications. Ellis Horwood, New York (1993).25 Brostow W (ed.), Performance of Plastics. Hanser, Munich (2000).26 Rutkowska M, Krasowska K, Heimowska A, Steinka I and Janik J, Polym
Degrad Stab 76:233–239 (2002).27 Janik J, Palys B and Petrovic ZS, Macromol Rapid Comm 24:265–268
(2003).28 Jackovich D, O’Toole B, Cameron Hawkins M and Sapochak L, J Cell
Plastics 41:153 (2005).29 Sefton MV and Mann JL, J Appl Polym Sci 25:829 (1980).30 Sorenson WR, Sweeny T and Campbell WW, Preparative Methods of
Polymer Chemistry, 3rd edn, p. 358. Wiley-Interscience, New York(2001).
31 Lin Y, Hsieh F and Huff HE, J Appl Polym Sci 65:695 (1997).32 Campanella A, Bonnaillie LM and Wool RP, J Appl Polym Sci 112:2567
(2009).33 Bilyeu B, Brostow W and Menard KP, Polym Compos 23:1111 (2002).34 Montevaro AE, da Silva EO, Costa APO, Samios D, Gerbase AE and
Petzhold CL, J Am Oil Chem Soc 82:395 (2005).35 Bastide J, Picot C and Candau S, J Polym Sci Phys 17:1441 (1979).36 Menard KP, Thermal transitions and their measurement, in
Performance of Plastics, ed. by Brostow W. Hanser, Munich (2000).37 Lucas EF, Soares BG and Monteiro E, Caracterizacao de polimeros.
e-Papers, Rio de Janeiro (2001).38 Gedde UW, Polymer Physics. Springer, Dordrecht, Boston (2001).39 Menard KP, Dynamic Mechanical Analysis, 2nd edn. CRC Press, Boca
Raton, FL (2008).40 Brostow W, Chiu R, Kalogeras IM and Vassilikou-Dova A, Mater Lett
62:3152 (2008).41 Brostow W, Deshpande S, Pietkiewicz D and Wisner SR, e-Polymers
(2009). no. (109).42 DiMarzio EA, Polymer 31:2294 (1990).43 Mitra S, Chattopadhay S and Bhowmick AK, Nanoscale Res Lett 4:420
(2009).
wileyonlinelibrary.com/journal/pi c© 2012 Society of Chemical Industry Polym Int 2013; 62: 116–126