Characterization of polyurethane foam waste for reuse in eco ...
16
Article 1 Characterization of polyurethane foam waste for 2 reuse in eco-efficient building materials 3 R. Gómez-Rojo 1 , L. Alameda 2 , Á. Rodríguez 3 , V. Calderón 4 and S. Gutiérrez-González 5 * 4 1 University of Burgos, Spain; [email protected] 5 2 University of Burgos, Spain; [email protected] 6 3 University of Burgos, Spain; [email protected] 7 4 University of Burgos, Spain; [email protected] 8 5 University of Burgos, Spain; [email protected] 9 10 * Correspondence: [email protected]; Tel.: +34 947 259 436 11 12 Abstract: In the European Union, the demand for polyurethane is continually growing. In 2017, the 13 estimated production value of polyurethane was 700,400T, of which 27.3% is taken to landfill, which 14 causes an environmental problem. In this paper the behaviour of various polyurethane foams from 15 the waste of different types of industries will be analysed with the aim of assessing their potential 16 use in construction materials. In order to this, the wastes were chemically tested by means of CHNS, 17 TGA, and leaching tests. They were tested microstructurally by means of SEM. The processing 18 parameters of the waste was calculated after finding out its granulometry and its physical properties 19 i.e. density and water absorption capacity. In addition, the possibility of incorporating these wastes 20 in plaster matrices was studied by determining its rendering in an operational context, finding out 21 its mechanical resistance to flexion and compression at 7 days, its reaction to fire as well as its weight 22 per unit of area and its thermal behaviour. The results show that in all cases, the waste is inert and 23 does not undergo leaching. The generation process of the waste determines the foam’s 24 microstructure in addition to its physical-chemical properties that directly affect building materials 25 in which they are included, thus offering different ways in which they can be applied. 26 Keywords: polymer waste; polyurethane foam; leaching test; microstructure 27 28 1. Introduction 29 According to the latest report published by Plastic Europe-the Facts 2017 [1], the demand for plastic 30 in Europe in 2016 was 49.9 MTn, 3.1% higher as regards 2014. Of this demand, 7.5% is polyurethane, 31 which implies an annual demand of 3.78 MTn in 2017. Of the 3.78 MTn, approximately 70% is in the 32 form of foam (1.40 MTn of flexible foam, 1.22 MTn rigid foam) 30% being that of polyurethane 33 elastomers and other products. Of the 2.62 MTn of PU foam, approximately 27% of waste is generated 34 (700.400 Tn), of which, 31.1% is recycled (220.000 Tn), 41.3% is incinerated (294.278 Tn) and the 35 remaining 27.3% is taken to landfill (193.120 Tn). The sectors according to the weighting for demand 36 are: Construction and building (24.5%); automotive (19.5%) refrigeration (21.3%) and other sectors 37 within textiles, usage in technology etc. (34.7%). The majority of polyurethane products such as low- 38 and high-density foam are thermostable [2]. The material is characterized by its lattice structure, 39 maintaining its shape and resistance under high-pressure and high-temperature conditions that end 40 up degrading, thus after it has been manufactured, and after it reaches gelation point, the material 41 cannot be melted in order to be remodeled into other products. As a consequence of this, the recycling 42 process of thermostable polyurethanes is complex and unprofitable (chemical, mechanical and 43 thermochemical recycling) [3]. As regards recovery techniques based on incineration in order to 44 regain energy, there are environmental disadvantages due to the emission of atmospheric 45 contaminants such as HCB dioxins and the emission of fine particles [4]. These disadvantages along 46 Preprints (www.preprints.org) | NOT PEER-REVIEWED | Posted: 17 December 2018 doi:10.20944/preprints201812.0191.v1 © 2018 by the author(s). Distributed under a Creative Commons CC BY license. Peer-reviewed version available at Polymers 2019, 11, 359; doi:10.3390/polym11020359
-
Upload
khangminh22 -
Category
Documents
-
view
1 -
download
0
Transcript of Characterization of polyurethane foam waste for reuse in eco ...
Article 1
Characterization of polyurethane foam waste for 2
reuse in eco-efficient building materials 3
R. Gómez-Rojo 1, L. Alameda 2, Á. Rodríguez 3, V. Calderón 4 and S. Gutiérrez-González 5* 4 1 University of Burgos, Spain; [email protected] 5 2 University of Burgos, Spain; [email protected] 6 3 University of Burgos, Spain; [email protected] 7 4 University of Burgos, Spain; [email protected] 8 5 University of Burgos, Spain; [email protected] 9
10 * Correspondence: [email protected]; Tel.: +34 947 259 436 11 12
Abstract: In the European Union, the demand for polyurethane is continually growing. In 2017, the 13 estimated production value of polyurethane was 700,400T, of which 27.3% is taken to landfill, which 14 causes an environmental problem. In this paper the behaviour of various polyurethane foams from 15 the waste of different types of industries will be analysed with the aim of assessing their potential 16 use in construction materials. In order to this, the wastes were chemically tested by means of CHNS, 17 TGA, and leaching tests. They were tested microstructurally by means of SEM. The processing 18 parameters of the waste was calculated after finding out its granulometry and its physical properties 19 i.e. density and water absorption capacity. In addition, the possibility of incorporating these wastes 20 in plaster matrices was studied by determining its rendering in an operational context, finding out 21 its mechanical resistance to flexion and compression at 7 days, its reaction to fire as well as its weight 22 per unit of area and its thermal behaviour. The results show that in all cases, the waste is inert and 23 does not undergo leaching. The generation process of the waste determines the foam’s 24 microstructure in addition to its physical-chemical properties that directly affect building materials 25 in which they are included, thus offering different ways in which they can be applied. 26
Keywords: polymer waste; polyurethane foam; leaching test; microstructure 27 28
1. Introduction 29
According to the latest report published by Plastic Europe-the Facts 2017 [1], the demand for plastic 30 in Europe in 2016 was 49.9 MTn, 3.1% higher as regards 2014. Of this demand, 7.5% is polyurethane, 31 which implies an annual demand of 3.78 MTn in 2017. Of the 3.78 MTn, approximately 70% is in the 32 form of foam (1.40 MTn of flexible foam, 1.22 MTn rigid foam) 30% being that of polyurethane 33 elastomers and other products. Of the 2.62 MTn of PU foam, approximately 27% of waste is generated 34 (700.400 Tn), of which, 31.1% is recycled (220.000 Tn), 41.3% is incinerated (294.278 Tn) and the 35 remaining 27.3% is taken to landfill (193.120 Tn). The sectors according to the weighting for demand 36 are: Construction and building (24.5%); automotive (19.5%) refrigeration (21.3%) and other sectors 37 within textiles, usage in technology etc. (34.7%). The majority of polyurethane products such as low- 38 and high-density foam are thermostable [2]. The material is characterized by its lattice structure, 39 maintaining its shape and resistance under high-pressure and high-temperature conditions that end 40 up degrading, thus after it has been manufactured, and after it reaches gelation point, the material 41 cannot be melted in order to be remodeled into other products. As a consequence of this, the recycling 42 process of thermostable polyurethanes is complex and unprofitable (chemical, mechanical and 43 thermochemical recycling) [3]. As regards recovery techniques based on incineration in order to 44 regain energy, there are environmental disadvantages due to the emission of atmospheric 45 contaminants such as HCB dioxins and the emission of fine particles [4]. These disadvantages along 46
Preprints (www.preprints.org) | NOT PEER-REVIEWED | Posted: 17 December 2018
© 2018 by the author(s). Distributed under a Creative Commons CC BY license.
Preprints (www.preprints.org) | NOT PEER-REVIEWED | Posted: 17 December 2018 doi:10.20944/preprints201812.0191.v1
© 2018 by the author(s). Distributed under a Creative Commons CC BY license.
Peer-reviewed version available at Polymers 2019, 11, 359; doi:10.3390/polym11020359

2
with the large amounts of waste taken to landfill, give rise to thinking of alternative recovery of this 47 type of waste. During the past decade, European obligations to control the environmental impact of 48 waste incineration (Directive 2000/76/CE) [5] and of landfill of waste (Directive 2008/98/CE) [6] have 49 led to the increase cost of these waste treatment options. These costs will increase as more strict 50 controls are introduced, as taxes on landfill and on incineration increase, further encouraging reuse. 51
There are several papers where the option of reusing polyurethane foam waste, combined with pitch 52 binders, has been researched and PU foam waste used as a dry aggregate in different cement or 53 gypsum matrices. Studies on cement and PU mortars have shown that there is a positive influence of 54 these recycled aggregates on their manufacture which insures excellent durability even with regard 55 to other traditional aggregates [7]. Previous research has led us to think that this polymer is able to 56 reduce the amount of sand in cement mortars by substituting sand with PU by between 13-33% [8], 57 25-50% [9] or even 25-100% [10], all of these taking into account substitution in volume. The choice of 58 the volume of substitution depends on the characteristics that are desired to be achieved in the final 59 product. Products that are considerably more flexible and hydrophobic than other conventional 60 materials [11] could potentially be obtained. In reference to research on gypsum material with 61 polyurethane, the results are shown that establish the compatibility of the PU waste with a gypsum-62 based aggregate by combining different amounts of the PU waste in order to obtain a new cladding 63 material for façades with thermal insulation properties [12]. Other research has advanced the design 64 of this material, incorporating it in prefabricated gypsum materials that is extremely light-weight and 65 has thermal and sound insulation properties. Laboratory tests have been carried out to improve the 66 mechanical properties of these materials by means of the inclusions of additives and fibres [13]. 67 Nevertheless, there is still a long way to go in order to optimise the properties of these materials. 68 Fundamentally, in terms of its fire reaction properties and acoustic improvements. One of the key 69 parameters for this is a thorough study of the waste’s physical, chemical and micro structural 70 characteristics, which can vary depending on its provenance. 71
The aim of this research is centred on the analysis of the properties of five polyurethane wastes from 72 different industries with a view to assess its potential reuse in prefabricated, gypsum-based 73 construction materials. The intention by doing so, is to provide an alternative to the current practice 74 of incineration and recycling options in accordance with the criteria established in the European 75 Parliament Directive 2008/98/CE and the European Council 19 November 2008 Directive on waste. 76
2. Materials and Methods 77
In order to determine the viability of using polyurethane waste cells to outline the possibility of 78 its use in new building materials, five types were selected from different industries and chemical 79 characterization tests were carried out using elemental analysis (CHNS), thermal gravimetric analysis 80 and waste leaching test were also carried out. In order for them to be incorporated into new materials 81 as a dry aggregate, the waste must be previously processed. After this, the granulometry is 82 determined and the processing parameters are calculated as well as their physical characterization 83 analysis which determines their real and apparent density, their ability to absorb water. Finally, they 84 are microstructurally characterized using Scanning Electron Microscopy (SEM). 85
3.1. Materials 86
Five polyurethane foams from different industries were analysed (Figure 1): 87
(P), (B), from the refrigeration insulation industry in Cuenca, Spain. 88
(I) from the refrigeration insulation industry in Zaragoza, Spain. 89
(A) from the automotive industry in France 90
Preprints (www.preprints.org) | NOT PEER-REVIEWED | Posted: 17 December 2018 Preprints (www.preprints.org) | NOT PEER-REVIEWED | Posted: 17 December 2018 doi:10.20944/preprints201812.0191.v1
Peer-reviewed version available at Polymers 2019, 11, 359; doi:10.3390/polym11020359

3
(SG) from scrap vehicles, Madrid (Spain) 91
The definition of each polymeric waste is: 92
(P): Rigid yellow polyurethane foam waste, in powder, compressed into pellet form (Pellets). The 93 waste is generated in the manufacture of insulation panels for the refrigeration sector. The waste is 94 produced by trimming edges during the production stage. 95
(B): Rigid yellow polyurethane foam waste, in the form of plates (Block). Waste generated in the 96 manufacture of insulation panels for the refrigeration sector. The waste comes from rejected panels 97 and remnants of panels used in factory tests. 98
(I): Rigid yellow polyurethane foam waste in the form of plates (Block). The waste is generated in the 99 manufacture of insulation panels for the refrigeration sector and comes from factory waste. 100
(A): Semi-rigid grey polyurethane foam waste, which comes in pieces and powder form, it is 101 compressed into a pellet shape. The waste is generated in the manufacture of automobiles. 102
(SG): Semi-rigid polyurethane foam waste; they are remains of car seats from scrapped cars. 103
104
105 Figure 1. Polyurethane foams from different industries. 106
107
108
Company Origin Presentation Nomenclature
PAP Insulating panels for the refrigeration sector
PELLETS P
PAP Insulating panels for the refrigeration sector
BLOCK B
ITALPANNELLI Insulating panels for the refrigeration sector
BLOCK I
ANTOLÍN Manufacture of automobiles
PELLETS A
SIGRAUTO Car seats BLOCK SG
Preprints (www.preprints.org) | NOT PEER-REVIEWED | Posted: 17 December 2018 Preprints (www.preprints.org) | NOT PEER-REVIEWED | Posted: 17 December 2018 doi:10.20944/preprints201812.0191.v1
Peer-reviewed version available at Polymers 2019, 11, 359; doi:10.3390/polym11020359
4
3.2. Methods 109
Elemental Analysis (CHNS) 110
This technique is used for the quantitative determination of carbon (C), hydrogen (H), nitrogen (N) 111 and sulphur (S) in all sample types, to obtain the oxide content, measured as a percentage of the 112 weight. The equipment used is a LECO Analyzer CHNS-932 and VTF-900. The analysis technique is 113 fully automated, and is based on the combustion of the samples under optimum conditions (T = 950-114 1,100ºC in pure oxygen atmosphere) to convert the aforementioned elements into simple gases (CO2, 115 N2, H2O and SO2) to achieve a quantitative determination of C, N, H and S content. 116
Waste Leaching test 117
This test was carried out according to the UNE-EN 12457-2 Standard [14]. A sample of waste is placed 118 in a bottle with a certain amount of water, and placed in a stirring device for 24 hours. Once the 119 mixture is stirred and filtered, the eluate (liquid to be tested) is obtained. Tests like pH, Electrical 120 conductivity (EC), Salt and TDS (total dissolved solids) were obtained. It is necessary to make a blank 121 with distilled water, before testing the eluate. 122
Thermogravimetric analysis (TGA) 123
This technique measures the change in mass of a sample, while being heated at a constant speed. In 124 this case, it is used to find out the degradation temperature of the waste, thus outlining the working 125 temperature of the material. The waste samples used in this test were previously processed. The 126 equipment used, is a Q600 thermal analyser TA Instruments (TGA/DSC), which simultaneously 127 provides a true measurement on the same sample from room temperature to 1500°C of heat flow 128 (DSC) and weight change (TGA). It has a dual balance mechanism, a twin conductor, and horizontal 129 purge gas system with mass flow control and gas switching capability. This equipment is joined via 130 a TG interface to an F-TIR spectrometer, which also facilitates the simultaneous analysis by infrared 131 spectroscopy of the gases produced in the decomposition of the substances studied. 132
Density 133
To calculate the real density of the polymer waste, test principles for natural stone, according to the 134 UNE-EN 1936: 2007 Standard [15] were applied, using the pycnometer method. It is necessary to 135 crush a sample of raw material until a fineness of particle capable of passing through a 0.063 mm 136 sieve is achieved. A 10 g sample of material in isopropyl alcohol is placed into the pycnometer and 137 then weighed. The pycnometer is cleaned, filled with isopropyl alcohol again and reweighed. The 138 real density (in Kg / m³) is calculated by means of the ratio between the mass of the dry and crushed 139 test piece, and the volume of liquid displaced by the mass. 140
To determine the apparent density of the different wastes used is this research, its weight / volume 141 ratio was calculated. The procedure consists of filling a container with a specific volume and it is 142 weighed, then the weight / volume equation is applied. In this case, a 1 litre capacity container was 143 used as a reference, which was filled with crushed waste and then weighed. 144
Water absorption capacity 145
In this test, that which is established in standard UNE-EN 13755:2008 [16] was adapted. The test 146 consists of placing the material to be tested (dry and with constant mass), into a container filled with 147 water until fully covered, for 24 hours. At the end of that period of time, the material is weighed and 148 is placed back into the water for another 24 hours. The material is weighed yet again and if it can be 149 observed that there is a constant weight that does not differ from the previous day, the material has 150 reached saturation. 151
Preprints (www.preprints.org) | NOT PEER-REVIEWED | Posted: 17 December 2018 Preprints (www.preprints.org) | NOT PEER-REVIEWED | Posted: 17 December 2018 doi:10.20944/preprints201812.0191.v1
Peer-reviewed version available at Polymers 2019, 11, 359; doi:10.3390/polym11020359
5
Then the following equation is applied: 152
Ab = (Saturated weight - Dry weight)/ Dry weight) x 10088 153
Laser granulometry 154
The different foams were crushed, and their granulometric size was determined through laser 155 granulometry diffraction using a HELOS 12K SYMPATEC analyser. The samples were analysed for 156 15 s in an isopropyl alcohol suspension. 157
Processing parameters 158
The processing parameters were defined by determining cutting time, crushing time and the energy 159 of the crushing. 160
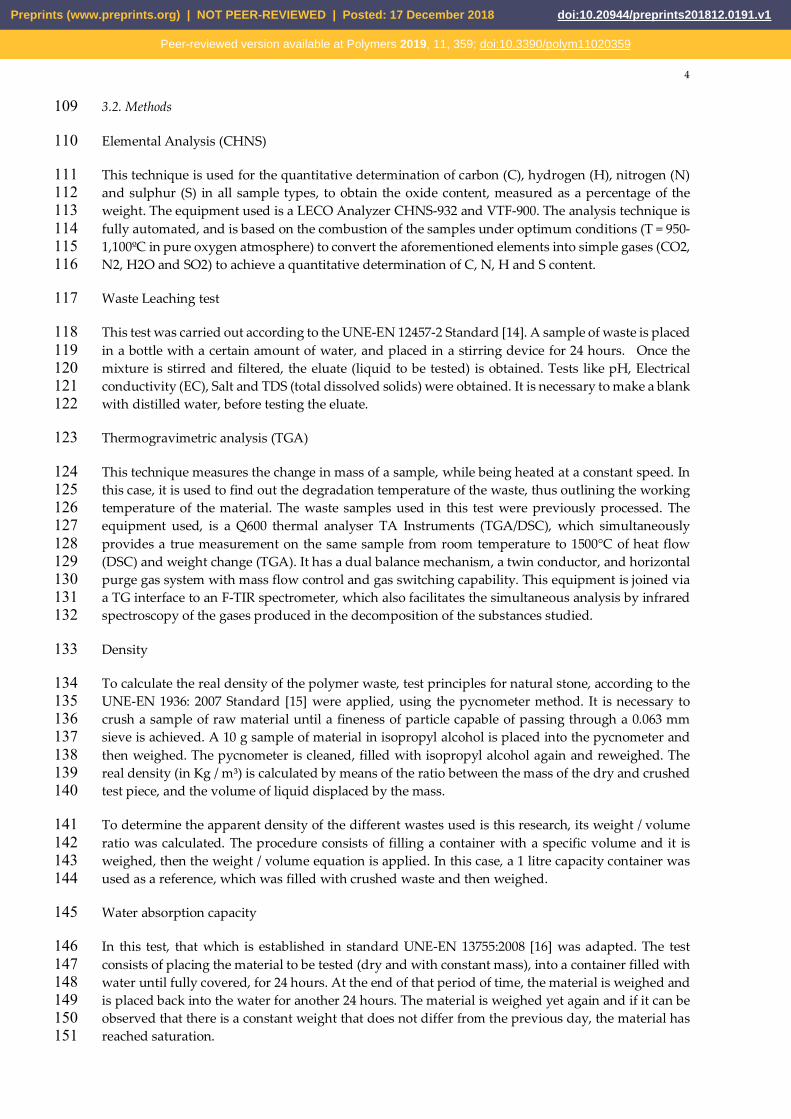
It is necessary to process the polyurethane foam to be used in the tests (B), (SG) and (I) wastes are 161 split into smaller pieces. These pieces are placed in a RETSCH SM100 Mill, where they undergo a 162 crushing and sieving process (Figure 2). The pellets (P and A) are directly placed into the crusher. 163
164 Figure 2. Previous Processing of Polyurethane foam waste 165
Scanning Electron Microscopy (SEM) 166
This technique, allows for the microscopic structure of the different polyurethanes (closed-cell 167 open-cell) to be discovered. For this test, the waste samples did not undergo processing. 168
The equipment used, is a Microscope FEI Quanta-600, which allows for the observation and 169 characterization of samples by obtaining high-resolution imaging of organic and inorganic materials 170 at high magnifications. The equipment can be used in high vacuum, acting as a traditional scanning 171 electron microscope (SEM), and can work in environmental mode (ESEM). The latter mode allows 172 observation without coating or metallizing the sample, which makes it a non-destructive technique. 173 The equipment is also used alongside two sets of X-ray microanalysers, the EDX and WDX Oxford 174 that allows for elemental analysis in a timely manner, or the compositional mapping of specific areas 175 of the materials studied. 176
3. Results and Discussion 177
3.1. Elementary analysis (CNHS) 178
Table 1 shows the results of the carbon, nitrogen and sulphur components of each of the wastes that 179 were analysed. As was expected, carbon was the majority component of all the polymer wastes. In 180 each case they had a similar percentage of carbon. The analysis also confirmed the existence of 181 hydrogen and nitrogen in smaller proportions with respect to the whole of the waste. As regards the 182 other components that each waste has, it could be asserted that as it is a case of polyurethane, there 183 is a significant amount of oxygen [17] and other components associated with the possible impurities 184 each foam may contain. For example, when it comes to foams that come from the scrapped vehicle 185 seats (SG), it can contain metals linked to elements from the actual seat such as copper or aluminium, 186 which will later me identified in the scanning electron microscopy test. On no occasion was the 187 presence of sulphur detected. 188
Preprints (www.preprints.org) | NOT PEER-REVIEWED | Posted: 17 December 2018 Preprints (www.preprints.org) | NOT PEER-REVIEWED | Posted: 17 December 2018 doi:10.20944/preprints201812.0191.v1
Peer-reviewed version available at Polymers 2019, 11, 359; doi:10.3390/polym11020359

6
Table 1. Results of Results CNHS Analysis of different PU waste 189
Waste Chemical element (%)
C H N S Others P 64.48 5.63 6.74 0.00 23.15 B 62.06 5.07 6.58 0.00 26.29
SG 64.67 7.75 4.80 0.00 22.78 A 63.74 6.15 6.04 0.00 24.07 I 63.34 5.58 7.28 0.00 23.80
3.2. Thermogravimetric Analysis (TGA) 190
The Tga test results show the % loss of weight of the different wastes when the temperature increases. 191
Wastes (P) and (B) come from the same company and have the same isocyanate polyol component 192 composition of. The difference between them both is the presence of metal impurities that (P) has 193 with respect to (B), which shows as being totally clean. This difference is noted in the loss of mass, 194 which in the case of (P) occurs at 280ºC, and that does not occur in waste (B). In both cases the first 195 degradation occurs at around 200ºC, polymer decomposition occurs from 325ºC to 550ºC (Figure 3). 196
197 Figure 3. Tga of the polyurethanes(P)-Fig.3a. and (B)-Fig.3b. that come from the insulatioin industry 198 for refrigeration from teh Paneles Aislantes Peninsulares Factory 199
In the case of foam (I) (Figure 4), it shows a very similar behaviour to that of foam (B). Both of them 200 come from the insulation for refrigeration industry and have a similar initial mass loss at 238º C and 201 the total decomposition of the polymer occurs between 345ºC-450 º C. 202
203 Figure 4. TGA of polyurethane (I) that come from the insulation industry for refrigeration from the Italpannelli 204 factory 205
0.0
0.2
0.4
0.6
0.8
Der
iv. W
eigh
t (%
/°C
)
20
40
60
80
100
Wei
ght (
%)
0 200 400 600 800
Temperature (°C)
AM18-015-01 PELLET 1 4mm.001––––––– AM18-015-01 PELLET 1 4mm rep2.001– – – – AM18-015-01 PELLET 1 4mm rep 3.001––––– ·
Universal V4.7A TA Instruments
0.0
0.2
0.4
0.6
0.8
1.0
Der
iv. W
eigh
t (%
/°C
)
20
40
60
80
100
Wei
ght (
%)
0 200 400 600 800
Temperature (°C)
AM18-015-02 BLOQUE 2 2mm.001––––––– AM18-015-02 BLOQUE 2 2mm rep 2.001– – – – AM18-015-02 BLOQUE 2 2mm rep 3.001––––– ·
Universal V4.7A TA Instruments
Preprints (www.preprints.org) | NOT PEER-REVIEWED | Posted: 17 December 2018 Preprints (www.preprints.org) | NOT PEER-REVIEWED | Posted: 17 December 2018 doi:10.20944/preprints201812.0191.v1
Peer-reviewed version available at Polymers 2019, 11, 359; doi:10.3390/polym11020359

7
In the case of flexible foam (SG), a minimal loss of mass was observed at 280 º C, probably due to the 206 metal impurities that car seats contain. The loss of mass corresponding to the polymer’s 207 decomposition occurs between 400ºC and 550ºC (Figure 5a). In the case of foam (A), three different 208 mass losses occur (Figure 5b). The first of these losses occurs at 320ºC with a significant degradation 209 of the material. The second loss occurs at 400ºC which corresponds to the polymers degradation and 210 the last stage occurs at 500ºC, which corresponds to the loss of other components in this foam.211
212 Figure. 5. The Tga of polyurethanes (SG) - Fig. 5a. and Fig.5b that come from the insulation industry for refrigeration, 213
from the Paneles Aislantes Peninsulares factory. 214
These results indicate that the thermal behaviour of the material is acceptable [18]. Thus, this thermal 215 analysis technique is a highly useful tool for studying the reuse of these polymers, with no chemical 216 or physical changes detected. 217
3.3. Scanning Electron Microscopy (SEM) 218
Generally speaking, polymeric cellular materials can be defined by a two-phased structure in which 219 the gaseous phase stemming from a foaming agent, whether physical or chemical, was dispersed 220 throughout a solid polymeric matrix [19]. Foam is a specific type of cellular material that is generated 221 by the expansion of a material in liquid form. This is the case of wastes type (B), (I) and (SG) that were 222 analysed in this research. However, there are processes subsequent to foaming that cause a loss of 223 cellular structure of the polymer. This is the case for wastes (P) and (A) that are obtained by means 224 of a milling process that generates particles of an extremely fine nature that are also compressed. 225 This causes a structure with layers of polymer that are very different from that of the wastes obtained 226 differently and have sheets of foamed polyurethane. (Figures 6a-6d). 227
-0.5
0.0
0.5
1.0
1.5
2.0
Der
iv. W
eigh
t (%
/°C
)
0
20
40
60
80
100
120
Wei
ght (
%)
0 200 400 600 800
Temperature (°C)
AM18-015-03 SG3 4mm.001––––––– AM18-015-03 SG3 4mm rep 2.001– – – – AM18-015-03 SG3 4mm rep 3.001––––– ·
Universal V4.7A TA Instruments
0.0
0.2
0.4
0.6
0.8
1.0
Der
iv. W
eigh
t (%
/°C
)
0
20
40
60
80
100
Wei
ght (
%)
0 200 400 600 800
Temperature (°C)
AM18-015-04 ANTOLIN 4mm.001––––––– AM18-015-04 ANTOLIN 4 4mm rep 2.001– – – – AM18-015-04 ANTOLIN 4 4mm rep 3.001––––– ·
Universal V4.7A TA Instruments
Preprints (www.preprints.org) | NOT PEER-REVIEWED | Posted: 17 December 2018 Preprints (www.preprints.org) | NOT PEER-REVIEWED | Posted: 17 December 2018 doi:10.20944/preprints201812.0191.v1
Peer-reviewed version available at Polymers 2019, 11, 359; doi:10.3390/polym11020359

8
228 Figure 6. Microstructure of the PU waste (P)-Fig.6a-6b. y (A)-Fig.6c-6d by SEM 229
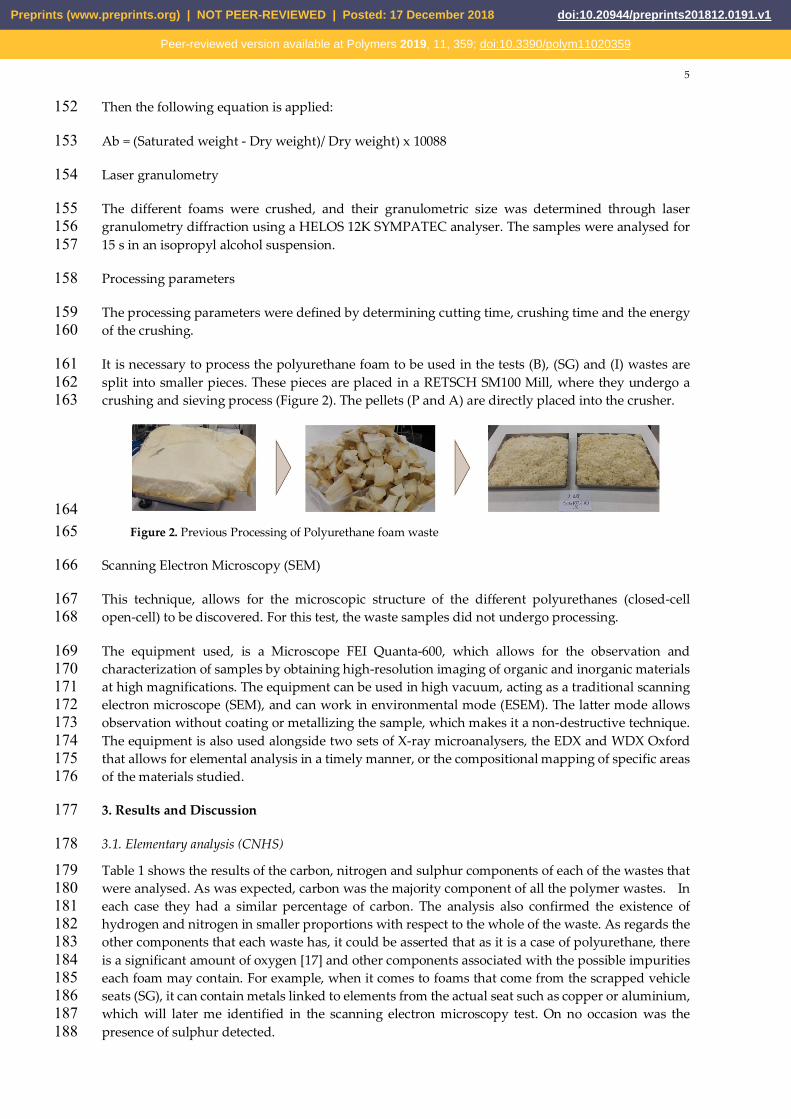
The cellular materials are classified according to their cellular structure and the cell connectivity. In 230 the case of foam type (B), the structure is an intermediate structure and it can be seen that a portion 231 of the cellular structures is formed by an open-cell structure while the other portion of the cellular 232 structure is formed of a closed-cell structure (Figure 7a-7b). In this case, the walls are of a 10 µm 233 thickness and the cells have a diameter of between 10 and 40 8 µm. Foam type (I) has a closed-cell 234 structure in which the gas is occluded in the interior of the cells. The cells are largely homogeneous 235 in terms of the size of which they are comprised, between 100-200 µm (Figure 7c-7d). Flexible foam 236 (SG) has an open-cell structure where gas can freely circulate between the cells since they are 237 interconnected with each other, which can cause an improvement in the acoustic properties [20]. 238 (Figure 7e-7f). In this case, a characteristic that is typical of this type of foam can be observed, that is 239
Preprints (www.preprints.org) | NOT PEER-REVIEWED | Posted: 17 December 2018 Preprints (www.preprints.org) | NOT PEER-REVIEWED | Posted: 17 December 2018 doi:10.20944/preprints201812.0191.v1
Peer-reviewed version available at Polymers 2019, 11, 359; doi:10.3390/polym11020359
9
the presence of pores in the cells’ interconnecting walls, as well as the presence of metal impurities.240
241 Figure 7. Microestructure of the PU waste (B)-Fig.7a-7b; (I)-Fig.7c-7d and (A)-Fig.7d-7e by SEM 242
3.4. Waste Leaching test 243
One of the processes that must be monitored when using waste materials as raw materials in 244 construction, is leaching. It is common for the materials to be in contact with water or dampness, 245 which could cause a leaching process [21]. In view of the results obtained from the leaching test (Table 246 2), it can be observed that the electrical conductivity does not exceed that maximum value permitted 247 (3000 µs/cm). As for the maximum amount of the total of dissolved solids (500 mg/L), on no occasion 248 was this amount exceeded. The values were always lower than 100 mg/L. The Ph levels were also 249 within the permitted range (5,5-9). It can therefore be established that the wastes analysed do not 250 display any contaminating behaviour when in contact with water or dampness thus they can be used 251 in construction materials. 252
Preprints (www.preprints.org) | NOT PEER-REVIEWED | Posted: 17 December 2018 Preprints (www.preprints.org) | NOT PEER-REVIEWED | Posted: 17 December 2018 doi:10.20944/preprints201812.0191.v1
Peer-reviewed version available at Polymers 2019, 11, 359; doi:10.3390/polym11020359

10
253 Table 2. Electrical connectivity, total of dissolved solids, salt and the pH of the different wastes 254
Waste EC (µs/cm) TDS (mg/L) Salt (mg/L) pH Distilled water 1.8 1.24 Out of scale 6.6
P 38.2 19.7 14.3 6.6 B 63.4 40.5 28.3 7.5
SG 149.2 95.4 69.0 7.9 A 27.9 21.5 15.6 7.7 I 32.8 20.7 15.3 6.8
3.5. Processing parameters 255
In Graph 1 the preparation (cutting) and crushing times are outlined, as well as the energy used in 256 the processing of 1 Kg of waste. 257
In this paper, wastes in slab form (I), board (B) as a whole (SG) and in pellet form (P), (A) were 258 studied. In the case of wastes (I), (B) and (SG) it was necessary to cut then prior to placing them into 259 the shredder. It must be taken into consideration that the process is carried out on a laboratory scale 260 in which the shredder has a limited input capacity. In this case, the waste that needed the least 261 amount of cutting time was waste (I) explained by the fact that it is has a compact closed-cell structure 262 and is more rigid than the other foams. The foam that needed the most amount of time was type (SG), 263 60 minutes shredding per Kg of the sample, as this is a flexible, highly pliable and difficult to handle 264 foam. As regards machine shredding time, the values proportionally vary to the prior cutting time. 265 In waste type (P) the duration of shredding took the least amount of time (6 minutes). This is followed 266 by type (I) with 20 minutes. The longest time is for waste (SG), there was additional difficulty in 267 working with the waste due to the machine’s sieve becoming blocked due to the nature of this type 268 of foam. The use of energy. 269
270 Graph 1. Cutting time, grinding time and energy consumption of different PU wastes 271
3.6. Laser diffraction granulometry 272
The granulometric study focussed on sizes less than 1mm. Graph 2 shows the granulometric results 273 of the different wastes in sizes smaller than 1 mm. In view of the results, it can be observed that wastes 274 in powder form (P), (A) have a very similar particle size with an average diameter of 229µm and 275 271µm respectively. The waste in the form of a slab (I) has a diameter of 194µm, noticeably greater 276 than the board shaped waste (B). The most significant difference can be observed in waste (SG) with 277 an average particle size of 401 µm and parts that can reach 772µm. The particle size distribution in 278
Preprints (www.preprints.org) | NOT PEER-REVIEWED | Posted: 17 December 2018 Preprints (www.preprints.org) | NOT PEER-REVIEWED | Posted: 17 December 2018 doi:10.20944/preprints201812.0191.v1
Peer-reviewed version available at Polymers 2019, 11, 359; doi:10.3390/polym11020359

11
the different wastes, alongside the real density values will determine the final mechanical properties 279 of the construction material [22]. Such is the case of plasters with dry aggregate of waste polyurethane 280 that will be studied in the following section. 281
282 Graph 2. Granulometric curve (Volume %) of different PU wastes 283
3.7. Determination of apparent and real density. Water absorption capacity 284
Another parameter that strongly determines the material’s final properties and as a consequence, 285 how it can be applied is density. On looking at the results of Table 3, it can be observed that wastes 286 with a higher apparent density are those that have been compressed into pellet form (P), (A), which 287 indicates that in a lessor volume there is space for a larger amount of the material. This factor is due 288 to the material’s extreme fineness and to the polyurethane being arranged in layers. This was 289 previously observed microstructurally by SEM imagery. The polymer with the lowest apparent 290 density was the flexible waste (SG) with 72% less. As can be observed, the apparent densities are, in 291 all cases, very low. This indicates that there was a problem related with the storage of this type of 292 waste as well as its transportation and keeping since a low weight of the materials occupies a large 293 volume [23]. The water absorption capacity of each waste varies according to the foam’s structure 294 and morphology. Thus, the flexible foam (SG) is the foam that showed the greatest absorption 295 capacity. This is probably due to the highly porous nature of its cells, which is further accentuated by 296 the presence of pores in between the cell walls. As it is a case of an open cell structure (Fig. 7e-7f), the 297 water enters the interior of the foam more easily. Both waste (B) and waste (I) showed lower 298 absorption capacity caused by a semi-closed and closed cell structure respectively. 299
Table 3. Results of apparent density, real density and total water absorption of different PU waste 300
301
302
303
304
3.8. The possibilities of the uses of the wastes studied 305
One of the ultimate aims of this research is to improve the use of these types of foams and expanding 306 this use in the industries that generate polyurethane, in this way improve the ratio of the volume of 307 reused PU. One option is to incorporate the processed waste as a dry aggregate in plaster matrices. 308 Different substitutions have been made in previous studies, of plaster type A1 for rigid PU foam 309 waste [24, 25]. The conclusion was reached that the optimal ratio of components in volume could be 310
Waste Apparent density (Kg/m3)
Real density (Kg/m3)
Total absorption (%)
P 141.7 1052.7 2.0 B 45.5 1370.9 28.0
SG 39.8 1211.1 645.0 A 86.1 1378.6 333.5 I 56.0 1105.0 49.0
Preprints (www.preprints.org) | NOT PEER-REVIEWED | Posted: 17 December 2018 Preprints (www.preprints.org) | NOT PEER-REVIEWED | Posted: 17 December 2018 doi:10.20944/preprints201812.0191.v1
Peer-reviewed version available at Polymers 2019, 11, 359; doi:10.3390/polym11020359
12
(1/1.5), that is, 1part gypsum with 1.5 parts of polyurethane foam waste. This study used all of the 311 wastes characterised in this paper. 312
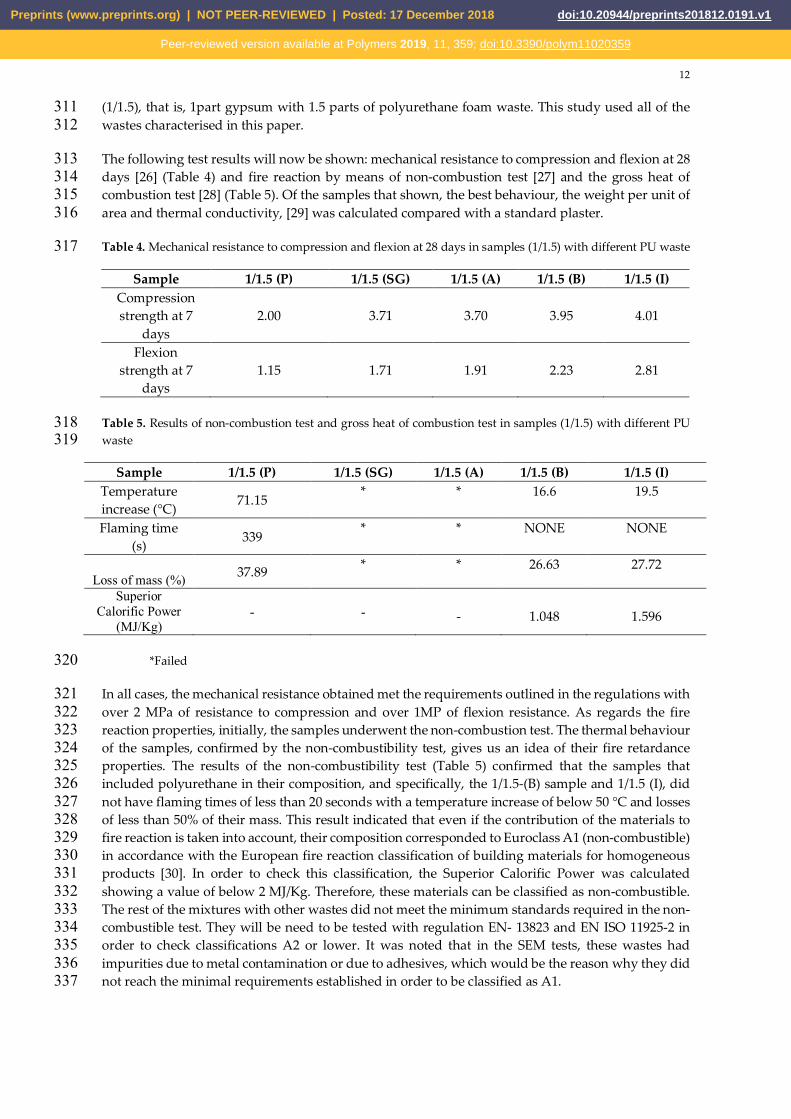
The following test results will now be shown: mechanical resistance to compression and flexion at 28 313 days [26] (Table 4) and fire reaction by means of non-combustion test [27] and the gross heat of 314 combustion test [28] (Table 5). Of the samples that shown, the best behaviour, the weight per unit of 315 area and thermal conductivity, [29] was calculated compared with a standard plaster. 316
Table 4. Mechanical resistance to compression and flexion at 28 days in samples (1/1.5) with different PU waste 317
Table 5. Results of non-combustion test and gross heat of combustion test in samples (1/1.5) with different PU 318 waste 319
*Failed 320
In all cases, the mechanical resistance obtained met the requirements outlined in the regulations with 321 over 2 MPa of resistance to compression and over 1MP of flexion resistance. As regards the fire 322 reaction properties, initially, the samples underwent the non-combustion test. The thermal behaviour 323 of the samples, confirmed by the non-combustibility test, gives us an idea of their fire retardance 324 properties. The results of the non-combustibility test (Table 5) confirmed that the samples that 325 included polyurethane in their composition, and specifically, the 1/1.5-(B) sample and 1/1.5 (I), did 326 not have flaming times of less than 20 seconds with a temperature increase of below 50 °C and losses 327 of less than 50% of their mass. This result indicated that even if the contribution of the materials to 328 fire reaction is taken into account, their composition corresponded to Euroclass A1 (non-combustible) 329 in accordance with the European fire reaction classification of building materials for homogeneous 330 products [30]. In order to check this classification, the Superior Calorific Power was calculated 331 showing a value of below 2 MJ/Kg. Therefore, these materials can be classified as non-combustible. 332 The rest of the mixtures with other wastes did not meet the minimum standards required in the non-333 combustible test. They will be need to be tested with regulation EN- 13823 and EN ISO 11925-2 in 334 order to check classifications A2 or lower. It was noted that in the SEM tests, these wastes had 335 impurities due to metal contamination or due to adhesives, which would be the reason why they did 336 not reach the minimal requirements established in order to be classified as A1. 337
Sample 1/1.5 (P) 1/1.5 (SG) 1/1.5 (A) 1/1.5 (B) 1/1.5 (I) Compression strength at 7
days 2.00 3.71
3.70 3.95
4.01
Flexion strength at 7
days 1.15 1.71
1.91 2.23
2.81
Sample 1/1.5 (P) 1/1.5 (SG) 1/1.5 (A) 1/1.5 (B) 1/1.5 (I) Temperature increase (°C) 71.15 * * 16.6 19.5
Flaming time (s) 339 * * NONE NONE
Loss of mass (%) 37.89 * * 26.63 27.72
Superior Calorific Power
(MJ/Kg) - -
-
1.048
1.596
Preprints (www.preprints.org) | NOT PEER-REVIEWED | Posted: 17 December 2018 Preprints (www.preprints.org) | NOT PEER-REVIEWED | Posted: 17 December 2018 doi:10.20944/preprints201812.0191.v1
Peer-reviewed version available at Polymers 2019, 11, 359; doi:10.3390/polym11020359
13
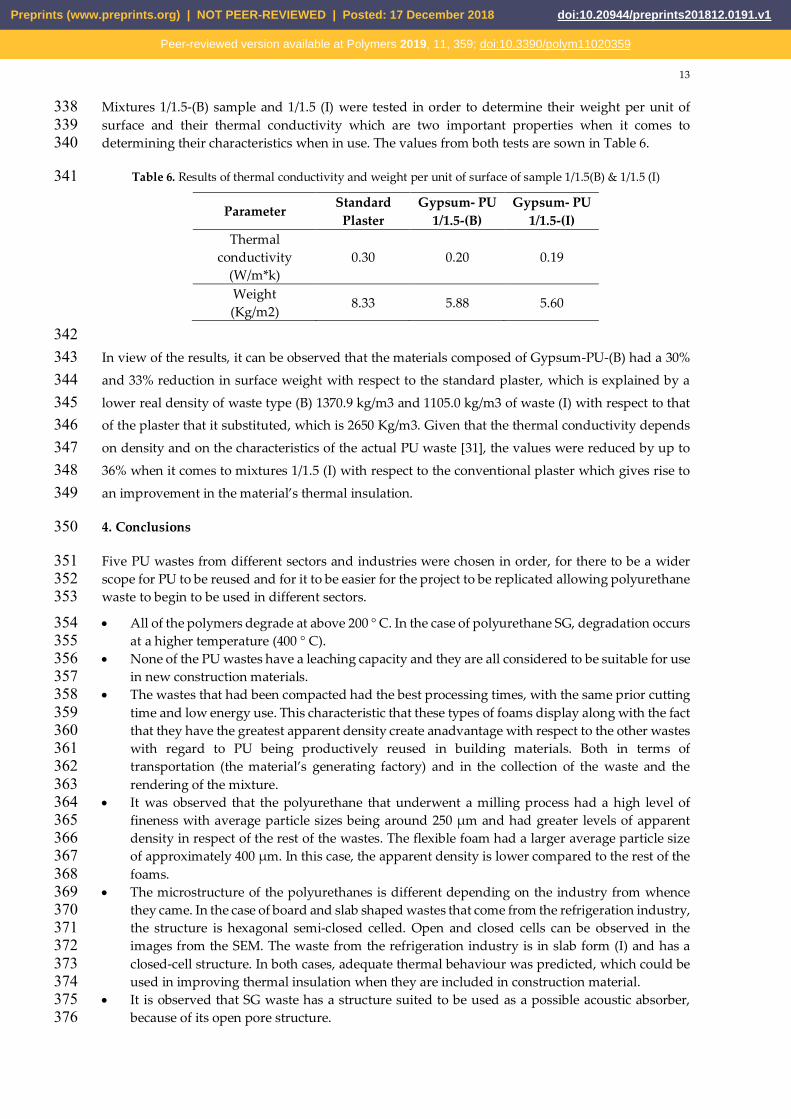
Mixtures 1/1.5-(B) sample and 1/1.5 (I) were tested in order to determine their weight per unit of 338 surface and their thermal conductivity which are two important properties when it comes to 339 determining their characteristics when in use. The values from both tests are sown in Table 6. 340
Table 6. Results of thermal conductivity and weight per unit of surface of sample 1/1.5(B) & 1/1.5 (I) 341
Parameter Standard Plaster
Gypsum- PU 1/1.5-(B)
Gypsum- PU 1/1.5-(I)
Thermal conductivity
(W/m*k) 0.30 0.20 0.19
Weight (Kg/m2) 8.33 5.88 5.60
342 In view of the results, it can be observed that the materials composed of Gypsum-PU-(B) had a 30% 343 and 33% reduction in surface weight with respect to the standard plaster, which is explained by a 344 lower real density of waste type (B) 1370.9 kg/m3 and 1105.0 kg/m3 of waste (I) with respect to that 345 of the plaster that it substituted, which is 2650 Kg/m3. Given that the thermal conductivity depends 346 on density and on the characteristics of the actual PU waste [31], the values were reduced by up to 347 36% when it comes to mixtures 1/1.5 (I) with respect to the conventional plaster which gives rise to 348 an improvement in the material’s thermal insulation. 349
4. Conclusions 350
Five PU wastes from different sectors and industries were chosen in order, for there to be a wider 351 scope for PU to be reused and for it to be easier for the project to be replicated allowing polyurethane 352 waste to begin to be used in different sectors. 353 All of the polymers degrade at above 200 ° C. In the case of polyurethane SG, degradation occurs 354
at a higher temperature (400 ° C). 355 None of the PU wastes have a leaching capacity and they are all considered to be suitable for use 356
in new construction materials. 357 The wastes that had been compacted had the best processing times, with the same prior cutting 358
time and low energy use. This characteristic that these types of foams display along with the fact 359 that they have the greatest apparent density create anadvantage with respect to the other wastes 360 with regard to PU being productively reused in building materials. Both in terms of 361 transportation (the material’s generating factory) and in the collection of the waste and the 362 rendering of the mixture. 363
It was observed that the polyurethane that underwent a milling process had a high level of 364 fineness with average particle sizes being around 250 µm and had greater levels of apparent 365 density in respect of the rest of the wastes. The flexible foam had a larger average particle size 366 of approximately 400 µm. In this case, the apparent density is lower compared to the rest of the 367 foams. 368
The microstructure of the polyurethanes is different depending on the industry from whence 369 they came. In the case of board and slab shaped wastes that come from the refrigeration industry, 370 the structure is hexagonal semi-closed celled. Open and closed cells can be observed in the 371 images from the SEM. The waste from the refrigeration industry is in slab form (I) and has a 372 closed-cell structure. In both cases, adequate thermal behaviour was predicted, which could be 373 used in improving thermal insulation when they are included in construction material. 374
It is observed that SG waste has a structure suited to be used as a possible acoustic absorber, 375 because of its open pore structure. 376
Preprints (www.preprints.org) | NOT PEER-REVIEWED | Posted: 17 December 2018 Preprints (www.preprints.org) | NOT PEER-REVIEWED | Posted: 17 December 2018 doi:10.20944/preprints201812.0191.v1
Peer-reviewed version available at Polymers 2019, 11, 359; doi:10.3390/polym11020359

14
The wastes that result from milling processes have a structure that is in the form of overlapping 377 layers with no defined hexagonal structure. In this case, the wastes had some metal impurities 378 in their structure associated with the actual milling process. 379
As a final aim of this research, there is the possibility of including the wastes in plaster matrices 380 in ratio with volume (1/1.5) thus obtaining adequate mechanical resistance to compression of 381 over 2 MPa, obtaining a reduction in thermal conductivity by 33% and a reduction in the weight 382 of the material by 31% was analysed. As regards the non-combustibility test and calorific value 383 test, only the rigid PU foam wastes (B), and (I) met the standards to have an A1 classification, 384 which is ideal for interior cladding materials for buildings. There was worse fire reaction 385 behaviour in samples (P), (A) and (SG) due to the impurities that they contain. Nevertheless, it 386 must be determined whether the classification in these two cases would be that of A2 or worse 387 and alternative ways for the material to be applied in different areas of a build will need to be 388 found. 389
Author Contributions: The following statements should be used “conceptualization, S.G.G.; methodology, L.A.; 390 software, R.G.R.; validation, S.G.G., A.R. and V.C.; formal analysis, S.G.G.; investigation, R.G.R.; resources, 391 S.G.G.; data curation, R.G.R.; writing—original draft preparation, S.G.G.; writing—review and editing, S.G.G.; 392 visualization, L.A.; supervision, S.G.G., A.R. and V.C.; funding acquisition, S.G.G.” 393 Funding: “This research was funded by LIFE PROGRAMME. EUROPEAN COMMISSION, grant number “LIFE 394 16 ENV/ES/000254” 395 Acknowledgments: This study was carried out within the framework of the “LIFE-REPOLYUSE “Recovery of 396 polyurethane for reuse in eco-efficient materials”. LIFE 16 ENV/ES/000254 Project. LIFE 2016. Environment Life 397 Programme. European Commission 398 Conflicts of Interest: “The authors declare no conflict of interest.” “The funders had no role in the design of the 399 study; in the collection, analyses, or interpretation of data; in the writing of the manuscript, or in the decision to 400 publish the results”. 401 402
References 403 404
1. Plastics, The Facts 2017. An analysis of European plastics production, demand and waste data. Plastics 405 Europe. Available online: 406 https://www.plasticseurope.org/application/files/5715/1717/4180/Plastics_the_facts_2017_FINAL_for407 _website_one_page.pdf (Accessed on 5th December 2018). 408
2. Członka, S.; Bertino, M.F.; Strzelec, K.; Strąkowska, A.; Masłowski, M. Rigid polyurethane foams 409 reinforced with solid waste generated in leather industry. Polymer Testing 2018, 69, 225-237. 410
3. Simón, D.; Borreguero, A.M.; Lucas, A.; Rodríguez, J.F. Recycling of polyurethanes from laboratory to 411 industry, a journey towards the sustainability. Waste Management 2018, 76,147-171. 412
4. Wang, Y.; Lai, N.; Zuo, J.; Chen, G.; Du, H. Characteristics and trends of research on waste-to-energy 413 incineration: A bibliometric analysis, 1999–2015. Renewable and Sustainable Energy Reviews 2016, 66, 95-414 104. 415
5. Directive 2000/76/EC of the European Parliament and of the Council of 4 December 2000 on the 416 incineration of waste. 417
6. Directive 2008/98/EC of the European Parliament and of the Council of 19 November 2008 on waste. 418 7. Junco, C.; Gadea, J.; Rodríguez, A.; Gutiérrez-González, S.; Calderón, V. Durability of lightweight 419
masonry mortars made with white recycled polyurethane foam. Cement & Concrete Composites 2012, 420 34, 1174-1179. 421
8. Mounanga, P.; Gbongbon, W.; Poullain, P.; Turcry, P. Proportioning and characterization of 422 lightweight concrete mixtures made with rigid polyurethane foam wastes. Cement & Concrete 423 Composites 2008, 30, 806-814. 424
9. Kismi M., Mounanga P. Comparison of short and long-term performances of lightweight aggregate 425 mortars made with polyurethane foam waste and expanded polystyrene beads. Proceedings on 2nd 426 International Seminar on Innovation and Valorization in Civil Engineering and Construction 427
Preprints (www.preprints.org) | NOT PEER-REVIEWED | Posted: 17 December 2018 Preprints (www.preprints.org) | NOT PEER-REVIEWED | Posted: 17 December 2018 doi:10.20944/preprints201812.0191.v1
Peer-reviewed version available at Polymers 2019, 11, 359; doi:10.3390/polym11020359

15
Materials. MATEC Web of Conferences, 2, 2012, article number 02019. doi: 428 10.1051/matecconf/20120201019. 429
10. Gadea, J.; Rodríguez, A.; Campos, P.L.; Garabito, J.; Calderón, V. Lightweight mortar made with 430 recycled polyurethane foam. Cement & Concrete Composites 2010, 32, 672-677. 431
11. Junco, C.; Rodríguez, A.; Calderón, V.; Muñoz-Rupérez, C.; Gutiérrez-González, S. Fatigue durability 432 test of mortars incorporating polyurethane foam wastes. Construction & Building Materials 2018,190, 433 373-381. 434
12. Gutiérrez-González, S.; Gadea, J.; Rodríguez, A.; Junco, C.; Calderón, V. Lightweight plaster materials 435 with enhanced thermal properties made with polyurethane foam wastes. Construction & Building 436 Materials 2012, 28,653-658. 437
13. Garabito, J., Alameda, L., Gadea, J., Gutiérrez-González, S. Influence of superplasticizers on the 438 properties of lightweight mortar plaster made with recycled polymers. Advanced Materials Research 439 2015, 1129, 546-553. 440
14. 12457-2:2003. Characterisation of waste - Leaching - Compliance test for leaching of granular waste 441 materials and sludges. part 1: one stage batch test at a liquid to solid ration of 2 l/kg with particle size 442 below 4 mm (without or with size reduction). CEN Comité Européen de Normalisation: European 443 Committee for Standardisation. 444
15. EN 1936:2007. Natural stone test methods - Determination of real density and apparent density, and 445 of total and open porosity. 446
16. EN 13755:2008. Natural stone test methods. Determination of water absorption at atmospheric 447 pressure. 448
17. Calderón, V.; Gutiérrez-González, S.; Gadea, J.; Rodríguez, A. Construction Applications of 449 Polyurethane Foam Wastes. In Book Recycling of Polyurethane Foams,1st ed.; Sabu, T., A.; Kanny, K., B; 450 Thomas, M.G., C; Vasudeo Rani, A., D.; Abitha V.K., E., Elsevier, Cambridge, UK, 2018, 10, 115-125. 451
18. Harini Bhuvaneswari, G. Degradability of Polymers. In Book Recycling of Polyurethane Foams, 1st ed.; 452 Sabu, T., A.; Kanny, K., B; Thomas, M.G., C; Vasudeo Rani, A., D.; Abitha V.K., E., Elsevier, Cambridge, 453 UK, 2018, 3, 29-44. 454
19. Klempner, D.; Sendijaveri’c, V.; Aseeva, R.M. Handbook of Polymeric Foams and Foam Technology. 455 Munich: Hanser Publishers, 2004. 456
20. Ma, X.; Tu, R.; Cheng, X.; Zhu, S.; Ma, J.; Fang, T. Experimental study of thermal behavior of insulation 457 material rigid polyurethane in parallel, symmetric, and adjacent building façade constructions. 458 Polymers 2018, 10 (10), 1104. 459
21. Bandow, N.; Gartiser, S.; Ilvonen, O.; Schoknecht, U. Evaluation of the impact of construction products 460 on the environment by leaching of possibly hazardous substances. Environmental Sciences Europe 2018, 461 30, 14. 462
22. Mostafa, H.E.; El-Dakhakhni, W.W.; Mekky, W.F. Use of reinforced rigid polyurethane foam for blast 463 hazard mitigation. Journal of Reinforced Plastics and Composites 2010, 29(20), 3048-3057. 464
23. Simón, D.; Borreguero, A.M.; de Lucas, A.; Rodríguez, J.F. Recycling of polyurethanes from laboratory 465 to industry, a journey towards the sustainability. Waste Management 2018, 76, 147-171. 466
24. Alameda, L.; Calderón, V.; Junco, C.; Rodríguez, A.; Gadea, J.; S. Gutiérrez-González, S. 467 Characterization of gypsum plasterboard with polyurethane foam waste reinforced with 468 polypropylene fibers. Materiales de Construcción 2016, 66, Issue 324, e100. 469
25. Gutiérrez González, S.; Junco, C.; Calderon, V.; Rodríguez, A.; Gadea, J. Design and Manufacture of a 470 Sustainable Lightweight Prefabricated Material Based on Gypsum Mortar with Semi-Rigid 471 Polyurethane Foam Waste 2018, Proceedings of Taha M. (eds) International Congress on Polymers in 472 Concrete (ICPIC 2018). ICPIC 2018. Springer, Cham, 449-455. 473
26. EN 13279-2. Gypsum binders and gypsum plasters. Test methods; 2004. 474 27. EN ISO 1182:2010. Reaction to fire tests for building products – Non-combustibility test. 475 28. ISO 1716:2018. Reaction to fire tests for products -- Determination of the gross heat of combustion 476
(calorific value). 477 29. EN 12667:2001. Thermal performance of building materials and products. Determination of thermal 478
resistance by means of guarded hot plate and heat flow meter methods. Products of high and medium 479 thermal resistance. 480
Preprints (www.preprints.org) | NOT PEER-REVIEWED | Posted: 17 December 2018 Preprints (www.preprints.org) | NOT PEER-REVIEWED | Posted: 17 December 2018 doi:10.20944/preprints201812.0191.v1
Peer-reviewed version available at Polymers 2019, 11, 359; doi:10.3390/polym11020359

16
30. Commission Decision of 8 February 2000 implementing Council Directive 89/106/EEC as regards the 481 classification of the reaction to fire performance of construction products. Official Journal of the 482 European Communities No L 50. 23.2.2000. 483
31. Gutiérrez-González,S.; Gadea, J.; Rodríguez, A.; Blanco-Varela, M.T.; Calderón, V. Compatibility 484 between gypsum and polyamide powder waste to produce lightweight plaster with enhanced thermal 485 properties. Construction & Building Materials 2012, 34, 179-185. 486 487
488 489
Preprints (www.preprints.org) | NOT PEER-REVIEWED | Posted: 17 December 2018 Preprints (www.preprints.org) | NOT PEER-REVIEWED | Posted: 17 December 2018 doi:10.20944/preprints201812.0191.v1
Peer-reviewed version available at Polymers 2019, 11, 359; doi:10.3390/polym11020359