Modelling of aluminium foam sandwich panels
22
Smart Structures and Systems, Vol. 13, No. 4 (2014) 615-636 DOI: http://dx.doi.org/10.12989/sss.2014.13.4.615 615 Copyright © 2014 Techno-Press, Ltd. http://www.techno-press.org/?journal=sss&subpage=8 ISSN: 1738-1584 (Print), 1738-1991 (Online) Modelling of aluminium foam sandwich panels Vincenzo D’Alessandro , Giuseppe Petrone a , Sergio De Rosa b and Francesco Franco c PASTA-Lab, Laboratory for Promoting experiences in Aeronautical Structures and Acoustics Department of Industrial Engineering – Aerospace Section Università degli Studi di Napoli “Federico II”, via Claudio 21 – 80125 Napoli, Italy (Received February 22, 2013, Revised November 25, 2013, Accepted December 13, 2013) Abstract. Aluminium Foam Sandwich (AFS) panels are becoming always more attractive in transportation applications thanks to the excellent combination of mechanical properties, high strength and stiffness, with functional ones, thermo-acoustic isolation and vibration damping. These properties strongly depend on the density of the foam, the morphology of the pores, the type (open or closed cells) and the size of the gas bubbles enclosed in the solid material. In this paper, the vibrational performances of two classes of sandwich panels with an Alulight® foam core are studied. Experimental tests, in terms of frequency response function and modal analysis, are performed in order to investigate the effect of different percentage of porosity in the foam, as well as the effect of the random distribution of the gas bubbles. Experimental results are used as a reference for developing numerical models using finite element approach. Firstly, a sensitivity analysis is performed in order to obtain a limit-but-bounded dynamic response, modelling the foam core as a homogeneous one. The experimental-numerical correlation is evaluated in terms of natural frequencies and mode shapes. Afterwards, an update of the previous numerical model is presented, in which the core is not longer modelled as homogeneous. Mass and stiffness are randomly distributed in the core volume, exploring the space of the eigenvectors. Keywords: aluminium foam; sandwich panel; modal analysis; modelling 1. Introduction The growing demand for vehicles, aircraft and trains having very high acoustic comfort and safety requirements leads to an increase of the structural weight, particularly in the automotive industry. On the other hand, the demand for lower fuel consumption vehicles requires lightweight structures. In order to meet all the requirements of the modern transportation engineering, new materials need to be developed, having low specific weight, high stiffness and strength, good capability of sound impact energy absorption. Highly porous materials with a cellular structure have interesting combination of physical and mechanical properties. Nature frequently uses Corresponding author, Ph. D. Student, E-mail: [email protected] a PhD Student, E-mail: [email protected] b Associate Professor c Associate Professor
Transcript of Modelling of aluminium foam sandwich panels

Smart Structures and Systems, Vol. 13, No. 4 (2014) 615-636
DOI: http://dx.doi.org/10.12989/sss.2014.13.4.615 615
Copyright © 2014 Techno-Press, Ltd.
http://www.techno-press.org/?journal=sss&subpage=8 ISSN: 1738-1584 (Print), 1738-1991 (Online)
Modelling of aluminium foam sandwich panels
Vincenzo D’Alessandro, Giuseppe Petronea, Sergio De Rosab and
Francesco Francoc
PASTA-Lab, Laboratory for Promoting experiences in Aeronautical Structures and Acoustics Department of Industrial Engineering – Aerospace Section
Università degli Studi di Napoli “Federico II”, via Claudio 21 – 80125 Napoli, Italy
(Received February 22, 2013, Revised November 25, 2013, Accepted December 13, 2013)
Abstract. Aluminium Foam Sandwich (AFS) panels are becoming always more attractive in transportation applications thanks to the excellent combination of mechanical properties, high strength and stiffness, with functional ones, thermo-acoustic isolation and vibration damping. These properties strongly depend on the density of the foam, the morphology of the pores, the type (open or closed cells) and the size of the gas bubbles enclosed in the solid material. In this paper, the vibrational performances of two classes of sandwich panels with an Alulight® foam core are studied. Experimental tests, in terms of frequency response function and modal analysis, are performed in order to investigate the effect of different percentage of porosity in the foam, as well as the effect of the random distribution of the gas bubbles. Experimental results are used as a reference for developing numerical models using finite element approach. Firstly, a sensitivity analysis is performed in order to obtain a limit-but-bounded dynamic response, modelling the foam core as a homogeneous one. The experimental-numerical correlation is evaluated in terms of natural frequencies and mode shapes. Afterwards, an update of the previous numerical model is presented, in which the core is not longer modelled as homogeneous. Mass and stiffness are randomly distributed in the core volume, exploring the space of the eigenvectors.
Keywords: aluminium foam; sandwich panel; modal analysis; modelling
1. Introduction
The growing demand for vehicles, aircraft and trains having very high acoustic comfort and
safety requirements leads to an increase of the structural weight, particularly in the automotive
industry. On the other hand, the demand for lower fuel consumption vehicles requires lightweight
structures. In order to meet all the requirements of the modern transportation engineering, new
materials need to be developed, having low specific weight, high stiffness and strength, good
capability of sound impact energy absorption. Highly porous materials with a cellular structure
have interesting combination of physical and mechanical properties. Nature frequently uses
Corresponding author, Ph. D. Student, E-mail: [email protected] a PhD Student, E-mail: [email protected]
b Associate Professor
c Associate Professor

Vincenzo D’Alessandro, Giuseppe Petrone, Sergio De Rosa and Francesco Franco
cellular material for load-bearing or functional purposes (i.e., wood, bones)(Gibson and Ashby
1999). Among the porous materials, the polymeric foams are currently the most used in several
fields, but their impact energy absorption capability is poor to guarantee a high level of passive
safety. Even metals and alloy can be foamed, by letting the liquid solidify but preserving the
morphology of the foam. Usually, metal foam have uniformly distributed gas pores in solid metal
with volume fraction in the range of 40 – 98%. The properties of the foam strongly depend on its
porosity and the cell type; there are three most common cell structures: open cell, closed
cell(Gibson and Ashby 1999)and a combination of the two (Stöbener et al. 2005). The type of cell
determines the field of application of the metal foam, as shown in Fig. 1 (Banhart 2001). Metallic
foams possess an excellent and unique combination of properties, which arise from the metallic
nature of matrix and the porosity behaviour:
low specific weight;
high stiffness to weight ratio;
high energy absorption capacity;
reduced thermal and electrical conductivity
good mechanical and acoustic damping;
not inflammable;
recyclable;
good machinability.
For this reason, in the last few years the interest in metallic foam has increased considerably,
especially made of aluminium alloys(Banhart and Baumeister 1998), which has brought to a large
extension of the literature about them, wherein the books by Gibson and Ashby(1999), by Ashby et
al.(2000), Degischer and Kriszt (2002) and the extensive work of Banhart and others (Banhart et
al. 1996, Baumeister et al. 1997, Lehmhus and Banhart 2003, Banhart 2005, Matijasevic and
Banhart 2006, Banhart and Seeliger 2008, Jiménez et al. 2009, Mukherjee et al. 2010, Saadatfar et
al. 2012) play a key role.
Fig. 1 Application of cellular metals grouped according to the type of porosity needed and the type of
application (functional or structural) (Banhart 2001)
616
Modelling of aluminium foam sandwich panels
Despite metal foams are finding applications in several engineering fields as bare component
(impact energy absorbers, silencers, etc.), the excellent properties of aluminium foams make them
attractive for use as sandwich core (the so-called Aluminium Foam Sandwich or AFS panels).
Sandwich panels, consisting of a foamed metal core and two metal skins, can be obtained by
bonding the face sheets to a foam with adhesives; alternatively, in order to avoid the degrade of the
adhesive with time or heat (in applications in which the temperature are very high), it is possible to
obtain a pure metallic bonding by roll-cladding sheets of metal to a sheet of foamable precursor
material. The resulting composite can be deformed in a successive step in order to get 3-D shaped
panels. The final heat treatment, in which only the foaming agent uniformly dispersed in the
precursor decomposes (releasing gas and forming the foam) and the face sheets remain dense,
leads to a sandwich panel (Banhart 2001). At the moment there are not large-scale industrial
applications for AFS panels, but many prototypes and studies show their great potential in the
automotive (Banhart 2001), aerospace (Schwingel et al. 2007), railway (Casavola et al. 2007) and
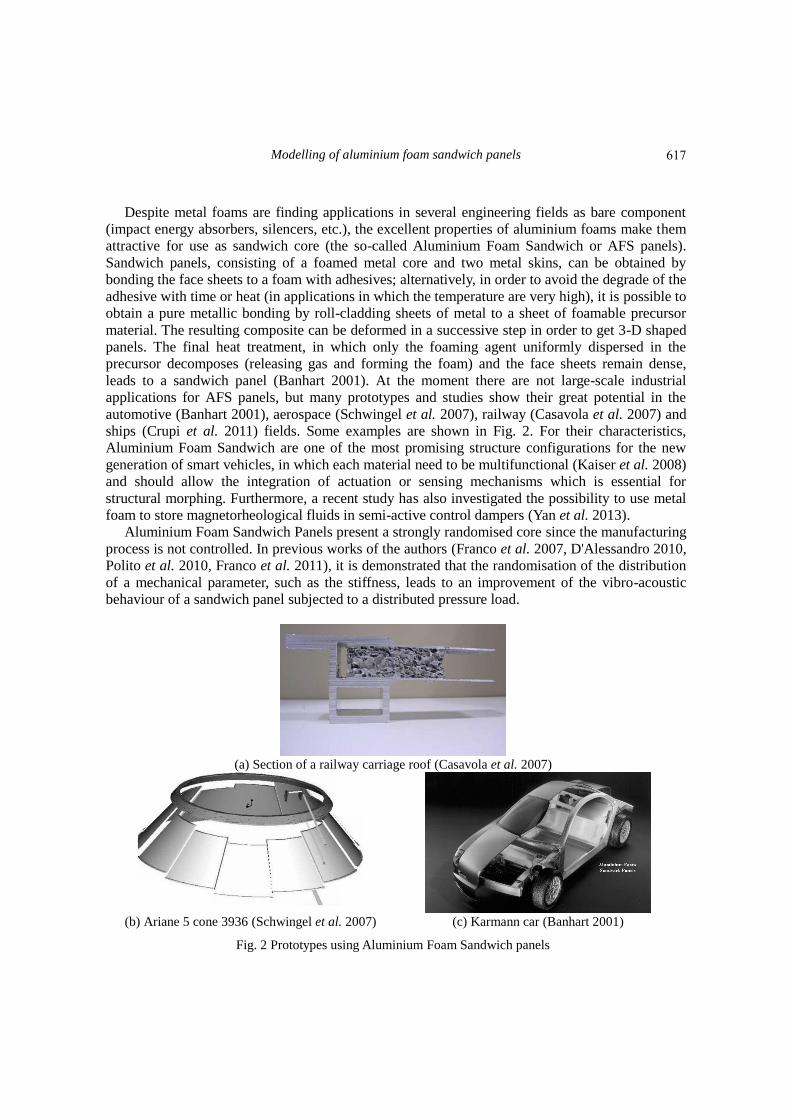
ships (Crupi et al. 2011) fields. Some examples are shown in Fig. 2. For their characteristics,
Aluminium Foam Sandwich are one of the most promising structure configurations for the new
generation of smart vehicles, in which each material need to be multifunctional (Kaiser et al. 2008)
and should allow the integration of actuation or sensing mechanisms which is essential for
structural morphing. Furthermore, a recent study has also investigated the possibility to use metal
foam to store magnetorheological fluids in semi-active control dampers (Yan et al. 2013).
Aluminium Foam Sandwich Panels present a strongly randomised core since the manufacturing
process is not controlled. In previous works of the authors (Franco et al. 2007, D'Alessandro 2010,
Polito et al. 2010, Franco et al. 2011), it is demonstrated that the randomisation of the distribution
of a mechanical parameter, such as the stiffness, leads to an improvement of the vibro-acoustic
behaviour of a sandwich panel subjected to a distributed pressure load.
(a) Section of a railway carriage roof (Casavola et al. 2007)
(b) Ariane 5 cone 3936 (Schwingel et al. 2007) (c) Karmann car (Banhart 2001)
Fig. 2 Prototypes using Aluminium Foam Sandwich panels
617
Vincenzo D’Alessandro, Giuseppe Petrone, Sergio De Rosa and Francesco Franco
In the present work the dynamic characteristics of Aluminium Foam Sandwich panels are
investigated experimentally and numerically in order to provide useful data for the preliminary
design using AFS panels. The experimental results are used as a reference to develop Finite
Element models. The first approach consists in modelling the core as a homogeneous material in
order to perform a sensitivity analysis. In the second one, the effect of a random distribution of the
mass and the stiffness in the core model is investigated and the space of the eigenvectors is
explored by means of different Gaussian's distributions of the mass. An overview on the
mechanical properties of aluminium foam is reported in Section 2. In Section 3 the description and
the results of the experimental tests are presented. In Section 4, a sensitivity analysis is performed
in order to obtain a limited-but-bounded response which takes into account the uncertainties on the
elastic modulus, and then Section 5 presents the correlation between numerical and experimental
results. The results of the correlation suggests an update of the numerical model, reported in
Section 6, and finally in Section 7 some concluding remarks are highlighted.
2. Mechanical properties of aluminium foam
The mechanical properties of metal foams depend strongly on those of the material they are
made of and on their relative density, i.e., their percentage of porosity. The higher is the relative
density, the higher are the mechanical properties. One of the attractive aspects of such materials is
that a desired profile of properties can be achieved by selecting the appropriate material to be
foamed with the appropriate percentage of porosity. Many suppliers offer a variety of density and,
correspondingly, of properties, documented in several works (Gibson and Ashby 1999, Ashby et al.
2000, Casavola et al. 2007). In particular, Banhart (2001) presents a fundamental collection of
works about the characterization of metal foams.
The relationship between the relative foam density and the many relative mechanical properties
obeys to a power law of the type (Baumeister et al. 1997)
Mr ρr =c∙ρ
rn (1)
where
Mr= Mf Ms is the relative mechanical property of interest (e.g., Young's modulus), obtained
as the ratio of the mechanical property of the foam 𝑀𝑓 and the mechanical property of the solid
material of which the foam is made 𝑀𝑠;
ρr= ρ
fρ
s is the relative foam density, in which 𝜌𝑓 and 𝜌𝑠 are the foam density and the
solid material density, respectively;
c is a constant;
nis an exponent (which is usually in the range 1.5 – 2.2).
The constant c and the exponent n mostly depend on the cell type (open or closed) and on the
imperfection in the cell structure, such as corrugation and curvature of cell walls and cell edges.
Other structural parameters, like cell size, cell shape and their variation have a minor influence on
the properties.
However, since the structural parameters are not easily controllable during the manufacturing
process, the mechanical properties can change into a wide range because of the imperfection listed
before.
618

Modelling of aluminium foam sandwich panels
2.1 Young’s modulus The relative foam density 𝜌𝑟 has the largest influence on the Young's modulus. For lower
density foam (ρr< 0.2), Gibson and Ashby (1999) have applied a simple bending strut model to a
cubic foam structure and found the following relation between Young's modulus and density valid
for closed-cell foam
Ef
Es
= C1ϕ2ρ
r2+C2(1-ϕ)ρ
r (2)
where:
ϕ is the fraction of solid contained in the cell edges;
(1-ϕ) the fraction contained in the cell face;
C1, C2are constants of proportionality.
This equation describes the combined effect of cell-edge bending term C1ϕ2ρ
r2, and cell-face
stretching one C2(1-ϕ)ρr. It remains to be determined the constants of proportionality, which
contain the effect of the imperfection in the cell structure. Simone and Gibson(1998) performed a
finite element analysis of periodic, closed tetrakaidecahedral cells with faces of uniform thickness,
finding the following relation
Ef
Es
= 0.32(ρr2+ρ
r) (3)
for relative densities less than 0.2, which is identical to Eq. (2) withC1=0.69, C2=1, ϕ=0.68. Eq.
(2) is valid as long as the main deformation mechanism is bending of cell edges.
For higher density foam, extension and compression of cell edges become more important and
therefore a deviation from these relations should be observed.
Ashby et al. (2000) propose other laws to evaluate the Young's modulus. For our purpose, one
of the simplest equations which allows to take easily into account the uncertainties due to the cell
structure is the following
Ef
Es= γ(0.5ρ
r2+0.3ρ
r) (4)
where the parameter γ varies in the range 0.1 – 1.
Furthermore, for design purposes, it is helpful to know that the tensile modulus of metal foams
is not the same as that in compression; the tensile modulus is greater than compression modulus,
typically, by 10%.
2.2 Shear modulus and Poisson’s ratio
The shear modulus of a closed-cell foam can be calculated in a similar way (Gibson and Ashby
1999)
Gf
Es
= C3ϕ2ρ
r2+C4(1-ϕ)ρ
r (5)
619
Vincenzo D’Alessandro, Giuseppe Petrone, Sergio De Rosa and Francesco Franco
Since the Poisson's ratio is the negative ratio of the lateral to the axial strain, it depends only on
the details of the cell shape but not on the relative density, as demonstrated by experimental
tests(Gibson and Ashby 1999). For closed-cell foam, an average value of the Poisson's ratio
is𝜈f=0.31.
It is possible to evaluate, with good approximation, the shear modulus by applying the
relationship for a material that is linear-elastic and isotropic
Gf= Ef
2(1+νf) (6)
2.3 Damping
Metal foams have higher mechanical damping than the solid material of which they are made.
The structural damping is highly influenced by the percentage of porosity in the foam, i.e., the
relative density. Ashby et al. (2000) propose a scaling law for the loss factor
𝜂𝑓
𝜂𝑠≈
(0.95-1.05)
ρr
(7)
which well agrees with the experimental results available in literature (Banhart et al. 1996).
3. Experimental investigation
Some experimental investigations were performed in order to determine the dynamic
characteristics of Aluminium Foam Sandwich (AFS) panels since they are still a new class of
sandwich. These are aimed to determine the basic modal properties such as the mode shapes and
natural frequencies, and then to evaluate the different behaviours of the investigated specimens.
3.1 Description of the test specimens
The Aluminium Foam Sandwich (AFS) panels consist in a three-layer composite comprising a
foamable (containing TiH2 as a blowing agent) aluminium alloy sheet as a core layer and two face
sheets still in aluminium alloy on both sides. The AFS panels tested are designed and
manufactured by the Austrian company Mepura Metallpulver GmbH. The manufacturing process
uses the decomposition of foaming agents into semisolids (Banhart 2001; Degischer and Kriszt
2002) the metal foam so obtained is called Alulight® .
Two classes of aluminium foam sandwich panels are analysed. Panels characteristics and
dimensions are listed in Tables 1 and 2; for sake of comprehension, class A and B are also called
the heaviest and the lightest, respectively. All the specimens have the same in-plane dimensions,
but with different thickness of both skins and core. The density of the foam, i.e., the percentage of
porosity, constitutes the main difference: the panels of the class B have much more gas bubbles
dispersed in the core than those dispersed in the class A foam. For each class, two nominally
identical panels are examined, designed by means of the letter of the class and a progressive
number (for instance, A1, A2 and so on).
620
Modelling of aluminium foam sandwich panels
Table 1 Attributes of the sandwich panels investigated
Class Weight
[kg] Skins Alloy Foam Alloy
Foam Density
[kg/m3]
Relative Foam
Density
A 3.2 EN AW 6082 AlMg3Si6 600 0.222
B 1.9 EN AW 6082 AlMg3Si6 390 0.144
Table 2 Dimensions of the sandwich panels investigated
Class Width
a [m]
Length
b [m]
Total thickness
t [m]
Skin thickness
ts [m]
Foam thickness
tf [m]
A 0.476 0.656 0.010 0.001 0.008
B 0.476 0.656 0.0086 0.0006 0.0074
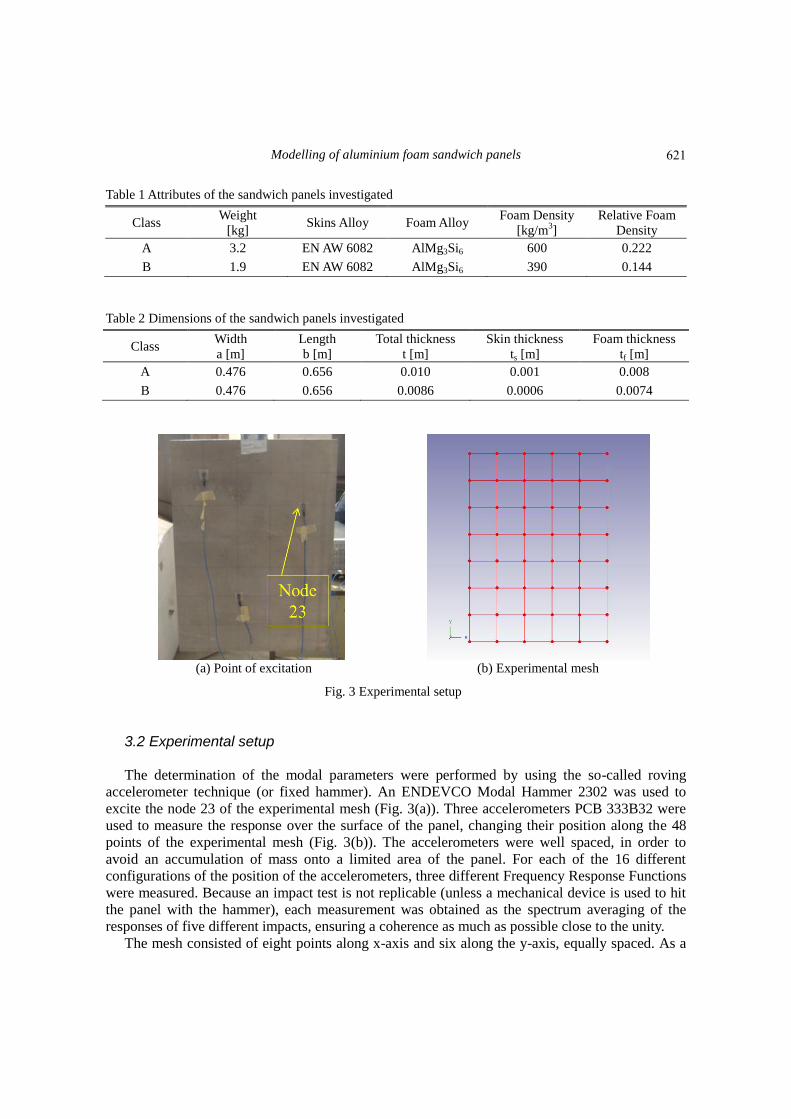
(a) Point of excitation (b) Experimental mesh
Fig. 3 Experimental setup
3.2 Experimental setup
The determination of the modal parameters were performed by using the so-called roving
accelerometer technique (or fixed hammer). An ENDEVCO Modal Hammer 2302 was used to
excite the node 23 of the experimental mesh (Fig. 3(a)). Three accelerometers PCB 333B32 were
used to measure the response over the surface of the panel, changing their position along the 48
points of the experimental mesh (Fig. 3(b)). The accelerometers were well spaced, in order to
avoid an accumulation of mass onto a limited area of the panel. For each of the 16 different
configurations of the position of the accelerometers, three different Frequency Response Functions
were measured. Because an impact test is not replicable (unless a mechanical device is used to hit
the panel with the hammer), each measurement was obtained as the spectrum averaging of the
responses of five different impacts, ensuring a coherence as much as possible close to the unity.
The mesh consisted of eight points along x-axis and six along the y-axis, equally spaced. As a
621

Vincenzo D’Alessandro, Giuseppe Petrone, Sergio De Rosa and Francesco Franco
rule of thumb, 2nw+1 grid points are required to describe nw half-waves, which means that the
used mesh allowed to describe three half-waves along the longest side and two half-waves along
the shortest one.
The data were recorded using the acquisition system LMS SCADAS III, in the bandwidth0 –
4000 Hz with a frequency resolution1 Hz; thus, data were analysed by means of the software LMS
Test.Lab 8.B and Matlab tools.
The panels were assumed to be not constrained to overcome any kind of problems arising from
the boundary conditions. Thus, the panels were suspended by using bungee cords in order to
simulate free boundary conditions on all sides.
3.3 Experimental results
3.3.1 Frequency response function By using the modal hammer and the set of three accelerometers, the global dynamic responses
of the panels investigated were measured. For each point of the experimental mesh, the Frequency
Response Function (FRF) in terms of accelerance (De Silva 2000)
A(f)= a(f)
F(f) (8)
was evaluated in the range0 – 4000 Hz, where a(f)is the acceleration, F(f)the force applied and f
the frequency. In order to obtain a global response of the panels, the Root Mean Square
Accelerance (RMSA) was calculated over the points of the experimental mesh. In Fig.4 the RMSA
of all the panels investigated is represented.
A good way to compare the response of specimens having different weight and thickness is
representing a dimensionless form. It is possible defining a Root Mean Square of the
Dimensionless Accelerance RMSA* by multiplying Eq. (8) by the mass m of the panel under
investigation
A*(f)= a(f)
F(f)∙m (9)
Fig. 4 Root Mean Square Accelerance VS. Frequency. — A1; — A2; — B1; — B2
622
Modelling of aluminium foam sandwich panels
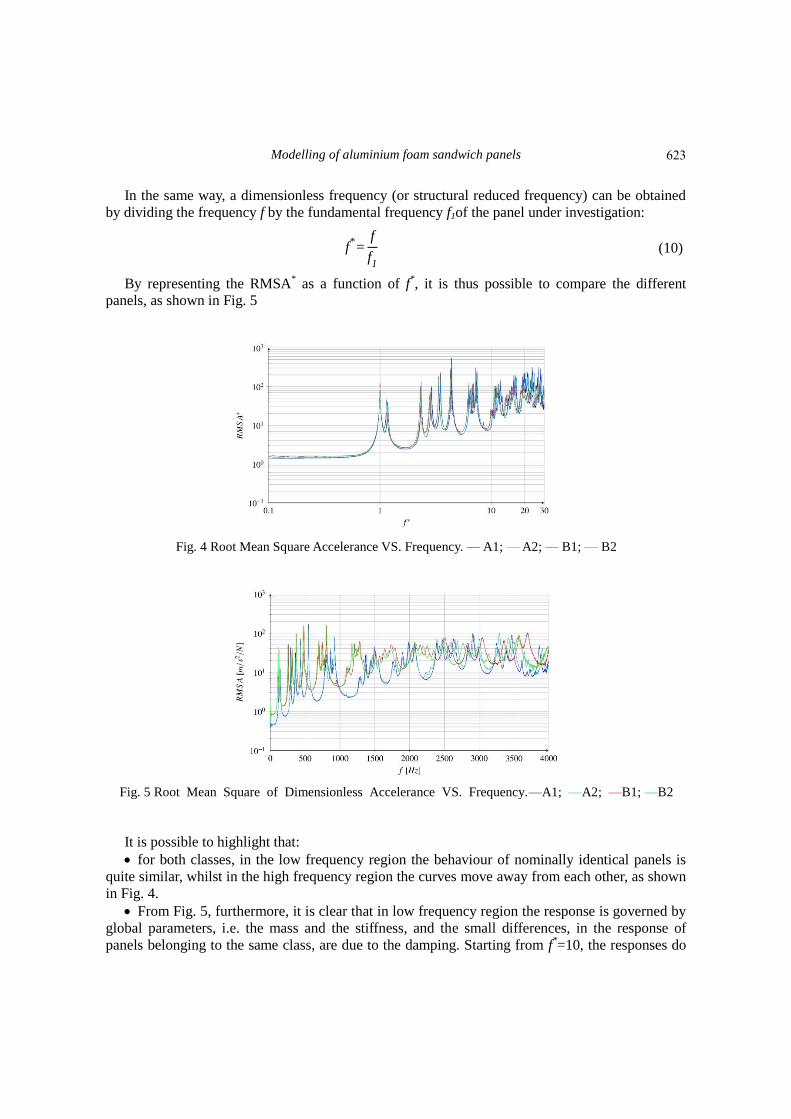
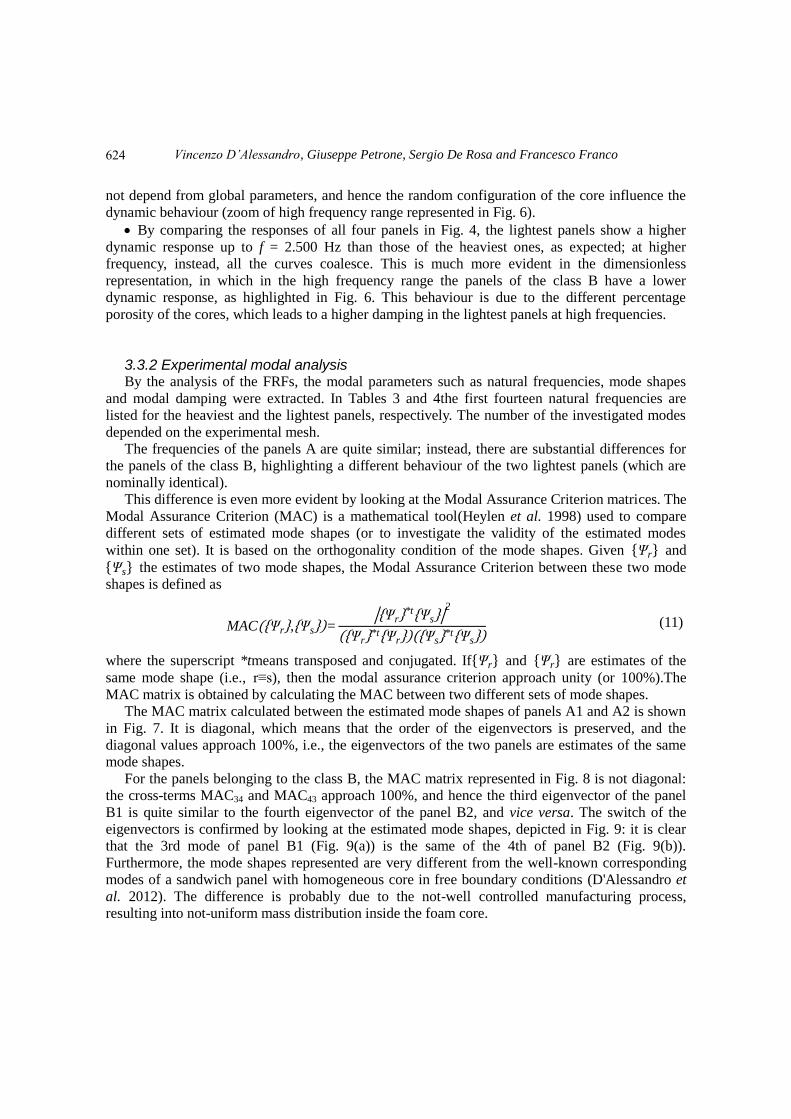
In the same way, a dimensionless frequency (or structural reduced frequency) can be obtained
by dividing the frequency f by the fundamental frequency f1of the panel under investigation:
f*=
f
f1
(10)
By representing the RMSA* as a function of f
*, it is thus possible to compare the different
panels, as shown in Fig. 5
Fig. 4 Root Mean Square Accelerance VS. Frequency. — A1; — A2; — B1; — B2
Fig. 5 Root Mean Square of Dimensionless Accelerance VS. Frequency.—A1; —A2; —B1; —B2
It is possible to highlight that:
for both classes, in the low frequency region the behaviour of nominally identical panels is
quite similar, whilst in the high frequency region the curves move away from each other, as shown
in Fig. 4.
From Fig. 5, furthermore, it is clear that in low frequency region the response is governed by
global parameters, i.e. the mass and the stiffness, and the small differences, in the response of
panels belonging to the same class, are due to the damping. Starting from f*=10, the responses do
623
Vincenzo D’Alessandro, Giuseppe Petrone, Sergio De Rosa and Francesco Franco
not depend from global parameters, and hence the random configuration of the core influence the
dynamic behaviour (zoom of high frequency range represented in Fig. 6).
By comparing the responses of all four panels in Fig. 4, the lightest panels show a higher
dynamic response up to f = 2.500 Hz than those of the heaviest ones, as expected; at higher
frequency, instead, all the curves coalesce. This is much more evident in the dimensionless
representation, in which in the high frequency range the panels of the class B have a lower
dynamic response, as highlighted in Fig. 6. This behaviour is due to the different percentage
porosity of the cores, which leads to a higher damping in the lightest panels at high frequencies.
3.3.2 Experimental modal analysis By the analysis of the FRFs, the modal parameters such as natural frequencies, mode shapes
and modal damping were extracted. In Tables 3 and 4the first fourteen natural frequencies are
listed for the heaviest and the lightest panels, respectively. The number of the investigated modes
depended on the experimental mesh.
The frequencies of the panels A are quite similar; instead, there are substantial differences for
the panels of the class B, highlighting a different behaviour of the two lightest panels (which are
nominally identical).
This difference is even more evident by looking at the Modal Assurance Criterion matrices. The
Modal Assurance Criterion (MAC) is a mathematical tool(Heylen et al. 1998) used to compare
different sets of estimated mode shapes (or to investigate the validity of the estimated modes
within one set). It is based on the orthogonality condition of the mode shapes. Given Ψr and Ψs the estimates of two mode shapes, the Modal Assurance Criterion between these two mode
shapes is defined as
MAC Ψr , Ψs = Ψr
*t Ψs 2
Ψr *t Ψr Ψs *t Ψs (11)
where the superscript *tmeans transposed and conjugated. If Ψr and Ψr are estimates of the
same mode shape (i.e., r≡s), then the modal assurance criterion approach unity (or 100%).The
MAC matrix is obtained by calculating the MAC between two different sets of mode shapes.
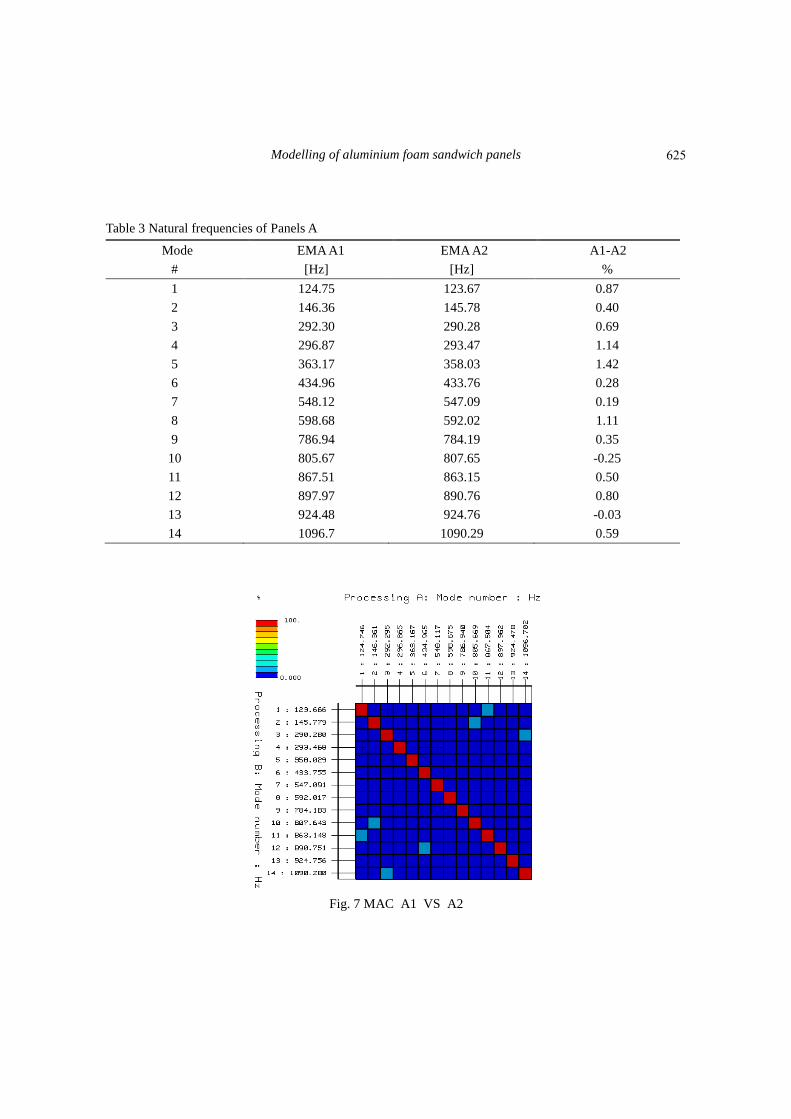
The MAC matrix calculated between the estimated mode shapes of panels A1 and A2 is shown
in Fig. 7. It is diagonal, which means that the order of the eigenvectors is preserved, and the
diagonal values approach 100%, i.e., the eigenvectors of the two panels are estimates of the same
mode shapes.
For the panels belonging to the class B, the MAC matrix represented in Fig. 8 is not diagonal:
the cross-terms MAC34 and MAC43 approach 100%, and hence the third eigenvector of the panel
B1 is quite similar to the fourth eigenvector of the panel B2, and vice versa. The switch of the
eigenvectors is confirmed by looking at the estimated mode shapes, depicted in Fig. 9: it is clear
that the 3rd mode of panel B1 (Fig. 9(a)) is the same of the 4th of panel B2 (Fig. 9(b)).
Furthermore, the mode shapes represented are very different from the well-known corresponding
modes of a sandwich panel with homogeneous core in free boundary conditions (D'Alessandro et
al. 2012). The difference is probably due to the not-well controlled manufacturing process,
resulting into not-uniform mass distribution inside the foam core.
624
Modelling of aluminium foam sandwich panels
Table 3 Natural frequencies of Panels A
Mode EMA A1 EMA A2 A1-A2
# [Hz] [Hz] %
1 124.75 123.67 0.87
2 146.36 145.78 0.40
3 292.30 290.28 0.69
4 296.87 293.47 1.14
5 363.17 358.03 1.42
6 434.96 433.76 0.28
7 548.12 547.09 0.19
8 598.68 592.02 1.11
9 786.94 784.19 0.35
10 805.67 807.65 -0.25
11 867.51 863.15 0.50
12 897.97 890.76 0.80
13 924.48 924.76 -0.03
14 1096.7 1090.29 0.59
Fig. 7 MAC A1 VS A2
625

Vincenzo D’Alessandro, Giuseppe Petrone, Sergio De Rosa and Francesco Franco
Table 4 Natural frequencies of Panels B
Mode EMA B1 EMA B2 B1-B2
# [Hz] [Hz] %
1 110.99 110.47 0.47
2 126.96 126.64 0.25
3 255.11 253.57 0.60
4 259.47 254.97 1.74
5 313.31 308.55 1.52
6 374.99 373.58 0.38
7 483.06 473.93 1.88
8 513.87 504.20 1.88
9 681.99 674.05 1.16
10 699.08 694.58 0.64
11 751.02 740.25 1.43
12 774.01 759.92 1.82
13 808.62 802.27 0.78
14 948.18 930.55 1.86
Fig. 8 MAC B1 VS B2
626

Modelling of aluminium foam sandwich panels
4. Numerical investigation
Numerical simulations were conducted, in terms of modal analysis and frequency response
function, using the commercial finite element solver MSC/Nastran 2008, focusing on the low
frequency region where panels belonging to the same class have a quite similar behaviour. A 3-D
model was realised, according to Laird (2010): the face sheets were modelled using 4-nodes
quadrilateral (CQUAD4) elements and the core using 8-nodes solid (CHEXA) elements.
The numerical mesh consisted of 48×32nodes along the in plane-directions and 4 nodes along
the thickness of the core. The panel was not constrained along its edges, as assumed in the
experimental tests. A unit force is applied on the numerical node corresponding to the point 23of
the experimental mesh, in order to compare the frequency response functions. Once the model was
built, first of all a modal analysis was performed in order to identify the first fourteen modes
parameters; thus, the frequency response function was evaluated based on the modal frequencies.
4.1 Sensitivity analysis
The mechanical properties of the skins are well defined since they are made of aluminium alloy
EN AW6082: Young's modulus Es = 71 GPa, Poisson's ratio𝜈s = 0.33, structural damping𝜂s = 2 ×
10-4
.
As explained in Section 2, no detailed information about the Young's modulus Ef and damping
𝜂f aluminium foam are available.
In order to provide a limited-but-bounded response which can help the designer in the
preliminary design using AFS panels, the parameter γ in Ashby's law (Eq. (4)) was changed in the
range 0.1 – 1, using a step Δγ = 0.05. The structural damping was calculated by assuming a unit
numerator in Eq. (7), which leads to𝜂fA = 1 × 10⁻³
and 𝜂fB = 1.4 × 10⁻³
. The Poisson's ratio was
assumed to be𝜈s = 0.31.
(a) 3rd mode of panel B1 (f=255.11 Hz) (b) 4th mode of panel B1 (f=259.47 Hz)
(c) 3rd mode of panel B2 (f=253.57 Hz) (d) 4th mode of panel B2 (f=254.97 Hz)
Fig. 9 3rd and 4th mode shapes of panels B1 and B2
627
Vincenzo D’Alessandro, Giuseppe Petrone, Sergio De Rosa and Francesco Franco
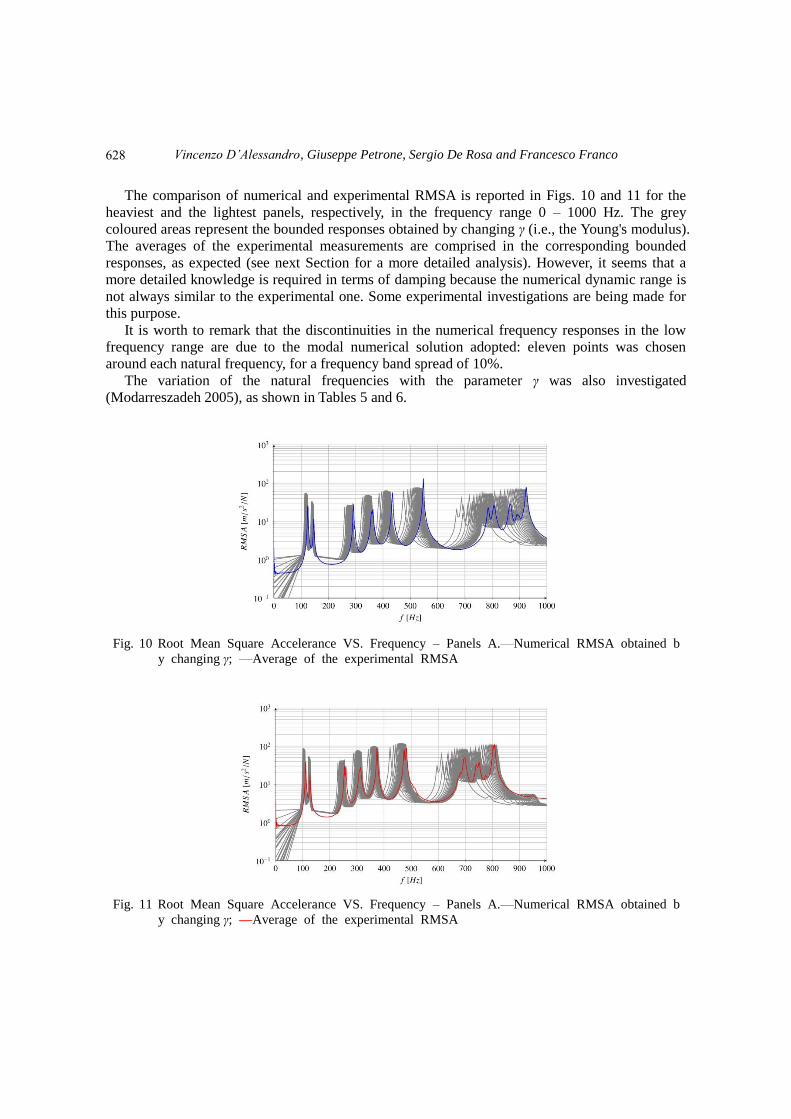
The comparison of numerical and experimental RMSA is reported in Figs. 10 and 11 for the
heaviest and the lightest panels, respectively, in the frequency range 0 – 1000 Hz. The grey
coloured areas represent the bounded responses obtained by changing γ (i.e., the Young's modulus).
The averages of the experimental measurements are comprised in the corresponding bounded
responses, as expected (see next Section for a more detailed analysis). However, it seems that a
more detailed knowledge is required in terms of damping because the numerical dynamic range is
not always similar to the experimental one. Some experimental investigations are being made for
this purpose.
It is worth to remark that the discontinuities in the numerical frequency responses in the low
frequency range are due to the modal numerical solution adopted: eleven points was chosen
around each natural frequency, for a frequency band spread of 10%.
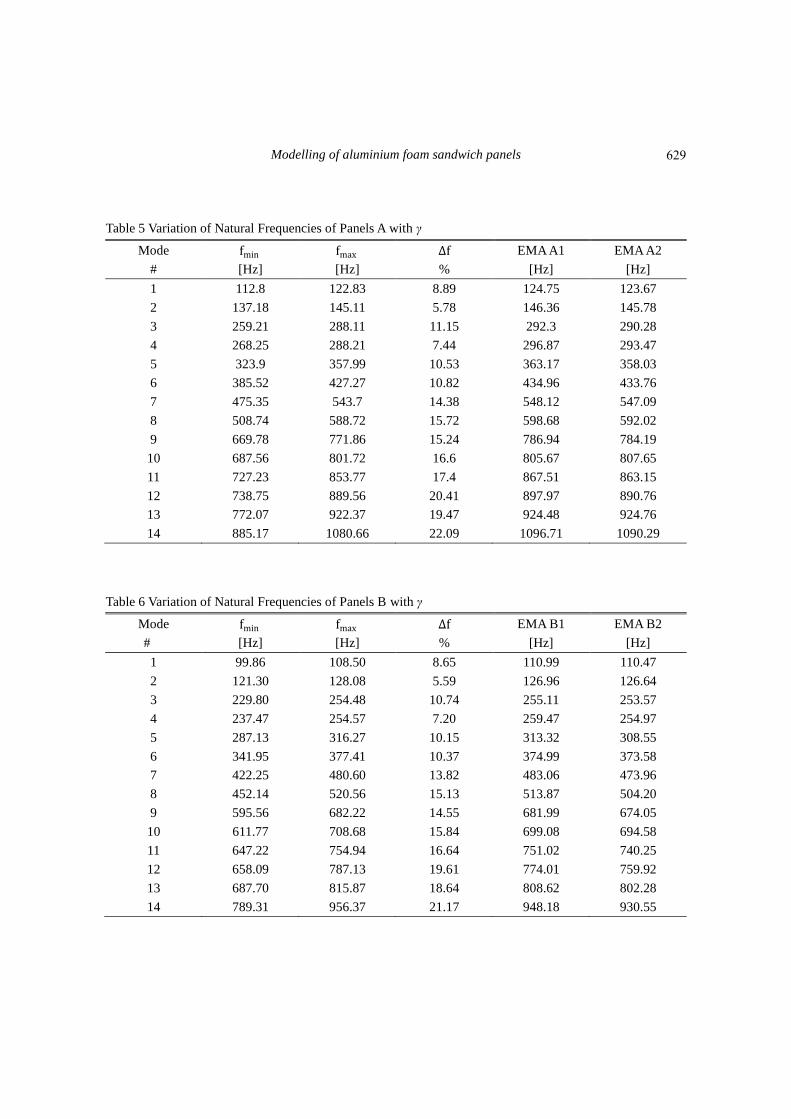
The variation of the natural frequencies with the parameter γ was also investigated
(Modarreszadeh 2005), as shown in Tables 5 and 6.
Fig. 10 Root Mean Square Accelerance VS. Frequency – Panels A.—Numerical RMSA obtained b
y changing γ; —Average of the experimental RMSA
Fig. 11 Root Mean Square Accelerance VS. Frequency – Panels A.—Numerical RMSA obtained b
y changing γ; —Average of the experimental RMSA
628
Modelling of aluminium foam sandwich panels
Table 5 Variation of Natural Frequencies of Panels A with γ
Mode fmin fmax ∆f EMA A1 EMA A2
# [Hz] [Hz] % [Hz] [Hz]
1 112.8 122.83 8.89 124.75 123.67
2 137.18 145.11 5.78 146.36 145.78
3 259.21 288.11 11.15 292.3 290.28
4 268.25 288.21 7.44 296.87 293.47
5 323.9 357.99 10.53 363.17 358.03
6 385.52 427.27 10.82 434.96 433.76
7 475.35 543.7 14.38 548.12 547.09
8 508.74 588.72 15.72 598.68 592.02
9 669.78 771.86 15.24 786.94 784.19
10 687.56 801.72 16.6 805.67 807.65
11 727.23 853.77 17.4 867.51 863.15
12 738.75 889.56 20.41 897.97 890.76
13 772.07 922.37 19.47 924.48 924.76
14 885.17 1080.66 22.09 1096.71 1090.29
Table 6 Variation of Natural Frequencies of Panels B with γ
Mode fmin fmax ∆f EMA B1 EMA B2
# [Hz] [Hz] % [Hz] [Hz]
1 99.86 108.50 8.65 110.99 110.47
2 121.30 128.08 5.59 126.96 126.64
3 229.80 254.48 10.74 255.11 253.57
4 237.47 254.57 7.20 259.47 254.97
5 287.13 316.27 10.15 313.32 308.55
6 341.95 377.41 10.37 374.99 373.58
7 422.25 480.60 13.82 483.06 473.96
8 452.14 520.56 15.13 513.87 504.20
9 595.56 682.22 14.55 681.99 674.05
10 611.77 708.68 15.84 699.08 694.58
11 647.22 754.94 16.64 751.02 740.25
12 658.09 787.13 19.61 774.01 759.92
13 687.70 815.87 18.64 808.62 802.28
14 789.31 956.37 21.17 948.18 930.55
629

Vincenzo D’Alessandro, Giuseppe Petrone, Sergio De Rosa and Francesco Franco
5. Experimental-numerical correlation
From the sensitivity analysis performed in Section 4, it is possible to determine the parameter γ
allowing the best fitting with experimental results, and then to evaluate the experimental-numerical
correlation in terms of natural frequencies and mode shapes. Hereinafter, the modal shapes are
described by the number of nodal lines along the two in-plane directions of the panel (x,y).
5.1 Heaviest panels (A)
The average of the experimental measurements of the panels belonging to the class A lies on
the upper bound of the grey area in Fig. 10, as well as highlighted in Table 5. This indicates that
the best experimental-numerical fitting for the class A is achieved by using γ = 1 in the whole
frequency range, i.e., a Young's modulus EA = 6.48 GPa. In Table 7 numerical and experimental
natural frequencies are listed, together with the percentage difference and the Modal Assurance
Criterion between the numerical and experimental eigenvectors. The correlation is promising for
both heaviest panels A1 and A2, since the percentage differences on the natural frequencies are
less than two percent and the MACs are greater than ninety percent for all the fourteen modes
considered.
Table 7 FEA-EMA correlation for the heaviest panels (A)
Mode FEA EMA A1 FEA-A1 FEA-A1 EMA A2 FEA-A2 FEA-A2
Name [Hz] [Hz] Diff. % MAC % [Hz] Diff. % MAC %
(1,1) 122.83 124.75 -1.53 99.7 123.67 -0.67 99.4
(0,2) 145.11 146.36 -0.86 99.4 145.78 -0.46 95.0
(1,2) 288.11 292.30 -1.43 98.4 290.28 -0.75 93.5
(2,0) 288.22 296.87 -2.91 98.1 293.47 -1.79 91.4
(2,1) 357.99 363.17 -1.43 98.2 358.03 -0.01 95.9
(0,3) 427.27 434.96 -1.77 99.0 433.76 -1.49 98.5
(1,3) 543.70 548.12 -0.81 99.3 547.09 -0.62 98.4
(2,2) 588.72 598.68 -1.66 99.4 592.02 -0.56 92.6
(3,0) 771.86 786.94 -1.92 98.0 784.19 -1.57 97.9
(0,4) 801.72 805.67 -0.49 98.7 807.65 -0.73 98.8
(3,1) 853.77 867.51 -1.58 98.2 863.15 -1.09 97.0
(2,3) 889.56 897.97 -0.94 98.2 890.76 -0.13 96.3
(1,4) 922.37 924.48 -0.23 99.1 924.76 -0.26 97.8
(3,2) 1080.66 1096.71 -1.46 99.1 1090.29 -0.88 98.2
5.1 Lightest panels (B)
For the lightest panels, i.e., class B, it seems there is not a single value of γ which allows a
perfect correlation in the whole frequency range; however, the best fitting is achieved by means of
γ = 0.95, i.e. a Young's modulus EB = 3.43 GPa, as can be observed by Fig. 11 and Table 6.
630
Modelling of aluminium foam sandwich panels
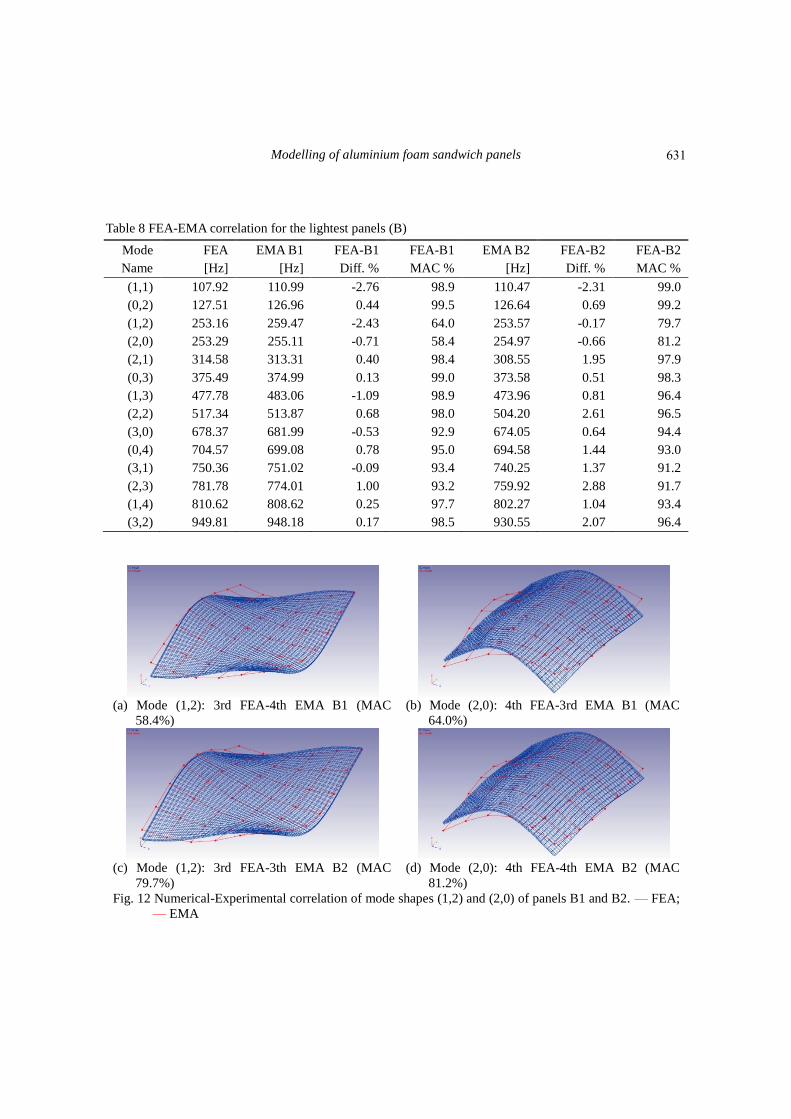
Table 8 FEA-EMA correlation for the lightest panels (B)
Mode FEA EMA B1 FEA-B1 FEA-B1 EMA B2 FEA-B2 FEA-B2
Name [Hz] [Hz] Diff. % MAC % [Hz] Diff. % MAC %
(1,1) 107.92 110.99 -2.76 98.9 110.47 -2.31 99.0
(0,2) 127.51 126.96 0.44 99.5 126.64 0.69 99.2
(1,2) 253.16 259.47 -2.43 64.0 253.57 -0.17 79.7
(2,0) 253.29 255.11 -0.71 58.4 254.97 -0.66 81.2
(2,1) 314.58 313.31 0.40 98.4 308.55 1.95 97.9
(0,3) 375.49 374.99 0.13 99.0 373.58 0.51 98.3
(1,3) 477.78 483.06 -1.09 98.9 473.96 0.81 96.4
(2,2) 517.34 513.87 0.68 98.0 504.20 2.61 96.5
(3,0) 678.37 681.99 -0.53 92.9 674.05 0.64 94.4
(0,4) 704.57 699.08 0.78 95.0 694.58 1.44 93.0
(3,1) 750.36 751.02 -0.09 93.4 740.25 1.37 91.2
(2,3) 781.78 774.01 1.00 93.2 759.92 2.88 91.7
(1,4) 810.62 808.62 0.25 97.7 802.27 1.04 93.4
(3,2) 949.81 948.18 0.17 98.5 930.55 2.07 96.4
(a) Mode (1,2): 3rd FEA-4th EMA B1 (MAC
58.4%)
(b) Mode (2,0): 4th FEA-3rd EMA B1 (MAC
64.0%)
(c) Mode (1,2): 3rd FEA-3th EMA B2 (MAC
79.7%)
(d) Mode (2,0): 4th FEA-4th EMA B2 (MAC
81.2%)
Fig. 12 Numerical-Experimental correlation of mode shapes (1,2) and (2,0) of panels B1 and B2. — FEA;
— EMA
631
Vincenzo D’Alessandro, Giuseppe Petrone, Sergio De Rosa and Francesco Franco
A comparison of experimental and numerical results is summarised in Table 8. Despite
numerical natural frequencies are well correlated with the experimental ones, the MAC presents
very low values for the third and fourth modes of both B1 and B2, as expected (Fig. 9). The
mismatch between the experimental eigenvectors and the numerical ones is evident, as shown in
Fig. 12. Since the core is modelled as a homogeneous material, the numerical model leads to a
torsional flexural (1,2) third mode shape and a purely flexural (2,0) fourth mode shape. As
previously represented in Fig. 9, the corresponding experimental mode shapes are not well defined
since flexural and torsional deformations coexist in both eigenvectors, especially for those of the
panel B1. This leads to a poor correlation in terms of MAC, highlighting that a finite element
model using a homogeneous core is not always able to describe the deformations of an AFS panel
because of the possible not uniform distribution of the mass inside the foam core.
6. Random spatial distribution of the core mass
As shown in the previous section, nominally identical AFS panels have a different dynamic
behaviour, which is also quite different from sandwich panels with homogeneous core. This lack
of homogeneity can lead to an improvement of the vibro-acoustic behaviour when the sandwich
panel is subject to a distributed pressure load (Franco et al. 2007, D'Alessandro 2010, Polito et al.
2010, Franco et al. 2011). In order to understand the possible effect of a random spatial
distribution of the core mass over the dynamic response and modal parameters of the panels
investigated, finite element models having not-homogeneous cores were developed.
For each class of AFS panels, twenty Gaussian's distributions (with a number of samples equal
to the number of solid elements in the core, i.e., 3906 CHEXA) of the core density were generated,
having as parameters:
μA = 600 kg/m3 and σA = 100 kg/m
3 for panels A;
μB = 390 kg/m3 and σB = 65 kg/m
3 for panels B.
μ and σ are the main value and the standard deviation of Gaussian's distributions, respectively.
Several techniques are described in literature to experimentally characterise the density
distribution of the cellular foam, such as X-ray techniques (radiography, radioscopy and
tomography) and eddy-current sensoring (Banhart 2001). However, in this work the standard
deviation is assumed to be 17% of the nominal density, whereas the mean value is equal to the
nominal one. Then, for each distribution, a different density was randomly assigned to each solid
element of the core model, as well as different Young's modulus calculated by means of Ashby's
law (Eq. (4)). An example of a random spatial distribution of the core mass for the panels A is
shown in Fig. 13: the scale on the right of the picture represents the range in which the foam
density changes, from a minimum value 208.4 kg/m3(in violet colour) to a maximum one 938.5
kg/m3(in red colour).
In Fig. 14, for each class of panels the average of the measured experimental RMSA is
compared to the calculated ones for the twenty models having a random mass distribution of the
core. As can be observed by the overlapping of the numerical curves, the local variations of mass
and stiffness do not all affect the global response (the Root Mean Square Acceleration is calculated
over all the points of the mesh), both for the heaviest (Fig. 14(a)) and the lightest (Fig. 14(b))
panels. This means that the global frequency response function of the dynamic system is not
influenced by the change of local parameters and hence a model with a homogeneous core can be
632

Modelling of aluminium foam sandwich panels
used to achieve the same results.
Despite the eigenvalues remain quite constant, the eigenvectors strongly change by
randomising the spatial distribution of the core property, obtaining a reshaping of the modal
deformation. In Section 5, it is shown that the numerical model of a sandwich panel with
homogeneous core is not always able to simulate the mode shapes of a AFS panel, as summarised
in Table 8 for the lightest panels, which exhibit low MACs for the modes (1,2) and (2,0). Thanks
to the randomization of the core properties, it is possible exploring the space of the eigenvectors,
achieving a general very good accordance.
Fig. 13 Isometric view of the numerical model of a foam core with random spatial distribution of mass
(a) Panels A: —Numerical RMSA calculated obtained by randomly distributing the core properties;
— Average of the experimental RMSA
(b) Panels B: —Numerical RMSA calculated obtained by randomly distributing the core properties;
— Average of the experimental RMSA
Fig. 14 Comparison of the experimental RMSA and twenty numerical RMSA calculated with random
distribution of the core density
633

Vincenzo D’Alessandro, Giuseppe Petrone, Sergio De Rosa and Francesco Franco
For instance, in Table 9 some correlation results are summarised in terms of Modal Assurance
Criterion. In particular, the experimental mode shapes of panel B1 are compared to the numerical
ones obtained by considering the homogeneous core (the original one), the random mass core
which gives the worst MACs and the random mass core which leads to the best correlation.
In Fig. 15 the best correlation obtained by randomising the core properties is shown for the
modes (1,2) and (2,0) of panel B1. The reshaping of these eigenvectors using this mass distribution
leads to very high values of MAC and furthermore, differently from the case in which the core was
modelled as homogeneous, there is no switch of the order of the modes.
Table 9 MAC between experimental mode shapes and numerical ones calculated using different core models
Mode
Name MAC Homogeneous MAC Worst
MAC
Best
% % %
(1,1) 98.9 98.9 98.9
(0,2) 99.5 99.5 99.6
(1,2) 64.0 52.6 97.4
(2,0) 58.4 49.1 98.2
(2,1) 98.4 98.3 98.4
(0,3) 99.0 99.0 99.0
(1,3) 98.9 98.9 98.9
(2,2) 98.0 98.1 98.1
(3,0) 92.9 91.4 92.7
(0,4) 95.0 93.3 94.5
(3,1) 93.4 94.1 93.3
(2,3) 93.2 93.9 93.1
(1,4) 97.7 97.5 97.9
(3,2) 98.5 98.4 98.5
(a) Mode (1,2): 3rd FEA–3rd EMA B1 (MAC
97.4%)
(b) Mode (2,0): 4th FEA–4th EMA B1 (MAC
98.2%)
Fig. 15 Numerical-Experimental correlation of mode shapes (1,2) and (2,0) of panels B1. — FEA; —
EMA
634
Modelling of aluminium foam sandwich panels
7. Conclusions
Experimental and numerical analysis of two classes of Aluminium Foam Sandwich panels are
described. The experimental results show that the present manufacturing process is not repeatable
yet because nominally identical panels have different dynamic behaviour, mostly in high frequency
region. However, in the low-frequency region the response is governed only by global parameters,
such as mass, stiffness and damping.
A sensitivity analysis by using a finite element model allows the identification of a bounded
response by changing the elastic modulus of the metal foam core, according to the Ashby's laws.
The value of the elastic modulus, which guarantees the best numerical-experimental fitting, is
used to compare the calculated and measured modal parameters. The comparison of numerical and
experimental mode shapes highlights that a model with a homogeneous core is not always able to
describe correctly the eigenvectors of the panels because of the not uniform distribution of the
mass in the foam core.
A model having a random spatial distribution of the core density is developed and studied: the
numerical-experimental correlation shows that the local variation of the core properties (mass and
stiffness) does not affect the dynamic response, but only the eigenvectors. This could lead to an
improvement of the vibro-acoustic response when the panel is subjected to a distributed load, as
demonstrate by previous works.
References
Ashby, M.F., Evans, A., Fleck, N.A., Gibson, L.J., Hutchinson, J.W. and Wadley, H. (2000), Metal foams: a
design guide, Butterworth-Heinemann, Boston.
Banhart, J. (2001), ―Manufacture, characterisation and application of cellular metals and metal foams‖, Prog.
Mater. Sci., 46(6), 559-632.
Banhart, J. (2005), ―Aluminium foams for lighter vehicles‖, Int. J. Vehicle. Des., 37(2-3), 114-125.
Banhart, J. and Baumeister, J. (1998), ―Deformation characteristics of metal foams‖, J. Mater. Sci., 33(6),
1431-1440.
Banhart, J., Baumeister, J. and Weber, M. (1996), ―Damping properties of aluminium foams‖, Mater. Sci.
Eng. A, 205(1-2), 221-228.
Banhart, J. and Seeliger, H.W. (2008), ―Aluminium foam sandwich panels: manufacture, metallurgy and
applications‖, Adv. Eng. Mater., 10(9), 793-802.
Baumeister, J., Banhart, J. and Weber, M. (1997), ―Aluminium foams for transport industry‖, Mater. Design.,
18(4-6), 217-220.
Casavola, C., Pappalettere, C. and Brandizzi, M. (2007), ―Mechanical characterization of bonded and
welded AFS sandwich component‖, Proceedings of the International Conference on Advanced Technology
in Experimental Mechanics (ATEM 07), Fukuoka (Japan), 12-14 September.
Crupi, V., Epasto, G. and Guglielmino, E. (2011), ―Impact response of aluminum foam sandwiches for
light-weight ship structures‖, Metals, 1(1), 98-112.
D'Alessandro, V. (2010), Vibroacoustic numerical investigation for innovative sandwich panel
configurations, Master Thesis, Aerospace Engineering, Department of Aerospace Engineering, Università
degli Studi di Napoli "Federico II".
D'Alessandro, V., Amabili, M., De Rosa, S. and Franco, F. (2012), ―Preliminary identification of sandwich
panels‖, Proceedings of the 4th International Conference on Noise and Vibration: Emerging Methods
(NOVEM 2012), Sorrento (Italy), April 1-4.
De Silva, C.W. (2000), Vibration: Fundamentals And Practice. CRC Press, Boca Raton, FL.
635
Vincenzo D’Alessandro, Giuseppe Petrone, Sergio De Rosa and Francesco Franco
Degischer, H.P. and Kriszt, B. (2002), Handbook of cellular metals: production, processing, applications,
Wiley-VCH.
Franco, F., Cunefare, K.A. and Ruzzene, M. (2007), ―Structural-acoustic optimization of sandwich panels‖,
J. Vib. Acoust., 129(3), 330-340.
Franco, F., De Rosa, S. and Polito, T. (2011), ―Finite element investigations on the vibroacoustic
performance of plane plates with random stiffness‖, Mech. Adv. Mater. Struct., 18(7), 484-497.
Gibson, L.J. and Ashby, M.F. (1999), Cellular solids: structure and properties, Cambridge University Press,
Cambridge, New York.
Heylen, W., Lammens, S. and Sas, P. (1998), Modal analysis theory and testing, Katholieke Universiteit
Leuven, Faculty of Engineering, Department of Mechanical Engineering, Division of Production
Engineering, Machine Design and Automation.
Jiménez, C., Garcia-Moreno, F., Mukherjee, M., Goerke, O. and Banhart, J. (2009), ―Improvement of
aluminium foaming by powder consolidation under vacuum‖, Scr. Mater., 61(5), 552-555.
Kaiser, O.S., Eickenbusch, H., Grimm, V. and Zweck, A. (2008). The future of the car, Zukünftige
Technologien Consulting, Düsseldorf.
Laird, G. (2010), ―Modeling composites with Femap 10.1.1 - An introduction to the how's and why's‖, from
http://www.predictiveengineering.com/.
Lehmhus, D. and Banhart, J. (2003), ―Properties of heat-treated aluminium foams‖, Mater. Sci. Eng. A,
349(1-2), 98-110.
Matijasevic, B. and Banhart, J. (2006), ―Improvement of aluminium foam technology by tailoring of
blowing agent‖, Scr. Mater., 54(4), 503-508.
Modarreszadeh, M. (2005), Dynamic analysis of structures with interval uncertainty, PhD Thesis, Case
Western Reserve University.
Mukherjee, M., Garcia-Moreno, F. and Banhart, J. (2010), ―Defect generation during solidification of
aluminium foams‖, Scr. Mater., 63(2), 235-238.
Polito, T., Franco, F. and De Rosa, S. (2010), ―Parametric analyses of lightweight metallic sandwich plates‖,
Proceedings of the 24th International Conference on Noise and Vibration engineering (ISMA 2010),
Leuven (Belgium), September 20-22.
Saadatfar, M., Mukherjee, M., Madadi, M., Schröder-Turk, G.E., Garcia-Moreno, F., Schaller, F.M., Hutzler,
S., Sheppard, A.P., Banhart, J. and Ramamurty, U. (2012), ―Structure and deformation correlation of
closed-cell aluminium foam subject to uniaxial compression‖, Acta Mater., 60(8), 3604-3615.
Schwingel, D., Seeliger, H.-W., Vecchionacci, C., Alwes, D. and Dittrich, J. (2007). ―Aluminium foam
sandwich structures for space applications‖, Acta Astronaut., 61(1-6), 326-330.
Simone, A.E. and Gibson, L.J. (1998), ―The effects of cell face curvature and corrugations on the stiffness
and strength of metallic foams‖, Acta Mater., 46(11), 3929-3935.
Stöbener, K., Baumeister, J., Rausch, G. and Rausch, M. (2005). ―Forming metal foams by simpler methods
for cheaper solutions‖, Met. Powder Rep., 60(1), 12-16.
Yan, Y.X., Hui, L.X., M, Y., J, F. and Dong, L.H. (2013), ―Dynamic response time of a metal foam
magneto-rheological damper‖, Smart Mater. Struct., 22(2), 1-8.
FC
636