Development and Characterization of Tailored Polyurethane ...
28
Citation: Noureddine, B.; Zitouni, S.; Achraf, B.; Houssém, C.; Jannick, D.-R.; Jean-François, G. Development and Characterization of Tailored Polyurethane Foams for Shock Absorption. Appl. Sci. 2022, 12, 2206. https://doi.org/10.3390/ app12042206 Academic Editors: Nuno Gama and Alessandra Lorenzetti Received: 30 December 2021 Accepted: 18 January 2022 Published: 20 February 2022 Publisher’s Note: MDPI stays neutral with regard to jurisdictional claims in published maps and institutional affil- iations. Copyright: © 2022 by the authors. Licensee MDPI, Basel, Switzerland. This article is an open access article distributed under the terms and conditions of the Creative Commons Attribution (CC BY) license (https:// creativecommons.org/licenses/by/ 4.0/). applied sciences Article Development and Characterization of Tailored Polyurethane Foams for Shock Absorption Boumdouha Noureddine 1, * , Safidine Zitouni 1 , Boudiaf Achraf 1 , Chabane Houssém 2 , Duchet-Rumeau Jannick 3 and Gerard Jean-François 3 1 Laboratoire Génie des Matériaux, Ecole Militaire Polytechnique, BP 17, Bordj El-Bahri 16111, Algeria; safi[email protected] (S.Z.); [email protected] (B.A.) 2 Laboratoire de Chimie Macromoléculaire, Ecole Militaire Polytechnique, BP 17, Bordj El-Bahri 16111, Algeria; [email protected] 3 UMR CNRS 5223 Ingénierie des Matériaux Polymères, Université de Lyon, INSA Lyon, 20, Avenue Albert Einstein, 69621 Villeurbanne, France; [email protected] (D.-R.J.); [email protected] (G.J.-F.) * Correspondence: [email protected]; Tel.: +213-697-005-578 Abstract: In this paper, different types of polyurethane foams (PUR) having various chemical compo- sitions have been produced with a specific density to monitor the microstructure as much as possible. The foam may have a preferential orientation in the cell structure. The cellular polyurethane tends to have stubborn, typical cellular systems with strong overlap reversibility. Free expansion under atmospheric pressure enables formulas to grow until they are refined. Moreover, the physicochemical characterization of the developed foams was carried out. They later are described by apparent density, Shore hardness, Raman spectroscopy analysis, X-ray diffraction analysis, FTIR, TGA, DSC, and compression tests. The detailed structural characterization was used by scanning electron mi- croscope (SEM) and an optical microscope (MO) to visualize the alveolar polymer’s semi-opened cells, highlighting the opened-cell morphology and chemical irregularities. Polyurethane foams with different structural variables have a spectrum characterization that influences the phase separation and topography of polyurethane foam areas because their bonding capability with hydrogen depends on chain extender nature. These studies may aid in shock absorption production; a methodology of elaboration and characterization of filled polyurethane foams is proposed. Keywords: polyurethane foam; apparent density; Shore hardness; Raman spectroscopy; X-ray diffraction analysis; FTIR; TGA; DSC; SEM; compression tests; shock absorption 1. Introduction Human protection systems such as bullet vests, frames, and helmet or nonlethal pro- jectile weapons are increasingly used [1]. Protection materials must be resistant to fire and shock to reduce accidental injuries caused by explosives usage. In addition to their advantage and usefulness (costs, infrastructure, ease of handling, superior performance), polymers can offer the design of safer and cheaper protection systems with suitable fire resistance and shock resistance. Polymer foams, thanks to their cellular structure made up of open or closed cells, are promising candidates with strong shock absorption, ex- cellent acoustic and thermal isolation, and the ability to achieve intumescence [2]. The optimization of properties requires considering the relationship between microstructure and properties. The mechanical response of such materials is based on the nature and the intrinsic characteristics of polymer cell walls such as thickness, distribution, and cell type, which are the basic units for the foam architecture [3]. The mechanical properties can also be tuned by mixing high and low densities [4]. Polyurethane foams can be made of various chemicals and are very tunable. The alveolar polyurethanes are produced by combining poly(isocyanate) with polyols in a Appl. Sci. 2022, 12, 2206. https://doi.org/10.3390/app12042206 https://www.mdpi.com/journal/applsci
-
Upload
khangminh22 -
Category
Documents
-
view
0 -
download
0
Transcript of Development and Characterization of Tailored Polyurethane ...

�����������������
Citation: Noureddine, B.; Zitouni, S.;
Achraf, B.; Houssém, C.; Jannick,
D.-R.; Jean-François, G. Development
and Characterization of Tailored
Polyurethane Foams for Shock
Absorption. Appl. Sci. 2022, 12, 2206.
https://doi.org/10.3390/
app12042206
Academic Editors: Nuno Gama and
Alessandra Lorenzetti
Received: 30 December 2021
Accepted: 18 January 2022
Published: 20 February 2022
Publisher’s Note: MDPI stays neutral
with regard to jurisdictional claims in
published maps and institutional affil-
iations.
Copyright: © 2022 by the authors.
Licensee MDPI, Basel, Switzerland.
This article is an open access article
distributed under the terms and
conditions of the Creative Commons
Attribution (CC BY) license (https://
creativecommons.org/licenses/by/
4.0/).
applied sciences
Article
Development and Characterization of Tailored PolyurethaneFoams for Shock AbsorptionBoumdouha Noureddine 1,* , Safidine Zitouni 1, Boudiaf Achraf 1, Chabane Houssém 2 ,Duchet-Rumeau Jannick 3 and Gerard Jean-François 3
1 Laboratoire Génie des Matériaux, Ecole Militaire Polytechnique, BP 17, Bordj El-Bahri 16111, Algeria;[email protected] (S.Z.); [email protected] (B.A.)
2 Laboratoire de Chimie Macromoléculaire, Ecole Militaire Polytechnique, BP 17, Bordj El-Bahri 16111, Algeria;[email protected]
3 UMR CNRS 5223 Ingénierie des Matériaux Polymères, Université de Lyon, INSA Lyon, 20, Avenue AlbertEinstein, 69621 Villeurbanne, France; [email protected] (D.-R.J.);[email protected] (G.J.-F.)
* Correspondence: [email protected]; Tel.: +213-697-005-578
Abstract: In this paper, different types of polyurethane foams (PUR) having various chemical compo-sitions have been produced with a specific density to monitor the microstructure as much as possible.The foam may have a preferential orientation in the cell structure. The cellular polyurethane tendsto have stubborn, typical cellular systems with strong overlap reversibility. Free expansion underatmospheric pressure enables formulas to grow until they are refined. Moreover, the physicochemicalcharacterization of the developed foams was carried out. They later are described by apparentdensity, Shore hardness, Raman spectroscopy analysis, X-ray diffraction analysis, FTIR, TGA, DSC,and compression tests. The detailed structural characterization was used by scanning electron mi-croscope (SEM) and an optical microscope (MO) to visualize the alveolar polymer’s semi-openedcells, highlighting the opened-cell morphology and chemical irregularities. Polyurethane foams withdifferent structural variables have a spectrum characterization that influences the phase separationand topography of polyurethane foam areas because their bonding capability with hydrogen dependson chain extender nature. These studies may aid in shock absorption production; a methodology ofelaboration and characterization of filled polyurethane foams is proposed.
Keywords: polyurethane foam; apparent density; Shore hardness; Raman spectroscopy; X-raydiffraction analysis; FTIR; TGA; DSC; SEM; compression tests; shock absorption
1. Introduction
Human protection systems such as bullet vests, frames, and helmet or nonlethal pro-jectile weapons are increasingly used [1]. Protection materials must be resistant to fireand shock to reduce accidental injuries caused by explosives usage. In addition to theiradvantage and usefulness (costs, infrastructure, ease of handling, superior performance),polymers can offer the design of safer and cheaper protection systems with suitable fireresistance and shock resistance. Polymer foams, thanks to their cellular structure madeup of open or closed cells, are promising candidates with strong shock absorption, ex-cellent acoustic and thermal isolation, and the ability to achieve intumescence [2]. Theoptimization of properties requires considering the relationship between microstructureand properties. The mechanical response of such materials is based on the nature and theintrinsic characteristics of polymer cell walls such as thickness, distribution, and cell type,which are the basic units for the foam architecture [3]. The mechanical properties can alsobe tuned by mixing high and low densities [4].
Polyurethane foams can be made of various chemicals and are very tunable. Thealveolar polyurethanes are produced by combining poly(isocyanate) with polyols in a
Appl. Sci. 2022, 12, 2206. https://doi.org/10.3390/app12042206 https://www.mdpi.com/journal/applsci

Appl. Sci. 2022, 12, 2206 2 of 28
blowing agent [5,6]. Flexible, rigid or semirigid foams can be designed according tothe composition and chemistry of the reagents in use. Angèle Chomard examined theNCO/OH ratio effects between 1.00 and 1.06 [7]. The fatigue resistance was enhanced andthe final polyurethane molar weight was increased, along with strength, variability, andbetter-controlled alternating flexible segments (SS) and rigid segments (SR) [8]. A highratio increases the risk of cracking. Thus, a balance between mechanical strength and usagemust be established. The number of urethane and urea bonds is usually increased when theratio of NCO/OH increases, thus raising the possibility of hydrogen bonding. This effectincreases the amount of the rigid segments, leading to an increase of elastic module E, anincrease of the crystallinity degree to which rigid segments crystallize, and a decrease in theelongation of the polymer [7]. With a ratio of NCO/OH less than 1, mechanical properties(modulus, tension, and stress at break) are poor because of the low molar mass of theshaped PU chains [9]. The improvement in the total NCO/OH ratio a small amount above1 gives the possibility to compensate for the lack of isocyanate feature by side reactions andtherefore provide a higher modulus by optimizing the chain’s elongation and growing theintensity of the urethane bonding device [10]. Recently, one of the main facets of change inthe processing of polyurethane products is the exclusion of hazardous substances from theproduction method and their substitution with environmentally safe ones [11].
Concerns about materials derived from petroleum resources are common owing totheir environmental and healthcare implications. That is why scientists were keen todevelop polyurethane foam of vegetable origin. Ghasemlou et al. studied the biosyn-thetic pathways for synthesizing cyclic carbonates and non-isocyanate polyurethanes(NIPUs) [12]. Luca Bossa et al. prepared Mannich-based polyol for hard foams [13] and thepromotion of a homogeneous dispersion of fillers within the polymer matrix [14]. Ghasem-lou et al. used synergistic interactions to fabricate transparent and mechanically robustnanohybrids based on starch, non-isocyanate polyurethanes, and cellulose nanocrystals(CNCs) for the development of sustainable, high-performance materials [15].
Since Kistler suggested the manufacture of silica aerogels in the 1930s [16], great atten-tion has been paid to new advancements in fillers with alumina (Al2O3) [17,18] and multi-layered fillers mainly from clays [19,20]. Their unique form impacts polyurethane foam,leading to extremely exceptional durability and stability. Their low-cost, nonflammableand nonreactive character with superior damping properties makes it suitable for applica-tions in the military field and home, aerospace, and automotive applications. Increasingconcern has been raised about the evolution of loaded polyurethane foam using the sol-gelmethod. The foams obtained showed improved thermal resistance and heat insulationcompared with conventional polyurethane foam [21]. But this is not sufficient withoutimproving the structural properties and particularly the shock resistance [22,23]. Aluminaand bentonite are effective structural additives and are also flame retardants at the sametime in comparison to other materials. Chen et al. prepared, PVA-based aerogels includingsilica plus montmorillonite by a freeze-drying process and conducted a comprehensive andstructured assessment to study the stability of the PVA compounds [24].
Moreover, the flammability of polymers such as polystyrene, polypropylene, andpolyamide can be improved by dissolving the combined silica aerogel as a flame resistanceadditive [25]. Both bentonite and alumina can improve the physical properties of polymerfoams by providing lamellar roughness. The present work describes a new strategy formanufacturing polyurethane foams having given densities. Different proportions of struc-tural fillers are incorporated using the combined process, i.e., homogeneous mixing and freeexpansion. Other contents of bentonite and alumina fillers are mixed in the polyurethanematrix. The follow-up of the polymerization of co-monomers, alone or in the presence offillers, is made by FTIR analysis. At the same time, the company and the excellent scatteringof the stuffing in the polymer foam are confirmed by scanning electron microscopy. Gener-ally, polyurethane foams are made as the foam is being made. Nevertheless, the challengeis the promotion of homogeneous dispersion of fillers within the monomers before thepolymerization and the foaming. Even though previous studies have provided significant

Appl. Sci. 2022, 12, 2206 3 of 28
insights on improving shock absorption capacity, thermal stability, and insulation, theefficiency of alumina and bentonite on the shock-absorbing effect of polyurethane foamswas not investigated [5,26].
2. Materials and Methods2.1. Materials
The polyol P0010 provided by Confortchem (Pointe-Claire, QC, Canada), is a polyetherpolyol (POPE) grafted by 10% styrene-acrylonitrile (SAN) chains. At RT, its density is1.1 g cm−3, and its viscosity is 5.842 Pas.
The diisocyanate is a polymeric methane diphenyl diisocyanate (PMDI) containing30% NCO, which BASF provided.
Four catalysts were used: Tetramethylenediamine (TMD) solid catalyst acquired fromMerck KGaA - Strasbourg; Triethylenediamine (A-33), with a concentration by 33% in dipropy-lene glycol (DPG) provided from Struktol (Stow, OH, USA); (bis(2-dimethylaminoethyl) ether(A-1), a potent amine catalytic agent, with a concentration of 70% in DPG, obtained fromNiax (Waterford, NY, USA); 2-Tin ethylhexanoate (A19) from Niax exploited due to its abil-ity to stimulate the secondary isocyanate-hydroxyl reaction and on its excellent solubilityin polyether polyols.
The crosslinking agent used as a chain extender is glycerol C3H8O3 (GCO) fromPanReac (Darmstadt, Germany). The molar mass is 92.10 g·mol−1.
The surfactant used is a non-hydrolyzable silicone (L-580 Aspect (HS) oil) for cellularpolytheistic PUR from Niax. Its density at RT is 1.026 g·cm−3.
The blowing agent is dichloromethane (CH2Cl2), at 99.8% purity supplied by AcroSeal(Illkirch-Graffenstaden, France).
Hydrochloric acid (HCl) is a hydrogen chloride aqueous solution, 37%, were receivedfrom Biochem Chemopharma France, and hydrogen peroxyde 10%, was acquired fromSaidal (Algiers, Algeria).
The selected Coloring Agent (AO) is conventionally used in the polyurethane industry,and the microparticle (pigment) is distributed into a polyether polyol (with main OHgroups), supplied by Evonik Industries (Essen, Germany).
The plasticizer used is dibutyl phthalate (DBP) with the chemical formulation C6H4(CO2C4H9)2 and a purity of 99%, acquired from Interchimie (Compans, France).
We selected aluminum oxide Al2O3 (Alumina), bulk density is 3.69 g/cm3 made ofrefractory clays based on a mixture of silica-alumina bricks by Mountain Debbagh halloysiteand Tamazert’s kaolin. The bentonite (BNT) used in the context of this work is natural,extracted from the Hammam Boughrara deposit of Maghnia, and which has a trade nameof “Bentonite Brute”, consisting essentially of montmorillonite and with a bulk density of2.2–2.4 g/cm3, acquired from Bental (Mostaganem, Algeria).
We did the chemical modification Na-MMT; after that, MMT (25 g) was put in a400 mL flask, followed by distilled water (400 g), and OTAC (6.77 g) was added. Theresponse temperature was maintained at 350 K for 3 h and then filtered. Finally, organicallyadjusted montmorillonite was washed 3–5 times with distilled water, positioned in anoven, and dried for 6 h at 370 K. Finally, we got OMMT ground (montmorillonite that waschanged organically).
2.2. Processing of Polyurethane Foams (PUR)
The polyurethane foam is formed from various components undergoing two simulta-neous reactions. As seen in Figure 1, polyol and diisocyanate react to generate polyurethanemacromolecules [27]. The response is exothermic, and the heat is used to evaporate volatileliquids, i.e., blowing agents responsible for the expansion and the processed foam. Carbondioxide is formed through auxiliary reactive chemicals vaporized during the reaction toprovide additional gases that blow the liquid polymer, as shown in Figure 1.

Appl. Sci. 2022, 12, 2206 4 of 28
Figure 1. Polyurethane formation [4].
In this mechanism, a carbamic acid is formed as an intermediate. This reactionproduces 197 kilojoules of heat per mole of water. Reacting with another isocyanate groupgives disubstituted urea or urea, or urine. An isocyanate can react with disubstituted ureato form a substituted biuret. Several authors have published kinetic experiments on thecarbon dioxide formation rate [28]. Isocyanates react with labile hydrogen compounds ina sophisticated way that produces hydrogen cyanide as a byproduct. Allophanates areformed when isocyanates combine with urethanes between 100 and 140 ◦C (Figure 2d).An analysis of the literature explains the complicated reaction pathways related to theisocyanate function. Many of these methods are still speculative, and their validation takesconsiderable time [29].
Figure 2. Foaming reaction yielding to CO2 and amine and subsequent responses.
The choice of polyol, isocyanate rules the processing of flexible polymer foam materialsand the most suitable catalyst to achieve a reliable recipe leading to a flexible foam with thedesired characteristics. Catalysis is necessary for processing material in an economicallyviable period, from an industrial point of view [30], i.e., no more than 10 min. PURdevelopment in free expansion mode is carried out at atmospheric pressure using a 300 mLreactor with a mechanical stirrer with 2500 rpm speed. After the thickening of the PURand its cooling, the foam is removed from the mold. After 24 h in the open (to harden), theremolded product is kept away from light and moisture for later evaluation. The diagramdisplays our experimental approach in Figure 1 in support information (SI).
All formulations are summarized in Table 1. Bentonite was added to neat polyurethaneformulations to improve the intumescence and stiffness of foams. Other additives such asstabilizers and technological adjuvants are added to modify the properties of foams. Theformulations are according to the following code PURNCO/OH/Catalyst/BNT/Al2O3 inTable 1.
We investigated the influence of the catalyst and surfactant NCO/OH ratios and theeffect of additives on the kinetics of the expansion process and the shape and stiffness ofthe polyurethane foam.

Appl. Sci. 2022, 12, 2206 5 of 28
Table 1. Quantity of the prepared polyurethane foams (in wt.%).
Component Materials
PUR_01 PUR_02 PUR_03 PUR_04 PUR_05 PUR_06
PUR1.05/0.93/0/0
PUR1.1/1.25/10.52/0
PUR1.04/1.25/10.43/0
PUR1.08/0.97/3.52/0
PUR1.05/1.89/0/10.53
PUR1.01/1.74/0/0
A
Polyol (wt.%) 62.58 59.09 58.44 62.17 58.83 65.94Glycerin(wt.%) 1.38 2.19 2.15 2.29 2.28 1.01
Dichloromethane(wt.%) 0.74 0 0 0 1.24 0.82
Silicone (wt.%) 0.83 2.07 1.46 1.54 1.24 2.75PEG (wt.%) 1.25 0 0 0 0 1.11
CatalystBDMAEE
(wt.%)0.93 1.26 1.26 1 1.79 1.76
Bentonite(wt.%) 0 10.52 10.43 3.52 0 0
Alumina(wt.%) 0 0 0 0 10.53 0
B PMDI (wt.%) 32.29 24.87 26.26 29.49 24.09 26.61
2.2.1. Influence of the NCO/OH Ratio
To optimize the free expansion formulation of PUR, we used the ratio of NCO/OHmade with catalysts: BDMAEE (5 wt.% POPE)/2-TEH (2.5 wt.% POPE), described asthe relationship of -NCO number per kg of -OH functions per kg, recognizing that theratio of the PUR varies from 1.01 to 1.1. The marginal NCO excess will lead to lowercharacteristics, especially modulus, since the reaction will be thus incomplete. The tworemaining formulae were chosen to minimize the number of available NCO functions andprocessed at a 1.06 NCO/OH ratio. PUR formulations with an NCO/OH ratio of PUR_2,PUR_ 5, and PUR_1 achieved our objective, including open cells. The foam resulting fromPUR_3 had a stiff feature and homogenous cell dispersion. The PUR_4 based foam wasstill stiff, but the cells’ distribution was more or less homogenous. The foam resulting fromPUR_6 looked pretty rigid, but it was still dense and sticky. We set the PMDI, polyol, andglycerin concentrations and changed the additives’ ratio to small quantities (summary inTable 2).
Table 2. The various ratios used during the PUR formula optimization.
Samples NCO/OH NCO (mol)/PMDI (mL)
NCO (mol)/GCO (mL)
NCO (mol)/Additives (mL) Shore A (A) Apparent
Density (at RT)
PUR_01 1.05 44.55 3.1 39.32 50 0.32PUR_02 1.1 44.55 3.1 37.4 37 0.07PUR_03 1.06 44.55 3.1 38.92 51 0.23PUR_04 1.04 44.55 3.1 39.73 76 0.23PUR_05 1.08 44.55 3.1 38.15 47 0.18PUR_06 1.01 44.55 3.1 41 85 0.34
2.2.2. Influence of the Catalyst
Four catalysts were used while keeping the NCO/OH proportion. Since the resultingfoam was in a semirigid shape, whatever the type and mass of the catalyst, adding A33alone at 5% of the polyol (POPE) mass resulted in a relatively good expansion reaction,which created an intact semirigid substance (Figure 3a). Adding A33 and EO at 5 and 0.5%of POPE resulted in a speedy cream expansion of fewer than 12 s (Figure 3b). Lastly, theessential components were not even correctly combined. For both catalysts, adding A33and EA1 at 2.5% of POPE resulted in a versatile substance with slight expansion due to

Appl. Sci. 2022, 12, 2206 6 of 28
low reaction acceleration (see Figure 3c). The inclusion of A33 and TMD at 5% and 0.5%of POPE, respectively, resulted in an exceedingly slow growth with a 320-s improvement.Therefore, it can be inferred that the benefit of adding TMD is the position of an expansionretardant. Still, its crucial downside is the reaction with isocyanates to urea, which is whythe spray looks very sticky (Figure 3d).
Figure 3. Influence of the nature of the catalyst on the morphology of the polyurethane foams(NCO/OH = 1.1): (a) 5 wt.% TEDA; (b) TEDA (5 wt.% POPE)/2-TEH (0.5 wt.% POPE); (c) BDMAEE(5 wt.% POPE)/2-TEH (2.5 wt.% POPE); (d) TEDA (5 wt.% POPE)/TMDA (0.5 wt.% POPE).
2.3. Physical-Chemical Characterization2.3.1. Raman Spectroscopy
We used a model Forman 685-2 Foster spectrometer for Raman characterization, pow-ered by 685-2 software form, and a laser diode emitting red bright by 685 nm wavelength.Raman’s offsets 400–2000 cm−1 range were calculated. The parameters of acquisition usedwere 532 nm green laser with 1% power, x50 microscope objective, the woven spectralrange of 100 toward 3200 cm−1, 10 s exposure time, three accumulations for respective spec-trum. The spectra obtained were broken up by the TA Universal Analysis and Dmfit2011software [31].
2.3.2. X-ray Scattering (WAXS)
Porous phase dimensional characterization was mainly achieved by X-ray diffrac-tion (XRD). This device has a GD 2000 goniometer and is managed by WinDust32. Thediffractogram was deconvolved with the Gaussian function to compute the amorphous andcrystalline phases. The peak areas were calculated using WinAcq32. The radiation usedwas of CuKα type with a voltage of 40 kV and 30 mA and an angle speed of 0.01◦/s. Thefillers bentonite and alumina were crystalline. The software WinDust 32 and WinSearchindicated a tetragonal crystalline system with mesh a = b = 3.78 and c = 9.51 for bentonite.In addition, the hexagonal system for alumina with parameters of mesh a = b = 4.98 Å andc = 17.02 Å.
2.3.3. Analyses Spectroscopy FTIR
Fourier’s Infrared Transform Spectroscopy (FTIR) is a well-developed analyticalmethod for hydrogen bonding analysis and phase separation phenomena [32].
Appl. Sci. 2022, 12, 2206 7 of 28
The spectrophotometer is a SHIMADZU, type 8400 S. The analytical range is about500–3500 cm−1 with 60 scans and 2 cm−1 resolutions. A mass of 2 mg of samples wascompacted under a 60 kN press.
2.3.4. Thermogravimetric Analysis
Thermogravimetric analyses (TGA) were conducted under a nitrogen flow and per-formed with a TA Instruments Q50. The weight of the sample ranged from 3 to 4 mg. Thisthermal degradation took place in inert or oxidizing gas atmospheres. Samples were heatedat 10 ◦C·min−1 from 20 ◦C to 500 ◦C.
2.3.5. Differential Scanning Calorimetry (DSC)
DSC was performed on a TA Instruments Q100 under a nitrogen flow. Nonhermeticaluminum capsules were used for 3–5 mg samples. The heating of the first ramp was madeat 10 ◦C·min−1 up to 125 ◦C. The sample was cooled down at 10 ◦C·min−1 up to −100 ◦C.The heating second ramp was performed with the speed of 10 ◦C·min−1 up to 250 ◦C,200 ◦C or 150 ◦C depending on the sample degradation temperature.
2.4. Microstructural Characterization2.4.1. Optical Microscopy
Microstructural analysis was performed using an optical microscope OPTO-EDUA12.1502-T Advanced Compound Trinocular. Optical microscopic depth limits indicatethat low magnifications are suitable for the three-dimensional nature of foams.
2.4.2. Electron Scanning Microscopy (SEM)
Backscattered images from electrons were obtained from a scanning electron micro-scope (SEM), a Jeol JSM-5410LV coupled with Isis Dispersive Energy X-ray SpectrometerEDS in conjunction with an EMA probe Oxford Link. The SEM used was the FEI brand,QUANTA 600, with a maximum voltage of 10 KV under a high vacuum HV. The samplepreparation included cutting foam samples in bits of around 5× 3× 2 mm3, using a scalpelblade. Each piece was mounted on an aluminum sample holder. Metallization with goldwas required to get a conductive coating to cover the sample surface and thus prevent thephenomenon of accumulation of charges.
2.5. Mechanical Behavior of Foams2.5.1. Compression Tests
Six series of test pieces were cut following two different directions, that is to say, in thehorizontal and vertical directions. Each series included four cylindrical specimens preparedfrom previously described formulations (Figure S3 in SI). The sample was compressedbetween the two compression plates until a strain was established. A force sensor measuredand recorded the variation in the stress applied to distort the piece. The apparatus usedfor the compression tests was a 40 T dynamometer, which can be used in tension andcompression. The mechanical compression tests were carried out according to standardASTM D3574 [33]. This test involved compressing the sample to 80% of its specific thicknessat a displacement rapidity of 3.33 × 10⁻⁵ m/s. Compression was maintained for 900 s. Thestress-strain curve and the final stress value after 60 s, defined as compressive strength,were recorded. Dimensions of compression samples were cylindrical. This test involvedcompressing the sample to 80% of its specific thickness at a 2 mm/min displacement pace.Dimensions of polyurethane foam samples for compression test are in Table S1 in SI.
2.5.2. Resilience Impact
Impact tolerance is one of the mechanical qualities of polymer materials often soughtand used directly for reinforcement. A shocking test of the CHARPY type was usedaccording to the ISO 179-1 standard.
Appl. Sci. 2022, 12, 2206 8 of 28
Hardness Shore A tests were made with a MITUTOYO brand type A durometer,model 811-315-01; at room temperature, Shore A spreads on a measurement scale from0 to 100 (100 = overall hardness: 0 = overall penetration). Ten measurements were madeon each sample. The final compliance value was determined according to the ASTMD2240 standard.
3. Results3.1. Physical–Chemical Characterization3.1.1. Raman Spectroscopy
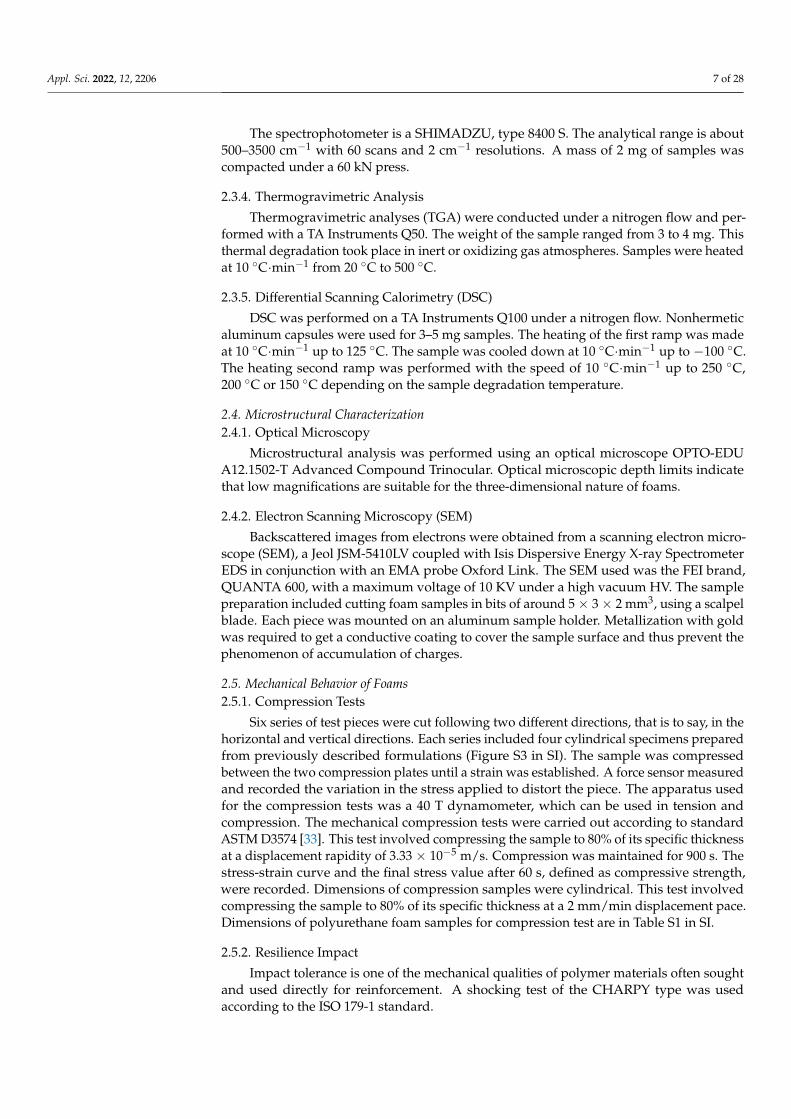
Raman spectroscopy allows checking the polyurethane structure of the foam, what-ever the formulation and no-no side reactions led to other undesirable products. Figure 4demonstrates that the addition of the additives did not alter the PUR essential characteris-tics. Some authors [34] assign the peak at 1530 cm−1 to 4,4′ para MDI isomers in the MPDI.Others claim it accounts for a third of the vibration of the C-C elongation of the PMDIaromatic rings in monosubstituted benzene [35].
Figure 4. Raman spectra of the different PUR with various additives.
We note that no characteristic Raman peak appeared in the 500 cm−1 range for foamscontaining bentonite loadings (samples PUR_02, PUR_03, and PUR_04). The fifth PUR_05alumina-containing polyurethane foam did not have loads such as PUR_06, and PUR_01had a distinctive crest. Writers mean that alumina with a crystalline structure dispersed ina polyurethane matrix in the condensed phase can act as a physical barrier to strengthenthe foam cell walls, effectively affecting the enhancement of its shock-absorbing properties.
3.1.2. Analyses Spectroscopy FTIR
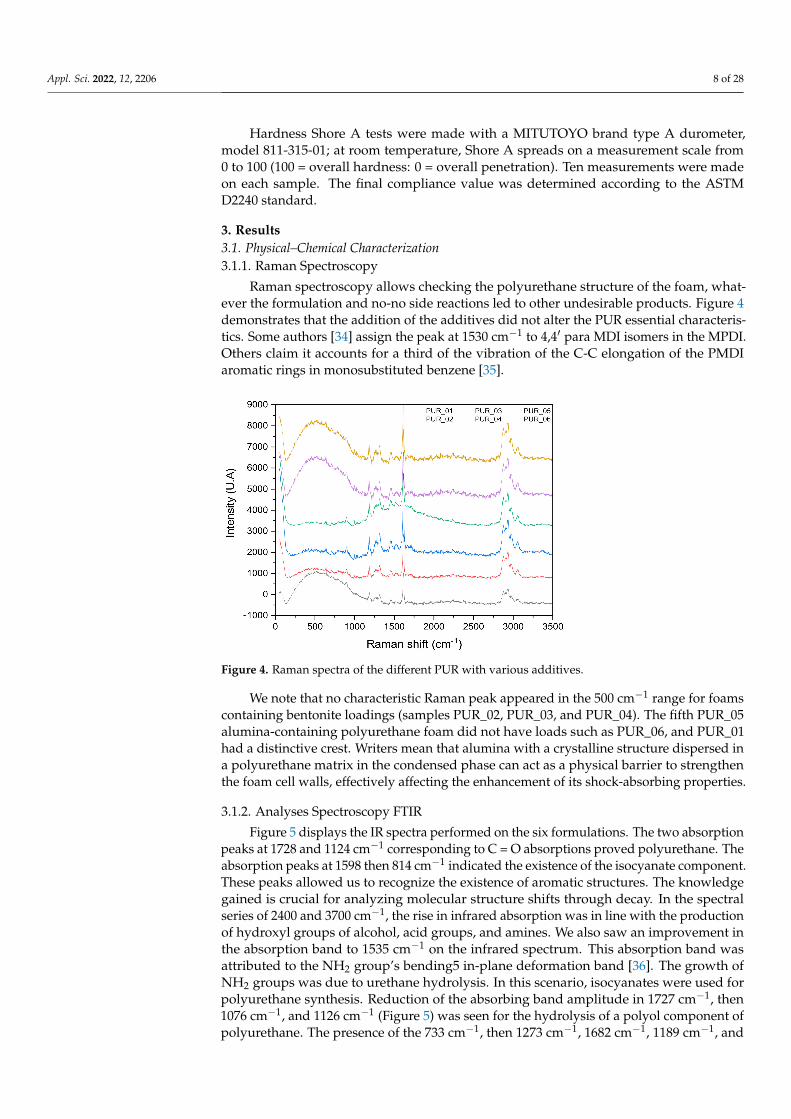
Figure 5 displays the IR spectra performed on the six formulations. The two absorptionpeaks at 1728 and 1124 cm−1 corresponding to C = O absorptions proved polyurethane. Theabsorption peaks at 1598 then 814 cm−1 indicated the existence of the isocyanate component.These peaks allowed us to recognize the existence of aromatic structures. The knowledgegained is crucial for analyzing molecular structure shifts through decay. In the spectralseries of 2400 and 3700 cm−1, the rise in infrared absorption was in line with the productionof hydroxyl groups of alcohol, acid groups, and amines. We also saw an improvement inthe absorption band to 1535 cm−1 on the infrared spectrum. This absorption band wasattributed to the NH2 group’s bending5 in-plane deformation band [36]. The growth ofNH2 groups was due to urethane hydrolysis. In this scenario, isocyanates were used forpolyurethane synthesis. Reduction of the absorbing band amplitude in 1727 cm−1, then1076 cm−1, and 1126 cm−1 (Figure 5) was seen for the hydrolysis of a polyol component ofpolyurethane. The presence of the 733 cm−1, then 1273 cm−1, 1682 cm−1, 1189 cm−1, and
Appl. Sci. 2022, 12, 2206 9 of 28
916 cm−1 absorption bands was also confirmed. Spectra of raw materials FTIR are shownin Figures S6–S13 at in SI.
Figure 5. Comparative overlay of infrared spectra for samples of polyurethane foam.
Raman spectroscopy is a technology that works in conjunction with FTIR to provideadditional information. The addition of clay bentonite significantly increased the overallintensity of the C-C aromatic band as measured by the Raman technique. However, itslocation moved to lower frequencies (about 1643 to 1535 cm−1), implying that interactionsbetween double carbon conjugated bonds are more aromatic [37].
The following polymerized infrared absorption spectroscopy levels were allocatedbased on the treatment of the infrared sample polyurethane foam: 1257 cm−1 symmetricallyextended, Si-CH3, Si-O-Si 1003 cm−1 protracted, 791 cm−1, 755 cm−1 -(CH2)3- rocked. The1003 cm−1 absorption band Si-O-Si confirmed the polymerized monomers on the foamsurfaces, and thus the FTIR reaction of the handled foam originated primarily from theexternal polymer network.
3.1.3. X-ray Scattering (WAXS)
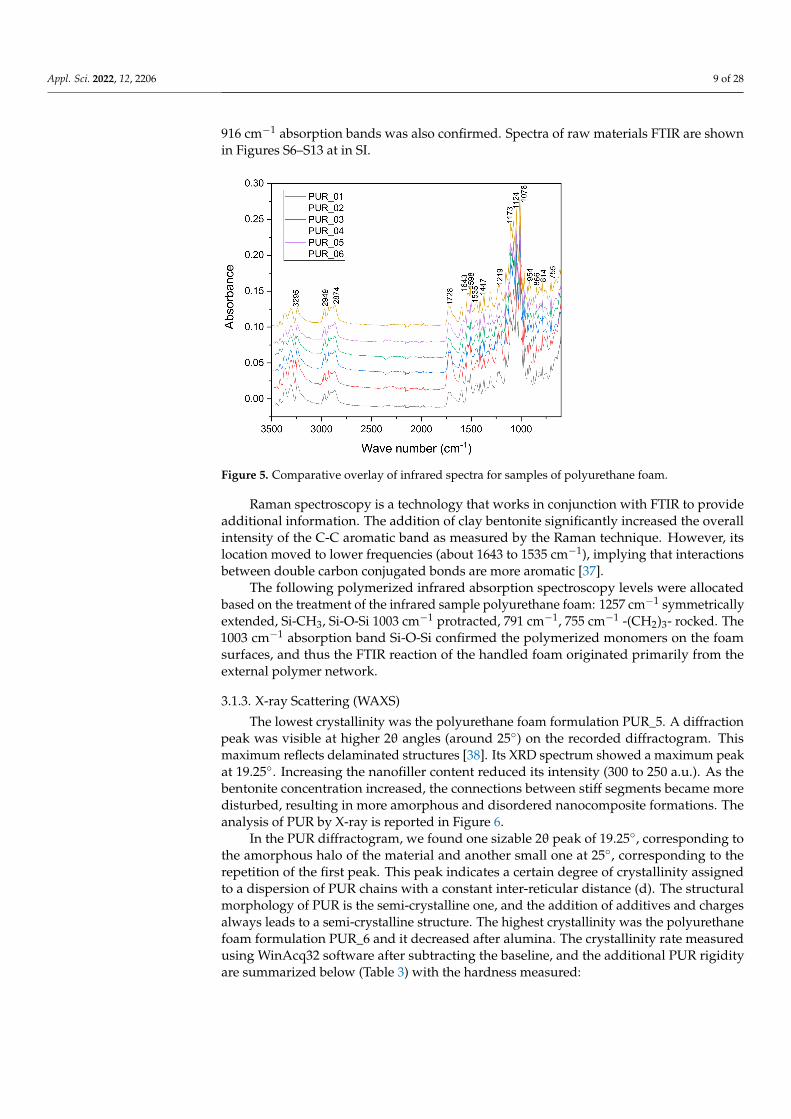
The lowest crystallinity was the polyurethane foam formulation PUR_5. A diffractionpeak was visible at higher 2θ angles (around 25◦) on the recorded diffractogram. Thismaximum reflects delaminated structures [38]. Its XRD spectrum showed a maximum peakat 19.25◦. Increasing the nanofiller content reduced its intensity (300 to 250 a.u.). As thebentonite concentration increased, the connections between stiff segments became moredisturbed, resulting in more amorphous and disordered nanocomposite formations. Theanalysis of PUR by X-ray is reported in Figure 6.
In the PUR diffractogram, we found one sizable 2θ peak of 19.25◦, corresponding tothe amorphous halo of the material and another small one at 25◦, corresponding to therepetition of the first peak. This peak indicates a certain degree of crystallinity assignedto a dispersion of PUR chains with a constant inter-reticular distance (d). The structuralmorphology of PUR is the semi-crystalline one, and the addition of additives and chargesalways leads to a semi-crystalline structure. The highest crystallinity was the polyurethanefoam formulation PUR_6 and it decreased after alumina. The crystallinity rate measuredusing WinAcq32 software after subtracting the baseline, and the additional PUR rigidityare summarized below (Table 3) with the hardness measured:
Appl. Sci. 2022, 12, 2206 10 of 28
Figure 6. X-ray diffractogram for samples of polyurethane foam.
Table 3. Diffractogram parameters and rigidity of different PUR produced.
Foams d (nm) (2θ) Crystallinity Rate (%) Rigidity by Shore A
PUR_1 39.82 60PUR_2 9.23 37.11 52PUR_3 (9.58◦) 32.2 65PUR_4 4.6 34.15 70PUR_5 (19.26◦) 36.01 55PUR_6 44.55 80
WinAcq32 software used XRD patterns to measure the degree of crystallinity. The2h scan range was set to 5–45 since this values range contained all of the strong crys-talline peaks. The hard polyurethane PUR_6 had 44.55% crystallinity, whereas the softpolyurethane PUR_3% had 32.2 crystallinity (shown in PUR diffractograms in Figure 6).Our materials’ rigidity was proportional to crystallinity [39]. Notwithstanding the rigiditycalculated by shore A, our elaborate PUR was semirigid.
3.1.4. Thermogravimetric Analysis
The TGA analyses reported in Figures 7 and 8 were carried out on the polyurethanefoam samples.
The TGA curve from different samples indicates a single transition with a maximumof approximately 400 ◦C. The first derivative of the mass loss revealed a first mass loss ataround 191 ◦C. This transition corresponded to a mass loss that occurred during foaming.
The polyurethane foam curve demonstrates two thermal transformations at 260 ◦Cand 340 ◦C. Many authors have related these changes to various areas of the polyurethaneframework [40,41]. The first transformation was the degradation of the part isocyanate,and the second was the polyol element.
The proportion of residual mass in loaded polyurethane foams was determined usingthe TGA curve as a reference. Bentonite decomposes at temperatures ranging from 400 ◦Cto 800 ◦C. Whereas alumina decomposes at temperatures greater than 700 ◦C, using a fillerincreases the thermal stability of polyurethane and the specific gravity and toughness ofpolyurethane. Polyurethane foam incorporating bentonite has a higher residual mass.
All polyurethane foams undergo two separate degradation processes. The first heatbreakdown process occurs as a result of urethane bond cleavage. Consequently, the ini-tial deterioration stage happens during the thermal disintegration of the hard segments,

Appl. Sci. 2022, 12, 2206 11 of 28
whereas the secondary degradation step occurs during the temperature breakdown of thesoft segments.
PUR_5 exhibited a higher initial temperature of decomposition (Td5%) and a highermaximum temperature of weight loss (Tdmax) than PUR_2, PUR_3, and PUR_4, which maybe ascribed to the nanoparticle-PMDI bonds being broken. The thermal stability of the ure-thane linkages formed between polyether polyol (POPE) and polymeric methane diphenyldiisocyanate (PMDI) was reduced. Bentonite and alumina were homogeneously distributedthroughout all polyurethane samples, as the proportion of leftover mass corresponded tothe quantity applied.
Figure 7. Evolution of the % loss of mass as a function of temperature for different polyurethane foams.
Figure 8. Differential curves (DTG) of polyurethane foams.
3.1.5. Differential Scanning Calorimetry (DSC)
Glass transition temperatures Tg may be determined by DSC at temperatures rangingfrom 40 to 80 ◦C [42]. The DSC thermograms of polyurethane foams are shown in Figure 9.

Appl. Sci. 2022, 12, 2206 12 of 28
Figure 9. DSC thermograms of polyurethane foams (10 K·min−1).
The flexible matrix was characterized in our case by a glass transition, which hada starting temperature of Tg =−30 ◦C to −60 ◦C. The rigid domains displayed manymelting peaks at temperatures Tm1, Tm2, Tm3. A significant phenomenon occurred at anintermediate temperature Onset Tr = −51 ◦C and could be associated with rigid domainglass transition [43], and then with a flexible and inflexible interface micro mix [44]. Partialsoft phase crystallization may be excluded [45]. These segments often have a concise chainlength. These flexible segments can be crystallized at low temperatures between 20 ◦C and40 ◦C.
Figure 9 indicates that the Tg differed with all samples tested. However, we sawa decrease for PUR_01 from −30 to −45. This reduction represents an improvement inthe free volume of the polymer, which may be linked with a decrease in polymerization,crosslinking or crystallinity.
Tg refers to the average polymer molar mass under Flory–Fox law in Equation (1):
Tg = Tg∞ − KMn
(1)
In this formula, K is a related observed parameter connected to volume, and Mn is theaverage number of molecular weights. Tg∞ is the maximal transitional glass temperature aparticle of infinite particle weight could attain. Therefore, a reduction in the molar massleads to a decrease of Tg, according to this equation. The Fox–Flory hypothesis considersthe free volume differences between chain endpoints and the interior chain unit [46]. Inour approach, chain ends were ignored.
Nonetheless, the inner block units’ free volumes and the block ends should be some-what different. When temperatures reach these levels, the PUR blocks connected to eachhard segment block are very mobile and ensure that the ends of the hard block are notconstrained. The ends of hard blocks can function as free chain ends.
For polyurethane foam, a decrease of Tg is clarified by the decomposition of a previ-ously IRTF characterized polyol causing polymer fragmentation chains, thereby reducingaverage molar weight, enhanced free volume, and molecular mobility. DSC specifies thetransformation of the glass and melting temperatures of our PUR. The results of the dif-ferent physical and chemical characterization of polyurethane foams are summarized inTable 4.

Appl. Sci. 2022, 12, 2206 13 of 28
Table 4. Glass transition and melting temperatures of our PUR foams determined by DSC(10 K·min−1).
Foams Tg (◦C) Tm1 (◦C) Tm2 (◦C) Tdmax (◦C) Residue % Td5% (◦C)
PUR_1 −36 - - 382 9.5 282PUR_2 −57 120 188 367 17.8 254PUR_3 −43 137 384 25.9 279PUR_4 −35 - - 378 14.3 271PUR_5 −34 - - 390 11.8 292PUR_6 −49 - - 388 21.0 291
Temperature measurements at 5% mass loss (Td5%) were 254, 279, and 271 ◦C forPUR-Bentonite, and 292 ◦C for PUR-Alumina, respectively. All polyurethane samplesdemonstrated a significant weight loss in the 367–384 ◦C region (17.8%, 25.9%, and 14.3% forPU-Bentonite, respectively), indicating their exceptional heat stability. Most weight loss hap-pens at 390 ◦C (11.8% for PUR-Alumina). Both PUR-Bentonite exhibited a slightly greateramount of char residue compared to PUR-Alumina. The DTG curve of PUR-Aluminais shown in (Figure 8. Additionally, there were maximum temperatures in the range of280–450 ◦C associated with mass loss due to thermal decomposition.
A broad phenomenon was present with intermediate temperature Tr = −51 ◦C. ThisPOPE had a rather high molar mass (3500 g/mol); hence, it had a marked crystallinecharacter. The fluid POPE sequences were arranged about each other in a rather large massproportion in the PUR chains, contributing to the production of crystalline phases [47].The polyol molar mass used in a PUR synthesis reached 1000 g/mol. As in our case,“soft” sequences of the polyol of PUR chains were ordered. The usage of PMDI as a chainexpansion agent does not facilitate the arrangement of rigid series, nor does it prohibit thecrystallization of rigid phase. During the second temperature increase, our material’s softphase was no longer as pure as more rigid fragments blended better with the soft phase.These glass transfer temperatures and soft domain recrystallization were higher. Flexiblesection recrystallization indicated the existence of the micro separation process and therebyshowed the findings of the IR study. Recrystallization revealed that our PUR was onlypartly related, marked by a significant decrease in recrystallization enthalpy.
3.2. Mechanical Characterization3.2.1. Compression Tests
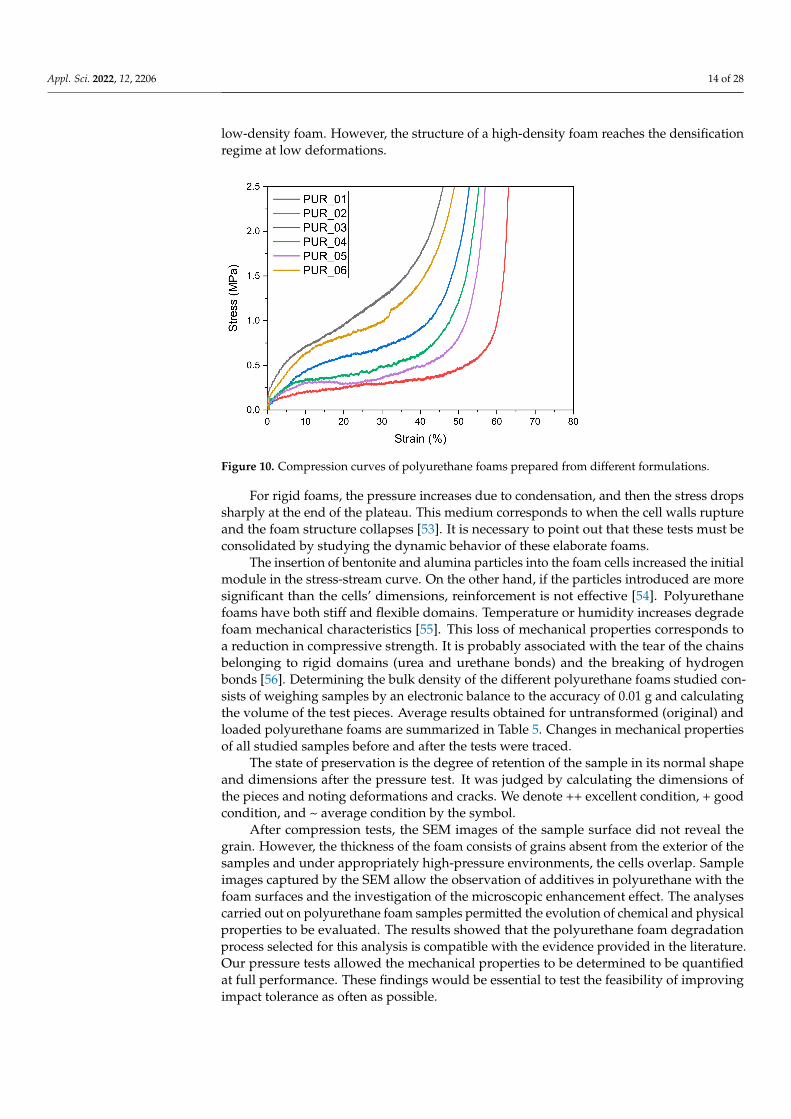
The characteristic force-displacement curve of polyurethane foam (Figure 10) showsthe three strain regimes typical of viscoelastic materials. The first part of the curve is linearand corresponds to the elastic regime. When the constraint was removed, the deformationof the sample was reversible. After the yield point, which is the end of the linear part, thestress-strain curve shows a long plateau at almost constant stress. This part corresponds tothe platform. It is associated with the plastic deformation structure through a polyurethanefoam brittle to the rupture of the cell walls. As the strain increased, the walls of cellscame into contact with each other. When all the voids were filled, the resistance of thefoam increased rapidly, proportional to the measured stress. This last section of the curveis called the densification scheme [48]. The curve representative of cellular compressionshows a linear phase shadowed by a load plateau (force) and a densification step. The loadincreased considerably with displacement, behavior in three stages [49]. A slight dispersionwas observed between the six specimens carried out under the same production conditionsand tests [50].
The mechanical properties of polyurethane foam depend strongly on density, cell sizeand form, and the percentage of close and open cells. The foam may have a preferentialorientation of the structure of the cells. Cells frequently appear elongated along the directionof expansion. It has been demonstrated that when the density of the foam increases, theelastic limit and plateau height rise [51], while the elongation of the plateau decreases [52].This means mean that high-density foam is better at resisting the restrictions applied than
Appl. Sci. 2022, 12, 2206 14 of 28
low-density foam. However, the structure of a high-density foam reaches the densificationregime at low deformations.
Figure 10. Compression curves of polyurethane foams prepared from different formulations.
For rigid foams, the pressure increases due to condensation, and then the stress dropssharply at the end of the plateau. This medium corresponds to when the cell walls ruptureand the foam structure collapses [53]. It is necessary to point out that these tests must beconsolidated by studying the dynamic behavior of these elaborate foams.
The insertion of bentonite and alumina particles into the foam cells increased the initialmodule in the stress-stream curve. On the other hand, if the particles introduced are moresignificant than the cells’ dimensions, reinforcement is not effective [54]. Polyurethanefoams have both stiff and flexible domains. Temperature or humidity increases degradefoam mechanical characteristics [55]. This loss of mechanical properties corresponds toa reduction in compressive strength. It is probably associated with the tear of the chainsbelonging to rigid domains (urea and urethane bonds) and the breaking of hydrogenbonds [56]. Determining the bulk density of the different polyurethane foams studied con-sists of weighing samples by an electronic balance to the accuracy of 0.01 g and calculatingthe volume of the test pieces. Average results obtained for untransformed (original) andloaded polyurethane foams are summarized in Table 5. Changes in mechanical propertiesof all studied samples before and after the tests were traced.
The state of preservation is the degree of retention of the sample in its normal shapeand dimensions after the pressure test. It was judged by calculating the dimensions ofthe pieces and noting deformations and cracks. We denote ++ excellent condition, + goodcondition, and ~ average condition by the symbol.
After compression tests, the SEM images of the sample surface did not reveal thegrain. However, the thickness of the foam consists of grains absent from the exterior of thesamples and under appropriately high-pressure environments, the cells overlap. Sampleimages captured by the SEM allow the observation of additives in polyurethane with thefoam surfaces and the investigation of the microscopic enhancement effect. The analysescarried out on polyurethane foam samples permitted the evolution of chemical and physicalproperties to be evaluated. The results showed that the polyurethane foam degradationprocess selected for this analysis is compatible with the evidence provided in the literature.Our pressure tests allowed the mechanical properties to be determined to be quantifiedat full performance. These findings would be essential to test the feasibility of improvingimpact tolerance as often as possible.

Appl. Sci. 2022, 12, 2206 15 of 28
Table 5. Characteristics of samples before and after mechanical tests.
Foams E (MPa) at 2% Stress @plateau(MPa)
Density (g/cm3)at 0%
Density afterCompression(g/cm3) at 0%
DeformationMax (
Appl. Sci. 2022, 12, x FOR PEER REVIEW 15 of 29
the chains belonging to rigid domains (urea and urethane bonds) and the breaking of hy-drogen bonds [56]. Determining the bulk density of the different polyurethane foams studied consists of weighing samples by an electronic balance to the accuracy of 0.01 g and calculating the volume of the test pieces. Average results obtained for untransformed (original) and loaded polyurethane foams are summarized in Table 5. Changes in mechan-ical properties of all studied samples before and after the tests were traced.
Table 5. Characteristics of samples before and after mechanical tests.
Foams E (MPa)at 2%
Stress @plateau
(MPa)
Density (g/cm3) at
0%
Density after Compression (g/cm3) at 0%
Deformation Max ( ɛ max)
Masse of Polyurethane
Foams Compression (mg)
Mass Loss after (mg)
Weight Loss after
Compression (% mg/mg)
Conservation State
PUR_01 0.13 0.13 0.32 0.46 61.6 11.66 0.03 0.3 ++ PUR_02 0.03 1.38 0.07 0.07 64.27 2.13 0.13 6.5 ++ PUR_03 0.06 0.06 0.24 0.23 59.81 6.19 0.04 0.7 + PUR_04 0.07 0.07 0.22 0.22 61.9 6.22 0.05 0.9 + PUR_05 0.06 0.06 0.17 0.16 68.4 4.56 0.07 1.7 ++ PUR_06 0.12 0.06 0.33 0.31 59.74 9.34 0.08 0.9 ~
The state of preservation is the degree of retention of the sample in its normal shape and dimensions after the pressure test. It was judged by calculating the dimensions of the pieces and noting deformations and cracks. We denote ++ excellent condition, + good con-dition, and ~ average condition by the symbol.
After compression tests, the SEM images of the sample surface did not reveal the grain. However, the thickness of the foam consists of grains absent from the exterior of the samples and under appropriately high-pressure environments, the cells overlap. Sam-ple images captured by the SEM allow the observation of additives in polyurethane with the foam surfaces and the investigation of the microscopic enhancement effect. The anal-yses carried out on polyurethane foam samples permitted the evolution of chemical and physical properties to be evaluated. The results showed that the polyurethane foam deg-radation process selected for this analysis is compatible with the evidence provided in the literature. Our pressure tests allowed the mechanical properties to be determined to be quantified at full performance. These findings would be essential to test the feasibility of improving impact tolerance as often as possible.
3.2.2. Resilience Impact The findings of the research indicate explicitly that polyurethane foams are extremely
robust. In addition, the test findings suggest that the resistance of PUR foams improves with increased hardness. The resistance coefficient of the 80 °Sh A toughness polyure-thane foam is about 16% greater than that of the 70 °Sh toughness polyurethane foam. Strong durability implies decent resistance. This is what was observed, which gives them tenacity, and adding bentonite makes the foam more tenacious.
The study of the microphotographs reveals, however, that there are no indicators of elastic deformation in the tension surface of the test PUR samples. However, the surface of the higher toughness PUR samples reveals less harm, even though multiple material cracks are evident. These cracks can result from the deformation of the material cyclically (tired) during the friction phase. The structural research would not understand why the tougher polyurethanes are more resistant. The frictional properties of the materials were investigated under settings that varied according to their chemical composition and dis-tinctive PUR-type molecular structure.
Based on the review of the testing findings, polyurethane foams will improve stabil-ity and operating efficiency instead of other polymeric materials. A study into the physical alteration of polyurethanes added to the bases of different structures would clarify their
max)
Masse ofPolyurethane
FoamsCompression (mg)
Mass Loss after(mg)
Weight Lossafter
Compression (%mg/mg)
ConservationState
PUR_01 0.13 0.13 0.32 0.46 61.6 11.66 0.03 0.3 ++PUR_02 0.03 1.38 0.07 0.07 64.27 2.13 0.13 6.5 ++PUR_03 0.06 0.06 0.24 0.23 59.81 6.19 0.04 0.7 +PUR_04 0.07 0.07 0.22 0.22 61.9 6.22 0.05 0.9 +PUR_05 0.06 0.06 0.17 0.16 68.4 4.56 0.07 1.7 ++PUR_06 0.12 0.06 0.33 0.31 59.74 9.34 0.08 0.9 ~

Appl. Sci. 2022, 12, 2206 16 of 28
3.2.2. Resilience Impact
The findings of the research indicate explicitly that polyurethane foams are extremelyrobust. In addition, the test findings suggest that the resistance of PUR foams improveswith increased hardness. The resistance coefficient of the 80 ◦Sh A toughness polyurethanefoam is about 16% greater than that of the 70 ◦Sh toughness polyurethane foam. Strongdurability implies decent resistance. This is what was observed, which gives them tenacity,and adding bentonite makes the foam more tenacious.
The study of the microphotographs reveals, however, that there are no indicators ofelastic deformation in the tension surface of the test PUR samples. However, the surfaceof the higher toughness PUR samples reveals less harm, even though multiple materialcracks are evident. These cracks can result from the deformation of the material cyclically(tired) during the friction phase. The structural research would not understand whythe tougher polyurethanes are more resistant. The frictional properties of the materialswere investigated under settings that varied according to their chemical composition anddistinctive PUR-type molecular structure.
Based on the review of the testing findings, polyurethane foams will improve stabilityand operating efficiency instead of other polymeric materials. A study into the physicalalteration of polyurethanes added to the bases of different structures would clarify theirresistant mechanisms and probable technical uses in the future. The results of the Charpytests are summarized in the following Table 6.
Table 6. The results of the Charpy tests.
Samples Average Energy PercentageConsumed % Average Consumed Energy (J) Rigidity (A)
PUR_01 2.388 0.597 60PUR_02 69 17.25 52PUR_03 4.256 1.064 65PUR_04 3.336 0.834 70PUR_05 29.05 7.26 55PUR_06 1.952 0.488 80
3.3. Microstructural Characterization3.3.1. Optical Microscope
Figure 11 provides the findings of the description of the microstructure polyurethanefoam included as reference material. The optical microscope’s picture reveals a partiallyopen-cell foam that does not close entirely by the wall and interacts with or without othercells between the walls of specific cells and visible cell membranes. The legal age of cells,though, indicates that membranes are missing. Open-cell moisture is typically moisture softor mid-soft. The cell structure is partly open because it is compatible with the foam’s nature.
These polymer compositions resulted in single-phase and heterophase solids thatwere examined morphologically. The physicochemical properties of these materials wereanalyzed by Raman spectroscopy. They have also been shown to detect their structurein good agreement with the standard sheets ASTM. Because of the effects obtained, theelaborated pieces appear to have stubborn regular cellular structures with significantreversibility of overlap.
3.3.2. Scanning Electron Microscopy (SEM)
The SEM photos often demonstrate the appearance of the grains and the surfaces ofthe cells are rougher, and the analyses suggest that they are additives in the polyurethanefoam preparation (Figure 12). We used alumina fillers with a particle size = 3 to 6 µm. Wepurified the bentonite, and OMMT montmorillonite extracted from it had a grain size of1 to 2 µm in diameter. Samples of the specified sizes were cut with a band saw, i.e., verticalto the direction of foam growth, and we observed the inner section of the foams in theSEM device.

Appl. Sci. 2022, 12, 2206 17 of 28
Figure 11. Cellular image of polyurethane.
The images represent the SEM several days after the compression experiment. It wasobserved that after compression at the maximum deformation, the polyurethane foambegan to recover because the cohesion of the cell structure was marked with a few tears onthe cell walls.
The back distributed electron images permitted the deposits on the foam structure tobe illuminated. The figure indicates the pictures of all the samples, flexible and solid. Aftercompression, its shape was preserved unchanged, whereas the cell wall was weakened,and the specimen lacked its recovery properties.
Micrographs show that our PUR cells were either half-open or partly open, interactingwith each other, spherical in form, oval pores, circular pores with an overall diameter below50 µm and reasonably normal pore distribution. We analyzed the particle size for theSEM micrograph (histogram) using Image j software. We got the results as shown in thecorresponding Figure 13.
3.3.3. Descriptive Statistics
The distribution of polyurethane foam cells and filler is summarized in the correspond-ing Table 7.

Appl. Sci. 2022, 12, 2206 18 of 28
Figure 12. SEM micrographs showing the PUR pores and distribution of BNT and Al2O3 particles.

Appl. Sci. 2022, 12, 2206 19 of 28
Figure 13. A histogram illustrates the mean pore diameter distribution for the various PUR generated.

Appl. Sci. 2022, 12, 2206 20 of 28
Table 7. Calculation of radii values of polyurethane foam cells and filler material.
Samples Dimensions Maximum Minimum Average Cell
PUR_1Diameter (µm2) 224.94 58.59 138.35 ± 22
Area (µm2) 60,965.2 16,950.09 36,449.02
PUR_2Diameter (µm2) 132.28 32.65 76.64 ± 17
Area (µm2) 16,760.99 3918.89 10,205.01
PUR_3Diameter (µm2) 122.7 29.15 57.27 ± 11
Area (µm2) 32,399.06 1124.84 6764.04
PUR_4Diameter (µm2) 128.26 27.01 63.82 ± 17
Area (µm2) 19,348.27 1281.34 7241.19
PUR_5Diameter (µm2) 194.07 83.72 137.64 ± 22
Area (µm2) 72,771.57 14,014.35 35,205.52
PUR_6Diameter (µm2) 123.17 29.01 72.07 ± 22
Area (µm2) 21,395.45 3307.8 12,464.61
3.4. Cellular Polyurethane Evaluation3.4.1. Evaluation of Stiffness and Apparent Density
Data demonstrate that polyurethane foam material’s evident apparent density specifi-cally impacts the cell structure. The cell volume, compression power, and elongation atbreak increase with apparent density. We tested its rigidity and apparent density after cre-ating a collection of foams of parallelepiped form. These results are described in Figure 14.The findings showed that the hardness was proportional to the density. The denser thesample was, the harder it was.
Figure 14. The influence of bulk density-assigned hardness on the structure of polyurethanefoams (PUR).
The interpretation of the bubbles involved in producing this delivery cellular ofpolyurethane, development, and stabilization processes is exceedingly complicated. Look-ing at foam structure in the examined density range can help predict mechanical character-istics more effectively [57].
The last two SEM images compare the microstructure of the second and sixth polyurethanefoam samples, representing the smallest and largest apparent density ratio (Figure 15).

Appl. Sci. 2022, 12, 2206 21 of 28
Figure 15. SEM micrographs of foams. (a) Formulation PUR_6 (Density = 0.34); (b) FormulationPUR_2 (Density = 0.07).
Foam measurements demonstrate shaped cells through scanning electron microscopy(Figure 15). The foam cells appear spherical and partially open in the studied density range(0.07–0.34). The foam density is regulated by the gas produced during the reaction. Theyinfluence the amount and scale of cells. From the cell diameter distribution (Figure 16)obtained from the picture study, the Gaussian distribution can be modified to evaluate itswidth and average diameter. The cell average size is 15 lm for relative density above 0.34,with a small distribution.
Foams with densities from 0.18 to 0.23 all have a cell-size distribution that increasesas the density declines, and their typical size is far greater than that of foam of 80 lm. Theaverage size of the lowest density foam (0.07) for an equal distribution is 105 lm.
3.4.2. Mechanical Behavior Modelling
To obtain a perfect model, we used an electron microscope SEM. To find a mathematical–physical model requires additional investigation. All computational and experimentaldata were combined to compare the newest polymeric foam research findings. On theother hand, Figure 17 combines bulk density, hardness and average diameter values of thepolyurethane foam samples.

Appl. Sci. 2022, 12, 2206 22 of 28
Figure 16. The diameter average (square) and width of distribution (circle) of the PUR foam cellsfunction do the density.
Figure 17. Curves with variable rigidity and bulk density with PUR are based on their additivematerial.
The figure below shows the plateau stress ln E of the foam samples as a function ofdensity and ln (Diameter) function of ln (apparent density). This plateau stress, also calledelastic breaking stress, is essential in the design of impact-resistant polyurethane foamsbecause it heralds the commencement of the foam microstructure’s mechanical instability.The modulus is represented as a function of polyurethane foam density. The modulus ofthe foam is proportional to the density of the form thru a power-law relationship.
E∗ = α (ρ∗)n (2)
E* is the foam modulus and ρ* is the foam density. Further, n is the density proponent,and the data are well suited for a density proponent of n = 1.7 over the density range shownin Figure 18.

Appl. Sci. 2022, 12, 2206 23 of 28
Figure 18. The evolution of the stress at the plateau’s beginning as a function of the total density asdetermined by compressive tests on polyurethane foam reinforced foams.
Figure 19 shows the logarithm of values for polyurethane foam and solid polymer of1.2 g/cm3. A sample of average density is equivalent to a huge polymeric foam of perfectdensity. A single direction with a 1.6 ramp confirms the force-law connection and intersectswith the coordinates of ρPUR = 1, verifying the polymer-solid modulus relationship. Inthis case, 2 GPa modulus is within the range of 1.5 to 2.5 GPa (PU values) [58].
Figure 19. The modulus of the foams exhibits a power-law relationship with the bulk density anddiameter of the cell.
In the following, the junction of the best-fit graph is utilized to calculate the solidpolymer modulus. The breakdown stress at the plateau of foam samples is demonstratedas a density function in Figures 20 and 21. They are critical for the impact-mitigationdesign of polyurethane foams because they signal the onset of structural instability in

Appl. Sci. 2022, 12, 2206 24 of 28
the microstructure of the polyurethane foam [59]. Additionally, it exhibits power-lawdependence on the density of the polyurethane foam, even though the exponent of density2 is somewhat more significant than the value suggested by the modulus of elasticity.
Figure 20. The mean cell diameter of the cell polyurethane foam is the relative density.
Figure 21. The energy consumed according to the apparent density of polyurethane foams.
The figure shows the results of the pressure tests over the whole range of foam densitiesinvestigated. The results reveal that the material’s energy absorption capacity rises linearlywith foams density. The values range from 0.03 MPa for a polyurethane foam densityof 0.07 g/cm3 to 0.12 MPa for a polyurethane foam density of 0.31 g/cm3. The energyvalues will appear to be significantly proportional to the importance of the polyurethanefoam densities. For the quasi-static compression test, brittleness and hence loss of materialelasticity determine the energy values.

Appl. Sci. 2022, 12, 2206 25 of 28
4. Conclusions
Our approach was focused on reverse engineering, for which we performed researchon PUR material and raw materials for our potential product. To successfully render thisformulation work, we used grafted polyether polyols specifically built to produce flexiblefoams, a PMDI-type hardener, and glycerol as a chain spreader to produce crosslinkedpolymer polyurethane.
The ATG study revealed the impact tolerant quality of the manufactured goods, veri-fied these findings and showed an optimum content of 10.5 wt.% bentonites by combiningall the necessary bonuses. We demonstrated that our foams are mainly covered by intu-mescence through the mechanical characterization of polyurethane foams via compressiontesting. It should also be noted that the good shockproof result, which we obtained afteradding BNT and Al2O3 with a low rate of 10.5 wt.% for PUR_5, only increased the tenacityof our PUR in going from 9% shock adsorption by Charpy tests by 7.26 J.
Quasi-static compression tests were performed. Compression tests revealed normalviscoelastic behavior in three phases: linear elastic deformation, plateau, and densification.We successfully created PUR foams, which IRTF and Raman spectral analyzes verified. Thecritical properties of our products can be described in their low visible density (~0.3 g/cm3)and low Tg (−35 ◦C). The latter was also lower after incorporating BNT and Al2O3,which also have shock-absorbent properties (−33.64 ◦C). According to XRD results, theestablished PUR had semicrystalline structures, and the degree of crystallinity ranged from32 to 44%. They also had strong thermal stability up to 270 ◦C (analysis of DSC and TGA).By incorporating BNT, standardized tests demonstrated the shock-absorbing function ofour PUR matrix.
A microscopic examination with a scan electron microscope would then be suggestedto view the semi-open cells of the alveolar polymer. According to the results obtained,cellular polymer components have stubborn, typical cell structures with substantial overlapreversibility. The microstructural analysis revealed the open-cell nature of the elaboratefoam. Changes in isocyanate regions were tracked for detection. This modification pro-duced details on the foam’s kinetic reaction and morphological evolution.
To conclude our analysis, it is evident that clay typically influences polyurethanematerials. Indeed, there was a sharp rise in the system’s viscosity and increased implemen-tation difficulties. Therefore, optimizing the clay dispersion model seems essential. Thus,while high shear does not necessarily imply exfoliation, an extruder may be preferablefor spreading clays. The final physicochemical properties of materials will be enhanced.The prospects opened up by this work are therefore numerous. Several challenges needto be addressed in the short term, including incorporating the required inorganic fillerfor PUR. There must be an optimized balance between rigidity and hardness. This way,an analysis can be performed utilizing other cross-linkage chain extenders. Lastly, theinterlinking rate of our PUR needs to be improved by generating further interlinks betweenmacromolecular chains. By introducing different materials, the impact-resistant nature canalso be strengthened.
The final properties of the foam depend on the chemical composition, the blowingagent, the process conditions, and the nature of the mold facing. Thanks to the constantdevelopments of new formulations, polyurethane foams are today manufactured with agreat variety. Proposed in this article is the development and characterization of differentpolyurethane foams for use as base materials for nonlethal projectiles. First, various sampleswere made from formulations.

Appl. Sci. 2022, 12, 2206 26 of 28
Supplementary Materials: The following supporting information can be downloaded at: https://www.mdpi.com/article/10.3390/app12042206/s1, Figure S1: Work methodology flowchart; Figure S2:Foaming process and final; Figure S3: The range of test specimens manufactured on the polyurethanefoam formulation; Figure S4: Resilience test specimens; Figure S5: X-ray diffractogram of a sample ofMeghnia bentonite; Figure S6: IR spectrum of polyols; Figure S7: IR spectrum of PMDI; Figure S8: IRtriethylenetetramine spectrum; Figure S9: IR tin octoate spectrum; Figure S10: IR spectrum of glycerin;Figure S11: IR spectrum of silicone oil; Figure S12: IR spectrum of dichloromethane; Figure S13:Infrared spectrum of bentonite; Table S1: Dimensions of polyurethane foam samples for compressiontest; Table S2: Assignments of major functional groups in the polyol FTIR spectrum; Table S3: As-signments of the Main Functional Groups of the IRDF Spectrum; Table S4: Assignments of the mainfunctional groups of the A33 FTIR spectrum; Table S5: Assignments of the Main Functional Groupsof the OE FTIR Spectrum; Table S6: Assignments of the Main Functional Groups of the Glycerin FTIRSpectrum; Table S7: Assignments of the main functional groups of the silicone oil FTIR spectrum;Table S8: Allocations of the main functional groups of the dichloromethane FTIR spectrum; TableS9: Characteristic peak allocations; Table S10: Peak assignments characteristic of the reagents used;Table S11: Essential bands of polyurethane foam infrared spectra.
Author Contributions: Conceptualization and methodology B.N., S.Z. and G.J.-F.; software, C.H. andB.N.; formal analysis, C.H. and D.-R.J.; investigation, B.A. and G.J.-F.; resources, G.J.-F. and B.N.; datacuration, B.N. and G.J.-F.; writing—original draft preparation, B.N., S.Z., B.A. and G.J.-F.; writing—review and editing, B.N., G.J.-F., S.Z. and B.A.; visualization, supervision, project administration, S.Z.and G.J.-F.; funding acquisition, B.N. and B.A. All authors have read and agreed to the publishedversion of the manuscript.
Funding: This research was funded by The General Directorate of Scientific Research and Technologi-cal Development DG-RSDT grant number #Projects PNE/2019-EMP, and was funded by the Ministryof Higher Education and Scientific Research (MESRS).
Institutional Review Board Statement: The study was conducted in accordance with the Declarationof Helsinki and approved by the Ethics Committee of Ecole Militaire Polytechnique, Algeria.
Informed Consent Statement: Informed consent was obtained from all subjects involved in the study.
Data Availability Statement: All graphs can be requested from the corresponding author ([email protected]).
Acknowledgments: The authors gratefully acknowledge the Macromolecular Chemistry Laboratory(LCM) team, the Applied Chemistry Teaching and Research Unit, at the EMP Polytechnic MilitarySchool, in collaboration with the Polymer Materials Engineering laboratory of Lyon IMP/INSA, forsupervising this work.
Conflicts of Interest: The authors declare no conflict of interest.
References1. Boumdouha, N.; Boudiaf, A.; Safidine, Z. Mechanical and chemical characterizations of filled polyurethane foams used for
non-lethal projectiles. In Proceedings of the 10 the European Symposium on Non-Lethal Weapons EWG-NLW, Brussels, Belgium,20–23 May 2019; p. 68.
2. Pagalank, P.; April, S.; Francisco, S.; Schwartz, D.S.; Evans, A.G. Porous and Cellular Materials for Structural Applications; MaterialsResearch Society: Warrendale, PA, USA, 1998; Volume 521.
3. Gibson, L.J.; Ashby, M.F. Cellular Solids: Structure and Properties; Cambridge University Press: Cambridge, UK, 1999;ISBN 0521499119.
4. Noureddine, B.; Zitouni, S.; Achraf, B.; Amar, O.; Eddine, T.D.; Abderouf, L. Mechanical and microstructural characterization ofpolyurethane foams. In Proceedings of the 8th Chemistry Days JCh8–EMP, Bordj El Bahri, Algeria, 26–27 March 2019; MilitaryPolytechnic School (EMP): Bordj El Bahri, Algeria, 2019; p. 169.
5. Noureddine, B.; Zitouni, S.; Achraf, B.; Tria, D.; Amar, O. Élaboration et caractérisation mécanique des mousses polyuréthanesmodifiés. In Proceedings of the Fourth International Conference on Energy, Materials, Applied Energetics and PollutionICEMAEP2018, Constantine, Algeria, 29–30 April 2018; Université Frères Mentouri Constantine 1: Constantine, Algeria, 2018;pp. 136–142.
6. Bezazi, A.; Scarpa, F. Tensile fatigue of conventional and negative Poisson’s ratio open cell PU foams. Int. J. Fatigue 2009, 31,488–494. [CrossRef]
Appl. Sci. 2022, 12, 2206 27 of 28
7. Chomard, A.-M. Fatigue thermique des matériaux polyuréthane: Essais d’optimisation d’une formulation PU à base de polyester.Ph.D. Thesis, INSA Lyon, Villeurbanne, France, 1997; p. 210.
8. Fuest, R.W. Polyurethane Elastomers. In Rubber Technology; Carl Hanser Verlag GmbH & Co. KG: München, Germany, 2009;Volume 89, pp. 238–263. ISBN 940112924X.
9. Dieter, J.W.; Byrne, C.A. Aliphatic polyurethane elastomers with high performance properties. Polym. Eng. Sci. 1987, 27, 673–683.[CrossRef]
10. Hanhi, K.; Stenberg, B. Friction and the dynamic mechanical and thermal properties of polyurethane elastomers. Microcellularpolyurethanes. Prog. Rubber Plast. Technol. 1994, 10, 54–78.
11. Jiang, M.; He, L.; Gong, W.; Dong, L.; Xie, H.; Xiong, C. Enhancement of Polymer Foam Quality by Modifying Structural andDecomposition Characteristics of Chemical Blowing Agent. Polym.-Plast. Technol. Eng. 2012, 51, 263–267. [CrossRef]
12. Ghasemlou, M.; Daver, F.; Ivanova, E.P.; Adhikari, B. Bio-based routes to synthesize cyclic carbonates and polyamines precursorsof non-isocyanate polyurethanes: A review. Eur. Polym. J. 2019, 118, 668–684. [CrossRef]
13. De Luca Bossa, F.; Verdolotti, L.; Russo, V.; Campaner, P.; Minigher, A.; Lama, G.C.; Boggioni, L.; Tesser, R.; Lavorgna, M.Upgrading sustainable polyurethane foam based on greener polyols: Succinic-based polyol and mannich-based polyol. Materials2020, 13, 3170. [CrossRef]
14. De Luca Bossa, F.; Santillo, C.; Verdolotti, L.; Campaner, P.; Minigher, A.; Boggioni, L.; Losio, S.; Coccia, F.; Iannace, S.; Lama, G.C.Greener nanocomposite polyurethane foam based on sustainable polyol and natural fillers: Investigation of chemico-physicaland mechanical properties. Materials 2020, 13, 211. [CrossRef] [PubMed]
15. Ghasemlou, M.; Daver, F.; Ivanova, E.P.; Murdoch, B.J.; Adhikari, B. Use of Synergistic Interactions to Fabricate Transparent andMechanically Robust Nanohybrids Based on Starch, Non-Isocyanate Polyurethanes, and Cellulose Nanocrystals. ACS Appl. Mater.Interfaces 2020, 12, 47865–47878. [CrossRef] [PubMed]
16. Dorcheh, A.S.; Abbasi, M.H. Silica aerogel; synthesis, properties and characterization. J. Mater. Process. Technol. 2008, 199, 10–26.[CrossRef]
17. Feinle, A.; Hüsing, N. Mixed metal oxide aerogels from tailor-made precursors. J. Supercrit. Fluids 2015, 106, 2–8. [CrossRef]18. Zu, G.; Shen, J.; Wang, W.; Lian, Y.; Zou, L.; Zhang, Y.; Liu, B.; Zhang, F. Heat-resistant, strong titania aerogels achieved by
supercritical deposition. J. Supercrit. Fluids 2015, 106, 145–151. [CrossRef]19. Huang, P.; Fan, M. Development of facture free clay-based aerogel: Formulation and architectural mechanisms. Compos. Part B
Eng. 2016, 91, 169–175. [CrossRef]20. Finlay, K.A.; Gawryla, M.D.; Schiraldi, D.A. Effects of fiber reinforcement on clay aerogel composites. Materials 2015, 8, 5440–5451.
[CrossRef] [PubMed]21. Verdolotti, L.; Lavorgna, M.; Lamanna, R.; Di Maio, E.; Iannace, S. Polyurethane-silica hybrid foam by sol-gel approach: Chemical
and functional properties. Polymer 2015, 56, 20–28. [CrossRef]22. BOUMDOUHA, N.; SAFIDINE, Z.; BOUDIAF, A. Experimental Study of Loaded Foams During Free Fall Investigation and
Evaluation of Microstructure. Int. J. Adv. Manuf. Technol. 2021. [CrossRef]23. Noureddine, B.; Zitouni, S.; Achraf, B.; Amar, O.; Eddine, T.D. Élaboration et caractérisation mécanique des mousses polymères:
Application aux projectiles non létaux. In Proceedings of the 11th Days of Mechanics JM’11–EMP; Military Polytechnic School(EMP): Bordj El Bahri, Algeria, 2011; pp. 24–33.
24. Chen, H.B.; Wang, Y.Z.; Schiraldi, D.A. Preparation and flammability of poly(vinyl alcohol) composite aerogels. ACS Appl. Mater.Interfaces 2014, 6, 6790–6796. [CrossRef] [PubMed]
25. Motahari, S.; Motlagh, G.H.; Moharramzadeh, A. Thermal and flammability properties of polypropylene/silica aerogel composites.J. Macromol. Sci. Part B Phys. 2015, 54, 1081–1091. [CrossRef]
26. Noureddine, B.; Zitouni, S.; Achraf, B.; Amar, O.; Eddine, T.D.; Abderaouf, L.M. Manufacture of polyurethane foam with acertain density. In Proceedings of the The International Conference on Recent Advances in Robotics and Automation ICRARE’18,Monastir, Tunisia, 3–4 November 2018; C.E.S International Joint Conferences: Monastir, Tunisia, 2018; pp. 21–30.
27. Camberlin, Y.; Pascault, J.P.; Letoffe, M.; Claudy, P. Synthesis and Dsc Study of Model Hard Segments From Diphenyl MethaneDiisocyanate and Butane Diol. J. Polym. Sci. A1 1982, 20, 383–392. [CrossRef]
28. Guemaz, N. Préparation et étude de la stabilité thermique des polyuréthanes. Ph.D. Thesis, Université Ferhat Abbas, Sétif,Algeria, 2018.
29. Michel, F. Chimie et physico-chimie des polymères—2e édition—Michel Fontanille, Yves Gnanou—Google Livres, 3e éd. ed; Sciences supChimie Cours; Dunod: Paris, France, 2014; ISBN 978-2-10-058915-9.
30. Kiss, G.; Rusu, G.; Peter, F.; Tănase, I.; Bandur, G. Recovery of Flexible Polyurethane Foam Waste for Efficient Reuse in IndustrialFormulations. Polymers 2020, 12, 1533. [CrossRef] [PubMed]
31. Massiot, D.; Fayon, F.; Capron, M.; King, I.; Le Calvé, S.; Alonso, B.; Durand, J.; Bujoli, B.; Gan, Z.; Hoatson, G. Modelling one-andtwo-dimensional solid-state NMR spectra. Magn. Reson. Chem. 2002, 40, 70–76. [CrossRef]
32. Queiroz, D.P.; de Pinho, M.N.; Dias, C. ATR− FTIR studies of poly (propylene oxide)/polybutadiene bi-soft segment ure-thane/urea membranes. Macromolecules 2003, 36, 4195–4200. [CrossRef]
33. Methods, S.T. Standard Test Methods for Flexible Cellular Materials—Slab, Bonded, and Molded Urethane Foams. ASTM 2012, 5,1–29.

Appl. Sci. 2022, 12, 2206 28 of 28
34. Mushkin, Y.I.; Smirnova, N.F.; Tsigin, B.M.; Finkel’shtein, A.I. IR and UV spectea of diaminodiphenylmethane isomers and thecorresponding diisocyanates. J. Appl. Spectrosc. 1971, 15, 1623–1627. [CrossRef]
35. Stephenson, C.V.; Coburn, W.C.; Wilcox, W.S. The vibrational spectra and assignments of nitrobenzene, phenyl isocyanate, phenylisothiocyanate, thionylaniline and anisole. Spectrochim. Acta 1961, 17, 933–946. [CrossRef]
36. Wilhelm, C.; Gardette, J.L. Infrared analysis of the photochemical behaviour of segmented polyurethanes: Aliphatic poly(ether-urethane)s. Polymer 1998, 39, 5973–5980. [CrossRef]
37. Tammer, M.G. Sokrates: Infrared and Raman characteristic group frequencies: Tables and charts. Colloid Polym. Sci. 2004, 283, 235.[CrossRef]
38. Dresselhaus, M.S.; Dresselhaus, G. Intercalation compounds of graphite. Adv. Phys. 2002, 51, 1–186. [CrossRef]39. Trovati, G.; Sanches, E.A.; Neto, S.C.; Mascarenhas, Y.P.; Chierice, G.O. Characterization of polyurethane resins by FTIR, TGA,
and XRD. J. Appl. Polym. Sci. 2010, 115, 263–268. [CrossRef]40. Malíková, M.; Rychlý, J.; Matisová-Rychlá, L.; Csomorová, K.; Janigová, I.; Wilde, H.W. Assessing the progress of degradation in
polyurethanes by chemiluminescence. I. Unstabilised polyurethane films. Polym. Degrad. Stab. 2010, 95, 2367–2375. [CrossRef]41. Krämer, R.H.; Zammarano, M.; Linteris, G.T.; Gedde, U.W.; Gilman, J.W. Heat release and structural collapse of flexible
polyurethane foam. Polym. Degrad. Stab. 2010, 95, 1115–1122. [CrossRef]42. Dollimore, D. Thermal Characterization of Polymeric Materials. Thermochim. Acta 1983, 60, 119–120. [CrossRef]43. Koberstein, J.T.; Galembos, A.F.; Leung, L.M. Compression-Molded Polyurethane Block Copolymers. 1. Microdomain Morphology
and Thermomechanical Properties. Macromolecules 1992, 25, 6195–6204. [CrossRef]44. Saiani, A.; Novak, A.; Rodier, L.; Eeckhaut, G.; Leenslag, J.W.; Higgins, J.S. Origin of multiple melting endotherms in a high hard
block content polyurethane: Effect of annealing temperature. Macromolecules 2007, 40, 7252–7262. [CrossRef]45. Unal, S.; Ozturk, G.; Sisson, K.; Long, T.E. Poly(caprolactone) containing highly branched segmented poly(ester urethane)s via A2
with oligomeric B3 polymerization. J. Polym. Sci. Part A Polym. Chem. 2008, 46, 6285–6295. [CrossRef]46. Fox, T.G., Jr.; Flory, P.J. Second-order transition temperatures and related properties of polystyrene. I. Influence of molecular
weight. J. Appl. Phys. 1950, 21, 581–591. [CrossRef]47. Hibon, S. Elaboration de formulations Polyuréthane/Nanocharges minérales: Influence des charges sur la synthèse des
prépolymères. Ph.D. Thesis, INSA Lyon, Villeurbanne, France, 2006; p. 201.48. Harte, A.M.; Fleck, N.A.; Ashby, M.F. The fatigue strength of sandwich beams with an aluminium alloy foam core. Int. J. Fatigue
2001, 23, 499–507. [CrossRef]49. Goussery-Vafiadès V Caractérisations Microstructurale Et Mécanique De Mousses De Nickel À Cellules Ouvertes Pour Batteries
De Véhicules Hybrides. Ph.D. Thesis, École Nationale Supérieure des Mines de Paris, Paris, France, 2004.50. Bezazi, A.; Scarpa, F. Mechanical behaviour of conventional and negative Poisson’s ratio thermoplastic polyurethane foams under
compressive cyclic loading. Int. J. Fatigue 2007, 29, 922–930. [CrossRef]51. Gong, L.; Kyriakides, S.; Jang, W.Y. Compressive response of open-cell foams. Part I: Morphology and elastic properties. Int. J.
Solids Struct. 2005, 42, 1355–1379. [CrossRef]52. Saha, M.C.; Mahfuz, H.; Chakravarty, U.K.; Uddin, M.; Kabir, M.E.; Jeelani, S. Effect of density, microstructure, and strain rate on
compression behavior of polymeric foams. Mater. Sci. Eng. A 2005, 406, 328–336. [CrossRef]53. Jin, H.; Lu, W.Y.; Scheffel, S.; Hinnerichs, T.D.; Neilsen, M.K. Full-field characterization of mechanical behavior of polyurethane
foams. Int. J. Solids Struct. 2007, 44, 6930–6944. [CrossRef]54. Saint-Michel, F.; Chazeau, L.; Cavaillé, J.Y. Mechanical properties of high density polyurethane foams: II Effect of the filler size.
Compos. Sci. Technol. 2006, 66, 2709–2718. [CrossRef]55. Dounis, D.V.; Wilkes, G.L. Structure-property relationships of flexible polyurethane foams. Polymer 1997, 38, 2819–2828. [CrossRef]56. Moreland, J.C.; Wilkes, G.L.; Turner, R.B. Viscoelastic behavior of flexible slabstock polyurethane foams: Dependence on
temperature and relative humidity. I. Tensile and compression stress (load) relaxation. J. Appl. Polym. Sci. 1994, 52, 549–568.[CrossRef]
57. Dawson, J.R.; Shortall, J.B. The microstructure of rigid polyurethane foams. J. Mater. Sci. 1982, 17, 220–224. [CrossRef]58. Bossert, R.G. Fibres, plastics and rubbers: A handbook of common polymers (Roff, W.J.). J. Chem. Educ. 1957, 34, 417. [CrossRef]59. Green, D.J. Mechanical Behavior of Cellular Ceramics. In Proceedings of the Metallurgical Society of the Canadian Institute of
Mining and Metallurgy; Elsevier: Amsterdam, The Netherlands, 1988; pp. 191–192.