Optical and Physical Properties of SiO2 Nanoparticles and Tetra Ortho Silicate Doped in Polyurethane...
8
[Malekfar, 3(2): February, 2014 http: // www.ijesrt.com(C)Inter IJESRT INTERNATIONAL JOUR Optical and Physical Prop D R. Ma 1 Department of Physics, Tarb In this article optical and phys different concentrations of SiO2 nanop organic agent with different concent composition. Optical microscopy ima samples were measured. The cell size o SiO2 was recognized as a best specim revealed that PUOC/1wt. % SiO2 and phase separation, DPS, and the hydro spectroscopy data. Two samples, PUOC among the synthesized samples. By ad increased. This is similar to the behavi the real density of samples were decrea samples were calculated. By adding SiO Keywords: polyurethane, SiO2, spectro Introduction Polyurethanes (PUs) are kind synthetic materials in industry that are coating, synthesizing and preparing le foams, thermoplastic elastomers and Nowadays, scientists are interested polyurethane with high performance some factors that affects the morpholo as the hard and soft sections of the P and weight of these two components construction of the chains of PU. organic polymers lack important prop stability at low temperatures and wea strengths which has led in introduc materials doping for improving properties of organic matrixes. Orga composite hybrid materials have both organic polymers and inorganic mate flexibility, ductility, rigidity, high the etc… receiving these properties fr inorganic and organic agents [4]. Silica NP is one of the por materials with high specific surface surface energy. It has been shown tha is useful for improving the characterist matrix especially in mechanical–ther properties [3]. In this research we 4] I Impa rnational Journal of Engineering Sciences & Research [842-846] RNAL OF ENGINEERING SCIENCES & RE TECHNOLOGY perties of SiO2 Nanoparticles and Tetra O Doped in Polyurethane Foams alekfar 1 , M. Nadafan and Z. Dehghani biat Modares University, P. O. Box 14115–175, Tehr [email protected] Abstract sical property of the composition of polyurethane open ce particles (1 and 2wt. %) will be reported. Tetra ortho si trations (0.05, 0.1, 0.15 and 0.2 Vol./Vol.) was add aging, watering uptake, FTIR and Raman spectroscopy of samples by adding SiO2 NPs and TEOS was decreased men for absorbing water. By focusing on the recorded R d PUOC/200µl TEOS have more covalent bonds than ot ogen bonding index, R, in samples were evaluated in t C/1wt. % SiO2 and PUOC/800µl TEOS, have the highes dding SiO2 NPs and TEOS into PUOC, the apparent de ior of real density in SiO2 NPs into PUOC but by adding ased. The total porosity, open porosity and closed porosit O2 NPs and TEOS into PUOC, the open porosity of samp oscopy, porosity, density. ds of attractive used widely in eathers, fibers, so on [1–3]. in producing e by changing ogy of PU such PU matrix, size and chemical Furthermore, perties such as ak mechanical cing inorganic the physical anic–inorganic advantages of erials such as ermal stability, from both of rous inorganic area and high at silica doping tics of polymer rmal–chemical have tried to evaluate the presence of silica considering and focusing on its The most common silica organic of becoming easily purified an controllable rate of reaction, is T two sources of silica–SiO2 NPs ortho silicate (TEOS) with open Furthermore the properties of usi as inorganic or organic source and investigated. Materials and Methods Silicon oxide nanopart type, Spherical particles, 15–20 n purchased from US Research (Fig.1). Tetraethyl ortho silicate ( 99%) was used from Merck. diisocyanate (MDI, density=1.2 polyol (SROC: Semi Rig density=1.1g/cm3) was collected Co., Ltd., Tehran, Iran and deion as blowing agent. Preparation of PUOC/ SiO2 Two different weight p (1 and 2 wt. %) were dissolved i part solution individually. Diss ISSN: 2277-9655 act Factor: 1.852 Technology ESEARCH Ortho Silicate ran, I.R. Iran ell (PUOC) with two ilicate (TEOS) as an ded to polyurethane y of the synthesized d. The PUOC/1wt. % Raman spectra, it is thers. The degree of terms of their FTIR st R and DPS factors ensity of foams was g TEOS into PUOC, ty of the synthesized ples was increased. in PU matrix with s optical properties. c precursor, for sake nd having slow and TEOS. We have used s and tetra ethylene n cell PUs structure. ing different sources d new products were ticles (99.5+%, S– nm, amorphous) was Nanomaterials, Inc (TEOS, C8H20O4Si, Diphenyl methane 23g/cm3), polyether gid Open Cell, d from Exxon Panah nized water was used ercent of SiO2 NPs into open cell polyol solving carried out
Transcript of Optical and Physical Properties of SiO2 Nanoparticles and Tetra Ortho Silicate Doped in Polyurethane...

[Malekfar, 3(2): February, 2014
http: // www.ijesrt.com(C)International Journal of Engineering Sciences & Research Technology
IJESRT
INTERNATIONAL JOURNA
Optical and Physical Properties of SiO2 Nanoparticles and Tetra Ortho Silicate Doped in Polyurethane Foams
R. Malekfar1Department of Physics, Tarbiat Modares University, P. O. Box 14115
In this article optical and physical property of the composition of polyurethane open cell (PUOC) with two different concentrations of SiO2 nanoparticles (1 and 2wt. %) will be reported. Tetra ortho silicate (TEOS) as an organic agent with different concentrations (0.05, 0.1, 0.15 and 0.2 Vol./Vol.) was added to polyurethane composition. Optical microscopy imaging, watering uptake, FTIR and Raman spectroscopy of the synthesized samples were measured. The cell size of samples by adding SiO2 NPs and TEOS was SiO2 was recognized as a best specimen for absorbing water. By focusing on the recorded Raman spectra, it is revealed that PUOC/1wt. % SiO2 and PUOC/200phase separation, DPS, and the hydrogen bonding index, R, in samples were evaluated in terms of their FTIR spectroscopy data. Two samples, PUOC/1wt. % SiO2 and PUOC/800among the synthesized samples. By adding SiO2 NPs and TEOS inincreased. This is similar to the behavior of real density in SiO2 NPs into PUOC but by adding TEOS into PUOC, the real density of samples were decreased. The total porosity, open porosity and closed porosity of tsamples were calculated. By adding SiO2 NPs and TEOS into PUOC, the open porosity of samples was increased. Keywords: polyurethane, SiO2, spectroscopy, porosity, density.
Introduction Polyurethanes (PUs) are kinds of attractive
synthetic materials in industry that are used widely in coating, synthesizing and preparing leathers, fibers, foams, thermoplastic elastomers and so on [1Nowadays, scientists are interested in producing polyurethane with high performance by changing some factors that affects the morphology of PU such as the hard and soft sections of the PU matrix, size and weight of these two components and chemical construction of the chains of PU. Furthermore, organic polymers lack important properties such as stability at low temperatures and weak mechanical strengths which has led in introducing inorganic materials doping for improving the physical properties of organic matrixes. Organiccomposite hybrid materials have both advantages of organic polymers and inorganic materials such as flexibility, ductility, rigidity, high thermal stability, etc… receiving these properties from both of inorganic and organic agents [4].
Silica NP is one of the porous inorganic materials with high specific surface area and high surface energy. It has been shown that silica doping is useful for improving the characteristics of polymer matrix especially in mechanical–thermalproperties [3]. In this research we have tried to
2014] ISSN: 2277 Impact Factor:
International Journal of Engineering Sciences & Research Technology[842-846]
INTERNATIONAL JOURNAL OF ENGINEERING SCIENCES & RESEARCH TECHNOLOGY
Optical and Physical Properties of SiO2 Nanoparticles and Tetra Ortho Silicate Doped in Polyurethane Foams
Malekfar 1, M. Nadafan and Z. Dehghani
Department of Physics, Tarbiat Modares University, P. O. Box 14115–175, Tehran, I.R. [email protected]
Abstract In this article optical and physical property of the composition of polyurethane open cell (PUOC) with two
different concentrations of SiO2 nanoparticles (1 and 2wt. %) will be reported. Tetra ortho silicate (TEOS) as an trations (0.05, 0.1, 0.15 and 0.2 Vol./Vol.) was added to polyurethane
composition. Optical microscopy imaging, watering uptake, FTIR and Raman spectroscopy of the synthesized samples were measured. The cell size of samples by adding SiO2 NPs and TEOS was decreased. The PUOC/1wt. % SiO2 was recognized as a best specimen for absorbing water. By focusing on the recorded Raman spectra, it is revealed that PUOC/1wt. % SiO2 and PUOC/200µl TEOS have more covalent bonds than others. The degree of
DPS, and the hydrogen bonding index, R, in samples were evaluated in terms of their FTIR spectroscopy data. Two samples, PUOC/1wt. % SiO2 and PUOC/800µl TEOS, have the highest R and DPS factors among the synthesized samples. By adding SiO2 NPs and TEOS into PUOC, the apparent density of foams was increased. This is similar to the behavior of real density in SiO2 NPs into PUOC but by adding TEOS into PUOC, the real density of samples were decreased. The total porosity, open porosity and closed porosity of tsamples were calculated. By adding SiO2 NPs and TEOS into PUOC, the open porosity of samples was increased.
: polyurethane, SiO2, spectroscopy, porosity, density.
Polyurethanes (PUs) are kinds of attractive
synthetic materials in industry that are used widely in coating, synthesizing and preparing leathers, fibers, foams, thermoplastic elastomers and so on [1–3]. Nowadays, scientists are interested in producing
urethane with high performance by changing some factors that affects the morphology of PU such as the hard and soft sections of the PU matrix, size and weight of these two components and chemical construction of the chains of PU. Furthermore,
ers lack important properties such as stability at low temperatures and weak mechanical strengths which has led in introducing inorganic materials doping for improving the physical properties of organic matrixes. Organic–inorganic
s have both advantages of organic polymers and inorganic materials such as flexibility, ductility, rigidity, high thermal stability, etc… receiving these properties from both of
Silica NP is one of the porous inorganic materials with high specific surface area and high surface energy. It has been shown that silica doping is useful for improving the characteristics of polymer
thermal–chemical ies [3]. In this research we have tried to
evaluate the presence of silica in PU matrix with considering and focusing on its optical properties. The most common silica organic precursor, for sake of becoming easily purified and having slow and controllable rate of reaction, is TEOS. We have used two sources of silica–SiO2 NPs and tetra ethylene ortho silicate (TEOS) with open cell PUs structure. Furthermore the properties of using different sources as inorganic or organic source and new products were investigated. Materials and Methods
Silicon oxide nanoparticles (99.5+%, Stype, Spherical particles, 15–20 nm, amorphous) was purchased from US Research Nanomaterials, Inc (Fig.1). Tetraethyl ortho silicate (TEOS, C8H20O4Si, 99%) was used from Merck. Diphenyl diisocyanate (MDI, density=1.23g/cm3), polyether polyol (SROC: Semi Rigid Open Cell, density=1.1g/cm3) was collected from Exxon Panah Co., Ltd., Tehran, Iran and deionized water was used as blowing agent. Preparation of PUOC/ SiO2
Two different weight percent of SiO2 NPs (1 and 2 wt. %) were dissolved into open cell polyol part solution individually. Dissolving carried out
ISSN: 2277-9655 Impact Factor: 1.852
International Journal of Engineering Sciences & Research Technology
ENCES & RESEARCH
Optical and Physical Properties of SiO2 Nanoparticles and Tetra Ortho Silicate
175, Tehran, I.R. Iran
In this article optical and physical property of the composition of polyurethane open cell (PUOC) with two different concentrations of SiO2 nanoparticles (1 and 2wt. %) will be reported. Tetra ortho silicate (TEOS) as an
trations (0.05, 0.1, 0.15 and 0.2 Vol./Vol.) was added to polyurethane composition. Optical microscopy imaging, watering uptake, FTIR and Raman spectroscopy of the synthesized
decreased. The PUOC/1wt. % SiO2 was recognized as a best specimen for absorbing water. By focusing on the recorded Raman spectra, it is
l TEOS have more covalent bonds than others. The degree of DPS, and the hydrogen bonding index, R, in samples were evaluated in terms of their FTIR
l TEOS, have the highest R and DPS factors to PUOC, the apparent density of foams was
increased. This is similar to the behavior of real density in SiO2 NPs into PUOC but by adding TEOS into PUOC, the real density of samples were decreased. The total porosity, open porosity and closed porosity of the synthesized samples were calculated. By adding SiO2 NPs and TEOS into PUOC, the open porosity of samples was increased.
evaluate the presence of silica in PU matrix with considering and focusing on its optical properties. The most common silica organic precursor, for sake of becoming easily purified and having slow and
rate of reaction, is TEOS. We have used SiO2 NPs and tetra ethylene
ortho silicate (TEOS) with open cell PUs structure. Furthermore the properties of using different sources as inorganic or organic source and new products were
Silicon oxide nanoparticles (99.5+%, S–20 nm, amorphous) was
purchased from US Research Nanomaterials, Inc (Fig.1). Tetraethyl ortho silicate (TEOS, C8H20O4Si, 99%) was used from Merck. Diphenyl methane diisocyanate (MDI, density=1.23g/cm3), polyether polyol (SROC: Semi Rigid Open Cell, density=1.1g/cm3) was collected from Exxon Panah Co., Ltd., Tehran, Iran and deionized water was used
ght percent of SiO2 NPs (1 and 2 wt. %) were dissolved into open cell polyol part solution individually. Dissolving carried out

[Malekfar, 3(2): February, 2014] ISSN: 2277-9655 Impact Factor: 1.852
http: // www.ijesrt.com(C)International Journal of Engineering Sciences & Research Technology [842-846]
under vigorous electrical stirring for 20 seconds with 3000 rpm until a homogenous solution was achieved. After that MDI part was added to the solution by doing vortex at 2000rpm for 4–5 seconds. Then for a well prepared sample the cover of the container of PU/SiO2 was taken off. After 10–12 seconds reaction was ended by formation of foams in samples. The ratio of polyol:MDI was 1 (2ml):1(2ml). For the analysis purposes the samples were kept in the stream of the liquid nitrogen gas and then were cut in the slices with 1mm diameter.
Figure 1. SEM image of SiO2 nanoparticle prepared US Research Nanomaterials, Inc.
Preparation of PUOC/TEOS
Four different amounts of TEOS: 200, 400, 600 and 800µl were individually dissolved into 2ml of the open cell polyol. The procedure of preparing samples was the same as for PU/SiO2 samples, mentioned above, hence dissolving of TEOS into polyol part was easier than for SiO2 NPs. Results and Discussion Microscopic Evaluation
In order to determine cell size of PU and observing its microstructure optical microscopy is used. For this aim, thin layers of PU nanocomposite and PU/TEOS with thicknesses of about 1mm were cut perpendicular to the rising direction of foam. The freeze–fractured surfaces of the samples were prepared at liquid nitrogen temperature and then examined.
Different image of blank PU, PU containing nanocomposites of SiO2 or TEOS with different concentrations were collected. Fig. (2a) to (2e) show the transmitting optical microscopy images for PUOC including TEOS and SiO2 NPs.
It can be seen in Fig. 2 that by increasing of SiO2 NPs in pure PUOC the cell sizes in the matrix have been changed, foams containing 1 and 2 wt. % SiO2 have lesser large cell sizes in comparison of their pure PUOC. However the cell networking looks to be destroyed in foams containing 2 wt. % SiO2.The PUOC structures have been changed by
increasing of TEOS, figures show that the mean cell size of the foams decreases. By examining the micrographs it reveals that the mean cell sizes of all PUOC composites and PUOC nanocomposite samples can be classified in the following manner:
Figure 2. Microstructures of: (a) blank PUOC, (b) PUOC/1wt. % SiO2 (c) PUOC/2wt. % SiO2, (d) PUOC/200µl TEOS, (e) PUOC/400µl TEOS, (f) PUOC/600µl TEOS and (g) PUOC/800µl TEOS. The successive mean cell size of PUOC composite foams are: blank PUOC > PUOC/200µl TEOS > PUOC/400µl TEOS > PUOC/1wt% SiO2> PUOC/600µl TEOS > PUOC/2wt% SiO2> PUOC/800µl TEOS. FTIR Spectroscopy Analysis
Fourier transform infra–red (FTIR) transmission spectra of the samples as powder–pressed KBr pellets was collected by using a Thermo Nicolet Nexus 670 FTIR spectrometer system with 4cm-1 resolution and in the wave number range from 4000 to 400cm-1 at room temperature. FTIR Spectroscopy of PUOC/SiO2 The FTIR skeletal spectra in Fig. 3 of PUOC/SiO2 have some important features related to the presence of SiO2 NPs. The intensity of peaks at 635, 815, and 1103 cm-1 in Fig. 3 referred to Si–C [5], symmetric stretching/bending Si–O–Si bond [6,7] and asymmetric stretching Si–O–Si bond [7] which were increased by adding SiO2 NPs contents up to 2wt. %. These peaks had higher intensity in PUOC/2wt. %SiO2 in compared with PUOC/1wt. % SiO2 that it was concluded as the extra amount of SiO2 in PUOC/2wt. % SiO2 rather than PUOC/1wt. %SiO2. There are some peaks at 1460, 1540 and 3340 cm-1 assigned to the secondary reaction between isocyanate and urethane groups [8] of PUOC, N–H bending [9], and N–H bonds of urethane [10] in PUOC nanocomposite foams that the intensity of them decrease by adding SiO2 NPs up to 1wt. % and then increase up to 2wt. %. The number of cross linking sites in PUOC foam was increased by adding SiO2 NPs into polymer matrix. The fundamental factor for measuring physical properties of PUOC foam is phase separation. Xia and Song [11] can examine the degree of phase separation (DPS) by the Cooper method. There are two peaks at 1708 and 1718 cm-1 which are related to

[Malekfar, 3(2): February, 2014] ISSN: 2277-9655 Impact Factor: 1.852
http: // www.ijesrt.com(C)International Journal of Engineering Sciences & Research Technology [842-846]
the bonded carbonyl and free carbonyl groups [2]. The hydrogen bonding index, R, is assigned to the ratio of absorption peak as bonded freeR A A= , where
Abonded is the absorbance peak intensity of 1708 cm-1 and Afree is the absorbance peak intensity of 1718 cm-
1. The hydrogen bonding index, R, and DPS increases up to 1wt. % SiO2 contents and begin to decrease up to 2wt. % SiO2 NPs.
Figure 3. FTIR spectra of blank PUOC and PUOC/SiO2 nanocomposites. The R index and DPS factor were increased form blank PUOC nanocomposite foams to PUOC/1wt. % SiO2 nanocomposite and then decreased in PUOC/2wt. % SiO2 nanocomposite (Table 1). The data anticipate that silica NPs are probably dispersed in soft segments of PUOC/1wt. % SiO2 but by increasing the amount of SiO2 NPs, they prefer to disperse in hard segments. FTIR Spectroscopy of PUOC/TEOS
Fig. 4 has shown the detailed FTIR spectra of PUOC/TEOS composites. It is clear that all the spectra are similar but there are some differences among them. After adding TEOS to PUOC matrix some absorption peaks are created at 457, 1012, and 1080 cm-1 in all PUOC/TEOS composites. These peaks are related to Si–O–Si bond rocking vibration [12], Si–O–C bonding [5], and asymmetric Si–O–Si stretching mode [7]. In all of them the procedure is similar since by adding SiO2 NPs up to 600µl the intensity of these peaks decrease and then start to increase by adding up to 800µl to PUOC matrix. So the PUOC/600µlTEOS has less covalent bonding compared to others.
There are two peaks at 1690 and 1718 cm-1 that are related to the bonded carbonyl and free carbonyl groups, respectively [2]. In this case, the hydrogen bonding index, R, and DPS decrease by adding TEOS contents up to 600µl and begin to increase up to 800µl TEOS into PUOC foams (Table
1). The results show that in low loading of TEOS in PUOC foams, the produced SiO2 by adding TEOS is set in hard segment. However, in high loading of TEOS it is set in soft segment.
The intensity of peaks at 1460, 1535, and 3360 cm-1 are related to the secondary reaction between isocyanate and urethane groups [8], urethane N–H bending [9], and N–H bonds of urethane [10] in PUOC composite foams, respectively, which were decreased by adding TEOS contents up to 600µl and started to increase up to 800µl TEOS into polymer matrix.
Figure 4. FTIR spectra of blank PUOC and PUOC/200µl, 400µl, 600µl, and 800µl TEOS. Raman Back-Scattering Analysis
Raman spectra of the samples were collected by using a Thermo Nicolet Almega dispersive micro-Raman spectrometer operating by a 532 nm laser line as the second harmonic of a Nd:YLF laser in a back-scattering configuration. Raman Spectra of PUOC/SiO2
The possible interaction between SiO2 NPs and PUOC foams was investigated by analyzing the recorded Raman spectra shown in Fig.5. In these composites by adding SiO2 NPs in PUOC matrix, the C–H wagging [13] bond was appeared in two composites at 870 cm-1 which they were not observed in pure PUOC. This peak was shifted to higher wave numbers by increasing the amount of SiO2 NPs in PUOC matrix. The Raman peak at 646 cm-1 is related to C–C–C bending [13] mode that is just in PUOC/1wt. % SiO2 with a weak intensity. Furthermore the Si–O–Si stretching vibration bond [12] is just existed in PUOC/1wt. % SiO2 at 1040 cm-1. There is another Raman peak at 487 cm-1 that assigned to the rocking of Si–O–Si bond [14] and by increasing the amount of SiO2 NPs, this Raman peak is shifted to lower wave numbers. All samples have C–C stretching bond [13] at 1595 cm-1 but this bond at PUOC/2wt. % SiO2 has more intensity than pure

[Malekfar, 3(2): February, 2014] ISSN: 2277-9655 Impact Factor: 1.852
http: // www.ijesrt.com(C)International Journal of Engineering Sciences & Research Technology [842-846]
PUOC and PUOC/1wt. % SiO2. The C–H bending and C–C stretching bonds [13] in all samples are at about 1500 cm-1. As the intensity of this peak in PUOC/1wt. % SiO2 is higher than others, it reveals our expectation about the hardness of this composite. The interesting point is that by adding SiO2 in pure PUOC two more modes appear in them which are assigned to C–C bending and C–H bending at 1300cm-1. These peaks start to shift toward lower wave numbers by adding SiO2 NPs up to 2wt. % in PUOC matrix.
Figure 5. Raman spectra of blank PUOC, and PUOC/SiO2 nanocomposites. Raman Spectra of PUOC/TEOS
The detailed Raman spectra of PUOC/TEOS are shown in Fig. 6. The Raman peak at 626 cm-1 is related to existence of TEOS [12] which was observed in all PUOC/TEOS composites. This peak is shifted at 400µl TEOS with PUOC towards large wave numbers that it is related to the dispersion state of TEOS in the PUOC matrix. There is a Raman peak at 482 cm-1 that is assigned to rocking of Si–O–Si bond [14]. This peak is just in the 800µl and 600µl TEOS with PUOC samples, which existed for high concentrations of TEOS rather than in other synthesized composites. Furthermore this peak has shifted to higher wave numbers by increasing the amount of TEOS in PUOC matrix but the intensity of it started to decrease. There is a band which is presented in the 960–980 cm-1 region in all PUOC/TEOS composites and assigned to Si–O stretching vibrations of silanol (Si–OH) groups [14,15].
All peaks that are related to Si show the interaction between TEOS and PUOC that they lead to produce of SiO2 in PUOC matrix confirms our initial expectation. According to C–C stretching and C–H bending modes [13] at 1500 cm-1 among PUOC/TEOS composites it is seen that these peaks have higher intensity in 200µl TEOS in comparison
with the related Raman spectrum of 800µl TEOS sample. These peaks are very weak in two other composites. The C–C–C bending mode [13] has appeared at 670 cm-1 in 200, 400 and 600µl TEOS with PUOC which was shifted to lower wave numbers by adding the amount of TEOS and it is reasonable to claim that the sample with 200µl TEOS has stronger bonds than the other composites.
Figure 6. Raman spectra of blank PUOC, PUOC/200µl, 400µl, 600µl, and 800µl TEOS. Water Uptake
In order to determine the water uptake and water absorption of the samples, all samples were cut to 10 mm *10 mm dimensions with 1mm thickness. The samples were dried in a vacuum oven for 24 hour and their dry weights were measured as Wd. The wet weight of soaking samples (Wt) was examined in deionised water at room temperature at different immersion times up to 96 hours. Water absorption of the samples was calculated by using the following relation [16]:
(%) 100 (1)t d
d
W WW
W
−= ×
The mean value of three different readings was taken. Fig. 7 shows the water absorption of PUOC /TEOS and SiO2 NPs. The most water uptaking of PUOC samples is related to the samples with 1 wt. % SiO2 NPs into polymer matrix. Water uptake of the samples with SiO2 NPs is higher than pure samples; this is reasonable for the inherent hydrophilic of SiO2 NPs. The best amount of TEOS for absorbing water in PU is 200µl TEOS even though 600µl TEOS in PUOC is the nearest absorbing water to 200µl TEOS. As was seen the best component of PUOC in terms of absorbing water is PUOC/200µl TEOS, but the best nanocomposite component in PUOC has lesser concentration of SiO2 NPs in PUOC matrix. Apparent Density And Real Density
[Malekfar, 3(2): February, 2014] ISSN: 2277-9655 Impact Factor: 1.852
http: // www.ijesrt.com(C)International Journal of Engineering Sciences & Research Technology [842-846]
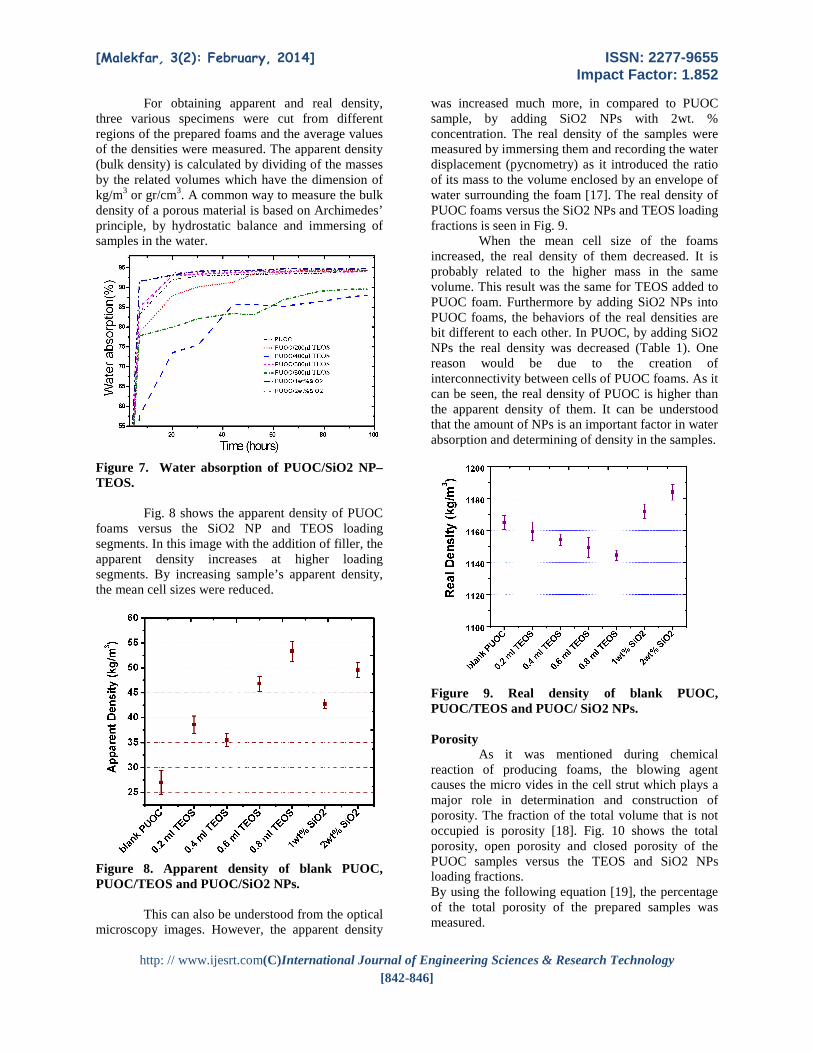
For obtaining apparent and real density, three various specimens were cut from different regions of the prepared foams and the average values of the densities were measured. The apparent density (bulk density) is calculated by dividing of the masses by the related volumes which have the dimension of kg/m3 or gr/cm3. A common way to measure the bulk density of a porous material is based on Archimedes’ principle, by hydrostatic balance and immersing of samples in the water.
Figure 7. Water absorption of PUOC/SiO2 NP– TEOS.
Fig. 8 shows the apparent density of PUOC foams versus the SiO2 NP and TEOS loading segments. In this image with the addition of filler, the apparent density increases at higher loading segments. By increasing sample’s apparent density, the mean cell sizes were reduced.
Figure 8. Apparent density of blank PUOC, PUOC/TEOS and PUOC/SiO2 NPs.
This can also be understood from the optical microscopy images. However, the apparent density
was increased much more, in compared to PUOC sample, by adding SiO2 NPs with 2wt. % concentration. The real density of the samples were measured by immersing them and recording the water displacement (pycnometry) as it introduced the ratio of its mass to the volume enclosed by an envelope of water surrounding the foam [17]. The real density of PUOC foams versus the SiO2 NPs and TEOS loading fractions is seen in Fig. 9.
When the mean cell size of the foams increased, the real density of them decreased. It is probably related to the higher mass in the same volume. This result was the same for TEOS added to PUOC foam. Furthermore by adding SiO2 NPs into PUOC foams, the behaviors of the real densities are bit different to each other. In PUOC, by adding SiO2 NPs the real density was decreased (Table 1). One reason would be due to the creation of interconnectivity between cells of PUOC foams. As it can be seen, the real density of PUOC is higher than the apparent density of them. It can be understood that the amount of NPs is an important factor in water absorption and determining of density in the samples.
Figure 9. Real density of blank PUOC, PUOC/TEOS and PUOC/ SiO2 NPs. Porosity
As it was mentioned during chemical reaction of producing foams, the blowing agent causes the micro vides in the cell strut which plays a major role in determination and construction of porosity. The fraction of the total volume that is not occupied is porosity [18]. Fig. 10 shows the total porosity, open porosity and closed porosity of the PUOC samples versus the TEOS and SiO2 NPs loading fractions. By using the following equation [19], the percentage of the total porosity of the prepared samples was measured.

[Malekfar, 3(2): February, 2014] ISSN: 2277-9655 Impact Factor: 1.852
http: // www.ijesrt.com(C)International Journal of Engineering Sciences & Research Technology [842-846]
( )1 100% (2)total apparent realϕ ρ ρ= − ×
The real and apparent densities of the samples were measured in previous section. In PUOC foams the total porosity of PUOC/TEOS composites is about 2 % less than the blank PUOC foam. On the other hand, the open porosity is a sign of sound absorption that the foam with high open porosity is a good sound absorber [20]. By using the given data from water absorption and also the saturation time of samples, the volume of water was measured by using the following relation
( ) (3)water saturated dry waterV m m ρ= −
where saturatedm is the mass of water saturated foam
and drym is the oven dry mass of the samples. The
waterρ is the mass density of water. If the waterV
volume of water is divided by the original foam volume, the percentage of open porosity of the samples will be calculated. The difference between the open porosity and the total porosity will be the percentage of closed porosity of the samples.
Figure 10. Total porosity, open porosity and close porosity of blank PUOC, PUOC/TEOS and PUOC/SiO2 NPs.
It is clear in PUOC nanocomposites that the open porosity of them reaches a maximum of up to about 66%, higher than the blank PUOC foam for 2wt. % SiO2 content. Then by increasing the SiO2 NPs loading fraction, the open porosity of PUOC nanocomposites starts to increase. The decreasing of mean cell size tends to higher conductivity of water and its absorption will increase. This means that by decreasing cell size, the open porosity starts to increase.
Table 1.Calculated values of some properties of blank PUOC, PUOC/SiO2 NPs and PUOC/TEOS composites
Conclusions Two PUOC hybrids prepared with SiO2 NPs
and TEOS as the energy decaying filler at high loading fractions up to 2wt. % SiO2 and 800µl TEOS. The relationship among the mentioned PUOC foam microstructure via optical micrograph and its different optical and non-optical properties were evaluated. The interaction between fillers and blank PUOC and thus the effects of this interaction on optical and non-optical properties of PEU nanocomposites and PUOC composites was investigated by FTIR and Raman spectroscopy. The following results can be pointed: 1. The mean cell sizes of foams initially increases
on the addition of SiO2NPs from 0.0wt. % up to 1.0wt. % but tends to decrease up to 2.0wt. %. By increasing TEOS content from 200µl up to 800µl into the blank PUOC, the mean cell sizes of foams decreased.
2. The water absorption of samples showed that the PUOC/1wt. % SiO2NPs was the best sample for absorbing water. Furthermore, by increasing TEOS contents into blank PEU, the water up taking was increased but their capacity of them for absorbing water were less than PUOC/1wt. % SiO2 foam.
3. The results indicated that there was a maximum of 8% decrease in the apparent density of PUOC/1wt. % SiO2 nanocomposite in comparison with the blank PUOC foam. The apparent densities of PUOC/TEOS foams were between apparent density of PUOC/1wt. % SiO2 and PUOC/2wt. % SiO2.
4. The real density reaches a maximum of up to about 3.5% higher than blank PUOC foam for 1wt. % SiO2 and then start to decrease for 2wt. % SiO2. The real densities of PUOC/TEOS

[Malekfar, 3(2): February, 2014] ISSN: 2277-9655 Impact Factor: 1.852
http: // www.ijesrt.com(C)International Journal of Engineering Sciences & Research Technology [842-846]
foams were between real density of PUOC/1wt. % SiO2 and PEU/2wt. % SiO2.
5. The open porosity of the PUOC foam reached a maximum of up to about 18% higher than the blank PUOC foam for 2 wt. % of SiO2 NPs content.
References
[1] B. Yildiz, M.O. Seydibeyoglu, F.S. Guner, “Polyurethane–zinc borate composites with high oxidative stability and flame retardancy”, Polymer Degradation and Stability, 94, pp.1072, 2009.
[2] L. Bistricic, G. Baranovic, M. Leskovac, E.G. Bajsic, “Hydrogen bonding and mechanical properties of thin films of polyether-based polyurethane–silica nanocomposites”, European Polymer Journal, 46, pp. 1975, 2010.
[3] Y. Zhu, X. Zhao, Z. Wang, D. An, Y. Ma, S. Guan, Y. Du, B. Zhou, X. Gao, “Synthesis and characterization of polyurethane/SiO2 nanocomposites”, Applied Surface Science, 257, pp.4719, 2011.
[4] S. Pandey, S.B. Mishra, “Sol–gel derived organic–inorganic hybrid materials: synthesis, characterizations and applications”, Journal of Sol-Gel Science Technology, 59, pp.73, 2011.
[5] H. Zhou, Y. Chen, H. Fan, H. Shi, Z. Luo, B. Shi, The polyurethane/SiO2 nano-hybrid membrane with temperature sensitivity for water vapor permeation, Journal of Membrane Science ,318, pp.71, 2008.
[6] Z. Luo, R.Y. Hong, H.D. Xie, W.G. Feng, “One-step synthesis of functional silica nanoparticles for reinforcement of polyurethane coatings”, Powder Technology, 218, pp.23, 2012.
[7] M. Sadeghi, M.A. Semsarzadeh, M. Barikani, M. Pourafshari Chenar, “Gas separation properties of polyether-based polyurethane–silica nanocomposite membranes”, Journal of Membrane Science, 376, pp.188, 2011
[8] J.L. Rivera-Armenta, T. Heinze, A.M. Mendoza-Martinez, “New polyurethane foams modified with cellulose derivatives”, European Polymer Journal, 40, pp. 2803, 2004.
[9] S. Parnell, K. Min, M. Cakmak, “Kinetic studies of polyurethane polymerization with Raman spectroscopy”, Polymer, 44, pp. 5137, 2003.
[10] R.C.S. Araujo, V.M.D. Pasa, B.N. Melo, “Effects of biopitch on the properties of flexible polyurethane foams”, European Polymer Journal, 41, pp. 1420, 2005.
[11] H. Xia, M. Song, “Preparation and characterization of polyurethane–carbon nanotube composites”, Soft Matter, 1, pp. 386, 2005.
[12] M. Gnyba, M. Jedrzejewska-Szczerska, M. Keranen, J. Suhonen, “sol-gel materials investigation by means of raman spectroscopy”, Proceedings of the XVII IMEKO World Congress Metrology in the 3rd Millennium, Dubrovnik, Croatia, 273 (2003).
[13] O. M. Primera-Pedrozo, G.D.M. Rodriguez, J. Castellanos, H. Felix-Rivera, O. Resto, S.P.Hernandez-Rivera, “Increasing surface enhanced Raman spectroscopy effect of RNA and DNA components by changing the pH of silver colloidal suspensions”, Spectrochimica Acta Part A: Molecular and Biomolecular Spectroscopy, 87, pp.77, 2012.
[14] E.R. Jisha, G. Balamurugan, P. Selvakumar, N. Edison, R. Rathiga, “Synthesis Of Silica Nanoparticle By Chemical Method And Their Antibacterial Activity”, International Journal of PharmTech Research, 4, pp.1323, 2012
[15] J. Bjornstrom, A. Martinelli, J.R.T. Johnson, A. Matic, I. Panas, “Signatures of a drying SiO2 - (H2O)x gel from Raman spectroscopy and quantum chemistry”, Chemical Physics Letters, 380, pp.165, 2003.
[16] C.Y. Bai, X.Y. Zhang, J.B. Dai, C.Y. Zhang, “Water resistance of the membranes for UV curable waterborne polyurethane dispersions”, Progress in Organic Coatings, 59, pp. 331, 2007.
[17] J. Rouquerolt, D. Avnir, C.W. Fairbridge, D.H. Everett, J.H. Haynes, N. Pernicone, J.D.F.Ramsay, K.S.W. Sing, K.K. Unger, “Recommendations for the characterization of porous solids”, Pure and Applied Chemistry, 66, pp. 1739, 1994.
[18] C. Torres-Sanchez, J.R. Corney, “Effects of ultrasound on polymeric foam porosity”, Ultrason Sonochem, 15, pp. 408, 2008.
[19] J.L. Ryszkowska, M. Auguscik, A. Sheikh, A.R. Boccaccini, “Biodegradable polyurethane composite scaffolds containing Bioglass for bone tissue engineering”, Composites Science and Technology, 70, pp. 1894, 2010.

[Malekfar, 3(2): February, 2014] ISSN: 2277-9655 Impact Factor: 1.852
http: // www.ijesrt.com(C)International Journal of Engineering Sciences & Research Technology [842-846]
[20] S. Basirjafari, R. Malekfar, S. Esmaielzadeh Khadem, “Low loading of carbon nanotubes to enhance acoustical properties of poly(ether)urethane foams”, Journal of Applied Physics, 112, pp.104312, 2012.


![Structural Study on the Complex of Ortho-Ester Tetra Azophenylcalix[4]arene (TEAC) with Th(IV)](https://static.fdokumen.com/doc/165x107/632385e14d8439cb620cf299/structural-study-on-the-complex-of-ortho-ester-tetra-azophenylcalix4arene-teac.jpg)