A Study of Cellulose Based Biodegradable Foams and Sponges
72
A Study of Cellulose Based Biodegradable Foams and Sponges A Thesis Presented to The Academic Faculty By Ryan Coda In Partial Fulfillment of the Requirements for the Degree Master of Science in Paper Science and Engineering Georgia Institute of Technology May 2005
-
Upload
independent -
Category
Documents
-
view
2 -
download
0
Transcript of A Study of Cellulose Based Biodegradable Foams and Sponges
A Study of Cellulose Based Biodegradable Foams and Sponges
A Thesis Presented to
The Academic Faculty
By
Ryan Coda
In Partial Fulfillment of the Requirements for the Degree
Master of Science in Paper Science and Engineering
Georgia Institute of Technology May 2005
A Study of Cellulose Based Biodegradable Foams and Sponges
Approved by: Dr. Yulin Deng Dr. Jeff Empie Dr. Jeff Hsieh
Date Approved: April 11, 2005
iii
ACKNOWLEDGEMENTS
I would like to take this opportunity to thank those who
have made this thesis possible. First, I will extend a
thank you to my advisor, Dr. Yulin Deng, for being
understanding and keeping faith even when progress was
slow. Dr. Deng was an excellent mentor throughout my two
years at the Georgia Institute of Technology.
Thanks also goes out to my colleagues Dr. Zegui Yan, Dr.
Yulin Zhao, Dr. Qunhui Sun, Ying Wang, Se-Young Yoon, and
Brett Brotherson. Each of them have helped me in their own
way. A big thanks goes out to Mike Huang, as well, for all
of his computer help.
I would also like to thank everyone involved in the Georgia
Tech hockey program, especially Coach Greg Stathis, Coach
Brian McSparron, Coach Paul Gattung, and Coach Kenny
“Sarge” Day. This thesis never would have been possible
without my coaches and teammates understanding when I had
to miss team obligations for the benefit of my research.
Having the opportunity to play for such a classy
iv
organization was a big factor in preventing graduate school
from becoming overwhelming.
Last, but definitely not least, I would like to thank my
family for enduring my long hours at school and the
frustrations that sometimes came with those long hours. My
little girl, Gabrielle, could always cheer me up, even on
the worst of days, and my soon-to-be-wife, Cherry, kept me
pushing forward.
v
TABLE OF CONTENTS
ACKNOWLEDGEMENTS iii
LIST OF FIGURES vii
LIST OF TABLES ix
SUMMARY x
CHAPTER 1 INTRODUCTION 1
CHAPTER 2 LITERATURE REVIEW 3 2.1 CELLULOSE LIQUEFACTION METHODS 3
2.1.1 Dissolution in polyhyrdric alcohols 3 2.1.2 Dissolution in N-methylmorpholine-
N-oxide (NMMO) 4 2.1.3 Dissolution in ionic liquids 5 2.1.4 Dissolution in LiCl/DMAC system 6 2.1.5 Viscose rayon method 6 2.2 FOAMS/SPONGES FROM DISSOLVED CELLULOSE 10 2.2.1 Polyurethane foam from dissolved cellulose 11 2.2.2 Cellulose sponges from viscose rayon solutions 22 2.3 FIBER REINFORCEMENT 27 CHAPTER 3 EXPERIMENTAL 30 3.1 PREPARATION AND PROPERTIES OF PULPS 30 3.2 VISCOSE PREPARATION 32 3.2.1 Steeping 32 3.2.2 Pressing and shredding 32 3.2.3 Aging (Mercerization) 33 3.2.4 Xanthation 33 3.2.5 Dissolving and ripening 33 3.3 VISCOSE VISCOSITY 34 3.4 SODIUM SULFATE CRYSTALLIZATION 35 3.5 CELLULOSE SPONGE FORMATION 35 3.6 SPONGE TESTING 38
vi
3.6.1 Air to cellulose ratio 38 3.6.2 Density, absorbency, bound water, swelling 41 3.6.3 Tensile testing 43 3.6.4 Regenerated cellulose DP 43 CHAPTER 4 RESULTS, DISCUSSION, AND CONCLUSIONS 44 4.1 RAW MATERIALS 44 4.2 SPONGE RESULTS 45 4.2.1 Air to cellulose ratio and dry density 45 4.2.2 Absorbency, swelling, and bound water 49 4.2.3 Tensile index 53 4.3 DISCUSSION AND CONCLUSIONS 55 CHAPTER 5 FUTURE 58 REFERENCES 60
vii
LIST OF FIGURES
Figure 1: Structure of N-methylmorphonline-N-oxide (NMMO). 5 Figure 2: Cellulose xanthate representation. 7 Figure 3: Reaction between isocyanate and alcohol. 11 Figure 4: Reaction between isocyanate and water. 12 Figure 5: Change of residual rate with reaction time. 13 Figure 6: Effect of glycerin content on residual rate. 15 Figure 7: Residual content after starch addition. 17 Figure 8: Weight loss of foam buried in soil. 20 Figure 9: Weight loss of foam buried in leaf mold. 20 Figure 10: Oven temperatures during cellulose regeneration. 37 Figure 11: No filler sponge (bottom). 40 Figure 12: No filler sponge (top). 40 Figure 13: 10% HW sponge (bottom) 40 Figure 14: 10% HW sponge (top). 40 Figure 15: 20% HW sponge (bottom). 40 Figure 16: 20% HW sponge (top). 40 Figure 17: 10% SW sponge (bottom). 41 Figure 18: 10% SW sponge (top). 41 Figure 19: 20% SW sponge (bottom). 41 Figure 20: 20% SW sponge (top). 41
viii
Figure 21: Photo of undissolved fiber fragment at 10x magnification. 45 Figure 22: Dry density as a function of fiber content. 48 Figure 23: Hardwood fiber across pore. 49 Figure 24: Softwood fiber across pore. 49 Figure 25: Sponge absorbency. 52 Figure 26: Sponge swelling upon wetting. 52 Figure 27: Bound water in sponge. 52 Figure 28: Sponge tensile index. 54
ix
LIST OF TABLES
Table I: Sample viscose production details. 9 Table II: Composition and properties of liquefied biomass polyols. 18 Table III: Biomass composition influence on mechanical properties. 19 Table IV: Compositions of pastes for sponge production. 36 Table V: Average results for hardwood reinforced sponges (including the 0% filler sponge). 46 Table VI: Average results for softwood reinforced sponges (including the 0% filler sponge). 46
x
SUMMARY
Environmental concerns have brought about a push to replace
non-biodegradable products that are made from non-renewable
resources. Investigations regarding use of wood fibers and
other biomass as a raw material for biodegradable foams and
sponges are an example of such a replacement. Foams made
at least partially of biomass can be created using
cellulose from wood fibers once the cellulose is converted
into a fluid form. Polyurethane foams can be made from
polyols containing as much as 50% biomass by combined
dissolution of wood and starch. Sponges can be made
completely from cellulose regenerated from a viscose rayon
solution, and the effect of using wood fibers as
reinforcement material within the cellulose matrix of such
sponges was studied. The effect of fiber content and fiber
length on absorbance, swelling, density, air to cellulose
ratios, bound water, and tensile was determined.
1
CHAPTER 1
INTRODUCTION
Environmental concerns are driving the effort to find new
methods for producing many common items using renewable and
biodegradable resources as opposed to the synthetic and
often petrol-based materials commonly used. Cellular
plastic, or plastic foam, is an example of such a product
which can potentially be produced completely, or at least
partially, with biomass such as lignocellulosics. These
foams can be rigid, semi-rigid, or flexible depending on
the structure of the polymer used for synthesis. They can
be absorbent or non-absorbent. The absorbent types are
typically called sponges. The pore size and arrangement,
and, therefore, the density, of these foams can be
manipulated to suit nearly any need. The great versatility
of foam/sponge materials makes them very important in our
everyday lives, with applications ranging from packaging to
furniture cushioning to insulation to household cleaning
and much more.
The major downfall of the majority of today’s foams is that
they are typically produced from non-renewable, non-
2
recyclable, and non-biodegradable materials, such as
polyurethane. The large abundance of natural cellulose
from wood pulp, along with its excellent mechanical and
thermal properties and biodegradability, make it an
attractive alternative to such environmentally harmful
materials. Cellulose must first be converted into fluid
form with the appropriate properties necessary as a
starting material, which is no trivial task.
It is widely known that cellulose does not melt, but it
will undergo thermal degradation at high temperature [1].
Cellulose must therefore be converted into a liquid form by
either direct dissolution or by derivitization and
subsequent dissolution of the derivative. The strong
inter-chain and intra-chain hydrogen bonding involved in
the crystalline regions make reactions and dissolution of
cellulose difficult. There are a number of liquefaction
methods available, however, and some of these result in
products that can be, at least to some extent, incorporated
into foam.
3
CHAPTER 2
LITERATURE REVIEW
2.1 Cellulose Liquefaction Methods
There are a variety of methods used to convert cellulose
into a fluid form, whether they be direct dissolution or
derivitization followed by dissolution of the derivative.
Some of these methods will be described below. The use of
the resulting liquid for foam production will be discussed
for two of these methods in section 2.2.
2.1.1 Dissolution in polyhydric alcohols
The use of polyhydric alcohols as a solvent for cellulose
is potentially a very useful dissolution method for the
production of polyurethane foam. A liquefied mixture of
biomass and a polyhydric alcohol of appropriate molecular
weight can be used directly as a polyol for polyurethane
foam production [2].
The strong hydrogen bonding involved in cellulose is a
result of the large number of hydroxyl groups present in
the molecular chains. Polyhydric alcohols, along with a
sulfuric acid catalyst, are capable of disrupting this
4
hydrogen bonding by providing additional hydroxyl groups to
compete with the cellulose inter-chain and inter-chain
hydrogen bonding and their large size forces the chains
apart. This process is not very efficient, however, and
the wood undergoes a recondensation reaction once wood
concentrations of greater than approximately 33% are
reached [3].
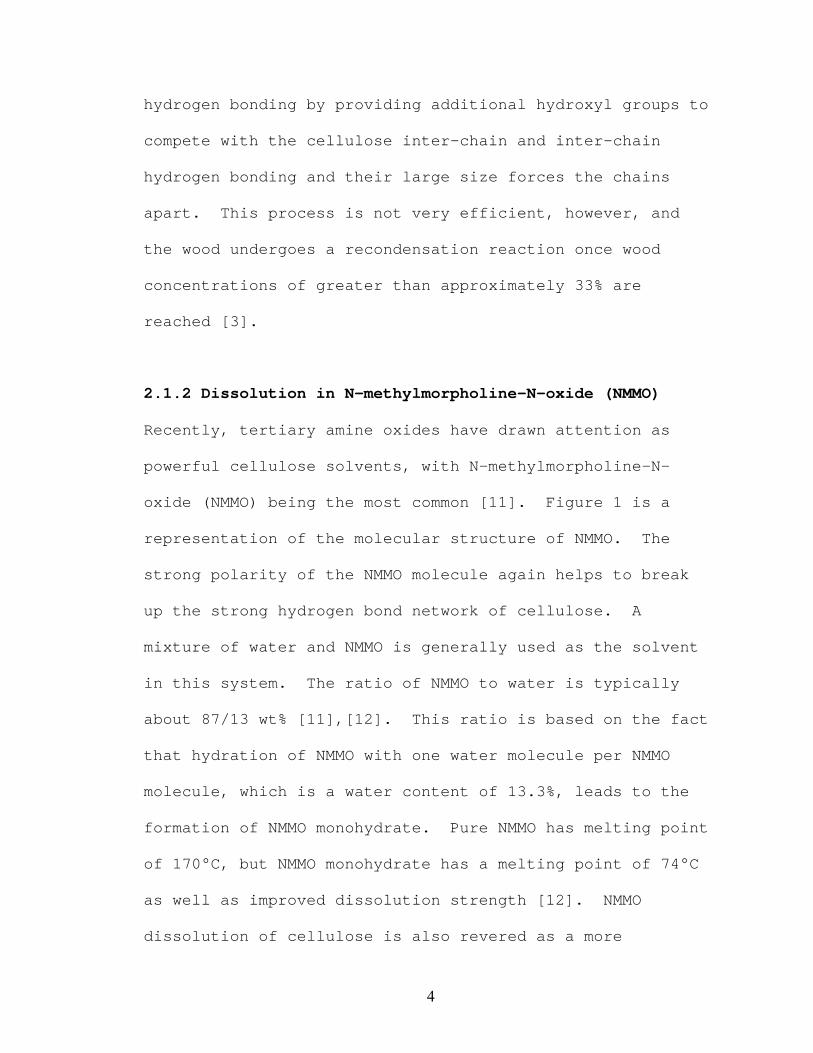
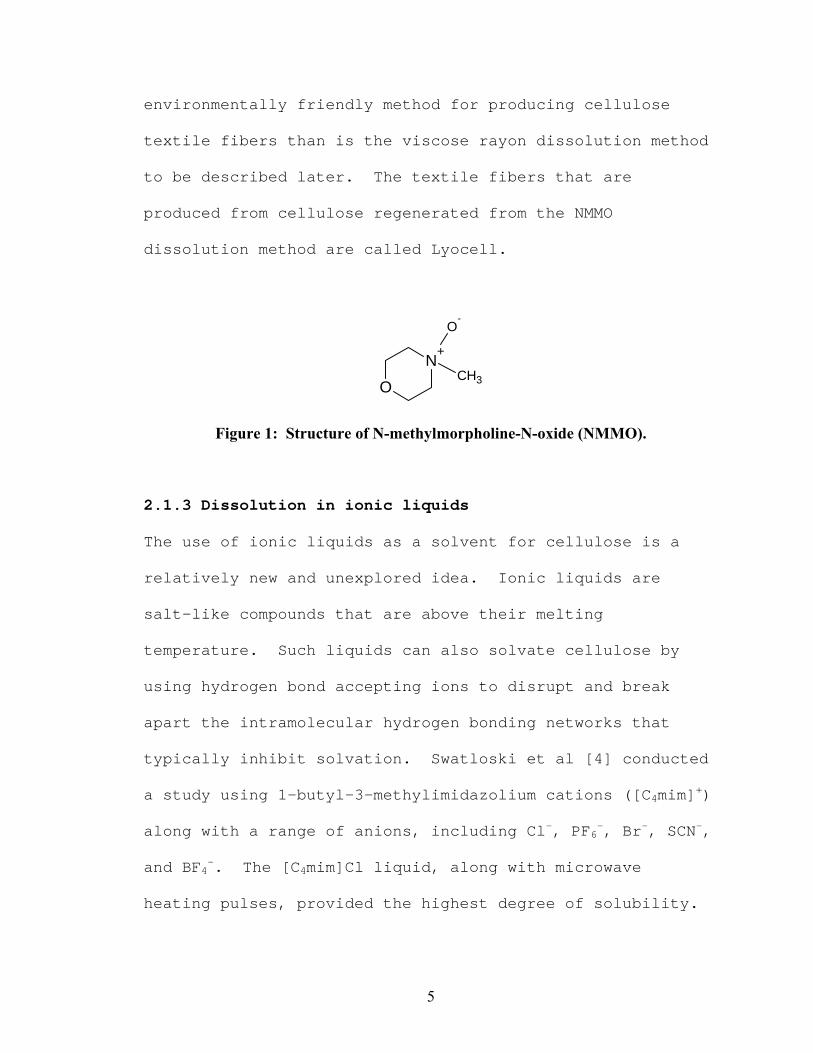
2.1.2 Dissolution in N-methylmorpholine-N-oxide (NMMO)
Recently, tertiary amine oxides have drawn attention as
powerful cellulose solvents, with N-methylmorpholine-N-
oxide (NMMO) being the most common [11]. Figure 1 is a
representation of the molecular structure of NMMO. The
strong polarity of the NMMO molecule again helps to break
up the strong hydrogen bond network of cellulose. A
mixture of water and NMMO is generally used as the solvent
in this system. The ratio of NMMO to water is typically
about 87/13 wt% [11],[12]. This ratio is based on the fact
that hydration of NMMO with one water molecule per NMMO
molecule, which is a water content of 13.3%, leads to the
formation of NMMO monohydrate. Pure NMMO has melting point
of 170°C, but NMMO monohydrate has a melting point of 74°C
as well as improved dissolution strength [12]. NMMO
dissolution of cellulose is also revered as a more
5
environmentally friendly method for producing cellulose
textile fibers than is the viscose rayon dissolution method
to be described later. The textile fibers that are
produced from cellulose regenerated from the NMMO
dissolution method are called Lyocell.
N+
OCH3
O-
Figure 1: Structure of N-methylmorpholine-N-oxide (NMMO).
2.1.3 Dissolution in ionic liquids
The use of ionic liquids as a solvent for cellulose is a
relatively new and unexplored idea. Ionic liquids are
salt-like compounds that are above their melting
temperature. Such liquids can also solvate cellulose by
using hydrogen bond accepting ions to disrupt and break
apart the intramolecular hydrogen bonding networks that
typically inhibit solvation. Swatloski et al [4] conducted
a study using 1-butyl-3-methylimidazolium cations ([C4mim]+)
along with a range of anions, including Cl-, PF6-, Br-, SCN-,
and BF4-. The [C4mim]Cl liquid, along with microwave
heating pulses, provided the highest degree of solubility.
6
Even this method only obtained a solubility of 25% by
weight, however.
2.1.4 Dissolution in LiCl/DMAC system
Solutions of LiCl/N,N’-dimethylacetamide (DMAC) are another
common dissolution system for cellulose. This system
breaks up the cellulose hydrogen bonds in a similar way to
ionic liquids, with the DMAC forming a complex with the
lithium ions and liberating the chloride ions, which
interact with the cellulose hydroxyl groups [4].
2.1.5 Viscose rayon method
The viscose method is, in fact, a very old method of
dissolving cellulose by first derivatizing. A process for
the preparation of dissolved cellulose solutions by
treating alkali cellulose with carbon disulfide was
patented as early as 1892 by Cross, Bevan, and Beadle [5].
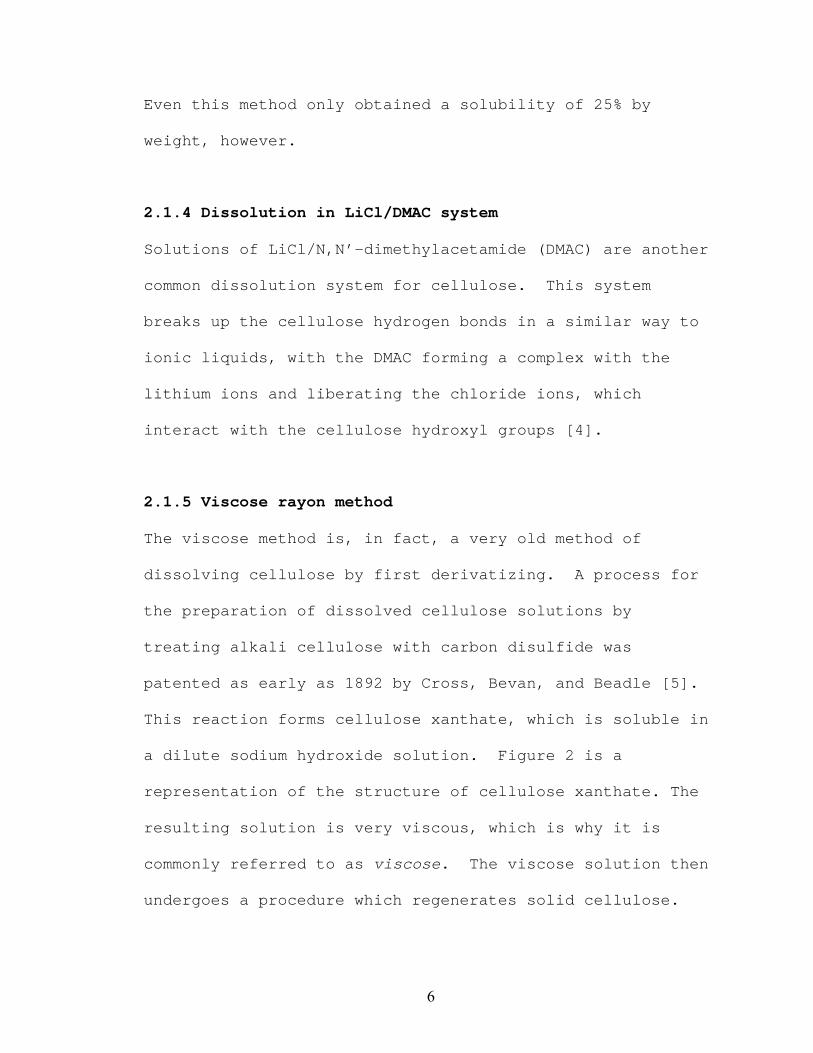
This reaction forms cellulose xanthate, which is soluble in
a dilute sodium hydroxide solution. Figure 2 is a
representation of the structure of cellulose xanthate. The
resulting solution is very viscous, which is why it is
commonly referred to as viscose. The viscose solution then
undergoes a procedure which regenerates solid cellulose.
7
O
H
HH
H
OH
H OH
OH
O
H
HH
H
OH
H O
OH
O
O
R
R
SS-
n
Na+
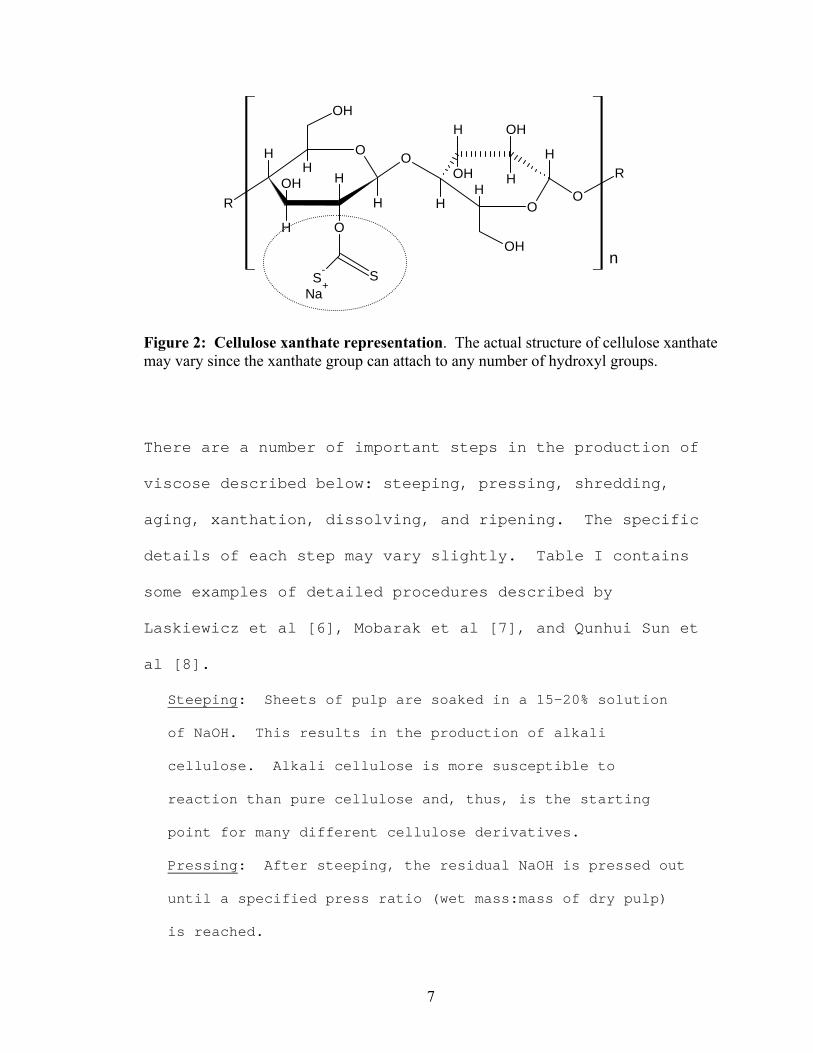
Figure 2: Cellulose xanthate representation. The actual structure of cellulose xanthate may vary since the xanthate group can attach to any number of hydroxyl groups. There are a number of important steps in the production of
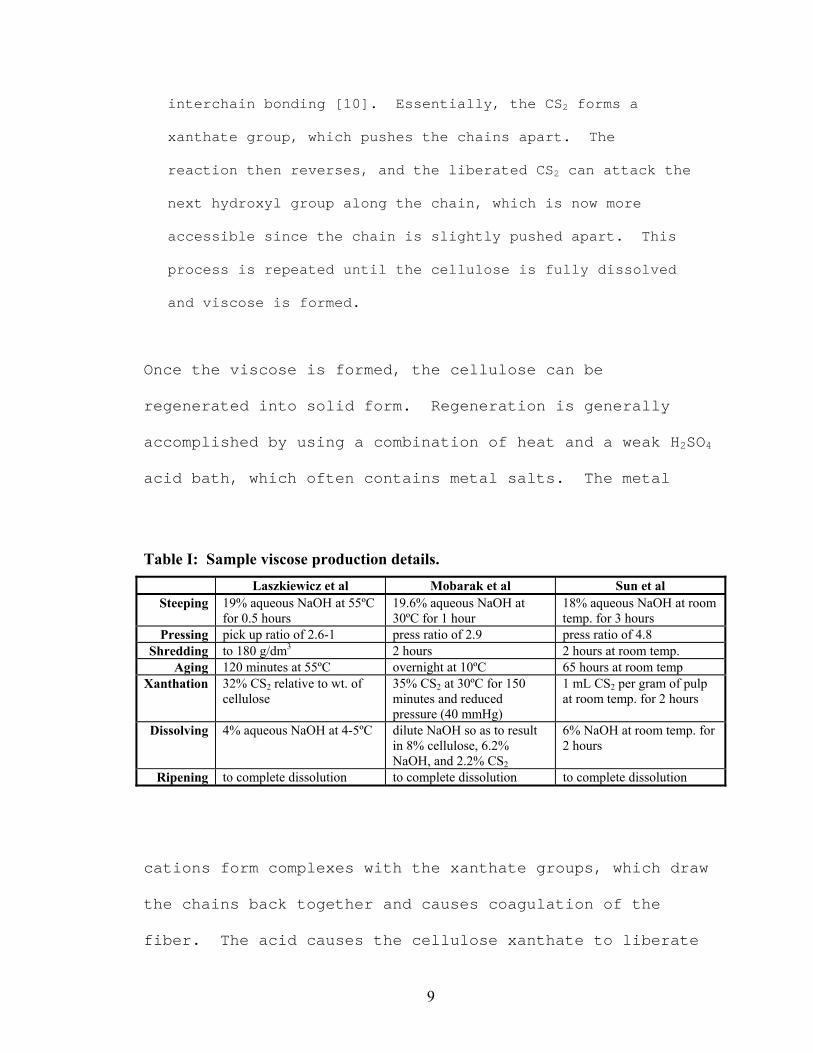
viscose described below: steeping, pressing, shredding,
aging, xanthation, dissolving, and ripening. The specific
details of each step may vary slightly. Table I contains
some examples of detailed procedures described by
Laskiewicz et al [6], Mobarak et al [7], and Qunhui Sun et
al [8].
Steeping: Sheets of pulp are soaked in a 15-20% solution
of NaOH. This results in the production of alkali
cellulose. Alkali cellulose is more susceptible to
reaction than pure cellulose and, thus, is the starting
point for many different cellulose derivatives.
Pressing: After steeping, the residual NaOH is pressed out
until a specified press ratio (wet mass:mass of dry pulp)
is reached.
8
Shredding: The pressed sheets are shredded until a bread-
crumb-like appearance is obtained. The shredding results
in a greater surface area in contact with ambient oxygen.
Aging: This stage typically last anywhere from 48-72
hours, depending on the desired end properties. During
aging, cellulose is oxidized, which results in a decrease
in the degree of polymerization (DP). The viscosity of the
final viscose will decrease with decreased DP [9]. This
step is also referred to as mercerization.
Xanthation: The aged alkali cellulose is treated with
carbon disulfide (CS2) to produce cellulose xanthate. The
crystalline regions of the cellulose are not easily
penetrated by the CS2, so the resulting compound may more
accurately be described as a block copolymer of cellulose
and cellulose xanthate.
Dissolving: The cellulose xanthate is dissolved in a
dilute NaOH solution. Dissolution is possible since the
bulky xanthate groups push the cellulose chains apart and
thereby weaken the interchain hydrogen bonds.
Ripening: Due to the initial inaccessibility of much of
the crystalline regions of the cellulose, not all of the
cellulose xanthate is initially soluble. However, the
xanthation reaction is reversible, meaning some of the
xanthate groups revert back to hydroxyl groups and release
free CS2. This free CS2 can then combine with another
hydroxyl group and gradually break down the cellulose
9
interchain bonding [10]. Essentially, the CS2 forms a
xanthate group, which pushes the chains apart. The
reaction then reverses, and the liberated CS2 can attack the
next hydroxyl group along the chain, which is now more
accessible since the chain is slightly pushed apart. This
process is repeated until the cellulose is fully dissolved
and viscose is formed.
Once the viscose is formed, the cellulose can be
regenerated into solid form. Regeneration is generally
accomplished by using a combination of heat and a weak H2SO4
acid bath, which often contains metal salts. The metal
Table I: Sample viscose production details. Laszkiewicz et al Mobarak et al Sun et al
Steeping 19% aqueous NaOH at 55ºC for 0.5 hours
19.6% aqueous NaOH at 30ºC for 1 hour
18% aqueous NaOH at room temp. for 3 hours
Pressing pick up ratio of 2.6-1 press ratio of 2.9 press ratio of 4.8 Shredding to 180 g/dm3 2 hours 2 hours at room temp.
Aging 120 minutes at 55ºC overnight at 10ºC 65 hours at room temp Xanthation 32% CS2 relative to wt. of
cellulose 35% CS2 at 30ºC for 150 minutes and reduced pressure (40 mmHg)
1 mL CS2 per gram of pulp at room temp. for 2 hours
Dissolving 4% aqueous NaOH at 4-5ºC dilute NaOH so as to result in 8% cellulose, 6.2% NaOH, and 2.2% CS2
6% NaOH at room temp. for 2 hours
Ripening to complete dissolution to complete dissolution to complete dissolution
cations form complexes with the xanthate groups, which draw
the chains back together and causes coagulation of the
fiber. The acid causes the cellulose xanthate to liberate
10
CS2 molecules, which can easily leave in gaseous form as a
result of the elevated temperature. The heat also causes
water to diffuse away, which increases the concentration of
dissolved cellulose. The increased concentration causes
cellulose to precipitate out of solution as the solubility
limits are reached [10]. Regeneration is generally
completed in two phases: 1) initial coagulation and 2)
complete regeneration of the coagulated cellulose.
2.2 Foams/Sponges From Dissolved Cellulose
Once wood cellulose is in a liquid form, it can be more
easily manipulated to form products such as foam and sponge
material. The production of polyurethane foam from wood
liquefied in polyhydric alcohols and sponge material
produced from viscose rayon are two common methods for
biomass-based foam and sponge production. Sponge
production from NMMO is also gaining some attention, but
this science is still relatively new and will not be
discussed in this particular study.
11
2.2.1 Polyurethane foam from dissolved cellulose
As previously discussed, cellulose can be dissolved in
polyhydric alcohols. The resulting solution can be
directly used as a polyol in the production of polyurethane
foam, increasing the biodegradability of such foam.
Biomass-based polyurethane foams can be produced with
comparable compressive strengths, as tested by ASTM 1621,
to those produced by conventional polyols [13].
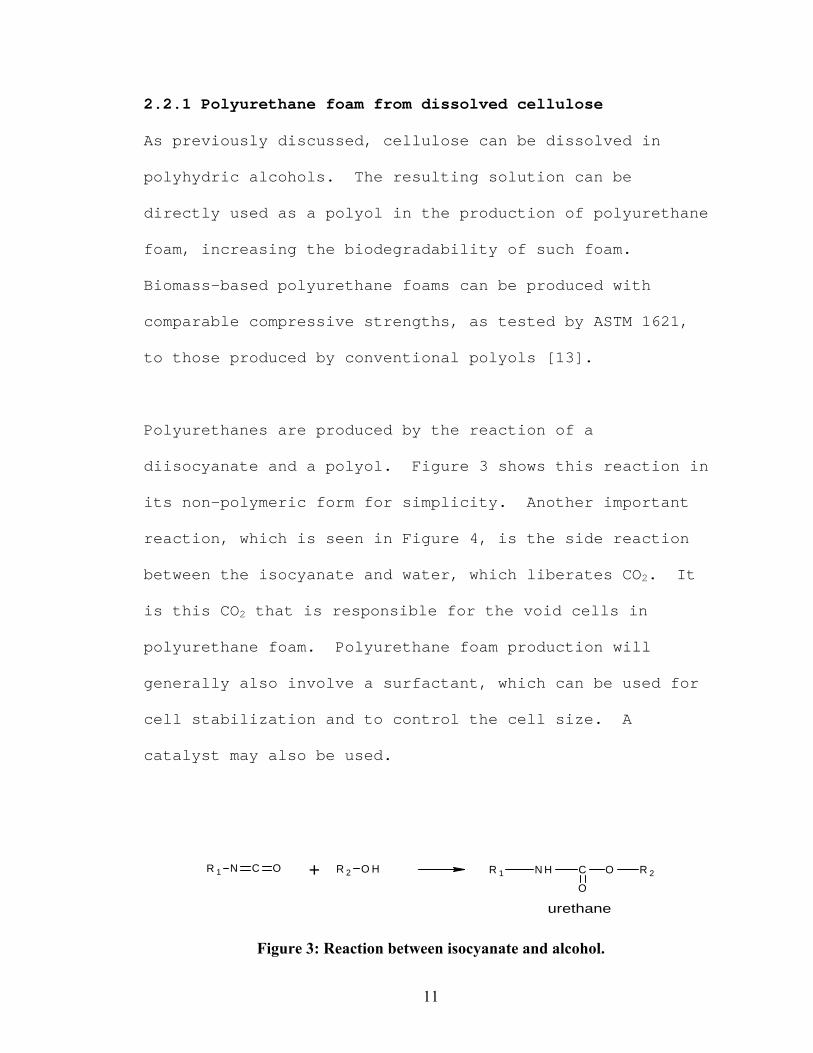
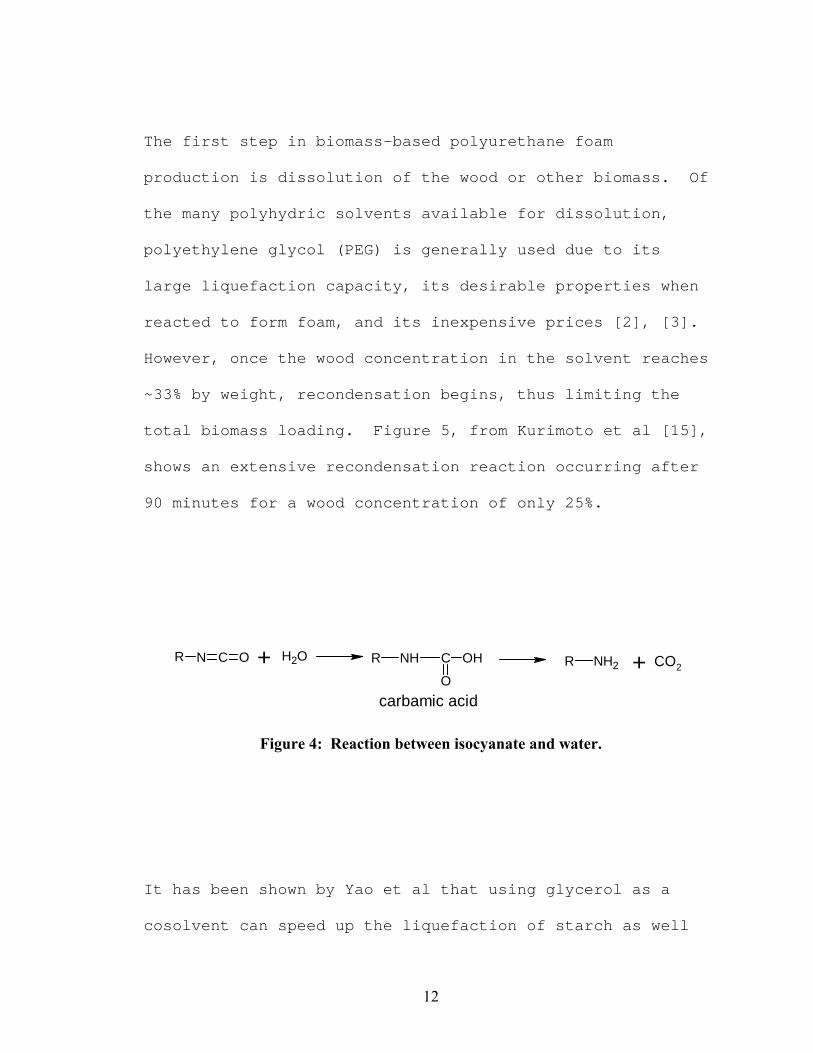
Polyurethanes are produced by the reaction of a
diisocyanate and a polyol. Figure 3 shows this reaction in
its non-polymeric form for simplicity. Another important
reaction, which is seen in Figure 4, is the side reaction
between the isocyanate and water, which liberates CO2. It
is this CO2 that is responsible for the void cells in
polyurethane foam. Polyurethane foam production will
generally also involve a surfactant, which can be used for
cell stabilization and to control the cell size. A
catalyst may also be used.
R 1 N C O + R 2 O H R 1 N H C
O
O R 2
urethane
Figure 3: Reaction between isocyanate and alcohol.
12
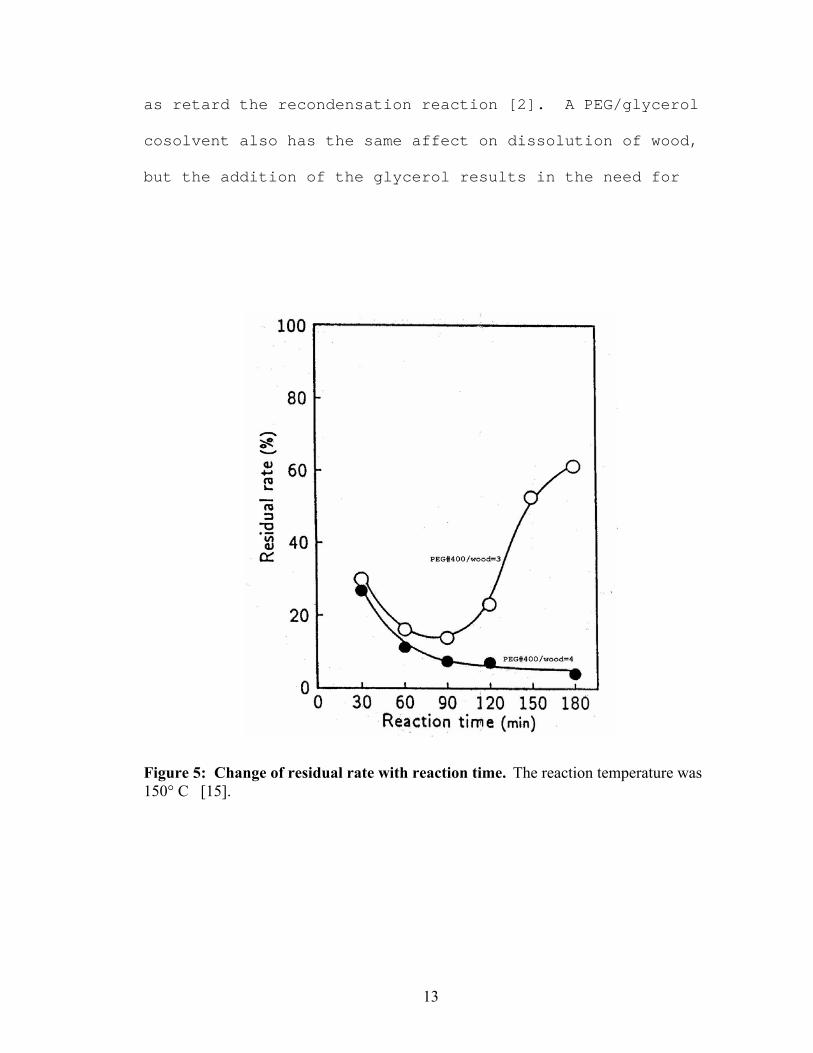
The first step in biomass-based polyurethane foam
production is dissolution of the wood or other biomass. Of
the many polyhydric solvents available for dissolution,
polyethylene glycol (PEG) is generally used due to its
large liquefaction capacity, its desirable properties when
reacted to form foam, and its inexpensive prices [2], [3].
However, once the wood concentration in the solvent reaches
~33% by weight, recondensation begins, thus limiting the
total biomass loading. Figure 5, from Kurimoto et al [15],
shows an extensive recondensation reaction occurring after
90 minutes for a wood concentration of only 25%.
R N C O + OH2 R NH C
O
OH NH2R + CO2
carbamic acid
Figure 4: Reaction between isocyanate and water.
It has been shown by Yao et al that using glycerol as a
cosolvent can speed up the liquefaction of starch as well
13
as retard the recondensation reaction [2]. A PEG/glycerol
cosolvent also has the same affect on dissolution of wood,
but the addition of the glycerol results in the need for
Figure 5: Change of residual rate with reaction time. The reaction temperature was 150° C [15].
14
larger amounts of expensive isocyanate for foam production.
A glycerol content of 10% has been found satisfactory for
wood dissolution [14]. The increased dissolution with
glycerol is thought to occur due to the larger number of
molecules and available hydroxyl groups for a given weight
of glycerol. The use of glycerol in small amounts does not
have much affect on the total amount of wood that can be
dissolved; it mainly speeds up the dissolution and impedes
the recondensation reaction that generally occurs with
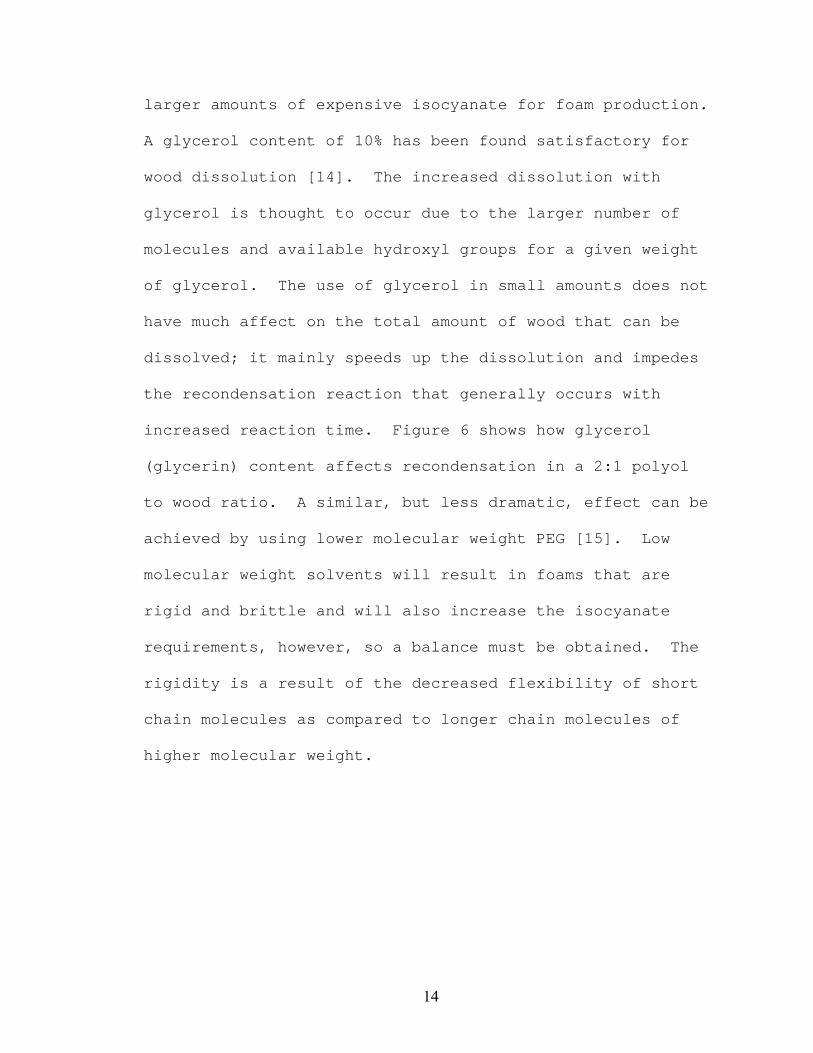
increased reaction time. Figure 6 shows how glycerol
(glycerin) content affects recondensation in a 2:1 polyol
to wood ratio. A similar, but less dramatic, effect can be
achieved by using lower molecular weight PEG [15]. Low
molecular weight solvents will result in foams that are
rigid and brittle and will also increase the isocyanate
requirements, however, so a balance must be obtained. The
rigidity is a result of the decreased flexibility of short
chain molecules as compared to longer chain molecules of
higher molecular weight.
15
Figure 6: Effect of glycerin content on residual rate. Graph obtained from Kurimoto et al [15]. Reaction was at polyol:wood = 2 and temp = 150°C.
Another factor to be considered during the liquefaction is
the hydroxyl number of the resulting polyol, where the
hydroxyl number is defined as “the number of milligrams of
potassium hydroxide equivalent to the phthalic anhydride
consumed in the phthalification of 1 gram of sample” [2]
and is determined by the procedure stated by Yao et al
[16]. The hydroxyl number is important to polyurethane
production as the NCO:OH ratio must be carefully controlled
since this ratio contributes to the formation of the three
16
dimensional network in the polymer matrix and, thus,
influences the mechanical properties [17]. This ratio
generally ranges from 0.8 to 1.6 [15], [17], [18].
Shrinkage tends to occur with NCO:OH ratios less than one
[18].
Polyurethane foams are typically made from polyols with
hydroxyl numbers ranging from 300-500 while biomass
typically has hydroxyl numbers around 1500 [2]. Therefore,
biomass concentrations need to be kept low, even if more
could be dissolved. Yao et al have produced rigid foams
from polyols containing as much as 50% total biomass,
however, by combined liquefaction of wood and starch [16].
The resulting polyols had hydroxyl numbers from 300 to 400.
The polyols used by Yao et al were obtained by first
dissolving wood in a solvent of PEG #400 (average molecular
weight of 400), glycerol, and a sulfuric acid catalyst.
The desired amount of wood was liquefied with a reaction
time sufficient to obtain a constant amount of residual
(unliquefied wood). The starch was then added and the
reaction again continued until a constant residual amount
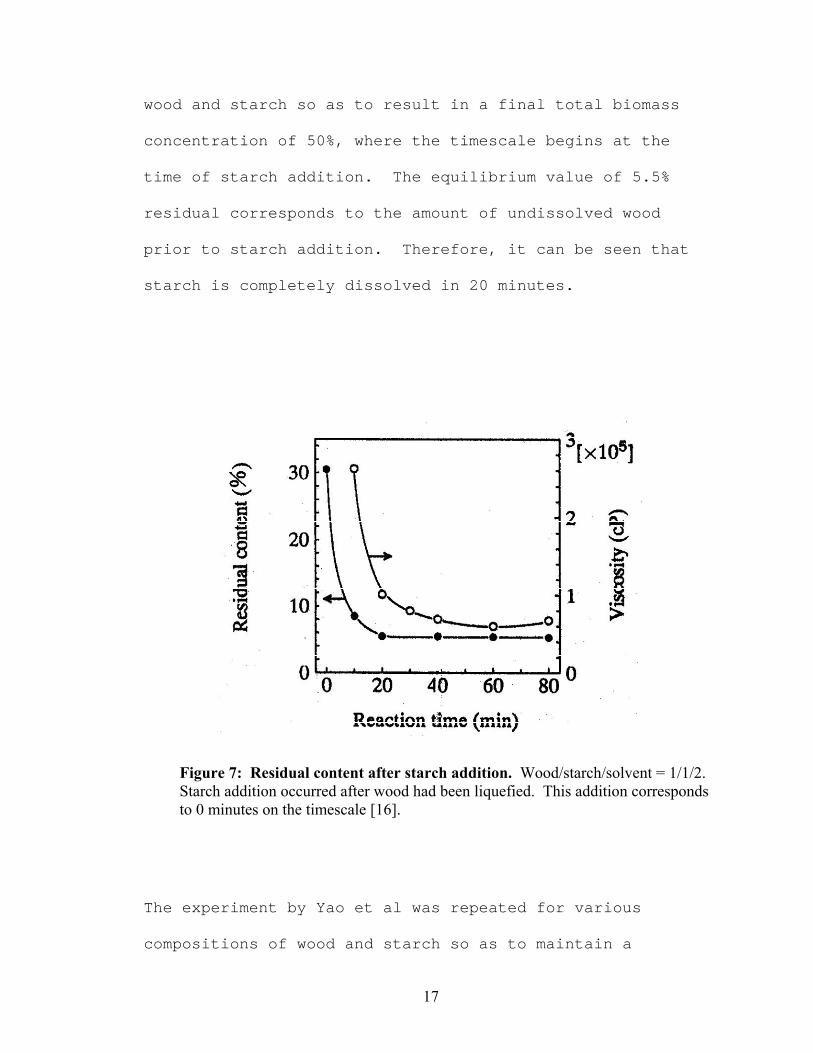
remained. Figure 7, from Yao et al [16], shows the
residual content and viscosity of a solution of equal parts
17
wood and starch so as to result in a final total biomass
concentration of 50%, where the timescale begins at the
time of starch addition. The equilibrium value of 5.5%
residual corresponds to the amount of undissolved wood
prior to starch addition. Therefore, it can be seen that
starch is completely dissolved in 20 minutes.
Figure 7: Residual content after starch addition. Wood/starch/solvent = 1/1/2. Starch addition occurred after wood had been liquefied. This addition corresponds to 0 minutes on the timescale [16].
The experiment by Yao et al was repeated for various
compositions of wood and starch so as to maintain a
18
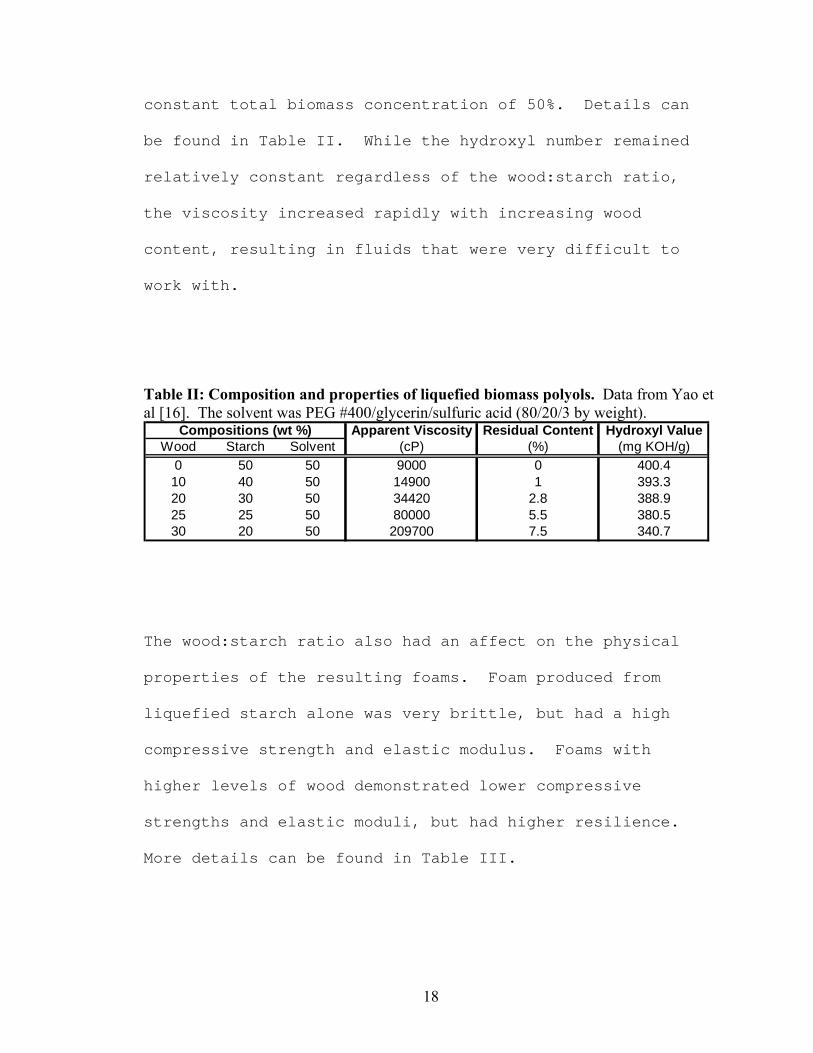
constant total biomass concentration of 50%. Details can
be found in Table II. While the hydroxyl number remained
relatively constant regardless of the wood:starch ratio,
the viscosity increased rapidly with increasing wood
content, resulting in fluids that were very difficult to
work with.
Table II: Composition and properties of liquefied biomass polyols. Data from Yao et al [16]. The solvent was PEG #400/glycerin/sulfuric acid (80/20/3 by weight).
Apparent Viscosity Residual Content Hydroxyl ValueWood Starch Solvent (cP) (%) (mg KOH/g)
0 50 50 9000 0 400.410 40 50 14900 1 393.320 30 50 34420 2.8 388.925 25 50 80000 5.5 380.530 20 50 209700 7.5 340.7
Compositions (wt %)
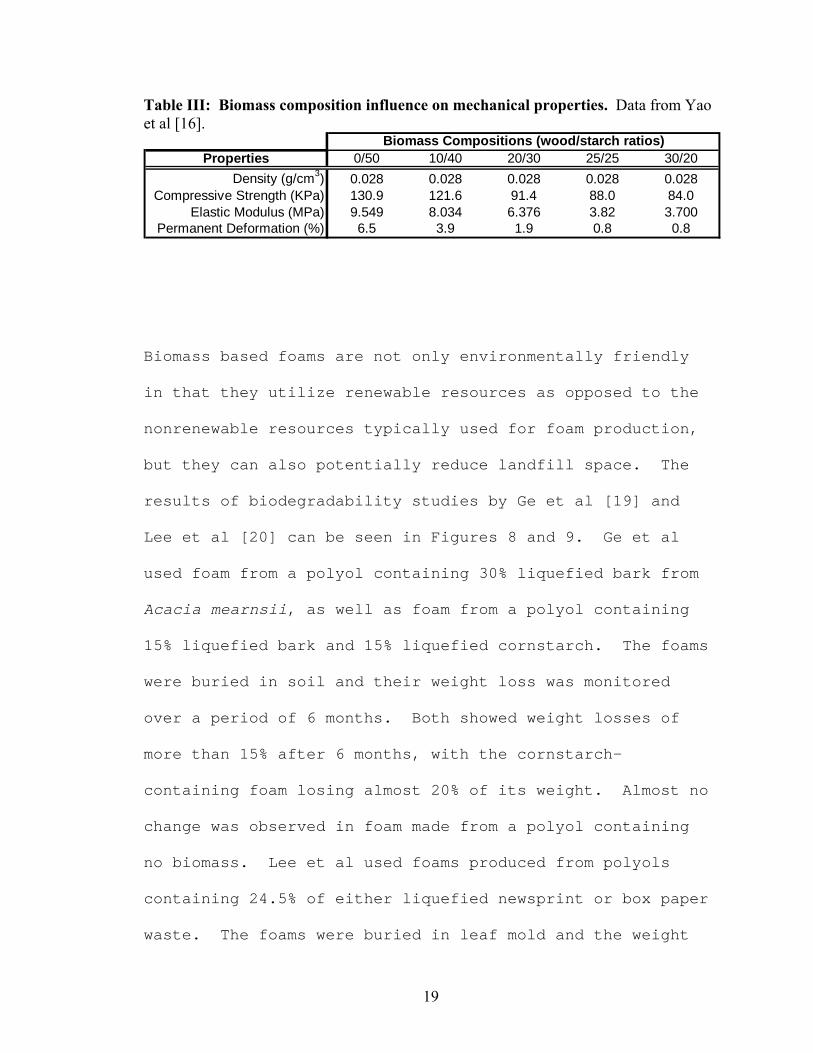
The wood:starch ratio also had an affect on the physical
properties of the resulting foams. Foam produced from
liquefied starch alone was very brittle, but had a high
compressive strength and elastic modulus. Foams with
higher levels of wood demonstrated lower compressive
strengths and elastic moduli, but had higher resilience.
More details can be found in Table III.
19
Table III: Biomass composition influence on mechanical properties. Data from Yao et al [16].
Properties 0/50 10/40 20/30 25/25 30/20Density (g/cm3) 0.028 0.028 0.028 0.028 0.028
Compressive Strength (KPa) 130.9 121.6 91.4 88.0 84.0Elastic Modulus (MPa) 9.549 8.034 6.376 3.82 3.700
Permanent Deformation (%) 6.5 3.9 1.9 0.8 0.8
Biomass Compositions (wood/starch ratios)
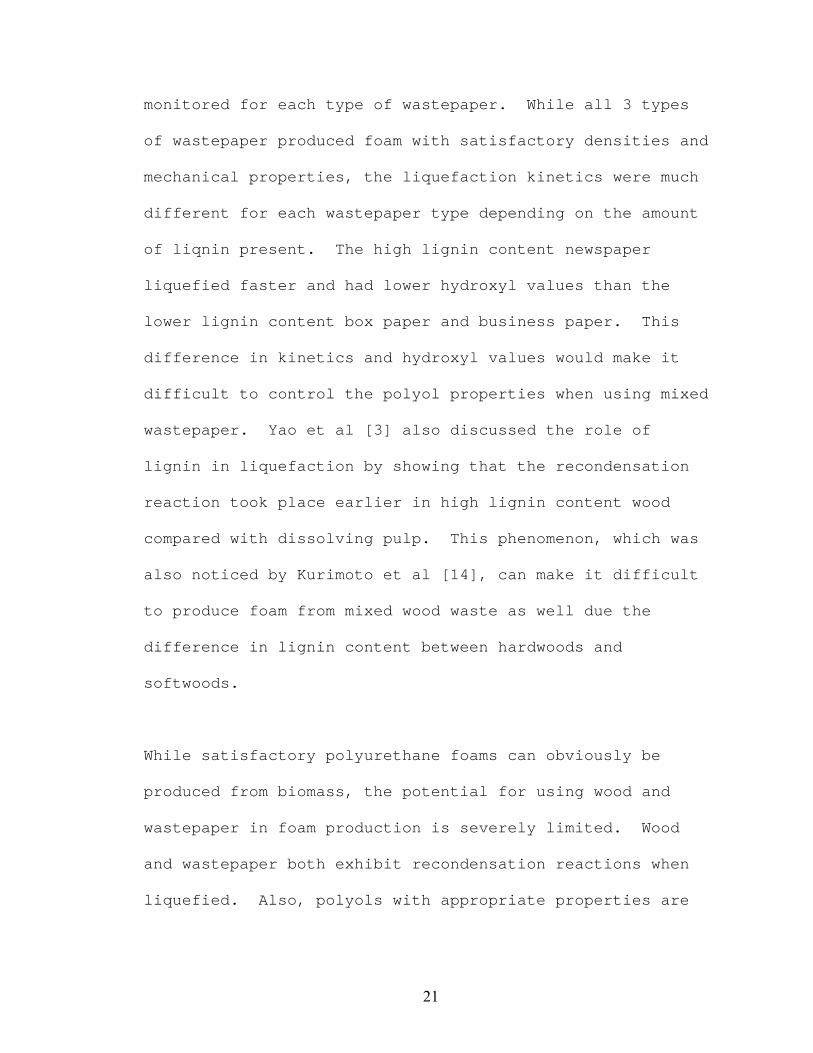
Biomass based foams are not only environmentally friendly
in that they utilize renewable resources as opposed to the
nonrenewable resources typically used for foam production,
but they can also potentially reduce landfill space. The
results of biodegradability studies by Ge et al [19] and
Lee et al [20] can be seen in Figures 8 and 9. Ge et al
used foam from a polyol containing 30% liquefied bark from
Acacia mearnsii, as well as foam from a polyol containing
15% liquefied bark and 15% liquefied cornstarch. The foams
were buried in soil and their weight loss was monitored
over a period of 6 months. Both showed weight losses of
more than 15% after 6 months, with the cornstarch-
containing foam losing almost 20% of its weight. Almost no
change was observed in foam made from a polyol containing
no biomass. Lee et al used foams produced from polyols
containing 24.5% of either liquefied newsprint or box paper
waste. The foams were buried in leaf mold and the weight
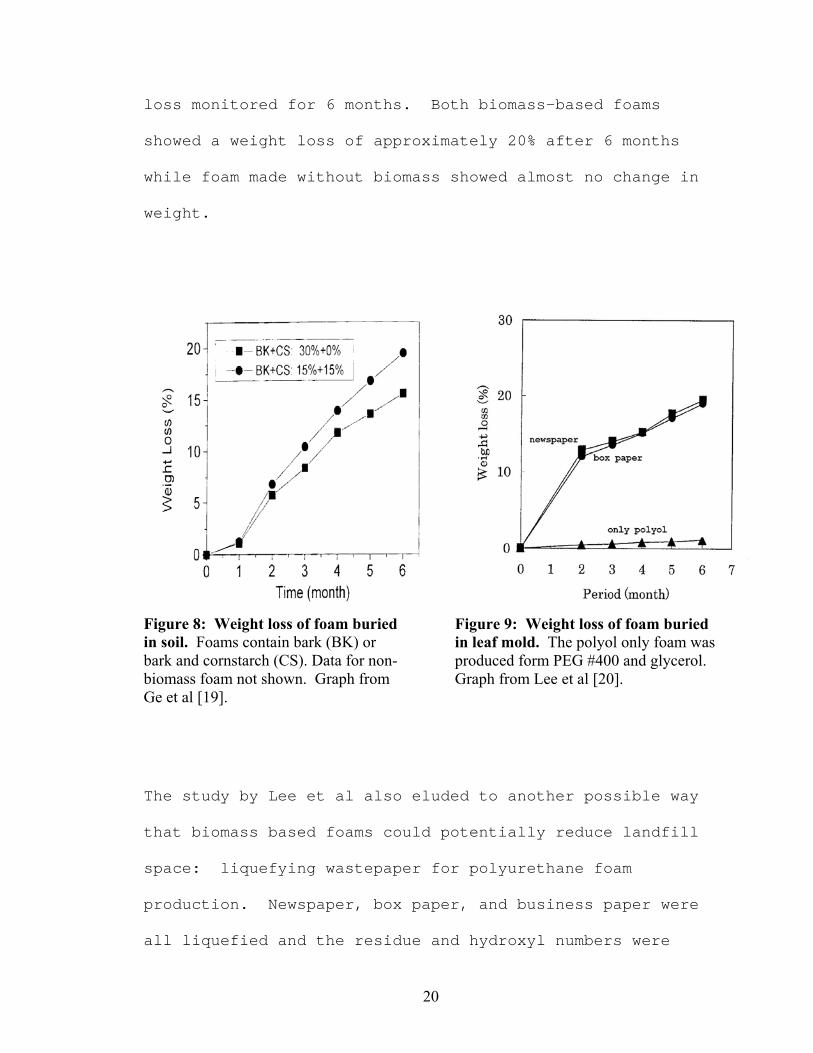
20
loss monitored for 6 months. Both biomass-based foams
showed a weight loss of approximately 20% after 6 months
while foam made without biomass showed almost no change in
weight.
Figure 8: Weight loss of foam buried in soil. Foams contain bark (BK) or bark and cornstarch (CS). Data for non-biomass foam not shown. Graph from Ge et al [19].
Figure 9: Weight loss of foam buried in leaf mold. The polyol only foam was produced form PEG #400 and glycerol. Graph from Lee et al [20].
The study by Lee et al also eluded to another possible way
that biomass based foams could potentially reduce landfill
space: liquefying wastepaper for polyurethane foam
production. Newspaper, box paper, and business paper were
all liquefied and the residue and hydroxyl numbers were
21
monitored for each type of wastepaper. While all 3 types
of wastepaper produced foam with satisfactory densities and
mechanical properties, the liquefaction kinetics were much
different for each wastepaper type depending on the amount
of liqnin present. The high lignin content newspaper
liquefied faster and had lower hydroxyl values than the
lower lignin content box paper and business paper. This
difference in kinetics and hydroxyl values would make it
difficult to control the polyol properties when using mixed
wastepaper. Yao et al [3] also discussed the role of
lignin in liquefaction by showing that the recondensation
reaction took place earlier in high lignin content wood
compared with dissolving pulp. This phenomenon, which was
also noticed by Kurimoto et al [14], can make it difficult
to produce foam from mixed wood waste as well due the
difference in lignin content between hardwoods and
softwoods.
While satisfactory polyurethane foams can obviously be
produced from biomass, the potential for using wood and
wastepaper in foam production is severely limited. Wood
and wastepaper both exhibit recondensation reactions when
liquefied. Also, polyols with appropriate properties are
22
difficult to produce from mixtures of wood or wastepaper
containing different concentrations of lignin.
2.2.2 Cellulose sponges from viscose rayon solutions
Cellulose is a very attractive material for sponge
production due to its hydrophillic nature, its
renewability, and its biodegradability. Such sponges have a
wide variety of applications from household cleaning to
medical applications such as tissue cultures and wound
healing [26], [27]. All-cellulose sponges can be readily
produced from a viscose rayon solution, the manufacture of
which has already been discussed. Viscose is more commonly
used for textile manufacture. Unlike the textile
application, however, cellulose regeneration into sponge
form does not necessarily involve the use of sulfuric acid
baths. The acid baths involved in rayon fiber formation
serve the purpose of rapid decomposition of the cellulose
xanthate at the surface of the fiber. This rapid
regeneration forms a cellulose skin that helps support the
fiber during spinning. This supporting skin is not
necessary for sponge formation, and the application of heat
alone to a viscose paste containing crystals of sodium
sulfate decahydrate is enough to regenerate the cellulose
23
from the cellulose xanthate present in the viscose. While
other salts, such as trisodium phosphate [21], [22], [23],
can be used, sodium sulfate is the most common for sponge
formation. The choice between sodium sulfate and trisodium
phosphate mainly depends on the desired pore size, with
trisodium phosphate crystals being smaller than sodium
sulfate crystals. Also, a paste made with sodium sulfate
will be acidic in nature whereas a paste made with
trisodium phosphate will be alkaline. Therefore, sodium
sulfate pastes would need to be used shortly after they are
made up. The heat required for regeneration of cellulose
from trisodium phosphate containing pastes is slightly
lower than that of sodium sulfate containing pastes [21].
The inclusion of salt crystals in the viscose serves a dual
purpose in cellulose sponge production. First, the
crystals form void spaces within the resulting cellulose
matrix after they dissolve during the cellulose
regeneration process. To ensure a satisfactory structure
and uniformity of the final sponge, an amount of crystals
must be added so that they are in intimate contact with
each other and the liquid portion of the paste will fill in
the very small spaces between the crystals. Generally,
this means the initial paste will contain in excess of 50%
24
by weight of salt crystals [22]. The other purpose of the
salt crystals is to coagulate the viscose by providing a
high salt content in the solution. The sodium sulfate also
helps retard the rate of cellulose regeneration to impart a
higher degree of crystallinity in the regenerated cellulose
[24]. In textile fiber formation, zinc sulfate is often
used in the regeneration bath since the zinc ions help form
complexes with the xanthate groups, pulling the cellulose
chains together and crosslinking them. Since zinc is known
to be a highly toxic chemical and can form a crust on the
spinning equipment, the use of aluminum sulfate (alum) has
been investigated as an environmentally friendly
alternative to zinc sulfate for fiber spinning [25]. Alum
was determined to be a satisfactory alternative to zinc
sulfate. No literature was found, however, regarding
whether aluminum sulfate could be an economically favorable
replacement for the sodium sulfate involved in sponge
formation.
Cellulose regeneration into sponge form from a viscose
rayon solution generally occurs in two stages. During the
first stage, the viscose is heated to approximately 55°-75°
C for approximately 15-60 minutes, depending on the
thickness of the sponge to be made [22]. This moderate
25
heat is sufficient to coagulate the cellulose into a gel-
like form. This initial coagulation retards the
dissolution and migration of the salt crystals within the
paste [22]. The heat necessary for this coagulation is
often provide by infrared lamps or by passing an
alternating electric current through the paste to raise the
temperature. A high frequency electric field may also be
used [28]. These methods provide rapid, even heating to
the viscose paste. The second stage of regeneration
involves the complete regeneration of the cellulose from
the gel-like mass by increasing the heat to approximately
90°-95° C. During this stage, the salt crystals completely
dissolve in the water present in the paste. The complete
regeneration also results in the release of gases, such as
carbon disulfide or other sulfur compounds, and these gases
displace the salt solution leaving behind gas-filled pores
[22]. The paste undergoes shrinkage during regeneration,
which makes it difficult to use a mold to form sponges of
specific dimensions.
Cellulose sponges may also incorporate comminuted cellulose
or reinforcing fibers within the regenerated cellulose
matrix. Little literature was found regarding the
technical aspects of including reinforcing fibers in
26
cellulose sponges, however, which was a driving force
behind the laboratory study to be discussed later. The
comminuted cellulose may consist of 50% or more by weight
of the overall cellulose in the final sponge. Fred Stieg
investigated the effect of comminuted cellulose by varying
the amounts and by comparing mercerized comminuted
cellulose with unmercerized comminuted cellulose within the
resulting sponge [21]. Stieg concluded that adding greater
amounts of comminuted cellulose will decrease the tensile
strength and absorbency as well as decrease the amount of
swelling upon wetting. Although the total absorbency is
decreased with increasing amounts of comminuted cellulose,
the rate of absorption increases. These effects are
further magnified for mercerized comminuted cellulose than
for the unmercerized variety [22]. The use of mercerized
comminuted cellulose also decreases the amount of shrinkage
that occurs during regeneration, making it easier to
control the final geometry with a mold during regeneration
[22].
Another method for controlling the final tensile and
absorbency properties of cellulose sponges involves the
degree of polymerization of the cellulose in the wood pulp
initially used to create the viscose rayon solution. Using
27
the viscosity of a solution of pulp dissolved in
cuprammonium hydroxide as an indicator of the degree of
polymerization, Stieg was able to conclude that a higher DP
resulted in more structural stability and tensile strength
but less absorbency and swelling upon wetting [22].
2.3 Fiber Reinforcement
Fibers of various types are often used to reinforce
composite materials. Since foams and sponges are
essentially composite materials containing void spaces,
inclusion of reinforcement fibers into foams and sponges
may also be advantageous in regards to mechanical
properties. In the case of cellulose sponges, the length
of the reinforcing fibers is typically in the range of 0.5
mm to 50 mm [29], [30].
In short fiber reinforced composites, the fibers reinforce
the matrix by allowing some of the applied load to transfer
to the fibers through the shearing action at the fiber-
matrix interface [32]. This reinforcing mechanism
obviously requires good interfacial bonding for enhanced
reinforcing effects. This makes cellulose fibers an
excellent choice of reinforcing fibers for cellulose
sponges due to the hydrogen bonding that will occur between
28
the fibers and the regenerated cellulose matrix. The
viscose may even attack the cellulose on the outside of the
fibers ensuring good interfacial bonding [30]. Fiber
surface treatments could also be used to increase
interfacial bonding of cellulose fibers to a polyurethane
matrix if necessary. Such surface treatments have been
found beneficial for cellulose fibers in a polyethylene
matrix [32].
The lengths and amounts of the fibers present as
reinforcing material are also important. Both Kalaprasad
et al and Yang et al have shown an initial increase in
tensile strength as reinforcing fiber length increases and
a subsequent decrease after a certain critical fiber length
is reached [32],[33]. The critical fiber length is
dependent on the strength of the individual fibers, their
aspect ratio, and the interfacial bond between the fibers
and the surrounding matrix. Yang et al have also shown
that as the amount of fibers of a given length increases,
the tensile strength increases up to a maximum point and
then declines. This decrease is likely due to
conglomeration of fibers. The concentration of the matrix
material is low in these areas, and a weak spot is formed
[33]. A similar phenomenon can occur with long fibers,
29
which have a tendency to exhibit large amounts of curl.
This may further explain why tensile strengths begin to
decrease when longer fiber lengths are used.
Fibers may also aid as tensile reinforcement by bridging
across cracks that propagate when stress is applied. The
result of this mechanism would be an increased importance
of the number of fibers present over the total mass or
volume of the fibers since a larger number of fibers would
increase the probability that a bridge would be present
across a propagating crack.
30
CHAPTER 3
EXPERIMENTAL
The objective of this study was to characterize the effect
of wood fiber reinforcement material on the absorbency,
tensile index, density, air to cellulose ratio, entrapment
of bound water (water which can not be removed by
pressing), and swelling upon wetting of the resulting
sponges formed from cellulose regenerated from a viscose
rayon solution. Sodium sulfate decahydrate crystals were
used as the pore forming media. Various amounts of
softwood fibers and hardwood fibers were incorporated into
the sponge matrix and the final properties were recorded as
a function of fiber content. Unrefined bleached softwood
Kraft pulp from James River Corporation was used to produce
the viscose solution as well as to provide the softwood
reinforcement fibers. Unrefined bleached hardwood Kraft
pulp, also from James River, was used as the hardwood
reinforcement fiber.
3.1 Preparation and Properties of Pulps
The degree of polymerization (DP) of the softwood pulp used
for viscose production was determined for reference in
31
future studies and so that it could be compared to the DP
of the final regenerated cellulose. After determining the
air dry moisture content of the pulp using a Metler Toledo
Moisture Balance, the cupriethylenediamine (CED) viscosity
of the pulp was determined according to TAPPI Standard T
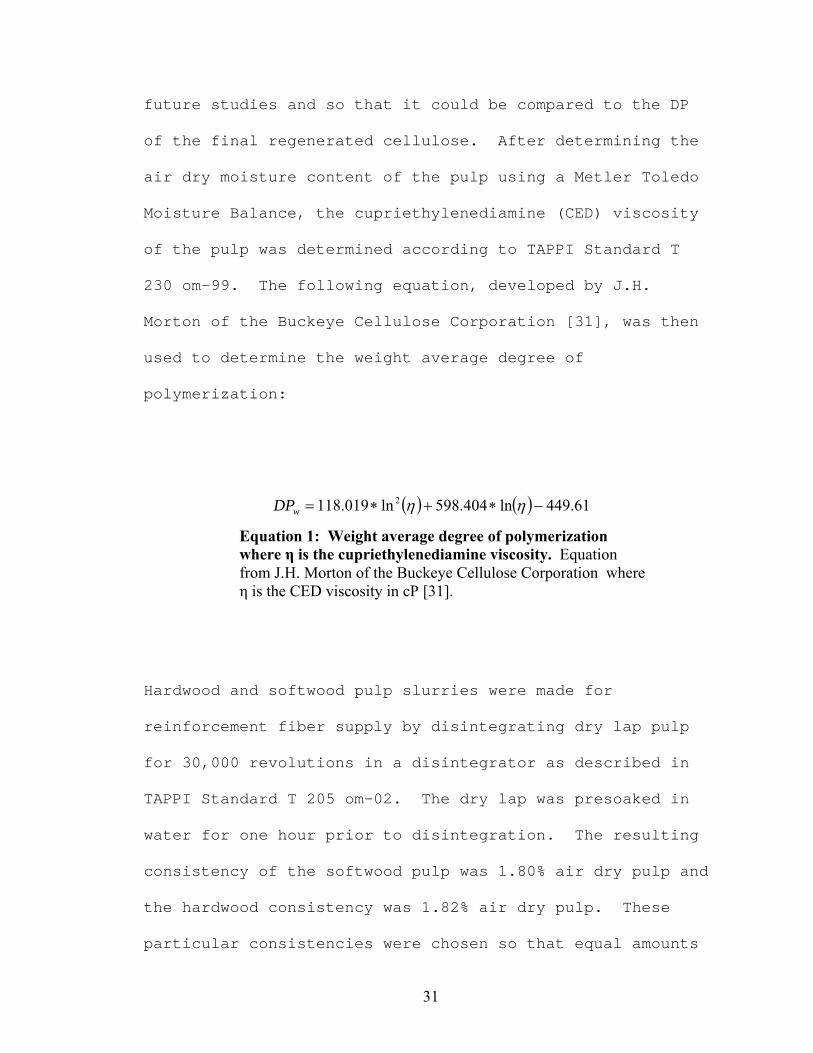
230 om-99. The following equation, developed by J.H.
Morton of the Buckeye Cellulose Corporation [31], was then
used to determine the weight average degree of
polymerization:
( ) ( ) 61.449ln404.598ln019.118 2 −∗+∗= ηηwDP
Equation 1: Weight average degree of polymerization where η is the cupriethylenediamine viscosity. Equation from J.H. Morton of the Buckeye Cellulose Corporation where η is the CED viscosity in cP [31].
Hardwood and softwood pulp slurries were made for
reinforcement fiber supply by disintegrating dry lap pulp
for 30,000 revolutions in a disintegrator as described in
TAPPI Standard T 205 om-02. The dry lap was presoaked in
water for one hour prior to disintegration. The resulting
consistency of the softwood pulp was 1.80% air dry pulp and
the hardwood consistency was 1.82% air dry pulp. These
particular consistencies were chosen so that equal amounts
32
of slurry could be added for hardwood as for softwood for a
given oven dry fiber content in the final sponge after
accounting for the residual moisture in the air dry pulp.
Small portions of each slurry were further diluted to
proper conditions for a measurement of the length weighted
average fiber length using a Fiber Quality Analyzer.
3.2 Viscose Preparation
The procedure that follows was developed based on the
procedures described in Table I. The aforementioned
softwood dry lap was used for the viscose preparation.
3.2.1 Steeping
Sheets of softwood dry lap pulp were soaked in 19.0 wt%
aqueous sodium hydroxide for 3 hours at room temperature to
form alkali cellulose. The total air dry mass of the pulp
was 20.1 grams.
3.2.2 Pressing and shredding
The soaked sheets of dry lap were pressed between numerous
sheets of blotter paper until a press ratio of 4.25 was
obtained, where the press ratio is defined as the ratio of
alkali cellulose mass to the original mass of the dry pulp.
33
The pressed alkali cellulose was then shredded in an IKA
M20 Universal Grinder until a breadcrumb-like appearance
was obtained.
3.2.3 Aging (Mercerization)
The breadcrumb-like alkali cellulose was exposed to room
temperature air for 50 hours.
3.2.4 Xanthation
Carbon disulfide was added to the mercerized pulp at a
ratio of 1 mL CS2 per gram of oven dry pulp. The resulting
mixture was shaken by hand for 30 seconds to ensure some CS2
was absorbed by all the mercerized cellulose. Nearly all
the CS2 liquid was absorbed. The container was then shaken
for 3 hours at room temperature using Lab-Line Orbit Shaker
at 250 rpm. This agitation ensured continuous diffusion of
the CS2 through the mercerized cellulose.
3.2.5 Dissolving and ripening
A dilute sodium hydroxide solution was added to the
xanthated cellulose such that the final solution
concentration would be 8 wt% cellulose and ~8 wt% sodium
hydroxide accounting for the sodium hydroxide already
present from the preparation of the mercerized pulp. The
34
lignin content of the wood pulp was disregarded and the
pulp was considered to be 100% cellulose. The resulting
mixture was 8.0 wt% cellulose, 8.3 wt% NaOH, 10.1 wt% CS2
(amount initially present, not the unreacted amount), and
73.6 wt% water. This mixture was then shaken on the Lab-
Line Orbit Shaker for 1 hour at room temperature and
subsequently stirred with an IKA RW20 mixer until a
homogeneous mixture existed. The mixture was left at room
temperature overnight to ripen to complete dissolution.
The solution was then stored in a freezer for until ready
for use.
3.3 Viscose Viscosity
In order to obtain some sort of characterization of the
viscose viscosity for future reference, a Grace M3500
Viscometer was used. Only a small amount of viscose was
available for viscosity testing after foam production, so
it was necessary to dilute the viscose to a ratio of 8:1
water:viscose to meet the minimum volume requirements for
the viscometer. The viscosity test took place at 72° F and
a shear rate of 100 s-1.
35
3.4 Sodium Sulfate Crystallization
To obtain the necessary crystals of sodium sulfate
decahydrate, anhydrous sodium sulfate powder was dissolved
in water at 90° C under agitation until the solubility
limit was reached. The heat was then turned off and the
solution was allowed to cool to room temperature under
constant agitation. Once room temperature was reached, an
ice batch was used to further reduce the temperature of
this supersaturated solution. Agitation was continued
until the solution became cloudy. Once the crystals
reached an appropriate size, the agitation was stopped and
the solution was immediately filtered using vacuum
filtration. The resulting crystals were stored in a sealed
container in a refrigerator to prevent reversion to the
anhydrous form.
3.5 Cellulose Sponge Formation
The paste necessary for cellulose sponge formation was
produced based on the formulation described by Stieg for
the production of a regenerated cellulose sponge containing
no filler [23]. Sponges were made such that the final dry
cellulose content of the sponge was either 0% fiber, 10%
hardwood fiber, 20% hardwood fiber, 10% softwood fiber, or
20% softwood fiber with the remainder of the cellulose in
36
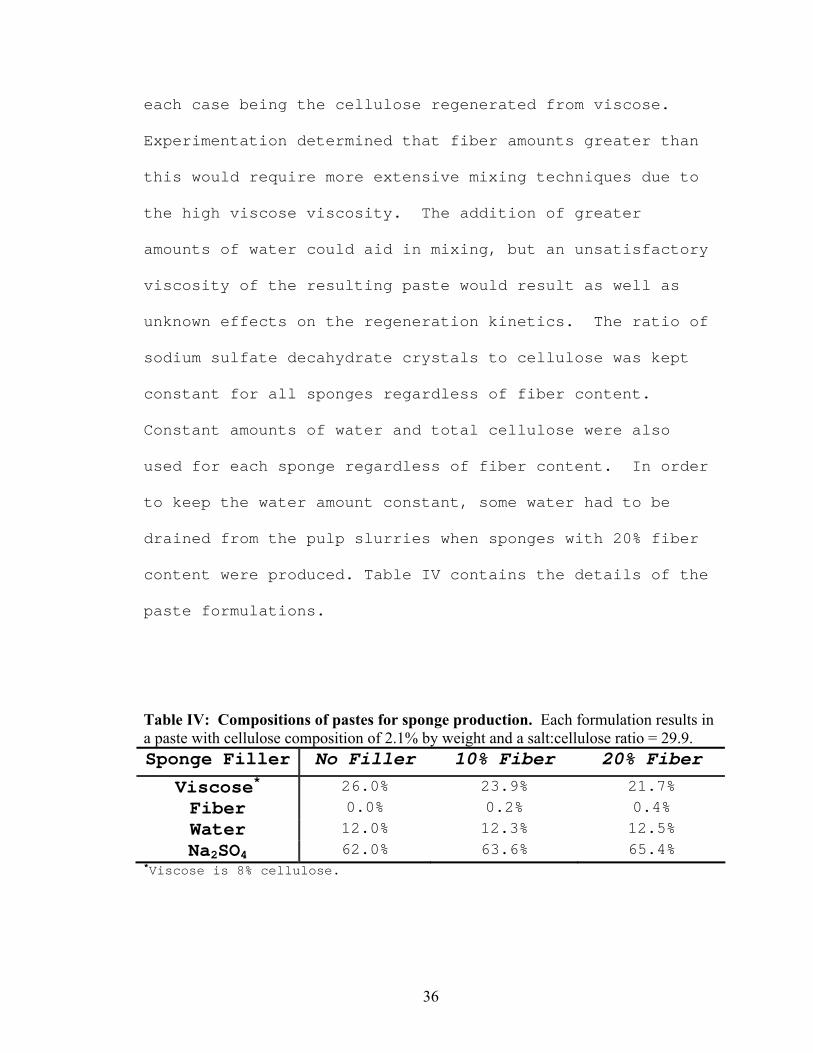
each case being the cellulose regenerated from viscose.
Experimentation determined that fiber amounts greater than
this would require more extensive mixing techniques due to
the high viscose viscosity. The addition of greater
amounts of water could aid in mixing, but an unsatisfactory
viscosity of the resulting paste would result as well as
unknown effects on the regeneration kinetics. The ratio of
sodium sulfate decahydrate crystals to cellulose was kept
constant for all sponges regardless of fiber content.
Constant amounts of water and total cellulose were also
used for each sponge regardless of fiber content. In order
to keep the water amount constant, some water had to be
drained from the pulp slurries when sponges with 20% fiber
content were produced. Table IV contains the details of the
paste formulations.
Table IV: Compositions of pastes for sponge production. Each formulation results in a paste with cellulose composition of 2.1% by weight and a salt:cellulose ratio = 29.9. Sponge Filler No Filler 10% Fiber 20% Fiber
Viscose* 26.0% 23.9% 21.7% Fiber 0.0% 0.2% 0.4% Water 12.0% 12.3% 12.5% Na2SO4 62.0% 63.6% 65.4%
*Viscose is 8% cellulose.
37
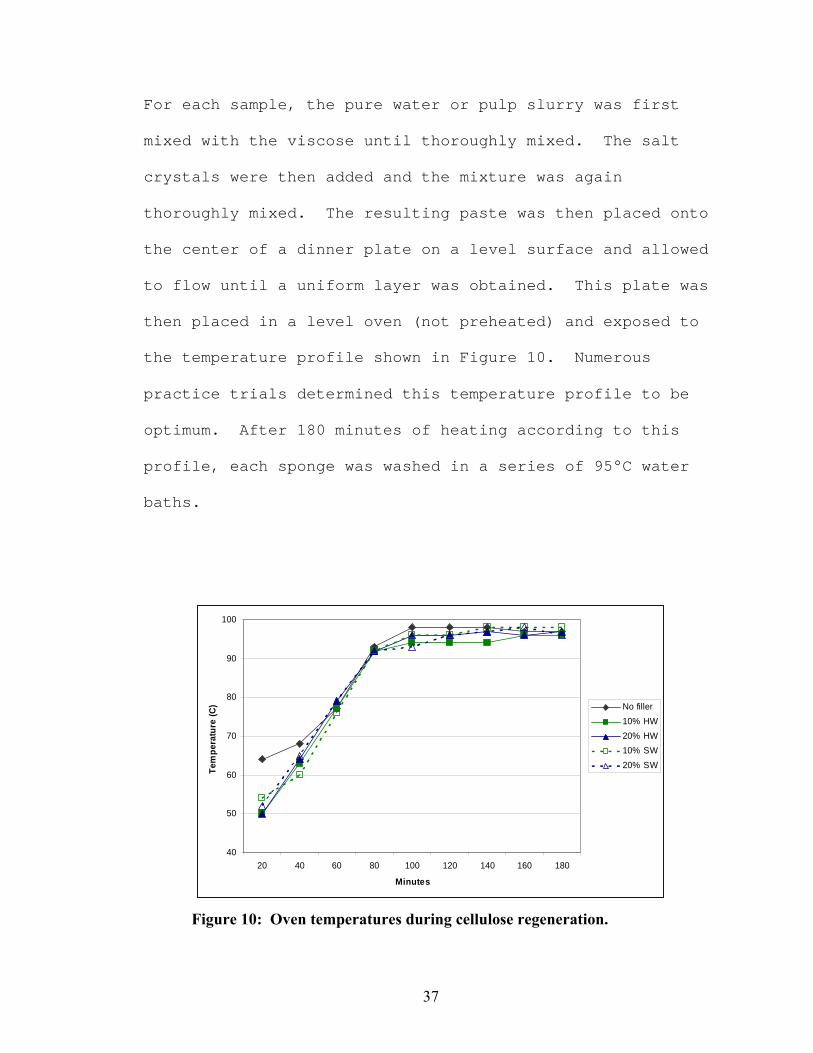
For each sample, the pure water or pulp slurry was first
mixed with the viscose until thoroughly mixed. The salt
crystals were then added and the mixture was again
thoroughly mixed. The resulting paste was then placed onto
the center of a dinner plate on a level surface and allowed
to flow until a uniform layer was obtained. This plate was
then placed in a level oven (not preheated) and exposed to
the temperature profile shown in Figure 10. Numerous
practice trials determined this temperature profile to be
optimum. After 180 minutes of heating according to this
profile, each sponge was washed in a series of 95°C water
baths.
40
50
60
70
80
90
100
20 40 60 80 100 120 140 160 180
Minutes
Tem
pera
ture
(C) No filler
10% HW20% HW10% SW20% SW
Figure 10: Oven temperatures during cellulose regeneration.
38
3.6 Sponge testing
After the sponges were air-dried to a constant weight, they
underwent a series of tests to characterize their
absorbency, tensile index, density, air to cellulose ratio,
entrapment of bound water, and swelling upon wetting. The
air to cellulose ratio and the tensile index were tested
with sponge material in the “bound water state” in order to
obtain test samples of similar moisture content for each
type of sponge. Bound water is defined as the water within
the sponge that can not be removed from pressing alone.
Evaporation is the only way to remove the water that is
bound into the sponge. This state was chosen over the dry
state since most, if not all, sponge applications will
involve moisture in the sponge. The bound water state was
obtained by wetting the samples to saturation, pressing the
wet samples by hand, and then further pressing between
blotter paper using a handsheet press at 15 psi for one
minute. Experimentation determined this pressure and
duration to be adequate for removal of all unbound water
without any permanent deformation of the sample.
3.6.1 Air to cellulose ratio
The air to cellulose ratio was determined for the sponge
material in the bound water state. One square inch of each
39
sponge type was scanned into a monochrome bitmap file where
all open space was represented by black pixels and the
cellulose area was represented by white pixels. The
resulting bitmap was converted into a JPEG file format
which had a pixel array of 1050 x 1050. A computer program
was then developed in the Jython programming language in
order to count the number of black pixels present in the
image. The program returned the total number of black
pixels present in the 1050 x 1050 pixel array and the ratio
of black pixels to white pixels was calculated as a measure
of the air to cellulose ratio. This test was completed for
both sides of each sponge, and the average was assumed to
be representative of the interior. The values were later
verified by the ‘count black/white pixels’ function in the
UTHSCSA Image Tool 3.00 image analysis program. The air to
cellulose ratio found in this manner is not necessarily an
absolute number since variation may occur when converting
the image to black and white. The value may in fact be
dependent on the scanner and computer used. This method is
adequate for comparison purposes, however, as long as the
same scanner, computer, and system settings are used for
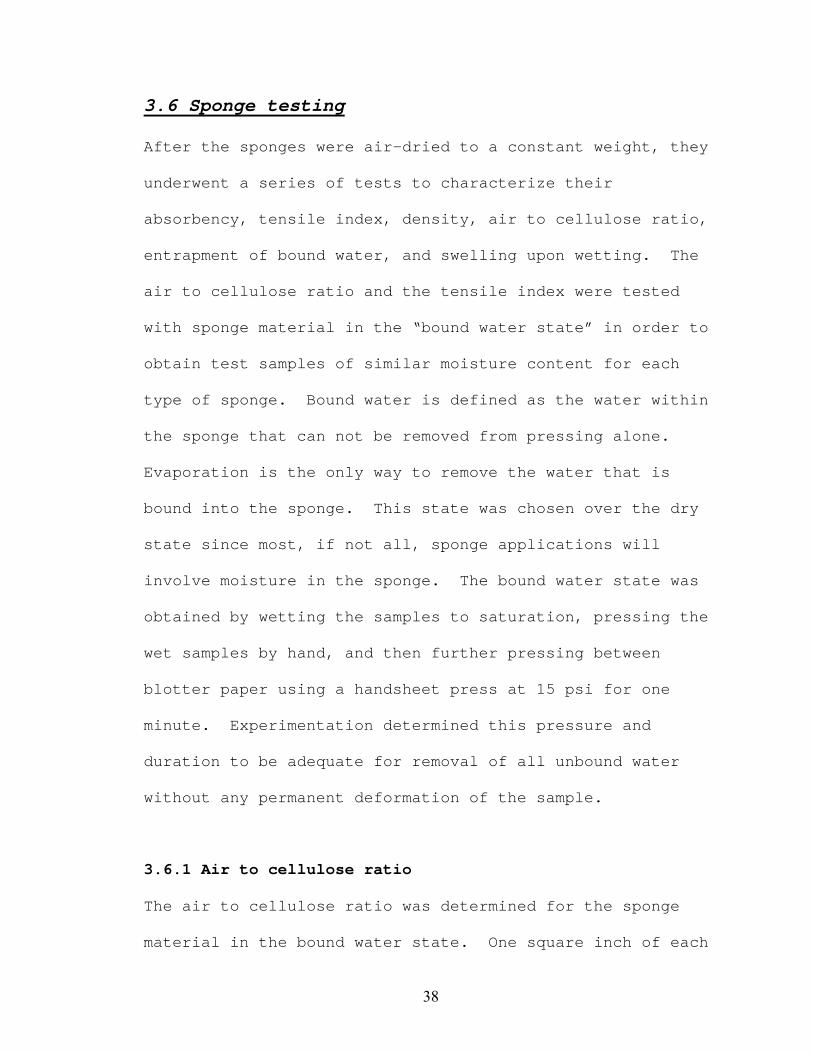
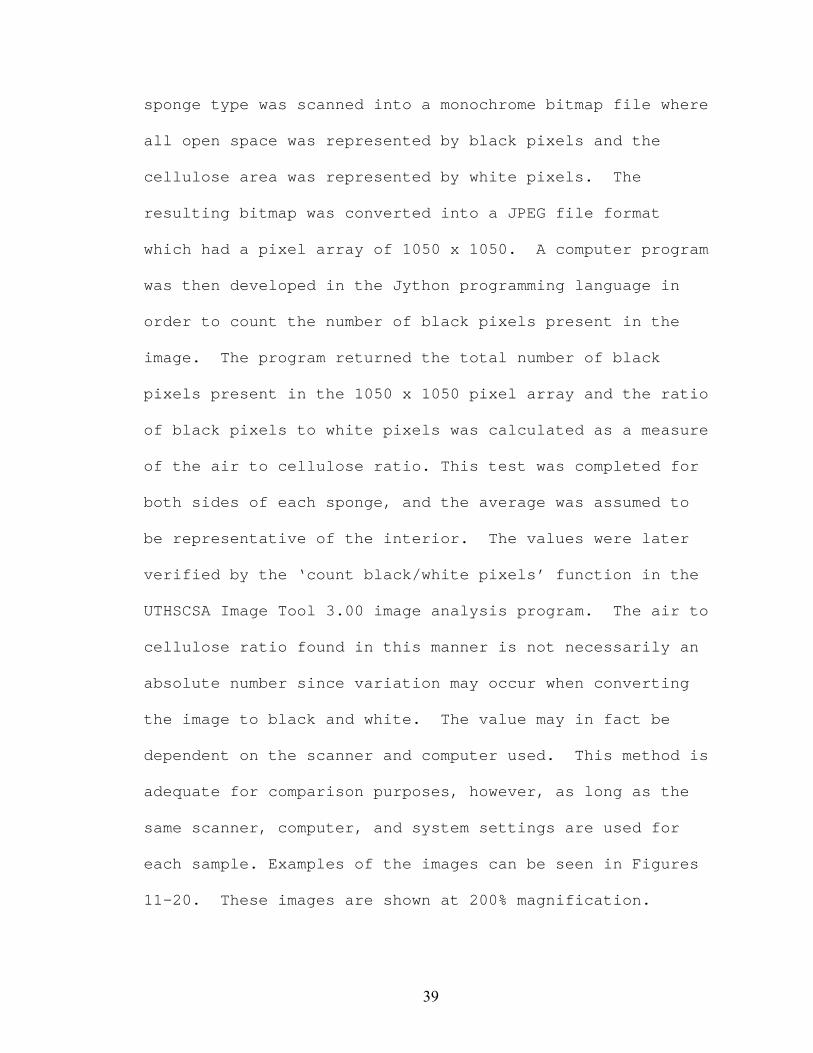
each sample. Examples of the images can be seen in Figures
11-20. These images are shown at 200% magnification.
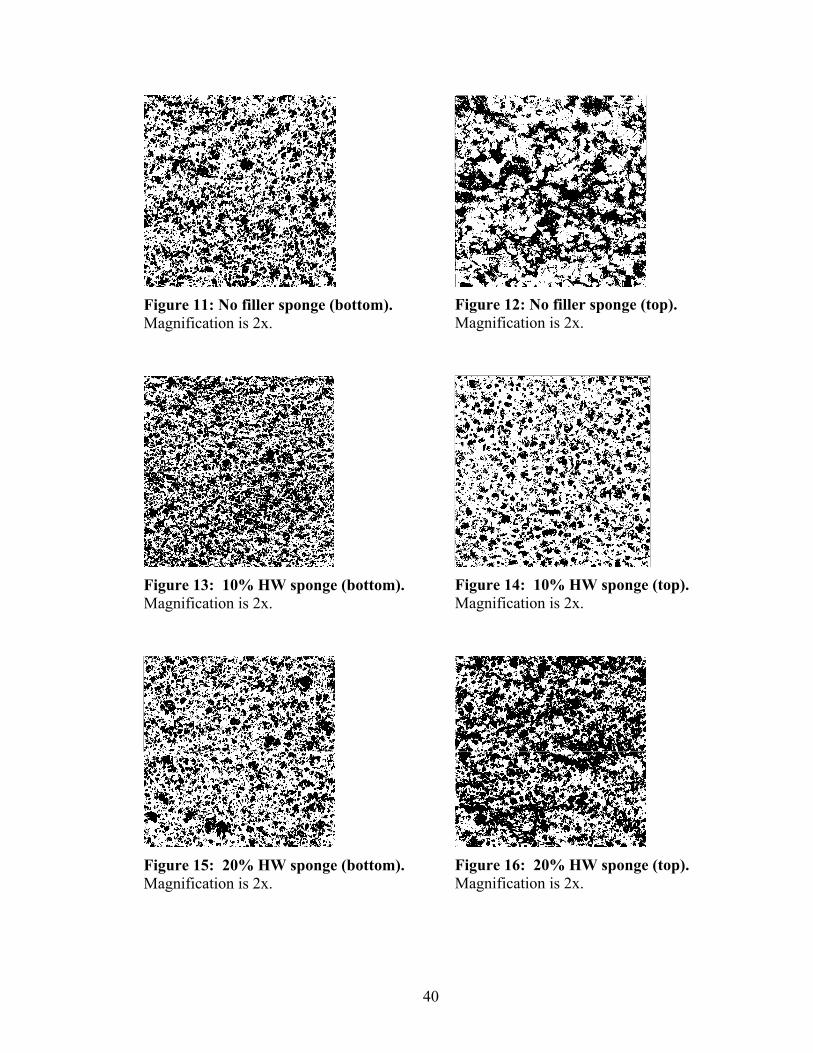
40
Figure 11: No filler sponge (bottom). Magnification is 2x.
Figure 13: 10% HW sponge (bottom). Magnification is 2x.
Figure 15: 20% HW sponge (bottom). Magnification is 2x.
Figure 12: No filler sponge (top). Magnification is 2x.
Figure 14: 10% HW sponge (top). Magnification is 2x.
Figure 16: 20% HW sponge (top). Magnification is 2x.
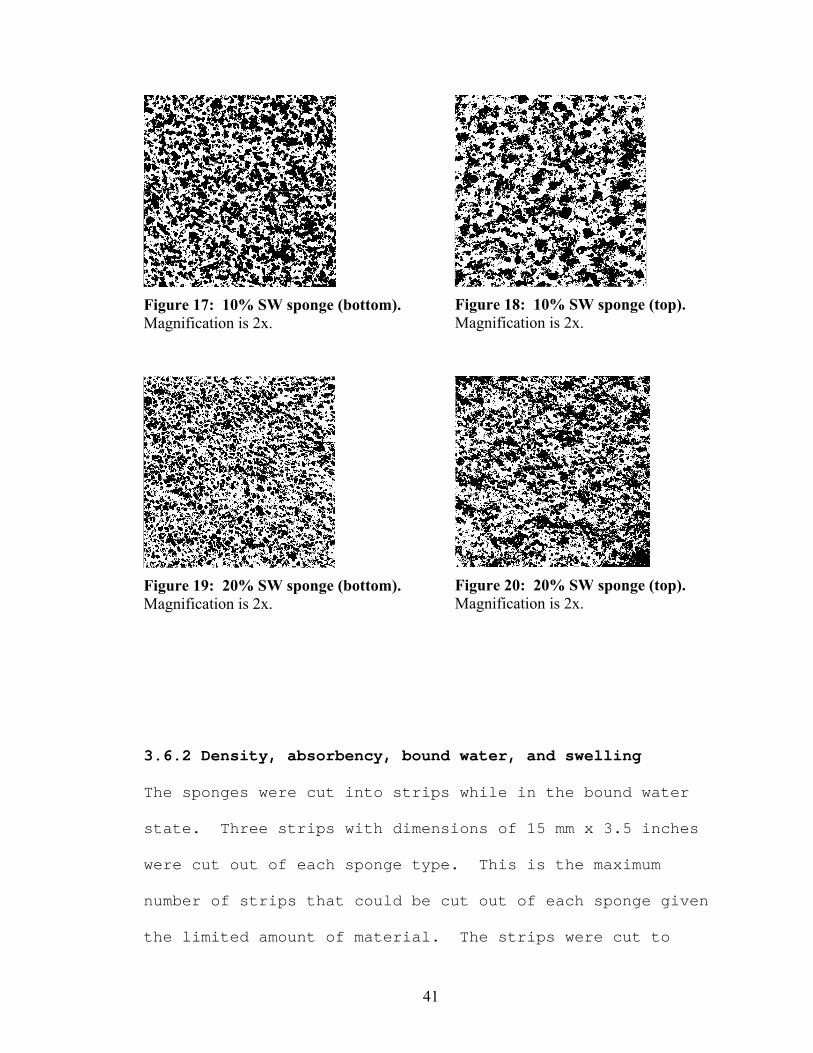
41
Figure 17: 10% SW sponge (bottom). Magnification is 2x.
Figure 19: 20% SW sponge (bottom). Magnification is 2x.
Figure 18: 10% SW sponge (top). Magnification is 2x.
Figure 20: 20% SW sponge (top). Magnification is 2x.
3.6.2 Density, absorbency, bound water, and swelling
The sponges were cut into strips while in the bound water
state. Three strips with dimensions of 15 mm x 3.5 inches
were cut out of each sponge type. This is the maximum
number of strips that could be cut out of each sponge given
the limited amount of material. The strips were cut to
42
these particular dimensions while in the bound water state
so that the same strips could later be used for tensile
testing. The mass of each strip was recorded so that the
mass of bound water could be determined by comparing this
mass to the dry mass. The strips were then allowed to air
dry between flat surfaces of minimal weight to prevent
curling upon drying. Once dry, the caliper was determined
using a hand-held manual micrometer to prevent compression,
which returned a value in thousandths of an inch. The
length and width data were also recorded along with the
mass for dry volume and density determination.
After the dry state data was collected, the strips were
submerged into a graduated cylinder for 15 seconds each and
then removed. The volume change in the graduated cylinder
was then used as an indicator of absorbance rate. The
strips were then submerged in water for 5 minutes. Once
removed, the mass and dimensions were measured for
determination of absorbency and swelling. The strips were
then pressed back to their bound water state for tensile
testing.
43
3.6.3 Tensile testing
Tensile tests were conducted using the 15 mm wide strips in
their bound water state. An Instron 4400R was used with an
initial jaw separation of 2 inches and a crosshead speed of
0.5000 inches per minute. The tensile index was calculated
using the maximum load and the grammage of the sponge
material in its bound water state.
3.6.4 Regenerated cellulose DP
A small portion of the sponge containing no filler was used
to determine the degree of polymerization (DP) of the
regenerated cellulose so that it could be compared to DP of
the original softwood pulp. The cupriethylenediamine (CED)
viscosity method described in TAPPI Standard T 230 om-99
was again used along with Equation 1, on page 31, to
determine the DP.
44
CHAPTER 4
RESULTS, DISCUSSION, AND CONCLUSIONS
4.1 Raw Materials
The viscose used in the preparation of the cellulose foam
was produced with a softwood pulp with a weight average
degree of polymerization of approximately 2750.
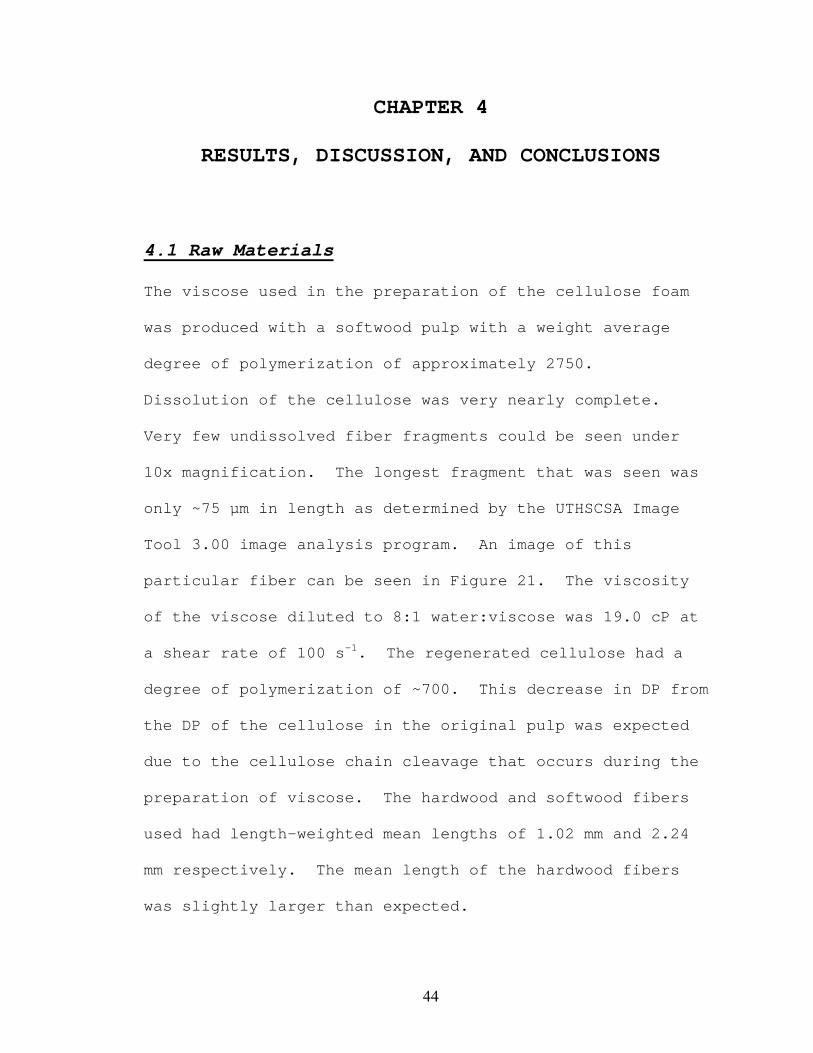
Dissolution of the cellulose was very nearly complete.
Very few undissolved fiber fragments could be seen under
10x magnification. The longest fragment that was seen was
only ~75 µm in length as determined by the UTHSCSA Image
Tool 3.00 image analysis program. An image of this
particular fiber can be seen in Figure 21. The viscosity
of the viscose diluted to 8:1 water:viscose was 19.0 cP at
a shear rate of 100 s-1. The regenerated cellulose had a
degree of polymerization of ~700. This decrease in DP from
the DP of the cellulose in the original pulp was expected
due to the cellulose chain cleavage that occurs during the
preparation of viscose. The hardwood and softwood fibers
used had length-weighted mean lengths of 1.02 mm and 2.24
mm respectively. The mean length of the hardwood fibers
was slightly larger than expected.
45
Figure 21: Photo of undissolved fiber fragment at 10x magnification. Picture is 415 µm wide and the undissolved fiber is ~75 µm in length.
4.2 Sponge Results
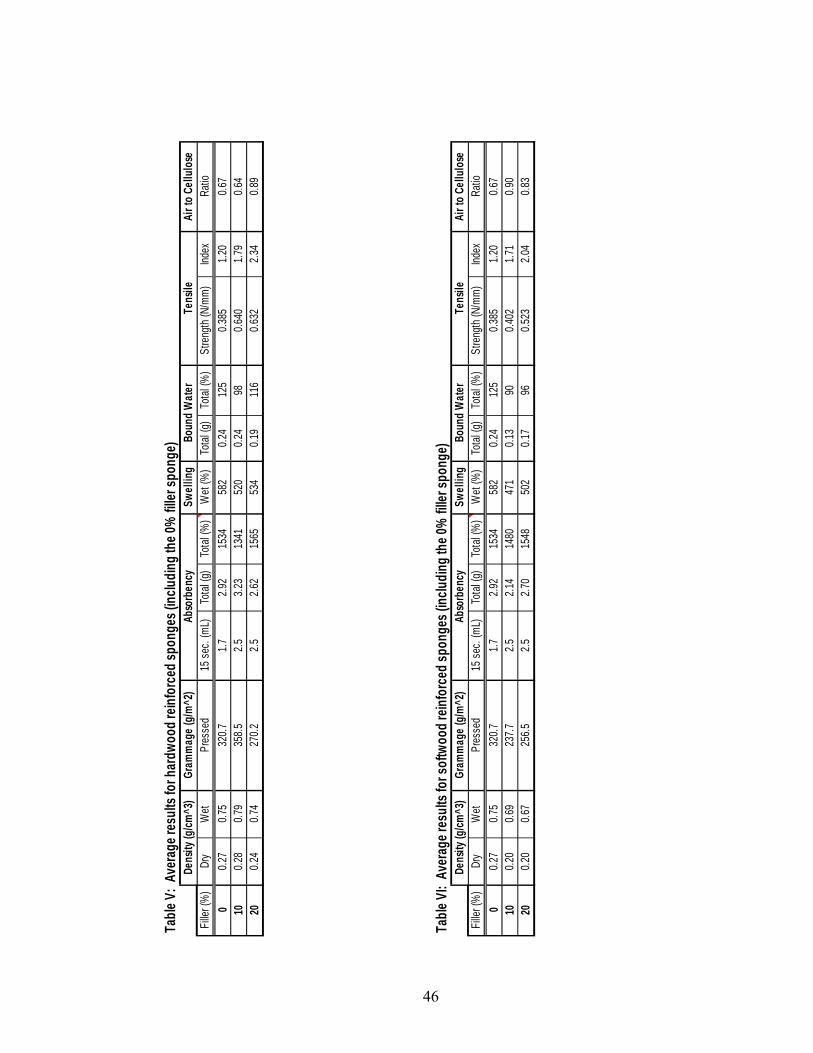
Tables V and VI contain summaries of the average results
for the hardwood reinforced and softwood reinforced sponges
respectively. Statistical analysis of the data was done at
a 5% significance level. This significance level means
that if that if two means are determined to be
statistically different, there is only a 5% chance that
they are actually equal, and that the difference actual
comes from experimental error.
4.2.1 Air to cellulose ratio and dry density
The air to cellulose ratio average was determined by
averaging the result of the two sides of the sponges. The
top sides generally had a greater air to cellulose ratio
than the bottom sides, which was initially unexpected since
46
Table
V: A
vera
ge re
sults
for h
ardw
ood r
einfo
rced
spon
ges (
includ
ing th
e 0%
filler
spon
ge)
Gram
mag
e (g
/m^2
)Sw
ellin
gAi
r to
Cellu
lose
Filler
(%)
Dry
Wet
Pres
sed
15 se
c. (m
L)To
tal (g
)To
tal (%
)W
et (%
)To
tal (g
)To
tal (%
)St
rength
(N/m
m)Ind
exRa
tio0
0.27
0.75
320.7
1.72.9
215
3458
20.2
412
50.3
851.2
00.6
710
0.28
0.79
358.5
2.53.2
313
4152
00.2
498
0.640
1.79
0.64
200.2
40.7
427
0.22.5
2.62
1565
534
0.19
116
0.632
2.34
0.89
Table
VI:
Aver
age r
esult
s for
softw
ood r
einfo
rced
spon
ges (
includ
ing th
e 0%
filler
spon
ge)
Gram
mag
e (g
/m^2
)Sw
ellin
gAi
r to
Cellu
lose
Filler
(%)
Dry
Wet
Pres
sed
15 se
c. (m
L)To
tal (g
)To
tal (%
)W
et (%
)To
tal (g
)To
tal (%
)St
rength
(N/m
m)Ind
exRa
tio0
0.27
0.75
320.7
1.72.9
215
3458
20.2
412
50.3
851.2
00.6
710
0.20
0.69
237.7
2.52.1
414
8047
10.1
390
0.402
1.71
0.90
200.2
00.6
725
6.52.5
2.70
1548
502
0.17
960.5
232.0
40.8
3
Dens
ity (g
/cm^3
)Ab
sorb
ency
Boun
d W
ater
Tens
ile
Dens
ity (g
/cm^3
)Ab
sorb
ency
Boun
d W
ater
Tens
ile
47
some pore forming crystals typically settled towards the
bottom before the initial coagulation of the cellulose.
After further examination, however, the top surfaces appear
to have larger, more irregular pores, as can be seen in
Figures 11-20. This phenomenon makes sense since the
gases released during regeneration escape from the top
causing these large pores. The air to cellulose ratios of
the fiber-containing sponges were about 20-35% greater than
that of the sponge with no filler. The 10% hardwood
specimen did not follow this trend, but that is likely due
to the fact that a low porosity cellulose skin formed on
the top layer of this sponge resulting in a very low air to
cellulose ratio. This skin layer is evident in Figure 13
and also explains why this specimen does not fit some other
trends.
The dry density results also correlate with the air to
cellulose ratios. The densities of the fiber-containing
sponges are statistically lower than the no-filler sponge,
except in the case of the 10% hardwood sponge, due to the
skin on the top layer. The hardwood fiber sponges have
statistically higher densities at a given fiber content
than the softwood fiber sponges. The amount of fiber only
affects the density in the hardwood sponges according to
48
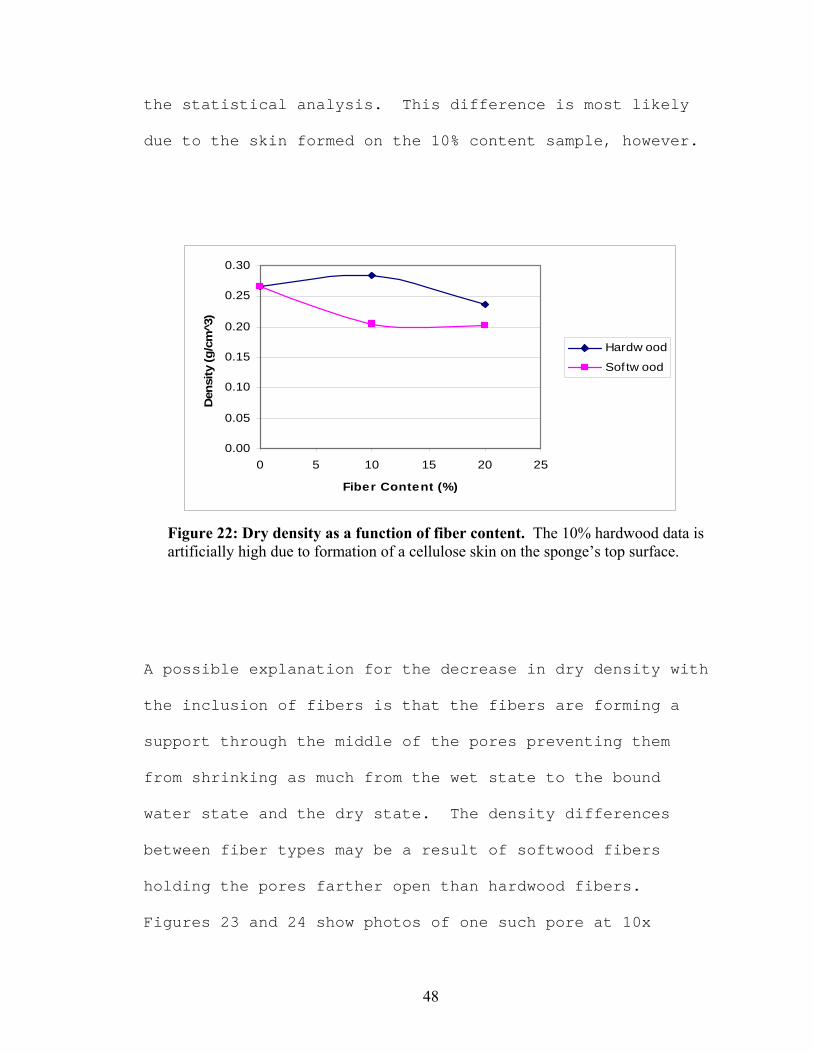
the statistical analysis. This difference is most likely
due to the skin formed on the 10% content sample, however.
0.00
0.05
0.10
0.15
0.20
0.25
0.30
0 5 10 15 20 25
Fiber Content (%)
Den
sity
(g/c
m3̂)
Hardw ood
Softw ood
Figure 22: Dry density as a function of fiber content. The 10% hardwood data is artificially high due to formation of a cellulose skin on the sponge’s top surface.
A possible explanation for the decrease in dry density with
the inclusion of fibers is that the fibers are forming a
support through the middle of the pores preventing them
from shrinking as much from the wet state to the bound
water state and the dry state. The density differences
between fiber types may be a result of softwood fibers
holding the pores farther open than hardwood fibers.
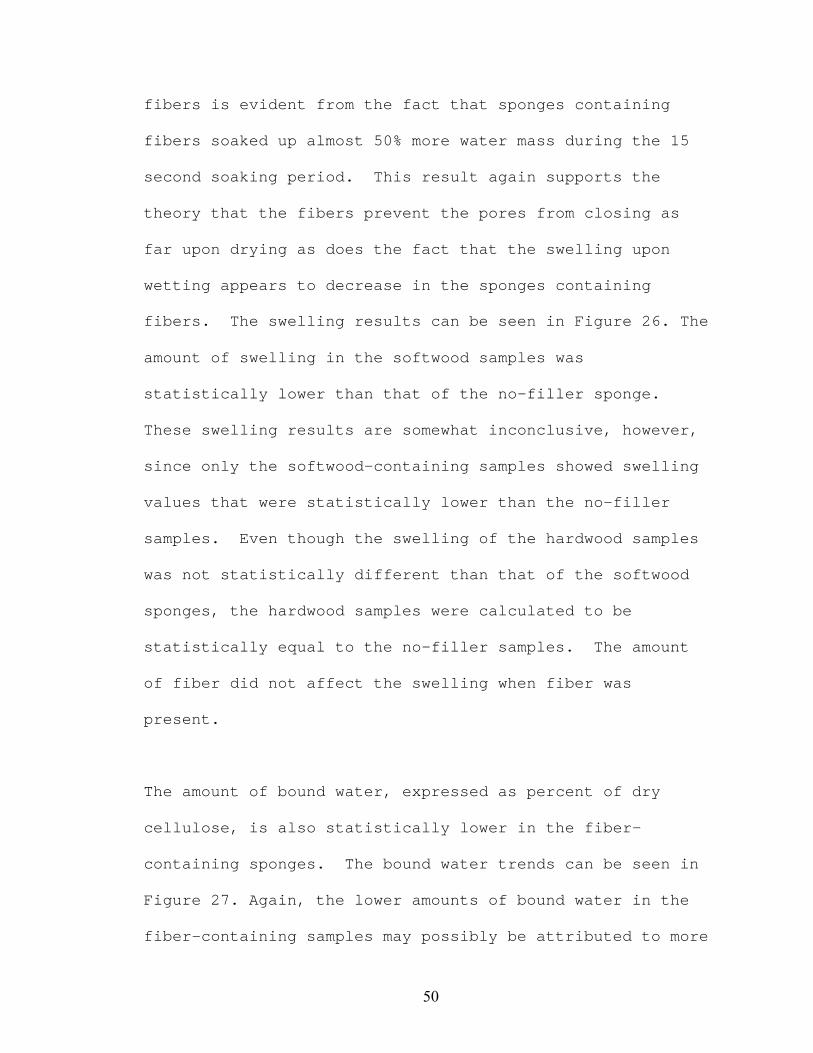
Figures 23 and 24 show photos of one such pore at 10x
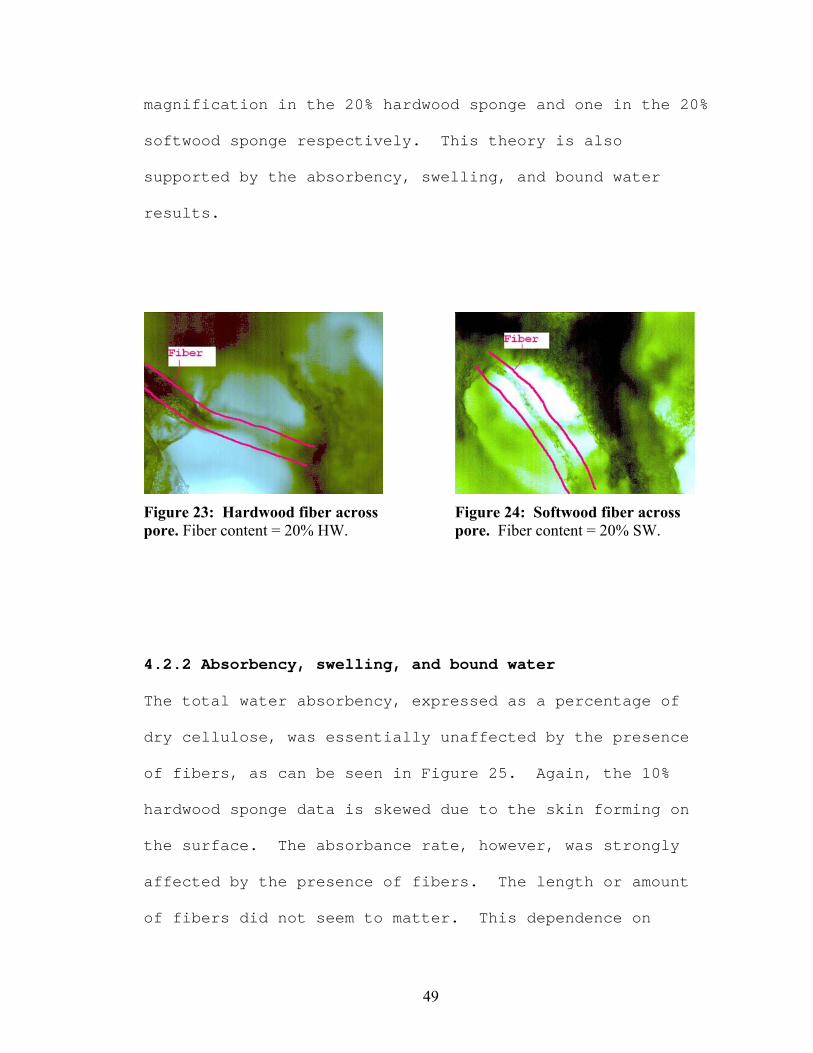
49
magnification in the 20% hardwood sponge and one in the 20%
softwood sponge respectively. This theory is also
supported by the absorbency, swelling, and bound water
results.
Figure 23: Hardwood fiber across pore. Fiber content = 20% HW.
Figure 24: Softwood fiber across pore. Fiber content = 20% SW.
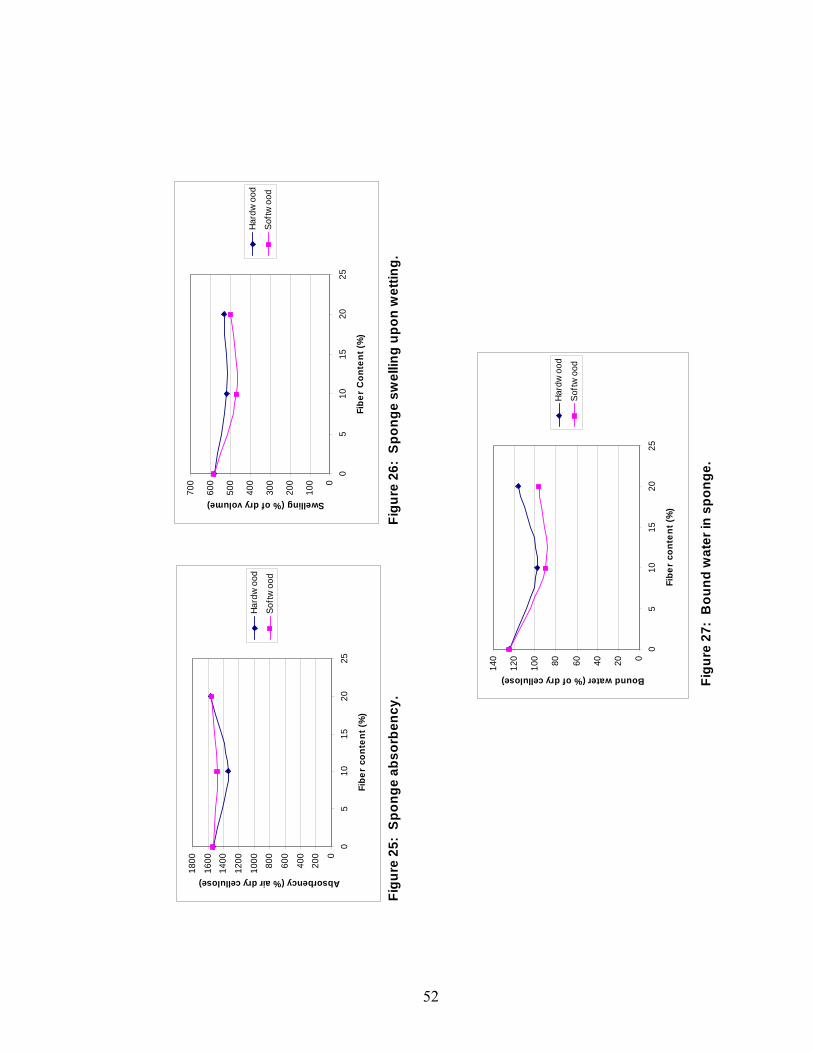
4.2.2 Absorbency, swelling, and bound water
The total water absorbency, expressed as a percentage of
dry cellulose, was essentially unaffected by the presence
of fibers, as can be seen in Figure 25. Again, the 10%
hardwood sponge data is skewed due to the skin forming on
the surface. The absorbance rate, however, was strongly
affected by the presence of fibers. The length or amount
of fibers did not seem to matter. This dependence on
50
fibers is evident from the fact that sponges containing
fibers soaked up almost 50% more water mass during the 15
second soaking period. This result again supports the
theory that the fibers prevent the pores from closing as
far upon drying as does the fact that the swelling upon
wetting appears to decrease in the sponges containing
fibers. The swelling results can be seen in Figure 26. The
amount of swelling in the softwood samples was
statistically lower than that of the no-filler sponge.
These swelling results are somewhat inconclusive, however,
since only the softwood-containing samples showed swelling
values that were statistically lower than the no-filler
samples. Even though the swelling of the hardwood samples
was not statistically different than that of the softwood
sponges, the hardwood samples were calculated to be
statistically equal to the no-filler samples. The amount
of fiber did not affect the swelling when fiber was
present.
The amount of bound water, expressed as percent of dry
cellulose, is also statistically lower in the fiber-
containing sponges. The bound water trends can be seen in
Figure 27. Again, the lower amounts of bound water in the
fiber-containing samples may possibly be attributed to more
51
open pores in these sponges. The pores in the no-fiber
sponge may close enough during compression that water is
held within the matrix by capillary forces within these
small pores. It should also be noted that the bound water
percentage is statistically higher for the hardwood-
containing sponge than the softwood-containing sponge at
20% content. This difference is likely due to the amount
of bound water within the fibers themselves. The 10%
hardwood samples did not contain statistically different
amounts of bound water than the 10% softwood samples, but
the hardwood results were artificially lowered due to the
skin effect.
52
Figu
re 2
5: S
pong
e ab
sorb
ency
.Fi
gure
26:
Spo
nge
swel
ling
upon
wet
ting.
Figu
re 2
7: B
ound
wat
er in
spo
nge.
0
200
400
600
800
1000
1200
1400
1600
1800
05
1015
2025
Fibe
r co
nten
t (%
)
Absorbency (% air dry cellulose)
Hard
woo
d
Softw
ood
0
100
200
300
400
500
600
700
05
1015
2025
Fibe
r C
onte
nt (%
)
Swelling (% of dry volume)
Hard
woo
d
Softw
ood
020406080100
120
140
05
1015
2025
Fibe
r co
nten
t (%
)
Bound water (% of dry cellulose)
Hard
woo
d
Softw
ood
53
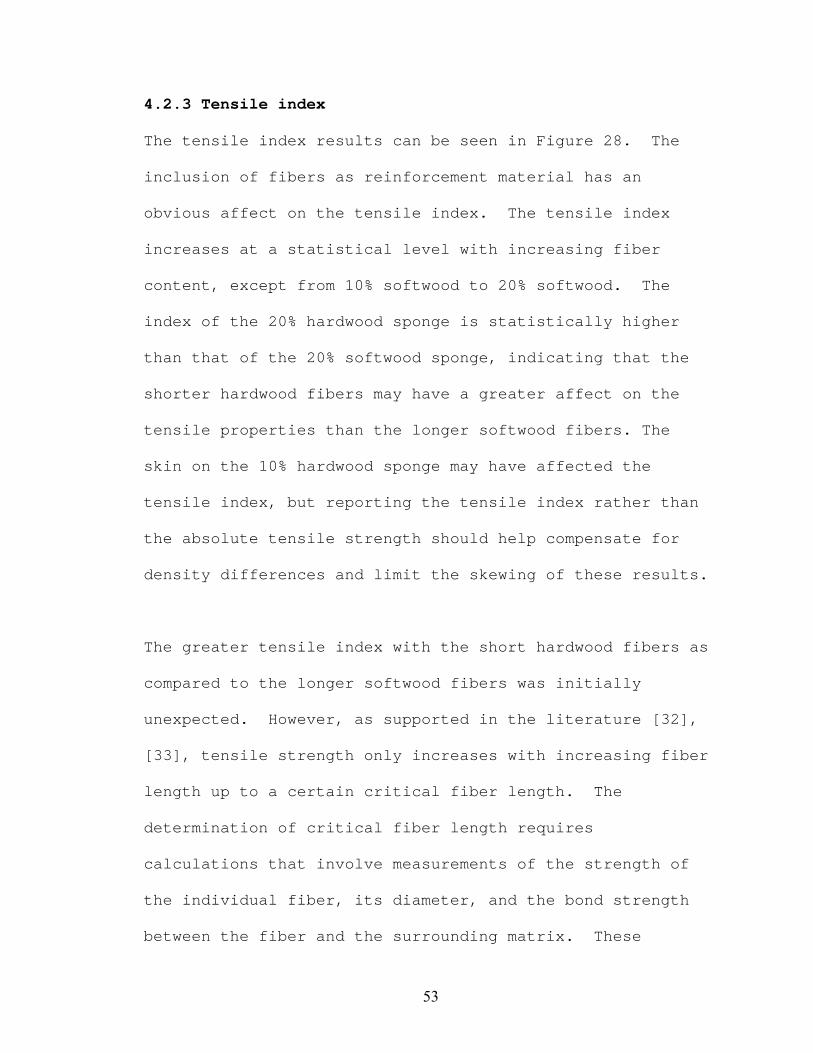
4.2.3 Tensile index
The tensile index results can be seen in Figure 28. The
inclusion of fibers as reinforcement material has an
obvious affect on the tensile index. The tensile index
increases at a statistical level with increasing fiber
content, except from 10% softwood to 20% softwood. The
index of the 20% hardwood sponge is statistically higher
than that of the 20% softwood sponge, indicating that the
shorter hardwood fibers may have a greater affect on the
tensile properties than the longer softwood fibers. The
skin on the 10% hardwood sponge may have affected the
tensile index, but reporting the tensile index rather than
the absolute tensile strength should help compensate for
density differences and limit the skewing of these results.
The greater tensile index with the short hardwood fibers as
compared to the longer softwood fibers was initially
unexpected. However, as supported in the literature [32],
[33], tensile strength only increases with increasing fiber
length up to a certain critical fiber length. The
determination of critical fiber length requires
calculations that involve measurements of the strength of
the individual fiber, its diameter, and the bond strength
between the fiber and the surrounding matrix. These
54
measurements are outside the scope of this particular
project, but the data suggest that the critical fiber
length may fall somewhere between the hardwood fiber length
and the softwood fiber length assuming similar fiber
strengths, diameters, and interfacial bonding. The
difference may be a result of differences in hardwood and
softwood properties themselves rather than the actual
length of the fibers, however. The greater tensile index
for a given hardwood content may also be higher than that
of the same softwood content since more hardwood fibers are
present. This larger number of fibers increases the
probability that cracks propagating as a result of the
tensile stress would be bridged by a fiber.
0.00
0.50
1.00
1.50
2.00
2.50
0 5 10 15 20 25
Fiber content (%)
Tens
ile In
dex
(N*m
/g)
Hardw ood
Softw ood
Figure 28: Sponge tensile index.
55
4.3 Discussion and conclusions
The initial laboratory work uncovered many roadblocks to
the production of consistent foam samples. Initial
practice samples of various geometries showed severe
nonuniformity in the finished sponge due to settling of the
pore forming crystals before adequate coagulation took
place. A large number of practice trials were completed
before a suitable method and sample geometry were developed
for final foam preparation. The thin, flat geometry used
in the final foam preparation, along with the heating
profile that was used, minimized pore settling and uneven
heating of the paste during regeneration. Once this
roadblock was overcome, samples of suitable uniformity
could be produced. The low porosity skin that developed on
the top of the 10% hardwood sponge sample did not initially
seem like it was severe enough to have much affect on the
results. In retrospect, this sample should have been
redone. The data from this sample initially seemed to fit
into the trends, however, so the data were kept. During
final preparation of the data, a formula error was noticed
in the spreadsheet used to calculate many of the final
properties, and it then became obvious that the 10%
hardwood data was quite skewed. However, it is still
reasonable to conclude from these results that:
56
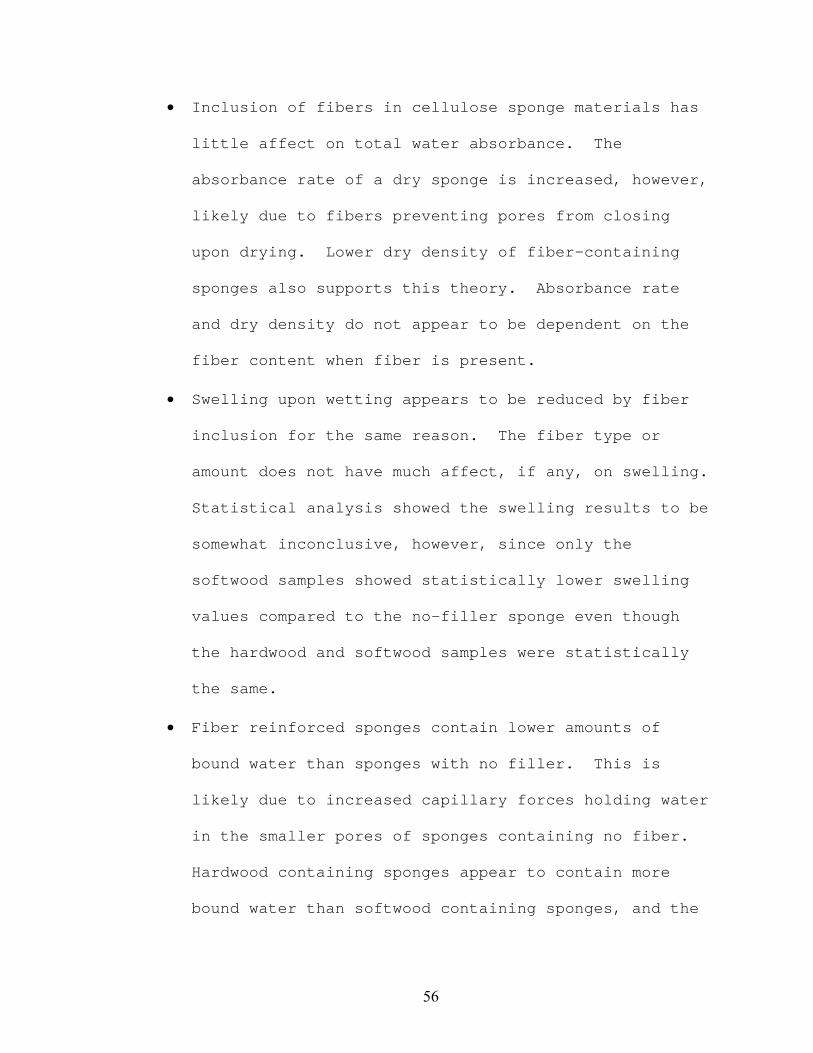
• Inclusion of fibers in cellulose sponge materials has
little affect on total water absorbance. The
absorbance rate of a dry sponge is increased, however,
likely due to fibers preventing pores from closing
upon drying. Lower dry density of fiber-containing
sponges also supports this theory. Absorbance rate
and dry density do not appear to be dependent on the
fiber content when fiber is present.
• Swelling upon wetting appears to be reduced by fiber
inclusion for the same reason. The fiber type or
amount does not have much affect, if any, on swelling.
Statistical analysis showed the swelling results to be
somewhat inconclusive, however, since only the
softwood samples showed statistically lower swelling
values compared to the no-filler sponge even though
the hardwood and softwood samples were statistically
the same.
• Fiber reinforced sponges contain lower amounts of
bound water than sponges with no filler. This is
likely due to increased capillary forces holding water
in the smaller pores of sponges containing no fiber.
Hardwood containing sponges appear to contain more
bound water than softwood containing sponges, and the
57
amount of fiber does not appear to affect the bound
water content when fiber is present.
• Inclusion of reinforcement fiber increases the tensile
index of the resulting sponge. The index increases
with increasing fiber content, and hardwood fibers
appear to provide more reinforcement.
58
CHAPTER 5
FUTURE
There are many aspects of cellulose sponges that can be
investigated in future work. The inclusion of comminuted
cellulose in the sponge matrix along with reinforcing
fibers could result in great control over the final
properties of the sponge. Also, the alternate methods
mentioned like infrared heating and electric currents may
minimize the problem of crystal migration in the paste.
These methods allow for quicker coagulation time while
still maintaining even heating of the sample. More work
should be done to determine if the apparent increase in
tensile strength for hardwood fibers over softwood fibers
is a result of the properties of the fibers themselves, or
if it due to the fiber length or number of fibers.
There is also much more work to be done involving biomass-
based polyurethane foams. While only low concentrations of
dissolved wood can be achieved, biomass concentrations of
50% have been successfully used for polyurethane foam
production by dissolving wood and starch together. A
biomass loading of 50% will still have a large affect on

59
biodegradability and landfill space. Polyurethane foam
production does not seem to have much potential as a use
for wastepaper or wood wastes, however.
60
REFERENCES
1. Nishino, T., Matsuda, I., Hirao, K., All-Cellulose Composite, Macromolecules, v. 37, 7683-7687, 2004.
2. Yaoguang, Y., Yoshioka, M., Shiraishi, N., Water-
Absorbing Polyurethane Foams from Liquefied Starch, Jour. of Appl. Poly. Sci., v. 60, 1939-1949, 1996.
3. Yaoguang, Y., Yoshioka, M., Shiraishi, N., Combined
Liquefaction of Wood and Starch in a Polyethylene Glycol/Glycerin Blended Solvent, Mokuzai Gakkaishi, v. 39, no. 8, 930-938, 1993.
4. Swatloski, R.P., Spear, S.K., Holbrey, J.D., Rogers,
R.D., Dissolution of Cellulose with Ionic Liquids, J. Am. Chem. Soc., v. 124, no. 8, 4974-4975, 2002.
5. Trotman, S.R., Trotman, E.R., Artificial Silks, Charles
Griffin and Company, Ltd., London, 1931. 6. Laskiewicz, B., Wcislo, P., Cuculo, J.A., Fibers Made
From Concentrated Viscose Solutions, Jour. Of Appl. Poly. Sci., v. 46, n. 3, 445-448, 1992.
7. Mobarak, F., Nada, A.M., Fahmy, Y., Activation of
Cellulose Towards Xanthation, Cellulose Chemistry and Technology, v. 16, n.4, 415-420, 1982.
8. Qunhui Sun et al, personal contact. 9. Wheeler, W., The Manufacture of Artificial Silk,
Chapman & Hall, Ltd., London, 1931. 10. http://www.fibersource.com/f-tutor/rayon.htm 11. Koo, Y.S., Wang, Y.S., You, S.H., Kim, H.D.,
Preparation and Properties of Chemical Cellulose from Ascidian Tunic and Their Regenerated Cellulose Fibers, Jour. Of Appl. Poly. Sci., v. 85, 1634-1643, 2002.
12. Fink, H.P., Weigel, P., Ganster, J., Structure
formation of regenerated cellulose materials from NMMO solutions, Progress in Polymer Sci., v. 26, 1473-1524, 2001.
61
13. Hartman, S., Polyurethane Foams from the Reaction of Bark and Diisocyanate, Wood Technology: Chemical Aspects, American Chemical Society, 257-269, 1977.
14. Kurimoto, Y., Doi, S., Tamura, Y., Species Effects on
Wood-Liquefaction in Polyhydric Alcohols, Holzforschung, v. 53, 617-622, 1999.
15. Kurimoto, Y., Shirakawa, K., Yoshioka, M., Shiraishi,
N., Liquefaction of Untreated Wood With Polyhydric Alcohols and Its Application to Polyurethane Foams, Chemical Modification of Lignocellulosics, FRI Bulletin No. 176, 163-172, 1992.
16. Yao, Y., Yoshioka, M., Shiraishi, N., Rigid
Polyurethane Foams from Combined Liquefaction of Wood and Starch, Mokuzai Gakkaishi, v. 41, no. 7, 659-668, 1995.
17. Rozman, H.D., Tay, G.S., Abusamah, A., The Effect of
Glycol Type, Glycol Mixture, and Isocyanate/Glycol Ratio on Flexural Properties of Oil Palm Empty Fruit Bunch-Polyurethane Composites, Journ. of Wood Chem. and Tech., v. 23, Nos. 3 & 4, 249-260, 2003.
18. Kurimoto, Y., Takeda, M., Koizumi, A., Yamauchi, S.,
Doi, S., Tamura, Y., Mechanical Properties of Polyurethane Films Prepared From Liquefied Wood With Polymeric MDI, Bioresource Technology, V. 74, 151-157, 2000.
19. Ge, J., Zhong, W., Guo, Z., Li, W., Sakai, K.,
Biodegradable Polyurethane Materials from Bark and Starch. I. Highly Resilient Foams, Jour. Of Appl. Poly. Sci., v. 77, 2575-2580, 2000.
20. Lee, S., Teramoto, Y., Shiraishi, N., Biodegradable
Polyurethane Foam From Liquefied Waste Paper and Its Thermal Stability, Biodegradability, and Genotoxicity, Jour. Of Appl. Poly. Sci., v. 83, 1482-1489, 2002.
21. Stieg, F., US Patent 2,880,726, 1954. 22. Stieg, F., US Patent 3,261,704, 1966. 23. Stieg, F., US Patent 3,382,303, 1968.
62
24. http://www.mindfully.org/Plastic/Cellulose/Rayon-Fiber.htm.
25. Parekh, et al, US Patent 5,358,679, 1994. 26. Martson, M., Viljanto, J., Hurme, T., Laippala, P.,
Saukko, P., Is Cellulose Sponge Degradable or Stable As Implantation Material? An In Vivo Subcutaneous Study in the Rat, Biomaterials, v. 20, 1989-1995, 1999.
27. Martson, M., Viljanto, J. Laippala, P., Saukko, P.,
Connective Tissue Formation in Subcutaneous Cellulose Sponge Implants in the Rat, European Surgery Research, v. 30, 419-425, 1998.
28. Pekarek, F., US Patent 2,899,704, 1959. 29. Chevalier, C., Chanzy, H., Wertz, J., US Patent
6,129,867, 2000. 30. I.G. Fairbenindustriis A Itie Ngesellschaft, British
Patent GB435128, 1935. 31. Morton, J.H., Viscosity/DP Relations for Cellulose
Dissolved in Cuprammonium and Cupriethylenediamine Solvents, The Chemistry and Processing of Wood and Plant Fibrous Materials, Woodhead Publishing Ltd., 151-158, 1996.
32. Kalaprasad, G., Francis, B., Thomas, Se., Kumar, C.,
Pavithran, C., Groeninckx, G., Thomas, Sa., Effect of Fibre Length and Chemical Modifications on the Tensile Properties of Intimately Mixed Short Sisal/Glass Hybrid Fibre Reinforced Low Density Polyethylene Composites, Polymer International, v. 53, 1624-1638, 2004.
33. Yang, Z., Zhao, B., Qin, S., Hu, Z., Jin, Z., Wang, J.,
Study on the Mechanical Properties of Hybrid Reinforced Rigid Polyurethane Composite Foam, Jour. Of Appl. Poly. Sci., v. 92, 1493-1500, 2004.