Biodegradable Poly(DL-lactide-co-glycolide) (PLGA) - MDPI
30
Citation: Gögele, C.; Müller, S.; Belov, S.; Pradel, A.; Wiltzsch, S.; Lenhart, A.; Hornfeck, M.; Kerling, V.; Rübling, A.; Kühl, H.; et al. Biodegradable Poly(D-L-lactide-co-glycolide) (PLGA)-Infiltrated Bioactive Glass (CAR12N) Scaffolds Maintain Mesenchymal Stem Cell Chondrogenesis for Cartilage Tissue Engineering. Cells 2022, 11, 1577. https://doi.org/10.3390/ cells11091577 Academic Editors: Karina Theresa Wright and Charlotte Hulme Received: 28 February 2022 Accepted: 3 May 2022 Published: 7 May 2022 Publisher’s Note: MDPI stays neutral with regard to jurisdictional claims in published maps and institutional affil- iations. Copyright: © 2022 by the authors. Licensee MDPI, Basel, Switzerland. This article is an open access article distributed under the terms and conditions of the Creative Commons Attribution (CC BY) license (https:// creativecommons.org/licenses/by/ 4.0/). cells Article Biodegradable Poly(D-L-lactide-co-glycolide) (PLGA)-Infiltrated Bioactive Glass (CAR12N) Scaffolds Maintain Mesenchymal Stem Cell Chondrogenesis for Cartilage Tissue Engineering Clemens Gögele 1,2 , Silvana Müller 3 , Svetlana Belov 3 , Andreas Pradel 3 , Sven Wiltzsch 3 , Armin Lenhart 3 , Markus Hornfeck 3 , Vera Kerling 3 , Achim Rübling 3 , Hannes Kühl 3 , Kerstin Schäfer-Eckart 4 , Bernd Minnich 5 , Thomas Martin Weiger 2 and Gundula Schulze-Tanzil 1, * 1 Institute of Anatomy and Cell Biology, Paracelsus Medical University, Nuremberg and Salzburg, 90419 Nuremberg, Germany; [email protected] 2 Department of Biosciences and Medical Biology, Paris Lodron University Salzburg, 5020 Salzburg, Austria; [email protected] 3 Faculty of Materials Science, Technische Hochschule Nürnberg Georg Simon Ohm, 90489 Nuremberg, Germany; [email protected] (S.M.); [email protected] (S.B.); [email protected] (A.P.); [email protected] (S.W.); [email protected] (A.L.); [email protected] (M.H.); [email protected] (V.K.); [email protected] (A.R.); [email protected] (H.K.) 4 Bone marrow Transplantation Unit, Medizinische Klinik 5, Klinikum Nürnberg, Paracelsus Medizinische Privatuniversität, 90419 Nuremberg, Germany; [email protected] 5 Department of Environment & Biodiversity, Paris Lodron University Salzburg, 5020 Salzburg, Austria; [email protected] * Correspondence: [email protected]; Tel.: +49-911-398-(11) (ext. 6772); Fax: +49-911-398-6774 Abstract: Regeneration of articular cartilage remains challenging. The aim of this study was to increase the stability of pure bioactive glass (BG) scaffolds by means of solvent phase polymer in- filtration and to maintain cell adherence on the glass struts. Therefore, BG scaffolds either pure or enhanced with three different amounts of poly(D-L-lactide-co-glycolide) (PLGA) were characterized in detail. Scaffolds were seeded with primary porcine articular chondrocytes (pACs) and human mes- enchymal stem cells (hMSCs) in a dynamic long-term culture (35 days). Light microscopy evaluations showed that PLGA was detectable in every region of the scaffold. Porosity was greater than 70%. The biomechanical stability was increased by polymer infiltration. PLGA infiltration did not result in a decrease in viability of both cell types, but increased DNA and sulfated glycosaminoglycan (sGAG) contents of hMSCs-colonized scaffolds. Successful chondrogenesis of hMSC-colonized scaffolds was demonstrated by immunocytochemical staining of collagen type II, cartilage proteoglycans and the transcription factor SOX9. PLGA-infiltrated scaffolds showed a higher relative expression of cartilage related genes not only of pAC-, but also of hMSC-colonized scaffolds in comparison to the pure BG. Based on the novel data, our recommendation is BG scaffolds with single infiltrated PLGA for cartilage tissue engineering. Keywords: bioactive glass; CAR12N; cartilage regeneration; polymer infiltration; chondrogenesis 1. Introduction Articular cartilage covers the surface of joints, allows smooth sliding motions between two joint bodies, and provides uniform pressure distribution on the subchondral bone in response to joint loading through its unique viscoelasticity [1]. This is primarily accom- plished by the highly specific and exquisitely organized cartilage extracellular matrix (ECM), Cells 2022, 11, 1577. https://doi.org/10.3390/cells11091577 https://www.mdpi.com/journal/cells
-
Upload
khangminh22 -
Category
Documents
-
view
1 -
download
0
Transcript of Biodegradable Poly(DL-lactide-co-glycolide) (PLGA) - MDPI

Citation: Gögele, C.; Müller, S.; Belov,
S.; Pradel, A.; Wiltzsch, S.; Lenhart,
A.; Hornfeck, M.; Kerling, V.; Rübling,
A.; Kühl, H.; et al. Biodegradable
Poly(D-L-lactide-co-glycolide)
(PLGA)-Infiltrated Bioactive Glass
(CAR12N) Scaffolds Maintain
Mesenchymal Stem Cell
Chondrogenesis for Cartilage Tissue
Engineering. Cells 2022, 11, 1577.
https://doi.org/10.3390/
cells11091577
Academic Editors: Karina
Theresa Wright
and Charlotte Hulme
Received: 28 February 2022
Accepted: 3 May 2022
Published: 7 May 2022
Publisher’s Note: MDPI stays neutral
with regard to jurisdictional claims in
published maps and institutional affil-
iations.
Copyright: © 2022 by the authors.
Licensee MDPI, Basel, Switzerland.
This article is an open access article
distributed under the terms and
conditions of the Creative Commons
Attribution (CC BY) license (https://
creativecommons.org/licenses/by/
4.0/).
cells
Article
Biodegradable Poly(D-L-lactide-co-glycolide)(PLGA)-Infiltrated Bioactive Glass (CAR12N) ScaffoldsMaintain Mesenchymal Stem Cell Chondrogenesis forCartilage Tissue EngineeringClemens Gögele 1,2 , Silvana Müller 3, Svetlana Belov 3, Andreas Pradel 3, Sven Wiltzsch 3, Armin Lenhart 3,Markus Hornfeck 3, Vera Kerling 3, Achim Rübling 3, Hannes Kühl 3 , Kerstin Schäfer-Eckart 4, Bernd Minnich 5,Thomas Martin Weiger 2 and Gundula Schulze-Tanzil 1,*
1 Institute of Anatomy and Cell Biology, Paracelsus Medical University, Nuremberg and Salzburg,90419 Nuremberg, Germany; [email protected]
2 Department of Biosciences and Medical Biology, Paris Lodron University Salzburg, 5020 Salzburg, Austria;[email protected]
3 Faculty of Materials Science, Technische Hochschule Nürnberg Georg SimonOhm, 90489 Nuremberg, Germany; [email protected] (S.M.);[email protected] (S.B.); [email protected] (A.P.);[email protected] (S.W.); [email protected] (A.L.);[email protected] (M.H.); [email protected] (V.K.);[email protected] (A.R.); [email protected] (H.K.)
4 Bone marrow Transplantation Unit, Medizinische Klinik 5, Klinikum Nürnberg,Paracelsus Medizinische Privatuniversität, 90419 Nuremberg, Germany;[email protected]
5 Department of Environment & Biodiversity, Paris Lodron University Salzburg, 5020 Salzburg, Austria;[email protected]
* Correspondence: [email protected]; Tel.: +49-911-398-(11) (ext. 6772); Fax: +49-911-398-6774
Abstract: Regeneration of articular cartilage remains challenging. The aim of this study was toincrease the stability of pure bioactive glass (BG) scaffolds by means of solvent phase polymer in-filtration and to maintain cell adherence on the glass struts. Therefore, BG scaffolds either pure orenhanced with three different amounts of poly(D-L-lactide-co-glycolide) (PLGA) were characterizedin detail. Scaffolds were seeded with primary porcine articular chondrocytes (pACs) and human mes-enchymal stem cells (hMSCs) in a dynamic long-term culture (35 days). Light microscopy evaluationsshowed that PLGA was detectable in every region of the scaffold. Porosity was greater than 70%.The biomechanical stability was increased by polymer infiltration. PLGA infiltration did not result ina decrease in viability of both cell types, but increased DNA and sulfated glycosaminoglycan (sGAG)contents of hMSCs-colonized scaffolds. Successful chondrogenesis of hMSC-colonized scaffolds wasdemonstrated by immunocytochemical staining of collagen type II, cartilage proteoglycans and thetranscription factor SOX9. PLGA-infiltrated scaffolds showed a higher relative expression of cartilagerelated genes not only of pAC-, but also of hMSC-colonized scaffolds in comparison to the pureBG. Based on the novel data, our recommendation is BG scaffolds with single infiltrated PLGA forcartilage tissue engineering.
Keywords: bioactive glass; CAR12N; cartilage regeneration; polymer infiltration; chondrogenesis
1. Introduction
Articular cartilage covers the surface of joints, allows smooth sliding motions betweentwo joint bodies, and provides uniform pressure distribution on the subchondral bone inresponse to joint loading through its unique viscoelasticity [1]. This is primarily accom-plished by the highly specific and exquisitely organized cartilage extracellular matrix (ECM),
Cells 2022, 11, 1577. https://doi.org/10.3390/cells11091577 https://www.mdpi.com/journal/cells
Cells 2022, 11, 1577 2 of 30
formed by a few (1.4 × 10⁴ cells/ mm3) specialized cartilage cells (chondrocytes) [2,3]. Themajor components in hyaline joint cartilage include collagen types II, VI, IX, XI, sulphatedglycosaminoglycans (sGAG), the water-binding cartilage proteoglycan (PG) aggrecan andstructural proteins such as cartilage oligomeric matrix protein (COMP) and matrilin 1and 3 [1]. Due to the facts that the chondrocytes are only supplied by diffusion from thesynovial fluid with no direct blood access, hyaline cartilage is bradytrophic and lacks bloodor lymphatic vessels and nerves [2,4,5]. One can assume that this also greatly reduces theability of cartilage to regenerate since it is vulnerable to multiple harmful factors such astrauma, overloading, aging and inflammation [6]. One of the most common late sequelaeof cartilage injuries is the chronic joint disease posttraumatic osteoarthritis (OA), for whichthere are still no cures that could interfere with the etiopathogenesis of OA and thus alterits natural course [7–9]. For this reason, autologous chondrocyte implantation (ACI) ormatrix-associated chondrocyte implantation (MACI) are used to counteract the progress-ing inflammatory response induced by cartilage defects [10–15]. The MACI is a newertechnique in which chondrocytes were colonized in a three-dimensional (3D) arrangementand the matrix serves as a cell carrier, protecting them from mechanical overloading [16].Despite the very encouraging results obtained so far, also in the long-term studies [17–20],some limitations remain, such as the extensive costs particularly for the cell preparation [21],two surgical procedures required [22] and the loss of the specific cellular phenotype duringexpansion in vitro [23,24]. Senescence [25] and dedifferentiation [23,24] of cells must beprevented. When mesenchymal stem cells (derived from the bone marrow (B), adipose tis-sue (A), synovium (S), or periosteum (P)) are used, successful chondrogenic differentiationshould occur and senescence [26] as well as hypertrophy be prevented [27–29]. For thisreason, materials should be used for cartilage tissue engineering that provide incentives forcells to adhere, survive, proliferate, and build up a new and specific mechano-competentECM [30–32]. Such stimuli are, on the one hand the geometric structure (three dimensional[3D] topology) and thus, the corresponding interconnective porosity and permeability ofthe scaffolds to enable cell immigration and nutrition [30,33] and, on the other hand, therelease of bioactive molecules (e.g., growth factors, peptides and essential amino acids) [34]or ions [35]. Bioactive glasses (BG) were developed for this reason, to cause a release ofdifferent ions over time stimulating the cells. While the first bioactive glasses describedby L. Hench were developed primarily for bone regeneration, today there are a varietyof bioactive glasses with different ion compositions available that can also be used forother tissue applications including nerve, skin and cartilage regeneration [36–39]. Theadvantage of BG is not only the temporal degradation rate in vitro or in vivo but also theeasy processability, which depends on the ion composition [40].
However, a decisive disadvantage of BG compared to many other materials is thatthey can be very brittle [41]. The brittleness does not only depend on the ion compo-sition, but also on the topology, e.g., distribution of the pores, the strut thickness inthe case of scaffolds and the overall porosity. In order to meet both, the cellular re-quirements by means of bioactivity and porosity on the one hand and to withstand thebiomechanical conditions in the body on the other hand, so-called composite materialswere developed [41,42]. Composites of BG and diverse synthetic polymers (polycaprolac-tone (PCL) [43], poly(ethylene glycol) (PEG) [44], poly(glycolic acid) (PGE) [45], polylactidacid (PLA) [46], poly (D-L-lactide-co-glycolide) (PLGA) [47] Poly(L-lactide) (PLLA) [48]and many more) have been proven to be suitable as bioactive carriers for different celltypes due to their good biomechanical properties, high biocompatibility, non-toxicity andbiological integrity.
In this study, a composite cartilage scaffold was developed by combining a newlypatented BG (CAR12N) [49] with PLGA utilizing a novel and simple solvent phase infiltra-tion based approach to integrate a sponge of PLGA into a 100% BG scaffold by maintaininghigh porosity. The objective of this work was to evaluate the distribution of the polymer,and the associated change in porosity. Cytotoxicity of the scaffolds was assessed in orderto subsequently achieve a long-term culture of up to 35 days with articular chondrocytes

Cells 2022, 11, 1577 3 of 30
and mesenchymal stem cells (MSCs) as chondrogenic cells. Quantitative measurementsof DNA and metabolic activity allowed conclusions to be drawn about the maintenanceof proliferation, while the synthesis of sGAGs and expression of cartilage related extracel-lular matrix proteins provided ECM formation of the cells. Furthermore, the progress ofchondrogenesis in the newly developed composite scaffold was evaluated by relative geneexpression of the most prominent cartilage-specific markers (Figure 1).
Cells 2022, 11, x FOR PEER REVIEW 3 of 31
in order to subsequently achieve a long-term culture of up to 35 days with articular chon-
drocytes and mesenchymal stem cells (MSCs) as chondrogenic cells. Quantitative meas-
urements of DNA and metabolic activity allowed conclusions to be drawn about the
maintenance of proliferation, while the synthesis of sGAGs and expression of cartilage
related extracellular matrix proteins provided ECM formation of the cells. Furthermore,
the progress of chondrogenesis in the newly developed composite scaffold was evaluated
by relative gene expression of the most prominent cartilage-specific markers (Figure 1).
Figure 1. Graphical abstract. Knee joints from the pig (A,B) were explanted in order to isolate native
chondrocytes (C). From the human iliac crest (D) mesenchymal stem cells (E) were obtained. Pri-
mary cells were subsequently colonized on pure bioactive glass scaffolds (BG, F), which were one-
time (1P, G), twice (2P, H), or three times (3P, I) infiltrated with Poly(D-L-lactide-co-glycolide)
(PLGA). Prior to colonization extensive analyses were performed to characterize the material prop-
erties (J). After up to 35 days in a dynamic culture, the cellular changes (cytotoxicity, viability, col-
onized surface, scanning electron microscopy, DNA and sulfated glycosaminoglycan (sGAG) con-
tents, metabolic activity, immunocytochemical staining and real time polymerase chain reactions
(PCR)) were examined in more detail (K).
2. Materials and Methods
2.1. Bioactive Glass (BG) Scaffold Fabrication (CAR12N)
The BG scaffolds (CAR12N) were produced by our recently patented glass composi-
tion (DE 10 2018 114 946 B3, 2019) (see Table 1). The detailed BG scaffold preparation was
previously described [49]. After the sintering process [360 °C/hour (h) until 380 °C with
no holding time, 46 °C/h until 520 °C with no holding time and 360 °C/h until 655 °C with
40 min (min) holding time] the scaffolds were stored in a desiccator for dry storage until
further use. Before using the scaffolds in the cell culture (for colonization, for cytotoxicity
assay see description below) the scaffolds were leached out (0.1 g scaffold mass on 1 mL
liquid) for 8 days in a 0.1 M hydrochloric acid (HCl), stored for a minimum of 8 days and
a maximum of 28 days in pyrogenic Aqua distilled (A. dist.; Carl Roth GmbH, Karlsruhe,
Germany) and preincubated for two days in culture medium.
Figure 1. Graphical abstract. Knee joints from the pig (A,B) were explanted in order to isolatenative chondrocytes (C). From the human iliac crest (D) mesenchymal stem cells (E) were obtained.Primary cells were subsequently colonized on pure bioactive glass scaffolds (BG, F), which wereone-time (1P, G), twice (2P, H), or three times (3P, I) infiltrated with Poly(D-L-lactide-co-glycolide)(PLGA). Prior to colonization extensive analyses were performed to characterize the material proper-ties (J). After up to 35 days in a dynamic culture, the cellular changes (cytotoxicity, viability, colonizedsurface, scanning electron microscopy, DNA and sulfated glycosaminoglycan (sGAG) contents,metabolic activity, immunocytochemical staining and real time polymerase chain reactions (PCR))were examined in more detail (K).
2. Materials and Methods2.1. Bioactive Glass (BG) Scaffold Fabrication (CAR12N)
The BG scaffolds (CAR12N) were produced by our recently patented glass composition(DE 10 2018 114 946 B3, 2019) (see Table 1). The detailed BG scaffold preparation waspreviously described [49]. After the sintering process [360 ◦C/hour (h) until 380 ◦C with noholding time, 46 ◦C/h until 520 ◦C with no holding time and 360 ◦C/h until 655 ◦C with40 min (min) holding time] the scaffolds were stored in a desiccator for dry storage untilfurther use. Before using the scaffolds in the cell culture (for colonization, for cytotoxicityassay see description below) the scaffolds were leached out (0.1 g scaffold mass on 1 mLliquid) for 8 days in a 0.1 M hydrochloric acid (HCl), stored for a minimum of 8 days and amaximum of 28 days in pyrogenic Aqua distilled (A. dist.; Carl Roth GmbH, Karlsruhe,Germany) and preincubated for two days in culture medium.

Cells 2022, 11, 1577 4 of 30
Table 1. chemical composition of BG.
Chemical Patented Mass [%]
Silicon dioxide (SiO2) 62.7Sodium oxide (Na2O) 25.6
Diphospho pentoxide (P2O5) 7.0Boron oxide (B2O3) 2.0
Potassium oxide (K2O) 1.0Potassium nitrate (KNO3) 0.5Sodium sulfate (Na2SO4) 0.4Sodium chloride (NaCl) 0.3Sodium fluoride (NaF) 0.2Titanium oxide (TiO2) 0.12
Yttria stable Zirconia (ZrO2 + Y2O3) 0.1Zinc oxide (ZnO) 0.06
Copper oxide (CuO) 0.02total 100.00
2.2. Preparation of PLGA-Infiltrated CAR12N Scaffolds
The scaffold systems were prepared according to our patent DE 10 2019 124 879A1. Poly(D,-L-lactide-co-glycolide) (PLGA; 85:15; RG 858S; Evonik, Essen, Germany) wasused for the scaffold infiltration. PLGA was dissolved with dioxane (Carl Roth GmbH)in a 5:95 relation. The following calculation was used to determine the dioxane quantityrequired: Mdioxane =
MPLLA5 × 95. The PLGA was completely dissolved (30 min at 75 ◦C)
to achieve a homogeneous infiltration of the BG scaffold. The PLGA solution infiltratedthe pure BG scaffolds either one-time (1P), twice (2P) or three times (3P). Infiltration wasperformed by a drop technique. The first drop on the top, the second drop was added onthe bottom and the third drop was added again on the top region. Each drop containedin average 0.0028 g of PLGA. The coated scaffolds were then immersed in a 60 ◦C A. dist.for 1–2 min for the PLGA to precipitate. The infiltrated scaffolds were dried for 30 min at100 ◦C and then stored in the desiccator until further use.
2.3. Scaffold Characterization by Light Microscopy
To better distinguish the PLGA from pure glass, the PLGA solution (see descriptionabove) was dyed with the dye Sudan IV (scarlet red, Carl Roth GmbH). The dried scaffoldsstained with Sudan red PLGA (BG as control, 1P, 2P, 3P) were then vertically cut in half witha razor blade. Light microscopic (Olympus SZH10 Research Stereo, Hamburg, Germany)images were taken with the camera system (Zeiss, Axio Cam ERc5s/Olympus Highlight3001, Wetzlar, Germany) depicting the upper third (top region), middle third (middleregion), and lower third (bottom region) of the PLGA-infiltrated scaffolds to evaluate thedistribution of PLGA. Three images of three scaffolds from three different batches weretaken and the percentage of PLGA, glass, and pores was calculated using GNU ImageManipulation Program (GIMP) (free software version 2.10.24) and ImageJ version 1.53i(National Institutes of Health, MD, USA).
2.4. Pore Perimeter, Strut Length Measurement and Porosity
The pore perimeter was calculated from the native scaffold pictures with the “Freehandselections tool” from the ImageJ software. The strut length and diameter were calculatedfrom the native scaffold pictures with the “straight line tool” from the ImageJ software.Porosity was calculated with the following formula: Φ =
(1− ρ
ρ0
)× 100% The density ρ
of the unsintered bioactive glass in the form of a fragment after the casting process and thedensity ρ0 of a scaffold were used for the calculation. The theoretical density of the glass isdetermined using the BatchMaker program (ilis GmbH, Erlangen, Germany). The exactchemical composition (Table 1) had to be entered to calculate the properties of the glass.For the calculation of the real density, a bubble-free piece of glass was used. The density of

Cells 2022, 11, 1577 5 of 30
the scaffolds was determined by the mass of the samples. The porosity refers only to theopen pores and not to the pores inside the struts.
2.5. pH Measurements
A pH meter (PCE-PH20S, PCE Americas Inc., Jupiter, FL, USA) was used to measurethe pH values. The pH value was determined every day during the leaching process ofthe scaffold variants in 0.1 M HCl at room temperature (RT, 22.02 ± 0.11 ◦C), once a week(over 4 weeks) during scaffold storage in A. dist. (at RT) and every day during incubationin growth medium (37 ◦C). Four different BG batches were tested in this study.
2.6. Mechanical Strength Testing
This test was used to compare the compressive strength and, more importantly, thefracture behavior of unleached and leached scaffolds, either PLGA-infiltrated or not. Thecompressive strength was the resistance of the scaffold to the action of pressure and couldbe calculated as the quotient of the failure load and the cross-sectional area. The testswere carried out with the GT200 particle compression tester (M-TECH Automation GmbH,Cologne, Germany). Measurements were shown as Supplemental Figure S1.
2.7. Cell Isolation, Cultivation and Colonization
The pACs were isolated from 4 healthy knee joints from 4–6 months old female pigs de-rived from the abattoir. The harvested cartilage pieces were cut into small slices (2 mm) anddigested by collagenase NB5 derived from Clostridium histolyticum (1 mg/mL, Nordmark,Uetersen, Germany) diluted in chondrocyte growth medium (96% [v/v] DMEM/Ham’sF-12 [1:1] with stable L-glutamin, 1% [v/v] amphotericin B, 1% [v/v] MEM amino acids, 1%[v/v] penicillin/streptomycin, 1% [v/v] ascorbic acid supplemented (all products from CarlRoth GmbH) with 10% fetal calf serum (FCS) (Pan-Biotech GmbH, Aidenbach, Germany)overnight in a rotatory device at 37 ◦C. After sieving (100 µm cell sieve, TPP, Trasadingen,Switzerland) and washing, isolated chondrocytes were cultured in chondrocyte growthmedium in T175 flask (CellPlus, Sarstedt AG, Nümbrecht, Germany). For expansion,chondrocytes were detached with 0.05%/0.02% trypsin/ Ethylenediaminetetraacetic acid(EDTA) solution (Carl Roth GmbH) and seeded in T175 flasks. Every second day growthmedium was changed. Voluntary male bone marrow donors (average age of 29± 12.1) wereused to isolate their hMSCs. The ethical commission of the Bavarian medical association(no.17074, 6 February 2018) approved the harvesting and usage of human derived tissuesfor experiments. The experiments were performed in accordance with the Declaration ofHelsinki. The bone marrow blood transplantation unit of the Nuremberg General Hospitaltook the biopsies from the iliac crest. MSC growth medium was mingled with fresh bonemarrow blood (4:1) and transferred into a T175 flask (Sarstedt). The components of hMSC’sgrowth medium were: Dulbecco’s modified Eagle’s medium (DMEM with stable glutamine[3.7 g/L NaHCO3 and 4.5 g/L D-glucose], Pan-Biotech GmbH), 5% human growth factor-rich human Platelet Lysate (PL) solution (PL BioScience, Aachen, Germany), 0.04% heparin(PL BioScience), 1% [v/v] amphotericin B, 1% natrium pyruvate (Pan-Biotech GmbH), 1%penicillin/streptomycin (Carl Roth GmbH). Fresh medium (10 mL) was added to each flaskafter 3 days. A complete medium removal was carried out on day 6. Two washing steps ofthe adherent cells were performed with phosphate-buffered saline (PBS, Carl Roth GmbH)and an incubation in 20 mL fresh MSC growth medium was carried out until a confluencyof 80–90% was reached. The cell isolation and cultivation protocol used is described in ourlast publication [49].
Cubic scaffolds (6.64 ± 0.40 mm length; 6.64 ± 0.40 mm width; 3.32 ± 0.45 mmhigh) without or with PLGA were leached out in 0.1 M HCl solution for eight days afterproduction. For a minimum of eight days the scaffolds were stored in A. dist. with verylow pyrogen content before they were incubated for two days in culture medium. Then,the scaffolds were transferred to a TubeSpin bioreactor tube (TPP) and colonized with5 × 105 primary cells pACs or hMSCs (in passages between 3 and 4) per scaffold for
Cells 2022, 11, 1577 6 of 30
dynamic seeding in 5 mL chondrocyte or MSC growth medium. A homogenous celldistribution on the scaffold was reached by using a rotatory device (Bartelt GmbH, Graz,Austria) with 36 rpm at 37 ◦C. Every second day medium changes were executed until thecultivation was stopped at day 1, 3, 7, 21, and 35. Three independent experiments wereperformed with cells isolated from three different donors.
2.8. Cytotoxicity Testing
The murine fibroblast cell line L929 (derived from subcutaneous tissue, strain C3H/An,from Cell Line Services, Eppelheim, Germany) and synovial fibroblast cell line K4IM(derived from a male human synovium; with SV40 T antigen immortalized fibroblast-likesynoviocytes, cell line collection C616) were used for biological evaluation of cytotoxicityaccording to the international standard DIN EN ISO 10993-5 2009-10 norm. With an initialcell density of 1.0 × 10⁴ cells/cm2, thawed primary pACs and hMSCs (three differentdonors) and L929 fibroblasts (cultivated in the same cultivation medium as chondrocytes,the components are listed above) were cultured in growth medium until 80–90% confluenceat 37 ◦C and 5% CO2 was reached. A change of growth medium was carried out three timesa week. Determination of potential cytotoxic effects was evaluated with extracts from threedifferent scaffold batches. Cell-specific growth medium was used as extraction medium.Ten scaffolds (0.1769 g) of each scaffold variant (BG, 1P, 2P, 3P) were incubated in 1.769 mLextraction medium at 37 ◦C and 5% CO2 for 48 h under aseptic conditions using sterile,chemically inert cell culture plates (Sarstedt). The ratio scaffold/ extraction medium was100 mg scaffold in 1 mL medium. Cells (pACs, hMSCs, L929) were seeded in 96-well cellplates (Sarstedt) with an initial density of 1.0 x 10⁴ cells/cm2 and the cells were incubatedfor 24 h at 37 ◦C and 5% CO2 to allow cell adherence. After a removal of growth medium,cell cultivation in 100 µL extraction medium or control solutions per well was performedfor 24 h 37 ◦C and 5% CO2. As a positive control, a 10% dimethyl sulfoxide solution(DMSO, Carl Roth GmbH) in cell type specific growth medium was used. As a negativecontrol, cell type specific pure growth medium was used. In the Supplemental Figure S2,the test was extended by using 48 h incubated medium and 10% DMSO in 48 h incubatedmedium, to evaluate the influence of loss of higher temperature sensitive componentsof the growth medium. A complete removal of the supernatant after 24 h of incubationwith the respective extracts as carried out. To each well a mix of 80 µL of the respectivegrowth medium and 20 µL [3-(4,5-dimethylthiazol-2-yl)-5-(3-carboxymethoxyphenyl)-2-(4-sulfophenyl)-2H-tetrazolium, inner salt; MTS] solution (CellTiter 96®Aqueous One SolutionCell Proliferation Assay, Promega GmbH, Walldorf, Germany) was added. The absorbancewas measured photometrically at a wavelength of 490 nm (Tecan Austria GmbH, Grödig,Austria) after additional 2 h incubation of the cells under standard culture conditions. Thetest was performed with scaffold cultures seeded with three different pAC or MSC donors.Three different scaffold batches were tested with each donor. The protocol used is describedin detail in our previous publication [49].
2.9. Viability Assay
The viability assay was performed to analyze if the cells remained alive or died. Thelive/dead staining solution consisted of 1 µL propidium iodide (PI, 1% stock solutionin A. dist., ThermoFisher Scientific, Darmstadt, Germany) and 5 µL fluorescein diacetate(FDA, stock solution: 3 mg mL-1 in acetone, Sigma-Aldrich, St. Louis, MO, USA) in 1 mLPBS. Cell viability on the scaffolds was determined after 7, 21 and 35 days of cultivation.For performing the live/dead staining, the scaffolds were removed from growth medium,transferred to a microscopic cover slide and 50 µL of stain solution was added. After a5 min incubation period at RT, the fluorescence of live (green) and dead (red) cells wasmonitored using a Leica SPEII DMi8 confocal laser scanning microscope (CLSM, Leica,Wetzlar, Germany). The protocol used followed the procedure described in our previouspublication [49].

Cells 2022, 11, 1577 7 of 30
2.10. Calculation of the Viability, Colonized Scaffold Surface and Cell Seeding Efficiency
Based on the viability assay, three different pictures with vital and dead cells fromthree independent experiments were evaluated. The pictures were “split” with the LAS Xsoftware (Leica, 3D program) in the green and red channels. The amount of vital (green)and dead (red) cells on the scaffold surface was calculated with the “analyzer” featurein the program. For the calculation of the viability per scaffold surface, the amount ofvital (green) and dead (red) cells were evaluated. The quantification of viability wascalculated as follows: viability (%) =
amount o f live cellsamount o f live cells+dead cells × 100 For determining the
“colonized scaffold surface” only the green channel was taken and the area of vital cellswas chosen. The protocol applied has been described previously in detail [49]. The cellseeding efficiency was calculated based on the number of unattached cells that ended up inthe residual medium according to Dozza et al. [50] with the following calculation:
cell seeding e f f iciency (%) = 1− number o f unattached cellsnumber o f cells initially seeded
× 100
Cell counting was performed with a hemocytometer after 1 and 3 days.
2.11. Scanning Electron Microscopy
After a fixation of the scaffolds in 2% paraformaldehyde (PFA, Morphisto GmbH,Frankfurt am Main, Germany), 2.5% glutaraldehyde (Carl Roth GmbH) in PBS withoutCa2+ and Mg2+ overnight at 4 ◦C, the scaffolds were washed in PBS four times for 15 minand contrasted with 1% osmium tetroxide (OsO4, Carl Roth GmbH). Then, gentle rinsingof the scaffolds four times, each 15 min in PBS was performed before the dehydration inan ascending ETOH series (70%, 80%, 90% and 96% ETOH, each 30 min) and three timesin 100% ETOH for 15 min each started. Followed by a critical point drying, mountingonto specimen stubs and sputtering (agar auto carbon coater, BalTEC COD 030, Agarscientific Ltd., Essex, UK) with a thin layer of carbon (≈13 nm) of the scaffolds. SEMimages were taken under an ESEM XL30 (FEI Europe B.V., Eindhoven, The Netherlands)at an accelerating voltage of 25 kV. The described protocol follows the description in ourprevious publication [49].
2.12. Measurement of Total DNA and sGAG Amount
By CyQUANT® NF Cell Proliferation Assay the influence of respective treatment oncell division was examined after 1, 3, 7, 21, and 35 days. A serial dilution of calf thymusDNA stock solution (1 mg mL-1, Sigma Aldrich) with TE-buffer (TRIS EDTA buffer, 10 mMTRIS (pH 8.0), 1 mM EDTA in A. dist.) serves a standard curve. A mix of 25 µL of theserial calf thymus DNA dilution with 25 µL of CyQuant dye solution (1× Hank’s BalancedSalt Solution (HBSS, Carl Roth) + dye binding solution 1:250 (ThermoFisher Scientific Inc.,Waltham, MA, USA)) were used for the standard curve. The scaffolds, from time point 1, 3,7, 21 and 35 days were transferred to RNase and DNase free 2 mL safe seal tubes (Sarstedt)with 50 µL of the proteinase K digestion buffer (50 mM TRIS/HCl, 1 mM EDTA, 0.5% Tween20) containing 0.5 mg mL-1 proteinase K (PanReac, ApplyChem, Darmstadt, Germany).Seven millimeter stainless-steel beads (RNase- and DNase-free, sterile, Qiagen, Hilden,Germany) were used to homogenize the samples with the Tissue Lyser (Qiagen, 50 Hz,5 min, RT). A 250 µL proteinase K digestion buffer containing 0.5 mg mL-1 proteinase Kwas added. The sample digestion was performed for 16 h at 56 ◦C under continuousshaking. By freezing the samples at −20 ◦C for halve an hour the enzymatic reaction wasstopped. The thawed samples were centrifuged for 15 min at 16483.55 g. A mix of 10 µLof each sample with 150 µL TE buffer was made before 25 µL of the sample dilution weretransferred in triplicate into a black, flat-bottom, 96-well plate (Brand GmbH, Wertheim,Germany). A total of 25 µL of the dye solution (1× HBSS + dye solution 1:250) wasmixed with the samples. Coved plates were incubated at 37 ◦C for 1 h. The fluorescencemeasurement of each well was performed in triplicate at 485 excitation/530 emission nm

Cells 2022, 11, 1577 8 of 30
in a fluorometric plate reader (Tecan Austria GmbH). Three independent experiments withcells derived from three different donors were performed. The procedure described hasbeen published previously [49].
The DMMB Assay was performed with the same supernatant as in the CyQuant Assay.Samples were adequately diluted and, the DMMB solution (ApplyChem) was added(40 mM glycine (Sigma-Aldrich), 40 mM NaCl (Carl Roth GmbH) at pH 3 and DMMB[8.9 mM in ethanol (ETOH)]). For the standard curve chondroitin sulfate (Sigma-Aldrich)was taken. By using a genios spectral photometer (Tecan Austria GmbH), the absorptionshift was measured at a wavelength of λ = 633 nm to λ = 552 nm. Three independentexperiments with cells derived from three different donors were performed. The data werepresented as GAG per DNA amount.
2.13. Metabolic Activity Evaluation
The metabolic activity of the cells on scaffolds was determined with the CellTiter-Blue®
Cell Viability Assay (Promega GmbH) after the time points of 7 and 35 days. Scaffoldswere incubated with a mixture of 100 µL of the culture medium and 25 µL of CellTiter Bluesolution. After 2 h of incubation, 100 µL liquid were transferred into a fresh and new welland were than measured. The absorbance of each sample was measured in triplicates at570 nm and 600 nm in a fluorometric plate reader (Tecan Austria GmbH). Reference valueswere the uncolonized scaffolds and were calculated as 0% metabolic active.
2.14. Immunocytochemical Staining
The immunocytochemical stained proteins were visualized by the CLSM. After thecultivation time (21 days) scaffolds were fixed with 4% PFA and after a washing stepwith TRIS buffered saline (TBS: 0.05 M TRIS, 0.015 M NaCl, pH 7.6) the scaffolds wereincubated with protease-free donkey serum (5% diluted in TBS with 0.1% Triton X 100for cell permeabilization) for 20 min at RT. Incubation was carried out overnight at 4 ◦Cwith primary antibody (Table 2: collagen type II, cartilage proteoglycans, SOX9). Then, thesamples were washed with and incubated with donkey-anti-rabbit-Alexa 488 (Invitrogen,Carlsbad, CA, USA) or donkey-anti-mouse-cyanine-3 (Cy3, Invitrogen) coupled secondaryantibodies (diluted 1:200 in TBS, see Table 2) for 1 h at RT. In total, 10 µg/mL 4′,6′-diamidino-2-phenylindol (DAPI, Roche, Mannheim, Germany) was used to counterstain cell nuclei.After the washing steps (3×) of the immunolabeled scaffolds with TBS, the examinationwas performed with the CLSM. Three independent experiments were performed withrepresentative microscopic fields. For the calculation of the “collagen type II, cartilageproteoglycan and SOX9 area per cell”, three pictures of three independent experimentswere taken and split with the 3D CLSM Leica software in the “green”, “red” and “blue”channels. The green and red area (%) was measured and related to the amount to blue dots(=cell nuclei).
Table 2. Antibodies used in this study.
Target Primary Antibody Dilution Secondary Antibody Dilution
type II collagen Rabbit anti human, Acris Laboratories,Hiddenhausen, Germany 1:50 donkey-anti-rabbit, Alexa Fluor 488,
Invitrogen 1:200
cartilage proteoglycans Mouse anti human, ChemiconInternational, CA, USA 1:70 Donkey-anti-mouse; Cy3, Invitrogen 1:200
SOX9 Rabbit anti human, Merck,Darmstadt, Germany 1:100 donkey-anti-rabbit, Alexa Fluor 488,
Invitrogen 1:200
2.15. RNA Isolation
After 7 and 21 days, BG and 1P scaffolds colonized with pACs and hMSCs weresnap-frozen (each n = 3). Homogenization of the scaffolds and native porcine articularcartilage (n = 3) were performed in RLT-buffer (Qiagen) with the Tissue Lyser for 5 minat 50 Hz. According to the manufacturer’s instructions (Qiagen) RNA isolation and pu-rification was carried out with RNeasy Mini kit, including on-column DNAse treatment.

Cells 2022, 11, 1577 9 of 30
Nanodrop ND-1000 spectrophotometer (Peqlab, Biotechnologie GmbH, Erlangen, Ger-many) was used to monitor (260/280 absorbance ration) the purity and quality of the RNAsamples. The procedure described is consistent with the protocol outlined in our previouspublication [49].
2.16. Quantitative Real Time PCR
The QuantiTect Reverse Transcription Kit was used for reverse transcription of 120 ngof total RNA for cDNA synthesis. For each semiquantitative real-time PCR (qRT-PCR)reaction 35 ng cDNA were used for TaqMan Gene Expression Assays (Life Technologies,Carlsbad, CA, USA) with primer pairs for aggrecan (ACAN), collagen type I (Col1A1),collagen type II (Col2A1), collagen type IX (Col9A3), collagen type X (Col10A1), collagentype XI (Col11A1), cartilage oligomeric matrix protein (COMP), forkhead boxO 1 (FOXO1),SRY (sex-determining region Y)-box 9 protein (SOX9) and the β-actin (ACTB) as the refer-ence gene (Table 3) real time PCR detector StepOnePlus (Applied Bioscience (ABI), FosterCity, CA, USA) thermocycler with the program StepOnePlus software 2.3 (ABI) was usedfor qRT-PCR performance. The relative expression of the target gene by the cells on thescaffolds was normalized to the ACTB expression and calculated for each sample using the∆∆CT method as described by Schefe et al. 2006 [51].
Table 3. Detailed information of primers used in the present study.
Gene Symbol Species Gene Name Efficacy Amplicon Length(Base Pairs) Assay ID #
ACAN Homo sapiens Aggrecan 1.95 93 Hs00202971_m1
ACAN Sus scrofa Aggrecan 1.69 60 Ss03374823_m1
ACTB Homo sapiens β-actin 1.89 171 Hs99999903_m1
ACTB Sus scrofa β-actin 1.71 77 Ss03376081_u1
Col1A1 Homo sapiens Type I collagen 2.06 66 Hs00164004_m1
Col1A1 Sus scrofa Type I collagen 1.53 74 Ss03373340_m1
Col2A1 Homo sapiens Type II collagen 2.06 (1.9 *) 124 Hs00264051_m1
Col9A3 Homo sapiens Type IX collagen 1.99 # 52 Hs00951243_m1
Col9A3 Sus scrofa Type IX collagen 1.92 70 Ss06885389_m1
Col10A1 Homo sapiens Type X collagen 1.75 76 Hs00166657_m1
Col10A1 Sus scrofa Type X collagen 1.87 85 Ss03391766_m1
Col11A1 Homo sapiens Type XI collagen 1.80 # 98 Hs00266273_m1
Col11A1 Sus scrofa Type XI collagen 1.74 86 SS03373534_m1
COMP Homo sapiens Cartilage oligomericmatrix proteine 2.21# 101 Hs00164359_m1
COMP Sus scrofa Cartilage oligomericmatrix proteine 1.76 117 Ss03375728_u1
FOXO1 Homo sapiens Forkhead box O 1 1.84 # 103 Hs 00231106_m1
FOXO1 Sus scrofa Forkhead box O 1 1.56 107 Ss03388140_s1
SOX9 Homo sapiens SOX9 1.92 102 Hs00165814_m1
SOX9 Sus scrofa SOX9 1.57 145 Ss03392406_m1
all primers from Applied Biosystems ® (life technologies TM). * Primer efficacy determined for porcine chondro-cytes. # primer efficacy determined for human chondrocytes.

Cells 2022, 11, 1577 10 of 30
2.17. Statistical Analysis
The statistical description refers to all experiments performed. Data from all exper-iments are expressed as mean values with standard deviation (SD). GraphPad Prism8(GraphPad software Inc., San Diego, CA, USA) was used to perform statistics. A ROUToutlier test (Q = 1%) was performed. Shapiro–Wilk test was used for the analysis of thenormal distribution of the results. A two-tailed one-way ANOVA (Fisher) was used fol-lowed by Tukey´s multiple comparison post hoc testing to compare groups. The levelsignificance (CI) was set at p values of ≤0.05 (*) and p values of ≤0.0001(****). Power oftests was 0.8. Four different scaffold batches with three different scaffolds were takenfor the evaluation of the PLGA, glass and pore distribution, the glass strut length, theglass strut diameter, the pore perimeter and the porosity. Three different scaffold batcheswere taken for the stiffness measurement. Four different batches were taken for the pHmeasurement and three different batches were taken for the measurement of the scaffoldparameters (two-way ANOVA was used by Tukey´s multiple comparison post hoc testing).Independent experiments (3–4) with cells from three to four different donors were included.
3. Results3.1. PLGA Distribution within the Scaffolds
The leached scaffolds were vertically cut in half with a scalpel to evaluate the mor-phology in the top, middle and bottom regions of the scaffold. The red stained PLGA wasdetectable in every scaffold region but not homogenously distributed inside the scaffolds(1P, 2P, 3P). Due to using the “solvent phase infiltration” technique to introduce the PLGAinto the scaffolds, a higher amount of PLGA accumulated in the top region (Figure 2). Theevaluation of the percentage distribution of PLGA, glass and pores per picture gave anoverview of their position within the scaffold and therefore, the scaffold characteristics. ThePLGA amount was higher in the top and bottom regions of the 1P, 2P and 3P scaffolds incomparison to the middle region. The PLGA amount was significantly higher in the bottomregion in the 2P scaffolds in comparison to the 1P bottom region and the middle region ofthe 2P scaffolds (Figure 2M). The average glass content was over 55%. Nevertheless, therewas also a large scatter within the scaffold regions. In the top region of the 3P scaffold, therewas significantly lesser glass content than in the top region of the 1P scaffold (Figure 2N).The pore fraction per scaffold region was also uniform within a variant. The pure BGscaffolds depicted the highest pore fraction (Figure 2O). It must be mentioned that thesecalculations refer only to light microscopic images of scaffold sections.
3.2. Scaffold Topology and Polymer Infiltration
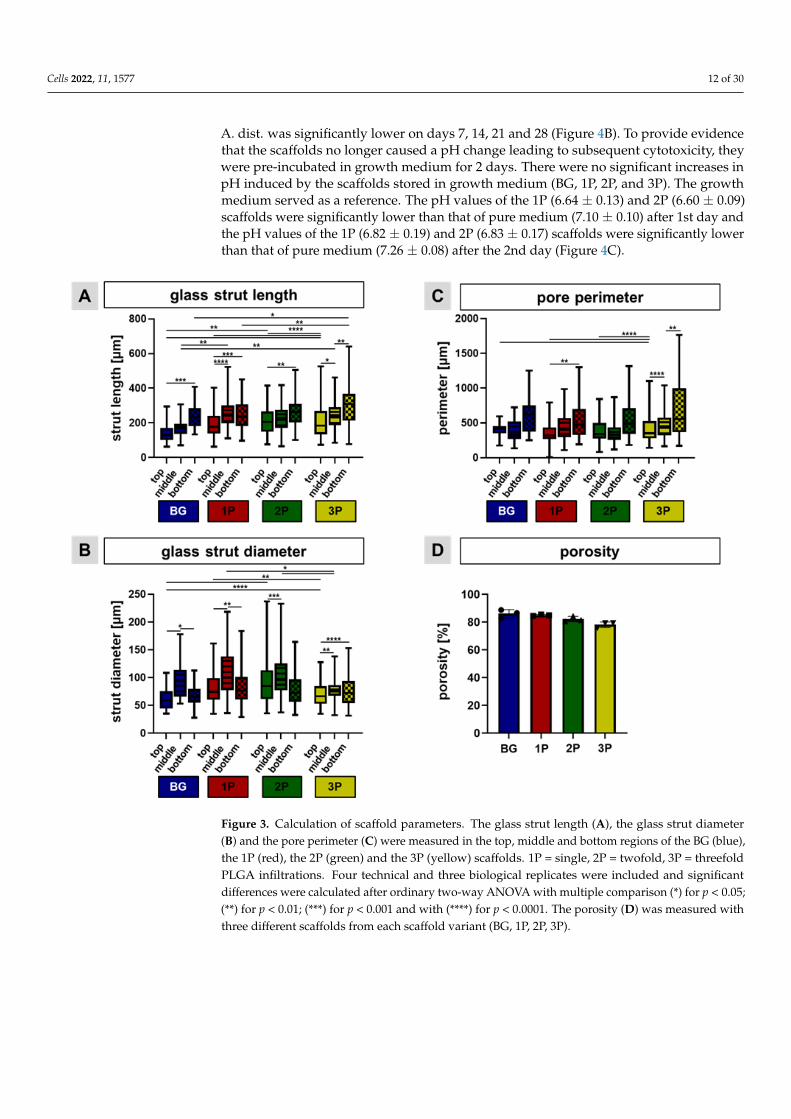
Based on the light microscopic images, the glass strut length, glass strut diameterand pore perimeter were measured. The glass strut lengths were generally greater than150 µm. The glass struts were significantly longer in the bottom region compared to thetop regions of all four scaffold variants. Additionally, there were significant differencesbetween the BG and 3P, the 2P and the 3P scaffolds within the bottom regions. The strutlength was in top region of the BG scaffolds significant smaller than in comparison to the2P and 3P scaffolds (Figure 3A). In contrast to the glass strut length, the glass strut diameterin the middle region was the highest in every scaffold variant in comparison to the top andthe bottom regions (significant differences in the BG and the 1P scaffolds). On average,the glass strut diameter was larger than 50 µm for all four scaffold variants. Significantdifferences of the strut diameter could be also calculated between the different variantsin the top region, for example BG and 3P; 1P and 3P; BG and 2P (Figure 3B). In general,the pore perimeter in the top, middle, and bottom regions of all four scaffold variantswas greater than 400 µm. In tendency, the pore perimeter in the bottom region of all fourscaffold variants was larger than in the top and middle regions. The bottom region had asignificantly higher perimeter in the 1P and the 3P scaffolds in comparison to the top or themiddle regions. Indeed, the perimeter of the 3P scaffolds in the top region is significantlysmaller than in the BG, the 1P and the 2P scaffolds (Figure 3C). Porosity slightly decreased

Cells 2022, 11, 1577 11 of 30
with increasing PLGA infiltration (not significantly), with the pure BG scaffold having aporosity of over 86% (86.10 ± 2.98), while the 3P scaffold had a porosity of less than 80%(78.14 ± 2.02) (Figure 3D).
Cells 2022, 11, x FOR PEER REVIEW 11 of 31
Figure 2. Detailed view of the four scaffold variants. The scaffolds (BG = pure bioactive glass scaffold
(A–C) in blue (M–O), 1P = single (D–F) in red (M–O), 2P = twofold (G–I) in green (M–O) and 3P =
threefold PLGA infiltrations (J–L) in yellow (M–O)), were vertically cut and light microscopic im-
ages were taken from the top view (A,D,G,J), from the middle (B,E,H,K) and the bottom (C,F,I,L)
view. The percentage distribution of PLGA (M), of glass (N) and pores (O) per picture was calcu-
lated. n = 4. Ordinary two-way ANOVA with multiple comparison, p values: * p < 0.05, (**) for p <
0.01; (***) for p < 0.001 and with (****) for p < 0.0001. Scale bar: 200 µm, PLGA was red dyed with the
dye Sudan IV red.
3.2. Scaffold Topology and Polymer Infiltration
Based on the light microscopic images, the glass strut length, glass strut diameter and
pore perimeter were measured. The glass strut lengths were generally greater than 150
µm. The glass struts were significantly longer in the bottom region compared to the top
regions of all four scaffold variants. Additionally, there were significant differences be-
tween the BG and 3P, the 2P and the 3P scaffolds within the bottom regions. The strut
length was in top region of the BG scaffolds significant smaller than in comparison to the
2P and 3P scaffolds (Figure 3A). In contrast to the glass strut length, the glass strut diam-
eter in the middle region was the highest in every scaffold variant in comparison to the
top and the bottom regions (significant differences in the BG and the 1P scaffolds). On
average, the glass strut diameter was larger than 50 µ m for all four scaffold variants. Sig-
nificant differences of the strut diameter could be also calculated between the different
variants in the top region, for example BG and 3P; 1P and 3P; BG and 2P (Figure 3B). In
general, the pore perimeter in the top, middle, and bottom regions of all four scaffold
variants was greater than 400 µm. In tendency, the pore perimeter in the bottom region of
all four scaffold variants was larger than in the top and middle regions. The bottom region
had a significantly higher perimeter in the 1P and the 3P scaffolds in comparison to the
top or the middle regions. Indeed, the perimeter of the 3P scaffolds in the top region is
significantly smaller than in the BG, the 1P and the 2P scaffolds (Figure 3C). Porosity
slightly decreased with increasing PLGA infiltration (not significantly), with the pure BG
scaffold having a porosity of over 86% (86.10 ± 2.98), while the 3P scaffold had a porosity
of less than 80% (78.14 ± 2.02) (Figure 3D).
Figure 2. Detailed view of the four scaffold variants. The scaffolds (BG = pure bioactive glass scaf-fold (A–C) in blue (M–O), 1P = single (D–F) in red (M–O), 2P = twofold (G–I) in green (M–O) and3P = threefold PLGA infiltrations (J–L) in yellow (M–O)), were vertically cut and light microscopicimages were taken from the top view (A,D,G,J), from the middle (B,E,H,K) and the bottom (C,F,I,L)view. The percentage distribution of PLGA (M), of glass (N) and pores (O) per picture was calculated.n = 4. Ordinary two-way ANOVA with multiple comparison, p values: * p < 0.05, (**) for p < 0.01;(***) for p < 0.001 and with (****) for p < 0.0001. Scale bar: 200 µm, PLGA was red dyed with the dyeSudan IV red.
3.3. pH Profile during Leaching Process and Gel Layer Formation
The alkali metal oxide content was reduced by selective leaching via an acid surfacetreatment. Alkali metal oxides, such as Na2O and K2O, were added to the CAR12N to actas network converters and thus, served to adjust the melting and sintering temperature.Through the selective leaching process, Na+ and K+ ions were dissolved from the glassmatrix by HCl. This resulted in an ion exchange between Na+/K+ in the network and H+
in the acidic solution. This led to a leached gel layer with minimal alkali content. It wasobserved that for all four scaffold variants (BG, 1P, 2P and 3P) there was a continuous butnot significant increase in pH over a period of 8 days. After one day most of the alkalis wentinto solution and after 8 days almost none (Figure 4A). In order not to exceed the leachingprocess, the scaffolds were subsequently transferred to A. dist. The leaching process has aduration of 8 days. Over the time course of up to 28 days, it could be shown for the BGscaffolds that the pH displayed an increasing phase and had already reached its plateauafter 10 days. The 1P, 2P and 3P scaffolds showed a similar pH course as the BG scaffolds.For the 1P scaffold, there was a significant pH increase from day 1 to day 7. In addition,the pH value of A. dist. was measured to obtain a reference value. As indicated by themanufacturer (pyrogen-free sterile water, Carl Roth GmbH), this value remained constantat 7.3 over the measured period of 28 days. Compared to the BG scaffolds, the pH value of
Cells 2022, 11, 1577 12 of 30
A. dist. was significantly lower on days 7, 14, 21 and 28 (Figure 4B). To provide evidencethat the scaffolds no longer caused a pH change leading to subsequent cytotoxicity, theywere pre-incubated in growth medium for 2 days. There were no significant increases inpH induced by the scaffolds stored in growth medium (BG, 1P, 2P, and 3P). The growthmedium served as a reference. The pH values of the 1P (6.64 ± 0.13) and 2P (6.60 ± 0.09)scaffolds were significantly lower than that of pure medium (7.10 ± 0.10) after 1st day andthe pH values of the 1P (6.82 ± 0.19) and 2P (6.83 ± 0.17) scaffolds were significantly lowerthan that of pure medium (7.26 ± 0.08) after the 2nd day (Figure 4C).
Cells 2022, 11, x FOR PEER REVIEW 12 of 31
Figure 3. Calculation of scaffold parameters. The glass strut length (A), the glass strut diameter (B)
and the pore perimeter (C) were measured in the top, middle and bottom regions of the BG (blue),
the 1P (red), the 2P (green) and the 3P (yellow) scaffolds. 1P = single, 2P = twofold, 3P = threefold
PLGA infiltrations. Four technical and three biological replicates were included and significant dif-
ferences were calculated after ordinary two-way ANOVA with multiple comparison (*) for p < 0.05;
(**) for p < 0.01; (***) for p < 0.001 and with (****) for p < 0.0001. The porosity (D) was measured with
three different scaffolds from each scaffold variant (BG, 1P, 2P, 3P).
3.3. pH Profile during Leaching Process and Gel Layer Formation
The alkali metal oxide content was reduced by selective leaching via an acid surface
treatment. Alkali metal oxides, such as Na2O and K2O, were added to the CAR12N to act
as network converters and thus, served to adjust the melting and sintering temperature.
Through the selective leaching process, Na+ and K+ ions were dissolved from the glass
matrix by HCl. This resulted in an ion exchange between Na+/K+ in the network and H+ in
the acidic solution. This led to a leached gel layer with minimal alkali content. It was ob-
served that for all four scaffold variants (BG, 1P, 2P and 3P) there was a continuous but
not significant increase in pH over a period of 8 days. After one day most of the alkalis
went into solution and after 8 days almost none (Figure 4A). In order not to exceed the
leaching process, the scaffolds were subsequently transferred to A. dist. The leaching pro-
cess has a duration of 8 days. Over the time course of up to 28 days, it could be shown for
the BG scaffolds that the pH displayed an increasing phase and had already reached its
plateau after 10 days. The 1P, 2P and 3P scaffolds showed a similar pH course as the BG
scaffolds. For the 1P scaffold, there was a significant pH increase from day 1 to day 7. In
addition, the pH value of A. dist. was measured to obtain a reference value. As indicated
by the manufacturer (pyrogen-free sterile water, Carl Roth GmbH), this value remained
Figure 3. Calculation of scaffold parameters. The glass strut length (A), the glass strut diameter(B) and the pore perimeter (C) were measured in the top, middle and bottom regions of the BG (blue),the 1P (red), the 2P (green) and the 3P (yellow) scaffolds. 1P = single, 2P = twofold, 3P = threefoldPLGA infiltrations. Four technical and three biological replicates were included and significantdifferences were calculated after ordinary two-way ANOVA with multiple comparison (*) for p < 0.05;(**) for p < 0.01; (***) for p < 0.001 and with (****) for p < 0.0001. The porosity (D) was measured withthree different scaffolds from each scaffold variant (BG, 1P, 2P, 3P).

Cells 2022, 11, 1577 13 of 30
Cells 2022, 11, x FOR PEER REVIEW 13 of 31
constant at 7.3 over the measured period of 28 days. Compared to the BG scaffolds, the
pH value of A. dist. was significantly lower on days 7, 14, 21 and 28 (Figure 4B). To pro-
vide evidence that the scaffolds no longer caused a pH change leading to subsequent cy-
totoxicity, they were pre-incubated in growth medium for 2 days. There were no signifi-
cant increases in pH induced by the scaffolds stored in growth medium (BG, 1P, 2P, and
3P). The growth medium served as a reference. The pH values of the 1P (6.64 ± 0.13) and
2P (6.60 ± 0.09) scaffolds were significantly lower than that of pure medium (7.10 ± 0.10)
after 1st day and the pH values of the 1P (6.82 ± 0.19) and 2P (6.83 ± 0.17) scaffolds were
significantly lower than that of pure medium (7.26 ± 0.08) after the 2nd day (Figure 4C).
Figure 4. pH measurements in hydrochloric acid (HCl, A) in water (B) and in cell type specific cul-
ture medium (C). A total of 100 mg of pure bioactive glass scaffold (BG, blue) of single PLGA(1P,
red), twofold (2P, green) and threefold PLGA infiltrations (3P, yellow) scaffolds was stored in 1 mL
liquid (HCl, Aqua distilled (A. dist.), 10% FCS containing chondrocyte growth medium). The meas-
urement in growth medium was undertaken only for 2 days, since it is normally changed every 2
days. All measurements were performed at RT (22.02 ± 0.11 °C). Significant differences (from four
different scaffold batches) were calculated after two-way ANOVA with multiple comparison (*) for
p < 0.05; (**) for p < 0.01 and (****) for p < 0.0001.
3.4. Polymer Infiltration Strengthens Scaffold Structure
The stiffness was measured up to a maximum force of 5000 mN. The force increases
until the individual struts break. From this point on, an abrupt drop in force took place.
However, since the remaining scaffold remained intact, the curve rose again afterwards.
In the non-leached specimens, none were completely destroyed. It could be shown that
PLGA infiltration did not lead to any changes in the fracture behavior (linear elastic be-
havior). However, differences could only be detected after leaching. The leached BG scaf-
folds showed a nearly horizontal fracture line. This occurred because the glass had a
weakened structure due to the dissolution of many ions and the stresses between the gel
layer and the non-leached glass. Complete failure happened in a range between 1500 and
3500 mN. At the end of the measurement, only small fragments (crumbs) were present in
all three leached BG samples. The fluctuations in the curves can be explained by the frac-
tures of the bars and the subsequent pressure build-up. The leached 3P scaffolds did not
appear to have been destroyed at all. The kinks in the curves were due to slight flattening
of the top surface. The PLGA supported the scaffold by its elastic properties. No signifi-
cant differences were observed between the leached 1P, 2P and 3P scaffolds. However, no
PLGA-infiltrated scaffold could be destroyed with the maximum possible test load of 5000
mN. Therefore, the stiffness beyond the maximum test force could not be represented
(Supplemental Figure S1).
Figure 4. pH measurements in hydrochloric acid (HCl, A) in water (B) and in cell type specific culturemedium (C). A total of 100 mg of pure bioactive glass scaffold (BG, blue) of single PLGA(1P, red),twofold (2P, green) and threefold PLGA infiltrations (3P, yellow) scaffolds was stored in 1 mL liquid(HCl, Aqua distilled (A. dist.), 10% FCS containing chondrocyte growth medium). The measurementin growth medium was undertaken only for 2 days, since it is normally changed every 2 days. Allmeasurements were performed at RT (22.02 ± 0.11 ◦C). Significant differences (from four differentscaffold batches) were calculated after two-way ANOVA with multiple comparison (*) for p < 0.05;(**) for p < 0.01 and (****) for p < 0.0001.
3.4. Polymer Infiltration Strengthens Scaffold Structure
The stiffness was measured up to a maximum force of 5000 mN. The force increasesuntil the individual struts break. From this point on, an abrupt drop in force took place.However, since the remaining scaffold remained intact, the curve rose again afterwards. Inthe non-leached specimens, none were completely destroyed. It could be shown that PLGAinfiltration did not lead to any changes in the fracture behavior (linear elastic behavior).However, differences could only be detected after leaching. The leached BG scaffolds showeda nearly horizontal fracture line. This occurred because the glass had a weakened structuredue to the dissolution of many ions and the stresses between the gel layer and the non-leachedglass. Complete failure happened in a range between 1500 and 3500 mN. At the end of themeasurement, only small fragments (crumbs) were present in all three leached BG samples.The fluctuations in the curves can be explained by the fractures of the bars and the subsequentpressure build-up. The leached 3P scaffolds did not appear to have been destroyed at all. Thekinks in the curves were due to slight flattening of the top surface. The PLGA supported thescaffold by its elastic properties. No significant differences were observed between the leached1P, 2P and 3P scaffolds. However, no PLGA-infiltrated scaffold could be destroyed with themaximum possible test load of 5000 mN. Therefore, the stiffness beyond the maximum testforce could not be represented (Supplemental Figure S1).
3.5. No Cytotoxic Effects by Polymer Infiltration
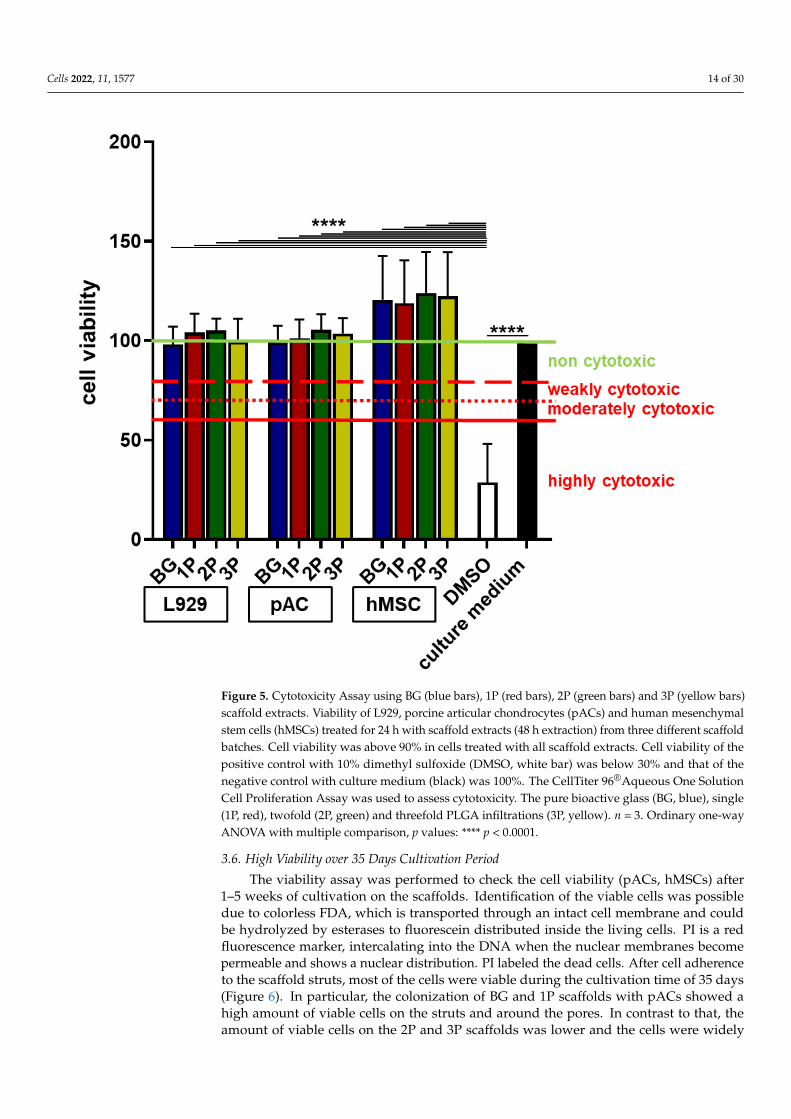
The cytotoxicity assay was performed to evaluate if the ion release negatively influ-enced the cell viability. In accordance with International Standards DIN EN ISO 10993-52009-10 norm not only murine L929 fibroblasts, but also the primary pACs and hMSCs(Figure 5) and K4IM (Supplemental Figure S2) were used since they were included in thefollowing experiments. The normalized cell viability (negative control, which representsthe fresh growth medium was set 100%) of all cell types (L929, pACs, hMSCs and K4IM)tested with four different scaffolds variants (BG, 1P, 2P, 3P) was over 95%. All testedsubstrates (growth medium after 48 h scaffold incubation) were highly significantly morecytocompatible compared to the positive control (DMSO, under 50%), which was highlycytotoxic. Therefore, none of the four scaffolds variants was cytotoxic and all could be usedfor further cell colonization experiments (Figure 5).
Cells 2022, 11, 1577 14 of 30
Cells 2022, 11, x FOR PEER REVIEW 14 of 31
3.5. No Cytotoxic Effects by Polymer Infiltration
The cytotoxicity assay was performed to evaluate if the ion release negatively influ-
enced the cell viability. In accordance with International Standards DIN EN ISO 10993-5
2009-10 norm not only murine L929 fibroblasts, but also the primary pACs and hMSCs
(Fig. 5) and K4IM (supplemental Figure S2) were used since they were included in the
following experiments. The normalized cell viability (negative control, which represents
the fresh growth medium was set 100%) of all cell types (L929, pACs, hMSCs and K4IM)
tested with four different scaffolds variants (BG, 1P, 2P, 3P) was over 95%. All tested sub-
strates (growth medium after 48 h scaffold incubation) were highly significantly more cy-
tocompatible compared to the positive control (DMSO, under 50%), which was highly cy-
totoxic. Therefore, none of the four scaffolds variants was cytotoxic and all could be used for
further cell colonization experiments (Figure 5).
Figure 5. Cytotoxicity Assay using BG (blue bars), 1P (red bars), 2P (green bars) and 3P (yellow bars)
scaffold extracts. Viability of L929, porcine articular chondrocytes (pACs) and human mesenchymal
stem cells (hMSCs) treated for 24 h with scaffold extracts (48 h extraction) from three different scaf-
fold batches. Cell viability was above 90% in cells treated with all scaffold extracts. Cell viability of
the positive control with 10% dimethyl sulfoxide (DMSO, white bar) was below 30% and that of the
negative control with culture medium (black) was 100%. The CellTiter 96® Aqueous One Solution
Cell Proliferation Assay was used to assess cytotoxicity. The pure bioactive glass (BG, blue), single
Figure 5. Cytotoxicity Assay using BG (blue bars), 1P (red bars), 2P (green bars) and 3P (yellow bars)scaffold extracts. Viability of L929, porcine articular chondrocytes (pACs) and human mesenchymalstem cells (hMSCs) treated for 24 h with scaffold extracts (48 h extraction) from three different scaffoldbatches. Cell viability was above 90% in cells treated with all scaffold extracts. Cell viability of thepositive control with 10% dimethyl sulfoxide (DMSO, white bar) was below 30% and that of thenegative control with culture medium (black) was 100%. The CellTiter 96®Aqueous One SolutionCell Proliferation Assay was used to assess cytotoxicity. The pure bioactive glass (BG, blue), single(1P, red), twofold (2P, green) and threefold PLGA infiltrations (3P, yellow). n = 3. Ordinary one-wayANOVA with multiple comparison, p values: **** p < 0.0001.
3.6. High Viability over 35 Days Cultivation Period
The viability assay was performed to check the cell viability (pACs, hMSCs) after1–5 weeks of cultivation on the scaffolds. Identification of the viable cells was possibledue to colorless FDA, which is transported through an intact cell membrane and couldbe hydrolyzed by esterases to fluorescein distributed inside the living cells. PI is a redfluorescence marker, intercalating into the DNA when the nuclear membranes becomepermeable and shows a nuclear distribution. PI labeled the dead cells. After cell adherenceto the scaffold struts, most of the cells were viable during the cultivation time of 35 days(Figure 6). In particular, the colonization of BG and 1P scaffolds with pACs showed ahigh amount of viable cells on the struts and around the pores. In contrast to that, theamount of viable cells on the 2P and 3P scaffolds was lower and the cells were widely

Cells 2022, 11, 1577 15 of 30
dispersed after 7 days of cultivation as well as after 35 days. Still, after 7 days of cultivationthe BG, 1P, 2P and 3P scaffolds were nearly fully colonized by the hMSCs. The strutswere covered by densely packed hMSCs up to 35 days. The hMSCs showed a spindleshaped and elongated cell body so that the pores could be covered. The cell shape could beassessed more clearly at a higher magnification (Supplemental Figure S2). The calculationof the pACs’ viability showed significant differences between the colonized BG scaffoldsin comparison to the colonized 2P scaffolds after 7 days. Although there were no furthersignificant differences after 21 days and 35 days, the same trend could be seen as after7 days (Figure 6I). Interestingly, there was a reduction in viability per hMSC-colonizedscaffolds after 7 days, also with a significant difference between BG and 3P scaffolds. After21 and 35 days, the viability was the highest in the 3P-colonized scaffolds in comparisonto the other scaffolds. The viability significantly increased in the 3P scaffolds from 7 to35 days (Figure 6J).
The calculated colonized surface of pACs growing on the scaffolds was highest after21 days in the BG scaffold (2.2 mm2). At every time point of analysis, pAC colonized 2P and3P scaffolds with a lower colonized surface (difference not significant) when compared totheir growth on BG and 1P scaffolds (Figure 6K). Interestingly, the highest hMSC-colonizedsurface was reached after 7 and 21 days on the 2P scaffold (5.6 mm2). The colonized surfaceof the 2P scaffolds was significantly higher than that of the colonized BG and 1P scaffoldsafter 7 days but also significantly higher than the 2P scaffolds after 35 days. There was alsoa reduction in colonized 2P scaffold surface from 21 days to 35 days. The same trend couldalso be seen in the colonized surface of 3P scaffolds, while the colonized surface of BG and1P scaffolds was constant over the whole colonization time (Figure 6L). The cell seedingefficiency was in all scaffold variants colonized with pACs or hMSCs higher than 70%. Nosignificant differences could be calculated, but in the pACs-colonized scaffolds a slightdecrease over time could be noticed, especially in scaffolds with a higher polymer amount(Figure 6M). More hMSCs could attach to the scaffolds in comparison to the pACs. Nosignificant differences could be calculated because the cell seeding efficiency lied over 95%in all scaffold variants, not only after the first 24 h but also after three days of cultivation(Figure 6N).
3.7. Scanning Electron Microscopy Analysis
The cell attachment of pACs and hMSCs on the different scaffolds was visualized withthe SEM analysis. After 7 and 35 days, the struts and pore walls of the BG and 1P scaffoldwere almost completely colonized with pACs. The cells were flattened, spread aroundthe whole struts and covered the pores (Figure 7(A1–B2)). The highly dispersed pACs inthe 2P and 3P scaffolds exhibited a round cell shape not only after 7 but also after 35 days(Figure 7 (C1–D2)). The hMSCs showed a long and spindle shaped cell body with a highnumber of filopodia in all four scaffold types, especially after 7 days. In the 1P scaffold, asynthesis of fibrous ECM could be also seen that covered not only the pores but also thePLGA (Figure 7(F1)). The PLGA could be distinguished from the glass. With increasingPLGA amount, the cells were only able to adhere to the PLGA.

Cells 2022, 11, 1577 16 of 30Cells 2022, 11, x FOR PEER REVIEW 16 of 31
Figure 6. Viability assay of colonized scaffolds, calculation of the cell viability per scaffold surface,
the colonized scaffold surface and the cell seeding efficiency. Representative pictures of three inde-
pendent experiments show vital (green) and dead (red) porcine articular chondrocytes (pACs) (A1–
D3) and human mesenchymal stem cells (hMSCs) (E1–H3) over a cultivation time of 7 to 35 days
(d). pACs (I) and hMSCs (J) viability per scaffold surface was calculated after 7, 21 and 35 d. Results
of the pACs (K) and hMSCs (L) colonized surface over the cultivation time. The cell seeding effi-
ciency (%) was calculated for pACs (M) and hMSCs (N) after 1 and 3 d, with no significant differ-
ences. The pure bioactive glass (BG, blue), single (1P, red), twofold (2P, green) and threefold PLGA
infiltrations (3P, yellow). Three independent experiments (n = 3) with cells from three different do-
nors were performed. Two-way ANOVA combined with the post hoc Tukey s multiple comparison
test between the groups: p values: * p < 0.05, ** p < 0.01 and *** p < 0.005. Scale bar: 200 µm.
Figure 6. Viability assay of colonized scaffolds, calculation of the cell viability per scaffold surface, thecolonized scaffold surface and the cell seeding efficiency. Representative pictures of three independentexperiments show vital (green) and dead (red) porcine articular chondrocytes (pACs) (A1–D3) andhuman mesenchymal stem cells (hMSCs) (E1–H3) over a cultivation time of 7 to 35 days (d). pACs(I) and hMSCs (J) viability per scaffold surface was calculated after 7, 21 and 35 d. Results of thepACs (K) and hMSCs (L) colonized surface over the cultivation time. The cell seeding efficiency (%)was calculated for pACs (M) and hMSCs (N) after 1 and 3 d, with no significant differences. Thepure bioactive glass (BG, blue), single (1P, red), twofold (2P, green) and threefold PLGA infiltrations(3P, yellow). Three independent experiments (n = 3) with cells from three different donors wereperformed. Two-way ANOVA combined with the post hoc Tukey´s multiple comparison test betweenthe groups: p values: * p < 0.05, ** p < 0.01 and *** p < 0.005. Scale bar: 200 µm.

Cells 2022, 11, 1577 17 of 30
Cells 2022, 11, x FOR PEER REVIEW 17 of 31
3.7. Scanning Electron Microscopy Analysis
The cell attachment of pACs and hMSCs on the different scaffolds was visualized
with the SEM analysis. After 7 and 35 days, the struts and pore walls of the BG and 1P
scaffold were almost completely colonized with pACs. The cells were flattened, spread
around the whole struts and covered the pores (Figure 7(A1–B2)). The highly dispersed
pACs in the 2P and 3P scaffolds exhibited a round cell shape not only after 7 but also after
35 days (Figure 7 (C1–D2)). The hMSCs showed a long and spindle shaped cell body with
a high number of filopodia in all four scaffold types, especially after 7 days. In the 1P
scaffold, a synthesis of fibrous ECM could be also seen that covered not only the pores but
also the PLGA (Figure 7(F1)). The PLGA could be distinguished from the glass. With in-
creasing PLGA amount, the cells were only able to adhere to the PLGA.
Figure 7. Scanning electron microscopy (SEM) of colonized scaffolds. Representative images of the
morphology not only of the pACs (A1–D2) on the scaffolds after 7 days (d) (A1–D1) and after 35 d
(A2–D2) but also of hMSCs (E1–H1) on the scaffolds after 7 (E1–H1) and 35 d (E2–H2) in dynamic
culture. The pure bioactive glass (BG, blue), single (1P, red), twofold (2P, green) and threefold PLGA
infiltrations (3P, yellow). Scale bar: 50 µm. pACs = porcine articular chondrocytes, hMSCs = human
mesenchymal stem cells, BG = bioactive glass. Single cells are marked with red arrow and cell layers
are marked by double headed arrows.
Figure 7. Scanning electron microscopy (SEM) of colonized scaffolds. Representative images of themorphology not only of the pACs (A1–D2) on the scaffolds after 7 days (d) (A1–D1) and after 35 d(A2–D2) but also of hMSCs (E1–H1) on the scaffolds after 7 (E1–H1) and 35 d (E2–H2) in dynamicculture. The pure bioactive glass (BG, blue), single (1P, red), twofold (2P, green) and threefold PLGAinfiltrations (3P, yellow). Scale bar: 50 µm. pACs = porcine articular chondrocytes, hMSCs = humanmesenchymal stem cells, BG = bioactive glass. Single cells are marked with red arrow and cell layersare marked by double headed arrows.
3.8. Sulfated Glycosaminoglycan per DNA Contents and Metabolic Activity Depend on Cell Typeand Time Point of Culturing
The GAG per DNA amount was determined after 1, 3, 7, 21 and 35 days. The GAGper DNA amount was slightly increasing over time in pAC-colonized scaffolds. At 21and the 35 days, high standard deviations could be recognized. After 21 and 35 days thepolymer-infiltrated scaffolds had a higher GAG per DNA amount than the pAC-colonizedscaffolds (Figure 8A). The GAG per DNA amount was also continuously increasing inthe hMSC-colonized BG scaffolds, while in the 1P scaffolds the highest GAG per DNAamount could be already recognized after 1 day and was then slightly decreasing. In the 2P
Cells 2022, 11, 1577 18 of 30
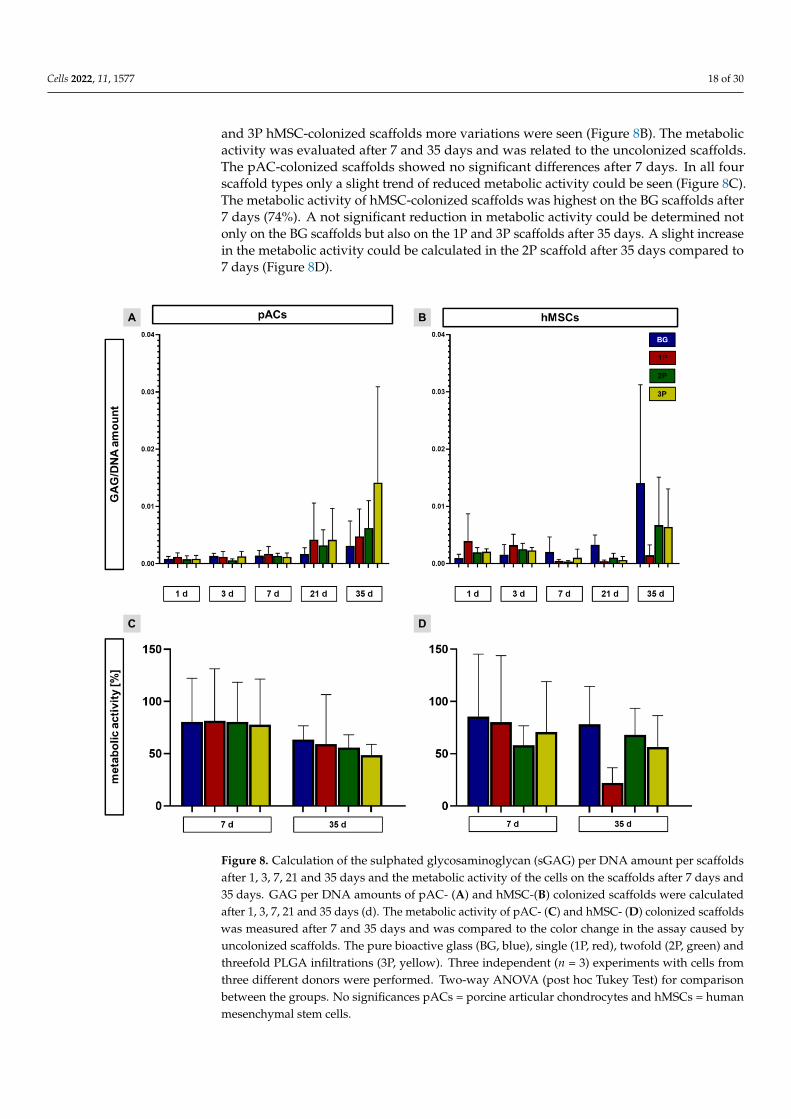
and 3P hMSC-colonized scaffolds more variations were seen (Figure 8B). The metabolicactivity was evaluated after 7 and 35 days and was related to the uncolonized scaffolds.The pAC-colonized scaffolds showed no significant differences after 7 days. In all fourscaffold types only a slight trend of reduced metabolic activity could be seen (Figure 8C).The metabolic activity of hMSC-colonized scaffolds was highest on the BG scaffolds after7 days (74%). A not significant reduction in metabolic activity could be determined notonly on the BG scaffolds but also on the 1P and 3P scaffolds after 35 days. A slight increasein the metabolic activity could be calculated in the 2P scaffold after 35 days compared to7 days (Figure 8D).
Cells 2022, 11, x FOR PEER REVIEW 18 of 31
3.8. Sulfated Glycosaminoglycan per DNA Contents and Metabolic Activity Depend on Cell
Type and Time Point of Culturing
The GAG per DNA amount was determined after 1, 3, 7, 21 and 35 days. The GAG
per DNA amount was slightly increasing over time in pAC-colonized scaffolds. At 21 and
the 35 days, high standard deviations could be recognized. After 21 and 35 days the pol-
ymer-infiltrated scaffolds had a higher GAG per DNA amount than the pAC-colonized
scaffolds (Figure 8A). The GAG per DNA amount was also continuously increasing in the
hMSC-colonized BG scaffolds, while in the 1P scaffolds the highest GAG per DNA
amount could be already recognized after 1 day and was then slightly decreasing. In the
2P and 3P hMSC-colonized scaffolds more variations were seen (Figure 8B). The metabolic
activity was evaluated after 7 and 35 days and was related to the uncolonized scaffolds.
The pAC-colonized scaffolds showed no significant differences after 7 days. In all four
scaffold types only a slight trend of reduced metabolic activity could be seen (Figure 8C).
The metabolic activity of hMSC-colonized scaffolds was highest on the BG scaffolds after
7 days (74%). A not significant reduction in metabolic activity could be determined not
only on the BG scaffolds but also on the 1P and 3P scaffolds after 35 days. A slight increase
in the metabolic activity could be calculated in the 2P scaffold after 35 days compared to
7 days (Figure 8D).
Figure 8. Calculation of the sulphated glycosaminoglycan (sGAG) per DNA amount per scaffolds
after 1, 3, 7, 21 and 35 days and the metabolic activity of the cells on the scaffolds after 7 days and
35 days. GAG per DNA amounts of pAC- (A) and hMSC-(B)colonized scaffolds were calculated
after 1, 3, 7, 21 and 35 days (d). The metabolic activity of pAC- (C) and hMSC- (D) colonized scaffolds
was measured after 7 and 35 days and was compared to the color change in the assay caused by
uncolonized scaffolds. The pure bioactive glass (BG, blue), single (1P, red), twofold (2P, green) and
threefold PLGA infiltrations (3P, yellow). Three independent (n = 3) experiments with cells from
Figure 8. Calculation of the sulphated glycosaminoglycan (sGAG) per DNA amount per scaffoldsafter 1, 3, 7, 21 and 35 days and the metabolic activity of the cells on the scaffolds after 7 days and35 days. GAG per DNA amounts of pAC- (A) and hMSC-(B) colonized scaffolds were calculatedafter 1, 3, 7, 21 and 35 days (d). The metabolic activity of pAC- (C) and hMSC- (D) colonized scaffoldswas measured after 7 and 35 days and was compared to the color change in the assay caused byuncolonized scaffolds. The pure bioactive glass (BG, blue), single (1P, red), twofold (2P, green) andthreefold PLGA infiltrations (3P, yellow). Three independent (n = 3) experiments with cells fromthree different donors were performed. Two-way ANOVA (post hoc Tukey Test) for comparisonbetween the groups. No significances pACs = porcine articular chondrocytes and hMSCs = humanmesenchymal stem cells.

Cells 2022, 11, 1577 19 of 30
3.9. Cartilage Related Protein Expression
Cartilage-specific ECM proteins, such as collagen type II, cartilage proteoglycans (PG)and the chondrogenic transcription factor SOX9 were analyzed by immunocytochemicalstaining (Figure 9). The pACs and hMSCs were cultivated on the different scaffold variantsfor 21 days before being immunolabeled for collagen type II (green), PG (red) and thetranscription factor SOX9 (green). The ECM proteins were present around, between andwithin the cells. The protein expression of collagen type II, PG and SOX9 tended to bereduced with a higher amount of PLGA in pAC-colonized scaffold variants (Figure 9I).The collagen type II immunoreactive area per cell of pAC-colonized BG scaffolds (0.0037± 0.0027%) was significantly larger in comparison to the pAC-colonized 3P scaffolds(0.00023 ± 0.00094%). The relative expressions of PG and SOX9 were generally higher inBG scaffolds than in PLGA-infiltrated BG scaffolds colonized with pACs (not significant).
Cells 2022, 11, x FOR PEER REVIEW 19 of 31
three different donors were performed. Two-way ANOVA (post hoc Tukey Test) for comparison
between the groups. No significances pACs = porcine articular chondrocytes and hMSCs = human
mesenchymal stem cells.
3.9. Cartilage Related Protein Expression
Cartilage-specific ECM proteins, such as collagen type II, cartilage proteoglycans
(PG) and the chondrogenic transcription factor SOX9 were analyzed by immunocyto-
chemical staining (Figure 9). The pACs and hMSCs were cultivated on the different scaf-
fold variants for 21 days before being immunolabeled for collagen type II (green), PG (red)
and the transcription factor SOX9 (green). The ECM proteins were present around, be-
tween and within the cells. The protein expression of collagen type II, PG and SOX9
tended to be reduced with a higher amount of PLGA in pAC-colonized scaffold variants
(Figure 9I). The collagen type II immunoreactive area per cell of pAC-colonized BG scaf-
folds (0.0037 ± 0.0027%) was significantly larger in comparison to the pAC-colonized 3P
scaffolds (0.00023 ± 0.00094%). The relative expressions of PG and SOX9 were generally
higher in BG scaffolds than in PLGA-infiltrated BG scaffolds colonized with pACs (not
significant).
In general, the protein expression per cell of collagen type II and SOX9 was higher in
hMSC-colonized scaffolds than in pAC-colonized scaffolds. The hMSC-colonized 2P scaf-
folds tended to express more proteins in comparison to the other colonized scaffolds var-
iants. No significant differences could be evaluated between the different scaffold variants
colonized with hMSCs (Figure 9J).
Figure 9. Cartilage-specific protein expression after 21 days of scaffold colonization. Representative
immunocytochemical staining of collagen type II (green) and cell nuclei (blue) of pACs (A1–D1) and
hMSCs (E1–H1), of cartilage proteoglycans (red) and cell nuclei (blue) of pACs (A2–D2) and hMSCs
(E2–H2) and the transcription factor SOX9 (green) and the cell nuclei (blue) of pACs (A3–D3) and
hMSCs (E3–H3). The calculation of the immunoreactivity (collagen type II, proteoglycans and
Figure 9. Cartilage-specific protein expression after 21 days of scaffold colonization. Representativeimmunocytochemical staining of collagen type II (green) and cell nuclei (blue) of pACs (A1–D1) andhMSCs (E1–H1), of cartilage proteoglycans (red) and cell nuclei (blue) of pACs (A2–D2) and hMSCs(E2–H2) and the transcription factor SOX9 (green) and the cell nuclei (blue) of pACs (A3–D3) andhMSCs (E3–H3). The calculation of the immunoreactivity (collagen type II, proteoglycans and SOX9)per cell was performed for pACs (I) and hMSCs (J). The pure bioactive glass (BG, blue), single (1P,red), twofold (2P, green) and threefold PLGA infiltrations (3P, yellow). Scale bar: 100 µm. n = 3.One-way ANOVA (post hoc Tukey Test) for comparison between the groups. p values: **** p < 0.0001.pACs = porcine articular chondrocytes and hMSCs = human mesenchymal stem cells.

Cells 2022, 11, 1577 20 of 30
In general, the protein expression per cell of collagen type II and SOX9 was higherin hMSC-colonized scaffolds than in pAC-colonized scaffolds. The hMSC-colonized 2Pscaffolds tended to express more proteins in comparison to the other colonized scaffoldsvariants. No significant differences could be evaluated between the different scaffoldvariants colonized with hMSCs (Figure 9J).
3.10. Non-Induced Human Mesenchymal Stem Cells Express Cartilage-Specific Genes
Several cartilage-associated genes were analyzed by real-time PCR analysis to estimatethe effect of BG and BG with single infiltration with PLGA on pACs and hMSCs after 7 and21 days of dynamic cultivation and compared to the native porcine cartilage (marked asred line). Gene expression of collagen types II, IX and XI as the most prominent cartilage-specific collagen types was upregulated in the pACs cultures after 21 days in comparisonto the 7 day cultivation time point for both scaffold variants (Figure 10A–C). After 21 daysthe expression was also higher in comparison to the native porcine cartilage. In thehMSCs culture, the expression of collagen type II (except for the BG scaffolds 21 days) (notsignificantly), IX (highly significantly) and collagen type XI (significantly) was lower incomparison to the native porcine cartilage, but a time dependent increase in the expressioncould be seen in the colonized BG scaffolds (Figure 10A–C). The transcription factors SOX9and FOXO1 were not only expressed by the pACs but also by the hMSCs on the BG and 1Pscaffolds. In general, the expression was lower (difference not significant, except for 21 daysold pure BG scaffolds) in comparison to the native porcine cartilage and pACs showeda higher expression than hMSCs (Figure 10D,E). After 21 days of cultivation time, theexpression of aggrecan was upregulated in comparison to the 7 days, not only in the pACsbut also in the hMSC culture. After 21 days the expression of aggrecan in the pAC culturewas higher (not significant) than in the native porcine cartilage (Figure 10F). Relative geneexpression of COMP was significantly lower in both pACs and hMSCs compared withnative porcine cartilage, but there was an increasing trend in COMP expression in BGand 1P scaffolds in both cultures over time (Figure 10G). The relative collagen type I geneexpression of pAC cultures increased in both scaffold types over time in contrary to thehMSCs, where a decrease over time could be observed with the 1P scaffolds (Figure 10H).The hypertrophic marker collagen type X was significantly lower expressed in the pAC-colonized BG and 1P scaffolds in comparison to the native porcine cartilage. The relativecollagen type X expression was slightly reduced in 1P scaffolds seeded with hMSCs (notsignificant) with increasing time but still higher in comparison to the native porcine cartilage(Figure 10I).

Cells 2022, 11, 1577 21 of 30Cells 2022, 11, x FOR PEER REVIEW 21 of 31
Figure 10. Normalized gene expression of cartilage extracellular matrix components and the tran-
scription factors SOX9 and FOXO1 after 7 (full bars) and 21 (checkered bars) days (d) in the BG
scaffolds (blue) and the PLGA-infiltrated BG scaffolds (red). Relative gene expression of collagen
types II (A), IX (B), XI (C), SOX9 (D), FOXO1 (E), aggrecan (F), COMP (G), collagen types I (H) and
X (I) were related to the native porcine cartilage (red line = 1). The pure bioactive glass (BG, blue)
and single (1P, red) PLGA infiltration. Three independent experiments with cells of three different
Figure 10. Normalized gene expression of cartilage extracellular matrix components and the tran-scription factors SOX9 and FOXO1 after 7 (full bars) and 21 (checkered bars) days (d) in the BGscaffolds (blue) and the PLGA-infiltrated BG scaffolds (red). Relative gene expression of collagentypes II (A), IX (B), XI (C), SOX9 (D), FOXO1 (E), aggrecan (F), COMP (G), collagen types I (H) and X(I) were related to the native porcine cartilage (red line = 1). The pure bioactive glass (BG, blue) andsingle (1P, red) PLGA infiltration. Three independent experiments with cells of three different donorsare summarized and show mean with standard deviation. Significant differences were calculated afterone-way ANOVA (post hoc Tukey Test): p values * p < 0.05, ** p < 0.01, **** p < 0.0001. Gene expressionwas normalized to the reference gene β-actin (ACTB). pACs: porcine articular chondrocytes, hMSCs:human mesenchymal stem cells.

Cells 2022, 11, 1577 22 of 30
4. Discussion
The basic idea behind the invention of bioactive glass was to facilitate bone regenera-tion [36]. Numerous studies have shown that BG can lead to an increase in the adherenceand proliferation of osteoblasts through the hydroxyapatite layer formed [52–54], but alsothat BG stimulated bone formation [55–57]. Well-known examples for silicate bioactiveglasses are BG1393, BG45S5 and BG60S5 [58]. One shared characteristic of them is theformation of a hydroxyapatite layer by typical conventional BGs [59] which is due to theirchemical composition, releasing Ca2+ and PO4
3− ions [59,60]. In some in vitro studies,cartilage regeneration has also been addressed with these glasses [61,62]. However, theseBGs were only used as composite material [61,62] and not as “single material” scaffolds likein our study. The fact that BG can be used for cartilage tissue engineering is insufficientlyexplored so far.
In a previous study we showed that a highly porous bioactive glass scaffold allows theadhesion, survival and cartilage ECM expression of primary pACs and hMSCs as well aschondrogenesis [49]. Comparing two cell types, this previous study revealed the followingresults: chondrogenesis of hMSCs was induced by a pure BG scaffold without any chemicalchondrogenic supplements, and pACs maintained their chondrocyte-specific phenotypeover the whole in vitro culture period of 35 days. Nevertheless, the pure BG scaffold is notsufficiently stable for the mechanical load in the knee joint. An ideal scaffold for cartilageregeneration should resist the mechanical loading during joint movements and provide anappropriate 3D structure for cell survival, ECM formation and nutrient transport [63,64].For this reason, infiltration with PLGA was performed in the current study to improvethe stability of the entire scaffold. A polymer was chosen for BG infiltration, due to itsgood processability, low reactivity and its biodegradability [65,66]. In addition, previousstudies showed cytocompatibility of polymers like PLLA with chondrogenic cells [48,67].Until now, it was still unclear which amount of PLGA is useful to increase the mechanicalstability of the scaffold. As the results showed, the infiltration process with PLGA could befurther optimized in future, since the polymer was not homogeneously distributed insidethe scaffold because it was a handmade process not automated by devices. However, in thisstudy the basic question of whether an optimal scaffold topology can be achieved has beenaddressed and, further investigations of BG/PLGA composites will also use establishedfabrication techniques [48]. The inhomogeneity in PLGA distribution in the BG scaffolddid not affect the overall porosity of these composite scaffolds. Further optimization ofthis technique for more homogeneous infiltration, e.g., under rotatory conditions is afocus of future experiments as well as the opportunity to apply other commonly knowntechniques such as thermally induced phase separation (TIPS). Indeed, many differentprotocols and fabrication techniques exist to establish composite scaffolds with syntheticpolymers including the TIPS, Fused Deposition Modeling (FDM) and electrospinning (ESP)with cooling system [48,66,68,69], which are costly and time consuming. Therefore, a simpleand quick infiltration method was chosen. One important advantage of this method is, that,as supported by the data, the scaffold topology, particularly the porosity, previously provento be useful for cartilage tissue engineering [49] did not show major changes by polymerintegration into the BG scaffold. Porosity and pore interconnectivity are very important notonly for the maintenance of the cell phenotype, but also for cell migration into inner partsof the scaffold [67,70]. Despite PLGA infiltration, the total porosity in our scaffolds was stillvery high (over 76%). As in other studies describing composites of polymers like PLLA,PLGA with BG particles, no significant correlation between polymer/BG amount andporosity was found [71–73]. It is unclear whether the inhomogeneous polymer distributionin the scaffold also affects the cells. In particular, the viability and SEM images suggestthat increased polymer contents in the composite scaffold may reduce the direct contactof pACs with the BG and thus, adherence may also be impaired. The cell distributionwithin the pores is not only essential for bone, but also for cartilage regeneration and alsothe cell morphology provides information about cell-material interactions. The evaluationof cell morphology was performed with SEM, which showed not only the cell adherence

Cells 2022, 11, 1577 23 of 30
at the glass struts as well as at the polymer, but allowed also estimations concerning thecytoskeleton architecture. This is supported by another study that showed the typicalelongated cell body with filopodia of adipose tissue-derived mesenchymal stromal cellson BG45S5/PLLA scaffolds [74] or of mouse bone-derived mesenchymal stem cells onBG/PLGA scaffolds [75]. Furthermore, it could be possible that through PLGA infiltration,the pores become too “closed” for chondrocytes and a cell–cell interaction or the supplywith suitable nutrients might be reduced. Nevertheless, small cell cluster formation asobserved with the pACs on 2P and 3P might not hinder chondrogenesis since mesenchymalcell condensations are known to initiate chondrogenesis during development of cartilage.Even though the distribution of PLGA was not completely uniform, an increase in stabilitywas achieved, primarily before the leaching process. The leaching process applied hereis completely different and not comparable with those described in other studies thatused a salt leaching method to produce the pores inside biodegradable scaffolds for boneregeneration [71,76–78]. Nevertheless, the leaching process of CAR12N performed withHCl is necessary to form a bioactive gel layer around the glass struts and to achievebioactivity by ion release. During the leaching process in HCl, the 3P scaffolds exhibited ahigher pH fluctuation than the pure BG scaffolds, which resulted in a more uniform pHincrease over time. Interestingly, the pH of all PLGA-infiltrated scaffolds was always lowerthan that of BG scaffolds during storage in water (28 days) and was in the range suitable forcell culture. It may suggest that the PLGA prevents an ion release from the BG by coveringthe gel layer, but there may also be some hydrolytic degradation of the PLGA in acidiclactic acid monomers [66]. In a previous study, it has already been published that PLGAled to a release of acidic degradation products, both in vitro and in vivo [79]. However, thePLGA used in this study has a long degradation profile as reported by the manufacturer(Evonik) of at least 18 months.
Modulation of the slightly alkaline pH associated with the BG by polymers likePLLA presents an advantage of this material combination for applications in the biolog-ical system [71]. PLGA/BG45S5 scaffolds compensate the pH of PBS solution [80]. Thecalculation of the exact amount of ion release was not performed in this study but will becarried out in future. It is important due to the fact that the ion release in a therapeuticdose is responsible for the gel layer formation, the cell adherence on the glass struts andcell proliferation [81–85].
The ion release and hence, bioactivity, can be also seen as a therapeutical tool [86–89]and has possibly stimulatory effects on intracellular calcium spiking, ECM production orcell proliferation, similar to mechanotransduction [90]. Mechanical stimuli, like a dynamicrotation system were used to achieve cell attachment in this study. We could show, inaccordance to other studies which had a homogenous cell distribution on the scaffoldsurface [91], an increase in cell viability [92] and of sGAG production through the continu-ous nutrition flow in comparison to static cultivation [93]. The mechanical stimuli will berecognized by the primary cilia of chondrocytes, which are non-motile sensory organelleswith a few micrometer length [94]. Integrins, especially α2, α3 and β1, accomplish chon-drocyte adherence to the ECM and are expressed on the primary cilium [95]. It has beenshown that β1-integrins are responsible for adherence to biodegradable polymers, such asPGA, PLA, and PCL, in both, chondrocytes and MSCs [96].
Our current study confirmes a high cyto- and biocompatibility of PLGA functionalizedBG scaffolds (1P, 2P, 3P) with both cell types by the cytotoxicity and viability assay not onlyafter 7 and 21 days but also after 35 days of cultivation. Porcine articular chondrocytes wereselected due to the fact that they can be harvested from healthy knee joints, their easy andabundant availability, superior proliferation and ECM synthesis capacities. The use of bonemarrow-derived hMSCs was chosen because they are easily accessible, have the ability ofchondrogenic differentiation and, the problem of immune rejection after implantation, dueto low immunogenicity, could be circumvented [97,98].
In contrast to pACs, the hMSCs showed not only better adherence to the scaffoldsinfiltrated multiple times with PLGA, but also maintenance of DNA content and protein

Cells 2022, 11, 1577 24 of 30
expression over the cultivation period. It should be emphasized that the chondrocyte-colonized area of 1P scaffolds was comparable to the colonized area of BG scaffolds,whereas the adherence of pACs on scaffolds decreased with higher PLGA content. Thisfact led us to the decision to perform further PCR analyses with the BG and 1P scaffoldvariants. There were discrepancies between colonized area and measured DNA contentsprobably due to the flattened cell shape of hMSCs. The results show that PLGA does notaffect chondrogenesis in pACs. Cell adherence is a key criterion to be fulfilled for a cartilagescaffold and is also related to cell cycle progression and hence, DNA synthesis [99]. It isunclear how many cells adhere inside the scaffold. Unfortunately, conventional cuttingtechniques undertaken to show the cell distribution and ECM deposition inside the scaf-folds failed due to the high glass content and hence, the brittleness of the scaffolds. Sincehyaline cartilage consists of about 60% water and 40% ECM, one of the main goals forcartilage tissue engineering is to maintain and increase ECM synthesis [100]. Even thoughthe metabolic activity of hMSCs in multiple times PLGA-infiltrated scaffolds decreasedduring the cultivation period, significant increases in sGAG synthesis but also in proteinexpression of collagen type II, cartilage related proteoglycans and the chondrogenic tran-scription factor SOX9 could be detected. The transcription factor SOX9 is expressed andactivated during mesenchymal condensation and in native cartilage tissue. Furthermore,SOX9 is an activator of, for example, collagen type II, IX, aggrecan and matrilin 3 andtherefore plays, an important role during early chondrogenesis in 3D cultures [101–104].Since there were no major differences in protein expression between the multiple andsingle-infiltrated BG scaffolds except for a significant decrease in collagen type II synthesisby pACs in 3P scaffolds, gene expression analysis was restricted to BG and 1P. We wereable to confirm this relationship between collagen type II and SOX9, although the relativegene expression of SOX9 was not significantly increased over cultivation time. An increasein the relative gene expression of collagen type II and aggrecan was detected in the pACsbut also in the hMSC-colonized BG and 1P scaffolds. Another early transcription factorwhich is very important within the embryonal condensation stage during chondrogenesis,is FOXO1 [105]. The relative expression of FOXO1 per se in undifferentiated hMSCs inthe culture indicated that CAR12N probably initiated the chondrogenesis. Some authorsfound that FOXO1 also contributes to the maintenance of cartilage homeostasis in adultchondrocytes [106,107]. In addition, future investigation will be performed with respectto dedifferentiation and hypertrophic differentiation of chondrocytes using immunocyto-chemical staining for collagen type I and the hypertrophy markers collagen type X, andmatrix metalloproteinase (MMP)13 as well as osteogenic runt-related transcription factor 2(RUNX2) [108,109] or alkaline phosphatase.
To allow longterm culture we decided to use supplements such as 10% FCS and5% PL for pAC and hMSC scaffold cultures as well as added amphotericin to inhibitfungal contamination. These additives could impair chondrogenesis or facilitate unwantedhypertrophic differentiation, but still allowed cartilage-specific marker expression in ourstudy suggesting that the BG had sufficient chondro-inductive effects. Due to the factthat the relative gene expression of collagen types I and X tended to be downregulated inlonger cultivation time, we hypothesized a beginning of chondrogenesis. Moreover, theupregulation of the relative gene expression of minor collagens like type IX and XI not onlyin the pACs but especially in the hMSCs indicated that the formation of a stable collagennetwork and thus the organization of a complex cartilage ECM had begun with a long-term cultivation [110]. Another ECM component, which is responsible for compressiveresilience of articular cartilage during joint loading, is the proteoglycan aggrecan [111]. Theupregulation of aggrecan and COMP in both, pAC and hMSC cultures and the fact thatother scientists have also demonstrated the regulation by mechanical stimuli of these ECMcomponents confirmed our hypothesis regarding the importance of a dynamic cultivationmethod [112–115]. It seemed that not only the dynamic cultivation strategy and the porosityof the scaffolds but also the pH has influence on the cross-linking of the collagen chains.

Cells 2022, 11, 1577 25 of 30
This effect of H+ ions on cross-linking has been reported by another group, which showedthe influence of BG45S5 on the bone regeneration [116].
Based on these data, our hypothesis for further experiments is that these infiltratedPLGA BG scaffolds are might be well suitable for a co-culture model to regenerate cartilagedefects. In the bottom region, with a higher amount of PLGA, hMSCs were colonized,while chondrocytes will have direct contact to the pure BG struts in the upper phase ofthe scaffolds. In addition, co-culture was also advocated to prevent dedifferentiation andinstead, promote cartilage-associated ECM formation [117].
A degradation of the colonized scaffolds with and without PLGA was not observedduring the 35 days of culturing, since size and shape of the scaffolds were maintained. Aslow degradation profile is wanted for the scaffolds since neocartilage formation by thechondrogenic cells needs also a long time. Nevertheless, the degradation and the exactrelease of silicon (Si), sodium (Na), phosphate (P) and boron (B) has to be monitored indetail in a long-term experiment not only in vitro but also in vivo.
5. Conclusions
The present results confirmed that these scaffolds allow the adherence, proliferation,sGAG synthesis and cartilage-specific gene and protein expression. Thus, our CAR12N scaf-folds are well suited for cartilage tissue engineering. A detailed scaffold characterization inview of PLGA distribution and effects of PLGA integration on pore perimeters, strut diam-eters and porosity revealed no significant changes in overall topology, which was suitablefor pAC and hMSC adherence. While PLGA infiltration had no major effect on pH changesafter leaching, it is of utmost importance for mechanical loading and hMSC-colonization.PLGA-infiltrated scaffolds had a higher stiffness in comparison to the pure BG, which areoften regarded as too brittle for future clinical application. Nevertheless, the biomechanicaldata are preliminary and a detailed comparison of the scaffold with PLGA and nativecartilage has to be undertaken. This study demonstrated that chondrogenesis, particularlyof hMSCs, and the maintenance of the chondrogenic phenotype of pACs occurred in singlePLGA-infiltrated scaffolds without inductive growth factor supplementation. Further workshould focus on the gene expression of cartilage related matrix proteins like collagen typeII, XI, IX and XI, aggrecan and the transcription factors SOX9 and FOXO1 of pACs andhMSCs on colonized CAR12N/PLGA composite scaffolds after mechanical loading in abioreactor. Testing the biocompatibility and chondrogenesis in vivo with the pure CAR12Nand single PLGA/BG scaffolds are one step further towards clinical application for cartilagedefect treatments.
Particularly, the combined implantation of single PLGA-infiltrated CAR12N scaffoldswith hMSCs isolated from an iliac crest biopsy during the same surgery into chondraldefects could provide a reasonable approach as well as to place a cell-free scaffolds on adefect providing access to subchondral bone marrow.
6. Patents
The BG scaffolds (CAR12N) were produced by the patented glass composition(DE 10 2018 114 946 B3, 2019). The scaffold systems were prepared according to ourpatent DE 10 2019 124 879 A1.
Supplementary Materials: The following supporting information can be downloaded at: https://www.mdpi.com/article/10.3390/cells11091577/s1. Figure S1: Viability assay of colonized scaffolds.Figure S2: Cytotoxicity assay using BG (blue bars), 1P (red bars), 2P (green bars) and 3P (yellow bars)scaffold extracts.
Author Contributions: Data curation: C.G., Conceptualization, C.G., G.S.-T., methodology, C.G.,S.M., A.P., S.B., V.K., A.R. and G.S.-T., validation, C.G. and G.S.-T., formal analysis, C.G. and G.S.-T.,S.W., A.L., T.M.W. and B.M., investigation, C.G., G.S.-T., A.P., S.M. and A.R., supervision: G.S.-T., S.W.,T.M.W. and A.L., funding acquisition: C.G. and M.H., project administration: C.G., M.H. and G.S.-T.,visualization: C.G., resources: G.S.-T., H.K., B.M. and K.S.-E., writing—original draft preparation C.G.

Cells 2022, 11, 1577 26 of 30
and G.S.-T., writing—review and editing, C.G., G.S.-T., S.M., S.W., A.L., A.R., T.M.W., K.S.-E., B.M.,M.H., H.K. and S.B. All authors have read and agreed to the published version of the manuscript.
Funding: This research was partly supported by a grant of the Klinikum Nuremberg foundation (toClemens Gögele), by a research grant of the University of Salzburg (to Clemens Gögele), by a grant ofthe Staedtler-foundation (to Markus Hornfeck), by a grant of the pilot research project of the technicaluniversity Nuremberg (to Markus Hornfeck).
Institutional Review Board Statement: The study was conducted in accordance with the Declarationof Helsinki, and approved by the Ethics Committee of Bavarian medical association (protocol codeno.17074, 6 February 2018).
Informed Consent Statement: Informed consent was obtained from all subjects involved in the study.
Data Availability Statement: Not applicable.
Acknowledgments: We thank Clea Kline for proofreading and Vittorio-Enrico Parziale for con-tributing to scaffold production. We thank Christian Kaps for providing the K4IM synoviocytecell line.
Conflicts of Interest: The authors declare no conflict to interest. They confirm that this manuscripthas not been published previously. It is not under consideration for publication elsewhere, and ifaccepted, it will not be published elsewhere in the same form, in English or in any other language.The corresponding author confirms the above statements on behalf of the co-authors.
References1. Carballo, C.B.; Nakagawa, Y.; Sekiya, I.; Rodeo, S.A. Basic Science of Articular Cartilage. Clin. Sports Med. 2017, 36, 413–425.
[CrossRef] [PubMed]2. Archer, C.W.; Francis-West, P. The chondrocyte. Int. J. Biochem. Cell Biol. 2003, 35, 401–404. [CrossRef]3. Stockwell, R.A. The interrelationship of cell density and cartilage thickness in mammalian articular cartilage. J. Anat. 1971, 109,
411–421. [PubMed]4. Ulrich-Vinther, M.; Maloney, M.D.; Schwarz, E.M.; Rosier, R.; O’Keefe, R.J. Articular cartilage biology. J. Am. Acad. Orthop. Surg.
2003, 11, 421–430. [CrossRef]5. Chen, S.; Fu, P.; Wu, H.; Pei, M. Meniscus, articular cartilage and nucleus pulposus: A comparative review of cartilage-like tissues
in anatomy, development and function. Cell Tissue Res. 2017, 370, 53–70. [CrossRef]6. Zhang, S.; Hu, B.; Liu, W.; Wang, P.; Lv, X.; Chen, S.; Liu, H.; Shao, Z. Articular cartilage regeneration: The role of endogenous
mesenchymal stem/progenitor cell recruitment and migration. Semin. Arthritis Rheum. 2020, 50, 198–208. [CrossRef]7. Sarzi-Puttini, P.; Cimmino, M.A.; Scarpa, R.; Caporali, R.; Parazzini, F.; Zaninelli, A.; Atzeni, F.; Canesi, B. Osteoarthritis: An
overview of the disease and its treatment strategies. Semin. Arthritis Rheum. 2005, 35, 1–10. [CrossRef]8. Schulze-Tanzil, G. Experimental Therapeutics for the Treatment of Osteoarthritis. J. Exp. Pharmacol. 2021, 13, 101–125. [CrossRef]9. Safari, R.; Jackson, J.; Sheffield, D. Digital Self-Management Interventions for People With Osteoarthritis: Systematic Review With
Meta-Analysis. J. Med. Internet Res. 2020, 22, e15365. [CrossRef]10. Brittberg, M.; Lindahl, A.; Nilsson, A.; Ohlsson, C.; Isaksson, O.; Peterson, L. Treatment of deep cartilage defects in the knee with
autologous chondrocyte transplantation. N. Engl. J. Med. 1994, 331, 889–895. [CrossRef]11. Brittberg, M. Autologous chondrocyte transplantation. Clin. Orthop. Relat. Res. 1999, 367, S147–S155. [CrossRef] [PubMed]12. Brittberg, M.; Peterson, L.; Sjogren-Jansson, E.; Tallheden, T.; Lindahl, A. Articular cartilage engineering with autologous
chondrocyte transplantation. A review of recent developments. J. Bone Joint Surg. Am. 2003, 85, 109–115. [CrossRef]13. Brittberg, M. Autologous chondrocyte implantation–technique and long-term follow-up. Injury 2008, 39, S40–S49. [CrossRef]
[PubMed]14. Richter, D.L.; Schenck, R.C., Jr.; Wascher, D.C.; Treme, G. Knee Articular Cartilage Repair and Restoration Techniques: A Review
of the Literature. Sports Health 2016, 8, 153–160. [CrossRef] [PubMed]15. Brittberg, M.; Recker, D.; Ilgenfritz, J.; Saris, D.B.F.; Group, S.E.S. Matrix-Applied Characterized Autologous Cultured Chon-
drocytes Versus Microfracture: Five-Year Follow-up of a Prospective Randomized Trial. Am. J. Sports Med. 2018, 46, 1343–1351.[CrossRef]
16. Brittberg, M. Cell carriers as the next generation of cell therapy for cartilage repair: A review of the matrix-induced autologouschondrocyte implantation procedure. Am. J. Sports Med. 2010, 38, 1259–1271. [CrossRef]
17. Gomoll, A.H.; Gillogly, S.D.; Cole, B.J.; Farr, J.; Arnold, R.; Hussey, K.; Minas, T. Autologous chondrocyte implantation in thepatella: A multicenter experience. Am. J. Sports Med. 2014, 42, 1074–1081. [CrossRef]
18. Kreuz, P.C.; Kalkreuth, R.H.; Niemeyer, P.; Uhl, M.; Erggelet, C. Long-Term Clinical and MRI Results of Matrix-AssistedAutologous Chondrocyte Implantation for Articular Cartilage Defects of the Knee. Cartilage 2019, 10, 305–313. [CrossRef]

Cells 2022, 11, 1577 27 of 30
19. Nawaz, S.Z.; Bentley, G.; Briggs, T.W.; Carrington, R.W.; Skinner, J.A.; Gallagher, K.R.; Dhinsa, B.S. Autologous chondrocyteimplantation in the knee: Mid-term to long-term results. J. Bone Joint Surg. Am. 2014, 96, 824–830. [CrossRef]
20. Ogura, T.; Mosier, B.A.; Bryant, T.; Minas, T. A 20-Year Follow-up After First-Generation Autologous Chondrocyte Implantation.Am. J. Sports Med. 2017, 45, 2751–2761. [CrossRef]
21. Mistry, H.; Connock, M.; Pink, J.; Shyangdan, D.; Clar, C.; Royle, P.; Court, R.; Biant, L.C.; Metcalfe, A.; Waugh, N. Autologouschondrocyte implantation in the knee: Systematic review and economic evaluation. Health Technol Assess 2017, 21, 1–294.[CrossRef] [PubMed]
22. Anders, S.; Schaumburger, J.; Schubert, T.; Grifka, J.; Behrens, P. [Matrix-associated autologous chondrocyte transplantation(MACT). Minimally invasive technique in the knee]. Oper. Orthop. Traumatol. 2008, 20, 208–219. [CrossRef] [PubMed]
23. Schnabel, M.; Marlovits, S.; Eckhoff, G.; Fichtel, I.; Gotzen, L.; Vecsei, V.; Schlegel, J. Dedifferentiation-associated changes inmorphology and gene expression in primary human articular chondrocytes in cell culture. Osteoarthr. Cartil. 2002, 10, 62–70.[CrossRef] [PubMed]
24. Schulze-Tanzil, G. Activation and dedifferentiation of chondrocytes: Implications in cartilage injury and repair. Ann. Anat. 2009,191, 325–338. [CrossRef] [PubMed]
25. McCulloch, K.; Litherland, G.J.; Rai, T.S. Cellular senescence in osteoarthritis pathology. Aging Cell 2017, 16, 210–218. [CrossRef]26. Li, J.; Pei, M. Cell senescence: A challenge in cartilage engineering and regeneration. Tissue Eng. Part B Rev. 2012, 18, 270–287.
[CrossRef]27. Portron, S.; Hivernaud, V.; Merceron, C.; Lesoeur, J.; Masson, M.; Gauthier, O.; Vinatier, C.; Beck, L.; Guicheux, J. Inverse
regulation of early and late chondrogenic differentiation by oxygen tension provides cues for stem cell-based cartilage tissueengineering. Cell Physiol. Biochem. 2015, 35, 841–857. [CrossRef]
28. Hubka, K.M.; Dahlin, R.L.; Meretoja, V.V.; Kasper, F.K.; Mikos, A.G. Enhancing chondrogenic phenotype for cartilage tissueengineering: Monoculture and coculture of articular chondrocytes and mesenchymal stem cells. Tissue Eng. Part B Rev. 2014, 20,641–654. [CrossRef]
29. Bian, L.; Zhai, D.Y.; Mauck, R.L.; Burdick, J.A. Coculture of human mesenchymal stem cells and articular chondrocytes reduceshypertrophy and enhances functional properties of engineered cartilage. Tissue Eng. Part A 2011, 17, 1137–1145. [CrossRef]
30. Wasyleczko, M.; Sikorska, W.; Chwojnowski, A. Review of Synthetic and Hybrid Scaffolds in Cartilage Tissue Engineering.Membranes 2020, 10, 348. [CrossRef]
31. Vinatier, C.; Guicheux, J. Cartilage tissue engineering: From biomaterials and stem cells to osteoarthritis treatments. Ann Phys.Rehabil. Med. 2016, 59, 139–144. [CrossRef] [PubMed]
32. Stampoultzis, T.; Karami, P.; Pioletti, D.P. Thoughts on cartilage tissue engineering: A 21st century perspective. Curr. Res. Transl.Med. 2021, 69, 103299. [CrossRef]
33. Bruzauskaite, I.; Bironaite, D.; Bagdonas, E.; Bernotiene, E. Scaffolds and cells for tissue regeneration: Different scaffold poresizes-different cell effects. Cytotechnology 2016, 68, 355–369. [CrossRef] [PubMed]
34. Kalkan, R.; Nwekwo, C.W.; Adali, T. The Use of Scaffolds in Cartilage Regeneration. Crit. Rev. Eukaryot. Gene Expr. 2018, 28,343–348. [CrossRef] [PubMed]
35. Dang, W.; Wang, X.; Li, J.; Deng, C.; Liu, Y.; Yao, Q.; Wang, L.; Chang, J.; Wu, C. 3D printing of Mo-containing scaffolds withactivated anabolic responses and bi-lineage bioactivities. Theranostics 2018, 8, 4372–4392. [CrossRef]
36. Hench, L.L. The story of Bioglass. J. Mater. Sci. Mater Med. 2006, 17, 967–978. [CrossRef]37. Marquardt, L.M.; Day, D.; Sakiyama-Elbert, S.E.; Harkins, A.B. Effects of borate-based bioactive glass on neuron viability and
neurite extension. J. Biomed. Mater. Res. A 2014, 102, 2767–2775. [CrossRef]38. Marza, S.M.; Magyari, K.; Bogdan, S.; Moldovan, M.; Pestean, C.; Nagy, A.; Tabaran, F.; Licarete, E.; Suarasan, S.;
Dreanca, A.; et al. Skin wound regeneration with bioactive glass-gold nanoparticles ointment. Biomed. Mater. 2019,14, 025011. [CrossRef]
39. Lin, R.; Deng, C.; Li, X.; Liu, Y.; Zhang, M.; Qin, C.; Yao, Q.; Wang, L.; Wu, C. Copper-incorporated bioactive glass-ceramicsinducing anti-inflammatory phenotype and regeneration of cartilage/bone interface. Theranostics 2019, 9, 6300–6313. [CrossRef]
40. Fu, Q.; Saiz, E.; Rahaman, M.N.; Tomsia, A.P. Bioactive glass scaffolds for bone tissue engineering: State of the art and futureperspectives. Mater. Sci. Eng. C Mater. Biol. Appl. 2011, 31, 1245–1256. [CrossRef]
41. Kaur, G.; Kumar, V.; Baino, F.; Mauro, J.C.; Pickrell, G.; Evans, I.; Bretcanu, O. Mechanical properties of bioactive glasses, ceramics,glass-ceramics and composites: State-of-the-art review and future challenges. Mater. Sci. Eng. C Mater. Biol. Appl. 2019, 104,109895. [CrossRef] [PubMed]
42. Rahaman, M.N.; Day, D.E.; Bal, B.S.; Fu, Q.; Jung, S.B.; Bonewald, L.F.; Tomsia, A.P. Bioactive glass in tissue engineering. ActaBiomater. 2011, 7, 2355–2373. [CrossRef] [PubMed]
43. da Fonseca, G.F.; Avelino, S.O.M.; Mello, D.C.R.; do Prado, R.F.; Campos, T.M.B.; de Vasconcellos, L.M.R.; de Sousa Triches, E.;Borges, A.L.S. Scaffolds of PCL combined to bioglass: Synthesis, characterization and biological performance. J. Mater. Sci. Mater.Med. 2020, 31, 41. [CrossRef]
44. Bellucci, D.; Salvatori, R.; Giannatiempo, J.; Anesi, A.; Bortolini, S.; Cannillo, V. A New Bioactive Glass/Collagen HybridComposite for Applications in Dentistry. Materials 2019, 12, 2079. [CrossRef]

Cells 2022, 11, 1577 28 of 30
45. Navarro-Requena, C.; Weaver, J.D.; Clark, A.Y.; Clift, D.A.; Perez-Amodio, S.; Castano, O.; Zhou, D.W.; Garcia, A.J.; Engel, E. PEGhydrogel containing calcium-releasing particles and mesenchymal stromal cells promote vessel maturation. Acta Biomater. 2018,67, 53–65. [CrossRef]
46. Alksne, M.; Kalvaityte, M.; Simoliunas, E.; Rinkunaite, I.; Gendviliene, I.; Locs, J.; Rutkunas, V.; Bukelskiene, V. In vitro comparisonof 3D printed polylactic acid/hydroxyapatite and polylactic acid/bioglass composite scaffolds: Insights into materials for boneregeneration. J. Mech. Behav. Biomed. Mater. 2020, 104, 103641. [CrossRef] [PubMed]
47. Tavakoli, E.; Mehdikhani-Nahrkhalaji, M.; Hashemi-Beni, B.; Zargar-Kharazi, A.; Kharaziha, M.J.P.M.S. Preparation, characteriza-tion and mechanical assessment of poly (lactide-co-glycolide)/hyaluronic acid/fibrin/bioactive glass nano-composite scaffoldsfor cartilage tissue engineering applications. Procedia Mater. Sci. 2015, 11, 124–130. [CrossRef]
48. Conoscenti, G.; Carfi Pavia, F.; Ongaro, A.; Brucato, V.; Goegele, C.; Schwarz, S.; Boccaccini, A.R.; Stoelzel, K.; La Carrubba, V.;Schulze-Tanzil, G. Human nasoseptal chondrocytes maintain their differentiated phenotype on PLLA scaffolds produced bythermally induced phase separation and supplemented with bioactive glass 1393. Connect. Tissue Res. 2019, 60, 344–357.[CrossRef]
49. Goegele, C.; Wiltzsch, S.; Lenhart, A.; Civilleri, A.; Weiger, T.M.; Schaefer-Eckart, K.; Minnich, B.; Forchheimer, L.; Hornfeck, M.;Schulze-Tanzil, G. Highly porous novel chondro-instructive bioactive glass scaffolds tailored for cartilage tissue engineering.Mater. Sci. Eng. C Mater. Biol. Appl. 2021, 130, 112421. [CrossRef]
50. Dozza, B.; Lesci, I.G.; Duchi, S.; Della Bella, E.; Martini, L.; Salamanna, F.; Falconi, M.; Cinotti, S.; Fini, M.; Lucarelli, E.; et al.When size matters: Differences in demineralized bone matrix particles affect collagen structure, mesenchymal stem cell behavior,and osteogenic potential. J. Biomed. Mater. Res. A 2017, 105, 1019–1033. [CrossRef]
51. Schefe, J.H.; Lehmann, K.E.; Buschmann, I.R.; Unger, T.; Funke-Kaiser, H. Quantitative real-time RT-PCR data analysis: Currentconcepts and the novel “gene expression’s CT difference” formula. J. Mol. Med. 2006, 84, 901–910. [CrossRef] [PubMed]
52. Kuroda, K.; Okido, M. Hydroxyapatite coating of titanium implants using hydroprocessing and evaluation of their osteoconduc-tivity. Bioinorg. Chem. Appl. 2012, 2012, 730693. [CrossRef] [PubMed]
53. Barrere, F.; van der Valk, C.M.; Meijer, G.; Dalmeijer, R.A.; de Groot, K.; Layrolle, P. Osteointegration of biomimetic apatite coatingapplied onto dense and porous metal implants in femurs of goats. J. Biomed. Mater. Res. B Appl. Biomater. 2003, 67, 655–665.[CrossRef]
54. Shu, R.; McMullen, R.; Baumann, M.J.; McCabe, L.R. Hydroxyapatite accelerates differentiation and suppresses growth ofMC3T3-E1 osteoblasts. J. Biomed. Mater. Res. A 2003, 67, 1196–1204. [CrossRef] [PubMed]
55. Xynos, I.D.; Hukkanen, M.V.; Batten, J.J.; Buttery, L.D.; Hench, L.L.; Polak, J.M. Bioglass 45S5 stimulates osteoblast turnover andenhances bone formation In vitro: Implications and applications for bone tissue engineering. Calcif. Tissue Int. 2000, 67, 321–329.[CrossRef] [PubMed]
56. Amaral, M.; Costa, M.; Lopes, M.; Silva, R.; Santos, J.; Fernandes, M.J.B. Si3N4-bioglass composites stimulate the proliferationof MG63 osteoblast-like cells and support the osteogenic differentiation of human bone marrow cells. Biomaterials 2002, 23,4897–4906. [CrossRef]
57. Johari, B.; Kadivar, M.; Lak, S.; Gholipourmalekabadi, M.; Urbanska, A.M.; Mozafari, M.; Ahmadzadehzarajabad, M.; Azarnezhad,A.; Afshari, S.; Zargan, J.; et al. Osteoblast-seeded bioglass/gelatin nanocomposite: A promising bone substitute in critical-sizecalvarial defect repair in rat. Int. J. Artif. Organs 2016, 39, 524–533. [CrossRef] [PubMed]
58. Huang, J. Design and Development of Ceramics and Glasses. In Biology and Engineering of Stem Cell Niches; Academic Press:Cambridge, MA, USA, 2017; pp. 315–329. [CrossRef]
59. Islam, M.T.; Felfel, R.M.; Abou Neel, E.A.; Grant, D.M.; Ahmed, I.; Hossain, K.M.Z. Bioactive calcium phosphate-based glassesand ceramics and their biomedical applications: A review. J. Tissue Eng. 2017, 8, 2041731417719170. [CrossRef]
60. Goudarzi, Z.; Parvin, N.; Sharifianjazi, F.J.C.I. Formation of hydroxyapatite on surface of SiO2–P2O5–CaO–SrO–ZnO bioactiveglass synthesized through sol-gel route. Ceram. Int. 2019, 45, 19323–19330. [CrossRef]
61. Zhou, M.; Yu, D. Cartilage tissue engineering using PHBV and PHBV/Bioglass scaffolds. Mol. Med. Rep. 2014, 10, 508–514.[CrossRef]
62. Wu, J.; Xue, K.; Li, H.; Sun, J.; Liu, K. Improvement of PHBV scaffolds with bioglass for cartilage tissue engineering. PLoS ONE2013, 8, e71563. [CrossRef] [PubMed]
63. Koh, Y.G.; Lee, J.A.; Kim, Y.S.; Lee, H.Y.; Kim, H.J.; Kang, K.T. Optimal mechanical properties of a scaffold for cartilage regenerationusing finite element analysis. J. Tissue Eng. 2019, 10, 2041731419832133. [CrossRef] [PubMed]
64. Park, I.S.; Jin, R.L.; Oh, H.J.; Truong, M.D.; Choi, B.H.; Park, S.H.; Park, D.Y.; Min, B.H. Sizable Scaffold-Free Tissue-EngineeredArticular Cartilage Construct for Cartilage Defect Repair. Artif. Organs 2019, 43, 278–287. [CrossRef] [PubMed]
65. Fitzgerald, R.; Bass, L.M.; Goldberg, D.J.; Graivier, M.H.; Lorenc, Z.P. Physiochemical Characteristics of Poly-L-Lactic Acid(PLLA). Aesthet. Surg. J. 2018, 38, S13–S17. [CrossRef]
66. Reddy, M.S.B.; Ponnamma, D.; Choudhary, R.; Sadasivuni, K.K. A Comparative Review of Natural and Synthetic BiopolymerComposite Scaffolds. Polymers 2021, 13, 1105. [CrossRef] [PubMed]
67. Conoscenti, G.; Schneider, T.; Stoelzel, K.; Carfi Pavia, F.; Brucato, V.; Goegele, C.; La Carrubba, V.; Schulze-Tanzil, G. PLLAscaffolds produced by thermally induced phase separation (TIPS) allow human chondrocyte growth and extracellular matrixformation dependent on pore size. Mater. Sci. Eng. C Mater. Biol. Appl. 2017, 80, 449–459. [CrossRef] [PubMed]

Cells 2022, 11, 1577 29 of 30
68. Lara-Padilla, H.; Mendoza-Buenrostro, C.; Cardenas, D.; Rodriguez-Garcia, A.; Rodriguez, C.A. Influence of Controlled Cooling inBimodal Scaffold Fabrication Using Polymers with Different Melting Temperatures. Materials 2017, 10, 640. [CrossRef] [PubMed]
69. Chen, Q.; Roether, J.; Boccaccini, A.J.T.i.t.e. Tissue engineering scaffolds from bioactive glass and composite materials. Top. TissueEng. 2008, 4, 1–27.
70. Dehghani, F.; Annabi, N. Engineering porous scaffolds using gas-based techniques. Curr. Opin. Biotechnol. 2011, 22, 661–666.[CrossRef]
71. Niu, Y.; Guo, L.; Liu, J.; Shen, H.; Su, J.; An, X.; Yu, B.; Wei, J.; Shin, J.W.; Guo, H.; et al. Bioactive and degradable scaffolds of themesoporous bioglass and poly(l-lactide) composite for bone tissue regeneration. J. Mater. Chem. B 2015, 3, 2962–2970. [CrossRef]
72. Zhang, K.; Wang, Y.; Hillmyer, M.A.; Francis, L.F. Processing and properties of porous poly(L-lactide)/bioactive glass composites.Biomaterials 2004, 25, 2489–2500. [CrossRef] [PubMed]
73. Maquet, V.; Boccaccini, A.R.; Pravata, L.; Notingher, I.; Jerome, R. Porous poly(alpha-hydroxyacid)/Bioglass composite scaffoldsfor bone tissue engineering. I: Preparation and in vitro characterisation. Biomaterials 2004, 25, 4185–4194. [CrossRef] [PubMed]
74. Larranaga, A.; Alonso-Varona, A.; Palomares, T.; Rubio-Azpeitia, E.; Aldazabal, P.; Martin, F.J.; Sarasua, J.R. Effect of bioactiveglass particles on osteogenic differentiation of adipose-derived mesenchymal stem cells seeded on lactide and caprolactone basedscaffolds. J. Biomed. Mater. Res. A 2015, 103, 3815–3824. [CrossRef]
75. Tian, T.; Xie, W.; Gao, W.; Wang, G.; Zeng, L.; Miao, G.; Lei, B.; Lin, Z.; Chen, X. Micro-Nano Bioactive Glass Particles IncorporatedPorous Scaffold for Promoting Osteogenesis and Angiogenesis in vitro. Front. Chem. 2019, 7, 186. [CrossRef]
76. Xie, Y.; Lan, X.R.; Bao, R.Y.; Lei, Y.; Cao, Z.Q.; Yang, M.B.; Yang, W.; Wang, Y.B. High-performance porous polylactide stereocom-plex crystallite scaffolds prepared by solution blending and salt leaching. Mater. Sci. Eng. C Mater. Biol. Appl. 2018, 90, 602–609.[CrossRef]
77. Rakovsky, A.; Gotman, I.; Rabkin, E.; Gutmanas, E.Y. beta-TCP-polylactide composite scaffolds with high strength and enhancedpermeability prepared by a modified salt leaching method. J. Mech. Behav. Biomed. Mater. 2014, 32, 89–98. [CrossRef]
78. Cannillo, V.; Chiellini, F.; Fabbri, P.; Sola, A.J.C.S. Production of Bioglass® 45S5–Polycaprolactone composite scaffolds viasalt-leaching. Compos. Struct. 2010, 92, 1823–1832. [CrossRef]
79. Pamula, E.; Menaszek, E. In vitro and in vivo degradation of poly(L: -lactide-co-glycolide) films and scaffolds. J. Mater. Sci. Mater.Med. 2008, 19, 2063–2070. [CrossRef]
80. Li, H.; Chang, J. pH-compensation effect of bioactive inorganic fillers on the degradation of PLGA. Compos. Sci. Technol. 2005, 65,2226–2232. [CrossRef]
81. Gentleman, E.; Stevens, M.M.; Hill, R.G.; Brauer, D.S. Surface properties and ion release from fluoride-containing bioactive glassespromote osteoblast differentiation and mineralization in vitro. Acta Biomater. 2013, 9, 5771–5779. [CrossRef]
82. Blochberger, M.; Hupa, L.; Brauer, D.S. Influence of zinc and magnesium substitution on ion release from Bioglass 45S5 atphysiological and acidic pH. Biomed. Glas. 2015, 1. [CrossRef]
83. Da Silva, J.G.; Babb, R.; Salzlechner, C.; Sharpe, P.T.; Brauer, D.S.; Gentleman, E. Optimisation of lithium-substituted bioactiveglasses to tailor cell response for hard tissue repair. J. Mater. Sci. 2017, 52, 8832–8844. [CrossRef] [PubMed]
84. El-Fiqi, A.; Mandakhbayar, N.; Jo, S.B.; Knowles, J.C.; Lee, J.H.; Kim, H.W. Nanotherapeutics for regeneration of degeneratedtissue infected by bacteria through the multiple delivery of bioactive ions and growth factor with antibacterial/angiogenic andosteogenic/odontogenic capacity. Bioact. Mater. 2021, 6, 123–136. [CrossRef] [PubMed]
85. Cholewa-Kowalska, K.; Kokoszka, J.; Laczka, M.; Niedzwiedzki, L.; Madej, W.; Osyczka, A.M. Gel-derived bioglass as acompound of hydroxyapatite composites. Biomed. Mater. 2009, 4, 055007. [CrossRef]
86. Xie, D.; Zhao, J.; Weng, Y.; Park, J.G.; Jiang, H.; Platt, J.A. Bioactive glass-ionomer cement with potential therapeutic function todentin capping mineralization. Eur. J. Oral. Sci. 2008, 116, 479–487. [CrossRef]
87. Yli-Urpo, H.; Vallittu, P.K.; Narhi, T.O.; Forsback, A.P.; Vakiparta, M. Release of silica, calcium, phosphorus, and fluoride fromglass ionomer cement containing bioactive glass. J. Biomater. Appl. 2004, 19, 5–20. [CrossRef]
88. Jebahi, S.; Oudadesse, H.; Jardak, N.; Khayat, I.; Keskes, H.; Khabir, A.; Rebai, T.; El Feki, H. Biological therapy of strontium-substituted bioglass for soft tissue wound-healing: Responses to oxidative stress in ovariectomised rats. Ann. Pharm. Fr. 2013, 71,234–242. [CrossRef]
89. de Laia, A.G.S.; Barrioni, B.R.; Valverde, T.M.; de Goes, A.M.; de Sá, M.A.; Pereira, M.d.M.J.J.o.M.S. Therapeutic cobalt ionincorporated in poly (vinyl alcohol)/bioactive glass scaffolds for tissue engineering. J. Mater. Sci. 2020, 55, 8710–8727. [CrossRef]
90. Zhang, K.; Wang, L.; Liu, Z.; Geng, B.; Teng, Y.; Liu, X.; Yi, Q.; Yu, D.; Chen, X.; Zhao, D.; et al. Mechanosensory andmechanotransductive processes mediated by ion channels in articular chondrocytes: Potential therapeutic targets for osteoarthritis.Channels 2021, 15, 339–359. [CrossRef]
91. Melchels, F.P.; Barradas, A.M.; van Blitterswijk, C.A.; de Boer, J.; Feijen, J.; Grijpma, D.W. Effects of the architecture of tissueengineering scaffolds on cell seeding and culturing. Acta Biomater. 2010, 6, 4208–4217. [CrossRef]
92. Zhu, Y.; Song, K.; Jiang, S.; Chen, J.; Tang, L.; Li, S.; Fan, J.; Wang, Y.; Zhao, J.; Liu, T. Numerical Simulation of Mass Transferand Three-Dimensional Fabrication of Tissue-Engineered Cartilages Based on Chitosan/Gelatin Hybrid Hydrogel Scaffold in aRotating Bioreactor. Appl. Biochem. Biotechnol. 2017, 181, 250–266. [CrossRef] [PubMed]
93. Luo, L.; Eswaramoorthy, R.; Mulhall, K.J.; Kelly, D.J. Decellularization of porcine articular cartilage explants and their subsequentrepopulation with human chondroprogenitor cells. J. Mech. Behav. Biomed. Mater. 2015, 55, 21–31. [CrossRef] [PubMed]
Cells 2022, 11, 1577 30 of 30
94. Muhammad, H.; Rais, Y.; Miosge, N.; Ornan, E.M. The primary cilium as a dual sensor of mechanochemical signals in chondro-cytes. Cell Mol. Life Sci. 2012, 69, 2101–2107. [CrossRef] [PubMed]
95. McGlashan, S.R.; Jensen, C.G.; Poole, C.A. Localization of extracellular matrix receptors on the chondrocyte primary cilium. J.Histochem. Cytochem. 2006, 54, 1005–1014. [CrossRef]
96. Lee, J.W.; Kim, Y.H.; Park, K.D.; Jee, K.S.; Shin, J.W.; Hahn, S.B. Importance of integrin beta1-mediated cell adhesion onbiodegradable polymers under serum depletion in mesenchymal stem cells and chondrocytes. Biomaterials 2004, 25, 1901–1909.[CrossRef]
97. Chan, T.M.; Harn, H.J.; Lin, H.P.; Chou, P.W.; Chen, J.Y.; Ho, T.J.; Chiou, T.W.; Chuang, H.M.; Chiu, S.C.; Chen, Y.C.; et al.Improved human mesenchymal stem cell isolation. Cell Transplant. 2014, 23, 399–406. [CrossRef]
98. Harrell, C.R.; Markovic, B.S.; Fellabaum, C.; Arsenijevic, A.; Volarevic, V. Mesenchymal stem cell-based therapy of osteoarthritis:Current knowledge and future perspectives. Biomed. Pharmacother. 2019, 109, 2318–2326. [CrossRef]
99. Zhu, X.; Assoian, R.K. Integrin-dependent activation of MAP kinase: A link to shape-dependent cell proliferation. Mol. Biol. Cell1995, 6, 273–282. [CrossRef]
100. McKee, T.J.; Perlman, G.; Morris, M.; Komarova, S.V. Extracellular matrix composition of connective tissues: A systematic reviewand meta-analysis. Sci. Rep. 2019, 9, 10542. [CrossRef]
101. Lefebvre, V.; Angelozzi, M.; Haseeb, A. SOX9 in cartilage development and disease. Curr. Opin. Cell Biol. 2019, 61, 39–47.[CrossRef]
102. Ng, L.J.; Wheatley, S.; Muscat, G.E.; Conway-Campbell, J.; Bowles, J.; Wright, E.; Bell, D.M.; Tam, P.P.; Cheah, K.S.; Koopman, P.SOX9 binds DNA, activates transcription, and coexpresses with type II collagen during chondrogenesis in the mouse. Dev. Biol.1997, 183, 108–121. [CrossRef] [PubMed]
103. Yasuda, H.; Oh, C.D.; Chen, D.; de Crombrugghe, B.; Kim, J.H. A Novel Regulatory Mechanism of Type II Collagen Expressionvia a SOX9-dependent Enhancer in Intron 6. J. Biol. Chem. 2017, 292, 528–538. [CrossRef] [PubMed]
104. Szychlinska, M.A.; Calabrese, G.; Ravalli, S.; Parrinello, N.L.; Forte, S.; Castrogiovanni, P.; Pricoco, E.; Imbesi, R.; Castorina, S.;Leonardi, R.; et al. Cycloastragenol as an Exogenous Enhancer of Chondrogenic Differentiation of Human Adipose-DerivedMesenchymal Stem Cells. A Morphological Study. Cells 2020, 9, 347. [CrossRef] [PubMed]
105. Fowler, D.A.; Larsson, H.C.E. The tissues and regulatory pattern of limb chondrogenesis. Dev. Biol. 2020, 463, 124–134. [CrossRef]106. Wang, C.; Shen, J.; Ying, J.; Xiao, D.; O’Keefe, R.J. FoxO1 is a crucial mediator of TGF-beta/TAK1 signaling and protects against
osteoarthritis by maintaining articular cartilage homeostasis. Proc. Natl. Acad. Sci. USA 2020, 117, 30488–30497. [CrossRef]107. Matsuzaki, T.; Alvarez-Garcia, O.; Mokuda, S.; Nagira, K.; Olmer, M.; Gamini, R.; Miyata, K.; Akasaki, Y.; Su, A.I.; Asahara, H.;
et al. FoxO transcription factors modulate autophagy and proteoglycan 4 in cartilage homeostasis and osteoarthritis. Sci. Transl.Med. 2018, 10. [CrossRef]
108. Zhang, M.; Meng, Q.C.; Yang, X.F.; Mu, W.D. TGF-beta1/WISP1/Integrin-alpha interaction mediates human chondrocytesdedifferentiation. Eur. Rev. Med. Pharmacol. Sci. 2020, 24, 8675–8684. [CrossRef]
109. Rim, Y.A.; Nam, Y.; Ju, J.H. The Role of Chondrocyte Hypertrophy and Senescence in Osteoarthritis Initiation and Progression.Int. J. Mol. Sci. 2020, 21, 2358. [CrossRef]
110. Luo, Y.; Sinkeviciute, D.; He, Y.; Karsdal, M.; Henrotin, Y.; Mobasheri, A.; Onnerfjord, P.; Bay-Jensen, A. The minor collagens inarticular cartilage. Protein Cell 2017, 8, 560–572. [CrossRef]
111. Dudhia, J. Aggrecan, aging and assembly in articular cartilage. Cell Mol. Life Sci. 2005, 62, 2241–2256. [CrossRef]112. Wang, P.Y.; Chow, H.H.; Tsai, W.B.; Fang, H.W. Modulation of gene expression of rabbit chondrocytes by dynamic compression in
polyurethane scaffolds with collagen gel encapsulation. J. Biomater. Appl. 2009, 23, 347–366. [CrossRef] [PubMed]113. Chery, D.R.; Han, B.; Zhou, Y.; Wang, C.; Adams, S.M.; Chandrasekaran, P.; Kwok, B.; Heo, S.J.; Enomoto-Iwamoto, M.; Lu, X.L.;
et al. Decorin regulates cartilage pericellular matrix micromechanobiology. Matrix Biol. 2021, 96, 1–17. [CrossRef] [PubMed]114. Giannoni, P.; Siegrist, M.; Hunziker, E.B.; Wong, M. The mechanosensitivity of cartilage oligomeric matrix protein (COMP).
Biorheology 2003, 40, 101–109. [PubMed]115. Antunes, B.P.; Vainieri, M.L.; Alini, M.; Monsonego-Ornan, E.; Grad, S.; Yayon, A. Enhanced chondrogenic phenotype of primary
bovine articular chondrocytes in Fibrin-Hyaluronan hydrogel by multi-axial mechanical loading and FGF18. Acta Biomater. 2020,105, 170–179. [CrossRef] [PubMed]
116. Bosetti, M.; Zanardi, L.; Hench, L.; Cannas, M. Type I collagen production by osteoblast-like cells cultured in contact with differentbioactive glasses. J. Biomed. Mater. Res. 2002, 64A, 189–195. [CrossRef]
117. Meretoja, V.V.; Dahlin, R.L.; Wright, S.; Kasper, F.K.; Mikos, A.G. Articular chondrocyte redifferentiation in 3D co-cultures withmesenchymal stem cells. Tissue Eng. Part C Methods 2014, 20, 514–523. [CrossRef] [PubMed]