Biodegradable Polymer Blends and Their Biocomposites
377
Biodegradable Polymer Blends and Their Biocomposites: Compatibilization and Performance Evaluation By Rajendran Muthuraj A Thesis Presented to The University of Guelph In partial fulfilment of requirements for the degree of Doctor of Philosophy in Engineering Guelph, Ontario, Canada ©Rajendran Muthuraj, November, 2015
-
Upload
khangminh22 -
Category
Documents
-
view
4 -
download
0
Transcript of Biodegradable Polymer Blends and Their Biocomposites

i
Biodegradable Polymer Blends and Their Biocomposites: Compatibilization
and Performance Evaluation
By
Rajendran Muthuraj
A Thesis
Presented to
The University of Guelph
In partial fulfilment of requirements
for the degree of
Doctor of Philosophy
in
Engineering
Guelph, Ontario, Canada
©Rajendran Muthuraj, November, 2015

ii
ABSTRACT
BIODEGRADABLE POLYMER BLENDS AND THEIR BIOCOMPOSITES:
COMPATIBILIZATION AND PERFORMANCE EVALUATION
Non-biodegradable polymers, polymer blends and composites are known to persist in the
environment over a long time. The use of certain biodegradable polymers is limited as they often fail
to match some of the non-biodegradable counterpart perfromances. Blends of biodegradable
polymers and composites with complementary attributes can provide materials that strike a
balance between cost and performance. This research was focused on the fabrication and
performance evaluation of biodegradable polymer blends and composites, as potential
alternatives to non-biodegradable polymeric materials. Industrially viable melt processing
techniques like extrusion and injection molding were adopted to fabricate and evaluate the
structure-property-relationship of biodegradable polymer blends and composites. In this research
work, two different types of commercially available biodegradable polyesters, namely
poly(butylene adipate-co-terephthalate) (PBAT) and poly(butylene succinate) (PBS) were used
to fabricate binary blends and composites. Melt blending these two polymers yielded synergistic
properties, which are not present in the respective polymers. The optimal PBS/PBAT blend was
selected based on its overall performance and it was used as the standard biocomposite matrix.
Miscanthus is a purpose grown energy crop and has not been explored much for polymer
Advisor: Dr. Amar K. Mohanty
Co-advisor: Dr. Manjusri Misra
Rajendran Muthuraj
University of Guelph, 2015

iii
composite applications. This fiber was used as reinforcing agents in the PBS, PBAT and blend of
PBS/PBAT matrix to compare the effects of matrix properties upon the performance of the
resulting composites.
One important aspect of this study was reactive compatibilization to improve the
interfacial adhesion between the miscanthus fibers and polymer matrix. Maleic anhydride grafted
polyesters were synthesized as a compatibilizer, which was used to improve the compatibility
with the miscanthus fibers and polymer matrices. The improved fiber-to-polymer matrix
adhesion exhibited in better mechanical performances of the resulting composites compared to
that of uncompatibilized counterparts. The influence of major processing parameters such as
processing temperature, screw speed, fiber length, and holding pressure on the mechanical
performance were statistically analyzed by factorial design of experiment. The impact strength of
the PBS/PBAT/miscanthus fiber composites was significantly dependent on the fiber length. The
durability of the biodegradable polymer (PBS, PBAT and PBS/PBAT blend) was investigated
after being exposed to elevated temperature (50oC) and humidity (90%) for 30 days. It was found
that the mechanical properties of the samples were heavily affected under the selected
environmental conditions and exposure time.
An optimum biocomposite formulation was successfully extruded and injection molded
for continuous prototype manufacturing in pilot-scale production facilities.

iv
Dedicated to my family

v
Acknowledgements
It would not have been possible to accomplish this PhD thesis without my advisors, Dr.
Amar Kumar Mohanty and Dr. Manjusri Misra. I would like to thank them for their consistent
support, encouragement and guidance during the course of this project. I am also grateful to my
advisory committee members, Dr. Animesh Dutta and Dr. Loong-Tak Lim for their fruitful
comments towards my research work and support for my research work. Dr. Fantahun Defersha
is gratefully acknowledged for his support in statistical analysis.
I would like to express my sincere thanks to my parents Mr. P. Muthuraj, Mrs. M.
Karuppathal, and my brother Mr. M. Venkatachalam and my sisters Miss. M. Bhaghyalakshmi
and Mrs. M. Manoranjitham who provided never-ending support and kindness throughout my
life. Also, I am very much thankful to the Bioproducts Discovery and Development Center
(BDDC) colleagues and my friends who have directly and indirectly helped me throughout this
project.
I would like to express my gratitude to funding agencies that provided financial support
to carry out this research: Ontario Ministry of Agriculture, Food and Rural Affairs (OMAFRA),,
Ontario Ministry of Economic Development and Innovation (MEDI), Ontario Research Fund -
Research Excellence Round 4 program (ORF-RE04), Natural Sciences and Engineering
Research Council (NSERC) − Discovery Grant, National Centre of Excellence (NCE) AUTO21
Network and our private sector partner - New Energy Farms for providing miscanthus fiber
samples.

vi
List of publications
Patent
Mohanty. A.K., Misra. M., Zarrinbakhsh. N., Muthuraj. R., Wang. T., U-Rodriguez. A.,
Vivekanandhan. S., Biodegradable polymer-based composites with tailored properties
and method of making those, US provisional application, Application number-62128736,
filed on March-2015.
Peer-reviewed journal publications
Muthuraj. R., Misra. M., Mohanty. A.K., 2014, Biodegradable Poly(butylene succinate)
and Poly(butylene adipate-co-terephthalate) Blends: Reactive Extrusion and Performance
Evaluation, Journal of Polymers and the Environment, 22, 336–349.
Muthuraj. R., Misra. M., Mohanty. A.K., 2015, Hydrolytic degradation of biodegradable
polyesters under simulated environmental conditions. Journal of Applied Polymer
Science, 132, 42189-42201.
Muthuraj. R., Misra. M., Mohanty. A.K., Injection Molded Sustainable Biocomposites
From Poly(butylene succinate) Bioplastic and Perennial Grass, ACS sustainable
chemistry & engineering, 2015, 3, 2767−2776.
Muthuraj. R., Misra. M., Defersha.F., Mohanty. A.K., Influence of Processing Parameters
on the Impact Strength of miscanthus composites: A Statistical Approach, Composites
Part A: Applied Science and Manufacturing, 2015,
DOI:10.1016/j.compositesa.2015.09.003
Book chapter
Muthuraj. R., Misra. M., Mohanty. A.K., 2015, Chapter 5: Studies on mechanical,
thermal, and morphological characteristics of biocomposites from biodegradable polymer
blends and natural fibers. In: Misra. M, Pandey. J. K, Mohanty. A.K., (Eds.)
Biocomposites: Design and Mechanical Performance, Woodhead Publishing Limited,
Cambridge, UK, pp. 93-140.

vii
Peer-reviewed conference publications
Muthuraj. R., Misra. M., Mohanty. A.K., 2015, “Durability Studies of Biodegradable
Polymers under Accelerated Weathering Conditions”, Society of Plastic Engineering
(ANTEC), March 23-25, Orlando, Florida, USA.
Muthuraj. R., Misra. M., Mohanty. A.K., 2015, “Binary Blends of poly(butylene adipate-
co-terephthalate) and poly(butylene succinate): A new matrix for biocomposites
applications”, AIP Conf. Proc. 1664, 150009-1.
Muthuraj. R., Misra. M., Mohanty. A.K., 2013, “Plasticization of Co-products from
Bioethanol Industries: Potential Uses in Biocomposites”, The 19th
International
Conference on Composite Materials (ICCM), pp 7764-7771.

xxi
Table of Contents Acknowledgements ........................................................................................................... v
List of publications .......................................................................................................... vi
List of Tables ............................................................................................................... xxix
List of Figures ............................................................................................................. xxxii
List of abbreviations and defined terms ......................................................................... xlii
Chapter 1: Introduction ..................................................................................................... 1
Abstract ............................................................................................................................. 1
1.1 Research problems ...................................................................................................... 1
1.2 Objectives and Hypotheses ......................................................................................... 2
1.3 Thesis organization ..................................................................................................... 4
Chapter 2: Studies on Mechanical, Thermal and Morphological Characteristics of
Biocomposites from Biodegradable Polymer Blends and Natural Fibers* ...................... 9
2.1 Introduction ................................................................................................................. 9
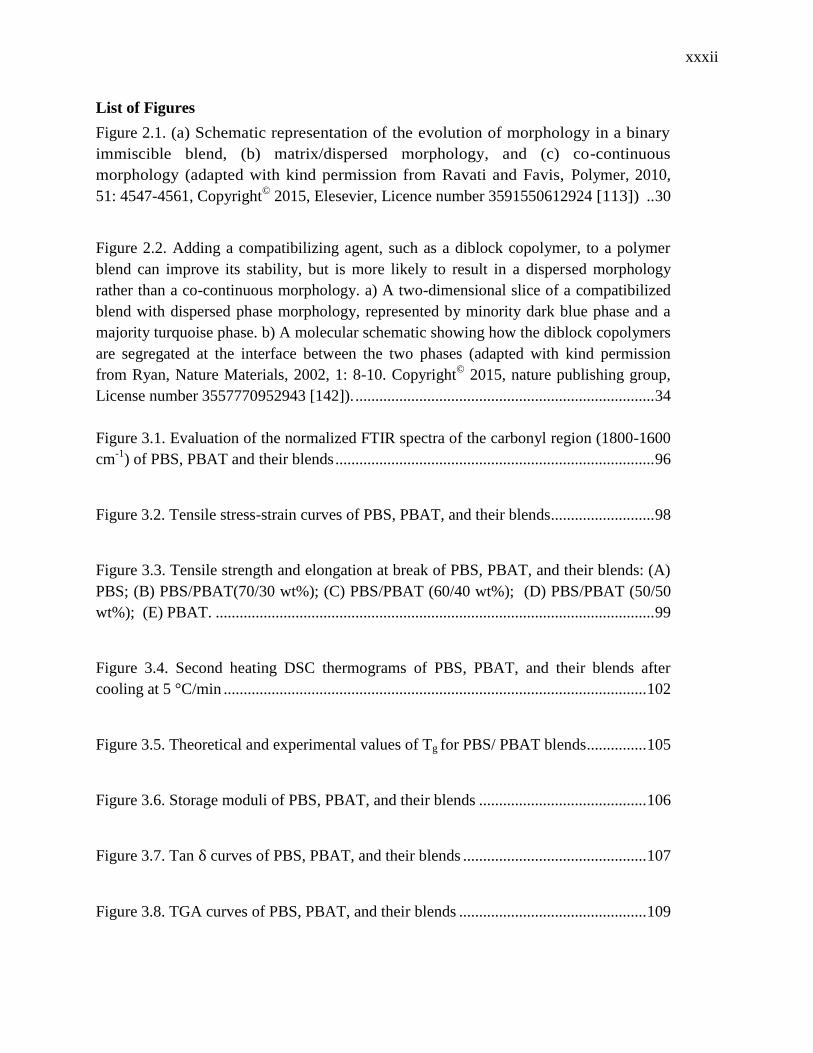
2.2. Biodegradable and compostable polymeric materials ............................................. 10
2.3. Renewable resource based biodegradable polymers: Some examples .................... 11
2.3.1 Poly(lactic acid), PLA ............................................................................................ 12
2.3.2 Microbial polyesters-Polyhydroxyalkanoates (PHAs) .......................................... 14
2.4 Fossil fuel based biodegradable polymers: Some examples ..................................... 17
2.4.1 Poly(butylene succinate), PBS ............................................................................... 17
2.4.2 Poly(butylene adipate-co-terephthalate), PBAT .................................................... 19
2.4.3 Poly(caprolactone), PCL ........................................................................................ 21
2.5. Recyclability of biodegradable polymers ................................................................ 21
2.6. Durability of biodegradable polymers ..................................................................... 23
2.7. Polymer blends: Some examples ............................................................................. 24
2.7.1 Miscible biodegradable polymer blends ................................................................ 26
2.7.2 Immiscible biodegradable polymer blends ............................................................ 28
2.7.3 Compatibilization of polymer blends..................................................................... 32
2.7.4 Non-reactive compatibilization of biodegradable polymer blends ................ 33
2.7.5 Reactive compatibilization of biodegradable polymer blends: Few specific
examples ......................................................................................................................... 35

xxii
2.7.5.1 Reactive compatibilization of PLA/PBAT blends: ............................................. 35
2.7.5.2 Reactive compatibilization of PLA/PBS blends: ................................................ 37
2.7.5.3 Reactive compatibilization of PLA/PHB and PHBV/PBS blends:..................... 38
2.7.5.4 Reactive compatibilization of PLA/PCL blends: ................................................ 40
2.8 Natural fibers ............................................................................................................ 41
2.8.1 Classification of natural fibers ............................................................................... 41
2.8.2 Natural fibers: nature and behavior........................................................................ 42
2.8.3 Advantages and challenges in using natural fibers ................................................ 42
2.9. Biocomposites .......................................................................................................... 43
2.9.1 Advantageous of natural fiber composites ............................................................. 44
2.9.2 Attributes of natural fiber composites.................................................................... 45
2.10. Biocomposites based on biodegradable blends as matrix material: Some
specific examples ............................................................................................................ 47
2.10.1 Biocomposites based on PHBV blends................................................................ 48
2.10.2 Biocomposites based on PLA blends ................................................................... 54
2.11. Natural fiber composites market and their applications ........................................ 61
2.12 Conclusions ............................................................................................................. 62
References ....................................................................................................................... 64
Chapter 3: Fully Biodegradable Poly (butylene succinate) and Poly (butylene
adipate-co-terephthalate) Blends: Reactive Extrusion and Performance Evaluation* ... 88
Abstract ........................................................................................................................... 88
3.1 Introduction ............................................................................................................... 89
3.2 Experimental section ................................................................................................. 91
3.2.1 Materials ................................................................................................................ 91
3.2.3 Fourier transform infrared spectroscopy (FTIR) ................................................... 92
3.2.4 Mechanical properties ............................................................................................ 92
3.2.6 Differential scanning calorimetry (DSC) ............................................................... 93
3.2.7 Dynamic mechanical analysis (DMA) ................................................................... 93
3.2.8 Heat deflection temperature (HDT) ....................................................................... 94
3.2.9 Thermogravimetric analysis (TGA) ....................................................................... 94
3.2.10 Rheological studies .............................................................................................. 94

xxiii
3.2.11 Polarizing optical microscopy (POM) ................................................................. 94
3.2.12 Scanning electron microscopy (SEM) ................................................................. 95
3.3 Results and Discussion ............................................................................................. 95
3.3.1 Fourier transform infrared spectroscopy (FTIR) ................................................... 95
3.3.2 Mechanical properties ............................................................................................ 97
3.3.3 Melt flow index .................................................................................................... 100
3.3.4 Differential scanning calorimetry ........................................................................ 101
3.3.5 Dynamic mechanical analysis .............................................................................. 105
3.3.6 Heat deflection temperature ................................................................................. 107
3.3.7 Thermogravimetric analysis................................................................................. 108
3.3.8 Rheological properties ......................................................................................... 110
3.3.9 Polarizing optical microscopy.............................................................................. 115
3.3.10 Scanning electron microscopy ........................................................................... 117
3.4 Conclusions ............................................................................................................. 119
References ..................................................................................................................... 119
Chapter 4: Preparation and Characterization of Maleic Anhydride Grafted
Biodegradable Polyesters .............................................................................................. 124
Abstract ......................................................................................................................... 124
4.1 Introduction ............................................................................................................. 125
4.2 Materials and Methods ............................................................................................ 128
4.2.1 Synthesis of MAH grafted PBS, PBAT and their blend ...................................... 128
4.2.2 Grafting mechanism ............................................................................................. 130
4.2.3 Purification of MAH grafted samples .................................................................. 133
4.2.4 Determination of grafting percentage .................................................................. 133
4.2.5 Gel percentage measurement ............................................................................... 134
4.2.6 Fourier transform infrared (FTIR) spectroscopy ................................................. 135
4.2.7 Thermogravimetric analysis (TGA) ..................................................................... 135
4.2.8 Differential scanning calorimetry (DSC) ............................................................. 135
4.3 Results and Discussion ........................................................................................... 135
4.3.1 Infrared spectroscopy ........................................................................................... 135
4.3.2 MAH grafting percentage calculation .................................................................. 139

xxiv
4.3.3 Gel content measurement ..................................................................................... 142
4.3.4 Thermogravimetric analysis................................................................................. 144
4.3.5 Differential scanning calorimetry ........................................................................ 145
4.4 Conclusions ............................................................................................................. 147
References ..................................................................................................................... 148
Chapter 5: Enhanced Mechanical Performances of Fully Biodegradable Miscanthus
Fibers Reinforced Poly (butylene succinate) Composites* .......................................... 156
Abstract ......................................................................................................................... 156
5.1 Introduction ............................................................................................................. 157
5.2 Materials and Methods ............................................................................................ 159
5.2.1 Materials .............................................................................................................. 159
5.2.2 Thermal property ................................................................................................. 160
5.2.3 Biocomposite preparation .................................................................................... 161
5.2.4 Mechanical testing ............................................................................................... 161
5.2.5 Statistical analysis ................................................................................................ 162
5.2.6 Dynamic mechanical analysis .............................................................................. 162
5.2.7 Melt flow index (MFI) ......................................................................................... 162
5.2.8 Differential scanning calorimetry (DSC) ............................................................. 163
5.2.9 Scanning electron microscopy (SEM) ................................................................. 163
5.3 Results and discussion ............................................................................................ 164
5.3.1 Thermogravimetric analysis................................................................................. 164
5.3.2 Efficiency of compatibilizer ................................................................................ 165
5.3.3 Mechanical properties versus fiber loading ......................................................... 167
5.3.4 Dynamic mechanical analysis .............................................................................. 177
5.3.5 Adhesion factor calculation ................................................................................. 179
5.3.6 Heat deflection temperature ................................................................................. 180
5.3.7 Melt flow analysis ................................................................................................ 182
5.3.8 Differential scanning calorimetry ........................................................................ 183
5.3.9 Morphological analysis ........................................................................................ 184
5.4 Conclusions ............................................................................................................. 188
References ..................................................................................................................... 189

xxv
Chapter 6: Mechanical Performances of Biocomposites Made From Miscanthus
Fibers and Poly(butylene adipate-co-terephthalate) Matrix ......................................... 196
Abstract ......................................................................................................................... 196
6.1 Introduction ............................................................................................................. 197
6.2 Materials ................................................................................................................. 198
6.3 Biocomposite fabrication method ........................................................................... 199
6.4 Characterization methods........................................................................................ 199
6.5 Results and Discussion ........................................................................................... 200
6.5.1 Mechanical properties .......................................................................................... 200
6.5.2 Melt flow index and Heat deflection temperature ............................................... 203
6.5.3 Scanning electron microscopy ............................................................................. 204
6.6 Conclusions ............................................................................................................. 205
References ..................................................................................................................... 206
Chapter 7: Biocomposites Consisting of Miscanthus Fibres in a Biodegradable
Binary Blend Matrix: Preparation and Performance Evaluation* ................................ 208
Abstract ......................................................................................................................... 208
7.1 Introduction ............................................................................................................. 209
7.2.1 Materials .............................................................................................................. 212
7.2.2 Processing of polymer blend and their composites.............................................. 213
7.2.3 Mechanical properties .......................................................................................... 213
7.2.4 Density ................................................................................................................. 213
7.2.5 Dynamic mechanical analysis (DMA) ................................................................. 214
7.2.7 Differential scanning calorimetry (DSC) ............................................................. 215
7.2.8 Thermogravimetric analysis (TGA) ..................................................................... 215
7.2.9 Morphological analysis ........................................................................................ 215
7.2.10 Rheological property .......................................................................................... 215
7.3 Results and Discussion ........................................................................................... 216
7.3.1 Mechanical properties .......................................................................................... 216
7.3.2 Theoretical approximation of Young’s modulus of the PBS/PBAT
biocomposites ............................................................................................................... 223
7.3.3 Dynamic mechanical properties ........................................................................... 226
7.3.4 Density ................................................................................................................. 229

xxvi
7.3.5 Heat deflection temperature ................................................................................. 230
7.3.6 Thermogravimetric analysis................................................................................. 230
7.3.7 Differential scanning calorimetry ........................................................................ 232
7.3.8 Measurements of fiber diameter, length, and aspect ratio ................................... 235
7.3.9 Morphology of composites .................................................................................. 237
7.3.10 Rheological property .......................................................................................... 239
7.4 Conclusions ............................................................................................................. 241
References ..................................................................................................................... 242
Chapter 8: Influence of Processing Parameters on the Impact Strength of
Biocomposites: A Statistical Approach* ...................................................................... 250
Abstract ......................................................................................................................... 250
8.1 Introduction ............................................................................................................. 251
8.2 Full factorial design methodology .......................................................................... 254
8.3 Materials ................................................................................................................. 255
8.4 Experimental procedure .......................................................................................... 256
8.4.1 Samples preparation ............................................................................................. 256
8.5 Characterization methods........................................................................................ 257
8.5.1 Fiber dimension measurement ............................................................................. 257
8.5.2 Mechanical testing and scanning electron microscopy (SEM) ............................ 258
8.6 Results and Discussion ........................................................................................... 258
8.6.1 Mechanical properties .......................................................................................... 258
8.6.2 Analysis of variance (ANOVA) for impact strength ........................................... 260
8.6.3 Effect of processing parameters on the impact strength ...................................... 262
8.6.4 Fiber length distribution ....................................................................................... 267
8.6.4 Scanning electron microscopy ............................................................................. 270
8.6.5 Mathematical model development ....................................................................... 271
8.6.6 Diagnostic verification of the developed model .................................................. 272
8.7 Conclusions ............................................................................................................. 274
References ..................................................................................................................... 275
Chapter 9: Hydrolytic Degradation of Biodegradable Polyesters under Simulated
Environmental Conditions* .......................................................................................... 280

xxvii
Abstract ......................................................................................................................... 280
9.1 Introduction ............................................................................................................. 281
9.2 Materials and Methodology .................................................................................... 284
9.2.1 Materials .............................................................................................................. 284
9.2.2 Sample preparation and conditioning .................................................................. 284
9.2.3 Moisture absorption ............................................................................................. 285
9.2.4 Fourier transform infrared spectroscopy (FTIR) ................................................. 285
9.2.5 Mechanical properties .......................................................................................... 286
9.2.6 Differential scanning calorimetry (DSC) ............................................................. 286
9.2.7 Dynamic mechanical analysis (DMA) ................................................................. 287
9.2.8 Rheological properties ......................................................................................... 287
9.2.9 Polarizing optical microscopy (POM) ................................................................. 287
9.2.10 Morphological analysis ...................................................................................... 287
9.3 Results and Discussion ........................................................................................... 288
9.3.1 Moisture absorption ............................................................................................. 288
9.3.2 Hydrolytic degradation mechanism of PBS and PBAT ....................................... 289
9.3.3 Changes in mechanical properties ....................................................................... 292
9.3.4 Differential scanning calorimetry ........................................................................ 300
9.3.5 Dynamic mechanical analysis .............................................................................. 303
9.3.6 Rheological properties ......................................................................................... 306
9.3.7 Polarizing optical microscopy.............................................................................. 308
9.3.8 Morphological analysis ........................................................................................ 311
9.4. Conclusions ............................................................................................................ 313
References ..................................................................................................................... 314
Chapter 10: Conclusions, Contributions, and Recommendations for Future Work ..... 318
Abstract ......................................................................................................................... 318
10.1 Overview ............................................................................................................... 318
10.2 Conclusions ........................................................................................................... 318
10.3 Significant contributions ....................................................................................... 321
10.4 Recommendations for future works ...................................................................... 323

xxviii
Appendix I: Binary Blends of Poly(Butylene Succinate) and Poly(Butylene Adipate-
co-Terephthalate): A New Matrix for Biocomposites Applications* ........................... 325
Abstract ......................................................................................................................... 325
A-I.1.Introduction ......................................................................................................... 325
A-I.2. Materials and Methods ....................................................................................... 326
A-I.3. Results and Discussion ....................................................................................... 328
A-I.4. Conclusions ........................................................................................................ 332
References ..................................................................................................................... 333
Appendix II: Durability Studies of Biodegradable Polymers under Accelerated
Weathering Conditions* ............................................................................................... 334
Abstract ......................................................................................................................... 334
A-II.1. Introduction ....................................................................................................... 334
A-II.2. Materials and Methods ...................................................................................... 336
A-II.3. Results and Discussion...................................................................................... 337
A-II.4. Conclusions ....................................................................................................... 342

xxix
List of Tables
Table 2.1. Classification and molecular structure of some biodegradable polymers ....... 11
Table 2.2. Properties of some biodegradable polymers in comparison to non-
biodegradable polymers ..................................................................................................... 16
Table 2.3. Ecoflex® based masterbatches for different applications [66,67] ..................... 20
Table 2.4. List of companies engaged in the production of some biodegradable polymer
blends (the table was modified after referene [9,94,95]). .................................................. 25
Table 2.5. Properties of some natural and synthetic fibers ................................................ 46
Table 2.6. Recently developed biodegradable polymer blend matrix based biocomposites56
Table 3.1. Melt flow index (MFI) of the neat polymers and their blends ........................ 100
Table 3.2. Solubility parameter values for polymers ....................................................... 104
Table 3.3. Heat deflection temperatures of the neat polymers and their blends .............. 108
Table 4.1. Properties of the neat PBS, PBAT and PBS/PBAT blend .............................. 128
Table 4.2. Proposed formulation for producing maleation of PBS, PBAT, and PBS/PBAT
blend ................................................................................................................................. 130
Table 4.3. Maleic anhydride grafting percentage of the PBS, PBAT and PBS/PBAT blend
....................................................................................................................................... 140
Table 4.4. Detailed DSC results of the maleated PBS and PBS/PBAT blend (MAH
grafted samples were prepared with 1 phr DCP and 5 phr MAH) ................................... 147
Table 5.1. Mechanical properties of PBS composites with two different MAH grafting
levels of compatibilizer .................................................................................................... 167
Table 5.2. A comparison of mechanical properties of injection molded PBS/natural fiber
composites (Note: the reported percentage differences were calculated based on the neat
PBS matrix properties) ..................................................................................................... 176

xxx
Table 5.3. Heat deflection temperature (HDT) and melt flow index (MFI) of neat PBS
and its composites ............................................................................................................ 181
Table 5.4. Summary of differential scanning calorimetry traces of neat PBS and its
composites........................................................................................................................ 182
Table 6.1. Melt flow index (MFI) and Heat deflection temperature (HDT) measurement204
Table 7.1. Notched Izod impact strength of PBS/PBAT blend and its compatibilized and
uncompatibilized composites ........................................................................................... 223
Table 7.2. Heat deflection temperature (HDT) and density of PBS/PBAT blend and its
compatibilized and uncompatibilized composites ........................................................... 229
Table 7.3. Thermogravimetric data of miscanthus, PBS/PBAT blend and their composites
....................................................................................................................................... 232
Table 7.4. Detailed differential scanning calorimetry analysis of the PBS/PBAT blend
and their composites ........................................................................................................ 235
Table 7.5. Average fiber length (L), average fiber diameter (D), and aspect ratio (L/D) of
the miscanthus fiber before and after compounding ........................................................ 236
Table 8.1. Selected processing parameters and their respected levels ............................. 255
Table 8.2. Physical and mechanical properties of the PBS/PBAT blend and miscanthus
fibers ................................................................................................................................ 256
Table 8.3. The 16 investigated experimental conditions ................................................. 257
Table 8.4. A complete summary of all the experiments and the related mechanical
properties of PBS/PBAT/miscanthus composites ............................................................ 260
Table 8.5. Analysis of Variance (ANOVA) for notched Izod impact strength ............... 261
Table 8.6. Average fiber length (L), average fiber diameter (D), and aspect ratio (L/D) of
the miscanthus fiber before and after compounding ........................................................ 269
Table 9.1. Notched Izod impact strength of the samples before and after conditioned at
50oC with 90% relative humidity ..................................................................................... 300

xxxi
Table 9.2. DSC results for PBS, PBAT and their blend before and after 30 days
conditioned at 50oC with 90% relative humidity ............................................................. 303
Table 9.3. Relative molecular weight (M1/M2) of the PBS, PBAT and PBS/PBAT blend
before and after 6 days conditioned at 50oC with 90% relative humidity ....................... 308
Table A-II.1. General properties of PBS, PBAT, PBS/PBAT (60/40 wt%) and PP.
(a obtained from material data sheet,
b and PBS/PBAT (60/40 wt%) data were measured
in the lab) ……………………………………………………………………………....337
Table A-II.2. Notched Izod impact strength of PBS, PBAT, PBS/PBAT (60/40 wt%)
and PP before and after 18 days conditioning at 50oC with 90%
RH………………………………………………………………………………………340
xxxii
List of Figures
Figure 2.1. (a) Schematic representation of the evolution of morphology in a binary
immiscible blend, (b) matrix/dispersed morphology, and (c) co-continuous
morphology (adapted with kind permission from Ravati and Favis, Polymer, 2010,
51: 4547-4561, Copyright©
2015, Elesevier, Licence number 3591550612924 [113]) .. 30
Figure 2.2. Adding a compatibilizing agent, such as a diblock copolymer, to a polymer
blend can improve its stability, but is more likely to result in a dispersed morphology
rather than a co-continuous morphology. a) A two-dimensional slice of a compatibilized
blend with dispersed phase morphology, represented by minority dark blue phase and a
majority turquoise phase. b) A molecular schematic showing how the diblock copolymers
are segregated at the interface between the two phases (adapted with kind permission
from Ryan, Nature Materials, 2002, 1: 8-10. Copyright©
2015, nature publishing group,
License number 3557770952943 [142]). ........................................................................... 34
Figure 3.1. Evaluation of the normalized FTIR spectra of the carbonyl region (1800-1600
cm-1
) of PBS, PBAT and their blends ................................................................................ 96
Figure 3.2. Tensile stress-strain curves of PBS, PBAT, and their blends.......................... 98
Figure 3.3. Tensile strength and elongation at break of PBS, PBAT, and their blends: (A)
PBS; (B) PBS/PBAT(70/30 wt%); (C) PBS/PBAT (60/40 wt%); (D) PBS/PBAT (50/50
wt%); (E) PBAT. .............................................................................................................. 99
Figure 3.4. Second heating DSC thermograms of PBS, PBAT, and their blends after
cooling at 5 °C/min .......................................................................................................... 102
Figure 3.5. Theoretical and experimental values of Tg for PBS/ PBAT blends ............... 105
Figure 3.6. Storage moduli of PBS, PBAT, and their blends .......................................... 106
Figure 3.7. Tan curves of PBS, PBAT, and their blends .............................................. 107
Figure 3.8. TGA curves of PBS, PBAT, and their blends ............................................... 109

xxxiii
Figure 3.9. DTG curves of PBS, PBAT, and their blends ............................................... 109
Figure 3.10. Complex viscosity of PBS, PBAT, and their blends with different weight
fractions of PBAT at 140 oC ............................................................................................ 110
Figure 3.11. Loss modulus versus frequency for PBS, PBAT, and their blends with
different weight fractions of PBAT at 140 oC ................................................................. 112
Figure 3.12. Storage modulus versus frequency for PBS, PBAT, and their blends with
different weight fractions of PBAT at 140 oC ................................................................. 113
Figure 3.13. Cole–Cole plot of the PBS/PBAT blends at 140 oC .................................... 114
Figure 3.14. (a) Photograph of the film annealed at 80 oC: (i) PBS; (ii) PBS/PBAT
(70/30 wt%); (iii) PBS/PBAT (60/40 wt%) and (iv) PBS/PBAT (50/50 wt%). Figure (b)
Photograph of the film annealed at 90 oC: (i) PBS; (ii) PBS/PBAT (70/30 wt%); (iii)
PBS/PBAT (60/40 wt%) and (iv) PBS/PBAT (50/50 wt%) ............................................ 116
Figure 3.15. (a) SEM images of PBS and PBAT blends (left hand side) (i) PBS/PBAT
(70/30 wt%); (ii) PBS/PBAT (60/40 wt%) and (iii) PBS/PBAT (50/50 wt%) . (b) SEM
images of PBS and PBAT blends surface after et al.,hing with THF (right hand side): (i)
PBS/PBAT (70/30 wt%); (ii) PBS/PBAT (60/40 wt%) and (iii) PBS/PBAT (50/50 wt%)
....................................................................................................................................... 118
Figure 4.1. Proposed reaction mechanism of maleic anhydride grafted PBS (MAH-g-
PBS) ................................................................................................................................. 131
Figure 4.2. Proposed reaction mechanism of maleic anhydride grafted PBAT (MAH-g-
PBAT) .............................................................................................................................. 132
Figure 4.3. FTIR spectra of MAH, neat PBS and MAH-g-PBS with 1 phr DCP and 5 phr
MAH ................................................................................................................................ 136
Figure 4.4. FTIR spectra of the MAH, neat PBAT and MAH-g-PBAT with 1 phr DCP
and 5 phr MAH ................................................................................................................ 137

xxxiv
Figure 4.5. FTIR spectra of MAH, neat PBS/PBAT blend and MAH-g-PBS/PBAT blend
with 1 phr DCP and 5 phr MAH ...................................................................................... 139
Figure 4.6. Gel content of maleic anhydride grafted PBS, PBAT, and PBS/PBAT samples
with 5 phr MAH and different concentration of DCP ..................................................... 143
Figure 4.7. TGA thermograms of neat and maleated PBS, PBAT and PBS/PBAT blend
(the maleated samples were obtained with 1 phr DCP and 5 phr MAH) ........................ 144
Figure 4.8. DSC second heating curves of neat PBS, PBS/PBAT (60/40 wt%) and their
maleated samples with 1 phr DCP and 5 phr MAH......................................................... 145
Figure 4.9. DSC first cooling curves of neat PBS, PBS/PBAT (60/40 wt%) and their
maleated samples with 1phr DCP and 5 phr MAH.......................................................... 146
Figure 5.1.SEM micrograph of as received miscanhtus fibers……………………........160
Figure 5.2. Thermogravimetric analysis of miscanthus fiber under different environment
....................................................................................................................................... 164
Figure 5.3. Tensile properties of PBS and PBS/miscanthus composites: A) neat PBS, B)
PBS/miscanthus (70/30 wt%), C) PBS/miscanthus/compatibilizer (65/30/5 wt%), D)
PBS/miscanthus (60/40 wt%), E) PBS/miscanthus/compatibilizer (55/40/5 wt%), F)
PBS/miscanthus (50/50 wt%), and G) PBS/miscanthus/compatibilizer (45/50/5wt%)... 169
Figure 5.4. Reduced tensile strength of uncompatibilized and compatibilized
PBS/miscanthus composites plotted against volume fraction of fibers according to
equation 5.4. ..................................................................................................................... 171
Figure 5.5. Flexural properties of PBS and PBS/miscanthus composites: A) neat PBS, B)
PBS/miscanthus (70/30 wt%), C) PBS/miscanthus/compatibilizer (65/30/5 wt%), D)
PBS/miscanthus (60/40 wt%), E) PBS/miscanthus/compatibilizer (55/40/5 wt%), F)
PBS/miscanthus (50/50 wt%), and G) PBS/miscanthus/compatibilizer (45/50/5 wt%).. 172

xxxv
Figure 5.6. Nothced Izod impact strength of PBS and PBS/miscanthus composites: A)
neat PBS, B) PBS/miscanthus (70/30 wt%), C) PBS/miscanthus/compatibilizer (65/30/5
wt%), D) PBS/miscanthus (60/40 wt%), E) PBS/miscanthus/compatibilizer (55/40/5
wt%), F) PBS/miscanthus (50/50 wt%), and G) PBS/miscanthus/compatibilizer (45/50/5
wt%) ................................................................................................................................. 175
Figure 5.7. Dynamic mechanical analysis of PBS and PBS/miscanthus composites: A)
neat PBS, B) PBS/miscanthus (70/30 wt%), C) PBS/miscanthus/compatibilizer (65/30/5
wt%), D) PBS/miscanthus (60/40 wt%), E) PBS/miscanthus/compatibilizer (55/40/5
wt%), F) PBS/miscanthus (50/50 wt%), and G) PBS/miscanthus/compatibilizer (45/50/5
wt%) ................................................................................................................................. 178
Figure 5.8. Tan δ curves of PBS and its composites: A) neat PBS, B) PBS/miscanthus
(70/30 wt%), C) PBS/miscanthus/compatibilizer (65/30/5 wt%), D) PBS/miscanthus
(60/40 wt%), E) PBS/miscanthus/compatibilizer (55/40/5 wt%), F) PBS/miscanthus
(50/50 wt%), and G) PBS/miscanthus/compatibilizer (45/50/5 wt%) ............................. 179
Figure 5.9. Adhesion factor of PBS/miscanthus composites: A) PBS/miscanthus (70/30
wt%), B) PBS/miscanthus/compatibilizer (65/30/5 wt%), C) PBS/miscanthus (60/40
wt%), D) PBS/miscanthus/compatibilizer (55/40/5 wt%), E) PBS/miscanthus (50/50
wt%), and F) PBS/miscanthus/compatibilizer (45/50/5 wt%) ......................................... 180
Figure 5.10. DSC second heating thermograms of PBS and its composites: A) neat PBS,
B) PBS/miscanthus (70/30 wt%), C) PBS/miscanthus/compatibilizer (65/30/5 wt%), D)
PBS/miscanthus (60/40 wt%), E) PBS/miscanthus/compatibilizer (55/40/5 wt%), F)
PBS/miscanthus (50/50 wt%), and G) PBS/miscanthus/compatibilizer (45/50/5 wt%).. 183
Figure 5.11. DSC first cooling thermograms of PBS and its composites: A) neat PBS, B)
PBS/miscanthus (70/30 wt%), C) PBS/miscanthus/compatibilizer (65/30/5 wt%), D)
PBS/miscanthus (60/40 wt%), E) PBS/miscanthus/compatibilizer (55/40/5 wt%), F)
PBS/miscanthus (50/50 wt%), and G) PBS/miscanthus/compatibilizer (45/50/5 wt%).. 184
Figure 5.12. SEM micrograph of tensile fractured surface of uncompatibilized PBS
composites with low (150x) and high (500x) magnification; (a) and (b) are
PBS/miscanthus (70/30 wt%) composites; (c) and (d) are PBS/miscanthus (60/40 wt%)
composites; (e) and (f) are PBS/miscanthus (50/50 wt%) composites ............................ 186

xxxvi
Figure 5.13. SEM micrograph of tensile fractured surface of compatibilized PBS
composites with low (150x) and high (500x) magnification; (a) and (b) are
PBS/miscanthus (70/30 wt%) composites; (c) and (d) are PBS/miscanthus (60/40 wt%)
composites; (e) and (f) are PBS/miscanthus (50/50 wt%) composites ........................... 187
Figure 6.1. Tensile strength and tensile modulus of PBAT and its composites; (A) neat
PBAT, (B) PBAT/miscanthus fibers (70/30 wt%), (C) PBAT/miscanthus fibers/MAH-g-
PBAT (65/30/5 wt%), (D) PBAT/miscanthus fibers (60/40 wt%), and (E)
PBAT/miscanthus fibers/MAH-g-PBAT (65/30/5 wt%) ................................................ 201
Figure 6.2. Flexural properties of PBAT and its compatibilized and uncompatibilized
composites: (A) neat PBAT, (B) PBAT/miscanthus fibers (70/30 wt%), (C)
PBAT/miscanthus fibers/MAH-g-PBAT (65/30/5 wt%), (D) PBAT/miscanthus fibers
(60/40 wt%), and (E) PBAT/miscanthus fibers/MAH-g-PBAT (65/30/5 wt%).............. 202
Figure 6.3. Notched Izod impact strength of PBAT and its compatibilized and
uncompatibilized composites: (A) neat PBAT, (B) PBAT/miscanthus fibers (70/30 wt%),
(C) PBAT/miscanthus fibers/MAH-g-PBAT (65/30/5 wt%), (D) PBAT/miscanthus fibers
(60/40 wt%), and (E) PBAT/miscanthus fibers/MAH-g-PBAT (65/30/5 wt%).............. 203
Figure 6.4. SEM micrographs of uncompatibilized PBAT/misanthus fibers (60/40 wt%)
composites (A) and compatibilized PBAT/misanthus fibers/MAH-g-PBAT (55/40/5
wt%) composites (B)........................................................................................................ 205
Figure 7.1. Tensile properties of PBS/PBAT blend and their composites: (A) PBS/PBAT,
(B) PBS/PBAT + miscanthus fibers (70/30 wt%), (C) PBS/PBAT + miscanthus fibers +
MAH-g-PBS/PBAT (65/30/5 wt%), (D) PBS/PBAT + miscanthus fibers (60/40 wt%),
(E) PBS/PBAT + miscanthus fibers + MAH-g-PBS/PBAT (55/40/5 wt%), (F)
PBS/PBAT + miscanthus fibers (50/50 wt%), and (G) PBS/PBAT + miscanthus fibers +
MAH-g-PBS/PBAT (45/50/5 wt%). ................................................................................ 217
Figure 7.2. Stress-strain curves of PBS/PBAT blend and their composites: (A)
PBS/PBAT, (B) PBS/PBAT + miscanthus fibers (70/30 wt%), (C) PBS/PBAT +
miscanthus fibers (60/40 wt%), (D) PBS/PBAT + miscanthus fibers (50/50 wt%), (E)
PBS/PBAT + miscanthus fibers + MAH-g-PBS/PBAT (65/30/5 wt%), (F) PBS/PBAT +
miscanthus fibers + MAH-g-PBS/PBAT (55/40/5 wt%), and (G) PBS/PBAT +
miscanthus fibers + MAH-g-PBS/PBAT (45/50/5 wt%). ............................................... 219

xxxvii
Figure 7.3. Flexural properties of PBS/PBAT blend and their composites: (A)
PBS/PBAT, (B) PBS/PBAT + miscanthus fibers (70/30 wt%), (C) PBS/PBAT +
miscanthus fibers + MAH-g-PBS/PBAT (65/30/5 wt%), (D) PBS/PBAT + miscanthus
fibers (60/40 wt%), (E) PBS/PBAT + miscanthus fibers + MAH-g-PBS/PBAT (55/40/5
wt%), (F) PBS/PBAT + miscanthus fibers (50/50 wt%), and (G) PBS/PBAT +
miscanthus fibers + MAH-g-PBS/PBAT (45/50/5 wt%). ............................................... 221
Figure 7.4. Expected reaction between the miscanthus and the compatibilizer .............. 221
Figure 7.5. Variation of experimental and theoretical values of Young’s modulus as a
function of fiber loading .................................................................................................. 226
Figure 7.6. Storage moduli of PBS/PBAT blend and their composites: (A) PBS/PBAT,
(B) PBS/PBAT + miscanthus fibers (70/30 wt%), (C) PBS/PBAT + miscanthus fibers
(60/40 wt%), (D) PBS/PBAT + miscanthus fibers (50/50 wt%), (E) PBS/PBAT +
miscanthus fibers + MAH-g-PBS/PBAT (65/30/5 wt%), (F) PBS/PBAT+ miscanthus
fibers + MAH-g-PBS/PBAT (55/40/5 wt%), and (G) PBS/PBAT + miscanthus fibers +
MAH-g-PBS/PBAT (45/50/5 wt%). ................................................................................ 227
Figure 7.7. Tan δ of PBS/PBAT blend and their composites: (A) PBS/PBAT, (B)
PBS/PBAT + miscanthus fibers (70/30 wt%), (C) PBS/PBAT + miscanthus fibers (60/40
wt%), (D) PBS/PBAT + miscanthus fibers (50/50 wt%), (E) PBS/PBAT + miscanthus
fibers + MAH-g-PBS/PBAT (65/30/5 wt%), (F) PBS/PBAT+ miscanthus fibers + MAH-
g-PBS/PBAT (55/40/5 wt%), and (G) PBS/PBAT + miscanthus fibers + MAH-g-
PBS/PBAT (45/50/5 wt%). .............................................................................................. 228
Figure 7.8. Thermogravimetric traces for miscanthus, PBS/PBAT blend and its
composites........................................................................................................................ 231
Figure 7.9. DSC second heating thermograms: (A) PBS/PBAT, (B) PBS/PBAT +
miscanthus fibers (70/30 wt%), (C) PBS/PBAT + miscanthus fibers (60/40 wt%), (D)
PBS/PBAT + miscanthus fibers (50/50 wt%), (E) PBS/PBAT + miscanthus fibers +
MAH-g-PBS/PBAT (65/30/5 wt%), (F) PBS/PBAT+ miscanthus fibers + MAH-g-
PBS/PBAT (55/40/5 wt%), and (G) PBS/PBAT + miscanthus fibers + MAH-g-
PBS/PBAT (45/50/5 wt%). .............................................................................................. 233

xxxviii
Figure 7.10. DSC first cooling thermograms: (A) PBS/PBAT, (B) PBS/PBAT +
miscanthus fibers (70/30 wt%), (C) PBS/PBAT + miscanthus fibers (60/40 wt%), (D)
PBS/PBAT + miscanthus fibers (50/50 wt%), (E) PBS/PBAT + miscanthus fibers +
MAH-g-PBS/PBAT (65/30/5 wt%), (F) PBS/PBAT+ miscanthus fibers + MAH-g-
PBS/PBAT (55/40/5 wt%), and (G) PBS/PBAT + miscanthus fibers + MAH-g-
PBS/PBAT (45/50/5 wt%). .............................................................................................. 234
Figure 7.11. Fiber length distribution before and after compounding: (A) as received
miscanthus fibers distribution, (B) fibers distribution in 30 wt% composites, (C) fibers
distribution in 40 wt% composites, and (D) fibers distribution in 50 wt% composites. . 237
Figure 7.12. SEM micrographs of uncompatibilized PBS/PBAT blend composites with
different fiber loads: (A) PBS/PBAT + miscanthus fibers (70/30 wt%), (B) PBS/PBAT +
miscanthus fibers (60/40 wt%), and (C) PBS/PBAT + miscanthus fibers (50/50 wt%) . 238
Figure 7.13. SEM micrographs of compatibilized PBS/PBAT blend composites with
different amount of fiber loads: (A) PBS/PBAT + miscanthus fibers + MAH-g-
PBS/PBAT (65/30/5 wt%), (B) PBS/PBAT + miscanthus fibers + MAH-g-PBS/PBAT
(55/40/5 wt%), and (C) PBS/PBAT + miscanthus fibers + MAH-g-PBS/PBAT (45/50/5
wt%). ................................................................................................................................ 239
Figure 7.14. Complex viscosity of PBS/PBAT blend and its composites: (A) PBS/PBAT,
(B) PBS/PBAT + miscanthus fibers (70/30 wt%), (C) PBS/PBAT + miscanthus fibers
(60/40 wt%), (D) PBS/PBAT + miscanthus fibers (50/50 wt%), (E) PBS/PBAT +
miscanthus fibers + MAH-g-PBS/PBAT (65/30/5 wt%), (F) PBS/PBAT + miscanthus
fibers + MAH-g-PBS/PBAT (55/40/5 wt%), and (G) PBS/PBAT + miscanthus fibers +
MAH-g-PBS/PBAT (45/50/5 wt%). ................................................................................ 240
Figure 8.1. Main effect plot for the impact strength ........................................................ 263
Figure 8.2. Plot of interaction effects for the impact strength of biocomposites ............ 264
Figure 8.3. Half Normal probability plot of the standardized effects for impact strength of
the PBS/PBAT/miscanthus composites ........................................................................... 265

xxxix
Figure 8.4. Pareto chart of the standardized effects for the impact strength of the
PBS/PBAT/miscanthus biocomposites ............................................................................ 266
Figure 8.5. Tensile stress-strain curves of PBS/PBAT/miscanthus composites with
changing fiber length 4 mm (A) and 2 mm (B) ............................................................... 267
Figure 8.6. Histograms of miscanthus fiber length distribution before and after
compounding in a twin screw extruder ............................................................................ 268
Figure 8.7. Represents the SEM micrographs of the PBS/PBAT/miscanthus composites;
(a) PBS/PBAT composites with 2 mm miscanthus (b) PBS/PBAT composites with 4 mm
miscanthus........................................................................................................................ 270
Figure 8.8. Normal probability plot of the residuals for impact strength ........................ 273
Figure 8.9. Residual plots versus fitted values for impact strength ................................. 273
Figure 8.10. Variation of the residuals with observed order values of the impact strength
of the PBS/PBAT/miscanthus composites. ...................................................................... 274
Figure 9.1. Moisture absorption curves as a function of conditioning time .................... 289
Figure 9.2. Hydrolysis reaction of PBS ........................................................................... 290
Figure 9.3. Hydrolysis reaction of PBAT ........................................................................ 290
Figure 9.4. FTIR spectra of PBS, PBAT and PBS/PBAT before and after 30 days exposed
to 50oC with 90% relative humidity................................................................................. 292
Figure 9.5. Tensile strength of PP, PBS, PBAT and PBS/PBAT as a function of exposure
time at 50oC with 90% relative humidity ......................................................................... 294
Figure 9.6. Flexural strength of PP, PBS, PBAT and PBS/PBAT as a function of
exposure time at 50oC with 90% relative humidity ......................................................... 295

xl
Figure 9.7. Testing failure mode of PBS, PBAT, PBS/PBAT and PP after 30 days
exposed to 50oC with 90% relative humidity .................................................................. 296
Figure 9.8. Percentage elongation of PP, PBS, PBAT and PBS/PBAT as a function of
exposure time at 50oC with 90% relative humidity ......................................................... 297
Figure 9.9. Tensile modulus of PP, PBS, PBAT and PBS/PBAT as a function of exposure
time at 50oC with 90% relative humidity ......................................................................... 298
Figure 9.10. Flexural modulus of PP, PBS, PBAT and PBS/PBAT as a function of
exposure time at 50oC with 90% relative humidity ......................................................... 299
Figure 9.11. DSC heating cycles for PBS, PBAT and PBS/PBAT before and after
exposed to 50oC with 90% relative humidity for 30 days ............................................... 301
Figure 9.12. DSC cooling curves for PBS, PBAT and PBS/PBAT before and after
exposed to 50oC with 90% relative humidity for 30 days ............................................... 302
Figure 9.13. Storage modulus of PBS, PBAT and PBS/PBAT before and after exposed to
50oC with 90% relative humidity for 30 days .................................................................. 304
Figure 9.14. Loss factor peak (tan δ) of PBS, PBAT and PBS/PBAT before and after 30
days exposed to 50oC with a relative humidity of 90% ................................................... 305
Figure 9.15. Shear viscosity curves for PBS, PBAT and PBS/PBAT before and after 6
days exposed to 50oC with a relative humidity of 90% ................................................... 308
Figure 9.16. Polarized optical micrographs of PBS, PBAT and PBS/PBAT before and
after 30 days conditioned at 50oC and 90% relative humidity......................................... 310
Figure 9.17. SEM micrographs of PBS, PBAT and PBS/PBAT before and after 30 days
conditioned at 50oC and 90% relative humidity .............................................................. 312

xli
Figure 10.1. Prototypes were made from biodegradable polymers/miscanthus fiber by
extrusion and injection molding method.......................................................................... 323
Figure A-I. 1. Tensile properties of (A) PBAT, (B) PBS, (C) PBAT/PBS (60/40 wt%) and
(D) PBAT/PBS (70/30 wt%) blend ................................................................................. 329
Figure A-I. 2. HDT and MFI values of (A) PBAT, (B) PBS, (C) PBAT/PBS (60/40 wt%)
and (D) PBAT/PBS (70/30 wt%) blend ........................................................................... 330
Figure A-I. 3. SEM image of the cryofractured PBAT/PBS (60/40 wt%) blend ........... 331
Figure A-I. 4. POM image of the (i) PBS and (ii) PBAT/PBS (60/40 wt%) blend ........ 332
Figure A-II. 1. Tensile strength of PBS, PBAT, PBS/PBAT (60/40 wt%) and PP before
and after 18 days exposed to 50oC with 90% RH. ........................................................... 338
Figure A-II. 2. Flexural strength of PBS, PBAT, PBS/PBAT (60/40 wt%) and PP before
and after 18 days exposed to 50oC with 90% RH. ........................................................... 339
Figure A-II. 3. SEM micrographs of PBS, PBAT, and PBS/PBAT (60/40 wt%) before (A,
B and C) and after (D, E and F) 18 days exposed to 50oC with 90% RH ...................... 341

xlii
List of abbreviations and defined terms
ABS Acrylonitrile butadiene styrene
ANOVA Analysis of Variance
APTMS (3-aminopropyl) trimethoxysilane
ASTM American society for testing and materials
ATR Attenuated total reflectance
BDO 1,4-butanediol
DCP Dicumyl peroxide
DDGS Distiller’s dried grains with solubles
DMA Dynamic mechanical analysis
DSC Differential scanning calorimetry
DTG Derivative thermogram
EBA-GMA Ethyl-butyl acrylate and glycidyl methacrylate copolymer
EGMA Ethylene-glycidyl methacrylate
EMAA-Zn Ethylene methacrylic acid zinc ionomer
EMA-GMA Ethylene methyl acrylate-glycidyl methacrylate terpolymer
ENR Epoxidized natural rubber
EPA Environmental protection agency
EPDM Ethylene-propylene-diene terpolymer
FDA Food and drug administration
FRCs Fiber reinforced plastic composites
FTIR Fourier Transform Infrared Spectroscopy
GMA Glycidyl methacrylate
HB Hydroxybutyrate
HDPE High-density polyethylene

xliii
HDT Heat deflection temperature
HSD Honestly significant difference
HV Hydroxyvalerate
ISO International organization for standardization
KOH Potassium hydroxide
LTI Lysine triisocynate
LVE Linear viscoelastic
MA-g-PP Maleic anhydride-grafted-polypropylene
MAH Maleic anhydride
MAH-g-PBS/PBAT Maleic anhydride-grafted-poly(butylene
succinate)/poly(butylene adipate-co-terephthalate)
MFI Melt flow index
NaOH Sodium hydroxide
PBAT Poly(butylene adipate-co-terephthalate)
PBS Poly(butylene succinate)
PBSA Poly(butylene succinate-co-adipate)
PBT Poly(butylene terephthalate)
PC Polycarbonate
PCL Polycaprolactone
PDI Poly dispersity index
PDLA Poly(D-lactic acid)
PE Polyethylene
PEBA Poly(ether-b-amide) copolymer
PET Poly(ethylene terephthalate)
PHAs Polyhydroxyalkanoates

xliv
PHB Poly(3-hydroxybutyrate)
PHB-g-PBS Poly(hydroxybutyrate)-grafted-poly(butylene succinate)
PHB-g-PLA Poly(hydroxybutyrate)-grafted-poly(lactic acid)
PHBV Poly(3-hydroxybutyrate-co-3-hydroxyvalerate)
PHBV-g-PBS Poly(3-hydroxybutyrate-co-3-valerate)-grafted-poly(butylene
succinate)
PLA Poly(lactic acid)
PLLA Poly(L-lactic acid)
PMDI Polymeric methylene diphenylene diisocyanate
PMMA Poly(methyl methacrylate)
PP Polypropylene
PPC Poly(propylene carbonate)
PS Polystyrene
PVA Poly(vinyl alcohol)
PVAc Poly(vinyl acetate)
PVDF Poly(vinylidene fluoride)
RH Relative humidity
ROP Ring opening polymerization
RWF Recycled wood fiber
SAN Styrene acrylonitrile
SEM Scanning electron microscopy
TFC Twice functionalized nanoclay
TGA Thermogravimetric analysis
T-GMA Random terpolymer of ethylene, acrylic ester and glycidyl methacrylate
THF Tetrahydrofuran
TMPTA Trimethylolpropane triacrylate

xlv
TPP Triphenyl phosphite
Nomenclature
% Percentage
Crystallization enthalpy
Melting enthalpy
Theoretical melting enthalpy of 100% crystalline polymers
Young’s modulus of the fibers
Young’s modulus of the matrix
Volume fraction of fiber
Volume fractions of matrix
∆Gm Gibbs free energy
∆Hm Heat of mixing
∆Scm Mixing of combinatorial entropy
∆Sem Mixing of excess entropy
DF Degree of freedom
E’ Storage modulus
EL Longitudinal modulus
ET Transverse modulus
F F-value (statistics)
G'' Loss modulus at melt state
G' Storage modulus at melt state
g/10min Grams per 10 minutes
g/cm3
Gram per cubic centimeter
GPa Giga Pascal

xlvi
h Hours
J/g Joule per gram
kN kilonewton
kV kilovolts
l/d length/diameter of the reinforcement
M1/M2 Relative molecular weight
mA milli-ampere
Mc Young’s modulus of the composites
mol% mole percentage
MPa Mega pascal
MS Mean square
Mw Weight average molecular weight
NA Not applicable
P P-value (in ANOVA table)
Pa.s Pascal second
phr Parts per hundred
R Universal gas constant
R2 R-squared
R2
adj Adjusted R-squared
SS Sum of square
T Absolute temperature
Tan δ Loss modulus to storage modulus ratio
Tc Crystallization temperature
Tg Glass transition temperature

xlvii
Tm Melting temperature
Tmax Maximum degradation temperature
Tonset Onset degradation temperature
wt% Weight percentage
Greek symbols
Volume fractions of the fiber
Volume fractions of the matrix
Densities of the composites
Densities of the fiber
Densities of the matrix
T
B Load-bearing capacity of the dispersed component
ƞo Zero shear viscosity
x Stress transfer constant
α Alpha level (statistics)
δ Solubility parameters
η* Complex viscosity
λ Ratio of length measured before (L0) and after (L) tensile test
σ Tensile strength of composites
χ Crystallinity
χ Flory-Huggins interaction parameter
Group molar attraction constant of the polymer
Reinforcement geometry

1
Chapter 1: Introduction
Abstract: This chapter briefly describes the research problems associated to this research work.
In order to address these research problems, this chapter provides a hypothesis followed by
objectives of the present work. The main objectives to be accomplished in this research work are
presented. This chapter also discusses the thesis organization and a short summary of each
following chapters.
1.1 Research problems
After use, petroleum-based non-biodegradable polymers persist in the soil for hundreds
of years, creating environmental concerns. Carbons from these polymers are not renewable and
their supply is quickly depleting. In addition, non-biodegradable polymers are not satisfactory
materials for short-lifespan applications such as packaging, catering, textile, agricultural,
household uses, and surgery, as incineration of many non-biodegradable polymeric material
wastes can produce non eco-friendly emissions. Recycling these products may require high-
energy consumption. Therefore, biodegradable/compostable polymers are an alternative for these
non-biodegradable/non-compostable polymers. The insufficient performances of the
biodegradable polymers are limiting their certain applications. This can be overcome by melt
blending two or more dissimilar biodegradable polymers while preserving biodegradability of
the parent components. Furthermore, the cost of biodegradable polymer is quite expensive
compared to that of commonly used polymers. Biodegradable polymers and their blends are
often used to produce biocomposites to modify overall properties. The use of biodegradable
polymers and their blends as a matrix for producing biocomposites will result in products with
enhanced performances and lower cost. The relatively hydrophobic nature of biodegradable
polymer matrix is less compatible with hydrophilic natural fibers due to the polarity difference

2
between them. The incompatibility between the polymers and fibers leads to weak stress transfer
from one phase to another phase. This weak stress transfer causes inferior mechanical properties
of the resulting composites. This problem can be effectively addressed by compatibilization
strategy.
1.2 Objectives and Hypotheses
The optimal blend can be selected based on its overall performance and it can be used as
the standard biocomposite matrix. Increase in the cost of biocomposites could be mitigated by
adding environmentally friendly low cost fibers/reinforcement such as miscanthus fibers [1]. The
selected fiber crop does not currently have good value added applications in composites sectors
[2]. Finding value-added applications for this material would improve the economics for the
respective producers. Compatibilization chemistry has a predominant role in the performances of
yielded biocomposites. Maleic anhydride (MAH) is a well-known functional monomer for
grafting onto the polymer backbone because of its chemical reactivity, lower efficiency of self
polymerization, reactive compatibilizer, and low toxicity. The MAH grafted copolymer can
significantly improve interfacial adhesion and thereby result in good mechanical properties of the
composites. Carlson et al., [3] observed the enhanced interfacial adhesion/interaction between
the polylactide (PLA)/starch composites with the addition of MAH grafted PLA compatibilizer.
Some other researchers have reported improved interfacial adhesion in the PLA composites with
the addition of MAH grafted PLA as a reactive compatibilizer [4, 5]. Similarly, poly(butylene
adipate-co-terephthalate) (PBAT) and poly(butylene succinate) (PBS) based composites were
compatibilized by the use of MAH grafted PBAT [6] and MAH grafted PBS [7], respectively. To
our knowledge, there was no literature available on the compatibilized PBS/miscanthus

3
composites, PBAT/miscanthus composites and PBS/PBAT/miscanthus composites with MAH
grafted reactive compatibilizer.
The purpose of this study was to use reactive compatibilization strategy to increase the
compatibility between the PBS/miscanthus fiber, PBAT/miscanthus fiber and
PBS/PBAT/miscanthus fibers. In this study, MAH grafted biopolymers were synthesized as a
compatibilizer, which was anticipated to have a high compatibility with the hydroxyl
functionality of the reinforcements (e.g., miscanthus). Hence, a MAH grafted biopolymer was
used for the target compatibilization of this work. Improved fibers-polymer matrix adhesion was
hypothesized to result in better mechanical properties of the resulting biocomposites. Moreover,
fibers-matrix adhesion was evaluated through theoretical methods, microscopical analysis, and
the performances of the resulting biocomposites.
The objectives of this project were as follows:
Objective 1 was to generate optimum property for biodegradable binary polymer blends
of poly(butylene adipate-co-terephthalate), PBAT and poly(butylene succinate), PBS, which can
be used as a matrix for biocomposite fabrication. In addition, the durability of PBS, PBAT and
their blend was investigated after being exposed to elevated humidity (90%) and temperature
(50oC).
Objective 2 was to functionalize PBS, PBAT and their blend by the melt free radical
grafting of maleic anhydride (MAH) onto its backbone. These MAH functionalized polymers
were use as a compatibilizing agent in subsequent steps.
The first part of Objective 3 was to investigate the compatabilization effect of MAH
grafted PBS on performances of the PBS/miscanthus composites. Second part of this objective

4
was to understand and investigate how the addition of miscanthus fibers and MAH gafted PBAT
to PBAT influences the melt processes as well as their mechanical properties.
Objective 4 was to fabricate and to evaluate performance of miscanthus fiber reinforced
PBS/PBAT blend matrix based biocomposites. The effect of compatibilizer (MAH-grafted-
PBS/PBAT blend) on the resulting biocomposites was investigated by means of mechanical,
thermo-mechanical, morphological, and rheological properties. A statistical analysis was used to
map the relations between the mechanical properties of the PBS/PBAT/miscanthus
biocomposites and the processing parameters.
1.3 Thesis organization
This thesis is separated into several chapters. Chapter 1 explains outline of the thesis,
including hypothesis, and objectives of this project.
Chapter 2 reviews the literature on mechanical, thermal and morphological
characteristics of biodegradable polymer blends and their natural fiber reinforced composites
(biocomposites) made from biodegradable polymer blends and natural fibers. Structure-property-
performance of biodegradable polymer blends and their biocomposites fabricated using melt
processing methods is the prime focus of this chapter. In addition to the economical advantages,
natural fibers also offer several other benefits and challenges in fabrication of biocomposite
materials, which are all reviewed in detail in different sections of this chapter. Strategies like
reactive compatibilization have been widely studied to overcome the compatibility issue between
the matrix and fiber phases. This chapter has also attempted to correlate the enhanced
fiber/matrix adhesion with the resulting biocomposite performances.
Chapter 3 discusses the preparation and performance evaluation of biodegradable PBS
and PBAT binary blends. The mechanical properties of the resulting blends were correlated with

5
compatibility of the blended components and infrared spectroscopy. The processability and
phase morphology of the prepared PBS/PBAT blends were investigated by rheological properties
and microscopic analysis, respectively. Furthermore, the performance of the PBS/PBAT blends
including thermal and thermo-mechanical properties were investigated and reported.
Chapter 4 describes experiments carried out in accomplishment of an objective 3. The
melt state graft copolymerization of biodegradable polymers with maleic anhydride (MAH). The
MAH grafting efficiency on the PBS, PBAT and PBS/PBAT blend was investigated while
varying concentrations of the dicumyl peroxide (DCP) free radical initiator. The percentage of
maleic anhydride grafting on the polyesters backbone was quantified based on acid–base titration
method. In addition, the graft copolymerization was confirmed by FTIR spectroscopic analysis.
Differential scanning calorimetry (DSC) and thermogravimertic analysis (TGA) were used to
study the effect of MAH grafting on the polyesters backbone.
Chapter 5 discusses the effects of compatibilizer concentration on the mechanical
performances of the PBS matrix based biocomposites. In order to achieve maximum
performance of the PBS/miscantus composites, the composites were prepared as a function of
compatibilizer concentrations and fiber loadings. Two different compatibilizers, i.e., higher and
lower degree of maleic anhydride grafted PBS (MAH-g-PBS), were used to explore the influence
of compatibilizer on mechanical performance of resulting composites. It was observed that the
composites with 5 wt% compatibilizer exhibited optimum mechanical performances. The load-
bearing capacity/reinforcing effect of the miscanthus fiber composite was analyzed with the help
of theoretical methods. In addition, the degree of interaction between the components was
demonstrated from the height of tan δ peak values as well as SEM analysis. The melt

6
processability of the PBS composites with fiber loading up to 50 wt% was assessed by melt flow
index (MFI) measurement.
Chapter 6 provides manufacture and characterization of biocomposites made from
miscanthus fibers and PBAT matrix. In this chapter, PBAT biocomposites were produced at
various loadings of miscanthus fibers with and without maleic anhydride grafted PBAT (MAH-
g-PBAT) compatibilizer. The effect of fiber loading on melt flow and mechanical properties was
also studied.
In Chapter 7, preparation and performance evaluation of biocomposites consisting of
miscanthus fibers in a biodegradable binary blend matrix were conducted. The mechanical
performance of the composites was investigated with different weight percentage of fiber
loadings. The elastic modulus of the composites was evaluated by parallel, series, Hrisch and
Halpin-Tsai theoretical models and the values were compared with the experimental values.
Maleic anhydride functionalized PBS/PBAT (MAH-g-PBS/PBAT) blend used as a
compatibilizer improved interfacial bonding between the phases in the resulting composites.
Thermal, thermo-mechanical, rheological and physical properties were studied for resulting
compatibilized and uncompatibilized composites. SEM analysis was employed to demonstrate
the interfacial bonding between matrix and fibers in the compatibilized composites.
In Chapter 8, effects of processing parameter on the impact performance of
biodegradable polymer blend matrix based biocomposites were studied. A biocomposite
consisting of miscanthus fibers and a biodegradable PBS/PBAT blend matrix was produced by
extrusion and injection molding method. A full factorial experimental design was used to predict
the statistically significant variables on the impact strength of the PBS/PBAT biocomposites.
The main and interaction effects of the variables were studied using analysis of variance

7
(ANOVA) at 95% confidence level. The accuracy of the developed model was examined by
residuals plots and coefficients. Among the selected independent processing parameters, the
most and least significant processing parameters on the impact strength were fiber length and
holding pressure, respectively.
Chapter 9 investigated the durability of PBS, PBAT and their blend was assessed by
exposure to elevated temperature and humidity. The influence of moisture and temperature on
the mechanical performances was examined as a function of exposure time. The mechanical
properties of the PBS, PBAT and PBS/PBAT blend were heavily affected after being exposed to
90% humidity and 50oC. The change in crystallinity of the exposed samples was correlated with
observed modulus. At last, Chapter 10 provides an overall conclusion and recommendations for
future work in this research.
References
[1] http://www.newenergyfarms.com/news.php. (Accessed on Jaunary 2015)
[2] R. M. Johnson, N. Tucker, S. Barnes, Impact performance of Miscanthus/Novamont Mater-
Bi® biocomposites, Polymer Testing, 2003, 22 (2): 209-215.
[3] D. Carlson, L. Nie, R. Narayan, P. Dubois, Maleation of polylactide (PLA) by reactive
extrusion, Journal of Applied Polymer Science, 1999, 72 (4): 477-485.
[4] L. Petersson, K. Oksman, A. P. Mathew, Using maleic anhydride grafted poly(lactic acid) as
a compatibilizer in poly(lactic acid)/layered-silicate nanocomposites, Journal of Applied Polymer
Science, 2006, 102 (2): 1852-1862.
[5] D. Plackett, Maleated Polylactide as an Interfacial Compatibilizer in Biocomposites, Journal
of Polymers and the Environment, 2004, 12 (3): 131-138.

8
[6] H.-S. Kim, B.-H. Lee, S. Lee, H.-J. Kim, J. Dorgan, Enhanced interfacial adhesion,
mechanical, and thermal properties of natural flour-filled biodegradable polymer bio-composites,
Journal of Thermal Analysis and Calorimetry, 2011, 104 (1): 331-338.
[7] Y. Nabar, J. M. Raquez, P. Dubois, R. Narayan, Production of Starch Foams by Twin-Screw
Extrusion: Effect of Maleated Poly(butylene adipate-co-terephthalate) as a Compatibilizer,
Biomacromolecules, 2005, 6 (2): 807-817.

9
Chapter 2: Studies on Mechanical, Thermal and Morphological Characteristics of
Biocomposites from Biodegradable Polymer Blends and Natural Fibers*
*A version of this chapter has been published in:
R. Muthuraj, M. Misra, A. K. Mohanty, Chapter: 5 Studies on mechanical, thermal, and
morphological characteristics of biocomposites from biodegradable polymer blends and natural
fibers. In: M. Misra, J.K. Pandey, A. Mohanty (Eds.) Biocomposites: Design and Mechanical
Performance, Woodhead Publishing, 2015, pp. 93-140.
2.1 Introduction
Bioplastics can contribute significantly to sustainable development in terms of the
environment and ecological systems. Over the past two decades, the utilization of biobased
and/or biodegradable polymeric materials has gained significant research attention from both
academia and industry. Bioplastics are a group of plastics with wide range of properties and
applications. According to European Bioplastics, a bioplastic can be biobased, biodegradable or
a combination of both biobased and biodegradable. In 2010, the worldwide annual production of
plastics was reported to be 265 Mt [1], reached at 299 Mt in 2013 [2]. Meanwhile, bioplastics
production was estimated to be 1.6 Mt in 2013 [3]. European bioplastics market report has
predicted the annual bioplastic production to be ~6.7 Mt in 2018 [3], which is a 22% hike
compared to bioplastics production in 2012. Currently, bioplastics contribute 10-15% of the
total plastic market share and by 2020 the market share is expected to be around 25-30%, mainly
driven by the gradual increase in the number of bioplastics processing companies [4]. Based on
overwhelming chemical and material demand, the US Department of energy aims to reach 10%
renewable resource based chemical production by 2020 and 50% by 2050 [5]. Main reasons for
biopolymers being on prime focus are reduction of CO2 emissions, reduced waste problems, and
establishment of sustainable alternatives to conventional materials.

10
Petroleum based non-biodegradable polymers can remain intact in landfills for decades,
causing grave environmental concerns. Such non-biodegradable polymers are not suited for
applications requiring short lifespan. Incineration of many non-biodegradable plastics waste after
their end use can produce harmful emissions. The US Environmental Protection Agency (EPA)
has reported that most of the synthetic plastic waste enters landfills, oceans, and lakes [6]. This
problem can be overcome by using biodegradable polymers that can offer effective solution to
this scenario as they are degradable in the presence of naturally occurring microorganisms.
Biodegradable polymers, whether obtained from renewable resources or petroleum resources, are
potential substitutes for some non-biodegradable polymers.
2.2. Biodegradable and compostable polymeric materials
All biodegradable plastics fall under the bioplastic category and for it to be
biodegradable, it should possess the ability to break down into smaller molecules through the
action of naturally occurring microbes [7]. In order to assess the biodegradability of polymeric
substances, standard experimental procedures are established by national and international
organizations. These standards are used to investigate the biodegradability of polymeric
materials in specific environmental conditions. The ASTM D6400 standard defines compostable
polymeric materials as follows: “a plastic that undergoes biological degradation during
composting to yield CO2, H2O, inorganic compounds and biomass at a rate consistent with other
known compostable materials and leaves no visually distinguishable or toxic residues” [7]. This
(ASTM D6400) test method is similar to that given in the ISO 17088. Detailed biodegradability
and compostability mechanisms of polymeric materials have been reviewed by Muniyasamy et
al., [8]. In 1980s, synthetic biodegradable polymers were first introduced and were considered
potential substitutes for non-biodegradable polymers [9]. Currently, there are many
11
biodegradable polymers produced from petrochemical resources and renewable resources [10].
Biodegradability of the polymeric materials generally depends on the molecular formula
and does not depend on the monomer origin [11,12]. Therefore, biodegradable polymers
can be derived from non-renewable resources and/or renewable resources. We can sort
these biodegradable polymers based on the source of the feedstock used to make them
(Table 2.1).
Table 2. 1. Classification and molecular structure of some biodegradable polymers
2.3. Renewable resource based biodegradable polymers: Some examples
Renewable resource based biodegradable polymers have their origin either from plant or
biological resources. On the other hand, non-renewable resources based biodegradable polymers
are generally made from fossil fuel based monomers. Few examples of renewable resource based
biodegradable polymers are discussed below.

12
2.3.1 Poly(lactic acid), PLA
PLA was first synthesized by DuPont scientist Wallace Hume Carothers in 1931 as a
typical linear aliphatic thermoplastic polyester, derived from agricultural feedstock like corn,
sugar cane, and sugar beet [13,14]. PLA is synthesized from lactic acid (2-hydroxypropanoic
acid) monomers through application of heat under vacuum conditions. PLA can be produced by
various methods, like direct condensation polymerization, ring-opening polymerization, and
azeotropic dehydration [15]. Low molecular weight PLA is not acceptable for some of the
applications due to poor mechanical performance. High molecular weight PLA preparation by
direct dehydration condensation is not feasible due to the equilibrium not favoring a high
molecular weight polymer. Therefore, Cargill Dow LLC developed a new technology (ring-
opening polymerization) to produce high molecular weight PLA through an economic route
[16,17]. This process involves three separate steps [15,16]. First step involves a
polycondensation reaction, which converts lactic acid into PLA oligomers (1000-5000 Daltons).
In the second step, PLA oligomers are catalytically converted into a mixture of lactide
stereoisomers. After vacuum distillation of lactide stereoisomers, ring-opening polymerization
(ROP) is typically preferred to produce high molecular weight PLA due to its high degree of
controllability. One of the biggest advantages of the ROP method is the elimination of water
formation step, allowing to attain high molecular weight structures to be attained [18]. This was
the first attempt to synthesize renewable resources based economically and commercially viable
biodegradable polymer (PLA) by melt stage rather than in solution [19]. Stereochemistry of PLA
plays a vital role in the synthesis of stereoisomers such as L (+), D (-), and meso (L, D) lactic
acid by using an appropriate microorganism. Four different types of PLA can be produced using
different kinds of lactide monomers: L-PLA (PLLA), D-PLA (PDLA), mixtures of L and D, and
meso-PLA. The L-PLA and D-PLA are optically active, as opposed to mixtures of L and D, and

13
meso-PLA, which are optically inactive. These steriochemical structures determine the
crystallinity of PLA. For instance, PLA with >93% L-lactic acid is semicrystalline in nature
whereas PLA containing 50-93% L-lactic acid becomes amorphous in nature [15]. Due to
amorphous nature, PDLA does not show crystallization or melting enthalpies under differential
scanning calorimetry tests, while PLLA have melt crystallization, cold crystallization, and
melting enthalpies due to the formation and melting of crystals. Other parameters affecting PLA
properties include polymerization conditions, thermal history, purity, and molecular weight.
In terms of tensile strength, tensile modulus (Table 2.2) [20] and gas (O2 and CO2) barrier
properties [21], PLA is more superior than polypropylene, however, toughness and impact
strength are lower than commodity polymers [16]. PLA can be processed in conventional
processing equipments such as extrusion, injection, stret al.,h blow molding, extrusion blow film,
thermoforming, foaming, melt spinning, cast film and sheet [16]. Therefore, PLA has potential
applications ranging from food packaging, compostable bags, household items, and textiles to
medical supplies. Due to these attractive properties of PLA, the global production of PLA is
expected to reach $5.2 billion by 2020 with growth rate of 19.5% during 2013 to 2020 [22].
Unfortunately, PLA has some inherent drawbacks including low heat deflection temperature
[23], poor melt strength in comparison with polyolefins [24], slow crystallization rate [19], and
too brittle. Moreover, PLA is not able to biodegrade at room temperature i.e., it is not home
compostable [23]. These properties prevent PLA from being applied in varied applications.
Several attempts have been made to address these issues using plasticization, rubber toughening,
blending with other polymers, and reinforcement with natural fibers [25-27]. Recently, the
toughens modification of PLA has been reviewed exhaustively by Kfoury et al., [26]

14
2.3.2 Microbial polyesters-Polyhydroxyalkanoates (PHAs)
Microbial polyester synthesis began in the year 1901 and detailed investigations were
conducted in 1925 [13]. In the late 1920s, Maurice Lemoigne first discovered
polyhydroxyalkanoates (PHAs) using the Bacillus megaterium bacteria [28]. Two different types
of bacterial polyesters along with their chemical structure are shown in Table 2.1. PHAs are a
family of linear thermoplastic polyesters, which can degrade by the microorganisms [29]. PHAs
can be found as homopolymers or copolymers. The performance of PHAs is dependent on their
chemical composition. After the 1970s, researcher’s curiosity and an impending energy crisis
initiated the commercialization of poly(3-hydroxybutyrate), PHB. PHB is the first microbial
polyester synthesized through fermentation of sugar and starch with the help of a microorganism.
PHB is a saturated linear homopolymer, which behaves like traditional thermoplastics. It can be
processed in traditional processing equipments such as extrusion, injection and compression
molding. PHB has properties that are very similar to those of a commodity polymer like
polypropylene (PP) [30,31]. However, poor thermal stability [29,32], embrittlement due to high
crystallinity [13,32] and narrow processing window [33] of PHB hinder its wide range of
applications. The brittleness/impact strength of PHB can be modified by copolymerization of
hydroxybutyrate (HB) and hydroxyvalerate (HV) [13] or blending with tough polymers [31]. For
instance, poly(3-hydroxybutyrate-co-3-hydroxyvalerate) (PHBV) is more ductile and flexible
compared to PHB [32]. In 1990, poly(3-hydroxybutyrate-co-3-valerate) (PHBV), was introduced
into the market by Imperial Chemical Industries Inc. (ICI) [13]. Currently, the major PHAs
producers are Tianan (EnmatTM
), Kaneka (NodaxTM
), PHB Industrial (Biocycle®
), Mitsubishi
Gas Chemicals (BiogreenTM
), Biomer® biopolyester, and Metabolix (Mirel
®). PHAs have
desirable properties like higher melting point (Table 2.2) and higher crystallinity, comparable to
commodity polymer (PP), with added advantageous like good biodegradability, compostability
15
and biocompatibility. PHAs have potential applications in medical fields, like wound
management, vascular system, drug delivery, orthopedic, and urology [34]. However, the
thermal degradation temperature range of PHBV is 180-200 oC, which is very close to their
melting temperature. In addition, the main drawback of PHB and low valerate content PHBV is
their poor impact strength and low elongation at break caused by low nucleation density. All the
above factors combined with high cost hinder the application of PHBV in a wide range of fields
[35]. Increasing the valerate unit up to 34 mol% can help in decreasing the brittleness of PHBV
[30]. However, increase in the HV content can decrease the melting temperature, tensile strength,
modulus of elasticity and glass transition temperature [30]. Most of the commercially produced
PHBV contains HV content below 15 mol% [32]. The melting temperature (Tm) of such PHBV
is still high (e.g. HV = 11 mol%, Tm = 157 °C) and thermal degradation may occur during melt
processing [30]. In addition, it possesses very low ductility, very similar to PHB. The synthesis
of PHBV with higher valerate content requires a lot of energy consumption for production,
sterilization, and purification. Therefore, intensive research needs to be directed towards
reducing the production cost of PHBV, and in bringing the cost to be on par with traditional
plastics like PP [36]. Extensive research has been conducted on polymers from PHA family to
overcome the above discussed drawbacks [30,32,33,37]. Different approaches adopted to address
the challenges of PHAs are discussed in the following blend and composites sections. In addition
to PHBV based polymer blends, natural fibers are potential candidate to reduce the cost of
PHBV based materials while enhancing some of their mechanical properties [27].

16
Table 2. 2. Properties of some biodegradable polymers in comparison to non-biodegradable polymers
Polymers
Density
(g/cm3)
Melting point
(oC)
Tensile strength
(MPa)
Tensile modulus
(MPa)
Elongation at
break (%)
References
PLA 1.21-1.25 150-162 21-60 350-3500 2.5-6 [36, 38]
PLLA 1.24-1.30 170-200 15.5-150 2700-4140 3-10 [36, 38]
PDLA 1.25-1.27 Amorphous 27.6-50 1000-3450 2-10 [38]
PHB 1.18-1.26 168-182 40 3500-4000 5-8 [36, 38]
PHBV 1.23-1.25 144-172 20-25 500-1500 17.5-25 [36, 39]
PBS 1.26-1.32 96-114 19-36 324-647 200-807 [40]
PCL 1.11-1.15 58-65 21-42 210-440 300-1000 [38, 41]
PBAT 1.25 110-115 36 80 820 [39, 42]
HDPE 0.92 110 10 177 700 [40-41]
PP 0.9-1.16 161-170 30-40 1100-1600 20-400 [36]
17
2.4 Fossil fuel based biodegradable polymers: Some examples
Biodegradability of a polymer is basically based on chemical structure unlike from the
source from which it is obtained. Thus, biodegradable polymers besides renewable based sources
(as discussed above) can also be made from fossil fuel sources. Few examples of such polymer
are reviewed below.
2.4.1 Poly(butylene succinate), PBS
PBS is a promising aliphatic biodegradable thermoplastic polyester (chemical structure is
shown in Table 2.1). It is synthesized by condensation polymerization of 1,4-butanediol (BDO)
and succinic acid in the presence of a catalyst [40]. Low molecular weight PBS is weak and
brittle in nature. Therefore, Showa Highpolymer Co. Ltd in Japan, produced relatively high
molecular weight PBS under the trade name BionolleTM
[40]. High molecular weight PBS was
achieved through melt condensation polymerization followed by coupling reaction with a chain
extender (e.g. hexamethylene diisocynate). The condensation polymerization can be performed
using either direct melt polymerization or solution polymerization. Direct melt polycondensation
is the most promising method for PBS synthesis as it can produce the high molecular weight PBS
suitable for food contact applications [43]. Currently some of the companies producing PBS
include Xinfu pharmaceutical (China), Hexing (China), Ire Chemical (Korea). Nippon Shokubai
(Japan), Mitsubishi Chemical (Japan), Showa Highpolymer (Japan), and Jinfa Tech (China)
[44,45].
Interestingly, PBS can also be produced from either biobased, fossil fuel based monomers
or a combination of both bio and fossil fuel based monomers. There are several companies
around the world producing pilot scale biobased succinic acid, including BioAmber and Myriant.
Mitsubishi Chemical has developed a new technology to produce partially biobased PBS having

18
54% biobased content derived from biobased succinic acid [46]. It can be used in applications
requiring food contact and applications besides non-food contact uses while meeting global
biodegradability standards. Traditionally, 1,4-BDO is produced from fossil fuel resources.
Alternatively, the biobased 1,4-BDO is produced through a fermentation process using glucose
monomers. Therefore, there is a possibility to produce PBS from 100% renewable resource
based monomers [47]. PBS is a biodegradable polyester with balanced thermo-mechanical
properties compared to other polymers such as polypropylene, polyethylene, PHB and PLA [48].
Mechanical and thermal properties of PBS depends mainly on crystallinity, crystal structure and
molecular weight [49]. Good thermal stability, processing properties, semi crystalline nature and
an ideal melting point range, makes PBS a promising biodegradable polymer [50-52]. Notably,
the strength of PBS is comparable to those of low-density polyethylene (LDPE) and
polypropylene (PP), as shown in Table 2.2. PBS based products are widely used for many
applications, such as packaging film, agriculture mulch film, sheets, laminates, bags, hygiene
products, non-woven, split yarn, monofilament and multifilament [53]. However, the stiffness,
water vapor barrier, melt viscosity and impact strength of PBS are often not sufficient for many
applications. These drawbacks can be effectively addressed by blending with other polymers
[54], fillers [55,56] and additives [51]. The stiffness of the PBS has been improved by the
addition of natural fibers [55] and blending with brittle polymers like PHB [57]. The melt
viscosity and gas barrier properties of the PBS were improved with the help of reactive agents
[51] and nanofillers [56], respectively.
Poly(butylene succinate-co-adipate), PBSA, is a random copolyester, made from 1,4-
butanediol, succinic acid, and adipic acid by polycondensation reaction. It has excellent impact
strength, elongation and processability. Co-monomer content dictates the physical properties of

19
the copolymer of PBS like PBSA. For instance, the adipate content must be lower than 15 mol%
in order to maintain the melting point of PBSA above 100 oC [58]. In addition, adipate co-
monomer content has a greater influence on the biodegradability and mechanical properties of
PBSA [40]. PBSA has higher impact strength and elongation as compared to PBS, whereas the
tensile strength and melting point of the PBSA are lower than that of PBS.
2.4.2 Poly(butylene adipate-co-terephthalate), PBAT
Polymers that are solely aromatic polyesters such as poly(ethylene terephthalate) (PET)
and poly(butylene terephthalate) (PBT) are resistant to microbial attack [59]. However,
copolymerization of aliphatic monomers with aromatic monomers results in a biodegradable
polymer, like PBAT. PBAT, a biodegradable aliphatic-aromatic copolyester, is derived from
fossil fuel based adipic acid, terephthalic acid, and butane diol by a polycondensation reaction
[60]. The chemical structure of PBAT is shown in Table 2.1. Due to its mixed chemical
structure, PBAT can be enzymatically hydrolyzed in the presence of microorganisms followed
by mineralization like aliphatic polyesters [11]. The concentration of aromatic functionality plays
a vital role in the performance of the PBAT. PBAT shows higher thermal and mechanical
properties with a terephthalic acid concentration above 35 mol% but good biodegradability was
achieved with an aromatic moiety concentration lower than 55 mol% [33]. Therefore, PBAT
with a range of about 35 to 55 mol% of terephthalic acid can offer an optimal performance [61].
In 1998, PBAT with 22.2 mol% of aromatic moiety was commercialized under the trade
name, Ecoflex®, by BASF [11]. BASF studied the biodegradability of PBAT under composting
conditions. More than 90% of PBAT was observed to be metabolized within three months [62].
Witt and coworkers [11] studied the biodegradability of Ecoflex® under composting conditions
according to DIN-V-54900 standard and concluded that there is no environmental risk after

20
composting Ecoflex®. Mechanical properties of PBAT are comparable to polyethylene (Table
2.2) [63], but with water vapor permeability of PBAT (240 gm-2
d-1
) being higher than LDPE (3
gm-2
d-1
) [62]. In order to overcome this shortcoming, BASF is producing a wide range of
biodegradable master-batched Ecoflex® (mixed with wax, talc, carbon black, chalk or silica et
al.,) to fulfill the requirements set for different applications. Details of the masterbatches are
shown in Table 2.3 [64]. Among them, wax based masterbatch film has potential to reduce the
water vapor permeability up to 75% compared to virgin PBAT [62]. PBAT possesses excellent
toughness, biodegradability and processability. Therefore, PBAT is widely used for compostable
organic waste bags, agricultural mulch films, as well as lamination/coatings for starch-based
products [65]. Moreover, it can be used to tailor the properties of starch, PLA, and PHAs,
thereby opening up new applications for PBAT based materials. Currently, there are few
companies producing PBAT, including BASF (Germany), Ire Chemical (Korea), Shandong
Fuwin New Material (China), and Xinfu Pharmaceutical (China).
Table 2. 3. Ecoflex® based masterbatches for different applications [66,67]
Masterbatches Filler/additive
types
Filler
content
Proposed applications
Ecoflex® Batch
AB1
Chalk 60% Packaging films, compost bags and
agricultural films
Ecoflex® Batch
SL 05
Erucamide ESA
(lubricant)
5% Packaging films, compost bags and
agricultural films
Ecoflex® Batch C
Black
Carbon black 35% Packaging films, compost bags and
agricultural films
Ecoflex® Batch C
White
Titanium
dioxide (TiO2)
60% Packaging films, compost bags and
agricultural films
Ecoflex® Batch
SL 2
Lubricant (Wax) 5% Packaging films, compost bags and
agricultural films

21
2.4.3 Poly(caprolactone), PCL
PCL is a linear aliphatic biodegradable polyester derived from caprolactone by ring-
opening polymerization. PCL can also be produced by anionic, cationic, coordination, radical
and enzymatic catalyzed polymerization [68,69]. PCL is a typical semi-crystalline synthetic
thermoplastic with crystallinity ~50%, melting temperature of 58-65 oC (depending on the
crystallinity), and glass transition temperature of -60 oC [38]. PCL has been most widely used in
drug delivery, tissue engineering, and dentistry as it is approved by the US Food and Drug
Administration (FDA). PCL is commercially available under different trade names: Capa™
(Perstorp, UK), PlaccelTM
(Daicel Chemical Indus, Japan) and Tone® (Dow, USA). A well-
known PCL/starch biodegradable blend is commercially available in the market under the brand
name Mater-Bi®
Z grades, and is produced by Novamount, Italy [70]. This blend is mainly used
for biodegradable and/or compostable films and sheets. Inherent toughness and biocompatibility
of PCL are desired attributes that makes it an ideal choice of blending partner. In this view, PCL
has been blended with PLA, PHAs and PBS for different biomedical applications [71-75].
2.5. Recyclability of biodegradable polymers
Recyclability of plastics is a process that extends their service lives before discarding.
Plastic waste can be recycled in two different ways: mechanical and chemical recycling.
Mechanical recycling involves a polymer being re-melted and re-processed into desired products
through different processing techniques [76]. Chemical recycling is a process (depolymerization)
that converts polymers into their monomers, which are then used as a feedstock for further
polymerization process [9]. Among these recycling methods, mechanical recycling is most
favored method for bioplastics recycling. Many studies have been investigated on the mechanical
recyclability of biodegradable polymers, like PLA [77-80], PCL [81], PHBV [80, 82],
PLA/PHBV blend [80] and PBS [83]. Multiple extrusion and injection molding of the PLA

22
(3002D NatureWorks®, USA) has been studied by Żenkiewicz [77]. After re-extruding PLA for
10 times, the tensile strength, tensile strain and impact strength were reduced by 5.2, 2.4, and
20.2%, respectively. On the other hand, melt flow rate, oxygen and water vapor permeability
rates were significantly increased. After the 10-time extrusion cycle of PLA, the oxygen and
water vapor permeability rates were increased by 39 and 18%, respectively. Thermal properties,
such as thermal stability, crystallization, and melting point were slightly reduced while there was
no change in glass transition temperature. Another study investigated the recyclability of PLLA
(L9000, Biomer, Germany) up to seven-injection molding [78]. The authors found that the
tensile modulus was not heavily affected, whereas rheological properties, molecular weight,
hardness, tensile strength and strain at break were reduced considerably. A recent study also
proved that eight times mechanical recycling of PLLA (L9000, Biomer, Germany) leads to
considerable reduction in its mechanical properties as well as thermal stability [79]. Meanwhile,
the melt flow index (MFI) of the eight times recycled PLLA showed 15 times higher value than
unprocessed PLLA. The reduced mechanical properties were attributed to thermo-mechanical
degradation of PLLA during melt re-processing. Consequently, the molecular weight, thermal
stability and viscosity of the PLLA decreased. Such reduction in properties can be overcome by
using thermal stabilizers such as quinine and tropolone [78]. However, the study concluded that
PLLA (L9000, Biomer) can be recycled up to five times without a significant change in the
tensile properties and flexural modulus [79]. Zaverl and coworkers [82] investigated thermal and
mechanical properties of PHBV being recycled for seven times. Mechanical properties such as
impact, tensile, and flexural properties were not affected after recycling up to four times;
however, there was slight decrease after a fourth cycle. According to this study [82], there was
no change observed in the molecular weight of PHBV after two cycles. A considerable

23
molecular weight reduction was observed after the third (8.7%), fourth (13.5%) and fifth cycles
(16.6%). Even after fifth round of recycling, melting temperature and thermal stability of the
PHBV were not affected significantly. The chemical structure of the PHBV was not changed
during melt reprocessing, which was confirmed by Fourier transform infrared (FTIR)
spectroscopy. On the contrary, PHBV is more susceptible to thermo-mechanical degradation
compared to PLA [80]. Therefore, blending of PHBV with PLA can minimize the degradation of
PHBV during recycling. Recyclability of PCL has been investigated by Moraczewski [81]. After
eight cycles, there were no changes observed in tensile strength and elongation at break.
However, MFI, thermal stability, and Charpy impact strength of PCL were dependent on the
number of cycles. This study suggests that the recycled PCL can be blended with virgin PCL.
According to Kanemura et al., [83], PBS (Bionolle® 1020) can be recycled without affecting its
bending strength and modulus when reprocessed up to three times at 140°C using a compression
molding method. In addition, the molecular weight of the PBS was not heavily affected after
three times of reprocessing at 140oC. Therefore, this study concluded that PBS is a suitable
candidate for material recycling.
2.6. Durability of biodegradable polymers
Generally, durability is very important for polymers as it increases their suitability for a
wide range of applications. The durability of polymeric materials can be investigated by
exposing to simulated environmental variables such as temperature, and humidity. Only a few
studies have examined the durability of biodegradable polymeric materials [84-88]. These
literature sources report that biodegradable polymers are very sensitive to elevated temperature
and humidity. Recently, Harries and Lee [86,87] assessed the durability of PLA at elevated
temperature and humidity with respect to time. Their experimental findings suggest that after 28

24
days of exposure at 70 oC temperature with 90% relative humidity, PLA materials experienced
severe loss in mechanical properties. Therefore, commercial PLA cannot fulfill long-term
durability requirements set by the automotive industry. This drawback can be addressed either by
reducing the hydrolysis reaction through addition of scavengers/sacrificial compounds or by
blending/alloying with other durable polymers [86]. The degradation of PHBV has been
examined in distilled water and marine environments at different temperatures [89,90]. The
mechanical property performance of the PHBV gradually deteriorated with increasing immersion
time. This effect is attributed to the hydrolytic degradation of ester bonds in the PHBV
backbone. Usually, the durability of the polyesters depends on the chemical structure. Among
PLA, PBS, PBAT, and PBSA, PLA and PBAT are more durable compared to PBS and PBSA
[84]. However, the durability of PBS and its composites has been noticed to improve with the
addition of trimethylolpropane triacrylate (TMPTA) as an anti-hydrolysis agent [84]. The
durability of PBS, PBAT and their blend has been investigated by exposure to 50 oC and 90%
relative humidity for a duration of up to 30 days [91]. This study concluded that the
biodegradable polymers (PBS, PBAT and PBS/PBAT) could readily undergo hydrolytic
degradation in the presence of elevated temperature and humidity. The durability of
biodegradable polymers need to be improved under high humidity and temperature for
expanding their applications.
2.7. Polymer blends: Some examples
Neat polymers for commercial applications usually cannot fulfill all product
requirements. One of the alternatives for modifying the properties of polymers are to blend with
other polymers (one or more), which have complementary properties. Blending two or more
structurally different polymers might improve or tailor some of the properties and its cost

25
performance, making a blend that is able to meet specific end-use requirements [26].
Furthermore, polymer blending can be performed in standard processing equipment such as
twin-screw extruders. Generally, polymer blends possess unique physico-mechanical properties,
which are usually not present in their individual components. Polymer blends have a wide range
of applications in fields such as automotive, household items, electrical and electronics. Some of
the commercially available biodegradable polymer blends are listed in Table 2.4. A blend of
polylactic acid/lignin/fatty acid/wax shows mechanical properties similar to acrylonitrile
butadiene styrene (ABS). It has strong thermal insulation properties as well as excellent chemical
resistance against polar substances [92]. The properties of STARCLA™
(20 µm film) are
comparable to polyethylene [93]. BASF is producing biodegradable PBAT/PLA (55/45 wt%)
blend under the trade name of Ecovio®. The mechanical performance of Ecovio
® is similar to the
properties of high-density polyethylene [62].
Table 2. 4. List of companies engaged in the production of some biodegradable polymer blends
(the table was modified after referene [9, 94,95]).
Blends Applications Trade name Manufacturer
PLA/PBAT Blown films Ecovio®
BASF, Germany
PLA/copolymer Injection molding:
housewares, tackle
Cereplast
sustainable®
Cereplast Inc., USA
PCL based blend Films and injection molded
items
Mater-Bi®
Novamount, Italy
PLA/co-polyester
blend
Blown film and co-
extrusion
Bio-Flex® FKuR, Germany
PLA based blend Extrusion and blown film StarclaTM
Showa Denko
Europe
Biodegradable co-
polyester blend
Blown film and injection
molded parts
TerraloyTM
Teknor Apex
PLA/PBS or PBSA Food service ware IngeoTM
AW
240D
NatureWorks, USA
PBAT/PHA Fiber and non-woven BioTufTM
970 Heritage Plastics Inc.
USA

26
As discussed previously, high cost and inferior mechanical properties relative to several
commodity plastics are the downside of most of the biodegradable polymers and therefore wide
scale adaptability of these polymers have been significantly hampered. In order to effectively
overcome these drawbacks, melt blending is a fast, economical and a convenient approach
compared to developing a novel polymeric material through synthetic polymerization technique
[96]. For example, slow crystallization behavior and poor impact resistance of PLA hinders its
wide range of industrial applications. Researchers have found that crystallization and cold
crystallization were enhanced by incorporating PBS into PLA systems [97]. Yokohar and
Yamaguchi [98] have conducted studies on the structure-properties correlation of PLA/PBS
blend. They found that the cold-crystallization temperature of PLA was reduced in the blend
compared to neat PLA. This result indicated that PBS acted as a nucleating agent in the PLA
matrix. Blends of biodegradable polymers are being used for short-term applications, such as
absorbable medical implantations, compostable food packaging containers, and agricultural
mulch films. Kim and coworkers [85, 88] have reported the durability of talc filled biodegradable
PBS/PBAT (55/45 wt%) blends under marine environments. Better elastic properties were
observed in biodegradable materials compared to that of the recycled PE.
2.7.1 Miscible biodegradable polymer blends
At thermodynamic equilibrium, mixtures of polymers that exist in a single phase at the
molecular scale are referred to as miscible (soluble) blends [99]. Miscibility of polymers in the
blend system can be detected through glass transition temperature (Tg) and phase morphology.
Miscible polymer blends show single glass transition temperature. In most cases, the miscibility
of two polymers depends on the molecular weight, chemical structure of the polymer, and
crystallinity [100]. In the polymer blend system, some of the properties are determined by

27
miscibility, interaction and phase morphology. For example, the mechanical properties of the
miscible blends follow the rule of mixture [101]. A blend is considered partially miscible if there
exists phase separation but each polymer rich phase contains a sufficient amount of the other
polymer to alter the properties of that phase (e.g., the glass transition temperature) [101].
Normally, polymers are miscible with each other up to a certain limit. The Flory-Huggins theory
is most frequently used to calculate mutual solubility of polymer blends using an interaction
parameter. The Flory-Huggins interaction parameter (χ) can be obtained by the following
equation 1.1 [102]:
=
( ) (1.1)
The term Vr is reference volume, T is absolute temperature, δ1 and δ2 are the solubility
parameters of the components and R is the gas constant. The solubility parameters can be
calculated using group contribution methods [103]. If the interaction parameter (χ) value is less
than 0.5, it can be considered as miscible blend [104]. The Flory-Huggins theory always yields
negative interaction parameter values for miscible blends. For instance, a PHB/
poly(epichlorohydrin-co-ethylene oxide), PEEO blend has an interaction parameter value of -
0.089 [105] while a PLA/PBS blend has an interaction parameter value of -0.15 [106]. Another
study showed limited miscibility of PHB with 20% PBS blend [107]. This miscibility was
evidenced by shift in glass transition temperature and depression of the PHB melting
temperature. Bhatia et al., [108] found that a PLA/PBS blend system has partial miscibility when
the PBS composition was lower than 20 wt%. This result has been confirmed by rheological
properties. However, tensile strength and modulus of the PLA/PBS blends are lower compared to
neat PLA. The brittleness of the PLA is reduced with the addition of PBS, thus making it a

28
suitable material for packaging applications [108]. Park and Im [106] studied blends of two
typical biopolyesters (PLA and PBS) by melt blending through an extruder. In this polymer
blend system, a single glass transition temperature was observed, which was attributed to
enhanced miscibility, between the polymer phases. Spherulites morphology of the blends was
observed through optical polarizing microscopy and they concluded that crystallization induced
phase separation occurred when the PBS volume increased by more than 40 wt% in the blend
system. Moreover, PLA/poly(ethylene glycol) [109-110], PLA/poly(ethylene oxide) [104, 111],
and PHB/poly(ethylene oxide) [112] blends were able to form miscible blend system.
2.7.2 Immiscible biodegradable polymer blends
If mixtures of two polymers exhibit separate phase morphology (i.e., matrix-droplet and
co-continuous morphology), they are referred to as immiscible blends [113], as shown in Figure
2.1a. In the binary blends, the matrix-droplet phase morphology (Figure. 2.1b) changes to co-
continuous morphology (Figure. 2.1c) with an increase in the volume fraction of the dispersed
phase. Immiscible polymer blends exhibits different glass transition temperatures characteristic
of their pure blend components and core-shell morphology. The core-shell morphology of the
immiscible blends depends on the viscosity of the individual blend components, processing
aspects, composition, and compatibility between the components. Inherently some
biodegradable polymers (PBS, PBSA, PBAT, certain PHAs and PCL) have good toughness and
elongation. Therefore, they are considered as a promising candidate for modifying brittle
biodegradable polymers while preserving the biodegradability. However, a large amount of
literature shows that most of the polymer blends are immiscible due to poor dispersion of
the inclusion phase in the continuous phase, weak interfacial adhesion, and instability
between the components [26]. For instance, biodegradable polymer blends of PHBV/PCL

29
[114], PHBV/PBAT [115], PHBV/PBS [116], PHBV/PLA [117], PLA/PBS [98], PLA/PBAT
[118,119], PLLA/PCL [120], PLA/PHB [121], PCL/PBS [122], and PBS/PBAT [54] are all
immiscible blends. In order to improve the interaction between the pure polymers in the
blend system, compatibilization has proven to be an effective strategy for the immiscible
polymer blend systems.
Jiang et al., [119] studied the toughening of PLA through melt blending with
PBAT. Dynamic mechanical analysis (DMA) results showed two independent glass
transition temperature (Tg) peaks corresponding to their individual components, suggesting
that the PLA/PBAT blends were immiscible. Mechanical properties of the PLA blends
showed the greatest improvement in elongation and toughness with incorporation of
PBAT from 5 to 20 wt%. These improvements were correlated with de-bonding-induced
by shear yield and weak interfacial adhesion between the components in the blends. Wu et
al., [123] studied the PBS/PLA blend morphology, rheological properties, and interfacial
tension between the polymers. They observed that PBS/PLA blends were
thermodynamically not miscible and possessed co-continuous phase morphology in the
50/50 wt% blend. DSC analysis reveled that PBS has no significant effect on melting point
and crystallization behavior of PLA, but on the other hand, PLA had little effect on
melting point and cold crystallization of PBS.

30
Figure 2.1. (a) Schematic representation of the evolution of morphology in a binary
immiscible blend, (b) matrix/dispersed morphology, and (c) co-continuous morphology
(adapted with kind permission from Ravati and Favis, Polymer, 2010, 51: 4547-4561,
Copyright©
2015, Elesevier, Licence number 3591550612924 [113]).
Furthermore, Zhou et al., [124] studied PBS/PLA blends for biomedical
applications. They also made similar observations i.e., PBS/PLA blends were immiscible
and their mechanical properties followed the rule of mixtures. The hydrolysis behavior of
PBS, PLA and their blends was investigated under simulated body fluid for 16 months at
37 oC. The PBS/PLA blends lost their tensile properties earlier than the neat polymers due
to faster hydrolysis reaction facilitated by the interface present between the blend
components. Throughout the hydrolysis time, the molecular weight reduction of the blends
was faster than that of parent polymers. A blend of PHBV/PCL has been studied by
Jenkins et al., [125] and they suggested that the blend is not miscible.Melt-blended immiscible
PHBV/PLA blend was studied by Nanda et al., [117]. The mechanical performances of the
blends were dependent on processing parameters and composition of the constituents. The

31
elongation at break observed in PHBV/PLA blend [117] increased slightly compared to neat
PLA and PHBV. Similar trends were observed in compostable PLA/PHBV blend by Ma et al.,
[126]. It was demonstrated that matrix yielding and interfacial debonding were responsible for
the increased toughness in PLA/PHBV blends. According to Qiu et al., [116], a PHBV/PBS
blend is not miscible due to the independent Tg of two phases.
Some of the immiscible blends are considered compatible blends when they show fine
phase morphology and satisfactory performance in their mechanical properties [96]. These types
of blends show their characteristic Tg but most often the Tg values are shifted towards other
components in the blends indicating improved compatibility. The performance of the compatible,
immiscible polymer blends depends on many factors including their interaction, component
properties, composition, and compatibility between the polymers phases. Among all the
parameters, interaction is a factor of greater importance because it determines the thickness of
the interface between the components. John et al., [122] have investigated the compatibility and
miscibility of PBS, PBAT, and PCL blends. From DSC analysis, the blends of PCL/PBAT and
PCL/PBS are seen to have two melting points, which correspond to their individual melting
points. This result clearly indicates that these blends are not completely miscible. However, from
DMA analysis, a single Tg was observed for the PBS/PBAT blend. This is because the Tg
values of both the neat PBS and PBAT are very close to each other. Moreover, these blends
showed an interesting behavior when tested for tensile strength. The tensile strength of
PBS/PBAT (70/30 wt%) and PCL/PBS (30/70 wt%) blends was higher than that of neat PBS,
PBAT and PCL. This improvement was attributed to the interaction between the blended
components as well as a change in crystallinity. Recently, Muthuraj et al., [54] have reported a
similar type of synergistic effect in the PBS/PBAT blends.

32
2.7.3 Compatibilization of polymer blends
Compatibilization is an interfacial phenomenon in the heterogeneous polymer blends.
This interfacial activity can be modified by reactive and non-reactive processing strategies.
Compatibilization is a process by which the blend properties are enhanced while increasing
adhesion between the phases, reducing the interfacial tension, and stabilizing morphology [127].
To achieve these goals, there are several strategies to the method of compatibilization. The
degree of compatibility between the components in the blends can be enhanced through the
addition of compatibilizers [60-62]. The resulting mechanical properties of the immiscible,
compatible blend will have a balance of their parent polymer properties or show a synergistic
improvement [99]. Many commercially available polymer blends on the market are mostly
compatibilized using a compatibilizer [1]. Polymers with polar groups can interact between the
components in the blend through non-bonded interactions such as dipole-dipole interactions and
hydrogen bonding [1]. Therefore, biopolymers have more mutual miscibility than polyolefins.
Compatibilization of polymer blends was reviewed in detail by Koning et al., [96], and Imre and
Pukanszky [1]. According to these sources, the process of adding a premade compatibilizer
(block-copolymers) that has a strong affinity towards the blend components is referred to as
physical compatibilization. Introducing a compatibilizer that can promote chemical reaction
and/or specific interaction between the blend components is referred to as reactive or in-situ
compatibilization. Varieties of reactive compatibilizers have been identified in the earlier
publications [128-136]. Next section of this chapter discusses these compatibilization methods.
Generally, premade graft or block copolymers are mostly used to modify the
heterogeneous polymer blends interface by a non-reactive compatibilization method. In order to
make effective compatibilization of the blends by block-copolymers, the copolymer must have a

33
maximum solubility with components in the blend. This leads to strong interfacial adhesion
while lowering the interfacial tension between the components. The molecular weight and
concentration of compatibilizer (block copolymer) should be slightly higher than that of critical
entanglement and critical micelle concentration, respectively [137]. In addition, compatibilized
blends exhibit dispersed particle size at a sub-micron level which prevents coalescence during
subsequent processing [96]. Non-reactive biopolymer blends with block-copolymers have been
widely studied in the literature [138-140]. However, non-reactive compatibilization is less
efficient than reactive compatibilization [96]. Reactive extrusion generates reactive sites, which
interact with the other polymer component and localize themselves at interface between the
components in the blends. Such localization at an interface enhances the mechanical properties
and decreases the domain size of the inclusion phase. Reactive extrusion of the polymer blends
can be performed by one step (in-situ) or two-step extrusion. All of the components are
introduced simultaneously in the one-step reactive extrusion [141]. In the two-step reactive
extrusion, the first step involves functionalization of polymer with reactive agents followed by
the second step in which the functionalized polymers are blended with other components through
extrusion [142].
2.7.4 Non-reactive compatibilization of biodegradable polymer blends
Historically, immiscible polymer blends can be compatibilized through the addition of a
graft or block copolymers [127]. The block-copolymer acts as a compatibilizer between the
components in the immiscible polymer blend systems. As a consequence, the block copolymer
can reduce the interfacial tension between the components [142], as shown in Figure 2.2.
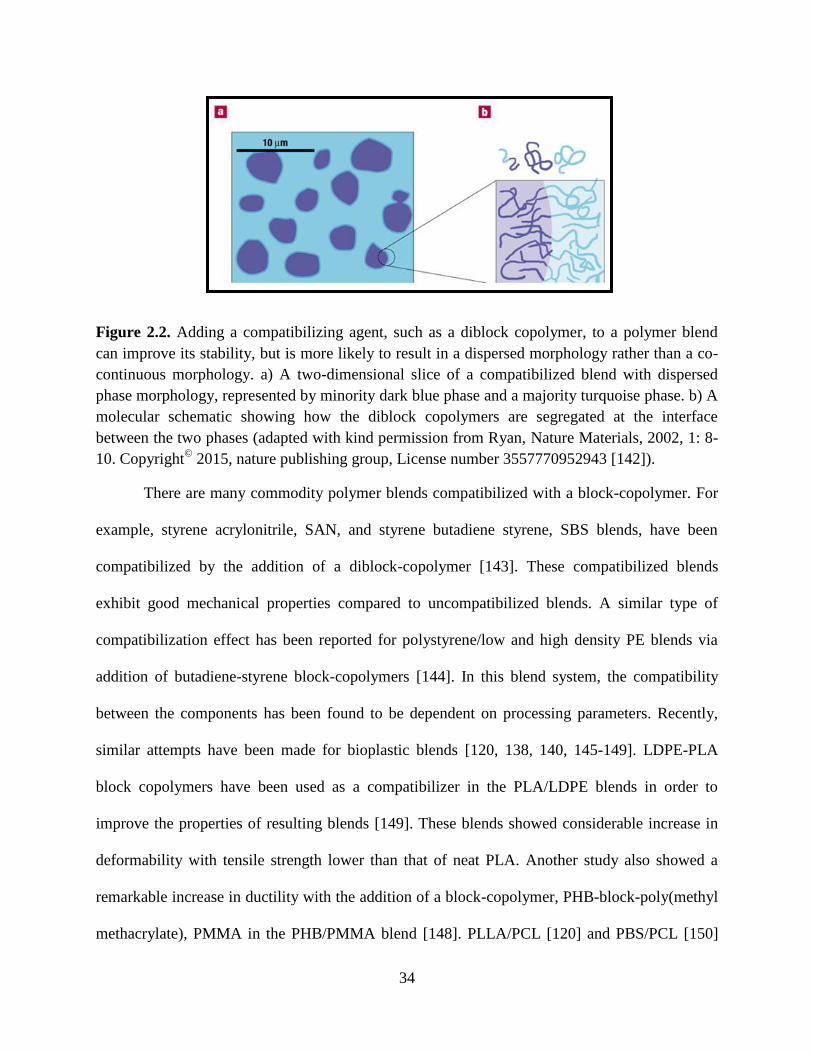
34
Figure 2.2. Adding a compatibilizing agent, such as a diblock copolymer, to a polymer blend
can improve its stability, but is more likely to result in a dispersed morphology rather than a co-
continuous morphology. a) A two-dimensional slice of a compatibilized blend with dispersed
phase morphology, represented by minority dark blue phase and a majority turquoise phase. b) A
molecular schematic showing how the diblock copolymers are segregated at the interface
between the two phases (adapted with kind permission from Ryan, Nature Materials, 2002, 1: 8-
10. Copyright©
2015, nature publishing group, License number 3557770952943 [142]).
There are many commodity polymer blends compatibilized with a block-copolymer. For
example, styrene acrylonitrile, SAN, and styrene butadiene styrene, SBS blends, have been
compatibilized by the addition of a diblock-copolymer [143]. These compatibilized blends
exhibit good mechanical properties compared to uncompatibilized blends. A similar type of
compatibilization effect has been reported for polystyrene/low and high density PE blends via
addition of butadiene-styrene block-copolymers [144]. In this blend system, the compatibility
between the components has been found to be dependent on processing parameters. Recently,
similar attempts have been made for bioplastic blends [120, 138, 140, 145-149]. LDPE-PLA
block copolymers have been used as a compatibilizer in the PLA/LDPE blends in order to
improve the properties of resulting blends [149]. These blends showed considerable increase in
deformability with tensile strength lower than that of neat PLA. Another study also showed a
remarkable increase in ductility with the addition of a block-copolymer, PHB-block-poly(methyl
methacrylate), PMMA in the PHB/PMMA blend [148]. PLLA/PCL [120] and PBS/PCL [150]

35
blends were compatibilized with triblock copolymer, (polyethylene oxide–polypropylene oxide–
polyethylene oxide). These two studies concluded that the blends with compatibilizer achieved
better compatibility and toughness compared to those of the uncompatibilized blends. The
enhanced compatibility between the components was further confirmed by a Tg shift and
decrease in PCL domain size in the matrix.
2.7.5 Reactive compatibilization of biodegradable polymer blends: Few specific examples
Poor compatibility between the phases is a major drawback in multi phase immiscible
polymer blends. Immiscible polymer blends can be compatibilized by introducing a
compatibilizer. Extensive work has been conducted on improving the compatibility between the
phases in heterogeneous biodegradable polymer blend systems.
2.7.5.1 Reactive compatibilization of PLA/PBAT blends: Recently, significant research has
been directed towards producing compatible PLA/PBAT blend through reactive processing. For
instance, Sirisinha and Somboon [128] investigated the reactive PLA/PBAT blends by adding 0
to 0.5 wt% of dicumyl peroxide (DCP) for blown-film processing. This study was completed
using fixed PLA/PBAT ratio (70/30 wt%) and varied the DCP loading from 0 to 0.5 wt%.
Rheological, melt flow index, and melt strength properties were measured to investigate the
synergistic effect of DCP addition into the blend system. The addition of DCP into a PLA/PBAT
blend was found to increase the elasticity and viscosity. In addition, good melt strength of the
blend allowed for easy processing when blowing the plastic into a film.
According to the literature [129], solubility parameter values of PLA and PBAT are 10.1
and 22.95 (cal/cm3)1/2
, respectively. The difference in solubility parameter leads to the formation
of immiscible blends as well as a reduction in their mechanical performance. These drawbacks
are addressed by using glycidyl methacrylate (GMA) as a reactive compatibilizer in melt blended

36
PLA/PBAT. Kumar and coworkers [129] studied the effect of mechanical, thermal as well as
morphological properties of PLA/PBAT blends with GMA. They incorporated GMA (3 and 5
wt%) into the optimum PLA/PBAT blend system in order to improve compatibility between the
components. They found that the impact strength of the PLA/PBAT/GMA (70/25/5) blends
increased (72%) as compared to virgin PLA. The increment in properties was attributed to the
formation of ethylene acrylic ester at the interface with the addition of GMA. Morphological
examinations confirmed that compatibility between the PLA and PBAT phases was in fact
improved in the presence of GMA. Thermo-mechanical analysis (DMA) further corroborated the
improvement noticed in compatibility between the PLA and PBAT and heterogeneous phase
morphology of the PLA/PBAT blends Furthermore, with the addition of GMA within
PLA/PBAT blends, reduction in crystallinity and inward shift in melting point were observed by
DSC analysis, supporting the enhanced compatibility between the two polymers.
Zhang et al., [130] investigated reactive blending of PLA/PBAT with a reactive
processing agent, a random terpolymer of ethylene, acrylic ester and glycidyl methacrylate
(abbreviated as T-GMA in their work). They prepared reactive blends of PLA/PBAT with T-
GMA at a varying concentration of 1 to 10 wt% by a melt blending technique. They found that
the tensile toughness and impact strength of the blends were improved with 1 wt% of T-GMA
incorporation, but no changes occurred with increasing T-GMA concentrations. The toughness
and impact strength improvement were attributed to increased miscibility between PLA and
PBAT phase, which was confirmed by SEM analysis. From the DSC analysis, they found two
glass transition temperatures from the blends, indicating that the blends were not homogenous
after adding T-GMA. During melt blending, the PLA/PBAT blend can be compatibilized by a
transesterification product with the help of terbutyl titanate (TBT) [131]. The mechanical and

37
thermo-mechanical properties of this compatibilized blend were improved significantly
compared to the non-compatibilized PLA/PBAT blend. Best elongation at break (298%), impact
strength (9 kJ/m2), and tensile strength (45 MPa) of PLA/PBAT blend were obtained with 0.5%
TBT concentration. The compatibility between PLA and PBAT has been improved through
transesterification reaction products, which was demonstrated by SEM micrographs.
2.7.5.2 Reactive compatibilization of PLA/PBS blends: PLA/PBS blends have been
compatibilized using lysine triisocynate (LTI) as a reactive processing agent [135]. Significantly
higher level of improvement was observed in the impact strength (2-4 fold increase compared to
PLA), and elongation at break with a decrease in melt flow rate. This improvement could
possibly be due to the grafting or crosslinking of LTI with PBS or PLA in the blends. However,
this reactive compatibilization was detrimental to tensile strength of PLA/PBS blends. A similar
trend was observed in the PLLA/PBS blend with a dicumyl peroxide (DCP) reactive agent [51].
These blends achieved stronger interfacial adhesion and fine dispersed phase morphology owing
to the increased compatibility between the blended components. Consequently, the PLLA/PBS
blend with 0.1 parts per hundred (phr) of DCP showed 12-fold increment in the Izod impact
strength compared to virgin PLLA. This improvement was attributed to debonding through shear
yielding. However, both flexural strength and flexural modulus continuously decreased with
increasing DCP concentration. Yet, DCP is not an appropriate choice when trying to improve
elongation at break of PLLA/PBS blends. Unlike PLLA/PBS blends, PLA/PBAT blends with
0.1-0.2 phr DCP showed significant improvements in elongation at break as well as increased
impact toughness [141]. Chen et al., [151] investigated the compatibility between the PLA and
PBS blends with twice functionalized nanoclay (TFC). SEM revealed that the PBS domain size
gradually decreased when 2 wt% TFC was incorporated into PLA/PBS blends, due to increased

38
compatibility between the polymer phase in the blend system. Elongation at break was increased
with the addition of TFC into PLA/PBS blends. Flory-Huggins theory suggested that TFC has a
high compatibility with the PLLA phase when compared to the PBS phase. In addition, there was
no improvement in the elongation at break when nanoclay without functionalization was
incorporated, which indicates that no compatibility existed between the PLA/PBS blends. Ojijo
et al.,[152] have improved the toughness of PLA/PBSA blends by in-situ compatibilization with
triphenyl phosphite (TPP). Comparing the impact strength and elongation at break for neat PLA
and PLA/PBSA blend containing 10% PBSA and 2% TPP, the impact strength and elongation at
break of compatibilized PLA/PBSA blend showed 166% and 516% higher value compared to
neat PLA. These improvements were attributed to shear yielding of the matrix, which was
initiated by the debonding between the blended components. In addition, there was no significant
change in the tensile strength and thermal stability of the compatibilized blends. The authors also
suggested that the barrier properties, thermal properties and mechanical properties of this
toughened PLA/PBSA blend system could be improved by the addition of clay into such a
system.
2.7.5.3 Reactive compatibilization of PLA/PHB and PHBV/PBS blends: Reactive
compatibilized PLA/20 wt% PHB (MirelTM
M4300) copolymers showed 1.3 J tensile toughness
and 200% elongation at break [121]. These values are significantly higher than neat PLA and
non-reactive blends of PLA/20 wt% PHB. It is important to note that this amorphous PHB is
thermodynamically immiscible with PLA. However, reactively compatibilized PLA/PHB blend
shown that the notched Izod impact strength of immiscible PLA/20 wt% PHB copolymer blend
is 20 times greater than that of virgin PLA (from 0.4 ft.lb/inch to ~8.2 ft.lb/inch) [121]. The same

39
blend displayed a tensile modulus of ~2 GPa and tensile strength of ~50 MPa. Therefore, the
stiffness-toughens performance of this blend is superior compared to PBT and polypropylene.
PBS is another biodegradable thermoplastic polyester with tensile strength comparable to
PP and stiffness similar to LDPE with fair processability using processing equipments of
conventional polyolefin thermoplastics [153]. PBS has a glass transition temperature of around -
30oC, which gives it a high toughness compared to the polymer at room temperature. Also, the
high elongation of PBS (more than 200%), makes it an ideal candidate to blend with a brittle
biopolymer [116]. Therefore, PBS seems to be one of the biodegradable polymers that can be
effective in improving the toughness of PHBV. Ma et al., [57] investigated the toughening
mechanism of PHB/PBS blend and PHBV/PBS blend by using an in-situ compatibilizer DCP
through melt blending. They found that the PBS domain size was considerably reduced by
incorporating DCP into those two blends. The domain size reduction was directly related to the
interfacial adhesion between the components in the blend systems. During melt blending,
addition of DCP into the blends could generate a grafting reaction between the components
(PHBV, PHB, and PBS) in the blends such as PHBV-g-PBS and PHB-g-PBS. The PHBV-g-PBS
and PHB-g-PBS acted as a compatibilizer in the blend system which in turn improved the
interfacial adhesion between the polymer phases. Consequently, the mechanical properties of the
PHB/PBS and PHBV/PBS blends were considerably increased. For example, after incorporation
of DCP (0.5 wt%), the elongation at break of PHBV/PBS (80/20) blend was increased by 39-
fold, in comparison to the corresponding uncompatibilized blend. In addition, a significant
improvement was observed in un-notched Izod impact toughness of the PHB/PBS blends with
0.5 wt% DCP. Similarly, the poor compatibility between the PHB and PLA has been improved
by using DCP as reactive agent [154]. The strength and impact toughness of the compatibilized

40
blends were improved in comparison to uncompatibilized PHB/PLA blends. The improved
compatibility was attributed to the formation of crosslink network and/or copolymer (PHB-g-
PLA) at the interfaces. Consequently, the the inclusion phase (PLA) domain size was observed to
have reduced significantly.
2.7.5.4 Reactive compatibilization of PLA/PCL blends: Shin and Han [132] showed melt
blending of PLA/PCL resulted in immiscible blend without compatibilizer and that the
compatibility was improved by adding GMA into the blend. The improved compatibility has a
direct relationship with mechanical properties and fine morphology. In addition, they have
observed that GMA acted as a reactive monomer between the PLA/PCL blend interfaces. Liu et
al., [133] have studied super toughened ternary blends with PLA/ethyl-butyl acrylate and
glycidyl methacrylate copolymer (EBA-GMA)/ethylene methacrylic acid zinc ionomer (EMAA-
Zn). This reactive blend exhibited remarkable improvements in notched Izod impact strength
(from 38 to 770 J/m) and elongation at break (from 5 to 229%). These improvements were
attributed to the compatibilization that occurred between the components in the resulting blends.
In another study, reactive blending of PLA and ethylene-glycidyl methacrylate (EGMA) showed
a dramatic improvement in impact strength (70 kJ/m2) and elongation at break (>200%)
compared to virgin PLA [134]. Zhang et al., [155] have studied a super-toughened multiphase
PLA blends with series of renewable poly(ether-b-amide) (PEBA) copolymer and ethylene
methyl acrylate-glycidyl methacrylate (EMA-GMA) terpolymer. This reactive multiphase blend
(PLA/EMA-GMA/PEBA (70/20/10 wt%) system showed a massive improvement in the impact
toughness (~500 J/m) and elongation at break (~75%). The authors concluded that the
improvements are attributed to the combination of strong interfacial adhesion between the phases
and massive shear yielding phenomena. Both the miscibility and impact energy of the PLA/PCL

41
blends were dramatically improved with the addition of lysine triisocynate (LTI) [136]. This was
due to reduction in size of the PCL phase in the PLA matrix; this behavior reduced the localized
stress concentration triggered by interfacial failure. A blend of PLA/PCL (85/15) was melt
processed with and without LTI (1 wt%) as a reactive additive [136]. The average fracture
energy of PLA/PCL/LTI was measured to be five times higher than that of PLA/PCL blend.
Similar to other studies, addition of LTI was found to increase the miscibility of PLA with PCL.
The improved compatibility between the PLA and PCL contributed to the reduction of PCL
domain size, which facilitated increased energy absorption during the fracture process. Wang et
al., [156] have improved the toughness of PLA/PCL blends by in-situ compatibilization with
triphenyl phosphite (TPP). The percentage elongation of the reactively compatibilized
PLA/PCL/TPP (80/20/2 or 20/80/2 by weight) blends improved considerably when compared to
neat PLA and corresponding uncompatibilized blend. This result suggested that a synergism
existed for certain compositions of PLA/PCL blends. Moreover, the compatibilized blends
showed higher susceptibility to enzymatic degradation when compared to neat PLA, PCL and
PLA/PCL blend without reactive agent.
2.8 Natural fibers
2.8.1 Classification of natural fibers
Natural fibers are are classified based on their origin as it can be obtained from either
plant or animal sources. The major component of animal fibers (e.g., wool, feather, angora fiber,
and silk fiber) is protein, whereas the major component of plant fibers is cellulose [157]. Plant
fibers (cellulosic/lignocellulosic fibers) can be classified based on their origin: seed/fruit fibers
(e.g., cotton, coir, et al.,), leaf fibers (e.g., sisal, pineapple), bast fibers (e.g., jute, keneaf, flax et
al.,), agriculture residues (e.g., corn straw, wheat straw, corn stover, et al.,) and grass/reed fibers

42
(switch grass, miscanthus, bamboo, et al.,). Plant fibers (excluding cotton) are mainly composed
of water-soluble organic components, lignin, waxes, cellulose, hemicellulose, and pectin. Based
on the type of the biomass, the chemical compositions of fibers can vary widely [158].
2.8.2 Natural fibers: nature and behavior
The performance of the plant fiber depends on its internal structure, architecture,
chemical composition, crystallinity and micro-fibril orientation angle [159] (Table 2.5). Among
the natural fiber constituents, cellulose has higher crystallinity. In contrast, lignin is amorphous
in nature with a highly complex aromatic structure. Because of its stiffness, lignin acts as a
protective barrier for cellulose in the plant. Hemicellulose is a highly branched polymer with a
degree of polymerization 10-1000 times lower than cellulose [160]. Pectin is usually found in
primary cell wall of most plant fibers. Pectin is more hydrophilic component in plant fiber due to
presence of carboxylic acid group. Generally, native cellulose has strength > 2GPa and a
stiffness of 138 GPa [161]. The stiffness of natural fibers depends on the microfibril angle.
Therefore, plant fibers with high cellulose content (~60-80%) and low microfibril angles have a
strong reinforcing effect in composites. Both pectin and hemicelluloses play important roles in
the water absorption, swelling, elasticity, wet strength and fiber bundle integration of the fibers
[41].
2.8.3 Advantages and challenges in using natural fibers
Unlike synthetic fibers, natural fibers are lightweight and inexpensive. They possess high
toughness, reduced tool wear, good insulation properties, reduced human health hazard,
enhanced energy recovery, recyclability, and biodegradability [153]. The specific modulus and
strength of the natural fibers are comparable to glass fibers [46, 160, 162], as shown in Table 2.5.
Furthermore, the natural abundance, renewability, CO2 neutrality and lower density of natural

43
fibers have caused an increasing demand for these fibers in material applications. However, there
are some major drawbacks with respect to plant fibers, including complex supply chain,
geographical availability, moisture absorption, and inconsistency. The inconsistency of the plant
fibers is related to many factors, such as harvesting time, species type, soil quality, fertilization,
moisture content of the fibers, location of the plant growth, as well as climatic conditions during
plant growth [157]. Moisture absorption of the natural fiber can vary greatly depending on the
fiber types. This moisture absorption creates performance problems for products made out of
such natural fiber composites. Due to low thermal stability, natural fibers are recommended for
process/use below 200oC [36, 157]. These issues can be effectively addressed by appropriate
material selection/screening techniques [162, 163].
2.9. Biocomposites
The term composites originated from the Latin word, compositus. In general, composites
are materials made from two or more distinct constituent having significantly different physical
and/or chemical properties. At least two components are required in order to prepare composites
material: matrix or continuous phase and reinforcement or discontinuous phase. The continuous
phase acts as a binder while the discontinuous phase acts as reinforcement. Often both
continuous and discontinuous phases are easily distinguishable in the resulting composite
materials. Generally, the mechanical performances of the reinforcements are higher than those of
the matrix phases. Composite materials properties can be tailored to suit specific application
requirements. Composites are generally classified based on their matrix sources like metal,
ceramic and polymer (thermoplastic and thermoset). Based on their reinforcements, the
composites can be further categorized as fibre (short or long) composites and particulate
(powder, flacks and spherical) composites, fabric based composites and long fiber reinforced

44
thermoplastic composites. Most common fibers, such as aramid, carbon and glass are used as a
reinforcement in conventional polymer matrices, such as PP, epoxy resins, unsaturated polyesters
and polyurethane [164], while E-glass fibers dominate in the fiber reinforced plastic composites
(FRCs) market [161]. Biocomposites offer a combination of high mechanical properties,
lightweight, moldability and design flexibility. Thermoplastic polymer matrices usually
dominate the class of natural fiber composites.
FRCs have diversified applications in automotive interior parts, packaging, construction,
furniture, consumer goods, electrical, musical instruments, wind turbine rotor blade and decking
industries [161]. A combination of flax and carbon fiber reinforced composites are used in
sporting equipment (snowboards, tennis racket and bicycle frames) because of its superior
vibration damping properties and mechanical performance [157]. In 2002, fiber reinforced
composites share of the global market was 771 million kg and this has continued to grow
extensively [41]. The amount increased to 8.7 million tons in 2011 [161]. In 2002, fiber
composites had a maximum share of 31% in automotive applications followed by construction
applications (26%) [10]. In Europe, this trend increased significantly because of mounting
environmental concerns. Increasing interest in biodegradable and/or biologically derived
materials has fueled vivid research in biocomposites [46]. Either a composite produced from the
combination of non-biodegradable polymer with a natural fiber/filler or a bioplastics with
synthetic fibers/fillers can be called as biocomposites.
2.9.1 Advantageous of natural fiber composites
Natural fiber composites (NFCs) have numerous benefits compared to synthetic fibers
such as abundant availability, lightweight, eco-friendly, nonabrasive, inexpensive, good fatigue
and specific strength [165]. Biocomposites made from plant based fiber and renewable resource

45
based polymers can be termed eco-composites or all green composites [46]. Any biocomposites
that are compostable, recyclable, environmentally friendly and commercially adequate can help
in waste management [162]. Biocomposites are in huge demand for automotive uses, as they
reduce both manufacturing costs and fuel consumption while meeting the consumer pull for
greener products [36]. Because of global warming, environmental concerns, and an increased
interest in greener products, biocomposites based on bioplastics have been developed.
2.9.2 Attributes of natural fiber composites
Properties of NFCs are strongly influenced by many factors, including stress transfer
between the fiber-matrix, fiber orientation, fiber-matrix interaction, fiber volume, fiber length
and aspect ratio. There are some drawbacks associated with natural fiber composites, like
incompatibility with some polymer system, poor wetting, moisture sensitive, non-destructive
behavior, and lower thermal stability that could affect the composites performance [36, 164].
Natural fibers are mainly hydrophilic in nature making them incompatible with the
hydrophobic polymer matrix and their addition can lead to a reduction in the mechanical
performance of the resulting products [153]. The polarity difference between the
thermoplastics matrix and the natural fibers may result in poor fiber-matrix adhesion in the
resulting composites. A lack of interaction/compatibility between reinforcement and matirx
reduces the overall performance of the resulting materials [41]. The compatibility between
the reinforcement and matrix can be improved by chemical surface modification (sodium
hydroxide, permanganate, peroxide, maleic anhydride, organosilanes, and isocynates) and
physical surface modification (cold plasma treatment, corona treatment) of the fibers [41].

46
Table 2.5. Properties of some natural and synthetic fibers
Fibers Density
(g/cm3)
Specific tensile
strength
(MPa)
Specific tensile
modulus
(GPa)
Elongation
at break
(%)
Cellulose
content
(wt%)
Cellulose
Crystallinity
(%)
Microfibril
angle
(Degree)
Moisture
(wt%)
Price
(US$/kg) References
Flax 1.5 535-1000 18.4-53 1.2-3.2 64-71 50-90 5-10 8-12 2.1-4.2 [157, 159, 161]
Hemp 1.47 372-608 47.3 2-4 70-74 50-90 2-6 6.2-12 1.0-2.1 [153, 157, 159,
161]
Jute 1.3-1.5 269-548 6.85-20.6 1.5-1.8 61-72 50-80 8 12.5-13.7 0.35-1.5 [153, 157, 159,
161]
Kenaf 1.5-1.6 641 36.55 1.6 31-39 - - 6.2-12 0.26-0.52 [157, 159]
Ramie 1.5-1.6 147-625 29.3-85 2-3.8 68.6-76.2 - 7.5 12-17 1.5-2.5 [153, 157, 159]
Sisal 1.45 366-441 6.5-15.2 3-7 66-78 50-70 10-25 11 0.6-0.7 [157, 159, 161]
Bamboo 1.1 454 32.6 1.4 26-60 40-60 8-11 9.16 0.45-0.5 [157]
Coir 1.2 146 3.3-5 30 32-43 27-33 30-49 11.36 0.25-0.5 [159, 161]
Cotton 1.6 179-373 3.44-7.9 7-8 82.7-91 - - 7.85-8.5 2.1-4.2 [159, 161]
Abaca 1.5 267 8 3-10 56-63 20-25 15 0.345 [36, 159]
Pineapple 1.4-1.6 118-446 4-27 1.6 70-82 44-60 14 11.8 0.4-0.55 [153, 161, 165]
Banana 1.35 444 13.2 3.36 44-64 45-55 10-12 10.71 - [159, 161]
Miscanthus 1.41 - 6.7 - 38 - - - - [166, 167]
Switchgrass 1.40 37.7 6.4 - 32 - - - - [166, 168]
Softwood 1.5 667 26.6 4.4 - - - - - [159]
E-glass 2.55 1333 28.63 3.4 - - - - 2 [36, 159, 165]

47
Another strategy is to improve the interfacial adhesion through the addition of a
“compatibilizing/coupling agent” into the composites during processing [36]. Generally, the
“compatibilizer/coupling” agents are used to modify the interface between the matrix and
reinforcement in the composite structures. The interfacial modification may be in the form of
a physical and/or chemical interaction between the components in the composites. Enhanced
compatibility between the phases of the composites helps in improving fiber-matrix adhesion,
resulting in improved performance of the resulting composites. Natural fiber composites with
compatibilizers are reviewed in detail in subsequent sections.
2.10. Biocomposites based on biodegradable blends as matrix material: Some specific
examples
There have been many reviews on natural fiber composites [157, 159, 163, 169], [161],
[41, 170, 171], [10, 36, 46, 172]. Most of these publications reviewed single polymer matrix
based biocomposites. Reviews of biocomposites fabricated using biodegradable blends as matrix
material are very limited. Recently, biocomposite fabrication using blends of polymer matrices is
part of the growing trend because blend matrices could provide an optimum stiffness-toughness
balance, or tailored properties for resulting biocomposites. Currently, few biodegradable pre-
blends are commercially available in the market, for instance PHBV/PBAT blend, available
under the name of ENMATTM
from Tianan Biologic Materials Company. Ltd., China [173].
BASF commercialized a biodegradable polymer blend under the trade name Ecovia®. It is a
blend of PLA/PBAT (45/55 wt%) with 45 wt% biobased content [174]. In addition, FKuR is
producing PLA-Copolyester blends under the trade name Bio-Flex. All of these blends are
successful matrix material for the incorporation of natural fibers. Zhang et al., [175] fabricated a
biodegradable and renewable ternary blends from PHBV, PLA and PBS. The ternary blends
(PLA/PHBV/PBS) showed a unique stiffness-toughness balanced mechanical properties

48
compared to their neat components. The authors concluded that the ternary blend
(PLA/PHBV/PBS) system is very promising for the biocomposites application. Similarly,
Muthuraj et al., [54] have also developed a binary blend of PBS and PBAT with good thermal,
mechanical and thermo-mechanical properties to be used as a matrix material for composite
applications. These research efforts are indicative of the fact that the multiphase polymer blend
provides a simple and an effective way to develop a new polymer matrix system for natural fiber
composites.
2.10.1 Biocomposites based on PHBV blends
As stated previously PHBV is a brittle and biodegradable polymer. By blending PHBV
with tough, biodegradable polymers, their mechanical and thermal properties can be tailored
without sacrificing the biodegradability [117]. Therefore, many researchers have extensively
studied the toughened PHBV blend biocomposites (Table 2.6). For example, Javadi et al., [173]
investigated the preparation and performance of solid and microcellular pre-blend of
PHBV/PBAT and its recycled wood fiber (RWF) based composites with and without silane
treatments. There were no significant changes in the SEM morphology of the
PHBV/PBAT/silane-treated-RWF composites and PHBV/PBAT/untreated-RWF composites,
suggesting that silane treatment was not worthy for improving thermal properties and interfacial
bonding between the fiber-matrix. However, addition of 10% RWF into PHBV/PBAT blends
increased the crystallinity, storage modulus, specific tensile strength, tensile modulus and
decreased strain at break and toughness compared to the neat PHBV/PBAT blend. Overall, the
authors concluded that silane-treated-RWF reinforced PHBV/PBAT composites did not induce
any significant changes in morphology, mechanical and thermal properties of
PHBV/PBAT/RWF untreated-RWF composites.

49
Nagarajan et al., [168] studied the performance of biocomposites fabricated from a pre-
blend of PHBV/PBAT (45/55%, ENMATTM
) as matrix and switchgrass fiber (20-40 wt%) as
reinforcement. An obvious increase was observed in the modulus of the composites because of
the reinforcing effect of the switchgrass fibers. However, the resulting composites showed poor
interfacial adhesion between the fiber-matrix. Therefore, the interfacial adhesion was improved
by adding poly (diphenylmethane diisocynate), (PMDI) as a compatibilizer (0.5, 0.75 and 1 phr).
SEM analysis indicated the occurrence of a better stress transformation between the fibers and
matrix through improved interfacial adhesion, which lead to an increase in the mechanical
performance of the resulting composites. The critical concentration of compatibilizer was found
to be 0.75 phr. This critical concentration yielded 80, 40 and 56% improvements in notched Izod
impact strength, flexural strength and tensile strength, respectively. Furthermore, the composites
with and without compatibilizer showed a considerable improvements in storage modulus and
heat resistance properties compared to the matrix. The melt flow of both compatibilized and
uncompatibilized composites sharply reduced in comparison to the PHBV/PBAT blend matrix.
For example, with addition of 30 wt% switchgrass fibers into PHBV/PBAT matrix, melt flow
index (MFI) reduced to 7 g/10min. It could be due to the restriction of polymer chain mobility in
the presence of stiff fibers. The MFI of the composites with 30 wt% switchgrass fibers and 0.75
phr compatibilizer is around 5 g/10 min. Authors suggest that this biocomposites can be injection
molded with the help of some processing additives.
Biocomposites was prepared from a PHBV/PBAT(45/55%) blend and distiller’s dried
grains with solubles (DDGS) using melt processing technique by Zarrinbakhsh et al., [176]. This
study explored the influence of compatibilizer (0.5 and 1% PMDI) and lubricating agent (3 and
6% corn oil) on the performance of the resulting biocomposites. Use of PMDI as a

50
compatibilizer was observed to increase mechanical properties significantly when compared to
uncompatibilized composites. The composites with only 0.5% PMDI showed a maximum
improvement in tensile strength (39%) and modulus (24%). There was no significant change of
these mechanical properties while increasing PMDI content from 0.5 to 1%. Similar trends were
observed in flexural properties. These improvements may be due to the good interfacial adhesion
that occurred through cross-linking reactions between the components in the composites. This
reaction was confirmed by MFI reduction, as well as by the increased melt viscosity of the
composites. However, the addition of only corn oil reduced both the stiffness and strength of the
composites. Interestingly, combination of both corn oil and PMDI displayed a synergistic effect
in impact strength and elongation at break. Authors attributed this improvement to the lubrication
effect of corn oil, which enhanced the chemical reaction between the components. Water
absorption rate of all the biocomposites was higher than PHBV/PBAT blend matrix. However,
the initial water absorption rate of the compatibilized composites was lower than that of the
uncompatibilized composites. Reduction of free hydroxyl groups in the DDGS particles after
chemically reacting with the matrix was believed to be the reason. The interfacial interaction
between matrix and DDGS was justified by scanning electron microscopy analysis. In few other
studies, the biodegradability of DDGS/PBAT [177], DDGS/PLA [178], and DDGS/PHA [179]
composites has been investigated under different environmental conditions. These DDGS based
biocomposites exhibited superior biodegradation rate compared to their biodegradable polymer
matrix.
In a different study, Nagarajan et al., [158] studied the influence of adding 30 wt% of
various natural fibers (miscanthus, switchgrass, wheat straw, corn stalk, and soy stalk) into
PHBV/PBAT (45/55 wt%) blend by extrusion and injection molding technique. They have

51
evaluated the water uptake behavior, mechanical, thermal and thermo-mechanical properties.
Among biocomposites with different types of fibers, miscanthus based composites exhibited
higher mechanical properties, heat deflection temperature, higher thermal stability, and
comparatively low water absorption. The observed property differences between the composites
were due to difference in fiber composition, fiber length distribution, and the interaction between
the fibers-matrix. Moreover, SEM micrographs showed debonding and fiber pullout from the
matrix, which was attributed to the inefficient stress transfer occurring between the components.
Similar to this study, various types of agricultural residues reinforced PLA composites have also
been reviewed [180]. The biodegradability rate of these nature fiber reinforced composites can
be expected to be much faster in comparison to their parent components [181].
The influences of man-made cellulose, jute and abaca fiber on the mechanical properties
of PHBV/PBAT (70/27.6% and 2.6% processing additive) blend were also investigated by
Bledzki and Jaszkiewicz [182]. The composites samples were produced in extrusion and
injection molding process. The fillers had positive effects on tensile properties and notched
Charpy impact strength. Among the abaca, jute fibers and man-made cellulose, abaca fiber has a
high tensile strength (980 MPa) and a high modulus (27-32 GPa) [182]. However, abaca fiber
based composites underperformed compared to man-made cellulose and jute fiber composites.
The composites with man-made cellulose showed a massive improvement (> 500%) in notched
Charpy impact strength and a 50% improvement in tensile strength over the PHBV/PBAT
matrix. SEM micrograph of PHBV/PBAT composites showed a poor adhesion between the
fiber-matrix. This was attributed to the partial degradation of PHBV/PBAT blend during melt
processing and post-molding shrinkage of the PHBV/PBAT blend matrix. Similar to a previous
study, a massive increase in the tensile modulus was observed for the PHBV/PBAT/(70/27.6%

52
and 2.6% processing additive) blend with jute fiber composites [183]. The observed results were
attributed to chemical composition, aspect ratio and the geometry of the fibers. SEM analysis
revealed that the compatibility between the fiber and the matrix was poor due to the shrinkage
nature of PHBV in the matrix. Even still, PHBV/PBAT composite properties are comparable
with PP biocomposites.
The effects of sodium hydroxide (NaOH) treated and pectinase retted kenaf fibers on
PHBV/PBAT composite properties were studied using compression molding [184]. This study
investigated the dynamic mechanical analysis and crystallization behavior of composites with
two different fiber lengths (5 and 10 mm). The dynamic mechanical properties of the composites
showed that the storage modulus of the composites increased with the addition of fiber compared
to the PHBV/PBAT matrix. The storage modulus of pectinase retted fiber reinforced composites
was higher compared to corresponding composites with NaOH retted fiber. The composites with
5 mm retted fibers showed a higher storage modulus than the 10 mm fiber and their hybrid (1:1)
composites. In the presence of both pectinase and NaOH retted fibers, the glass transition
temperature of PBAT increased and the damping factor of PHBV phase reduced. The fiber
retting had influence on crystallization, melting and spherulite morphology of the PHBV/PBAT
matrix, which was confirmed by polarizing optical microscopy (POM) analysis. POM was used
to study the nucleation density and spherulite growth of PHBV/PBAT blends and their
biocomposites. The nucleation density of the PHBV/PBAT blend increased with the addition of
fibers and it lead to a change in the crystal morphology of the resulting composites.
Consequently, the melting point of the composites was reduced as compared to the PHBV/PBAT
matrix with increase in the melting enthalpy. This suggested that the pectinase retted kenaf fibers
have more surface activity and thus increased the crystallinitythan the unmodified kenaf fiber.

53
The complex viscosity of the composites was higher than the matrix because of the restricted
polymer chain mobility in the presence of rigid fibers. NaOH retted fiber composites showed less
nucleation density and larger spherulites as compared to pectinase retted fiber composites. This
was attributed to the enhanced roughness of the NaOH retted kenaf, which tend to form tiny
spherulites.
Zarrinbakhsh et al., [185] investigated green composites made from distiller’s dried
grains with solubles (DDGS) and an optimized blend of PHBV/PBS (70/30 wt%) matrix.
Mechanical, thermal, morphological, and thermo-mechanical properties of the injection molded
composites were studied. Interestingly, after water washing of DDGS, the thermal stability of
DDGS was improved because of water solube moleculaes were washed away. The improved
thermal stability allowed for higher processing temperatures without any thermal degradation of
DDGS up to 180oC. The water-washed DDGS composites showed an improved tensile and
flexural strength compared to non-washed DDGS composites. When poly(diphenylmethane
diisocynate) (PMDI) was introduced as a compatibilizer into water-washed DDGS composite,
there were significant improvements in flexural strength and tensile strength. The flexural and
tensile modulus of the DDGS composites has an increasing trend in the following order:
PHBV/PBS blend matrix<non-washed DDGS composites<water-washed DDGS
composites<water-washed/compatibilized DDGS composites. The improved tensile and flexural
properties were attributed to the enhanced interfacial adhesion between the fillers and matrix,
which was confirmed through SEM. The impact strength of water-washed DDGS composites
and water-washed/compatibilized DDGS composites was lower compared to non-washed DDGS
composites. It was hypothesized that the poor interfacial bonding between the phases needs more

54
energy to break the fillers because the crack propagation occurred around the fillers rather than
braking fillers.
Recently, Zhang et al., [186] studied preparation and performance evaluation of
sustainable green composites from ternary PHBV/PBAT/epoxidized natural rubber (50/35/15
wt%) blend matrix and miscanthus fibers. The selected ternary blend system has non-break
behavior under notched Izod impact test. However, the addition of 10 wt% miscanthus fiber into
this ternary blend matrix, the impact strength of the resulting composites was observed around
273 J/m. A similar trend was observed in the elongation at break and tensile strength. This
reduction was mainly due to weak interfacial interaction between the fiber-matrix as well as poor
load transfer capability between the fiber-matrix. Interestingly, this drawback was overcome by
adding 0.3 wt% DCP as a reactive agent in the composites. In the presence of DCP, the polymers
formed graft copolymers and partially crosslink network between the polymers, which improved
the compatibility between the blend components. The authors also investigated the effect of 0.3
wt% DCP while increasing fiber content up to 20 wt% in the resulting composites. The impact
energy of the composite with 20 wt% fiber and 0.3 wt% DCP still remained at 240.5 J/m. The
flexural properties and storage modulus were found to increase with increasing fiber content up
to 20 wt%, which is a fairly common observation in natural fiber reinforced polymer composites.
2.10.2 Biocomposites based on PLA blends
PBAT, PBS, and PCL are the best candidates for increased toughness of PLA in their
respective blends. Blending PLA with tough polymers (PBAT, PBS, and PCL) resulted in a
higher toughness but lower stiffness in the blends in comparison to virgin PLA. The low stiffness
can be addressed by adding fibers/filler to PLA blends. Therefore, many researchers have
extensively studied toughened PLA based biocomposites, as shown in Table 2.6. Commercially

55
available pre-blends of PLA/PBAT, 45/55 wt%, (BASF-Ecovio®) with chemically (alkali
treatment) treated curaua fiber reinforced biocomposites were studied by Harnnecker et al.,
[174]. There was a slight (4oC) increase in Tg of the composites compare to the PLA/PBAT
blend. This fact was attributed to the intermolecular (hydrogen bonds) interaction between the
fibers and polymer matrix. Moreover, DSC thermograms showed an endothermic peak during
heating cycle for all the composites whereas PLA/PBAT blend did not show any endothermic
peak during heating cycle. This was believed to be due to the nucleation effect of curaua fiber in
the composites. Performance of these composite was studied with and without the addition of
compatibilizer (2 wt%) i.e., maleic anhydride-grafted-polypropylene (MA-g-PP). Tensile, impact
and flexural strength of the compatibilized composites increased with increased fiber content
from 5 to 20 wt%. For example, the compatibilized composites with 20 wt% curaua fibers
showed 56% increase in flexural strength and 75% increase in the tensile strength.

56
Table 2.6. Recently developed biodegradable polymer blend matrix based biocomposites
Blend matrix Fiber/filler Compatibilizer/Coupling agent Manufacturing
process
References
Type Content Name Chemical structure
PHBV/PBAT Recycled wood fiber 10% Gamma-
methacryloxypropylt
rimethoxysilane
CH2=C(CH3)
CO2CH2CH2CH2Si
(OCH3)3
Injection
molding
[173]
PHBV/PBAT Switchgrass 20-40% Poly
diphenylmethane
diisocyanate (PMDI)
Injection
molding
[168]
PHBV/PBAT Distiller’s dried grains
with solubles (DDGS)
20% Poly
diphenylmethane
diisocyanate (PMDI)
Injection
molding
[176]
PHBV/PBAT Miscanthus, switchgrass,
wheat straw, corn stalk,
and soy stalk
30% NA NA Injection
molding
[158]
PHBV/PBAT Jute, abaca and man-
made cellulose
30% NA NA Injection
molding
[182]
PHBV/PBAT Cellulose, Jute, abaca
and flax
30% NA NA Injection
molding
[183]
PHBV/PBAT Kenaf 5 and
10%
NA NA Compression
molding
[184]
PHBV/PBS Distiller’s dried grains
with solubles (DDGS)
30% Poly
diphenylmethane
diisocyanate (PMDI)
Injection
molding
[185]
PHBV/PLA Soy hull, switchgrass,
and miscanthus
30% NA NA Injection
molding
[166]
PHBV/PLA Soy fiber 30 and
50%
2,5-Bis(tert-
butylperoxy)-2,5-
dimethylhexane
Injection
molding
[187]

57
PLA/PBAT Kenaf 10-50% (3-aminopropyl)
trimethoxysilane
(APTMS)
Compression
molding
[188]
PLA/PBAT Curaua 5-20% Maleic anhydride
grafted
polypropylene (MA-
g-PP)
Compression
molding
[174]
PLA/PBAT Softwood flour 30-50% NA NA Injection
molding
[189]
PLA/PBAT Wood flour 20-30% NA NA Compression
molding
[190]
PLA/PBAT Ramie 10% NA NA Compression
molding
[191]
PLA/PCL Alkali treated palm fiber 10-25% Dicumyl peroxide
(DCP)
Injection
molding
[192]
PLA/PCL Silane treated Jute and
Untreated Jute
50% Trimethoxy (methyl)
silane
CH3Si (OCH3)3 Compression
molding
[193]
PLLA/PBS Flax 25.5% NA NA Injection
molding
[194]

58
The increased mechanical properties were attributed to the improvement of interfacial
adhesion between the fibers and matrix, which was confirmed by cross-sectional fracture
analysis. In addition, water absorption of the compatibilized composite was almost 100% lower
compared to the uncompatibilized composite. Sis et al., [188] examined the impact, flexural, and
tensile properties of the PLA/PBAT/kenaf fiber composites with and without coupling agent ((3-
aminopropyl) trimethoxysilane), APTMS, by melt blending. The tensile, flexural and impact
strength of PLA/PBAT/kenaf composites decreased with increasing fiber loading. This was
because of inadequate fiber-matrix interaction and poor dispersion of fiber in the matrix. The
composites were modified with different amount (from 1 to 5 wt%) of APTMS coupling agent.
The optimum properties were obtained for PLA/PBAT/kenaf composites with the addition of 2
wt% coupling agent. This composite showed 22, 42 and 63% improvement in Izod impact
strength, tensile strength, and flexural strength, respectively. In addition, the tensile and flexural
moduli of the composites with coupling agent were considerably higher than composites without
coupling agent. The storage modulus of the composites with and without coupling agent exhibits
similar trends, like the tensile and flexural modulus. This behavior was ascribed to good
adhesion between the phases.
Unlike PLA/PBAT/kenaf and curaua fiber composites, PLA/PBAT/wood flour
composites exhibited an increase in both tensile and flexural properties compare to the neat
PLA/PBAT (45/55 wt%) blend (Ecovio®
) [189]. With increasing fiber load from 30 to 50 wt%, a
48.2% reduction was observed in the Charpy impact strength of the resulting composites
compared to PLA/PBAT blend matrix. The loss in impact strength was attributed to low fiber
aspect ratio of wood flour [189]. The water resistance property of the composites was reduced
because of hygroscopic nature of the wood flour. However, the composites with an addition of

59
50 wt% wood flour showed significant improvements in tensile strength (27.2%), modulus
(174.3%), and flexural strength (20.6%) as compared to neat PLA/PBAT blend. These
improvements were related to good fiber-matrix adhesion and better distribution of fibers in the
matrix. This trend is in contradiction to the finding of Georgiopoulos et al., [190]. Another study
observed similar results for PLA/PBAT(70/30 wt%) biocomposites [195]. More recently, a
comparison study between PLA/30% ramie composites and PLA/PBAT(95/5, 90/10 and
85/15%) with 30 wt% ramie composites has been investigated by Yu and Li [191]. In general,
strong interfacial bonding between fiber and the matrix decreases the water absorption of the
natural fiber composites. The Vicat softening temperature, flexural and tensile strength of the
PLA/PBAT/ramie (85/15%) composites were lower than PLA based composites, which was due
to the soft elastomeric nature of the PBAT phase. Yet, the notched Izod impact strength of the
PLA/PBAT/ramie composites was superior compared to PLA/ramie composites. This suggests
that the PBAT phase induced stress concentration under impact load. Consequently, the PBAT
phase absorbed more energy during failure of the PLA/PBAT composites. In order to maintain
energy dissipation source in the PLA/PBAT composite system, concentration of PBAT was
considered an important factor. Furthermore, thermal stability of the PLA/PBAT based
composites was studied by thermogravimetric analysis. It was found that the thermal stability of
PLA/PBAT based ramie composites was higher than PLA based composites because the PBAT
phase enhanced the charring process for the composites [191].
Ibrahim et al., [192] studied the performance of uncompatibilized and compatibilized
PLA/PCL (10/90 wt%)/alkali treated palm fiber composites with 10 to 25 wt% fiber loading.
With the addition of 0.01 phr DCP, the flexural modulus, impact strength, tensile strength, and
flexural strength of the composites were superior when compared to uncompatibilized

60
composites. These improvements were attributed to strong fiber and matrix adhesion and good
fiber distribution in the matrix. Fiber and matrix adhesion was confirmed by damping behavior
as well as by SEM analysis. DCP increased the viscosity and crosslinking while reducing the
brittleness of the composites. Consequently, the tensile modulus of compatibilized composites
was lower than uncompatibilized composites in the entire fiber composition. A similar trend was
noticed in storage modulus of the compatibilized composites. The storage modulus of the
composites increased up to 15 wt% fiber loading and then decreased with increasing fiber up to
25 wt%. The increased storage modulus was due to the reinforcing effect of the fibers. The
decreased storage modulus with increasing fiber loading was a result of free volumes that were
created due to crosslinking. Furthermore, the thermal stability of the composites was higher than
that of the matrix. Overall, the composites with 15 wt% fiber load showed balanced mechanical,
thermal and thermo-mechanical properties. Recently, PLLA/PBS blends with 25.5% flax fiber
composites showed well balanced mechanical properties without any compatibilizer [194].
The consequence of incorporating 30 wt% miscanthus, switchgrass, and soy hull their
hybrids as a reinforcement in the PHBV/PLA (70/30 wt%) blend matrix has been investigated by
Nanda et al., [166]. The performance of the green composites was examined by means of their
thermo-mechanical properties. Due to lack of interfacial adhesion between the components, the
tensile strength of all the composites was reduced significantly when compared to PHBV/PLA
matrix. Yet, the tensile and flexural moduli of all the composites were higher compared to
PHBV/PLA blend. There was no significant difference observed in the notched Izod impact
strength of all the composites compared to the PHBV/PLA matrix. Lower aspect ratio, and
smaller cellulose and lignin content of soy hull in comparison to miscanthus and switchgrass
resulted in soy hull composites displaying inferior mechanical properties. All of the composites

61
showed superior heat resistance properties compared to their matrix. Soy hull based composites
showed lower thermal stability compared to miscanthus and switchgrass based composites. This
could probably be due to the less thermally stable compounds, such as pectin and proteins,
present in the soy hull [187]. The melting temperature and melting enthalpy of the PLA and
PHBV were not affected in the presence of all the fibers. Soy hull based composites showed
more water absorption compared to other composites. This was due to the smaller amount of
lignin present in the soy hull [187]. This trend was changed in compatibilized PHBV/PLA/soy
fiber composites.
2.11. Natural fiber composites market and their applications
Natural fiber reinforced polymeric composites were produced early in 1908 [46]. Since
then, natural fiber composites (NFCs) have become attractive in both automotive and building
industries because of its low cost, low CO2 emissions and because it is lightweight. The specific
mechanical properties of NFCs are superior to synthetic fiber (glass, carbon and kevlar)
composites [160]. Currently, PP and polyurethane based biocomposites are being used in
automotive interior and exterior parts [10, 36]. In 2010, 430.7 million pounds of natural fiber
composites were produced and its worth was 289.3 million US$. This is expected to reach 531.3
million US$ by 2016, which means an 11% growth rate over the next 5 years [196]. Automotive
companies have set a goal and are working towards the possible replacement of some non-
biodegradable polymer products by using biocomposites and bioplastics. An average vehicle
contains 113 kg of plastic parts and approximately 50% of automotive interior parts are made up
of plastics [197]. Annually 10-11 million vehicles are discarded, and 25% of their parts cannot
be recycled or reused because they are made from foams, rubber, and synthetic fibers [197].

62
Biocomposites from PLA/kenaf and PBS/bamboo are used for making automotive spare
tire cover and tailgate trim, respectively [36, 198]. There exists the possibility of producing
durable car parts entirely from biodegradable materials. More specifically, a vehicle (Agri-Car)
with 90% biodegradable materials has been jointly designed by the University of Akron and
Ohio State University [46]. In 2009, the University of Warwick developed a prototype World
First Formula 3 racing car by using green composites [46]. In addition, the mechanical and heat
resistance properties of PLA/kenaf biocomposites were almost equal to those of conventional
polycarbonate/glass fiber composites. PLA based biocomposites are used to produce prototype
kayaks, wind turbine rotors, laptop computers and cellular phones [46, 198-200]. According to
this resource [159], the NFC market is expected to grow by up to 20% and more than 50% in
automotive and building applications, respectively. The global NFC market is expected to grow
to 531.3 million US$ by 2016 [196]. This forecast is significantly higher than the 2010 world
annual production (US$ 289.3 million) of the NFCs market. The European biocomposites market
growth rate is predicted at 21% per year. In 2008, biocomposite production totalled 129,000 tons
in Europe and this growth is expected to increase to 427,000 tons in 2014. Parallel to this, hemp
and flax fibers are major players in the natural fiber composites market share in the Europe
[163]. In 2000, the North American natural fiber market was worth 155 million US$ and it is
expected to reach US$ 1.38 billion by 2025 [157].
2.12 Conclusions
Recently, the utilization of biodegradable polymers has been accelerated due to the
environmental concerns associated with disposal of non-biodegradable plastics in landfills.
Higher cost, thermal instability, low melt strength and brittleness of biodegradable polymers
currently limit their extended application. Great efforts have been taken to overcome these

63
drawbacks by blending technique as well as incorporation of natural fibers. However, most of the
polymer blends are thermodynamically immiscible due to a difference in solubility. Generally,
the immiscible polymer blends lead to a weak interface between the blend partners. The poor
interfacial adhesion between the blend components can be modified using various additive,
compatibilizer and compatibilization strategies. The compatibilization effect and its influence on
the thermal, thermo-mechanical, morphological and mechanical properties of the blends have
been reviewed in this chapter. With the increasing cost of fossil fuels, more research attention is
being focused on developing renewable resource-based materials for various industrial
applications. Natural fiber reinforced biodegradable polymers provide a sustainable alternative to
non-biodegradable polymeric composites. It was found that biocomposites could be fabricated
from a stiffness-toughness balanced blend matrix with various natural fibers. The difference in
strength and modulus values between the natural fibers is attributed to the difference in
individual fiber compositions. Recently, multiple binary blend matrix based biocomposites have
been studied and they all exhibit superior performance compared to single polymer based
biocomposites. Due to uncompatibility between the matrix and fiber, several approaches have
been explored to modify both matrix and fiber to enhance the compatibility between them. The
mechanical properties of all the compatibilized composites are significantly higher in
comparison to uncompatibilized one. However, there are only a limited number of applications
for biodegradable polymers and their biocomposites. It is believed that significant research into
existing processing technology will help to widen the application potential of biodegradable
polymer-based blends and their biocomposites.

64
References
[1] B. Imre, B. Pukánszky, Compatibilization in bio-based and biodegradable polymer blends,
European Polymer Journal, 2013, 49 (6): 1215-1233.
[2] http://www.plasticseurope.org, (Last accessed in January, 2015).
[3] http://en.european-bioplastics.org/market, (Last accessed in January, 2015)
[4] http://www.hkc22.com/bioplastics.html, (Last accessed in January, 2015).
[5] T. R. Plant, The technology roadmap for plant/crop-based renewable resources 2020, (Last
accessed in January, 2015).
[6] B. E. DiGregorio, Biobased Performance Bioplastic: Mirel, Chemistry & Biology, 2009, 16
(1): 1-2.
[7] ASTM D6400-12, Standard Specification for Labeling of Plastics Designed to be Aerobically
Composted in Municipal or Industrial Facilities, ASTM International, West Conshohocken, PA,
2012, www.astm.org.
[8] S. Muniyasamy, A. Anstey, M. M. Reddy, M. Misra, A. Mohanty, Biodegradability and
Compostability of Lignocellulosic Based Composite Materials, Journal of Renewable Materials,
2013, 1 (4): 253-272.
[9] A. Soroudi, I. Jakubowicz, Recycling of bioplastics, their blends and biocomposites: A
review, European Polymer Journal, 2013, 49 (10): 2839-2858.
[10] M. J. John, S. Thomas, Biofibres and biocomposites, Carbohydrate Polymers, 2008, 71 (3):
343-364.
[11] U. Witt, T. Einig, M. Yamamoto, I. Kleeberg, W. D. Deckwer, R. J. Müller, Biodegradation
of aliphatic–aromatic copolyesters: evaluation of the final biodegradability and ecotoxicological
impact of degradation intermediates, Chemosphere, 2001, 44 (2): 289-299.

65
[12] U. Witt, M. Yamamoto, U. Seeliger, R.-J. Müller, V. Warzelhan, Biodegradable Polymeric
Materials-Not the Origin but the Chemical Structure Determines Biodegradability, Angewandte
Chemie International Edition, 1999, 38 (10): 1438-1442.
[13] L. Yu, K. Dean, L. Li, Polymer blends and composites from renewable resources, Progress
in Polymer Science, 2006, 31 (6): 576-602.
[14] W. Groot, J. V. Krieken, O. Sliekersl, A. D. Vos, Chapter 1: production and purifica¬tion
of lactic acid and lactide. In: Auras, R.A., Lim, L.-T., Selke, S.E., Tsuji, H. (Eds.), Poly(Lactic
Acid): Synthesis, Structures, Properties, Processing, and Applications. John Wiley & Sons inc.,
Hoboken, New Jersey, 2011, pp. 3.
[15] R. Auras, B. Harte, S. Selke, An Overview of Polylactides as Packaging Materials,
Macromolecular Bioscience, 2004, 4 (9): 835-864.
[16] L. T. Lim, R. Auras, M. Rubino, Processing technologies for poly(lactic acid), Progress in
Polymer Science, 2008, 33 (8): 820-852.
[17] D. E. Henton, P. Gruber. J. Lunt, J. Randall, Chapter 16: polylactic acid technology. In:
Mohanty, A.K., Misra, M., Drzal, L.T. (Eds.), Natural Fibers, Biopolymers, and Biocomposites.
CRC Press LLC, Boca Raton, FL, 2005, pp. 527–577.
[18] D. Garlotta, A Literature Review of Poly(Lactic Acid), Journal of Polymers and the
Environment, 2001, 9 (2): 63-84.
[19] K. Madhavan Nampoothiri, N. R. Nair, R. P. John, An overview of the recent developments
in polylactide (PLA) research, Bioresource Technology, 2010, 101 (22): 8493-8501.
[20] M. S. Huda, L. T. Drzal, M. Misra, A. K. Mohanty, Wood-fiber-reinforced poly(lactic acid)
composites: Evaluation of the physicomechanical and morphological properties, Journal of
Applied Polymer Science, 2006, 102 (5): 4856-4869.

66
[21] J. Vandewijngaarden, M. Murariu, P. Dubois, R. Carleer, J. Yperman, P. Adriaensens, S.
Schreurs, N. Lepot, R. Peeters, M. Buntinx, Gas Permeability Properties of Poly(3-
hydroxybutyrate-co-3-hydroxyhexanoate), Journal of Polymers and the Environment, 2014, 22
(4): 501-507.
[22] http://www.reportsandintelligence.com/polylactic-acid-market, (Last accessed in January,
2015).
[23] M. Zhang, N. L. Thomas, Blending polylactic acid with polyhydroxybutyrate: The effect on
thermal, mechanical, and biodegradation properties, Advances in Polymer Technology, 2011, 30
(2): 67-79.
[24] J. Lunt, Large-scale production, properties and commercial applications of polylactic acid
polymers, Polymer Degradation and Stability, 1998, 59 (1–3): 145-152.
[25] J. Ren, (ed.) Biodegradable Poly(Lactic Acid), Synthesis, Modification, Processing and
Applications, Tsinghua University Press, Beijing (Springer, Heidelberg), 2010, pp. 38–141.
[26] G. Kfoury, J.-M. Raquez, F. Hassouna, J. Odent, V. Toniazzo, D. Ruch, P. Dubois, Recent
advances in high performance poly(lactide): From “green” plasticization to super-tough materials
via (reactive) compounding, Frontiers in Chemistry, 2013, 1,1.
[27] Z. N. Terzopoulou, G. Z. Papageorgiou, E. Papadopoulou, E. Athanassiadou, E.
Alexopoulou, D. N. Bikiaris, Green composites prepared from aliphatic polyesters and bast
fibers, Industrial Crops and Products, 2014, (0): (doi:10.1016/j.indcrop.2014.1008.1034).
[28] R. A. J. Verlinden, D. J. Hill, M. A. Kenward, C. D. Williams, I. Radecka, Bacterial
synthesis of biodegradable polyhydroxyalkanoates, Journal of Applied Microbiology, 2007, 102
(6): 1437-1449.
67
[29] D. d. S. Rosa, D. M. Lenz, Chapter 16: biocomposites: Influence of matrix nature and
additives on the properties and biodegradation behaviour, In: Chamy. R., Rosenkranz. F., (Eds.),
Biodegradation-Engineering and Technology, InTech, Croatia, 2013, pp. 432-475.
[30] M. Avella, E. Martuscelli, M. Raimo, Review Properties of blends and composites based on
poly(3-hydroxy)butyrate (PHB) and poly(3-hydroxybutyrate-hydroxyvalerate) (PHBV)
copolymers, Journal of Materials Science, 2000, 35 (3): 523-545.
[31] Y. Parulekar, A. K. Mohanty, Biodegradable toughened polymers from renewable
resources: blends of polyhydroxybutyrate with epoxidized natural rubber and maleated
polybutadiene, Green Chemistry, 2006, 8 (2): 206-213.
[32] Q.-S. Liu, M.-F. Zhu, W.-H. Wu, Z.-Y. Qin, Reducing the formation of six-membered ring
ester during thermal degradation of biodegradable PHBV to enhance its thermal stability,
Polymer Degradation and Stability, 2009, 94 (1): 18-24.
[33] I. Vroman, L. Tighzert, Biodegradable Polymers, Materials, 2009, 2 (2): 307-344.
[34] Q. Wu, Y. Wang, G.-Q. Chen, 2009. Medical application of microbial biopolyesters
polyhydroxyalkanoates. Artificial Cells, Blood Substitutes, and Biotechnology. 37 (1), 1–12.
[35] N. Grassie, E. J. Murray, P. A. Holmes, The thermal degradation of poly(-(d)-β-
hydroxybutyric acid): Part 3—The reaction mechanism, Polymer Degradation and Stability,
1984, 6 (3): 127-134.
[36] G. Koronis, A. Silva, M. Fontul, Green composites: A review of adequate materials for
automotive applications, Composites Part B: Engineering, 2013, 44 (1): 120-127.
[37] M. G. A. Vieira, M. A. da Silva, L. O. dos Santos, M. M. Beppu, Natural-based plasticizers
and biopolymer films: A review, European Polymer Journal, 2011, 47 (3): 254-263.

68
[38] K. Van de Velde, P. Kiekens, Biopolymers: overview of several properties and
consequences on their applications, Polymer Testing, 2002, 21 (4): 433-442.
[39] A. K. Mohanty, M. Misra. T. L. Drzal, S. E. Selke, B. R. Harte, G. Hinrichsen, Chapter:1
Natural fibers, and biocomposites: an introduction, (Eds) A. K. Mohanty, M. Misra, T. L. Drzal,
Natural fibers, biopolymers, and biocomposites, CRC Press-Taylor & Francis Group, Boca
Raton (2005), pp. 1–36.
[40] T. Fujimaki, Processability and properties of aliphatic polyesters, ‘BIONOLLE’,
synthesized by polycondensation reaction, Polymer Degradation and Stability, 1998, 59 (1–3):
209-214.
[41] G. Bogoeva-Gaceva, M. Avella, M. Malinconico, A. Buzarovska, A. Grozdanov, G.
Gentile, M. E. Errico, Natural fiber eco-composites, Polymer Composites, 2007, 28 (1): 98-107.
[42] J.-L. Audic, B. Chaufer, Properties of biodegradable poly(butylene adipate-co-terephtalate)
and sodium caseinate blends, Journal of Applied Polymer Science, 2012, 125 (S2): E459-E467.
[43] J. Xu, B.-H. Guo. Microbial Succinic Acid, Its Polymer Poly(butylene succinate), and
Applications: G.-Q. Chen, (Editor), Plastics from Bacteria: Springer Berlin Heidelberg; 2010. p.
347-388.
[44] S. Kabasci, I. Bretz, Succinic acid: synthesis of biobased polymers from renewable
resources, in Renewable Polymers (Ed. V. Mittal), Scrivener Publishing LLC, ISBN: 978-0-470-
93877-S, 2012, pp. 355–379.
[45] R. Babu, K. O'Connor, R. Seeram, Current progress on bio-based polymers and their future
trends, Progress in Biomaterials, 2013, 2 (1): 8.
[46] E. Zini, M. Scandola, Green composites: An overview, Polymer Composites, 2011, 32 (12):
1905-1915.

69
[47] http://www.themoldingblog.com/2012/11/13/faurecia-bets-on-bio-pbs-for-auto-interiors/,
(Last accessed in January, 2015).
[48] P. Ma, Z. Ma, W. Dong, Y. Zhang, P. J. Lemstra, Structure/Property Relationships of
Partially Crosslinked Poly(butylene succinate), Macromolecular Materials and Engineering,
2013, 298 (8): 910-918.
[49] N. Jacquel, F. Freyermouth, F. Fenouillot, A. Rousseau, J. P. Pascault, P. Fuertes, R. Saint-
Loup, Synthesis and properties of poly(butylene succinate): Efficiency of different
transesterification catalysts, Journal of Polymer Science Part A: Polymer Chemistry, 2011, 49
(24): 5301-5312.
[50] E. S. Yoo, S. S. Im, Melting behavior of poly(butylene succinate) during heating scan by
DSC, Journal of Polymer Science Part B: Polymer Physics, 1999, 37 (13): 1357-1366.
[51] R. Wang, S. Wang, Y. Zhang, C. Wan, P. Ma, Toughening modification of PLLA/PBS
blends via in situ compatibilization, Polymer Engineering and Science, 2009, 49 (1): 26-33.
[52] Y. J. Kim, O. O. Park, Miscibility and Biodegradability of Poly(Butylene
Succinate)/Poly(Butylene Terephthalate) Blends, Journal of Polymers and the Environment,
1999, 7 (1): 53-66.
[53] S. Sinha Ray, K. Okamoto, M. Okamoto, Structure−Property Relationship in Biodegradable
Poly(butylene succinate)/Layered Silicate Nanocomposites, Macromolecules, 2003, 36 (7):
2355-2367.
[54] R. Muthuraj, M. Misra, A. Mohanty, Biodegradable Poly(butylene succinate) and
Poly(butylene adipate-co-terephthalate) Blends: Reactive Extrusion and Performance Evaluation,
Journal of Polymers and the Environment, 2014, 22 (3): 336-349.

70
[55] B. Calabia, F. Ninomiya, H. Yagi, A. Oishi, K. Taguchi, M. Kunioka, M. Funabashi,
Biodegradable Poly(butylene succinate) Composites Reinforced by Cotton Fiber with Silane
Coupling Agent, Polymers, 2013, 5 (1): 128-141.
[56] S. Risse, L. Tighzert, F. Berzin, B. Vergnes, Microstructure, rheological behavior, and
properties of poly(lactic acid)/poly(butylene succinate)/organoclay nanocomposites. Journal of
Applied Polymer Science, 2014, 131 (12), 40364-40372.
[57] P. Ma, D. G. Hristova-Bogaerds, P. J. Lemstra, Y. Zhang, S. Wang, Toughening of
PHBV/PBS and PHB/PBS Blends via In situ Compatibilization Using Dicumyl Peroxide as a
Free-Radical Grafting Initiator, Macromolecular Materials and Engineering, 2012, 297 (5): 402-
410.
[58] V. Tserki, P. Matzinos, E. Pavlidou, D. Vachliotis, C. Panayiotou, Biodegradable aliphatic
polyesters. Part I. Properties and biodegradation of poly(butylene succinate-co-butylene adipate),
Polymer Degradation and Stability, 2006, 91 (2): 367-376.
[59] E. Marten, R.-J. Müller, W.-D. Deckwer, Studies on the enzymatic hydrolysis of polyesters.
II. Aliphatic–aromatic copolyesters, Polymer Degradation and Stability, 2005, 88 (3): 371-381.
[60] S.-Y. Gu, K. Zhang, R. Jie, Z. Hui, Melt rheology of polylactide/poly(butylene adipate-co-
terephthalate) blends, Carbohydrate Polymers, 2008, 74 (1): 79-85.
[61] U. Witt, R.-J. Müller, W.-D. Deckwer, Studies on sequence distribution of
aliphatic/aromatic copolyesters by high-resolution 13C nuclear magnetic resonance spectroscopy
for evaluation of biodegradability, Macromolecular Chemistry and Physics, 1996, 197 (4): 1525-
1535.
[62] K. O. Siegenthaler, A. Künkel, G. Skupin, M. Yamamoto. Ecoflex® and Ecovio®:
Biodegradable, Performance-Enabling Plastics. In: Rieger, Künkel, Coates, Reichardt, Dinjus,

71
Zevaco, editors. Synthetic Biodegradable Polymers: Springer Berlin Heidelberg; 2012. p. 91-
136.
[63] M. Breulmann, A. Künkel, S. Philipp, V. Reimer, K. O. Siegenthaler, G. Skupin, M.
Yamamoto. “Polymers, biodegradable”, In: Ullmann's Encyclopedia of Industrial Chemistry.
Wiley-VCH, Berlin. 2000.
[64] http://worldaccount.basf.com/wa/plasticsAP~en_GB/portal/show/content/products/biodegra
dable_plastics/ecoflex_product_literature, (Last accessed in January 2015).
[65] A. Javadi, A. J. Kramschuster, S. Pilla, J. Lee, S. Gong, L.-S. Turng, Processing and
characterization of microcellular PHBV/PBAT blends, Polymer Engineering and Science, 2010,
50 (7): 1440-1448.
[66] http://worldaccount.basf.com/wa/plasticsAP~en_GB/portal/show/content/products/biodegra
dable_plastics/ecoflex_product_literature, (Last accessed in January 2015).
[67] http://www.plastixportal.co.za/basf_pdf/Ecoflex_Brochure.pdf, (Last accessed in January
2015).
[68] K. M. Stridsberg, M. Ryner, A. C. Albertsson, Controlled Ring Opening Polymerization:
Polymers with controlled Architecture. In Albertsson, A. C., (Ed.), Advances in Polymers
Science; SpringerVerlag, Berlin, 2002, 157, p 41-65.
[69] H. Uyama, S. Kobayashi, Enzyme-catalyzed polymerization to functional polymers, Journal
of Molecular Catalysis B: Enzymatic, 2002, 19–20 (0): 117-127.
[70] C. Bastioli, Properties and applications of Mater-Bi starch-based materials, Polymer
Degradation and Stability, 1998, 59 (1–3): 263-272.

72
[71] P. Sarazin, X. Roy, B. D. Favis, Controlled preparation and properties of porous poly(l-
lactide) obtained from a co-continuous blend of two biodegradable polymers, Biomaterials,
2004, 25 (28): 5965-5978.
[72] C. Hinüber, L. Häussler, R. Vogel, H. Brünig, G. Heinrich, C. Werner, Hollow fibers made
from a poly(3-hydroxybutyrate)/poly (caprolactone) blend, Express polymer Letters, 2011, 5 (7):
643-652.
[73] S. A. Casarin, S. M. Malmonge, M. Kobayashi, J. A. M. Agnelli, Study on In-Vitro
Degradation of Bioabsorbable Polymers Poly (hydroxybutyrate-co-valerate)-(PHBV) and Poly
(caprolactone)-(PCL), Journal of Biomaterials and Nanobiotechnology, 2011, 2 (3): 207-215.
[74] C. Del Gaudio, L. Fioravanzo, M. Folin, F. Marchi, E. Ercolani, A. Bianco, Electrospun
tubular scaffolds: On the effectiveness of blending poly (ε‐caprolactone) with poly
(3‐hydroxybutyrate‐co‐3‐hydroxyvalerate), Journal of Biomedical Materials Research Part B:
Applied Biomaterials, 2012, 100 (7): 1883-1898.
[75] E. Can, S. Bucak, E. Kınacı, A. Çalıkoğlu, T. Köse, Polybutylene Succinate (PBS)-
Polycaprolactone (PCL) Blends Compatibilized with Poly (ethylene oxide)-block-poly
(propylene oxide)-block-poly (ethylene oxide)(PEO-PPO-PEO) Copolymer for Biomaterial
Applications, Polymer-Plastics Technology and Engineering, 2014, 53 (11): 1178-1193.
[76] http://www.plasticsrecyclers.eu/mechanical-recycling, (Last accessed in January, 2015).
[77] M. Żenkiewicz, J. Richert, P. Rytlewski, K. Moraczewski, M. Stepczyńska, T. Karasiewicz,
Characterisation of multi-extruded poly(lactic acid), Polymer Testing, 2009, 28 (4): 412-418.
[78] I. Pillin, N. Montrelay, A. Bourmaud, Y. Grohens, Effect of thermo-mechanical cycles on
the physico-chemical properties of poly(lactic acid), Polymer Degradation and Stability, 2008,
93 (2): 321-328.

73
[79] J. P. Lopez, J. Girones, J. A. Mendez, J. Puig, M. A. Pelach, Recycling Ability of
Biodegradable Matrices and Their Cellulose-Reinforced Composites in a Plastic Recycling
Stream, Journal of Polymers and the Environment, 2012, 20 (1): 96-103.
[80] I. Zembouai, S. Bruzaud, M. Kaci, A. Benhamida, Y.-M. Corre, Y. Grohens, Mechanical
Recycling of Poly(3-Hydroxybutyrate-co-3-Hydroxyvalerate)/Polylactide Based Blends, Journal
of Polymers and the Environment, 2014, 22 (4): 449-459.
[81] K. Moraczewski, Characterization of multi-injected poly(ε-caprolactone), Polymer Testing,
2014, 33 (0): 116-120.
[82] M. Zaverl, M. Ö. Seydibeyoğlu, M. Misra, A. Mohanty, Studies on recyclability of
polyhydroxybutyrate-co-valerate bioplastic: Multiple melt processing and performance
evaluations, Journal of Applied Polymer Science, 2012, 125 (S2): E324-E331.
[83] C. Kanemura, S. Nakashima, A. Hotta, Mechanical properties and chemical structures of
biodegradable poly(butylene-succinate) for material reprocessing, Polymer Degradation and
Stability, 2012, 97 (6): 972-980.
[84] H.-S. Kim, H.-J. Kim, Enhanced hydrolysis resistance of biodegradable polymers and bio-
composites, Polymer Degradation and Stability, 2008, 93 (8): 1544-1553.
[85] S. Kim, S.-w. Park, K. Lee, Fishing performance of environmentally friendly tubular pots
made of biodegradable resin (PBS/PBAT) for catching the conger eel Conger myriaster,
Fisheries Science, 2014, 80 (5): 887-895.
[86] A. M. Harris, E. C. Lee, Heat and humidity performance of injection molded PLA for
durable applications, Journal of Applied Polymer Science, 2010, 115 (3): 1380-1389.
[87] A. M. Harris, E. C. Lee, Durability of polylactide-based polymer blends for injection-
molded applications, Journal of Applied Polymer Science, 2013, 128 (3): 2136-2144.

74
[88] S. Kim, S. Park, K. Lee, Fishing Performance of an Octopus minor Net Pot Made of
Biodegradable Twines, Turkish Journal of Fisheries and Aquatic Sciences, 2014, 14: 21-30.
[89] M. Deroiné, A. Le Duigou, Y.-M. Corre, P.-Y. Le Gac, P. Davies, G. César, S. Bruzaud,
Accelerated ageing and lifetime prediction of poly(3-hydroxybutyrate-co-3-hydroxyvalerate) in
distilled water, Polymer Testing, 2014, 39 (0): 70-78.
[90] M. Deroiné, A. Le Duigou, Y.-M. Corre, P.-Y. Le Gac, P. Davies, G. César, S. Bruzaud,
Seawater accelerated ageing of poly(3-hydroxybutyrate-co-3-hydroxyvalerate), Polymer
Degradation and Stability, 2014, 105 (0): 237-247.
[91] R. Muthuraj, M. Misra, A. K. Mohanty, Hydrolytic degradation of biodegradable polyesters
under simulated environmental conditions. Journal of Applied Polymer Science. 2015, 132 (27),
42189-42191.
[92] http://www.modernplastics.com/oct08/pdf/ecogehrpla.pdf, (Last accessed in January 2015).
[93] http://www.showa-denko.com/wp-content/uploads/2014/Starcla_2014.pdf (Last accessed in
January 2015).
[94] http://www.showa-denko.com/products/biodegradable-polymer-resin/ (Last accessed in
Janueary 2015)
[95] http://www.teknorapex.com/division/bioplastics/product_lines (Last accessed in January
2015)
[96] C. Koning, M. Van Duin, C. Pagnoulle, R. Jerome, Strategies for compatibilization of
polymer blends, Progress in Polymer Science, 1998, 23 (4): 707-757.
[97] M. Shibata, Y. Inoue, M. Miyoshi, Mechanical properties, morphology, and crystallization
behavior of blends of poly(l-lactide) with poly(butylene succinate-co-l-lactate) and poly(butylene
succinate), Polymer, 2006, 47 (10): 3557-3564.

75
[98] T. Yokohara, M. Yamaguchi, Structure and properties for biomass-based polyester blends of
PLA and PBS, European Polymer Journal, 2008, 44 (3): 677-685.
[99] E. A. gelos Manias, L. A. Utracki, Chapter: 2 Thermodynamics of polymer blends. in
Polymer blends handbook, (Eds): Utracki LA, Wilkie CA, Springer, Dordrecht, 2014, 1 (2nd ed),
171-289.
[100] E. Fekete, E. Földes, B. Pukánszky, Effect of molecular interactions on the miscibility and
structure of polymer blends, European Polymer Journal, 2005, 41 (4): 727-736.
[101] Robeson LM. Polymer Blends: A Comprehensive Review. Munich: Carl Hanser Verlag,
2007, 1-7.
[102] P. Szabó, E. Epacher, E. Földes, B. Pukánszky, Miscibility, structure and properties of
PP/PIB blends, Materials Science and Engineering: A, 2004, 383 (2): 307-315.
[103] P. A. Small, Some factors affecting the solubility of polymers, Journal of Applied
Chemistry, 1953, 3 (2): 71-80.
[104] I. Pillin, N. Montrelay, Y. Grohens, Thermo-mechanical characterization of plasticized
PLA: Is the miscibility the only significant factor?, Polymer, 2006, 47 (13): 4676-4682.
[105] L. L. Zhang, S. H. Goh, S. Y. Lee, G. R. Hee, Miscibility, melting and crystallization
behavior of two bacterial polyester/poly(epichlorohydrin-co-ethylene oxide) blend systems,
Polymer, 2000, 41 (4): 1429-1439.
[106] J. W. Park, S. S. Im, Phase behavior and morphology in blends of poly(L-lactic acid) and
poly(butylene succinate), Journal of Applied Polymer Science, 2002, 86 (3): 647-655.
[107] Z. Qiu, T. Ikehara, T. Nishi, Poly(hydroxybutyrate)/poly(butylene succinate) blends:
miscibility and nonisothermal crystallization, Polymer, 2003, 44 (8): 2503-2508.

76
[108] A. Bhatia, R. K. Gupta, S. N. Bhattacharya, H. Choi, Compatibility of biodegradable poly
(lactic acid)(PLA) and poly (butylene succinate)(PBS) blends for packaging application, Korea-
Australia Rheology Journal, 2007, 19 (3): 125-131.
[109] M. Sheth, R. A. Kumar, V. Davé, R. A. Gross, S. P. McCarthy, Biodegradable polymer
blends of poly(lactic acid) and poly(ethylene glycol), Journal of Applied Polymer Science, 1997,
66 (8): 1495-1505.
[110] K. Sungsanit, N. Kao, S. N. Bhattacharya, Properties of linear poly(lactic
acid)/polyethylene glycol blends, Polymer Engineering and Science, 2012, 52 (1): 108-116.
[111] A. J. Nijenhuis, E. Colstee, D. W. Grijpma, A. J. Pennings, High molecular weight poly(l-
lactide) and poly(ethylene oxide) blends: thermal characterization and physical properties,
Polymer, 1996, 37 (26): 5849-5857.
[112] M. Avella, E. Martuscelli, Poly-d-(−)(3-hydroxybutyrate)/poly(ethylene oxide) blends:
phase diagram, thermal and crystallization behaviour, Polymer, 1988, 29 (10): 1731-1737.
[113] S. Ravati, B. D. Favis, Morphological states for a ternary polymer blend demonstrating
complete wetting, Polymer, 2010, 51 (20): 4547-4561.
[114] Z. Qiu, W. Yang, T. Ikehara, T. Nishi, Miscibility and crystallization behavior of
biodegradable blends of two aliphatic polyesters. Poly(3-hydroxybutyrate-co-hydroxyvalerate)
and poly(ε-caprolactone), Polymer, 2005, 46 (25): 11814-11819.
[115] A. Javadi, A. J. Kramschuster, S. Pilla, J. Lee, S. Gong, L.-S. Turng, Processing and
characterization of microcellular PHBV/PBAT blends, Polymer Engineering and Science, 2010,
50 (7): 1440-1448.

77
[116] Z. Qiu, T. Ikehara, T. Nishi, Miscibility and crystallization behaviour of biodegradable
blends of two aliphatic polyesters. Poly(3-hydroxybutyrate-co-hydroxyvalerate) and
poly(butylene succinate) blends, Polymer, 2003, 44 (24): 7519-7527.
[117] M. R. Nanda, M. Misra, A. K. Mohanty, The Effects of Process Engineering on the
Performance of PLA and PHBV Blends, Macromolecular Materials and Engineering, 2011, 296
(8): 719-728.
[118] F. Signori, M.-B. Coltelli, S. Bronco, Thermal degradation of poly(lactic acid) (PLA) and
poly(butylene adipate-co-terephthalate) (PBAT) and their blends upon melt processing, Polymer
Degradation and Stability, 2009, 94 (1): 74-82.
[119] L. Jiang, M. P. Wolcott, J. Zhang, Study of Biodegradable Polylactide/Poly(butylene
adipate-co-terephthalate) Blends, Biomacromolecules, 2005, 7 (1): 199-207.
[120] V. Vilay, M. Mariatti, Z. Ahmad, K. Pasomsouk, M. Todo, Improvement of
microstructures and properties of biodegradable PLLA and PCL blends compatibilized with a
triblock copolymer, Materials Science and Engineering: A, 2010, 527 (26): 6930-6937.
[121] http://www.metabolix.com/sites/default/files/ANTEC-PLA_PVC.pdf, (Last accessed in
January, 2015).
[122] J. John, R. Mani, M. Bhattacharya, Evaluation of compatibility and properties of
biodegradable polyester blends, Journal of Polymer Science Part A: Polymer Chemistry, 2002,
40 (12): 2003-2014.
[123] D. Wu, L. Yuan, E. Laredo, M. Zhang, W. Zhou, Interfacial Properties, Viscoelasticity,
and Thermal Behaviors of Poly(butylene succinate)/Polylactide Blend, Industrial and
Engineering Chemistry Research, 2012, 51 (5): 2290-2298.

78
[124] J. Zhou, X. Wang, K. Hua, C. e. Duan, W. Zhang, J. Ji, X. Yang, Enhanced mechanical
properties and degradability of poly(butylene succinate) and poly(lactic acid) blends, Iranian
Polymer Journal, 2013, 22 (4): 267-275.
[125] M. J. Jenkins, Y. Cao, L. Howell, G. A. Leeke, Miscibility in blends of poly(3-
hydroxybutyrate-co-3-hydroxyvalerate) and poly(ɛ-caprolactone) induced by melt blending in
the presence of supercritical CO2, Polymer, 2007, 48 (21): 6304-6310.
[126] P. Ma, A. B. Spoelstra, P. Schmit, P. J. Lemstra, Toughening of poly (lactic acid) by poly
(β-hydroxybutyrate-co-β-hydroxyvalerate) with high β-hydroxyvalerate content, European
Polymer Journal, 2013, 49 (6): 1523-1531.
[127] L. A. Utracki, Compatibilization of Polymer Blends, The Canadian Journal of Chemical
Engineering, 2002, 80 (6): 1008-1016.
[128] K. Sirisinha, W. Somboon, Melt characteristics, mechanical, and thermal properties of
blown film from modified blends of poly(butylene adipate-co-terephthalate) and poly(lactide),
Journal of Applied Polymer Science, 2012, 124 (6): 4986-4992.
[129] M. Kumar, S. Mohanty, S. K. Nayak, M. Rahail Parvaiz, Effect of glycidyl methacrylate
(GMA) on the thermal, mechanical and morphological property of biodegradable PLA/PBAT
blend and its nanocomposites, Bioresource Technology, 2010, 101 (21): 8406-8415.
[130] N. Zhang, Q. Wang, J. Ren, L. Wang, Preparation and properties of biodegradable
poly(lactic acid)/poly(butylene adipate-co-terephthalate) blend with glycidyl methacrylate as
reactive processing agent, Journal of Materials Science, 2009, 44 (1): 250-256.
[131] S. Lin, W. Guo, C. Chen, J. Ma, B. Wang, Mechanical properties and morphology of
biodegradable poly(lactic acid)/poly(butylene adipate-co-terephthalate) blends compatibilized by
transesterification, Materials and Design, 2012, 36 (0): 604-608.

79
[132] B. Y. Shin, D. H. Han, Compatibilization of immiscible poly(lactic acid)/poly(ε-
caprolactone) blend through electron-beam irradiation with the addition of a compatibilizing
agent, Radiation Physics and Chemistry, 2013, 83 (0): 98-104.
[133] H. Liu, F. Chen, B. Liu, G. Estep, J. Zhang, Super Toughened Poly(lactic acid) Ternary
Blends by Simultaneous Dynamic Vulcanization and Interfacial Compatibilization,
Macromolecules, 2010, 43 (14): 6058-6066.
[134] H. T. Oyama, Super-tough poly(lactic acid) materials: Reactive blending with ethylene
copolymer, Polymer, 2009, 50 (3): 747-751.
[135] M. Harada, T. Ohya, K. Iida, H. Hayashi, K. Hirano, H. Fukuda, Increased impact strength
of biodegradable poly(lactic acid)/poly(butylene succinate) blend composites by using
isocyanate as a reactive processing agent, Journal of Applied Polymer Science, 2007, 106 (3):
1813-1820.
[136] T. Takayama, M. Todo, Improvement of impact fracture properties of PLA/PCL polymer
blend due to LTI addition, Journal of Materials Science, 2006, 41 (15): 4989-4992.
[137] N. C. Liu, W. E. Baker, Reactive polymers for blend compatibilization, Advances in
Polymer Technology, 1992, 11 (4): 249-262.
[138] Y.-H. Na, Y. He, X. Shuai, Y. Kikkawa, Y. Doi, Y. Inoue, Compatibilization Effect of
Poly(ε-caprolactone)-b-poly(ethylene glycol) Block Copolymers and Phase Morphology
Analysis in Immiscible Poly(lactide)/Poly(ε-caprolactone) Blends, Biomacromolecules, 2002, 3
(6): 1179-1186.
[139] K. Chavalitpanya, S. Phattanarudee, Poly(Lactic Acid)/Polycaprolactone Blends
Compatibilized with Block Copolymer, Energy Procedia, 2013, 34 (0): 542-548.

80
[140] C.-H. Kim, K. Y. Cho, E.-J. Choi, J.-K. Park, Effect of P(lLA-co-εCL) on the
compatibility and crystallization behavior of PCL/PLLA blends, Journal of Applied Polymer
Science, 2000, 77 (1): 226-231.
[141] P. Ma, X. Cai, Y. Zhang, S. Wang, W. Dong, M. Chen, P. J. Lemstra, In-situ
compatibilization of poly(lactic acid) and poly(butylene adipate-co-terephthalate) blends by
using dicumyl peroxide as a free-radical initiator, Polymer Degradation and Stability, 2014, 102
(0): 145-151.
[142] A. J. Ryan, Polymer science: Designer polymer blends, Nature Material, 2002, 1 (1): 8-10.
[143] R. Fayt, P. Teyssie, Molecular design of multicomponent polymer systems. 8. New
acrylonitrile-butadiene-styrene-like resins from styrene-acrylonitrile-based mechanical blends,
Macromolecules, 1986, 19 (7): 2077-2080.
[144] R. Fayt, R. Jérôme, P. Teyssié, Molecular design of multicomponent polymer systems. III.
Comparative behavior of pure and tapered block copolymers in emulsification of blends of low-
density polyethylene and polystyrene, Journal of Polymer Science: Polymer Physics Edition,
1982, 20 (12): 2209-2217.
[145] D. Wu, Y. Zhang, L. Yuan, M. Zhang, W. Zhou, Viscoelastic interfacial properties of
compatibilized poly(ε-caprolactone)/polylactide blend, Journal of Polymer Science Part B:
Polymer Physics, 2010, 48 (7): 756-765.
[146] H. Tsuji, T. Yamada, M. Suzuki, S. Itsuno, Part 7. Effects of poly(L-lactide-co-ϵ-
caprolactone) on morphology, structure, crystallization, and physical properties of blends of
poly(L-lactide) and poly(ϵ-caprolactone), Polymer International, 2003, 52 (2): 269-275.

81
[147] M. Avella, M. E. Errico, P. Laurienzo, E. Martuscelli, M. Raimo, R. Rimedio, Preparation
and characterisation of compatibilised polycaprolactone/starch composites, Polymer, 2000, 41
(10): 3875-3881.
[148] G. Ceccorulli, M. Scandola, G. Adamus, Compatibilizing effect of a graft copolymer on
bacterial poly(3-hydroxybutyrate)/poly(methyl methacrylate) blends, Journal of Polymer Science
Part B: Polymer Physics, 2002, 40 (13): 1390-1399.
[149] Y. Wang, M. A. Hillmyer, Polyethylene-poly(L-lactide) diblock copolymers: Synthesis
and compatibilization of poly(L-lactide)/polyethylene blends, Journal of Polymer Science Part
A: Polymer Chemistry, 2001, 39 (16): 2755-2766.
[150] E. Can, S. Bucak, E. Kınacı, A. C. Çalıkoğlu, G. T. Köse, Polybutylene Succinate (PBS) –
Polycaprolactone (PCL) Blends Compatibilized with Poly(ethylene oxide)-block-poly(propylene
oxide)-block-poly(ethylene oxide) (PEO-PPO-PEO) Copolymer for Biomaterial Applications,
Polymer-Plastics Technology and Engineering, 2014, 53 (11): 1178-1193.
[151] G.-X. Chen, H.-S. Kim, E.-S. Kim, J.-S. Yoon, Compatibilization-like effect of reactive
organoclay on the poly(l-lactide)/poly(butylene succinate) blends, Polymer, 2005, 46 (25):
11829-11836.
[152] V. Ojijo, S. Sinha Ray, R. Sadiku, Toughening of Biodegradable Polylactide/Poly(butylene
succinate-co-adipate) Blends via in Situ Reactive Compatibilization, ACS Applied Materials &
Interfaces, 2013, 5 (10): 4266-4276.
[153] A. K. Mohanty, M. Misra, G. Hinrichsen, Biofibres, biodegradable polymers and
biocomposites: An overview, Macromolecular Materials and Engineering, 2000, 276-277 (1): 1-
24.
82
[154] W. Dong, P. Ma, S. Wang, M. Chen, X. Cai, Y. Zhang, Effect of partial crosslinking on
morphology and properties of the poly(β-hydroxybutyrate)/poly(d,l-lactic acid) blends, Polymer
Degradation and Stability, 2013, 98 (9): 1549-1555.
[155] K. Zhang, V. Nagarajan, M. Misra, A. K. Mohanty, Supertoughened Renewable PLA
Reactive Multiphase Blends System: Phase Morphology and Performance, ACS Applied
Materials and Interfaces, 2014, 6 (15): 12436-12448.
[156] L. Wang, W. Ma, R. A. Gross, S. P. McCarthy, Reactive compatibilization of
biodegradable blends of poly(lactic acid) and poly(ε-caprolactone), Polymer Degradation and
Stability, 1998, 59 (1–3): 161-168.
[157] M. P. M. Dicker, P. F. Duckworth, A. B. Baker, G. Francois, M. K. Hazzard, P. M.
Weaver, Green composites: A review of material attributes and complementary applications,
Composites Part A: Applied Science and Manufacturing, 2014, 56 (0): 280-289.
[158] V. Nagarajan, A. K. Mohanty, M. Misra, Sustainable Green Composites: Value Addition
to Agricultural Residues and Perennial Grasses, ACS Sustainable Chemistry and Engineering,
2013, 1 (3): 325-333.
[159] F. Ahmad, H. S. Choi, M. K. Park, A Review: Natural Fiber Composites Selection in View
of Mechanical, Light Weight, and Economic Properties, Macromolecular Materials and
Engineering, 2015, 300 (1): 10-24.
[160] M.A. Al-Maadeed, S. Labidi, Chapter 4: Recycled polymers in natural fiber-reinforced
polymer composites. In: Hodzic, A., Shanks, R. (Eds.), Natural Fibre Composites: Materials,
Processes and Properties. Woodhead Publishing Limited, Cambridge, UK, 2014, pp. 103–114.
[161] D. Shah, Developing plant fibre composites for structural applications by optimising
composite parameters: a critical review, Journal of Materials Science, 2013, 48 (18): 6083-6107.

83
[162] A. K. Mohanty, M. Misra, L. T. Drzal, Sustainable Bio-Composites from Renewable
Resources: Opportunities and Challenges in the Green Materials World, Journal of Polymers and
the Environment, 2002, 10 (1-2): 19-26.
[163] D. U. Shah, Natural fibre composites: Comprehensive Ashby-type materials selection
charts, Materials and Design, 2014, 62 (0): 21-31.
[164] P. Wambua, J. Ivens, I. Verpoest, Natural fibres: can they replace glass in fibre reinforced
plastics?, Composites Science and Technology, 2003, 63 (9): 1259-1264.
[165] H. M. Akil, M. F. Omar, A. A. M. Mazuki, S. Safiee, Z. A. M. Ishak, A. Abu Bakar, Kenaf
fiber reinforced composites: A review, Materials and Design, 2011, 32 (8–9): 4107-4121.
[166] M. R. Nanda, M. Misra, A. K. Mohanty, Performance Evaluation of Biofibers and Their
Hybrids as Reinforcements in Bioplastic Composites, Macromolecular Materials and
Engineering, 2013, 298 (7): 779-788.
[167] A. Bourmaud, S. Pimbert, Investigations on mechanical properties of poly(propylene) and
poly(lactic acid) reinforced by miscanthus fibers, Composites Part A: Applied Science and
Manufacturing, 2008, 39 (9): 1444-1454.
[168] V. Nagarajan, M. Misra, A. K. Mohanty, New engineered biocomposites from poly(3-
hydroxybutyrate-co-3-hydroxyvalerate) (PHBV)/poly(butylene adipate-co-terephthalate)
(PBAT) blends and switchgrass: Fabrication and performance evaluation, Industrial Crops and
Products, 2013, 42 (0): 461-468.
[169] F. M. Al-Oqla, S. M. Sapuan, Natural fiber reinforced polymer composites in industrial
applications: feasibility of date palm fibers for sustainable automotive industry, Journal of
Cleaner Production, 2014, 66 (0): 347-354.

84
[170] M. Avella, A. Buzarovska, M. Errico, G. Gentile, A. Grozdanov, Eco-Challenges of Bio-
Based Polymer Composites, Materials, 2009, 2 (3): 911-925.
[171] M. U. Wahit, N. I. Akos, W. A. Laftah, Influence of natural fibers on the mechanical
properties and biodegradation of poly(lactic acid) and poly(ε-caprolactone) composites: A
review, Polymer Composites, 2012, 33 (7): 1045-1053.
[172] K. G. Satyanarayana, G. G. C. Arizaga, F. Wypych, Biodegradable composites based on
lignocellulosic fibers-An overview, Progress in Polymer Science, 2009, 34 (9): 982-1021.
[173] A. Javadi, Y. Srithep, J. Lee, S. Pilla, C. Clemons, S. Gong, L.-S. Turng, Processing and
characterization of solid and microcellular PHBV/PBAT blend and its RWF/nanoclay
composites, B: Applied Science and Manufacturing, 2010, 41 (8): 982-990.
[174] F. Harnnecker, D. dos Santos Rosa, D. Lenz, Biodegradable Polyester-Based Blend
Reinforced with Curauá Fiber: Thermal, Mechanical and Biodegradation Behaviour, Journal of
Polymers and the Environment, 2012, 20 (1): 237-244.
[175] K. Zhang, A. K. Mohanty, M. Misra, Fully Biodegradable and Biorenewable Ternary
Blends from Polylactide, Poly(3-hydroxybutyrate-co-hydroxyvalerate) and Poly(butylene
succinate) with Balanced Properties, ACS Applied Materials and Interfaces, 2012, 4 (6): 3091-
3101.
[176] N. Zarrinbakhsh, A. Mohanty, M. Misra, Improving the interfacial adhesion in a new
renewable resource-based biocomposites from biofuel coproduct and biodegradable plastic,
Journal of Materials Science, 2013, 48 (17): 6025-6038.
[177] S. Muniyasamy, M. M. Reddy, M. Misra, A. Mohanty, Biodegradable green composites
from bioethanol co-product and poly(butylene adipate-co-terephthalate), Industrial Crops and
Products, 2013, 43 (0): 812-819.
85
[178] H. Lu, S. A. Madbouly, J. A. Schrader, G. Srinivasan, K. G. McCabe, D. Grewell, M. R.
Kessler, W. R. Graves, Biodegradation Behavior of Poly(lactic acid) (PLA)/Distiller’s Dried
Grains with Solubles (DDGS) Composites, ACS Sustainable Chemistry and Engineering, 2014,
2 (12): 2699-2706.
[179] S. A. Madbouly, J. A. Schrader, G. Srinivasan, K. Liu, K. G. McCabe, D. Grewell, W. R.
Graves, M. R. Kessler, Biodegradation behavior of bacterial-based polyhydroxyalkanoate (PHA)
and DDGS composites, Green Chemistry, 2014, 16 (4): 1911-1920.
[180] C. Nyambo, V. Nagarajan, A. K. Mohanty, M. Misra, Chapter 8: natural fiber composites
from agricultural by-products: an overview. In: A. N. Netravali, C.M. Pastore, (Eds.),
Sustainable Composites: Fibers, Resins and Applications. DEStech Publications, Inc, Lancaster,
Pennsylvania, 2014, pp. 195–239
[181] R. Pradhan, M. Misra, L. Erickson, A. Mohanty, Compostability and biodegradation study
of PLA–wheat straw and PLA–soy straw based green composites in simulated composting
bioreactor, Bioresource Technology, 2010, 101 (21): 8489-8491.
[182] A. K. Bledzki, A. Jaszkiewicz, Mechanical performance of biocomposites based on PLA
and PHBV reinforced with natural fibres – A comparative study to PP, Composites Science and
Technology, 2010, 70 (12): 1687-1696.
[183] J. Adam, B. A. Korneliusz, M. Agnieszka, Dynamic mechanical thermal analysis of
biocomposites based on PLA and PHBV-A comparative study to PP counterparts, Journal of
Applied Polymer Science, 2013, 130 (5): 3175-3183.
[184] B. Yang, M. Nar, D. K. Visi, M. Allen, B. Ayre, C. L. Webber Iii, H. Lu, N. A. D’Souza,
Effects of chemical versus enzymatic processing of kenaf fibers on poly(hydroxybutyrate-co-

86
valerate)/poly(butylene adipate-co-terephthalate) composite properties, Composites Part B:
Engineering, 2014, 56 (0): 926-933.
[185] N. Zarrinbakhsh, M. Misra, A. K. Mohanty, Biodegradable Green Composites from
Distiller's Dried Grains with Solubles (DDGS) and a Polyhydroxy(butyrate-co-valerate)
(PHBV)-Based Bioplastic, Macromolecular Materials and Engineering, 2011, 296 (11): 1035-
1045.
[186] K. Zhang, M. Misra, A. K. Mohanty, Toughened Sustainable Green Composites from
Poly(3-hydroxybutyrate-co-3-hydroxyvalerate) Based Ternary Blends and Miscanthus Biofiber,
ACS Sustainable Chemistry and Engineering, 2014, 2 (10): 2345-2354.
[187] M. R. Nanda, M. Misra, A. K. Mohanty, Mechanical Performance of Soy-Hull-Reinforced
Bioplastic Green Composites: A Comparison with Polypropylene Composites, Macromolecular
Materials and Engineering, 2012, 297 (2): 184-194.
[188] A. Sis, N. Ibrahim, W. Yunus, Effect of (3-aminopropyl)trimethoxysilane on mechanical
properties of PLA/PBAT blend reinforced kenaf fiber, Iranian Polymer Journal, 2013, 22 (2):
101-108.
[189] E. Sykacek, W. Schlager, N. Mundigler, Compatibility of softwood flour and commercial
biopolymers in injection molding, Polymer Composites, 2010, 31 (3): 443-451.
[190] P. Georgiopoulos, E. Kontou, M. Niaounakis, Thermomechanical properties and
rheological behavior of biodegradable composites, Polymer Composites, 2014, 35 (6): 1140-
1149.
[191] T. Yu, Y. Li, Influence of poly(butylenes adipate-co-terephthalate) on the properties of the
biodegradable composites based on ramie/poly(lactic acid), Composites Part A: Applied Science
and Manufacturing, 2014, 58 (0): 24-29.

87
[192] A. Ibrahim, M. Wahit, A. Yussuf, Effect of fiber reinforcement on mechanical and thermal
properties of poly(ɛ-caprolactone)/poly(lactic acid) blend composites, Fibers and Polymers,
2014, 15 (3): 574-582.
[193] B. K. Goriparthi, K. N. S. Suman, M. R. Nalluri, Processing and characterization of jute
fiber reinforced hybrid biocomposites based on polylactide/polycaprolactone blends, Polymer
Composites, 2012, 33 (2): 237-244.
[194] A. Bourmaud, Y.-M. Corre, C. Baley, Fully biodegradable composites: Use of poly-
(butylene-succinate) as a matrix and to plasticize l-poly-(lactide)-flax blends, Industrial Crops
and Products, 2015, 64, 251–257.
[195] C. N. Ludvik, G. M. Glenn, A. P. Klamczynski, D. F. Wood, Cellulose Fiber/Bentonite
Clay/Biodegradable Thermoplastic Composites, Journal of Polymers and the Environment, 2007,
15 (4): 251-257.
[196] O. Faruk, A. K. Bledzki, H.-P. Fink, M. Sain, Progress Report on Natural Fiber Reinforced
Composites, Macromolecular Materials and Engineering, 2014, 299 (1): 9-26.
[197] http://www.bioproductsatguelph.ca/newsevt/colloquium/assets/flashpaper/r_campbell.swf,
(Last accessed in January, 2015).
[198] http://indiacompositesshow.com/bio-composites-in-automotive-applications/, (Last
accessed in January, 2015).
[199] M. Darder, P. Aranda, E. Ruiz-Hitzky, Bionanocomposites: A New Concept of Ecological,
Bioinspired, and Functional Hybrid Materials, Advanced Materials, 2007, 19 (10): 1309-1319.
[200] http://www.mastersoflinen.com/eng/technique/19-secteurs-d-application, (Last accessed in
January, 2015).

88
Chapter 3: Fully Biodegradable Poly (butylene succinate) and Poly (butylene adipate-co-
terephthalate) Blends: Reactive Extrusion and Performance Evaluation*
*A version of this chapter has been published in:
R. Muthuraj, M. Misra, A. K. Mohanty, Biodegradable poly (butylene succinate) and poly
(butylene adipate-co-terephthalate) blends: Reactive extrusion and performance evaluation,
Journal of Polymers and the Environment, 2014, 22:336–349 (adapted with kind permission
from Springer, Jul 09, 2015, License number 3664990312761).
Abstract
Two biodegradable polyesters, poly(butylene succinate) (PBS), and poly(butylene
adipate-co-terephthalate) (PBAT) were melt-compounded in a twin screw extruder to fabricate a
novel PBS/PBAT blends. The compatibility of the blends was attributed to the transesterification
reaction that was confirmed by Fourier transform infrared spectroscopy. The Gibbs free energy
equation was applied to demonstrate the miscibility of resulting blends. Dynamic mechanical
analysis of the blends exhibits an intermediate tan δ peak compared to the individual components
which suggests that the blend achieved compatibility. One of the key findings is that the tensile
strength of the optimized blends is higher compared to blended partner. Rheological properties
revealed a strong shear-thinning tendency of the blend by the addition of PBAT into PBS. The
phase morphologies of the blends were examined through scanning electron microscopy, which
revealed that phase separation occurred in the blends. The spherulite growth in the blends was
highly influenced by the crystallization temperature and composition. In addition, the presence of
a dispersed amorphous phase was found to be a hindrance to the spherulite growth, which was
confirmed by polarizing optical microscopy. Furthermore, the increased crystallization ability of
PBAT in the blend systems gives the blend a balanced thermal resistance property.

89
3.1 Introduction
The development of biodegradable material as a potential substitute for non-biodegradable
material is an emerging field of research and development. In recent years, different types of
biodegradable polymers have received an immense amount of attention for developing various
new materials and to reduce environmental concerns [1]. Some biodegradable polymers are
commercially available in the market, such as poly (propylene carbonate) (PPC), poly (butylene
adipate-co-terephthalate) (PBAT), polyhydroxyalkanoates (PHAs), polycaprolactone (PCL),
poly (lactic acid) (PLA), poly (butylene succinate) (PBS), and thermoplastic starch [2-5].
Biodegradable polymers are not currently widely used due to some limitations such as their cost,
mechanical properties, and thermal stability.
Researchers have been trying to address these issues by utilizing blending techniques to
obtain biodegradable blends with tailored properties. Compared to other methods, melt blending
is a cost effective and less time-consuming process for the development of new material with
balanced properties [6,7]. During melt blending, dipole interactions, hydrogen bonding, or a
combination of these occur naturally, and such interactions can enhance the overall performance
of the resulting products [8,9]. The modification can also be made during processing to further
improve the strength of the material. Well established literature is available for modification
studies of polymer blends using techniques such as in-situ compatibilization [10], graft
copolymerization [11], copolymerization [12], and transreactions [8, 13]. Transreactions include
an alcoholysis, acidolysis, and ester interchange reaction. These three reactions are generally
referred to as transesterification. The transesterfication reaction is an exchange mechanism which
can help to form a new type of ester linkage between the components in the blends [14]. The
resulting transesterification products very often play important roles in the miscibility,
compatibility, crystallinity, and mechanical properties of the blends. During the past several

90
years of research, many studies have been done on the transesterification of polyester blends
such as PBS/PCL [6], poly(ethylene terephthalate)/poly(ether imide) [15], poly(triethylene
terephthalte)/polycarbonate [16], PHB/PLA [17], and polycarbonate/poly(trimethylene
terephthalate) [18].
Among the biodegradable polyesters, both PBS and PBAT have been widely studied
because of their commercial availability and inherent biodegradability [1, 19]. PBS is an
aliphatic polyester which is synthesized from the polycondensation reaction of petroleum based
aliphatic dicarboxylic acid (succinic acid) and 1,4-butane diol [20-22]. The biodegradability of
PBS is similar to cellulose and bacterial polyesters like poly(hydroxybutyrate-co-valerate)
(PHBV) [23]. Only limited biodegradable thermoplastics are produced from renewable
resources. Recently, the PBS is produced from biobased monomer i.e., bio-succinic acid [24].
Therefore, exploring PBS as a matrix system for polymer blends and composites could diversify
the renewable resource based material applications. PBS is a good candidate for making
biodegradable products as well as having some unique physical properties such as
semicrystalline nature, thermal stability, good processing properties, good gas barrier properties,
and a lower melting point [25-28]. The main drawback of the PBS is low impact strength, which
is limiting its applications.
PBAT is commercially synthesized from petroleum based adipic acid, 1,4-butane diol,
and terephthalic acid, which is a good biodegradable polymer in the presence of naturally
occurring microorganisms [29-31]. Furthermore, it has excellent toughness and is mostly used
for film extrusion and coatings [32]. PBAT is a promising material to improve the toughness of
polymer blends which contain brittle polymers like poly(lactic acid) [33], polycarbonate [34],
and poly(hydroxybutyrate-co-valerate) [35]. As noted above, PBS and PBAT are the most

91
promising candidates for future biodegradable materials in various potential applications. Many
studies have reported the blending of either PBS or PBAT with other biodegradable polymers.
For instance, PBS has been incorporated with many polymers such as poly(triethylene succinate)
[21], poly(ethylene oxide) [36], poly(propylene carbonate) [37], poly(butylene terephthalate)
[28], copolyesters [30, 38], polyhydroxybutyrate [27], and polycaprolactone (PCL) [6]. Although
many studies have reported stiffness-toughness balanced biodegradable binary blends, to the best
of our knowledge no literature is available for PBS/PBAT binary blends. As two typical
thermoplastic biodegradable polyesters, the blend of PBS and PBAT are of great interest due to
their unique properties, which can extend their applications in diversified areas. Hence, the
present work focused on the fabrication of a novel high performance PBS/PBAT blend. The
binary blend was fabricated by an extrusion-injection molding technique. The resulting binary
blend was characterized by different analytical techniques.
3.2 Experimental section
3.2.1 Materials
PBS pellets (Bionolle 1020) with a weight average molecular weight (Mw) of 1.4 ×10⁵
g/mol and PDI of 1.82, manufactured by Showa Highpolymer, Japan, and were used. The
commercially available PBAT (Biocosafe 2003F) was purchased from Xinfu Pharmaceutical,
China. The molecular structures of the neat PBS and PBAT are shown in Scheme 3.1.

92
Scheme 3.1. Molecular structure of PBS and PBAT
3.2.2 Blend preparation
Prior to blending, PBS and PBAT pellets were vacuum dried at 80 oC for 12 h. Samples
with different compositions of PBS/PBAT were prepared in a DSM Xplore® micro-compounder.
The micro-extruder was equipped with a co-rotating twin screw and had a barrel volume of 15
cm3. A twin-screw aspect ratio of 18 and length of 150 mm was used in the melt blending
process. The process temperature, cycle time, and screw speed were kept constant at 140 oC, 2
min, and 100 rpm, respectively for different compositions of the PBS/PBAT blend. The molten
polymer was collected and injected into the mold at 30 oC using a 12 cm
3 micro-injection molder
(DSM Xplore®) kept at 140
oC. The molded test specimens were used for further
characterization.
3.2.3 Fourier transform infrared spectroscopy (FTIR)
FTIR spectra of PBS, PBAT and PBS/PBAT blends were obtained by using a Thermo
Scientific NicoletTM
6700 at ambient temperature. All the scans were performed from 400 to
4000 cm-1
with a resolution of 4 cm-1
. For each sample of the spectrum, 32 accumulated scans
were produced and the absorbance was recorded as a function of wavenumbers.
3.2.4 Mechanical properties
Tensile properties of the neat PBS, PBAT and PBS/PBAT blends were obtained by
Instron 3382, using a constant crosshead speed of 50 mm/min at room temperature. The tensile
properties were measured according to ASTM D638 test method using dumbbell shaped

93
samples. Data was collected by Blue hill software. All the reported values are an average of at
least five samples for each formulation.
3.2.5 Melt flow index (MFI)
MFI measurement of the neat polymers and their blends was carried out according to the
ASTM D1238 standard using a Qualitest (model 2000A) Melt Flow Indexer at 190 °C with a
standard weight of 2.16 kg. The presented results are an average of five replicates of each
formulation.
3.2.6 Differential scanning calorimetry (DSC)
DSC analysis was carried out in a thermal analysis instrument (TA Q-200), and the
analysis was performed under the nitrogen atmosphere. The sample was first scanned from 25 to
150 oC with a rate of heating 10
oC min
-1 and subsequently cooled down from 150 to -50
oC at a
cooling rate of 5 oC min
-1. A second heating scan of the samples was performed from -50 to 150
oC at a heating rate of 10
oC min
-1. The first heating cycle was used for the removal of thermal
history and the reported results are from the second heating cycle. The data were analyzed using
TA Instrument software.
3.2.7 Dynamic mechanical analysis (DMA)
The storage modulus and tan delta of PBS, PBAT and PBS/PBAT blends were measured
by a DMA Q800 from TA Instruments. The analysis was performed between -50 to 100 oC at a
heating rate of 3 oC/min. The experiment was carried out in a dual cantilever clamp with 1 Hz
frequency and 15 µm oscillating amplitude.

94
3.2.8 Heat deflection temperature (HDT)
HDT measurement was performed based on the ASTM D648 standard at a constant load
0.455 MPa in the same DMA Q800 thermal instrument. The analysis was performed at a heating
rate of 2 oC/min from ambient temperature to 100
oC in a three point bending mode.
3.2.9 Thermogravimetric analysis (TGA)
Thermal stability of the PBS, PBAT and PBS/PBAT blends was measured using a TA
Q500 Instrument. The experiment was carried out under the nitrogen environment from 25 to
600 oC with a rate of heating 20
oC min
-1. The maximum rate of degradation was observed from
the derivative thermogram (DTG).
3.2.10 Rheological studies
A strain-controlled rheometer (Anton Paar Modular Compact Rheometer MCR– 302)
was used to observe the rheological properties of neat polymers and their blends. Injection
molded samples were placed between the parallel-plates (diameter of the parallel plate is 25
mm), and the experiment was performed at 140 oC. The plates subsequently compressed the
samples, and the distance between the parallel plates was adjusted to 1 mm. Dynamic properties
were determined by a dynamic frequency sweep test. During the test, the range of frequency and
strain used was 500 to 0.01 rad/s and 3 %, respectively. These limits were fixed based on the
polymer torque sensitivity and their thermal stability.
3.2.11 Polarizing optical microscopy (POM)
Polarizing optical microscopy was performed on a Nikon, Universal Design Microscope.
The microscope was equipped with a Linkam LTS 420 hot stage, which is used to control the
temperature. A DS-2Mv (with DS-U2) color video camera with the capture NIS element imaging
software was used for POM observations. Samples were sandwiched between two glass slides.

95
Subsequently, samples were annealed at the crystallization temperature. The spherulities growth
was observed at two different crystallization temperatures of 80 and 90 oC.
3.2.12 Scanning electron microscopy (SEM)
Morphology of the PBS/PBAT blends was captured by an Inspect S50-FEI Company. The
cryofractured samples were used to observe the phase morphology of the blends. A selective
dissolution of polyester in tetrahydrofuran (THF) was used to distinguish the polymer phases. All
the samples were dried and sputtered with gold prior to imaging in order to make them
conductive.
3.3 Results and Discussion
3.3.1 Fourier transform infrared spectroscopy (FTIR)
The FTIR analysis was performed to identify the physical and chemical interaction
between the neat polymers during melt blending. The FTIR spectra of PBS, PBAT and
PBS/PBAT blends are shown in Figure 3.1. The carbonyl group frequency of neat polymers and
their blends was detected at 1712 cm-1
and 1716 cm-1
, respectively. The peak of the carbonyl
group was shifted towards higher wavenumbers for the PBS/PBAT blends compared to each of
the neat polymers, which clearly indicates that a strong chemical interaction occurred during the
melt process at 140 oC. Kwei [39] has reported that the shift (from 1722 to about 1705 cm
-1) of
the carbonyl group peak in the blends occurred as a result of chemical interactions between the
parent polymers. John et al., [6] also observed a similar type of transesterification reaction in the
PBS/PCL and PCL/EASTAR blends. These results can be explained by the formation of
copolyester of PBS and PBAT by an ester-ester interchange reaction. The resulting copolyester
which is compatible with the homopolymer of the unreacted PBS and PBAT may act as a
compatibilizer in the blend system. In the present study, no external transesterification catalyst

96
was added into the blends. Even though a transesterification reaction was observed during melt
blending, the amount of reaction gradually decreased with increasing PBAT wt%. This resultant
ester exchange reaction was due to the residual catalysts existing in the homopolymer synthesis,
which was supported by Wang et al., [40-42]. The transesterification product can further enhance
the mechanical performance of the resultant blends. Scheme 3.2 shows the expected chemical
structure of the transesterification product in the PBS/PBAT blends.
Figure 3.1. Evaluation of the normalized FTIR spectra of the carbonyl region (1800-1600 cm-1
)
of PBS, PBAT and their blends

97
Scheme 3.2. Expected transesterification product of PBS/PBAT blend
3.3.2 Mechanical properties
Figure 3.2 shows the stress-strain curves of PBS, PBAT, and their blends. Neat PBS
showed a higher tensile yield strength but lower elongation compared to neat PBAT. For PBS,
no apparent strain hardening was observed during the tensile test. On the other hand, PBAT
showed excellent elongation and obvious strain hardening regions in the stress-strain curves,
while its’ tensile and yield strength was poor. As for the blends, all the samples presented three
clear regions such as elastic, plastic deformation, and strain hardening. The first region showed
linear stretching with recoverable deformation, followed by the second region which revealed
plastic deformation which is a non recoverable deformation of the samples. The second region
indicated cold drawing behavior after the neck forming occurred in the samples. The third region
showed strain hardening, the tensile stress gradually increasing until the samples broke.
Crystalline slippage was also observed. Interestingly, after the strain increased to 150%, each
composition of the blend showed clear evidence of cold drawing which affected the polymer
chain alignment and resulted in strain hardening. Generally, amorphous and semi crystalline

98
polymer chain entanglement can lead to strain hardening. Strain hardening behavior is of great
importance in polymer processing such as film blowing, thermoforming, and blow molding due
to its good resistance against stretching of polymer segments. Also, strain hardening behavior
can make the process easier and lead to higher quality products [43]. Figure 3.3 shows tensile
strength and percentage elongation data. A significant property improvement was observed in the
blends.
The tensile strength of the PBS/PBAT (70/30 wt%) blend increased by 30% and 148%
over the neat PBS and PBAT, respectively. The percent elongation of PBS/PBAT (70/30 wt%)
blend was 150% higher than neat PBS. Tensile strength improvement is directly related to the
intermolecular forces, crystallinity, miscibility, compatibility, and molecular orientation of the
polymers in the blend [6]. In the present study, tensile strength improvement was directly related
to the amount of PBS present in the blend.
Figure 3.2. Tensile stress-strain curves of PBS, PBAT, and their blends

99
Tensile strength gradually reduced with increasing PBAT concentration in the blend
system, which reveals that the blend transesterification ability was reduced. Furthermore, the
increased PBAT content in the blend system may cause phase separation because of decreased
compatibility in the blend which can lead to the reduction of tensile strength. These results were
also observed from morphological analysis of the blends. John et al., [6] observed that a similar
phase separation occurs when increasing one component in a PBS/EASTAR and PCL/EASTAR
blend leading to reduced tensile strength in the blends. Tensile properties of the PBS/PBAT
blends were sharply increased compare to their parent polymers. Apparently, the PBS/PBAT
blends mechanical properties are comparable with literature polyethylene mechanical properties
[44]. Therefore, we believe that the PBS/PBAT blends can be potential substitute for no-
biodegradable polymers in the packaging applications.
Figure 3.3. Tensile strength and elongation at break of PBS, PBAT, and their blends: (A) PBS;
(B) PBS/PBAT(70/30 wt%); (C) PBS/PBAT (60/40 wt%); (D) PBS/PBAT (50/50 wt%); (E)
PBAT.

100
3.3.3 Melt flow index
MFI measurement is a common technique for studying the flow behavior of the
polymers [45]. Table 3.1 shows the melt flow index values of neat polymers and their blends.
The MFI values of extruded PBAT and PBS were 9 g/10min and 25 g/10min, respectively. After
blending both polymers, MFI of all the blends increased compared to the neat polymers. The
reduction of molecular weight, and changing thermal properties during the melt blending may be
responsible for this [3]. PBS/PBAT (70/30 wt%) blend had the highest melt flow rate compared
to neat polymers and other PBS/PBAT blends. The observed MFI improvement of the blends is
probably attributed to the residual catalyst in the PBS system which is accelerating the PBAT
degradation during MFI measurement. Possible degradation can be occurring by chain scission
of the polymers, depolymerization, oxidative degradation, and transesterification reactions. In
addition, reactive end groups, residual catalyst, unreacted starting monomers in the polymers,
and other impurities can accelerate the thermal degradation of the polymers. A similar
observation has been observed in the literature [46]. Increased MFI of the blends indicate better
flow behavior compared to neat polymers. Therefore, this blend system is suitable to use as a
new matrix system for polymer composites.
Table 3.1. Melt flow index (MFI) of the neat polymers and their blends
Samples MFI (g/10min)
Neat PBS
25.3±2.4
PBS/PBAT (70/30 wt%)
41.5±3.2
PBS/PBAT (60/40 wt%)
33.3±2.8
PBS/PBAT (50/50 wt%)
33.6±1.6
Neat PBAT 9.4±1.8

101
3.3.4 Differential scanning calorimetry
The thermal behaviors of the neat PBS, PBAT, and their blends were measured through
non-isothermal DSC analysis. Non-isothermal DSC results of PBS, PBAT, and PBS/PBAT
blends are shown in Figure 3.4. The PBS and PBAT showed melting points at 114 and 116oC,
respectively. Interestingly, the second heating cycle showed a double melting peak for neat PBS
and their blends due to the melt re-crystallization of the polymers. The second heating cycle DSC
result is given in Figure 3.4, the imperfect crystals melt at lower temperatures but the more
structurally perfect crystals melt at higher temperature [3]. Another possible reason may be that
the molecular weight distribution could also affect the melt of the polymers [47]. The
PBS/PBAT blend showed a similar melting behavior to that of PBS. The enthalpy of fusion for
neat PBS and PBAT was found to be 32 and 10 J/g, respectively. The blends showed a high
enthalpy of fusion compared to the neat polymers. The PBAT phase may act as a nucleating
agent for the PBS phase, which will improve the crystallization of PBS in the blend. Another
reason is a change in the regular structure of the interchange reaction product, which may lead to
the production of thicker lamellar crystals that melt with a higher enthalpy of fusion [6]. In all
the blends, single glass transition temperature (Tg) was observed because the Tg values of both
the neat polymers are very close to each other. Therefore, the values may be overlapping. The Tg
value of the blends shifted to lower temperatures compared with that of the neat polymer. A
similar observation was found through DMA analysis. This variation in Tg could be the cause of
an interchange reaction which occurs during the melt blending process and it is also evidence for
compatibility of the polymer in the blends. John et al., [6] have observed similar synergistic
effects in PBS/PCL blends. Miscibility of the binary polymer blends can be predicted from
Gordon- Taylor (G -T) equation (3.1) [48-49]

102
Figure 3.4. Second heating DSC thermograms of PBS, PBAT, and their blends after cooling at 5
°C/min
Tg =
(3.1)
where W1 and Tg1 are the weight fraction and glass transition temperature of PBAT, respectively.
The W2 and Tg2 are the weight fraction and glass transition temperature of PBS, respectively, and
the parameter k is the fitting constant. The Tg values are observed from the DSC analysis. If
k=1, the Gordon and Taylor theory represents a good interaction between two blended
components. If the k value is lower or higher than 1, it indicates poor interaction between the
components in the blend. Figure 3.5 shows the Tg value obtained from the Gordon-Taylor
equation. From the DSC, the Tg values observed for all the blends were -35 oC, close to the G -T
curve. This indicates that the theoretical and experiment Tg values are close to each other. In our
present study, the k value was found to be 0.98; this semi-quantitatively measured value can
further support the interaction, which occurred between the polymers in the blends. The k value

103
of the diglycidyl ether of bisphenol-A/poly(ethylene terephthalate) blend was 0.10; the small
value of k suggests that only weak interactions exist between the components in the blend [8,
50]. Richard et al., [50] observed a k value of 0.18 for the PLA/PHBV blend indicating poor
miscibility, which was confirmed through SEM analysis. These results are supportive of our
present work: that the components have a good compatibility in the blend system.
Miscibility and compatibility of the blends can be explained by Gibbs free energy.
Thermodynamically compatible PBS/PBAT blends were analyzed according to the Gibbs free
energy equation (3.2) [51]:
∆Gm = ∆Hm-T (∆Scm+∆S
em) (3.2)
where ∆Gm is Gibbs free energy, T is absolute temperature, ∆Hm is heat of mixing, ∆Scm is
mixing of combinatorial entropy and ∆Sem is the mixing of excess entropy. The molar volume of
the components inversely depends on the combinatorial entropy. Hence, molecular weight of the
polymers is directly related to combinatorial entropy. If the polymers have higher molecular
weight, the ∆Scm becomes zero. Therefore, the system is spontaneous; it could lead to a ∆Gm
which is less than zero while ∆Hm is less than zero. In practical fields, this is rarely possible and
so can be ignored. The ∆Hm is calculated using expression (3.3) [51]:
∆Hm = ( )2 (3.3)
where and are the solubility parameter values of PBS and PBAT; and are the
volume fraction of PBS and PBAT. The solubility parameter ( ) value of the PBS and PBAT
was calculated according to the expression (3.4) [51]:
= (3.4)

104
Where M, G and are the monomer molecular weight, group molar attraction constant of the
polymer, and density of the polymer, respectively. The group molar attraction constant was
calculated by Mark [52]. The Gibbs free energy and solubility parameter values for PBS and
PBAT were calculated by equation 3.3 and 3.4, and the values are given in Table 3.2. Gibbs free
energy values for PBS/PBAT blends are low and very close to each other, indicating that some
extent of compatibility was achieved in the blend system. Previous studies have reported similar
observations for some of the biopolymer blends such as PLA/PCL, PLA/PHBV, and PHBV/PCL
blends, and they too have reported slight miscibility was achieved in their melt blend process [7,
51, 53].
Table 3.2. Solubility parameter values for polymers
Samples
Group Molar attraction
constant G
(J1/2
cm3/2
mol-1
)
Solubility Parameter
(J1/2
cm3/2
)
Gibbs free energy
∆Gm
(J g-1
m-3
)
PBS 2990 20.93 -
PBAT 6154 22.28 -
PBS/PBAT (70/30 wt%) - - 0.382
PBS/PBAT (60/40 wt%) - - 0.437
PBS/PBAT (50/50 wt%) - - 0.455

105
Figure 3.5. Theoretical and experimental values of Tg for PBS/ PBAT blends
3.3.5 Dynamic mechanical analysis
Figure 3.6 shows the storage modulus of neat PBS, PBAT, and their blends. The storage
modulus value of the PBS and PBAT at room temperature was found to be 0.6 and 0.1 GPa,
respectively. PBS had a higher storage modulus compared to PBAT at all temperatures, and their
blends had values in between the PBS and PBAT. A similar trend was observed in the tensile and
flexural modulus values. Reduction in modulus while increasing temperature is attributed to
increasing polymer chain mobility. Generally, above the alpha transition temperature, molecular
motion increases and polymer segments move from glassy to a rubbery state, which is
accompanied by an increase in the molecular relaxation in the polymers [54].

106
Figure 3.6. Storage moduli of PBS, PBAT, and their blends
Figure 3.7 depicts the Tan curves of PBS, PBAT, and their blends. It shows the primary
and secondary transition peaks in neat PBAT at -20 and 62 oC, respectively. The primary
transition peak corresponds to the poly(butylene adipate) segment mobility, and the secondary
transition peak corresponds to the terephthalate unit mobility [55]. The Tg value of the PBS,
PBAT and PBS/PBAT blends was calculated from the maximum height of the Tan peak.
Generally, an incompatible blend shows two transition peaks which correspond to the Tg of
individual components in the system [56]. For a highly compatible and partially compatible
blend, a single transition peak can be seen lying between the transition temperature of individual
components with an increased broadness in the transition peak [9, 57]. In our present study, all
the blends were observed to have a single transition peak. The Tg values of the PBS/PBAT
blends were shifted towards lower temperatures compared to the neat PBS, which is a dilution
effect with the addition of PBAT into PBS. Another possible reason is that for partially or
completely compatible blends, the Tg shifts towards lower or higher temperatures as a function

107
of composition [56]. Moreover, the small variation in the Tg value shows further evidence of an
interchange reaction occurring between the neat homopolymers. The Tg shift was observed by
the influence of a transesterification reaction when polycarbonate was incorporated into the
poly(trimethylene terephthalate) [56].
Figure 3.7. Tan curves of PBS, PBAT, and their blends
3.3.6 Heat deflection temperature
HDT represents the maximum working temperature of materials and is defined as the
temperature at which a material will be deformed by 250 µm under a constant load of 0.455 MPa
[58]. The HDT value of the neat polymers and their blends is shown in Table 3.3. The HDT
value of the neat PBS and PBAT is 88 and 46 oC, respectively. In general, the HDT of
amorphous polymers is low, and close to their glass transition temperature. In the crystalline
polymers, the HDT is close to its melting point [7, 59]. In the present study, a balanced HDT
value of PBS/PBAT blends was observed due to the PBAT having a lower crystallinity and
thermal resistance compared to PBS.

108
Table 3.3. Heat deflection temperatures of the neat polymers and their blends
Samples HDT (oC)
Neat PBS
88.06±0.4
PBS/PBAT (70/30 wt%)
73.66±1.2
PBS/PBAT (60/40 wt%)
70.27±2.1
PBS/PBAT (50/50 wt%)
65.88±2.3
Neat PBAT 46.12±1.5
3.3.7 Thermogravimetric analysis
Figure 3.8 shows the thermal stability of PBS, PBAT, and their blends as a function of
temperature. PBS undergoes cyclic degradation mechanism and some of the predominant
byproducts are anhydrides, olefins, carbon dioxide, and esters [60]. PBAT degradation takes
place by the breakdown of the ester groups and chain scission of C-O and C-C bonds on the
polymer backbone. The onset degradation temperature (Tonset) of PBAT was 377oC and PBS
was 372oC. This suggests that PBAT has slightly more thermal stability compared to PBS. TGA
results reveal that PBS and PBAT present a relatively good thermal stability up to 300 oC.
These data are similar to published literature results [55, 61]. The maximum degradation
temperature (Tmax) was observed at 405, 413, 408, 410, and 413oC for extruded PBS, PBAT,
PBS/PBAT (70:30 wt%), PBS/PBAT (60:40 wt%), and PBS/PBAT (50:50 wt%), respectively.
The Tonset and Tmax of the blends were quite similar to those estimated for PBS and PBAT
homopolymer. All the blends showed single step degradation because the neat polymer
degradation temperatures were close to each other, which was made clear through a derivative
thermogram (Figure 3.9). According to the melt flow rate results, all the blends showed a
molecular weight reduction, but the thermal stability of the blends was gradually increased
compared to neat PBS. This may be improved compatibility between the polymer phases. While

109
increasing the PBAT content, thermal stability increased because PBAT is more thermally
stable compared to PBS. The results indicate that a compatible blend was achieved and supports
the DSC results.
Figure 3.8. TGA curves of PBS, PBAT, and their blends
Figure 3.9. DTG curves of PBS, PBAT, and their blends

110
3.3.8 Rheological properties
Rheological properties were investigated to identify the interaction between polymer
phases in the blends. Figure 3.10 shows the complex viscosity (η*) of the neat polymers and
their blends as a function of frequency at 140oC. Apparently, a higher complex viscosity was
observed in the lower frequency range compared to its higher frequency region. This rheological
behavior of the blends indicates that the blend is a pseudo plastic liquid. Furthermore, the neat
PBS and PBAT exhibited almost Newtonian behavior at below 1 rad/s frequency, and a strong
shear thinning behavior was observed beyond 1 rad/s frequency range.
Figure 3.10. Complex viscosity of PBS, PBAT, and their blends with different weight fractions
of PBAT at 140oC
The PBS/PBAT blends had a higher complex viscosity compared to the neat polymers at
lower oscillation frequencies. At higher frequencies, the complex viscosity of the blends was
between that of the neat polymers. This increased viscosity may have occurred because
transesterification can form pseudo structures [62] that can withstand shear forces. In addition,

111
this is due to phase morphology of the blends and compatibility between the phases. The higher
compatibility between the two phases leads to good dispersion of the discrete phase in the blend
system. As we can see in the SEM image, when PBAT content increases from 30 to 50 wt% in
the blend, the discrete phase (PBAT) morphology is changed form spherical droplet to co-
continuous morphology. This indicates that, the PBS/PBAT 70/30 wt% blend was more
compatible than PBS/PBAT 60/40 and 50/50 wt% blends. Consequently, the PBS/PBAT 70/30
wt% blend had higher melt viscosity than PBS/PBAT 60/40 and 50/50 wt% blend. A similar
behavior of the PLA/PBS and PLA/PBAT blends was reported in literature [63, 64]. In addition,
the transesterification reaction also plays a predominant role in viscosity improvement of the
blends. At lower frequency, the transesterification product acts as a solid-like particle in all the
PBS/PBAT blends and leads to a higher viscosity compared to the parent polymers. However,
the FTIR results showed transesterification product gradually decreased with increasing PBAT
content from 30 to 40 and 50 wt%. The higher content of PBAT reduces the transesterification
reaction in the blend system and thus reduces the viscosity compared to PBS/PBAT 70/30 wt%
blend. Li et a.l [64] have reported similar behavior for PLA/PBAT blends at lower frequencies
and also that the interaction between the polymers can increase the melt viscosity.
Figure 3.11 and 3.12 show the dynamic loss modulus and the storage modulus of PBS,
PBAT, and PBS/PBAT blends. Generally, dynamic loss modulus and storage modulus represent
the amount of energy dissipated in the viscous portion and the ability of a material to store
energy during deformation, respectively. Figure 3.11 shows that the storage modulus (G') of each
sample increased with increase in frequency. It was also observed that with the blending of
PBAT into PBS, there were no changes in the storage modulus (G') at higher frequencies. All the
blends showed a higher storage modulus at lower frequencies compared to the neat polymers.

112
The 70:30 wt% of PBS/PBAT blend had a higher loss modulus (G'') than other blends (Figure
3.12).
Figure 3.11. Loss modulus versus frequency for PBS, PBAT, and their blends with different
weight fractions of PBAT at 140oC
When the PBAT phase was finely dispersed in the blend, the fine dispersal could be
reason of interaction existing between the two phases. Stronger interactions were observed in the
PBS/PBAT (70:30 wt%) blend, which were exhibited as a higher loss modulus. In addition, the
increased storage modulus is attributed to the PBAT molecular chain entanglement with PBS
molecular chain mediated by transesterification product acting as a compatibilizer. The higher
entanglement density of the blends would store more recoverable energy. Generally, the
entanglement density of the blend is depends on the existing compatibility between the two
phases. The PBS/PBAT 70/30 wt% blend had more compatibility than PBS/PBAT 60/40 and
50/50 wt% blends as shown in SEM. The higher entanglement density of the PBS/PBAT 70/30
wt% blend leads to higher storage modulus. However, the storage modulus gradually decreased

113
at lower frequency while increasing PBAT content in the blends. A similar trend was observed in
the complex viscosity. This is consistent with higher trasesterification product present in 70/30
wt% blend. The reduced storage modulus of the blends is due to the morphology changes [64]
and entanglement density due to lower lower transesterification product present in the blend.
Figure 3.12. Storage modulus versus frequency for PBS, PBAT, and their blends with different
weight fractions of PBAT at 140oC
The Cole–Cole plot was used to explain the phase structure of PBS/PBAT blends and the
plot was performed between the real and imaginary viscosity components of the blends. If the
blend gives a single arc curve, it can suggest phase homogeneity at the melt stage [65].
Furthermore, if any deviations from a single arc are observed, they are evidence for
inhomogeneous morphology and phase separation occurring in the blends due to a second
relaxation mechanism occurring in the samples. The Cole-Cole plot for PBS/PBAT blend at
140oC is depicted in Figure 3.13.

114
Figure 3. 13. Cole–Cole plot of the PBS/PBAT blends at 140oC
A second circular arc was observed on the right-hand side of the curve, and it is clear
evidence for a second relaxation mechanism happening for all PBS/PBAT blends. Nevertheless,
when the PBAT reaches 40 and 50 wt% in the blends, the blends showed a tail on the right hand
side of the plot. This is probably due to the phase inversion occurred in the blends. This result
shows that co-existing phase morphology was formed in the entire blend system and that the
formed morphology may be the droplet-matrix or co-continuous phase morphology.
Consequently, the Cole–Cole plot shows an inhomogeneous morphology formed in PBS/PBAT
blend systems. There have been reports of PLA/PBAT blend systems with similar observations
of phase behavior when the PBAT concentration is more than 30 wt% in the matrix [64]. The
Cole-Cole plot clearly shows that the PBS/PBAT 70/30 wt% blend is more heterogeneous
compared to the 50/50 wt% blend.

115
3.3.9 Polarizing optical microscopy
The spherulite morphology of the blends was investigated by optical microscopy. The
dark and light regions represent the amorphous and crystalline phases, respectively. Figure 3.14
(a) shows that PBS/PBAT blends were annealed at a crystallization temperature of 80oC for 30
min. When the PBAT concentration was 50 wt% in the blend, an increased number of PBS
spherulites were observed with decreasing spherulite size. This decrease in size suggests that the
PBS chain mobility was disrupted and PBAT acted as a nucleating site to promote the formation
of crystalline nuclei. A PBS/polyvinylidene fluoride (PVDF) blend exhibited a similar
phenomenon when PVDF was the predominant species in the blend compared to the PBS [66].
The PBS chain mobility was slowed in the presence of highly viscous PBAT, thereby decreasing
spherulite growth. With increasing PBAT content from 30 to 50 wt% in the blends, the texture of
PBS spherulites became coarse. Figure 3.14 (b) shows the PBS/PBAT blends after being
annealed at a crystallization temperature of 90oC for 30 min. The increasing PBAT composition
in the blends caused a reduced number of spherulites because PBAT has less crystallinity and the
PBS chain mobility increases at the crystallization temperature of 90oC compared to 80
oC. With
increasing PBAT content in the blends, the spherulites became rougher. For 30 wt% PBAT
content in the blend, the PBS spherulites were uniformly distributed with uniform dimensions
after being annealed for a given time. Consequently, our present results conclude that the
spherulite size controls the mechanical properties and morphology of the blends. For example,
the large spherulite size leads to the fracture along the spherulite boundaries and only
occasionally through the spherulites. Therefore, small spherulite size can yield better tensile
stress as well as strain [67].

116
Figure 3.14. (a) Photograph of the film annealed at 80oC: (i) PBS; (ii) PBS/PBAT (70/30 wt%);
(iii) PBS/PBAT (60/40 wt%) and (iv) PBS/PBAT (50/50 wt%). Figure (b) Photograph of the
film annealed at 90oC: (i) PBS; (ii) PBS/PBAT (70/30 wt%); (iii) PBS/PBAT (60/40 wt%) and
(iv) PBS/PBAT (50/50 wt%)

117
3.3.10 Scanning electron microscopy
Phase morphology of the blends depends on the second components, processing
parameters, molecular weight of the virgin polymers, and compatibility between the polymers.
If the blending components have a similar melt viscosity, the resulting morphology will be
very fine and both polymers will be uniformly distributed throughout the blend whether it is
the minor or major phase. The same is true if the blend consists of similar melt viscosity
components. If the minor phase has a lower or higher viscosity compared to the major phase, it
leads to the spherical domains of finely or coarsely dispersed morphology in the matrix. As
shown in Figure 3.15, phase morphology in the blend was identified by the solvent et al.,hing
method. Being a good solvent for PBAT while unable to dissolve PBS, THF was used as the et
al.,hing solvent. The observed morphology of PBAT phase selectively removed from the
blends without disturbing the PBS matrix is shown in Figure 3.15 (b). The PBAT phase was
completely extracted under these conditions. The corresponding unextracted samples are
shown in Figure 3.15 (a). This indicates that the holes are the extracted PBAT phase by THF.
The surface morphology of the blend reveals that spherical PBAT particles were uniformly
distributed throughout the matrix. Finer dispersions were observed in lower PBAT composition
in the blend. When the PBAT composition was increased in the blend, the domain shape and
size gradually changed due to the coalescence phenomenon. This may also act to decrease the
tensile strength of the blends.

118
Figure 3.15. (a) SEM images of PBS and PBAT blends (left hand side) (i) PBS/PBAT (70/30
wt%); (ii) PBS/PBAT (60/40 wt%) and (iii) PBS/PBAT (50/50 wt%) . (b) SEM images of PBS
and PBAT blends surface after et al.,hing with THF (right hand side): (i) PBS/PBAT (70/30
wt%); (ii) PBS/PBAT (60/40 wt%) and (iii) PBS/PBAT (50/50 wt%)

119
3.4 Conclusions
We have succeeded in fabricating a high performance and biodegradable PBS/PBAT
blend through the melt blending technique. There is a significant improvement in tensile strength
and elongation by the incorporation of PBAT into PBS, indicating that a good level of
compatibility is achieved between the polymers. The observed compatibility is caused by the
formation of copolyester due to transesterification between the neat polymers, which was
confirmed by FTIR analysis. DSC and DMA analysis suggested that the blends show
compatibility between the PBS and PBAT. The rheological properties of blends such as the
complex viscosity, loss modulus, and storage modulus were increased with the addition of PBAT
into PBS. As the PBAT composition was increased, phase morphology changes occurred in the
blends, leading to decreased values of complex viscosity, loss modulus, and storage modulus.
The phase morphology of the PBS/PBAT blends shows a two phase structure in which PBAT is
the minor phase. Furthermore, polarizing optical microscopy analysis revealed that the PBAT
has disturbed the spherulite growth of the matrix. The prepared biodegradable PBS/PBAT blend
is a potential substitute for non-biodegradable packaging films, blow molding bottles and
flexible tubes.
References
[1] Wu D, Yuan L, Laredo E, Zhang M, Zhou W (2012) Ind Eng Chem Res 51:2290-8.
[2] Tokiwa Y, Calabia BP (2007) J Polym Environ 15:259-67.
[3] Zhang K, Mohanty AK, Misra M (2012) ACS Appl Mater Interfaces 4:3091-101.
[4] Ouyang W, Huang Y, Luo H, Wang D (2012) J Polym Environ 20:1-9.
[5] Yu T, Luo F, Zhao Y, Wang D, Wang F (2011) J Appl Polym Sci 120:692-700.
[6] John J, Mani R, Bhattacharya M (2002) J Polym Sci A Polym Chem 40:2003-14.
[7] Nanda MR, Misra M, Mohanty AK (2011) Macromol Mater Eng 296:719-28.

120
[8] Huang P, Zhong Z, Zheng S, Zhu W, Guo Q(1999) J Appl Polym Sci 73:639-47.
[9] Varughese KT, Nando GB, De PP, De SK (1988) J Mater Sci 23:3894-902.
[10] Nesarikar AR, Carr SH, Khait K, Mirabella FM (1997) J Appl Polym Sci 63:1179-87.
[11] Singh D, Malhotra VP, Vats JL (1999) J Appl Polym Sci 71:1959-68.
[12] Tang W, Murthy NS, Mares F, McDonnell ME, Curran SA (1999) J Appl Polym Sci
74:1858-67.
[13] Kotliar AM (1981) Journal of Polymer Science: Macromolecular Reviews 16:367-95.
[14] Jayakannan M, Anilkumar P (2004) J Polym Sci A Polym Chem 42:3996-4008.
[15] Chen HL (1995) Macromolecules 28:2845-51.
[16] Aravind I, Ahn KH, Ranganathaiah C, Thomas S (2009) Ind Eng Chem Res 48:9942-51.
[17] Focarete ML, Scandola M, Dobrzynski P, Kowalczuk M (2002) Macromolecules 35:8472.
[18] Aravind I, Eichhorn KJ, Komber H, Jehnichen D, Zafeiropoulos NE, Ahn KH, Grohens Y,
Stamm M, Thomas S (2009) J Phys Chem B 113:1569-78.
[19] Liu B, Bhaladhare S, Zhan P, Jiang L, Zhang J, Liu L, Hotchkiss AT (2011) Ind Eng
Chem Res 50:13859-65.
[20] Fujimaki T (1998) Polym Degrad Stab 59:209-14.
[21] Soccio M, Lotti N, Gigli M, Finelli L, Gazzano M, Munari A (2012) Polym Int 61:1163-9.
[22] Huang CL, Jiao L, Zhang JJ, Zeng JB, Yang KK, Wang YZ (2012) Polym Chem 3:800-8.
[23] Kim SW, Lim JC, Kim DJ, Seo KH (2004) J Appl Polym Sci 92:3266-74.
[24] Myriant Technologies websites Available at: http://wwwmyriantcom/succinicpagehtm
(Accessed on Febraury 2013).
[25] Yoo ES, Im SS (1999) J Polym Sci B Polym Phys 37:1357-66.
[26] Wang J, Zheng L, Li C, Zhu W, Zhang D, Xiao Y, Guan G (2012) Polym Test 31:39-45.

121
[27] Qiu Z, Ikehara T, Nishi T (2003) Polymer 44:2503-8.
[28] Kim YJ, Park OO (1999) J Polym Environ 7:53-66.
[29] Gu SY, Zhang K, Ren J, Zhan H (2008) Carbohydr Polym 74:79-85.
[30] Gan Z, Abe H, Kurokawa H, Doi Y (2001) Biomacromolecules 2:605-13.
[31] Sykacek E, Hrabalova M, Frech H, Mundigler N (2009) Compos Part A Appl Sci Manuf
40:1272-82.
[32] Javadi A, Kramschuster AJ, Pilla S, Lee J, Gong S, Turng LS (2010) Polym Eng Sci
50:1440-8.
[33] Jiang L, Liu B, Zhang J (2009) Ind Eng Chem Res 48:7594-602.
[34] Jang MO, Kim SB, Nam B-U (2012) Polym Bull 68:287-98.
[35] Javadi A, Srithep Y, Lee J, Pilla S, Clemons C, Gong S, Turng LS (2010) Compos Part A
Appl Sci Manuf 41:982-90.
[36] Qiu Z, Ikehara T, Nishi T (2003) Polymer 44:3095-9.
[37] Li Y, Shimizu H (2009) ACS Appl Mater Interfaces 1:1650-5.
[38] Huang X, Li C, Zheng L, Zhang D, Guan G, Xiao Y (2009) Polym Int 58:893-9.
[39] Kwei TK (1984) J Polym Sci B 22:307-13.
[40] Wang LH, Huang Z, Hong T, Porter RS (1990) J Macromol Sci-Phys B 29:155-169.
[41] Takiyama.E, Fujimaki.T, Seki.S, Hokari.T, Hatano.Y (1994) US Patent No. 5310782.
[42] Takiyama.E, Hatano .Y, Fujimaki.T, Seki.S, Hokari.T, Hosogane.T, Harigai.N (1995) US
Patent No. 5436056.
[43] Mittal V. Functional polymer blends: Synthesis, Properties, and Performance (CRC press,
New York 2012, p.235).
[44] Joseph K, Thomas S, Pavithran C (1996) Polymer 37:5139-49.

122
[45] Dobkowski Z (1986) Rheol Acta 25:195-8.
[46] Carrasco F, Pagès P, Gámez-Pérez J, Santana O-O, Maspoch ML (2010) Polymer Polym
Degrad Stab 95:116-25.
[47] Corre YM, Bruzaud S, Audic JL, Grohens Y (2012) Polym Test 31:226-35.
[48]Siciliano A, Seves A, Maro TD, Cimmino S, Martuscelli E, Silvestre C (1995)
Macromolecules 28:8065-72.
[49] Liu AS, Liau WB, Chiu WY (1998) Macromolecules 31:6593-9.
[50] Richards E, Rizvi R, Chow A, Naguib H (2008) J Polym Environ 16:258-66.
[51] Parulekar Y, Mohanty AK (2007) Macromol Mater Eng 292:1218-28.
[52] Mark JE. Physical Properties of Polymers Handbook (2nd edition, Spring Science, New
York, 2006. p.293).
[53] Jain S, Redy MM, Mohanty AK, Misra M, Ghosh AK (2010) Macromol Mater Eng
295:750-62.
[54] Menard KP. Dynamic Mechanical Analysis: A Practical introduction (2nd edition, CRC
Press, New York 1999, p. 85).
[55] Mohanty S, Nayak SK (2012) J Polym Environ 20:195-207.
[56] Aravind I, Boumod A, Grohens Y, Thomas S (2010) Ind Eng Chem Res 49:3873-82.
[57] Thomas S, Gupta BR, De SK (1987) J Vinyl Technol 9:71-85.
[58] ASTM D 648-07 Standard Test Method for Deflection Temperature of Plastics Under
Flexural Load in Edgewise Position.
[59] Kawamoto N, Saki A, Horikoshi T, Urushihara T, Tobita E (2007) J Appl Polym Sci
103:244-50.
[60] Lu SF, Chen M, Chen CH (2012) J Appl Polym Sci 123:3610-9.

123
[61] Chrissafis K, Paraskevopoulos KM, Bikiaris DN (2005) Thermochim Acta 435:142-50.
[62] Di Y, Iannace S, Maio ED, Nicolais L (2005) Macromol Mater Eng 290:1083-90.
[63] Bhatia A, Gupta, Rahul K., Bhattacharya, S.N. and Choi, H.J (2007) Korea-Aust Rheol J
19:125-131.
[64] Li K, Peng J, Turng LS, Huang HX (2011) Adv Polym Technol 30:150-7.
[65] Wang L, Jing X, Cheng H, Hu X, Yang L, Huang Y (2012) Ind Eng Chem Res 51:10088-
99.
[66] Wang T, Li H, Wang F, Schultz JM, Yan S (2011) Polym Chem 2:1688.
[67] V. I. Pavlov, Soviet materials science : a transl of Fiziko-khimicheskaya mekhanika
materialov / Academy of Sciences of the Ukrainian SSR, 1971, 4 (5): 438-440.

124
Chapter 4: Preparation and Characterization of Maleic Anhydride Grafted Biodegradable
Polyesters
Abstract
Maleic anhydride (MAH) grafting was quantified onto poly(butylene adipate-co-
terephthalate) (PBAT), poly(butylene succinate) (PBS), and their blend in the presence of free
radical initiator (dicumyl peroxide, DCP) by reactive melt processing in an internal batch mixer.
Fourier transform infrared (FTIR) spectroscopy confirmed the successful grafting of MAH on
the polyesters backbone. The dependence of grafting yield on initiator and MAH concentration
was calculated by back-titration. Compared to the MAH grafted PBS, the MAH grafted PBAT
and MAH grafted PBS/PBAT blend had slightly lower grafting yield over the entire range of
DCP concentrations. This difference in grafting yield could be due to the structural difference
and proton abstraction capability of the polymer backbone. Then, MAH grafting efficiency of
batch and continuous process was compared. The result shows that the batch processed samples
had slightly higher grafting yield than continuous processed samples. The slightly higher grafting
yield as observed in the internal batch process may be attributed to higher residence time and air
contact of the reaction medium. The crystallization and melting temperatures of the MAH
grafted samples were significantly decreased compared to their counterparts. This is possibly due
to the MAH group preventing the lamella growth and nucleation of MAH grafted samples, thus
leading to the formation of imperfect crystal structure compared to the virgin polymer. The onset
temperatures for thermal degradation of the MAH grafted samples were reduced compared to
neat polymers while their maximum and final decomposition temperature remained unchanged.

125
4.1 Introduction
Recently, biodegradable polymeric materials have gained great interest because of certain
environmental concerns in using non-biodegradable polymers. In order to reduce the problems
regarding the non-biodegradable polymer disposal in the environment, some of the
biodegradable polymers have been commercialized. However, many biodegradable polymers are
expensive compared to the commonly used polymers. Therefore, the use of biodegradable
polymers as a matrix for producing biocomposites will result in products with higher costs.
Increase in the cost of biocomposites could be mitigated by adding low-cost natural fillers/fibers
to make them cost competitive with traditional non-biodegradable composites.
Nevertheless, there are some technological challenges in successfully developing a
natural fiber/bioplastic composite. The hydrophilic character of the natural fibers/fillers hinders
its compatibility with the hydrophobic polymer matrix due to its lack of interfacial adhesion. The
incompatibility between the reinforcement and polymer leads to weak stress transfer from one
phase to another phase. This weak stress transfer causes inferior mechanical properties of the
resulting composites. Furthermore, very often polymer blends and composites are
thermodynamically immiscible. In most cases, immiscibility of the components of the
composites and blends is due to solubility parameter difference. Often such blends and
composites are not able to target specific applications. The immiscibility and poor compatibility
of the composites and blends can be overcome through a compatibilizer. A compatibilizer helps
to improve the better stress transfer between the components through interfacial adhesion,
uniform dispersed phase and reduced surface tension between the two phases [1].
Generally, the compatibilization of blends/composites can be performed in two ways i.e.,
non-reactive compatibilization and reactive compatibilization. Usually block copolymers are

126
used as a non-reactive compatibilizer because one constitutive block is miscible with one blend
component while the second block is miscible with the other component. This type of
compatibilizers is not economically viable for industrial applications and it is not used
extensively as a compatibilizer [2]. A reactive compatibilizer is a good choice for producing
compatibilized composites/blends. The reactive compatibilization involves forming the block or
graft copolymer in-situ during blend preparation via interfacial reaction of added functionalized
polymeric components. The maleic anhydride (MAH) grafted polymer is a well-known reactive
compatibilizer. For example, maleated polypropylene is extensively studied as a compatibilizer
in polypropylene based blends [3] as well as composites [4].
The polymer grafting reaction has a predominant role in preparing reactive compatibilizer
because it can introduce new reactive functional groups on the polymer backbone. The grafting
can be performed in different ways such as melt state, solution state, solid state, irradiation,
suspension in aqueous/organic solvents [5, 6] and ball milling [7]. Among them, melt state
reactive extrusion is a very common and economical way to create the grafted polymers. A
variety of functional monomers has been used as grafting agent on the polymer backbones [8-
10]. MAH is a very common functional monomer for grafting because of its unique free radical
reactive double bonds, reactive anhydride groups, and poor homopolymerization tendency during
free radical graft polymerization [11]. The poor homopolymerization of MAH enhances the
grafting efficiency of the resulting grafted polymers. In addition, MAH functional groups have
high reactivity with specific functional groups such as carboxyl, amine, and hydroxyl [12]. The
MAH grafting onto molten polypropylene (PP) [13], polyethylene (PE) [14], and ethylene-
propylene-diene (EPDM) terpolymer [15] has been investigated in the literature. In addition, the
MAH grafted polyolefins are commercially available in the market and act as a good

127
compatibilizer for PP and PE based blends/composites [16, 17]. Thus, MAH reactive functional
group on the polymer backbone significantly reduces the dispersed domain size and surface
tension, and increases the interfacial adhesion in the composites/blends.
Recently, this research has expanded to the biodegradable/biocompostable polymers like
polylactide (PLA) [18], poly(hydroxybutyrate-co-valerate) (PHBV) [19], poly(butylene adipate-
co-terephthalate) (PBAT) [20], poly(butylene succinate) (PBS) [21], and polycaprolactone (PCL)
[22]. MAH grafted copolymers have been show to be a good compatibility enhancer in the
biodegradable polymer based blends [23] and composites [24]. Research findings confirmed that
a small quantity of maleated compatibilizer increased the compatibility between two
thermodynamically immiscible materials. Few researchers have done detailed research on maleic
anhydride grafting onto PLA backbone by melt process [25, 26]. The use of MAH grafted PLA
as a compatibilizer has been studied while investigating the performance of composites materials
[18, 27, 28]. This literature has clearly shown that the compatibility was improved between the
matrices, and reinforcement through MA grafted PLA meanwhile improved their mechanical
performances. Similar observations were found in some other biodegradable polymer composites
with MAH grafted compatibilizers [29-31]. Many researchers have performed maleation of
biodegradable and non-biodegradable polymers but none of the literature was reported maleation
of PBS/PBAT blend.
This study synthesized and characterized MAH grafted biodegradable polymers. The
MAH grafted PBS, PBAT and PBS/PBAT blend were synthesized by varying initiator
concentration from 0.5 to 1 phr while keeping MAH concentration constant at 5 phr. The
grafting percentage was determined by back-titration method. In addition, the maleated samples

128
were characterized by thermal analysis, and FTIR spectroscopy. In addition, melt viscosity and
elasticity of the MAH grafted samples was studied by rheological analysis.
4.2 Materials and Methods
Commercially available PBAT (Biocosafe 2003) and PBS (Biocosafe 1903) pellets were
procured from Xinfu Pharmaceutical Co., Ltd, China. PBS, PBAT and their blend (60/40 wt%)
were processed by micro compounder (DSM Xplore®, The Netherland) using 140
oC processing
temperature. General properties of the virgin PBS, PBAT and blend of PBS/PBAT (60/40 wt%)
were measured and are reported in Table 4.1. Organic free radical initiator, dicumyl peroxide
(DCP-99% purity) was purchased from Acros Organics with half-life time about 9.2 s at 150°C
and maleic anhydride (MAH) was obtained from Sigma-Aldrich, USA. All the materilas were
used as received.
Table 4. 1. Properties of the neat PBS, PBAT and PBS/PBAT blend
Polymers Densitya
(g/cm3)
Melting
Pointb (
oC)
Glass Transition
Temperatureb (
oC)
Melt Flow Indexc
(g/10 min)
PBAT 1.26 115 -34 9.4±1.8
PBS 1.26 114 -31 25.3±2.4
PBS/PBAT (60/40 wt%) 1.26 114 -35 33.3±2.8
a: Measured by Archimedes method, b: Measured by DSC with heating rate 10 oC/min, c: 190
oC
with 2.16 kg
4.2.1 Synthesis of MAH grafted PBS, PBAT and their blend
Before processing the polymer pellets were dried at 80oC for 12 h. Based on our previous
research results, PBS/PBAT (60/40 wt%) blend was chosen as an optimum blend for further
study [33]. Hereafter, PBS/PBAT (60/40 wt%) blend will be referred to as PBS/PBAT blend.
Maleation of PBS (MAH-g-PBS), PBAT (MAH-g-PBAT) and PBS/PBAT blend (MAH-g-
PBS/PBAT) were prepared by varying the initiator concentration. The MAH-g-PBS, MAH-g-

129
PBAT, and MAH-g-PBS/PBAT samples were prepared in a laboratory-scale internal batch mixer
(Torque Rheometer, Haake PolyLab QC, Thermo scientific). The formulations are shown in
Table 4.2. The batch mixer barrel was divided into three heating zones. The temperatures of
these three heating zones were kept constant at 160oC with a screw speed of 60 rpm and reaction
time of 6 min for synthesizing all the samples. Reaction time of 6 min was divided into three
steps. In the first step, polymers were melted at 160oC for 2 min and in the second step a free
radical initiator was introduced into the molten polymers to make reactive sites for 2 min.
Finally, MAH was added into the reaction medium and reaction was carried out for another 2
min to obtain desired amount of grafting content onto polymers. It’s known that
homopolymerization of MAH is difficult with molten polymers because of the 1,2-disubstituted
double bond present in the MAH. In order to diminish the homopolymerization of the MAH in
the reaction medium, the reaction was carried out above the ceiling temperature (150oC). During
the reaction, the reaction mixture torque was monitored over time showing a significant
increment. The increased torque was likely due to grafting and gel formation occurred after
addition of MAH and DCP into polymers. The MAH grafted samples were taken out and ground
into small pieces for further analysis.
In addition, the MAH grafting of PBS/PBAT was performed in a continuous process
using a Leistritz extruder Micro 27, USA. The extruder had three kneading disc block regions
and self-wiping co-rotating twin screws. The extruder was consisting of 11 heating zones with
electric heating and a water cooling system. Appropriate amount of monomer, initiator and
polymers were manually premixed and fed into the hopper with a feed rate of 5 kg/h. In order to
compare batch process with continuous process, the continuous process was performed with
similar batch processing parameters such as processing temperature and screw speed. In

130
continuous process, 11 heating zones were set at a constant temperature of 160oC and screw
speed of 60 rpm. The MAH grafted molten materials were pumped through the extruder die,
quenched and pelletized.
Table 4.2. Proposed formulation for producing maleation of PBS, PBAT, and PBS/PBAT blend
Samples DCP (phr) MAH (phr)
MAH-g-PBS 0.5 5
MAH-g-PBS 0.7 5
MAH-g-PBS 1.0 5
MAH-g-PBAT 0.5 5
MAH-g-PBAT 0.7 5
MAH-g-PBAT 1.0 5
MAH-g-PBS/PBAT blend 0.5 5
MAH-g-PBS/PBAT blend 0.7 5
MAH-g-PBS/PBAT blend 1.0 5
4.2.2 Grafting mechanism
Melt state free radical grafting mechanism is a widely accepted method in academia and
industry. In the presence of peroxide free radical initiator, the possible MAH grafting reaction of
PBS and PBAT is shown in Figure 4.1 and 4.2 [20, 34]. Basically, the free radical mechanism
occurs in three steps of initiation, propagation and termination. The initiation step is well
established, which is the homolytic rupture of the initiator and produces free radicals at higher
temperature (peroxide decomposition temperature). Then the second step, propagation, is to form
macroradicals through abstraction of hydrogen atoms from the polymer α-carbon atom.

131
Figure 4.1. Proposed reaction mechanism of MAH grafted PBS (MAH-g-PBS) [34]

132
Figure 4.2. Proposed reaction mechanism of MAH grafted PBAT (MAH-g-PBAT) [20]

133
Once the radicals are formed, they can directly react with MAH onto the polymer
backbone. Finally, grafting process is terminated by recombination of radicals. This termination
reaction leads to the formation of succinic type anhydride structure on the polymer chains that
further undergo β-scission reaction on the grafted copolymers (Figure 4.1 and 4.2). There are
other possibility to form chain scission reaction either through backbiting or thermo hydrolysis
reactions [26]. Thermodynamically, when the maleation reaction takes place above ceiling
temperature, the homopolymerization of MAH (poly-MAH) grafting will not occur on the
polymer backbone [35]. In addition, if the grafting reaction takes place above ceiling temperature
the formed homopolymers (poly-MAH) decompose, unlike other functional monomers [36].
4.2.3 Purification of MAH grafted samples
The purification of the MAH grafted samples was performed according to a modified
procedure [20]. The unreacted MAH was removed by vacuum drying at 80oC for 24 h. Vacuum
dried MAH grafted sample was dissolved in chloroform at room temperature overnight. After
dissolution of MAH grafted sample, they were selectively precipitated in methanol and filtered.
The filtered sample was repeatedly washed with excess methanol to remove residual MAH and
DCP, followed by drying at 80oC under vacuum for 24 h. These dried samples were used for
further analysis.
4.2.4 Determination of grafting percentage
The MAH grafting percentage was determined by back-titration, which was modified
from Nabar et al., [20]. The purified MAH grafted sample was dissolved in 100 ml of
chloroform at ambient temperature for 2 h. Subsequently, the MAH groups were hydrolyzed into
carboxylic acid by adding a few drops of 1 N hydrochloric acid. Immediately, the solutions were
titrated against 0.025 N alcoholic KOH in the presence of few drops of phenolphthalein

134
indicator. Under this condition, maleated samples were completely soluble in chloroform and did
not precipitate during titration against alcoholic KOH. The grafting percentage was calculated as
follows:
Grafting Percentage (%) =
x98.06x100 (4.1)
where is the weight (g) of the maleated sample, is the volume of the KOH in liters,
is the normality of KOH dissolved in methanol, and MAH molecular weight is 98.06
(g/mol).
4.2.5 Gel percentage measurement
Soxhlet extraction was used to measure the gel percentage of the samples. Both grafted
and ungrafted PBS, PBAT and their blend are completely soluble in chloroform but cross-linked
PBS, PBAT, and blend of PBS/PBAT were found to be insoluble in chloroform. Based on the
PBS, PBAT and their blend solubility, the extraction was perfromed by refluxing chloroform for
24 h. After 24 h extraction, the obtained insoluble fractions on the filter paper were dried at 60oC
for 12 h to remove the residual chloroform. The dried filter papers were weighed, and gel (cross-
linked) content was calculated as follow:
Gel percentage =
X100 (4.2)
where Wi and Wf are the initial weight of sample in the filter paper and the final weight of
sample left in the filter paper after extraction, respectively. The gel content measurement was
repeated at least three times.

135
4.2.6 Fourier transform infrared (FTIR) spectroscopy
Structural differences between the samples were evaluated by FTIR spectroscopy
(Nicolet 6700-Thermo scientific) at room temperature with 36 consecutive scans. The analysis
was performed by measuring transmittance versus wavenumbers in the range of 4000-400 cm-1
at a resolution of 4 cm−1
.
4.2.7 Thermogravimetric analysis (TGA)
Thermal stability of the ungrafted and MAH grafted PBS, PBAT and their blend was
measured using a TA Q500 Instruments. The experiment was performed in the N2 atmosphere at
a flow rate of 60 mL min-1
with a heating rate of 20 oC/min.
4.2.8 Differential scanning calorimetry (DSC)
The melting temperature (Tm), crystallization temperature (Tc) and crystallization
enthalpy (∆Hc) of MAH grafted and ungrafted samples were analysised by TA Q200 DSC
Instruments. Accurately weighed samples were encapsulated into the aluminum pan and placed
into the DSC machine. The samples were heated in the presence of N2 atmosphere with a flow
rate of 50 mL min-1
. The reported melting temperature and crystallization temperature were
collected from the second heating and first cooling scans, respectively.
4.3 Results and Discussion
4.3.1 Infrared spectroscopy
The PBS, PBAT, PBS/PBAT blend and their respective MAH grafted samples were
analyzed trough FTIR spectroscopy (Figures 4.3-4.5). The FTIR spectra of MAH, PBS and
maleated PBS samples are shown in Figure 4.3. The broad and medium intensity peak at 955 cm-
1 is attributed to –C–OH bending of carboxylic groups in PBS. The stretching vibration of ester
carbonyl (>C=O) group was observed at 1718 cm-1
. Most of the saturated hydrocarbons contain

136
methyl groups. These methyl groups show a symmetric stretching band at 2962 cm-1
and an
asymmetric stretching band at 2872 cm-1
. In PBS, methyl and methylene C-H stretching bands
occur at 2945 and 2854 cm-1
, respectively. Two new small peaks (1859 and 1788 cm-1
) were
formed in MAH grafted PBS, which corresponds to the saturated cyclic anhydride carbonyl ring
(succinic anhydride group) [37, 38]. These characteristic peaks confirm that the MAH moieties
were successfully grafted on to the PBS backbone. The characteristic functional group of alkyl
ether is C-O-C. A strong symmetric C-O-C stretching peak can be seen at 1151 cm-1
in PBS,
which confirms that the PBS contains an alkyl ether group. In Figure 4.3, observed peaks at 955,
806, and 654 cm-1
were attributed to C-O stretching, CH2 in OC(CH2)2CO in-plane bending, and
–COO bending bands of the PBS and MAH grafted PBS. These peaks are clear evidence to
differentiate PBS from other polymers.
Figure 4.3. FTIR spectra of MAH, neat PBS and MAH-g-PBS with 1 phr DCP and 5 phr MAH
FTIR spectra of MAH, PBAT and maleated PBAT samples are presented in Figure 4.4.
The neat PBAT had peaks at 2951, 2864, 1716, 1463, 1402, 1259, 1157, 1111, 729 and 875 cm-1
.
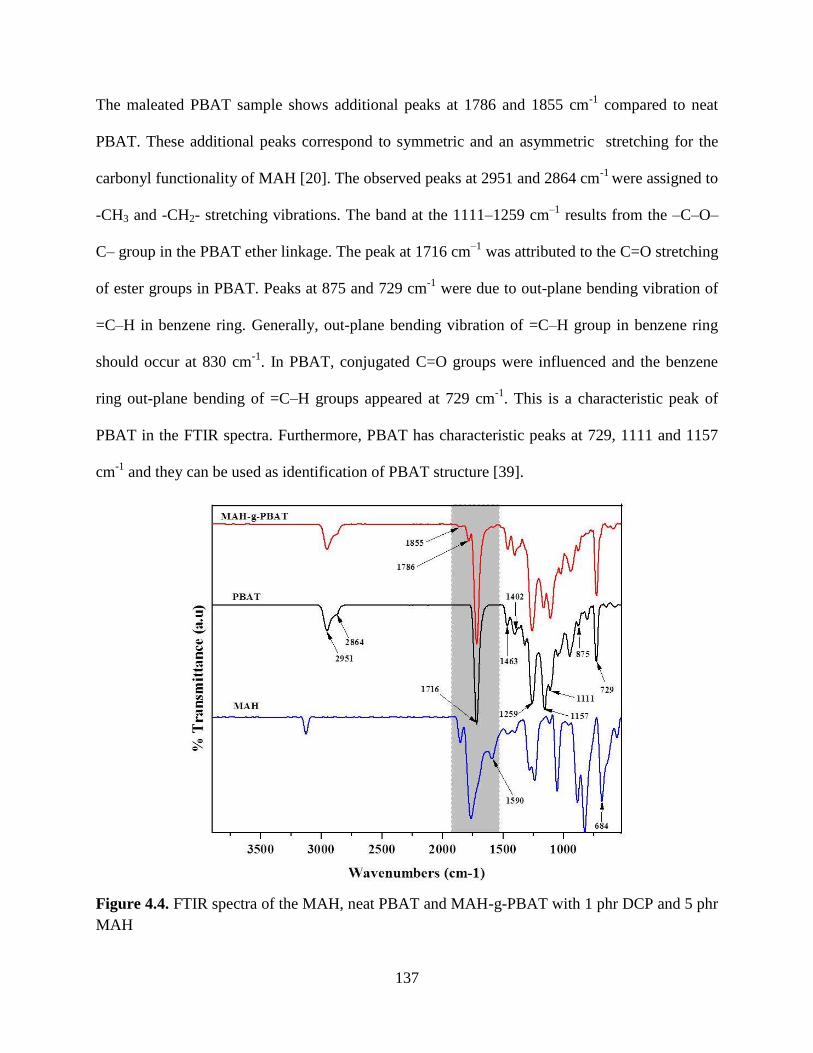
137
The maleated PBAT sample shows additional peaks at 1786 and 1855 cm-1
compared to neat
PBAT. These additional peaks correspond to symmetric and an asymmetric stretching for the
carbonyl functionality of MAH [20]. The observed peaks at 2951 and 2864 cm-1
were assigned to
-CH3 and -CH2- stretching vibrations. The band at the 1111–1259 cm–1
results from the –C–O–
C– group in the PBAT ether linkage. The peak at 1716 cm–1
was attributed to the C=O stretching
of ester groups in PBAT. Peaks at 875 and 729 cm-1
were due to out-plane bending vibration of
=C–H in benzene ring. Generally, out-plane bending vibration of =C–H group in benzene ring
should occur at 830 cm-1
. In PBAT, conjugated C=O groups were influenced and the benzene
ring out-plane bending of =C–H groups appeared at 729 cm-1
. This is a characteristic peak of
PBAT in the FTIR spectra. Furthermore, PBAT has characteristic peaks at 729, 1111 and 1157
cm-1
and they can be used as identification of PBAT structure [39].
Figure 4.4. FTIR spectra of the MAH, neat PBAT and MAH-g-PBAT with 1 phr DCP and 5 phr
MAH

138
FTIR spectra of MAH, PBS/PBAT blend and MAH grafted PBS/PBAT blend were
scanned separately and are shown in Figure 4.5. Peaks at 2956 and 2860 cm-1
were assigned to -
CH2- and -CH3 stretching vibration in the PBS/PBAT blend. More specifically, the peak at 1716
cm-1
was due to the C=O stretching vibration in the ester groups. The bands at 1259 and 1157
cm-1
attributed to the stretching vibration of ether groups in the PBAT and PBS, respectively.
The out plane and in plane bending vibration of terephthalic acid (benzene =C-H) unit in the
PBAT was observed peaks at 731 and 1036 cm-1
. The succinic acid -COO bending mode peak
appeared at 648 cm-1
and the succinic acid -CH2- group peak was observed at 806 cm-1
.
However, MAH grafted PBS/PBAT blend exhibited two distinguish peaks at 1857 and 1782 cm-
1, which were assigned to symmetric and asymmetric stretching of C=O groups in the grafted
MAH functionality [5]. This literature suggests that the FTIR absorption peak near 1850 cm-1
(symmetric stretching) and a peak near 1780 cm-1
(asymmetric stretching) are due to vibration
of anhydride. As a result, our FTIR spectra confirmed that the MAH groups are grafted on the
PBS/PBAT polyester backbone.
The characteristic peaks of MAH-g-PBS/PBAT (1857 cm-1
) were between that of MAH-
g-PBS (1859 cm-1
) and MAH-g-PBAT (1855 cm-1
). This suggests that the MAH was
successfully grafted on both the PBS and PBAT backbone in the PBS/PBAT blend. A similar
trend was observed by Li et al., [40] in the MAH grafted polyolefin (PE/PP) blend. In addition,
elimination of unreacted MAH in the grafted samples can be confirmed by disappearance of the
MAH C=C characteristic peak at 684 cm-1
in the FTIR spectra [13]. The FTIR peak at 1590 cm-1
belongs to the MAH C=C stretching. This cyclic C=C peak was not found in the MAH grafted
PBS, PBAT or PBS/PBAT blend, which suggests that the unreacted MAH was not present in the
MAH grafted samples.

139
Figure 4.5. FTIR spectra of MAH, neat PBS/PBAT blend and MAH-g- PBS/PBAT blend with 1
phr DCP and 5 phr MAH
4.3.2 MAH grafting percentage calculation
The MAH grafting percentage can be controlled by many parameters including reaction
temperature, rotor speed, resistance time, and monomer to initiator ratio [5, 22]. In this literature,
initiator concentration was changed upto 1% while MAH concentration, screw speed, and
processing temperature were kept constant. The main reason for keeping MAH content constant
was based on literature suggesting a higher influence on the grafting efficiency of the
concentration of initiator (DCP) than concentration of MAH [5]. Mani et al., [5] studied the
MAH grafting of PBS, poly(butylene succinate adipate) (PBSA), PLA, and Eastar co-polyester
with various initiator and MAH concentrations at different temperatures. They found that there is
more possibility to form cross-linking when the initiator concentration higher than 1%.
Therefore, in the current study, initiator concentration was kept below 1 phr for all the

140
experiments. Moreover, the MAH grafting reaction was conducted at only one temperature (160
oC) because previous researchers have reported that the temperature does not have a significant
influence on the MAH grafting efficiency of polyesters backbone [20, 26].
The MAH grafting was performed in a twin-screw extruder as well as through an internal
batch mixer. The MAH grafting percentage of the internal batch processed samples is shown in
Table 4.3. The grafting yields of the MAH-g-PBS, MAH-g-PBAT and MAH-g-PBS/PBAT
blend were gradually increased with increasing DCP concentration from 0.5 to 1 phr. However,
the MAH-g-PBS in the presence of 0.7 and 1 phr DCP initiator had a grafting yield of 2.45 and
2.56%, respectively. This observed small difference in the grafting yield may be due to the faster
termination reaction of free radicals at higher free radical concentrations in the reaction medium
[40].
Table 4.3. MAH grafting percentage of the PBS, PBAT and PBS/PBAT blend
Samples DCP (phr) MAH (phr) Grafting Percentage (%)
MAH-g-PBS 0.5 5 1.6
MAH-g-PBS 0.7 5 2.45
MAH-g-PBS 1.0 5 2.56
MAH-g-PBAT 0.5 5 1.34
MAH-g-PBAT 0.7 5 1.56
MAH-g-PBAT 1.0 5 1.90
MAH-g-PBS/PBAT blend 0.5 5 1.16
MAH-g-PBS/PBAT blend 0.7 5 1.40
MAH-g-PBS/PBAT blend 1.0 5 2.05

141
The MAH grafting onto the PBAT was performed in the presence of 0.5 phr DCP and 5
phr MAH, and the grafting yield observed was 1.34%. In a previous study, Chen and Zhang [29]
performed the MAH grafting onto PBAT with initiator and MAH concentrations of 0.5 and 5
phr, respectively. They also found that the MAH grafting yield was 1.34%.This result suggested
that the grafting yield variation in the PBS and PBAT found in the current study is reasonable.
When comparing grafting efficiency of PBS and PBAT with 1 phr DCP and 5 phr MAH, PBS
showed higher MAH grafting yield than PBAT (Table 4.3). This observed difference in MAH
grafting yield could be due to the structural difference and proton abstraction capability of the
polymer backbone. The same trend was observed in MAH grafted PBS/PBAT blends. In PBAT,
the observed lower MAH grafting yield compared to PBS may be attributed to a lower number of
free radical formations on its backbone than the PBS backbone. This lower number of radicals
leads to lower grafting efficiency [5]. In addition, the grafting yield difference may be due to the
viscosity difference between the polymers. The comparatively lower viscosity of PBS compared
to PBAT might allow the MAH to better disperse in the reaction medium and it can enhance
their grafting yield. This phenomenon may be limited in the high viscosity PBAT. An optimal
concentration of initiator and monomer are required to achieve a better grafting efficiency. The
present study shows that the optimal concentration of initiator and grafting monomer were 1 and
5 phr, respectively.
There is literature available for comparison of MAH-g-PBS and MAH-g-PBAT in an
internal mixer and continuous mixer [20, 21, 29, 30, 34, 41]. There is no literature available for
comparison of MAH-g-PBS/PBAT blend in both internal mixer and continuous mixer.
Therefore, in the present study investigated that MAH-g-PBS/PBAT blend in batch as well as in
continoues process. In both these processes, 1 phr DCP and 5 phr MAH were used to graft MAH

142
onto PBS/PBAT blend. The batch process and continuous process grafting yields were 2.05 and
1.65%, respectively. The grafting efficiency was significantly lower in continuous processed
MAH-g-PBS/PBAT blend compared to in batch process. This significantly lower grafting yield
in continuous process may be due to lower residence time compared to batch process. Generally,
the total residence time in a twin-screw extruder is lower when compared to batch mixture [42].
The slightly higher grafting yield as observed in internal batch process may be attributed to
higher residence time and air contact of the reaction medium [37]. Similarly, the internal batch
process had higher grafting efficiency than intermeshing co-rotating twin-screw extrusion
process [43]. Moreover, the grafting yields for MAH-g-PBS, MAH-g-PBAT and MAH-g-
PBS/PBAT blends were higher than that the commercially available MAH-g-PP (grafting yield
between 0.5–1.2%) [4]. Therefore, we believe that MAH grafted PBAT, PBS, and their blend
samples might act as an effective compatibilizer in their composites.
4.3.3 Gel content measurement
Generally, in the presence of DCP initiator, PBAT and PBS can form complex reactions
such as copolymers of PBAT and PBS (e.g. PBAT-g-PBS) as well as cross-linked/branched
PBAT and PBS [44]. The gel formation (cross-linking) was investigated by a solvent extraction
method and the results are shown in Figure 4.6. The gel content of the MAH grafted PBAT, PBS
and their blend steadily increased with increasing DCP content. This is reasonable because
increasing DCP content increases the free radical formation. Consequently, the formed excess
radicals can easily react with each other and leads to a cross-linking reaction. It was observed
that the PBS had more gel content than PBS/PBAT blend and PBAT in three different
concentrations of DCP content with the same MAH content (5 phr). The gel formation may be
reduced by increasing MAH concentration in the reaction medium. Increasing MAH content in

143
the reaction medium can react with excess free radicals on the polymer backbone. This may
increase the grafting percentage while reducing the gel formation. Ma et al., [44] examined
cross-linking behavior of PBS, poly(hydroxybutyrate-co-valerate) (PHBV), and PBS/PHBV
blend using DCP and they found that PBS forms more cross-linking than PHBV and PBS/PHBV
blend. A similar type of cross-linking reaction was observed in MAH grafting on PLA in the
presence of DCP [25, 45]. They found that the cross-linking of the PLA increases with
increasing DCP content.
Figure 4.6. Gel content of MAH grafted PBS, PBAT, and PBS/PBAT samples with 5 phr MAH
and different concentration of DCP
A study [46] reported that the gel formation could be controlled by adding styrene as a
co-monomer in the free radical initiated MAH grafting reaction. This co-monomer not only
reduces the gel formation in the reaction but also accelerates the grafting yield and grafting
reaction rate in the melt state. Nevertheless, using styrene as a co-monomer is not recommended
for certain applications. Therefore, it needs to be replaced by some other co-monomers [47]. A

144
few researchers have tried to prevent the gel formation during MAH grafting of polyolefin by
using electron donor additives [48]. Although, they found a gel-free MAH grafted polyolefin
product, the grafting yield was reduced.
4.3.4 Thermogravimetric analysis
Figure 4.7 shows the thermogravimetric result of neat and maleated PBS, PBAT and their
blends with respect to the temperature. Thermal stability of PBAT was higher than PBS and
PBS/PBAT blend. The onset degradation temperatures of the samples were detected from the
deviation of the baseline thermogravimetric curve by tangent plots. MAH grafted PBS, PBAT,
and blend of PBS/PBAT showed lower onset thermal degradation compared to neat PBS, PBAT
and PBS/PBAT. This onset of thermal degradation reduction may be attributed to the polymer
chain scission occurs during maleation reaction. Similar thermal stability reduction was found in
maleated PLA with peroxide initiators [25, 26]. However, maximum and final degradation
temperatures were not heavily affected in the current study.
Figure 4.7. TGA thermograms of neat and maleated PBS, PBAT and PBS/PBAT blend (the
maleated samples were obtained with 1 phr DCP and 5 phr MAH)

145
4.3.5 Differential scanning calorimetry
In polymer processing, non-isothermal DSC analysis is more practical interest than
isothermal DSC analysis. The heating and cooling non-isothermal DSC thermograms of the neat
and maleated samples are shown in Figures 4.8 and 4.9. Table 4.4 shows the Tc, ∆Hc, and Tm of
neat and maleated PBS and PBS/PBAT blend, and the reported values are obtained from second
heating and first cooling cycles. Both PBS and PBS/PBAT blends had almost the same melting
points because both PBS and PBAT melting points are very close to each other. Therefore, the
melting peaks may be overlapping. John et al., [49] also observed a similar phenomenon in
PBS/aliphatic–aromatic copolyester blend. The major melting points of virgin PBS, PBAT and
blend of PBS/PBAT are 114, 115 and 114oC, respectively.
Figure 4.8. DSC second heating curves of neat PBS, PBS/PBAT (60/40 wt%) and their maleated
samples with 1 phr DCP and 5 phr MAH.

146
Figure 4.9. DSC first cooling curves of neat PBS, PBS/PBAT (60/40 wt%) and their maleated
samples with 1phr DCP and 5 phr MAH
Interestingly, the PBS and blend of PBS/PBAT showed two distinct endothermic peaks at
108 (Tm1) and 114oC (Tm2), which may be attributed to two different lamellar thicknesses
presented in the PBS and PBS/PBAT blend. Usually double melting peaks are observed for
semicrystalline polymers and they can be explained by a melt re-crystallization mechanism [50].
These two melting points had a significantly lower temperature shift after MAH grafting on both
PBS and PBS/PBAT blend. This is possibly due to the fact that the MAH group may prevent the
lamella growth and nucleation of MAH grafted samples, thus leading to imperfect crystal
structure compared to their parent polymers [51]. However, all the MAH grafted samples had a
sharp melting point and a weak shoulder melting point. The weak shoulder melting peak and
sharp melting peak are attributed to lamella with more imperfect crystals and lamella with
perfect crystals, respectively. In addition, after MAH grafting, the PBS and blend of PBS/PBAT
showed one additional exothermic peak prior to melting points. This additional exothermic peak

147
resulted from recrystallization of PBS during heating [21]. The crystallization temperatures of
PBS/PBAT and PBS blend were considerably affected with the addition of MAH group on the
polyester backbone. An obvious crystallization temperature reduction was observed in PBS and
PBS/PBAT blend from 93 to 63oC and from 94 to 55
oC, respectively. The significant reduction
in crystallization temperature was attributed to the decrease in polymer chain regularity which
hinders crystal growth, leading to lower crystallization temperatures [25]. The crystallization
enthalpies (Table 4.4) of fusion for MAH-g-PBS and MAH-g-PBS/PBAT blend were found to
be 65 and 35 J/g, respectively. Both MAH-g-PBS and MAH-g-PBS/PBAT blend crystallization
enthalpies were lower than those of ungrafted PBS and PBS/PBAT blend. An apparent decrease
in crystallization enthalpy of MAH grafted samples was due to the reduction of polymer chain
regularity. A similar result for solid state MAH grafting onto PP was reported [52].
Table 4.4. Detailed DSC results of the maleated PBS and PBS/PBAT blend (MAH grafted
samples were prepared with 1 phr DCP and 5 phr MAH)
Samples Tm1 (oC) Tm2 (
oC) Tc (
oC) ∆Hc(J/g)
PBS 108 114 93 67
MAH-g-PBS 98 109 63 65
PBS/PBAT blend 108 114 94 39
MAH-g-PBS/PBAT blend 98 110 55 35
4.4 Conclusions
The radical grafting reaction of MAH onto the PBAT, PBS, and blend of PBS/PBAT was
investigated succefully. The characteristic peaks of MAH in the MAH grafted PBAT, PBS and
blend of PBS/PBAT were observed by FTIR spectroscopy. The characteristic peaks of MAH-g-
PBS/PBAT blend were located between that of MAH-g-PBS and MAH-g-PBAT. This revealed

148
that MAH was successfully grafted on both PBS and PBAT backbone in the MAH-g-PBS/PBAT
blend. The maximum MAH grafting yield was reached at MAH (5 phr) and DCP (1phr)
concentration in PBS, PBAT and PBS/PBAT blend. However, a higher grafting yield on the PBS
backbone was observed (2.56%) compared to MAH grafted PBAT (1.90%) and PBS/PBAT
blend (2.05%). The MAH grafting yield was compared in the batch and continuous process. The
batch processed sample had a slightly higher yield than the continuous processed sample. The
slightly higher grafting yield as observed in internal batch process may be attributed to higher
residence time. It was also observed that both grafting reaction and cross-linking can occur
during MAH grafting in the presence of DCP initiator. The crystallization temperature was
significantly reduced after MAH grafting on the polymer backbone. This crystallization
temperature reduction is attributed to chain branching that occurred on the polymer backbones.
Thermal stability of all the maleated samples (MAH-g-PBS, MAH-g-PBAT and MAH-g-
PBS/PBAT blend) were found to be reduced compared to their counterparts. This reduction can
be correlated with molecular chain scission that occurred in the maleated samples. These MAH
grafted polymers are expected to be a good adhesion promoter for natural fiber reinforced
composites.
References
1. J.W. Barlow, D.R. Paul, Mechanical compatibilization of immiscible blends. Polym. Eng.
Sci., 1984. 24(8): p. 525-534.
2. D.R. Paul, C.B. Bucknall, Polymer blends: formulation and performance. New york,
Wiley: 2000.

149
3. J. Roeder, R.V.B. Oliveira, M.C. Gonçalves, V. Soldi, A.T.N. Pires.,
Polypropylene/polyamide-6 blends: influence of compatibilizing agent on interface
domains. Polym Test, 2002. 21(7): p. 815-821.
4. H.S. Kim, B.H. Lee, S.W. Choi, S. Kim, H.J. Kim, The effect of types of maleic
anhydride-grafted polypropylene (MAPP) on the interfacial adhesion properties of bio-
flour-filled polypropylene composites. Composites Part A., 2007. 38(6): p. 1473-1482.
5. R. Mani, M. Bhattacharya, J. Tang, Functionalization of polyesters with maleic anhydride
by reactive extrusion. J. Polym. Sci. Part A: Polym. Chem., 1999. 37(11): p. 1693-1702.
6. E. Cataría, C. Albano, A. Karam, R. Perera, P. Silva, J. González, Grafting of a LLDPE
using gamma irradiation. Nucl. Instrum. Meth B., 2005. 236(1–4): p. 338-342.
7. W. Qiu, T. Endo, T. Hirotsu, A novel technique for preparing of maleic anhydride
grafted polyolefins. Eur. Polym. J., 2005. 41(9): p. 1979-1984.
8. M. Xanthos, M.W. Young, J.A. Biesenberger, Polypropylene/polyethylene terephthalate
blends compatibilized through functionalization. Polym. Eng. Sci., 1990. 30(6): p. 355-
365.
9. M. Hert, Tough thermoplastic polyesters by reactive extrusion with epoxy-containing
copolymers. Angew Makromol Chem., 1992. 196(1): p. 89-99.
10. S. Cartasegna, Silane-Grafted/Moisture-Curable Ethylene-Propylene Elastomers for the
Cable Industry. Rubber. Chem.Technol., 1986. 59(5): p. 722-739.
11. M.R. Thompson, C. Tzoganakis, G.L. Rempel, Terminal functionalization of
polypropylene via the Alder Ene reaction. Polymer, 1998. 39(2): p. 327-334.

150
12. S.J. Kim, S.J. Kima, B.S. Shina, J.L. Honga, W.J. Chob, C.S. Hab, Reactive
compatibilization of the PBT/EVA blend by maleic anhydride. Polymer, 2001. 42(9): p.
4073-4080.
13. B. De Roover, M. Sclavons, V. Carlier, J. Devaux, R. Legras, A. Momtaz, Molecular
characterization of maleic anhydride-functionalized polypropylene. J. Polym. Sci. Part A:
Polym. Chem., 1995. 33(5): p. 829-842.
14. Ganzeveld, K.J., L.P.B.M. Janssen, The grafting of maleic anhydride on high density
polyethylene in an extruder. Polym. Eng. Sci., 1992. 32(7): p. 467-474.
15. O.P. Grigoryeva, J. Karger-Kocsis, Melt grafting of maleic anhydride onto an ethylene–
propylene–diene terpolymer (EPDM). Eur. Polym. J., 2000. 36(7): p. 1419-1429.
16. P. Choudhary, S. Mohanty, S. K. Nayak, L. Unnikrishnan, Poly(L-lactide)/polypropylene
blends: Evaluation of mechanical, thermal, and morphological characteristics. J. Appl.
Polym. Sci., 2011. 121(6): p. 3223-3237.
17. Y.F. Kim, C.N. Choi, Y.D. Kim, K.Y. Lee, M.S. Lee, Compatibilization of immiscible
poly(l-lactide) and low density polyethylene blends. Fiber Polym, 2004. 5(4): p. 270-274.
18. M. Avella, G. Bogoeva-Gaceva, A. Buzarovska, M. E. Errico, G. Gentile, A. Grozdanov,
Poly(lactic acid)-based biocomposites reinforced with kenaf fibers. J. Appl. Polym. Sci.,
2008. 108(6): p. 3542-3551.
19. M. Avella, G. Bogoeva-Gaceva, A. Buzarovska, M. E. Errico, G. Gentile, A. Grozdanov,
Poly(3-hydroxybutyrate-co-3-hydroxyvalerate)-based biocomposites reinforced with
kenaf fibers. J. Appl. Polym. Sci., 2007. 104(5): p. 3192-3200.

151
20. Y. Nabar, J.M. Raquez, P. Dubois, R. Narayan, Production of Starch Foams by Twin-
Screw Extrusion: Effect of Maleated Poly(butylene adipate-co-terephthalate) as a
Compatibilizer. Biomacromolecules, 2005. 6(2): p. 807-817.
21. Y.J. Phua, N.S. Lau, K. Sudesh, W.S. Chow, Z.A. Mohd Ishak, Biodegradability studies
of poly(butylene succinate)/organo-montmorillonite nanocomposites under controlled
compost soil conditions: Effects of clay loading and compatibiliser. Polym. Degrad.
Stabil., 2012. 97(8): p. 1345-1354.
22. J. John, J. Tang, Z. Yang, M. Bhattacharya, Synthesis and characterization of anhydride-
functional polycaprolactone. J. Polym. Sci. Part A: Polym. Chem., 1997. 35(6): p. 1139-
1148.
23. M.A. Huneault, H. Li, Morphology and properties of compatibilized
polylactide/thermoplastic starch blends. Polymer., 2007. 48(1): p. 270-280.
24. V. Tserki, P. Matzinos, C. Panayiotou, Effect of compatibilization on the performance of
biodegradable composites using cotton fiber waste as filler. J. Appl. Polym. Sci., 2003.
88(7): p. 1825-1835.
25. S.W. Hwang, S.B. Lee, C.K. Lee, J.Y. Lee, J.K. Shim,S.E.M. Selke, H. Soto-Valdez, L.
Matuana, M. Rubino, R. Auras, Grafting of maleic anhydride on poly(L-lactic acid).
Effects on physical and mechanical properties. Polym Test., 2012. 31(2): p. 333-344.
26. D. Carlson, L. Nie, R. Narayan, P. Dubois, Maleation of polylactide (PLA) by reactive
extrusion. J. Appl. Polym. Sci., 1999. 72(4): p. 477-485.
27. W.S. Chow, W.L. Tham, P.C. Seow, Effects of maleated-PLA compatibilizer on the
properties of poly(lactic acid)/halloysite clay composites. J. Thermoplast. Compos., 2013;
26(10): pp. 1349-1363.
152
28. V.H. Orozco, W. Brostow, W. Chonkaew, B.L. López, Preparation and Characterization
of Poly(Lactic Acid)-g-Maleic Anhydride + Starch Blends. Macromol. Symp., 2009.
277(1): p. 69-80.
29. F. Chen, J. Zhang, In-situ poly(butylene adipate-co-terephthalate)/soy protein concentrate
composites: Effects of compatibilization and composition on properties. Polymer., 2010.
51(8): p. 1812-1819.
30. H.S. Kim, B.H. Lee, S. Lee, H.J. Kim, J.R. Dorgan, Enhanced interfacial adhesion,
mechanical, and thermal properties of natural flour-filled biodegradable polymer bio-
composites. J. Therm. Anal. Calorim., 2011. 104(1): p. 331-338.
31. C.S. Wu, Physical properties and biodegradability of maleated-polycaprolactone/starch
composite. Polym. Degrad. Stabil., 2003. 80(1): p. 127-134.
32. G. Moad, The synthesis of polyolefin graft copolymers by reactive extrusion. Prog.
Polym. Sci., 1999. 24(1): p. 81-142.
33. R. Muthuraj, M. Misra, A.K. Mohanty, Fully Biodegradable poly (butylene succinate)
and poly (butylene adipate-co-terephthalate) Blends: Reactive Extrusion and Performance
Evaluation. J. Polym. Environ., 2014. 22 (3): 336-349.
34. Y. J. Phua, W.S.Chow., Z. A. Mohd Ishak, Reactive processing of maleic anhydride-
grafted poly(butylene succinate) and the compatibilizing effect on poly(butylene
succinate) nanocomposites. Express Polymer Letters., 2013. 7(4): p. 340–354.
35. K.E. Russell, Grafting of maleic anhydride to hydrocarbons below the ceiling
temperature. J. Polym. Sci. Part A: Polym. Chem., 1995. 33(3): p. 555-561.
36. N.G. Gaylord, R. Mehta, D.R. Mohan, V. Kumar, Maleation of linear low-density
polyethylene by reactive processing. J. Appl. Polym. Sci., 1992. 44(11): p. 1941-1949.

153
37. S. Detyothin, S.E.M. Selke, R. Narayan, M. Rubino, R. Auras, Reactive functionalization
of poly(lactic acid), PLA: Effects of the reactive modifier, initiator and processing
conditions on the final grafted maleic anhydride content and molecular weight of PLA.
Polym. Degrad. Stabil., 2013. 98(12): p. 2697-2708.
38. G. Xiaohong, C.Q. Yang, FTIR Spectroscopy Study of the Formation of Cyclic
Anhydride Intermediates of Polycarboxylic Acids Catalyzed by Sodium Hypophosphite.
Textile Research Journal, 2000. 70(1): p. 64-70.
39. Y. Cai, J. Lv, J. Feng, Spectral Characterization of Four Kinds of Biodegradable Plastics:
Poly (Lactic Acid), Poly (Butylenes Adipate-Co-Terephthalate), Poly (Hydroxybutyrate-
Co-Hydroxyvalerate) and Poly (Butylenes Succinate) with FTIR and Raman
Spectroscopy. J. Polym. Environ., 2013. 21(1): p. 108-114.
40. C. Li, Y. Zhang, Y. Zhang, Melt grafting of maleic anhydride onto low-density
polyethylene/polypropylene blends. Polym Test., 2003. 22(2): p. 191-195.
41. M. Z. Ahmad Thirmizir, Z. A. Mohd Ishak, R. Mat Taib, S. Rahim, S. Mohamad Jani,
Natural Weathering of Kenaf Bast Fibre-Filled Poly(Butylene Succinate) Composites:
Effect of Fibre Loading and Compatibiliser Addition. J. Polym. Environ., 2011. 19(1): p.
263-273.
42. G. Moad, Chemical modification of starch by reactive extrusion. Prog. Polym. Sci., 2011.
36(2): p. 218-237.
43. J. Cha, J.L. White, Maleic anhydride modification of polyolefin in an internal mixer and
a twin-screw extruder: Experiment and kinetic model. Polym. Eng. Sci., 2001. 41(7): p.
1227-1237.

154
44. P. Ma, D.G. Hristova-Bogaerds, P.J. Lemstra, Y. Zhang, S. Wang, Toughening of
PHBV/PBS and PHB/PBS Blends via In situ Compatibilization Using Dicumyl Peroxide
as a Free-Radical Grafting Initiator. Macromol. Mater. Eng., 2012. 297(5): p. 402-410.
45. M. Takamura, T. Nakamura, T. Takahashi, K. Koyama, Effect of type of peroxide on
cross-linking of poly(l-lactide). Polym. Degrad. Stabil., 2008. 93(10): p. 1909-1916.
46. H.R.Z. Sheshkali, H. Assempour, H. Nazockdast, Parameters affecting the grafting
reaction and side reactions involved in the free-radical melt grafting of maleic anhydride
onto high-density polyethylene. J. Appl. Polym. Sci., 2007. 105(4): p. 1869-1881.
47. H. Cartier, G.H. Hu, Styrene-assisted melt free radical grafting of glycidyl methacrylate
onto polypropylene. J. Polym. Sci. Part A: Polym. Chem., 1998. 36(7): p. 1053-1063.
48. N.G. Gaylord, R. Mehta, V. Kumar, M. Tazi, High density polyethylene-g-maleic
anhydride preparation in presence of electron donors. J. Appl. Polym. Sci., 1989. 38(2):
p. 359-371.
49. J. John, R. Mani, M. Bhattacharya, Evaluation of compatibility and properties of
biodegradable polyester blends. J. Polym. Sci. Part A: Polym. Chem., 2002. 40(12): p.
2003-2014.
50. P. M. Ma, R. Y. Wang, S. F. Wang, Y. Zhang, Y. X. Zhang, D. Hristova, Effects of
fumed silica on the crystallization behavior and thermal properties of
poly(hydroxybutyrate-co-hydroxyvalerate). J. Appl. Polym. Sci., 2008. 108(3): p. 1770-
1777.
51. B. Song, Y. Wang , H. Bai, L. Liu, Y. Li, J. Zhang, Z. Zhou, Crystallization and melting
behaviors of maleic anhydride grafted poly(propylene) nucleated by an aryl amide
derivative. J. Therm. Anal. Calorim., 2010. 99(2): p. 563-570.

155
52. T. Liu, G-H. Hu, G-S Tong, L. Zhao, G-P. Cao, W-K. Yuan, Supercritical Carbon
Dioxide Assisted Solid-State Grafting Process of Maleic Anhydride onto Polypropylene.
Ind. Eng. Chem. Res., 2005. 44(12): p. 4292-4299.

156
Chapter 5: Enhanced Mechanical Performances of Fully Biodegradable Miscanthus Fibers
Reinforced Poly (butylene succinate) Composites*
*A part of this chapter has been published in: R. Muthuraj, M. Misra, A. K. Mohanty, Injection
Molded Sustainable Biocomposites From Poly(butylene succinate) Bioplastic and Perennial
Grass, ACS Sustainable Chem. Eng., 2015, 3, 2767−2776. (adapted with kind permission from
American Chemical Society, Nov 01, 2015).
Abstract
Miscanthus fiber reinforced poly (butylene succinate) (PBS) composites were fabricated
at various concentrations of fiber loadings. Two different compatibilizers, i.e., higher (2.5%) and
lower (1.6%) degree of maleic anhydride grafted PBS (MAH-g-PBS), were used to investigate
the influence of compatibilizer on mechanical performance of resulting composites. The
composites compatibilized with a higher degree of MAH-g-PBS showed superior mechanical
properties compared to neat PBS, uncompatibilized composites, and compatibilized composites
with a lower degree of MAH-g-PBS compatibilizer. The improved mechanical properties were
attributed to the enhanced interfacial adhesion that occurred between the fibers and the matrix.
The optimum coupling efficiency of the compatibilizers was determined by examining 3, 5 and
10 wt% compatibilizer while fiber content was kept constant at 30 wt%. It was found that the
PBS composites with 5 wt% MAH-g-PBS exhibit optimal performance. Consequently, the PBS
composites were prepared with fiber loading up to 50 wt% while the higher degree (2.5%) of
MAH-g-PBS compatibilizer was kept constant at 5 wt%. All the compatibilized composites had
greater thermo-mechanical and mechanical properties as compared to their corresponding
uncompatiblized composites as well as the neat PBS matrix. These improvements were attributed
to the enhanced interfacial bonding between the components with the addition of compatabilizer.
This phenomenon was confirmed by scanning electron microscopy (SEM) and theoretical

157
adhesion parameter values. Over all, this study provides an option for preparing a sustainable
biocomposite with superior mechanical and thermo-mechanical properties.
5.1 Introduction
Increasing environmental pollution, global warming and waste accumulation issues are
impetus for developing sustainable and environmentally friendly biodegradable materials to
replace non-biodegradable materials. One category of biodegradable materials is green
composites, which can be produced from biodegradable polymer matrices with natural fibers as
reinforcement. These green composite materials have been finding increased favor across
packaging, horticultural, automotive and biomedical applications [1-4]. There are several
biodegradable polymers commercially available in the market that are being used for green
composite fabrication. Among them, poly(butylene succinate), PBS, is one of the promising
candidates for green composite fabrication because it has good melt processability, relatively
higher heat deflection temperature than other biodegradable polymers, good thermo-mechanical
properties and biodegradability under composting environments [5]. PBS is typically produced
from petroleum based monomers but also can be produced from renewable-resource-based
succinic acid with bio-based content of ~54% [4]. These attractive properties may be responsible
for the increase in the use of PBS based green composites for various applications [3]. The cost
of PBS is more expensive than conventional non-biodegradable polymers [6]. It is well known
that this shortcoming can be overcome by blending with inexpensive natural fibers/fillers while
maintaining or enhancing the matrix performance. Therefore, a variety of natural fibers are used
to fabricate composites with PBS matrix [4].
In addition to being inexpensive, natural fibers are renewable, sustainable, biodegradable,
abundant and have good specific properties and low density compared to synthetic fibers such as

158
glass fiber [7]. Among the natural fibers, miscanthus fiber is mainly used for green energy
production, soil preservation and composite application [8]. It is an attractive fiber for composite
fabrication because of suitable fiber properties [7, 8], higher yield per hectare, lower production
cost [8] and thus realistic price [9]. Similar to many other natural fibers, miscanthus fiber is
thermally stable up to 200oC without any major thermal decomposition [7, 10]. It can be
processed with low melting (< 200oC) temperature polymers in conventional processing
equipment. According to Bourmaud and Pimbert [11], the miscanthus fibers have modulus of
9.49 GPa which is between hemp (12.14 GPa) and sisal (8.52 GPa) fibers. Kirwan et al., [9]
reported that miscanthus fibers have mechanical properties similar to commodity thermoplastics.
As a result, it can be expected that miscanthus fibers could offer good reinforcing effect in the
resulting composites. Due to these inherent properties, recently, miscanthus fiber is widely used
as reinforcement in biodegradable polymer matrix such as polylactide (PLA) [7], Mater-Bi® [12],
poly(vinyl alcohol) (PVA) [9], PLA/poly(hydroxybutyrate-co-valerate) (PHBV) blend [8] and
pre-blend of poly(butylene adipate-co-terephthalate) (PBAT)/PHBV [13] matrices. From these
studies, the properties of PLA/miscanthus fiber composites are comparable to some other fiber
reinforced composites. Interestingly, the impact load of Mater-Bi® is increased up to 30% with
the addition of miscanthus fibers. Furthermore, the flexural modulus of PVA/miscanthus fiber
composites is significantly higher when compared to PVA matrix. A similar occurrence has been
observed in the PHBV/PLA/miscanthus and PHBV/PBAT/miscanthus composites.
In general, compatibility between the natural fibers and biopolymer matrix is not
adequate because of their polarity differences. Because of incompatibility between the matrix-
fibers, the resulting composites have yielded an inferior mechanical performance than their neat
counterparts. For instance, the flexural strength and tensile strength of PHBV/PLA/miscanthus

159
composites are considerably reduced when compared to PHBV/PLA blend matrix [8]. Another
study by Nagarajan et al., [13] showed a drastic reduction in impact strength of PHBV/PBAT
pre-blend after incorporation of 30 wt% miscanthus fiber. Therefore, it is well documented that
the compatibility/interfacial bonding between the fiber-matrix can be enhanced by two ways.
The first method is surface modification of fibers through chemical, physical and biological
process [14]. In second method, a reactive compatibilizer/coupling agent can be introduced into
the composites system in order to improve the matrix-fiber interfacial adhesion [15]. In the
natural fiber/filler composites, most commonly used method is reactive compatibilizer i.e.,
maleic anhydride (MAH) grafted functional polymers. It has tendency to form a chemical bond
with surface free hydroxyl groups of the natural fibers in the resulting composites [15, 16].
Until now several types of natural fiber/filler reinforced PBS composites have been
investigated in the literature [5,17-20]. There is no data available for miscanthus fibers
reinforced PBS composites with improved performance. In order to overcome insufficient impact
strength and stiffness of PBS, the present study was aimed to develop PBS/miscanthus fiber
biocomposite with and without a reactive compatibilizer i.e., MAH grafted PBS (MAH-g-PBS).
Besides, the effect of compatibilizer concentrations, grafting level of MAH and fiber loading up
to 50 wt% upon the performance of resultant biocomposites were also evaluated by means of
mechanical and thermo-mechanical properties.
5.2 Materials and Methods
5.2.1 Materials
Injection molding grade poly(butylene succinate) (PBS, Biocosafe 1903F) pellets were
purchased from Xinfu Pharmaceutical Co., Ltd, China. The PBS pellets had melt flow index (at
190 oC with 2.16 kg load) of 22.23±1.78 g/10min, density of 1.26 g/cm
3 and melting point of

160
115oC. Miscanthus fibers with average length of 4.65±2.5 mm were kindly supplied by New
Energy Farms, Ontario, Canada. The chemical composition of miscanthus fiber is reported in our
group earlier publications [8, 13]. The surface morphology of as received miscanthus fibers is
shown in Figure 5.1. From the SEM analysis, it can be seen that the miscanthus fibers are in the
form of bundules. Two different grafting level of maleic anhydride grafted PBS (MAH-g-PBS)
compatibilizer (C1 and C2) is synthesized according to procedure reported in our previous
Chapter (Chapter 4). The grafting level of compatibilizer C1 and C2 is 2.5 and 1.6%,
respectively.
Figure 5.1. SEM micrograph of as received miscanhtus fibers
5.2.2 Thermal property
Thermogravimetric analysis was performed in a TGA Q500 (TA Instruments, USA) at a
heating rate of 20 ºC/min. In order to compare the thermal degradation of the samples under
different atmosphere, the experiments were performed both inert (nitrogen) and air atmosphere
with a flow rate of 50 mL/min. The experiment results were analyzed in TA instruments
software.

161
5.2.3 Biocomposite preparation
Both PBS and miscanthus fibers were dried for 12 h at 80 oC. After drying, the remaining
moisture content of both polymers and fibers was measured in an electrical moisture analyzer
(Denver Instrument) and the percentage of moisture content was 0.1% for PBS and 2.5% for
miscanthus fibers. The biocomposites fabrication was perfromed in an extrusion followed by
injection molding devices (DSM Xplore® 15 cc microcompounder, Netherlands). The extruder
consists of three collectively control heating zones, twin screws with an length and aspect ratio
of 150 mm and 18, respectively. Compounding was achieved by using following processing
parameters: the screw speed was set at 100 rpm; the processing temperature was set at 140oC;
and the processing/dwell time of the material inside the barrel was 2 minutes. All the test
samples were molded with mould temperature of 30oC, injection pressure of 10 bar and injection
time 8 s. The composites were prepared with three different concentrations (3, 5 and 10 wt%) of
compatibilizer and two different amount of functionality (C1 and C2) compatibilizer to study the
influence of compatibilizer concentration and functionality upon the performance of the
PBS/miscanthus composites. Furthermore, the PBS/miscanthus composites were prepared with
fiber loading up to 50 wt% in the presence and absence of optimum compatibilizer (C1)
concentration (5 wt%).
5.2.4 Mechanical testing
Before performing the mechanical test, test samples were conditioned at room
temperature for at least 40 h. The tensile, flexural and impact test were performed according to
ASTM D 638, ASTM D790 and ASTM D256, respectively. Tensile and flexural properties of
the test specimens were measured in an Instron-3382 at room temperature. The tensile properties
of the prepared samples were measured at a strain rate of 50 mm/min for neat PBS and 5mm/min
for all the composite samples. The flexural properties were measured with a cross-head speed of

162
14 mm/min and a support span length of 52 mm in a three point bending mode. Notched Izod
impact strength measurement was carried out in a TMI digital impact testing machine with 5 ft-
lb pendulum.
5.2.5 Statistical analysis
Statistical significant differences of mechanical properties were identified by Minitab®
17
software at 95% confidence level (P< 0.05). In order to determine significant difference among
mean values of mechanical properties, one-way analysis of variance (ANOVA) with Tukey’s
honestly significant difference (HSD) tests was conducted with a sample size of 5 for each
group.
5.2.6 Dynamic mechanical analysis
The temperature dependent storage modulus (E’) of PBS and its composites is examined
in a dynamic mechanical analyzer (DMA, Q800). The experiments were performed from -50 to
100 oC with a heating ramp of 3
oC/min as per ASTM D4065 standard. The storage modulus
measurements were investigated in a dual cantilever mode using strain of 1Hz frequency and
15µm oscillating amplitude. Heat deflection temperature (HDT) analyses were also performed
using a same DMA machine according to ASTM D648. The HDT measurements were carried
out from 25 to 115 oC with a heating rate of 2
oC/min in a three point bending mode. According
to ASTM D648, the reported HDT values are obtained from the temperature at which sample
deflection occurred at 250 µm with a constant load of 0.455 MPa.
5.2.7 Melt flow index (MFI)
MFI values of the samples were determined according to ASTM D1238 standard. All the
MFI measurements were performed in a melt flow indexer (Qualitest model 2000A) at 190oC

163
with a constant load of 2.16 kg. Five measurements were made for each batch and their average
values are reported here with standard deviations.
5.2.8 Differential scanning calorimetry (DSC)
DSC anlysis was employed to study the thermal properties of PBS and its composites.
The experiments were carried out in the presence of nitrogen atmosphere with a flow rate of 50
mL/min. Exactly weighed samples were heated from -50 to 160oC with a heating rate of 10
oC/min subsequently the samples were cooling until -50
oC with a rate of 5
oC/min. After end of
cooling cycle, a second heating cycle was performed from -50 to 160oC with a heating ramp of
10 oC/min. A first heating cycle was used to erase the thermal history of the samples. A second
heating and first cooling cycles are considered for the analysis. The percentage of crystallinity
was calculated as follows [21]:
χ =
X 100%
χ =
X 100% (5.1)
The parameter ∆Hc is crystallization enthalpy, respectively and ∆Hom is theoretical melting
enthalpy of one-hundred percentage crystalline PBS taken to be 110.3 J/g [21]. The term wf is
weight fraction of the fibers in the composite samples.
5.2.9 Scanning electron microscopy (SEM)
To examine the fracture, surface morphology of the fractured sample was analyzed using
an Inspect S50-FEI Company SEM at an accelerating voltage of 20 kV. Before observing sample
morphology, all the samples were gold coated with a final thickness of 20 nm with 20 mA in
order to make them electrically conductive.

164
5.3 Results and discussion
5.3.1 Thermogravimetric analysis
Thermal stability of the miscanthus fiber under air and nitrogen atmosphere is shown in
Figure 5.2.
Figure 5.2. Thermogravimetric analysis of miscanthus fiber under different environment
The miscanthus fiber showed only a 2% weight loss by 105oC in both nitrogen and air
atmosphere; this 2% weight loss is attributed to the residual moisture. There was no significant
further weight loss observed by 200oC under air or nitrogen atmospheric conditions, suggesting
that the miscanthus fiber can be compounded with polymers up to 200oC without severe thermal
degradation. Furthermore, the thermal stability of the miscanthus fiber was found to be similar to
other natural fibers [12]. Beyond 200oC, the degradation of miscanthus fiber was more
pronounced under air atmosphere compared to nitrogen atmosphere, perhaps due to the effect of
oxygen on degradation. Unlike under the nitrogen atmosphere, the weight of the char residue of
the miscanthus fiber under oxygen atmosphere was almost negligible at 790oC, this lack of char

165
residue may be due to the oxidation of char residue in air [22]. There were two and three major
derivative weight loss peaks observed for the miscanthus fiber under N2 and air atmosphere,
respectively. The oxidation of char residue under air atmosphere can be confirmed by the
observed extra derivative peak around 460oC (Figure 5.2).
5.3.2 Efficiency of compatibilizer
The efficiency of the two different MAH grafting level compatibilizers (C1 and C2) was
accessed by means of PBS composites mechanical properties. For this series of experiments, the
mechanical properties of the PBS/miscanthus composites are presented in Table 5.1 with (3, 5
and 10 wt%) and without MAH-g-PBS compatibilizers. All the mechanical properties were
increased except for tensile strength with addition of 30 wt% miscanthus fiber into the PBS
matrix. The observed flexural strength and modulus improvement of the composites can be
attributed to the reinforcing capability of miscanthus fibers [9]. The impact strength of short-
fiber composites can be influenced by several mechanisms, namely matrix shear yielding, fiber
pullout, fiber-matrix debonding, and fracture of fiber and matrix [23-25]. Among the impact
fracture mechanisms, the fiber pullout and strong interfacial adhesion are the most effective
mechanisms to improve the fracture toughness of the composites [24,26]. The impact strength of
PBS was increased upon addition of 30 wt% miscanthus fibers. This increased strength could be
due to the energy dissipation that occurres when matrix shear yielding and fiber pull-out
terminate the unwanted growth of crazes [25].
The tensile and flexural strength values of the composites higher with addition of both
compatibilizers (C1 and C2) as compared the strength of uncompatibilized composites. This
increased strength suggests that the MAH grafting on the PBS backbone was successful and it
acts as a compatibilizing agent between the matrix-fibers [27]. Similar tensile strength

166
improvement was observed in PLA/wood and PLA/wheat straw composites in the presence of
MAH grafted PLA compatibilizer [27, 28]. It can be seen (Table 5.1) that the composites with
C1 compatibilizer showed significantly higher flexural and tensile strength than did the
composites with C2 compatibilizer. This strength improvement is likely due to the difference in
molecular weight between C1 and C2 as well as number of MAH groups of the compatibilizer
[29]. An appropriate molecular weight and number of MAH groups of the compatibilizer could
provide better entanglement and stronger interfacial bonding between the phases [29, 30]. The
formation of chemical interaction between the fiber and MAH grafted compatibilizer has been
found to enhance the interfacial adhesion [31]. Since all the composites had the same amount of
fiber content (30 wt%), there was no considerable change observed in flexural and tensile
modulus of the composites with and without compatibilizer. The elongation at break of the PBS
was substantially reduced after incorporation of miscanthus fibers; this reduction has good
agreement with observed modulus of the PBS composites. Both compatibilized and
uncompatiblized PBS composites showed an insignificant difference in impact strength. This
similarities in the impact strength could be due to the same amount of energy being absorpted
during impact fracture, no matter whether the composites were compatibilized (fiber break along
with matrix) or not (fibers pull-out from matrix) [25].
Overall, it can be concluded that the composites with C1 compatibilizer (5 wt%) showed
an optimum mechanical performance in comparison to uncompatibilized and compatibilized
composites with C2 compatibilizer. Consequently, the PBS composites were prepared with C1
compatibilizer (5 wt%) increasing as a function of miscanthus fiber loading.The performances of
the prepared composites are discussed in the next section of this research work.

167
Table 5.1. Mechanical properties of PBS composites with two different MAH grafting levels of
compatibilizer
Samples
Tensile
strength
(MPa)
Elongation
at break
(%)
Tensile
Modulus
(MPa)
Flexural
Strength
(MPa)
Flexural
Modulus
(MPa)
Notched
Izod impact
strength
(J/m)
Neat PBS 39.4±0.7
(B, C)
246±10.5
(A)
642±12.7
(B)
33.18±1.0
(E)
759±29
(D)
28.40±0.91
(C)
PBS 70 wt%+30 wt%
Miscanthus
33.2±1.7
(D)
3.76±0.6
(B)
2210±84.9
(A)
55.04±1.3
(D)
2379±54
(A, B, C)
46.42±1.4
(A, B)
Biocomposites prepared with C1 compatibilizer
PBS 67 wt%+3 wt%
MAH-g-PBS +30 wt%
Miscanthus
41.3±1.5
(B, C)
3.67±0.2
(B)
2180±121
(A)
73.59±1.8
(A, B)
2277±104
(C)
47.48±4.8
(B)
PBS 65 wt%+5 wt%
MAH-g-PBS +30 wt%
Miscanthus
44.4±2.0
(A)
3.66±0.3
(B)
2300±91
(A)
75.32±2.4
(A)
2346±98
(B, C)
53.23±3.5
(A)
PBS 60 wt%+10 wt%
MAH-g-PBS +30 wt%
Miscanthus
45.3±1.6
(A)
4.02±0.3
(B)
2210±47
(A)
75.51±2.0
(A)
2347±211
(B, C)
52.38±1.2
(A)
Biocomposites prepared with C2 compatibilizer
PBS 67 wt%+3 wt%
MAH-g-PBS +30 wt%
Miscanthus
37.9±1.1
(C)
3.41±0.2
(B)
2240±39
(A)
65.28±2.0
(C)
2556±60
(A)
45.65±1.0
(B)
PBS 65 wt%+5 wt%
MAH-g-PBS +30 wt%
Miscanthus
38.4±0.6
(C)
3.61±0.2
(B)
2220±69
(A)
63.49±1.6
(C)
2503±56
(A, B)
46.22±0.98
(B)
PBS 60 wt%+10 wt%
MAH-g-PBS +30 wt%
Miscanthus
41.3±0.6
(B)
3.61±0.2
(B)
2200±15
(A)
70.79±1.4
(B)
2565±83
(A)
47.01±1.70
(B)
Means that do not share a letter in parentheses are significantly different at p<0.05 level.
5.3.3 Mechanical properties versus fiber loading
The tensile properties of the natural fiber reinforced composites are dependent on both
the matrix and fiber characters. The tensile strength of natural fiber composite is mainly
influenced by three factors such as interfacial interaction between the components fiber
orientation, and stress concentration [23]. On the other hand, wettability of fibers by the matrix,

168
volume fraction of fibers, and aspect ratio of fibers determine tensile modulus of the natural fiber
composite [23]. Figure 5.3 shows the variation of tensile strength and tensile modulus of PBS
composites with different fiber loadings with and without compatibilizer. The neat PBS had
tensile strength of 39 MPa and tensile modulus of 0.66 GPa. Due to lack of interfacial interaction
between the phases and incompatibility between the miscanthus fiber and the PBS, the tensile
strength decreased significantly after inclusion of miscanthus fibers into the PBS. Particularly,
the addition of the 50 wt% miscanthus fiber into the PBS matrix yielded a 22% reduction in
tensile strength. As expected, the tensile modulus of the composites can be influenced by the
fiber content in the composite matrix. Consequently, the tensile modulus of the PBS composites
was steeply increased with increasing miscanthus fiber content up to 50 wt%. For instance, the
PBS composite with 50 wt% miscanthus fiber showed a maximum tensile modulus value of 3.88
GPa, which is 475% higher than that of neat PBS. This improvement was due to the reinforcing
effect of miscanthus fiber in the PBS matrix. Among the tensile modulus and tensile strength of
the composites, tensile strength was influenced by the addition of compatibilizer. The tensile
strength of all the compatibilized composites was significantly higher than that of the
uncompatibilized composites as well as of PBS matrix. The observed improvement in the tensile
strength of the compatibilized composites is possibly due to an enhanced interfacial adhesion
between the components. In the presence of compatibilizer, the tensile strength improvement of
the PBS/miscanthus composite leveled off beyond 30 wt% fiber loading. Furthermore, the tensile
modulus of the compatibilized composites did not show any substantial difference compared to
that of the corresponding uncompatibilized composites. This observation is consistent with
PLA/wood composites [27].
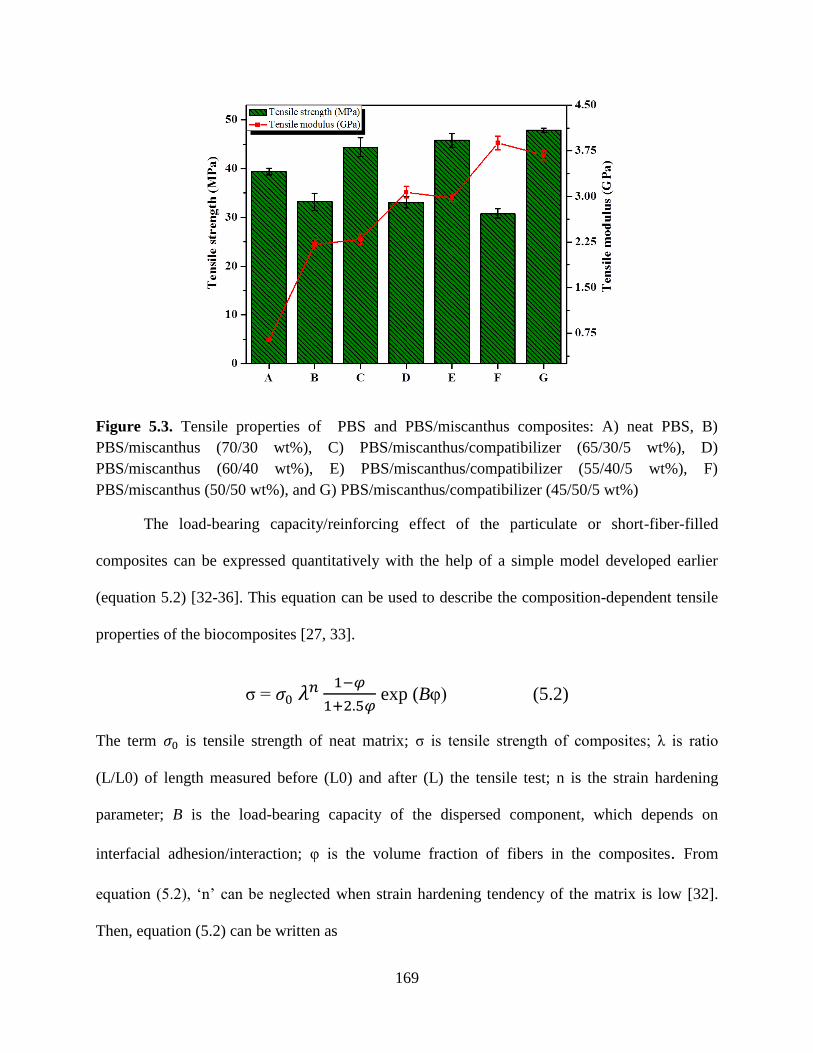
169
Figure 5.3. Tensile properties of PBS and PBS/miscanthus composites: A) neat PBS, B)
PBS/miscanthus (70/30 wt%), C) PBS/miscanthus/compatibilizer (65/30/5 wt%), D)
PBS/miscanthus (60/40 wt%), E) PBS/miscanthus/compatibilizer (55/40/5 wt%), F)
PBS/miscanthus (50/50 wt%), and G) PBS/miscanthus/compatibilizer (45/50/5 wt%)
The load-bearing capacity/reinforcing effect of the particulate or short-fiber-filled
composites can be expressed quantitatively with the help of a simple model developed earlier
(equation 5.2) [32-36]. This equation can be used to describe the composition-dependent tensile
properties of the biocomposites [27, 33].
σ =
exp (Bφ) (5.2)
The term is tensile strength of neat matrix; σ is tensile strength of composites; λ is ratio
(L/L0) of length measured before (L0) and after (L) the tensile test; n is the strain hardening
parameter; B is the load-bearing capacity of the dispersed component, which depends on
interfacial adhesion/interaction; φ is the volume fraction of fibers in the composites. From
equation (5.2), ‘n’ can be neglected when strain hardening tendency of the matrix is low [32].
Then, equation (5.2) can be written as

170
σ =
exp (Bφ) (5.3)
Equation 5.4 is obtained from simplified linear form of equation 5.3 [32, 36]
ln σred = ln σ
= ln + Bφ (5.4)
If we plot the natural logarithm of reduced tensile strength as a function of fiber content,
this reduced tensile strength must give a straight line with a slope of B, which corresponds to
load-bearing capacity [34,36]. In Figure 5.4, the tensile strength of both compatibilized and
uncompatibilized composites is plotted against fiber content in equation 5.4. It was observed that
a linear correlation occurred for compatibilized and uncompatibilized composites with dissimilar
slope (B) value. The B value was proportional to the load-bearing capacity/reinforcing effect of
the resulting composites. The compatibilized composites showed superior load-bearing capacity
with B value of 4.85 while uncompatibilized composites yielded least reinforcing effect with B
value of 3.65. The enhanced load-bearing capacity of the compatibilized composites was
consistent with observed tensile modulus and strength of the PBS/miscanthus composite. The B
value (4.85) of the compatibilized PBS/composites found in this study was much higher than
compatibilized PLA/wood composites [27, 32, 35], suggesting that the load-bearing capacity of
compatibilized PBS/miscanthus composites is greater than compatibilized PLA/wood
composites.

171
Figure 5.4. Reduced tensile strength of uncompatibilized and compatibilized PBS/miscanthus
composites plotted against volume fraction of fibers according to equation 5.4.
Flexural properties of PBS and its compatibilized and uncompatibilized composites are
given in Figure 5.5. Unlike tensile strength, the flexural strength of all the uncompatibilized
composites is remarkably higher as compared to neat PBS. This increase can be attributed to the
enhanced stiffness of the PBS matrix after incorporation of the miscanthus fibers. However,
there is a slight reduction in flexural strength of uncompatibilized composites with increasing
fiber loadings from 30 to 50 wt%. For instance, the flexural strength of uncompatibilized
composites with 50 wt% miscanthus fiber is 12% lower than that of uncompatibilized
composites with 30 wt% fiber. This reduction is attributed to the agglomeration of fibers and
thus leads to uneven dispersion of the fibers in the matrix. In contrast, flexural modulus of the
composites gradually increased with increasing fiber content up to 50 wt%. This trend has good
agreement with tensile modulus observation in this current study.

172
Figure 5.5. Flexural properties of PBS and PBS/miscanthus composites: A) neat PBS, B)
PBS/miscanthus (70/30 wt%), C) PBS/miscanthus/compatibilizer (65/30/5 wt%), D)
PBS/miscanthus (60/40 wt%), E) PBS/miscanthus/compatibilizer (55/40/5 wt%), F)
PBS/miscanthus (50/50 wt%), and G) PBS/miscanthus/compatibilizer (45/50/5 wt%)
Regarding flexural modulus, there was insignificant difference observed between the
compatibilized and uncompatibilized composites. In contrary, the compatibilized composites
exhibit superior flexural strength compared to uncompatibilized composites. Similar to tensile
strength of compatibilized PBS composites; the flexural strength of compatibilized PBS
composites levels off when fiber loading is increased from 30 to 50 wt%. Compared to neat PBS,
the flexural strength and flexural modulus of compatibilized PBS composites with 50 wt%
miscanthus fibers were found to increase 139 and 515%, respectively. The observed
improvement in the compatibilized composites could be due to the strong reinforcing effect of
miscanthus fibers and reduced fiber agglomeration in the matrix.
The notched Izod impact strength of PBS and its composites with and without
compatibilizer is shown in Figure 5.6. The impact strength of neat PBS is around 28 J/m, which

173
can be comparable to homopolypropylene [37]. Unlike impact strength of compression molded
PBS/30 wt% kenaf composites [38] and injection molded PLA/30 wt% wheat straw composites
[28], there is a trend for impact strength of injection molded PBS composite to increase with
miscanthus fibers loading up to 40 wt%. In contrast, the PBS composites with 50 wt%
miscanthus fibers did not show any significant impact strength improvement when compared to
neat PBS. This could be due to the uneven fiber dispersion in the matrix when composites
contain more fibers i.e., 50 wt%. The impact strength improvement was more pronounced in the
compatibilized composites in comparison to their corresponding uncompatibilized composites.
When impact strength of compatibilized and uncompatibilized PBS/miscanthus composites was
compared, a maximum improvement (47%) was noticed in compatibilized composites with 50
wt% fiber loading. Avella et al., [39, 40] have observed a similar trend in compatibilized
PHBV/kenaf composites and compatibilized PLA/kenaf fiber composites. According to these
studies, the observed improvement was due to the better adhesion between the components, less
fiber pullout under impact load, and enhanced uniform fiber dispersion in the matrix. However,
the impact strength of compatibilized composites gradually declined with increasing fiber
loading from 30 to 50 wt%, which follows a similar trend to uncompatibilized composites. This
could be due to the fiber-fiber contact that was increased with increasing fiber loadings. When
the fiber content is increased in the polymer matrix system, the fibers tend to form an
agglomeration in the matrix due to strong hydrophilic fiber to fiber interaction. The
agglomeration creates strong stress concentration regions that require less energy to elongate the
crack propagation under selected impact testing condition. Therefore, the composites with fiber
agglomeration lead to less impact strength [41].

174
In order to compare the effectiveness of this work, mechanical properties of injection
molded PBS biocomposites as described in the literature are presented in Table 5.2. It can be
seen that bamboo, ramie and flax fiber reinforced PBS composites tensile strength is greater than
that of PBS/miscanthus composites. In contrast, miscanthus fiber reinforced PBS composites
enhanced tensile modulus by 473% which is significantly higher than other natural fiber
(bamboo, flax, hemp, wood and waste silk) reinforced PBS composites [5, 42, 43]. This tensile
modulus increase indicates that the reinforcing effect of miscanthus fibers is obvious. Even
though chopped short miscanthus fibers were used in the current study, the flexural properties of
the PBS/miscanthus composite are quite comparable with continuous basalt fiber roving/PBS
composites [42]. In addition, the PBS/miscanthus fiber composites exhibit superior flexural
properties compared to PBS composites with ramie, kenaf and waste silk fibers. The notched
Izod impact strength of PBS/miscanthus fibers composite was about 47% higher in comparison
to neat PBS. When kenaf (30 wt% ) short fibers were incorporated into PBS, the impact strength
of neat PBS was reduced by ~79% (from 40 to 11 J/m2) [38]. In the present study, the impact
strength was improved about 47% in comparison to neat PBS. From the above, it clearly
suggests that the improved mechanical performances of the PBS/miscanthus composites can be
achieved by the simple method.

175
Figure 5.6. Nothced Izod impact strength of PBS and PBS/miscanthus composites: A) neat
PBS, B) PBS/miscanthus (70/30 wt%), C) PBS/miscanthus/compatibilizer (65/30/5 wt%), D)
PBS/miscanthus (60/40 wt%), E) PBS/miscanthus/compatibilizer (55/40/5 wt%), F)
PBS/miscanthus (50/50 wt%), and G) PBS/miscanthus/compatibilizer (45/50/5 wt%)

176
Table 5.2. A comparison of mechanical properties of injection molded PBS/natural fiber composites (Note: the reported percentage
differences were calculated based on the neat PBS matrix properties)
Fiber
type
Optimum
fiber
(wt%)
Type of compatibilizer used Change in tensile
properties (%)
Change in flexural
properties (%)
Change
in Izod
impact
strength
(%)
References
Strength Modulus Strength Modulus
Bamboo 15 poly(ethylene glycol)
methacrylate
~76 ~52 NA NA NA [51]
Ramie 30 Alkali treatment ~55 ~431 ~86 ~267 NA [5]
Kenaf 30 Maleic anhydride grafted PBS NA NA ~23 ~399 ~(-79) [38]
Flax 30 Maleic anhydride grafted PBS ~28 ~358 NA NA NA [43]
Wood 30 Maleic anhydride grafted PBS ~5 ~329 NA NA NA [43]
Hemp 30 Maleic anhydride grafted PBS ~13 ~353 NA NA NA [43]
Bamboo 30 Maleic anhydride grafted PBS ~(-16) NA NA NA NA [52]
Wood 30 Maleic anhydride grafted PBS ~(-40) NA NA NA NA [52]
Waste silk 40 NA ~17 ~140 ~26 ~54 NA [53]
Miscanthus 50 Maleic anhydride grafted PBS ~22 ~473 ~139 ~515 ~47 Present
study

177
5.3.4 Dynamic mechanical analysis
DMA was used to investigate the viscoelastic properties of PBS and its composites with
respect to temperatures. The interfacial adhesion between the matrix and the fibers can be
estimated by loss factor (tan δ) and storage modulus (E’) properties. For example, the E’ values
of the natural fiber composites are sensitive to the dispersion of fibers in the matrix as well as
interfacial bonding between the phases. Figure 5.7 illustrates the storage modulus of PBS and its
composites over the wide temperature range. It can be remarked that the E’ value of composites
monotonically increased with the addition of miscanthus fibers up to 50 wt%. This can be
attributed to the reinforcing effect of the miscanthus fibers in the PBS matrix. In addition, the E’
of compatibilized composites is slightly higher with respect to corresponding uncompatibilized
composites. For instance, the storage modulus of compatibilized composites with 50 wt%
miscanthus fibers showed 6.8 GPa at -60oC, which is higher than corresponding
uncompatibilized composites (6.52 GPa) as well as neat PBS (2.98 GPa) at the glassy region (-
60oC). The same trend has been observed across the entire investigated range of temperature.
This suggests that compatibilized composites had uniform fiber dispersion and the high degree of
interaction between the phases. However, all the samples showed a drastic reduction of E’ at -
16oC, which is attributed to the glass transition temperature (tan δ) of PBS. Moreover, the E’ of
all the samples were gradually decreased with increasing temperature up to 100oC. This decrease
in E’ is an expected consequence of the molecular motion/relaxation while increasing
temperatures.

178
Figure 5.7. Dynamic mechanical analysis of PBS and PBS/miscanthus composites: A) neat
PBS, B) PBS/miscanthus (70/30 wt%), C) PBS/miscanthus/compatibilizer (65/30/5 wt%), D)
PBS/miscanthus (60/40 wt%), E) PBS/miscanthus/compatibilizer (55/40/5 wt%), F)
PBS/miscanthus (50/50 wt%), and G) PBS/miscanthus/compatibilizer (45/50/5 wt%)
Figure 5.8 shows the tan δ curves of PBS and its composites with different weight
percentage fiber loadings. The glass transition temperature (position of tan δ peak maximum) of
the PBS is not affected considerably as content of miscanthus fiber increases up to 50 wt%. In
contrast, the height of the loss factor (tan δ) of the PBS was reduced by incorporation of
miscanthus fibers. This reduction corresponds to the stiffness improvement of the PBS in the
presence of fibers and is evidenced by increase of the E’. The height of the tan δ value was
reduced in the compatibilized composites compared to their corresponding uncompatibilized
counterparts. These reductions were due to the improved interaction between the phases with
addition of compatibilizer. This can be further confirmed by evaluating the interface adhesion
factor (A) between the fiber and matrix.

179
Figure 5.8. Tan δ curves of PBS and its composites: A) neat PBS, B) PBS/miscanthus (70/30
wt%), C) PBS/miscanthus/compatibilizer (65/30/5 wt%), D) PBS/miscanthus (60/40 wt%), E)
PBS/miscanthus/compatibilizer (55/40/5 wt%), F) PBS/miscanthus (50/50 wt%), and G)
PBS/miscanthus/compatibilizer (45/50/5 wt%)
5.3.5 Adhesion factor calculation
From the height of tan δ peak values, Kubar et al., [44] described a methodology to
evaluate degree of interaction between the composite components. When there is strong
interfacial interaction/adhesion between the phases and reduction of macromolecular mobility
around the reinforcement surface, the value of adhesion factor (A) decreases. Thus, lower values
of adhesion factor (A) are evidence of a high degree of interactions between the fibers and the
matrix. According to this methodology, the adhesion/interaction between the fiber and the matrix
can be estimated by adhesion factor (A), which was calculated in the following equation [44]:
A =
– 1 (5.5)
where tan δM (T) and tan δC (T) represent the relative damping values of the neat matrix and the
composite at a given temperature, respectively, and Vf is the volume fraction of fiber.

180
Figure 5.9. Adhesion factor of PBS/miscanthus composites: A) PBS/miscanthus (70/30 wt%),
B) PBS/miscanthus/compatibilizer (65/30/5 wt%), C) PBS/miscanthus (60/40 wt%), D)
PBS/miscanthus/compatibilizer (55/40/5 wt%), E) PBS/miscanthus (50/50 wt%), and F)
PBS/miscanthus/compatibilizer (45/50/5 wt%)
Figure 5.9 shows the adhesion factor values of the composites with respect to
temperatures. Unlike composites with higher fiber content (40 and 50 wt%), the composites with
lower fiber content (30 wt%) showed lower adhesion factor values. Better interfacial interaction
between components in the composites with 30 wt% fibers in contrast to composites with 50
wt% fibers content indicates the lower adhesion factor value. Moreover, the adhesion factor
value of all the compatibilized composites was found to be lower in comparison to that of
corresponding uncompatibilized composites. The lower adhesion factor value may be result of
further enhancement of the interfacial adhesion between the fibers and the matrix in the presence
of compatibilizer.
5.3.6 Heat deflection temperature
HDT value is used to determine physical deformation of a polymeric material at elevated
temperatures with a set of testing conditions. The HDT values of neat PBS and its compatibilized
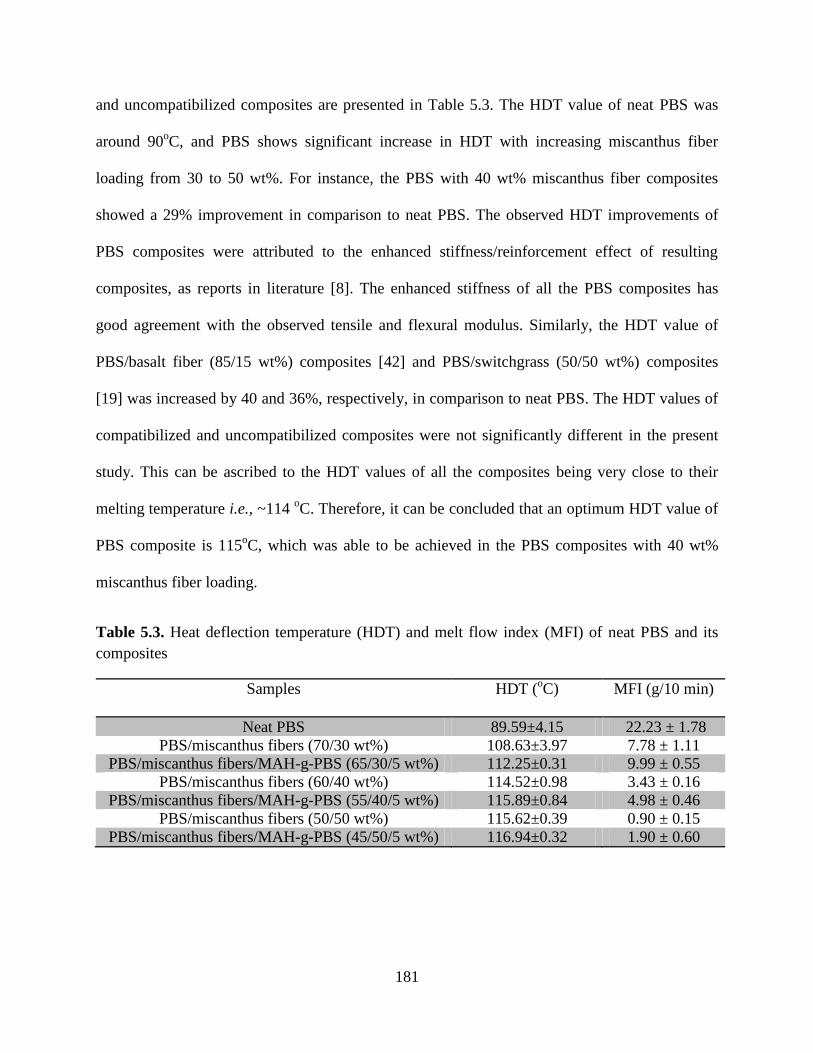
181
and uncompatibilized composites are presented in Table 5.3. The HDT value of neat PBS was
around 90oC, and PBS shows significant increase in HDT with increasing miscanthus fiber
loading from 30 to 50 wt%. For instance, the PBS with 40 wt% miscanthus fiber composites
showed a 29% improvement in comparison to neat PBS. The observed HDT improvements of
PBS composites were attributed to the enhanced stiffness/reinforcement effect of resulting
composites, as reports in literature [8]. The enhanced stiffness of all the PBS composites has
good agreement with the observed tensile and flexural modulus. Similarly, the HDT value of
PBS/basalt fiber (85/15 wt%) composites [42] and PBS/switchgrass (50/50 wt%) composites
[19] was increased by 40 and 36%, respectively, in comparison to neat PBS. The HDT values of
compatibilized and uncompatibilized composites were not significantly different in the present
study. This can be ascribed to the HDT values of all the composites being very close to their
melting temperature i.e., ~114 oC. Therefore, it can be concluded that an optimum HDT value of
PBS composite is 115oC, which was able to be achieved in the PBS composites with 40 wt%
miscanthus fiber loading.
Table 5.3. Heat deflection temperature (HDT) and melt flow index (MFI) of neat PBS and its
composites
Samples
HDT (oC) MFI (g/10 min)
Neat PBS 89.59±4.15 22.23 ± 1.78
PBS/miscanthus fibers (70/30 wt%) 108.63±3.97 7.78 ± 1.11
PBS/miscanthus fibers/MAH-g-PBS (65/30/5 wt%) 112.25±0.31 9.99 ± 0.55
PBS/miscanthus fibers (60/40 wt%) 114.52±0.98 3.43 ± 0.16
PBS/miscanthus fibers/MAH-g-PBS (55/40/5 wt%) 115.89±0.84 4.98 ± 0.46
PBS/miscanthus fibers (50/50 wt%) 115.62±0.39 0.90 ± 0.15
PBS/miscanthus fibers/MAH-g-PBS (45/50/5 wt%) 116.94±0.32 1.90 ± 0.60

182
5.3.7 Melt flow analysis
The melt processability of the PBS and its composites was assessed by MFI analysis.
Table 5.3 represents the effect of fiber content and compatibilizer on the MFI value of PBS
composites. It was found that the MFI value of neat PBS is around 22 g/10 min. Unlike neat
PBS, the MFI value of PBS composites was drastically decreased with increasing fiber content
from 30 to 50 wt%. For example, the lowest MFI value (~1 g/10min) was observed for the
uncompatibilized PBS with 50 wt% miscanthus fiber composites. In general, the ability of
polymer melt flow is hampered in the presence of rigid fibers and fillers. Recently, this type of
MFI reduction was observed in PLA/50 wt% jute fiber composites and PLA/50 wt% hemp fiber
composites by Gunning et al., [45]. However, it is worth noting that all the compatibilized
composites showed a marginal improvement in MFI value when compared to that of
corresponding uncompatibilized composites. This increased MFI value of the compatibilized
composites is attributed to the good fiber dispersion in the matrix, which can enhance the
flowability of composite materials [45]. Over all, the observed MFI value of the PBS composites
is appropriate for injection molding applications [46].
Table 5.4. Summary of differential scanning calorimetry traces of neat PBS and its composites
Samples Tc
(oC)
∆Hc
(J/g)
Tm
(oC)
∆Hm
(J/g)
Crystallinity
(%)
Neat PBS 92.97 69.57 113.39 67.60 61.28
PBS/miscanthus fibers (70/30 wt%) 92.48 48.81 112.95 47.86 61.98
PBS/miscanthus fibers/MAH-g-PBS
(65/30/5 wt%)
92.63 52.06 113.03 51.00 66.03
PBS/miscanthus fibers (60/40 wt%) 92.08 41.46 113.72 41.37 62.51
PBS/miscanthus fibers/MAH-g-PBS
(55/40/5 wt%)
92.33 42.53 114.34 42.47 64.17
PBS/miscanthus fibers (50/50 wt%) 91.71 32.30 114.47 31.45 57.26
PBS/miscanthus fibers/MAH-g-PBS
(45/50/5 wt%)
92.30 32.74 113.61 32.93 59.70

183
5.3.8 Differential scanning calorimetry
The effect of the incorporated miscanthus fibers on the melting temperature (Tm), melting
enthalpy (∆Hm), crystalline temperature (Tc), crystalline enthalpy (∆Hc) and percentage
crystallinity of PBS was analysed by DSC. For PBS and its composites, the DSC second heating
and first cooling cycle results are presented in Figures 5.10 and 5.11, respectively. Table 5.4
shows the melting enthalpy, crystallization enthalpy and percentage crystallinity of PBS before
and after incorporation of miscanthus fibers. The melting temperature and crystallization
temperature of neat PBS are found to be 113 and 93oC, respectively. The melting temperature of
PBS and its composites is very similar, which suggests that the PBS melting temperature is not
affected in the presence of miscanthus fibers.
Figure 5.10. DSC second heating thermograms of PBS and its composites: A) neat PBS, B)
PBS/miscanthus (70/30 wt%), C) PBS/miscanthus/compatibilizer (65/30/5 wt%), D)
PBS/miscanthus (60/40 wt%), E) PBS/miscanthus/compatibilizer (55/40/5 wt%), F)
PBS/miscanthus (50/50 wt%), and G) PBS/miscanthus/compatibilizer (45/50/5 wt%)
A similar trend was observed in crystallization temperature and percentage of
crystallinity of PBS after addition of miscanthus fibers. During the DSC heating cycle, a broad
bimodal melting peak for neat PBS was observed and can be attributed to the

184
meltrecrystallization phenomena. This bimodal melting peak of PBS became more distinct after
addition of miscanthus fibers. PBS crystallinity percentage was not heavily affected after
incorporation of miscanthus fibers; consequently, it can be expected that the biodegradability of
the PBS composites will be similar to that of neat PBS [47].
Figure 5.11. DSC first cooling thermograms of PBS and its composites: A) neat PBS, B)
PBS/miscanthus (70/30 wt%), C) PBS/miscanthus/compatibilizer (65/30/5 wt%), D)
PBS/miscanthus (60/40 wt%), E) PBS/miscanthus/compatibilizer (55/40/5 wt%), F)
PBS/miscanthus (50/50 wt%), and G) PBS/miscanthus/compatibilizer (45/50/5 wt%)
5.3.9 Morphological analysis
SEM was employed to investigate the interfacial bonding between the component in the
composites and the degree of fiber dispersion in the matrix. The tensile fractured surface
morphology of uncompatibililized and compatibilized PBS composites with different fiber
loadings is presented in Figures 5.11 and 5.12. SEM micrographs of uncompatibilized
composites (Figure 5.12) reveal interfacial gaps between the fiber and the matrix, poor fiber
wetting, fibers pullout traces, and poor dispersion of fibers in the matrix. Such phenomena can
clearly be observed in higher (500x) magnification SEM images (Figure 5.12. b, d and f). A

185
similar observation has been reported in PLA/kenaf composites [40], PHBV/kenaf composites
[39], PHBV/PLA/miscanthus composites [8], PBS/bamboo composites [48], PBS/kenaf fiber
composites [38] and PP/bio-flour composites [29]. In addition, increased fiber
bundles/aggregates are evident with increasing fiber content up to 50 wt%. This is possibly due
to an increase fiber-fiber interaction with increasing fiber contents in the matrix, which could
hinder the interaction between the phases in the composites [49]. This contributes to a reduction
in the tensile strength of resulting PBS composites with increasing fiber content from 30 to 50
wt%. It is well documented that most of the natural fibers are not compatible with a hydrophobic
polymer matrix, this lack of compatibility is responsible for fiber debonding from the matrix
during tensile fracture [29, 50]. Figure 5.12 shows SEM micrographs of compatibilized PBS
composites at lower (150x) and higher (500x) magnification. All the compatibilized composites
clearly showed paucity of fiber pullout traces from the matrix, good fiber dispersion in the
matrix, and fibers wholly embedded into the PBS matrix due to strong adhesion at the interfacial
regions compared to that of uncompatibilized composites. These observations are more
pronounced in higher (500x) magnification SEM micrographs (Figure 5.12. b, d and f). In the
compatibilized composites, it can be seen (Figure 5.13) that many fibers are coated with PBS
matrix without the interfacial gap formation. This result was attributed to the enhanced
fiber/matrix adhesion with the help of a reactive compatibilizer [29]. Consequently, all the
compatibilized composites enhanced mechanical performances as compared to their
corresponding uncompatibilized composites, which is also consistent with the observed lower
adhesion factor A values of compatibilized composites. Similar findings have been recently
reported for the compatibilized PBS/kenaf fiber composites [38].

186
Figure 5.12. SEM micrographs of tensile fractured surface of uncompatibilized PBS composites
with low (150x) and high (500x) magnification; (a) and (b) are PBS/miscanthus (70/30 wt%)
composites; (c) and (d) are PBS/miscanthus (60/40 wt%) composites; (e) and (f) are
PBS/miscanthus (50/50 wt%) composites.

187
Figure 5.13. SEM micrographs of tensile fractured surface of compatibilized PBS composites
with low (150x) and high (500x) magnification; (a) and (b) are PBS/miscanthus (70/30 wt%)
composites; (c) and (d) are PBS/miscanthus (60/40 wt%) composites; (e) and (f) are
PBS/miscanthus (50/50 wt%) composites.

188
5.4 Conclusions
Biocomposites from PBS and miscanthus fibers were successfully prepared by extrusion
and injection molding methods with different fiber loadings. The performances of the resulting
composites were evaluated based on mechanical, thermo-mechanical, and morphological
properties. The strong reinforcing effect of micanthus fibers led to an increase in the
stiffness/modulus of resulting PBS composites. The tensile strength of uncompatibilized
PBS/miscanthus composites was much lower compared to that of neat PBS. Unlike tensile
strength, the flexural and impact strengths were significantly enhanced after incorporation of
miscanthus fibers into the PBS matrix. The enhanced flexural strength was attributed to the
reinforcing effect of miscathus fibers. The fiber pullout mechanism is likely responsible for the
observed impact strength improvement. Addition of 5 wt% MAH-g-PBS into PBS composites
resulted a significant improvement in tensile and flexural strength compared to the corresponding
uncompatibilized composites and neat matrix. For example, the PBS composites with 50 wt%
miscanthus and 5 wt% MAH-g-PBS resulted in 22, 139 and 47% improvements in tensile,
flexural and impact strength compared to neat PBS. These improvements were attributed to the
enhanced interfacial interaction between the components, as confirmed by adhesion parameter
values and by surface morphological analysis. Furthermore, the enhanced thermo-mechanical
properties were consistent with tensile and flexural modulus. Although, the MFI value of the
PBS was considerably reduced after incorporation of miscanthus fibers, the observed MFI value
of the PBS composites is still appropriate for the injection molding process. Because the PBS
crystallinity was not affected by incorporation of miscanthus fibers, it can be expected that the
biodegradability of the PBS composites will be similar to that of neat PBS.

189
References
[1] M. P. M. Dicker, P. F. Duckworth, A. B. Baker, G. Francois, M. K. Hazzard, P. M.
Weaver, Green composites: A review of material attributes and complementary
applications, Composites Part A: Applied Science and Manufacturing, 2014, 56 (0): 280-
289.
[2] F. P. La Mantia, M. Morreale, Green composites: A brief review, Composites Part A:
Applied Science and Manufacturing, 2011, 42 (6): 579-588.
[3] G. Koronis, A. Silva, M. Fontul, Green composites: A review of adequate materials for
automotive applications, Composites Part B: Engineering, 2013, 44 (1): 120-127.
[4] E. Zini, M. Scandola, Green composites: An overview, Polymer Composites, 2011, 32
(12): 1905-1915.
[5] M. Zhou, J. Yan, Y. Li, C. Geng, C. He, K. Wang, Q. Fu, Interfacial strength and
mechanical properties of biocomposites based on ramie fibers and poly(butylene
succinate), RSC Advances, 2013, 3 (48): 26418-26426.
[6] A. Hamma, M. Kaci, Z. A. Mohd Ishak, A. Pegoretti, Starch-grafted-polypropylene/kenaf
fibres composites. Part 1: Mechanical performances and viscoelastic behaviour,
Composites Part A: Applied Science and Manufacturing, 2014, 56 (0): 328-335.
[7] G. Gamon, P. Evon, L. Rigal, Twin-screw extrusion impact on natural fibre morphology
and material properties in poly(lactic acid) based biocomposites, Industrial Crops and
Products, 2013, 46 (0): 173-185.
[8] M. R. Nanda, M. Misra, A. K. Mohanty, Performance Evaluation of Biofibers and Their
Hybrids as Reinforcements in Bioplastic Composites, Macromolecular Materials and
Engineering, 2013, 298 (7): 779-788.

190
[9] K. Kirwan, R. M. Johnson, D. K. Jacobs, G. F. Smith, L. Shepherd, N. Tucker,
Enhancing properties of dissolution compounded Miscanthus giganteus reinforced
polymer composite systems: Part 1. Improving flexural rigidity, Industrial Crops and
Products, 2007, 26 (1): 14-27.
[10] M. Johnson, N. Tucker, S. Barnes, K. Kirwan, Improvement of the impact performance
of a starch based biopolymer via the incorporation of Miscanthus giganteus fibres,
Industrial Crops and Products, 2005, 22 (3): 175-186.
[11] A. Bourmaud, S. Pimbert, Investigations on mechanical properties of poly(propylene)
and poly(lactic acid) reinforced by miscanthus fibers, Composites Part A: Applied
Science and Manufacturing, 2008, 39 (9): 1444-1454.
[12] R. M. Johnson, N. Tucker, S. Barnes, Impact performance of Miscanthus/Novamont
Mater-Bi® biocomposites, Polymer Testing, 2003, 22 (2): 209-215.
[13] V. Nagarajan, A. K. Mohanty, M. Misra, Sustainable Green Composites: Value Addition
to Agricultural Residues and Perennial Grasses, ACS Sustainable Chemistry &
Engineering, 2013, 1 (3): 325-333.
[14] O. Faruk, A. K. Bledzki, H.-P. Fink, M. Sain, Progress Report on Natural Fiber
Reinforced Composites, Macromolecular Materials and Engineering, 2014, 299 (1): 9-26.
[15] T. Yu, N. Jiang, Y. Li, Study on short ramie fiber/poly(lactic acid) composites
compatibilized by maleic anhydride, Composites Part A: Applied Science and
Manufacturing, 2014, 64 (0): 139-146.
[16] M. J. A. van den Oever, H. W. Elbersen, E. R. P. Keijsers, R. J. A. Gosselink, B. de
Klerk-Engels, Switchgrass (Panicum virgatumL.) as a reinforcing fibre in polypropylene
composites, Journal of Materials Science, 2003, 38 (18): 3697-3707.

191
[17] G. Dorez, A. Taguet, L. Ferry, J. M. Lopez-Cuesta, Thermal and fire behavior of natural
fibers/PBS biocomposites, Polymer Degradation and Stability, 2013, 98 (1): 87-95.
[18] S. M. Lee, D. Cho, W. H. Park, S. G. Lee, S. O. Han, L. T. Drzal, Novel
silk/poly(butylene succinate) biocomposites: the effect of short fibre content on their
mechanical and thermal properties, Composites Science and Technology, 2005, 65 (3–4):
647-657.
[19] S. Sahoo, M. Misra, A. K. Mohanty, Effect of compatibilizer and fillers on the properties
of injection molded lignin-based hybrid green composites, Journal of Applied Polymer
Science, 2013, 127 (5): 4110-4121.
[20] H.-S. Kim, H.-J. Kim, J.-W. Lee, I.-G. Choi, Biodegradability of bio-flour filled
biodegradable poly(butylene succinate) bio-composites in natural and compost soil,
Polymer Degradation and Stability, 2006, 91 (5): 1117-1127.
[21] Y. J. Phua, W. S. Chow, Z. A. Mohd Ishak, The hydrolytic effect of moisture and
hygrothermal aging on poly(butylene succinate)/organo-montmorillonite
nanocomposites, Polymer Degradation and Stability, 2011, 96 (7): 1194-1203.
[22] F. Sliwa, N.-e. El Bounia, G. Marin, F. Charrier, F. Malet, A new generation of wood
polymer composite with improved thermal stability, Polymer Degradation and Stability,
2012, 97 (4): 496-503.
[23] D. N. Saheb, J. P. Jog, Natural fiber polymer composites: A review, Advances in
Polymer Technology, 1999, 18 (4): 351-363.
[24] F. Ramsteiner, R. Theysohn, Tensile and impact strengths of unidirectional, short fibre-
reinforced thermoplastics, Composites, 1979, 10 (2): 111-119.

192
[25] J. Wu, D. Yu, C.-M. Chan, J. Kim, Y.-W. Mai, Effect of fiber pretreatment condition on
the interfacial strength and mechanical properties of wood fiber/PP composites, Journal
of Applied Polymer Science, 2000, 76 (7): 1000-1010.
[26] D. A. Norman, R. E. Robertson, The effect of fiber orientation on the toughening of short
fiber-reinforced polymers, Journal of Applied Polymer Science, 2003, 90 (10): 2740-
2751.
[27] Á. Csikós, G. Faludi, A. Domján, K. Renner, J. Móczó, B. Pukánszky, Modification Of
Interfacial Adhesion With A Functionalized Polymer In Pla/Wood Composites, European
Polymer Journal, 2015, 68 (0): 592–600.
[28] C. Nyambo, A. K. Mohanty, M. Misra, Effect of Maleated Compatibilizer on
Performance of PLA/Wheat Straw-Based Green Composites, Macromolecular Materials
and Engineering, 2011, 296 (8): 710-718.
[29] H.-S. Kim, B.-H. Lee, S.-W. Choi, S. Kim, H.-J. Kim, The effect of types of maleic
anhydride-grafted polypropylene (MAPP) on the interfacial adhesion properties of bio-
flour-filled polypropylene composites, Composites Part A: Applied Science and
Manufacturing, 2007, 38 (6): 1473-1482.
[30] T. J. Keener, R. K. Stuart, T. K. Brown, Maleated coupling agents for natural fibre
composites, Composites Part A: Applied Science and Manufacturing, 2004, 35 (3): 357-
362.
[31] A. K. Mohanty, M. Misra, L. T. Drzal, Surface modifications of natural fibers and
performance of the resulting biocomposites: An overview, Composite Interfaces, 2001, 8
(5): 313-343.

193
[32] R. Csizmadia, G. Faludi, K. Renner, J. Móczó, B. Pukánszky, PLA/wood biocomposites:
Improving composite strength by chemical treatment of the fibers, Composites Part A:
Applied Science and Manufacturing, 2013, 53 (0): 46-53.
[33] P. Müller, K. Renner, J. Móczó, E. Fekete, B. Pukánszky, Thermoplastic starch/wood
composites: Interfacial interactions and functional properties, Carbohydrate Polymers,
2014, 102 (0): 821-829.
[34] G. Faludi, J. Hári, K. Renner, J. Móczó, B. Pukánszky, Fiber association and network
formation in PLA/lignocellulosic fiber composites, Composites Science and Technology,
2013, 77 (0): 67-73.
[35] G. Faludi, G. Dora, K. Renner, J. Móczó, B. Pukánszky, Improving interfacial adhesion
in pla/wood biocomposites, Composites Science and Technology, 2013, 89 (0): 77-82.
[36] G. Faludi, G. Dora, B. Imre, K. Renner, J. Móczó, B. Pukánszky, PLA/lignocellulosic
fiber composites: Particle characteristics, interfacial adhesion, and failure mechanism,
Journal of Applied Polymer Science, 2014, 131 (4): 39902.
[37] R. Muthuraj, M. Misra, A. K. Mohanty, Hydrolytic degradation of biodegradable
polyesters under simulated environmental conditions, Journal of Applied Polymer
Science, 2015, 132, 42189.
[38] M. Z. A. Thirmizir, Z. A. M. Ishak, R. M. Taib, S. Rahim, S. M. Jani, Kenaf-bast-fiber-
filled biodegradable poly(butylene succinate) composites: Effects of fiber loading, fiber
length, and maleated poly(butylene succinate) on the flexural and impact properties,
Journal of Applied Polymer Science, 2011, 122 (5): 3055-3063.
[39] M. Avella, G. Bogoeva-Gaceva, A. Buzõarovska, M. Emanuela Errico, G. Gentile, A.
Grozdanov, Poly(3-hydroxybutyrate-co-3-hydroxyvalerate)-based biocomposites

194
reinforced with kenaf fibers, Journal of Applied Polymer Science, 2007, 104 (5): 3192-
3200.
[40] M. Avella, G. Bogoeva-Gaceva, A. Bužarovska, M. E. Errico, G. Gentile, A. Grozdanov,
Poly(lactic acid)-based biocomposites reinforced with kenaf fibers, Journal of Applied
Polymer Science, 2008, 108 (6): 3542-3551.
[41] M.S. Huda, L.T. Drazel, D. Ray, A.K. Mohanty, M. Misra, Natural-fiber composites in
the automotive sector: In, Properties and Perfromance of Natural-Fiber Composites
(Edt:K Pickering), Woodhead Publishing Limited, England, 248, 2008.
[42] Y. Zhang, C. Yu, P. K. Chu, F. Lv, C. Zhang, J. Ji, R. Zhang, H. Wang, Mechanical and
thermal properties of basalt fiber reinforced poly(butylene succinate) composites,
Materials Chemistry and Physics, 2012, 133 (2–3): 845-849.
[43] V. Tserki, P. Matzinos, N. E. Zafeiropoulos, C. Panayiotou, Development of
biodegradable composites with treated and compatibilized lignocellulosic fibers, Journal
of Applied Polymer Science, 2006, 100 (6): 4703-4710.
[44] J. Kubát, M. Rigdahl, M. Welander, Characterization of interfacial interactions in high
density polyethylene filled with glass spheres using dynamic-mechanical analysis,
Journal of Applied Polymer Science, 1990, 39 (7): 1527-1539.
[45] M. A. Gunning, L. M. Geever, J. A. Killion, J. G. Lyons, C. L. Higginbotham,
Improvement in mechanical properties of grafted polylactic acid composite fibers via hot
melt extrusion, Polymer Composites, 2014, 35 (9): 1792-1797.
[46] http://www.mondigroup.com/products/PortalData/1/Resources/products_services/packagi
ng/kr aft_papers/brochures/FIBROMER_Broschuere_Low_Res.pdf.

195
[47] Y. Du, T. Wu, N. Yan, M. T. Kortschot, R. Farnood, Fabrication and characterization of
fully biodegradable natural fiber-reinforced poly(lactic acid) composites, Composites
Part B: Engineering, 2014, 56 (0): 717-723.
[48] S. Lee, S. Wang, Biodegradable polymers/bamboo fiber composite with bio-based
coupling agent, Composites Part A: Applied Science and Manufacturing, 2006, A37 80 -
91.
[49] M. N. Islam, M. R. Rahman, M. M. Haque, M. M. Huque, Physico-mechanical properties
of chemically treated coir reinforced polypropylene composites, Composites Part A:
Applied Science and Manufacturing, 2010, 41 (2): 192-198.
[50] H. Demir, U. Atikler, D. Balköse, F. Tıhmınlıoğlu, The effect of fiber surface treatments
on the tensile and water sorption properties of polypropylene–luffa fiber composites,
Composites Part A: Applied Science and Manufacturing, 2006, 37 (3): 447-456.
[51] L. Bao, Y. Chen, W. Zhou, Y. Wu, Y. Huang, Bamboo fibers @ poly(ethylene glycol)-
reinforced poly(butylene succinate) biocomposites, Journal of Applied Polymer Science,
2011, 122 (4): 2456-2466.
[52] H.-S. Kim, B.-H. Lee, S. Lee, H.-J. Kim, J. Dorgan, Enhanced interfacial adhesion,
mechanical, and thermal properties of natural flour-filled biodegradable polymer bio-
composites, Journal of Thermal Analysis and Calorimetry, 2011, 104 (1): 331-338.
[53] S. Ok Han, S. Muk Lee, W. Ho Park, D. Cho, Mechanical and thermal properties of
waste silk fiber-reinforced poly(butylene succinate) biocomposites, Journal of Applied
Polymer Science, 2006, 100 (6): 4972-4980.

196
Chapter 6: Mechanical Performances of Biocomposites Made From Miscanthus Fibers and
Poly(butylene adipate-co-terephthalate) Matrix
Abstract
Miscanthus fibers reinforced biodegradable poly(butylene adipate-co-terephthalate)
(PBAT) based biocomposite was successfully produced by traditional melt processing methods.
The material properties of the produced PBAT/miscanthus composites were evaluated by means
of mechanical, thermal and morphological properties. Compared to neat PBAT, the flexural
properties, and tensile modulus were increased after the incorporation of miscanthus fibers into
the PBAT matrix. These improvements were attributed to the strong reinforcing effect of
miscanthus fibers. Relatively high hydrophilic nature of the miscanthus fibers and the relatively
high hydrophobic character of PBAT matrix lead to weak interfacial interaction between the
components in the resulting PBAT/miscanthus composites. This weak interface was evidenced in
the impact and tensile strength of the uncompatibilized PBAT composite. The interfacial
bonding between the miscanthus fibers and PBAT was modified with 5 wt% of maleic anhydride
grafted PBAT (MAH-g-PBAT) as a reactive compatibilizer. In the compatibilized PBAT
composites, the improved interfacial interaction between the PBAT and the miscanthus fiber was
corroborated with mechanical, thermal and morphological properties. The compatibilized PBAT
composite with 40 wt% miscanthus fibers exhibited an average heat deflection temperature of
81oC, notched Izod impact strength of 184 J/m, tensile strength of 19.4 MPa, and flexural
strength of 22 MPa. From the scanning electron microscopy analysis, a better interfacial
interaction between the components can be observed in the compaitibilized PBAT composites,
which contribute to enhanced mechanical properties.

197
6.1 Introduction
Natural fiber composites (biocomposites) are an attractive material for many applications
because natural fibers are renewable, sustainable, low cost, lightweight, environmental friendly
nature and easy processing. Recently, biodegradable polymer matrix based biocomposites are
widely studied because of some environmental impacts such as waste disposal of non-
biodegradable plastic based materials. Among the biodegradable polymers, poly(butylene
adipate-co-terephthalate) (PBAT) is an aliphatic-aromatic copolyester, which is typically
synthesized from fossil fuel based monomers. PBAT has properties similar to non-biodegradable
polymers like polyethylene. However, the high cost, low heat resistance property, inferior
stiffness and strength are major shortcomings of the PBAT to extend its applications. These
shortcomings can be overcome by the addition of natural fibers/fillers into PBAT matrix. In
order to reduce the cost of PBAT, Muniyasamy et al., [1] and Torres et al., [2] prepared
biocomposite from PBAT and biofuel industry co-products. Due to the polarity difference
between the natural fibers/fillers and polymer matrices, most of the biocomposites are not
compatible between the phases. As a result, chemically modified (sulphuric acid hydrolysis,
silanization and acetylation) curua fibers reinforced PBAT biocomposites were investigated by
Marques et al., [3]. The authors suggest that the chemically modified curua fibers were enhanced
the performance of the resulting biocomposites owing to improve the fiber-matrix
interaction/adhesion. Similarly, PBAT/peanut husk composites were prepared with and without
maleic anhydride grafted PBAT (MAH-g-PBAT) compatibilizer [4]. The compatibilized
PBAT/peanut husk composites exhibited superior mechanical properties than that of
uncompatibilized composites and neat PBAT. Furthermore, the degradability of PBAT,
compatibilized PBAT/peanut husk composites and uncompatibilized PBAT/peanut husk
composites were investigated under biological environments [4]. It has been found that the

198
compatibilized PBAT/peanut husk composites showed slightly lower degradation rate than
corresponding uncompatibilized composites. Interestingly, the rate of PBAT biodegradation was
enhanced after incorporation of natural fillers into PBAT [4]. This observation had good
agreement with another study investigated by Muniyasamy et al., [1].
Perennial grasses are good candidate for polymer matrix based composite applications
because of its good fiber properties [5] and reducing “food Versus fuel” competition. Very
limited literature is available for perennial grass (switchgrass, miscanthus, indiangrass,
napiergrass, Arundo donax L, big bluestem, little bluestem, et al.,,) reinforced polymer
composites. Miscanthus (elephant grass) is a typical lignocellulosic C4 grass, which grows in
North America, Europe and Asia. Miscanthus is mostly used for biofuel production and animal
bedding uses. Furthermore, miscanthus fiber based composites are developed for packaging
application under the name of SunaturaTM
[6]. Only few researchers have been investigated the
performance of miscanthus fiber reinforced biocomposites. Consequently, the present study was
aimed to produce a biocomposite from PBAT and miscanthus fibers. In addition, this study was
also employed to improve the compatibility between the PBAT matrix and the miscanthus fibers
by a reactive compatibilization strategy.
6.2 Materials
Commercially available Oyster white PBAT pellets (Biocosafe 2003) were purchased
from Xinfu Pharmaceutical Co., Ltd, China. According to the manufacturer, the density and
melting temperature of PBAT are 1.26 g/cm3 and 110-115
oC, respectively. New Energy Farms,
Ontario, Canada, kindly provided miscanthus fibers with an average length of 4.65±2.5 mm. It
was used as received without further purification and/or modification. In this work, a maleic
anhydride grafted PBAT (MAH-g-PBAT) was used as a compatibilizer. A detailed MAH-g-

199
PBAT (MAH grafting level 1.9%) was explained in Chapter 4. Melt flow index (MFI) value of
the MAH-g-PBAT was measured at 190oC with 2.16 kg load according of ASTM D1238. The
MFI value of the MAH-g-PBAT was 44.46±9.96 g/10 min.
6.3 Biocomposite fabrication method
Both PBAT granules and miscanthus fibers were dried at 80oC for 10 h before
composites fabrication. The composite preparation was performed in a lab-scale extrusion and
injection molding technique. The extrusion process was carried out in a co-rotating twin-screw
extruder (DSM Xplore®, The Netherlands) with a barrel volume of 15cc. In order to produce
desired test specimens, the molten extrudate was immediately transferred into 12cc injection
molding device (DSM Xplore®, The Netherland). The extrusion processing was conducted at
140oC for 2 min while screw speed kept constant at 100 rpm and injection mould temperature of
30oC. All the samples including neat PBAT, compatibilized and uncompatibilized composites
were prepared using above said processing conditions. In the present study, the compatibilizer
(MAH-g-PBAT) concentration was fixed at 5 wt% for all the compatibilized composites
preparation. The chosen compatiblizer concentration (5 wt%) was based on optimal
performances of the composites in our previous work (Chapter 5).
6.4 Characterization methods
Tensile, flexural and impact properties of the PBAT and its composites were measured
according to the procedure reported in Chapter 5 (Section 5.2.4). The heat deflection temperature
(HDT), melt flow index (MFI) and fracture surface morphology of the samples were analyzed
based on the procedure reported in Chapter 5 (Section 5.2.6, 5.2.7 and 5.2.9).

200
6.5 Results and Discussion
6.5.1 Mechanical properties
The tensile properties of the neat PBAT and its composites are presented in Figure 6.1.
Neat PBAT had an average tensile strength of 20 MPa. There was a significant reduction in
tensile strength of PBAT after incorporation of miscanthus fibers; this reduction, suggesting that
the compatibility between the PBAT and miscanthus was not sufficient [4]. Similar trend has
been noticed in the PBAT/peanut husk composites [4] and PBAT/sisal fiber composites [7]. In
the presence of compatibilizer (MAH-g-PBAT), the PBAT/miscanthus fiber composites showed
a substantial increase in tensile strength as compared to uncompatibilized PBAT/misccanthus
composites. The observed increased in tensile strength for the compatibilized composite was
attributed to the enhanced compatibility between the components. This observation agreed with
other research works reported elsewhere for PBAT composites [4, 7]. The tensile modulus of the
PBAT was increased with the addition of miscanthus fibers, which can be attributed to the strong
reinforcing capability of miscanthus fibers in the PBAT matrix. The modulus of compatibilized
and uncompatibilized composites was not different. A maximum tensile modulus (~700 MPa)
was observed in the PBAT composite with 40 wt% fiber loading. The observed tensile strength
and modulus values of PBAT/miscnthus fiber composites are comparable with low-density
polyethylene (LDPE) [8].

201
Figure 6.1. Tensile strength and tensile modulus of PBAT and its composites; (A) neat PBAT,
(B) PBAT/miscanthus fibers (70/30 wt%), (C) PBAT/miscanthus fibers/MAH-g-PBAT (65/30/5
wt%), (D) PBAT/miscanthus fibers (60/40 wt%), and (E) PBAT/miscanthus fibers/MAH-g-
PBAT (65/30/5 wt%)
The flexural properties of the PBAT and its composites are depicted in Figure 6.2. Both
flexural modulus and flexural strength of PBAT were increased with increasing miscanthus fiber
content up to 40 wt%. Zhang et al., [9] also observed such a type of flexural properties
improvement in the miscanthus fiber reinforced toughened green composites. In another study by
Kirwan et al., [10] found that the flexural properties of the composites with miscanthus were
superior compared to their matrix of the composite. They concluded that the enhanced flexural
properties were attributed to the strong reinforcing effect of miscanthus fibers in the matrix. In
the present study, the flexural strength of the compatibilized composites was higher compared to
their uncompatibilized counterparts and neat PBAT. The enhanced flexural strength of the
compatibilized composite has same trend like tensile strength of compatibilized composites.

202
Figure 6.2. Flexural properties of PBAT and its compatibilized and uncompatibilized
composites: (A) neat PBAT, (B) PBAT/miscanthus fibers (70/30 wt%), (C) PBAT/miscanthus
fibers/MAH-g-PBAT (65/30/5 wt%), (D) PBAT/miscanthus fibers (60/40 wt%), and (E)
PBAT/miscanthus fibers/MAH-g-PBAT (65/30/5 wt%).
Notched Izod impact test result of the neat PBAT and its composites are demonstrated in
Figure 6.3. Neat PBAT showed non-break impact strength while PBAT composites showed
hinge break impact strength under selected test conditions. There was a significant reduction in
impact strength after incorporation of 30 wt% miscanthus fibers into the PBAT matrix. This
impact strength reduction was more pronounced in the PBAT composite with the addition of 40
wt% miscanthus fiber. A similar trend was observed in the composites produced from
miscanthus fiber and toughen polymer matrix [9]. In this study, the compatibilized composites
yielded better impact strength compared to their corresponding uncompatibilized composites. In
particular, the impact strength of PBAT/miscanthus/MAH-g-PBAT (55/40/5 wt%) composites
showed 76% improvement in comparison to uncompatibilized PBAT/miscanthus (60/40 wt%)
composites. The observed effect of compatibilization upon the impact strength of resulting

203
PBAT/miscanthus composites is consistent with compatibilized miscanthus fiber reinforced
toughen biocomposites impact strength [9].
Figure 6.3. Notched Izod impact strength of PBAT and its compatibilized and uncompatibilized
composites: (A) neat PBAT, (B) PBAT/miscanthus fibers (70/30 wt%), (C) PBAT/miscanthus
fibers/MAH-g-PBAT (65/30/5 wt%), (D) PBAT/miscanthus fibers (60/40 wt%), and (E)
PBAT/miscanthus fibers/MAH-g-PBAT (65/30/5 wt%)
6.5.2 Melt flow index and Heat deflection temperature
Table 6.1 summarises the melt flow index (MFI) and heat deflection temperatures (HDT)
of the neat PBAT, as well as uncompatibilized and compatibilized composites. MFI is one of the
important properties for composite materials because it can determine the possible processing
methods for different application. The MFI of the PBAT composites was lower than that of neat
PBAT. The observed MFI value reduction of the PBAT composites was attributed to the
restriction of polymer chain mobility in the presence of fibers. Due to the high MFI value of the
MAH-g-PBAT compatibilizer (44.46±9.96 g/10 min), the compatibilized PBAT/miscanthus
composites showed slightly high MFI value compared to their corresponding uncompatibilized
composites. The observed MFI values of the both compatibilized and uncompatibilized PBAT
composites are not high enough for mass production of household injection moulding articles

204
[12]. The low MFI value of PBAT composites could be modified by the addition of flow
additives. Table 6.1 depicts the HDT values of neat PBAT and its composites with different
concentration of miscanthus fibers. It can be seen that the HDT value of PBAT was around 46oC.
The HDT value of PBAT composites was considerably higher compared to that of neat PBAT.
This increased HDT value of PBAT composites was attributed to the increased stiffness of the
resulting composites. The HDT value of the composite was more pronounced in the presence of
compatibilizer. This may be due to the enhanced compatibility between components as discussed
earlier. Such HDT improvement has been observed in the compatibilized perennial grass
reinforced biocomposites [9, 11].
Table 6.1. Melt flow index (MFI) and heat deflection temperature (HDT) measurement
Samples MFI (g/10 min) @
190oC with 2.16 kg
HDT (oC)
Neat PBAT 9.4±1.8 46.12 ± 1.5
PBAT/miscanthus (70/30 wt%) 1.28±0.13 67.56±2.05
PBAT/miscanthus/MAH-g-PBAT
(65/30/5 wt%)
1.47±0.10 70.92±2.75
PBAT/miscanthus (60/40 wt%) 1.19±0.09 75.74±1.11
PBAT/miscanthus/MAH-g-PBAT
(55/40/5 wt%)
1.59±0.12 80.72±1.97
6.5.3 Scanning electron microscopy
Figure 6.4 shows the SEM micrographs of tensile fractured compatibilized and
uncompatibilized PBAT composites. In the uncompatibilized composites (Figure 6.4 A), there is
a clear evidence for lack of adhesion between the fibers and matrix phase and fiber pullout.
Furthermore, the fibers were not completely coated with PBAT matrix in the resulting
uncompatibilized composite. This suggests that the affinity between the matrix and fibers is very

205
poor. The observed insufficient interaction between the components is responsible for the
inferior mechanical performance of uncompatibilized PBAT composites. On the other hand, the
compatibilized PBAT/miscanthus fiber composites morphology (Figure 6.4 B) showed better
interfacial adhesion and the miscanthus fibers were well embedded with PBAT matrix. Unlike
uncompatibilized composites, most of the fibers were covered by PBAT matrix in the composites
with compatibilizer, indicating that the compatibilizer (MAH-g-PBAT) played a crucial role to
enhance the interfacial bonding between the phases. Consequently, the compatibilized
composites can lead to stronger stress transfer between the phase compared the PBAT
composites without compatibilizer. The enhanced compatibility between the PBAT and
miscanthus fibers was consistant with its mecahcnial properties.
Figure 6.4. SEM micrographs of uncompatibilized PBAT/misanthus fibers (60/40 wt%)
composites (A) and compatibilized PBAT/misanthus fibers/MAH-g-PBAT (55/40/5 wt%)
composites (B)
6.6 Conclusions
The effect of miscanthus fibers on the performance of PBAT/miscanthus fiber composite
was examined. Due to strong reinforcing effect of miscanthus fibers in the PBAT matrix, the
stiffness of the resulting PBAT/miscanthus composites is higher than neat PBAT. At the same

206
time, the tensile strength and impact strength had negative effect on the addition of miscanthus
fibers into PBAT matrix. This detrimental effect of the uncompatibilized composites tensile
strength and impact strength was considerably improved by compatibilization strategy. The
compatibilized PBAT/miscanthus composites exhibited superior performances more than that of
uncompatibilized composites. The enhanced compatibility was confirmed by microscopic
analysis. Overall, the compatibilized PBAT composite with 40 wt% miscanthus fibers showed a
maxima improvement in mechanical properties. As a result, the prepared sustainable
PBAT/miscanthus composite is possible alternative for non-biodegradable composite materials.
References
[1] S. Muniyasamy, M. M. Reddy, M. Misra, A. Mohanty, Biodegradable green composites
from bioethanol co-product and poly(butylene adipate-co-terephthalate), Industrial Crops
and Products, 2013, 43 (0): 812-819.
[2] S. Torres, R. Navia, R. Campbell Murdy, P. Cooke, M. Misra, A. K. Mohanty, Green
Composites from Residual Microalgae Biomass and Poly(butylene adipate-co-
terephthalate): Processing and Plasticization, ACS Sustainable Chemistry and
Engineering, 2015, 3 (4): 614-624.
[3] M. V. Marques, J. Lunz, V. Aguiar, I. Grafova, M. Kemell, F. Visentin, A. Sartori, A.
Grafov, Thermal and Mechanical Properties of Sustainable Composites Reinforced with
Natural Fibers, Journal of Polymers and the Environment, 2014, 1-10.
[4] C.-S. Wu, Utilization of peanut husks as a filler in aliphatic–aromatic polyesters:
Preparation, characterization, and biodegradability, Polymer Degradation and Stability,
2012, 97 (11): 2388-2395.

207
[5] W. Liu, A. K. Mohanty, P. Askeland, L. T. Drzal, M. Misra, Influence of fiber surface
treatment on properties of Indian grass fiber reinforced soy protein based biocomposites,
Polymer, 2004, 45 (22): 7589-7596.
[6] http://sunatura.newenergyfarms.com/blended.html (accessed on November, 2015)
[7] C.-S. Wu, Process, Characterization and Biodegradability of Aliphatic Aromatic
Polyester/Sisal Fiber Composites, Journal of Polymers and the Environment, 2011, 19
(3): 706-713.
[8] J. Morawiec, A. Pawlak, M. Slouf, A. Galeski, E. Piorkowska, N. Krasnikowa,
Preparation and properties of compatibilized LDPE/organo-modified montmorillonite
nanocomposites, European Polymer Journal, 2005, 41 (5): 1115-1122.
[9] K. Zhang, M. Misra, A. K. Mohanty, Toughened Sustainable Green Composites from
Poly(3-hydroxybutyrate-co-3-hydroxyvalerate) Based Ternary Blends and Miscanthus
Biofiber, ACS Sustainable Chemistry and Engineering, 2014, 2 (10): 2345-2354.
[10] K. Kirwan, R. M. Johnson, D. K. Jacobs, G. F. Smith, L. Shepherd, N. Tucker,
Enhancing properties of dissolution compounded Miscanthus giganteus reinforced
polymer composite systems: Part 1. Improving flexural rigidity, Industrial Crops and
Products, 2007, 26 (1): 14-27.
[11] V. Nagarajan, M. Misra, A. K. Mohanty, New engineered biocomposites from poly(3-
hydroxybutyrate-co-3-hydroxyvalerate) (PHBV)/poly(butylene adipate-co-terephthalate)
(PBAT) blends and switchgrass: Fabrication and performance evaluation, Industrial
Crops and Products, 2013, 42 (0): 461-468.
[12] A. V. Shenoy, D. R. Saini, Melt flow index: More than just a quality control rheological
parameter. Part I, Advances in Polymer Technology, 1986, 6 (1): 1-58.

208
Chapter 7: Biocomposites Consisting of Miscanthus Fibres in a Biodegradable Binary
Blend Matrix: Preparation and Performance Evaluation*
*A part of this chapter has been filed US provisional patent application:
A. K. Mohanty, M. Misra, N. Zarrinbakhsh, R. Muthuraj, T. Wang, A. U-Rodriguez, and
S.Vivekanandhan, Biodegradable polymer-based composites with tailored properties and method of
making those, US provisional patent application, Application number-62128736, 2015.
Abstract
Biocomposites were fabricated from miscanthus fibers and a blend composed of
poly(butylene succinate) (PBS)/poly(butylene adipate-co-terephthalate) (PBAT) matrix by
extrusion and injection molding process. The performance of the composites was investigated
with different weight percentages of fiber loading. Due to the strong reinforcing ability of the
miscanthus fibers, the elastic modulus increased dramatically to 2.1 GPa when fiber loading
increased to 50 wt%. The elastic modulus of the composites was evaluated by parallel, series,
Hrisch and Halpin-Tsai theoretical models and the values were compared to experimental values.
Addition of miscanthus fibers into PBS/PBAT blend; it sharply reduced both tensile and impact
strength. These reductions were attributed to the incompatibility between the miscanthus fibers
and PBS/PBAT blend resin. As a result, maleic anhydride functionalized PBS/PBAT blend was
prepared and used as a compatibilizer to improve interfacial interaction between the different
phases in the resulting composites. With the addition of 5 wt% compatibilizer to the composites
a significant improvement in the mechanical properties as compared to corresponding
uncompatibilized counterparts was found. SEM analysis demonstrated strong interface between
fiber and matrix in the compatibilized composites. The aspect ratio of the fibers was drastically
reduced after compounding because of fibers underwent attrition during processing. The shear
thinning behavior was found to increase with increasing fiber content. It could be due to the

209
reduced entanglement of the polymer chains in the composites. The density of the resulting
biocomposites was lower than glass fibers. Over all, the addition of miscanthus fibers into a
PBS/PBAT blend matrix to form composites can offer a significant benefit in terms of economic
competitiveness and functional performance.
7.1 Introduction
Due to global environmental concerns, recent academic research and literature in the field
of polymer has been focused on research into biobased and/or biodegradable polymeric
materials. The US Environmental Protection Agency has reported that most non-durable plastic
waste goes to landfills because recycling of these plastics is still a challenge. Because of this,
material scientists are interested as this can be reduced through the use of biodegradable
polymeric materials. Biodegradable polymers are easily degraded in the presence of naturally
occurring microbes to CO2 and H2O under aerobic conditions or CH4 and H2O under anaerobic
conditions [1]. Commercially available aliphatic and aliphatic-aromatic biodegradable polyesters
such as poly(butylene adipate-co-terephthalate) (PBAT) and poly(butylene succinate) (PBS) are
promising for use in natural fiber composites. Both PBS and PBAT are produced from fossil fuel
based monomers. PBS can be produced from renewable resource based succinic acid with ~54%
biobased content [2], however, these polymers are currently have poor cost-performance as
compared to traditional polymers. This poor cost performance is due to limited production of
these polymers [3].
Interest into this kind of polymers has increased recently because of the reduced carbon
footprint and greenhouse gas emissions associated with their use. Despite this interest and the
potential environmental benefits, these polymers cannot yet be utilized on their own for some
commercial applications because they do not satisfy many product requirements. These

210
shortcomings can be overcome by reinforcing some inexpensive natural fibers into polymer
matrices [4]. As such, in 2010 natural fiber composites production amounted to 430.7 million
pounds in the United States with an associated worth amounting to 289.3 million USD [5]. As a
commodity this market is estimated to reach 531.3 million US$ by 2016, with a short-term
growth rate of 11% in the next 5 years. Effective use of renewable resource derived fibers
provides environmental benefits with respect to ultimate disposability. Natural fibers have many
economic advantages compared to synthetic fibers in addition to being biodegradable,
renewable, and lightweight. Reduce reliance on petroleum oil, reduced tool wear, good specific
strength and minimized hazardous materials emission (noxious gases or solid residue) during
combustion are also beneficial [6, 7].
Miscanthus is a typical lignocellulosic biomass and is a promising fast growing non-food
crop. If this biomass could be successfully reinforced into a polymer matrix, it could increase
revenue for miscanthus growers. Miscanthus fibers are advantageous because it is low cost, high
yield, has low input conditions and a low maturation time, has potential for soil remediation, can
help balance carbon dioxide in the environment, and is able to sequester carbon underground.
Due to these benefits, the best strategy is to combine biodegradable polymers with miscanthus
fibers in order to create cheap sustainable biocomposites with good reinforcement properties.
Bourmaud and Pimbert [7] measured the modulus and hardness value of miscanthus fibers using
the nanoindentation method. They found average modulus and hardness values are 9.49 and 0.34
GPa, respectively. These properties are quite comparable with other agro fibers such as hemp
and sisal [7].
Green composite materials can be derived from natural/bio fibers and biodegradable
polymers and have been developed for many industrial applications [8]. The performance of the

211
resulting composite mainly depends on orientation in the matrix, volume fraction of fibers, fiber
distribution, fiber-matrix interaction and ability of stress transfer between the components [8].
Natural fibers are inherently hydrophilic in nature [9] and are as such incompatible the
hydrophobic polymer matrix. This leads to inferior mechanical performance of the resulting
biocomposites. Additionally, during processing, natural fibers have a tendency to disperse poorly
in the matrices due to agglomeration [7]. Therefore, various strategies have been developed in
order to overcome these drawbacks in biocomposites [10]. Some of these strategies include using
a compatibilizing agent/interfacial modifier to improve interfacial bonding between the phases in
the composites [11-15]. Keener et al., [16] used a commercially available and economically
produced maleic anhydride (MAH) grafted polymer as a compatibilizing agent for fabricating
biocomposites. This study has proven that the relatively polar nature of maleic anhydride groups
may have a tendency to form covalent bonds, secondary bonds and mechanical interlocking in
the biocomposites. Another study reported by Tserki et al., [11] showed the effect of cotton
fibers on the mechanical properties of poly(butylene succinate-co-butylene adipate) (PBSA) with
and without MAH grafted PBSA (MAH-g-PBSA) as a compatibilizing agent. This study showed
significant improvement in all mechanical properties as compared to uncompatibilized
composites. A similar trend has been reported in the poly(3-hydroxy-co-3-hydroxyvalerate)
(PHBV)/kenaf fiber biocomposites [13]. Kim et al., [12] used MAH grafted polymers as a
compatibilizer for bamboo and wood flour filled PBS and poly(lactic acid), PLA biocomposites.
In these composites, MAH grafted PBS (MAH-g-PBS) and MAH grafted PLA (MAH-g-PLA)
showed improvements in mechanical and thermal properties when compared to other maleated
compatibilizers. However, only a few researchers have investigated miscanthus fiber reinforced
biodegradable polymer composites. Johnson et al., [17] have studied Mater-Bi®/miscanthus fiber

212
composites and found that the impact performances were significantly increased as compared to
neat polymer. Nanda et al., [18] examined a composite made from agro fibers (miscanthus,
switchgrass and soy hull) and a binary blend matrix of PLA/PHBV. The authors concluded that
the miscanthus fiber based biocomposites have superior mechanical and thermo-mechanical
properties compared to many other agro fibers (switchgrass and soy hull) based PLA/PHBV
blend matrix composites. However, un-to-date no literature has been reported on fabrication of
composites from miscanthus fiber with a PBS/PBAT blend matrix. The present study aims to
explore the fabrication and performance evaluation of miscanthus fiber reinforced PBS/PBAT
based biocomposites. The effect of compatibilizer (MAH-grafted-PBS/PBAT blend) on the
resulting biocomposites was investigated by means of mechanical, thermo-mechanical,
morphological, and rheological properties.
7.2 Materials and Methodology
7.2.1 Materials
Miscanthus fibers were kindly supplied by New Energy Farms, Ontario, Canada. The
miscanthus fibers were used as received without any further purification and/or modification.
The predetermined fiber lengths and diameters were 4.65±2.5 and 0.074±0.024 mm,
respectively. Commercially available PBAT (Biocosafe 2003F) and PBS (Biocosafe 1903)
granules were procured from Xinfu Pharmaceutical Co., Ltd (China). Maleic anhydride grafted
PBS/PBAT blend (MAH-g-PBS/PBAT) was prepared in Haake PolyLab at 160oC with 5 phr of
MAH and 1 phr of dicumyl peroxide (DCP) according to the procedure reported in Chapter 4 and
it was used as a compatibilizer in this chapter. The grafting percentage of the compatibilizer was
determined by acid-base titration and the grafting percentage was 2.05%. The melt flow index

213
(MFI) of the compatibilizer was 81±24 g/10 min (MFI measured @ 190 oC, 2.16 kg according to
ASTM D1238).
7.2.2 Processing of polymer blend and their composites
Before melt processing, both polymers and fibers were dried at 80oC for at least 10 h in
an oven. According to our previous research findings, PBS/PBAT (60/40 wt%) blend was taken
as a matrix for composites fabrication in the present study [20]. Here after PBS/PBAT (60/40
wt%) blend will be referred as PBS/PBAT blend. This blend matrix based composites were
prepared by incorporating 30, 40 and 50 wt% of miscanthus fibers. For comparison, these
composites were also prepared with the addition of 5 wt% MAH-g-PBS/PBAT. All the
compounding and injection molding were carried out in a DSM Xplore®, The Netherlands. The
capacity of DSM extruder and injection molder was 15 and 12 cm3, respectively. Compounding
of the formulation was done with co-rotating twin-screw extruder with a length of 150 mm and a
L/D of 18. The desired composite test specimens were produced at 140oC with residence time of
2 min, mould temperature at 30oC, and screw speed of 100 rpm. Injection molding was done
with injection pressure of 10 bar for 8 s, and holding and packing pressures of 10 bar for 10 s
each.
7.2.3 Mechanical properties
The tensile, flexural and impact properties of the PBS/PBAT blend and its composites
were measured according to the procedure reported in Chapter 5 (Section 5.2.4).
7.2.4 Density
An electronic densimeter (Alfa Mirage, model MD-300S) was used to measure the
density of the PBS/PBAT blend and their composites. The density measurement was performed

214
by Archimedes principle. The density of the miscanthus fiber was calculated by rule of mixture,
i.e.,
= + (7.1)
where , and , are the densities and volume fractions of the fiber and matrix,
respectively.
7.2.5 Dynamic mechanical analysis (DMA)
Dynamic mechanical properties were measured according to ASTM D4065 standard in a
DMA Q800, TA instruments Inc, USA. The storage modulus and tan delta results were obtained
as a function of temperature with a temperature ramp of 3 oC/min. The tests were carried out in a
dual cantilever clam with a 15 µm oscillating amplitude and 1 Hz vibrating frequency. Heat
deflection temperatures (HDT) of the samples were measured using same DMA machine as per
ASTM D648 standard. The experiments were carried out in a three point bending clamp at a
heating ramp of 2 oC/min from room temperature to desire temperature. The reported HDT
values of the samples are an average of two measurements.
7.2.6 Fiber length measurements
In order to measure the fiber length and diameter after processing, the composite samples
were dissolved in chloroform and then fibers were isolated by filtering. The isolated fibers were
rinsed thoroughly with the same solvent and dried at 70oC for 24 h. The processed and
unprocessed fibers were photographed through a digital camera and the fiber dimensions were
measured by Image J software (at least 85 individual fibers were measured). The measured fibers
length and diameter were inserted in Minitab®17 statistical software to get fiber distribution
histogram.

215
7.2.7 Differential scanning calorimetry (DSC)
DSC analyses were performed under controlled nitrogen environment (50 mL/min) by
using TA instruments DSC Q200. The data were recorded for heat flow with respect to
temperatures using standard aluminum pan. The heating ramp rate was kept at 10 °C/min while
cooling ramp rate was kept at 5 °C/min for conventional DSC. The experiment was carried out
from -50 to 180oC, followed by cooling to -50
oC. Then they were reheated from -50 to 180
oC.
The first heating scans were used to remove thermal history of the sample. The results were
collected from the second heating and first cooling scans.
7.2.8 Thermogravimetric analysis (TGA)
The thermal degradation behavior of the samples was evaluated using TA instruments
TGA Q500. The experiments were performed in a controlled nitrogen flow rate of 60 mL/min
with a heating rate of 20 oC/min.
7.2.9 Morphological analysis
In order to enhance the electrical conductivity of the specimen surface, the samples were
gold coated prior to observe the composites samples morphology. Morphology of the impact
fractured specimens was observed by Inspect S50-FEI Company scanning electron microscopy.
7.2.10 Rheological property
The rheological property was measured at 140oC using Anton Parr Rheometer MCR 301.
The experiments were carried out in a parallel-plate with 25 mm diameter and 1 mm gap
between the plates. The shear viscosity of the samples was measured from 629 to 0.1 rad/s by
frequency sweep test. Disc shape injection molded samples were used to study the rheological
behaviour of PBS/PBAT blend and their composites.

216
7.3 Results and Discussion
7.3.1 Mechanical properties
The tensile properties of PBS/PBAT blend and their composites are presented in Figure
7.1. Mechanical properties of the natural fiber reinforced composites are significantly dependent
upon many factors including fiber type, aspect ratio of fibers, orientation of fibers, fiber-matrix
adhesion, fiber dispersion in the matrix, and chemical composition of the fibers [21]. Apparently,
all the composites showed higher tensile modulus value than the PBS/PBAT blend matrix. The
tensile modulus of the composites gradually increased with increasing fiber loading from 30 to
50 wt%. Generally the addition of stiff fibers into polymer matrices restricts polymer chain
mobility and thus increases the stiffness of the resulting composites [22]. However, a reduction
in tensile strength was observed with an increase in fiber content up to 50 wt%. Incorporation of
hygroscopic natural fibers into the hydrophobic polymer matrix has a negative effect on tensile
strength of the composite. A number of researchers have reported a similar effect with natural
fiber composites [18, 22]. This reduction is associated with uncompatibility between the fiber-
matrix as well as lack of sufficient fiber dispersion in the matrix [23]. These drawbacks can be
overcome by modifying composite matrices or by reinforcement. In general, commercially
available MAH grafted polyolefins are more widely used in composite industries as a
compatibilizer [14]. Many studies have documented that the compatibilizers could connect the
fibers and the matrix through chemical bonds like covalent bonds or hydrogen bonds [15].
Therefore, MAH grafted compatibilizers have great potential to surpass the performance of
composites through strong interfacial adhesion between the different phases.
In this study, MAH grafted PBS/PBAT blend was used as a compatibilizer in order to
improve compatibility between the PBS/PBAT blend matrix and the miscanthus fibers. One of

217
the main advantages of modifying PBS/PBAT matrix as a compatibilizer for PBS/PBAT blend
based composites is that the chemical structures are identical and, consequently, compatible. All
the compatibilized composites showed a distinct enhancement in tensile properties in comparison
to their corresponding uncompatibilized composites. These improvements were likely due to the
enhanced interfacial bonding between the fiber-matrix. For instance, incorporation of
compatibilizer (5 wt%) into 50 wt% miscanthus fiber composite showed 69% tensile strength
and 7% tensile modulus improvement as compared to their corresponding uncompatibilized
composites. Similar improvements in the compatibilized biocomposites have been shown in the
literature [23,24]. The improved tensile strength of the compatibilized composites is likely due to
the physical entanglements, which can occur between the compatibilizer and matrix. Due to the
entanglement of polymer chains, the applied stress on the matrix can be effectively transformed
to the fibers [25].
Figure 7.1. Tensile properties of PBS/PBAT blend and their composites: (A) PBS/PBAT, (B)
PBS/PBAT + miscanthus fibers (70/30 wt%), (C) PBS/PBAT + miscanthus fibers + MAH-g-
PBS/PBAT (65/30/5 wt%), (D) PBS/PBAT + miscanthus fibers (60/40 wt%), (E) PBS/PBAT +
miscanthus fibers + MAH-g-PBS/PBAT (55/40/5 wt%), (F) PBS/PBAT + miscanthus fibers
(50/50 wt%) and (G) PBS/PBAT + miscanthus fibers + MAH-g-PBS/PBAT (45/50/5 wt%).

218
Figure 7.2 shows the typical stress-strain curves of the PBS/PBAT blend and their
composites. It was noted that the stress-strain curve of the PBS/PBAT blend clearly shows three
types of behavior i.e., elastic deformation, plastic deformation and strain hardening. However,
the stress-strain curves of all the composites samples shows elastic and plastic deformation after
maximum stress has reached. There was no strain hardening observed in the composites samples.
These observations suggest that composites are less ductile than the PBS/PBAT blend. This is
not surprising because the short fibers reinforced composite does not necessarily increase the
ductility of the composites. Sahoo et al., [26] found a similar trend in PBS based biocomposites.
This ductility reduction is also evidence for the improved stiffness of the composites when
compared to PBS/PBAT blend. A drastic reduction was observed in elongation at break after
incorporation of miscanthus fibers into the PBS/PBAT blend matrix. This is common
observation for almost all the fiber reinforced composites [11]. All the compatibilized
composites exhibited slightly higher elongation at break compared to their corresponding
uncompatibilized composites. This implies that the interfacial adhesion was improved between
the phases [27]. Our findings agreed well with the previous works by Wang et al., [27] and
Zhang et al., [28]. However, the percentage elongation values of their compatibilized composites
were much lower than the PBS/PBAT blend.

219
Figure 7.2. Representative stress-strain curves of PBS/PBAT blend and their composites: (A)
PBS/PBAT, (B) PBS/PBAT + miscanthus fibers (70/30 wt%), (C) PBS/PBAT + miscanthus
fibers (60/40 wt%), (D) PBS/PBAT + miscanthus fibers (50/50 wt%), (E) PBS/PBAT +
miscanthus fibers + MAH-g-PBS/PBAT (65/30/5 wt%), (F) PBS/PBAT + miscanthus fibers +
MAH-g-PBS/PBAT (55/40/5 wt%), and (G) PBS/PBAT + miscanthus fibers + MAH-g-
PBS/PBAT (45/50/5 wt%).
Figure 7.3 illustrates the influence the flexural properties of PBS/PBAT blend matrix
based composites with and without compatibilizer. The flexural modulus and strength of the
PBS/PBAT blend matrix were 380 and 17 MPa, respectively. Similarly, to the tensile modulus,
the addition of miscanthus fibers into PBS/PBAT blends lead to a remarkable improvement in
the flexural modulus of the composites. Similar occurrence has been reported in flexural
modulus with increasing filler content in different thermoplastic matrix systems [29, 30].
Moreover, the addition of miscanthus fibers into poly(vinyl acetate) (PVAc)/poly(vinyl alcohol)
(PVA) blend resulted in superior flexural properties than PVAc/PVA blend [31]. Normally the
polymer chain mobility is hindered by presence of fibers, consequently the composites become
stiffer and have a higher modulus as compared to their matrix [15]. The compatibilized

220
composites showed slight improvement in flexural modulus compared with their corresponding
uncompatibilized composites. This indicates that the compatibilizer may reduce the fiber
agglomeration in the resulting biocomposites. Additionally, the flexural strength of the
uncompatiblized composites reduced after incorporation of 50 wt% fibers. This could be
associated with weak fiber-matrix interaction, insufficient wetting between the fiber-matrix, and
agglomeration (fiber-fiber interaction) of fibers in the matrix [29]. Interestingly, the flexural
strength of the uncompatibilized composites is still superior in comparison to PBS/PBAT blend
matrix. This phenomenon once again proves that the miscanthus fibers have good reinforcing
capabilities in the PBS/PBAT blend matrix. Overall, flexural properties of the compatibilized
composites were superior to their uncompatibilized counterparts. Similar trends have been
reported elsewhere [15]. The compatibilized composite with 50 wt% miscanthus fiber exhibited
the highest flexural strength (192%) and modulus (520%) compared with PBS/PBAT matrix.
The enhanced fiber-matrix adhesion can be hypothesized as follows: the grafted maleic
anhydride groups of MAH-g-PBSPBAT are able to interact with surface hydroxyl groups of the
miscanthus fibers, while the PBS/PBAT segments are miscible with the bulk PBS/PBAT blend
matrix phase through cocrystallization [32]. The expected reaction mechanism of MAH-g-
PBSPBAT with miscanthus fibers is shown in Figure 7.4.

221
Figure 7.3. Flexural properties of PBS/PBAT blend and their composites: (A) PBS/PBAT, (B)
PBS/PBAT + miscanthus fibers (70/30 wt%), (C) PBS/PBAT + miscanthus fibers + MAH-g-
PBS/PBAT (65/30/5 wt%), (D) PBS/PBAT + miscanthus fibers (60/40 wt%), (E) PBS/PBAT +
miscanthus fibers + MAH-g-PBS/PBAT (55/40/5 wt%), (F) PBS/PBAT + miscanthus fibers
(50/50 wt%) and (G) PBS/PBAT + miscanthus fibers + MAH-g-PBS/PBAT (45/50/5 wt%).
Figure 7.4. Expected reaction between the miscanthus fiber and the compatibilizer
222
The results in Table 7.1 represent the Izod impact strength of uncompatibilized and
compatibilized composites as a function of miscanthus fibers. The PBS/PBAT blend showed
non-break impact strength. Contarory, with the addition of miscanthus fibers into PBS/PBAT
blend matrix resulted in a significant reduction in impact strength. This is attributed to the failure
mode of PBS/PBAT blend changed from ductile to brittle failure in the presence of fibers. As
explained before, the lignocellulosic fibers are restricting the polymer chain mobility in the
resulting composites, and thus reduce capability to absorb energy during impact fracture [33]. In
addition, the weak interface between the components is also important factor for deteriorated
impact strength of the composites. This can also be confirmed by area reduction under the tensile
stress-strain curves. However, a considerable amount of impact strength was increased after
incorporation of compatibilizer into the composites. The compatibilized composites with 30, 40
and 50 wt% fibers showed 59, 62, and 36% improvement in impact strength when compared to
their corresponding uncompatibilized composites, respectively. These improvements could be
due to enhanced interfacial bonding between the matrix-fiber. Good interfacial adhesion helps to
promote stress transfer between the phase through covalent and/or hydrogen bonds [34].
Furthermore, there is a possibility of mechanical interlocking in the compatibilized composites,
which may occur between the compatibilizer-fiber and/or between the compatibilizer-matrix. It
can be noted that the compatibilized composite with 50 wt% fiber showed lower impact strength
compared to compatibilized composites with fiber content of 30 and 40 wt%. This could be due
to the high fiber content lead to agglomeration and thus weaken the resulting composites [18].
Overall, the observed mechanical properties of the compatibilized PBS/PBAT matrix based
composites suggest that the compatibility between the fiber-matrix has been greatly improved.

223
Table 7.1. Notched Izod impact strength of PBS/PBAT blend and its compatibilized and
uncompatibilized composites
Samples
Notched Izod Impact strength
(J/m)
PBS/PBAT Non-break
PBS/PBAT + miscanthus fibers (70/30 wt%) 64.50 ± 3.59
PBS/PBAT + miscanthus fibers (60/40 wt%) 54.36 ± 2.94
PBS/PBAT + miscanthus fibers (50/50 wt%) 46.57 ± 1.64
PBS/PBAT + miscanthus fibers + MAH-g-PBS/PBAT
(65/30/5 wt%)
102.47 ± 4.36
PBS/PBAT + miscanthus fibers + MAH-g-PBS/PBAT
(55/40/5 wt%)
88.15 ± 2.59
PBS/PBAT + miscanthus fibers + MAH-g-PBS/PBAT
(45/50/5 wt%)
63.42 ± 3.12
7.3.2 Theoretical approximation of Young’s modulus of the PBS/PBAT biocomposites
There are several mathematical models that have been proposed to predict composite
properties [35]. Some models such as parallel, series, Hirsch’s, and Halpin-Tsai models are very
often used to determine the randomly oriented rigid short fiber composite behavior.
In parallel and series models, Young’s modulus can be calculated by using following equations,
Parallel model
Mc = + (7.2)
Series model
Mc =
(7.3)
In both models, Mc, Mm and Mf represent the Young’s modulus of the composites,
matrix, and fibers while Vf and Vm represent the volume fractions of fiber and matrix,
respectively.

224
Hirsch’s model
This model is combination of both parallel and series models. In a fiber composite with
random fiber orientation, the elastic modulus can be predicted by Hirsch’s model. The model is
shown below,
Mc = x ( + ) + (1-x)
(7.4)
where χ is a value (0 to 1), which describes the stress transfer between the fiber and matrix.
Halpin-Tsai and Tsai Pagano model
Theoretical moduli of the aligned discontinuous fiber composites can be determined
according to the Halpin-Tsai (H-T) equation. According to the H-T model, the longitudinal (EL)
and transverse modulus (ET) can be calculated using the following equations (7.5 and 7.6):
EL= Em
(7.5)
ET= Em
(7.6)
where
=
(7.7)
=
(7.8)
where is the measure of reinforcement geometry and it can be defined as:
= 2( (7.9)

225
Aspect ratio of the reinforcement is l/d. In a fiber composite with random (Erandom) fiber
orientation, the elastic modulus can be determined using the Tsai Pagano model and it is written
as:
Erandom = (7.10)
Figure 7.5 compares the theoretical and experimental Young’s modulus of the composites
with different volume fraction of fibers. Both the theoretical and experimental Young’s moduli
of the composites were increased with increasing fiber content from 30 to 50 wt%. However, the
predicated modulus by parallel and series models are significantly deviated from experimental
modulus values. These deviations could be due to the model operating under the assumption that
there is no interaction between the fiber-matrix in the composites. According to this literature
[36], there is possibility for interaction between the composite components. It was observed that
the experimental moduli of the composites had good agreement with theoretically calculated
moduli by the Hirsch model. In the Hirsch model, the parameter x determines the stress transfer
between the fiber and the matrix. In order to determine a linear-fit value with experimental
values, the x values varied from 0 to 1 in the equation 7.4. A best fit was found between
theoretical and experimental values when the x value 0.33 in equation 7.4. The obtained x value
is slightly higher than the carbon fiber reinforced PLA and PHBV composites [37,38]. This
suggests that the PBS/PBAT/miscanthus composites have a more effective stress transfer than
carbon fiber reinforced PLA and PHBV composites. It was found that the experimental and
predicted modulus values of the composites are in good agreement with 30 wt% fiber loading.
When increasing fiber content from 30 to 50 wt% the modulus values are slightly deviating from
the experimental values. This deviation probably attributed to the agglomeration of fibers in the
matrix and thereby the applied stress is not able to transfer uniformly between aggregated fibers

226
to dispersed fibers [35]. It is clear that the predicated moduli using the H-T model are slightly
deviated from the experimental modulus values. This behavior could be attributed to the modulus
difference in the nodes, internodes, stem and leaves of the miscanthus fiber [7]. A similar trend
has been observed in the switchgrass reinforced PBAT/PHBV blend matrix composites [39].
Figure 7.5. Variation of experimental and theoretical values of Young’s modulus as a function
of fiber loading
7.3.3 Dynamic mechanical properties
As shown in Figure 7.6, the storage modulus for PBS/PBAT blend and their composites
varies with respect to temperature. The storage modulus (E’) values of PBS/PBAT blend and
their composites were higher below the glass transition temperature (Tg) which is -19 oC.
However, the E’ values of all the samples observed an abrupt decrease at the Tg of PBS/PBAT
blend. This is due to the fact that the polymer chain mobility increases above the Tg of
PBS/PBAT blend. It was found that the storage modulus values of compatibilized and
uncompatibilized composites were significantly higher as compared to the PBS/PBAT blends.

227
Therefore, it was concluded that the miscanthus fibers had a strong influence on the storage
modulus improvement of the resulting composites. The improved storage modulus was in
accordance with the flexural and tensile moduli values of the PBS/PBAT blend composites.
Nanda et al., [18] reported that the stiffness of the miscanthus based PHBV/PLA composites was
higher than PHBV/PLA matrix due to reinforcing effect of miscanthus fibers. The E’ values of
the compatibilized composites were slightly higher as compared to the corresponding
uncompatibilized composites. A similar observation has been reported in the compatibilized PLA
and PBS composites [12].
Figure 7.6. Storage moduli of PBS/PBAT blend and their composites: (A) PBS/PBAT, (B)
PBS/PBAT + miscanthus fibers (70/30 wt%), (C) PBS/PBAT + miscanthus fibers (60/40 wt%),
(D) PBS/PBAT + miscanthus fibers (50/50 wt%), (E) PBS/PBAT + miscanthus fibers + MAH-g-
PBS/PBAT (65/30/5 wt%), (F) PBS/PBAT+ miscanthus fibers + MAH-g-PBS/PBAT (55/40/5
wt%), and (G) PBS/PBAT + miscanthus fibers + MAH-g-PBS/PBAT (45/50/5 wt%).
The molecular transitions and energy dissipation of polymeric materials can be
determined by damping factor peaks (tan δ). Figure 7.7 shows the tan δ peaks of PBS/PBAT
blend and their composites. There is no significant shift observed in tan δ peak after the addition

228
of miscanthus fiber into PBS/PBAT blend. This observation is consistent with elsewhere [40].
Incorporation of fibers into PBS/PBAT blends reduces the tan δ peak intensity, which is
attributed with the restriction of the polymer chains mobility in the presence of fibers. In the neat
polymer systems, the polymer chain segments are free from restraints, thus have high intensity
tan δ peaks when compared to the composites. In the present study, compatibilized composites
had a slightly higher damping effect than uncompatibilized composites. This indicates that the
fiber-matrix adhesion was improved with the addition of compatibilizer. The molecular motion
at the interfacial regions contributes to the damping of the materials [31]. As seen in Figure 7.7,
the broadness of the tan δ peak is increased with increasing fiber from 30 to 50 wt%. This is due
to the increased heterogeneity in the composite system, which was supported by SEM analysis.
Figure 7.7. Tan δ of PBS/PBAT blend and their composites: (A) PBS/PBAT, (B) PBS/PBAT +
miscanthus fibers (70/30 wt%), (C) PBS/PBAT + miscanthus fibers (60/40 wt%), (D)
PBS/PBAT + miscanthus fibers (50/50 wt%), (E) PBS/PBAT + miscanthus fibers + MAH-g-
PBS/PBAT (65/30/5 wt%), (F) PBS/PBAT+ miscanthus fibers + MAH-g-PBS/PBAT (55/40/5
wt%), and (G) PBS/PBAT + miscanthus fibers + MAH-g-PBS/PBAT (45/50/5 wt%).

229
7.3.4 Density
It is well known that the density of natural fibers is lower than glass fibers. The low
density of natural fibers enables a reduction in weight of the composite material for many
applications including automotive industries. Density of the PBS/PBAT blend and their
composites is shown in Table 7.2. The densities of the miscanthus fibers reinforced composites
are above 1.3 g/cm3, which is comparatively higher than PBS/PBAT blend. Moreover, the
composites density was gradually increased with increasing fiber content from 30 to 50 wt%.
This is mainly due to the higher density of the miscanthus fiber (1.412 g/cm3) when compared to
neat PBS/PBAT blend (1.252 g/cm3). The calculated density of miscanthus fiber is 1.412 g/cm
3,
which can be compared to some other natural fibers that are reported in the literature [41, 42].
There is no significant difference observed in the compatibilized and corresponding
uncompatibilized composites densities. The observed densities of the both compatibilized and
uncompatibilized PBS/PBAT blend composites are lower than glass fibers [43].
Table 7.2. Heat deflection temperature (HDT) and density of PBS/PBAT blend and its
compatibilized and uncompatibilized composites
Samples HDT (oC) Density (g/cm
3)
PBS/PBAT 74.34 ± 0.63 1.252 ± 0.002
PBS/PBAT + miscanthus fibers (70/30 wt%) 98.98 ± 0.79 1.300 ± 0.001
PBS/PBAT + miscanthus fibers (60/40 wt%) 98.73 ± 3.31 1.319 ± 0.003
PBS/PBAT + miscanthus fibers (50/50 wt%) 105.09 ± 1.21 1.335 ± 0.003
PBS/PBAT + miscanthus fibers + MAH-g-
PBS/PBAT (65/30/5 wt%)
99.76 ± 2.98 1.306 ± 0.001
PBS/PBAT + miscanthus fibers + MAH-g-
PBS/PBAT (55/40/5 wt%)
100.95 ± 4.95 1.322 ± 0.003
PBS/PBAT + miscanthus fibers + MAH-g-
PBS/PBAT (45/50/5 wt%)
105.68 ± 3.62 1.338 ± 0.002

230
7.3.5 Heat deflection temperature
According to ASTM D648, the temperature at which the test specimen deforms by 250
µm under a bending stress of 0.455 MPa is called heat deflection temperature (HDT) of
polymeric materials. HDT plays a vital role in selecting polymeric materials for specific
applications because it represents the maximum working limit temperature of materials. Table
7.2 shows the HDT value of the PBS/PBAT blend and its composites. All the composites have
higher HDT than PBS/PBAT blend. The HDT of the 30, 40 and 50 wt% fiber reinforced
composites was around 100, 100 and 105oC, respectively. According to Nanda et al., [18],
miscanthus fiber reinforced PHBV/PLA composites have higher HDT values than switchgrass
based PHBV/PLA composites. It has been suggested that this is due to the higher stiffness and
reinforcing effect of miscanthus fibers. A marginal improvement was observed while increasing
fiber content from 30 to 50 wt%. This could be because the HDT value of the composites is very
close to the melting point (115 oC) of PBS/PBAT blend. The HDT values of the compatibilized
composites were not significantly different as compared to their corresponding uncompatibilized
composites. From these observations, we can conclude that the PBS/PBAT composite with 30
wt% miscanthus fiber reached an optimum HDT value.
7.3.6 Thermogravimetric analysis
Figure 7.8 shows the thermal stability of miscanthus fibers, PBS/PBAT blend and their
composites as a function of temperature. Table 7.3 summarizes the temperature at 5 (T5), 25
(T25), and 50 (T50) percent weight loss of all the samples. It can be seen that the miscanthus
fibers had a lower onset thermal stability (256oC) as compared to PBS/PBAT blend and its
composites. This could be attributed to the less thermally stable components such as pectin,
proteins and residual moisture. Despite this temperature is being much higher than the processing
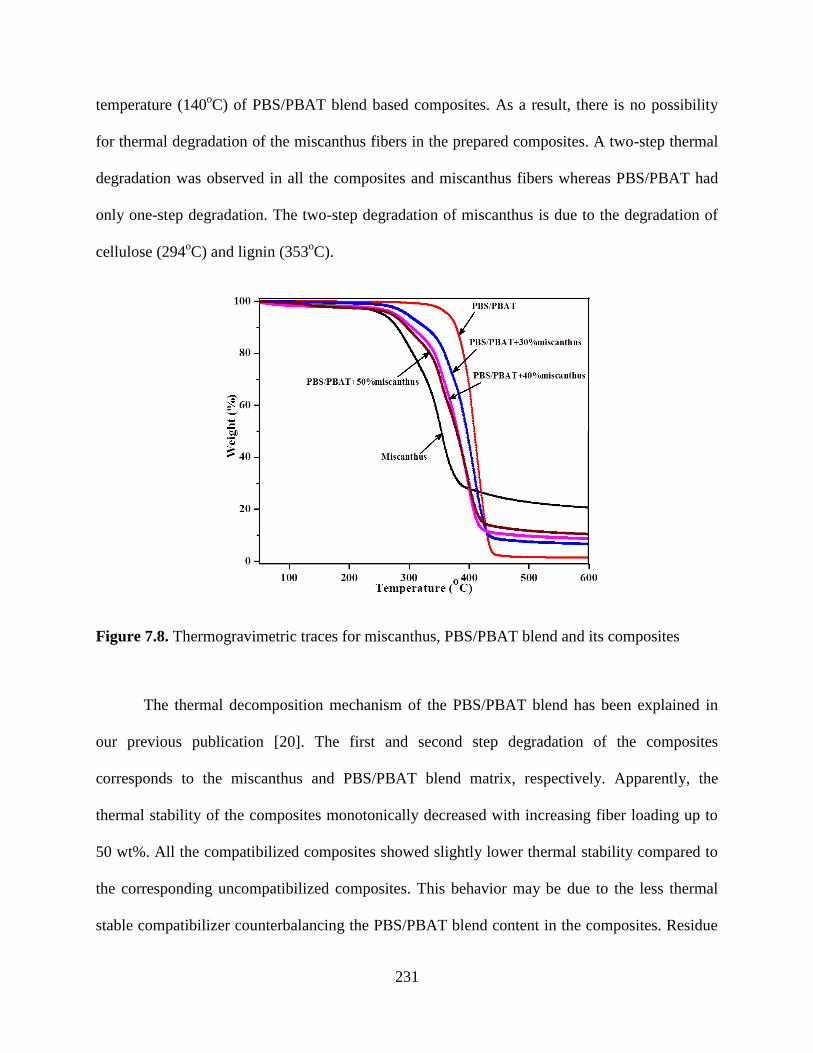
231
temperature (140oC) of PBS/PBAT blend based composites. As a result, there is no possibility
for thermal degradation of the miscanthus fibers in the prepared composites. A two-step thermal
degradation was observed in all the composites and miscanthus fibers whereas PBS/PBAT had
only one-step degradation. The two-step degradation of miscanthus is due to the degradation of
cellulose (294oC) and lignin (353
oC).
Figure 7.8. Thermogravimetric traces for miscanthus, PBS/PBAT blend and its composites
The thermal decomposition mechanism of the PBS/PBAT blend has been explained in
our previous publication [20]. The first and second step degradation of the composites
corresponds to the miscanthus and PBS/PBAT blend matrix, respectively. Apparently, the
thermal stability of the composites monotonically decreased with increasing fiber loading up to
50 wt%. All the compatibilized composites showed slightly lower thermal stability compared to
the corresponding uncompatibilized composites. This behavior may be due to the less thermal
stable compatibilizer counterbalancing the PBS/PBAT blend content in the composites. Residue

232
remains even after heating to 500 oC under the nitrogenous atmosphere due to the carbonaceous
residue and inorganic matter in the materials [44]. In miscanthus, about 20% char residue was
obtained at 600 oC. Consequently, the char residues of the composites were increased with
increasing fiber loading from 30 to 50 wt%.
Table 7.3. Thermogravimetric data of miscanthus, PBS/PBAT blend and their composites
Sample T5 (oC) T25 (
oC) T50 (
oC) Char residue
at 600 oC (%)
Miscanthus 256 318 354 20.60
PBS/PBAT 365 395 409 1.36
MAHgPBS/PBAT 339 388 405 0.87
PBS/PBAT + miscanthus fiber (70/30 wt%) 297 368 396 6.56
PBS/PBAT + miscanthus fiber (60/40 wt%) 276 351 381 8.65
PBS/PBAT + miscanthus fiber (50/50 wt%) 279 351 382 10.34
PBS/PBAT + miscanthus fibers + MAH-g-
PBS/PBAT (65/30/5 wt%)
281 357 386 6.60
PBS/PBAT + miscanthus fibers + MAH-g-
PBS/PBAT (55/40/5 wt%)
274 350 383 8.66
PBS/PBAT + miscanthus fibers + MAH-g-
PBS/PBAT (45/50/5 wt%)
271 345 379 10.42
7.3.7 Differential scanning calorimetry
Thermal properties of composites were investigated by non-isothermal DSC analysis.
Figures 7.9 and 7.10 show the melting temperatures (Tm) and crystallization temperatures (Tc) of
the PBS/PBAT blend and their composites with and without compatibilizer. The detailed second
heating and first cooling cycles are summarized in Table 7.4. All the composites and blend
matrix showed bimodal endoderm peaks, which correspond to two different types of crystal
lamella formed during cooling. In the presence of miscanthus fibers, the melting point (114 °C)

233
of PBS/PBAT blend is not affected significantly, as shown in Figure 7.9. However, the melting
enthalpy (∆Hm) of the composites decreased considerably (Table 7.4). This can be attributed to
the reduced volume fraction of the polymer in the resulting composites. The ∆Hm values of both
compatibilized and uncompatibilized composites were significantly reduced in comparison to
blend of PBS/PBAT. This result suggests that the composites require less energy to melt in
comparison to the blend of PBS/PBAT. The melting enthalpy of the composites is directly
related to the amount of polymer present in the composites. As such, less energy is required to
melt a smaller amount of polymer in the composites than in the neat polymers. A double melting
peak of PBS/PBAT blend has clearly separated in the composites. This can be attributed to the
enhanced heterogeneous crystal formation with the addition of miscanthus fiber into PBS/PBAT
blend. The crystallization temperature of PBS/PBAT blend was observed at 94.85oC (Figure
7.10).
Figure 7.9. DSC second heating thermograms: (A) PBS/PBAT, (B) PBS/PBAT + miscanthus
fibers (70/30 wt%), (C) PBS/PBAT + miscanthus fibers (60/40 wt%), (D) PBS/PBAT +
miscanthus fibers (50/50 wt%), (E) PBS/PBAT + miscanthus fibers + MAH-g-PBS/PBAT
(65/30/5 wt%), (F) PBS/PBAT+ miscanthus fibers + MAH-g-PBS/PBAT (55/40/5 wt%), and
(G) PBS/PBAT + miscanthus fibers + MAH-g-PBS/PBAT (45/50/5 wt%).

234
The crystallization rate is slightly decreased after the addition of miscanthus fiber into
PBS/PBAT blend matrix. This is attributed to the miscanthus fibers restricting the polymer chain
mobility and diffusion to the surface of the nuclei [45]. This result is in accordance with the
PHBV/bamboo fiber composites [45], PHBV/pineapple leaf fiber composites [46] and
PHBV/kneaf fiber composites [13]. Lee and Wang [47], however, reported that the PBS
crystallization rate can be enhanced with the addition of natural fibers. Their finding contradicts
results from the present study. This discrepancy could be due to the differences in the nature of
the fibers [46]. Both compatibilized and uncompatibilized composites had a lower ∆Hc value
than PBS/PBAT blend (Table 7.4). This can be attributed to the amount of PBS/PBAT blend
present in the composites.
Figure 7.10. DSC first cooling thermograms: (A) PBS/PBAT, (B) PBS/PBAT + miscanthus
fibers (70/30 wt%), (C) PBS/PBAT + miscanthus fibers (60/40 wt%), (D) PBS/PBAT +
miscanthus fibers (50/50 wt%), (E) PBS/PBAT + miscanthus fibers + MAH-g-PBS/PBAT
(65/30/5 wt%), (F) PBS/PBAT+ miscanthus fibers + MAH-g-PBS/PBAT (55/40/5 wt%), and
(G) PBS/PBAT + miscanthus fibers + MAH-g-PBS/PBAT (45/50/5 wt%).

235
Table 7.4. Detailed differential scanning calorimetry analysis of the PBS/PBAT blend and their
composites
7.3.8 Measurements of fiber diameter, length, and aspect ratio
The average length and the diameter of miscanthus fibers before and after processing is
summarized in Table 7.5. Before processing, the average length of miscanthus fibers was
4.65±2.5 mm with aspect ratio (L/D) of 63. After processing, however, the fiber length, diameter
and aspect ratio were significantly reduced. The measured fiber lengths were within the range of
0.72-1.07 mm. The reduced fiber length is attributed to the strong shear force, which developed
during the compounding process. During the course of processing, the fibers can undergo
defibrillation. This defibrillation leads to reduce the diameter of the fibers in the resulting
composites.
Figure 7.11 shows the fiber length distribution before and after compounding. Before
compounding the fiber lengths were observed in the wide range of 1.5 to 15.5 mm. However,
after compounding the fiber length distribution became narrower (range of 0.1 to 2.5 mm).
Samples
Tc (oC)
∆Hc (J/g)
Tm (oC)
∆Hm
(J/g)
PBS/PBAT 94.85 36.11 113.94 40.37
PBS/PBAT + miscanthus fibers (70/30 wt%) 92.03 26.22 114.51 27.72
PBS/PBAT + miscanthus fibers (60/40 wt%) 91.18 21.51 114.63 20.96
PBS/PBAT + miscanthus fibers (50/50 wt%) 92.46 21.06 113.86 20.74
PBS/PBAT + miscanthus fibers + MAH-g-
PBS/PBAT (65/30/5 wt%)
90.81 27.09 114.09 27.42
PBS/PBAT + miscanthus fibers + MAH-g-
PBS/PBAT (55/40/5 wt%)
90.56 26.30 113.95 21.26
PBS/PBAT + miscanthus fibers + MAH-g-
PBS/PBAT (45/50/5 wt%)
91.34 26.03 113.39 22.99

236
Before extrusion, the diameter of the fibers was 0.74±0.024 mm. After being subjected to an
extrusion process a drastic reduction was observed in the fibers diameter. This is because of the
fiber breakage during extrusion in a twin screw extruder [15]. Moreover, the individualization of
the fiber bundles during high mechanical shear produced in the compounding chamber is perhaps
responsible for this observation. Similar trends were observed in the sisal fiber reinforced PBS
composites [48] as well as kenaf fiber reinforced starch grafted PP composites [49].
Table 7. 5. Average fiber length (L), average fiber diameter (D), and aspect ratio (L/D) of the
miscanthus fiber before and after compounding
Samples Number
of fibers
Average
length (L)
(mm)
Average
diameter
(D)
(mm)
Aspect
ratio
(L/D)
Miscanthus fibers before
compounding
85 4.65±2.5 0.74±0.024 6.3
PBS/PBAT+miscanthus fibers
(70/30 wt%)
85 1.07±0.35 0.28±0.011 3.8
PBS/PBAT+miscanthus fibers
(60/40 wt%)
85 1.07±0.34 0.30±0.014 3.6
PBS/PBAT+miscanthus fibers
(50/50 wt%)
85 0.73±0.25 0.24±0.007 3.0

237
Figure 7. 11. Fiber length distribution before and after compounding: (A) as received
miscanthus fibers distribution, (B) fibers distribution in 30 wt% composites, (C) fibers
distribution in 40 wt% composites, and (D) fibers distribution in 50 wt% composites.
7.3.9 Morphology of composites
The performance of the composite materials mainly depends on the interfacial interaction
between the phases and dispersion of all components in a given matrix system. Generally,
efficiently reinforced natural fibers are withstanding from the fiber pullout during fracture
phenomenon. This type of fracture can be observed only in composites with good interfacial
bonding between the phases. A composite with dissimilar polarity constituents resulted in weak
interfacial adhesion between the constituents. The fracture surface SEM micrographs of
uncompatibilized and compatibilized composites with different weight percentage of fiber load
are shown in Figures 7.12 and 7.13. As can be clearly seen, all the uncompatibilized composites
had worse fiber dispersion, fiber debonding, fiber pullout, and fiber aggregation. This gives

238
evidence of poor interfacial bonding between the fiber-matrix and thus reduced performance of
the composites [14].
Figure 7.12. SEM micrographs of uncompatibilized PBS/PBAT blend composites with different
fiber loads: (A) PBS/PBAT+miscanthus fibers (70/30 wt%), (B) PBS/PBAT+miscanthus fibers
(60/40 wt%) and (C) PBS/PBAT+miscanthus fibers (50/50 wt%)
By contrast, the morphology of the compatibilized composites (Figure 7.13) showed less
fiber pullout and better interfacial bonding between fibers-matrix compared to the
uncompatibilized composites. Similar types of interactions have been reported for PBS and
PBAT based composites with MAH grafted compatibilizer [12, 24]. The improved fiber-matrix
adhesion is consistent with enhanced mechanical properties of the compatibilized composites.
Overall, morphological analysis concludes that the fiber-matrix adhesion has improved with the
help of compatibilizer.

239
Figure 7.13. SEM micrographs of compatibilized PBS/PBAT blend composites with different
amount of fiber loads: (A) PBS/PBAT+miscanthus fibers+MAH-g-PBS/PBAT (65/30/5 wt%),
(B) PBS/PBAT+miscanthus fibers+MAH-g-PBS/PBAT (55/40/5 wt%), and (C)
PBS/PBAT+miscanthus fibers+MAH-g-PBS/PBAT (45/50/5 wt%).
7.3.10 Rheological property
Rheological properties can offer a detailed structural-property relationship of polymer
composites. Therefore, the influences of fiber content and compatibilizer on the complex
viscosity of the composites were investigated (Figure 7.14). The PBS/PBAT blend showed
Newtonian flow behavior at lower frequency whereas a slight shear thinning behavior was
observed at higher frequency. This behavior was commonly found in polymer melts because
polymer chain entanglement density drastically reduced with increasing frequency. Additionally,
the average end-to-end distance of the polymer chains increased at higher frequency range.
Complex viscosity of the composites is higher at lower frequency as compared to the PBS/PBAT
blend. Theoretically, the addition of fillers/fibers into the thermoplastic polymer matrix will lead

240
to an increased viscosity of the melt. This is possibly due to the rigidity of the fibers which
restricts the polymer chain mobility in the melt state, thus causing viscosity improvement in the
composites [50].
Figure 7.14. Complex viscosity of PBS/PBAT blend and its composites: (A) PBS/PBAT, (B)
PBS/PBAT + miscanthus fibers (70/30 wt%), (C) PBS/PBAT + miscanthus fibers (60/40 wt%),
(D) PBS/PBAT + miscanthus fibers (50/50 wt%), (E) PBS/PBAT + miscanthus fibers + MAH-g-
PBS/PBAT (65/30/5 wt%), (F) PBS/PBAT+ miscanthus fibers + MAH-g-PBS/PBAT (55/40/5
wt%), and (G) PBS/PBAT + miscanthus fibers + MAH-g-PBS/PBAT (45/50/5 wt%).
In addition, an increase in viscosity can be observed with an increase in the fiber loading.
This may be due to agglomeration of fibers and the increased fiber-fiber interaction in the
composites. A similar effect is commonly observed in all the melt state composites. A steady
viscosity reduction was observed in all the composite samples with increasing frequency. The
complex viscosity of the compatibilized composites was slightly lower compared to the
uncompatibilized counterparts in the tested frequency range. This could be due to the lower
molecular weight of the compatibilizer, following the mixture rule [51]. The MAH grafted

241
PBS/PBAT compatibilizer showed much higher MFI value (81 g/10min at 190oC with 2.16kg)
than the neat PBS/PBAT blend MFI value (33 g/10min at 190oC with 2.16kg). The MFI
improvement of the maleic anhydride PBS/PPBAT compatibilizer is attributed to the molecular
weight reduction in the presence of free radical initiator. Maleated compatibilizer viscosity
should, thereby, be considered when analyzing compatibilized composites melt viscosities. The
same trend has been already reported in the compatibilized PP blends and their composites [52].
7.4 Conclusions
A biocomposite was prepared from PBS/PBAT blend matrix and miscanthus fibers by a
melt process. The moduli of the prepared composites were increased remarkably with the
incorporation of miscanthus fibers into blend of PBS/PBAT matrix. These improvements suggest
that the miscanthus fiber acts as reinforcement in the PBS/PBAT matrix system. The tensile and
impact strength of the composites deteriorated with the addition of miscanthus fibers to
PBS/PBAT blend matrix. This was due to the lack of interfacial bonding between the phases. In
order to improve this issue in the resulting composites, a reactive compatibilizer (MAH-g-
PBS/PBAT) was introduced into the composites. It was found that the mechanical properties of
the compatibilized composites were noticeably increased. This is mainly because of the
improved interfacial bonding between the components, which were demonstrated by SEM. The
DSC analysis revealed that the crystallization temperatures of the composites were lower
compared to the PBS/PBAT blend matrix. This can be attributed to the miscanthus fiber
restricting the mobility and diffusion of polymer chains to the surface of the nuclei. The length
and diameter of the fibers was reduced considerably after compounding. This is due to the
fibrillation, which occurred during compounding. It was also found that the density of all the
composites was slightly higher when compared to the PBS/PBAT blend. From this study, it can

242
be concluded that the prepared biodegradable polymer based composites are a possible candidate
to replace non-biodegradable composites in applications where biodegradability is essential but
extreme thermal and humidity exposure is not required.
References
[1] E. Chiellini, R. Solaro, Biodegradable Polymeric Materials, Advanced Materials, 1996, 8
(4): 305- 313.
[2] E. Zini, M. Scandola, Green composites: An overview, Polymer Composites, 2011, 32
(12): 1905-1915.
[3] P. Bordes, E. Pollet, L. Avérous, Nano-biocomposites: Biodegradable polyester/nanoclay
systems, Progress in Polymer Science, 2009, 34 (2): 125-155.
[4] M. Avella, E. Martuscelli, M. Raimo, Review Properties of blends and composites based
on poly(3-hydroxy)butyrate (PHB) and poly(3-hydroxybutyrate-hydroxyvalerate)
(PHBV) copolymers, Journal of Materials Science, 2000, 35 (3): 523-545.
[5] O. Faruk, A. K. Bledzki, H.-P. Fink, M. Sain, Progress Report on Natural Fiber
Reinforced Composites, Macromolecular Materials and Engineering, 2013, n/a-n/a.
[6] K. G. Satyanarayana, G. G. C. Arizaga, F. Wypych, Biodegradable composites based on
lignocellulosic fibers-An overview, Progress in Polymer Science, 2009, 34 (9): 982-1021.
[7] A. Bourmaud, S. Pimbert, Investigations on mechanical properties of poly(propylene)
and poly(lactic acid) reinforced by miscanthus fibers, Composites Part A: Applied
Science and Manufacturing, 2008, 39 (9): 1444-1454.
[8] Z. N. Terzopoulou, G. Z. Papageorgiou, E. Papadopoulou, E. Athanassiadou, E.
Alexopoulou, D. N. Bikiaris, Green composites prepared from aliphatic polyesters and

243
bast fibers, Industrial Crops and Products, 2014, (0):
(doi:10.1016/j.indcrop.2014.1008.1034).
[9] A. K. Mohanty, M. Misra, G. Hinrichsen, Biofibres, biodegradable polymers and
biocomposites: An overview, Macromolecular Materials and Engineering, 2000, 276-277
(1): 1-24.
[10] H.-S. Kim, S. Kim, H.-J. Kim, H.-S. Yang, Thermal properties of bio-flour-filled
polyolefin composites with different compatibilizing agent type and content,
Thermochimica Acta, 2006, 451 (1–2): 181-188.
[11] V. Tserki, P. Matzinos, C. Panayiotou, Effect of compatibilization on the performance of
biodegradable composites using cotton fiber waste as filler, Journal of Applied Polymer
Science, 2003, 88 (7): 1825-1835.
[12] H.-S. Kim, B.-H. Lee, S. Lee, H.-J. Kim, J. Dorgan, Enhanced interfacial adhesion,
mechanical, and thermal properties of natural flour-filled biodegradable polymer bio-
composites, Journal of Thermal Analysis and Calorimetry, 2011, 104 (1): 331-338.
[13] M. Avella, G. Bogoeva-Gaceva, A. Buzõarovska, M. Emanuela Errico, G. Gentile, A.
Grozdanov, Poly(3-hydroxybutyrate-co-3-hydroxyvalerate)-based biocomposites
reinforced with kenaf fibers, Journal of Applied Polymer Science, 2007, 104 (5): 3192-
3200.
[14] M. Z. A. Thirmizir, Z. A. M. Ishak, R. M. Taib, S. Rahim, S. M. Jani, Kenaf-bast-fiber-
filled biodegradable poly(butylene succinate) composites: Effects of fiber loading, fiber
length, and maleated poly(butylene succinate) on the flexural and impact properties,
Journal of Applied Polymer Science, 2011, 122 (5): 3055-3063.

244
[15] J. M. Lee, Z. A. Mohd Ishak, R. Mat Taib, T. T. Law, M. Z. Ahmad Thirmizir,
Mechanical, Thermal and Water Absorption Properties of Kenaf-Fiber-Based
Polypropylene and Poly(Butylene Succinate) Composites, Journal of Polymers and the
Environment, 2013, 21 (1): 293-302.
[16] T. J. Keener, R. K. Stuart, T. K. Brown, Maleated coupling agents for natural fibre
composites, Composites Part A: Applied Science and Manufacturing, 2004, 35 (3): 357-
362.
[17] R. M. Johnson, N. Tucker, S. Barnes, Impact performance of Miscanthus/Novamont
Mater-Bi® biocomposites, Polymer Testing, 2003, 22 (2): 209-215.
[18] M. R. Nanda, M. Misra, A. K. Mohanty, Performance Evaluation of Biofibers and Their
Hybrids as Reinforcements in Bioplastic Composites, Macromolecular Materials and
Engineering, 2013, 298 (7): 779-788.
[19] G. Moad, The synthesis of polyolefin graft copolymers by reactive extrusion, Progress in
Polymer Science, 1999, 24 (1): 81-142.
[20] R. Muthuraj, M. Misra, A. Mohanty, Biodegradable Poly(butylene succinate) and
Poly(butylene adipate-co-terephthalate) Blends: Reactive Extrusion and Performance
Evaluation, Journal of Polymers and the Environment, 2014, 22 (3): 336-349.
[21] A. K. Mohanty, M.Misr, L.T. Drzal. Natural fibers, biopolymers, and biocomposites;
CRC Press-Taylor & Francis Group, Boca Raton (2005), pp. 1–36., 2005.
[22] C. Nyambo, A. K. Mohanty, M. Misra, Polylactide-Based Renewable Green Composites
from Agricultural Residues and Their Hybrids, Biomacromolecules, 2010, 11 (6): 1654-
1660.

245
[23] S. Sahoo, M. Misra, A. K. Mohanty, Biocomposites From Switchgrass and Lignin Hybrid
and Poly(butylene succinate) Bioplastic: Studies on Reactive Compatibilization and
Performance Evaluation, Macromolecular Materials and Engineering, 2013, n/a-n/a.
[24] C.-S. Wu, Utilization of peanut husks as a filler in aliphatic–aromatic polyesters:
Preparation, characterization, and biodegradability, Polymer Degradation and Stability,
2012, 97 (11): 2388-2395.
[25] A. Arbelaiz, B. Fernández, J. A. Ramos, A. Retegi, R. Llano-Ponte, I. Mondragon,
Mechanical properties of short flax fibre bundle/polypropylene composites: Influence of
matrix/fibre modification, fibre content, water uptake and recycling, Composites Science
and Technology, 2005, 65 (10): 1582-1592.
[26] R. Bhardwaj, A. K. Mohanty, L. T. Drzal, F. Pourboghrat, M. Misra, Renewable
Resource-Based Green Composites from Recycled Cellulose Fiber and Poly(3-
hydroxybutyrate-co-3-hydroxyvalerate) Bioplastic, Biomacromolecules, 2006, 7 (6):
2044-2051.
[27] H. Wang, X. Sun, P. Seib, Strengthening blends of poly(lactic acid) and starch with
methylenediphenyl diisocyanate, Journal of Applied Polymer Science, 2001, 82 (7):
1761-1767.
[28] J.-F. Zhang, X. Sun, Mechanical Properties of Poly(lactic acid)/Starch Composites
Compatibilized by Maleic Anhydride, Biomacromolecules, 2004, 5 (4): 1446-1451.
[29] Z. A. M. Ishak, B. N. Yow, B. L. Ng, H. P. S. A. Khalil, H. D. Rozman, Hygrothermal
aging and tensile behavior of injection-molded rice husk-filled polypropylene
composites, Journal of Applied Polymer Science, 2001, 81 (3): 742-753.
246
[30] Y. C. Shinichi Shibata, Isao Fukumoto, Press forming of short natural fiber-reinforced
biodegradable resin: Effects of fiber volume and length on flexural properties, Polymer
Testing, 2005, 24 (8): 1005–1011.
[31] K. Kirwan, R. M. Johnson, D. K. Jacobs, G. F. Smith, L. Shepherd, N. Tucker,
Enhancing properties of dissolution compounded Miscanthus giganteus reinforced
polymer composite systems: Part 1. Improving flexural rigidity, Industrial Crops and
Products, 2007, 26 (1): 14-27.
[32] E. Igarza, S. G. Pardo, M. J. Abad, J. Cano, M. J. Galante, V. Pettarin, C. Bernal,
Structure–fracture properties relationship for Polypropylene reinforced with fly ash with
and without maleic anhydride functionalized isotactic Polypropylene as coupling agent,
Materials & Design, 2014, 55 (0): 85-92.
[33] H.-S. Kim, H.-S. Yang, H.-J. Kim, Biodegradability and mechanical properties of agro-
flour–filled polybutylene succinate biocomposites, Journal of Applied Polymer Science,
2005, 97 (4): 1513-1521.
[34] C. Varga, N. Miskolczi, L. Bartha, G. Lipóczi, Improving the mechanical properties of
glass-fibre-reinforced polyester composites by modification of fibre surface, Materials &
Design, 2010, 31 (1): 185-193.
[35] G. Kalaprasad, K. Joseph, S. Thomas, C. Pavithran, Theoretical modelling of tensile
properties of short sisal fibre-reinforced low-density polyethylene composites, Journal of
Materials Science, 1997, 32 (16): 4261-4267.
[36] S. Joseph, M. S. Sreekala, Z. Oommen, P. Koshy, S. Thomas, A comparison of the
mechanical properties of phenol formaldehyde composites reinforced with banana fibres
and glass fibres, Composites Science and Technology, 2002, 62 (14): 1857-1868.

247
[37] R. Chen, M. Misra, A. K. Mohanty, Injection-moulded biocomposites from polylactic
acid (PLA) and recycled carbon fibre: Evaluation of mechanical and thermal properties,
Journal of Thermoplastic Composite Materials, 2013,
[38] J. P. Reddy, S. Ahankari, M. Misra, A. Mohanty, A New Class of Injection Moulded
Structural Biocomposites from PHBV Bioplastic and Carbon Fibre, Macromolecular
Materials and Engineering, 2013, 298 (7): 789-795.
[39] V. Nagarajan, M. Misra, A. K. Mohanty, New engineered biocomposites from poly(3-
hydroxybutyrate-co-3-hydroxyvalerate) (PHBV)/poly(butylene adipate-co-terephthalate)
(PBAT) blends and switchgrass: Fabrication and performance evaluation, Industrial
Crops and Products, 2013, 42 (0): 461-468.
[40] C. Nyambo, A. K. Mohanty, M. Misra, Effect of Maleated Compatibilizer on
Performance of PLA/Wheat Straw-Based Green Composites, Macromolecular Materials
and Engineering, 2011, 296 (8): 710-718.
[41] A. K. Mohanty, M. Misra, L. T. Drzal, Surface modifications of natural fibers and
performance of the resulting biocomposites: An overview, Composite Interfaces, 2001, 8
(5): 313-343.
[42] H. Ku, H. Wang, N. Pattarachaiyakoop, M. Trada, A review on the tensile properties of
natural fiber reinforced polymer composites, Composites Part B: Engineering, 2011, 42
(4): 856-873.
[43] S. Sahoo, M. Misra, A. K. Mohanty, Biocomposites From Switchgrass and Lignin Hybrid
and Poly(butylene succinate) Bioplastic: Studies on Reactive Compatibilization and
Performance Evaluation, Macromolecular Materials and Engineering, 2014, 299 (2): 178-
189.

248
[44] P. R. Hornsby, E. Hinrichsen, K. Tarverdi, Preparation and properties of polypropylene
composites reinforced with wheat and flax straw fibres: Part I Fibre characterization,
Journal of Materials Science, 1997, 32 (2): 443-449.
[45] S. Singh, A. K. Mohanty, T. Sugie, Y. Takai, H. Hamada, Renewable resource based
biocomposites from natural fiber and polyhydroxybutyrate-co-valerate (PHBV)
bioplastic, Composites Part A: Applied Science and Manufacturing, 2008, 39 (5): 875-
886.
[46] S. Luo, A. N. Netravali, Mechanical and thermal properties of environment-friendly
“green” composites made from pineapple leaf fibers and poly(hydroxybutyrate-co-
valerate) resin, Polymer Composites, 1999, 20 (3): 367-378.
[47] S.-H. Lee, S. Wang, Biodegradable polymers/bamboo fiber biocomposite with bio-based
coupling agent, Composites Part A: Applied Science and Manufacturing, 2006, 37 (1):
80-91.
[48] Y.-H. Feng, D.-W. Zhang, J.-P. Qu, H.-Z. He, B.-P. Xu, Rheological properties of sisal
fiber/poly(butylene succinate) composites, Polymer Testing, 2011, 30 (1): 124-130.
[49] A. Hamma, M. Kaci, Z. A. Mohd Ishak, A. Pegoretti, Starch-grafted-polypropylene/kenaf
fibres composites. Part 1: Mechanical performances and viscoelastic behaviour,
Composites Part A: Applied Science and Manufacturing, 2014, 56 (0): 328-335.
[50] N. Marcovich, M. Reboredo, J. Kenny, M. Aranguren, Rheology of particle suspensions
in viscoelastic media. Wood flour-polypropylene melt, Rheologica Acta, 2004, 43 (3):
293-303.

249
[51] F. Martí-Ferrer, F. Vilaplana, A. Ribes-Greus, A. Benedito-Borrás, C. Sanz-Box, Flour
rice husk as filler in block copolymer polypropylene: Effect of different coupling agents,
Journal of Applied Polymer Science, 2006, 99 (4): 1823-1831.
[52] N. Le Moigne, M. van den Oever, T. Budtova, Dynamic and capillary shear rheology of
natural fiber-reinforced composites, Polymer Engineering and Science, 2013, 53 (12):
2582-2593.

250
Chapter 8: Influence of Processing Parameters on the Impact Strength of Biocomposites: A
Statistical Approach*
*A version of this chapter has been published in: R. Muthuraj, M. Misra, A. K. Mohanty,
Influence of Processing Parameters on the Impact Strength of Biocomposites: A Statistical
Approach, Composites Part A: Applied Science and Manufacturing, 2015,
DOI:10.1016/j.compositesa.2015.09.003.
Abstract
A biocomposite consisting of miscanthus fibers and a biodegradable polymer blend
(poly(butylene succinate) (PBS) and poly(butylene adipate-co-terephthalate) (PBAT)) matrix
was produced. The flexural strength of the PBS/PBAT/miscanhtus composites was increased
considerably (~127%) when compared to the neat PBS/PBAT blend. This increase was attributed
to the strong reinforcing effect of miscanthus fiber. The tensile strength of the
PBS/PBAT/miscanthus composite was inferior to the PBS/PBAT blend matrix. The impact
performance of the composites was optimized by manipulating the processing parameters such as
processing temperature, fiber length, the holding pressure, and screw speed. A full factorial
experimental design was used to predict the statistically significant variables on the impact
strength of the PBS/PBAT biocomposites. Furthermore, a regression model was developed to
study the impact strength of the composites. The main effects and interaction effects of the
variables were studied using analysis of variance (ANOVA) and factorial plots at 95%
confidence level. The accuracy of the developed model was examined by using residuals plots
and coefficients. Among the selected independent processing parameters, fiber length has a most
significant effect on the impact strength of the PBS/PBAT/miscanthus composites. The least
significant effect on the impact strength was attributed to the holding pressures. A poor
interfacial interaction between the miscanthus fibers and the PBS/PBAT blend was observed by
means of impact fractured surface morphological analysis. From scanning electron microscopy

251
(SEM) analysis, it can be observed that the composites prepared with 2.07 mm miscanthus fibers
had more fiber pullouts than 4.65 mm counterparts. This phenomenon could be responsible for
the observed high impact strength of the composites with 2.07 mm fibers compared to
composites prepared with 4.65 mm fibers.
8.1 Introduction
The increasing environmental pollution throughout the world has placed great emphasis
on eco-friendly sustainable material development. Consequently, more attention has been
focused on a sustainable material development by using bio-based and/or biodegradable
materials instead of petroleum based non-biodegradable materials. Governments in many
countries are supporting the usage of green products, and a reduction of dependence on
petroleum because of the associated environmental benefits [1]. Currently there are many
bioplastics (biodegradable and/or bio-based polymers) available in the market. Among them,
poly(butylene succinate) PBS, and poly(butylene adipate-co-terephthalate) PBAT are promising
biodegradable polyesters. The impact toughness/strength of the PBS is insufficient for a wide
range of applications [2]. Blending PBS with PBAT can enhance the impact and tensile
toughness of the PBS [3]. However, these polymers still cannot be used for wide range of
applications on their own because they cannot fulfill some of the product requirements [4]. These
issues can be overcome by blending, reinforcing, and forming composites with inexpensive
natural fibers in the polymer matrices [1].
Natural fiber (Kenaf, flax, hemp and jute) reinforced composites have been used for
many applications including those in the automotive, electronic, horticultural, packaging,
consumer goods and construction sectors [5]. Miscanthus is an alternative fiber for viable
biocomposite applications. Miscanthus is a typical lignocellulosic perennial grass and is a

252
promising non-food crop, which grows rapidly compared to some other crops. There are many
advantages of utilizing miscanthus as reinforcement in composites such as high yield [6], low
moisture content at harvest [6], low input conditions [7], soil remediation potential [7], good
fiber properties (tensile strength, hardness, and modulus) [8], and thermal stability up to 200oC
[9]. Currently, miscanthus fibers have only limited applications though these could be diversified
by developing viable biocomposites. The key strategy is the combination of bioplastics with
miscanthus fibers, which could create an eco-friendly sustainable biocomposite. Recently, the
performance of miscanthus fibers reinforced in a biodegradable polymer matrix has been
investigated by few researchers [6-8, 10-13]. In order to compare the effect of miscanthus fibers
on the resulting composites, Nagarajan et al., [12] investigated the performance of five different
lignocellulosic fibers (miscanthus, switchgrass, wheat straw, soy stalk and corn stalk) reinforced
poly(hydroxybutyrate-co-valerate) PHBV/PBAT (45/55 wt%) composites. This study revealed
that the miscanhtus fiber reinforced PHBV/PBAT composites exhibited superior properties
compared to other fiber reinforced PHBV/PBAT composites. Similar observations were made in
the miscanthus fibers reinforced PHBV/polylactide (PLA) (60/40 wt%) composites [7]. A recent
study by Zhang et al., [11] reported that the toughened multiphase green composite can be
obtained from miscanthus fiber reinforced PHBV/PBAT/epoxidized natural rubber (ENR)
matrix.
In a multi-phase material, processing parameters and variables play a vital role in the
performance of the resulting material. Recently, many researchers conducted experimental
studies to investigate the performance of heterogeneous composite materials. Johnson et al., [13]
used a two-level factorial design to investigate the influence of processing parameters such as
temperature, screw speed, filler content, and size on the impact performance of Mater-

253
Bi®/miscanthus composites. In another study [6] a Box-Cox transformation method was used to
examine the influence of processing parameters on the performance of the Mater-Bi®/miscanthus
fiber composites. From these studies, it was noted that processing temperature has more
influence on the performance of the composites. The significant influences of processing
parameters (processing temperature, screw speed, humidity, filler content, and the aspect ratio of
filler) on the elastic modulus, heat deflection temperature and impact strength of the Mater-
Bi®/wood flour composites has been studied by Morreale et al., [14]. The selected processing
variables are based on specific industrial target applications including automotive indoor
furnishing and panels. The filler aspect ratio had more influence on the impact strength while
filler content exhibited more influence on the heat deflection temperature as well as the elastic
modulus. Another study by Kirwan et al., [5] studied the influence of processing parameters on
the flexural properties of poly(vinyl alcohol), PVA/poly(vinyl acetate), PVAc/miscanthus
composites. The authors found that the processing temperature to be the most influencing factor
on the flexural properties followed by the washing of fibers. Most studies in current literature
investigate the composites (short fiber reinforced biodegradable polymer blend matrix based
composites) characteristics with fixed processing parameters. The aim of this work was to
fabricate biocomposites using a bioplastic blend of PBS/PBAT (60/40 wt%) as the matrix and
miscanthus fibres as the reinforcement with several independent processing variables (processing
temperature, screw speed, holding pressure, and fiber length). The influence of the processing
variables on the performance of the biocomposites was investigated by using a statistical
approach, i.e., full factorial design and analysis of variance (ANOVA).

254
8.2 Full factorial design methodology
More than one factor can affect an experimental result. In general, a factorial experiment
studies the simultaneous effects of two or more factors on experimental results [15]. In the
literature, it was suggested that there are many independently controllable processing
parameters/factors (processing temperature, mixing speed, pressure, reinforcement amount, and
size) which influence the performance of the resulting biocomposite [6, 13, 14]. As such, a
detailed investigation was conducted to fix the upper and lower limits of the independent
processing parameters for PBS/PBAT/miscanthus composites fabrication. The miscanthus fibers
can be melted and compounded with polymers at up to 200 oC without exhibiting any major
thermal decomposition [6]. As a result the miscanthus fiber reinforced composites preparation
should be performed below said temperature. Shear force occurs during the extrusion process
and can damage the fiber geometry. The mixing speed or screw speed of the composites can play
a vital role in maintaining sufficient fiber geometry (aspect ratio). For instance, high screw speed
may cause more fiber breakage while low screw speed can lead to less homogeneity of the
components in the composites. In this study miscanthus is used as a short fiber which should
have a wide range of aspect ratio distributions. This work aims to study the effect of two
different fiber lengths (2.07 and 4.65 mm) on the mechanical performance of the composites.
One of the hypotheses that were tested in this work is that high holding pressure will lead to a
composite with higher performance. High holding pressure may also help to reduce the shrinkage
of the resulting composites.
The processing temperature, fiber length, holding pressure and screw speed were selected
to be the variables in the factorial design. Two levels were assigned for each of these parameters
for the composite fabrication as shown in Table 8.1.

255
Table 8.1. Selected processing parameters and their respected levels
S.No Factor Notation Lower level Higher level
1 Temperature (oC) A 140 180
2 Holding pressure (bar) B 6 10
3 Screw speed (rpm) C 100 150
4 Fiber length (mm) D 2 4
These parameter levels were selected after a series of screening experiments had been
conducted. In order to fully understand the interaction between the parameters, a full factorial
design was selected in a 2k experimental design. In this study, randomization was carried out to
increase the precision of the experimental results by reducing the sampling variability. It was
assumed that the experimental results between the two levels are linear. The experimental design
was performed in statistical software Minitab®17 and, the same software was used to analyze the
results by means of statistical plots (main effect plot, interaction effect plot, normal probability
plot, residual plots, and Pareto plot) at a 95% confidence level.
8.3 Materials
Poly(butylene succinate), PBS and poly(butylene adipate-co-terephthalate), PBAT were
obtained from Xinfu pharmaceuticals Co. Ltd, China. Both PBS and PBAT are semi-crystalline
grade produced from fossil fuel based monomers. The PBS and PBAT have onset thermal
degradation temperatures of 372 and 377oC, respectively [16]. Two different lengths (2.08±0.95
and 4.65±2.45 mm) of miscanthus fiber were kindly supplied by New Energy Farms, Ontario,
Canada. Hereafter, these two fiber lengths (2.08±0.95 and 4.65±2.45 mm) will be referred as 2
and 4 mm. All the materials were used without any further purification.

256
Table 8.2. Physical and mechanical properties of the PBS/PBAT blend and miscanthus fibers
Properties Values
Melt flow index of PBS/PBAT (60/40 wt%) 33±3 g/10min
(190oC with 2.16 kg)
Notched Izod impact strength of PBS/PBAT blend Non-break [3]
Onset thermal degradation of miscanthus fiber* ~260oC
Density of the miscanthus fibers* 1.41 g/cm3
Modulus of the miscanthus fibers 9.49 GPa [8]
*Thermal stability and density of miscanthus fibers were measured in our previous study
(Chapter 7)
8.4 Experimental procedure
8.4.1 Samples preparation
Based on our previous study [16], we have selected a PBS/PBAT (60/40 wt%) blend as
an optimum composition for composites fabrication. Hereafter, the PBS/PBAT (60/40 wt%)
blend will be referred as PBS/PBAT blend. Table 8.2 shows some of the general properties of
miscanthus fiber and PBS/PBAT blend. A 30 wt% miscanthus fiber is selected to fabricate
biocomposites with a blend of biodegradable polymer (PBS/PBAT) matrix. The choice of using
miscanthus fiber in this present work was because of its good fiber properties and the strong
potential supply. Prior to melt compounding, both polymers and miscanthus fibers were dried at
80°C at least 12 h. Appropriate amounts of dried polymers and fibers were manually pre-mixed
at the solid state and the composites fabrication was performed by changing four processing
variables, as shown in Table 8.3. The PBS/PBAT/miscanthus fiber composites were prepared in
a lab-scale extrusion and injection molding process. The lab-scale co-rotating twin-screw
extruder (DSM explore, Netherlands) and injection molding machine (DSM explore,
Netherlands) had volume of 15 and 12 cm
3, respectively. The composite samples were molded

257
with a mold temperature of 30oC and the residence time of the materials inside the extrusion
barrel was 2 min.
Table 8.3. The 16 investigated experimental conditions
Experiment Temperature (oC) Screw speed (rpm) Holding pressure (bar) Fiber length (mm)
1 140 100 10 2
2 140 150 10 4
3 180 150 6 2
4 180 100 6 2
5 180 100 6 4
6 180 150 10 2
7 180 100 10 2
8 140 150 10 2
9 140 150 6 4
10 140 150 6 2
11 140 100 6 4
12 180 100 10 4
13 140 100 10 4
14 180 150 6 4
15 180 150 10 4
16 140 100 6 2
8.5 Characterization methods
8.5.1 Fiber dimension measurement
In order to measure the fiber length after processing, the composite samples were
dissolved in chloroform and then fibers were isolated by filtering. The isolated fibers were rinsed
thoroughly with the same solvent and dried at 70oC for 24 h. The processed and unprocessed
fibers were photographed through a digital camera (Nikon AF-S DX) and the fiber dimensions
were measured by Image J software (at least 85 individual fibers were measured). The measured
fibers length was inserted in Minitab®17 statistical software to get fiber length distribution
histogram.

258
8.5.2 Mechanical testing and scanning electron microscopy (SEM)
All the prepared test specimens were conditioned at room temperature for at least 40 h
before evaluating mechanical performances. Universal Testing Machine (Instron, Model-3382)
was use to measure the flexural and tensile properties of the test samples in accordance with
ASTM D790 and ASTM D638, respectively. The flexural testing was performed with a cross-
head speed of 14 mm/min. The tensile properties of neat PBS/PBAT blend and all the
composites were measured with a cross-head movement of 50 and 5 mm/min, respectively.
Notched Izod impact testing was performed according to ASTM D256 in a TMI monitor impact
testing machine using a 5 ft.lb pendulum. The reported tensile and flexural properties are
averages of five samples for each formulation. Minimum six test samples were tested for each
formulation and the average values are reported for impact strength. The morphologies of the
fracture surface were observed by using a SEM. Prior to observation of the sample morphology;
the samples were sputter-coated with a thin layer of gold. The analysis has been performed in
Inspect S50-FEI SEM.
8.6 Results and Discussion
8.6.1 Mechanical properties
Table 8.4 represents the mechanical properties of biocomposites as well as the factors
that are used for each experiment. Due to the reinforcing effect of miscanthus fibers, the flexural
strengths of all the composites were higher than that of the neat PBS/PBAT blend (denoted as
control). A similar trend has been observed in the PHBV/PBAT/miscanthus composites and
rubber toughened PHBV/PBAT/miscanthus fiber composites [11, 12]. Kirwan et al., [5] have
found to improve flexural properties of miscanthus fiber reinforced PVA/PVAc blend. Due to
strong reinforcing capability of miscanthus fibers, both tensile and flexural modulus of the
composites increased (data not shown) compared to neat PBS/PBAT blend. On the other hand,

259
all the composites showed inferior tensile strength as compared to control sample (matrix). The
observed reduction is attributed to the incompatibility between the miscanthus fiber and the
PBS/PBAT blend matrix. Such a reduction is very often observed in natural fiber reinforced
thermoplastic composites [7]. The miscanthus fibers have higher wax and silica content
compared to wood fibers which may be responsible for the incompatibility between the
PBS/PBAT matrix and the miscanthus fibers [13]. The tensile and flexural strengths of the
PBS/PBAT/miscanthus composites are not significantly affected with varying processing
parameters. Similarly, tensile and flexural modulus of the PBS/PBAT/miscanthus composites
was not affected significantly with varying processing parameters (data not shown). The Izod
impact strength of the control sample (matrix) showed non-break behavior under tested impact
conditions. Contrastingly, all composite samples showed hinge break behavior under the selected
test conditions. This phenomenon was attributed to the incorporation of stiff fibers into a ductile
polymer matrix. Taking this into consideration, the observed impact strength of the
PBS/PBAT/miscanthus composites was still superior to carbon fiber reinforced composites such
as PLA/carbon fiber (70/30 wt%) [17], PHBV/carbon fiber (70/30 wt%) [18], poly(trimethylene
terephthalate), PTT/carbon fiber composites (70/30 wt%) [19]. It can be noted that the
processing parameters have more influenced on the impact strength of PBS/PBAT/miscanthus
composites.

260
Table 8.4. A complete summary of all the experiments and the related mechanical properties of
PBS/PBAT/miscanthus composites
Experiment Temperature
(oC)
Screw
speed
(rpm)
Holding
pressure
(bar)
Fiber
length
(mm)
Tensile
strength
(MPa)
Flexural
strength
(MPa)
Impact
strength
(J/m)
1 140 100 10 2 21.9±0.26 37.48±0.23 82.34±4.55
2 140 150 10 4 18.8±0.34 34.62±0.30 66.45±3.50
3 180 150 6 2 19.9±0.30 38.61±0.66 76.48±7.85
4 180 100 6 2 19.4±0.34 37.57±0.62 77.04±3.16
5 180 100 6 4 21.6±0.54 39.08±0.43 62.94±2.70
6 180 150 10 2 20.7±1.13 37.86±0.92 67.17±3.08
7 180 100 10 2 19.8±0.40 36.96±2.08 70.90±2.85
8 140 150 10 2 21.1±0.41 37.62±0.27 79.29±6.10
9 140 150 6 4 19.0±0.43 34.62±0.70 67.00±3.13
10 140 150 6 2 19.6±1.05 34.72±0.83 75.39±3.50
11 140 100 6 4 19.3±0.49 33.93±0.35 70.93±3.00
12 180 100 10 4 19.8±0.81 33.99±0.50 67.89±5.00
13 140 100 10 4 19.2±0.55 34.51±0.68 68.19±4.51
14 180 150 6 4 21.6±0.18 38.74±0.92 62.57±4.37
15 180 150 10 4 19.7±0.76 34.39±0.16 62.76±3.79
16 140 100 6 2 19.7±0.67 34.89±1.24 77.55±2.95
Control 140 100 6 0 32.9±1.24 17.12±0.27 non-break
8.6.2 Analysis of variance (ANOVA) for impact strength
ANOVA is a statistical model, which can be used to investigate the significant main and
interaction effects of factors with respect to response. The model had 15 degrees of freedom with
four factors and two levels. To estimate the individual and interaction factors upon the impact
strength, sum of square (SS), mean square (MS), F-test statistics and p-values are presented in
the ANOVA Table 8.5.

261
Table 8.5. Analysis of Variance (ANOVA) for notched Izod impact strength
Source DF Sum of
squares (SS)
Mean squares
(MS)
F P
Temperature 1 96.97 96.97 6.63 0.050
Screw speed 1 26.70 26.70 1.82 0.235
Holding pressure 1 1.51 1.51 0.10 0.761
Fiber length 1 374.71 374.71 25.61 0.004
Temperature*Screw speed 1 0.07 0.07 0.01 0.946
Temperature*Holding pressure 1 15.43 15.43 1.05 0.352
Temperature*Fiber length 1 2.70 2.70 0.18 0.686
Screw speed*Holding pressure 1 2.75 2.75 0.19 0.683
Screw speed*Fiber length 1 0.17 0.17 0.01 0.917
Holding pressure*Fiber length 1 4.63 4.63 0.32 0.598
Error 5 73.16 14.63
Total 15 598.81
S = 3.82523 R-Sq = 87.78% R-Sq(adj) = 63.35%
In this study we have used an alpha level (α) = 0.05 for each F test to analyze the factorial
design experiment. Usually, the higher value of F-ratio suggests more influence of that factor on
the experiment response. According to an F-test, F=25.61 has a p-value of 0.004. Since the p-
value is less than 0.05, we then have sufficient evidence to conclude that the mean impact
strength of the biocomposites was significantly influenced by fiber length. At a 95% confidence
interval (P<0.05), it should be noted that the screw speed and holding pressure do not show
significant effects on the impact strength of the composites. The interaction effects did not
significantly influence the impact strength of the composites. The square correlation coefficient
(R2) was used to judge the adequacy of the developed model fit. The R
2 value can be interpreted

262
as the percentage reduction in the total variation in the experiment obtained by using the
developed model. The typical R2 value is 0 ⩽ R
2 ⩽ 1. The value of R
2 (87.78%) and R
2adj
(63.35%) is substantial and hence the developed model fits the experimental results very well.
8.6.3 Effect of processing parameters on the impact strength
Among the mechanical properties, impact strength was more affected by the processing
factors than other mechanical properties. The impact strength of the short fiber composites
mainly influenced by many factors including matrix intrinsic properties, optimum fiber-matrix
interaction, fiber concentration, fiber geometry, fiber-matrix stress transfer efficiency, fiber
orientation, and fiber dispersion and distribution [20]. At the same time, the fiber bridging, fiber
pull-outs, crack propagation and matrix deformation mechanisms contribute a vital role in the
impact rupture of short fiber reinforced composites [21]. Many of these mechanisms contribute
simultaneously during impact tests, which make it complicated to determine the impact strength
of the composites. Therefore, it is important to investigate the statistically significant factors
upon the impact performance. Morreale et al., [14] have studied the impact performance of the
composites with varying processing parameters. In addition, John et al., [6, 13] have performed a
systematic study of impact performance of Mater-Bi®/miscanthus composites by using factorial
design.
In the present study, the effect of processing parameters/factors on the notched Izod
impact strength was statistically analyzed. More specifically, the statistical analysis was mainly
focused on determining which factors and interactions parameters had more influence on the
Izod impact energy of the biocomposites. Generally, the plot which provides a response with
respect to the changes in the levels of the factors is called the main effect plot. Figure 8.1 shows
the influence of the investigated factors on the impact strength of the resulting biocomposites.

263
Figure 8.1. Main effect plot for the impact strength
Factors with steeper slopes have larger effects and thus a greater influence on the results.
From the main effect plots, it can be observed that the temperature and fiber length factor levels
have more significant effect, which is evidenced with a strong line slope. On the other hand,
holding pressure has almost no effect on the response when varying its levels. The composites
prepared with low temperature processing (140oC), low screw speed (100 rpm), and small fiber
length (2 mm) have higher impact strength compared to those produced with high processing
temperature (180oC), high screw speed (150 rpm) and high fiber length (4 mm). The holding
pressure did not have a great effect on the impact strength upon changing levels such as 6 and 10
bar.
Figure 8.2 represents the statistically significant binary interaction between the selected
variables. The joint effects of two factors such as fiber length/holding pressure, fiber
length/screw speed, holding pressure/screw speed, fiber length/temperature, holding
pressure/temperature, and screw speed/temperature were investigated. If there was no interaction
between the selected variables, the lines on the display should have been approximately parallel.

264
When the response of two factors was not parallel, this indicates a possible interaction between
the selected factors.
Figure 8.2. Plot of interaction effects for the impact strength of biocomposites
Among the selected variable combinations, it can be noted that the most significant
interaction variables are holding pressure/temperature, fiber length/temperature, screw
speed/holding pressure, and fiber length/holding pressure. There is no significant interaction
between the temperature/screw speed and screw speed/holding pressure on the impact strength of
the resulting biocomposites. It can be concluded that the selected variable combinations
(temperature/screw speed and screw speed/fiber length) behave separately, which are not
dependent on each other. Out of the selected four variables the fiber length had the most
significant effect on impact strength while screw speed had the least significant effect.

265
Figure 8.3 shows the significant factors influencing the impact strength of the
PBS/PBAT/miscanthus composites with a confidence level (α) of 0.05. According to the half
normal probability plot the points which are farther away from the fitted line represent the
significant effect on the impact strength. The points which appear close to the straight line
indicate insignificant effects on the impact strength. In the Figure 8.3, it can be seen that all the
significant factors (temperature and fiber length) are represented as square symbols while those
not significant factors are presented as circle symbols.
Figure 8.3. Half Normal probability plot of the standardized effects for impact strength of the
PBS/PBAT/miscanthus composites
The individual and interaction factors for the impact strength of the biocomposites can be
investigated using a horizontal Pareto chart and the results are shown in Figure 8.4. A Pareto
chart is a bar chart that orders the bars from largest to smallest along with a vertical line. This
chart is often used to analyze the statistical significant difference of the individual and interaction
effects on the response. The vertical line in the Pareto chart indicates the significant factors on

266
the response. For example, the bars extended to the right hand side of the vertical line are
significant.
Figure 8.4. Pareto chart of the standardized effects for the impact strength of the
PBS/PBAT/miscanthus biocomposites
In the present study, a Student’s t-test was performed in a Pareto chart with 15 degrees of
freedom at a 95% confidence interval. The t-value (vertical line in the chart) was found to be
2.57 which determine the significant factors and/or interactions on the impact strength of the
composites. The fiber length (D) had significant effect upon the impact strength of the
composites because the standardized effect value is higher than vertical line standardized effect
value 2.57 (t-value). The processing temperature exhibited significant effect on the impact
performance of the Mater-Bi®/miscanthus composites [6, 13]. Contrary to our present result
particle size did not significantly influenced the impact performance of the
biopolymer/miscanthus composites [6, 13]. This could be due to the morphological difference
between the materials due to changing the processing variables.

267
Generally, the tensile toughness of the composites can be calculated from area under the
stress-strain curve. Figure 8.5 shows the stress-strain curves of PBS/PBAT composites with 2
mm miscanthus fibers (B) and 4 mm miscanthus fibers (A). These two composites are prepared
with same processing conditions whilst changing fiber lengths. It can be noticed that the
composites prepared with 2 mm fibers showed better tensile toughness compared to composites
prepared with 4 mm fibers. This result has good agreement with observed impact strength of the
composites with 2 mm fibers.
Figure 8.5. Tensile stress-strain curves of PBS/PBAT/miscanthus composites with changing
fiber length 4 mm (A) and 2 mm (B)
8.6.4 Fiber length distribution
Before and after processing, the length distribution of miscanthus fibers is shown in
Figure 8.6. After processing, the fiber length distribution is broader compared to before
processing. At the same time, the fiber length is drastically reduced. It can be observed that the
length of 4.65 and 2.07 mm miscanthus fibers is not significantly different after processing. For
instance, after processing, the miscanthus fibers with average length reduced from 4.65±2.5 to
1.07±0.34 mm and from 2.07±0.94 to 0.80±0.39 mm. After processing, the length distribution of

268
4.65 mm fibers is varied from 0.45 to 1.9 mm while 2.07 mm fibers varied from 0.2 to 1.9 mm.
This is because of the fiber breakage during extrusion in a twin-screw extruder [22].
Figure 8.6. Histograms of miscanthus fiber length distribution before and after compounding in
a twin screw extruder
Moreover, the individualization of the fiber bundles during high mechanical shear
produced in the compounding chamber is perhaps responsible for this observation. Similar trends
were observed in the sisal fiber reinforced PBS composites [23] as well as kenaf fiber reinforced
starch grafted PP composites [24]. The fiber length has a strong influence on mechanical
performances [25]. It can be noted from Figure 8.6, most of the fibers distributed with >0.9 mm
length in the composites fabricated with 4.65 mm fibers. On the other hand, the composites
15129630
25
20
15
10
5
0
Mean 4.649
StDev 2.453
N 85
Fiber Length (mm)
Nu
mb
er
of
Fib
ers
Long fibers before processing
1.81.51.20.90.60.30.0
18
16
14
12
10
8
6
4
2
0
Mean 1.073
StDev 0.3466
N 85
Fiber length (mm)
Nu
mber o
f fi
bers
Long fibers after processing
15129630
30
25
20
15
10
5
0
Mean 2.075
StDev 0.9477
N 85
Fiber length (mm)
Nu
mb
er
of
fib
ers
Short fibers before processing
1.81.51.20.90.60.3-0.0
12
10
8
6
4
2
0
Mean 0.8014
StDev 0.3950
N 85
Fiber length (mm)
Nu
mb
er
of
fib
ers
Short fibers after processing

269
processed with 2.07mm fiber composites showed most of the fibers distributed <0.9 mm length
in the resulting composites. Based on the fiber distribution after processing, more number of
fiber ends can be observed in the composites prepared with 2.07 mm miscanthus fibers compared
to 4.65 mm miscanthus fibers. Consequently, more number of fiber pullouts can be expected
from the composites prepared with 2.07 mm miscanthus fibers compared to 4.65 mm miscanthus
fibers counterpart. The occurrence of more fiber pullout may be responsible for the observed
high impact strength in the composites prepared with 2.07 mm miscanthus fibers.
Table 8.6. Average fiber length (L), average fiber diameter (D), and aspect ratio (L/D) of the
miscanthus fiber before and after compounding
In general, the composites with a higher aspect ratio fiber should provide superior impact
strength than the composites with lower aspect ratio fiber. For a given composites system, the
recovered fiber length and aspect ratio were examined (Table 8.6) which revealed that the longer
fibers had a higher aspect ratio (3.8) than short fibers (3.2) after processing. The composite with
lower aspect ratio showed higher impact strength while the composite with higher aspect ratio
had lower impact strength. This could be due to the difference in the fiber orientation during
sample preparation [5, 26, 27]. The high aspect ratio fibers can align across the samples and thus
fail to effectively transfer stress between the fiber and matrix. During impact fracture the crack
Samples Number
of fibers
Average length
(L) (mm)
Average diameter
(D) (mm)
Aspect
ratio(L/D)
Long fibers before
compounding
85 4.65±2.5 0.74±0.024 6.3
Short fibers before
compounding
85 2.07±0.94 0.29±0.13 7.13
Long fibers after compounding 85 1.07±0.34 0.28±0.11 3.8
Short fibers after
compounding
85 0.80±0.39 0.25±0.09 3.2

270
initiation and propagation are mainly influenced by matrix behavior and morphology of the
sample, respectively [28]. This phenomenon could play a vital role on the impact strength of
PBS/PBAT/miscanthus composites when changing the fiber lengths.
8.6.4 Scanning electron microscopy
The impact strength of the short fiber reinforced composites is influenced by many
parameters including fiber pull-out and degree of adhesion [29]. In order to study the impact
fracture mechanism of PBS/PBAT/miscanthus composites, the surface morphology of the impact
fractured samples was investigated by SEM analysis. In the short fiber composites the fibers with
subcritical aspect ratio lead to fiber pullout during fracture [30]. Figure 8.7 (a) and (b) represent
the SEM morphology of the 2 mm miscanthus fiber reinforced PBS/PBAT composites and 4 mm
miscanthus fiber reinforced PBS/PBAT composites, respectively.
Figure 8.7. Represents the SEM micrographs of the PBS/PBAT/miscanthus composites; (a)
PBS/PBAT composites with 2 mm miscanthus (b) PBS/PBAT composites with 4 mm
miscanthus
The SEM micrographs of both composites indicate that the fiber pullout mechanism and
poor interfacial bonded regions played eminent role during impact fracture of the composites.
There was no clear morphological difference witnessed in the composites with 2 and 4 mm

271
fibers. However, the observed impact strength difference between the 2 and 4 mm fiber
composites may be due to the combined effects of pullout, energy dissipation mechanism and
fiber orientation [30, 31]. Further work could be performed to find out which mechanism is
responsible to determine the impact strength of miscanthus fibers reinforced PBS/PBAT
composites.
8.6.5 Mathematical model development
The predicated response of the composites is “Y” and it can be represented by equation
(8.1) as a function of independent factors:
Y=f(A,B,C,D) (8 .1)
The polynomial equation was used to explain the main and interaction effect of all the
independent variables [15]. The polynomial equation can be expressed as follows,
Y = X0 + X1 (A) + X2 (B) + X3 (C) + X4 (D) + X5 (AB) + X6 (AC) + X7 (AD) + X8
(BC) + X9 (BD) +X10 (CD) + X11 (ABC) +X12 (ABD) +X13 (ACD) + X14 (BCD) +
X15 (ABCD) (8.2)
The term X0 represents average response (impact strength) value, X1, X2,….X15 is the
regression coefficient of main and interaction effects, A is processing temperature, B is screw
speed, C is holding pressure and D is fiber length. In the equation (8.2), three and four factor
interactions are not considered due to their insignificance [32]. The equation (8.2) can thereby be
modified as;
Y = X0 + X1 (A) + X2 (B) + X3 (C) + X4 (D) + X5 (AB) + X6 (AC) + X7 (AD) + X8 (BC) +
X9 (BD) + X10 (CD) (8.3)
The regression coefficients were calculated using MINITAB®17 statistical software for impact
strength. Substituting significant factor coefficients into Equation 8.3, it can be rewritten as
follows:

272
Y (impact strength) = 70.931 – 2.462 (temperature) – 4.839 (fiber length) (8.4)
When compared to longer and shorter miscanthus fiber reinforced PBS/PBAT composites, the
composites with a shorter fiber showed higher impact strength than the composites with a longer
fiber. The observed impact strength difference could be mainly due to the difference in fiber
distribution in the matrix. Generally, the longer fibers can lead to agglomeration and thus
favoring for crack initiation and poor stress transfer during impact test.
8.6.6 Diagnostic verification of the developed model
The assumption underlying the analysis of variance for each experimental design is
similar to those required for a regression analysis. Assumptions for a completely randomized
design are that the data for the treatment have normal probability distribution with equal
variances. The assumptions can be checked with the residual plots. The normal probability
plot/normal plot for the notched Izod impact strength of the biocomposites is shown in Figure
8.8. To meet the normality assumption points should fall close to straight line on the normal plot.
The normal plot of the impact strength data is dispersed along a straight line, which indicates that
the assumption of normal distribution is valid. The plot of residuals versus fit can be used to
ensure the linear model adequacy.

273
Figure 8.8. Normal probability plot of the residuals for impact strength
Figure 8.9 shows the plot of the residual versus fit for impact strength of the
PBS/PBAT/miscanthus composites. Figure 8.9 shows the variation of impact strength from –1.5
to 1.5 J/m in between fitted and observed values. From the residual versus fit plot, the random
scatter of residuals around the horizontal line can be seen which indicates that the model is
adequate for impact strength data.
Figure 8.9. Residual plots versus fitted values for impact strength

274
The typical residual plot in Figure 8.10 represents the residual versus observation order of
the impact strength of PBS/PBAT/miscanthus composites. There is no distinct pattern observed
in the residuals plot. Both positive and negative residuals are evenly distributed along the
observation order in Figure 8.10. This observation suggests that the impact strength of
PBS/PBAT/miscanthus composites is distributed normally.
Figure 8.10. Variation of the residuals with observed order values of the impact strength of the
PBS/PBAT/miscanthus composites.
8.7 Conclusions
In conclusion the miscanthus fibers can be used as a reinforcing agent for tough
biodegradable polymers. The stiffness and flexural strength of the PBS/PBAT (60/40 wt%)
blends is improved with addition of miscanthus fibers. This is a common observation in natural
fiber reinforced composites. The impact strength of the PBS/PBAT blend was considerably
reduced after incorporation of miscanthus fiber into PBS/PBAT blend matrix. This could be due
to the phase separation of the components in the multiphase material. However, the composites
with 2 mm fiber showed superior impact resistance than 4 mm fiber reinforced composites. This
impact strength variation could be due to the difference in fiber pullout mechanism during
impact test. The influence of independent processing variables on the impact strength of

275
PBS/PBAT/miscanthus composites has been investigated by 24
full factorial design of
experiment. Using student’s t-test and F-test, the statistically significant main and interaction
variables were analyzed at a 95% confidence level. According to main effect plot, Pareto plot,
and half-normal plot, the fiber length plays an important role on the impact strength of the
composites as does processing temperature. From the normality plot, it was observed that the
data are normally distributed along the straight line with R2 value of 87.78%. Further work could
be performed by maximizing more number of variables as well as levels.
References
[1] G. Bogoeva-Gaceva, M. Avella, M. Malinconico, A. Buzarovska, A. Grozdanov, G. Gentile,
M. E. Errico, Natural fiber eco-composites, Polymer Composites, 2007, 28 (1): 98-107.
[2] J. Wang, L. Zheng, C. Li, W. Zhu, D. Zhang, Y. Xiao, G. Guan, Fully biodegradable blends
of poly(butylene succinate) and poly(butylene carbonate): Miscibility, thermal properties,
crystallization behavior and mechanical properties, Polymer Testing, 2012, 31 (1): 39-45.
[3] R. Muthuraj, M. Misra, A. K. Mohanty, Hydrolytic degradation of biodegradable polyesters
under simulated environmental conditions, Journal of Applied Polymer Science, 2015, 132,
42189.
[4] H.-S. Kim, H.-J. Kim, J.-W. Lee, I.-G. Choi, Biodegradability of bio-flour filled
biodegradable poly(butylene succinate) bio-composites in natural and compost soil, Polymer
Degradation and Stability, 2006, 91 (5): 1117-1127.
[5] K. Kirwan, R. M. Johnson, D. K. Jacobs, G. F. Smith, L. Shepherd, N. Tucker, Enhancing
properties of dissolution compounded Miscanthus giganteus reinforced polymer composite
systems: Part 1. Improving flexural rigidity, Industrial Crops and Products, 2007, 26 (1): 14-27.

276
[6] M. Johnson, N. Tucker, S. Barnes, K. Kirwan, Improvement of the impact performance of a
starch based biopolymer via the incorporation of Miscanthus giganteus fibres, Industrial Crops
and Products, 2005, 22 (3): 175-186.
[7] M. R. Nanda, M. Misra, A. K. Mohanty, Performance Evaluation of Biofibers and Their
Hybrids as Reinforcements in Bioplastic Composites, Macromolecular Materials and
Engineering, 2013, 298 (7): 779-788.
[8] A. Bourmaud, S. Pimbert, Investigations on mechanical properties of poly(propylene) and
poly(lactic acid) reinforced by miscanthus fibers, Composites Part A: Applied Science and
Manufacturing, 2008, 39 (9): 1444-1454.
[9] P. Szabó, G. Várhegyi, F. Till, O. Faix, Thermogravimetric/mass spectrometric
characterization of two energy crops, Arundo donax and Miscanthus sinensis, Journal of
Analytical and Applied Pyrolysis, 1996, 36 (2): 179-190.
[10] K. Zhang, V. Nagarajan, N. Zarrinbakhsh, A. K. Mohanty, M. Misra, Co-injection molded
new green composites from biodegradable polyesters and miscanthus fibers, Macromolecular
Materials and Engineering, 2014, 299 (4): 436-446.
[11] K. Zhang, M. Misra, A. K. Mohanty, Toughened Sustainable Green Composites from
Poly(3-hydroxybutyrate-co-3-hydroxyvalerate) Based Ternary Blends and Miscanthus Biofiber,
ACS Sustainable Chemistry and Engineering, 2014, 2 (10): 2345-2354.
[12] V. Nagarajan, A. K. Mohanty, M. Misra, Sustainable Green Composites: Value Addition to
Agricultural Residues and Perennial Grasses, ACS Sustainable Chemistry and Engineering,
2013, 1 (3): 325-333.
[13] R. M. Johnson, N. Tucker, S. Barnes, Impact performance of Miscanthus/Novamont Mater-
Bi® biocomposites, Polymer Testing, 2003, 22 (2): 209-215.

277
[14] M. Morreale, R. Scaffaro, A. Maio, F. P. La Mantia, Mechanical behaviour of Mater-
Bi®/wood flour composites: A statistical approach, Composites Part A: Applied Science and
Manufacturing, 2008, 39 (9): 1537-1546.
[15] D.C. Montgomery Design and Analysis of Experiments (4th ed.) Wiley, New York (1997).
[16] R. Muthuraj, M. Misra, A. Mohanty, Biodegradable Poly(butylene succinate) and
Poly(butylene adipate-co-terephthalate) Blends: Reactive Extrusion and Performance Evaluation,
Journal of Polymers and the Environment, 2014, 22 (3): 336-349.
[17] R. Chen, M. Misra, A. K. Mohanty, Injection-moulded biocomposites from polylactic acid
(PLA) and recycled carbon fibre Evaluation of mechanical and thermal properties, Journal of
Thermoplastic Composite Materials, 2014, 27 (9): 1286-1300.
[18] J. P. Reddy, S. Ahankari, M. Misra, A. Mohanty, A New Class of Injection Moulded
Structural Biocomposites from PHBV Bioplastic and Carbon Fibre, Macromolecular Materials
and Engineering, 2013, 298 (7): 789-795.
[19] S. Vivekanandhan, M. Misra, A. K. Mohanty, Thermal, mechanical, and morphological
investigation of injection molded poly(trimethylene terephthalate)/carbon fiber composites,
Polymer Composites, 2012, 33 (11): 1933-1940.
[20] F. Ramsteiner, R. Theysohn, Tensile and impact strengths of unidirectional, short fibre-
reinforced thermoplastics, Composites, 1979, 10 (2): 111-119.
[21] S. C. Tjong, S. A. Xu, Y. W. Mai, Impact fracture toughness of short glass fiber-reinforced
polyamide 6,6 hybrid composites containing elastomer particles using essential work of fracture
concept, Materials Science and Engineering: A, 2003, 347 (1–2): 338-345.

278
[22] J. M. Lee, Z. A. Mohd Ishak, R. Mat Taib, T. T. Law, M. Z. Ahmad Thirmizir, Mechanical,
thermal and water absorption properties of kenaf-fiber-based polypropylene and poly(butylene
succinate) composites, Journal of Polymers and the Environment, 2013, 21 (1): 293-302.
[23] Y.-H. Feng, D.-W. Zhang, J.-P. Qu, H.-Z. He, B.-P. Xu, Rheological properties of sisal
fiber/poly(butylene succinate) composites, Polymer Testing, 2011, 30 (1): 124-130.
[24] A. Hamma, M. Kaci, Z. A. Mohd Ishak, A. Pegoretti, Starch-grafted-polypropylene/kenaf
fibres composites. Part 1: Mechanical performances and viscoelastic behaviour, Composites Part
A: Applied Science and Manufacturing, 2014, 56 (0): 328-335.
[25] W. Liu, L. T. Drzal, A. K. Mohanty, M. Misra, Influence of processing methods and fiber
length on physical properties of kenaf fiber reinforced soy based biocomposites, Composites Part
B: Engineering, 2007, 38 (3): 352-359.
[26] A. N. Oumer, O. Mamat, A Review of Effects of Molding Methods, Mold Thickness and
Other Processing Parameters on Fiber Orientation in Polymer Composites, Asian Journal of
Scientific Research, 2013, 6 (3): 401-410.
[27] B.-D. Park, J. J. Balatinecz, Mechanical properties of wood-fiber/toughened isotactic
polypropylene composites, Polymer Composites, 1997, 18 (1): 79-89.
[28] V. N. Hristov, R. Lach, W. Grellmann, Impact fracture behavior of modified
polypropylene/wood fiber composites, Polymer Testing, 2004, 23 (5): 581-589.
[29] D. N. Saheb, J. P. Jog, Natural fiber polymer composites: A review, Advances in Polymer
Technology, 1999, 18 (4): 351-363.
[30] V. Alvarez, A. Vazquez, C. Bernal, Effect of microstructure on the tensile and fracture
properties of sisal fiber/starch-based composites, Journal of composite materials, 2006, 40 (1):
21-35.

279
[31] K. Senthil Kumar, I. Siva, P. Jeyaraj, J. T. Winowlin Jappes, S. C. Amico, N. Rajini,
Synergy of fiber length and content on free vibration and damping behavior of natural fiber
reinforced polyester composite beams, Materials and Design, 2014, 56 (0): 379-386.
[32] K. Palanikumar, J. Paulo Davim, Mathematical model to predict tool wear on the machining
of glass fibre reinforced plastic composites, Materials and Design, 2007, 28 (7): 2008-2014.

280
Chapter 9: Hydrolytic Degradation of Biodegradable Polyesters under
Simulated Environmental Conditions*
*A version of this chapter has been published in: R. Muthuraj, M. Misra, A. K. Mohanty,
Hydrolytic degradation of biodegradable polyesters under simulated environmental conditions,
Journal of Applied Polymer Science, 2015, 132, 42189. (adapted with kind permission from John
Wiley and Sons, Jul 09, 2015, License number 3664990532946).
Abstract
In this study, the durability of poly(butylene succinate) (PBS), poly(butylene adipate-co-
terephthalate) (PBAT) and PBS/PBAT blend was assessed by exposure to 50 oC and 90%
relative humidity for a duration of up to 30 days. Due to the easy hydrolysis of esters, the
mechanical properties of PBS and PBAT are significantly affected with increasing conditioning
time. The PBS, PBAT and PBS/PBAT showed an increase in modulus as well as a decrease in
tensile strength and elongation at break with increased exposure time. Furthermore, the impact
strength of PBAT remains unaffected up to 30 days of exposure. However, it was clearly
observed that the fracture mode of PBS/PBAT changed from ductile to brittle after being
exposed to high heat and humid conditions. This may be attributed to the hydrolysis products of
PBS accelerating the degradation of PBAT in the PBS/PBAT blend. The differential scanning
calorimetry results suggested that the crystallinity of the samples increased after being exposed
to elevated temperature and humidity. This phenomenon was attributed to the induced
crystallization from low molecular weight polymer chains that occurred during hydrolysis.
Therefore, low molecular weight polymer chains are often favored to the crystallinity
enhancement. The increase in crystallinity eventually increased the modulus of the conditioned
samples. The enhanced crystallinity was further confirmed by polarizing optical microscopy

281
(POM) analysis. Moreover, the hydrolysis of the polyesters was evaluated by scanning electron
microscopy (SEM), rheology, and Fourier transform infrared (FTIR) spectroscopy analysis.
9.1 Introduction
During the past decade, biodegradable polymers and their blends have gained great
attention in wide range of applications due to their low environmental footprint. Among the
biodegradable polymers, poly(butylene succinate) (PBS) is a promising aliphatic polyester, made
from fossil fuel based 1,4-butanediol and succinic acid precursors, which can also be derived
from biobased succinic acid. PBS has many desirable properties including good toughness and
melt processability. The mechanical properties of the PBS fall between polyolefins with a wide
processing window [1, 2]. In addition, the mechanical and thermal properties of the PBS depend
on the degree of crystallinity and the spherulite morphology [3]. Degradability of the PBS has
been widely studied under different environmental conditions [4-8].These studies claimed that
the PBS is susceptible to hydrolysis in the presence of moisture/water. The main route of
hydrolytic degradation occurs through cleavage of ester linkages and leads to lower molecular
weight compounds.
Solely aromatic polyesters are resistant to biological degradation. Therefore, an attempt
has been made to introduce aliphatic moieties into aromatic polyesters in order to enhance the
hydrolytic degradation [9]. For example, poly(butylene adipate-co-terephthalate) (PBAT) is a
commercialized biodegradable aliphatic-aromatic copolyester [10]. The PBAT exhibits good
thermal and mechanical properties with a terephthalic acid concentration above 35 mol% [11].
At the same time, PBAT possesses good biodegradability with an aromatic moiety concentration
below 55 mol%. The properties of PBAT can be compared to that of low-density polyethylene
with regards to its tensile properties. Nowadays, PBS and PBAT are widely used for many
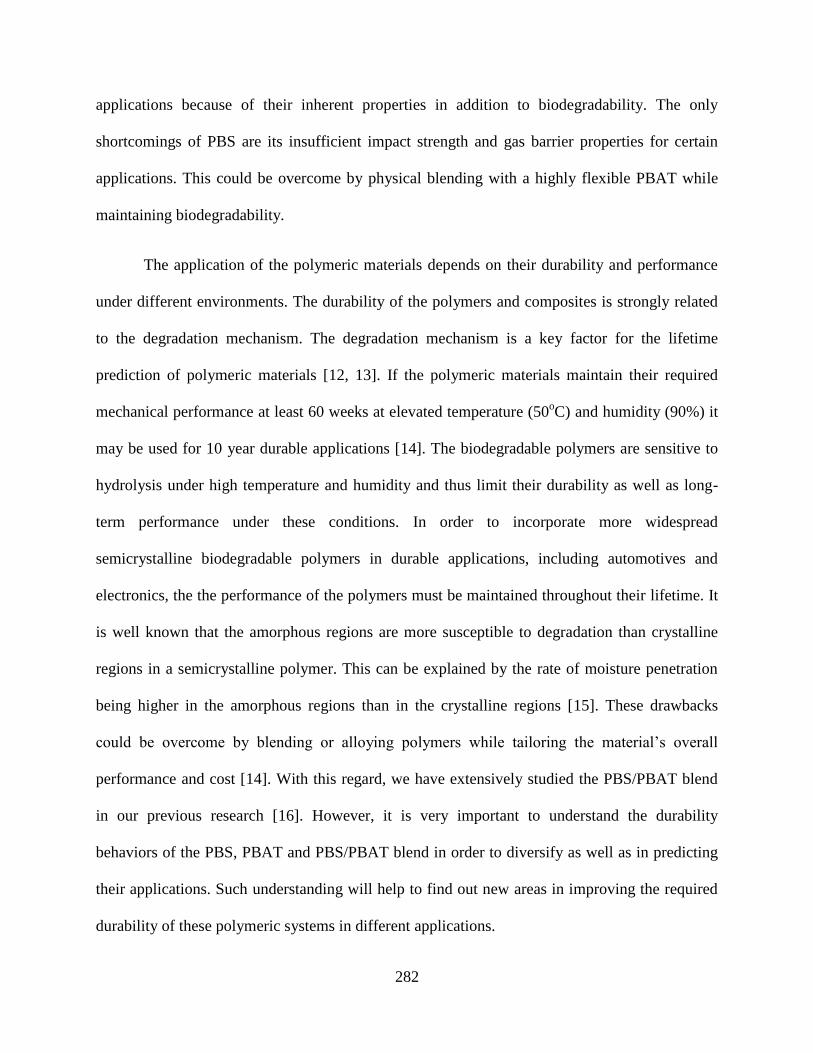
282
applications because of their inherent properties in addition to biodegradability. The only
shortcomings of PBS are its insufficient impact strength and gas barrier properties for certain
applications. This could be overcome by physical blending with a highly flexible PBAT while
maintaining biodegradability.
The application of the polymeric materials depends on their durability and performance
under different environments. The durability of the polymers and composites is strongly related
to the degradation mechanism. The degradation mechanism is a key factor for the lifetime
prediction of polymeric materials [12, 13]. If the polymeric materials maintain their required
mechanical performance at least 60 weeks at elevated temperature (50oC) and humidity (90%) it
may be used for 10 year durable applications [14]. The biodegradable polymers are sensitive to
hydrolysis under high temperature and humidity and thus limit their durability as well as long-
term performance under these conditions. In order to incorporate more widespread
semicrystalline biodegradable polymers in durable applications, including automotives and
electronics, the the performance of the polymers must be maintained throughout their lifetime. It
is well known that the amorphous regions are more susceptible to degradation than crystalline
regions in a semicrystalline polymer. This can be explained by the rate of moisture penetration
being higher in the amorphous regions than in the crystalline regions [15]. These drawbacks
could be overcome by blending or alloying polymers while tailoring the material’s overall
performance and cost [14]. With this regard, we have extensively studied the PBS/PBAT blend
in our previous research [16]. However, it is very important to understand the durability
behaviors of the PBS, PBAT and PBS/PBAT blend in order to diversify as well as in predicting
their applications. Such understanding will help to find out new areas in improving the required
durability of these polymeric systems in different applications.

283
Only limited research works have been reported on the long-term durability behaviours of
biodegradable polymers under simulated environmental conditions [13,14,17-19]. For instance,
the long-term durability of polylactide (PLA) samples has been studied by few researchers [13,
14, 20]. These studies showed that the mechanical performance of the PLA was significantly
affected after exposure to elevated temperature and moisture levels. Therefore, PLA is still an
underperforming biopolymer for long-term durable applications such as automotive parts. In
addition, Harris and Lee [13] have studied the hydrolytic degradation of PLA and a
PLA/polycarbonate (PC) blend exposed to elevated temperature and humidity for 28 days. They
have noticed a reduction in the mechanical performance of PLA and PLA/PC blend with
increasing conditioning time. Therefore, the author concludes that the PLA accelerated the
degradation of PC in the PLA/PC blend under these conditions. However, PLA/PC blend
exhibits superior flexural strength than neat PLA during the entire conditioning period. Another
study by Kim and Kim [17] showed that polypropylene (PP) has a more hydrolytic resistant
behaviour than biodegradable polymers (PBS, PBAT and PLA) because of its inherent non-
biodegradability character.
To the best of our knowledge, there have not been many studies available in literature on
the durability of PBS, PBAT and their blends at elevated temperature and humidity. Considering
the above, in the present study, our attention was to investigating the durability of PBS, PBAT
and PBS/PBAT blend at an elevated temperature and humidity level. In this sense, the present
study was aimed to investigate the effect of mechanical and physico-mechanical properties of
PBS, PBAT and PBS/PBAT blend at 50oC with 90% relative humidity for duration of up to 30
days. The samples were evaluated before conditioning and after 6, 12, 24 and 30 days of

284
continuous conditioning. The hydrolytic degradation of the polyesters was examined by using
various analytical techniques.
9.2 Materials and Methodology
9.2.1 Materials
For this study, commercially available PBAT pellets were supplied by Xinfu
Pharmaceutical Co., Ltd, China, under the trade name of Biocosafe 2003F with a melting point
of 117oC. PBS pellets were supplied by the same company under the trade name of Biocosafe
1903F with a melting point of 115oC. PP-1350N homopolymer was procured from Pinnacle
Polymers (Garyville, LA). According to manufacturer information, the density and melt flow
index of the PP-1350N are 0.9 g/cm3 and 55 g/10min, respectively. Neat PBS and PBAT were
dried in an oven for six h at 80oC to remove the moisture prior to melt processing.
9.2.2 Sample preparation and conditioning
Neat PP, PBS, PBAT and blend of PBS/PBAT (60/40 wt%) were extruded in a Leistritz
extruder with a screw speed of 100 rpm. The extruder was equipped with co-rotating twin-screws
with a screw diameter of 27 mm and a L/D ratio of 48. Prior to the injection molding, the
extrudates were pelletized and dried in an oven at 80oC for 12 h. The dried extruded pellets were
injection molded in an ARBURG allrounder 370C (Model No: 370 S 700-290/70, Germany)
injection molding machine to obtain desired test specimens. The injection-moulding machine had
a maximum injection pressure of 2000 bar and a screw diameter of 35 mm. The extrusion and
injection molding process was carried out with a processing temperature of 140oC for PBS,
PBAT and PBS/PBAT and 180oC for PP.
In the literature, the durability of polymers, polymer blends and their composites was
studied at different accelerated environmental conditions, [21-23] in vehicle and in-field

285
conditions [13,14]. Furthermore, long-term durability of the polymeric material has been studied
in the presence of Xenon light, UV light, metal halide and carbon arc lamps by many researchers
[24, 25]. However, in order to model the PBS, PBAT and PBS/PBAT blend for automotive
interior applications; all the moulded samples were conditioned under simulated temperature
(50oC) and relative humidity (90%) [18]. These conditions were simulated using an
environmental chamber, Envirotronics Endurance C340. The samples were tested initially before
and after 6, 12, 24, and 30 days continuous conditioning at 50oC and 90% relative humidity
(RH). Except moisture absorption analysis, all other characterizations were performed after
drying the test samples at 80oC for 24 h in order to avoid plasticization effect of excess moisture
in the specimens.
9.2.3 Moisture absorption
Before performing moisture absorption test, all the samples were dried at 80 oC till a
constant weight is reached. The moisture absorption of the samples was calculated by taking out
the samples at required time interval for the set environmental exposure conditions (50 oC and
90% RH). The percentage of moisture uptake was calculated by using the equation:
Moisture uptake (%) =
x 100 (9.1)
where Wa and Wb are weight of the samples after and before moisture exposure. The reported
moisture absorption values are an average of three samples.
9.2.4 Fourier transform infrared spectroscopy (FTIR)
FTIR analysis was performed in a Thermo Scientific NicoletTM
6700 at room temperature
with a Smart Orbit attachment. FTIR spectrum was recorded in the range of 4000-400cm-1
with a
resolution of 4 cm-1
and averaged over 36 readings.

286
9.2.5 Mechanical properties
Tensile and flexural tests were performed in an Instron Universal Testing Machine
(Model 3382) according to ASTM D638 and D790, respectively. The crosshead movement
speeds of 14 mm/min for flexural test and 50 mm/min for tensile test were used as recommended
by the respective standards. The tensile tests were performed until the conditioned samples broke
at the grip region as a consequence of embrittlement. Therefore, the experiment was conducted
only up to 30 days. Notched Izod impact strength was assessed with an impact test machine from
TMI 43-02, USA, complying with ASTM D256.The results are reported as an average of five
samples for each formulation.
9.2.6 Differential scanning calorimetry (DSC)
The DSC analysis was performed in a TA-Q200 instrument with a heating and cooling
rate of 10 and 5 oC/min, respectively. The samples were heated under a nitrogen flow rate of 50
mL/min. The melting enthalpy was calculated by measuring area under the curves using TA
analysis software. The first heating cycle was considered in order to measure sample crystallinity
before and after conditioning. The percentage crystallinity of the PBS and PBAT was calculated
by using the following formula:
% Crystallinity (χc) =
x 100% (9.2)
where ∆Hm100 is the theoretical enthalpy of melting for 100% crystalline PBS (110.3 J/g) [8] and
PBAT (114 J/g) [26]. ∆Hm is the measured enthalpy of melting. The PBS cystallinity in the
PBS/PBAT blend was calculated as follows:
χc =
x 100% (9.3)

287
where wf is the weight fraction of the PBAT in the PBS/PBAT blend.
9.2.7 Dynamic mechanical analysis (DMA)
DMA analysis was performed using TA Instrument (DMA Q800), USA. The
experiments were conducted from -60 to 100oC. The selected temperature range was based on
the glass transition temperature and melting temperature of the samples. The scans were
performed at a constant rate of heating (3 oCmin
-1) with oscillating amplitude of 15 µm and a
frequency of 1 Hz in a dual cantilever clamp mode.
9.2.8 Rheological properties
Rheological properties were obtained in an Anton Paar Rheometer MCR302. The
experiments were carried out in parallel plates with a gap of 1 mm and a diameter of 25 mm. In
order to avoid degradation of the samples during the experiments, all the samples were vacuum
dried at 80 oC for 4 h before performing the experiments. The shear viscosity values of the
samples both before and after conditioning were measured at 140oC from 300 to 0.01 rad/s.
9.2.9 Polarizing optical microscopy (POM)
Spherulite morphology of the samples was observed by using optical polarizing
microscope (Nikon Eclipse LV100) equipped with a Linkam LTS 420 hot stage. Thin films of
the samples were made by heating the sample between two transparent microscope glass slides.
All the samples were heated to 150⁰C for 60 s followed by the samples being quickly transferred
to 90⁰C in the microscope hot stage. Subsequently, the samples were kept at close to
crystallization temperature (90oC) and the spherulite growth was recorded using a Nikon camera.
9.2.10 Morphological analysis
The specimens were prepared by sputtering gold particles in order to avoid electrical
charging during examination. A scanning electron microscope, Inspect S 50, FEI Netherlands,

288
was utilized to examine the fracture surface morphology of the specimens. The surface
morphology of the specimens was examined at an accelerating voltage of 20 kV.
9.3 Results and Discussion
9.3.1 Moisture absorption
Moisture absorption of all the samples was investigated as a function of exposure time.
Figure 9.1 shows the moisture absorption curves in percent of the PP, PBS, PBAT and
PBS/PBAT blend up to 34 days. Generally, more or less; all the polymers tend to absorb
moisture in a humid atmosphere. Usually, polymers with strong polar functionality such as
carbonyl (>C=O) groups and amine groups are able to absorb moisture by hydrogen bonds [27].
Therefore, it is expected that the polyesters can absorb more moisture than the relatively non-
polar polymers such as PP. It can be seen that the PP absorbed a very small amount
(0.011±0.004%) of moisture and the moisture absorption curve has reached a typical Fickian
behavior. It has been reported that the PP is resistant to moisture absorption even at elevated
temperatures [28]. On the contrary, moisture absorption of PBS, PBAT and their blend was
monotonically increased with increasing exposure time up to 34 days. After 34 days exposure,
the PBS showed a maximum moisture absorption (1.11±0.002%) followed by PBS/PBAT
(1.05±0.01%) and PBAT (0.99±0.003%). The observed moisture absorption difference between
the PBS and PBAT may be due to polarity differences between the polymers [29]. Due to the
moisture absorption, it can be expected that the PBS and PBAT can undergo hydrolytic
degradation at elevated temperature and humidity. Normally, higher moisture absorption of
polyesters causes undesirable losses in mechanical performances [13, 30].

289
Figure 9.1. Moisture absorption curves as a function of conditioning time
9.3.2 Hydrolytic degradation mechanism of PBS and PBAT
It is known that the ester linkages of PBS and PBAT are more sensitive to elevated
temperature and moisture [17, 19]. Therefore, in the presence of moisture, the PBS and PBAT
primarily can undergo hydrolytic degradation through cleavage of ester linkages on the polymer
backbone. In addition, the hydrolysis reaction may occur in the form of depolymerization
process and random chain scission mechanism [30]. The possible hydrolytic degradation of PBS
and PBAT under elevated humidity and temperature is depicted in Figure 9.2 and 9.3,
respectively.

290
Figure 9.2. Hydrolysis reaction of PBS
The chain scission is frequently terminated by carboxylic acid end groups [13,30,31] and
hydroxyl end groups [32]. A similar type of hydrolytic degradation mechanism was proposed
for PLA [13], PBS [8, 33] and poly(ethylene terephthalate) (PET) [30]. When PBS is exposed to
high temperature and humidity environment, the surrounding moisture can interact with ester
functionality of PBS and thus can create the low molecular weight PBS through hydrolytic
degradation mechanism [33].
Figure 9.3. Hydrolysis reaction of PBAT

291
The hydrolytic degradation of PBS, PBAT and their blend was further confirmed by
FTIR analysis. Figure 9.4 shows FTIR spectrum of PBS, PBAT and PBS/PBAT before and after
30 days of being exposed to elevated humidity and temperature. In PBS, the band at 917 cm-1
was due to the –C-O-C- groups in the ester linkage of PBS [8]. The band at 1325 cm-1
resulted
from the asymmetric stretching of the -CH2- group in the PBS backbone. The peak at 1045 cm-1
was attributed to the -O-C-C- stretching vibration and the peak in the range 1151 cm-1
. The band
at 1712 cm-1
resulted from the C=O stretching vibration of the ester group in PBS [17]. After 30
days hydrolysis of PBS, a remarkable decrease of –C-O-C- and C=O absorption intensity was
observed. These reductions in absorption intensity were due to lowering of the molecular weight
and deterioration of the chemical structure by hydrolysis after being exposed to moisture and
heat [8, 18, 34]. The characteristic peaks of the PBAT can be described as follows: a sharp peak
at 1710 cm-1
represents the C=O functionality of the ester linkage; the band at around 1267 cm-1
assigned to the C-O group in the ester linkage; the peak at 727 cm-1
resulted from four or more
adjacent -CH2- groups in the PBAT backbone. The peaks in the range of 700-900 cm-1
were
attributed to benzene substitutes [35]. After 30 days of exposure to moisture and heat, there is no
significant change observed in the FTIR spectra of PBAT. This is possibly due to the partial
aromatic structure of PBAT. On the contrary, the FTIR spectra of PBS/PBAT showed a
remarkable decrease in the characteristic peak intensity. This phenomenon may be attributed to
the hydrolysis product of PBS accelerating the degradation of PBAT in the PBS/PBAT blend
[31].

292
Figure 9.4. FTIR spectra of PBS, PBAT and PBS/PBAT before and after 30 days exposed to
50oC with 90% relative humidity
9.3.3 Changes in mechanical properties
Mechanical properties are the main indicators in order to evaluate the durability of the
polymeric materials. The influence of moisture and heat on the mechanical properties was
measured by tensile and flexural properties as well as impact strength. The mechanical properties
of neat PBS, PBAT, PBS/PBAT blend and PP are provided in our previous study [19]. Figure 9.5
shows the tensile strength of PBS, PBAT, PBS/PBAT and PP before and after exposure at 50 °C
with 90% RH up to 30 days. In general, the mechanical properties of semicrystalline polymers
are dependent on their molecular weight, crystal size and percentage of crystallinity [36]. The
tensile strength of PBS and PP showed slight enhancement after 6 days of exposure to 50oC and
90% RH. This can be attributed to the post crystallization of the samples after being exposed to
elevated humidity and temperature. A similar result has been found for PLA [13],

293
poly(hydroxybutyrate-co-valerate) (PHBV) [37], and homo polypropylene [38] specimens when
exposed to different environmental conditions. However, after 6 days of exposure; PBAT as well
as PBS/PBAT blend showed a slight reduction in tensile strength. This could be due to the
plasticization effect of hydrolytically degraded amorphous region in the PBAT. It can be
observed that the tensile strength of PBS, PBAT and PBS/PBAT blend decreased significantly
with increasing hydrolysis time. For example, after 12 days exposure time, the tensile strength of
PBS, PBAT, and PBS/PBAT blend was reduced by 40, 39 and 11%, respectively. The reduced
tensile strength may be attributed to the combined effect of hydrolytic degradation and molecular
weight reduction after being exposed to the raised humidity and temperature [33]. Generally, the
hydrolytic degradation of the biodegradable polymers is higher in the amorphous regions than
crystalline regions under high humidity [39]. A similar type of observation has been made in
PBS, PBAT, PBS/PBAT and PP after being exposure to 18 days of elevated humidity and heat
[19]. However, after 30 days of conditioning, the tensile strength of the PBS and PBS/PBAT
blend exhibited extreme degradation in contrast to PBAT. This is possibly due to the accelerated
degradation of PBS with the increased time at elevated temperature and humidity [15]. Our
finding had good agreement with the recent study by Kim and Kim [17]. Usually, the hydrolytic
degradation and biodegradability of the polymers mainly depend on the easily hydrolysable ester
functionality in the polymer backbone. In the present study, PP did not show any significant
reduction in the tensile strength up to 30 days conditioning, which is due to the non-polar as well
as its hydrophobicity type of characteristic.

294
Figure 9.5. Tensile strength of PP, PBS, PBAT and PBS/PBAT as a function of exposure time at
50 oC with 90% relative humidity
Figure 9.6 demonstrates the flexural strength of the PBS, PBAT, PBS/PBAT and PP after
and before exposure to elevated temperature and humidity. After 6 days of conditioning, the
PBAT did not show any significant improvement in the flexural strength, which may be due to
PBAT possessing a high entanglement density. Interestingly, the flexural strength of PBS,
PBS/PBAT blend and PP were increased 13, 15 and 15% respectively with increasing exposure
time up to 6 days. After 18 days of continuous conditioning at 50oC with 90% RH, the flexural
strength of PBS, PBS/PBAT and PP samples was found to increase slightly [19]. The increased
flexural strength is probably due to the increased crystallinity of the samples after being exposed
to elevated temperature [40].

295
Figure 9.6. Flexural strength of PP, PBS, PBAT and PBS/PBAT as a function of exposure time
at 50 oC with 90% relative humidity
However, it is important to note that the PBS and PBS/PBAT blend samples became
more brittle after 30 days conditioning and leading to premature failure during flexural test, as
shown in Figure 9.7. Harris and Lee [13] found that the PLA and PLA/PC blend underwent
severe flexural strength reduction because of the hydrolytic degradation under the exposed
elevated temperature (70oC) and humidity (90% RH). On the other hand, they have noticed that
the PC/ABS blend did not show any significant changes in the flexural strength up to 30 days
conditioning because of the resistance to the hydrolysis.

296
Figure 9.7. Testing failure mode of PBS, PBAT, PBS/PBAT and PP after 30 days exposed to
50oC with 90% relative humidity
Figure 9.8 represents the elongation at break of the samples with respect to the exposure
time. Except PBAT, all the samples showed drastic reduction in the elongation at break from
early exposure time. The PP, PBS and PBS/PBAT blend showed a drastic decrease in the percent
elongation after 6 days conditioning. Therefore, it is clear that the toughness is more sensitive
than the strength after being exposed to raised humidity and temperature. A similar trend has
been reported in the literature for PP [41], high-density polyethylene (HDPE) [42], and PHBV
[37]. After conditioning, PBS showed lower elongation than PP during the entire exposed time.
This implies that the PBS is more moisture sensitive than the PBAT and the PP. Toughness of
the polymer is mainly dependent on the tie molecules and entanglement of the polymer chains
[42-44]. When, the entanglement density decreased in the polymers it led to a reduction in the
toughness of the resultant materials. Apparently, PBAT is more ductile and less crystalline than
PBS due to the higher degree of chain entanglements. Therefore, PBAT maintains its elongation
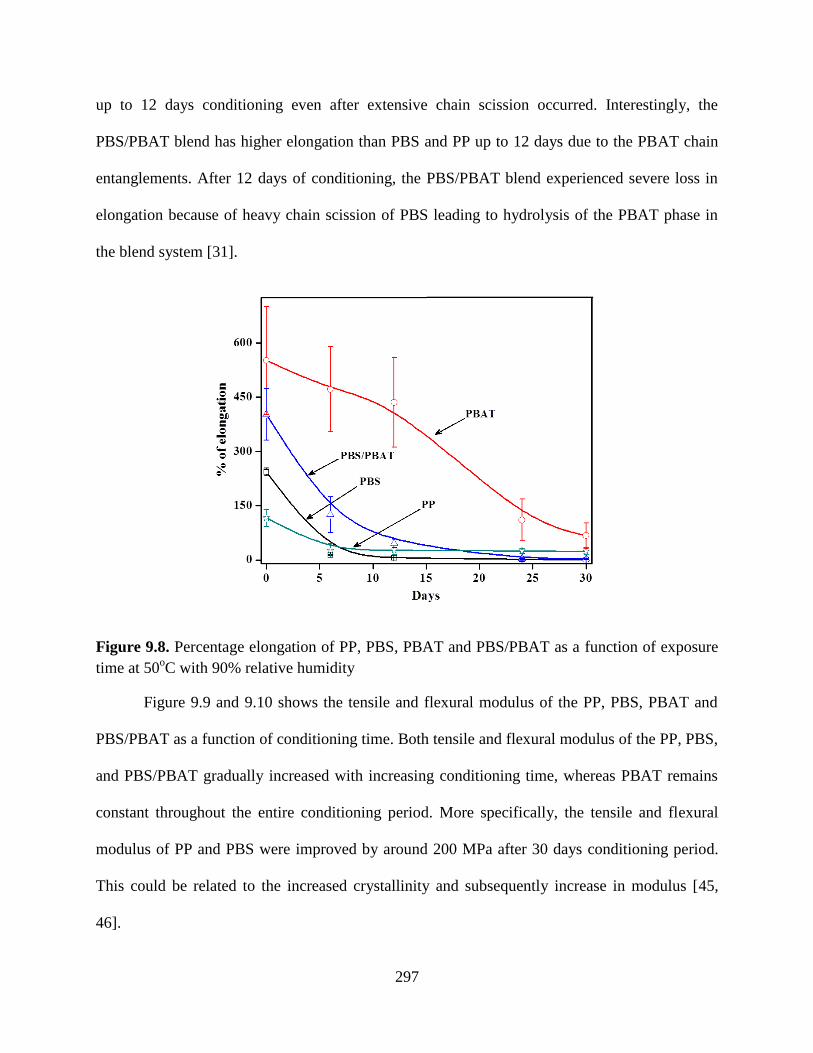
297
up to 12 days conditioning even after extensive chain scission occurred. Interestingly, the
PBS/PBAT blend has higher elongation than PBS and PP up to 12 days due to the PBAT chain
entanglements. After 12 days of conditioning, the PBS/PBAT blend experienced severe loss in
elongation because of heavy chain scission of PBS leading to hydrolysis of the PBAT phase in
the blend system [31].
Figure 9.8. Percentage elongation of PP, PBS, PBAT and PBS/PBAT as a function of exposure
time at 50oC with 90% relative humidity
Figure 9.9 and 9.10 shows the tensile and flexural modulus of the PP, PBS, PBAT and
PBS/PBAT as a function of conditioning time. Both tensile and flexural modulus of the PP, PBS,
and PBS/PBAT gradually increased with increasing conditioning time, whereas PBAT remains
constant throughout the entire conditioning period. More specifically, the tensile and flexural
modulus of PP and PBS were improved by around 200 MPa after 30 days conditioning period.
This could be related to the increased crystallinity and subsequently increase in modulus [45,
46].

298
Figure 9.9. Tensile modulus of PP, PBS, PBAT and PBS/PBAT as a function of exposure time
at 50oC with 90% relative humidity
A number of researchers have observed a similar tendency in the modulus after exposure
to different weathering conditions [12, 37, 42]. These studies were concluded that the modulus
improvement of the conditioned samples is associated with structural relaxation, increase in
crystallinity, crystal perfection and increase of lamella thickness. In addition, the brittleness of
the PBS and PBS/PBAT blend sample was also improved with increasing conditioning time up
to 30 days, accounting for the reduction in impact toughness.

299
Figure 9.10. Flexural modulus of PP, PBS, PBAT and PBS/PBAT as a function of exposure
time at 50oC with 90% relative humidity
Among the mechanical properties, impact energy is more sensitive to the environmental
exposure. Table 9.1 shows the impact strength of PBS, PBAT, PBS/PBAT and PP after and
before conditioning at 50oC and 90% RH. Before conditioning, the PBAT showed non-break
impact strength of 211 J/m while PBS and PP showed complete break with impact strength of 25
and 30 J/m, respectively. The impact energy of the PBS and PP decreased for the first 6 days of
conditioning. This reduction is probably due to the inadequate degree of entanglement between
amorphous and crystalline phase after exposed to 50oC and 90% RH [45]. The notched Izod
impact strength of PBS, PBAT, PBS/PBAT blend, and PP samples after conditioning for 18 days
is explained elsewhere [19]. With increased exposure time (from 6 to 30 days), the impact
energies of both PBS and PP were not significantly affected. In contrast, the impact energy of the
PBAT remains unchanged up to 30 days of conditioning at elevated temperature and humidity.
This may be due to the PBAT having sufficient molecular weight to form a significant degree of

300
entanglement up to 30 days of hydrolysis environments [14, 31]. Furthermore, the impact
strength of PBS/PBAT changed from a ductile to brittle fracture with increasing conditioning
time, as shown in Figure 9.7. This could be due to the accelerated degradation of PBS with the
increased exposure time. Moreover, except PBAT, all the samples exhibit brittle failure with
increasing conditioning time. This observation corroborated with the modulus improvements.
Table 9.1.Notched Izod impact strength (J/m) of the samples before and after conditioned at
50oC with 90% relative humidity
Samples Before
conditioning
After 6 days
conditioning
After 12 days
conditioning
After 24 days
conditioning
After 30 days
conditioning
PBS
24.80
±
6.55
12.54
±
6.20
13.19
±
1.91
12.90
±
1.003
12.41
±
1.07
PBAT
Non-break
(210.55
±
10.37)
Non-break
(211.62
±
46.54)
Non-break
(209.09
±
27.01)
Non-break
(203.97
±
25.22)
Non-break
(193.16
±
35.47)
PBS/PBAT Non-break
(226.77
±
43.95)
56.22
±
4.24
52.24
±
14.24
11.36
±
1.92
13.04
±
2.69
PP
30.40
±
7.08
21.77
±
0.79
24.47
±
2.33
19.74
±
0.79
20.97
±
0.90
9.3.4 Differential scanning calorimetry
After exposing the polymers to raised humidity and temperature, it is expected that the
spherulitic growth rates, lamellar thickness, and crystal interphase be modified due to the free
energy changes in the crystals formation. DSC traces of the samples before and after
conditioning are shown in Figure 9.11 and 9.12. The thermal properties of PBS, PBAT and
PBS/PBAT blends are summarized in Table 9.2. Melting enthalpy (∆Hm) of the sample was

301
calculated by measuring the area under the melting peak while crystallization enthalpy (∆Hc) was
the measured area under the crystallization peak.
Figure 9.11. DSC heating cycles for PBS, PBAT and PBS/PBAT before and after exposed to 50 oC with 90% relative humidity for 30 days
Before conditioning, all the samples showed a single melting temperature (Tm). In the
heating cycles (Figure 9.11), a small exothermic peak was also observed for PBS and PBS/PBAT
prior to melting peak. This resulted from the melt-recrystallization of PBS while heating [47].
However, after 30 days exposure, PBS and PBS/PBAT samples displayed a bimodal melting
peak, as shown in Figure 9.11. The hydrolytic degradation of the polymers leads to wide range of
molecular weight distribution. The shorter polymer chains are having tendency to form less thick
crystal lamella than the high molecular weight polymer chains. Due to the difference in the
lamella thickness, the hydrolytic degraded samples were melting at two different temperatures.
These observed double endothermic peaks are attributed to the different crystal lamella thickness
formation [8]. In addition, the Tm of PBAT shifted to low temperature after 30 days conditioning.

302
Either the change in amorphous-crystal surface energy or a decreased in the lamellar thickness
was responsible for the Tm decrease of a polyester after exposure to elevated temperature and
humidity [30]. For both PBS and PBS/PBAT, no change was observed in the melting
temperature (~115oC) after 30 days of exposure time.
Figure 9.12. DSC cooling curves for PBS, PBAT and PBS/PBAT before and after exposed to
50oC with 90% relative humidity for 30 days
In a semi-crystalline polymer, initially the amorphous regions are more susceptible for
hydrolysis [6]. From the DSC analysis, it was clearly observed that the ∆Hm and ∆Hc of the PBS,
PBAT and PBS/PBAT increased after 30 days of conditioning, indicating that degradation
mainly occurred in the amorphous regions. In addition, this phenomenon may be due to induced
crystallization from low molecular weight polymer chains that occurs during conditioning [13].
Therefore, low molecular weight polymer chains are often favored to the crystallinity
enhancement. Our findings have good agreement with previous studies [14]. According to these
studies, the chain scission leads to reduced entanglement density and tie molecules of the semi

303
crystalline polymers. The small molecular chains have potential to rearrange into the crystalline
region, which is called chemi-crystallization. This behavior has been observed in most of the
semicrystalline aliphatic biodegradable polymers including PBS [46]. The increased crystallinity
(χc) further accounts for the enhanced modulus as well as stiffness. The crystallization
temperature (Tc) of the PBS and PBS/PBAT significantly reduced after 30 days of conditioning.
This is attributed to the low molecular weight polymer chains leading to slow crystallization. A
similar crystallization behavior for PBS has been reported after exposure to raised humidity and
temperature [8]. Contrary, the crystallization temperature of PBAT was shifted to higher
temperature. This is probably due to the nucleation effect which is caused by oligomers [48].
Table 9.2. DSC results for PBS, PBAT and their blend before and after 30 days conditioned at
50oC with 90% relative humidity
Samples Tm (oC) ∆Hm (J/g) Tc (
oC) χc (%) Tg
* (
oC)
PBS before 115.2 68.26 91.98 61.88 -16.72
PBS after 114.8 84.41 77.15 76.52 -14.24
PBAT before 117.11 9.29 81.11 8.14 -20.27
PBAT after 114.30 16.51 96.50 14.48 -25.00
PBS/PBAT before 114.97 41.04 93.91 62.01 -19.04
PBS/PBAT after 114.39 43.44 71.32 65.63 -20.71
*Tg obtained from tan δ peaks
9.3.5 Dynamic mechanical analysis
Figure 9.13 shows the temperature dependence dynamic modulus of PBS, PBAT, and
their blend. It can be seen that the PBS had higher storage modulus than PBAT and PBS/PBAT.
Similar occurrence has been observed in the tensile and flexural modulus. However, the storage

304
modulus of all the samples gradually decreased with increasing temperature. This is attributed to
the enhanced polymer chain mobility with increasing temperatures [16]. As reported by Van der
wal et al., [49] above the glass transition temperature, storage modulus is dependent to the
degree of crystallinity. Below glass transition temperature, the modulus of crystalline as well as
amorphous phase is almost identical. Interestingly, after 30 days of conditioning, the storage
modulus of PBS, PBAT and their blend samples was found to increase slightly. This is because
the samples become stiffer, as evidenced by the increase in crystallinity after conditioning at
elevated temperature and humidity.
Figure 9.13. Storage modulus of PBS, PBAT and PBS/PBAT before and after exposure to 50oC
with 90% relative humidity for 30 days
Figure 9.14 shows the tan δ (loss factor) curves with respect to temperatures. In fact, the
peak temperature of the tan δ represents the glass transition temperature (Tg). The Tg values of
PBS, PBAT and PBS/PBAT blends are summarised in Table 9.2. The position of each tan δ peak
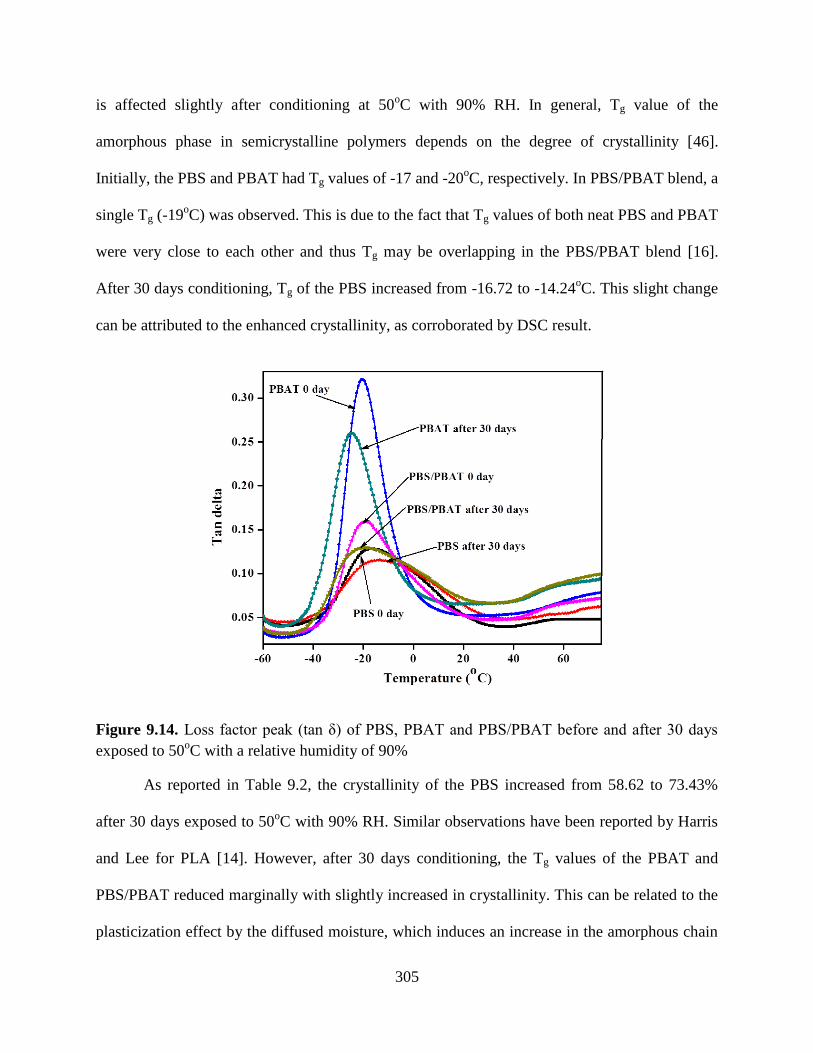
305
is affected slightly after conditioning at 50oC with 90% RH. In general, Tg value of the
amorphous phase in semicrystalline polymers depends on the degree of crystallinity [46].
Initially, the PBS and PBAT had Tg values of -17 and -20oC, respectively. In PBS/PBAT blend, a
single Tg (-19oC) was observed. This is due to the fact that Tg values of both neat PBS and PBAT
were very close to each other and thus Tg may be overlapping in the PBS/PBAT blend [16].
After 30 days conditioning, Tg of the PBS increased from -16.72 to -14.24oC. This slight change
can be attributed to the enhanced crystallinity, as corroborated by DSC result.
Figure 9.14. Loss factor peak (tan δ) of PBS, PBAT and PBS/PBAT before and after 30 days
exposed to 50oC with a relative humidity of 90%
As reported in Table 9.2, the crystallinity of the PBS increased from 58.62 to 73.43%
after 30 days exposed to 50oC with 90% RH. Similar observations have been reported by Harris
and Lee for PLA [14]. However, after 30 days conditioning, the Tg values of the PBAT and
PBS/PBAT reduced marginally with slightly increased in crystallinity. This can be related to the
plasticization effect by the diffused moisture, which induces an increase in the amorphous chain

306
mobility [30]. A similar type of negative Tg shift was observed in the PLA films [20] and
poly(ethylene terephthalate) (PET) composites [30] after exposure to elevated temperature and
humidity.
9.3.6 Rheological properties
Figure 9.15 represents the shear viscosity of the samples before and after 6 days of
conditioning at the elevated temperature and humidity. It was observed that all the samples
showed Newtonian and non-Newtonian flow behavior at lower and higher frequencies,
respectively. The 6 days conditioned samples exhibit a slight decrease in the shear viscosity
compared to the before conditioned samples. As expected, this behavior should be due to the
molecular weight reduction by random chain scission after being exposed to elevated
temperature and humidity. The molecular weight changes can be correlated with shear viscosity
of the sample at low shear rate. According to the literature [50], the weight average molecular
weight (M) is directly proportional to the viscosity of the polymer melt at a zero shear rate.
However, molecular weight distribution is independent to zero shear viscosity (ƞo). Generally,
the ƞo is obtained from extrapolation of the shear viscosity at lower shear rate (Newtonian
region), which considered as weight average molecular weight [51]. This relationship can be
explained as follows[50]:
ƞo = KM3.4
(9.4)
where K and M are the material constant and molecular weight respectively. In the present study,
relative molecular weight (M1/M2) of the samples before and after conditioning can be calculated
by using following equation:
log (
) = 3.4log (
) (9.5)

307
where ƞ1 and ƞ2 are the Zero shear viscosity of the samples before and after conditioning.
The molecular weight reduction is permanent damage caused by hydrolysis of the ester
functionalities on the polyesters backbone. Phua and coworkers [8] have studied the molecular
weight of hydrolytically degraded PBS samples. The authors found that the molecular weight
reduction was higher with an increasing conditioning period. Table 9.3 reports the zero shear
viscosity, viscosity ratio and relative molecular weight (calculated from equation 9.5) of the
samples before and after 6 days of conditioning. After 6 days conditioning, a significant
reduction in molecular weight and viscosity were observed for all the samples. As mentioned
before, PBS and PBAT are susceptible to the moisture. Therefore, it can be expected that the
moisture can easily hydrolyze the PBS and PBAT at 90% RH and it leads to a decrease in the
molecular weight as well as viscosity [13]. The molecular weight of the PBS/PBAT blend was
1.70 times lower after being subjected to hydrolytic degradation. This is relatively high
compared to PBS and PBAT. This may be due to the hydrolysis product of PBS or PBAT
accelerating the molecular weight reduction of the PBS/PBAT blend. After 6 days of exposure to
heat (50oC) and humidity (90%), the molecular weight reduction occurred in the following order
PBS/PBAT>PBAT>PBS, as shown in Table 9.3. This result agrees with the observed
mechanical properties of the conditioned samples as studied.

308
Figure 9.15. Shear viscosity curves for PBS, PBAT and PBS/PBAT before and after 6 days
exposed to 50oC with a relative humidity of 90%
Table 9. 3. Relative molecular weight (M1/M2) of the PBS, PBAT and PBS/PBAT blend before
and after 6 days conditioned at 50oC with 90% relative humidity
Samples Zero shear viscosity (Pa.s) Viscosity ratio
(ƞ1/ƞ2)
Relative molecular weight
(M1/M2) Before (ƞ1) After (ƞ2)
PBS 621.51 198.54 3.13 1.40
PBAT 2004.7 411.9 4.86 1.59
PBS/PBAT 1897.1 318.74 5.95 1.70
9.3.7 Polarizing optical microscopy
Figure 9.16 shows the spherulite morphology of PBS, PBAT and PBS/PBAT before and
after 30 days of exposure to raised humidity and temperature. The spherulite morphology of the
samples was analyzed at close to crystallization temperature (90oC). Before being exposed to
hydrolysis conditions, it was difficult to notice clear spherulite morphology at 90oC for all the
samples. However, after 30 days the conditioned samples exhibited an obvious spherulite

309
structure. It is generally agreed that the amorphous region is more susceptible for hydrolysis than
crystalline regions in semicrystalline polymers. Therefore, these findings have good agreement
with the improved percentage of crystallinity, which was observed by DSC. This type of
phenomenon is commonly found in the polymers when exposed to a degradation environment
[52, 53]. Interestingly, the amount of spherulite formation was higher in the samples with a
lower percentage of crystallinity. For instance, the PBS and PBS/PBAT blend showed less
number of spherulites than PBAT after 30 days exposed to hydrolysis. This is attributed to the
nucleation density difference in the samples. A similar trend has been observed in the degraded
polypropylene sample [53]. In addition, the PBS had a less amount of nucleation sites than
PBAT because of the severe molecular weight reduction by hydrolytic degradation. This
phenomenon was consistent with observed crystallization temperature by the DSC analysis.
Furthermore, the spherulite morphology of the 30 days exposed PBS and PBS/PBAT exhibits
clear ring-banded spherulites, which can be attributed to their reduced molecular weight. This
finding has good agreement with a previous study [52]. According to Kfoury et al., [54] the
percentage of crystallinity, size of crystallites and spherulite morphology have great influence on
the impact strength. The stress concentration ability of crystallites has been increased with an
enhanced percentage of crystallinity. Consequently, this could lead to a reduction in the impact
strength. In the present study, observed impact strength had good agreement with the spherulite
morphology and crystallinity.

310
Figure 9.16. Polarized optical micrographs of PBS, PBAT and PBS/PBAT before and after 30
days conditioned at 50oC and 90% relative humidity

311
9.3.8 Morphological analysis
To investigate the hydrolysis caused by moisture and temperature, SEM analysis was
carried out before and after 30 days conditioned samples. SEM micrographs of the PBS, PBAT
and their blend are depicted in Figure 9.17. Before exposure to hydrolysis environment, a smooth
surface morphology was observed for all the samples. On the other hand, after 30 days of
hydrolysis test, the PBS, PBAT and PBS/PBAT blend showed deep holes, cavities as well as
eroded regions. This observation indicates that the biodegradable polyesters (PBS, PBAT and
PBS/PBAT blend) can readily undergo severe degradation after being exposed to elevated
humidity and temperature. A similar type of physical damage in the hydrolytically degraded PBS
and PLA samples has been observed by Kanemura et al., [33] and Deroiné et al., [55] These
studies suggest that the formed irregular surface morphology is ascribed to the dissolution of
the oligomers during hydrolysis process [55]. It can be seen that the SEM image (Figure 9.17)
of the PBS showed significant erosion pits and large eroded regions compared to PBAT and
PBS/PBAT. This is corresponding to the higher rate of hydrolytic degradation of PBS after
conditioning for 30 days under the simulated environment [8]. In addition, an irregular fractured
surface was observed in the 30 days conditioned PBS sample. This is possibly due to the
increased crystallinity after being exposed to the hydrolysis environment.

312
Figure 9.17. SEM micrographs of PBS, PBAT and PBS/PBAT before and after 30 days
conditioned at 50oC and 90% relative humidity

313
9.4. Conclusions
The hydrolytic degradation of PP, PBS, PBAT and PBS/PBAT samples was examined
after exposure to elevated temperature and humidity. Because of chain scission through the
hydrolysis mechanism, the elongation at break and tensile strength of the PBS, PBAT and
PBS/PBAT were significantly affected after conditioning. However, the flexural and tensile
modulus of the PP, PBS and PBS/PBAT were slightly improved after exposure to heat and
humidity. This could be due to the improved crystallinity by molecular weight reduction
during the exposure time. The increased crystallinity was consistent with observed spherulite
morphology. The zero shear viscosity of the 6 days exposed samples was lower compared to
corresponding unexposed samples. This suggests that the molecular weight of the exposed
sample is reduced because of hydrolytic degradation. Interestingly, it was found that the
impact strength of the PBAT was not affected significantly over the entire exposure time,
whereas for PP, PBS and PBS/PBAT impact strength decreased up to 6 days of conditioning.
Over the hydrolysis time, the samples had rough surfaces and corrosive holes in the SEM
micrographs. This result agrees with the considerable reduction in the mechanical properties of
the samples after being exposed to elevated temperature and humidity. Our findings allow us to
conclude that the hydrolytic degradation of biodegradable polyesters needs to be reduced under
high humidity and temperature for diversifying their applications.

314
References
1. Fujimaki, T., Polym Degrad Stab, 1998, 59, 209-214.
2. Gerngross, T.; Slater, S.; Gross, R. A., Science, 2003, 299, 822-825.
3. Babu, R.P.; O’Connor, K.; Seeram, R., Prog Biomater, 2013, 2, 1-16.
4. Phua, Y.J.; Lau, N. S.; Sudesh, K.; Chow, W. S.; Mohd Ishak, Z. A., Polym Degrad Stab,
2012, 97, 1345-1354.
5. Anstey, A.; Muniyasamy, S.; Reddy, M.M; Misra, M.; Mohanty, A.K, J Polym Environ,
2014, 22, 209-218.
6. Kim, H.-S.; Kim, H.-J.; Lee, J.-W.; Choi, I.-G., Polym Degrad Stab, 2006, 91, 1117-
1127.
7. Tan, L.; Hu, J.; Ye, S.; Wei, J.; Chen, Y., Thermochim Acta, 2014, 575, 279-284.
8. Phua, Y. J.; Chow, W. S.; Mohd Ishak, Z. A., Polym Degrad Stab, 2011, 96, 1194-1203.
9. Gan, Z.; Kuwabara, K.; Yamamoto, M.; Abe, H.; Doi, Y., Polym Degrad Stab, 2004, 83,
289-300.
10. Milinkovic, A.; Miroslav, P.; Gregorova, A., Thermochimi Acta 590, 40-50 2014.
11. Vroman, I.; Tighzert, L., Materials, 2009, 2, 307-344.
12. Deroiné, M.; Le Duigou, A.; Corre, Y.-M.; Le Gac, P.-Y.; Davies, P.; César, G.;
Bruzaud, S., Polym Test, 2014, 39, 70-78.
13. Harris, A. M.; Lee, E. C., J Appl Polym Sci, 2013, 128, 2136-2144.
14. Harris, A. M.; Lee, E. C., J Appl Polym Sci, 2010, 115, 1380-1389.
15. Deng, M.; Zhou, J.; Chen, G.; Burkley, D.; Xu, Y.; Jamiolkowski, D.; Barbolt, T.,
Biomaterials, 2005, 26, 4327-4336.
16. Muthuraj, R.; Misra, M.; Mohanty, A., J Polym Environ, 2014, 22, 336-349.
17. Kim, H.-S.; Kim, H.-J., Polym Degrad Stab, 2008, 93, 1544-1553.

315
18. Berthé, V.; Ferry, L.; Bénézet, J. C.; Bergeret, A., Polym Degrad Stab, 2010, 95, 262-
269.
19. Muthuraj, R.; Misra, M.; Mohanty, A., Society of Plastic Engineering (SPE), 2015,
Orlando, Florida, USA.
20. Copinet, A.; Bertrand, C.; Govindin, S.; Coma, V.; Couturier, Y., Chemosphere, 2004,
55, 763-773.
21. Saha, S. K.; Tsuji, H., Polym Degrad Stab, 2006, 91, 1665-1673.
22. Proikakis, C. S.; Mamouzelos, N. J.; Tarantili, P. A.; Andreopoulos, A. G., Polym Degrad
Stab, 2006, 91, 614-619.
23. Li, X.; Liu, K. L.; Wang, M.; Wong, S. Y.; Tjiu, W. C.; He, C. B.; Goh, S. H.; Li, J., Acta
Biomater, 2009, 5, 2002-2012.
24. Marek, A.; Kaprálková, L.; Schmidt, P.; Pfleger, J.; Humlíček, J.; Pospíšil, J.; Pilař, J.,
Polym Degrad Stab, 2006, 91, 444-458.
25. Azuma, Y.; Takeda, H.; Watanabe, S.; Nakatani, H., Polym Degrad Stab, 209, 94, 2267-
2274.
26. Chivrac, F.; Kadlecová, Z.; Pollet, E.; Avérous, L., J Polym Environ, 2006, 14, 393-401.
27. Baschek, G.; Hartwig, G.; Zahradnik, F., Polymer, 1999, 40, 3433-3441.
28. Baghaei, B.; Skrifvars, M.; Rissanen, M.; Ramamoorthy, S. K., J Appl Polym Sci, 2014,
131, 40534.
29. Ravati, S.; Favis, B. D., Polymer, 2013, 54, 3271-3281.
30. Foulc, M. P.; Bergeret, A.; Ferry, L.; Ienny, P.; Crespy, A., Polym Degrad Stab, 2005, 89,
461-470.

316
31. Lyu. S.; Schley, J.; Loy, B.; Lind, D.; Hobot, C.; Sparer, R.; Untereker, D.,
Biomacromolecules, 2007, 8, 2301-2310.
32. Dong, W.; Zou, B.; Yan, Y.; Ma, P.; Chen, M., Int. J. Mol. Sci, 2013, 14, 20189-20203.
33. Kanemura, C.; Nakashima, S.; Hotta, A., Polym Degrad Stab, 2012, 97, 972-980.
34. Fanconi, B., Annu Rev Phys Chem, 1980, 31, 265-291.
35. Al-Itry, R.; Lamnawar, K.; Maazouz, A., Polym Degrad Stab, 2012, 97, 1898-1914.
36. Tordjeman, P.; Robert, C.; Marin, G.; Gerard, P., Eur. Phys. J. E 4, 2001, 459-465.
37. Deroiné, M.; Le Duigou, A.; Corre, Y.-M.; Le Gac, P.-Y.; Davies, P.; César, G.;
Bruzaud, S., Polym Degrad Stab, 2014, 105, 237-247.
38. Fiebig, J.; Gahleitner, M.; Paulik, C.; Wolfschwenger, J., Polym Test, 1999, 18, 257-266.
39. Tsuji, H.; Echizen, Y.; Nishimura, Y., Polym Degrad Stab, 2006, 91, 1128-1137.
40. Harris, A. M.; Lee, E. C., J Appl Polym Sci, 2008, 107, 2246-2255.
41. Song, D.; Gao, J.; Li, X.; Lu, L., Polym Test, 2014, 33, 131-137.
42. Mendes, L. C.; Rufino, E. S.; de Paula, F. O. C.; Torres Jr, A. C., Polym Degrad Stab,
2003, 79, 371-383.
43. Tidjani, A., J Appl Polym Sci, 1997, 64, 2497-2503.
44. Lyons, J. S., Polym Test, 1998, 17, 237-245.
45. Ferrer-Balas, D.; Maspoch, M. L.; Martinez, A. B.; Santana, O. O., Polymer, 2001, 42,
1697-1705.
46. Pegoretti, A.; Penati, A., Polymer, 2004, 45, 7995-8004.
47. Qiu, Z.; Komura, M.; Ikehara, T.; Nishi, T., Polymer, 2003, 44, 7781-7785.
48. Xu, H.; Teng, C.; Yu, M., Polymer, 2006, 47, 3922-3928.
49. van der Wal, A.; Mulder, J. J.; Gaymans, R. J., Polymer, 1998, 39, 5477-5481.

317
50. Pang, M.-M.; Pun, M.-Y.; Ishak, Z. A. M., J Appl Polym Sci, 2013, 129, 3237-3246.
51. Jordens, K.; Wilkes, G. L.; Janzen, J.; Rohlfing, D. C.; Welch, M. B., Polymer, 2000, 41,
7175-7192.
52. Sabino, M. A.; Feijoo, J. L.; Müller, A. J., Polym Degrad Stab, 2001, 73, 541-547.
53. Rabello, M. S.; White, J. R., Polymer 38, 6389-6399 1997.
54. Kfoury, G.; Raquez, J.-M.; Hassouna, F.; Odent, J.; Toniazzo, V.; Ruch, D.; Dubois, P.,
Frontiers in Chemistry2013, 1.
55. Deroiné, M.; Le Duigou, A.; Corre, Y.-M.; Le Gac, P.-Y.; Davies, P.; César, G.;
Bruzaud, S., Polym Degrad Stab, 2014, 108, 319-329

318
Chapter 10: Conclusions, Contributions, and Recommendations for Future Work
Abstract
This chapter reflects on the conclusions of the research study carried out in previous
chapters, and contribution to the knowledge made during this investigation. Furthermore, this
chapter presents recommendations/suggestions for future directions.
10.1 Overview
The objective of this project was to create a sustainable biocomposite with stiffness-
toughness balanced composites from biodegradable polymer matrix and miscanthus short fibers
by melt processing. Chapters 3 and 4 described the experiments performed on the preparation
and characterization of biodegradable polymer blends and compatibilizer for composite
applications. The effects of the compatibilizer synthesized in Chapter 4 were investigated in
Chapters 5, 6 and 7. Chapters 5 and 6 presented the performances of the single polymer matrix
based biocomposites with and without compatibilizer. In chapter 7, the composites were
produced with a binary blend matrix that showed optimum stiffness-toughness balanced
properties described in Chapter 3. In Chapter 8, a statistical approach was adopted to identify the
processing parameters that had the most significant effect on the performance of the
uncompatibilized composite prepared in Chapter 7. Finally, the durability of the selected
biodegradable polymer blends and their parent polymers were investigated in Chapter 9.
Individual conclusions were presented for the research described in each chapter. The following
section summarizes the interrelationship between results and objectives for this thesis.
10.2 Conclusions
Blending of polymers is an effective and economical way to obtain new materials with
desired properties. In order to design a biodegradable polymer blend with balanced mechanical

319
properties for biocomposite matrix application, commercially available poly(butylene succinate)
(PBS) and poly(butylene adipate-co-terephthalate) (PBAT) were melt blended through extrusion
and injection molding. Due to compatibility between the PBS and PBAT, the tensile toughness
and tensile strength of the PBS were remarkably enhanced after the inclusion of PBAT. The
observed compatibility results from the formation of copolyester due to the transesterification
reaction between the parent polymers, which was observed using an infrared spectroscopy.
Furthermore, the enhanced compatibility between the blended components was corroborated
with DSC and DMA analysis. The PBS/PBAT blend mechanical properties appeared to be
comparable with polyethylene mechanical properties. The rheological properties indicate that the
PBS/PBAT blend has good processability, which can allow higher fiber loading for the
composite fabrication. The surface morphological analysis of the PBS/PBAT blends provided
evidence that the PBS and PBAT are not miscible at a molecular level. The prepared
biodegradable PBS/PBAT (60/40 wt%) blend can be considered as a potential candidate for
biocomposite applications.
As reported in the literature, the compatibility between the hydrophilic natural fibers and
hydrophobic polymer matrix is very poor. Therefore, this research aimed to synthesize
compatibilizer as the next step of this thesis work. Solvent free and economically viable maleic
anhydride grafted PBS, PBAT and PBS/PBAT blend were prepared in the presence of dicumyl
peroxide (DCP) as a free radical initiator. The FTIR analysis was used to confirm the structural
changes in MAH grafting samples. The MAH grafting yield was calculated by titration method.
Among the MAH grafted PBS, PBAT and PBS/PBAT blend samples, a higher MAH grafting
yield was observed on the PBS backbone. In addition, the MAH grafting efficiency was
compared in the batch and continuous process. The batch processed sample had a slightly higher

320
yield than the continuous processed sample. During a MAH grafting reaction, both grafting and
cross-linking phenomena can occur in the presence of initiator. Thermogravimetic analysis
revealed that thermal stability of all the MAH grafted samples were found to be slightly reduced
compared to their counterparts.
Miscanthus fibers could be used as a reinforcement to produce PBS based biocomposites
while reducing cost and retaining PBS mechanical properties. Therefore, biocomposites were
produced from PBS and miscanthus fibers with and without compatibilizer by melt processing. A
strong reinforcing effect of micanthus fibers led to an increase in the tensile and flexural
modulus of the resulting PBS biocomposites. It was found that the tensile strength of
uncompatibilized PBS/miscanthus composites was reduced compared to neat PBS. At the same
time, the melt flow of the PBS composites was much lower compared to neat PBS. Indeed, the
observed MFI value of the PBS biocomposites is appropriate for some injection molding
processes. The compatibilizing efficiency of the MAH grafted PBS was investigated in the PBS
biocomposites by means of mechanical performances. It was observed that the compatibilized
PBS biocomposites showed superior impact strength, tensile strength, and flexural compared to
their uncompatibilized one and neat PBS. However, the shortcoming of the PBS/miscnathus
biocomposites was insufficient impact strength/toughness, which could limit its range of
applications. The impact strength of the polymeric materials is one of the most important
properties, which relates to the service life of the products. As a result, a higher impact strength
biocomposite was produced from PBAT and miscanthus fibers while lacking stiffness, flexural
strength and tensile strength of the resulting PBAT/miscanthus fiber composites.
Balanced stiffness, toughness and thermal properties of the biocomposites were produced
from PBS/PBAT blend matrix and miscanthus fibers. The tensile and impact strength of the

321
PBS/PBAT blend were decreased with the addition of miscanthus fibers. In order to overcome
this issue in the resulting formulations, a reactive compatibilizer (MAH-g-PBS/PBAT) was
introduced into the composite system. It was found that the mechanical properties of the
compatibilized composites were noticeably increased as compared to the uncompatibilized one.
The density of all the composites was found to be lower than synthetic fibers like glass fibers.
The comptibilized PBS/PBAT/miscanthus fiber composites showed balanced performance
compared to their individual compatibilized PBS/miscanthus composites and PBAT/miscanthus
composites. From this study, it can be concluded that the prepared biodegradable polymer blend
matrix based composites are a possible candidate to replace non-biodegradable composites in
applications where biodegradability is essential after use but extreme thermal and humidity
exposure are avoided.
The influence of independent processing parameters upon the impact strength of
PBS/PBAT/miscanthus composites was investigated by full factorial design of experiment. The
statistically significant variables were analyzed at a 95% confidence level. It was found that the
fiber length plays an important role to predict the impact strength of PBS/PBAT/miscanthus
composites. The durability of PBS, PBAT and blend of PBS/PBAT was examined after being
exposed to 50oC and 90% humidity with comparison to polypropylene. Due to hydrolytic
degradation of polyesters, the performances of the PBS, PBAT and their blend are not stable
like PP under selected environmental conditions. The hydrolytic degradation of the polyesters
was confirmed by FTIR, DSC, rheological, and morphological analysis.
10.3 Significant contributions
Most of the commercially available biodegradable polymers are not satisfying their
application requirements because of their cost and insufficient mechanical performances. In this

322
research work, the developed biodegradable PBS/PBAT blends have good mechanical, thermal
and rheological properties, which are not commercially available in the market. This
biodegradable polymer blend can be used for different industrial applications including
composite fabrication, blow molding, films and packaging. The cost of the biodegradable
polymers and their blends can also be reduced by composite fabrication with miscanthus fibers.
Utilizing these biodegradable polymers as a matrix and miscanthus fibers as a reinforcement for
biocomposite fabrication can reduce green house gas emissions while meeting consumer’s short
term application requirement.
In the present study, the observed mechanical performances of the blends and composites
were superior compared to the composites made with PP and miscanthus fiber composites. The
developed biodegradable green composites are possible substitutes for a class of 100%
petroleum-based non-biodegradable plastics and composites, which are currently used in
different applications. The prepared fully biodegradable material is a promising candidate for
environmental policies and public awareness, which can increase environmentally friendly
material usage. Providing value addition for these environmentally friendly materials could
increase the revenues for miscanthus growers. Dissemination of the new knowledge discoveries
of the present study could result in the implementation of a wide range of bio-based materials.
The final optimized biocomposite formulations were extruded and injection molded to produce
prototypes in an industrial trial to further the commercialization prospects of the new technology,
as shown in Figure 10.1. The produced biocomposites could be optimized to meet the
requirements for use in automotive applications, construction panels, and consumer products.

323
Figure 10.1. Prototypes were made from biodegradable polymers/miscanthus fiber by extrusion
and injection molding method.
10.4 Recommendations for future works
Various electron-rich co-monomers (e.g., styrene) could be used to investigate the
MAH grafting yield while reducing side reactions of the electron deficient monomers.
The developed biocomposites should be compatibilized by modification of
miscanthus fibers with sizing agents and using commercially available
compatibilizers to compare to MAH grafted compatibilizer.
The influence of fiber length on the performance of the resulting biocomposites
should be further explored by varying fiber length.
Further work could be performed by maximizing the number of processing
variables as well as levels to predict the most significant processing parameters on
the resulting biocmposites.
During processing, the odor of the composite fabrication process should be
eliminated to make industrial processing smooth and effective.

324
If these developed materials are required for long term applications, the durability
of the biodegradable polymers and their composites needs to be improved by anti-
hydrolysis agents.
Future studies can be conducted on these developed materials to evaluate and
certify them as a compostable blend and biocomposite.
In order to compare the cost of the prepared composites with commodity plastics,
economic analysis of the prepared composites should be studied.
Life cycle analysis is necessary to prove that the developed biocomposites are an
environmentally superior alternative to synthetic fiber reinforced composites.

325
Appendix I: Binary Blends of Poly(Butylene Succinate) and Poly(Butylene Adipate-co-
Terephthalate): A New Matrix for Biocomposites Applications*
*A version of this appendix has been published in: R. Muthuraj, M. Misra, and A. K. Mohanty,
Binary blends of poly (butylene adipate-co-terephthalate) and poly (butylene succinate): A new
matrix for biocomposites applications. PROCEEDINGS OF PPS-30: The 30th
International
Conference of the Polymer Processing Society–Conference Papers. Vol. 1664. AIP Publishing,
2015. (adapted with kind permission from AIP Publishing LLC, Jul 09, 2015, License number
3664990443173).
Abstract
In this study, biodegradable poly(butylene adipate-co-terephthalate) (PBAT) and
poly(butylene succinate) (PBS) binary blends were melt compounded. The mechanical, thermal
and morphological properties of the PBAT/PBS blends were investigated. The melt compounded
binary PBAT/PBS blends showed balanced mechanical properties (especially in tensile strength
and elongation) compared to neat components. The obtained melt flow index (MFI) value of the
blends is much higher than PBAT. This may be attributed to PBS phase residual catalyst because
it pronouncing thermal degradation of the polymers at higher temperature. The toughness of the
PBAT is not significantly affected with addition of 40 wt% PBS in the PBAT/PBS blend. This
could be the reason of good compatibility achieved between the PBAT and PBS phase in the
blends. The phase morphology and spherulite morphology were also correlated with
compatibility between the PBAT and PBS in the blends.
A-I.1.Introduction
In recent years, a new trend has arisen where polymer blends are being selected over
individual biopolymers as matrices for composite applications. This is because the process of
polymer blending is one of the most promising techniques to create materials with specific
desired properties by combining the different advantageous qualities of two or more neat
polymers. The resulting mechanical properties are typically a compromise between the parent

326
polymers. In cases of very successful compatibility, performance can be an overall improvement;
however, blending typically results in a general decrease in mechanical performance. The most
frequently used solution to overcome this problem is to compatibilize the blends. Block
copolymers or grafted polymers are widely used as compatibilizers leading to finer phase
morphologies and better interfacial properties [1]. However, the development of stiffness and
toughness balanced polymer blends for biocomposite matrix applications is in high demand. PBS
and PBAT are promising biodegradable polymers, with many inherent advantages. They present
good biodegradability, excellent toughness, good thermal stability, and commercial availability
in market. In addition, PBS and PBAT have been extensively studied in blends with other brittle
biodegradable polymers. PBS is obtained from the petroleum-based succinic acid and 1,4-
butanediol monomers. Interestingly, new methods have recently been developed such that these
two monomers can also be synthesized from renewable resources [2]. Therefore, PBS has the
newfound potential to be a biopolymer that is both biodegradable and bio-based. This new
development may further diversify the PBS utilization in different fields of applications.
Blending PBAT and PBS is of great interest because it returns desirable, unique properties while
retaining the biodegradable nature of the base materials [3]. Although many studies have
reported on balancing the stiffness-toughness in biodegradable binary blends. We report here the
binary blends of PBAT and PBS which represents good examples of super tough blends from the
biodegradable aliphatic-aromatic (PBAT) and aliphatic (PBS) polyesters. The resulting binary
blends exhibit balanced mechanical and thermal properties.
A-I.2. Materials and Methods
Injection grade PBS, trade name Bionolle 1020, was procured from Showa Highpolymer
Co. Ltd, Japan, with a molecular weight (Mw) of 1.4 ×10⁵ g/mol and PDI of 1.82. The PBAT

327
(Biocosafe 2003F) was purchased from Xinfu Pharmaceutical Co., Ltd, China. The chemical
structures of the neat PBS and PBAT are shown in Scheme A-I.1.
Scheme A-I.1. Chemical structures of PBS and PBAT
Prior to melt processing, the polymers were dried in conventional oven for 6 h at 80oC to
remove moisture and prevent degradation. Both PBAT and PBS were mixed and processed using
a lab-scale twin-screw extruder, and injected into moulds (DSM Xplore® 15 cc
microcompounder). For all samples prepared, the operating temperature was 140 oC, the screw
speed was 100 rpm, and the processing or dwell time of the materials inside the barrel was 2 min.
Tensile properties of the PBAT/PBS blends were measured according to ASTM D638 in a
Universal Testing Machine (Instron-3382) at a strain rate of 50 mm/min at room temperature;
results are reported as average values of five replicates for each experiment. Heat deflection
temperature (HDT) analyses were performed using a Dynamic Mechanical Analysis Q800 from
TA Instruments, according to ASTM D648. Melt flow index (MFI) was measured according to
ASTM D1238 at 190oC temperature using a 2.16 kg load. Cryofractured sample morphology was
examined using a Inspect S 50-FEI Netherlands scanning electron microscope (SEM) at an
accelerating voltage of 20 kV. Before observing sample morphology, the samples were gold

328
coated with a final thickness of 20 nm with 20 mA. The spherulite morphology of the
PBAT/PBS blend was observed using a Nikon polarizing optical microscope (POM) with hot
stage; these micrographs were taken to observe crystallization. Samples were sandwiched
between two microscope glass slides and heated to 150oC for 5 min before quickly transferring
the slide to the 150oC microscope hotplate. Subsequently, samples were annealed at the
crystallization temperature with a heating rate of 10 oC/min. The spherulite growth was recorded
at crystallization temperatures of 85oC using a Nikon camera.
A-I.3. Results and Discussion
The tensile properties of the PBAT, PBS and PBAT/PBS blends are shown in the Figure
A-I.1. The tensile strength of the PBAT/PBS blends was higher than that of the neat PBAT.
Specifically, the tensile strength of the PBAT/PBS (60/40 wt%) blend increased by 84%
compared to neat PBAT. At the same time, the percentage elongation of the PBAT/PBS (60/40
wt%) is similar to the PBAT. The tensile strength improvement is directly related to the
intermolecular forces, compatibility, and molecular orientation of the polymers in the blend [4].
In our previous study (Chapter 3) [3], it was concluding that the PBS/PBAT transesterification
product acts as a compatibilizer in the PBS/PBAT blends and leads to the improvement of their
tensile properties. In that specific work, the transesterification reaction was confirmed via
normalized FTIR spectra. Particularly in that research, the carbonyl peak of the neat PBS, PBAT
and PBS/PBAT blend was focused to observe its variation between the materials. The neat PBS
and PBAT carbonyl group frequency was observed at 1712 cm-1
. The carbonyl peak of the
PBS/PBAT blend shows a slight shift towards higher wavenumbers (1716 cm-1
). This shift could
be the reason a transesterification product formed during melt processing in the presence of
existing residual catalyst in the neat PBS and PBAT. In general, the resulting transesterification

329
product is more compatible with the homopolymers of the unreacted PBS and PBAT in the
PBS/PBAT blends. A similar observation is reported in the literature for PBS/PCL blends [4].
The mechanical properties of PBAT/PBS blends are comparable with commercially available
polyethylene (PE) reported previously on literature [5]. As such, we believe this indicates that
PBAT/PBS blends could be a potential substitute for non-biodegradable polymers in packaging
applications.
Figure A-I.1. Tensile properties of (A) PBAT, (B) PBS, (C) PBAT/PBS (60/40 wt%) and (D)
PBAT/PBS (70/30 wt%) blend
MFI values of the PBAT, PBS and PBAT/PBS blends are presented in Figure A-I.2. The
MFI of the PBAT/PBS blends (both 30 and 40 wt% PBS) were higher than neat PBAT, with
tests resulting in blend values similar to neat PBS. This suggested that the viscosity of the blends
is highly influenced by the incorporation of PBS into PBAT matrix. Alternatively, the low
observed viscosities of the polymer blends may be due to thermal degradation resulting from
exposure to high test temperatures i.e., 190 oC. Figure A-I.2 also presents the HDT of the PBAT,
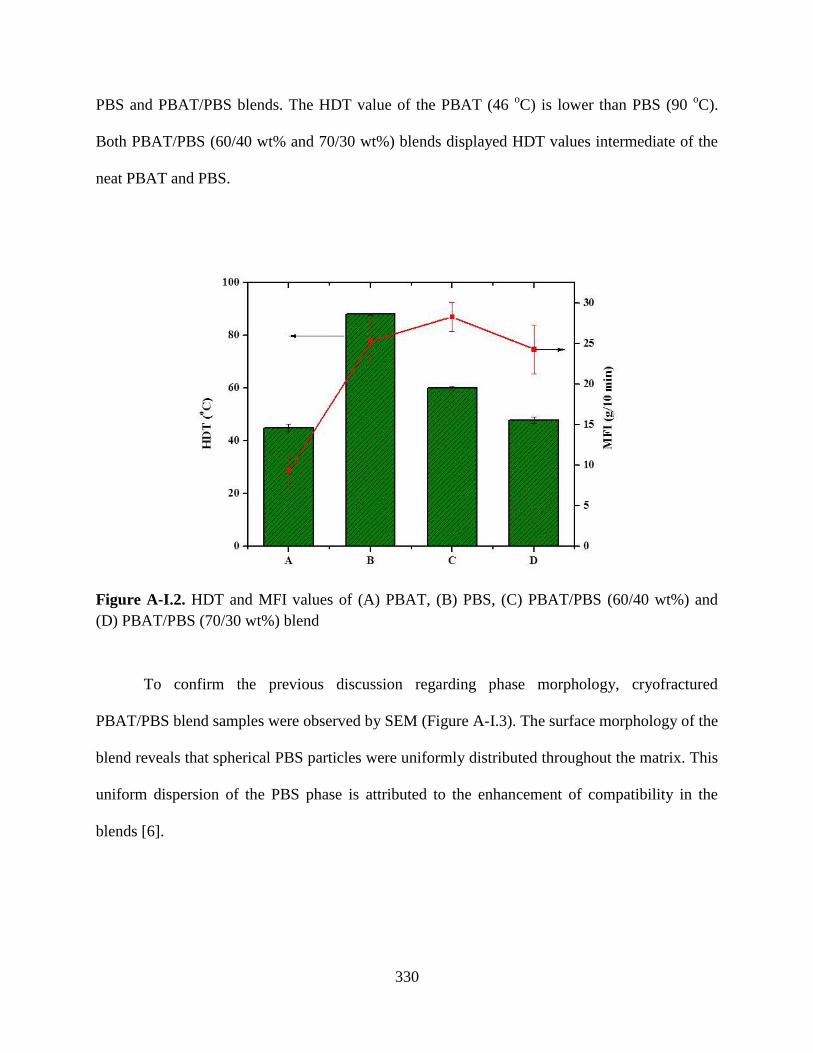
330
PBS and PBAT/PBS blends. The HDT value of the PBAT (46 oC) is lower than PBS (90
oC).
Both PBAT/PBS (60/40 wt% and 70/30 wt%) blends displayed HDT values intermediate of the
neat PBAT and PBS.
Figure A-I.2. HDT and MFI values of (A) PBAT, (B) PBS, (C) PBAT/PBS (60/40 wt%) and
(D) PBAT/PBS (70/30 wt%) blend
To confirm the previous discussion regarding phase morphology, cryofractured
PBAT/PBS blend samples were observed by SEM (Figure A-I.3). The surface morphology of the
blend reveals that spherical PBS particles were uniformly distributed throughout the matrix. This
uniform dispersion of the PBS phase is attributed to the enhancement of compatibility in the
blends [6].

331
Figure A-I.3. SEM image of the cryofractured PBAT/PBS (60/40 wt%) blend
The spherulite morphology of PBS and the PBAT/PBS (60/40 wt%) blend are shown in
Figure A-I.4. Generally, PBAT has poor capability to form perfect spherulite morphology when
compared to PBS. Therefore, the PBAT spherulite morphology is not shown in this work. The
crystallization temperatures of PBAT, PBS, and the PBAT/PBS blend are 53, 83 and 85 oC,
respectively. The PBS and PBAT/PBS blend spherulite morphologies were observed at 85oC for
30 min. The selected temperature was based on the crystallization temperature of PBS and
PBAT/PBS blends. High levels of spherulite growth were observed in both PBS and the
PBAT/PBS blend. However, the higher number of nucleations in the PBAT/PBS blend interferes
with crystal growth and lead to distorted lamellae. The fine dispersion of PBS phase in the PBAT
matrix reduces the lamellae thickness of the blend compared to neat PBS lamellae.

332
Figure A-I.4. POM image of the (i) PBS and (ii) PBAT/PBS (60/40 wt%) blend
A-I.4. Conclusions
The PBAT/PBS blends were produced on a lab-scale injection-molding machine. After
blending PBAT and PBS, the blends showed balanced stiffness-toughness properties compared
to neat samples. These balanced properties were attributed to the excellent compatibility between
the PBS and PBAT in the blends. The compatibility was caused by a transesterification product
formed during melt blending which acts as a compatibilizer in the blend. SEM image of the
PBAT/PBS blend confirms that there is a good compatibility achieved in the blends evidenced
by a uniform dispersion of the PBS phase in the PBAT matrix. Optical polarizing microscopy
results imply that the PBAT/PBS blend spherulite morphology was affected by the addition of
PBS into the PBAT matrix; this may be due to the poor crystalline nature of PBAT. The MFI
value of the PBAT/PBS blend is quite high compared to PBAT. This improved viscosity will
help to facilitate the production of high fiber-content composites. The PBAT/PBS blend-based
composites fabrication and performance evaluation are under investigation.

333
References
1. B. Imre, B. Pukánszky, Compatibilization in bio-based and biodegradable polymer
blends. Eur.Polym.J, 49, 1215-1233 (2013).
2. http://www.myriant.com/applications/pbs.cfm (accessed on Febraury 06, 2014).
3. R. Muthuraj, M. Misra, A.K. Mohanty, Biodegradable poly (butylene succinate) and poly
(butylene adipate-co-terephthalate) blends: Reactive extrusion and performance
evaluation. J.Polym.Environ, 22, 336–349 (2014).
4. J. John, R. Mani, M. Bhattacharya, Evaluation of compatibility and properties of
biodegradable polyester blends. J.Poly.Sci.Part A: Poly.Chem, 40, 2003-2014 (2002).
5. K. Joseph, S. Thomas, and C. Pavithran, Effect of chemical treatment on the tensile
properties of short sisal fibre-reinforced polyethylene composites. Polymer, 37, 5139-
5149 (1996).
6. J.M. Willis, B.D. Favis, Processing-morphology relationships of compatibilized
polyolefin/polyamide blends. Part I: The effect of an lonomer compatibilizer on blend
morphology. Polym.Eng.Sci, 28, 1416-1426 (1988).

334
Appendix II: Durability Studies of Biodegradable Polymers under Accelerated Weathering
Conditions*
*A version of this appendix has been published in: R. Muthuraj, M. Misra, and A. K. Mohanty,
Durability Studies of Biodegradable Polymers under Accelerated Weathering Conditions,
Society of Plastic Engineering (SPE, ANTEC), 2015, Orlando, Florida.
Abstract
Poly(butylene adipate-co-terephthalate), (PBAT) and poly(butylene succinate), (PBS) are
promising biodegradable polyesters whose blends have gained great attention in wide range of
applications. However, there are some drawbacks to the use of these biodegradable polymer
blends in durable applications. The main disadvantage of these materials is hydrolytic
degradation at elevated temperature and humidity. In this study, we have assessed the durability
of PBAT, PBS and PBS/PBAT blends at 50oC with 90% relative humidity (RH) for duration of
up to 18 days. The mechanical properties of these polyesters were evaluated before and after 18
days of conditioning at 50oC with 90% RH. The mechanical properties of the polyesters were
affected with increasing conditioning time. This can be attributed to the susceptibility of ester
bonds to hydrolytic degradation at elevated temperature and humidity. The hydrolytic
degradation was further confirmed by scanning electron microscopy.
A-II.1. Introduction
PBAT, a biodegradable aliphatic-aromatic copolyester, is derived from adipic acid,
terephthalic acid, and butane diol by polycondensation reaction [1]. Solely aromatic polyesters
are insensitive to the microbial attack [2]. However, this insensitivity can be modified through
copolymerization of aliphatic monomers with aromatic monomers, which resulted a
biodegradable polymer i.e., PBAT. The mechanical properties of PBAT are comparable with low
density polyethylene (LDPE) [3]. PBAT is widely used for compostable organic waste bags,
agricultural mulch films as well as lamination/coatings for starch-based products [4]. However,

335
there are some aspects that limit the use this biodegradable polymer in large-scale applications.
PBAT possesses excellent toughness, biodegradability and processability, allowing it to be used
to tailor the properties of some biopolymers, thereby opening up new applications for PBAT
based materials.
PBS is an aliphatic polyester which is traditionally synthesized from fossil fuel based 1,
4- butanediol (BDO) and succinic acid by polycondensation reaction [1]. Recently, renewable
resource based succinic acid and BDO can be produced by fermentation process. These biobased
monomers allow for a biobased PBS production. PBS has potential as a commercial product as it
shows wide variety of commercial applications because of its good processability,
thermomechanical properties, relatively high heat deflection temperature and biodegradability.
Also, PBS has properties close to commercial commodity polymers such as polyethylene (PE)
and polypropylene (PP) [5]. However, insufficient impact strength of the PBS is limits its
extensive applications.
Polymer blending is an effective approach to creating a material with some desired
properties by combining the different advantageous of two or more polymers. The resulting
mechanical properties are typically a compromise between those of the parent polymers.
Therefore, blending of PBS and PBAT is of great interest because it returns desirable properties
while retaining the biodegradable nature of the parent polymers in the resulting blends. The
resulting blend exhibits good mechanical, thermal and rheological properties [1].
Generally, durability is very important for the polymers in order to increase their
suitability for a wider range of applications. However, only few studies have been examined the
durability of biodegradable polymer based materials [6-8]. These literature sources report that

336
the biodegradable polymers are very sensitive to the elevated temperature and humidity.
Additionally, Kim and coworkers [9,10] have reported the durability of talc filled biodegradable
PBS/PBAT blends under marine environment. The authors suggest that the biodegradable
material showed better elastic properties than that of the commercial non-biodegradable material.
To the best of our knowledge, the durability study of PBS/PBAT blend has not yet been reported
in the literature. We report here the durability of PBS/PBAT blend under simulated temperature
(50oC) and relative humidity (90%). The present study was aimed to investigate the durability of
PBS, PBAT, PBS/PBAT and PP under simulated environmental conditions. The durability was
analyzed by means of mechanical properties such as tensile, flexural and impact strength.
A-II.2. Materials and Methods
Commercially available PBS (Biocosafe 1903F) and PBAT (Biocosafe 2003F) pellets were
procured from Xinfu Pharmaceutical Co., Ltd, China. Polypropylene (PP-1350N) was obtained
from Pinnacle Polymers (Garyville, LA). The general properties of the PBS, PBAT, PBS/PBAT
(60/40 wt%) and PP are shown in Table A-II.1. All the polymers were dried in oven for at least 8
h at 80oC to remove the moisture prior to melt processing. Prior to injection molding, all the
samples were extruded in a Leistritz twin-screw extruder with a screw speed of 100 rpm. The
extruder had an L/D ratio of 48 and a screw diameter of 27 mm. The extrudates were pelletized
and dried at 80oC for 12 h prior to the injection molding. The dried extruded pellets were then
injection molded in an ARBURG injection molding machine to obtain desired test specimens.
The injection molding machine had a maximum injection pressure of 2000 bar and a screw
diameter of 35 mm. The extrusion and injection molding process were carried out with a
processing temperature of 140oC for PBS, PBAT, PBS/PBAT (60/40 wt%) and 180
oC for PP.

337
Table A-II.1. General properties of PBS, PBAT, PBS/PBAT (60/40 wt%) and PP. (a obtained
from material data sheet, b and PBS/PBAT (60/40 wt%) data were measured in the lab)
Properties PBS PBAT PBS/PBAT
(60/40 wt%)
PP
Melt flow index (g/10min)a
≤30 ≤20 33 55
Melting point (oC)
a 110-120 110-120 110-120 165
Density (g/cm3)a 1.26 1.26 1.26 0.9
Moisture absorption after 14
days at 50oC with 90% RH
b
1.0 ± 0.004 0.83 ± 0.004 0.896 ± 0.002 0.008 ± 0.005
In order to evaluate the durability, the injection molded samples were exposed to 50 oC with
90% RH in an environmental chamber (Endurance C340, Envirotronics, Inc). The tensile and
flexural properties of the samples before and after conditioning were measured according to
ASTM standards in a Universal testing machine (Instron-3382) with a 50 kN load cell at room
temperature. The crosshead speed for tensile and flexural test was 50 mm/min and 14 mm/min,
respectively. Notched Izod impact strength was measured as per ASTM D256 in a TMI impact
testing machine. The results are reported an average values of five replicates for each set of
samples. Cryofractured sample morphology was examined using scanning electron microscopy
(Inspect S50-FEI Company) at an accelerating voltage of 20 kV. Prior to observing sample
morphology, the samples were gold coated with a final thickness of 20 nm with 20 mA.
A-II.3. Results and Discussion
Durability of PBS, PBAT, PBS/PBAT (60/40 wt%) and PP samples were examined in
terms of mechanical properties. The results obtained from the samples before and after
conditioning are depicted in Figures A-II.1 and A-II.2 and Table A-II.2. Figure A-II.1 shows the

338
tensile strength of the samples before and after 18 days conditioning. The tensile strength of
PBS, PBAT and PBS/PBAT significantly reduced after 18 days exposed to 50oC with 90% RH.
Generally, biodegradable polymers undergo hydrolytic degradation in the presence of moisture
and heat [6]. After 14 days exposed to 50oC with 90% RH, biodegradable polymers showed
greater moisture absorption than PP (Table A-II.1). This is attributed to the relatively high
polarity of the biodegradable polymers studied here. The higher moisture absorption of PBS,
PBAT and their blend leads to a decrease in molecular weight and tensile strength via hydrolysis
of the ester bonds. Due to the non-polar nature of PP, this plastic samples maintains its tensile
strength after 18 days exposed to 50oC with 90% RH. Our findings have good agreement with
literature [8].
Figure A-II.1. Tensile strength of PBS, PBAT, PBS/PBAT (60/40 wt%) and PP before and after
18 days exposed to 50oC with 90% RH.
Flexural strength of the PBS, PBAT, PBS/PBAT and PP samples before and after 18 days
conditioning is shown in Figure A-II.2. The flexural strength of PBS and PP is higher than
PBAT and PBS/PBAT blend. Except PBAT, all the samples showed a slight increase in the

339
flexural strength after 18 days conditioning. This increase can be ascribed to post-crystallization
phenomena which occurred during conditioning [11].
Figure A-II.2. Flexural strength of PBS, PBAT, PBS/PBAT (60/40 wt%) and PP before and
after 18 days exposed to 50oC with 90% RH.
The notched Izod impact strength of the samples is shown in Table A-II.2. After 18 days
conditioning, there is no significant change observed in the impact strength of PBAT. This could
be due to the PBAT maintaining its sufficient molecular weight in order to form a significant
degree of entanglement [12]. In the present study, impact strength of PBS was improved by
adding PBAT. It can be seen that the impact strength of PBS, PBS/PBAT decreased considerably
after 18 days exposed. In addition, it was clearly observed that the fracture mode of PBS/PBAT
changed from ductile to brittle after exposure to heat and humidity. This may be attributed to the
hydrolysis products of PBS accelerated the degradation of PBAT in the PBS/PBAT blend
system. As mentioned before, PP is resistant to hydrolytic degradation due to its non-polar
nature. Therefore, as expected, mechanical properties are not affected significantly after 18 days
exposure to the hydrolysis environment.

340
Table A-II.2. Notched Izod impact strength of PBS, PBAT, PBS/PBAT (60/40 wt%) and PP
before and after 18 days conditioning at 50oC with 90% RH.
Samples PBS PBAT PBS/PBAT (60/40 wt%) PP
Before conditioning
(J/m)
24.80 ± 6.55 Non-break
Non-break 30.4 ± 7.08
After 18 days
conditioning (J/m)
13.53 ± 1.21 Non-break
17.46 ± 7.22 22.3 ± 5.45
Figure A-II.3 shows the SEM micrographs of the samples before and after 18 days of
conditioning at 50oC with 90% RH. The PBS, PBAT and PBS/PBAT exhibits relatively very
smooth and clear surface morphology before exposed to elevated temperature and humidity. It is
clear from the SEM images that after 18 days of conditioning, the samples had gained rough
surface, deep holes as well as cavities. This result agrees with the considerable reduction
observed in the mechanical properties of the samples after 18 days exposure [8]. Furthermore,
ongoing degradation can be seen (Figure A-II.3) in the form of slightly eroded regions. This
shows that the PBS, PBAT and PBS/PBAT underwent degradation with increasing conditioning
time. The formed holes and cavities are attributed to the dissolution of the oligomers during
hydrolysis mechanism. All these observations suggest that the PBS, PBAT and PBS/PBAT can
readily undergo hydrolytic degradation in the presence of high humidity and temperature.

341
Figure A-II.3. SEM micrographs of PBS, PBAT, and PBS/PBAT (60/40 wt%) before (A, B and
C) and after (D, E and F) 18 days exposed to 50oC with 90% RH.

342
A-II.4. Conclusions
We have studied the durability of biodegradable PBS, PBAT, PBS/PBAT and non-
biodegradable PP at elevated temperature and humidity. The temperature and humidity had an
influence on the mechanical properties of the conditioned biodegradable polymers. After 18 days
exposed to 50oC with 90% RH, the samples morphology changed from smooth to an eroded
surface. These morphological changes suggest that the samples can undergo degradation within
18 days of conditioning as studied. Furthermore, our ongoing research will focus on the
extensive analysis of PBS, PBAT and PBS/PBAT blend at various stages of hydrolytic
degradation. In order to expand the potential of PBS and PBAT for durable applications, it is
essential to reduce the hydrolytic degradation behavior while maintaining compostability at the
end of life.
References
1. R. Muthuraj, M. Misra, A.K. Mohanty, Biodegradable Poly(butylene succinate) and
Poly(butylene adipate-co-terephthalate) Blends: Reactive Extrusion and Performance
Evaluation, J.Polym.Environ, 22(3), p. 336-349 (2014).
2. E. Marten, R.J. Müller, W.D. Deckwer, Studies on the enzymatic hydrolysis of
polyesters. II. Aliphatic–aromatic copolyesters, Polym.Degrad.Stab, 88(3), p. 371-381
(2005).
3. M. Breulmann, A. Kunkel, S. Philipp, V. Reimer, K.O. Siegenthaler, G. Skupin, M.
Yamamoto, Polymers, Biodegradable, in Ullmann's Encyclopedia of Industrial
Chemistry, Wiley-VCH Verlag GmbH & Co. KGaA (2000).

343
4. A. Javadi, A.J. Kramschuster, S. Pilla, J. Lee, S. Gong, L-S Turng, Processing and
characterization of microcellular PHBV/PBAT blend, Polym.Eng.Sci, 50(7), p. 1440-
1448 (2010).
5. T. Fujimaki, Processability and properties of aliphatic polyesters, ‘BIONOLLE’,
synthesized by polycondensation reaction. Polym.Degrad.Stab, 59(1–3), p. 209-214
(1998).
6. A.M. Harris, E.C. Lee, Heat and humidity performance of injection molded PLA for
durable applications, J.Appl.Polym.Sci, 115(3), p. 1380-1389 (2010).
7. A.M. Harris, E.C. Lee, Durability of polylactide-based polymer blends for injection-
molded applications, J.Appl.Polym.Sci, 128(3), p. 2136-2144 (2013).
8. S.H. Kim, H.J. Kim, Enhanced hydrolysis resistance of biodegradable polymers and bio-
composites, Polym.Degrad.Stab, 93(8), p. 1544-1553 (2008).
9. S. Kim, S.W. Park, K. Lee, Fishing performance of environmentally friendly tubular pots
made of biodegradable resin (PBS/PBAT) for catching the conger eel Conger myriaster,
Fish.Res, 80(5), p. 887-895 (2014).
10. S. Kim, S.W. Park, K. Lee, Fishing performance of an octopus minor net pot made of
biodegradable twines, Turk. J.Fish.Aquat.Sci, 14, p. 21-30 (2014).
11. M. Deroiné, A.L. Duigou, Y-M. Corre, P-Yves Le Gac, P. Davies, G. César, S. Bruzaud,
Accelerated ageing and lifetime prediction of poly(3-hydroxybutyrate-co-3-
hydroxyvalerate) in distilled water. Polym.Test, 39(0), p. 70-78 (2014).
12. G. Kfoury, J.M. Raquez, F. Hassouna, J. Odent, V. Toniazzo, D. Ruch, P. Dubois, Recent
advances in high performance poly(lactide): From “green” plasticization to super-tough
materials via (reactive) compounding, Front.Chem, 1, p.1-45 (2013).