Manufacture and Characterisation of Short Fibre Biocomposites
234
Manufacture and Characterisation of Short Fibre Biocomposites Angelica Ma¨ elle Delphine Legras M. Sc. A thesis submitted for the degree of Doctor of Philosophy at The University of Queensland in 2016 School of Mechanical and Mining Engineering
-
Upload
khangminh22 -
Category
Documents
-
view
1 -
download
0
Transcript of Manufacture and Characterisation of Short Fibre Biocomposites
Manufacture and Characterisation of Short Fibre
Biocomposites
Angelica Maelle Delphine Legras
M. Sc.
A thesis submitted for the degree of Doctor of Philosophy at
The University of Queensland in 2016
School of Mechanical and Mining Engineering
Abstract
In response to environmental concerns, the composites industry is showing a growing interest
in natural fibre biocomposites as an alternative to wood plastic composites and glass fibre
thermoplastics. Albeit many years of research, the potential of these new materials has not
being reached and the properties obtained are too often lower than expected. A main reason for
this is because the natural fibre properties are variable and poorly characterised, and inefficient
traceability makes it difficult to grade the fibres. When it comes to biocomposite manufacturing,
short plant fibre composites have attracted the interest of the thermoplastic compounding
industry but only a few companies have mastered the compounding step. Too often, the
extruder is treated as a “black box” and the critical processing parameters have not yet been
identified. As a result, the full potential of extrusion process for biocomposites is not exhausted.
This research aimed to generate a better understanding of bast fibre surfaces, their interaction
with the matrix and to optimise the extrusion process for short fibre biocomposites. New
generation in-lens Scanning Electron Microscopy (SEM) and X-ray Photoelectron Spectroscopy
(XPS) provided quantitative information of the first ten nanometres of the fibre surface with
high precision, and Inverse Gas Chromatography (IGC) enabled the determination of natural
fibre surface energy. Combined, XPS, in-lens SEM and IGC offered a unique complementarity
to unravel natural fibre surface properties. In particular, the results achieved provided key
complementary information about the nature of the chemical groups present at the fibre surface
and showed clear evidence of the effect of fibre treatment on the surface properties. Field retting
and water washing were insufficient to remove lignins, pectins and waxes from flax and kenaf
fibre surface. Alkaline treated fibres had a cleaner but rough surface still partially covered with
an amorphous layer rich in lignins and waxes. Surface energy profiles obtained by IGC also
revealed a change in polarity and the distribution of the energetic active sites post treatment.
In addition, the critical parameters to determine the BET surface area values with IGC were
identified and a protocol applicable to natural fibres was proposed.
The series of extrusion trials brought new insights into the feasibility of large scale biocomposite
extrusion. Statistical analysis showed a significant interdependence between all factors and
particularly between the screw speed and the screw design. At both laboratory scale and
i
medium scale, fibre content was the dominant factor for the tensile strength and elastic modulus
whilst screw speed and screw design affected to a lower degree the tensile properties. The fibre
surface properties and fibre length distribution were also determinant for the biocomposite
properties. For instance, the alkaline treated fibre reinforced polypropylene composites under-
performed compared to the water washed fibre polypropylene composites although the former
had a surface more energetically homogeneous and less polar. It is assumed that the higher
fibre aspect ratio of the water washed fibres and their homogeneous fibre length distribution
largely contributed to increase the composite performance.
Finally, extrusion at industrial scale has been successfully performed and represents a major
achievement of the thesis. However, significant amount of porosity was noticed in the extruded
samples throughout the trials and further work is required to overcome this issue. Whilst the
porosity detected in the samples questions the industrial-usefulness of some of the results, the
contribution of this thesis to the development of natural fibre compounding capability at The
University of Queensland and collaborating local industries was immense. The methodology
and the lessons learned will undoubtedly be used to further optimise the extrusion process and
produce better biocomposite materials.
ii

Declaration by author
This thesis is composed of my original work, and contains no material previously published or
written by another person except where due reference has been made in the text. I have clearly
stated the contribution by others to jointly-authored works that I have included in my thesis.
I have clearly stated the contribution of others to my thesis as a whole, including statistical
assistance, survey design, data analysis, significant technical procedures, professional editorial
advice, and any other original research work used or reported in my thesis. The content of my
thesis is the result of work I have carried out since the commencement of my research higher
degree candidature and does not include a substantial part of work that has been submitted
to qualify for the award of any other degree or diploma in any university or other tertiary
institution. I have clearly stated which parts of my thesis, if any, have been submitted to
qualify for another award.
I acknowledge that an electronic copy of my thesis must be lodged with the University Library
and, subject to the policy and procedures of The University of Queensland, the thesis be made
available for research and study in accordance with the Copyright Act 1968 unless a period of
embargo has been approved by the Dean of the Graduate School.
I acknowledge that copyright of all material contained in my thesis resides with the copyright
holder(s) of that material. Where appropriate I have obtained copyright permission from the
copyright holder to reproduce material in this thesis.
iii
Publications during candidature
Journal Paper
1. A. Legras, A. Kondor, M. T. Heitzmann and R. W. Truss, Inverse gas chromatography
for natural fibre characterisation: Identification of the critical parameters to determine
the Brunauer–Emmett–Teller specific surface area, Journal of Chromatography A 1425
(2015): 273-279.
Peer-reviewed Conference Papers
1. A. Legras, R. W. Truss, C. Chaleat and M. T. Heitzmann, A practical toolbox to overcome
the multiple challenges of biocomposites extrusion, Australasian Composites Conference,
2015, Gold Coast, Australia.
2. A. Legras, R. W. Truss, S. Rao, D. Bhattacharyya, N. Soatthiyanon, A. Crosky and
M. T. Heitzmann, Optimisation of the twin-screw compounding process for short fibre
biocomposites, Australasian Composites Conference, 2014, Newcastle, Australia.
3. M. T. Heitzmann, A. M. Ali, A. Legras, L. J. Vandi and J. Milne, Hemp hurd flour as an
alternative low cost filler in wood plastic composites, Second International Conference on
Performance-based and Life-cycle Structural Engineering, 2015, Brisbane, Australia.
Publications included in this thesis
1. A. Legras, A. Kondor, M. T. Heitzmann and R. W. Truss, Inverse gas chromatography
for natural fibre characterisation: Identification of the critical parameters to determine
the Brunauer–Emmett–Teller specific surface area, Journal of Chromatography A 1425
(2015): 273-279 - incorporated in Chapter 4 as Section 4.1.
iv

Contributor Statement of contribution
A. Legras Designed experiments (100%)
Wrote the paper (100%)
A. Kondor Edited paper (30%)
M. T. Heitzmann Edited paper (10%)
R. W. Truss Edited paper (60%)
Contributions by others to the thesis
Chapter 3
Ron Rasch (Centre for Microscopy & Microanalysis, The University of Queensland) performed
the Scanning Electron Microscopy analysis which led to the results presented in Section 3.2.
Dr. Barry Wood (Centre for Microscopy & Microanalysis, The University of Queensland)
performed the X-Ray Photoelectron Spectroscopy measurements and significantly contributed
to the interpretation of the high resolution spectra presented in Section 3.3.
Chapter 4
Dr. Anett Kondor (Surface Measurement Systems) provided guidance in Inverse Gas Chro-
matography and assisted in interpreting the data presented in Section 4.1 and 4.2.
Chapter 5
Mercedes Alcock (Composites Innovation Centre) did the Single Fibre Tensile Testing and
provided the raw data, which led to the tensile properties shown in Figure 5.6.
Dr. Celine Chaleat, John Milne (Centre for High Performance Polymers, The University of
Queensland) and Dr. Michael T. Heitzmann (Composites Group, The University of Queens-
land) largely contributed in performing the series of extrusion trials and injection moulding
presented in Section 5.3 and 5.5.
Dr. Lin-P’ing Choo-Smith (Composites Innovation Centre) performed the X-Ray Diffraction
analysis presented in Section 5.3 and significantly contributed to the data interpretation.
v
Dr. Hayder Salem (The University of British Columbia) performed the fibre dimensional analy-
sis with the Fibre Quality Analyser, which led to the fibre length distribution profiles presented
in Section 5.3.
Dr. Chad Ulven (North Dakota State University) organised Micro Computed Tomography of
extruded compounds shown in Figure 5.15 and Figure 5.11.
Dr. Luigi J. Vandi (Composites Group, The University of Queensland) organised the Thermo-
gravimetric Analysis presented in Section 5.3 and assisted with the data interpretation.
Benjamin Ziegelaar (undergraduate student, The University of Queensland) assisted in the
laboratory scale extrusion trials described in Section 5.2.
Statement of parts of the thesis submitted to qualify for
the award of another degree
None.
vi
Acknowledgements
To the Cooperative Research Centre for Advanced Composite Structures (CRC-ACS) and The
University of Queensland for funding my research and giving me the opportunity to travel
within Australia and to North America for experimental work and conferences.
To Rowan W. Truss, my Principal Advisor, for your guidance and often thought provoking
feedback which guided me in my research and led me down to the right path. Your experience
and knowledge enabled us to bring new perspectives into the field and I really enjoyed our end-
less debates on the complexity of natural fibres. Thank you for supporting me and encouraging
me all the way along. You helped me bringing this journey to the finish line and I am deeply
grateful for your advice and patience in the process.
To Michael T. Heitzmann, my mentor and Scientific Advisor, for your guidance and inspiration
throughout. This biocomposite success story would not be, without your unfailing motivation
and creativity. You taught me a lot and showed me new perspectives. You also gave me
the opportunity to extend this journey beyond Australia and offered me one of the greatest
challenge of these years; a ticket to Winnipeg. Thank you Michael, it has been a pleasure to
work with you and I am looking forward to further collaboration in the future.
To the FibreCITY team, Lin-P’ing Choo-Smith, Mercedes Alcock, Jennifer Bell, Frank Wheeler,
Simon Potter, Sean McKay and Co. from the Composites Innovation Centre in Winnipeg, and
to Anett Kondor from Surface Measurement Systems. I am indebted for your warm welcome
and generous assistance in the research on Inverse Gas Chromatography. Winnipeg has been a
unique adventure that opened new opportunities beyond the PhD.
To the colleagues from the Centre for High Performance Polymers, Celine Chaleat and John
Milne who helped me in designing many of the extrusion trials in the laboratory. Thanks for
your time and guidance, the much of the success of biocomposite extrusion is attributable to
your assistance. Acknowledgements and thanks also go to the colleagues from Eagle Farm,
Lance McGarva and Doug Holliday and to the CRC-ACS P1.1 team, especially the fellows
from the University of Auckland and from the University of New South Wales.
To Ron Rasch and Dr. Barry Wood (Centre for Microscopy and Microanalysis, The University
of Queensland), for your expertise and all the time you dedicated to my experimental work on
the surface characterisation.
vii

To the UQ Composites Group, Martin Veidt, Amandeep Virk, Luigi, Philippe, Simon, Hannes,
Mitch and Co. It was a pleasure to work with you in such a nice atmosphere. Thanks for your
advice and, most of all, thank you for the positive energy you all brought to the team.
To my extended family, alias all the UQ fellows that shared with me many hours in this
amazing campus. Special dedication to Mingyuan, Jenny, Liliana, Maria Clara, Mauricio,
Hugh, Sandeep, Simon, Alex. We shared much more than scientific discussions and for sure our
paths will cross again in the future. You were the best adopted family one could imagine and
I cannot fully express here how much you gave me.
To my housemates Fred and Hayley, it was a pleasure to reach home everyday and find these
two happy faces. Thank you for making every day a great one, thank you for your patience,
help and advice in this Australian journey. Cricket101 was an appetizer to the Australian life,
we have more to share in the future.
To the EEIGM family, Pauline, Elise, Lucie, Stephane, Jo., Maxime and Co. Thank you for
your support, your respective journeys have been enriching and motivating.
To the French community, in particular the Pisasale family, Vanessa & Chris and Nathalie &
Luigi. You took me under your wings when I landed in Brisbane and you have always been
there to help me. Thank you for your kindness and support.
To Sensei Sinn Chew and all the karate mates, you taught me more than Okinawa Goju-Ryu
Karate. In the Dojo I found respect, relief and a place to breath away. I am looking forward
the next Katas and sparring sessions. See you on the Dojo.
To el Argentino, Juan Pablo, you were the best “collateral damage” of this journey... Thank
you for your encouragement and ongoing support beyond the borders, especially during thesis
writing. Your happiness and philosophy of life inspire me, you took my breath away. I am
ready for our next challenge, see you there.
Finally, and above all, thanks to my family for their endless support all these years. Beyond
Spain, Sweden, Germany and Australia, you have always been there for me. I am immensely
grateful for all the love and encouragement you have given me.
This thesis was accomplished with the important life ingredients you have all instilled in me,
Thank You.
viii
Keywords
natural fibres, biocomposites, surface analysis, inverse gas chromatography, extrusion, com-
pounding
Australian and New Zealand Standard Research Classifi-
cations (ANZSRC)
ANZSRC code: 091202, Composite and Hybrid Materials, 100%
Fields of Research (FoR) Classification
FoR code: 0912, Materials Engineering, 100%
ix

Science is a way of thinking much more than it is a body of knowledge.
C. Sagan

Contents
Abstract i
Acknowledgements vii
Contents xi
List of Figures xiv
List of Tables xvii
Abbreviations xix
1 Introduction 1
1.1 Background & Motivations . . . . . . . . . . . . . . . . . . . . . . . . . . . . . . 1
1.2 Scope and Objectives . . . . . . . . . . . . . . . . . . . . . . . . . . . . . . . . . 3
1.3 Thesis Outline . . . . . . . . . . . . . . . . . . . . . . . . . . . . . . . . . . . . . 5
2 Literature Review 6
2.1 Natural Fibre Composites: general background . . . . . . . . . . . . . . . . . . . 6
2.1.1 Natural fibres and biocomposites . . . . . . . . . . . . . . . . . . . . . . 6
2.1.2 Performance & properties . . . . . . . . . . . . . . . . . . . . . . . . . . 10
2.1.2.1 Natural fibre properties . . . . . . . . . . . . . . . . . . . . . . 10
2.1.2.2 NFCs properties . . . . . . . . . . . . . . . . . . . . . . . . . . 11
Tensile behaviour . . . . . . . . . . . . . . . . . . . . . . . . . . . 11
Impact strength . . . . . . . . . . . . . . . . . . . . . . . . . . . . 13
Main factors for biocomposite performance . . . . . . . . . . . . . 14
2.2 Natural Fibre Characterisation . . . . . . . . . . . . . . . . . . . . . . . . . . . 17
2.2.1 Surface properties . . . . . . . . . . . . . . . . . . . . . . . . . . . . . . . 17
2.2.1.1 Natural fibre structure . . . . . . . . . . . . . . . . . . . . . . . 17
2.2.1.2 Natural fibre surface properties . . . . . . . . . . . . . . . . . . 19
2.2.1.3 Surface characterisation techniques . . . . . . . . . . . . . . . . 20
2.2.1.4 IGC: a novel technique to characterise natural fibre surfaces . . 23
2.3 Compounding Short Fibre Biocomposites . . . . . . . . . . . . . . . . . . . . . . 29
xi
3 Surface Characterisation 32
3.1 Materials . . . . . . . . . . . . . . . . . . . . . . . . . . . . . . . . . . . . . . . 32
3.2 Scanning Electron Microscopy . . . . . . . . . . . . . . . . . . . . . . . . . . . . 37
3.3 X-Ray Photoelectron Spectroscopy . . . . . . . . . . . . . . . . . . . . . . . . . 46
3.3.1 Theroretical background . . . . . . . . . . . . . . . . . . . . . . . . . . . 46
3.3.2 Experimental . . . . . . . . . . . . . . . . . . . . . . . . . . . . . . . . . 48
3.3.3 Results and discussions . . . . . . . . . . . . . . . . . . . . . . . . . . . . 49
3.3.3.1 Effect of water wash and alkaline treatment on kenaf and hempfibres . . . . . . . . . . . . . . . . . . . . . . . . . . . . . . . . 53
3.3.3.2 High resolution scans . . . . . . . . . . . . . . . . . . . . . . . . 57
3.3.3.3 Peak fitting and identification of functional groups in kenaf fibres 67
4 Inverse Gas Chromatography on Natural Fibres 80
4.1 Identification of the Critical Parameters to Determine the Brunauer-Emmett-Teller Specific Surface Area . . . . . . . . . . . . . . . . . . . . . . . . . . . . . 81
4.1.1 Introduction . . . . . . . . . . . . . . . . . . . . . . . . . . . . . . . . . . 81
4.1.2 Experimental procedure . . . . . . . . . . . . . . . . . . . . . . . . . . . 84
4.1.2.1 Materials . . . . . . . . . . . . . . . . . . . . . . . . . . . . . . 84
4.1.2.2 Methods . . . . . . . . . . . . . . . . . . . . . . . . . . . . . . . 85
4.1.3 Results and Discussions . . . . . . . . . . . . . . . . . . . . . . . . . . . 89
4.1.3.1 Reproducibility within a column . . . . . . . . . . . . . . . . . 89
4.1.3.2 Solvent dependence . . . . . . . . . . . . . . . . . . . . . . . . . 92
4.1.3.3 Variability within a batch . . . . . . . . . . . . . . . . . . . . . 93
4.1.3.4 Sample packing . . . . . . . . . . . . . . . . . . . . . . . . . . . 94
4.1.4 Conclusions . . . . . . . . . . . . . . . . . . . . . . . . . . . . . . . . . . 95
4.1.5 Acknowledgements . . . . . . . . . . . . . . . . . . . . . . . . . . . . . . 96
4.2 Surface Energy of Natural Fibres . . . . . . . . . . . . . . . . . . . . . . . . . . 97
4.2.1 Theoretical background . . . . . . . . . . . . . . . . . . . . . . . . . . . . 97
4.2.1.1 Surface energy and adhesion mechanisms . . . . . . . . . . . . . 97
4.2.1.2 Determination of the dispersive component of the fibre surfaceenergy γLWS . . . . . . . . . . . . . . . . . . . . . . . . . . . . . 100
4.2.1.3 Determination of the acid-base component of the fibre surfaceenergy γAB
S . . . . . . . . . . . . . . . . . . . . . . . . . . . . . 102
4.2.2 Experimental procedure . . . . . . . . . . . . . . . . . . . . . . . . . . . 103
4.2.3 Case studies . . . . . . . . . . . . . . . . . . . . . . . . . . . . . . . . . . 111
4.2.3.1 Surface energy profiles of natural fibres . . . . . . . . . . . . . . 112
4.2.3.2 Effect of chemical treatment on the fibre surface energy profile . 116
4.3 Conclusions . . . . . . . . . . . . . . . . . . . . . . . . . . . . . . . . . . . . . . 121
5 Optimisation of Extrusion Process for Biocomposites 122
5.1 Introduction . . . . . . . . . . . . . . . . . . . . . . . . . . . . . . . . . . . . . . 122
5.2 Preliminary Work . . . . . . . . . . . . . . . . . . . . . . . . . . . . . . . . . . . 123
5.2.1 Compound optimisation . . . . . . . . . . . . . . . . . . . . . . . . . . . 124
5.2.2 Effect of screw speed and screw design . . . . . . . . . . . . . . . . . . . 126
xii
5.2.3 Lessons learned . . . . . . . . . . . . . . . . . . . . . . . . . . . . . . . . 129
5.2.3.1 Fibre feeding . . . . . . . . . . . . . . . . . . . . . . . . . . . . 129
5.2.3.2 Up-scaling . . . . . . . . . . . . . . . . . . . . . . . . . . . . . . 130
5.2.3.3 Fibre traceability from the field to the factory . . . . . . . . . . 130
5.3 Experimental Approach . . . . . . . . . . . . . . . . . . . . . . . . . . . . . . . 132
5.3.1 Materials . . . . . . . . . . . . . . . . . . . . . . . . . . . . . . . . . . . 132
5.3.2 Fibre characterisation . . . . . . . . . . . . . . . . . . . . . . . . . . . . 134
5.3.2.1 Fibre length distribution . . . . . . . . . . . . . . . . . . . . . . 136
5.3.2.2 XRD analysis . . . . . . . . . . . . . . . . . . . . . . . . . . . . 139
5.3.2.3 TGA analysis . . . . . . . . . . . . . . . . . . . . . . . . . . . . 141
5.3.2.4 Single Fibre Tensile Testing . . . . . . . . . . . . . . . . . . . . 143
5.3.3 Design of Experiment towards large scale compounding . . . . . . . . . . 145
5.4 Results & Discussions . . . . . . . . . . . . . . . . . . . . . . . . . . . . . . . . . 150
5.4.1 Tensile modulus response . . . . . . . . . . . . . . . . . . . . . . . . . . . 151
5.4.2 Tensile strength response . . . . . . . . . . . . . . . . . . . . . . . . . . . 156
5.4.3 Effect of fibre treatment on tensile properties . . . . . . . . . . . . . . . . 160
5.4.4 Effect of injection moulding on tensile properties . . . . . . . . . . . . . . 163
5.5 Industrial Trials . . . . . . . . . . . . . . . . . . . . . . . . . . . . . . . . . . . . 166
5.5.1 Compounding of kenaf/MAPP/PP with Duromer . . . . . . . . . . . . . 166
5.5.2 Profile extrusion of kenaf/PVC compounded pellets with ETI . . . . . . 167
5.6 Conclusions . . . . . . . . . . . . . . . . . . . . . . . . . . . . . . . . . . . . . . 169
6 Conclusions & Recommendations 171
6.1 Conclusions . . . . . . . . . . . . . . . . . . . . . . . . . . . . . . . . . . . . . . 172
6.2 Recommendations . . . . . . . . . . . . . . . . . . . . . . . . . . . . . . . . . . . 177
Bibliography 179
A Tensile properties of natural fibres: reference data 204
xiii
List of Figures
1.1 Chart representing the route to short bast fibre biocomposites . . . . . . . . . . 2
1.2 Triad of natural fibre properties, characterisation techniques and extrusion . . . 5
2.1 Natural fibres, Biopolymers and Biocomposites . . . . . . . . . . . . . . . . . . 9
2.2 Ranges of specific Youngs’ Modulus values for natural fibres and glass fibres[Dittenber and GangaRao, 2012] . . . . . . . . . . . . . . . . . . . . . . . . . . 11
2.3 Performances of natural fibre thermoplastics (see references in Appendix A) . . 13
2.4 Prediction of tensile and impact performance with respect to fibre length for fibrereinforced thermoplastic composites (adapted from Thomason and Vlug [1996]) 15
2.5 Structural hierarchy in kenaf plant (modified from Khalil et al. [2013] and Baillie[2004]) . . . . . . . . . . . . . . . . . . . . . . . . . . . . . . . . . . . . . . . . . 17
2.6 SEM images of raw sisal fibre (A) and sisal fibres after various chemical treat-ments: immersion in resorcinol/hexamethylenetetramine aqueous solution (B),mercerisation (C) and mercerisation followed by immersion in resorcinol/hex-amethylenetetramine aqueous solution (D) (modified from Martins et al. [2006]). . . . . . . . . . . . . . . . . . . . . . . . . . . . . . . . . . . . . . . . . . . . . 21
2.7 IGC Surface Energy Analyser (modified image supplied by Surface MeasurementSystems) . . . . . . . . . . . . . . . . . . . . . . . . . . . . . . . . . . . . . . . 25
2.8 Twin-screw extrusion sheet line with downstream side feeding (www.leistritz-extrusion.com) . . . . . . . . . . . . . . . . . . . . . . . . . . . . . . . . . . . . 29
3.1 Conventional SEM with below lens SE detector and new generation FE-SEMwith in-lens on axis filter detector (adapted from [Stricher, 2012]) . . . . . . . . 38
3.2 SEM micrographs of flax fibres as received imaged with conventional SE detector(a) and UED detector filtering backscattered electrons (b) . . . . . . . . . . . . 39
3.3 SEM micrographs of flax fibres alkaline treated imaged with conventional SEdetector (a), (b) and UED detector filtering backscattered electrons (c), (d) . . . 41
3.4 SEM micrographs of kenaf fibres as received imaged with conventional SE detec-tor (a) and UED detector filtering backscattered electrons (b) . . . . . . . . . . 43
3.5 SEM micrographs of kenaf fibres water washed imaged with conventional SEdetector (a) and UED detector filtering backscattered electrons (b) . . . . . . . 44
3.6 SEM micrographs of kenaf fibres alkaline treated imaged with conventional SEdetector (a) and UED detector filtering backscattered electrons (b) . . . . . . . 45
3.7 Photoelectron scattering induced by X-Ray illumination . . . . . . . . . . . . . 46
xiv
List of Figures
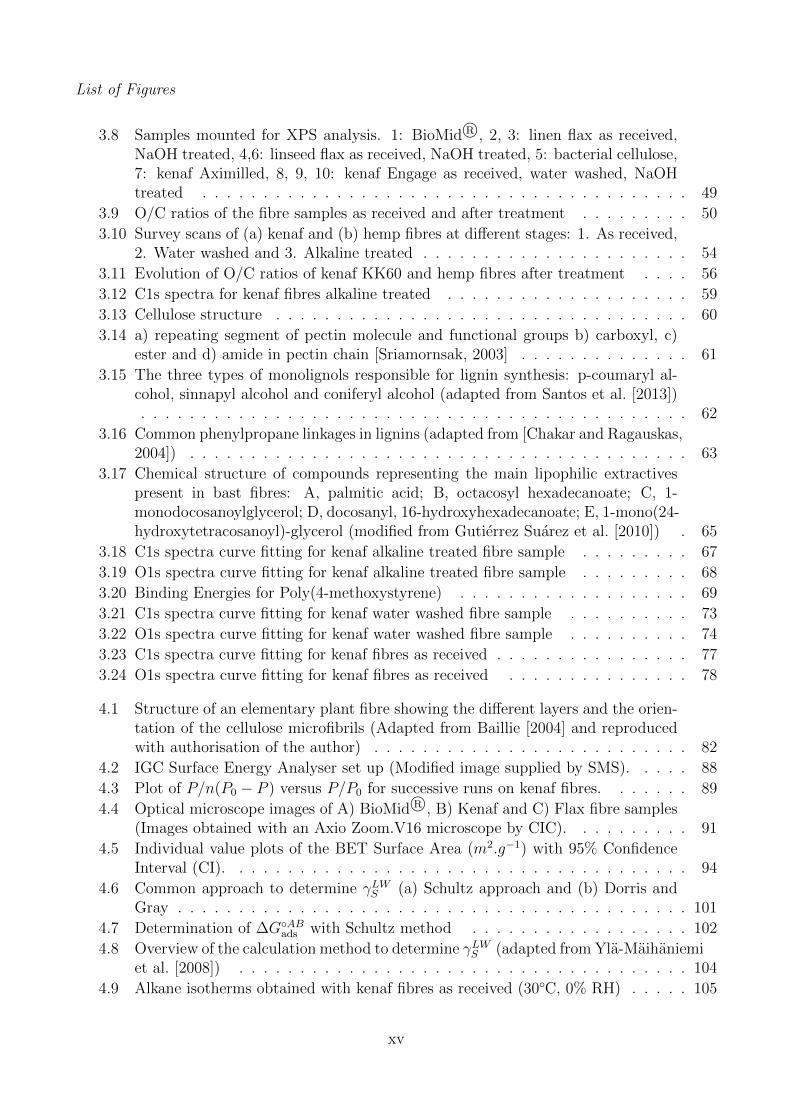
3.8 Samples mounted for XPS analysis. 1: BioMid R©, 2, 3: linen flax as received,NaOH treated, 4,6: linseed flax as received, NaOH treated, 5: bacterial cellulose,7: kenaf Aximilled, 8, 9, 10: kenaf Engage as received, water washed, NaOHtreated . . . . . . . . . . . . . . . . . . . . . . . . . . . . . . . . . . . . . . . . 49
3.9 O/C ratios of the fibre samples as received and after treatment . . . . . . . . . 50
3.10 Survey scans of (a) kenaf and (b) hemp fibres at different stages: 1. As received,2. Water washed and 3. Alkaline treated . . . . . . . . . . . . . . . . . . . . . . 54
3.11 Evolution of O/C ratios of kenaf KK60 and hemp fibres after treatment . . . . 56
3.12 C1s spectra for kenaf fibres alkaline treated . . . . . . . . . . . . . . . . . . . . 59
3.13 Cellulose structure . . . . . . . . . . . . . . . . . . . . . . . . . . . . . . . . . . 60
3.14 a) repeating segment of pectin molecule and functional groups b) carboxyl, c)ester and d) amide in pectin chain [Sriamornsak, 2003] . . . . . . . . . . . . . . 61
3.15 The three types of monolignols responsible for lignin synthesis: p-coumaryl al-cohol, sinnapyl alcohol and coniferyl alcohol (adapted from Santos et al. [2013]). . . . . . . . . . . . . . . . . . . . . . . . . . . . . . . . . . . . . . . . . . . . . 62
3.16 Common phenylpropane linkages in lignins (adapted from [Chakar and Ragauskas,2004]) . . . . . . . . . . . . . . . . . . . . . . . . . . . . . . . . . . . . . . . . . 63
3.17 Chemical structure of compounds representing the main lipophilic extractivespresent in bast fibres: A, palmitic acid; B, octacosyl hexadecanoate; C, 1-monodocosanoylglycerol; D, docosanyl, 16-hydroxyhexadecanoate; E, 1-mono(24-hydroxytetracosanoyl)-glycerol (modified from Gutierrez Suarez et al. [2010]) . 65
3.18 C1s spectra curve fitting for kenaf alkaline treated fibre sample . . . . . . . . . 67
3.19 O1s spectra curve fitting for kenaf alkaline treated fibre sample . . . . . . . . . 68
3.20 Binding Energies for Poly(4-methoxystyrene) . . . . . . . . . . . . . . . . . . . 69
3.21 C1s spectra curve fitting for kenaf water washed fibre sample . . . . . . . . . . 73
3.22 O1s spectra curve fitting for kenaf water washed fibre sample . . . . . . . . . . 74
3.23 C1s spectra curve fitting for kenaf fibres as received . . . . . . . . . . . . . . . . 77
3.24 O1s spectra curve fitting for kenaf fibres as received . . . . . . . . . . . . . . . 78
4.1 Structure of an elementary plant fibre showing the different layers and the orien-tation of the cellulose microfibrils (Adapted from Baillie [2004] and reproducedwith authorisation of the author) . . . . . . . . . . . . . . . . . . . . . . . . . . 82
4.2 IGC Surface Energy Analyser set up (Modified image supplied by SMS). . . . . 88
4.3 Plot of P/n(P0 − P ) versus P/P0 for successive runs on kenaf fibres. . . . . . . 89
4.4 Optical microscope images of A) BioMid R©, B) Kenaf and C) Flax fibre samples(Images obtained with an Axio Zoom.V16 microscope by CIC). . . . . . . . . . 91
4.5 Individual value plots of the BET Surface Area (m2.g−1) with 95% ConfidenceInterval (CI). . . . . . . . . . . . . . . . . . . . . . . . . . . . . . . . . . . . . . 94
4.6 Common approach to determine γLWS (a) Schultz approach and (b) Dorris andGray . . . . . . . . . . . . . . . . . . . . . . . . . . . . . . . . . . . . . . . . . . 101
4.7 Determination of ∆G◦ABads with Schultz method . . . . . . . . . . . . . . . . . . 102
4.8 Overview of the calculation method to determine γLWS (adapted from Yla-Maihaniemiet al. [2008]) . . . . . . . . . . . . . . . . . . . . . . . . . . . . . . . . . . . . . 104
4.9 Alkane isotherms obtained with kenaf fibres as received (30◦C, 0% RH) . . . . . 105
xv
List of Figures
4.10 Retention volume of n-alkane series obtained with kenaf fibres as received (30◦C,0% RH) . . . . . . . . . . . . . . . . . . . . . . . . . . . . . . . . . . . . . . . . 106
4.11 Alkane series obtained with kenaf fibres as received (30◦C, 0% RH) . . . . . . . 107
4.12 γLWS profile of kenaf fibres as received obtained with Dorris and Gray method,peak CoM (30◦C, 0% RH) . . . . . . . . . . . . . . . . . . . . . . . . . . . . . . 108
4.13 Extrapolation of γLWS profile . . . . . . . . . . . . . . . . . . . . . . . . . . . . 109
4.14 γLWS distribution profile up to 100% coverage . . . . . . . . . . . . . . . . . . . 110
4.15 Distribution of the surface energy components: (a) γLWS and (b) γABS distribution
profiles for cellulose BioMid R©, kenaf and linseed flax fibres . . . . . . . . . . . . 114
4.16 γTOTS distribution profiles for cellulose BioMid R©, kenaf and linseed flax fibres . 115
4.17 Effect of chemical treatment on (a) γLWS and (b) γABS . . . . . . . . . . . . . . . 118
4.18 Effect of water wash and alkaline treatment on γTOTS distribution profile of kenaf 120
5.1 Screw configuration and feeding location on the twin-screw extruder BrabenderDSE 25 . . . . . . . . . . . . . . . . . . . . . . . . . . . . . . . . . . . . . . . . 124
5.2 Experimental approach to optimise the extrusion process for short fibre biocom-posites (image inspired by [Mussig and Haag, 2012]) . . . . . . . . . . . . . . . 132
5.3 Fibre length distribution obtained with the HiRes FQA (a) water washed fibresand (b) alkaline treated fibres . . . . . . . . . . . . . . . . . . . . . . . . . . . . 138
5.4 XRD radial plots (mean, normalized) (data kindly provided by CIC) . . . . . . 140
5.5 TGA curves (a) sample mass and (b) weight loss . . . . . . . . . . . . . . . . . . 142
5.6 Histograms of tensile properties for a batch of kenaf fibres (39 elements): (a)Young’s modulus and (b) tensile strength . . . . . . . . . . . . . . . . . . . . . . 144
5.7 Screw design (aggressive configuration) and pressure profiles . . . . . . . . . . . 147
5.8 Main effect plot of elastic modulus (GPa) . . . . . . . . . . . . . . . . . . . . . 151
5.9 Pareto chart of elastic modulus (GPa) . . . . . . . . . . . . . . . . . . . . . . . 153
5.10 Interaction plot of elastic modulus (GPa) . . . . . . . . . . . . . . . . . . . . . 154
5.11 Volume rendering showing the porosity and fibre dispersion in kenaf/MAPP/PPcompounds with (a) aggressive screw and (b) soft screw (Micro CT Images kindlyprovided by NDSU) . . . . . . . . . . . . . . . . . . . . . . . . . . . . . . . . . . 155
5.12 Main effect plot tensile strength (MPa) . . . . . . . . . . . . . . . . . . . . . . 156
5.13 Pareto chart of tensile strength (MPa) . . . . . . . . . . . . . . . . . . . . . . . 158
5.14 Interaction plot of tensile strength (MPa) . . . . . . . . . . . . . . . . . . . . . 159
5.15 Volume rendering showing the porosity and fibre dispersion in (a) kenaf waterwashed fibres/MAPP/PP composites and (b) kenaf alkaline treated fibres/MAP-P/PP composites (Micro CT Images kindly provided by NDSU) . . . . . . . . . 162
5.16 Tensile properties of compounds directly extruded vs. injection moulded (a)average tensile modulus (MPa) and (b) average tensile strength (GPa) Note:error bars represent the standard deviation when it could be calculated . . . . . . 164
5.17 First biocomposite profiles extruded in an Australian industry . . . . . . . . . . 168
6.1 Triad of natural fibre properties, characterisation techniques and extrusion . . . 172
A.1 Literature review on biocomposite properties (1) . . . . . . . . . . . . . . . . . . 205
A.2 Literature review on biocomposite properties (2) . . . . . . . . . . . . . . . . . . 206
xvi
List of Tables
2.1 Botanical classification of plant fibres [Pickering, 2008] . . . . . . . . . . . . . . 7
2.2 Average chemical composition of common bast fibres [Bledzki and Gassan, 1999,Dittenber and GangaRao, 2012, Faruk et al., 2012, Mohanty et al., 2005, Satya-narayana et al., 2009] . . . . . . . . . . . . . . . . . . . . . . . . . . . . . . . . . 18
2.3 Comparison of common surface characterisation techniques . . . . . . . . . . . . 24
3.1 Samples used in the study . . . . . . . . . . . . . . . . . . . . . . . . . . . . . . 34
3.2 Details on the treatments applied to the fibre samples . . . . . . . . . . . . . . . 35
3.3 Samples studied by XPS . . . . . . . . . . . . . . . . . . . . . . . . . . . . . . . 48
3.4 Chemical compositions of the sample surfaces obtained by survey scans . . . . . 50
3.5 Predominant linkages in lignins in softwood (SWD) and hardwood (HWD) (fromSantos et al. [2013]) . . . . . . . . . . . . . . . . . . . . . . . . . . . . . . . . . . 63
3.6 Composition of lipophilic extractives in bast fibres (adapted from Gutierrez Suarezet al. [2010]) . . . . . . . . . . . . . . . . . . . . . . . . . . . . . . . . . . . . . . 64
3.7 Binding energies and concentrations (at%) of kenaf fibres NaOH treated . . . . . 71
3.8 Binding energies and concentrations (at%) of kenaf fibres water washed . . . . . 75
4.1 Industrial fibre grades used for the study . . . . . . . . . . . . . . . . . . . . . . 85
4.2 Strategy to investigate the critical parameters for BET experiment . . . . . . . . 87
4.3 Reproducibility BET experiment . . . . . . . . . . . . . . . . . . . . . . . . . . 89
4.4 Effect of adsorbate . . . . . . . . . . . . . . . . . . . . . . . . . . . . . . . . . . 93
4.5 Effect of fibre length . . . . . . . . . . . . . . . . . . . . . . . . . . . . . . . . . 95
4.6 Experimental procedure for surface energy analysis . . . . . . . . . . . . . . . . 112
4.7 Surface energy components (mJ.m−2) at 30◦C, 0% RH . . . . . . . . . . . . . . 112
4.8 Surface energy components (mJ.m−2) at 30◦C, 0% RH . . . . . . . . . . . . . . 116
5.1 Tensile properties of kenaf/MAPP/PP composites (ASTM D638) . . . . . . . . 125
5.2 Tensile properties of kenaf/PEMA/HDPE composites (ASTM D638) . . . . . . 127
5.3 Optimal configuration on Eurolab XL16 for kenaf/PEMA/HDPE composites . . 128
5.4 Samples used for extrusion trials . . . . . . . . . . . . . . . . . . . . . . . . . . . 133
5.5 Characteristics of kenaf KK60 alkaline treated fibres . . . . . . . . . . . . . . . . 135
5.6 Characteristics of kenaf KK60 water washed fibres . . . . . . . . . . . . . . . . . 136
5.7 Fibre dimension measurements . . . . . . . . . . . . . . . . . . . . . . . . . . . . 137
5.8 TGA data . . . . . . . . . . . . . . . . . . . . . . . . . . . . . . . . . . . . . . . 141
5.9 Screw configurations used in the design of experiment . . . . . . . . . . . . . . . 146
5.10 Factors and levels used in the design of experiment . . . . . . . . . . . . . . . . 148
xvii
List of Tables
5.11 L9 fractional factorial used for large scale compounding . . . . . . . . . . . . . . 148
5.12 Tensile properties of kenaf/MAPP/PP composites (ASTM D638) . . . . . . . . 150
5.13 Response table for means showing the relative influence on each factor on tensilemodulus . . . . . . . . . . . . . . . . . . . . . . . . . . . . . . . . . . . . . . . . 152
5.14 Response table for signal-to-noise ratios for tensile modulus . . . . . . . . . . . . 152
5.15 Response table for means showing the relative influence on each factor on tensilestrength . . . . . . . . . . . . . . . . . . . . . . . . . . . . . . . . . . . . . . . . 157
5.16 Response table for signal-to-noise ratios for tensile strength . . . . . . . . . . . . 157
5.17 Optimal extuder configuration to maximise tensile properties . . . . . . . . . . . 160
5.18 Effect of fibre treatment on tensile properties of kenaf/MAPP/PP extruded com-posites (ASTM D638) . . . . . . . . . . . . . . . . . . . . . . . . . . . . . . . . 160
5.19 Tensile properties obtained after injection moulding . . . . . . . . . . . . . . . . 163
5.20 Tensile properties obtained on industrial extrusion line with Duromer . . . . . . 167
5.21 Tensile properties obtained on industrial extrusion line with ETI . . . . . . . . . 168
xviii
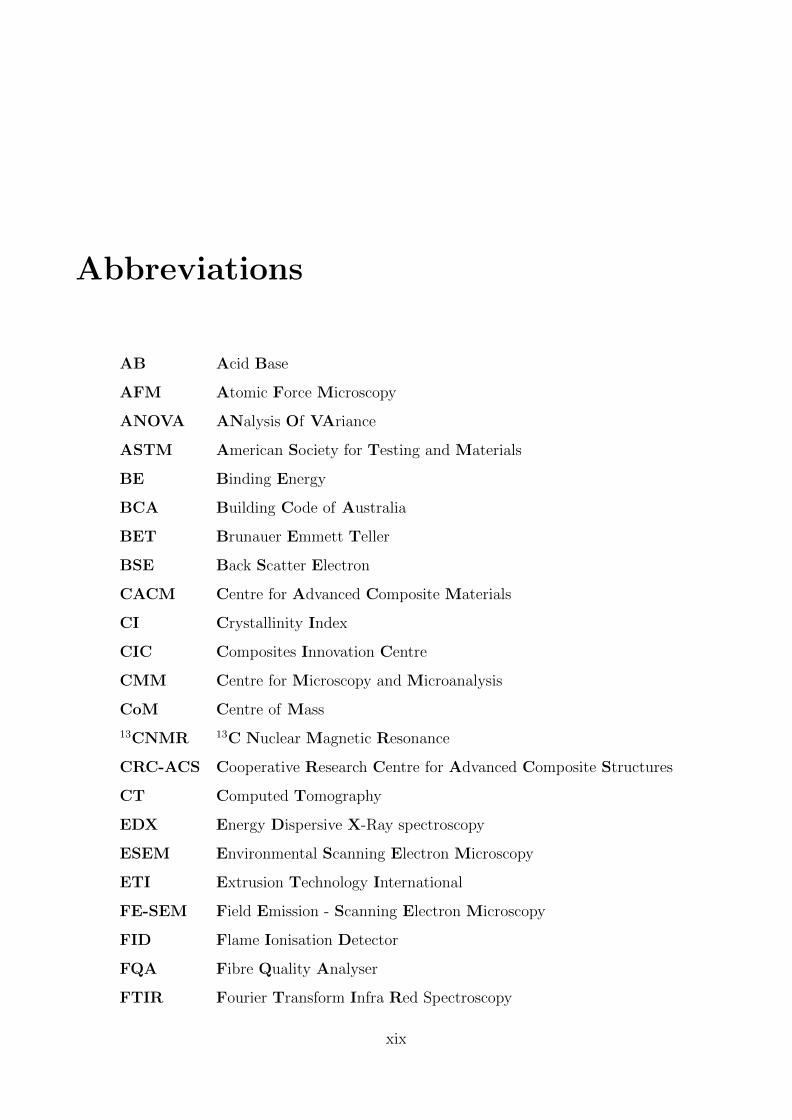
Abbreviations
AB Acid Base
AFM Atomic Force Microscopy
ANOVA ANalysis Of VAriance
ASTM American Society for Testing and Materials
BE Binding Energy
BCA Building Code of Australia
BET Brunauer Emmett Teller
BSE Back Scatter Electron
CACM Centre for Advanced Composite Materials
CI Crystallinity Index
CIC Composites Innovation Centre
CMM Centre for Microscopy and Microanalysis
CoM Centre of Mass
13CNMR 13C Nuclear Magnetic Resonance
CRC-ACS Cooperative Research Centre for Advanced Composite Structures
CT Computed Tomography
EDX Energy Dispersive X-Ray spectroscopy
ESEM Environmental Scanning Electron Microscopy
ETI Extrusion Technology International
FE-SEM Field Emission - Scanning Electron Microscopy
FID Flame Ionisation Detector
FQA Fibre Quality Analyser
FTIR Fourier Transform Infra Red Spectroscopy
xix

Abbreviations
FWHM Full Width Half Maximum
HDPE High Density PolyEthylene
IGC Inverse Gas Chromatography
KK60 Kohn Kaen 60
L/D Length to Diameter ratio
LW Lifshitz- Wand der Waals
MAPP Maleic Anhydride PolyPropylene
MFI Melt Flow Index
NFCs Natural Fibre Composites
NIST National Institute of Standards and Technology
O/C Oxygen to Carbon ratio
PE PolyEthylene
PEMA PolyEthylene Maleic Anhydride
PP PolyPropylene
PVC PolyVinyl Chloride
RH Relative Humidity
SE Surface Energy
SEA Surface Energy Analyser
SEI Secondary Electron Image
SEM Scanning Electron Microscopy
SFFT Single Fibre Tensile Testing
TGA Thermo Gravimetric Analysis
TTL Through The Lens
UED Upper Electron Detector
WPCs Wood Plastic Composites
XPS X-Ray Photoelectron Spectroscopy
XRD X-Ray Diffraction
xx

To my grandma Alice

Chapter 1
Introduction
1.1 Background & Motivations
Over the past few decades, considerable efforts have been made to develop alternatives to
synthetic polymer composites. Tightening of the environmental directives across the globe is
putting pressure on many industries to become more sustainable. At the same time, there is a
drive to create new markets for natural products and this has opened new fields of research. In
order to tackle such environmental issues and respond to an ever-increasing demand, natural
fibres, which by definition embody eco-friendly raw products, appear as potential candidates.
Plant fibre composites have been deemed potential substitutes for traditional materials as well
as replacements for other materials, in particular glass filled/reinforced plastics, Wood Plastic
Composites (WPCs) and timber. It is well established that some natural fibres possess inter-
esting physico-mechanical properties and, for instance, have an elastic modulus that compares
well to E-glass [Summerscales et al., 2010]. Their sustainability and high Young’s Modulus
per unit mass are the main advantages when compared to synthetic reinforcement elements
[Mohanty et al., 2001]. The combination of low cost, low carbon footprint and good tensile
properties makes plant fibres attractive as a reinforcement element in a plastic matrix for high
volume commodity products.
1
Chapter 1
WPCs have already gained significant share replacing timber as a building product. Due to
the large demand for timber, this resource is becoming increasingly sparse and expensive. In
many applications, plant fibre composites also have the potential to substitute timber. Plant
fibre biocomposites perform typically better than WPCs and yield (per area/per annum) is
higher for the common bast fibre producing plants [Grigoriou and Ntalos, 2001]. This makes
bast fibres attractive as replacement for wood fibres as fillers in commodity thermoplastics.
Despite many years of research, Natural Fibre Composites (NFCs) have not yet made it into
the market and research projects often stagger at up-scaling. Actual performance of NFCs
remains average compared to thermoplastics and sometimes underperform in tensile strength
[Sobczak et al., 2012]. Major issues persist along the value chain of NFCs, creating multiple
challenges for the industries involved and limiting the uptake of plant fibre composites. This is
due to the fact that the route to manufacture NFCs is complex and involves multiple variables
(see Figure 1.1).
Figure 1.1: Chart representing the route to short bast fibre biocomposites
Many factors influence the properties and quality of the fibres during crop production; the
choice of cultivar, the growth conditions and the harvesting period and technique. Post harvest
retting, fibre separation and fibre extraction are also critical stages that affect the fibres’ length
2
Chapter 1
and the fibres’ surface properties [Akin, 2012]. In addition, short natural fibre composites
are manufactured by direct processing or via compounding and processing. Each technique
involves specific processing variables that need to be adjusted for maximal product performance.
Between each stage, the transport and storage conditions can also affect the fibre quality. For
instance, moisture uptake and biodegradation are of major concern as natural fibres have high
hygrothermal sensitivity.
Too often, traceability during the fibre production, the fibre processing and the product man-
ufacturing is lacking or, when it exists, is insufficient. Consequently, systematic correlation
between the composite performance and the fibre properties is often not possible. In particu-
lar, many research studies have focused on process optimisation while working with fibres that
were poorly characterised; with little information on the fibre cultivar, the size distribution,the
degree of separation and on the surface properties. However, the performance of short fibre
reinforced composites strongly depends on the quality of the fibre/matrix interface, which in
turn is closely related to the fibre surface physico-chemical structure. This makes scale-up
to industrial production problematic. It seems necessary to bridge the gap between the fibre
producers and the product manufacturers so that one can relate the fibre processing effects
with the biocomposite properties to maximise the overall performance. Optimisation of the
compounding process for short fibre biocomposites and investigation of the feasibility of large
scale production should also be performed to launch short fibre biocomposites on the market.
1.2 Scope and Objectives
This PhD project was part of project P1.1 “Plant Fibre Biocomposites”of the Cooperative Re-
search Centre for Advanced Composite Structures (CRC-ACS). The overall aim of this project
was to develop technology for increased adoption of plant fibre biocomposites, to provide infor-
mation and guidelines to the Australian composites industry enabling them to increase usage
of sustainable composites, and to develop new composites based on thermoset, thermoplastic
and/or biopolymer matrices. The project consists of two major work packages. One work
package was focused on developing design guide lines for biocomposites, whilst work package
two was focused on the development of a thermoplastic short plant fibre composite. This PhD
3
Chapter 1
project forms an essential part of work package two. The objective of work package two was
defined in the CRC-ACS participant agreement as follows:
“Short fibre composite products, with fibres from plant sources, will be developed with an aim
of producing building products compliant (or compliant in the future) with the Building Code
of Australia (BCA). Short fibres from candidate bast fibres (a minimum of kenaf and hemp)
will be extracted using different physical and chemical methods, allowing the production of
reinforcing biofibre with maximised performance and competitive cost. Fibre lengths studied
will encompass short fibres (less than 5 mm) through to nanocellulose. Where a suitable method
is identified, extraction of plant product will be extended to the core to allow manufacture of
low-cost products. Candidate materials will undergo an optimised compounding process for
subsequent extrusion (optionally also for injection moulding and/or rotomoulding) to enable
maximised retained aspect ratio (above ten), optimised dispersion of reinforcing material, and
treatment system optimisation to enhance properties such as toughness, creep and elongation
to failure. Compounded materials will be manufactured by extrusion into structural shapes and
benchmarked against equivalent wood composites and manufactured products. Benchmarking
may include dry and wet mechanical properties, tensile, compression, flexural, impact and creep
properties. Demonstration of semi-structural or structural components will be undertaken, with
the aim of producing product compliant with the BCA.”
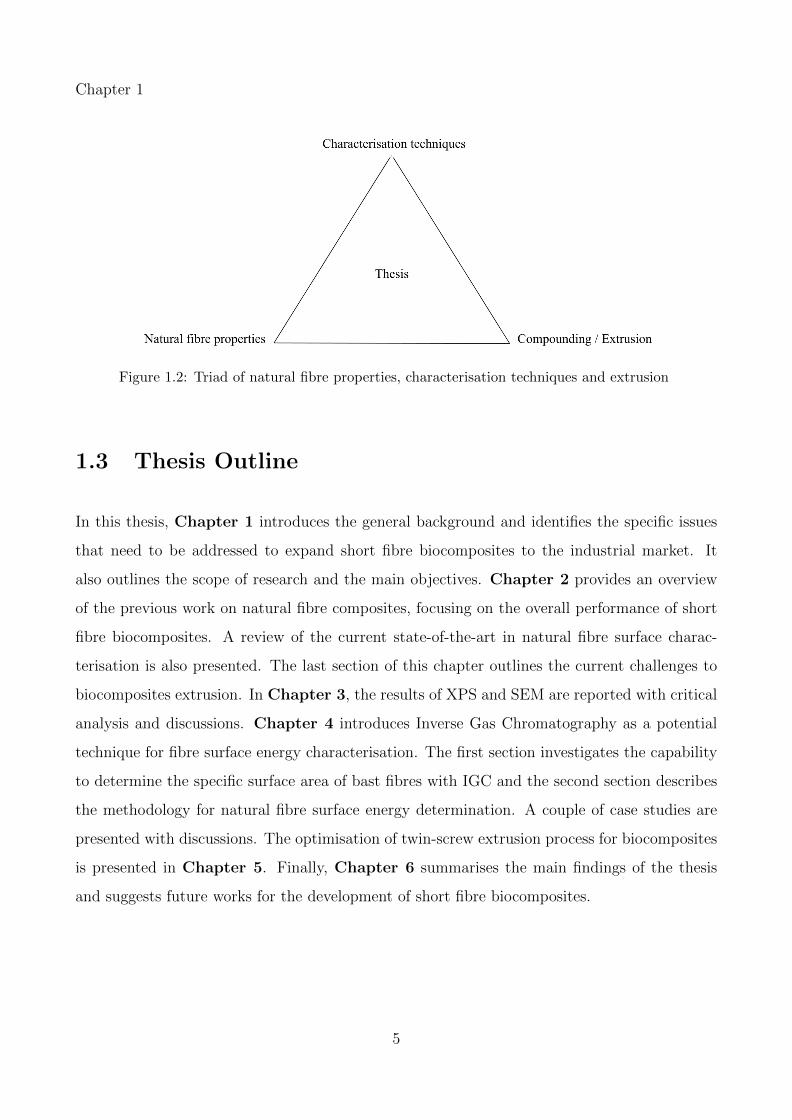
This thesis focused on key aspects of biocomposite development for industrial application that
is the triad of natural fibre properties, the techniques for natural fibre grading and the extrusion
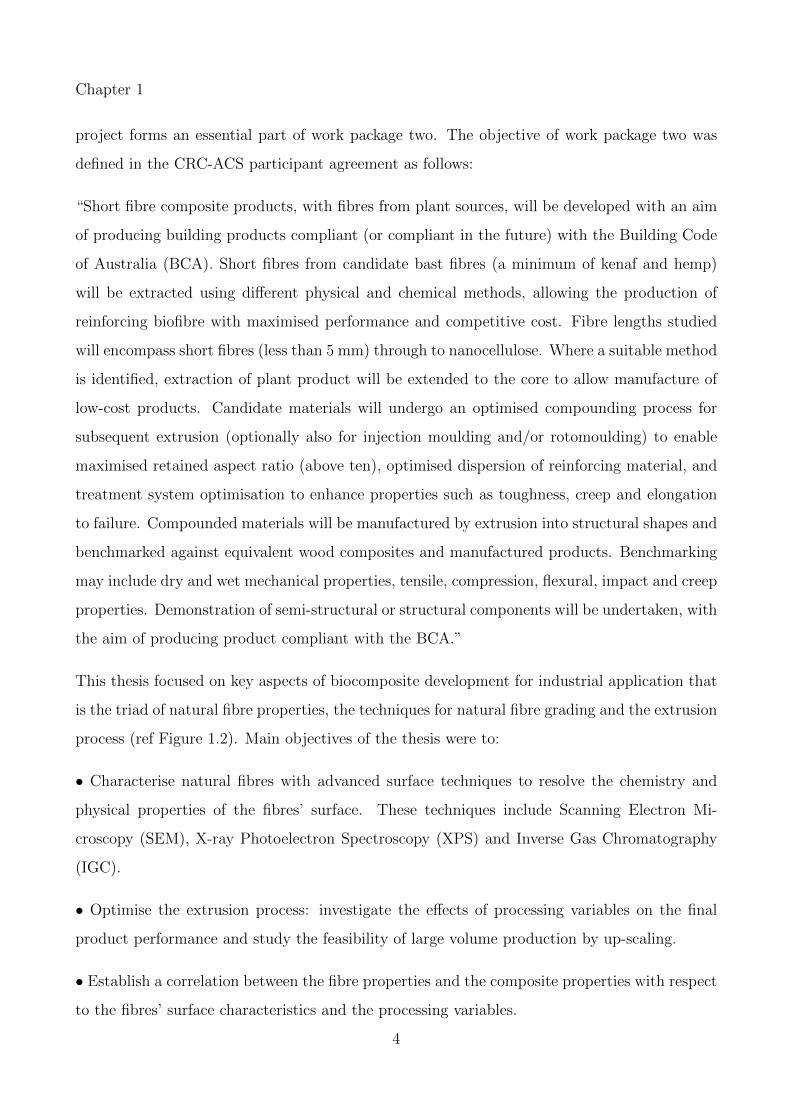
process (ref Figure 1.2). Main objectives of the thesis were to:
• Characterise natural fibres with advanced surface techniques to resolve the chemistry and
physical properties of the fibres’ surface. These techniques include Scanning Electron Mi-
croscopy (SEM), X-ray Photoelectron Spectroscopy (XPS) and Inverse Gas Chromatography
(IGC).
• Optimise the extrusion process: investigate the effects of processing variables on the final
product performance and study the feasibility of large volume production by up-scaling.
• Establish a correlation between the fibre properties and the composite properties with respect
to the fibres’ surface characteristics and the processing variables.
4
Chapter 1
Figure 1.2: Triad of natural fibre properties, characterisation techniques and extrusion
1.3 Thesis Outline
In this thesis, Chapter 1 introduces the general background and identifies the specific issues
that need to be addressed to expand short fibre biocomposites to the industrial market. It
also outlines the scope of research and the main objectives. Chapter 2 provides an overview
of the previous work on natural fibre composites, focusing on the overall performance of short
fibre biocomposites. A review of the current state-of-the-art in natural fibre surface charac-
terisation is also presented. The last section of this chapter outlines the current challenges to
biocomposites extrusion. In Chapter 3, the results of XPS and SEM are reported with critical
analysis and discussions. Chapter 4 introduces Inverse Gas Chromatography as a potential
technique for fibre surface energy characterisation. The first section investigates the capability
to determine the specific surface area of bast fibres with IGC and the second section describes
the methodology for natural fibre surface energy determination. A couple of case studies are
presented with discussions. The optimisation of twin-screw extrusion process for biocomposites
is presented in Chapter 5. Finally, Chapter 6 summarises the main findings of the thesis
and suggests future works for the development of short fibre biocomposites.
5


Chapter 2
Literature Review
2.1 Natural Fibre Composites: general background
Natural fibre composites is a broad and rapidly developing area of materials science. Several
publications provide a complete histology of natural fibres and their applications. Bledzki
and Gassan [1999] provided a state of the art review on natural fibre composite research and
development until the late 90s. Faruk et al. [2012] produced later an updated review on the latest
progresses from 2000 till 2010. Both manuscripts provide a clear and concise understanding
of what natural fibre reinforced composites are made of, how they are manufactured and how
they perform. The aim of this section is to give a general overview and to introduce short fibre
biocomposites which is the main theme of this work.
2.1.1 Natural fibres and biocomposites
The denomination “Natural Fibre Composite”(NFC) relates to any material that contains one
type of biofibre (or more) and a matrix component. The commonly accepted hierarchy in
the field of NFCs begins with “bio-based composites”at the top, beneath this biocomposites
(also called eco-composites) refer to any material containing a “bio”component and composites
that are fully “bio”are usually categorised as “green composites”[Mohanty et al., 2005]. The
following discussion focuses on composites reinforced with plant fibres.
6
Chapter 2
Natural fibres refer to vegetal fibres, fibres produced from biomass, mineral fibres and animal
fibres. Plant fibres are extracted from plants grown specifically (primary plants) or for other
purpose (secondary plants). In the latter case, the fibres are usually a by-product and sometimes
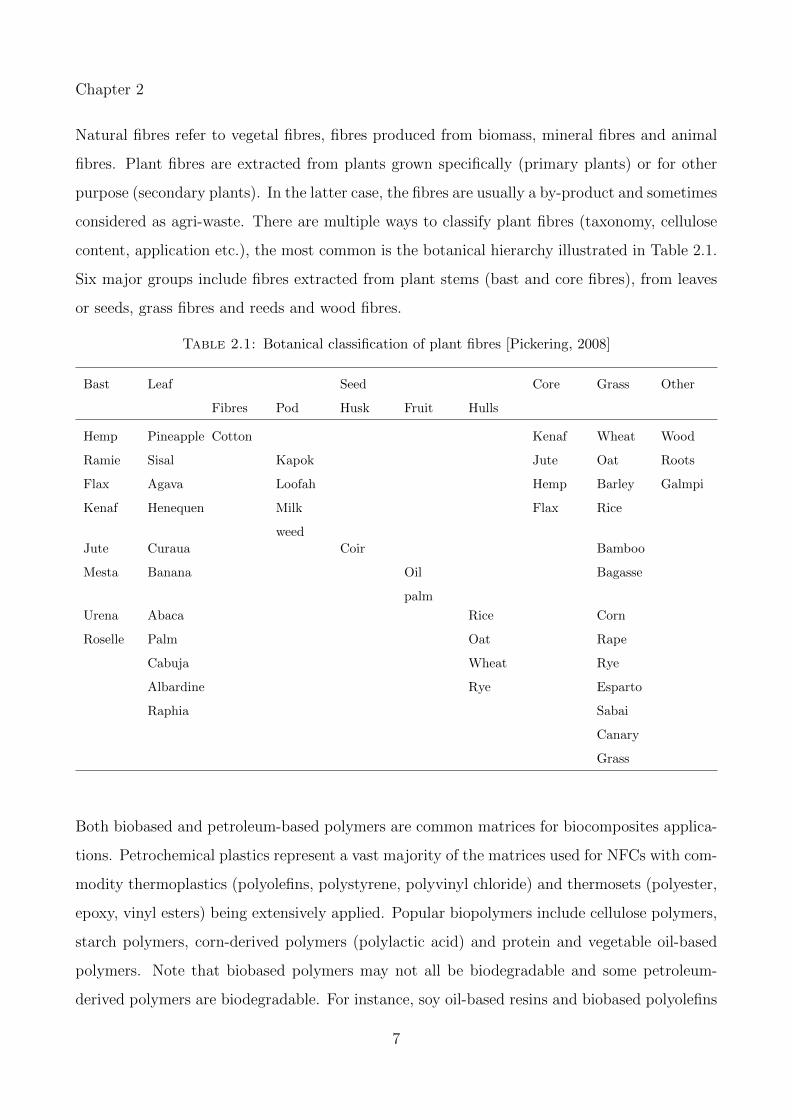
considered as agri-waste. There are multiple ways to classify plant fibres (taxonomy, cellulose
content, application etc.), the most common is the botanical hierarchy illustrated in Table 2.1.
Six major groups include fibres extracted from plant stems (bast and core fibres), from leaves
or seeds, grass fibres and reeds and wood fibres.
Table 2.1: Botanical classification of plant fibres [Pickering, 2008]
Bast Leaf Seed Core Grass Other
Fibres Pod Husk Fruit Hulls
Hemp Pineapple Cotton Kenaf Wheat Wood
Ramie Sisal Kapok Jute Oat Roots
Flax Agava Loofah Hemp Barley Galmpi
Kenaf Henequen Milk
weed
Flax Rice
Jute Curaua Coir Bamboo
Mesta Banana Oil
palm
Bagasse
Urena Abaca Rice Corn
Roselle Palm Oat Rape
Cabuja Wheat Rye
Albardine Rye Esparto
Raphia Sabai
Canary
Grass
Both biobased and petroleum-based polymers are common matrices for biocomposites applica-
tions. Petrochemical plastics represent a vast majority of the matrices used for NFCs with com-
modity thermoplastics (polyolefins, polystyrene, polyvinyl chloride) and thermosets (polyester,
epoxy, vinyl esters) being extensively applied. Popular biopolymers include cellulose polymers,
starch polymers, corn-derived polymers (polylactic acid) and protein and vegetable oil-based
polymers. Note that biobased polymers may not all be biodegradable and some petroleum-
derived polymers are biodegradable. For instance, soy oil-based resins and biobased polyolefins
7

Chapter 2
are non biodegradable polymers. Poly(ε-caprolactone) and aliphatic polyesters are common
examples of petrochemical biodegradable polymers. The ISO definition states that a biodegrad-
able plastic may be defined as a compound that undergoes “a significant change in its chemical
structure under specific environmental conditions resulting in a loss of some properties that
may vary as measured by standard test methods appropriate to the plastic and the application
in a period of time that determines its classification. The change in the chemical structure
results from the action of naturally occurring microorganisms.”[Muller, 2005]. Biodegradabil-
ity depends on the compound chemical structure and the environment. Some biocomposites
may be 100% biobased (in that case they are called green biocomposites) and partially or
completely biodegradable. For instance, Wood/PLA compounds are green composites com-
pletely biodegradable whilst products made of flax fibres embedded in biobased polyethylene
are partially biodegradable only. Satyanarayana et al. [2009] published an extended review that
provides a clear insight on biodegradable composites based on lignocellulosic fibres.
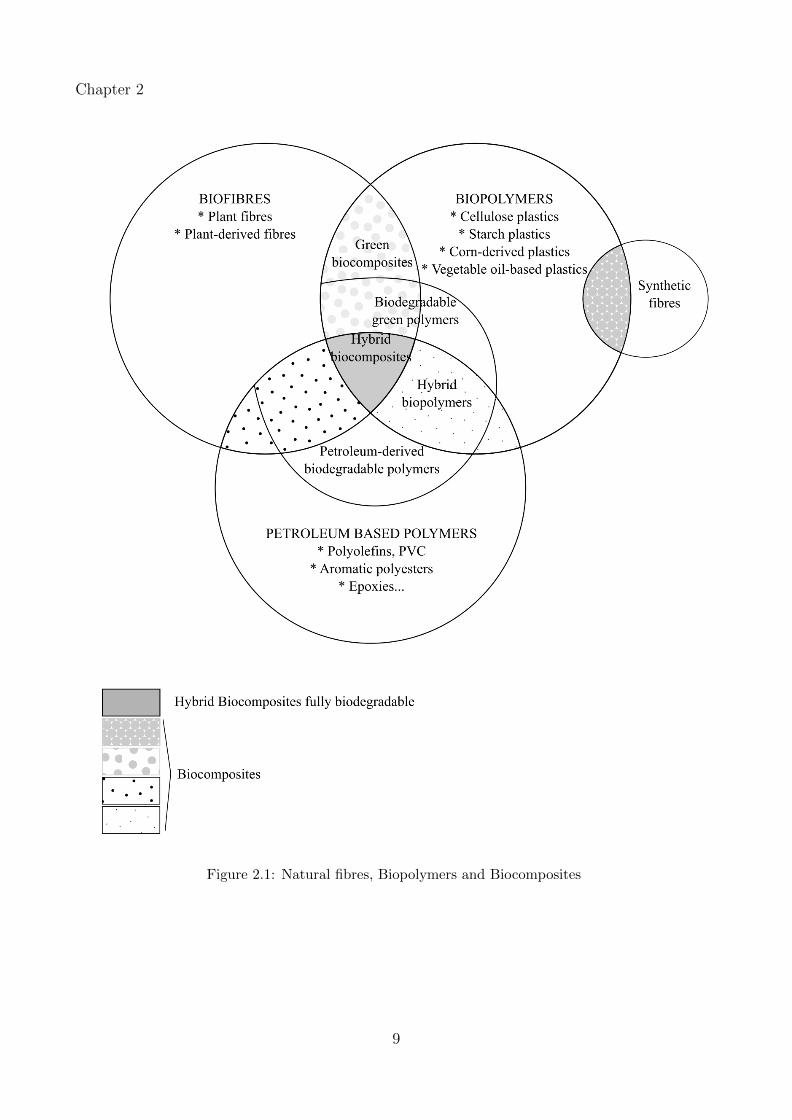
Finally, hybrid biocomposites combine biofibres with a polymer matrix. The latter can be
biobased, petroleum-derived or a blend of both. Combinations of biobased and petrochemical
polymers have been of particular interest as they offer interesting cost-performance proper-
ties and provide a compromise between fully fossil-based plastic matrices and 100% biobased
materials, for instance by limiting the moisture absorption or increasing the impact strength
[Mohanty et al., 2005]. Hybrid biocomposites may be the way to foster the implementation of
NFCs in industrial applications. An overview of the NFC types and their related compounds
is shown in Figure 2.1.
8
Chapter 2
Figure 2.1: Natural fibres, Biopolymers and Biocomposites
9
Chapter 2
2.1.2 Performance & properties
2.1.2.1 Natural fibre properties
Plant fibres, contrary to synthetic fibres, do not have standardised properties but rather their
properties spread over a large range. The mechanical properties of plant fibres depend on the
species, the growth conditions, time of harvest and the fibre location in the stem [Ayre et al.,
2009, Charlet et al., 2007, Duval et al., 2011, Mediavilla et al., 2001, Satyanarayana et al.,
2007]. Natural fibre mechanical properties also depend on the retting process [Akin et al., 2001,
Paridah et al., 2011, Stuart et al., 2006] and the extraction and separation techniques [Dupeyre
et al., 1998]. These processes also likely induce potential damage to the fibres [Hanninen et al.,
2012]. Finally, testing procedures are another source of discrepancy in the data [Mukherjee and
Satyanarayana, 1986]. For instance, the tensile performances vary with the specimen length as
the probability of sampling defects increases with increasing fibre length [Defoirdt et al., 2010,
Fidelis et al., 2013, Virk et al., 2009]. All the parameters mentioned above explain why values
published in literature vary to a considerable extent. An attempt to provide typical specific
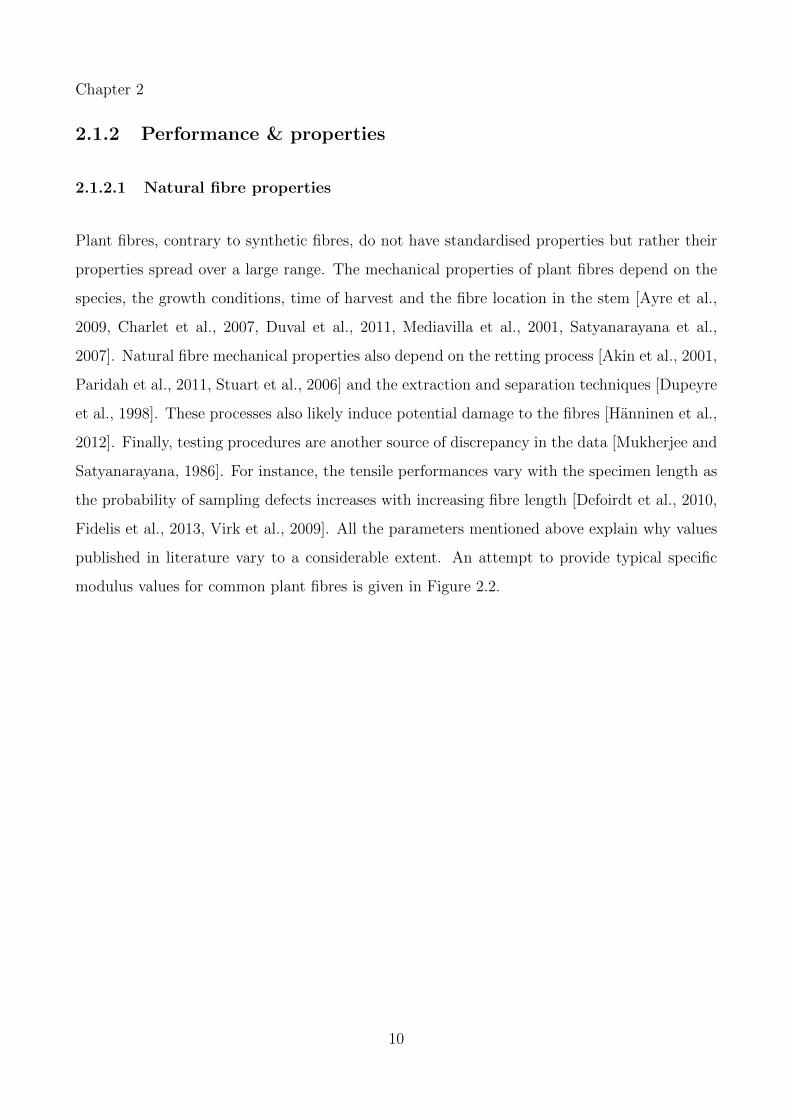
modulus values for common plant fibres is given in Figure 2.2.
10
Chapter 2
Figure 2.2: Ranges of specific Youngs’ Modulus values for natural fibres and glass fibres[Dittenber and GangaRao, 2012]
2.1.2.2 NFCs properties
A majority of studies on NFC performances focus on the tensile properties whilst impact, shear,
compression and flexural responses are less frequently investigated [Anderson, 2008, Arbelaiz
et al., 2005, Herrera-Franco and Valadez-Gonzalez, 2005, Thumm and Dickson, 2013]. This
section gives an overview of the tensile and impact properties one can expect from short plant
fibre reinforced thermoplastics.
Tensile behaviour Introduction of short fibres in thermoplastic matrix increases the stiff-
ness due to the fibre’s high elastic moduli. However, composite failure is usually more brittle
compared to the neat polymer and tensile strength tends to be similar or slightly reduced. Lower
strain at break and reduced strength are due to the composite microstructure and is directly
related to the constituents, the composition and manufacturing process. For instance, voids,
weak interfacial interactions and poor fibre dispersion act as defects and stress concentration
11
Chapter 2
points that induce failure. Under tensile load, composites with efficient stress transfer show
higher strength, higher stiffness and lower strain at break than those with a weak interface.
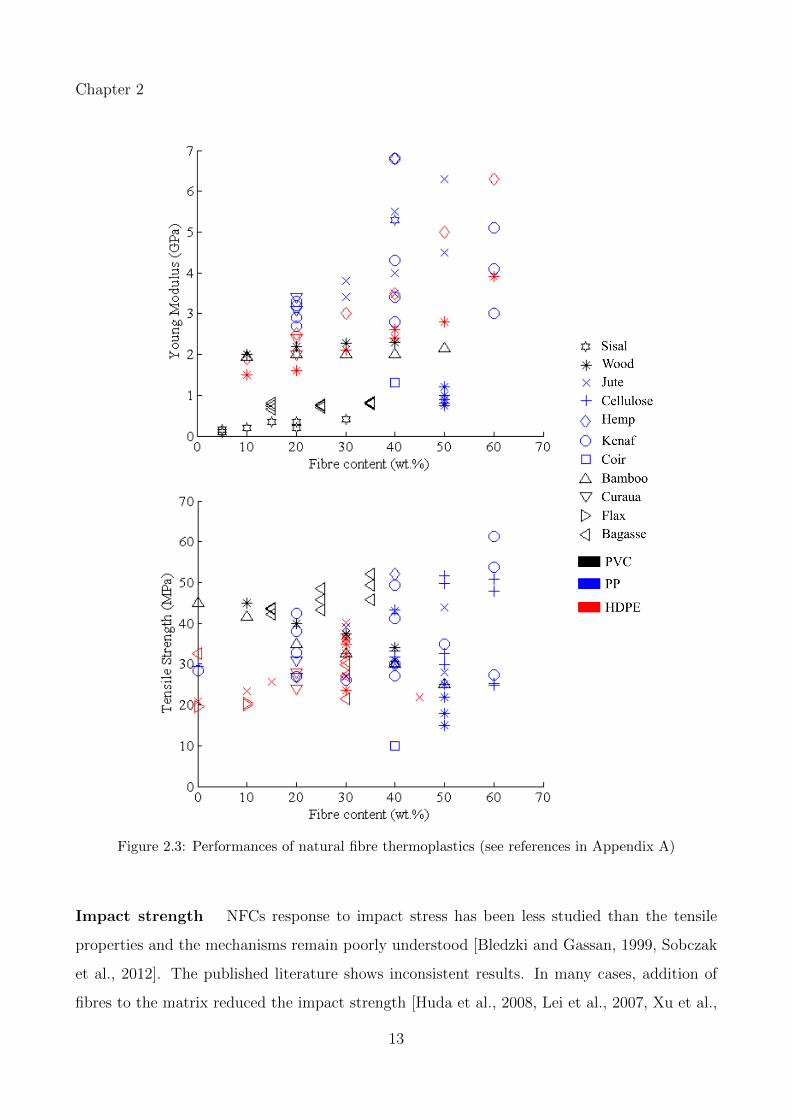
A review of the literature on tensile performance of short fibre thermoplastic biocomposites
is given in Figure 2.3. As shown in the graphs, there is an approximately linear increase in
stiffness with increasing fibre content till ca. 40 wt.%. Adding more than 40 wt.% fibre is less
efficient and the performance seems to reach a plateau. Efficient and homogeneous dispersion
is indeed difficult to achieve at higher fibre load and fibre agglomerates become potential stress
concentration zones. The data scattering in Figure 2.3 also reflects how the coupling agent,
the manufacturing process and the fibre treatment affect the biocomposite stiffness. Tensile
strength is much more difficult to improve and in many cases the performance equal the matrix
performance, or in some cases degrades the matrix performance (Figure 2.3).
12
Chapter 2
Figure 2.3: Performances of natural fibre thermoplastics (see references in Appendix A)
Impact strength NFCs response to impact stress has been less studied than the tensile
properties and the mechanisms remain poorly understood [Bledzki and Gassan, 1999, Sobczak
et al., 2012]. The published literature shows inconsistent results. In many cases, addition of
fibres to the matrix reduced the impact strength [Huda et al., 2008, Lei et al., 2007, Xu et al.,
13
Chapter 2
2008, Zheng et al., 2007] but some authors reported an improvement in impact properties
[Karnani et al., 1997, Rahman et al., 2010]. The fibre type also influence the impact properties
[Pavithran et al., 1987].
From a micromechanics point of view, adding short fibres to the polymer induces specific failure
modes, namely fibre-matrix interface failure, fibre fracture and fibre pull-out. These can increase
the energy dissipation but the deformation mechanisms and strain at break strongly depend on
the quality of the interface. Fibre load and fibre length are also critical [Bengtsson et al., 2007,
Rana et al., 2003]. Impact strength usually increases with fibre load till a threshold where good
dispersion may be difficult to achieve and fibre agglomerates become potential defects [Mohanty
et al., 2006, Thwe and Liao, 2003]. Impact strength increases with increasing fibre length but
the evolution profile closely depends on the interfacial shear strength and the critical fibre
length (this will be detailed in the next paragraph). Note that fibre length may also affect the
dispersion of the fibres in the matrix hence its influence is difficult to quantify. Efficient coupling
agents that strengthen the interface also tend to improve the impact properties [Bledzki and
Gassan, 1999, Mohanty et al., 2004]. Finally, NFCs have lower impact strength than Glass
Fibre Reinforced Plastics (GFRPs) because natural fibre tensile strengths fall below those of
glass fibres and hence fibre fracture occurs earlier i.e. at lower strain [Sobczak et al., 2012,
Wambua et al., 2003].
Main factors for biocomposite performance Like in traditional short fibre composites,
the compound mechanical properties depends on multiple variables. Fibre length is a major
criteria for mechanical properties. The concept of critical fibre length established by Cox [1952]
and Kelly and Tyson [1965] is well accepted for short synthetic fibre reinforced polymers. The
authors modelled the micromechanics of short fibre composites with a shear-lag mechanism and
defined the minimum fibre length required for the fibres to carry maximal shear stresses so that
the composite fails by fibre fracture rather than by shear failure at the interface [Bowyer and
Bader, 1972]. The critical fibre length lc is defined as:
lc =σfdf2τm
(2.1)
14
Chapter 2
with σf the tensile strength of the fibre, df the fibre diameter and τm the shear strength of the
interface, which is usually considered as the matrix shear strength. Equation 2.1 also shows how
the fibre aspect ratio and the fibre/matrix adhesion limit the reinforcement effect; low aspect
ratios or poor adhesion restrict the fibre reinforcement for any given length. On the other
hand, for a given [fibre, matrix] system with fixed aspect ratio and interface shear strength,
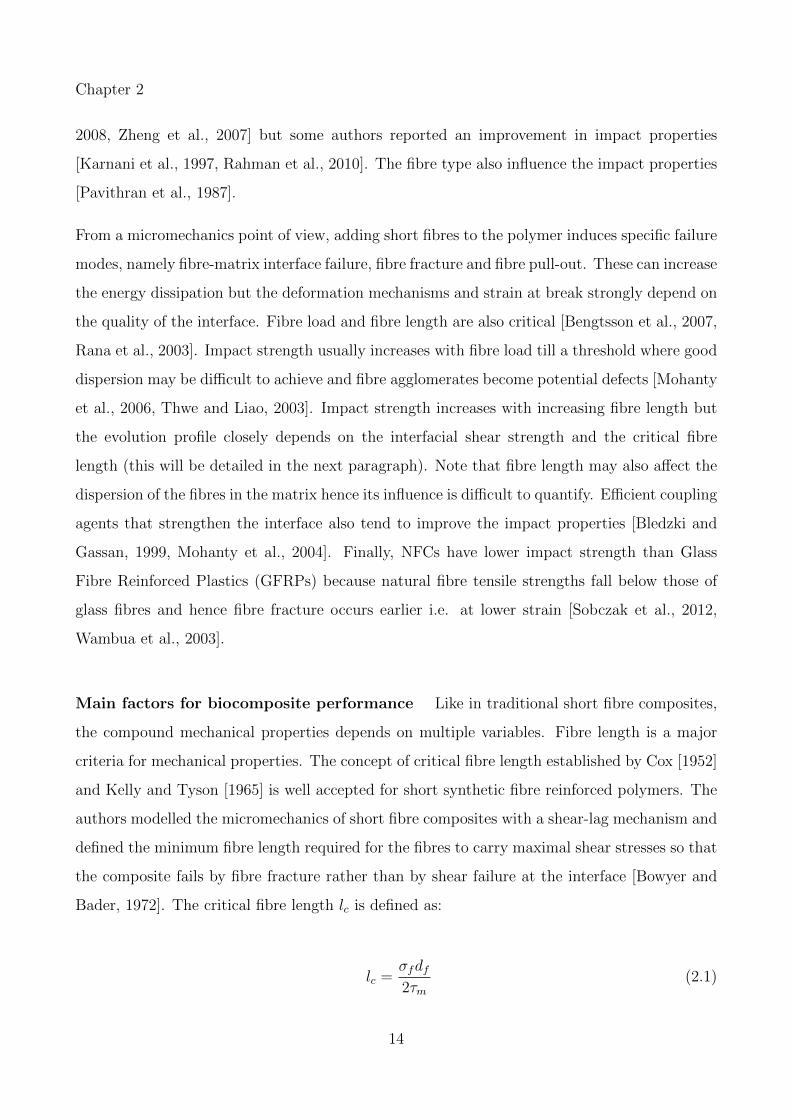
increasing fibre length results in better properties (Figure 2.4). Figure 5 also highlights how the
composite stiffness is readily improved even with very short fibres (<0.5 mm) compared with
tensile strength and toughness. This is because stiffness mainly relies on strain transfer between
the fibres and the matrix. Stiffness is measured in the elastic behaviour of the composite and
is barely sensitive to the ultimate tensile strength of each component.
Figure 2.4: Prediction of tensile and impact performance with respect to fibre length for fibrereinforced thermoplastic composites (adapted from Thomason and Vlug [1996])
However, the model of critical fibre length assumes a perfect interface (i.e. full stress transfer
from the matrix to the fibres) and elastic behaviour, which might not be realistic for natural
fibre composites. Given the complexity of the fibre/matrix interface, the variability in the fibre
dimension and the large range of properties, estimation of a single critical length for natural
15

Chapter 2
fibre composites is questionable. One can have the ideal [fibre, matrix] components but the
composite properties will not reach high performance unless the interface is efficient.
Fibre content and fibre orientation are also main factors for biocomposite performance. Optimal
condition is when the fibres are oriented along the load direction while increasing angles reduce
the transferred load. Actually, most of the short fibre reinforced thermoplastics have 2D or 3D
randomly oriented fibres and therefore fibre orientation is usually not considered as a variable
one can control. Fibre content is much easier to control and largely affects the overall mechanical
properties (Figure 2.4, Figure 2.3). Theoretically, the higher the fibre content the better the
reinforcement but actual performance is limited by the manufacturing process. Natural fibres
are indeed more challenging to process than traditional synthetic fibres and it is difficult to
achieve homogeneous dispersion at high fibre load. This will be discussed later in the chapter.
Finally, long term performance and durability are crucial for NFCs and constitute the major
concerns for their applications. Exposure to humidity, temperature and weathering (UV ra-
diation) reduce the product performance [Espert et al., 2004, Pickering, 2008]. Natural fibres
degrade easily under environmental conditions, which is an advantage for material disposal but
also a challenge for the compound durability. UV-absorber, anti-fungi and other additives are
usually introduced during the manufacturing process to slow down the degradation mechanisms
and better control the degradation rate over the product lifetime [Kamdem et al., 2004, Xie
et al., 2010].
16

Chapter 2
2.2 Natural Fibre Characterisation
This section reviews firstly the complexity of natural fibre structure and surface properties.
The second part discusses the challenges to characterise the surface of bast fibres with tradi-
tional techniques. The third part introduces Inverse Gas Chromatography as a novel promising
technique.
2.2.1 Surface properties
2.2.1.1 Natural fibre structure
Figure 2.5: Structural hierarchy in kenaf plant (modified from Khalil et al. [2013] and Baillie[2004])
17
Chapter 2
Note nomenclature: a single fibre is frequently called macrofibril, cell wall or technical fibre.
The cellulose fibril is also called microfibril or elementary fibre. For the sake of clarity, the
terms single fibre and cellulose fibril are used in the document.
Plants exhibit a multiscale hierarchical structure that reflects the outstanding complexity of
nature (Figure 2.5). Bast fibres are located in the outer layer of the plant stem, between the bark
(cuticle/epidermis and bark parenchyma cells) and the phloem (see illustration in Gorshkova
et al. [2000]). Bast fibres represent ca. 30-40% of the stem. In that area, single fibres gather in
bundles of variable sizes depending on the plant variety and its maturity (typically 50-100 µm
in kenaf stem and 100-300 µm in flax). A single fibre, so called bast fibre, has a complex 3D
microstructure with three membranes enclosing the lumen: the primary cell wall, the secondary
cell wall (S1, S2 and S3) and the plasma membrane. Each membrane consists of cellulose fibrils
embedded into a matrix of hemicellulose and lignin and also contains pectins, proteins, waxes
and other extractives. The chemical composition and the molecular arrangement vary between
the layers and fluctuate with the fibre location in the plant stem. For instance, the density of
cellulose crystals and the chain orientation vary within the different layers. The primary wall
contains fibrils dispersed with no proper orientation whilst in the secondary wall the cellulose
chains gather into bundles that follow to a certain degree the fibre axis. The arrangement in the
latter makes it more dense than in the other layers. The tertiary wall has the lowest content of
cellulose and poor chain orientation [O’Sullivan, 1997]. The average composition for common
bast fibres is given in Table 2.2.
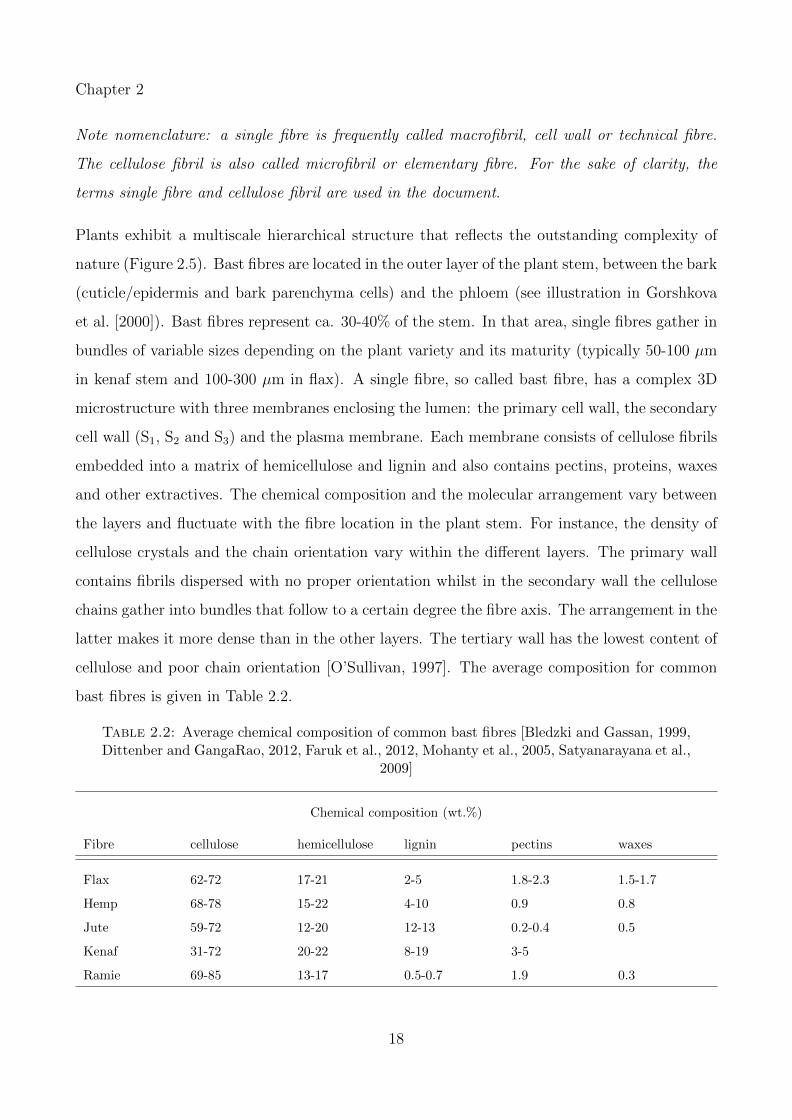
Table 2.2: Average chemical composition of common bast fibres [Bledzki and Gassan, 1999,Dittenber and GangaRao, 2012, Faruk et al., 2012, Mohanty et al., 2005, Satyanarayana et al.,
2009]
Chemical composition (wt.%)
Fibre cellulose hemicellulose lignin pectins waxes
Flax 62-72 17-21 2-5 1.8-2.3 1.5-1.7
Hemp 68-78 15-22 4-10 0.9 0.8
Jute 59-72 12-20 12-13 0.2-0.4 0.5
Kenaf 31-72 20-22 8-19 3-5
Ramie 69-85 13-17 0.5-0.7 1.9 0.3
18
Chapter 2
2.2.1.2 Natural fibre surface properties
The type of cellulose, the cellulose content, the orientation of the cellulose fibrils in the cell
walls (microfibril angle) and the crystallinity determine the mechanical properties [Baley, 2002,
Bledzki and Gassan, 1999]. On the other hand, the capability to form a strong interface with
polymer matrices closely depends on the surface chemistry. Natural fibres as an entity absorb
water and contain numerous hydrophilic components (cellulose, hemicellulose), which raises two
major issues. First, the fibres have high moisture uptake that compromises their dimensional
stability (swelling) and increases the risk of degradation. It also challenges the biocomposite
stability and long term performances. Secondly, the polarity of the polymers on the surface
of natural fibres can produce severe incompatibility with non-polar matrices. Fibre wetting is
therefore difficult to achieve. This inherent incompatibility should be overcome to get a strong
interface in the compound.
Note that the concept and the definition of surface for natural fibres is complex because the na-
ture of the surface depends on which “layer”is exposed, which in turn depends on the extraction
process and the post-processing steps, since these affect different levels of the fibre structure
[Le Duigou et al., 2012, Zafeiropoulos et al., 2002]. Depending on the surface exposed, natural
fibres may be more or less hydrophilic and more or less polar.
Common approaches to enhance the fibre/matrix interface involve fibre surface modification (via
chemical treatment, physical modification or grafting), use of coupling agents (fibre or matrix)
or use of compatibilisers. Bledzki et al. [1996], George et al. [2001], Keener et al. [2004], Li
et al. [2007] and John and Anandjiwala [2008] successively published reviews on the common
treatments applied to bast fibres. These documents describe the mechanisms and summarise
the main effects associated with the treatments. Actually, many studies showed sparse and
inconsistent results. No clear trends could be established so far on the effects of these surface
modification methods, but rather a general state of confusion and recurrent contradictions exist.
There are various explanations for these contradictions:
• Samples differ by their origin and processing history hence it is difficult to establish direct
comparison and cross-correlation between studies. For instance, treatment may be applied to
19
Chapter 2
the fibres before the final processing stage and therefore loses efficiency due to separation of
the bundles.
• Poor information on the fibre samples challenges data interpretation. Too often, an assump-
tion is made on the fibre specimen history. For example, in comparing flax samples, retted
and non retted, the latter fibre surface likely contains epidermal tissues. The nature of these
samples is quite different so a direct comparison would be inappropriate. As mentioned earlier,
this is more a problem of communication and a lack of traceability rather than a scientific issue.
• The methods used to analyse natural fibre surfaces. Characterisation of natural fibre surface
is complex because of the numerous components present on the surface. Appropriate methods
and strategy should be used to investigate these materials. This will be discussed in the next
section.
2.2.1.3 Surface characterisation techniques
Scanning Electron Microscopy (SEM) has been widely used to analyse natural fibre surface
topography and particularly to compare fibres before and after treatment [Baley et al., 2006,
Bismarck et al., 2001, Edeerozey et al., 2007, Sreekala et al., 2000]. A typical series of SEM
images is shown in Figure 2.6. The SEM micrographs reveal distinct topographies between
the treated fibres, which highlight the different effects of fibre treatment on the sisal fibres’
surface. Environmental Scanning Electron Microscopy (ESEM) is another type of SEM that
allows imaging of fibres in their natural state without being dehydrated (no vaccuum, no sample
coating) [Donald, 2003]. This technique has a potential interest to study natural fibres but few
works have been published so far [Liu et al., 2004, Lu et al., 2008]. A novel generation of
SEM (field emission SEM) is being developed that achieves good resolution at low acceleration
voltages thanks to a specific “in-lens”detector configuration [Liu, 2000]. This technique allows
imaging of the very near fibre surface (ca. tens of nanometers) and contrast mapping at low
atomic number [Rasch et al., 2014, Truss et al., 2015, Trygg and Fardim, 2011].
20
Chapter 2
Figure 2.6: SEM images of raw sisal fibre (A) and sisal fibres after various chemical treatments:immersion in resorcinol/hexamethylenetetramine aqueous solution (B), mercerisation (C) andmercerisation followed by immersion in resorcinol/hexamethylenetetramine aqueous solution
(D) (modified from Martins et al. [2006])
Atomic Force Microscopy (AFM) has been used to a lesser extent to evaluate the fibre surface
roughness [Gustafsson et al., 2003, Koljonen et al., 2003, Le Duigou et al., 2012]. AFM provides
3D topography and has higher resolution than SEM (typically <1 nm and 10 nm respectively)
but a much smaller analysis window (ca. factor 100). SEM is usually preferred to visualise
various fibres at a time. AFM is also more complicated to operate than SEM, is a sensitive
technique but time consuming. On the other hand, AFM allows force mapping (elastic forces,
adhesion forces) but few works have been published on these applications for natural fibres
[Guhados et al., 2005, Le Troedec et al., 2011].
Fourier Transform Infrared Spectroscopy (FTIR) and X-ray Photoelectron Spectroscopy (XPS)
are commonly applied to characterise natural fibre surfaces [Felix and Gatenholm, 1991, Sgriccia
et al., 2008, Tserki et al., 2005, Valadez-Gonzalez et al., 1999]. FTIR gives semi-quantitative
information of the chemical groups present on the fibre surface (the absorbance spectra are
compared to a reference spectrum), is easy to operate and it is also relatively straightforward
21
Chapter 2
to interpret data. After many years of research, the absorption bands of the main components
(cellulose, hemicellulose, lignins) have been identified and reference data are available [Moran
et al., 2008, Nelson and O’Connor, 1964b, Oh et al., 2005b, Yang et al., 2007]. XPS provides
quantitative information of the very near surface composition (first 10 nm) based on the anal-
ysis of peak shifts in the binding energy spectra. Wood pulp and cellulose fibres have been
extensively studied [Andresen et al., 2006, Dorris and Gray, 1978a, Johansson, 2002, Johansson
and Campbell, 2004, Johansson et al., 1999]. However, data analysis is challenging for complex
surfaces typical of natural fibres. The accuracy of peak fitting and identification of chemical
groups have been discussed by multiple authors [Artyushkova, 2010, Johansson et al., 2004,
McIntyre et al., 1981].
Average chemical composition of natural fibres has also been studied by Carbon-13 Nuclear
Magnetic Resonance (13CNMR) and particularly the identification of aromatic compounds in
lignins [Froass et al., 1998, Martınez et al., 2008, Seca et al., 1998]. 13CNMR is a powerful tech-
nique to decipher the chemistry of natural fibres but it reflects the overall chemical composition
rather than the surface chemistry (samples are dissolved in solution). Data interpretation also
remains difficult due to the complexity of the technique [Mansfield et al., 2012].
Finally, characterisation of the crystalline structure and estimation of the degree of crystallinity
of cellulose fibrils in plants have been performed with X-Ray Diffraction (XRD), Fourier Trans-
form Raman Spectroscopy, FTIR and 13CNMR [He et al., 2007, Nelson and O’Connor, 1964a,
Newman and Hemmingson, 1990, Oh et al., 2005a, Zuluaga et al., 2009]. XRD is usually
preferred because it is more direct than the other techniques and it provides quantitative in-
formation (calculation of the Crystallinity Index (CI)) but data interpretation remains difficult
[Park et al., 2010].
Each of the techniques aforementioned has its own specific variables: analysis depth, sensitivity
and sampling area. The concept of “surface”is therefore relative to the method chosen for
characterisation. For fibre grading at large scale, other criteria should also be considered when
selecting a characterisation technique such as the resources necessary to run an experiment
(time, funds, personnel, consumables) and the complexity to run and interpret experimental
data. The latter depends on whether the technique is well established for natural fibres and if
22
Chapter 2
consistent databases are available. A comparison of the techniques reviewed in this section is
given in Table 2.3.
2.2.1.4 IGC: a novel technique to characterise natural fibre surfaces
The fibre surface chemistry, its adsorption capacity as well as its wettability and dispersability
in a matrix correlate with the fibre surface energy values and depend also on the accessible
surface area. The surface energy is directly related to the thermodynamic work of adhesion.
The surface energy provides information on the intermolecular forces that can occur at the fibre
surface. These combine long range Van der Waals forces and short range chemical forces, also
known as dispersive and polar forces respectively. The nature of these interactions and their
intensity also depend on the accessible surface area.
Traditional methods used to determine the fibre surface energy involve the measurement of
contact angles. Various approaches reviewed by Williams [2015] and Heng et al. [2007] provide
methods for measuring droplet angles to calculate the fibre surface tension. The most common
are the Young model, the Fowkes and extended Fowkes (Owens & Wendt) approaches and the
Van Oss et al. model. Capillary rise, Wilhelmy plate and sessile drop are common methods and
numerous studies have been published on natural fibres [Collins, 1947, Rong et al., 2002, Shen
et al., 2004]. Although these techniques are excellent on flat surfaces, natural fibre’s porous
structure and heterogeneous surface properties challenge the accuracy and the validity of the
experimental data [Pietak et al., 2007]. These methods are based on liquid-solid interactions
where swelling and dissolution may occur and skew the data.
Inverse Gas Chromatography (IGC) is an alternative tool to study surface energies. Briefly, the
gas probe molecules are transported by the carrier gas and injected into the chromatography
column containing the sample at defined conditions of pressure and temperature. Adsorption
followed by desorption occur at the sample surface and an elution peak results (Figure 2.7).
The study of the thermodynamic quantities from sorption equilibrium enables to determine
the surface energy components of the material under investigation. It is a versatile technique
to characterise samples of any shape, as long as the specimen can be packed in the column
and molecular interactions can occur. IGC exists since the early 50s and it has been applied
23
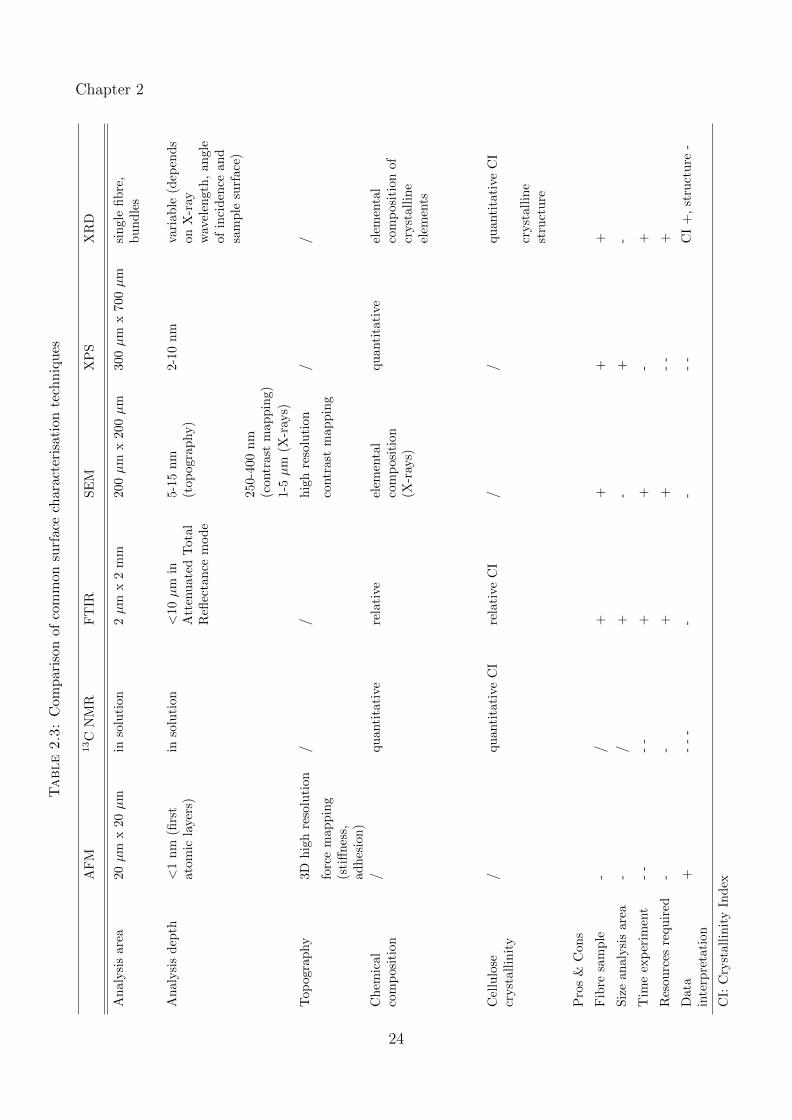
Chapter 2
Table2.3:
Com
par
ison
ofco
mm
onsu
rfac
ech
arac
teri
sati
onte
chn
iqu
es
AF
M13C
NM
RF
TIR
SE
MX
PS
XR
D
An
alysi
sar
ea20
µm
x20
µm
inso
luti
on2µ
mx
2m
m200µ
mx
200µ
m300µ
mx
700µ
msi
ngle
fib
re,
bu
nd
les
An
alysi
sd
epth
<1
nm
(firs
tat
omic
laye
rs)
inso
luti
on<
10µ
min
Att
enu
ate
dT
ota
lR
eflec
tan
cem
od
e
5-1
5n
m(t
op
ogra
phy)
2-1
0n
mva
riab
le(d
epen
ds
on
X-r
ayw
avel
ength
,an
gle
of
inci
den
cean
dsa
mp
lesu
rface
)250-4
00
nm
(contr
ast
map
pin
g)
1-5µ
m(X
-ray
s)
Top
ogra
phy
3Dh
igh
reso
luti
on/
/h
igh
reso
luti
on
//
forc
em
app
ing
(sti
ffn
ess,
adh
esio
n)
contr
ast
map
pin
g
Ch
emic
alco
mp
osit
ion
/qu
anti
tati
vere
lati
veel
emen
tal
com
posi
tion
(X-r
ays)
qu
anti
tati
veel
emen
tal
com
posi
tion
of
cryst
all
ine
elem
ents
Cel
lulo
secr
yst
alli
nit
y/
qu
anti
tati
veC
Ire
lati
veC
I/
/qu
anti
tati
veC
I
cryst
all
ine
stru
ctu
re
Pro
s&
Con
s
Fib
resa
mp
le-
/+
++
+
Siz
ean
alysi
sar
ea-
/+
-+
-
Tim
eex
per
imen
t-
--
-+
+-
+
Res
ourc
esre
quir
ed-
-+
+-
-+
Dat
ain
terp
reta
tion
+-
--
--
--
CI
+,
stru
ctu
re-
CI:
Cry
stal
lin
ity
Ind
ex
24
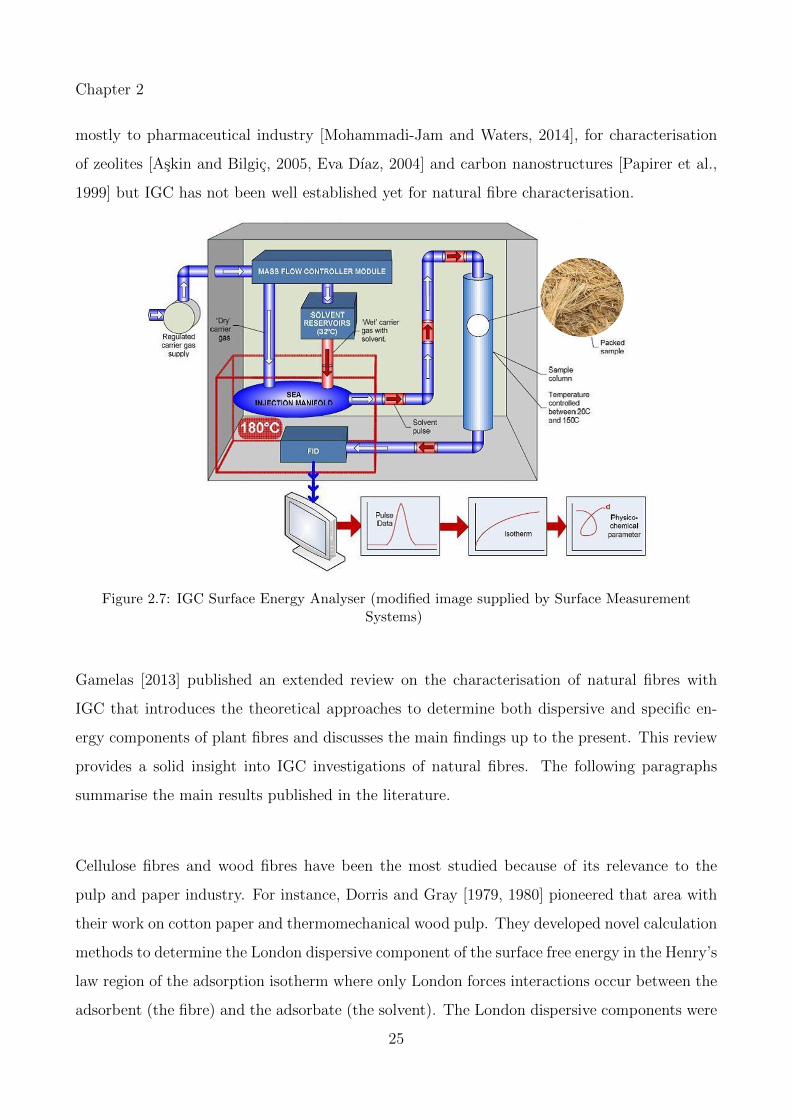
Chapter 2
mostly to pharmaceutical industry [Mohammadi-Jam and Waters, 2014], for characterisation
of zeolites [Askin and Bilgic, 2005, Eva Dıaz, 2004] and carbon nanostructures [Papirer et al.,
1999] but IGC has not been well established yet for natural fibre characterisation.
Figure 2.7: IGC Surface Energy Analyser (modified image supplied by Surface MeasurementSystems)
Gamelas [2013] published an extended review on the characterisation of natural fibres with
IGC that introduces the theoretical approaches to determine both dispersive and specific en-
ergy components of plant fibres and discusses the main findings up to the present. This review
provides a solid insight into IGC investigations of natural fibres. The following paragraphs
summarise the main results published in the literature.
Cellulose fibres and wood fibres have been the most studied because of its relevance to the
pulp and paper industry. For instance, Dorris and Gray [1979, 1980] pioneered that area with
their work on cotton paper and thermomechanical wood pulp. They developed novel calculation
methods to determine the London dispersive component of the surface free energy in the Henry’s
law region of the adsorption isotherm where only London forces interactions occur between the
adsorbent (the fibre) and the adsorbate (the solvent). The London dispersive components were
25
Chapter 2
estimated at 50 mJ.m−2 and 39 mJ.m−2 for the cellulose paper and the wood fibres respectively.
Since then, their approach has been widely used to determine the dispersive surface energy
component of natural fibres. Other studies on various type of cellulose (cotton, hardwood
cellulose, cellulose powder etc.) reported values between 40 mJ.m−2 and 50 mJ.m−2 [Belgacem
et al., 1995, Tshabalala, 1997, Tze et al., 2006].
It would seem appropriate here to explain in further detail why the dispersion of surface energy
is of interest and how this is specifically of importance to bio-based composites since polar
forces are not mentioned here.
More recently, IGC has been applied to bast fibres. A review of the literature shows that the
data obtained range from ca. 35 mJ.m−2 to 45 mJ.m−2 i.e. slightly lower values than those of
cellulose fibres [Gamelas, 2013]. Mills et al. [2008] attributed these values to the lower cellulose
content and higher lignin and hemicellulose content in bast fibres compared with cellulose fibres
but no clear trend was established and energy values differed considerably within the same fibre
varieties. For instance, the energy dispersive component of hemp at 40◦C varied between 36
mJ.m−2, 38 mJ.m−2 and 41 mJ.m−2, that of sisal was estimated at 38 mJ.m−2, 41 mJ.m−2 and
49 mJ.m−2 and that of flax at 35 mJ.m−2 and 43 mJ.m−2 [Gulati and Sain, 2006, Heng et al.,
2007, Mills et al., 2008, Ramires and Frollini, 2012].
As expected, energy values changed substantially with temperature although the evolution was
non uniform. Mills et al. [2008] studied the evolution of dispersive energy with temperature for
various fibres and found that hemp, flax and kenaf energy decreased with increasing temperature
from 43.1 mJ.m−2, 42.7 mJ.m−2 and 43.1 mJ.m−2 at 20◦C to 35.9 mJ.m−2, 34.9 mJ.m−2 and
36.9 mJ.m−2 at 40◦C respectively. However, jute, abaca and sisal showed higher energy values
at higher temperature: 40.2 mJ.m−2, 35.8 mJ.m−2 and 35.5 mJ.m−2 at 20◦C and 43.5 mJ.m−2,
36.2 mJ.m−2 and 41.2 mJ.m−2 at 40◦C respectively.
IGC has also been used to study the effect of fibre processing and chemical treatment on the
surface energy. Heng et al. [2007] found that flax fibres dew retted in the field had higher
energy values than fibres separated with industrial washing or by steam explosion treatment
(45.4 mJ.m−2 versus 35.5 mJ.m−2 and 31.6 mJ.m−2 respectively). Cordeiro et al. [2011a]
studied the effect of alkali treatment and zein treatment on various fibres and a majority
26
Chapter 2
of samples showed a decrease in dispersive energy values after treatment (flax, hemp, kenaf,
agave and sisal) although some fibres were outliers (pineapple). The authors extended their
study to wood and bagasse fibres and observed a similar scenario: eucalyptus and bagasse
fibres displayed lower energy values after treatment (respectively 43.2 mJ.m−2 and 44.2 mJ.m−2
before treatment vs. 42.7 mJ.m−2 and 42.8 mJ.m−2 after treatment) whereas spruce and wheat
showed higher energy (respectively 41.6 mJ.m−2 and 45.1 mJ.m−2 before treatement vs. 44.2
mJ.m−2 and 48.8 mJ.m−2 after treatement) [Cordeiro et al., 2012]. Ashori et al. [2012] also
observed different behaviours on cotton fibres, tobacco fibres and other natural fibres after alkali
treatment. Besides, Pommet et al. [2008] observed a slight decrease in energy for both hemp
and sisal fibres treated in bacterial cellulose medium (2% and 9% respectively) but an increase
in energy by 50% and 62% respectively when the fibres were pretreated in alkali solution.
Overall, no general trends could be established so far on the surface energy values of bast fibres
due to the variety of the results obtained. This is likely because IGC has only been recently
applied to natural fibres and a lot still needs to be done to better understand the thermodynamic
phenomena involved. The current status of IGC for natural fibre surface characterisation can
be summarised as follow:
• Few IGC studies have been performed on bast fibres hence only small data sets are available.
Given the various fibre types and their wide range of properties, more experimental work should
be conducted in order to extend the existing database and, when possible, to establish trends
between the fibre types and their surface properties.
• Most of the studies on natural fibres have been performed in different conditions (temperature,
relative humidity), with different solvents and using various calculation procedures. The lack
of information and details of experimental procedures make it difficult to compare and validate
data. Moreover, the large variability of natural fibre properties and their complexity compared
to synthesised and well designed man made materials means that a systematic study of the
common procedures and models implemented in IGC is required to assess its capabilities as a
technique to characterise natural fibre surfaces.
• IGC requires the specific surface area to determine the surface energy, especially as this can
depend on surface coverages. Usually, the specific surface area is determined by the Brunauer
27
Chapter 2
Emmett Teller (BET) method which uses nitrogen sorption [Bismarck et al., 2002, Livingston,
1949] or krypton [Beebe et al., 1945, Rosenberg, 1956], for surface areas below 0.5 m2.g−1 where
the nitrogen shows limitations [Sing, 2001]. These techniques involve extreme conditions of high
vacuum at low temperature (77K) under which the fibre properties are likely to change and thus
the BET surface area. An alternative and preferred technique for measuring the BET surface
area of low surface natural fibres would be to use IGC at room temperature. Some authors
determined the BET area values of bast fibres with IGC but none questioned the influence of
experimental conditions on the measured specific surface areas [Ashori et al., 2012, Cordeiro
et al., 2012]. For instance, the solvent choice and the effect of sample packing have not been
investigated. Whether these experimental conditions influence the thermodynamic behaviour of
the molecules in the column and hence lead to different BET values should be considered. Lee
and Luner [1993] already raised this issue when studying the adsorption isotherms of alkanes
on cellulose and suggested further investigation but not much has been done since then.
• Traditional IGC is performed at infinite dilution which means that only the higher energetic
sites interact with the solvent molecules and therefore single surface energy values will be similar
even though the fibre surface is heterogeneous [Williams, 1994]. Natural fibre surfaces present
chemical heterogeneities (functional groups, degree of crystallinity) and physical heterogeneities
(porosity, asperities etc.) hence the energy values are expected to vary along the surface.
Mapping the surface energy heterogeneity profile would be more representative of natural fibre
surface and constitutes a new area of research to explore. The new generation of IGC equipment
enable experiments with finite dilution which opens new opportunities for natural fibre surface
characterisation [Rudzinski and Everett, 2012, Thielmann, 2004, Yla-Maihaniemi et al., 2008].
28
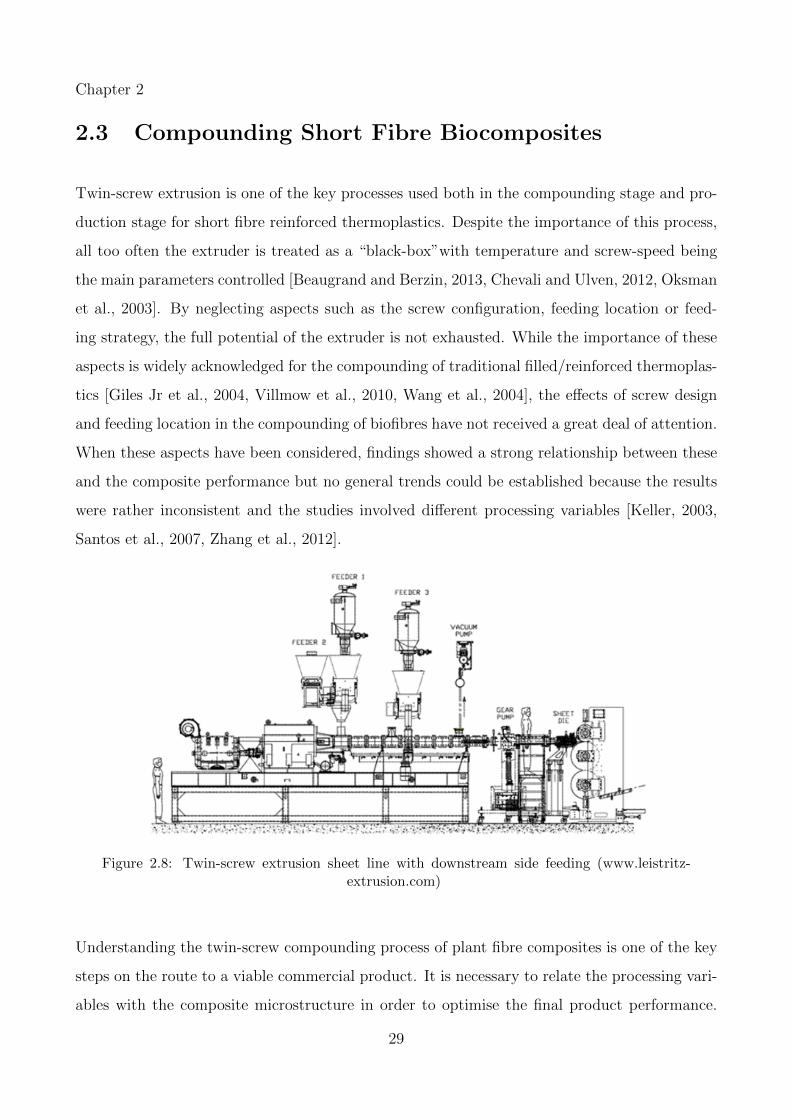
Chapter 2
2.3 Compounding Short Fibre Biocomposites
Twin-screw extrusion is one of the key processes used both in the compounding stage and pro-
duction stage for short fibre reinforced thermoplastics. Despite the importance of this process,
all too often the extruder is treated as a “black-box”with temperature and screw-speed being
the main parameters controlled [Beaugrand and Berzin, 2013, Chevali and Ulven, 2012, Oksman
et al., 2003]. By neglecting aspects such as the screw configuration, feeding location or feed-
ing strategy, the full potential of the extruder is not exhausted. While the importance of these
aspects is widely acknowledged for the compounding of traditional filled/reinforced thermoplas-
tics [Giles Jr et al., 2004, Villmow et al., 2010, Wang et al., 2004], the effects of screw design
and feeding location in the compounding of biofibres have not received a great deal of attention.
When these aspects have been considered, findings showed a strong relationship between these
and the composite performance but no general trends could be established because the results
were rather inconsistent and the studies involved different processing variables [Keller, 2003,
Santos et al., 2007, Zhang et al., 2012].
Figure 2.8: Twin-screw extrusion sheet line with downstream side feeding (www.leistritz-extrusion.com)
Understanding the twin-screw compounding process of plant fibre composites is one of the key
steps on the route to a viable commercial product. It is necessary to relate the processing vari-
ables with the composite microstructure in order to optimise the final product performance.
29
Chapter 2
Multiples authors showed that the processing variables affect the final properties of the ex-
truded compound [Carneiro et al., 2000, Siaotong et al., 2010, Sombatsompop and Panapoy,
2000]. Development and optimisation of extrusion process for biocomposites also require specific
challenges to be tackled that arise when working with natural fibres:
• Feeding the fibres into the barrel is a main issue because of their low density and fluffiness.
Feeding masterbatches is difficult because the blend tends to separate. Side-feeding the fibres
is also challenging as these tend to bridge in the hopper, which generates inconsistent feeding
into the barrel.
• It is necessary to control the humidity in the barrel as natural fibres have high moisture uptake
and moisture release during processing induces porosity in the final product unless efficient
venting is maintained. The vacuum systems should be positioned according to the screw design
and in particular the location of the kneading blocks [Giles Jr et al., 2004]. Monitoring the
fibre humidity content during storage also helps to reduce moisture release.
• Natural fibres have low thermal degradation that requires the temperatures in the barrel
to stay below 180◦C- 200◦C [John and Anandjiwala, 2008, Mohanty et al., 2001]. However,
the temperature profile in an extruder is complex and results from multiple mechanisms. The
materials, the extruder configuration (screw design, barrel length to weight ratio, venting and
cooling zones) and the processing conditions (screw speed, barrel temperature, torque, residence
time) determine the melt temperature profile in the barrel. The extruder should be configured
to achieve efficient mixing and fibre dispersion without degradation of the fibres.
• Last but not least, characterisation of biocomposites may be arduous especially analysing
fibre dispersion in the matrix. Estimation of the fibre length distribution is difficult as well
because traditional techniques applied to synthetic fibre composites involve burning the matrix
[Bowyer and Bader, 1972, Fu et al., 2000]. This method is obviously not applicable to natural
fibre composites. X-Ray Micro Computed Tomography (µ-CT) enables 3D visualisation of
short fibre composites and has made significant progress in the last decades [Shen et al., 2004,
Stock, 1999] but few works have been published on natural fibres composites [Alemdar et al.,
2008, Chinga-Carrasco et al., 2013, Etaati et al., 2014]. Limitation in resolution (typically
1µm to 5µm) and low contrast between natural fibres and thermoplatics render the analysis
30
Chapter 2
difficult [Virk et al., 2010]. New generations of X-Ray nanotomographs enable higher resolution
(<400nm) but these are expensive and few research laboratories own such apparatuses. Finally,
image processing and quantification are complex [Miettinen et al., 2012].
When it comes to large scale production of biocomposites, only a few companies have mas-
tered the compounding step and are selling commercial biocomposite compounds (c2renew,
Automotive Performance Materials (NAFILean technology), Greencore). A major reason is
the many challenges upstream of the extrusion process with which manufacturers are typically
unfamiliar. Numerous research programs are conducted in Europe, Canada, South America
and in other countries with an interest in this part of the bio-economy (BioStruct, UltraFibre,
Naturtruck etc.). The majority of investigations have not made it past the laboratory scale.
Studies are performed with small to medium extruders and usually focus on one aspect rather
than on the overall production process. A complete production process also encompasses the
management of material supply, storage, material preparation in large volumes and last but not
least, extrusion on a large scale i.e. with large throughput. Handling big volumes of natural
fibre is complicated because of their important volume to weight ratio and high sensitivity to
humidity. The scale-up process is challenging, particularly for research groups with limited
facilities, but this procedure is sine qua non for commercialisation of short fibre biocomposites.
It is necessary to study the feasibility of the biocomposite extrusion at a large scale to identify
the specific needs and issues that arise. Resultant information should be transmitted to the
manufacturers so that extrusion production lines become competitive and biocomposites are
implemented progressively into the market.
31
Chapter 3
Surface Characterisation
This chapter lays out firstly the materials used throughout the thesis and gives a brief overview
of the effects of alkaline treatment on natural fibre properties. The second section presents
the Scanning Electron Microscopy (SEM) analysis, with a comparison between the surface
properties of natural fibres as received and post chemical treatment. Surface analysis by X-
ray Photoelectron Spectroscopy (XPS) follows in the third section. The latter investigates the
effect of fibre processing on the oxygen to carbon ratio and further analyses the fibre surface
chemistry by peak fitting the high resolution spectra.
3.1 Materials
The purpose of this study was to develop and validate the capability of various experimental
techniques to characterise natural fibre surfaces and, in particular, to analyse the effect of fibre
processing on the surface properties. As mentioned in the previous chapters, there is a large
variability of fibre properties between species and genera and as result of fibre growth conditions
and processing. Since the focus of this work was on commercial exploitation of natural fibres, it
was important to select fibres readily available and processed via standard methods at industrial
scale to ensure traceability and reliable supply. Various types of fibres were used so that
the experimental data could be representative and to enable cross comparisons. Three main
varieties of bast fibres were tested: flax, kenaf and hemp. Various samples of each variety were
32
Chapter 3
provided by different suppliers and in variable amounts. Cellulose fibres and a batch of cellulose
pellicles produced by bacteria were also integrated to the test matrix as a reference for Inverse
Gas Chromatography (IGC) and XPS. The information available regarding the fibre origins
and processing steps were sometimes unfortunately incomplete among the samples. The data
provided by the suppliers are reported in the following paragraphs and summarised in Table
3.1 and Table 3.2.
A Canadian linseed flax and a Chinese linen flax (varieties unknown) were supplied by Compos-
ites Innovation Centre (CIC), Winnipeg, Canada. The latter had been previously water retted
while the linseed flax (unretted) had been mechanically decorticated by a lab scale scutching
machine (Alcock et al. [2012]). Two kenaf samples from different origins were used: a Thai
kenaf and a variety of kenaf grown in the USA. Engage Eco Product Co. Ltd (Wattana, Thai-
land) supplied batches of Thai kenaf variety Kohn-Kaen 60 (KK60). The fibres were locally
ribbon retted for 2-3 weeks in local waterways, rinsed and dried before shipping. The other
kenaf sample was supplied by Ecofibre Industries Operations Pty Ltd. (EIO), grown in Mis-
sissippi (USA) and retted (retting process unknown). Finally, a non-woven hemp mat (variety
unknown) was supplied by CIC. All the samples mentioned previously were considered and
labelled “as received”as per the conditions at delivery.
BioMid cellulose fibres were supplied by ENC International (South Korea). BioMid is a
cellulose-based continuous filament produced from a dry-jet-wet spinning process. The feed-
stock is a mixture of softwood and hardwood chips, a by-product from the wood pulp and paper
industry. The cellulose is extracted from the biomass and then injected through a spinneret.
Cellulose films generated by G. Xylinus bacterial activity were used as a second reference mate-
rial. G. Xylinus bacteria cultivated in a specific medium (Hestin and Schramm liquid medium)
can produce cellulose in a similar way to plants. In the process, bacterial cellulose pellicles are
extracted from the gel grown during fermentation, then washed to remove the extra bacteria
and polymers and stored in a biocide solution (Dolan [2014]). This biomimetic system has
been largely used to model plant cell wall mechanics (Iguchi et al. [2000], Mikkelsen and Gidley
[2011]). The samples were provided by G. Dolan (ARC Centre of Excellence in Plant Cell Walls,
The University of Queensland, Australia). Both BioMid and cellulose film were expected to be
33
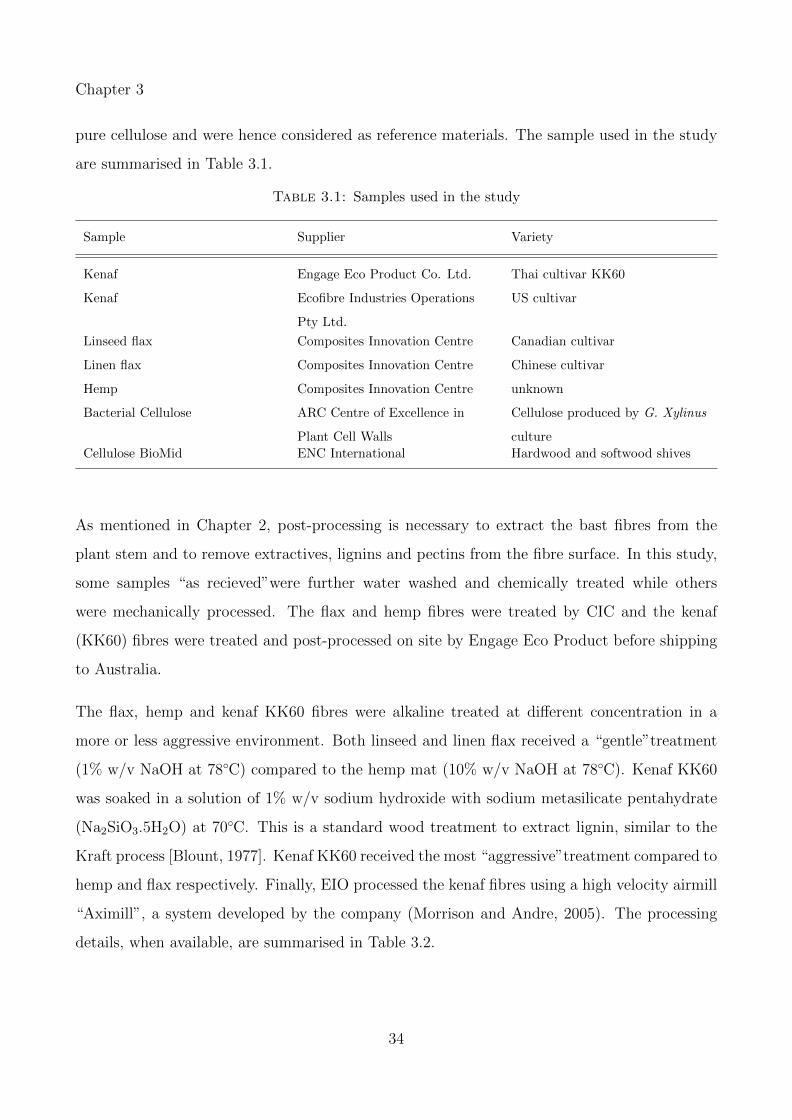
Chapter 3
pure cellulose and were hence considered as reference materials. The sample used in the study
are summarised in Table 3.1.
Table 3.1: Samples used in the study
Sample Supplier Variety
Kenaf Engage Eco Product Co. Ltd. Thai cultivar KK60
Kenaf Ecofibre Industries Operations
Pty Ltd.
US cultivar
Linseed flax Composites Innovation Centre Canadian cultivar
Linen flax Composites Innovation Centre Chinese cultivar
Hemp Composites Innovation Centre unknown
Bacterial Cellulose ARC Centre of Excellence in
Plant Cell Walls
Cellulose produced by G. Xylinus
culture
Cellulose BioMid ENC International Hardwood and softwood shives
As mentioned in Chapter 2, post-processing is necessary to extract the bast fibres from the
plant stem and to remove extractives, lignins and pectins from the fibre surface. In this study,
some samples “as recieved”were further water washed and chemically treated while others
were mechanically processed. The flax and hemp fibres were treated by CIC and the kenaf
(KK60) fibres were treated and post-processed on site by Engage Eco Product before shipping
to Australia.
The flax, hemp and kenaf KK60 fibres were alkaline treated at different concentration in a
more or less aggressive environment. Both linseed and linen flax received a “gentle”treatment
(1% w/v NaOH at 78◦C) compared to the hemp mat (10% w/v NaOH at 78◦C). Kenaf KK60
was soaked in a solution of 1% w/v sodium hydroxide with sodium metasilicate pentahydrate
(Na2SiO3.5H2O) at 70◦C. This is a standard wood treatment to extract lignin, similar to the
Kraft process [Blount, 1977]. Kenaf KK60 received the most “aggressive”treatment compared to
hemp and flax respectively. Finally, EIO processed the kenaf fibres using a high velocity airmill
“Aximill”, a system developed by the company (Morrison and Andre, 2005). The processing
details, when available, are summarised in Table 3.2.
34

Chapter 3
Table 3.2: Details on the treatments applied to the fibre samples
Sample As received Water washed Post-Processed
Linseed flax Non retted, / 1. Scutched
mechanically
decorticated by
scutching
2. Soaked: 1% w/v NaOH in
ethanol solution (95%), at 78◦C
3. Washed, oven dried at 80◦C for
24 h
Linen flax Water retted / Same treatment as linseed flax
Hemp mat No data 1. Soaking in distilled water for
24 h at RT
1. Water washed
2. Washed, air dried for 48 h 2. Soaked: 10% w/v NaOH at
60◦C for 2 h
3. Washed till pH=7, air dried for
48 h
Kenaf KK60 Water retted 1. Water retted 1. Water retted
2-3 weeks in lo-
cal waterways
2. Washed, dried and hammer
milled
2. Soaked in a alkaline solution
(1% w/v NaOH, sodium metasili-
cate pentahydrate) at 70◦C for 40
min
3. Washed, dried and hammer
milled
Kenaf EcoFibre No data / Mechanically processed by high
velocity airmill
The following paragraphs describe the physico-chemical modifications induced by alkaline treat-
ment on natural fibres in order to better understand the effect on the surface properties of the
fibres studied and to help with the interpretation of experimental data.
Alkaline treatment, also called mercerisation, is an old process developed by John Mercer (UK)
in the early 19th century to modify cellulose fibres, particularly cotton in the textile industry.
The standard definition established in the ASTM D1965 refers to “the process of subjecting a
vegetable fibre to an interaction with a fairly concentrated aqueous solution of a strong base,
to produce swelling with resultant changes in the fine structure, dimension, morphology and
35
Chapter 3
mechanical properties”. This technique has been developed, applied and improved for cotton
textiles. The physico-chemical transformations happening through mercerisation are fairly well
understood for cotton fibres and the process has been optimised to tailor the fibre properties.
The effects of mercerisation on cotton fibres have been expansively reviewed [Ugbolue, 1990,
Warwicker and Hallam, 1970] and will not be detailed here. The main effects on mechanical
properties are: an increase in tensile strength, a better elasticity and a higher strain at break.
Cotton fibres also gain in lustre and uniformity due to the changes in the cross-section (they get
more circular), to a better surface homogeneity and untwisting of the cellulose fibrils [Ugbolue,
1990].
A brief overview of the effects of alkaline treatment on cellulose fibres may help to interpret
the mechanisms that occur on bast fibres. Soaking cellulose fibres in highly concentrated alkali
medium induces swelling that further leads to shrinkage and molecular chain reorientation upon
removal of the swelling agent. Another important structural change is the transformation of
cellulose I into cellulose II [Ugbolue, 1990]. The polymorphs have slightly dissimilar crystallo-
graphic structures but the main difference is the way the cellulose chains are packed. These lie
parallel to each other in cellulose I and anti-parallel in cellulose II [O’Sullivan, 1997]. In the
latter configuration, the chain elastic modulus is slightly lower compared to the E modulus in
native cellulose [Kroon-Batenburg and Kroon, 1997] but the effect of molecular orientation and
fibre shrinkage predominate and the overall tensile properties increase [Zeronian et al., 1990].
Unlike cotton fibres that are made of ca. 90% cellulose, bast fibres contain multiple components
and the overall effect of alkali treatment results from the effects on the cellulose fibrils and on
the non-cellulosic constituents i.e. hemicellulose, lignins, pectins, waxes and other extractives
present on the fibre surface. Consequently, immersion of bast fibres in alkali medium involves
various adjunct mechanisms. It is assumed that the non cellulosic matrix [hemicellulose +
lignin] is partially dissolved and so the cellulose chains pack more densely i.e. the crystallinity
index increases [Bledzki and Gassan, 1999, Lefeuvre et al., 2015, Sharma et al., 1995]. This
phenomenon also increases the Youngs’ modulus. Gassan and Bledzki [1999a] claimed that
reduction of the non cellulosic matrix, on the other hand, weakens the stress transfer to the
cellulose fibrils i.e. it reduces the stress development in the fibres under tensile load. The authors
mentioned that removal of lignins also affects the middle lamella because some microvoids
36
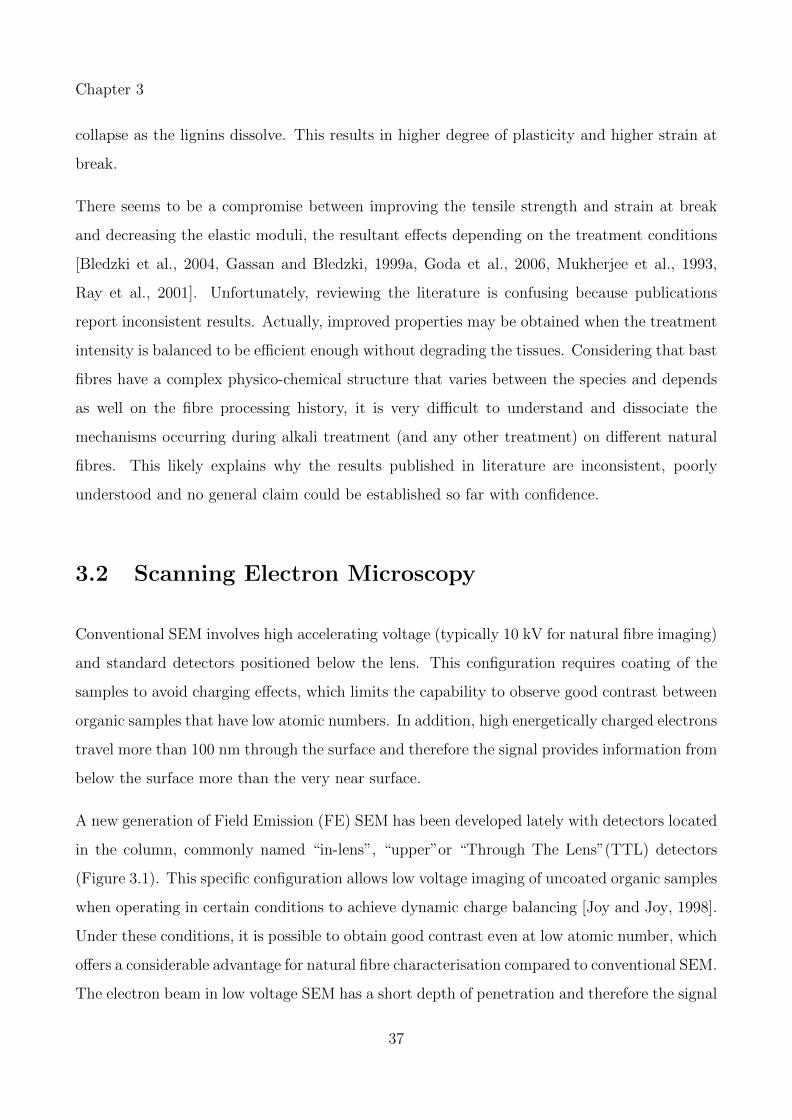
Chapter 3
collapse as the lignins dissolve. This results in higher degree of plasticity and higher strain at
break.
There seems to be a compromise between improving the tensile strength and strain at break
and decreasing the elastic moduli, the resultant effects depending on the treatment conditions
[Bledzki et al., 2004, Gassan and Bledzki, 1999a, Goda et al., 2006, Mukherjee et al., 1993,
Ray et al., 2001]. Unfortunately, reviewing the literature is confusing because publications
report inconsistent results. Actually, improved properties may be obtained when the treatment
intensity is balanced to be efficient enough without degrading the tissues. Considering that bast
fibres have a complex physico-chemical structure that varies between the species and depends
as well on the fibre processing history, it is very difficult to understand and dissociate the
mechanisms occurring during alkali treatment (and any other treatment) on different natural
fibres. This likely explains why the results published in literature are inconsistent, poorly
understood and no general claim could be established so far with confidence.
3.2 Scanning Electron Microscopy
Conventional SEM involves high accelerating voltage (typically 10 kV for natural fibre imaging)
and standard detectors positioned below the lens. This configuration requires coating of the
samples to avoid charging effects, which limits the capability to observe good contrast between
organic samples that have low atomic numbers. In addition, high energetically charged electrons
travel more than 100 nm through the surface and therefore the signal provides information from
below the surface more than the very near surface.
A new generation of Field Emission (FE) SEM has been developed lately with detectors located
in the column, commonly named “in-lens”, “upper”or “Through The Lens”(TTL) detectors
(Figure 3.1). This specific configuration allows low voltage imaging of uncoated organic samples
when operating in certain conditions to achieve dynamic charge balancing [Joy and Joy, 1998].
Under these conditions, it is possible to obtain good contrast even at low atomic number, which
offers a considerable advantage for natural fibre characterisation compared to conventional SEM.
The electron beam in low voltage SEM has a short depth of penetration and therefore the signal
37
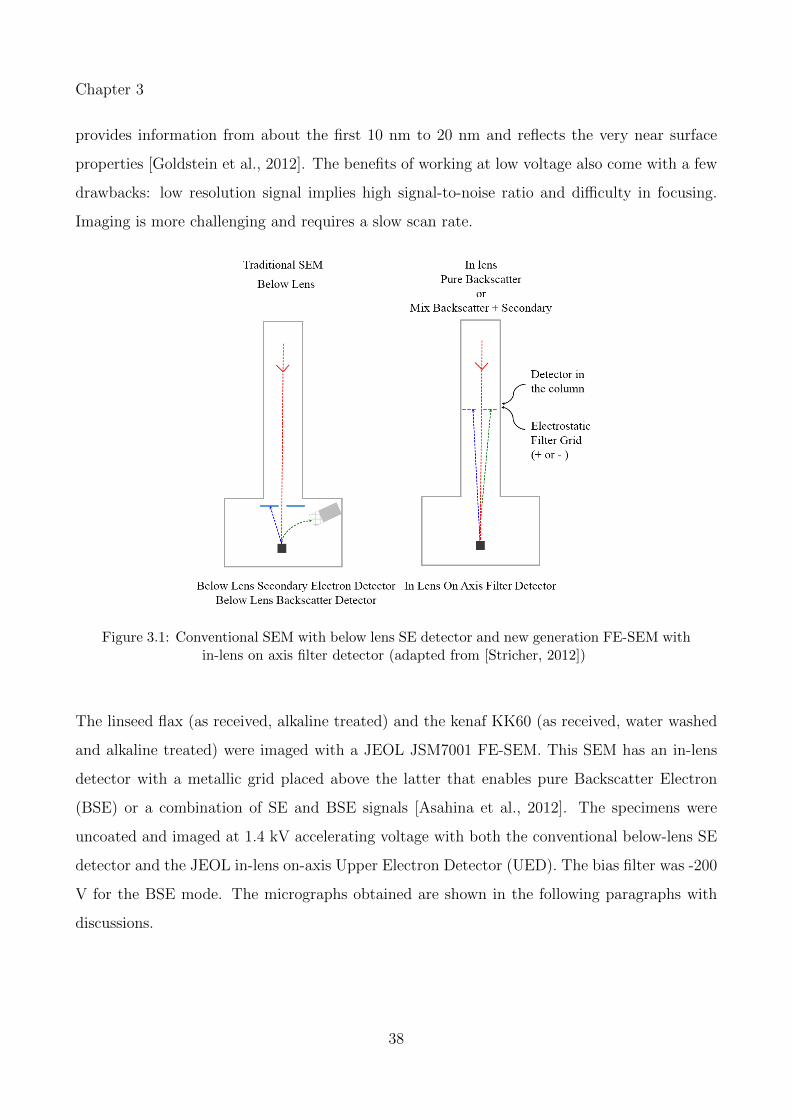
Chapter 3
provides information from about the first 10 nm to 20 nm and reflects the very near surface
properties [Goldstein et al., 2012]. The benefits of working at low voltage also come with a few
drawbacks: low resolution signal implies high signal-to-noise ratio and difficulty in focusing.
Imaging is more challenging and requires a slow scan rate.
Figure 3.1: Conventional SEM with below lens SE detector and new generation FE-SEM within-lens on axis filter detector (adapted from [Stricher, 2012])
The linseed flax (as received, alkaline treated) and the kenaf KK60 (as received, water washed
and alkaline treated) were imaged with a JEOL JSM7001 FE-SEM. This SEM has an in-lens
detector with a metallic grid placed above the latter that enables pure Backscatter Electron
(BSE) or a combination of SE and BSE signals [Asahina et al., 2012]. The specimens were
uncoated and imaged at 1.4 kV accelerating voltage with both the conventional below-lens SE
detector and the JEOL in-lens on-axis Upper Electron Detector (UED). The bias filter was -200
V for the BSE mode. The micrographs obtained are shown in the following paragraphs with
discussions.
38
Chapter 3
(a) (b)
Figure 3.2: SEM micrographs of flax fibres as received imaged with conventional SE detector(a) and UED detector filtering backscattered electrons (b)
The Secondary Electron Images (SEI) of the flax fibres as received show that the fibre surface
was rough and contained multiple layers (Figure 3.2a). The top layer (label A) was likely the
cuticle/epidermis layer, which was expected to be seen as these fibres were non retted. Dust
particles and traces of epidermal particles were scattered over the outer layer surface, likely
projected during scutching. The outer layer was fragmented during mechanical scutching in
some areas (bottom centre and middle right of the fibre) and made visible the bast fibre bundles
underneath (label B) but most of the fibre surface remained coated with a mixture of amorphous
like materials, probably lignins, lipids, pectins and extractives.
Micrographs obtained with UED detector filtering the BSE reveal a clear contrast between
the outer layer and the layer underneath (Figure 3.2b), with boundaries corresponding to the
fragmentation pattern identified on the topographical SEI. This suggests a significant difference
in the chemical composition between both layers, due to the presence of polymeric components
of various average atomic numbers [Rasch et al., 2014, Truss et al., 2015]. Bast fibres contain
cellulose, hemicellulose, pectins, lignins and other extractives, and each component has a specific
oxygen content and average atomic number, which explains the contrast observed with BSE
imaging. Cellulose has a theoretical oxygen to carbon (O/C) ratio of 0.83, hemicellulose and
pectins have similar O/C given their chemical structure, pure lignins O/C averages 0.33 and
39
Chapter 3
extractives have lower O/C values [Dorris and Gray, 1978a]. A scale based on the O/C ratio of
each component gives the following increasing brightness sequence using the UED BSE imaging:
Extractives <Lignins <Cellulose, hemicellulose, pectins <Inorganic particles
Some spots appear much brighter than other components of the outer layer (indicated with
arrows). These were likely inorganic particles from the plants such as mineral silicates. Rasch
et al. [2014] observed similar features on flax fibres and performed Energy Dispersive X-Ray
(EDX) analysis that confirmed traces of Si, Al, Mg, K and O in various samples. Truss et al.
[2015] also identified silica, particles rich in Ca and particles rich in Si, Al, Mg, K and O on the
surface of hemp fibres.
SEM imaging was performed on the fibres post alkaline treatment (Figure 3.3). The individual
flax fibres can be clearly distinguished on the SEI image of the alkaline treated fibres (Figure
3.3a and 3.3b). The chemical treatment removed most of the cuticle/epidermis layer, revealing
the fibres located underneath. Although fibre separation was obvious, the outer layer was
still visible in some cases in the background (label A). The regular patterns transverse to the
fibre axis were nodes and kinks (indicated with arrows 1). The bast fibres were still covered by
scattered patches of an amorphous like substance adhering to the fibre surface that was probably
a mixture of lignins remaining on the surface (indicated with arrows 2). It is common to observe
residual lignin particles adhering to the fibre surface after chemical treatment [Edeerozey et al.,
2007, Gassan and Bledzki, 1999b, Stuart et al., 2006].
40

Chapter 3
(a) (b)
(c) (d)
Figure 3.3: SEM micrographs of flax fibres alkaline treated imaged with conventional SEdetector (a), (b) and UED detector filtering backscattered electrons (c), (d)
The UED BSE images of the alkaline treated fibres have low contrast (illustrated in Figure
3.3c and 3.3d), meaning that the fibre surfaces were much more homogeneous than in their as
received state (Figure 3.2b). Some spots appeared slightly darker than the background fibre
surface, which supports the hypothesis that these were a mixture of lignins remaining on the
surface after treatment. A few bright spots were also still visible, most likely residual inorganic
compounds (indicated with arrows).
41
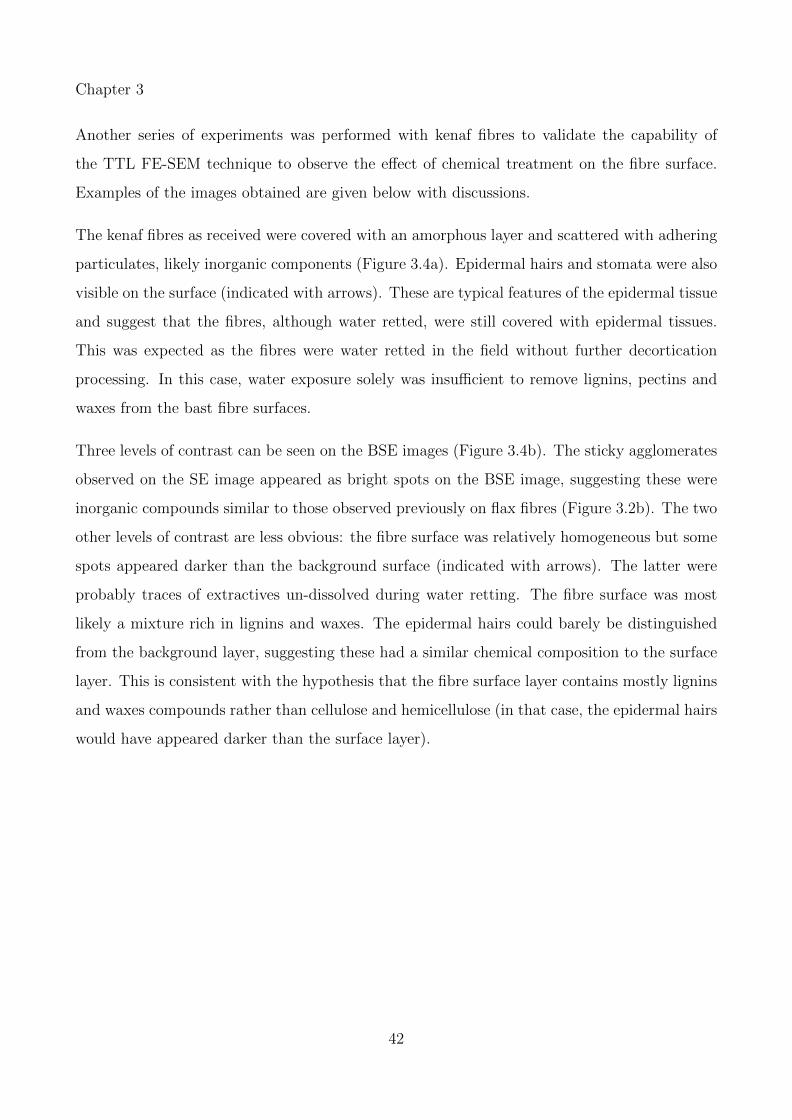
Chapter 3
Another series of experiments was performed with kenaf fibres to validate the capability of
the TTL FE-SEM technique to observe the effect of chemical treatment on the fibre surface.
Examples of the images obtained are given below with discussions.
The kenaf fibres as received were covered with an amorphous layer and scattered with adhering
particulates, likely inorganic components (Figure 3.4a). Epidermal hairs and stomata were also
visible on the surface (indicated with arrows). These are typical features of the epidermal tissue
and suggest that the fibres, although water retted, were still covered with epidermal tissues.
This was expected as the fibres were water retted in the field without further decortication
processing. In this case, water exposure solely was insufficient to remove lignins, pectins and
waxes from the bast fibre surfaces.
Three levels of contrast can be seen on the BSE images (Figure 3.4b). The sticky agglomerates
observed on the SE image appeared as bright spots on the BSE image, suggesting these were
inorganic compounds similar to those observed previously on flax fibres (Figure 3.2b). The two
other levels of contrast are less obvious: the fibre surface was relatively homogeneous but some
spots appeared darker than the background surface (indicated with arrows). The latter were
probably traces of extractives un-dissolved during water retting. The fibre surface was most
likely a mixture rich in lignins and waxes. The epidermal hairs could barely be distinguished
from the background layer, suggesting these had a similar chemical composition to the surface
layer. This is consistent with the hypothesis that the fibre surface layer contains mostly lignins
and waxes compounds rather than cellulose and hemicellulose (in that case, the epidermal hairs
would have appeared darker than the surface layer).
42
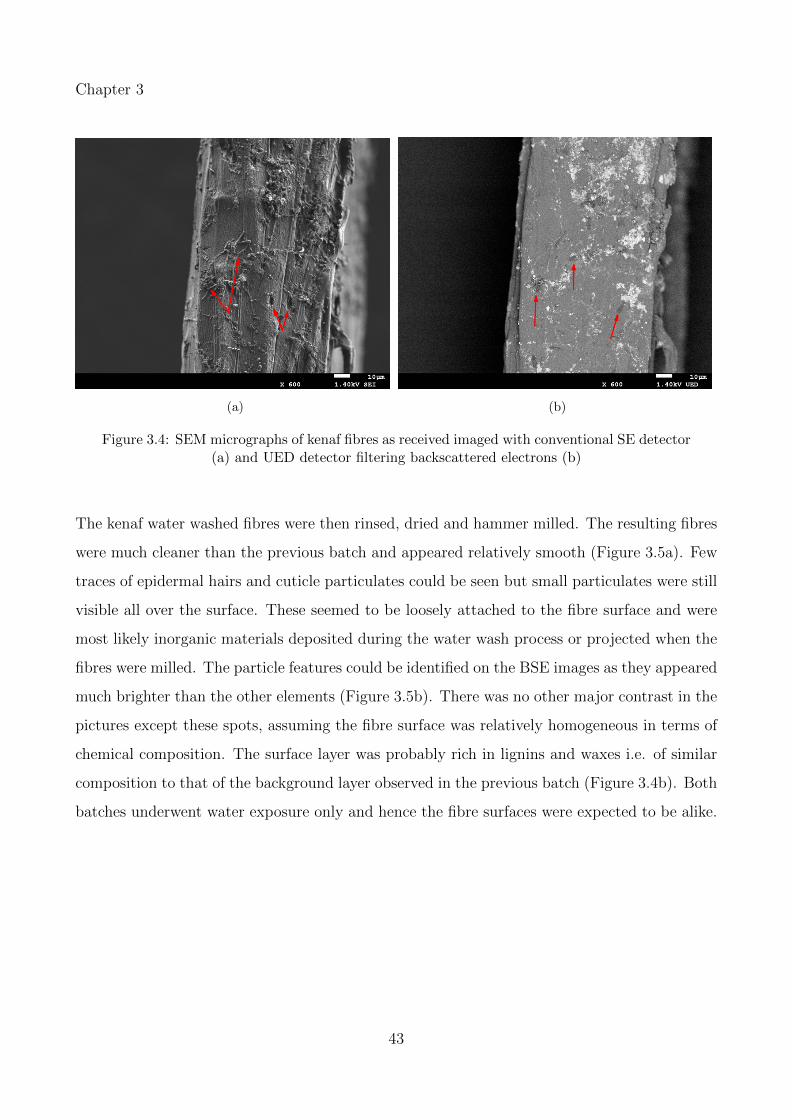
Chapter 3
(a) (b)
Figure 3.4: SEM micrographs of kenaf fibres as received imaged with conventional SE detector(a) and UED detector filtering backscattered electrons (b)
The kenaf water washed fibres were then rinsed, dried and hammer milled. The resulting fibres
were much cleaner than the previous batch and appeared relatively smooth (Figure 3.5a). Few
traces of epidermal hairs and cuticle particulates could be seen but small particulates were still
visible all over the surface. These seemed to be loosely attached to the fibre surface and were
most likely inorganic materials deposited during the water wash process or projected when the
fibres were milled. The particle features could be identified on the BSE images as they appeared
much brighter than the other elements (Figure 3.5b). There was no other major contrast in the
pictures except these spots, assuming the fibre surface was relatively homogeneous in terms of
chemical composition. The surface layer was probably rich in lignins and waxes i.e. of similar
composition to that of the background layer observed in the previous batch (Figure 3.4b). Both
batches underwent water exposure only and hence the fibre surfaces were expected to be alike.
43
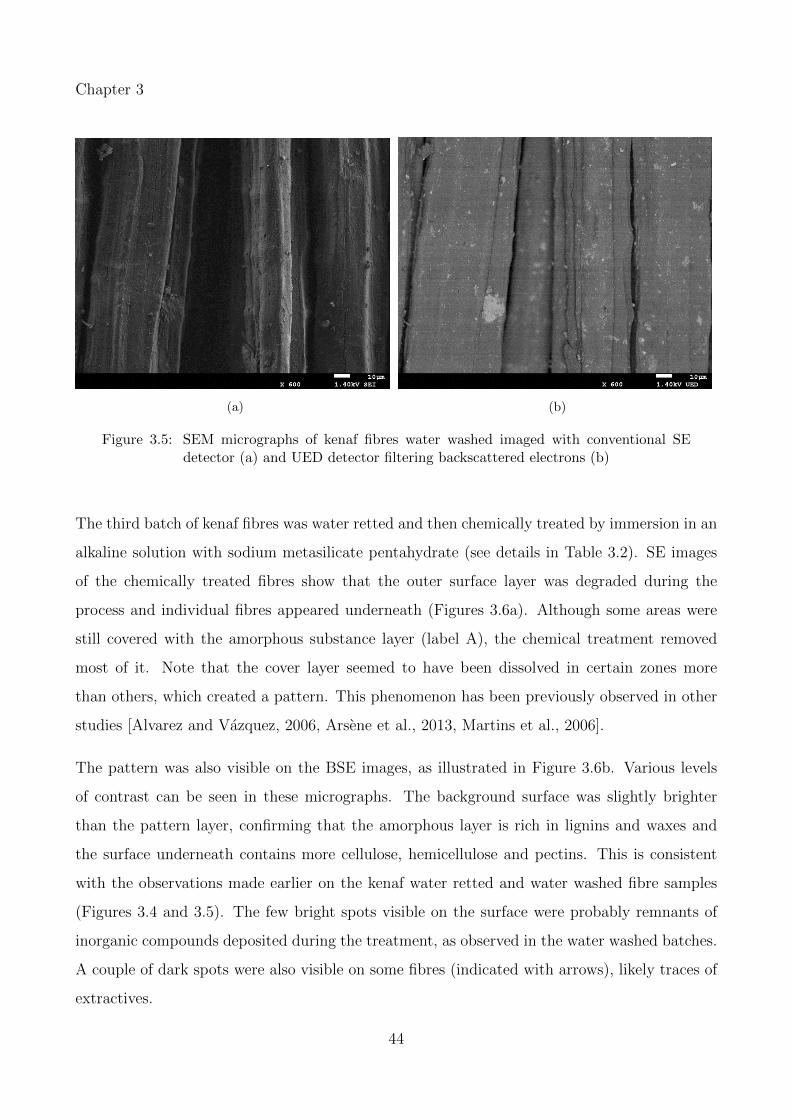
Chapter 3
(a) (b)
Figure 3.5: SEM micrographs of kenaf fibres water washed imaged with conventional SEdetector (a) and UED detector filtering backscattered electrons (b)
The third batch of kenaf fibres was water retted and then chemically treated by immersion in an
alkaline solution with sodium metasilicate pentahydrate (see details in Table 3.2). SE images
of the chemically treated fibres show that the outer surface layer was degraded during the
process and individual fibres appeared underneath (Figures 3.6a). Although some areas were
still covered with the amorphous substance layer (label A), the chemical treatment removed
most of it. Note that the cover layer seemed to have been dissolved in certain zones more
than others, which created a pattern. This phenomenon has been previously observed in other
studies [Alvarez and Vazquez, 2006, Arsene et al., 2013, Martins et al., 2006].
The pattern was also visible on the BSE images, as illustrated in Figure 3.6b. Various levels
of contrast can be seen in these micrographs. The background surface was slightly brighter
than the pattern layer, confirming that the amorphous layer is rich in lignins and waxes and
the surface underneath contains more cellulose, hemicellulose and pectins. This is consistent
with the observations made earlier on the kenaf water retted and water washed fibre samples
(Figures 3.4 and 3.5). The few bright spots visible on the surface were probably remnants of
inorganic compounds deposited during the treatment, as observed in the water washed batches.
A couple of dark spots were also visible on some fibres (indicated with arrows), likely traces of
extractives.
44
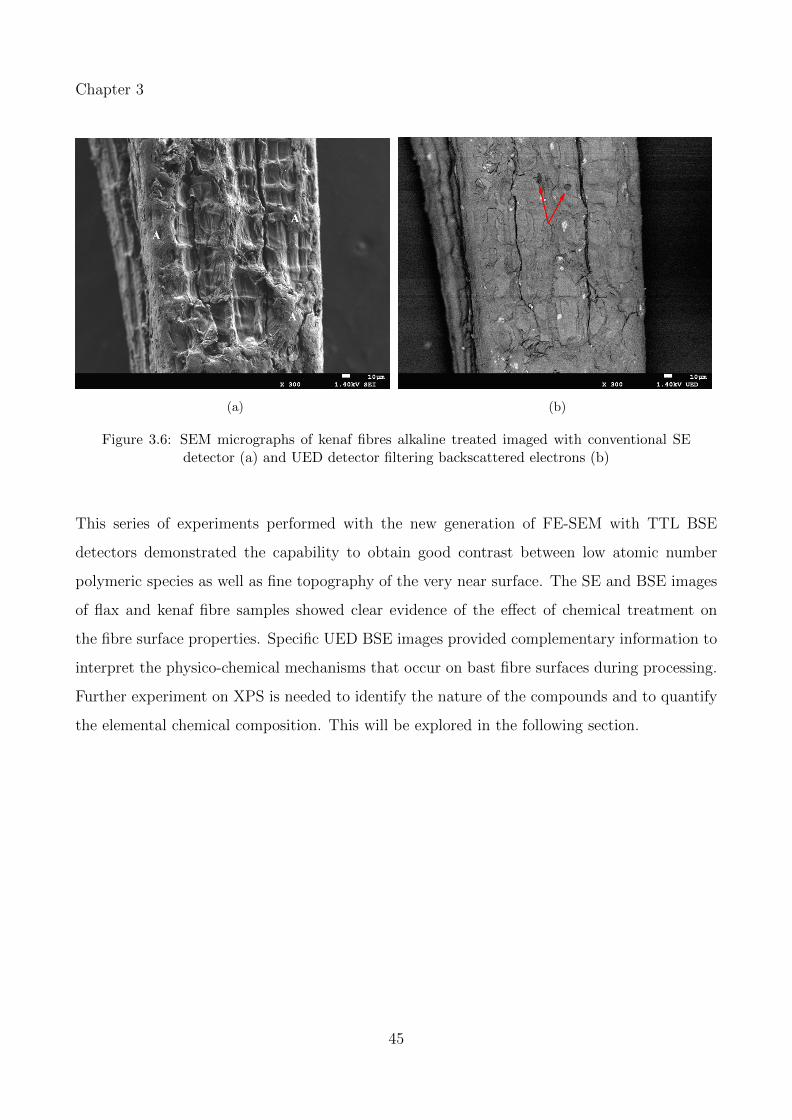
Chapter 3
(a) (b)
Figure 3.6: SEM micrographs of kenaf fibres alkaline treated imaged with conventional SEdetector (a) and UED detector filtering backscattered electrons (b)
This series of experiments performed with the new generation of FE-SEM with TTL BSE
detectors demonstrated the capability to obtain good contrast between low atomic number
polymeric species as well as fine topography of the very near surface. The SE and BSE images
of flax and kenaf fibre samples showed clear evidence of the effect of chemical treatment on
the fibre surface properties. Specific UED BSE images provided complementary information to
interpret the physico-chemical mechanisms that occur on bast fibre surfaces during processing.
Further experiment on XPS is needed to identify the nature of the compounds and to quantify
the elemental chemical composition. This will be explored in the following section.
45
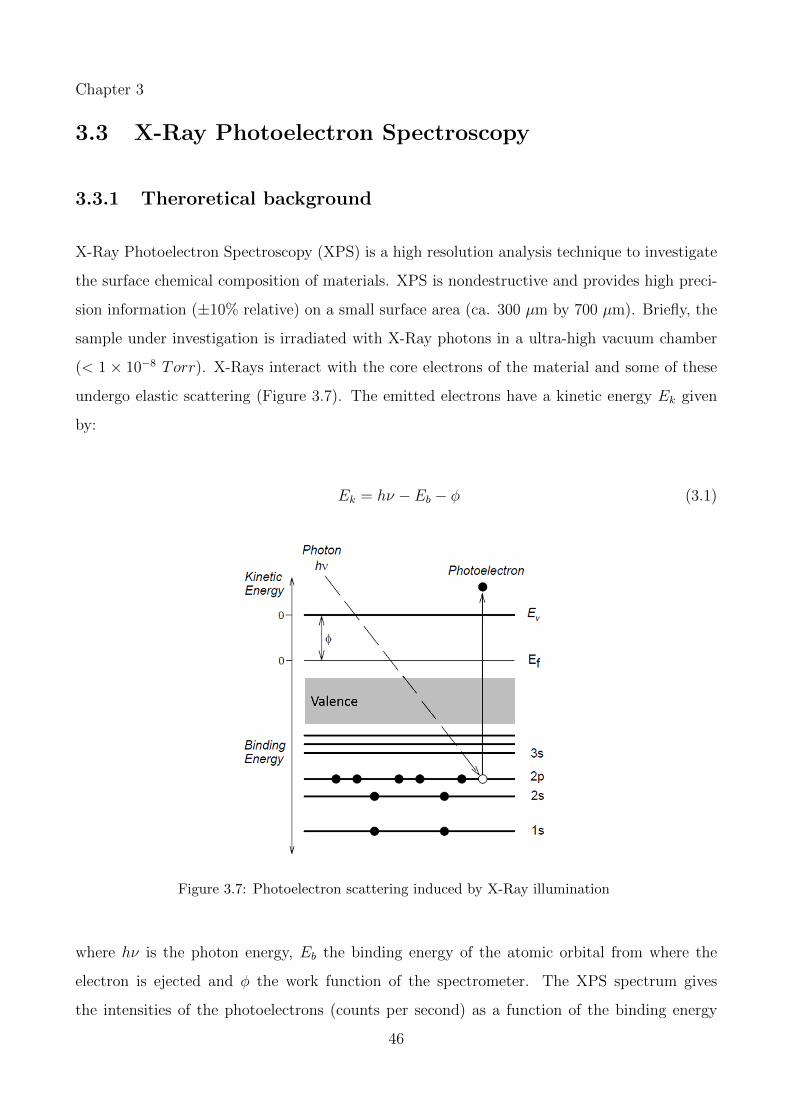
Chapter 3
3.3 X-Ray Photoelectron Spectroscopy
3.3.1 Theroretical background
X-Ray Photoelectron Spectroscopy (XPS) is a high resolution analysis technique to investigate
the surface chemical composition of materials. XPS is nondestructive and provides high preci-
sion information (±10% relative) on a small surface area (ca. 300 µm by 700 µm). Briefly, the
sample under investigation is irradiated with X-Ray photons in a ultra-high vacuum chamber
(< 1 × 10⁻⁸ Torr). X-Rays interact with the core electrons of the material and some of these
undergo elastic scattering (Figure 3.7). The emitted electrons have a kinetic energy Ek given
by:
Ek = hν − Eb − φ (3.1)
Figure 3.7: Photoelectron scattering induced by X-Ray illumination
where hν is the photon energy, Eb the binding energy of the atomic orbital from where the
electron is ejected and φ the work function of the spectrometer. The XPS spectrum gives
the intensities of the photoelectrons (counts per second) as a function of the binding energy
46
Chapter 3
Eb (eV). As the binding energy is specific to each element, it is possible to determine which
atoms are present in the sample surface by measuring the kinetic energy of the photoelectron.
The position and intensity of the peaks provide information on the chemistry (oxidation state)
and quantitative elemental composition (>0.1 atom %) for all elements, except hydrogen and
helium [Dorris and Gray, 1978b].
In XPS, the emitted photons electrons have low kinetic energy and so only those from the
very near surface escape and can be detected. In other words, XPS data is representative of
the near sample surface only. Hence, this technique is of particular interest for natural fibres
because it involves the chemical groups that will interact directly with the polymer matrix. For
comparison, XPS analysis samples ca. 2-10 nm in depth (ca. 30 first atomic layers) vs. 1-5 µm
for Energy Dispersive X-ray Spectroscopy (EDX). EDX data give chemical analysis of a deeper
volume that may have considerably different chemistry than the first atomic layers.
XPS analyses on natural fibres were originally performed on wood fibres and cellulose paper
in the late 70s, driven by the pulp and paper industry. Dorris and Gray [1978a,b], Gellerstedt
and Gatenholm [1999], Laine et al. [1994] pioneered XPS analysis with their works on wood
pulps and paper. Since then, numerous studies were published on natural fibre characterisation
by XPS [Johansson et al., 2004, Ostenson et al., 2006, Rasch et al., 2014, Truss et al., 2015,
Zafeiropoulos et al., 2003]. However, it remains difficult to establish the elemental composition
and to quantify the compounds present on the fibre surface because the reference values for
chemical composition found in the literature are based on dry matter and hence represent the
average chemical composition of the fibre (primary wall, secondary walls, inner membrane).
The fibre surface chemistry contains other specific groups (pectins, lignins, waxes, extractives)
and therefore the average composition may be non representative and constitutes a poor ref-
erence for XPS analysis. It is also particularly challenging to build models for natural fibres
because the elemental proportions vary between the fibre genera and species and also within a
sample. All the reasons aforementioned suggest that XPS data interpretation for natural fibres
is particularly problematic and should be based on the analysis of multiple specimen per sample
rather than a singular specimen in order to have good confidence in the data.
47
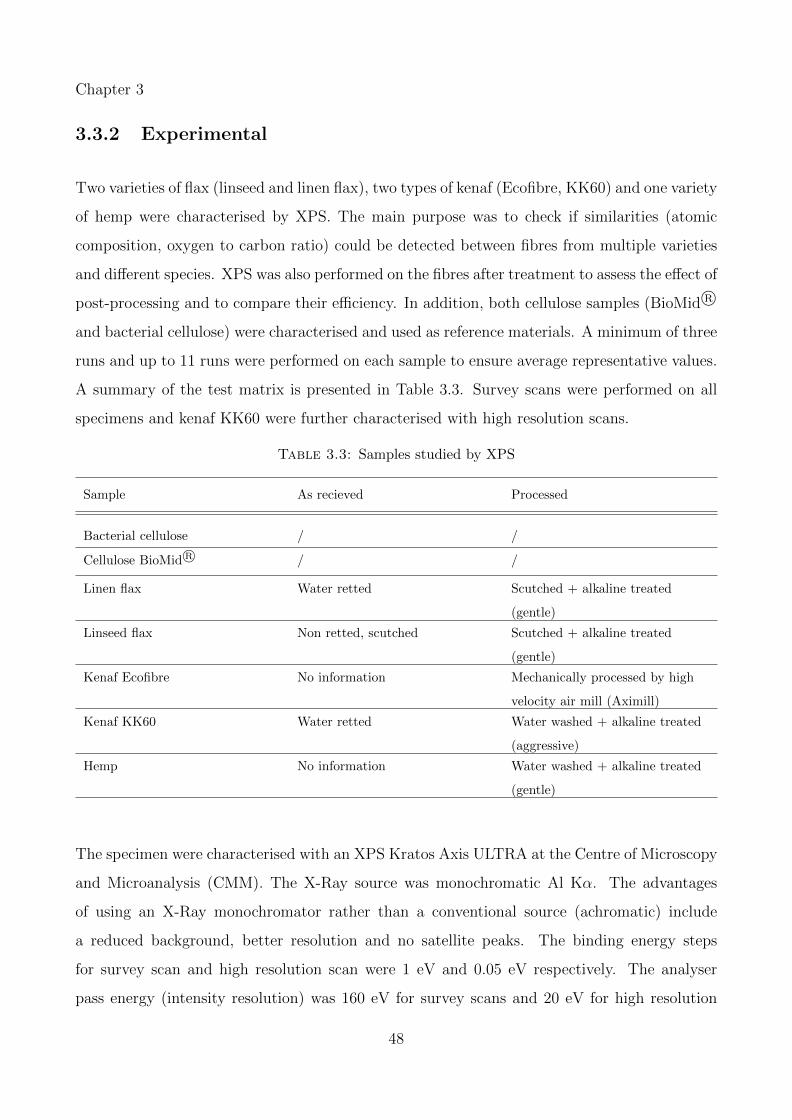
Chapter 3
3.3.2 Experimental
Two varieties of flax (linseed and linen flax), two types of kenaf (Ecofibre, KK60) and one variety
of hemp were characterised by XPS. The main purpose was to check if similarities (atomic
composition, oxygen to carbon ratio) could be detected between fibres from multiple varieties
and different species. XPS was also performed on the fibres after treatment to assess the effect of
post-processing and to compare their efficiency. In addition, both cellulose samples (BioMid R©
and bacterial cellulose) were characterised and used as reference materials. A minimum of three
runs and up to 11 runs were performed on each sample to ensure average representative values.
A summary of the test matrix is presented in Table 3.3. Survey scans were performed on all
specimens and kenaf KK60 were further characterised with high resolution scans.
Table 3.3: Samples studied by XPS
Sample As recieved Processed
Bacterial cellulose / /
Cellulose BioMid R© / /
Linen flax Water retted Scutched + alkaline treated
(gentle)
Linseed flax Non retted, scutched Scutched + alkaline treated
(gentle)
Kenaf Ecofibre No information Mechanically processed by high
velocity air mill (Aximill)
Kenaf KK60 Water retted Water washed + alkaline treated
(aggressive)
Hemp No information Water washed + alkaline treated
(gentle)
The specimen were characterised with an XPS Kratos Axis ULTRA at the Centre of Microscopy
and Microanalysis (CMM). The X-Ray source was monochromatic Al Kα. The advantages
of using an X-Ray monochromator rather than a conventional source (achromatic) include
a reduced background, better resolution and no satellite peaks. The binding energy steps
for survey scan and high resolution scan were 1 eV and 0.05 eV respectively. The analyser
pass energy (intensity resolution) was 160 eV for survey scans and 20 eV for high resolution
48
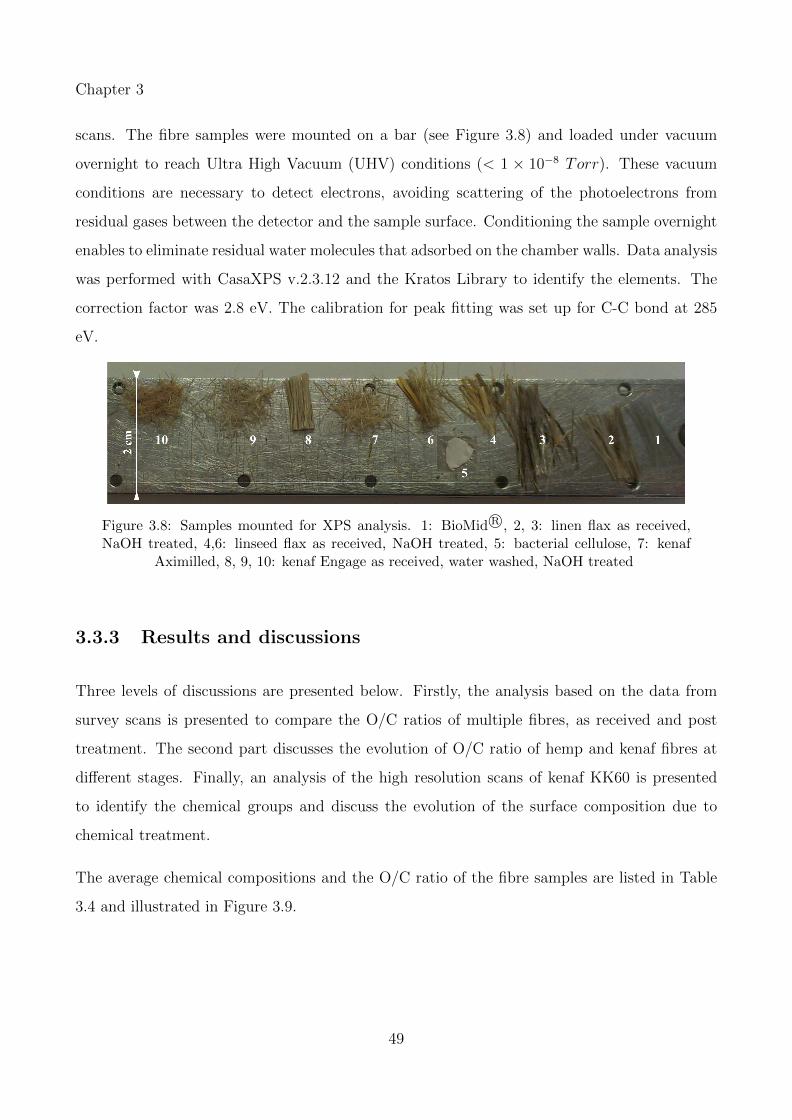
Chapter 3
scans. The fibre samples were mounted on a bar (see Figure 3.8) and loaded under vacuum
overnight to reach Ultra High Vacuum (UHV) conditions (< 1 × 10⁻⁸ Torr). These vacuum
conditions are necessary to detect electrons, avoiding scattering of the photoelectrons from
residual gases between the detector and the sample surface. Conditioning the sample overnight
enables to eliminate residual water molecules that adsorbed on the chamber walls. Data analysis
was performed with CasaXPS v.2.3.12 and the Kratos Library to identify the elements. The
correction factor was 2.8 eV. The calibration for peak fitting was set up for C-C bond at 285
eV.
Figure 3.8: Samples mounted for XPS analysis. 1: BioMid R©, 2, 3: linen flax as received,NaOH treated, 4,6: linseed flax as received, NaOH treated, 5: bacterial cellulose, 7: kenaf
Aximilled, 8, 9, 10: kenaf Engage as received, water washed, NaOH treated
3.3.3 Results and discussions
Three levels of discussions are presented below. Firstly, the analysis based on the data from
survey scans is presented to compare the O/C ratios of multiple fibres, as received and post
treatment. The second part discusses the evolution of O/C ratio of hemp and kenaf fibres at
different stages. Finally, an analysis of the high resolution scans of kenaf KK60 is presented
to identify the chemical groups and discuss the evolution of the surface composition due to
chemical treatment.
The average chemical compositions and the O/C ratio of the fibre samples are listed in Table
3.4 and illustrated in Figure 3.9.
49
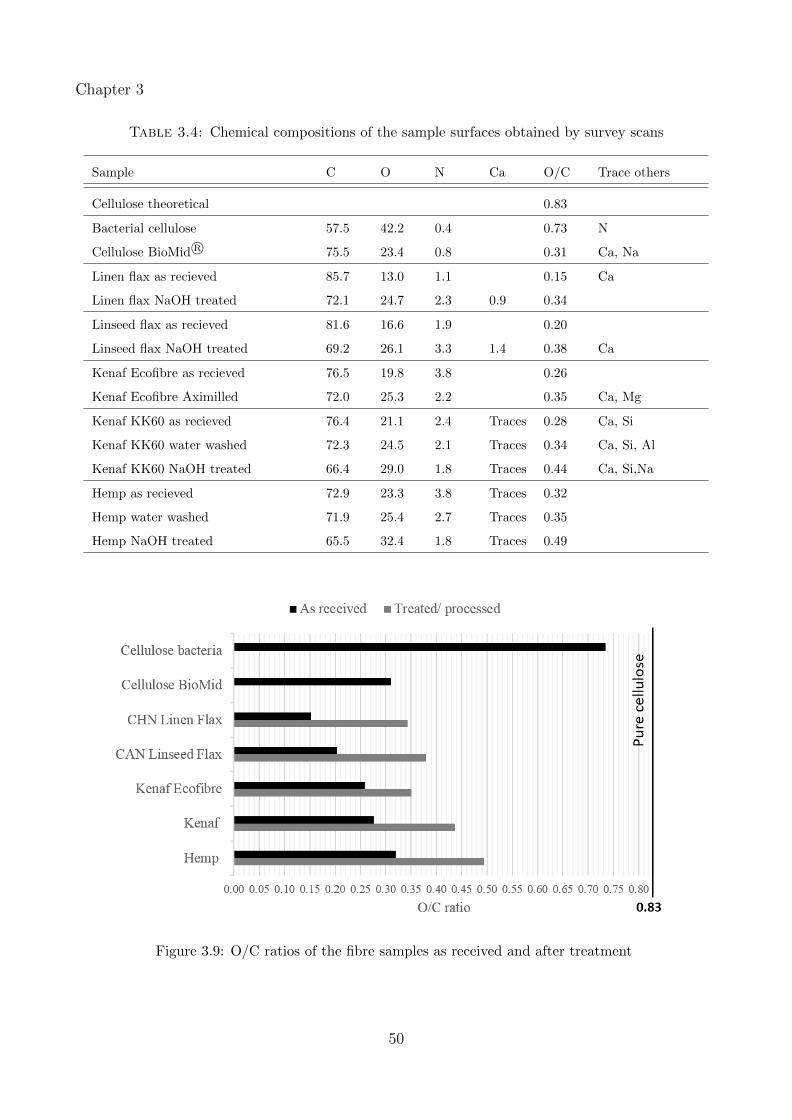
Chapter 3
Table 3.4: Chemical compositions of the sample surfaces obtained by survey scans
Sample C O N Ca O/C Trace others
Cellulose theoretical 0.83
Bacterial cellulose 57.5 42.2 0.4 0.73 N
Cellulose BioMid R© 75.5 23.4 0.8 0.31 Ca, Na
Linen flax as recieved 85.7 13.0 1.1 0.15 Ca
Linen flax NaOH treated 72.1 24.7 2.3 0.9 0.34
Linseed flax as recieved 81.6 16.6 1.9 0.20
Linseed flax NaOH treated 69.2 26.1 3.3 1.4 0.38 Ca
Kenaf Ecofibre as recieved 76.5 19.8 3.8 0.26
Kenaf Ecofibre Aximilled 72.0 25.3 2.2 0.35 Ca, Mg
Kenaf KK60 as recieved 76.4 21.1 2.4 Traces 0.28 Ca, Si
Kenaf KK60 water washed 72.3 24.5 2.1 Traces 0.34 Ca, Si, Al
Kenaf KK60 NaOH treated 66.4 29.0 1.8 Traces 0.44 Ca, Si,Na
Hemp as recieved 72.9 23.3 3.8 Traces 0.32
Hemp water washed 71.9 25.4 2.7 Traces 0.35
Hemp NaOH treated 65.5 32.4 1.8 Traces 0.49
Figure 3.9: O/C ratios of the fibre samples as received and after treatment
50
Chapter 3
Firstly, the O/C ratios obtained from the fibres as received were far lower than the O/C ratio
of pure cellulose (0.83), indicating that the fibre surfaces contained several components other
than cellulose. This was expected, given the composition of bast fibres, and the values obtained
agree well with XPS data found by previous authors. Sgriccia et al. [2008] observed higher
O/C ratio for kenaf fibres (0.45) than for hemp (0.27) and flax fibres (0.19). Tserki et al. [2005]
reported similar O/C values for hemp (0.26) and slightly higher values for flax (0.24) but other
authors reported low O/C values for flax fibres. Stricher [2012] analysed flax LINEO R© fibres
and estimated an O/C of about 0.19 and Csiszar et al. [2013] found O/C of 0.16. Zafeiropoulos
et al. [2003] studied green flax and dew retted flax with XPS and found O/C ratios of 0.22 and
0.25 respectively. The authors claimed that these low O/C values resulted from a surface rich
in waxes and lignins.
Cellulose BioMid R© surface displayed a ratio O/C of 0.31 that is far from the theoretical ratio of
pure cellulose. The surface seemed rather similar to kenaf and hemp (both are produced also at
industrial scale) with a O/C ratio of 0.28 and 0.32 respectively. The cellulose paper-like surface
produced from bacteria showed an average O/C ratio of 0.73 that is much closer to pure cellulose.
Dorris and Gray [1978b] and Andresen et al. [2006] found similar values on XPS analysis of
cellulose fibres from filter paper (0.79 to 0.83 and 0.74 respectively). In the current study, a set of
three cellulose samples from different production batches have been analysed and showed similar
values from 0.70 to 0.75, hence the average value was assumed to be representative. A possible
sample contamination with carbon may have induced the slightly lower values than that of pure
cellulose and is often observed on cellulose samples [Johansson and Campbell, 2004]. Traces of
nitrogen were detected in one of the specimen, which suggested residual bacteria on the sample
surface. Bacteria contain multiple intracellular organic molecules including proteins, made from
chains of amino acids that contain amine groups [Carpita and Gibeaut, 1993, Cosgrove, 1997].
Fibres subjected to milling have seen their O/C ratio increased by ca. 35% that could be
explained by the fibre breaking and defibrillation. In an Aximill, the fibres are exposed to high
velocity air flow that generates two reverse cyclones leading the fibres bundles to break and
separate as they impact each other and the chamber wall. The epidermal tissues and cuticle
attached to the fibres were also likely removed during dry milling. These epidermal tissues had
low O/C ratio, which explains the increase in O/C observed after the Aximilling process. This
51
Chapter 3
mechanical process seemed to have less impact on the fibre surface properties than the alkaline
treatments. The O/C ratio increased by 50% minimum after alkaline treatment and by 35%
only after the Aximilling process. However, the comparison between both processes should
be done with caution. The surface may have been modified to different levels (depth) and in
various aspects; not only chemically but structurally (surface roughness, degree of separation)
and a comparison based on survey scan only could be misleading.
The effect of alkaline treatment on O/C ratio was clear for all specimens: O/C increased
considerably by more than 50% on hemp fibres and up to 125% on flax fibres. It would be
incorrect to compare directly the chemical compositions between the specimens because the
alkaline treatments applied were different. Kenaf KK60 fibres were subjected to an aggressive
treatment with sodium silicate and caustic soda while the flax fibres were immersed in a more
gentle alkaline solution. Hemp fibres were treated with an intermediate alkaline solution. This
will be discussed in detail later.
At this level, based on survey scan data, interpretation of the chemical composition evolution
is anything but straightforward because the mechanisms involved may be different and might
still result in similar O/C values (linen flax and kenaf Ecofibre for example).
The highest O/C ratio increase has been observed on the flax fibre specimens, with an augmen-
tation of 90% and 125% for the linseed and the linen flax respectively. The variability between
the two types of flax subjected to same treatment is of particular interest. This could be related
to the fibre properties in their as received state: both fibre surfaces showed different O/C ratios
(0.15 for linen flax vs. 0.20 for linseed flax). This was expected as flax grown for seeds and
linen flax go through different cultivation routes. Linseed flax culture maximises seed yield
hence harvest occurs at full seed maturity whereas flax linen is harvested earlier for optimal
fibre quality [Bismarck et al., 2005]. Bast fibre structure and chemical composition are closely
related to plant maturity and the linseed and linen flax fibre surfaces differ in both chemistry
and physical structure [Akin, 2012]. Also, linseed flax stems are thicker and more difficult to
extract than flax linen stems. In our study, the linseed flax fibres were unretted and extracted
by hammer mill. This mechanical process is aggressive on the fibres and likely induced kinks
that act as stress concentration points and are preferential sites for chemical reaction [Hanninen
et al., 2012]. Unretted fibres likely contain more pectins, waxes and non-cellulosic molecules
52
Chapter 3
than the water retted fibres [Akin, 2012]. For all the reasons aforementioned, it was expected
that alkaline treatment may alter the fibres in different ways. Note that the O/C ratio of lin-
seed flax sample as received was lower than the O/C values usually attributed to fibres rich in
lignin (at maturity) which range around 0.30 or above [Johansson, 2002]. Morvan et al. [2003]
previously questioned the amount of lignin and its location in flax fibre walls. The O/C ratio
observed in this study suggests the predominance of extractives and pectins on the surface as
the fibres were not retted. Extractives are indeed much richer in carbon than polysaccharides
and have lower O/C ratios. For instance, Laine et al. [1994] found O/C values of about 0.12 in
wood pulp.
Note that these observations are not exclusive to this study but can be extended to the dis-
cussions about natural fibre treatment analysis in general: it does not make sense to compare
composition values and O/C ratios without minimal amount of information on the sample (va-
riety, growing conditions, harvest, retting, post- processing). A proper traceability brings clues
to avoid incoherent assumptions and to support data interpretation.
3.3.3.1 Effect of water wash and alkaline treatment on kenaf and hemp fibres
Figure 3.10 shows the survey scan spectra of kenaf and hemp fibres at different stages; as
received, water washed and alkaline treated. The overlays highlight the specificities of each
spectra to detect the presence of singular elements. It is preferable to compare the spectra
with the peak ratios rather than the peak amplitudes because the base line varies between the
runs and so does the signal intensity. The latter depends to some degree on the sample surface
profile, which is particularly true for natural fibres specimens that lay down in bundles like a
nest on the XPS stage.
53

Chapter 3
(a)
(b)
Figure 3.10: Survey scans of (a) kenaf and (b) hemp fibres at different stages: 1. As received,2. Water washed and 3. Alkaline treated
54
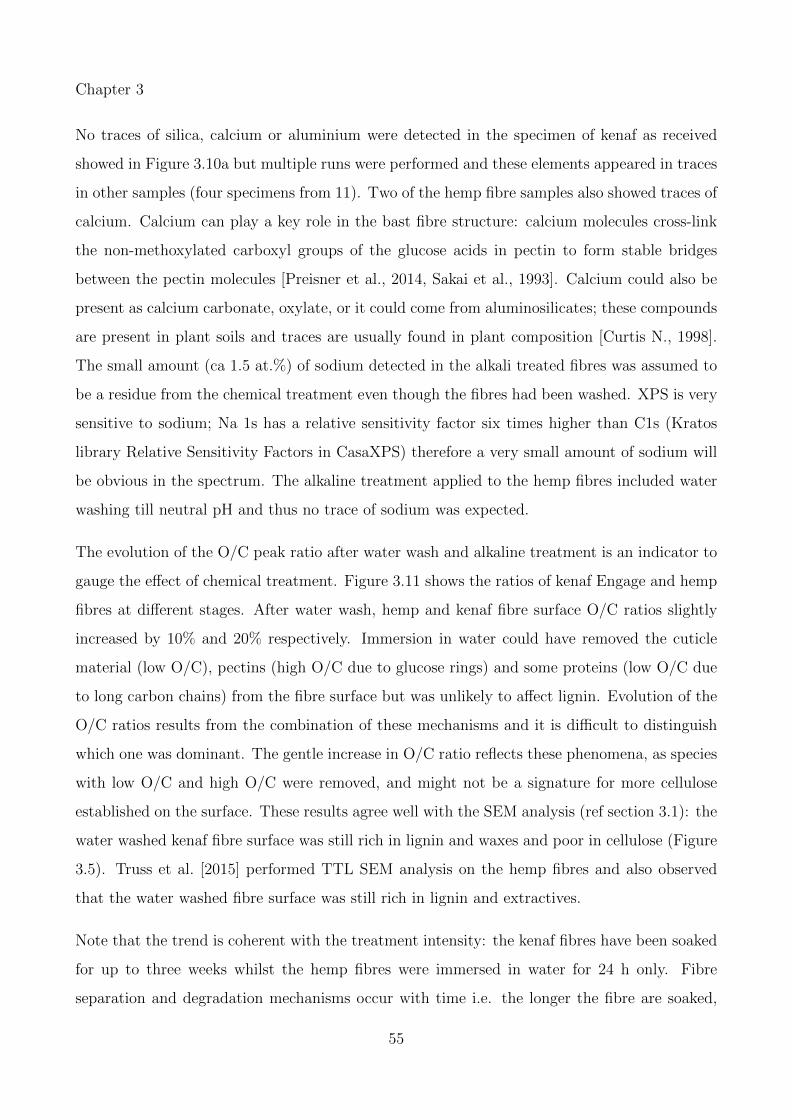
Chapter 3
No traces of silica, calcium or aluminium were detected in the specimen of kenaf as received
showed in Figure 3.10a but multiple runs were performed and these elements appeared in traces
in other samples (four specimens from 11). Two of the hemp fibre samples also showed traces of
calcium. Calcium can play a key role in the bast fibre structure: calcium molecules cross-link
the non-methoxylated carboxyl groups of the glucose acids in pectin to form stable bridges
between the pectin molecules [Preisner et al., 2014, Sakai et al., 1993]. Calcium could also be
present as calcium carbonate, oxylate, or it could come from aluminosilicates; these compounds
are present in plant soils and traces are usually found in plant composition [Curtis N., 1998].
The small amount (ca 1.5 at.%) of sodium detected in the alkali treated fibres was assumed to
be a residue from the chemical treatment even though the fibres had been washed. XPS is very
sensitive to sodium; Na 1s has a relative sensitivity factor six times higher than C1s (Kratos
library Relative Sensitivity Factors in CasaXPS) therefore a very small amount of sodium will
be obvious in the spectrum. The alkaline treatment applied to the hemp fibres included water
washing till neutral pH and thus no trace of sodium was expected.
The evolution of the O/C peak ratio after water wash and alkaline treatment is an indicator to
gauge the effect of chemical treatment. Figure 3.11 shows the ratios of kenaf Engage and hemp
fibres at different stages. After water wash, hemp and kenaf fibre surface O/C ratios slightly
increased by 10% and 20% respectively. Immersion in water could have removed the cuticle
material (low O/C), pectins (high O/C due to glucose rings) and some proteins (low O/C due
to long carbon chains) from the fibre surface but was unlikely to affect lignin. Evolution of the
O/C ratios results from the combination of these mechanisms and it is difficult to distinguish
which one was dominant. The gentle increase in O/C ratio reflects these phenomena, as species
with low O/C and high O/C were removed, and might not be a signature for more cellulose
established on the surface. These results agree well with the SEM analysis (ref section 3.1): the
water washed kenaf fibre surface was still rich in lignin and waxes and poor in cellulose (Figure
3.5). Truss et al. [2015] performed TTL SEM analysis on the hemp fibres and also observed
that the water washed fibre surface was still rich in lignin and extractives.
Note that the trend is coherent with the treatment intensity: the kenaf fibres have been soaked
for up to three weeks whilst the hemp fibres were immersed in water for 24 h only. Fibre
separation and degradation mechanisms occur with time i.e. the longer the fibre are soaked,
55
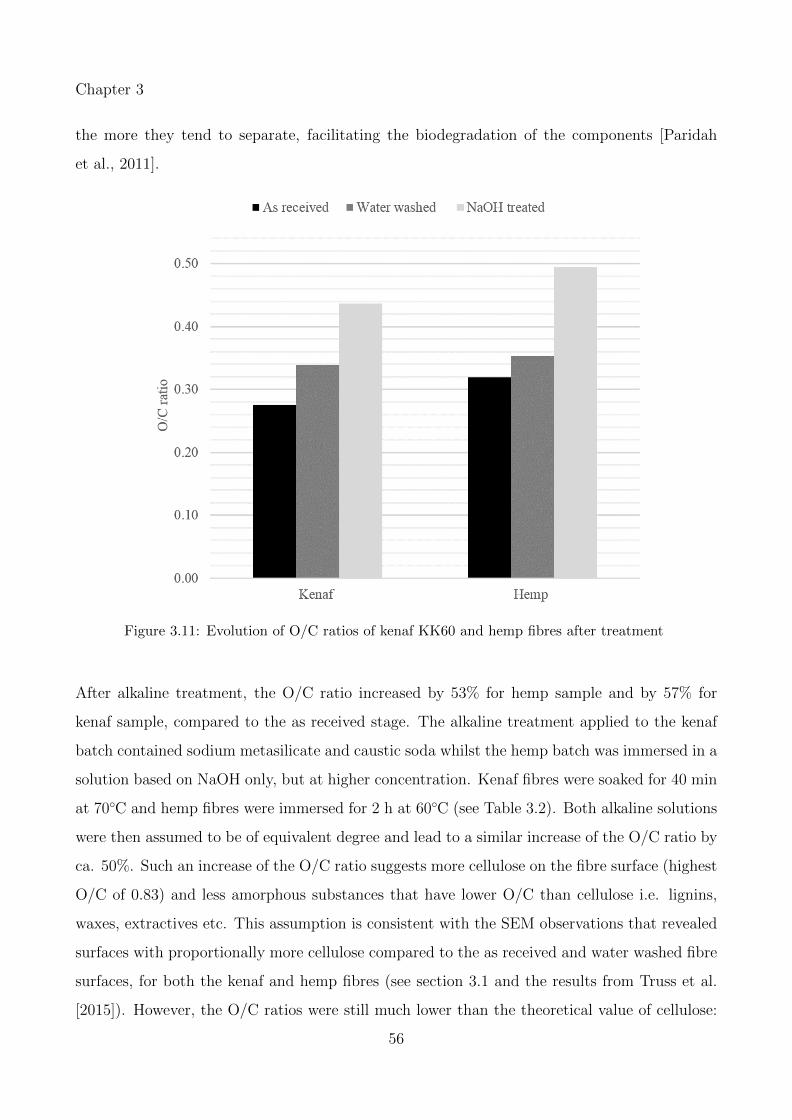
Chapter 3
the more they tend to separate, facilitating the biodegradation of the components [Paridah
et al., 2011].
Figure 3.11: Evolution of O/C ratios of kenaf KK60 and hemp fibres after treatment
After alkaline treatment, the O/C ratio increased by 53% for hemp sample and by 57% for
kenaf sample, compared to the as received stage. The alkaline treatment applied to the kenaf
batch contained sodium metasilicate and caustic soda whilst the hemp batch was immersed in a
solution based on NaOH only, but at higher concentration. Kenaf fibres were soaked for 40 min
at 70◦C and hemp fibres were immersed for 2 h at 60◦C (see Table 3.2). Both alkaline solutions
were then assumed to be of equivalent degree and lead to a similar increase of the O/C ratio by
ca. 50%. Such an increase of the O/C ratio suggests more cellulose on the fibre surface (highest
O/C of 0.83) and less amorphous substances that have lower O/C than cellulose i.e. lignins,
waxes, extractives etc. This assumption is consistent with the SEM observations that revealed
surfaces with proportionally more cellulose compared to the as received and water washed fibre
surfaces, for both the kenaf and hemp fibres (see section 3.1 and the results from Truss et al.
[2015]). However, the O/C ratios were still much lower than the theoretical value of cellulose:
56
Chapter 3
hemp fibres had an O/C of 0.49 and kenaf 0.44 compared to 0.83 for pure cellulose. This agrees
as well with the SEM results that showed in both cases the alkaline treated fibre surfaces were
still rich in lignins and extractives.
It is worth noting that a comparison based solely on the O/C ratio absolute values could be
misleading. For instance, both water washes seemed to produce the same effect on the fibres
(hemp O/C ratio reached 0.35 and kenaf O/C ratio was 0.34 after water wash) and alkaline
treatment seemed to be more efficient on hemp than on kenaf (final O/C was 0.49 and 0.44 for
hemp and kenaf respectively). However, as mentioned previously, discussions based on the O/C
values only should be treated with caution because similar O/C can be obtained from different
surface chemistries. Information on the fibre as received (origin, processing) and details on
the chemical treatments largely helped to interpret the data. For a better understanding of
the fibre surface chemistry and to validate the assumptions made, further analysis with high
resolution scans is needed.
3.3.3.2 High resolution scans
High resolution scans were performed over the main elements of interest to study their “chem-
istry” and deduce which chemical functional groups were present on the sample surface. These
scans give information on the chemical shift; the change in Binding Energy (BE) of a core
electron due to a change in chemical bonding of that electron. Core binding energies are deter-
mined by the electrostatic interactions between the core and the nucleus. Binding energies are
reduced or increased depending on whether a valence electron charge is withdrawn or added
respectively. Hence, for each element, secondary peaks appear at specific binding energies cor-
responding to different chemical bonding. These peaks can be dissociated from each other and
identified by peak fitting the XPS spectra.
In practice, the XPS spectra is fitted with a series of single peaks positioned so that the sum
envelope fits the experimental curve. Each single peak can be (and should be) attributed to a
chemical bonding by identification with the corresponding element BE. References for C1s, O1s
and N1s binding energies can be found in the literature (Beamson and Briggs [1992], Ratner
and Castner [2009]) and a large database established by the National Institute of Standards
57
Chapter 3
and Technology (NIST) is available online (srdata.nist.gov). Note that the chemical shifts may
vary slightly depending on the chemical environment of the atoms i.e. in complex molecules.
This is particularly true for natural fibre surfaces as these contain various polysaccharides and
other extractives components that comprise aromatic groups. A comprehensive peak fitting of
the main elements (C, O and N) should provide key information to identify which functional
groups are present (or not) on the sample surface.
Peak fitting is powerful but it is a difficult task since peak deconvolution must be fastidious to
be correct (Artyushkova [2010]). Peak fitting can have shallow minima so several options may
have similar goodness of fit. However, peak shapes and widths are not arbitrary but rather
follow models built on physics (Gaussian- Lorentzian shape etc.). Hence, specific rules and
criteria apply to ensure the curve fit is coherent, reproducible and as accurate as possible. Four
essential rules have been established (Artyushkova [2010], Beamson and Briggs [1992]):
• All peaks within the same element should have the same (± 0.2 eV) Full Width Half Maximum
(FWHM). In complex molecules, tolerance up to ± 0.5 eV may be justified.
• When comparing multiple samples from the same specimen (for instance fibres before and
after treatment), the reference sample is first curve fitted and the other spectra are fitted
following the same constraints. The BE and FWHM should be constrained to ± 0.2 eV. New
peaks are added if necessary.
• If there is no reference sample, one sample is taken as a reference and the other spectra are
curve fitted with the constraints mentioned above.
• Cross correlation between the elements is a key indication to verify that the deconvolution
is coherent. For example, if the peak representative of C-N=O bond is identified in the C1s
spectrum, it should be present as well in N1s and O1s spectra.
The following case study focuses on the kenaf fibre samples. High resolution scans were per-
formed on C, O and N. Peaks were curve fitted with CasaXPS software according to the criteria
mentioned previously (BE, FWHM). The alkaline treated fibre sample was taken as a reference
assuming that it would be the “simplest” among the three samples because the peaks were
sharp and distinct. The peak fitting model was then applied to the water washed fibre sample
58
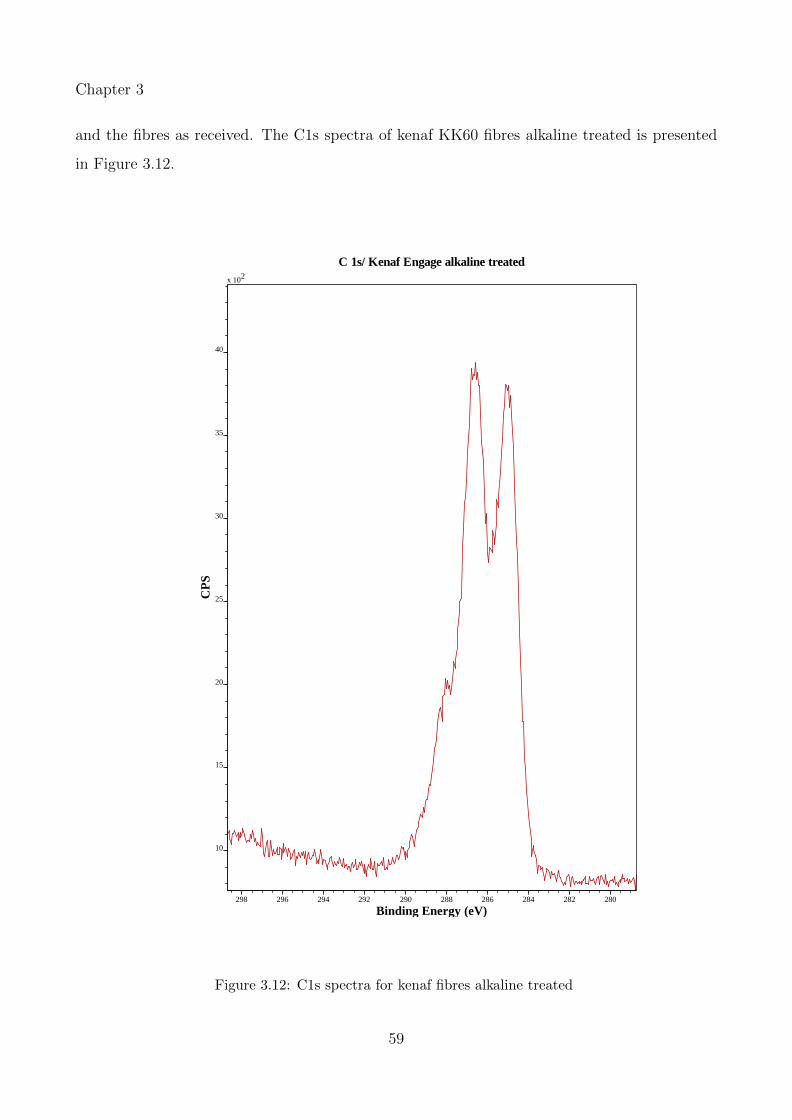
Chapter 3
and the fibres as received. The C1s spectra of kenaf KK60 fibres alkaline treated is presented
in Figure 3.12.
C 1s/ Kenaf Engage alkaline treatedx 102
10
15
20
25
30
35
40
CP
S
298 296 294 292 290 288 286 284 282 280
Binding Energy (eV)
Figure 3.12: C1s spectra for kenaf fibres alkaline treated
59
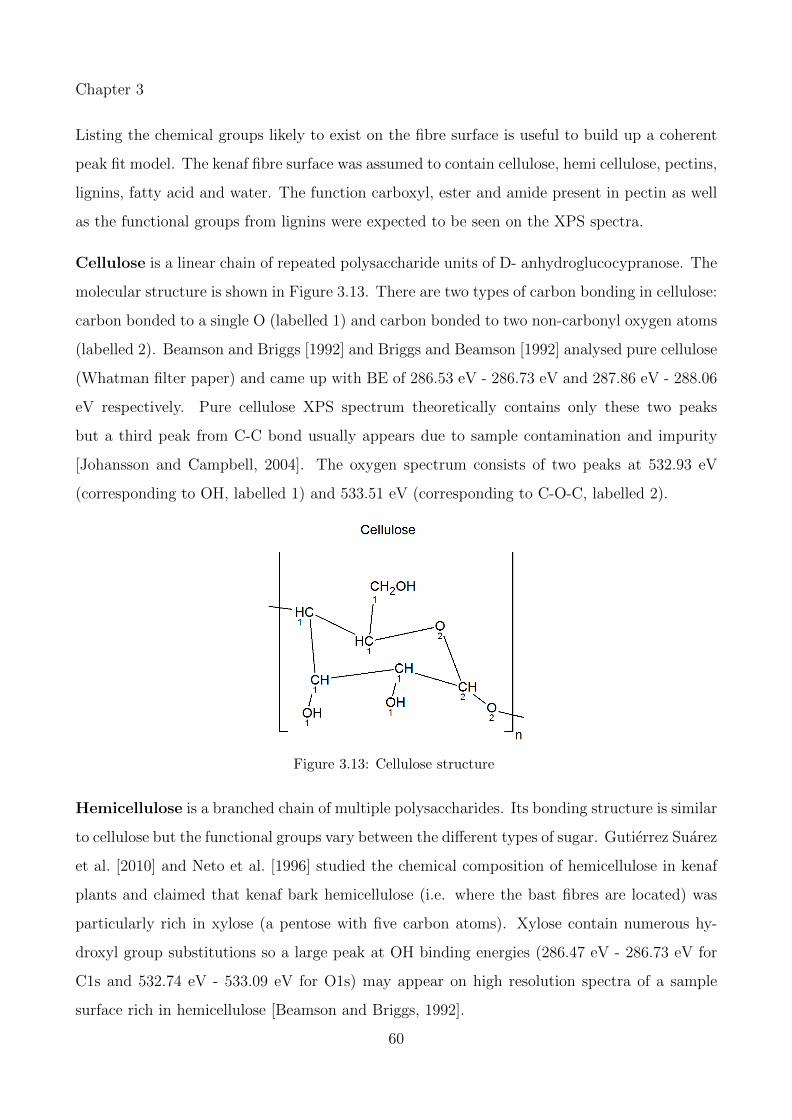
Chapter 3
Listing the chemical groups likely to exist on the fibre surface is useful to build up a coherent
peak fit model. The kenaf fibre surface was assumed to contain cellulose, hemi cellulose, pectins,
lignins, fatty acid and water. The function carboxyl, ester and amide present in pectin as well
as the functional groups from lignins were expected to be seen on the XPS spectra.
Cellulose is a linear chain of repeated polysaccharide units of D- anhydroglucocypranose. The
molecular structure is shown in Figure 3.13. There are two types of carbon bonding in cellulose:
carbon bonded to a single O (labelled 1) and carbon bonded to two non-carbonyl oxygen atoms
(labelled 2). Beamson and Briggs [1992] and Briggs and Beamson [1992] analysed pure cellulose
(Whatman filter paper) and came up with BE of 286.53 eV - 286.73 eV and 287.86 eV - 288.06
eV respectively. Pure cellulose XPS spectrum theoretically contains only these two peaks
but a third peak from C-C bond usually appears due to sample contamination and impurity
[Johansson and Campbell, 2004]. The oxygen spectrum consists of two peaks at 532.93 eV
(corresponding to OH, labelled 1) and 533.51 eV (corresponding to C-O-C, labelled 2).
Figure 3.13: Cellulose structure
Hemicellulose is a branched chain of multiple polysaccharides. Its bonding structure is similar
to cellulose but the functional groups vary between the different types of sugar. Gutierrez Suarez
et al. [2010] and Neto et al. [1996] studied the chemical composition of hemicellulose in kenaf
plants and claimed that kenaf bark hemicellulose (i.e. where the bast fibres are located) was
particularly rich in xylose (a pentose with five carbon atoms). Xylose contain numerous hy-
droxyl group substitutions so a large peak at OH binding energies (286.47 eV - 286.73 eV for
C1s and 532.74 eV - 533.09 eV for O1s) may appear on high resolution spectra of a sample
surface rich in hemicellulose [Beamson and Briggs, 1992].
60
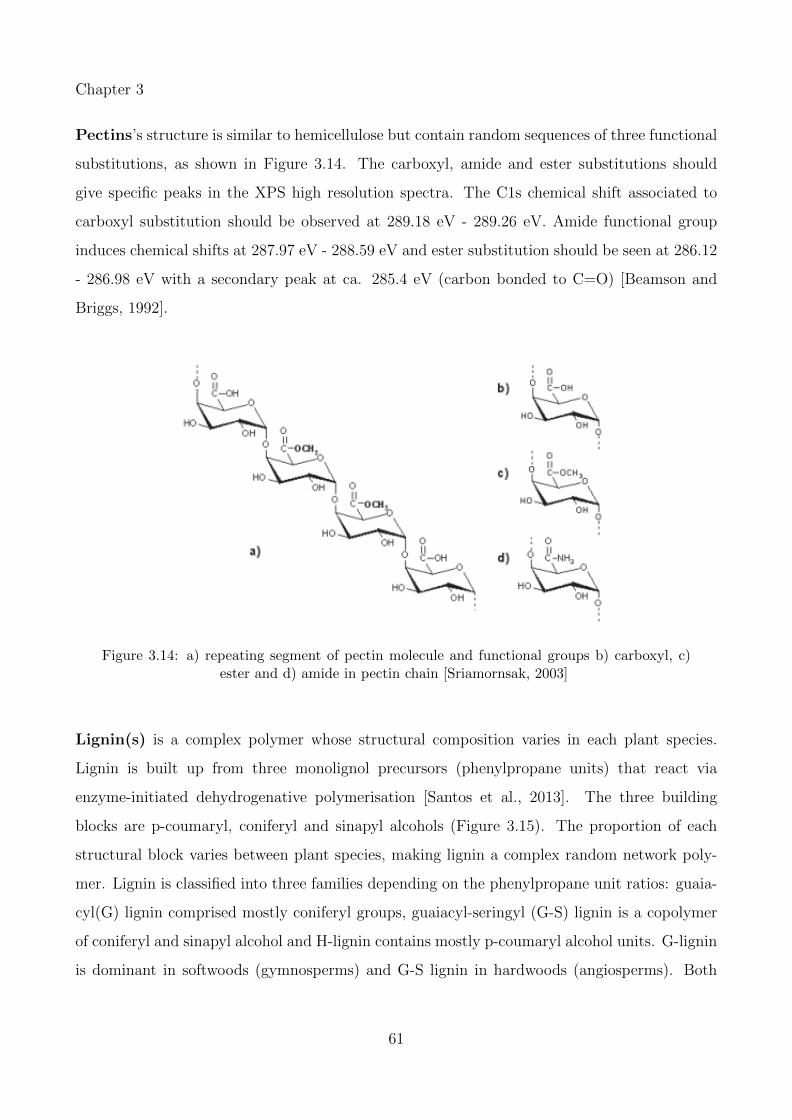
Chapter 3
Pectins’s structure is similar to hemicellulose but contain random sequences of three functional
substitutions, as shown in Figure 3.14. The carboxyl, amide and ester substitutions should
give specific peaks in the XPS high resolution spectra. The C1s chemical shift associated to
carboxyl substitution should be observed at 289.18 eV - 289.26 eV. Amide functional group
induces chemical shifts at 287.97 eV - 288.59 eV and ester substitution should be seen at 286.12
- 286.98 eV with a secondary peak at ca. 285.4 eV (carbon bonded to C=O) [Beamson and
Briggs, 1992].
Figure 3.14: a) repeating segment of pectin molecule and functional groups b) carboxyl, c)ester and d) amide in pectin chain [Sriamornsak, 2003]
Lignin(s) is a complex polymer whose structural composition varies in each plant species.
Lignin is built up from three monolignol precursors (phenylpropane units) that react via
enzyme-initiated dehydrogenative polymerisation [Santos et al., 2013]. The three building
blocks are p-coumaryl, coniferyl and sinapyl alcohols (Figure 3.15). The proportion of each
structural block varies between plant species, making lignin a complex random network poly-
mer. Lignin is classified into three families depending on the phenylpropane unit ratios: guaia-
cyl(G) lignin comprised mostly coniferyl groups, guaiacyl-seringyl (G-S) lignin is a copolymer
of coniferyl and sinapyl alcohol and H-lignin contains mostly p-coumaryl alcohol units. G-lignin
is dominant in softwoods (gymnosperms) and G-S lignin in hardwoods (angiosperms). Both
61
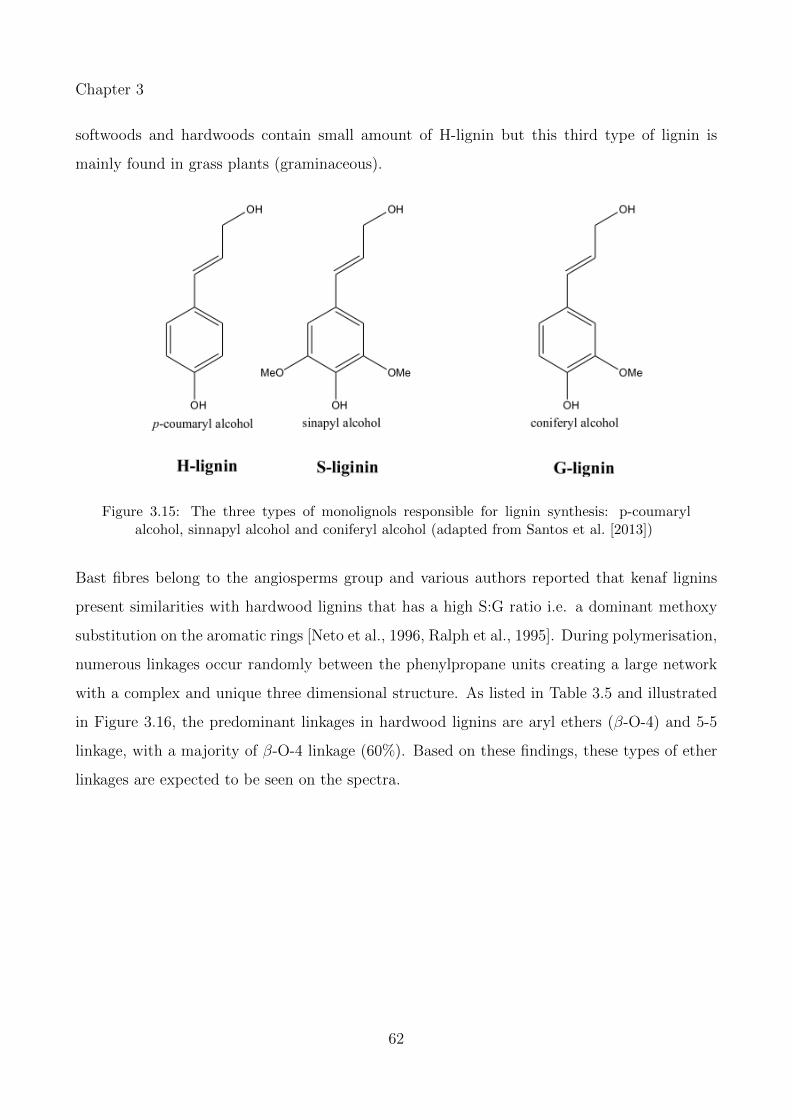
Chapter 3
softwoods and hardwoods contain small amount of H-lignin but this third type of lignin is
mainly found in grass plants (graminaceous).
Figure 3.15: The three types of monolignols responsible for lignin synthesis: p-coumarylalcohol, sinnapyl alcohol and coniferyl alcohol (adapted from Santos et al. [2013])
Bast fibres belong to the angiosperms group and various authors reported that kenaf lignins
present similarities with hardwood lignins that has a high S:G ratio i.e. a dominant methoxy
substitution on the aromatic rings [Neto et al., 1996, Ralph et al., 1995]. During polymerisation,
numerous linkages occur randomly between the phenylpropane units creating a large network
with a complex and unique three dimensional structure. As listed in Table 3.5 and illustrated
in Figure 3.16, the predominant linkages in hardwood lignins are aryl ethers (β-O-4) and 5-5
linkage, with a majority of β-O-4 linkage (60%). Based on these findings, these types of ether
linkages are expected to be seen on the spectra.
62
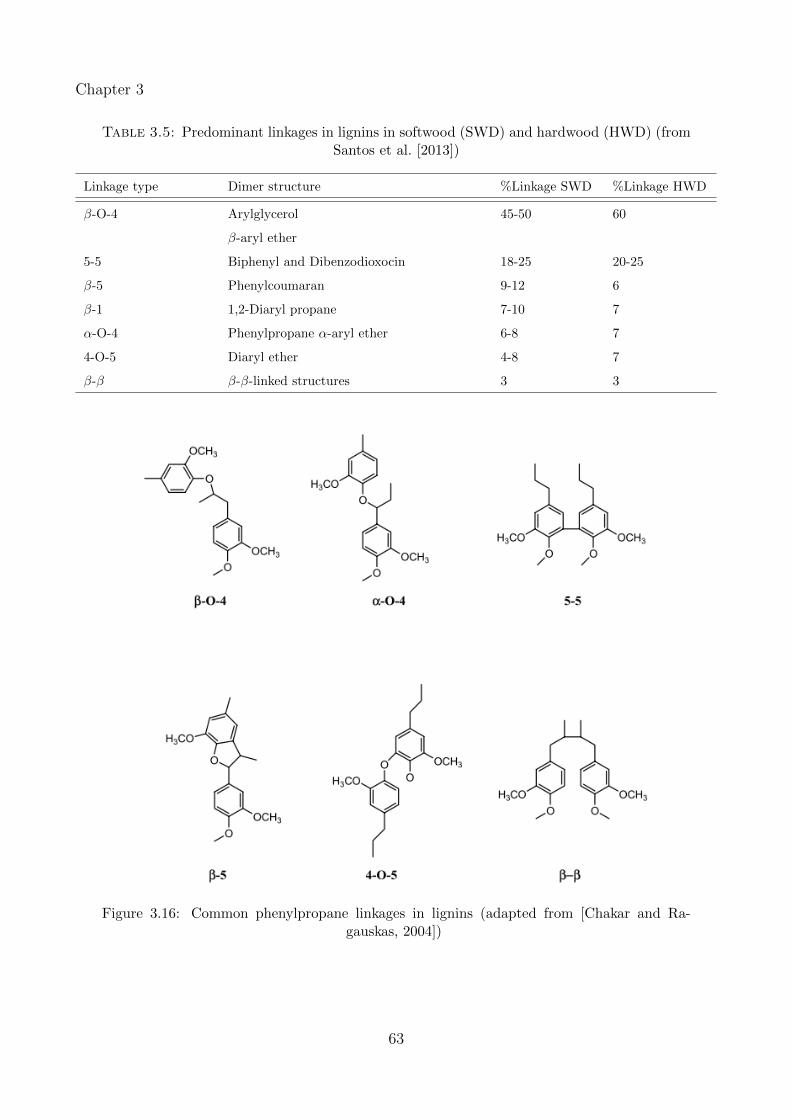
Chapter 3
Table 3.5: Predominant linkages in lignins in softwood (SWD) and hardwood (HWD) (fromSantos et al. [2013])
Linkage type Dimer structure %Linkage SWD %Linkage HWD
β-O-4 Arylglycerol
β-aryl ether
45-50 60
5-5 Biphenyl and Dibenzodioxocin 18-25 20-25
β-5 Phenylcoumaran 9-12 6
β-1 1,2-Diaryl propane 7-10 7
α-O-4 Phenylpropane α-aryl ether 6-8 7
4-O-5 Diaryl ether 4-8 7
β-β β-β-linked structures 3 3
Figure 3.16: Common phenylpropane linkages in lignins (adapted from [Chakar and Ra-gauskas, 2004])
63
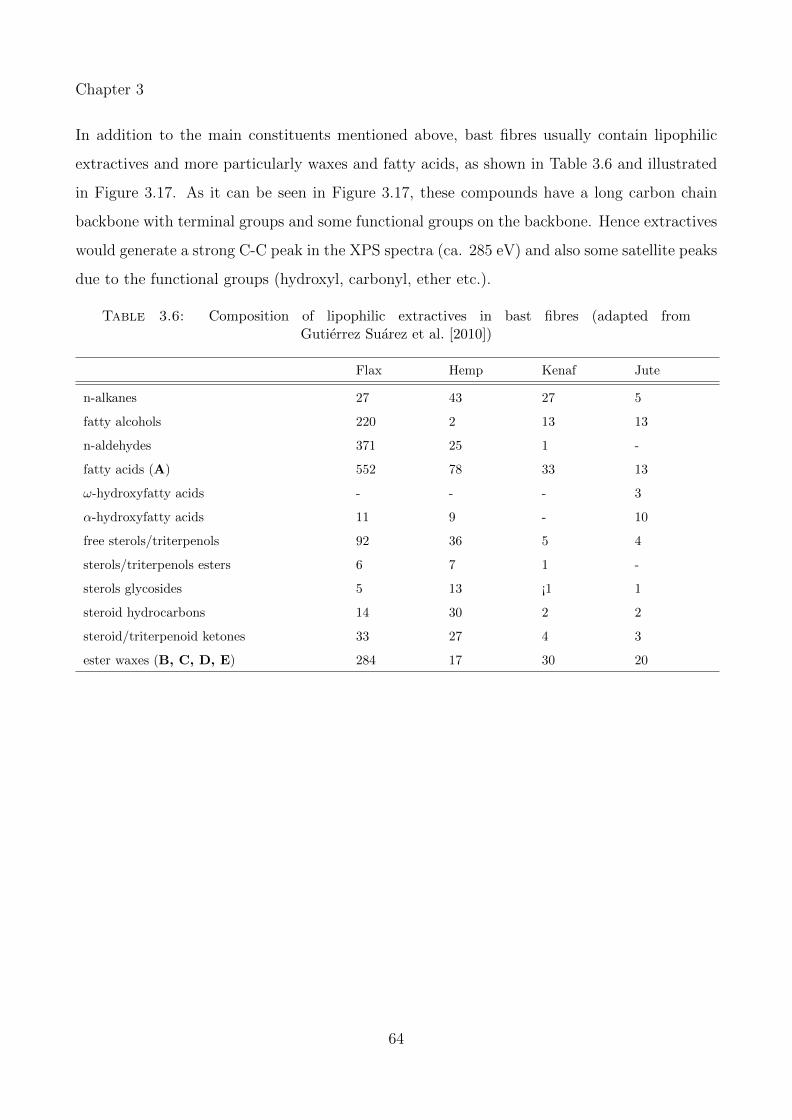
Chapter 3
In addition to the main constituents mentioned above, bast fibres usually contain lipophilic
extractives and more particularly waxes and fatty acids, as shown in Table 3.6 and illustrated
in Figure 3.17. As it can be seen in Figure 3.17, these compounds have a long carbon chain
backbone with terminal groups and some functional groups on the backbone. Hence extractives
would generate a strong C-C peak in the XPS spectra (ca. 285 eV) and also some satellite peaks
due to the functional groups (hydroxyl, carbonyl, ether etc.).
Table 3.6: Composition of lipophilic extractives in bast fibres (adapted fromGutierrez Suarez et al. [2010])
Flax Hemp Kenaf Jute
n-alkanes 27 43 27 5
fatty alcohols 220 2 13 13
n-aldehydes 371 25 1 -
fatty acids (A) 552 78 33 13
ω-hydroxyfatty acids - - - 3
α-hydroxyfatty acids 11 9 - 10
free sterols/triterpenols 92 36 5 4
sterols/triterpenols esters 6 7 1 -
sterols glycosides 5 13 ¡1 1
steroid hydrocarbons 14 30 2 2
steroid/triterpenoid ketones 33 27 4 3
ester waxes (B, C, D, E) 284 17 30 20
64
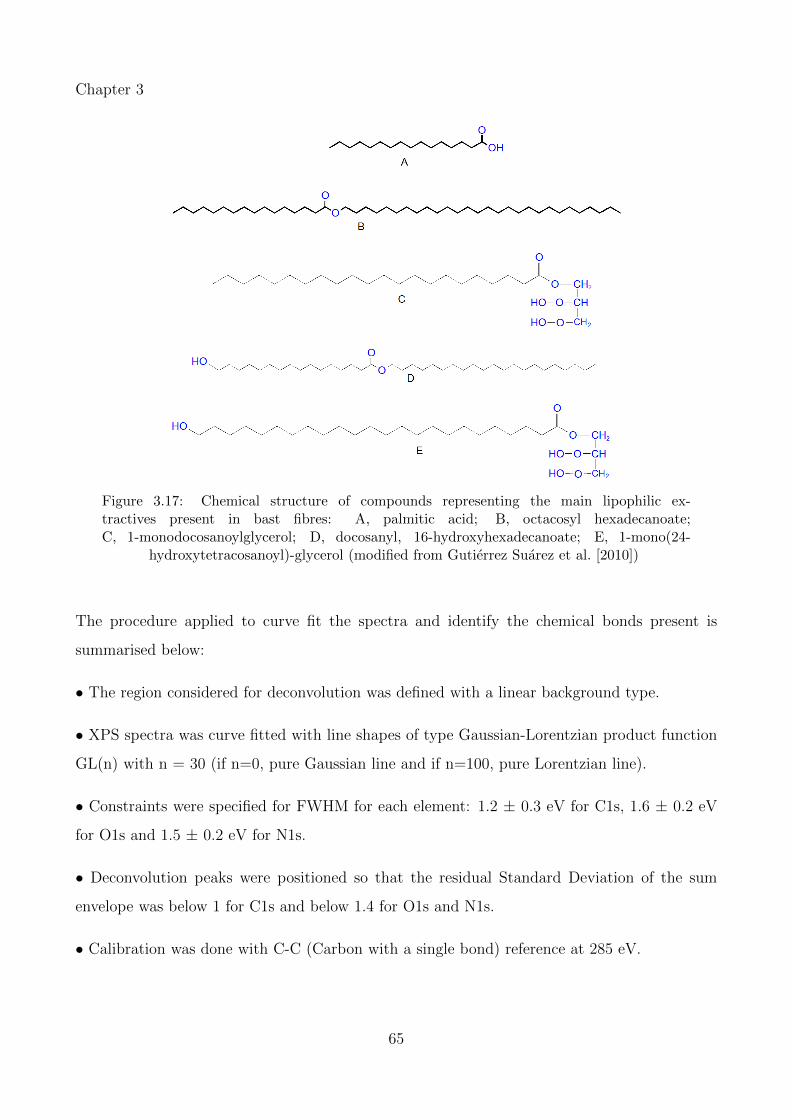
Chapter 3
Figure 3.17: Chemical structure of compounds representing the main lipophilic ex-tractives present in bast fibres: A, palmitic acid; B, octacosyl hexadecanoate;C, 1-monodocosanoylglycerol; D, docosanyl, 16-hydroxyhexadecanoate; E, 1-mono(24-
hydroxytetracosanoyl)-glycerol (modified from Gutierrez Suarez et al. [2010])
The procedure applied to curve fit the spectra and identify the chemical bonds present is
summarised below:
• The region considered for deconvolution was defined with a linear background type.
• XPS spectra was curve fitted with line shapes of type Gaussian-Lorentzian product function
GL(n) with n = 30 (if n=0, pure Gaussian line and if n=100, pure Lorentzian line).
• Constraints were specified for FWHM for each element: 1.2 ± 0.3 eV for C1s, 1.6 ± 0.2 eV
for O1s and 1.5 ± 0.2 eV for N1s.
• Deconvolution peaks were positioned so that the residual Standard Deviation of the sum
envelope was below 1 for C1s and below 1.4 for O1s and N1s.
• Calibration was done with C-C (Carbon with a single bond) reference at 285 eV.
65

Chapter 3
• Each single peak was attributed to a specific chemical bond by identification with reference
to published in the literature (Beamson and Briggs [1992], Ratner and Castner [2009]) and the
NIST database.
• Cross-correlation between N, C and O was performed to check the peak fitting model
66
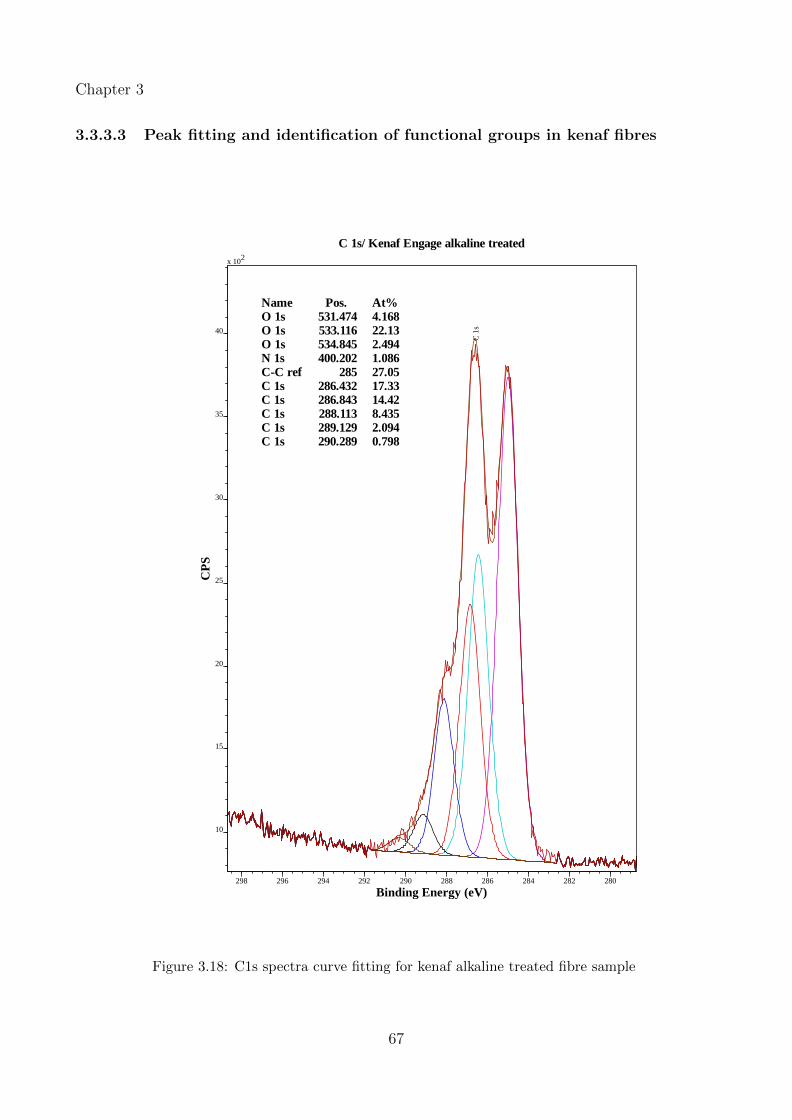
Chapter 3
3.3.3.3 Peak fitting and identification of functional groups in kenaf fibres
C 1s/ Kenaf Engage alkaline treated
NameO 1sO 1sO 1sN 1sC-C refC 1sC 1sC 1sC 1sC 1s
Pos.531.474533.116534.845400.202
285286.432286.843288.113289.129290.289
At%4.16822.132.4941.08627.0517.3314.428.4352.0940.798
C 1
s
x 102
10
15
20
25
30
35
40
CP
S
298 296 294 292 290 288 286 284 282 280
Binding Energy (eV)
Figure 3.18: C1s spectra curve fitting for kenaf alkaline treated fibre sample
67
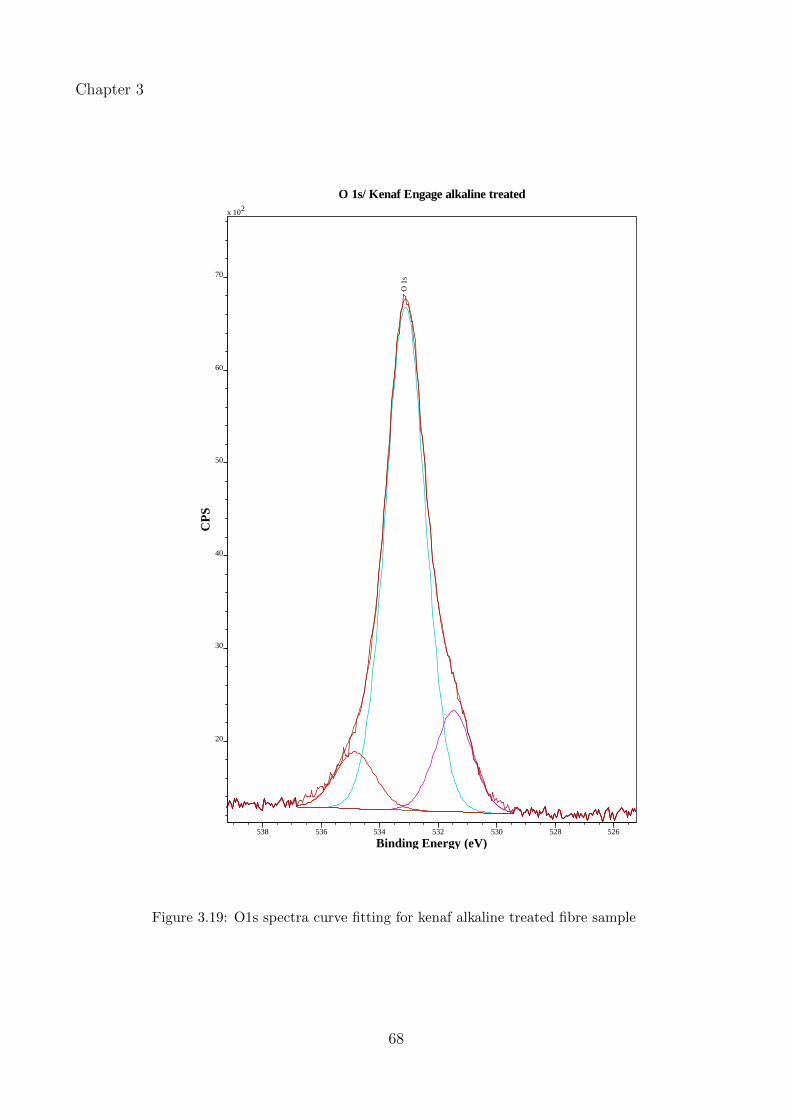
Chapter 3
O 1s/ Kenaf Engage alkaline treated
O 1
s
x 102
20
30
40
50
60
70
CP
S
538 536 534 532 530 528 526
Binding Energy (eV)
Figure 3.19: O1s spectra curve fitting for kenaf alkaline treated fibre sample
68
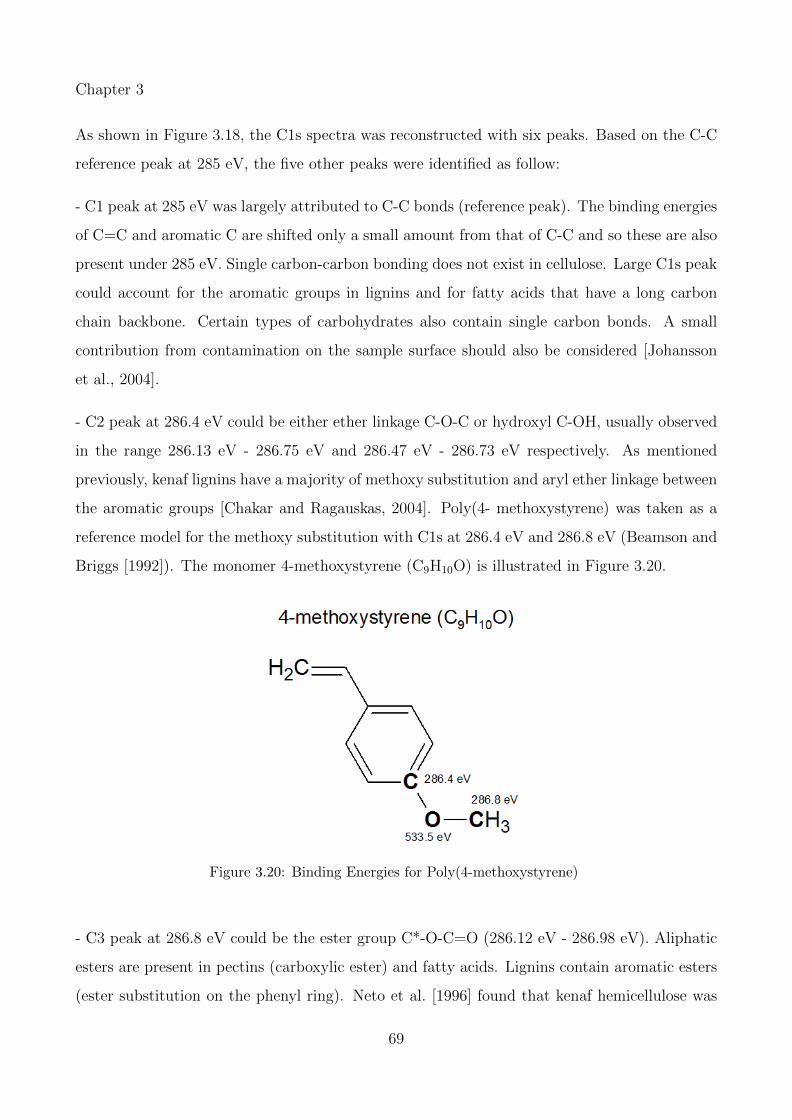
Chapter 3
As shown in Figure 3.18, the C1s spectra was reconstructed with six peaks. Based on the C-C
reference peak at 285 eV, the five other peaks were identified as follow:
- C1 peak at 285 eV was largely attributed to C-C bonds (reference peak). The binding energies
of C=C and aromatic C are shifted only a small amount from that of C-C and so these are also
present under 285 eV. Single carbon-carbon bonding does not exist in cellulose. Large C1s peak
could account for the aromatic groups in lignins and for fatty acids that have a long carbon
chain backbone. Certain types of carbohydrates also contain single carbon bonds. A small
contribution from contamination on the sample surface should also be considered [Johansson
et al., 2004].
- C2 peak at 286.4 eV could be either ether linkage C-O-C or hydroxyl C-OH, usually observed
in the range 286.13 eV - 286.75 eV and 286.47 eV - 286.73 eV respectively. As mentioned
previously, kenaf lignins have a majority of methoxy substitution and aryl ether linkage between
the aromatic groups [Chakar and Ragauskas, 2004]. Poly(4- methoxystyrene) was taken as a
reference model for the methoxy substitution with C1s at 286.4 eV and 286.8 eV (Beamson and
Briggs [1992]). The monomer 4-methoxystyrene (C9H10O) is illustrated in Figure 3.20.
Figure 3.20: Binding Energies for Poly(4-methoxystyrene)
- C3 peak at 286.8 eV could be the ester group C*-O-C=O (286.12 eV - 286.98 eV). Aliphatic
esters are present in pectins (carboxylic ester) and fatty acids. Lignins contain aromatic esters
(ester substitution on the phenyl ring). Neto et al. [1996] found that kenaf hemicellulose was
69
Chapter 3
particularly rich in xylan (xylan is a pentosan i.e. a carbohydrate with five C atoms) and
uronic acids. Uronic acids, which contain both carbonyl and carboxyl acid groups, could also
be present in soluble polysaccharides, for instance in pectins. Das et al. [1984] assumed that
all the uronic acids on the xylan backbone are ester-bonded with lignins, forming a lignin-
carbohydrate complex.
- C4 peak at 288.1 eV is typical from amide functional group N-C=O (287.97 eV - 288.59
eV). C1s peak at 288.1 eV is also O-C-O from cellulose but the O1s characteristic peaks from
cellulose (532.9 eV and 533.5 eV) were missing (Figure 3.19), therefore C4 peak was assigned
to N-C=O and C=O, most likely from pectins and proteins.
- C5 peak at 289.1 eV was attributed to the carbonyl bond in the ester group C-O-C*=O
(288.64 eV - 289.23 eV).
- C6 peak at 290.3 eV could be attributed to carbonate (290.35 eV - 290.44 eV) but the O1s
peaks characteristic from carbonate (532.4 eV and 533.9 eV) were not visible on the O1s spectra
and the concentration was slightly higher than that of Ca observed on the spectra (0.2 at% to
0.4 at%) therefore the presence of CaCO3 was unlikely. As mentioned in the previous section,
Ca can also complex with pectins and form branched macromolecules [Sedan et al., 2007]. The
latter are too complex to be identified and quantified by XPS. C6 peak could also result from
satellite peaks arising from shake up processes that involve Pi-Pi* transition in aromatic groups
[Clark et al., 1976, Morgan, 2014]. This phenomenon is likely to occur in the numerous phenyl
rings in lignins [Dorris and Gray, 1978b].
- The oxygen spectra was peak fitted with a broad central peak at 533.1 eV and two auxiliary
peaks at 531.5 eV and 534.8 eV (Figure 3.19). The broad peak was associated to ester bond
in pectins and in the methoxy substitution, within the tolerance of 0.5 eV (see Figure 3.19).
The low shoulder peak at 531.5 eV was attributed to the amide group (pectins) and carbonyl
bond in ester group (pectins, lignins, fatty acids). The high shoulder peak at 534.8 eV could
be from residual water in the fibre cells [Johansson et al., 1999]. This secondary peak has been
observed previously by Truss et al. [2015] on hemp fibres.
- Nitrogen was curve fitted with a single peak at 400.2 eV. Nitrogen was attributed to amide
N-C=O from pectins and proteins.
70
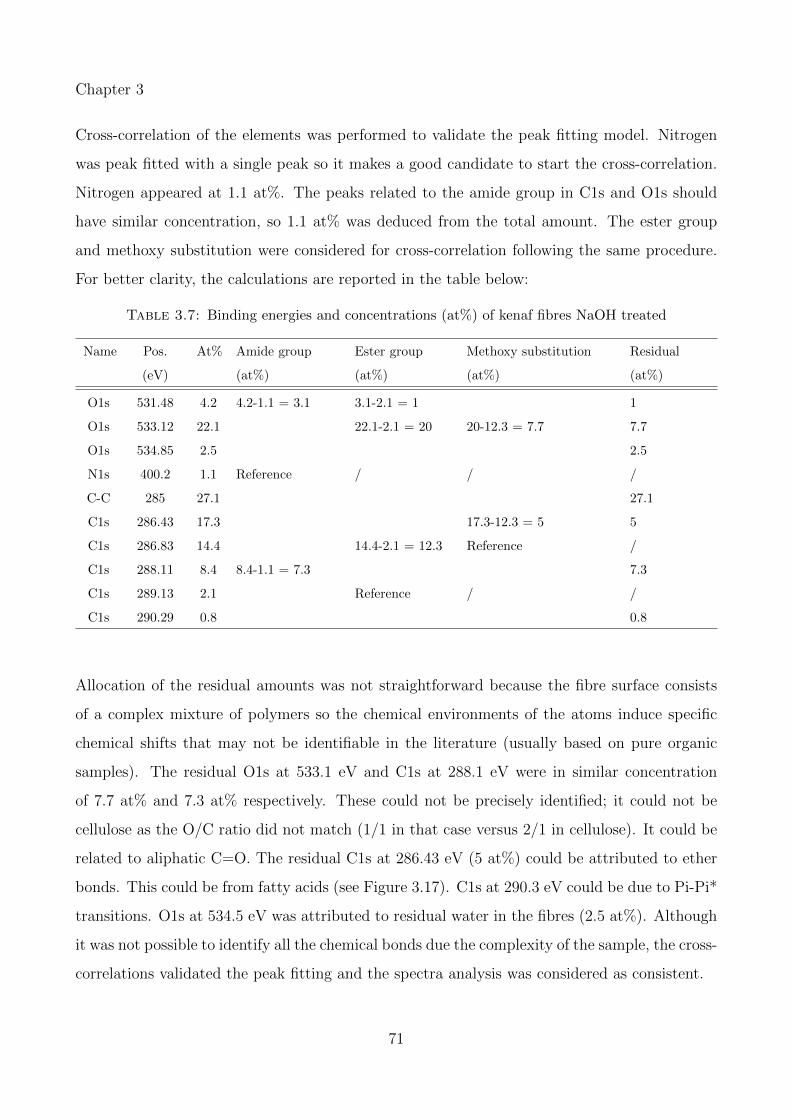
Chapter 3
Cross-correlation of the elements was performed to validate the peak fitting model. Nitrogen
was peak fitted with a single peak so it makes a good candidate to start the cross-correlation.
Nitrogen appeared at 1.1 at%. The peaks related to the amide group in C1s and O1s should
have similar concentration, so 1.1 at% was deduced from the total amount. The ester group
and methoxy substitution were considered for cross-correlation following the same procedure.
For better clarity, the calculations are reported in the table below:
Table 3.7: Binding energies and concentrations (at%) of kenaf fibres NaOH treated
Name Pos.
(eV)
At% Amide group
(at%)
Ester group
(at%)
Methoxy substitution
(at%)
Residual
(at%)
O1s 531.48 4.2 4.2-1.1 = 3.1 3.1-2.1 = 1 1
O1s 533.12 22.1 22.1-2.1 = 20 20-12.3 = 7.7 7.7
O1s 534.85 2.5 2.5
N1s 400.2 1.1 Reference / / /
C-C 285 27.1 27.1
C1s 286.43 17.3 17.3-12.3 = 5 5
C1s 286.83 14.4 14.4-2.1 = 12.3 Reference /
C1s 288.11 8.4 8.4-1.1 = 7.3 7.3
C1s 289.13 2.1 Reference / /
C1s 290.29 0.8 0.8
Allocation of the residual amounts was not straightforward because the fibre surface consists
of a complex mixture of polymers so the chemical environments of the atoms induce specific
chemical shifts that may not be identifiable in the literature (usually based on pure organic
samples). The residual O1s at 533.1 eV and C1s at 288.1 eV were in similar concentration
of 7.7 at% and 7.3 at% respectively. These could not be precisely identified; it could not be
cellulose as the O/C ratio did not match (1/1 in that case versus 2/1 in cellulose). It could be
related to aliphatic C=O. The residual C1s at 286.43 eV (5 at%) could be attributed to ether
bonds. This could be from fatty acids (see Figure 3.17). C1s at 290.3 eV could be due to Pi-Pi*
transitions. O1s at 534.5 eV was attributed to residual water in the fibres (2.5 at%). Although
it was not possible to identify all the chemical bonds due the complexity of the sample, the cross-
correlations validated the peak fitting and the spectra analysis was considered as consistent.
71
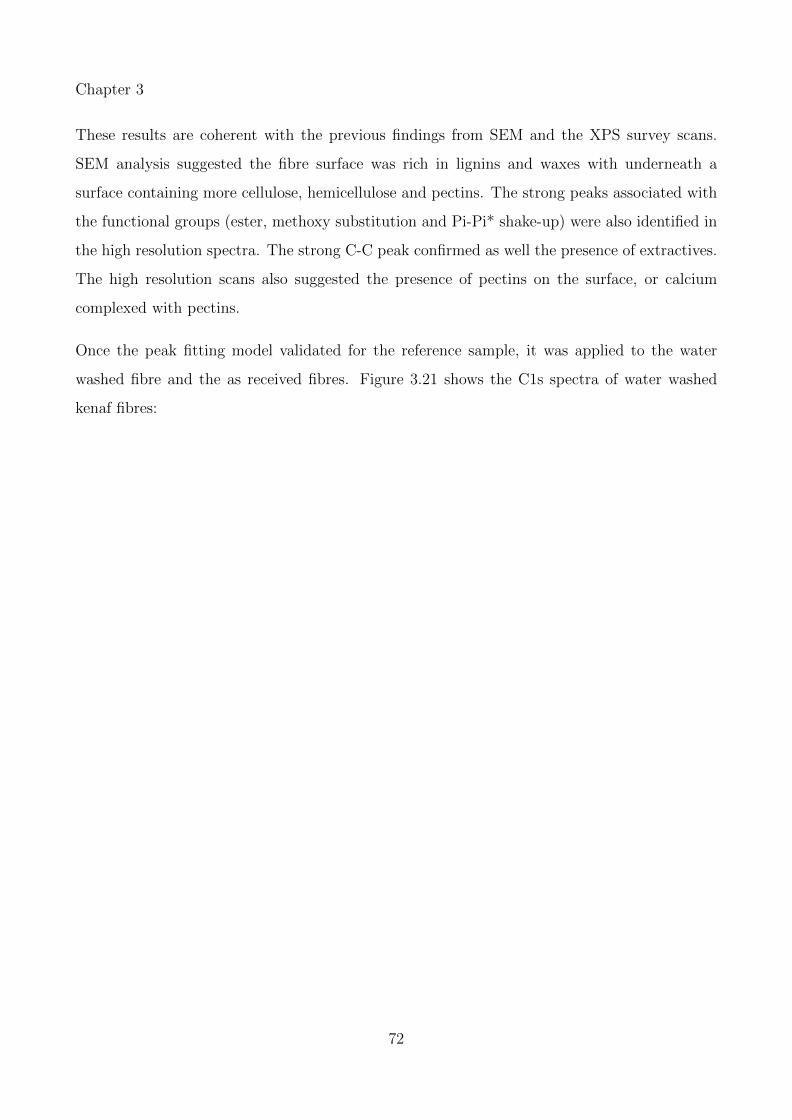
Chapter 3
These results are coherent with the previous findings from SEM and the XPS survey scans.
SEM analysis suggested the fibre surface was rich in lignins and waxes with underneath a
surface containing more cellulose, hemicellulose and pectins. The strong peaks associated with
the functional groups (ester, methoxy substitution and Pi-Pi* shake-up) were also identified in
the high resolution spectra. The strong C-C peak confirmed as well the presence of extractives.
The high resolution scans also suggested the presence of pectins on the surface, or calcium
complexed with pectins.
Once the peak fitting model validated for the reference sample, it was applied to the water
washed fibre and the as received fibres. Figure 3.21 shows the C1s spectra of water washed
kenaf fibres:
72
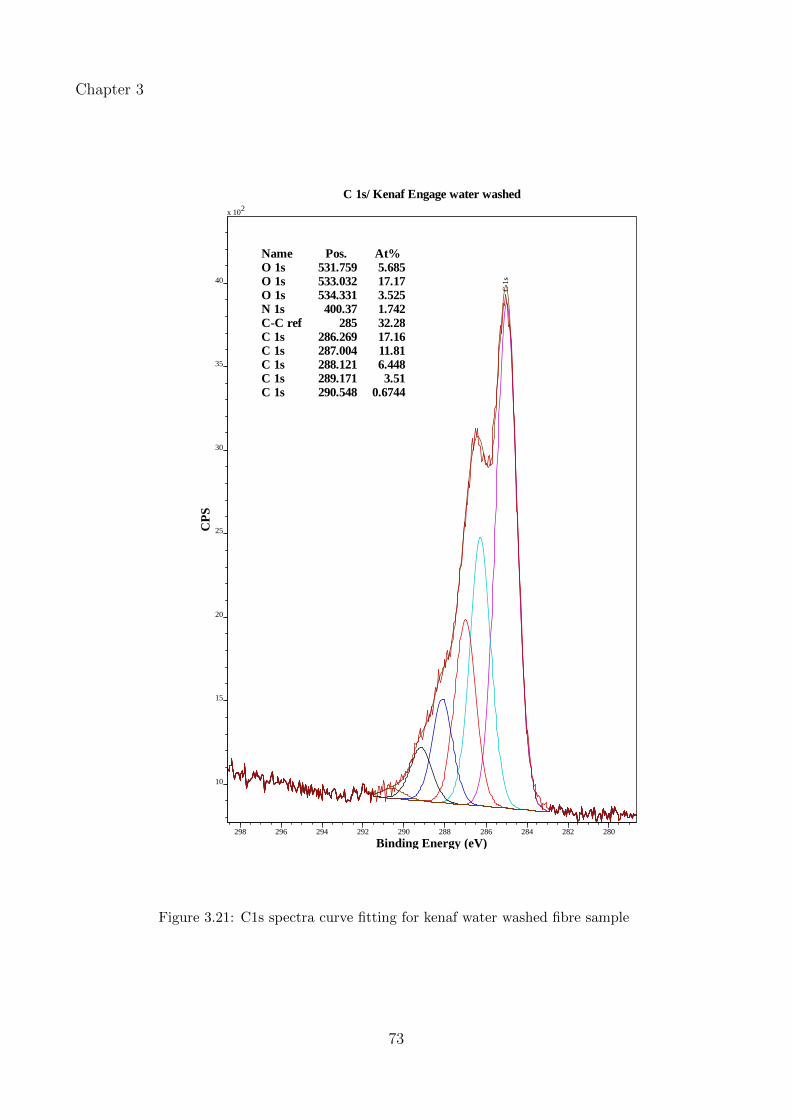
Chapter 3
C 1s/ Kenaf Engage water washed
NameO 1sO 1sO 1sN 1sC-C refC 1sC 1sC 1sC 1sC 1s
Pos.531.759533.032534.331400.37
285286.269287.004288.121289.171290.548
At%5.68517.173.5251.74232.2817.1611.816.4483.51
0.6744
C 1
s
x 102
10
15
20
25
30
35
40
CP
S
298 296 294 292 290 288 286 284 282 280
Binding Energy (eV)
Figure 3.21: C1s spectra curve fitting for kenaf water washed fibre sample
73
Chapter 3
O 1s/ Kenaf Engage water washed
O 1
s
x 102
15
20
25
30
35
40
45
50
55
CP
S
538 536 534 532 530 528 526
Binding Energy (eV)
Figure 3.22: O1s spectra curve fitting for kenaf water washed fibre sample
74
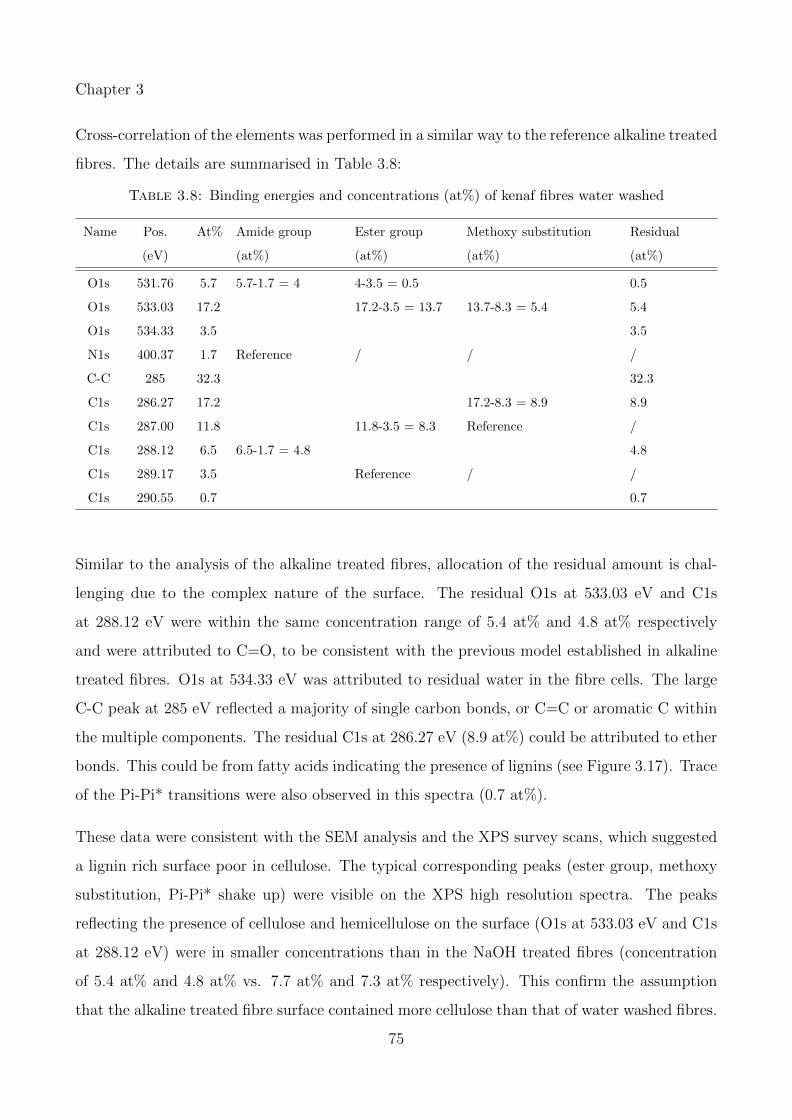
Chapter 3
Cross-correlation of the elements was performed in a similar way to the reference alkaline treated
fibres. The details are summarised in Table 3.8:
Table 3.8: Binding energies and concentrations (at%) of kenaf fibres water washed
Name Pos.
(eV)
At% Amide group
(at%)
Ester group
(at%)
Methoxy substitution
(at%)
Residual
(at%)
O1s 531.76 5.7 5.7-1.7 = 4 4-3.5 = 0.5 0.5
O1s 533.03 17.2 17.2-3.5 = 13.7 13.7-8.3 = 5.4 5.4
O1s 534.33 3.5 3.5
N1s 400.37 1.7 Reference / / /
C-C 285 32.3 32.3
C1s 286.27 17.2 17.2-8.3 = 8.9 8.9
C1s 287.00 11.8 11.8-3.5 = 8.3 Reference /
C1s 288.12 6.5 6.5-1.7 = 4.8 4.8
C1s 289.17 3.5 Reference / /
C1s 290.55 0.7 0.7
Similar to the analysis of the alkaline treated fibres, allocation of the residual amount is chal-
lenging due to the complex nature of the surface. The residual O1s at 533.03 eV and C1s
at 288.12 eV were within the same concentration range of 5.4 at% and 4.8 at% respectively
and were attributed to C=O, to be consistent with the previous model established in alkaline
treated fibres. O1s at 534.33 eV was attributed to residual water in the fibre cells. The large
C-C peak at 285 eV reflected a majority of single carbon bonds, or C=C or aromatic C within
the multiple components. The residual C1s at 286.27 eV (8.9 at%) could be attributed to ether
bonds. This could be from fatty acids indicating the presence of lignins (see Figure 3.17). Trace
of the Pi-Pi* transitions were also observed in this spectra (0.7 at%).
These data were consistent with the SEM analysis and the XPS survey scans, which suggested
a lignin rich surface poor in cellulose. The typical corresponding peaks (ester group, methoxy
substitution, Pi-Pi* shake up) were visible on the XPS high resolution spectra. The peaks
reflecting the presence of cellulose and hemicellulose on the surface (O1s at 533.03 eV and C1s
at 288.12 eV) were in smaller concentrations than in the NaOH treated fibres (concentration
of 5.4 at% and 4.8 at% vs. 7.7 at% and 7.3 at% respectively). This confirm the assumption
that the alkaline treated fibre surface contained more cellulose than that of water washed fibres.
75

Chapter 3
XPS high resolution scans also suggested that the surface contained more fatty acids than the
alkaline treated fibre surface: the residual C1s at 286.27 eV (8.9 at%) were more important
than in alkaline treated fibres (5 at% identified at 286.43 eV). This seems logical as NaOH is
more efficient to remove fatty acid than water wash.
Finally, the spectra from kenaf as received were peak fitted and analysed (Figure 3.23 and
Figure 3.24).
76
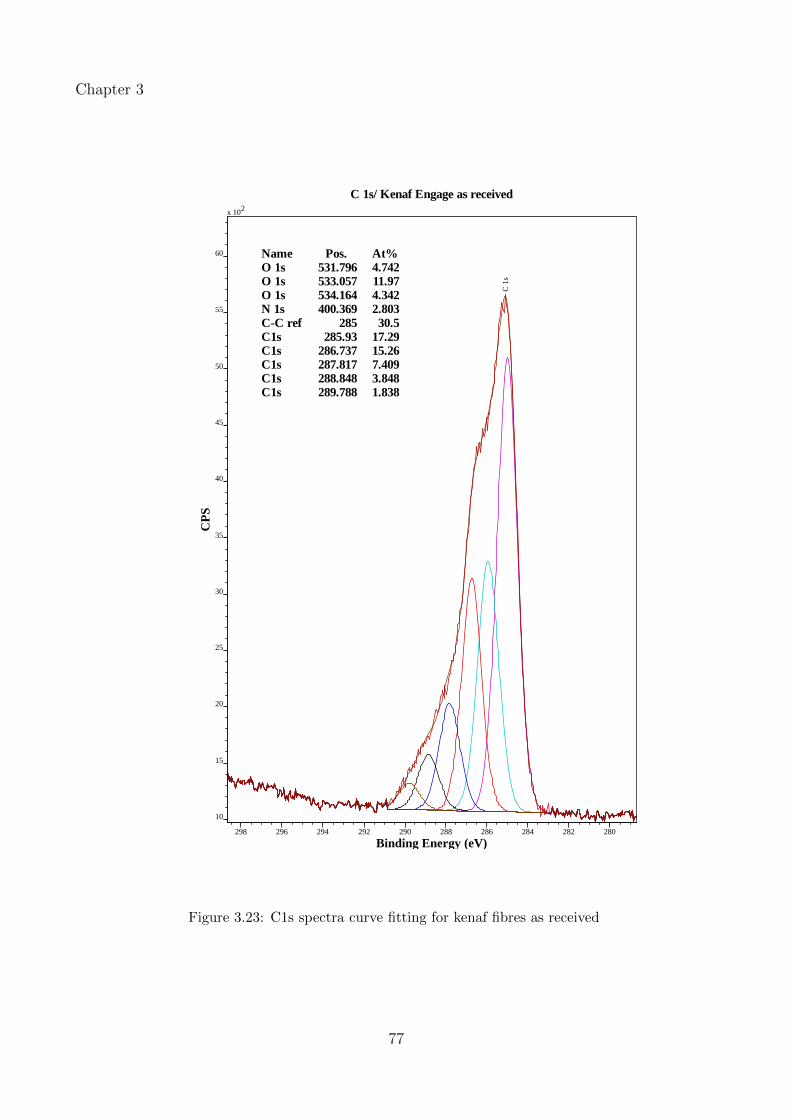
Chapter 3
C 1s/ Kenaf Engage as received
NameO 1sO 1sO 1sN 1sC-C refC1sC1sC1sC1sC1s
Pos.531.796533.057534.164400.369
285285.93
286.737287.817288.848289.788
At%4.74211.974.3422.80330.5
17.2915.267.4093.8481.838
C 1
s
x 102
10
15
20
25
30
35
40
45
50
55
60
CP
S
298 296 294 292 290 288 286 284 282 280
Binding Energy (eV)
Figure 3.23: C1s spectra curve fitting for kenaf fibres as received
77
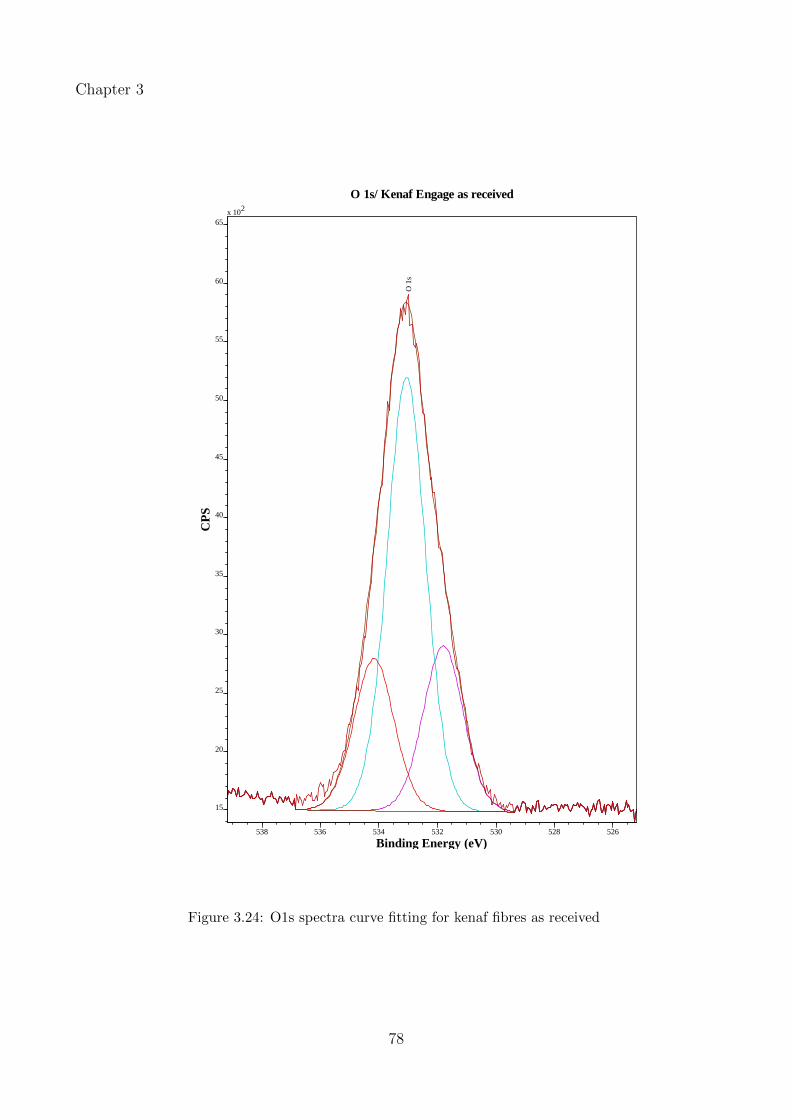
Chapter 3
O 1s/ Kenaf Engage as received
O 1
s
x 102
15
20
25
30
35
40
45
50
55
60
65
CP
S
538 536 534 532 530 528 526
Binding Energy (eV)
Figure 3.24: O1s spectra curve fitting for kenaf fibres as received
78
Chapter 3
An attempt was performed to do cross-correlation of the elements following the same procedure
as for the kenaf treated fibre samples but the peaks could not be specifically assigned to chemical
groups because of the surface complexity. The spectra was fitted following the same constraints
as for the other spectra and the residual standard deviation was 0.82 hence the curve fitting
was assumed correct. However, the chemical shifts were different than those observed in the
other samples and could not be identified either with typical binding energies referenced in the
literature [Beamson and Briggs, 1992, Ratner and Castner, 2009]. The binding energies depend
indeed on the specific environment where the chemical groups are located and, as shown earlier
by SEM (see Figure 3.4 in section 2.1), the surface of kenaf fibres as received was a mixture
of complex molecules therefore it was expected to observe slightly different shifts. Allocating
the peak was too challenging considering the numerous polymeric species likely present on the
surface and their complex molecular structure (lignins, extractives, oxygenated species etc.).
On the other hand, the trends were consistent with the SEM observations and the XPS survey
scans. The strong C-C peak suggested the presence of long carbon chain from fatty acids and
other extractives (see Figure 3.17). SEM analysis of the fibre surface revealed the presence of
lignins, pectins and waxes as well as some epidermal tissues (Figure 3.4). Nitrogen was also
more important than in the treated fibre spectra, suggesting more pectins and proteins on the
fibre surface in the as received stage than in the treated fibres. These could result from the
parenchyma cells in the epidermis/cuticle layer that are rich in pectins, as seen on the SEM
images.
In conclusion, XPS analysis of bast fibres brought key complementary information to the SEM
analysis. The survey scans showed that the O/C ratio of hemp and kenaf increased after
treatment, which suggested a change in the fibre surface chemistry. This was further confirmed
on the kenaf fibres with high resolution scans on carbon, oxygen and nitrogen. The experimental
data confirmed that the water wash and alkaline treatment cleaned the fibre surface and removed
most of the epidermal tissues. However, the treatments were too gentle to remove lignins and
pectins and the fibres’ surface remained rich in lignins and oxygenated species, and poor in
cellulose. On the other hand, these treatments may have modified the bast fibre physical
structure and the energetic site distribution, which play major roles in the physicochemical
interactions between the fibre and the matrix. This will be discussed in the next chapter.
79

Chapter 4
Inverse Gas Chromatography on
Natural Fibres
This chapter presents the research undertaken at the Composites Innovation Centre (CIC)
in Winnipeg, Manitoba, as part of the ongoing collaboration with the Cooperative Research
Centre for Advanced Composite Structures (CRC-ACS). The author was tasked to commis-
sion the inverse gas chromatograph system in the newly established FibreCITY facilities and
successfully developed experimental procedures for characterisation of plant fibres by Inverse
Gas Chromatography (IGC). Section 4.1 relates the method development to determine the spe-
cific surface area of natural fibres by IGC. This work has been published as: Legras, A., et
al. “Inverse gas chromatography for natural fibre characterisation: Identification of the critical
parameters to determine the Brunauer–Emmett–Teller specific surface area.”Journal of Chro-
matography A 1425 (2015): 273-279. Section 4.2 presents a method to determine the surface
energy profiles of plant fibres followed by application case studies.
Note: The paper has been formatted according to thesis requirements.
80
Chapter 4
4.1 Identification of the Critical Parameters to Deter-
mine the Brunauer-Emmett-Teller Specific Surface
Area
4.1.1 Introduction
Bast fibres have been traditionally destined for the textile industry and this remains the primary
application with constant innovations for clothing, technical textiles etc. However, the last
decades have seen a significant trend to utilise natural fibres in other sectors, particularly the
automotive industry [Ashori, 2008, Holbery and Houston, 2006, Karus and Kaup, 2002]. Natural
fibres appeal to vehicle manufacturers with their excellent strength to weight ratio, low cost,
low carbon footprint and availability. They are integrated into polymer matrices as filler or
reinforcement elements for interior components [Huda et al., 2008, Marsh, 2003]. Biocomposites
have also emerged as an alternative to wood plastic composites for building materials.
Diversification into novel applications places new demands on the fibre processing and proper-
ties. One of the major issues is that natural fibres are generally hydrophilic and consequently
are inherently incompatible with hydrophobic commodity polymers. Natural fibres also suffer
from considerable batch-to-batch heterogeneity and particularly dimensional variability, which
directly affect the tensile properties. Natural fibre moisture sensitivity is another issue for the
biocomposite durability.
The compatibility, dispersibility and reinforcement capability of natural fibres are related to
the fibre surface energy and to its specific surface area. Bast fibres have a complex 3D mi-
crostructure with multiple membranes enclosing the lumen. The chemical composition and
the molecular arrangement vary between the layers and depend on the fibre specie. The fi-
bre location within the plant stem and the growth conditions also play a major role in the
physico-chemical structure, creating fibres with unique and complex surfaces [Charlet et al.,
2007, Satyanarayana et al., 2007]. Figure 4.1 illustrates the architecture of bast fibre bundles
with cellulose microfibrils embedded into a matrix of hemicellulose and lignin. The outer layer
also contains pectins, waxes and other extractives. The fibre surface chemistry, its adsorption
81
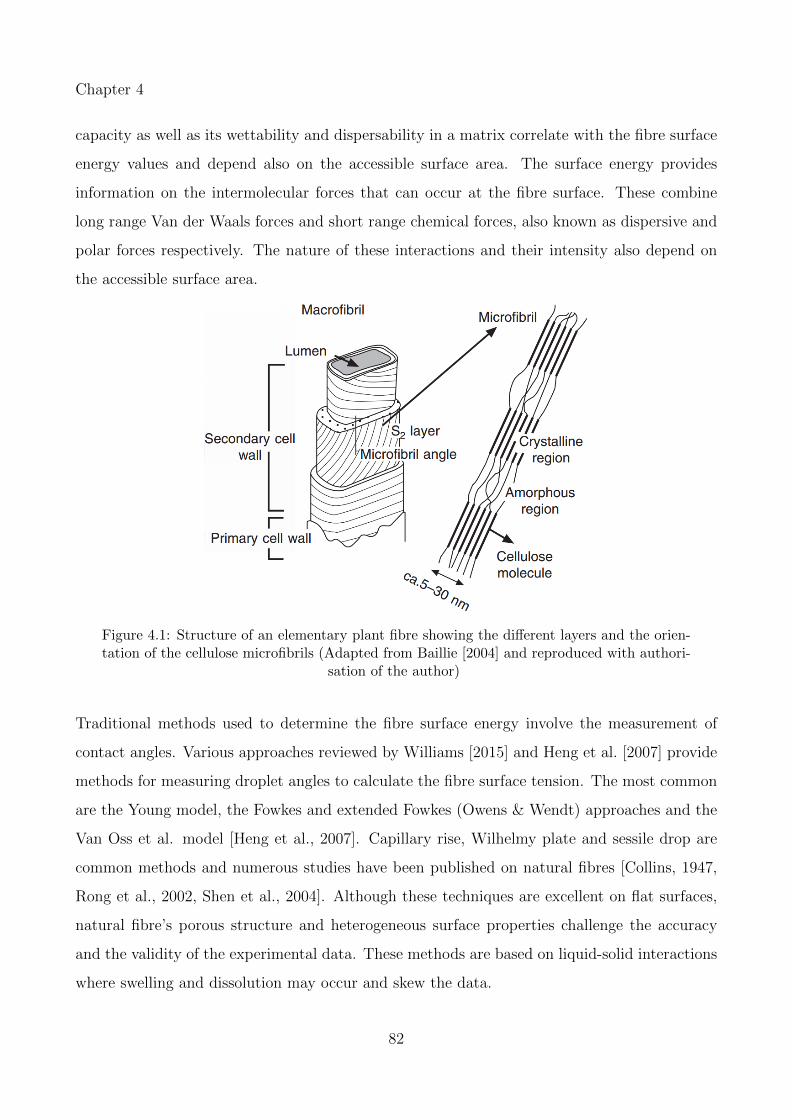
Chapter 4
capacity as well as its wettability and dispersability in a matrix correlate with the fibre surface
energy values and depend also on the accessible surface area. The surface energy provides
information on the intermolecular forces that can occur at the fibre surface. These combine
long range Van der Waals forces and short range chemical forces, also known as dispersive and
polar forces respectively. The nature of these interactions and their intensity also depend on
the accessible surface area.
Figure 4.1: Structure of an elementary plant fibre showing the different layers and the orien-tation of the cellulose microfibrils (Adapted from Baillie [2004] and reproduced with authori-
sation of the author)
Traditional methods used to determine the fibre surface energy involve the measurement of
contact angles. Various approaches reviewed by Williams [2015] and Heng et al. [2007] provide
methods for measuring droplet angles to calculate the fibre surface tension. The most common
are the Young model, the Fowkes and extended Fowkes (Owens & Wendt) approaches and the
Van Oss et al. model [Heng et al., 2007]. Capillary rise, Wilhelmy plate and sessile drop are
common methods and numerous studies have been published on natural fibres [Collins, 1947,
Rong et al., 2002, Shen et al., 2004]. Although these techniques are excellent on flat surfaces,
natural fibre’s porous structure and heterogeneous surface properties challenge the accuracy
and the validity of the experimental data. These methods are based on liquid-solid interactions
where swelling and dissolution may occur and skew the data.
82
Chapter 4
Inverse Gas Chromatography is an alternative tool to study surface energies. IGC is based
on solid-gas interactions and the affinity between gas probe molecules and the fibre surface
molecules is quantified. It is a versatile technique to characterise samples of any shape, as long
as the specimen can be packed in the column and molecular interactions can occur. IGC exists
since the early 50s and it has been applied mostly to pharmaceutical industry [Mohammadi-
Jam and Waters, 2014], for characterisation of zeolites [Askin and Bilgic, 2005, Eva Dıaz, 2004]
and carbon nanostructures [Papirer et al., 1999] but IGC has not been well established yet for
natural fibre characterisation. Most of the studies on natural fibres have been performed with
home built equipment, using different solvents and various calculation procedures. The lack of
information and details of experimental procedures make it difficult to compare and validate
data. Moreover, the large variability of natural fibre properties and their complexity compared
to synthesised and well designed man made materials means that a systematic study of the
common procedures and models implemented in IGC is required to assess its capabilities as a
technique to characterise natural fibre surfaces.
IGC requires the specific surface area to determine the surface energy, especially as this can
depend on surface coverages. Usually, the specific surface area of a solid is determined by BET
method which uses nitrogen sorption [Bismarck et al., 2002, Livingston, 1949] or krypton [Beebe
et al., 1945, Rosenberg, 1956], for surfaces areas below 0.5 m2.g−1 where the nitrogen technique
shows limitations [Sing, 2001]. These techniques involve extreme conditions of high vacuum at
low temperature (77K) under which the fibre properties are likely to change and thus the BET
surface area.
An alternative and preferred technique for measuring the BET surface area of low surface area
natural fibres would be to use IGC at room temperature. This paper systematically studies the
influence of various parameters that may affect the measured specific surface area using BET
theory with IGC. On the basis of the results of this study, a procedure applicable to natural
fibres is proposed.
BET theory
The BET theory was developed with nitrogen but is applicable to other gases such as those
used in IGC. Five types of isotherms can occur depending on the adsorption scenario [Charmas
83
Chapter 4
and Leboda, 2000, Thielmann, 2004]. The BET equation is applicable on isotherms type II
and IV only, where there is a formation of a monolayer followed by multi-layers and further
capillary condensation. The BET equation is given by:
P
n(P0 − P )=C − 1
nmC(P
P0
) +1
nmC(4.1)
where P is the solvent partial pressure in the gas phase (Torr), P0 the saturated solvent vapor
pressure (Torr), n the amount of gas adsorbed (Mol.g−1), nm the monolayer capacity (Mol.g−1)
and C the BET constant. The BET equation fits the isotherm (type II or IV) over a specific
range of equilibrium pressure P/P0, usually for 0.05 < P/P0 < 0.35. The monolayer capacity
nm can be determined from the slope and intercept of the linearised BET equation fitted to the
isotherm. The BET specific surface area (m2.g−1) is expressed as:
SBET = aNAnm (4.2)
with a the molecule cross section area, NA the Avogadro Number and nm the monolayer ca-
pacity. Since nm and a are known, the specific surface area SBET can be calculated.
4.1.2 Experimental procedure
4.1.2.1 Materials
Two types of bast fibres and one type of cellulose fibre were used in the study. The Cana-
dian linseed flax (variety unknown) specimen was supplied by Composites Innovation Centre
(CIC), Winnipeg, Manitoba (Canada). The fibres were not retted and have been mechanically
decorticated by a lab scale scutching machine [Alcock et al., 2012]. Kenaf fibres (variety KK60)
were provided by Engage Eco Products Co. Ltd. in Thailand. The fibres were locally ribbon
retted, rinsed and dried before shipping. Both flax and kenaf samples were characterised in the
84
Chapter 4
as-received conditions. BioMid R© cellulose fibres were supplied by ENC International (South
Korea). BioMid R© is a 100% cellulose-based continuous filament produced from dry-jet-wet
spinning process. The feedstock is a mixture of softwood and hardwood chips, a by-product
from the wood pulp and paper industry. The cellulose is extracted from the biomass and then
injected through a spinneret. Also, BioMid R© structure is different from the bast fibres that
have a “membrane” structure. BioMid R© fibres are expected to be a pure cellulose sample and
was considered as a reference for the study. The sample details are summarised in Table 4.1.
Table 4.1: Industrial fibre grades used for the study
Sample Variety Fibre processing
Cellulose BioMid R© (ENC International,South Korea)
Dry-jet-wet spinning process
Kenaf KK60 (Thailand) Water rettingFlax Linseed flax (Canadian variety
unknown)Mechanical decortication byscutching
4.1.2.2 Methods
The strategy to study the influence of experimental parameters on the output BET value
involved four criteria. The experimental approach is detailed in the following paragraphs and
summarised in Table 4.2.
• Reproducibility within the column:
Various diffusion processes can drive the elutant molecule flow in a column packed with porous
material. These scenarios depend on the column dimension, the sample porosity, the pack-
ing homogeneity and the flow rate [Thielmann, 2004]. Natural fibre pore widths range from
micrometers down to a few nanometers [Arsene et al., 2013, Bledzki et al., 2005, Stone and
Scallan, 1965] and so these exceed in size the elutant molecules (cross sectional area ca. 10
A2 to 100 A2 [Perry et al., 1997]). As a consequence, the free diffusion process dominates the
molecule flow into the column: the gas probe molecules travel both in axial and longitudinal
directions. As they elute, these likely encounter cavities and asperities where they will adsorb
before complete elution. Whether this phenomenon occurs randomly and if it further affects the
flow rate is questionable. Successive runs were performed on the same chromatography column
85

Chapter 4
under identical experimental conditions to assess the reproducibility of the BET experiment.
Note that this experiment is possible with inverse gas chromatography as the column can be
used multiple times.
• Gas probe:
Various solvents can be used to run a BET experiment with IGC, the requirement being non-
polar adsorbates where surface and no bulk sorption occurs. Octane, heptane and cyclohexane
are common adsorbates. Whether the nature of the solvent affects the BET value of natural
fibres or not has not been clarified so far and few authors specify which gas probe has been
used to determine the specific surface area. For the sake of clarity and to know if data obtained
from various solvents can be compared, the impact of the solvent choice on the output value
was investigated. Among the common adsorbates used for the BET experiment, octane and
cyclohexane were selected for two main reasons. The latter showed better retention peaks than
other solvents, for instance, hexane and heptane had too low retention times. The second reason
is that octane and cyclohexane differ in their molecular structure and chemical properties, which
facilitates the observation of effects due to molecule geometry.
• Variability within a batch:
The variability of the BET specific surface area measured using octane was investigated within
a batch of natural fibres. The specific surface area is expected to fluctuate as the diameter,
porosity and the surface profile vary between fibres. Little information is currently available as
to whether the specific surface area changes and to what extent. A chromatography column
usually contains ca. a gram of fibres i.e. a relatively small amount of material. It is necessary
to estimate how variable the BET value is for grading procedures.
• Sample packing:
Another variable rarely specified is the sample packing. Unlike powder particles, natural fibres
can be packed in the column in multiple ways. For instance, post-processed fibres are usually
chopped and well separated compared with fibres as received. Short and long fibres may behave
differently in the inverse gas chromatography column. In this experiment, the fibres were cut
86

Chapter 4
into “short”fibres of 2 cm length and compared with ”long” fibres of ca. 10 cm length (usual
fibre length in a column of 4 mm internal diameter).
Table 4.2: Strategy to investigate the critical parameters for BET experiment
Criterion Experimental Method
Reproducibility within the column Repeat 3 runs per columnGas probe Run with octane and cyclohexaneVariability within a batch Run 5 columns per batchSample packing Pack the column with long (10 cm) and short (2
cm) fibres
All experiments were conducted with an Inverse Gas Chromatograph Surface Energy Analyser
(IGC SEA) from Surface Measurement Systems (London, UK). This commercial equipment is
set-up for pulse chromatography; a precise amount of adsorbate is transported by the carrier
gas through the column containing the fibres. Adsorption followed by desorption occur at the
fibre surface and an elution peak results. The configuration of the IGC SEA is schematised
in Figure 4.2. The retention time was determined by a Flame Ionization Detector (FID) to
benefit a high sensitivity compared to thermal conductivity detector [Mohammadi-Jam and
Waters, 2014, Wang et al., 2013]. Silane-treated glass columns were filled with ca. 0.7 g to
1 g of fibres. The 4 mm internal diameter column was preferable for packing the fibres. To
insert the fibres in a column, wax-free dental floss was tied to the end of the fibres and then
pulled through the column. Once the fibres were in place, the dental floss was removed and the
column was then plugged with silanised glass wool to avoid any contamination in the injection
system. For the experiment with chopped fibres, the short fibres were introduced in the column
using a funnel and then packed with a column packing device. The columns were then plugged
as mentioned previously. The sample bed length was ca. 30 mm to minimise peak broadening
due to free molecular diffusion in the column. Helium was the carrier gas and methane was the
reference gas to determine the dead time, which represents the time necessary for a molecule to
travel across the column without any interaction. Octane and cyclohexane were injected over
a coverage range (n/nm) within 0.01 to 0.44, the minima and maxima values depending on the
sample mass. All experiments were carried out under the same conditions (30◦C, 0% RH) with
column conditioning for 1 hour (40◦C, 0% RH) before the first injection only. The carrier gas
flow rate was set up at 10 mL.min−1.
87
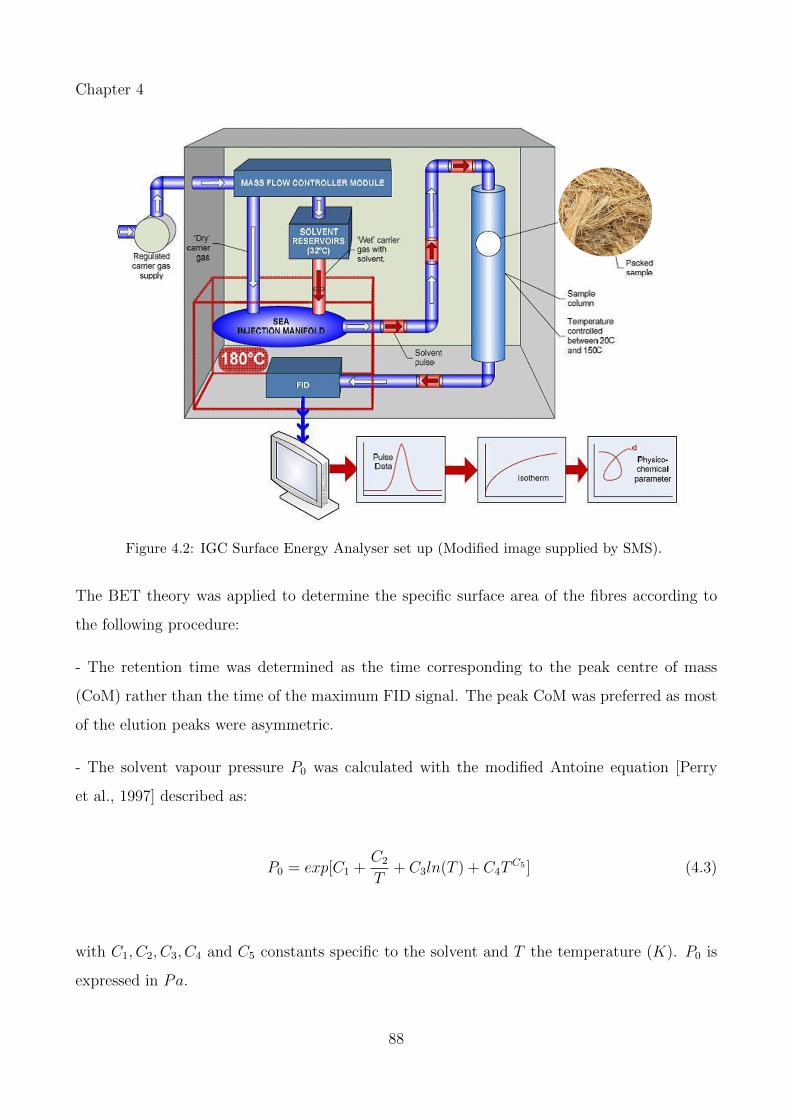
Chapter 4
Figure 4.2: IGC Surface Energy Analyser set up (Modified image supplied by SMS).
The BET theory was applied to determine the specific surface area of the fibres according to
the following procedure:
- The retention time was determined as the time corresponding to the peak centre of mass
(CoM) rather than the time of the maximum FID signal. The peak CoM was preferred as most
of the elution peaks were asymmetric.
- The solvent vapour pressure P0 was calculated with the modified Antoine equation [Perry
et al., 1997] described as:
P0 = exp[C1 +C2
T+ C3ln(T ) + C4T
C5 ] (4.3)
with C1, C2, C3, C4 and C5 constants specific to the solvent and T the temperature (K). P0 is
expressed in Pa.
88
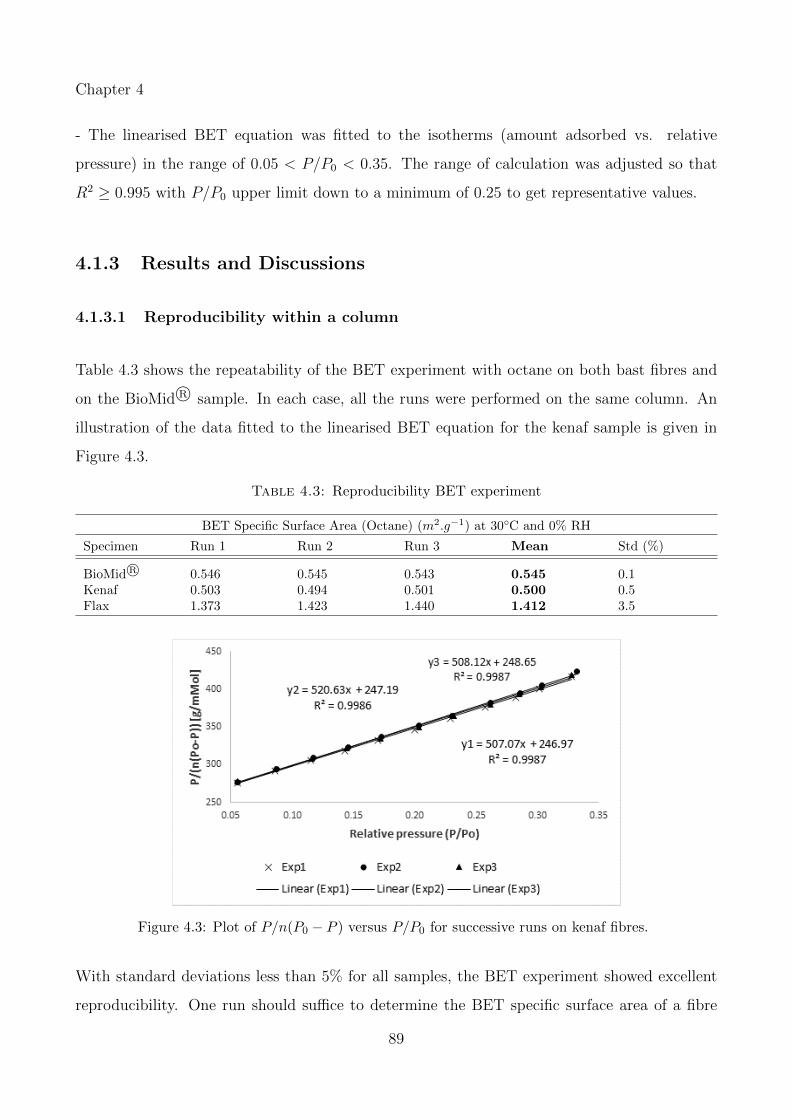
Chapter 4
- The linearised BET equation was fitted to the isotherms (amount adsorbed vs. relative
pressure) in the range of 0.05 < P/P0 < 0.35. The range of calculation was adjusted so that
R2 ≥ 0.995 with P/P0 upper limit down to a minimum of 0.25 to get representative values.
4.1.3 Results and Discussions
4.1.3.1 Reproducibility within a column
Table 4.3 shows the repeatability of the BET experiment with octane on both bast fibres and
on the BioMid R© sample. In each case, all the runs were performed on the same column. An
illustration of the data fitted to the linearised BET equation for the kenaf sample is given in
Figure 4.3.
Table 4.3: Reproducibility BET experiment
BET Specific Surface Area (Octane) (m2.g−1) at 30◦C and 0% RH
Specimen Run 1 Run 2 Run 3 Mean Std (%)
BioMid R© 0.546 0.545 0.543 0.545 0.1Kenaf 0.503 0.494 0.501 0.500 0.5Flax 1.373 1.423 1.440 1.412 3.5
Figure 4.3: Plot of P/n(P0 − P ) versus P/P0 for successive runs on kenaf fibres.
With standard deviations less than 5% for all samples, the BET experiment showed excellent
reproducibility. One run should suffice to determine the BET specific surface area of a fibre
89
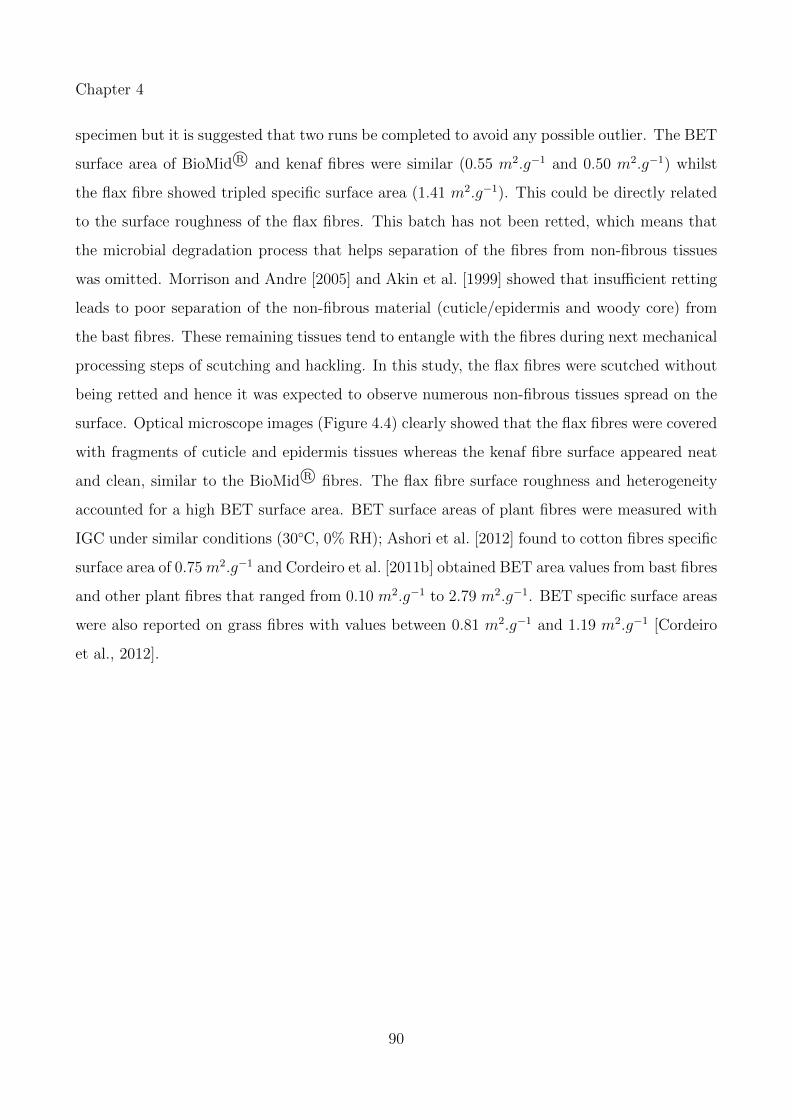
Chapter 4
specimen but it is suggested that two runs be completed to avoid any possible outlier. The BET
surface area of BioMid R© and kenaf fibres were similar (0.55 m2.g−1 and 0.50 m2.g−1) whilst
the flax fibre showed tripled specific surface area (1.41 m2.g−1). This could be directly related
to the surface roughness of the flax fibres. This batch has not been retted, which means that
the microbial degradation process that helps separation of the fibres from non-fibrous tissues
was omitted. Morrison and Andre [2005] and Akin et al. [1999] showed that insufficient retting
leads to poor separation of the non-fibrous material (cuticle/epidermis and woody core) from
the bast fibres. These remaining tissues tend to entangle with the fibres during next mechanical
processing steps of scutching and hackling. In this study, the flax fibres were scutched without
being retted and hence it was expected to observe numerous non-fibrous tissues spread on the
surface. Optical microscope images (Figure 4.4) clearly showed that the flax fibres were covered
with fragments of cuticle and epidermis tissues whereas the kenaf fibre surface appeared neat
and clean, similar to the BioMid R© fibres. The flax fibre surface roughness and heterogeneity
accounted for a high BET surface area. BET surface areas of plant fibres were measured with
IGC under similar conditions (30◦C, 0% RH); Ashori et al. [2012] found to cotton fibres specific
surface area of 0.75 m2.g−1 and Cordeiro et al. [2011b] obtained BET area values from bast fibres
and other plant fibres that ranged from 0.10 m2.g−1 to 2.79 m2.g−1. BET specific surface areas
were also reported on grass fibres with values between 0.81 m2.g−1 and 1.19 m2.g−1 [Cordeiro
et al., 2012].
90
Chapter 4
Figure 4.4: Optical microscope images of A) BioMid R©, B) Kenaf and C) Flax fibre samples(Images obtained with an Axio Zoom.V16 microscope by CIC).
91
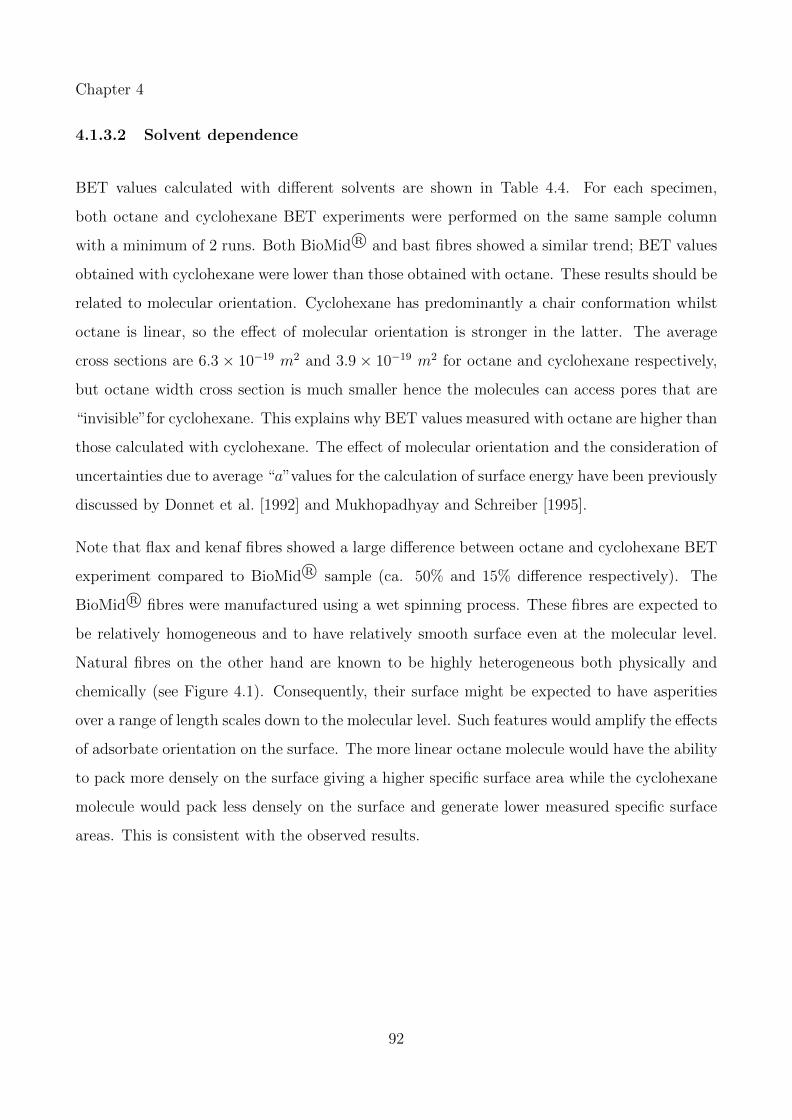
Chapter 4
4.1.3.2 Solvent dependence
BET values calculated with different solvents are shown in Table 4.4. For each specimen,
both octane and cyclohexane BET experiments were performed on the same sample column
with a minimum of 2 runs. Both BioMid R© and bast fibres showed a similar trend; BET values
obtained with cyclohexane were lower than those obtained with octane. These results should be
related to molecular orientation. Cyclohexane has predominantly a chair conformation whilst
octane is linear, so the effect of molecular orientation is stronger in the latter. The average
cross sections are 6.3 × 10⁻¹⁹ m2 and 3.9 × 10⁻¹⁹ m2 for octane and cyclohexane respectively,
but octane width cross section is much smaller hence the molecules can access pores that are
“invisible”for cyclohexane. This explains why BET values measured with octane are higher than
those calculated with cyclohexane. The effect of molecular orientation and the consideration of
uncertainties due to average “a”values for the calculation of surface energy have been previously
discussed by Donnet et al. [1992] and Mukhopadhyay and Schreiber [1995].
Note that flax and kenaf fibres showed a large difference between octane and cyclohexane BET
experiment compared to BioMid R© sample (ca. 50% and 15% difference respectively). The
BioMid R© fibres were manufactured using a wet spinning process. These fibres are expected to
be relatively homogeneous and to have relatively smooth surface even at the molecular level.
Natural fibres on the other hand are known to be highly heterogeneous both physically and
chemically (see Figure 4.1). Consequently, their surface might be expected to have asperities
over a range of length scales down to the molecular level. Such features would amplify the effects
of adsorbate orientation on the surface. The more linear octane molecule would have the ability
to pack more densely on the surface giving a higher specific surface area while the cyclohexane
molecule would pack less densely on the surface and generate lower measured specific surface
areas. This is consistent with the observed results.
92
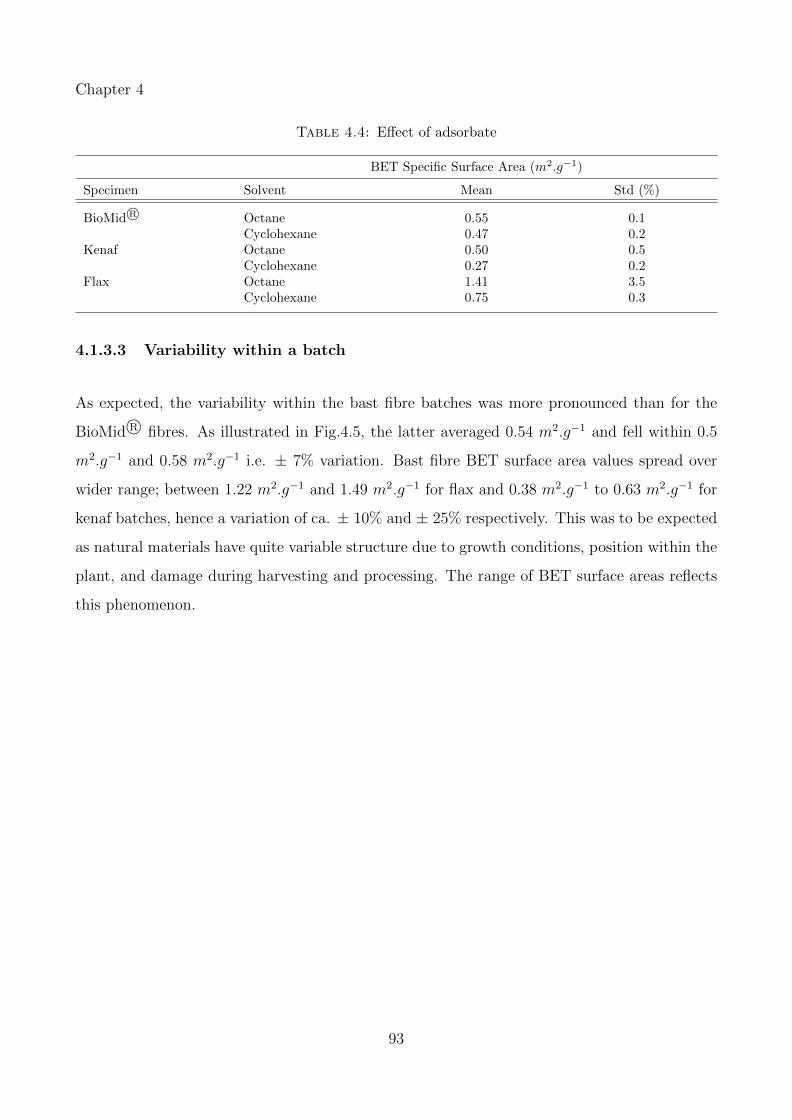
Chapter 4
Table 4.4: Effect of adsorbate
BET Specific Surface Area (m2.g−1)
Specimen Solvent Mean Std (%)
BioMid R© Octane 0.55 0.1Cyclohexane 0.47 0.2
Kenaf Octane 0.50 0.5Cyclohexane 0.27 0.2
Flax Octane 1.41 3.5Cyclohexane 0.75 0.3
4.1.3.3 Variability within a batch
As expected, the variability within the bast fibre batches was more pronounced than for the
BioMid R© fibres. As illustrated in Fig.4.5, the latter averaged 0.54 m2.g−1 and fell within 0.5
m2.g−1 and 0.58 m2.g−1 i.e. ± 7% variation. Bast fibre BET surface area values spread over
wider range; between 1.22 m2.g−1 and 1.49 m2.g−1 for flax and 0.38 m2.g−1 to 0.63 m2.g−1 for
kenaf batches, hence a variation of ca. ± 10% and ± 25% respectively. This was to be expected
as natural materials have quite variable structure due to growth conditions, position within the
plant, and damage during harvesting and processing. The range of BET surface areas reflects
this phenomenon.
93
Chapter 4
Figure 4.5: Individual value plots of the BET Surface Area (m2.g−1) with 95% ConfidenceInterval (CI).
4.1.3.4 Sample packing
Table 4.5 shows the effect of fibre length on the BET values. The ranges of variation for
BioMid R© (ca. +10%) and kenaf (ca. +20%) fibres agree well with the previous findings on the
variability within a batch and the effect of fibre length could be considered negligible in that
case. However, short flax fibres BET surface area values stepped outside the confidence interval
(95% CI) with a variation of 20% i.e. chopping the fibres induced significant effects. The non
consistency of these results could be related to the physico-chemical differencies between the
fibres. As seen in Figure 4.4, both BioMid R© and kenaf fibre surface were neat and homogeneous
compared to the flax fibres that were unretted. Chopping the latter may have shredded the
fibre ends, i.e. multiplied the accessible surface area. It may also have peeled off some of the
cuticle/epidermis fragments and hence opened access to new surfaces that displayed different
chemistries than the outer layer. Both phenomena likely generated new molecular interactions
with the adsorbate.
94

Chapter 4
Table 4.5: Effect of fibre length
BET Specific Surface Area (m2.g−1)
Specimen Packing Mean Std (%)
BioMid R© (Octane) long 0.55 0.1short 0.59 0.4
Kenaf (Octane) long 0.50 0.5short 0.42 0.1
Flax (Cyclohexane) long 0.75 0.3short 0.92 1.5
4.1.4 Conclusions
The BET specific surface area of kenaf and flax fibres differed, with an average of 0.51 m2.g−1
vs. 1.35 m2.g−1 respectively and the kenaf fibres showed similar BET value to cellulose fibres
(ca. 0.54 m2.g−1). The high specific area of flax, compared with kenaf and cellulose, was
related to the fibre surface roughness. Bast fibres had larger batch-to-batch variability than
synthesised cellulose fibres, which is a consequence of natural fibre structural irregularities and
heterogeneous properties.
The BET values obtained by IGC SEA showed a noticeable dependence on the elutant prop-
erties. For all specimens, the specific surface areas calculated from octane measurements were
higher than those from cyclohexane. This phenomenon is likely an effect of molecular orien-
tation. Sample packing also affected the BET surface area values but no clear trend could be
established. It is possible that chopping the unretted flax fibres either shredded the fibre ends
or removed lightly adherent cuticle /epidermal material on the surface increasing the accessible
surface area.
Based on these findings, the following protocol for determining the BET specific surface area
of natural fibres by IGC is proposed:
• Pack the chromatography column with the sample as is. Chopping fibres may induce non
negligible effects.
• Consider BET values obtained with the same solvent only for direct comparison.
95
Chapter 4
• For accurate calculation, consider the linearised BET equation over a coverage range (n/nm)
so that the correlation factor R2 > 0.995.
• Since repeatability is excellent (commercial equipment), two runs per column should be
sufficient to ensure confident results, assuming none of the data is an outlier.
These experimental data highlight the structural heterogeneity between different species of bast
fibres, in term of both chemical and physical singularities. Further data acquisition on natural
fibres is necessary to strengthen these models and extend the database to get consistent refer-
ences. However, the current results have demonstrated the potential of IGC for characterisation
of natural fibre surfaces. The authors encourage the development of inverse gas chromatography
for fibre grading as a complementary technique to traditional methods.
4.1.5 Acknowledgements
This study was undertaken as part of a collaboration between the Composites Innovation Cen-
tre (CIC) and the Cooperative Research Centre for Advanced Composites Structures Australia
(CRC-ACS) research project, established and supported under the Australian Government’s
Cooperative Research Centre Program. The author acknowledge the CRC-ACS Project P1.1
team and the CIC for their access to equipment. The technical support from Surface Measure-
ment Systems to develop the IGC experimental work is also gratefully acknowledged.
96
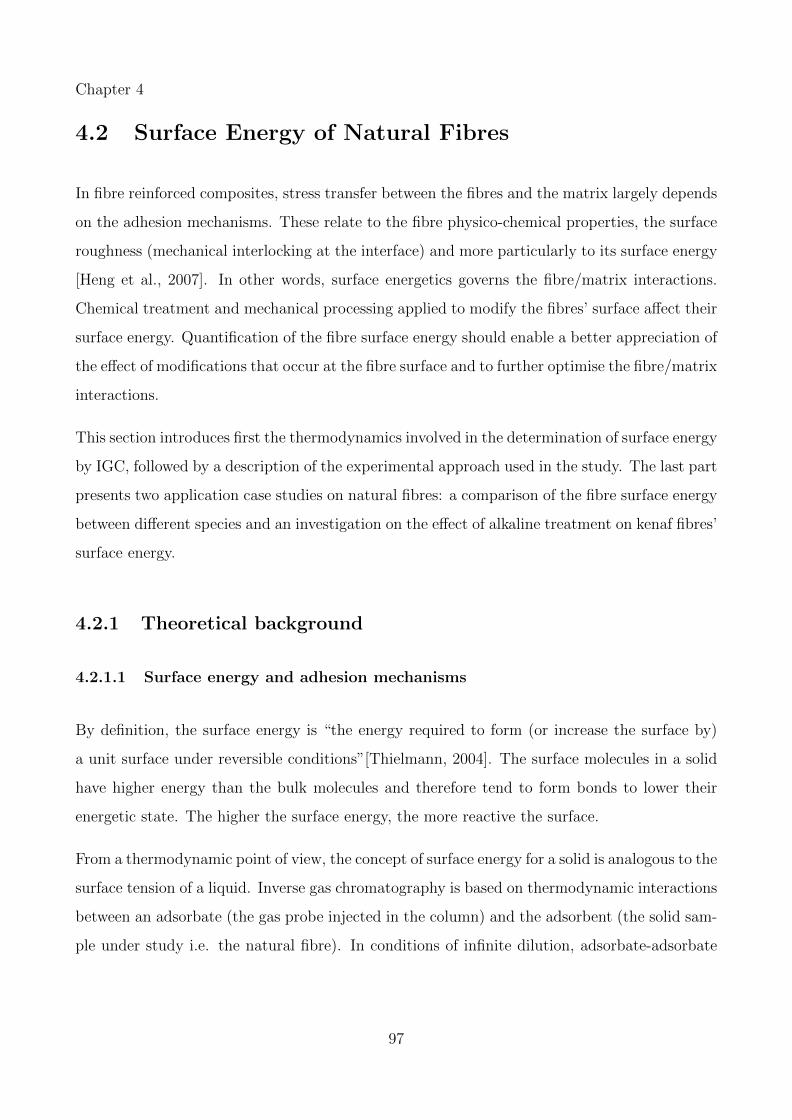
Chapter 4
4.2 Surface Energy of Natural Fibres
In fibre reinforced composites, stress transfer between the fibres and the matrix largely depends
on the adhesion mechanisms. These relate to the fibre physico-chemical properties, the surface
roughness (mechanical interlocking at the interface) and more particularly to its surface energy
[Heng et al., 2007]. In other words, surface energetics governs the fibre/matrix interactions.
Chemical treatment and mechanical processing applied to modify the fibres’ surface affect their
surface energy. Quantification of the fibre surface energy should enable a better appreciation of
the effect of modifications that occur at the fibre surface and to further optimise the fibre/matrix
interactions.
This section introduces first the thermodynamics involved in the determination of surface energy
by IGC, followed by a description of the experimental approach used in the study. The last part
presents two application case studies on natural fibres: a comparison of the fibre surface energy
between different species and an investigation on the effect of alkaline treatment on kenaf fibres’
surface energy.
4.2.1 Theoretical background
4.2.1.1 Surface energy and adhesion mechanisms
By definition, the surface energy is “the energy required to form (or increase the surface by)
a unit surface under reversible conditions”[Thielmann, 2004]. The surface molecules in a solid
have higher energy than the bulk molecules and therefore tend to form bonds to lower their
energetic state. The higher the surface energy, the more reactive the surface.
From a thermodynamic point of view, the concept of surface energy for a solid is analogous to the
surface tension of a liquid. Inverse gas chromatography is based on thermodynamic interactions
between an adsorbate (the gas probe injected in the column) and the adsorbent (the solid sam-
ple under study i.e. the natural fibre). In conditions of infinite dilution, adsorbate-adsorbate
97
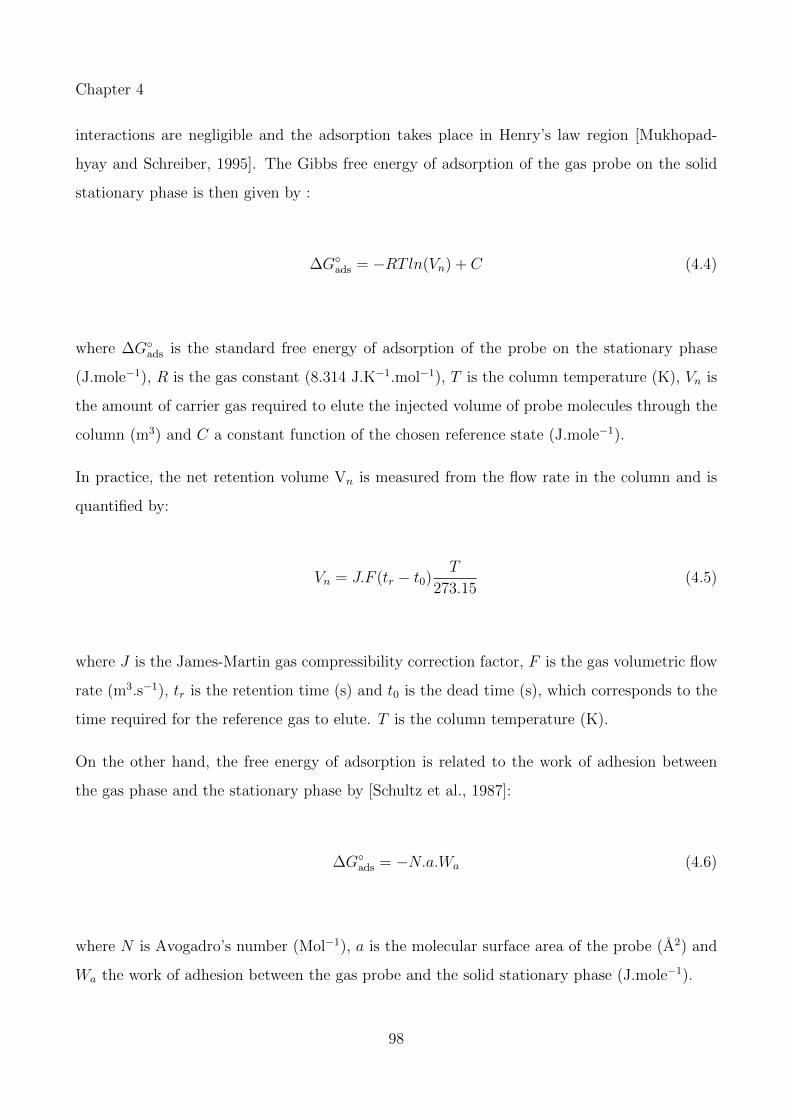
Chapter 4
interactions are negligible and the adsorption takes place in Henry’s law region [Mukhopad-
hyay and Schreiber, 1995]. The Gibbs free energy of adsorption of the gas probe on the solid
stationary phase is then given by :
∆G◦ads = −RTln(Vn) + C (4.4)
where ∆G◦ads is the standard free energy of adsorption of the probe on the stationary phase
(J.mole−1), R is the gas constant (8.314 J.K−1.mol−1), T is the column temperature (K), Vn is
the amount of carrier gas required to elute the injected volume of probe molecules through the
column (m3) and C a constant function of the chosen reference state (J.mole−1).
In practice, the net retention volume Vn is measured from the flow rate in the column and is
quantified by:
Vn = J.F (tr − t0)T
273.15(4.5)
where J is the James-Martin gas compressibility correction factor, F is the gas volumetric flow
rate (m3.s−1), tr is the retention time (s) and t0 is the dead time (s), which corresponds to the
time required for the reference gas to elute. T is the column temperature (K).
On the other hand, the free energy of adsorption is related to the work of adhesion between
the gas phase and the stationary phase by [Schultz et al., 1987]:
∆G◦ads = −N.a.Wa (4.6)
where N is Avogadro’s number (Mol−1), a is the molecular surface area of the probe (A2) and
Wa the work of adhesion between the gas probe and the solid stationary phase (J.mole−1).
98
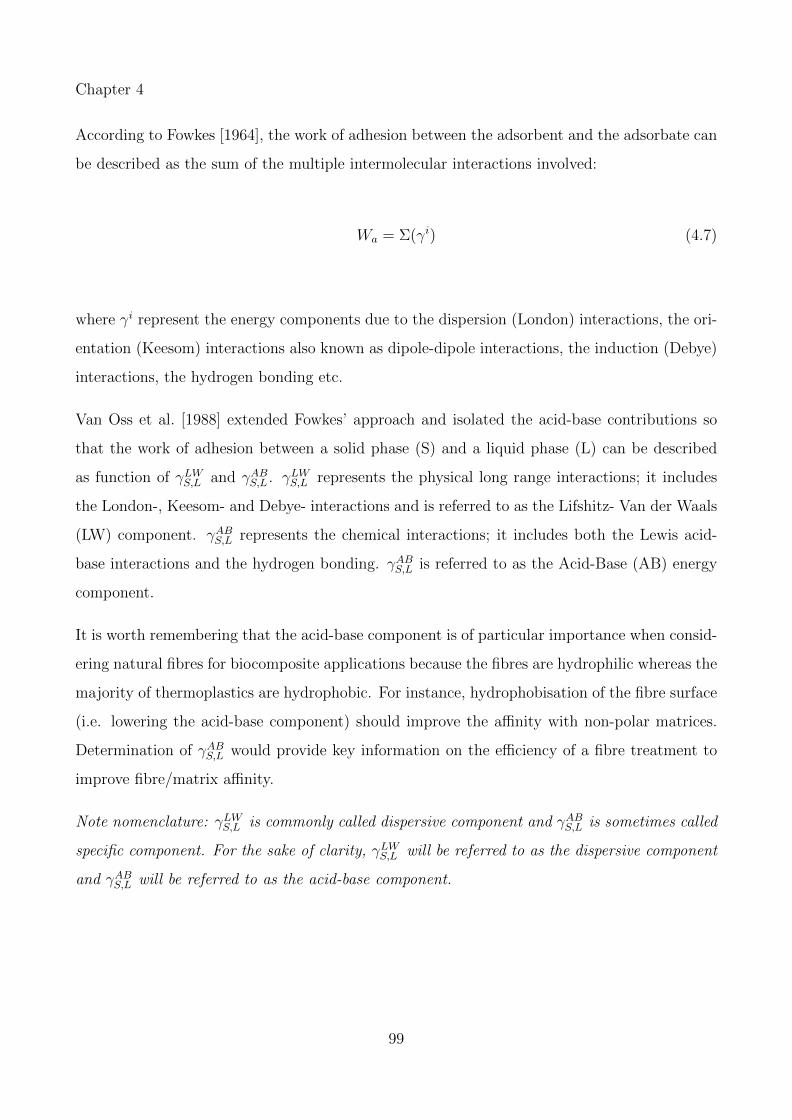
Chapter 4
According to Fowkes [1964], the work of adhesion between the adsorbent and the adsorbate can
be described as the sum of the multiple intermolecular interactions involved:
Wa = Σ(γi) (4.7)
where γi represent the energy components due to the dispersion (London) interactions, the ori-
entation (Keesom) interactions also known as dipole-dipole interactions, the induction (Debye)
interactions, the hydrogen bonding etc.
Van Oss et al. [1988] extended Fowkes’ approach and isolated the acid-base contributions so
that the work of adhesion between a solid phase (S) and a liquid phase (L) can be described
as function of γLWS,L and γABS,L . γLWS,L represents the physical long range interactions; it includes
the London-, Keesom- and Debye- interactions and is referred to as the Lifshitz- Van der Waals
(LW) component. γABS,L represents the chemical interactions; it includes both the Lewis acid-
base interactions and the hydrogen bonding. γABS,L is referred to as the Acid-Base (AB) energy
component.
It is worth remembering that the acid-base component is of particular importance when consid-
ering natural fibres for biocomposite applications because the fibres are hydrophilic whereas the
majority of thermoplastics are hydrophobic. For instance, hydrophobisation of the fibre surface
(i.e. lowering the acid-base component) should improve the affinity with non-polar matrices.
Determination of γABS,L would provide key information on the efficiency of a fibre treatment to
improve fibre/matrix affinity.
Note nomenclature: γLWS,L is commonly called dispersive component and γABS,L is sometimes called
specific component. For the sake of clarity, γLWS,L will be referred to as the dispersive component
and γABS,L will be referred to as the acid-base component.
99
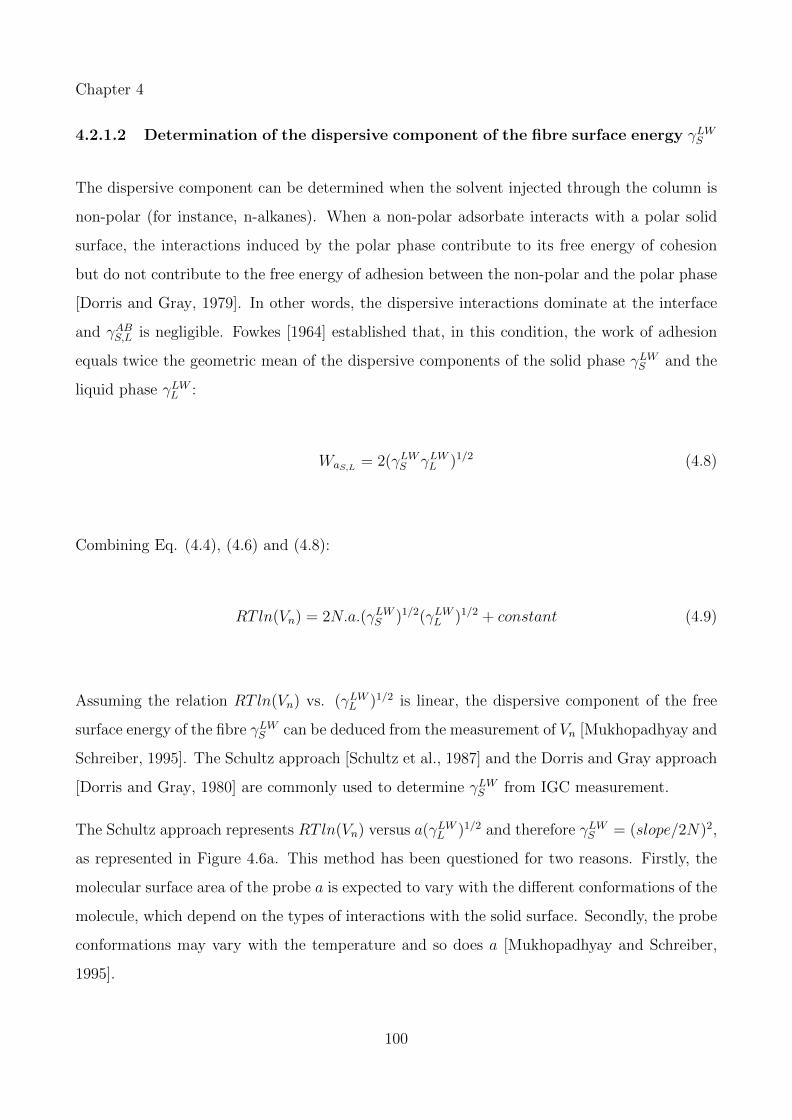
Chapter 4
4.2.1.2 Determination of the dispersive component of the fibre surface energy γLWS
The dispersive component can be determined when the solvent injected through the column is
non-polar (for instance, n-alkanes). When a non-polar adsorbate interacts with a polar solid
surface, the interactions induced by the polar phase contribute to its free energy of cohesion
but do not contribute to the free energy of adhesion between the non-polar and the polar phase
[Dorris and Gray, 1979]. In other words, the dispersive interactions dominate at the interface
and γABS,L is negligible. Fowkes [1964] established that, in this condition, the work of adhesion
equals twice the geometric mean of the dispersive components of the solid phase γLWS and the
liquid phase γLWL :
WaS,L = 2(γLWS γLWL )1/2 (4.8)
Combining Eq. (4.4), (4.6) and (4.8):
RTln(Vn) = 2N.a.(γLWS )1/2(γLWL )1/2 + constant (4.9)
Assuming the relation RTln(Vn) vs. (γLWL )1/2 is linear, the dispersive component of the free
surface energy of the fibre γLWS can be deduced from the measurement of Vn [Mukhopadhyay and
Schreiber, 1995]. The Schultz approach [Schultz et al., 1987] and the Dorris and Gray approach
[Dorris and Gray, 1980] are commonly used to determine γLWS from IGC measurement.
The Schultz approach represents RTln(Vn) versus a(γLWL )1/2 and therefore γLWS = (slope/2N)2,
as represented in Figure 4.6a. This method has been questioned for two reasons. Firstly, the
molecular surface area of the probe a is expected to vary with the different conformations of the
molecule, which depend on the types of interactions with the solid surface. Secondly, the probe
conformations may vary with the temperature and so does a [Mukhopadhyay and Schreiber,
1995].
100
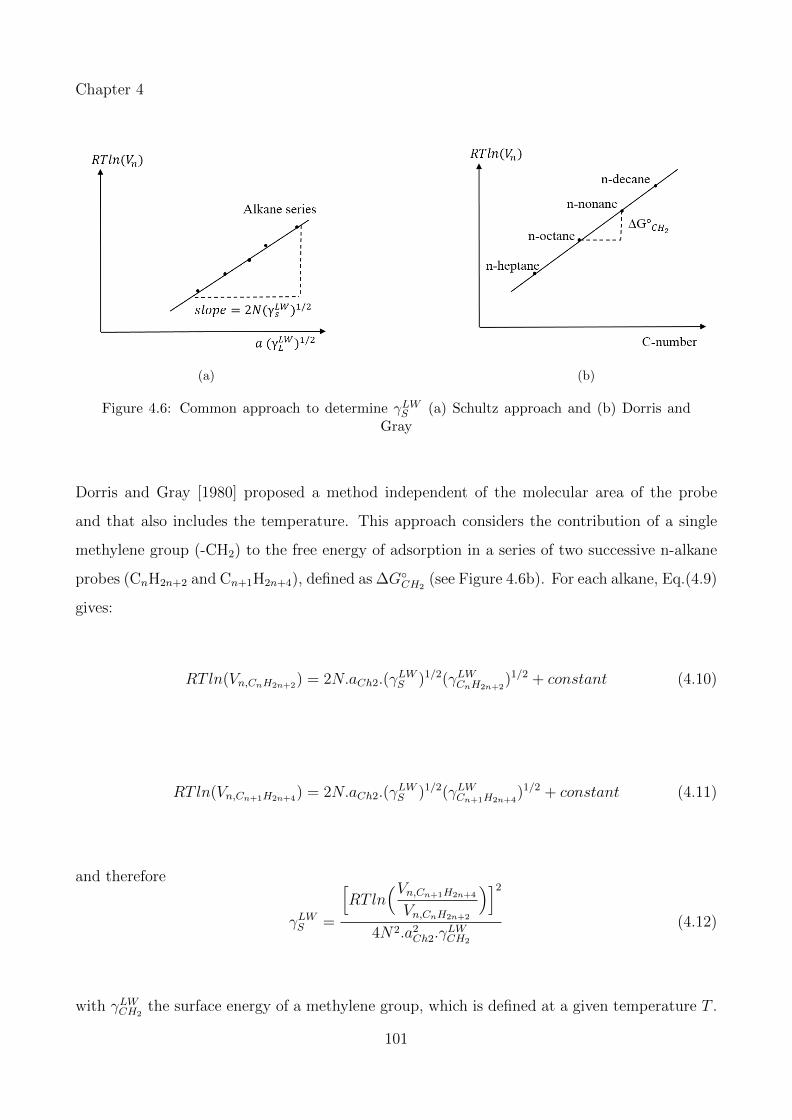
Chapter 4
(a) (b)
Figure 4.6: Common approach to determine γLWS (a) Schultz approach and (b) Dorris andGray
Dorris and Gray [1980] proposed a method independent of the molecular area of the probe
and that also includes the temperature. This approach considers the contribution of a single
methylene group (-CH2) to the free energy of adsorption in a series of two successive n-alkane
probes (CnH2n+2 and Cn+1H2n+4), defined as ∆G◦CH2
(see Figure 4.6b). For each alkane, Eq.(4.9)
gives:
RTln(Vn,CnH2n+2) = 2N.aCh2.(γLWS )1/2(γLWCnH2n+2
)1/2 + constant (4.10)
RTln(Vn,Cn+1H2n+4) = 2N.aCh2.(γLWS )1/2(γLWCn+1H2n+4
)1/2 + constant (4.11)
and therefore
γLWS =
[RTln
(Vn,Cn+1H2n+4
Vn,CnH2n+2
)]24N2.a2Ch2.γ
LWCH2
(4.12)
with γLWCH2the surface energy of a methylene group, which is defined at a given temperature T .
101
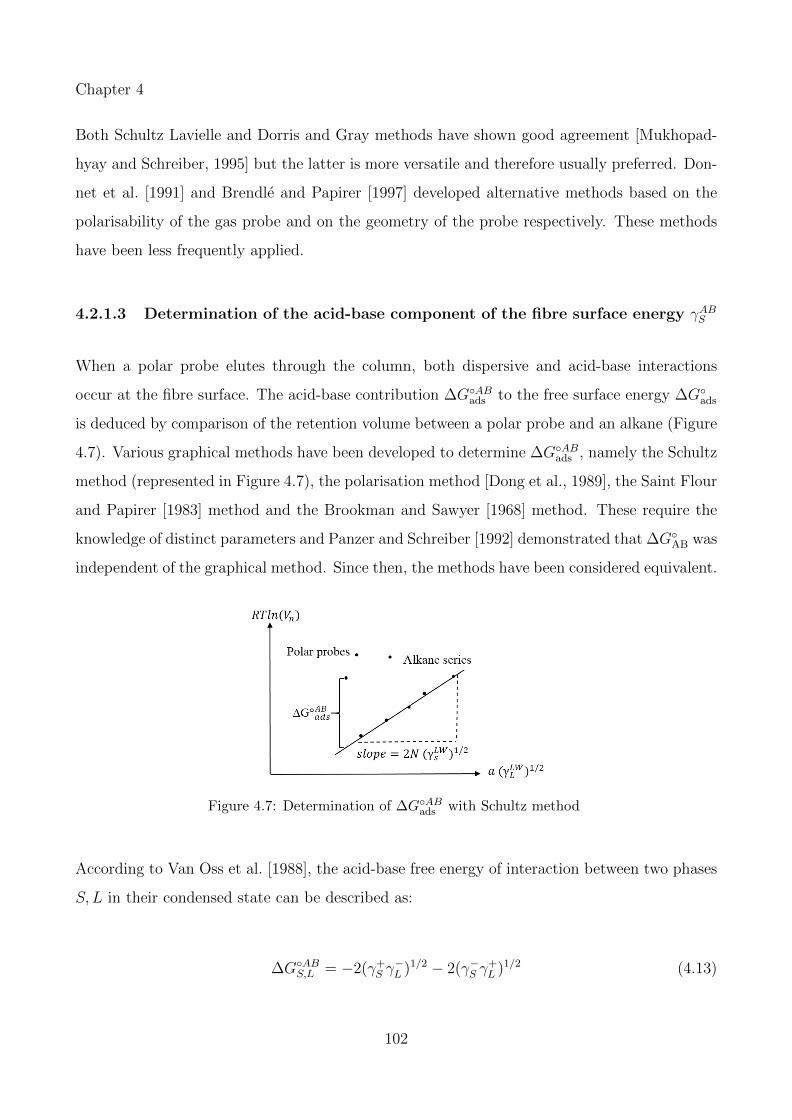
Chapter 4
Both Schultz Lavielle and Dorris and Gray methods have shown good agreement [Mukhopad-
hyay and Schreiber, 1995] but the latter is more versatile and therefore usually preferred. Don-
net et al. [1991] and Brendle and Papirer [1997] developed alternative methods based on the
polarisability of the gas probe and on the geometry of the probe respectively. These methods
have been less frequently applied.
4.2.1.3 Determination of the acid-base component of the fibre surface energy γABS
When a polar probe elutes through the column, both dispersive and acid-base interactions
occur at the fibre surface. The acid-base contribution ∆G◦ABads to the free surface energy ∆G◦
ads
is deduced by comparison of the retention volume between a polar probe and an alkane (Figure
4.7). Various graphical methods have been developed to determine ∆G◦ABads , namely the Schultz
method (represented in Figure 4.7), the polarisation method [Dong et al., 1989], the Saint Flour
and Papirer [1983] method and the Brookman and Sawyer [1968] method. These require the
knowledge of distinct parameters and Panzer and Schreiber [1992] demonstrated that ∆G◦AB was
independent of the graphical method. Since then, the methods have been considered equivalent.
Figure 4.7: Determination of ∆G◦ABads with Schultz method
According to Van Oss et al. [1988], the acid-base free energy of interaction between two phases
S, L in their condensed state can be described as:
∆G◦ABS,L = −2(γ+S γ
−L )1/2 − 2(γ−S γ
+L )1/2 (4.13)
102

Chapter 4
where γ+ represents the electron-acceptor parameter and γ− the electron-donor parameter of
the surface tension. These constituents are not additive and the total acid-base component of
the surface tension is given by:
γABS = 2(γ+S γ
−S )1/2 (4.14)
In practice, the experiment involves a series of n-alkanes to build the alkane reference line
followed by injection of a mono polar acid probe L1 (γ−L1 = 0) and a basic probe L2 (γ+L2 = 0).
In these conditions, a system of two equations with two unknowns can be established from
Eq.(4.13) to solve γABS . Two scales are commonly used for the surface tension components
of the probes, which are based on the surface tension of water. The Van Oss scale considers
the acid-base surface tension of water to be neutral (γ+l = γ−l = 25 mJ.m−2) where as the
Della Volpe scale assumes that water is more acidic (γ+l = 10 mJ.m−2 and γ−l = 65 mJ.m−2)
[Della Volpe and Siboni, 1997]. The latter has shown more accurate results than the Van Oss
scale [Baley et al., 2006, Kondor et al., 2014, Thielmann, 2004].
Finally, the total surface energy of the fibre surface equals the sum of γLWS and γABS as these
components are additive [Van Oss et al., 1988]:
γTOTS = γLWS + γAB
S (4.15)
4.2.2 Experimental procedure
IGC is usually performed at infinite dilution i.e. it involves very small amount of solvent,
typically 10−6 to 10−5 Mol [Belgacem and Gandini, 1999]. In these conditions, only adsorbate-
adsorbent interactions occur and adsorbate-adsorbate interactions are negligible: the retention
volume Vn is independent of the amount of adsorbate injected in the column hence the isotherms
are linear and Henry’s law applies [Yla-Maihaniemi et al., 2008]. On the other hand, working at
103
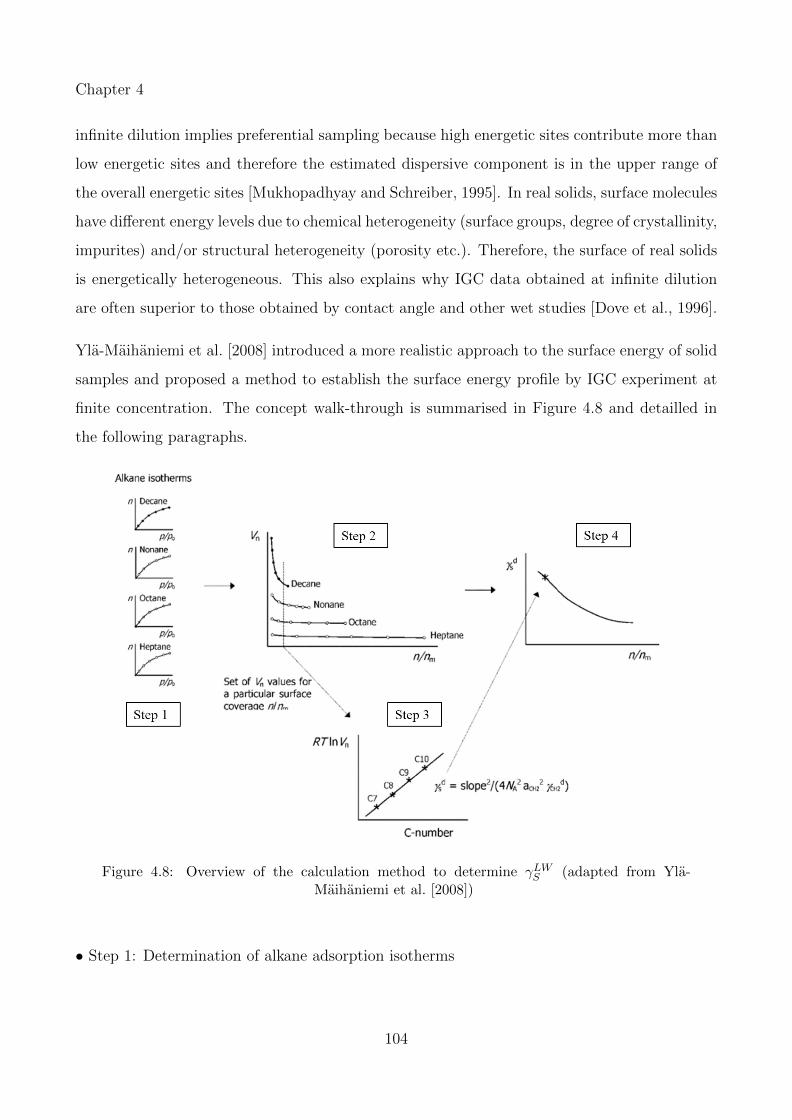
Chapter 4
infinite dilution implies preferential sampling because high energetic sites contribute more than
low energetic sites and therefore the estimated dispersive component is in the upper range of
the overall energetic sites [Mukhopadhyay and Schreiber, 1995]. In real solids, surface molecules
have different energy levels due to chemical heterogeneity (surface groups, degree of crystallinity,
impurites) and/or structural heterogeneity (porosity etc.). Therefore, the surface of real solids
is energetically heterogeneous. This also explains why IGC data obtained at infinite dilution
are often superior to those obtained by contact angle and other wet studies [Dove et al., 1996].
Yla-Maihaniemi et al. [2008] introduced a more realistic approach to the surface energy of solid
samples and proposed a method to establish the surface energy profile by IGC experiment at
finite concentration. The concept walk-through is summarised in Figure 4.8 and detailled in
the following paragraphs.
Figure 4.8: Overview of the calculation method to determine γLWS (adapted from Yla-Maihaniemi et al. [2008])
• Step 1: Determination of alkane adsorption isotherms
104
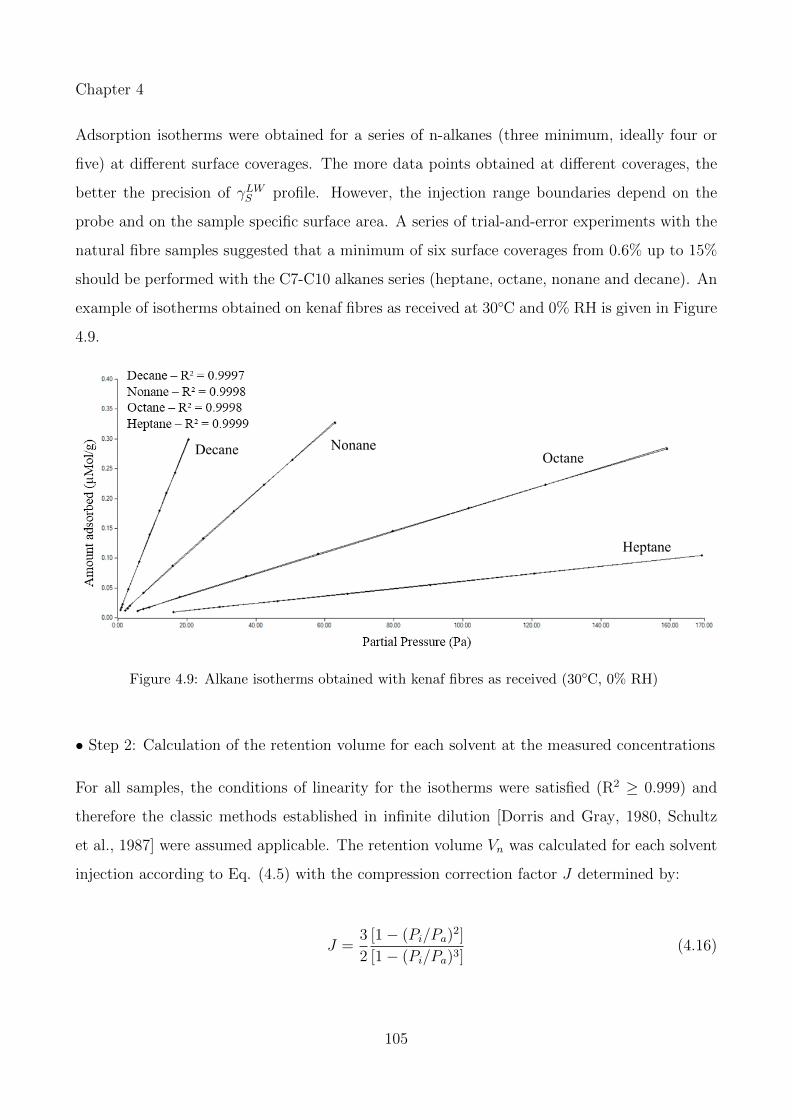
Chapter 4
Adsorption isotherms were obtained for a series of n-alkanes (three minimum, ideally four or
five) at different surface coverages. The more data points obtained at different coverages, the
better the precision of γLWS profile. However, the injection range boundaries depend on the
probe and on the sample specific surface area. A series of trial-and-error experiments with the
natural fibre samples suggested that a minimum of six surface coverages from 0.6% up to 15%
should be performed with the C7-C10 alkanes series (heptane, octane, nonane and decane). An
example of isotherms obtained on kenaf fibres as received at 30◦C and 0% RH is given in Figure
4.9.
Figure 4.9: Alkane isotherms obtained with kenaf fibres as received (30◦C, 0% RH)
• Step 2: Calculation of the retention volume for each solvent at the measured concentrations
For all samples, the conditions of linearity for the isotherms were satisfied (R2 ≥ 0.999) and
therefore the classic methods established in infinite dilution [Dorris and Gray, 1980, Schultz
et al., 1987] were assumed applicable. The retention volume Vn was calculated for each solvent
injection according to Eq. (4.5) with the compression correction factor J determined by:
J =3
2
[1 − (Pi/Pa)2]
[1 − (Pi/Pa)3](4.16)
105
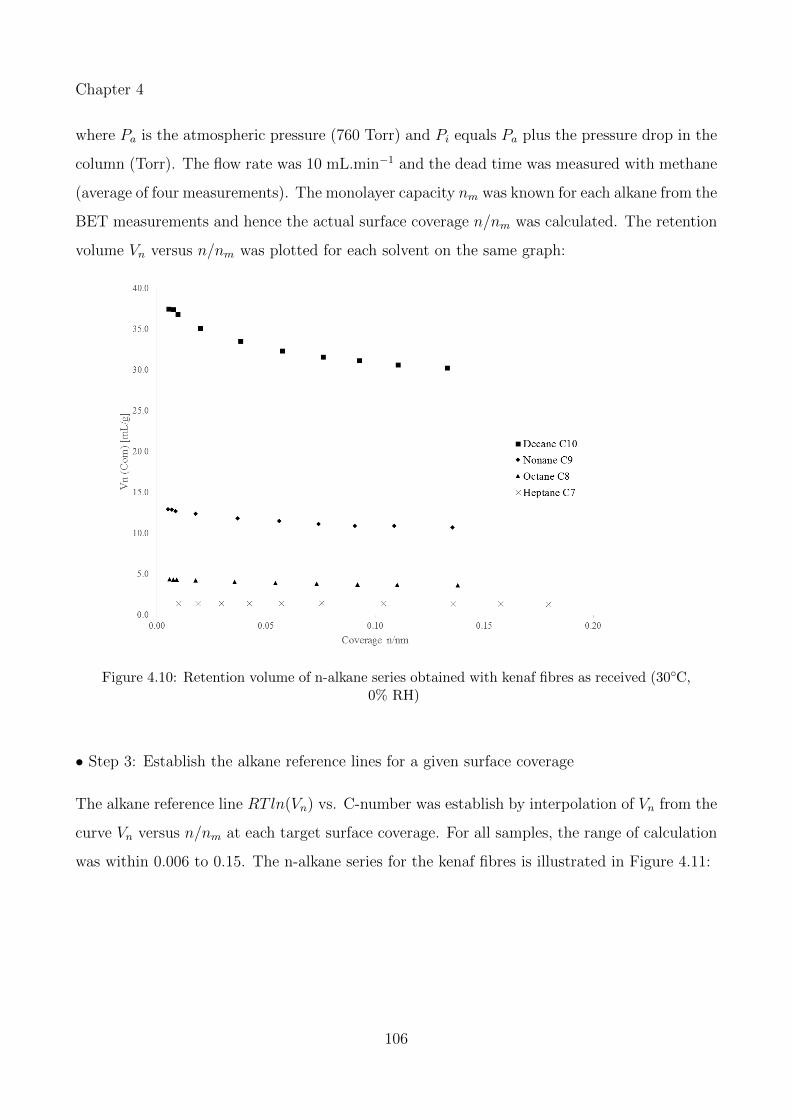
Chapter 4
where Pa is the atmospheric pressure (760 Torr) and Pi equals Pa plus the pressure drop in the
column (Torr). The flow rate was 10 mL.min−1 and the dead time was measured with methane
(average of four measurements). The monolayer capacity nm was known for each alkane from the
BET measurements and hence the actual surface coverage n/nm was calculated. The retention
volume Vn versus n/nm was plotted for each solvent on the same graph:
Figure 4.10: Retention volume of n-alkane series obtained with kenaf fibres as received (30◦C,0% RH)
• Step 3: Establish the alkane reference lines for a given surface coverage
The alkane reference line RTln(Vn) vs. C-number was establish by interpolation of Vn from the
curve Vn versus n/nm at each target surface coverage. For all samples, the range of calculation
was within 0.006 to 0.15. The n-alkane series for the kenaf fibres is illustrated in Figure 4.11:
106
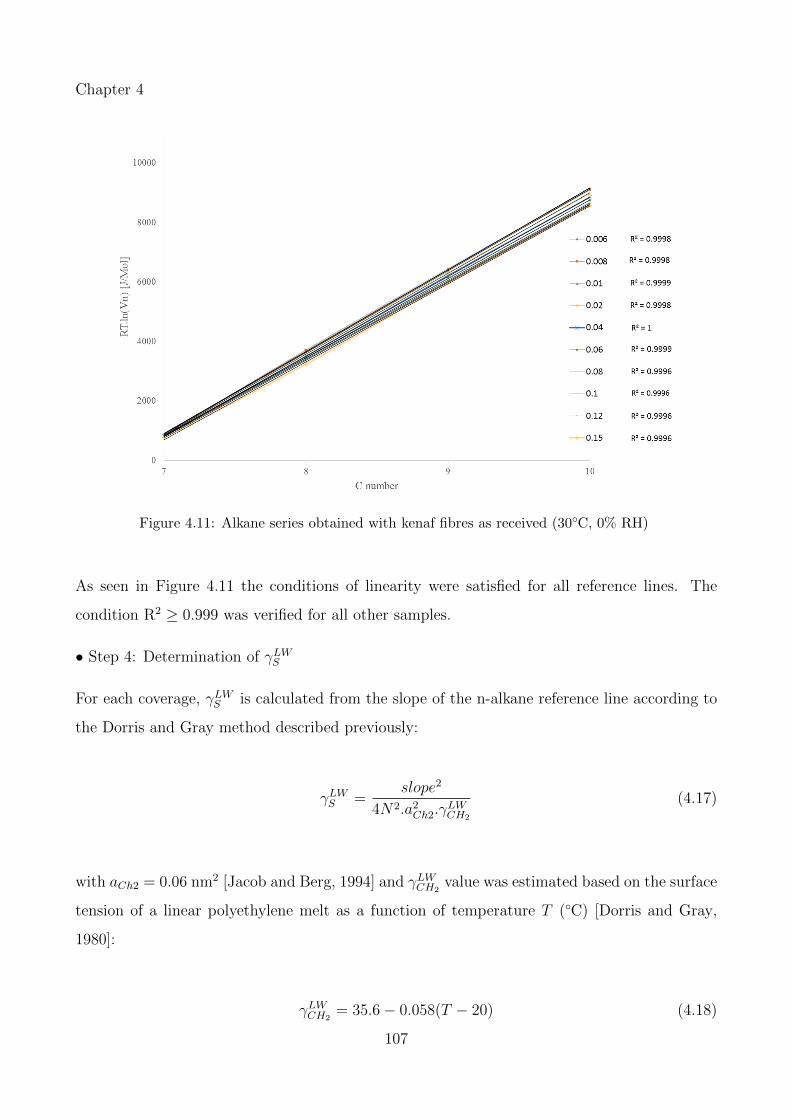
Chapter 4
Figure 4.11: Alkane series obtained with kenaf fibres as received (30◦C, 0% RH)
As seen in Figure 4.11 the conditions of linearity were satisfied for all reference lines. The
condition R2 ≥ 0.999 was verified for all other samples.
• Step 4: Determination of γLWS
For each coverage, γLWS is calculated from the slope of the n-alkane reference line according to
the Dorris and Gray method described previously:
γLWS =slope2
4N2.a2Ch2.γLWCH2
(4.17)
with aCh2 = 0.06 nm2 [Jacob and Berg, 1994] and γLWCH2value was estimated based on the surface
tension of a linear polyethylene melt as a function of temperature T (◦C) [Dorris and Gray,
1980]:
γLWCH2= 35.6 − 0.058(T − 20) (4.18)
107
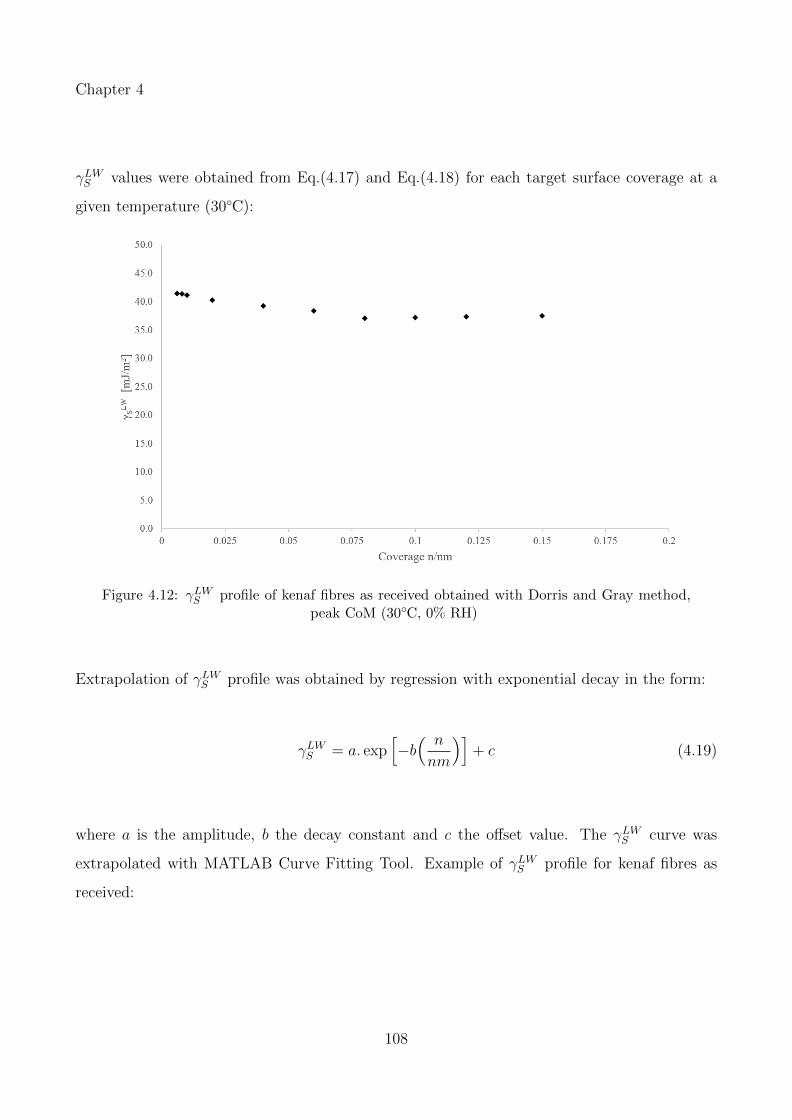
Chapter 4
γLWS values were obtained from Eq.(4.17) and Eq.(4.18) for each target surface coverage at a
given temperature (30◦C):
Figure 4.12: γLWS profile of kenaf fibres as received obtained with Dorris and Gray method,peak CoM (30◦C, 0% RH)
Extrapolation of γLWS profile was obtained by regression with exponential decay in the form:
γLWS = a. exp[−b( n
nm
)]+ c (4.19)
where a is the amplitude, b the decay constant and c the offset value. The γLWS curve was
extrapolated with MATLAB Curve Fitting Tool. Example of γLWS profile for kenaf fibres as
received:
108
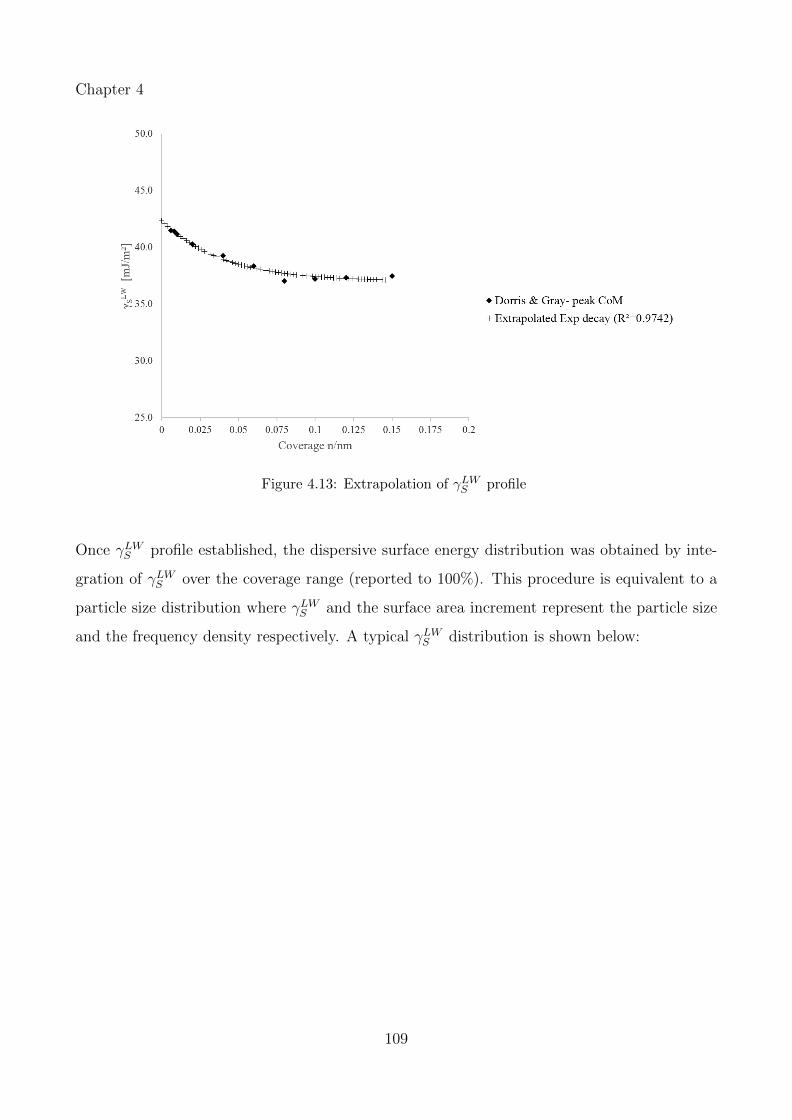
Chapter 4
Figure 4.13: Extrapolation of γLWS profile
Once γLWS profile established, the dispersive surface energy distribution was obtained by inte-
gration of γLWS over the coverage range (reported to 100%). This procedure is equivalent to a
particle size distribution where γLWS and the surface area increment represent the particle size
and the frequency density respectively. A typical γLWS distribution is shown below:
109
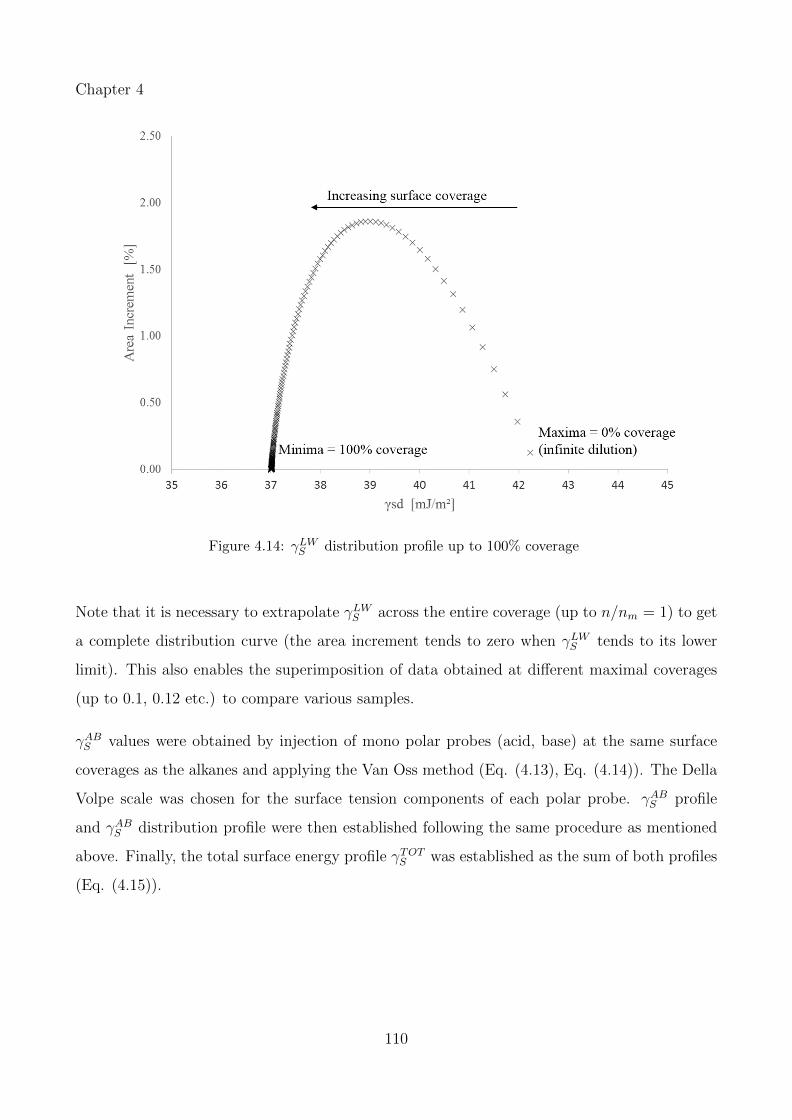
Chapter 4
Figure 4.14: γLWS distribution profile up to 100% coverage
Note that it is necessary to extrapolate γLWS across the entire coverage (up to n/nm = 1) to get
a complete distribution curve (the area increment tends to zero when γLWS tends to its lower
limit). This also enables the superimposition of data obtained at different maximal coverages
(up to 0.1, 0.12 etc.) to compare various samples.
γABS values were obtained by injection of mono polar probes (acid, base) at the same surface
coverages as the alkanes and applying the Van Oss method (Eq. (4.13), Eq. (4.14)). The Della
Volpe scale was chosen for the surface tension components of each polar probe. γABS profile
and γABS distribution profile were then established following the same procedure as mentioned
above. Finally, the total surface energy profile γTOTS was established as the sum of both profiles
(Eq. (4.15)).
110
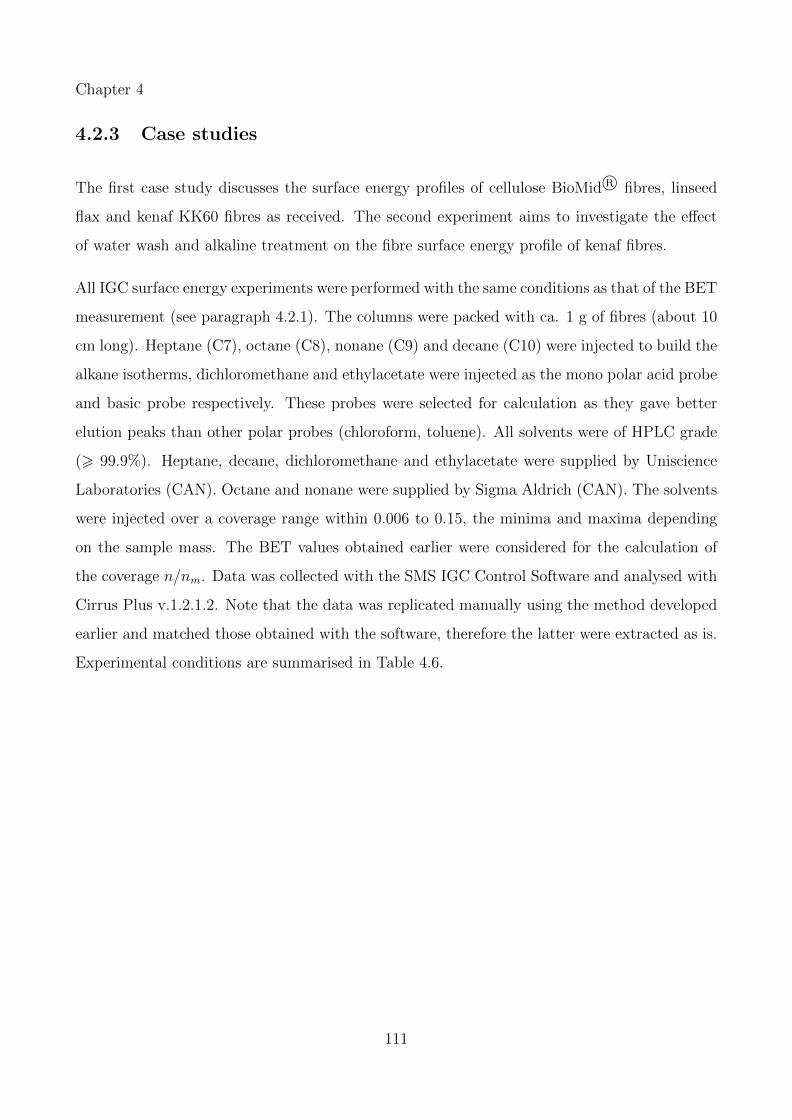
Chapter 4
4.2.3 Case studies
The first case study discusses the surface energy profiles of cellulose BioMid R© fibres, linseed
flax and kenaf KK60 fibres as received. The second experiment aims to investigate the effect
of water wash and alkaline treatment on the fibre surface energy profile of kenaf fibres.
All IGC surface energy experiments were performed with the same conditions as that of the BET
measurement (see paragraph 4.2.1). The columns were packed with ca. 1 g of fibres (about 10
cm long). Heptane (C7), octane (C8), nonane (C9) and decane (C10) were injected to build the
alkane isotherms, dichloromethane and ethylacetate were injected as the mono polar acid probe
and basic probe respectively. These probes were selected for calculation as they gave better
elution peaks than other polar probes (chloroform, toluene). All solvents were of HPLC grade
(> 99.9%). Heptane, decane, dichloromethane and ethylacetate were supplied by Uniscience
Laboratories (CAN). Octane and nonane were supplied by Sigma Aldrich (CAN). The solvents
were injected over a coverage range within 0.006 to 0.15, the minima and maxima depending
on the sample mass. The BET values obtained earlier were considered for the calculation of
the coverage n/nm. Data was collected with the SMS IGC Control Software and analysed with
Cirrus Plus v.1.2.1.2. Note that the data was replicated manually using the method developed
earlier and matched those obtained with the software, therefore the latter were extracted as is.
Experimental conditions are summarised in Table 4.6.
111
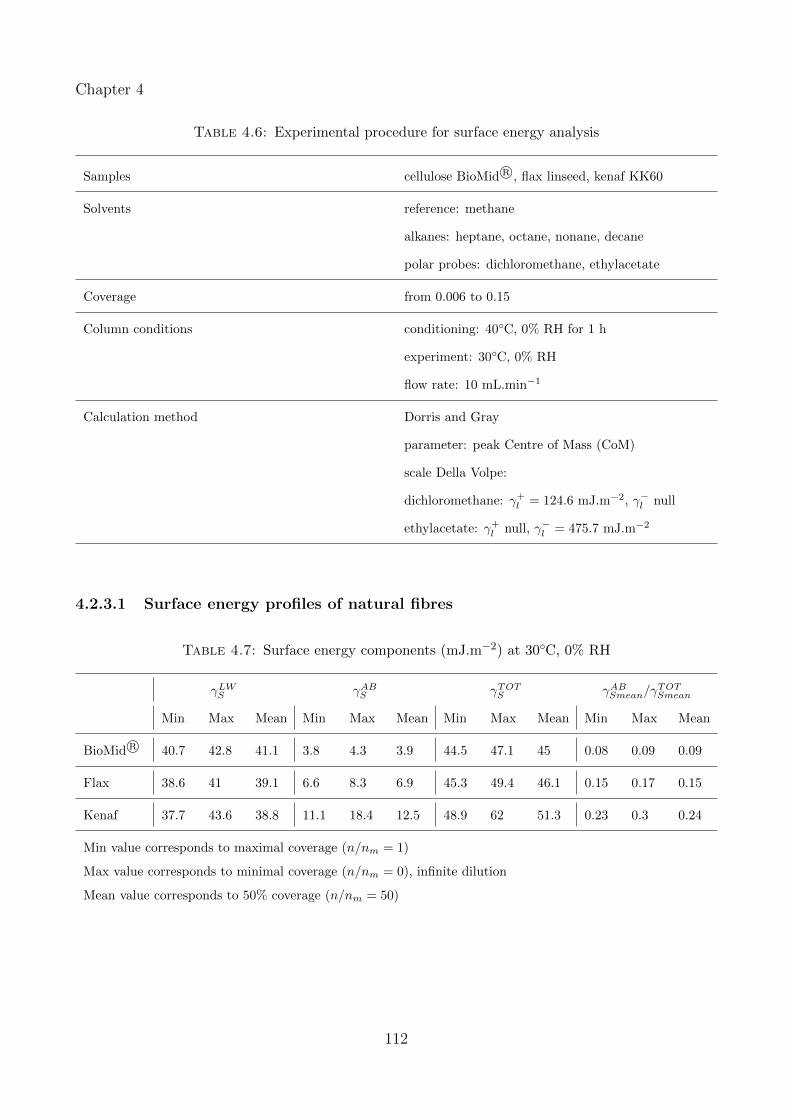
Chapter 4
Table 4.6: Experimental procedure for surface energy analysis
Samples cellulose BioMid R©, flax linseed, kenaf KK60
Solvents reference: methane
alkanes: heptane, octane, nonane, decane
polar probes: dichloromethane, ethylacetate
Coverage from 0.006 to 0.15
Column conditions conditioning: 40◦C, 0% RH for 1 h
experiment: 30◦C, 0% RH
flow rate: 10 mL.min−1
Calculation method Dorris and Gray
parameter: peak Centre of Mass (CoM)
scale Della Volpe:
dichloromethane: γ+l = 124.6 mJ.m−2, γ−l null
ethylacetate: γ+l null, γ−l = 475.7 mJ.m−2
4.2.3.1 Surface energy profiles of natural fibres
Table 4.7: Surface energy components (mJ.m−2) at 30◦C, 0% RH
γLWS γAB
S γTOTS γAB
Smean/γTOTSmean
Min Max Mean Min Max Mean Min Max Mean Min Max Mean
BioMid R© 40.7 42.8 41.1 3.8 4.3 3.9 44.5 47.1 45 0.08 0.09 0.09
Flax 38.6 41 39.1 6.6 8.3 6.9 45.3 49.4 46.1 0.15 0.17 0.15
Kenaf 37.7 43.6 38.8 11.1 18.4 12.5 48.9 62 51.3 0.23 0.3 0.24
Min value corresponds to maximal coverage (n/nm = 1)
Max value corresponds to minimal coverage (n/nm = 0), infinite dilution
Mean value corresponds to 50% coverage (n/nm = 50)
112
Chapter 4
The distribution profiles represent the surface energy heterogeneity in a similar manner to a
population distribution profile: the wider the curve, the more heterogeneous the surface. γLWS
and γABS distribution profiles of the cellulose, flax and kenaf fibres are given in Figure 4.15a and
Figure 4.15b respectively. The cellulose BioMid R© fibre surface was the most homogeneous with
dispersive energy values ranging from 40.7 mJ.m−2 to 42.8 mJ.m−2 and acid-base energy values
comprised between 3.8 mJ.m−2 and 4.3 mJ.m−2. This was expected as the BioMid R© fibres
were produced by spinning process and had a regular smooth surface. The flax fibre surface
appeared more heterogeneous than the BioMid R©, with 38.6 mJ.m−2 6 γLWS 6 41.0 mJ.m−2
and 6.6 mJ.m−2 6 γABS 6 8.3 mJ.m−2. The kenaf fibres showed the most heterogeneous surface
with 37.7 mJ.m−2 6 γLWS 6 43.6 mJ.m−2 and 11.1 mJ.m−2 6 γABS 6 18.4 mJ.m−2.
The γLWS profile trends suggested that the kenaf fibre surface contained active sites with energy
levels spread more than those of flax fibre surface. The dispersive component heterogeneity
could be due to porosity, defects and asperities on the kenaf fibres. Previously, SEM results
highlighted that the kenaf and flax fibre surface topography clearly differed. The kenaf fibre
surface was covered with patches of an amorphous mixture and the flax fibres were mostly cov-
ered by the epidermal/cuticle layer. Therefore, both surfaces likely contained different energetic
sites with various energy levels. The kenaf fibres’ surface likely contained a mixture of com-
ponents which explains the large dispersion. A ranking based on the mean values (coverage of
50%) gives γLWSmean(kenaf) 6 γLWSmean(flax) 6 γLWSmean(BioMid R©). The flax fibres were unretted
and likely contained more waxy substances than the kenaf fibres (water retted), which could
explain the higher dispersive energy values at higher coverages (waxes are highly non-polar).
The γABS distribution profile trends were similar to that of γLWS (Figure 4.15b). As expected,
BioMid R© fibres were the least polar and the most homogeneous i.e. the few polar sites present
on the fibres’ surface had similar energy levels. Flax fibre surface contained polar groups of
lower energy than that of kenaf fibre surface, which is consistent with the assumption that
the former surface was rich in waxes and the kenaf fibres contained various polar components.
Kenaf fibres’ surface likely comprised more Lewis acid-base functional groups than that of flax,
for instance lignins, pectins and extractives.
113
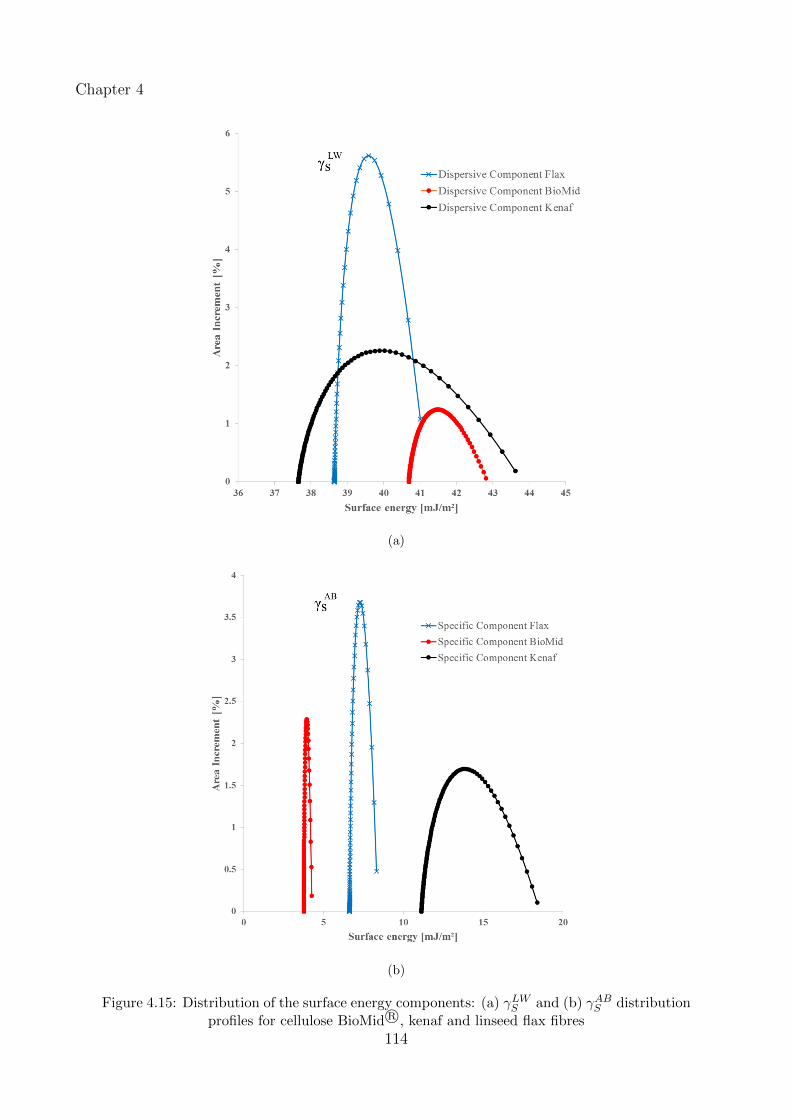
Chapter 4
(a)
(b)
Figure 4.15: Distribution of the surface energy components: (a) γLWS and (b) γABS distribution
profiles for cellulose BioMid R©, kenaf and linseed flax fibres
114
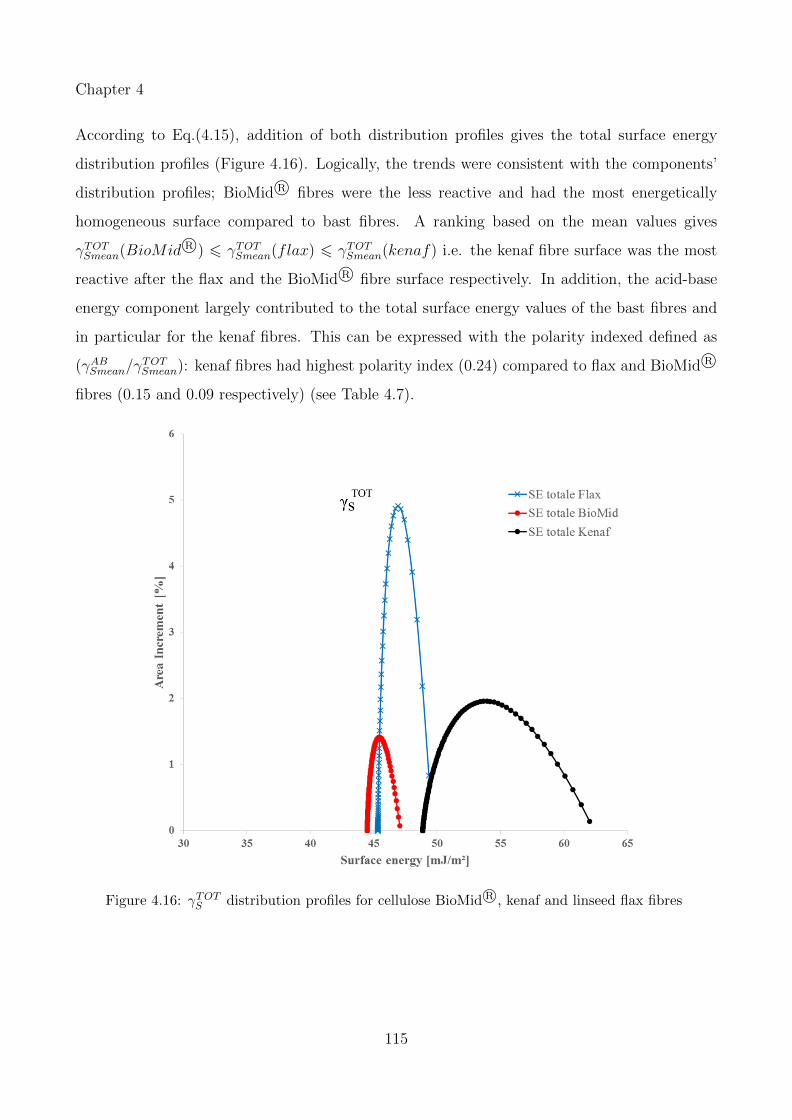
Chapter 4
According to Eq.(4.15), addition of both distribution profiles gives the total surface energy
distribution profiles (Figure 4.16). Logically, the trends were consistent with the components’
distribution profiles; BioMid R© fibres were the less reactive and had the most energetically
homogeneous surface compared to bast fibres. A ranking based on the mean values gives
γTOTSmean(BioMid R©) 6 γTOT
Smean(flax) 6 γTOTSmean(kenaf) i.e. the kenaf fibre surface was the most
reactive after the flax and the BioMid R© fibre surface respectively. In addition, the acid-base
energy component largely contributed to the total surface energy values of the bast fibres and
in particular for the kenaf fibres. This can be expressed with the polarity indexed defined as
(γABSmean/γ
TOTSmean): kenaf fibres had highest polarity index (0.24) compared to flax and BioMid R©
fibres (0.15 and 0.09 respectively) (see Table 4.7).
Figure 4.16: γTOTS distribution profiles for cellulose BioMid R©, kenaf and linseed flax fibres
115
Chapter 4
It is worth noting that data interpretation based on energy values obtained at infinite dilution
would be misleading. For instance, all energy components calculated at infinite dilution (en-
ergy values considered at 0% coverage) overestimate the mean values obtained at higher surface
coverage (50% surface coverage). The surface energy values of BioMid R© and flax fibres would
be overestimated by 5% and 7% respectively and by more than 20% for the kenaf fibres. Yla-
Maihaniemi et al. [2008] and Mukhopadhyay and Schreiber [1995] previously pointed out this
weakness of traditional IGC experiments. In addition, values obtained at infinite dilution sug-
gest that the kenaf fibres had highest dispersive energy component compared to the BioMid R©
and flax fibres, which differs from measurements at finite concentration. The latter provide a
more accurate representation of the surface and these results highlight the necessity to perform
IGC measurement at finite concentration.
4.2.3.2 Effect of chemical treatment on the fibre surface energy profile
Table 4.8: Surface energy components (mJ.m−2) at 30◦C, 0% RH
γLWS γAB
S γTOTS γAB
Smean/γTOTSmean
Min Max Mean Min Max Mean Min Max Mean Min Max Mean
Kenaf as
received
37.6 43.6 38.8 11.1 18.4 12.5 48.9 62 51.3 0.23 0.3 0.24
Kenaf
wash
39.5 41.7 39.9 9.2 13.9 10.1 48.8 55.6 50.1 0.19 0.25 0.20
Kenaf
NaOH
39.8 43.1 40.4 7.2 12 8.1 47 55 48.5 0.15 0.22 0.17
Min value corresponds to maximal coverage (n/nm = 1)
Max value corresponds to minimal coverage (n/nm = 0), infinite dilution
Mean value corresponds to 50% coverage (n/nm = 50)
The water wash and alkaline treatments changed both the distribution of the energetic sites and
the energy levels of γLWS and γABS and therefore of γTOT
S (Figure 4.17 and Figure 4.18). Both
the water wash and alkaline treatments induced a shift to higher average γLWS values suggesting
that the kenaf fibre surface became more hydrophobic (Figure 4.17a). The evolution of γLWS
profile indicates an increase in number of high energetic sites and/or an increase in energy
116
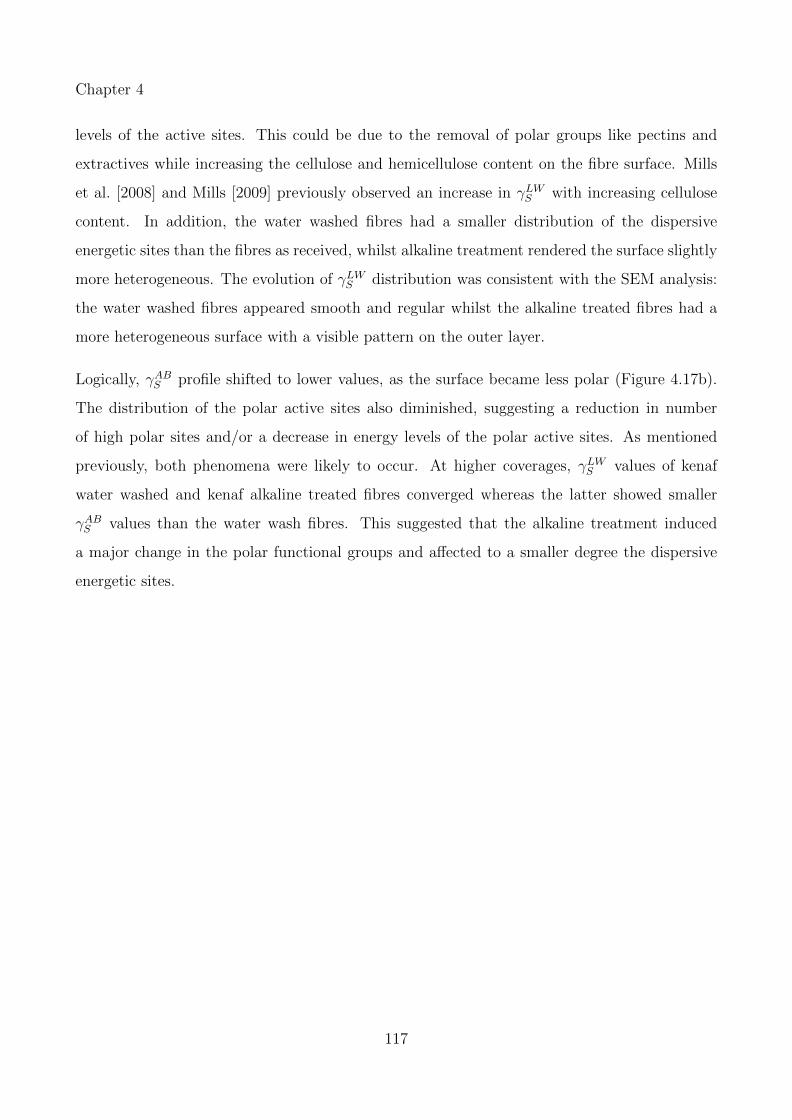
Chapter 4
levels of the active sites. This could be due to the removal of polar groups like pectins and
extractives while increasing the cellulose and hemicellulose content on the fibre surface. Mills
et al. [2008] and Mills [2009] previously observed an increase in γLWS with increasing cellulose
content. In addition, the water washed fibres had a smaller distribution of the dispersive
energetic sites than the fibres as received, whilst alkaline treatment rendered the surface slightly
more heterogeneous. The evolution of γLWS distribution was consistent with the SEM analysis:
the water washed fibres appeared smooth and regular whilst the alkaline treated fibres had a
more heterogeneous surface with a visible pattern on the outer layer.
Logically, γABS profile shifted to lower values, as the surface became less polar (Figure 4.17b).
The distribution of the polar active sites also diminished, suggesting a reduction in number
of high polar sites and/or a decrease in energy levels of the polar active sites. As mentioned
previously, both phenomena were likely to occur. At higher coverages, γLWS values of kenaf
water washed and kenaf alkaline treated fibres converged whereas the latter showed smaller
γABS values than the water wash fibres. This suggested that the alkaline treatment induced
a major change in the polar functional groups and affected to a smaller degree the dispersive
energetic sites.
117
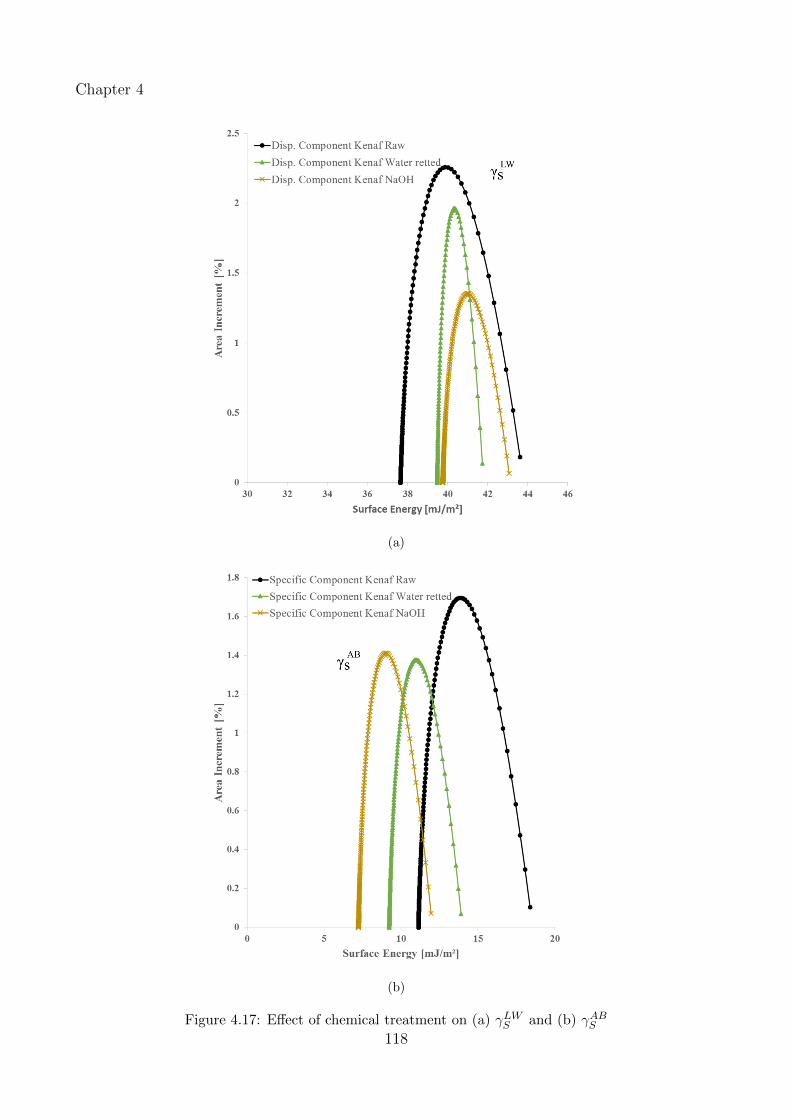
Chapter 4
(a)
(b)
Figure 4.17: Effect of chemical treatment on (a) γLWS and (b) γABS
118

Chapter 4
Finally, a comparison of the γTOTS distribution profiles highlights the overall effect of water wash
and alkaline treatment on the surface energy profile (Figure 4.18). The water wash reduced the
total surface energy values and the surface became more homogeneous. The alkaline treatment
further decreased the total energy values but rendered the surface slightly more heterogeneous.
Actually, the surface energy values were similar at high surface coverages: the kenaf as received,
water washed and alkaline treated fibres had a γTOTSmin = 48.9 mJ.m−2, 48.8 mJ.m−2 and 47
mJ.m−2 respectively. This indicates that both treatments only slightly affected the overall
surface energy of the fibres. On the other hand, the polarity index γABSmean/γ
TOTSmean showed that
both treatments reduced the surface polarity: kenaf fibres as received had a polarity index of
0.24 compared to 0.20 and 0.17 for the water washed and alkaline treated fibres respectively
(see Table 4.8).
As mentioned in the previous case study, a comparison based on measurements at infinite
dilution would overestimate the surface energy values by 20% for the kenaf fibres as received
(γTOTSinf = 62 mJ.m−2 and γTOT
Smean = 51.3 mJ.m−2) and by ca. 10% for the kenaf water washed
(γTOTSinf = 55.6 mJ.m−2 and γTOT
Smean = 50.1 mJ.m−2) and alkaline treated (γTOTSinf = 55 mJ.m−2
and γTOTSmean = 48.5 mJ.m−2).
119
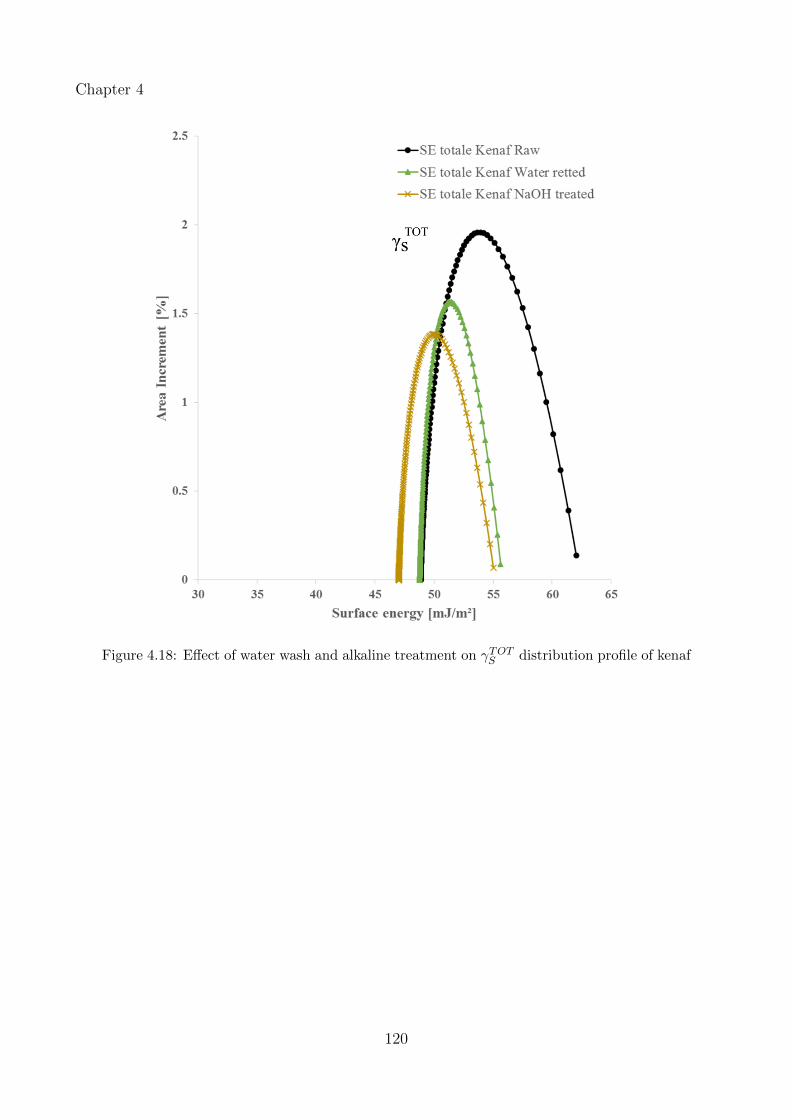
Chapter 4
Figure 4.18: Effect of water wash and alkaline treatment on γTOTS distribution profile of kenaf
120
Chapter 4
4.3 Conclusions
• IGC is a promising technique to study the surface energy of natural fibres, but IGC applied
to natural fibres is relatively recent therefore systematic studies need to be performed.
• In this study, the critical parameters to determine the BET surface area values were identified
and a protocol applicable to natural fibres was proposed.
• While IGC traditionally involves infinite dilution, surface energy measurements were per-
formed at finite concentration to obtain more realistic values. The surface energy distribution
profiles of the dispersive and the acid-base components provided key complementary informa-
tion to the overall surface energy profile of natural fibres and highlighted their specificity.
• Investigation of the effect of fibre treatment on the surface energy profiles of kenaf fibres
provided new insights, in particular the change in polarity and the distribution of the energetic
active sites. All results agreed well with the SEM and XPS analysis performed.
• IGC results showed that the alkaline treatment rendered the kenaf fibre surface less polar and
more energetically homogeneous. Consequently, the latter is expected to increase the interfacial
interactions with hydrophobic thermoplastics such as polypropylene, polyethylene and polyvinyl
chloride.
121
Chapter 5
Optimisation of Extrusion Process for
Biocomposites
The research presented in this chapter formed an integral part of the Cooperative Research
Centre for Advanced Composite Structures (CRC-ACS), Project P1.1 “Plant Fibre Biocom-
posites”. The first two sections give a brief synopsis of the CRC-ACS project and relevant
research to provide the reader an appreciation on how the thesis fits within the overall project.
The third section outlines the experimental approach used to design a series of extrusion tri-
als, followed by the results with discussions. The chapter concludes with an overview of the
extrusion trials performed with industrial partners.
5.1 Introduction
The aim of CRC-ACS P1.1 was to develop technology for increased adoption of plant fibre
biocomposites, to provide information and guidelines to the Australian composites industry en-
abling them to increase usage of sustainable composites, and to develop new composites based
on thermoset, thermoplastic and/or biopolymer matrices. Work package 2 “Enhanced Short
Fibre Biocomposites”, in which this project was integrated, had the aim to develop improved
short-fibre natural fibre composites for applications in the building and construction sector and
work towards the commercialisation of these materials by closing the existing gaps in the supply
122
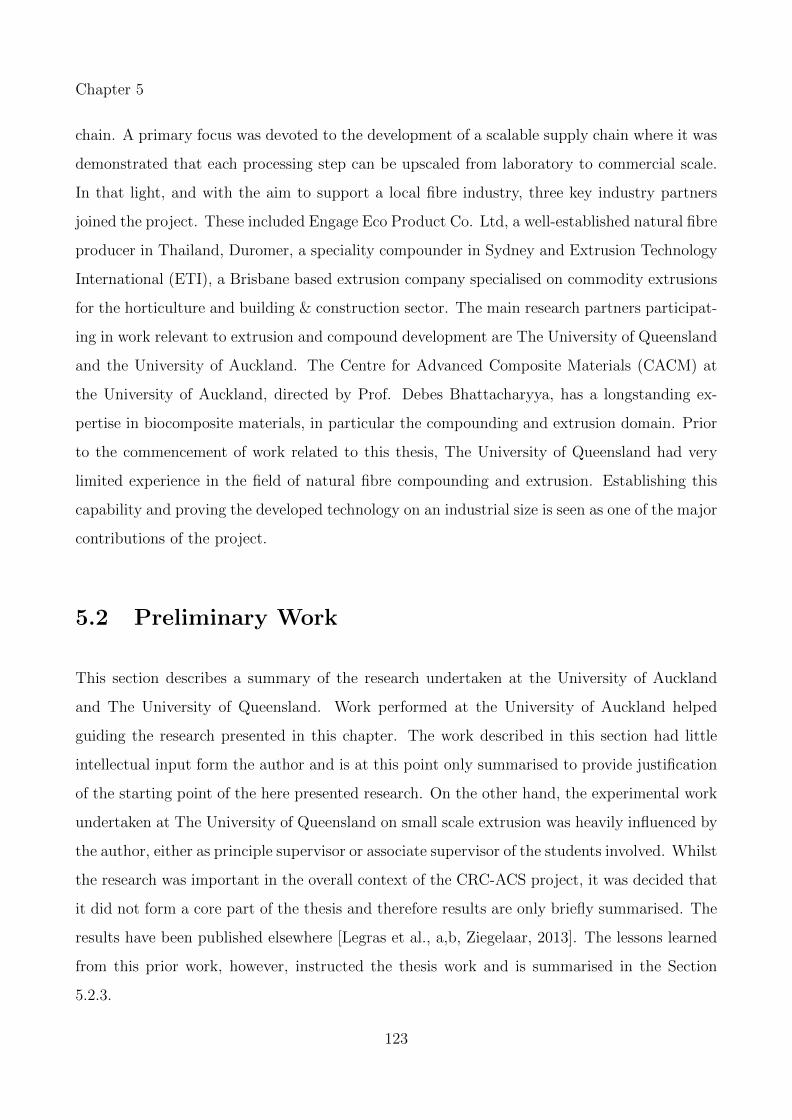
Chapter 5
chain. A primary focus was devoted to the development of a scalable supply chain where it was
demonstrated that each processing step can be upscaled from laboratory to commercial scale.
In that light, and with the aim to support a local fibre industry, three key industry partners
joined the project. These included Engage Eco Product Co. Ltd, a well-established natural fibre
producer in Thailand, Duromer, a speciality compounder in Sydney and Extrusion Technology
International (ETI), a Brisbane based extrusion company specialised on commodity extrusions
for the horticulture and building & construction sector. The main research partners participat-
ing in work relevant to extrusion and compound development are The University of Queensland
and the University of Auckland. The Centre for Advanced Composite Materials (CACM) at
the University of Auckland, directed by Prof. Debes Bhattacharyya, has a longstanding ex-
pertise in biocomposite materials, in particular the compounding and extrusion domain. Prior
to the commencement of work related to this thesis, The University of Queensland had very
limited experience in the field of natural fibre compounding and extrusion. Establishing this
capability and proving the developed technology on an industrial size is seen as one of the major
contributions of the project.
5.2 Preliminary Work
This section describes a summary of the research undertaken at the University of Auckland
and The University of Queensland. Work performed at the University of Auckland helped
guiding the research presented in this chapter. The work described in this section had little
intellectual input form the author and is at this point only summarised to provide justification
of the starting point of the here presented research. On the other hand, the experimental work
undertaken at The University of Queensland on small scale extrusion was heavily influenced by
the author, either as principle supervisor or associate supervisor of the students involved. Whilst
the research was important in the overall context of the CRC-ACS project, it was decided that
it did not form a core part of the thesis and therefore results are only briefly summarised. The
results have been published elsewhere [Legras et al., a,b, Ziegelaar, 2013]. The lessons learned
from this prior work, however, instructed the thesis work and is summarised in the Section
5.2.3.
123
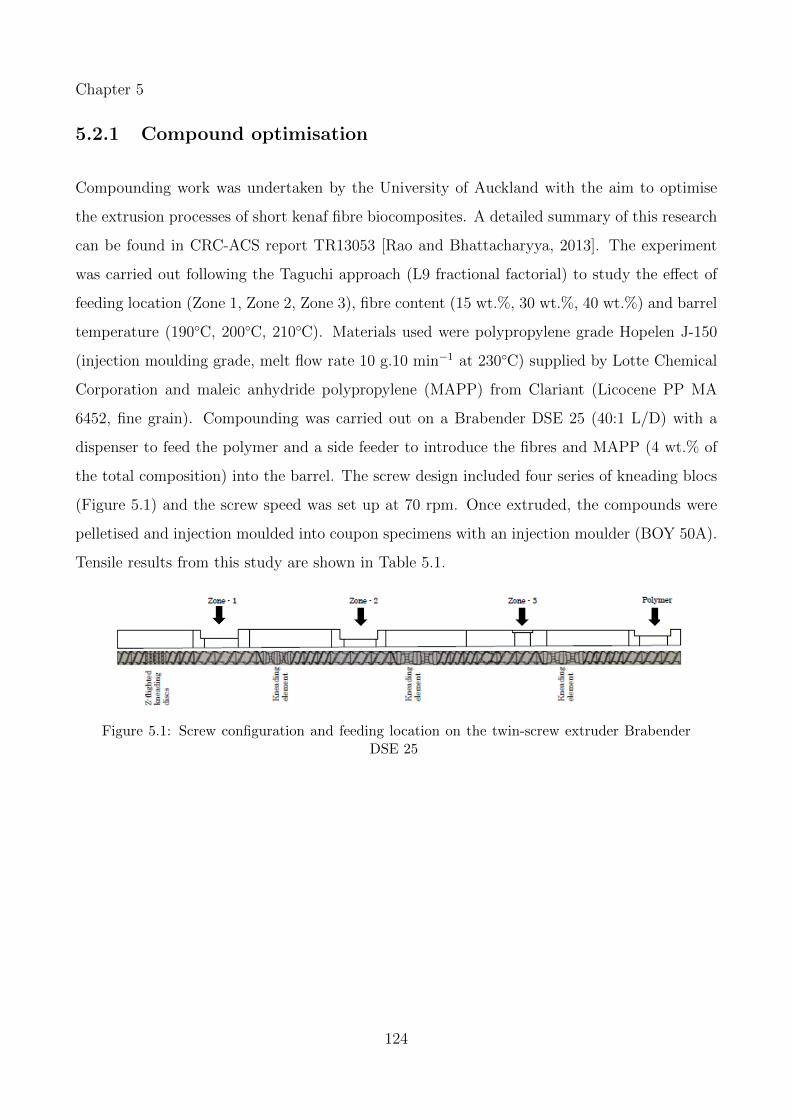
Chapter 5
5.2.1 Compound optimisation
Compounding work was undertaken by the University of Auckland with the aim to optimise
the extrusion processes of short kenaf fibre biocomposites. A detailed summary of this research
can be found in CRC-ACS report TR13053 [Rao and Bhattacharyya, 2013]. The experiment
was carried out following the Taguchi approach (L9 fractional factorial) to study the effect of
feeding location (Zone 1, Zone 2, Zone 3), fibre content (15 wt.%, 30 wt.%, 40 wt.%) and barrel
temperature (190◦C, 200◦C, 210◦C). Materials used were polypropylene grade Hopelen J-150
(injection moulding grade, melt flow rate 10 g.10 min−1 at 230◦C) supplied by Lotte Chemical
Corporation and maleic anhydride polypropylene (MAPP) from Clariant (Licocene PP MA
6452, fine grain). Compounding was carried out on a Brabender DSE 25 (40:1 L/D) with a
dispenser to feed the polymer and a side feeder to introduce the fibres and MAPP (4 wt.% of
the total composition) into the barrel. The screw design included four series of kneading blocs
(Figure 5.1) and the screw speed was set up at 70 rpm. Once extruded, the compounds were
pelletised and injection moulded into coupon specimens with an injection moulder (BOY 50A).
Tensile results from this study are shown in Table 5.1.
Figure 5.1: Screw configuration and feeding location on the twin-screw extruder BrabenderDSE 25
124
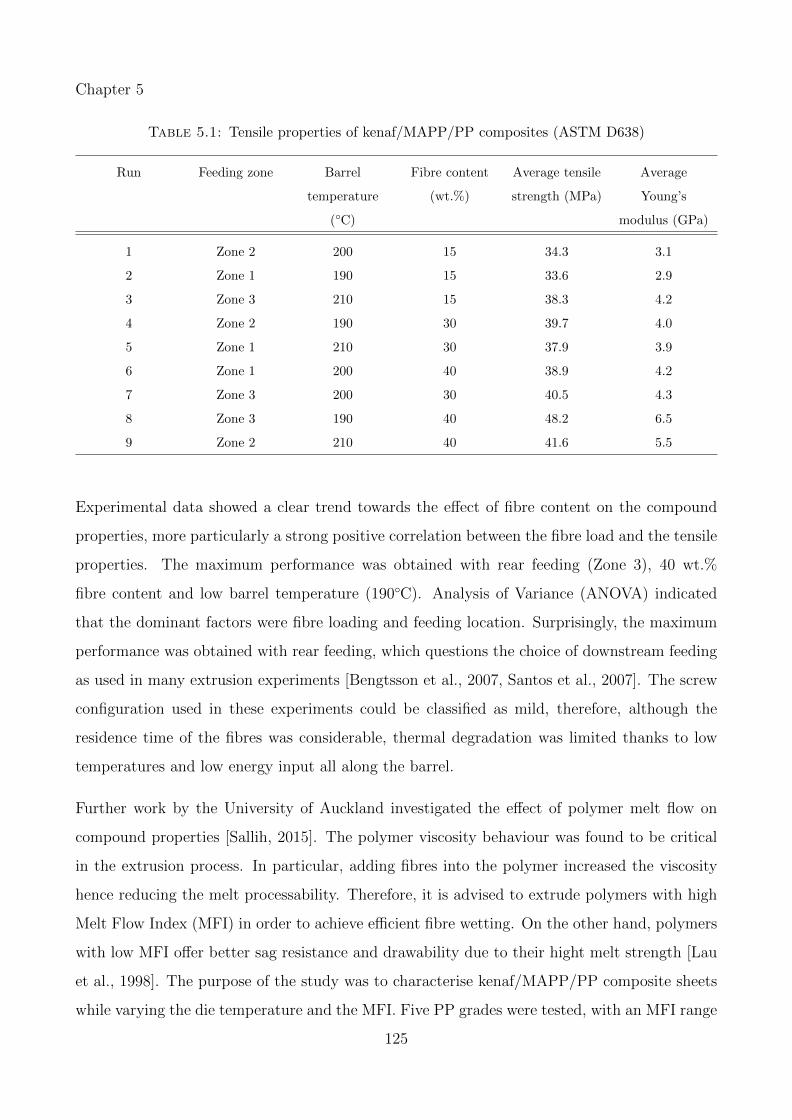
Chapter 5
Table 5.1: Tensile properties of kenaf/MAPP/PP composites (ASTM D638)
Run Feeding zone Barrel
temperature
(◦C)
Fibre content
(wt.%)
Average tensile
strength (MPa)
Average
Young’s
modulus (GPa)
1 Zone 2 200 15 34.3 3.1
2 Zone 1 190 15 33.6 2.9
3 Zone 3 210 15 38.3 4.2
4 Zone 2 190 30 39.7 4.0
5 Zone 1 210 30 37.9 3.9
6 Zone 1 200 40 38.9 4.2
7 Zone 3 200 30 40.5 4.3
8 Zone 3 190 40 48.2 6.5
9 Zone 2 210 40 41.6 5.5
Experimental data showed a clear trend towards the effect of fibre content on the compound
properties, more particularly a strong positive correlation between the fibre load and the tensile
properties. The maximum performance was obtained with rear feeding (Zone 3), 40 wt.%
fibre content and low barrel temperature (190◦C). Analysis of Variance (ANOVA) indicated
that the dominant factors were fibre loading and feeding location. Surprisingly, the maximum
performance was obtained with rear feeding, which questions the choice of downstream feeding
as used in many extrusion experiments [Bengtsson et al., 2007, Santos et al., 2007]. The screw
configuration used in these experiments could be classified as mild, therefore, although the
residence time of the fibres was considerable, thermal degradation was limited thanks to low
temperatures and low energy input all along the barrel.
Further work by the University of Auckland investigated the effect of polymer melt flow on
compound properties [Sallih, 2015]. The polymer viscosity behaviour was found to be critical
in the extrusion process. In particular, adding fibres into the polymer increased the viscosity
hence reducing the melt processability. Therefore, it is advised to extrude polymers with high
Melt Flow Index (MFI) in order to achieve efficient fibre wetting. On the other hand, polymers
with low MFI offer better sag resistance and drawability due to their hight melt strength [Lau
et al., 1998]. The purpose of the study was to characterise kenaf/MAPP/PP composite sheets
while varying the die temperature and the MFI. Five PP grades were tested, with an MFI range
125

Chapter 5
from 1.3 g.10 min−1 to 11 g.10 min−1: HP555G (MFI 1.3), HA899J (MFI 2.5), HP400L (MFI
5.5), HP422M (MFI 8.5) and HP400N (MFI 11). The maximal tensile and flexural mechanical
performance was obtained with the grade HP422M.
5.2.2 Effect of screw speed and screw design
A bench-top study was performed at The University of Queensland under supervision of the
author. The study focused on the influence of processing parameters on the mechanical prop-
erties of kenaf/high density polyethylene (HDPE) compounds. Kenaf fibres were supplied by
Ecofibre Industries Operations Pty Ltd and processed by high velocity air-mill (Aximill) prior
to extrusion. Materials were HDPE grade Cotene 3925 (MFI 3.5 g.10min−1 at 190◦C) supplied
by ICO Polymers and ethylene-maleic anhydride copolymer (PEMA) (licocene PE MA 4351)
supplied by Clariant. The fibres were added to the master batch PEMA (3 wt.%)/HDPE. L9
fractional factorial was performed with a lab-scale co-rotating twin-screw extruder EuroLab
XL16 (25:1 L/D). The Taguchi array involved three factors of three levels each: fibre loading (0
wt.%, 20 wt.%, 40 wt.%), screw speed (70 rpm, 100 rpm, 130 rpm) and various screw designs
(soft, mild, aggressive). The screw mixing zones were altered to modulate the shear input to
the melt flow using sequences of forward, neutral or rearward conveying elements (this will be
explained later in section 5.3). The feeding system comprised a top-mounted vibration plate to
feed the master batch and a Brabender volumetric side feeder to feed the fibres. The samples
were waterjet cut from direct extrusion (strip die) into ASTM D638 type IV tensile coupons.
Tensile data obtained are listed in Table 5.2.
126
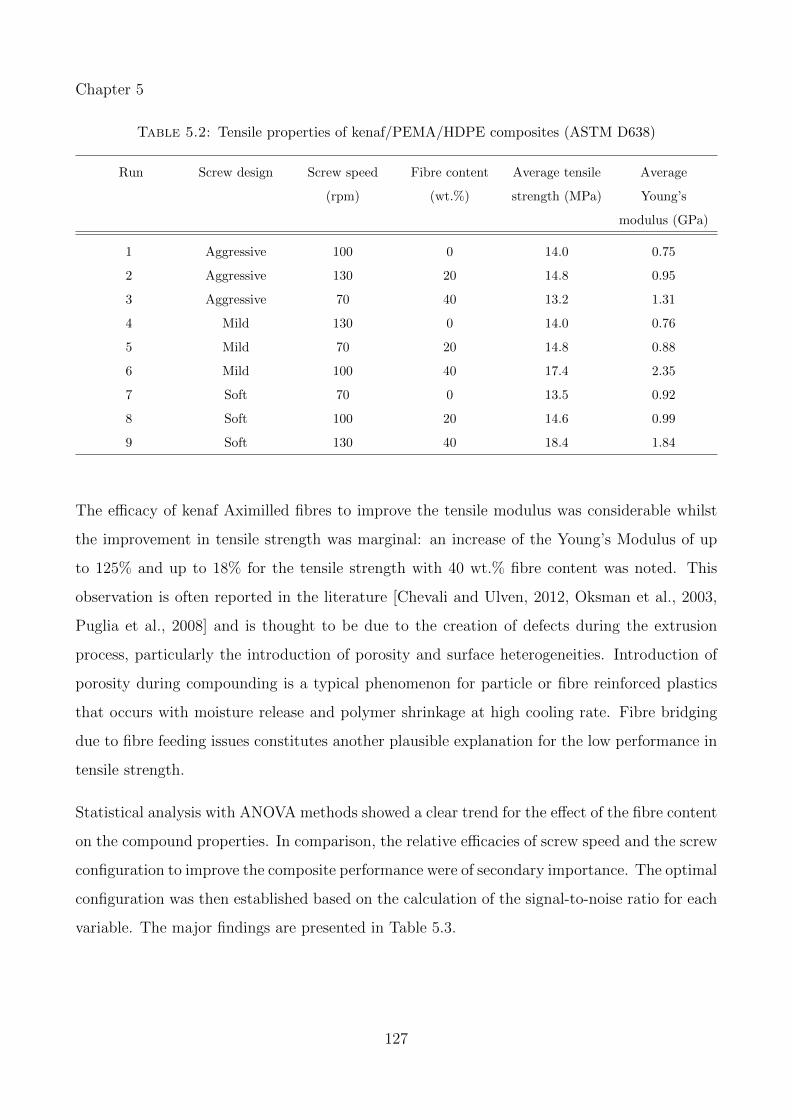
Chapter 5
Table 5.2: Tensile properties of kenaf/PEMA/HDPE composites (ASTM D638)
Run Screw design Screw speed
(rpm)
Fibre content
(wt.%)
Average tensile
strength (MPa)
Average
Young’s
modulus (GPa)
1 Aggressive 100 0 14.0 0.75
2 Aggressive 130 20 14.8 0.95
3 Aggressive 70 40 13.2 1.31
4 Mild 130 0 14.0 0.76
5 Mild 70 20 14.8 0.88
6 Mild 100 40 17.4 2.35
7 Soft 70 0 13.5 0.92
8 Soft 100 20 14.6 0.99
9 Soft 130 40 18.4 1.84
The efficacy of kenaf Aximilled fibres to improve the tensile modulus was considerable whilst
the improvement in tensile strength was marginal: an increase of the Young’s Modulus of up
to 125% and up to 18% for the tensile strength with 40 wt.% fibre content was noted. This
observation is often reported in the literature [Chevali and Ulven, 2012, Oksman et al., 2003,
Puglia et al., 2008] and is thought to be due to the creation of defects during the extrusion
process, particularly the introduction of porosity and surface heterogeneities. Introduction of
porosity during compounding is a typical phenomenon for particle or fibre reinforced plastics
that occurs with moisture release and polymer shrinkage at high cooling rate. Fibre bridging
due to fibre feeding issues constitutes another plausible explanation for the low performance in
tensile strength.
Statistical analysis with ANOVA methods showed a clear trend for the effect of the fibre content
on the compound properties. In comparison, the relative efficacies of screw speed and the screw
configuration to improve the composite performance were of secondary importance. The optimal
configuration was then established based on the calculation of the signal-to-noise ratio for each
variable. The major findings are presented in Table 5.3.
127
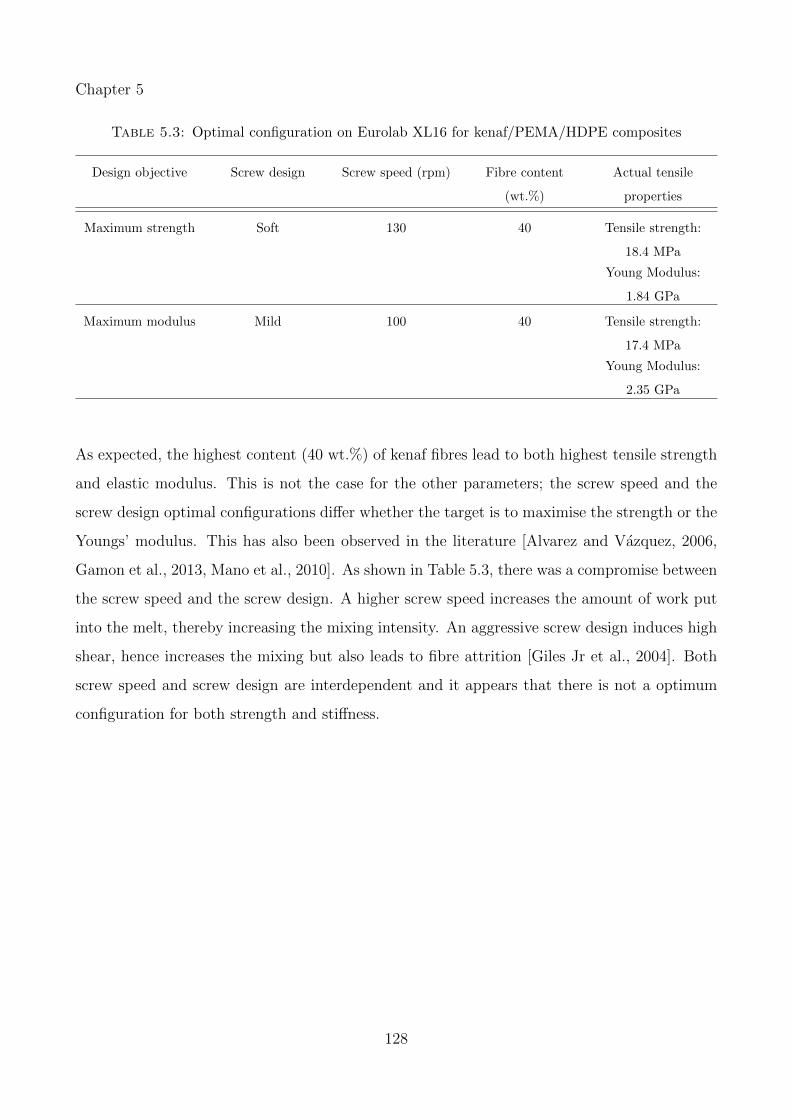
Chapter 5
Table 5.3: Optimal configuration on Eurolab XL16 for kenaf/PEMA/HDPE composites
Design objective Screw design Screw speed (rpm) Fibre content
(wt.%)
Actual tensile
properties
Maximum strength Soft 130 40 Tensile strength:
18.4 MPa
Young Modulus:
1.84 GPa
Maximum modulus Mild 100 40 Tensile strength:
17.4 MPa
Young Modulus:
2.35 GPa
As expected, the highest content (40 wt.%) of kenaf fibres lead to both highest tensile strength
and elastic modulus. This is not the case for the other parameters; the screw speed and the
screw design optimal configurations differ whether the target is to maximise the strength or the
Youngs’ modulus. This has also been observed in the literature [Alvarez and Vazquez, 2006,
Gamon et al., 2013, Mano et al., 2010]. As shown in Table 5.3, there was a compromise between
the screw speed and the screw design. A higher screw speed increases the amount of work put
into the melt, thereby increasing the mixing intensity. An aggressive screw design induces high
shear, hence increases the mixing but also leads to fibre attrition [Giles Jr et al., 2004]. Both
screw speed and screw design are interdependent and it appears that there is not a optimum
configuration for both strength and stiffness.
128

Chapter 5
5.2.3 Lessons learned
5.2.3.1 Fibre feeding
The first and main lesson learned through the series of experiments performed as part of project
CRC-ACS P 1.1 is the importance of feeding strategy. Feeding natural fibres in an extruder
is more challenging than feeding synthetic fibres. Traditionally, reinforcement elements and
polymer particles are fed as a master batch in compounding extrusion [Giles Jr et al., 2004].
However, feeding natural fibres mixed with the matrix as a master batch is difficult because
the fibres have low density and tend to separate, leading to inhomogeneous distribution in the
barrel. Also, fibres and polymer granules differ in size and hence do not mix easily. Side-feeding
is a preferred option to adjust the feeding rates separately, and it enables the modulation of
the feeding position. Natural fibres tend to bridge in the hopper which generates inconsistent
feeding, obstruction in the barrel and therefore results in compounds with poor mechanical
properties. Bridging is a common issue when feeding low density elements and in particular
wood fibres and natural fibres.
Natural fibre pelletising prior to extrusion process has been recently investigated to palliate
this issue (BioStruct project, Deutsche Bundesstiftung Umwelt project etc.). Following this
approach, the development of a pelletising process for short kenaf fibres was undertaken as an
undergraduate research project [Danks, 2014] at The University of Queensland. Natural fibre
pellets were successfully produced with a lab pellet mill. The best consistency was achieved
when adding 25 wt.% water content to the fibre prior to pelletising with the maximal vertical
roller load, through a 6 mm diameter die hole plate. Further investigation was performed on
the pellets drying behaviour in an oven and it was found that 70% of the additional water was
removed after nine hours at 60◦C. Validation tests were performed to feed fibre pellets with
a Brabender volumetric side feeder. It was found that the fibre pellets fed more consistently
than loose fibre feeding.
129
Chapter 5
5.2.3.2 Up-scaling
The scale-up process was the second important aspect identified during the multiple extrusion
trials performed. In biocomposite research, a majority of studies are undertaken with small
to medium sized extruders and usually focus on one aspect rather than on the overall process.
A complete production process also encompasses the management of material supply, storage,
material preparation in large volumes and last but not least, extrusion on a large scale i.e.
with large throughput. The scale-up process is challenging, particularly for research groups
with limited facilities, but this procedure is sine qua non for commercialisation of short fibre
biocomposites. It is necessary to study the feasibility of biocomposite extrusion at a large scale
to identify the specific needs and issues that arise.
5.2.3.3 Fibre traceability from the field to the factory
Finally, fibre traceability is key for successful extrusion and product optimisation. Compared to
typical synthetic fibres (E-glass, carbon fibres), handling large volumes of natural fibres requires
better control when it comes to material supply and logistics. This is mainly due to the fact that
plant fibres are natural materials, hence they exhibit a large variation in properties. Although
the plant fibre microstructure is similar to the wood cell, the growth conditions, plant yield
and post processing steps are completely different and only a few techniques can be transferred
from the wood industry to the agro-fibre industry.
As discussed in the previous chapters, natural fibres have already a considerable “history”when
they enter the compounding process. From the field to the factory, the fibres encounter multiple
steps that impact the final properties [Akil et al., 2011, Summerscales et al., 2010]. For example,
the bast fibre properties vary between genera and species, depend on the growing conditions
(chemical input/weather conditions) and on the harvesting time and technique [Mediavilla
et al., 2001]. The retting process and further treatment (chemical or mechanical) also impact
the fibre properties [Paridah et al., 2011].
130
Chapter 5
Most of the decisive factors are related to agronomy (plant variety, growing conditions) and
the processing conditions (harvesting, retting, treatment). Also, natural fibres display consid-
erable variance and there is currently little control over the “as received”sample properties.
To better manage these uncertainties, a proper traceability scheme should be implemented so
that industry and research entities obtain the maximum relevant information. It is suggested
that each batch is accompanied with a record of the “fibre story”in order to adjust the post
processing parameters (storage, fibre treatment, mechanical processing) i.e. to fully exploit the
fibre potential. Case-by-case material preparation also facilitates the extrusion process (feeding
strategy, control moisture content etc.) and maximises the fibre reinforcing effect.
A typical fibre record should provide at least the following information:
• Genera, specie (variety)
• Plantation location, growth conditions (chemical input)
• Retting process
• Post processing (chemical treatment, mechanical process)
131
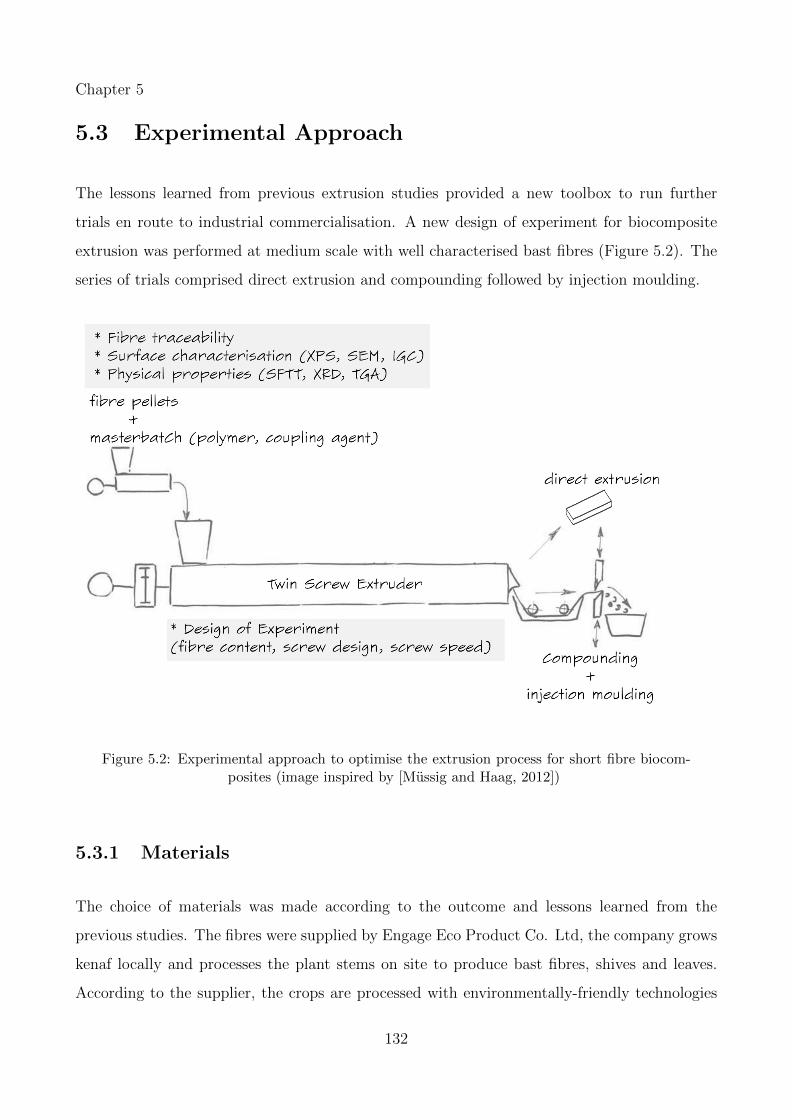
Chapter 5
5.3 Experimental Approach
The lessons learned from previous extrusion studies provided a new toolbox to run further
trials en route to industrial commercialisation. A new design of experiment for biocomposite
extrusion was performed at medium scale with well characterised bast fibres (Figure 5.2). The
series of trials comprised direct extrusion and compounding followed by injection moulding.
Figure 5.2: Experimental approach to optimise the extrusion process for short fibre biocom-posites (image inspired by [Mussig and Haag, 2012])
5.3.1 Materials
The choice of materials was made according to the outcome and lessons learned from the
previous studies. The fibres were supplied by Engage Eco Product Co. Ltd, the company grows
kenaf locally and processes the plant stems on site to produce bast fibres, shives and leaves.
According to the supplier, the crops are processed with environmentally-friendly technologies
132
Chapter 5
and the products are dust and pesticide-free. The company supplies national and international
customers from diverse industrial sectors (automotive, textile, construction, biocomposites,
animal feed etc.). Therefore, the fibre source met all criteria identified previously: large and
reliable supply, fibres produced and processed according to industrial standards with minimal
chemical input in order to limit the overall carbon footprint and to obtain fibres as “green”as
possible.
Engage Eco Product Co. Ltd grows the kenaf variety Khon Khaen 60 (KK60) from the specie
Hibiscus Cannabinus. Kenaf KK60 is one of the most common varieties produced in Asia and
Indonesia because of its high yield and high quality [Tahery et al., 2013]. The kenaf fibres
were locally water retted and alkaline treated to maximise their mechanical performance and,
in particular, to enhance the fibre/matrix interfacial interactions for biocomposite applications.
A second batch of fibres that had been water retted and water washed was also supplied for
comparison with the chemically treated fibres (see Table 3.2).
Polypropylene grade Moplen HP422M (MFI 8.5 g.10 min−1, LyondellBasell) was selected based
on the findings of Sallih [2015]. MAPP (Licocene PP MA 6452) was used as a coupling agent to
improve the fibre/matrix adhesion. MAPP is a grafted copolymer that has been commonly used
to enhance short fibre reinforced polypropylene compounds. It has been shown that addition of
about 3 wt.% to 5 wt.% MAPP to the compound formulation improved the overall mechanical
properties [Sallih, 2015]. Both the polypropylene and the coupling agent were fed in granulate
form to match the size of fibre pellets (3 mm long). It is advisable to have a formulation
with components of similar size to get good homogeneity and to maximise the mixing during
processing [Giles Jr et al., 2004]. A summary of the materials used for the extrusion trials is
provided in Table 5.4.
Table 5.4: Samples used for extrusion trials
Material Specification Supplier
Kenaf Cultivar KK60 Engage Eco Product Co. Ltd.
Polypropylene Moplen HP422M (MFI 8.5 g.10
min−1)
LyondellBasell Australia
Maleic anhydride polypropylene Licocene PP MA6452 (7% maleic
anhydride)
Clariant Germany
133
Chapter 5
5.3.2 Fibre characterisation
Kenaf fibre surface properties have been characterised by SEM, XPS and IGC. These results
were reported in the previous chapters and will only be briefly summarised in this section. The
fibres were also characterised by Single Fibre Tensile Testing (SFTT) and X-Ray Diffraction
(XRD) at the Composites Innovation Centre (Canada). In addition, Thermogravimetric Anal-
ysis (TGA) was performed at The University of Queensland. Finally, the fibre morphology
and aspect ratio were determined with the HiRes Fibre Quality Analyser (FQA) developed
by OpTest Equipment Inc. (Canada). These new results are briefly detailed in the following
paragraphs and the overall characterisation results are summarised in Table 5.5 and Table 5.6.
134
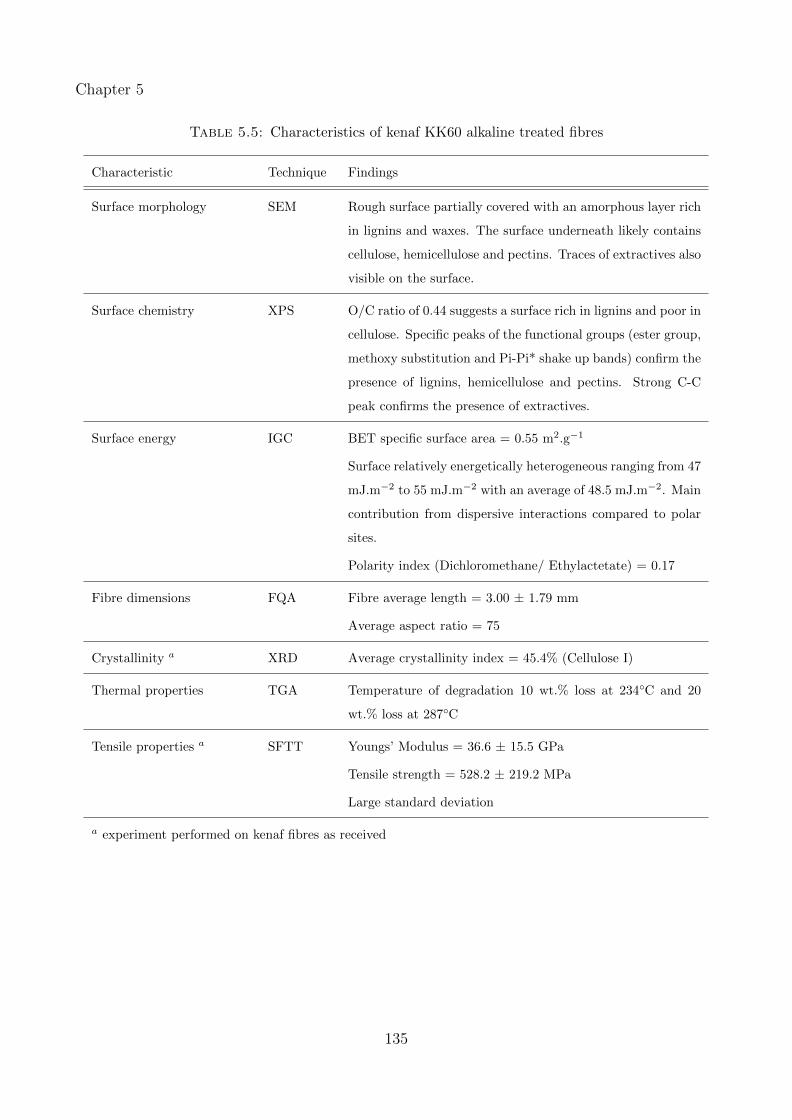
Chapter 5
Table 5.5: Characteristics of kenaf KK60 alkaline treated fibres
Characteristic Technique Findings
Surface morphology SEM Rough surface partially covered with an amorphous layer rich
in lignins and waxes. The surface underneath likely contains
cellulose, hemicellulose and pectins. Traces of extractives also
visible on the surface.
Surface chemistry XPS O/C ratio of 0.44 suggests a surface rich in lignins and poor in
cellulose. Specific peaks of the functional groups (ester group,
methoxy substitution and Pi-Pi* shake up bands) confirm the
presence of lignins, hemicellulose and pectins. Strong C-C
peak confirms the presence of extractives.
Surface energy IGC BET specific surface area = 0.55 m2.g−1
Surface relatively energetically heterogeneous ranging from 47
mJ.m−2 to 55 mJ.m−2 with an average of 48.5 mJ.m−2. Main
contribution from dispersive interactions compared to polar
sites.
Polarity index (Dichloromethane/ Ethylactetate) = 0.17
Fibre dimensions FQA Fibre average length = 3.00 ± 1.79 mm
Average aspect ratio = 75
Crystallinity a XRD Average crystallinity index = 45.4% (Cellulose I)
Thermal properties TGA Temperature of degradation 10 wt.% loss at 234◦C and 20
wt.% loss at 287◦C
Tensile properties a SFTT Youngs’ Modulus = 36.6 ± 15.5 GPa
Tensile strength = 528.2 ± 219.2 MPa
Large standard deviation
a experiment performed on kenaf fibres as received
135
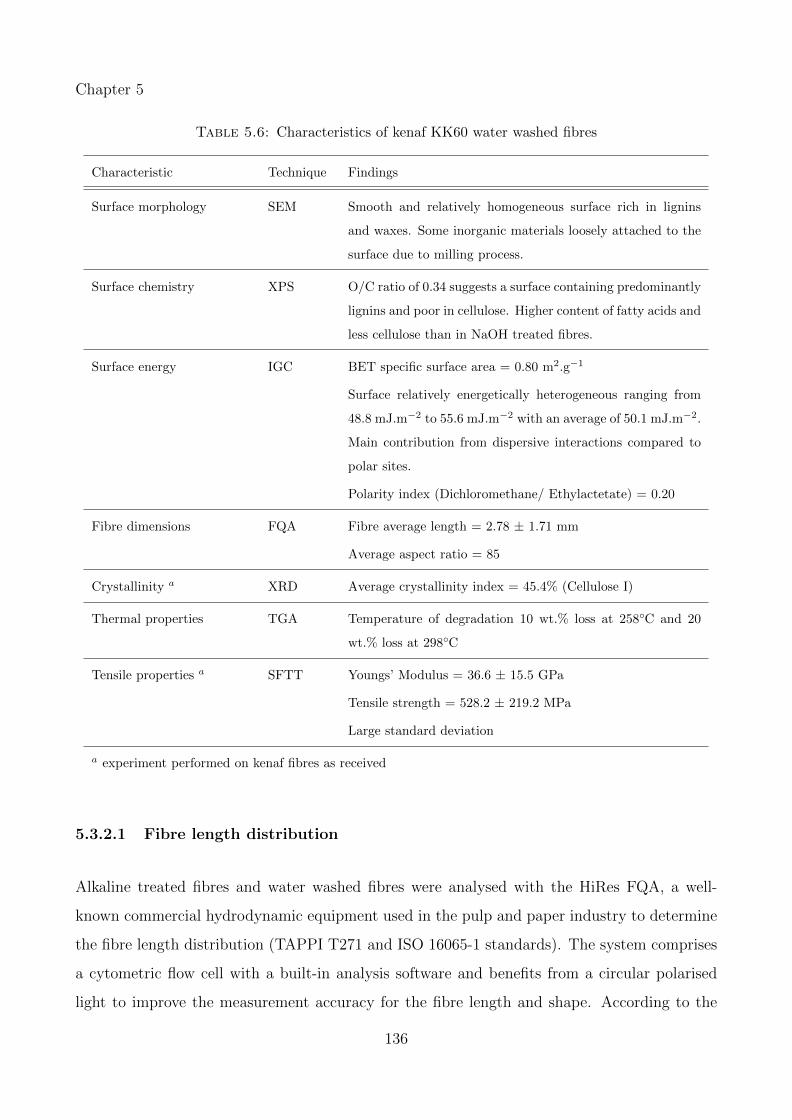
Chapter 5
Table 5.6: Characteristics of kenaf KK60 water washed fibres
Characteristic Technique Findings
Surface morphology SEM Smooth and relatively homogeneous surface rich in lignins
and waxes. Some inorganic materials loosely attached to the
surface due to milling process.
Surface chemistry XPS O/C ratio of 0.34 suggests a surface containing predominantly
lignins and poor in cellulose. Higher content of fatty acids and
less cellulose than in NaOH treated fibres.
Surface energy IGC BET specific surface area = 0.80 m2.g−1
Surface relatively energetically heterogeneous ranging from
48.8 mJ.m−2 to 55.6 mJ.m−2 with an average of 50.1 mJ.m−2.
Main contribution from dispersive interactions compared to
polar sites.
Polarity index (Dichloromethane/ Ethylactetate) = 0.20
Fibre dimensions FQA Fibre average length = 2.78 ± 1.71 mm
Average aspect ratio = 85
Crystallinity a XRD Average crystallinity index = 45.4% (Cellulose I)
Thermal properties TGA Temperature of degradation 10 wt.% loss at 258◦C and 20
wt.% loss at 298◦C
Tensile properties a SFTT Youngs’ Modulus = 36.6 ± 15.5 GPa
Tensile strength = 528.2 ± 219.2 MPa
Large standard deviation
a experiment performed on kenaf fibres as received
5.3.2.1 Fibre length distribution
Alkaline treated fibres and water washed fibres were analysed with the HiRes FQA, a well-
known commercial hydrodynamic equipment used in the pulp and paper industry to determine
the fibre length distribution (TAPPI T271 and ISO 16065-1 standards). The system comprises
a cytometric flow cell with a built-in analysis software and benefits from a circular polarised
light to improve the measurement accuracy for the fibre length and shape. According to the
136
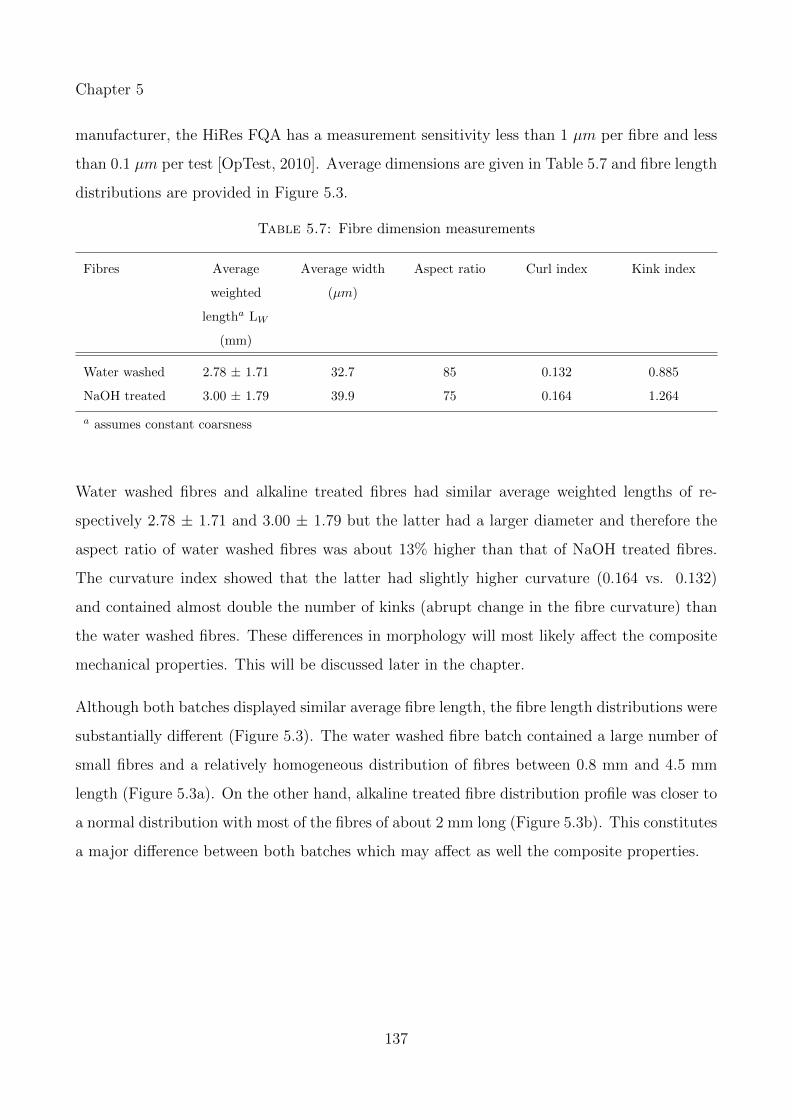
Chapter 5
manufacturer, the HiRes FQA has a measurement sensitivity less than 1 µm per fibre and less
than 0.1 µm per test [OpTest, 2010]. Average dimensions are given in Table 5.7 and fibre length
distributions are provided in Figure 5.3.
Table 5.7: Fibre dimension measurements
Fibres Average
weighted
lengtha LW
(mm)
Average width
(µm)
Aspect ratio Curl index Kink index
Water washed 2.78 ± 1.71 32.7 85 0.132 0.885
NaOH treated 3.00 ± 1.79 39.9 75 0.164 1.264
a assumes constant coarsness
Water washed fibres and alkaline treated fibres had similar average weighted lengths of re-
spectively 2.78 ± 1.71 and 3.00 ± 1.79 but the latter had a larger diameter and therefore the
aspect ratio of water washed fibres was about 13% higher than that of NaOH treated fibres.
The curvature index showed that the latter had slightly higher curvature (0.164 vs. 0.132)
and contained almost double the number of kinks (abrupt change in the fibre curvature) than
the water washed fibres. These differences in morphology will most likely affect the composite
mechanical properties. This will be discussed later in the chapter.
Although both batches displayed similar average fibre length, the fibre length distributions were
substantially different (Figure 5.3). The water washed fibre batch contained a large number of
small fibres and a relatively homogeneous distribution of fibres between 0.8 mm and 4.5 mm
length (Figure 5.3a). On the other hand, alkaline treated fibre distribution profile was closer to
a normal distribution with most of the fibres of about 2 mm long (Figure 5.3b). This constitutes
a major difference between both batches which may affect as well the composite properties.
137
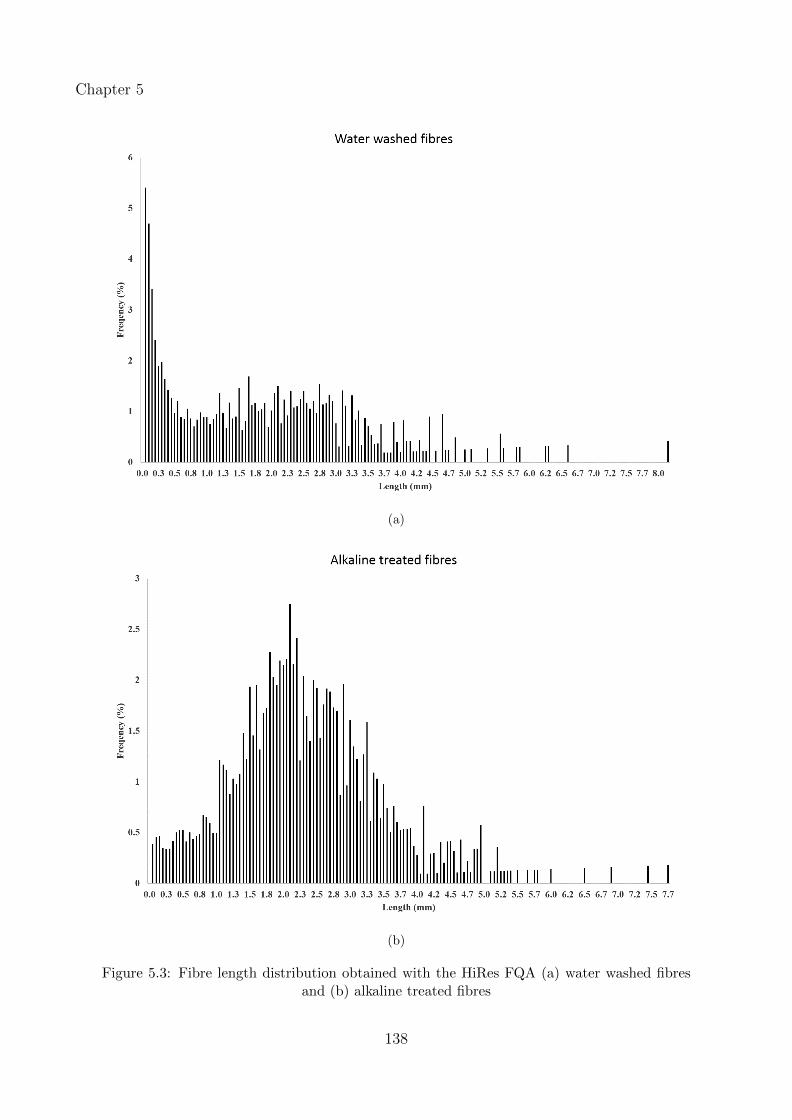
Chapter 5
(a)
(b)
Figure 5.3: Fibre length distribution obtained with the HiRes FQA (a) water washed fibresand (b) alkaline treated fibres
138
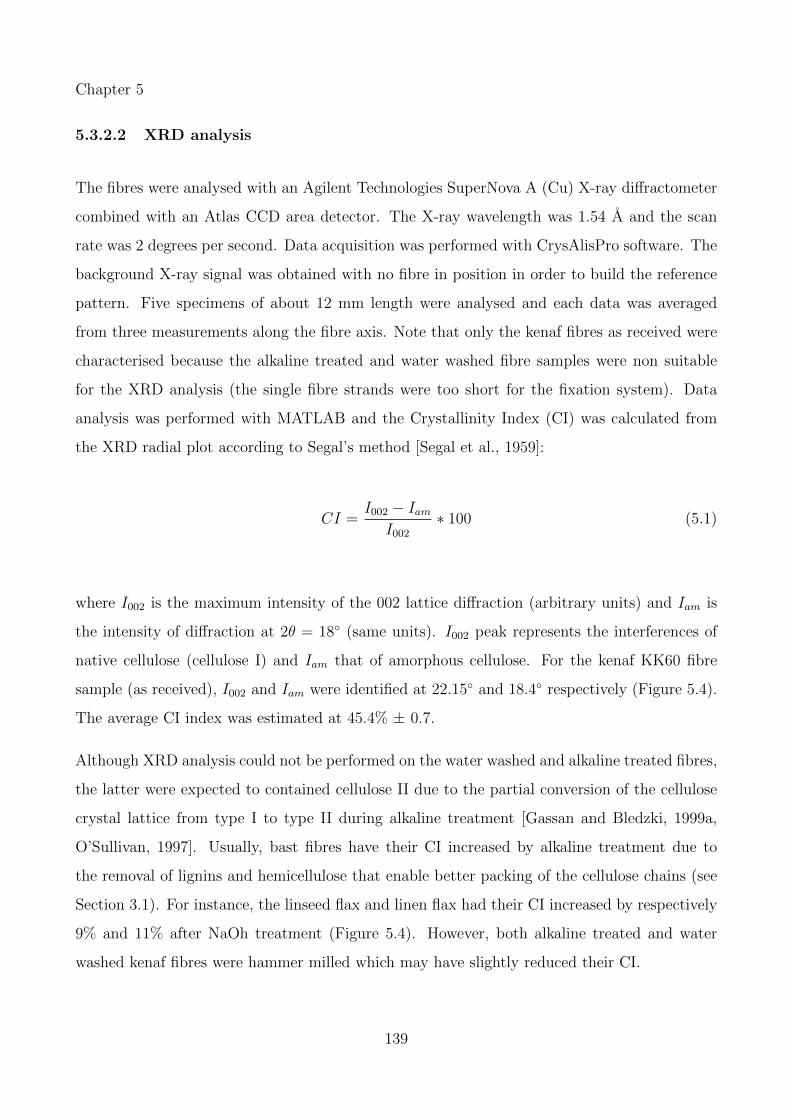
Chapter 5
5.3.2.2 XRD analysis
The fibres were analysed with an Agilent Technologies SuperNova A (Cu) X-ray diffractometer
combined with an Atlas CCD area detector. The X-ray wavelength was 1.54 A and the scan
rate was 2 degrees per second. Data acquisition was performed with CrysAlisPro software. The
background X-ray signal was obtained with no fibre in position in order to build the reference
pattern. Five specimens of about 12 mm length were analysed and each data was averaged
from three measurements along the fibre axis. Note that only the kenaf fibres as received were
characterised because the alkaline treated and water washed fibre samples were non suitable
for the XRD analysis (the single fibre strands were too short for the fixation system). Data
analysis was performed with MATLAB and the Crystallinity Index (CI) was calculated from
the XRD radial plot according to Segal’s method [Segal et al., 1959]:
CI =I002 − Iam
I002∗ 100 (5.1)
where I002 is the maximum intensity of the 002 lattice diffraction (arbitrary units) and Iam is
the intensity of diffraction at 2θ = 18◦ (same units). I002 peak represents the interferences of
native cellulose (cellulose I) and Iam that of amorphous cellulose. For the kenaf KK60 fibre
sample (as received), I002 and Iam were identified at 22.15◦ and 18.4◦ respectively (Figure 5.4).
The average CI index was estimated at 45.4% ± 0.7.
Although XRD analysis could not be performed on the water washed and alkaline treated fibres,
the latter were expected to contained cellulose II due to the partial conversion of the cellulose
crystal lattice from type I to type II during alkaline treatment [Gassan and Bledzki, 1999a,
O’Sullivan, 1997]. Usually, bast fibres have their CI increased by alkaline treatment due to
the removal of lignins and hemicellulose that enable better packing of the cellulose chains (see
Section 3.1). For instance, the linseed flax and linen flax had their CI increased by respectively
9% and 11% after NaOh treatment (Figure 5.4). However, both alkaline treated and water
washed kenaf fibres were hammer milled which may have slightly reduced their CI.
139
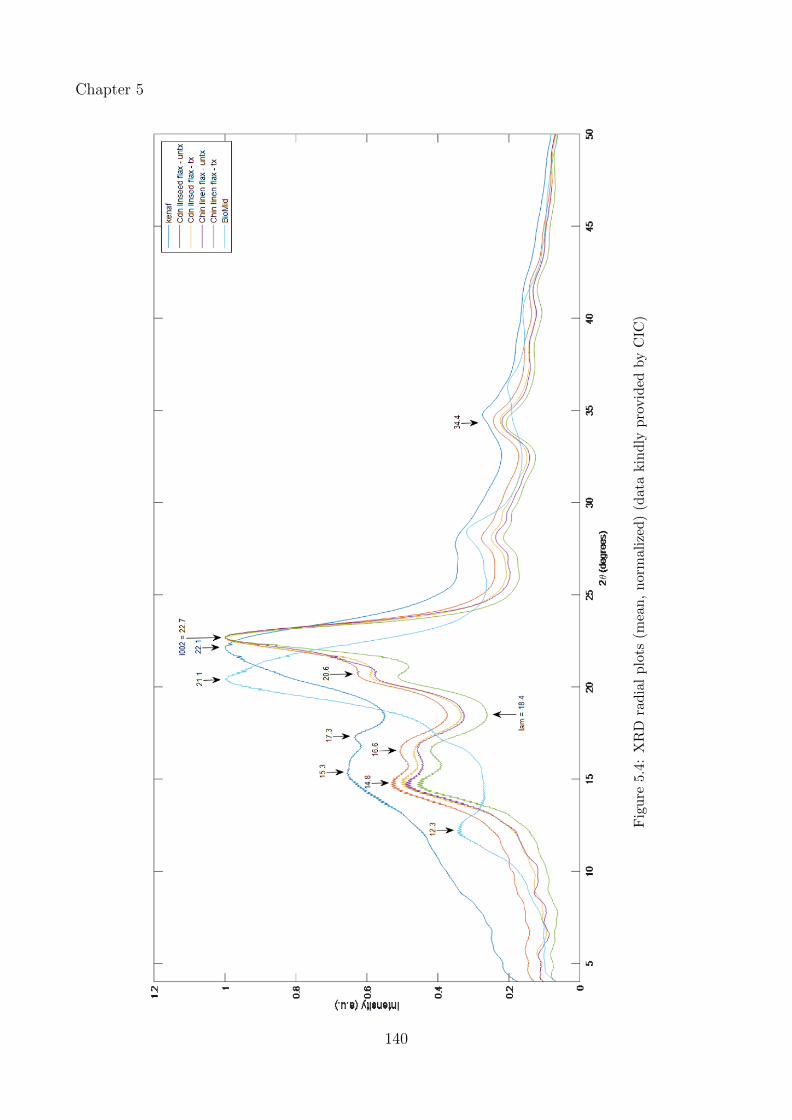
Chapter 5
Fig
ure
5.4
:X
RD
rad
ial
plo
ts(m
ean
,n
orm
aliz
ed)
(dat
akin
dly
pro
vid
edby
CIC
)
140
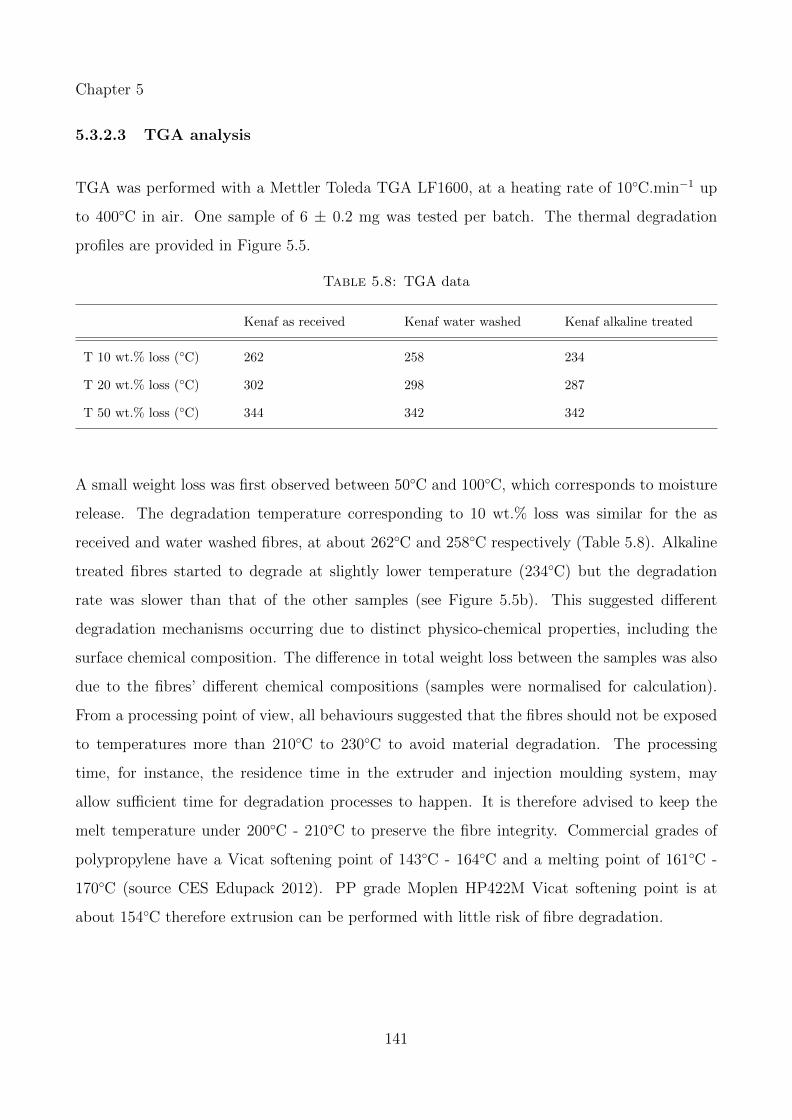
Chapter 5
5.3.2.3 TGA analysis
TGA was performed with a Mettler Toleda TGA LF1600, at a heating rate of 10◦C.min−1 up
to 400◦C in air. One sample of 6 ± 0.2 mg was tested per batch. The thermal degradation
profiles are provided in Figure 5.5.
Table 5.8: TGA data
Kenaf as received Kenaf water washed Kenaf alkaline treated
T 10 wt.% loss (◦C) 262 258 234
T 20 wt.% loss (◦C) 302 298 287
T 50 wt.% loss (◦C) 344 342 342
A small weight loss was first observed between 50◦C and 100◦C, which corresponds to moisture
release. The degradation temperature corresponding to 10 wt.% loss was similar for the as
received and water washed fibres, at about 262◦C and 258◦C respectively (Table 5.8). Alkaline
treated fibres started to degrade at slightly lower temperature (234◦C) but the degradation
rate was slower than that of the other samples (see Figure 5.5b). This suggested different
degradation mechanisms occurring due to distinct physico-chemical properties, including the
surface chemical composition. The difference in total weight loss between the samples was also
due to the fibres’ different chemical compositions (samples were normalised for calculation).
From a processing point of view, all behaviours suggested that the fibres should not be exposed
to temperatures more than 210◦C to 230◦C to avoid material degradation. The processing
time, for instance, the residence time in the extruder and injection moulding system, may
allow sufficient time for degradation processes to happen. It is therefore advised to keep the
melt temperature under 200◦C - 210◦C to preserve the fibre integrity. Commercial grades of
polypropylene have a Vicat softening point of 143◦C - 164◦C and a melting point of 161◦C -
170◦C (source CES Edupack 2012). PP grade Moplen HP422M Vicat softening point is at
about 154◦C therefore extrusion can be performed with little risk of fibre degradation.
141

Chapter 5
(a)
(b)
Figure 5.5: TGA curves (a) sample mass and (b) weight loss
142
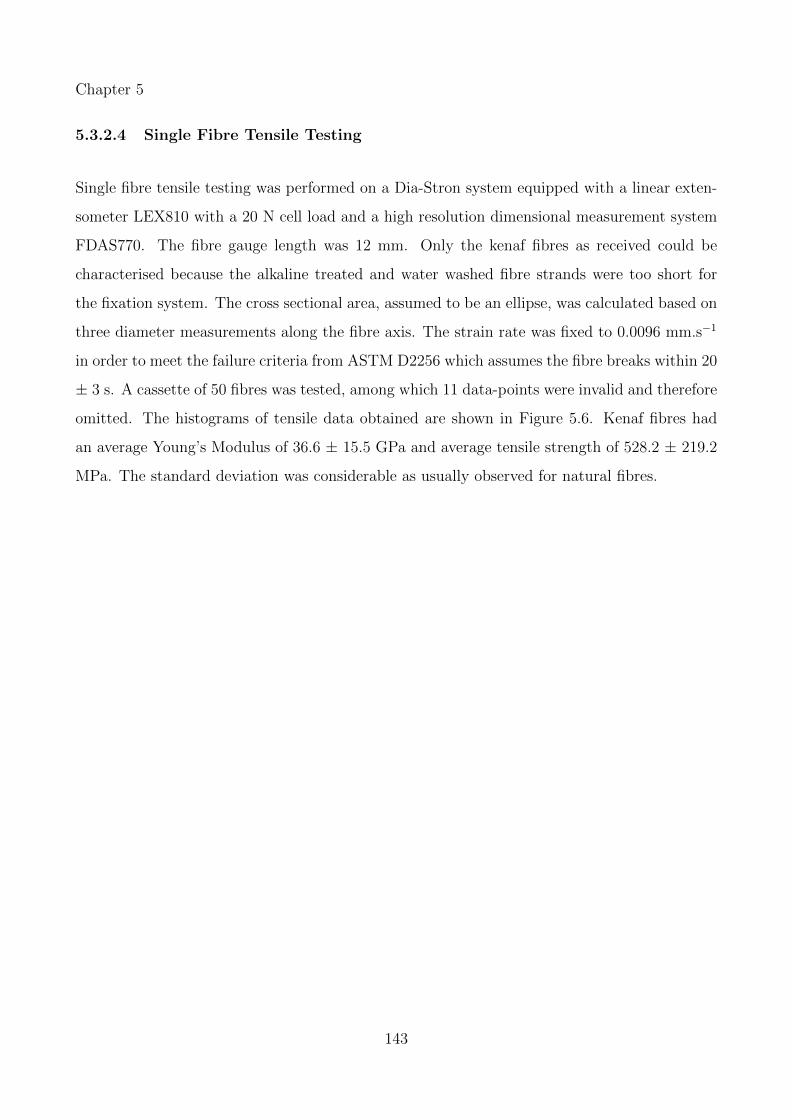
Chapter 5
5.3.2.4 Single Fibre Tensile Testing
Single fibre tensile testing was performed on a Dia-Stron system equipped with a linear exten-
someter LEX810 with a 20 N cell load and a high resolution dimensional measurement system
FDAS770. The fibre gauge length was 12 mm. Only the kenaf fibres as received could be
characterised because the alkaline treated and water washed fibre strands were too short for
the fixation system. The cross sectional area, assumed to be an ellipse, was calculated based on
three diameter measurements along the fibre axis. The strain rate was fixed to 0.0096 mm.s−1
in order to meet the failure criteria from ASTM D2256 which assumes the fibre breaks within 20
± 3 s. A cassette of 50 fibres was tested, among which 11 data-points were invalid and therefore
omitted. The histograms of tensile data obtained are shown in Figure 5.6. Kenaf fibres had
an average Young’s Modulus of 36.6 ± 15.5 GPa and average tensile strength of 528.2 ± 219.2
MPa. The standard deviation was considerable as usually observed for natural fibres.
143
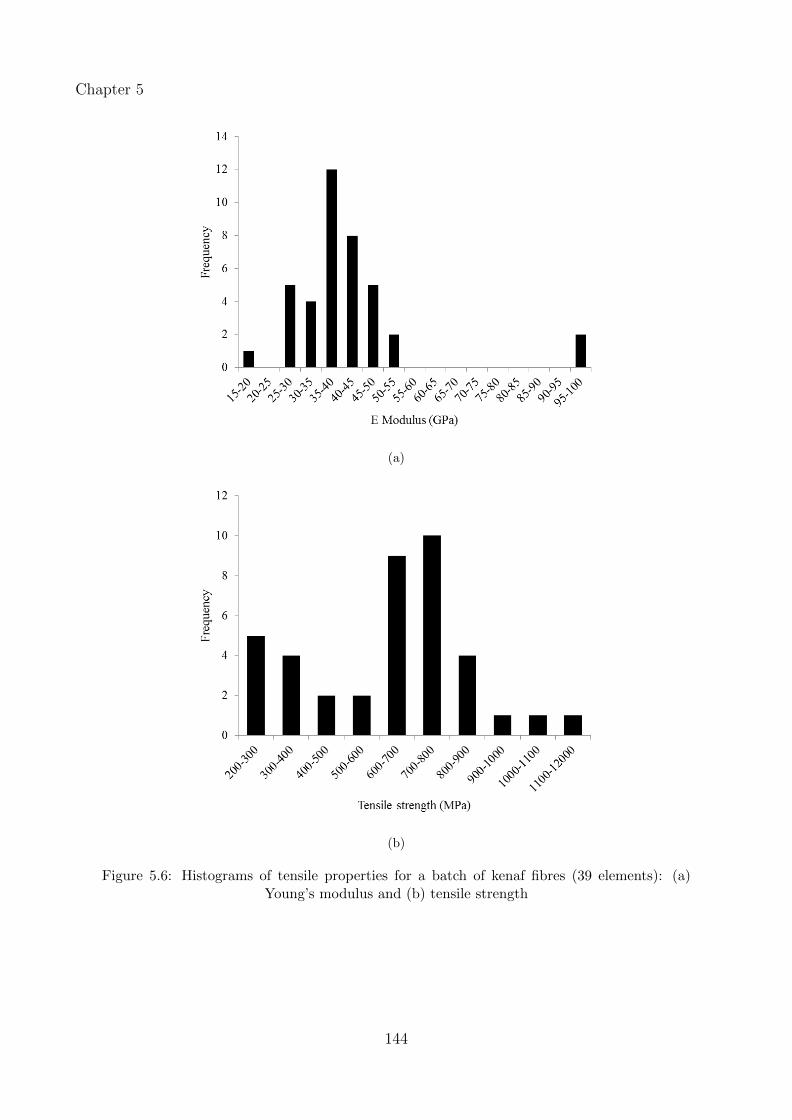
Chapter 5
(a)
(b)
Figure 5.6: Histograms of tensile properties for a batch of kenaf fibres (39 elements): (a)Young’s modulus and (b) tensile strength
144
Chapter 5
5.3.3 Design of Experiment towards large scale compounding
Optimisation of the extrusion process was performed at a medium scale (40:1 L/D) to investigate
which variables mostly affect the compound properties when extrusion is performed under
“industrial”conditions. One of the main objectives was to investigate the effect of screw design.
Screw configuration is key to obtaining adequate compound properties, in particular when
adding particulates for polymer reinforcement. Careful design of the screw elements allows
control of the melt pressure and the melt temperature in specific locations in order to obtain
sufficient mixing without degrading the compound [Giles Jr et al., 2004]. Based on the guideline
for extrusion published by Giles Jr et al. [2004], the following criteria were considered for short
kenaf fibres reinforced polypropylene compounding on a twin-screw extruder:
• Polypropylene viscosity is very shear sensitive and less temperature sensitive. Therefore a
high shear screw configuration was used to lower the viscosity and enhance the melt flow.
• Forward, neutral and rearward kneading elements were used to modulate the melt rheological
properties as it progresses in the barrel. For instance, a rearward kneading block creates a melt
seal which helps to completely melt the formulation before it moves downstream and it also
prevents the air from passing through. Configuration of the kneading block sequences affects
as well the residence time.
• Narrow kneading blocks were preferred to wide elements to provide efficient distributive
mixing of the fibres and to limit dispersive mixing that would shorten the fibres.
• Large-pitch conveying elements were placed between mixing zones (high pressure areas) to
create low pressure areas in order to avoid melt degradation due to overheating or too much
shear.
Three screw designs were configured according to the above criteria in order to input a soft,
mild or aggressive work into the melt flow. The soft screw design was based on a sequence of
two single mixing zones located in the first half of the barrel that comprised forward elements
only (M1-M2). The mild screw configuration involved a second sequence of kneading elements
(M3) that included a melt seal. M3 was located in the last third section of the barrel, prior to
compression zone towards the die. Finally, the most aggressive screw design comprised a third
145
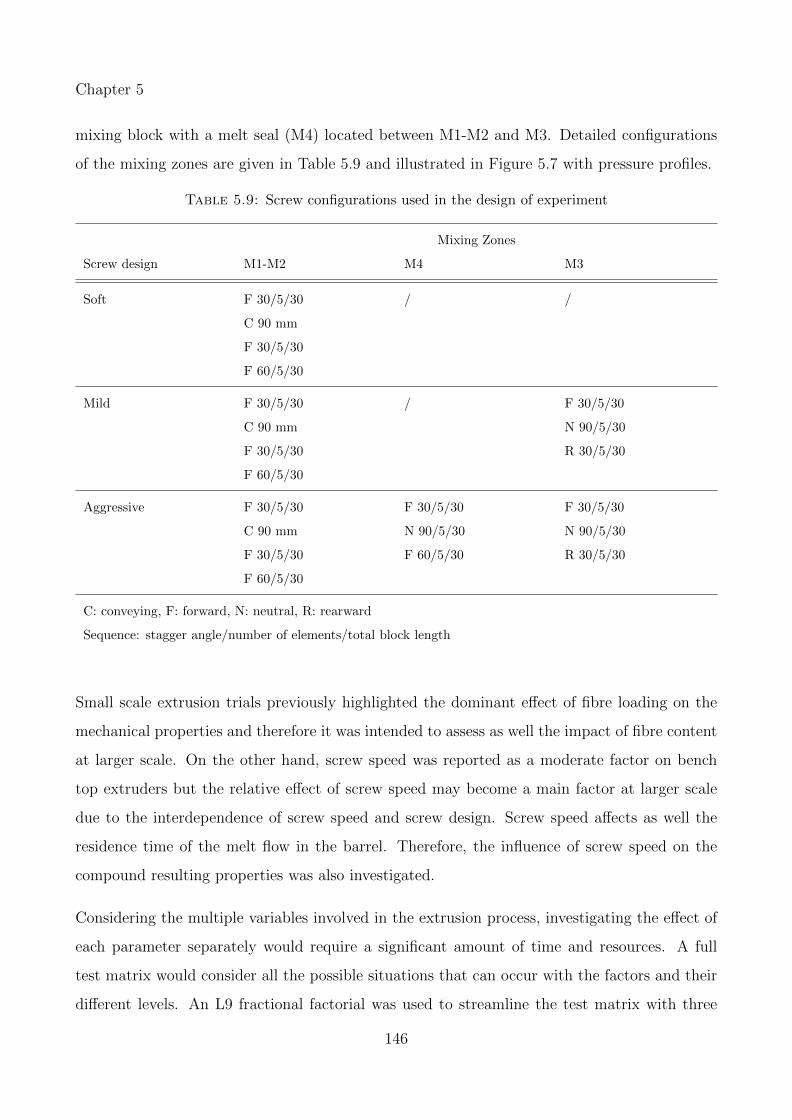
Chapter 5
mixing block with a melt seal (M4) located between M1-M2 and M3. Detailed configurations
of the mixing zones are given in Table 5.9 and illustrated in Figure 5.7 with pressure profiles.
Table 5.9: Screw configurations used in the design of experiment
Mixing Zones
Screw design M1-M2 M4 M3
Soft F 30/5/30 / /
C 90 mm
F 30/5/30
F 60/5/30
Mild F 30/5/30 / F 30/5/30
C 90 mm N 90/5/30
F 30/5/30 R 30/5/30
F 60/5/30
Aggressive F 30/5/30 F 30/5/30 F 30/5/30
C 90 mm N 90/5/30 N 90/5/30
F 30/5/30 F 60/5/30 R 30/5/30
F 60/5/30
C: conveying, F: forward, N: neutral, R: rearward
Sequence: stagger angle/number of elements/total block length
Small scale extrusion trials previously highlighted the dominant effect of fibre loading on the
mechanical properties and therefore it was intended to assess as well the impact of fibre content
at larger scale. On the other hand, screw speed was reported as a moderate factor on bench
top extruders but the relative effect of screw speed may become a main factor at larger scale
due to the interdependence of screw speed and screw design. Screw speed affects as well the
residence time of the melt flow in the barrel. Therefore, the influence of screw speed on the
compound resulting properties was also investigated.
Considering the multiple variables involved in the extrusion process, investigating the effect of
each parameter separately would require a significant amount of time and resources. A full
test matrix would consider all the possible situations that can occur with the factors and their
different levels. An L9 fractional factorial was used to streamline the test matrix with three
146

Chapter 5
Fig
ure
5.7
:S
crew
des
ign
(agg
ress
ive
con
figu
rati
on)
and
pre
ssu
rep
rofi
les
147
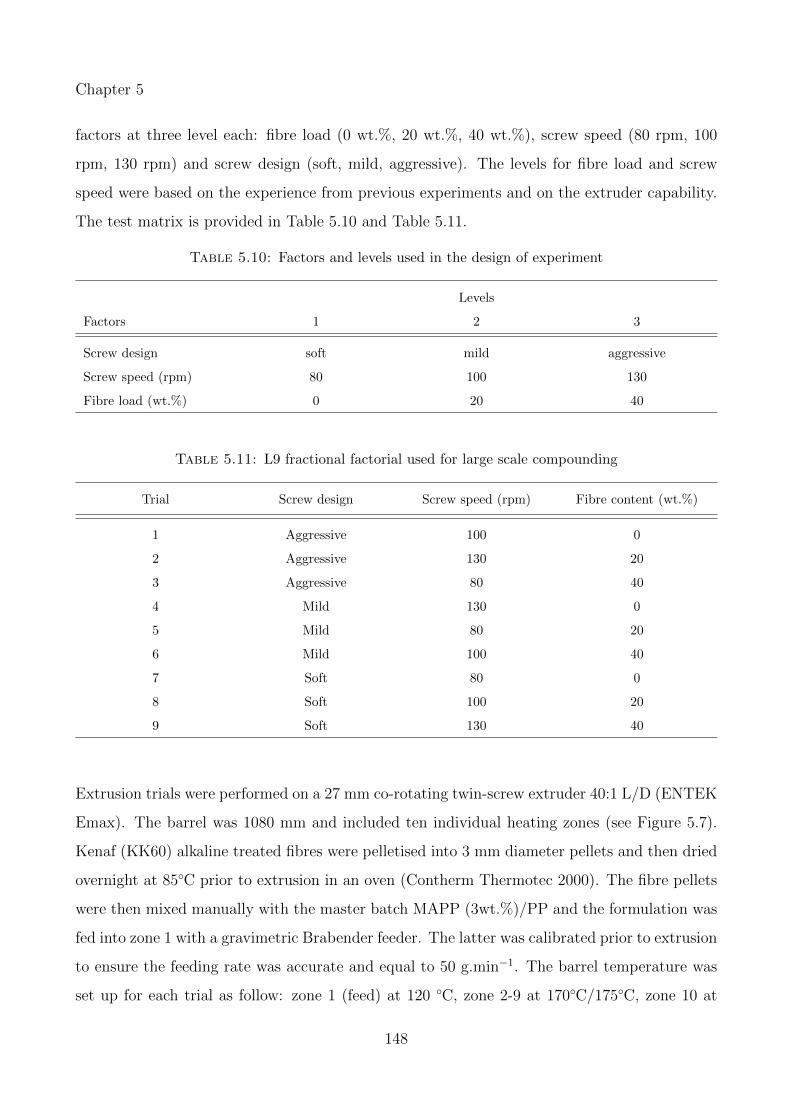
Chapter 5
factors at three level each: fibre load (0 wt.%, 20 wt.%, 40 wt.%), screw speed (80 rpm, 100
rpm, 130 rpm) and screw design (soft, mild, aggressive). The levels for fibre load and screw
speed were based on the experience from previous experiments and on the extruder capability.
The test matrix is provided in Table 5.10 and Table 5.11.
Table 5.10: Factors and levels used in the design of experiment
Levels
Factors 1 2 3
Screw design soft mild aggressive
Screw speed (rpm) 80 100 130
Fibre load (wt.%) 0 20 40
Table 5.11: L9 fractional factorial used for large scale compounding
Trial Screw design Screw speed (rpm) Fibre content (wt.%)
1 Aggressive 100 0
2 Aggressive 130 20
3 Aggressive 80 40
4 Mild 130 0
5 Mild 80 20
6 Mild 100 40
7 Soft 80 0
8 Soft 100 20
9 Soft 130 40
Extrusion trials were performed on a 27 mm co-rotating twin-screw extruder 40:1 L/D (ENTEK
Emax). The barrel was 1080 mm and included ten individual heating zones (see Figure 5.7).
Kenaf (KK60) alkaline treated fibres were pelletised into 3 mm diameter pellets and then dried
overnight at 85◦C prior to extrusion in an oven (Contherm Thermotec 2000). The fibre pellets
were then mixed manually with the master batch MAPP (3wt.%)/PP and the formulation was
fed into zone 1 with a gravimetric Brabender feeder. The latter was calibrated prior to extrusion
to ensure the feeding rate was accurate and equal to 50 g.min−1. The barrel temperature was
set up for each trial as follow: zone 1 (feed) at 120 ◦C, zone 2-9 at 170◦C/175◦C, zone 10 at
148
Chapter 5
175◦C/180◦C, zone 11 at 175◦C/185◦C and the die was not heated. Note that the extruder
set-up did not include a venting zone to avoid protrusion of the melt due to the back flow. The
melt was extruded through a strip die (30 mm x 4 mm) for direct extrusion and through a 3 x
∅3 mm rod die plate for compounding. The strips were water-jet cut into ASTM D638 type IV
tensile coupons and tested with an Instron 5884 load frame and Bluehill software v.3 combined
with an Instron Advanced Video Extensometer 2663 (gauge length 25 mm) at a crosshead
speed of 5 mm.min−1 and a 5 kN load cell. A minimum of five coupons were tested for each
combination. The rod extrudates were cut into pellets with a granulator and injection moulded
on a Babyplast 610P into ASTM D638 type IV at 170◦C (the volume of material available was
insufficient for a large scale injection moulding machine). Injection moulded specimens were
tensile tested in similar conditions than the strip extrudates.
149
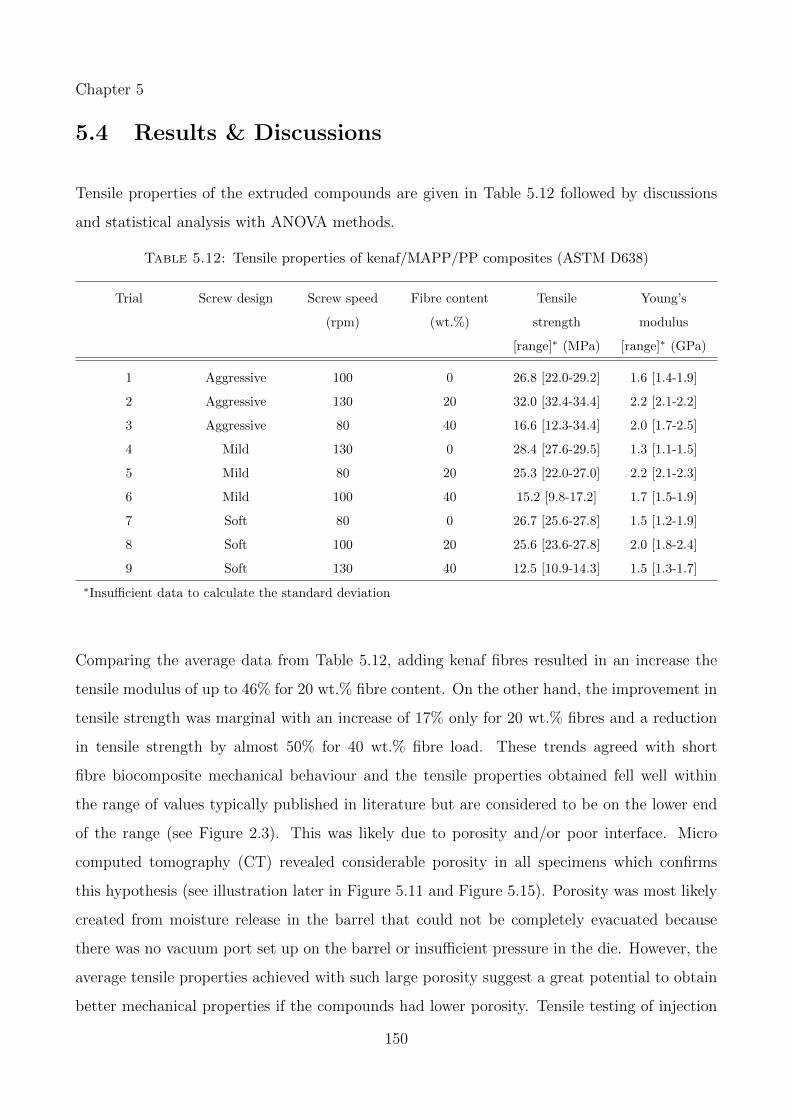
Chapter 5
5.4 Results & Discussions
Tensile properties of the extruded compounds are given in Table 5.12 followed by discussions
and statistical analysis with ANOVA methods.
Table 5.12: Tensile properties of kenaf/MAPP/PP composites (ASTM D638)
Trial Screw design Screw speed
(rpm)
Fibre content
(wt.%)
Tensile
strength
[range]∗ (MPa)
Young’s
modulus
[range]∗ (GPa)
1 Aggressive 100 0 26.8 [22.0-29.2] 1.6 [1.4-1.9]
2 Aggressive 130 20 32.0 [32.4-34.4] 2.2 [2.1-2.2]
3 Aggressive 80 40 16.6 [12.3-34.4] 2.0 [1.7-2.5]
4 Mild 130 0 28.4 [27.6-29.5] 1.3 [1.1-1.5]
5 Mild 80 20 25.3 [22.0-27.0] 2.2 [2.1-2.3]
6 Mild 100 40 15.2 [9.8-17.2] 1.7 [1.5-1.9]
7 Soft 80 0 26.7 [25.6-27.8] 1.5 [1.2-1.9]
8 Soft 100 20 25.6 [23.6-27.8] 2.0 [1.8-2.4]
9 Soft 130 40 12.5 [10.9-14.3] 1.5 [1.3-1.7]
∗Insufficient data to calculate the standard deviation
Comparing the average data from Table 5.12, adding kenaf fibres resulted in an increase the
tensile modulus of up to 46% for 20 wt.% fibre content. On the other hand, the improvement in
tensile strength was marginal with an increase of 17% only for 20 wt.% fibres and a reduction
in tensile strength by almost 50% for 40 wt.% fibre load. These trends agreed with short
fibre biocomposite mechanical behaviour and the tensile properties obtained fell well within
the range of values typically published in literature but are considered to be on the lower end
of the range (see Figure 2.3). This was likely due to porosity and/or poor interface. Micro
computed tomography (CT) revealed considerable porosity in all specimens which confirms
this hypothesis (see illustration later in Figure 5.11 and Figure 5.15). Porosity was most likely
created from moisture release in the barrel that could not be completely evacuated because
there was no vacuum port set up on the barrel or insufficient pressure in the die. However, the
average tensile properties achieved with such large porosity suggest a great potential to obtain
better mechanical properties if the compounds had lower porosity. Tensile testing of injection
150
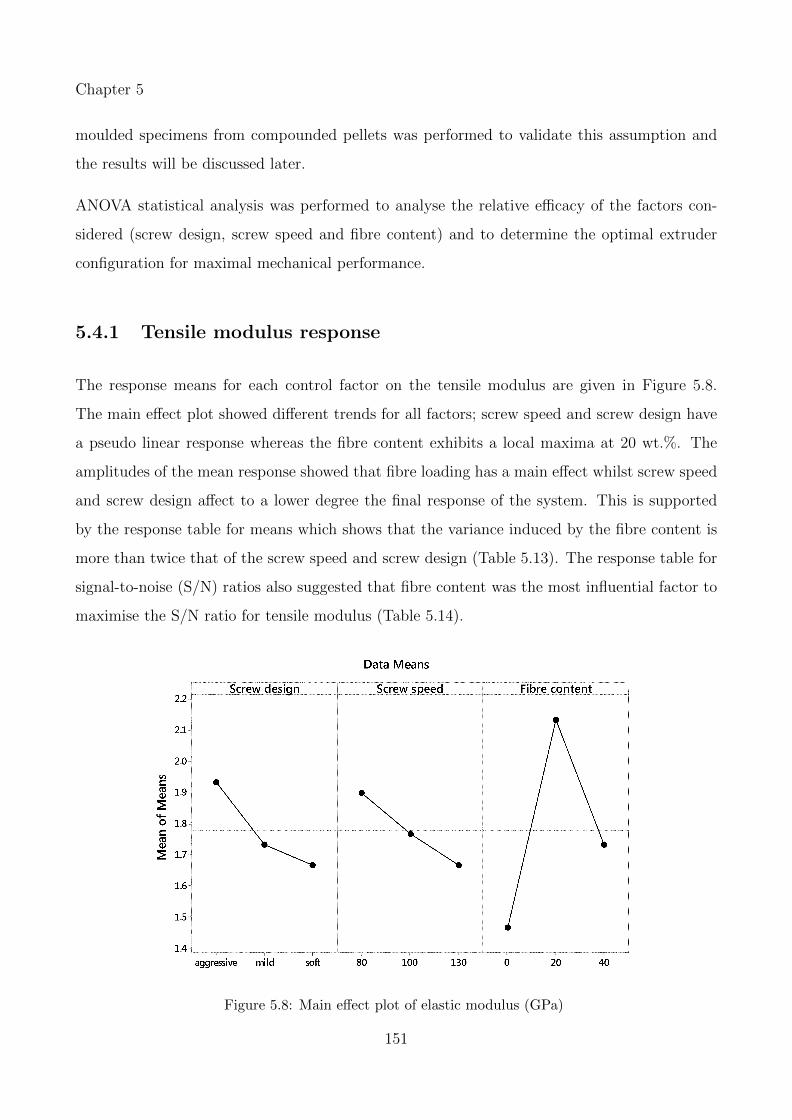
Chapter 5
moulded specimens from compounded pellets was performed to validate this assumption and
the results will be discussed later.
ANOVA statistical analysis was performed to analyse the relative efficacy of the factors con-
sidered (screw design, screw speed and fibre content) and to determine the optimal extruder
configuration for maximal mechanical performance.
5.4.1 Tensile modulus response
The response means for each control factor on the tensile modulus are given in Figure 5.8.
The main effect plot showed different trends for all factors; screw speed and screw design have
a pseudo linear response whereas the fibre content exhibits a local maxima at 20 wt.%. The
amplitudes of the mean response showed that fibre loading has a main effect whilst screw speed
and screw design affect to a lower degree the final response of the system. This is supported
by the response table for means which shows that the variance induced by the fibre content is
more than twice that of the screw speed and screw design (Table 5.13). The response table for
signal-to-noise (S/N) ratios also suggested that fibre content was the most influential factor to
maximise the S/N ratio for tensile modulus (Table 5.14).
Figure 5.8: Main effect plot of elastic modulus (GPa)
151
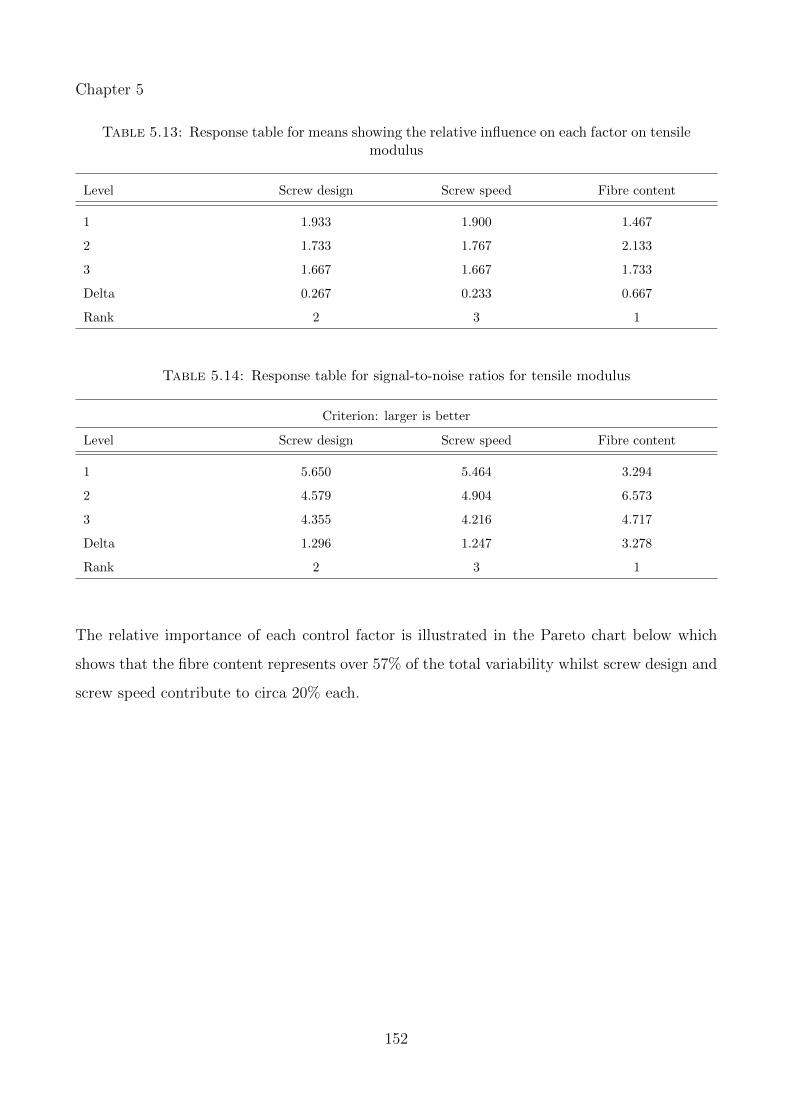
Chapter 5
Table 5.13: Response table for means showing the relative influence on each factor on tensilemodulus
Level Screw design Screw speed Fibre content
1 1.933 1.900 1.467
2 1.733 1.767 2.133
3 1.667 1.667 1.733
Delta 0.267 0.233 0.667
Rank 2 3 1
Table 5.14: Response table for signal-to-noise ratios for tensile modulus
Criterion: larger is better
Level Screw design Screw speed Fibre content
1 5.650 5.464 3.294
2 4.579 4.904 6.573
3 4.355 4.216 4.717
Delta 1.296 1.247 3.278
Rank 2 3 1
The relative importance of each control factor is illustrated in the Pareto chart below which
shows that the fibre content represents over 57% of the total variability whilst screw design and
screw speed contribute to circa 20% each.
152

Chapter 5
Figure 5.9: Pareto chart of elastic modulus (GPa)
ANOVA methods also enable the analysis of the interdependence of the variables in order to
compare the relative strength of the effects across factors. The interaction plot for tensile
modulus shows a significant interdependence between all factors and particularly between the
screw speed and screw design (Figure 5.10). This was expected as the shear intensity depends
on both factors. The non-linearity between the relative performance of screw speed and screw
design suggests complex interactions. For instance, the tensile modulus obtained with the
soft screw was inferior to that achieved with the mild and aggressive screws at low speed (80
rpm) but the trend reversed at 100 rpm. Poor performance at 80 rpm with the soft screw
configuration could be due to insufficient mixing whilst at 100 rpm more shear was generated,
optimising the rheological behaviour. However, the phenomenon was non-linear and the most
aggressive screw gave the best results at higher screw speed. This was most likely due to the
better consistency obtained with the aggressive screw compared to that obtained with the soft
screw (Figure 5.11). This confirms that the melt seal helps preventing the air to pass through
the last section of the barrel hence reducing porosity. On the other hand, screw speed and screw
design interact to a smaller degree with the fibre content but the phenomenon is amplified at
high fibre load. This can be related to the dominant effect of fibre content: the more the fibres,
153
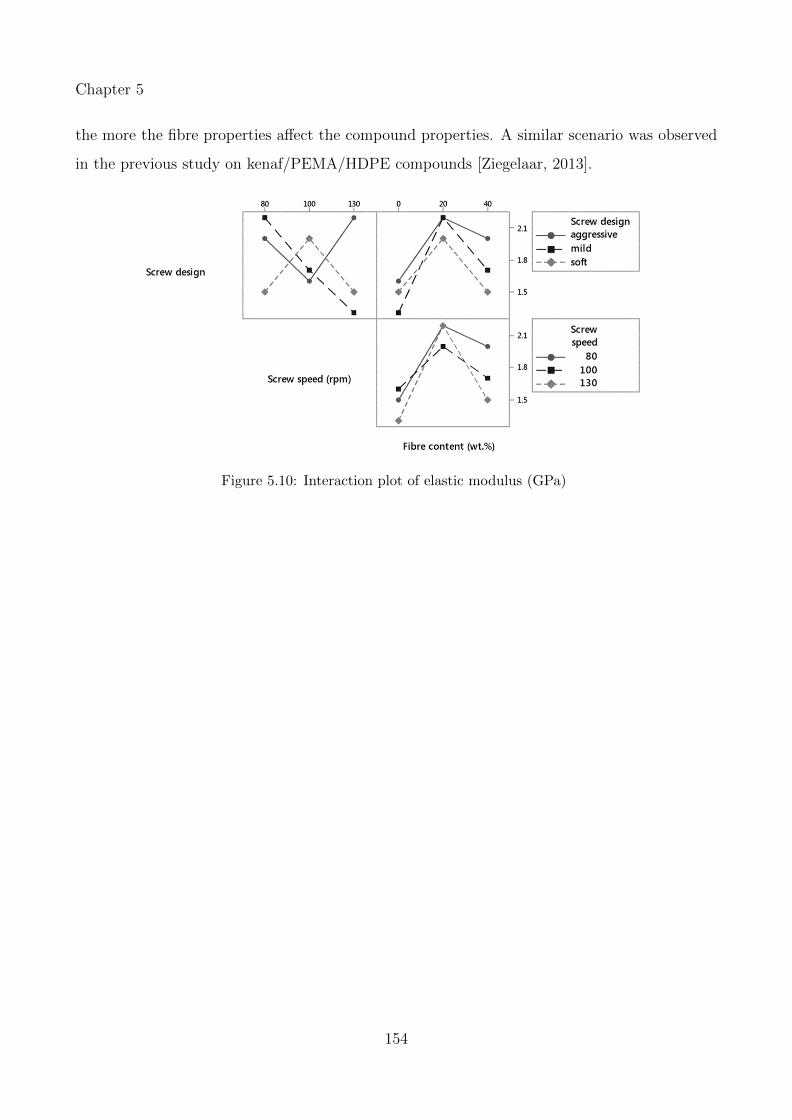
Chapter 5
the more the fibre properties affect the compound properties. A similar scenario was observed
in the previous study on kenaf/PEMA/HDPE compounds [Ziegelaar, 2013].
Figure 5.10: Interaction plot of elastic modulus (GPa)
154
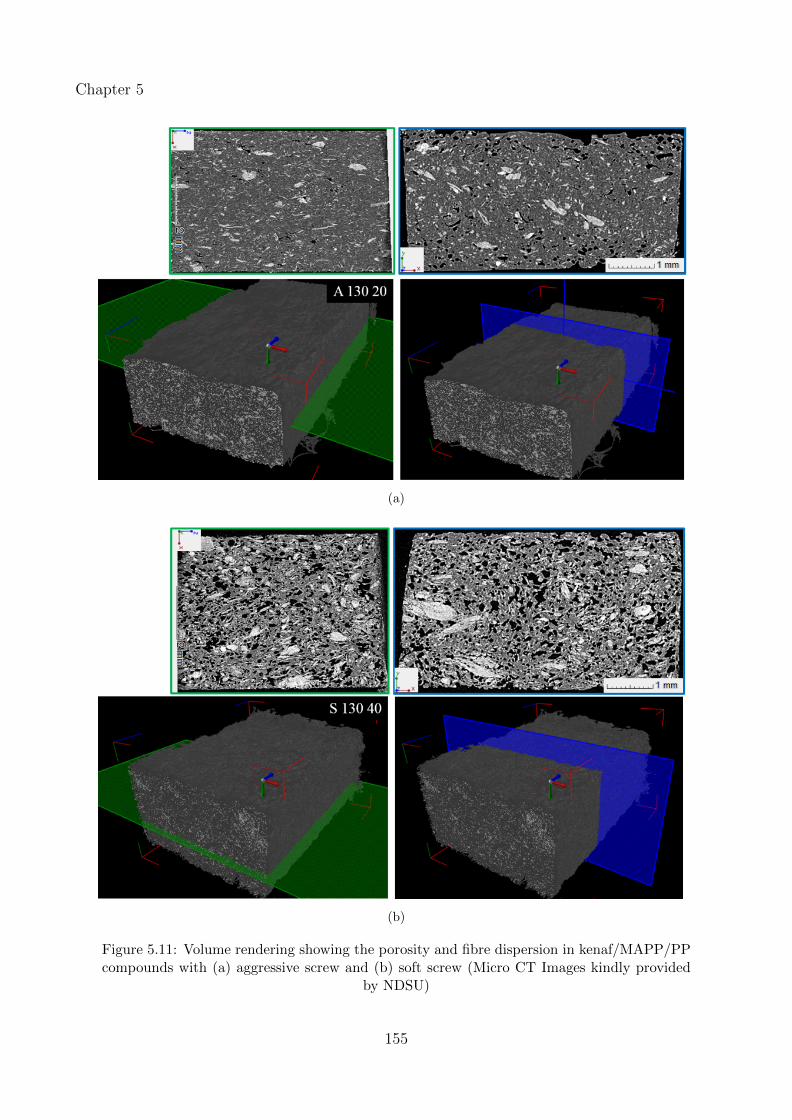
Chapter 5
(a)
(b)
Figure 5.11: Volume rendering showing the porosity and fibre dispersion in kenaf/MAPP/PPcompounds with (a) aggressive screw and (b) soft screw (Micro CT Images kindly provided
by NDSU)
155

Chapter 5
5.4.2 Tensile strength response
A similar approach was performed to analyse the effect of the control factors on the tensile
strength. The response means for each control factor on the tensile strength are given in Figure
5.12. As for tensile modulus, fibre content appears as the most significant factor on the final
response compared to screw speed and screw design. The latter shows a similar trend to that
observed on tensile modulus with a positive correlation with shear intensity. On the other hand,
screw speed displays a reverse trend with a negative correlation with increasing screw speed.
The fibre content response peaks at 20 wt.% and drastically under-performs with higher fibre
content. The main effect of fibre loading is quantified with the response table for means which
shows that the variance induced by the fibre content is more than seven times that of the screw
speed and more than three times that of the screw design (Table 5.15). The response table for
S/N ratios also suggested that fibre content was the most influential factor to maximise the
S/N ratio for tensile strength (Table 5.16).
Figure 5.12: Main effect plot tensile strength (MPa)
156
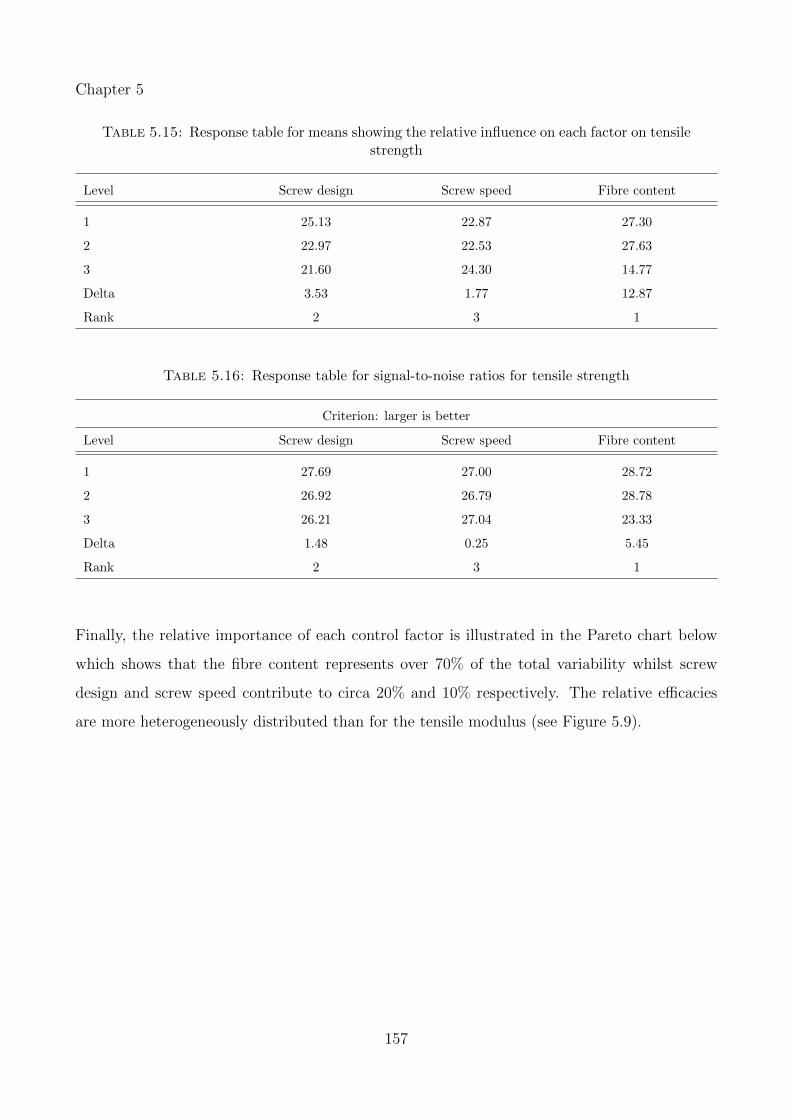
Chapter 5
Table 5.15: Response table for means showing the relative influence on each factor on tensilestrength
Level Screw design Screw speed Fibre content
1 25.13 22.87 27.30
2 22.97 22.53 27.63
3 21.60 24.30 14.77
Delta 3.53 1.77 12.87
Rank 2 3 1
Table 5.16: Response table for signal-to-noise ratios for tensile strength
Criterion: larger is better
Level Screw design Screw speed Fibre content
1 27.69 27.00 28.72
2 26.92 26.79 28.78
3 26.21 27.04 23.33
Delta 1.48 0.25 5.45
Rank 2 3 1
Finally, the relative importance of each control factor is illustrated in the Pareto chart below
which shows that the fibre content represents over 70% of the total variability whilst screw
design and screw speed contribute to circa 20% and 10% respectively. The relative efficacies
are more heterogeneously distributed than for the tensile modulus (see Figure 5.9).
157
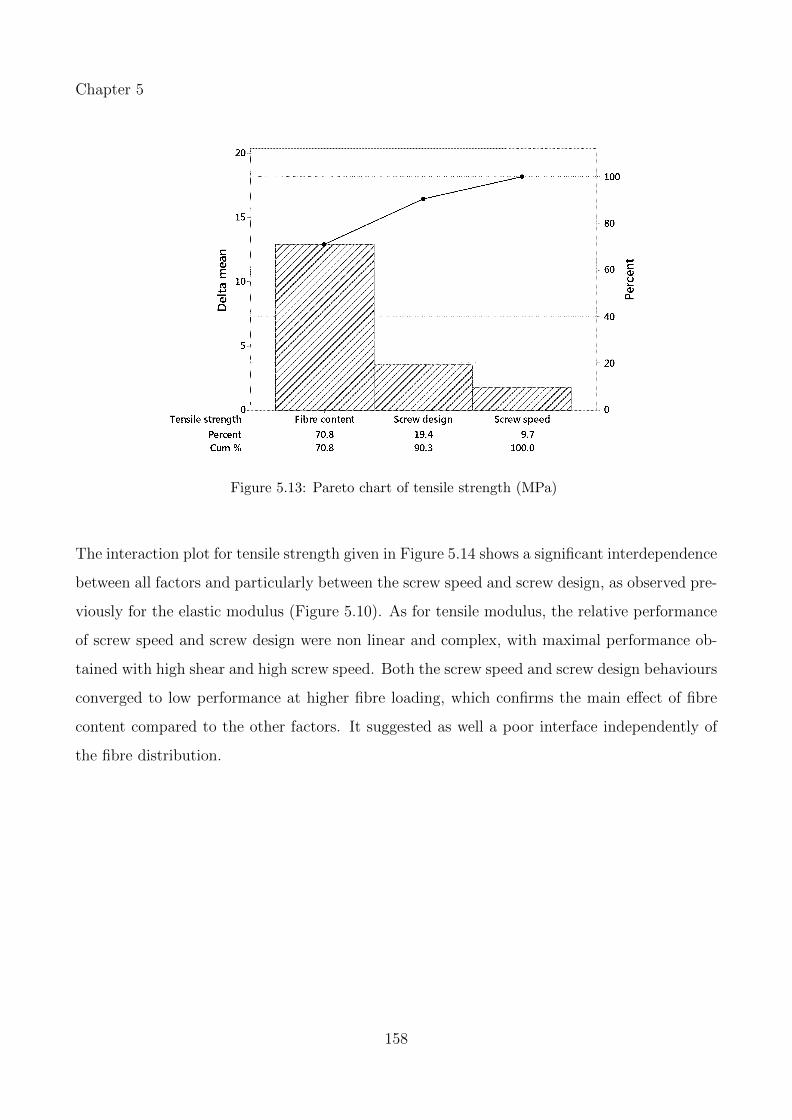
Chapter 5
Figure 5.13: Pareto chart of tensile strength (MPa)
The interaction plot for tensile strength given in Figure 5.14 shows a significant interdependence
between all factors and particularly between the screw speed and screw design, as observed pre-
viously for the elastic modulus (Figure 5.10). As for tensile modulus, the relative performance
of screw speed and screw design were non linear and complex, with maximal performance ob-
tained with high shear and high screw speed. Both the screw speed and screw design behaviours
converged to low performance at higher fibre loading, which confirms the main effect of fibre
content compared to the other factors. It suggested as well a poor interface independently of
the fibre distribution.
158
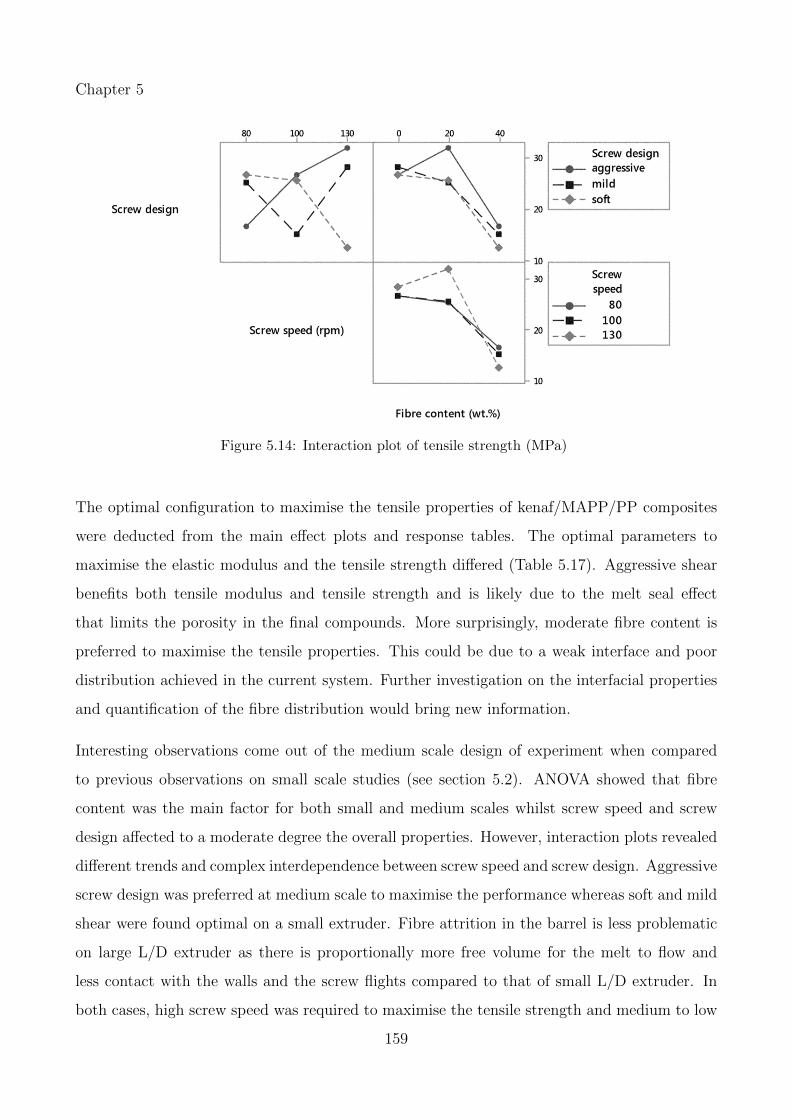
Chapter 5
Figure 5.14: Interaction plot of tensile strength (MPa)
The optimal configuration to maximise the tensile properties of kenaf/MAPP/PP composites
were deducted from the main effect plots and response tables. The optimal parameters to
maximise the elastic modulus and the tensile strength differed (Table 5.17). Aggressive shear
benefits both tensile modulus and tensile strength and is likely due to the melt seal effect
that limits the porosity in the final compounds. More surprisingly, moderate fibre content is
preferred to maximise the tensile properties. This could be due to a weak interface and poor
distribution achieved in the current system. Further investigation on the interfacial properties
and quantification of the fibre distribution would bring new information.
Interesting observations come out of the medium scale design of experiment when compared
to previous observations on small scale studies (see section 5.2). ANOVA showed that fibre
content was the main factor for both small and medium scales whilst screw speed and screw
design affected to a moderate degree the overall properties. However, interaction plots revealed
different trends and complex interdependence between screw speed and screw design. Aggressive
screw design was preferred at medium scale to maximise the performance whereas soft and mild
shear were found optimal on a small extruder. Fibre attrition in the barrel is less problematic
on large L/D extruder as there is proportionally more free volume for the melt to flow and
less contact with the walls and the screw flights compared to that of small L/D extruder. In
both cases, high screw speed was required to maximise the tensile strength and medium to low
159
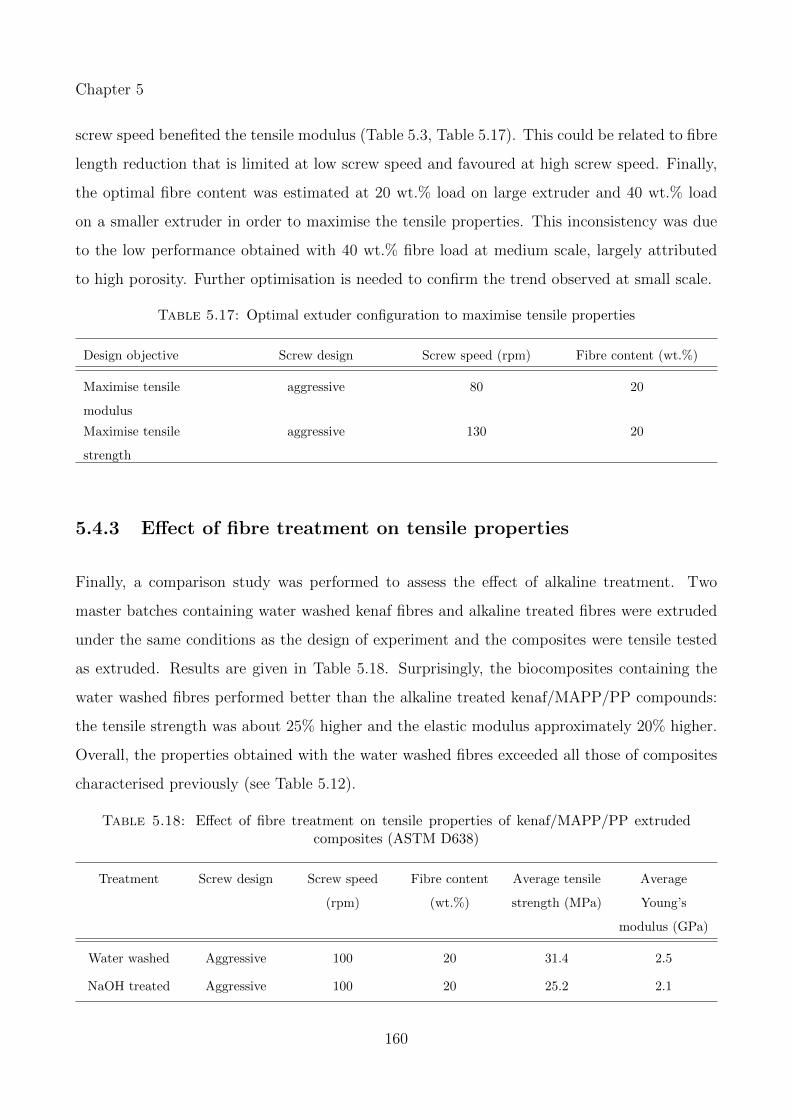
Chapter 5
screw speed benefited the tensile modulus (Table 5.3, Table 5.17). This could be related to fibre
length reduction that is limited at low screw speed and favoured at high screw speed. Finally,
the optimal fibre content was estimated at 20 wt.% load on large extruder and 40 wt.% load
on a smaller extruder in order to maximise the tensile properties. This inconsistency was due
to the low performance obtained with 40 wt.% fibre load at medium scale, largely attributed
to high porosity. Further optimisation is needed to confirm the trend observed at small scale.
Table 5.17: Optimal extuder configuration to maximise tensile properties
Design objective Screw design Screw speed (rpm) Fibre content (wt.%)
Maximise tensile
modulus
aggressive 80 20
Maximise tensile
strength
aggressive 130 20
5.4.3 Effect of fibre treatment on tensile properties
Finally, a comparison study was performed to assess the effect of alkaline treatment. Two
master batches containing water washed kenaf fibres and alkaline treated fibres were extruded
under the same conditions as the design of experiment and the composites were tensile tested
as extruded. Results are given in Table 5.18. Surprisingly, the biocomposites containing the
water washed fibres performed better than the alkaline treated kenaf/MAPP/PP compounds:
the tensile strength was about 25% higher and the elastic modulus approximately 20% higher.
Overall, the properties obtained with the water washed fibres exceeded all those of composites
characterised previously (see Table 5.12).
Table 5.18: Effect of fibre treatment on tensile properties of kenaf/MAPP/PP extrudedcomposites (ASTM D638)
Treatment Screw design Screw speed
(rpm)
Fibre content
(wt.%)
Average tensile
strength (MPa)
Average
Young’s
modulus (GPa)
Water washed Aggressive 100 20 31.4 2.5
NaOH treated Aggressive 100 20 25.2 2.1
160
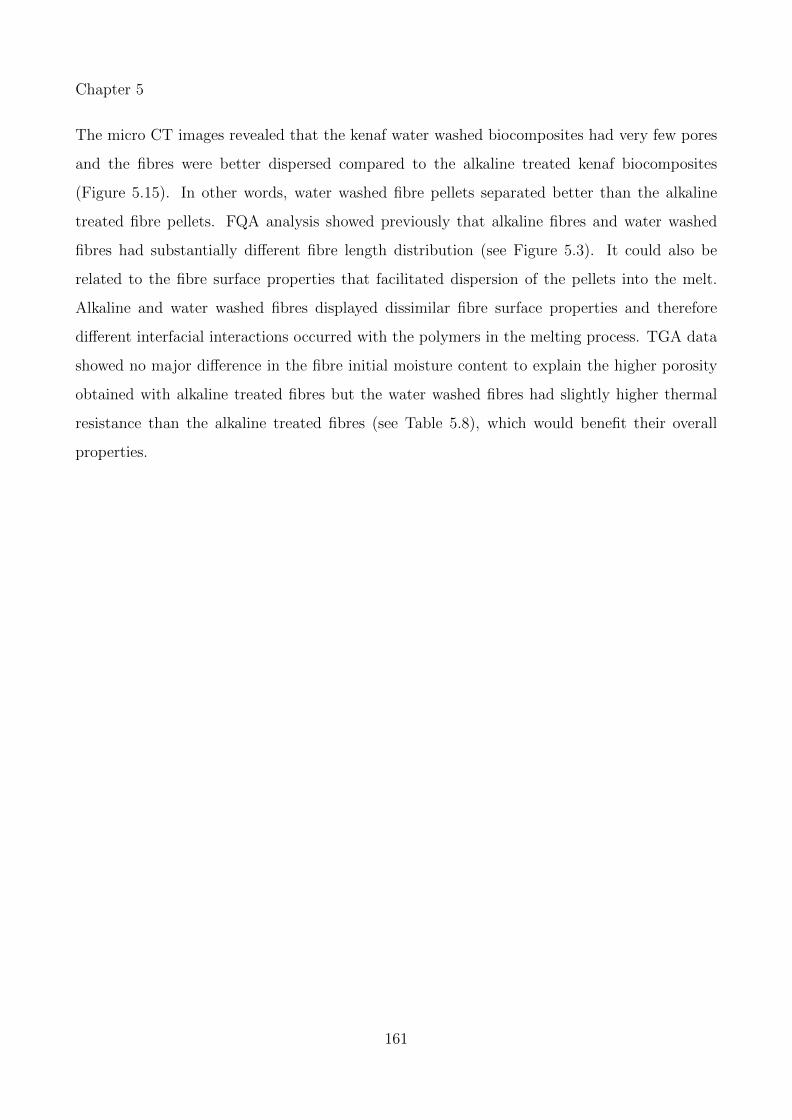
Chapter 5
The micro CT images revealed that the kenaf water washed biocomposites had very few pores
and the fibres were better dispersed compared to the alkaline treated kenaf biocomposites
(Figure 5.15). In other words, water washed fibre pellets separated better than the alkaline
treated fibre pellets. FQA analysis showed previously that alkaline fibres and water washed
fibres had substantially different fibre length distribution (see Figure 5.3). It could also be
related to the fibre surface properties that facilitated dispersion of the pellets into the melt.
Alkaline and water washed fibres displayed dissimilar fibre surface properties and therefore
different interfacial interactions occurred with the polymers in the melting process. TGA data
showed no major difference in the fibre initial moisture content to explain the higher porosity
obtained with alkaline treated fibres but the water washed fibres had slightly higher thermal
resistance than the alkaline treated fibres (see Table 5.8), which would benefit their overall
properties.
161

Chapter 5
(a)
(b)
Figure 5.15: Volume rendering showing the porosity and fibre dispersion in (a) kenaf waterwashed fibres/MAPP/PP composites and (b) kenaf alkaline treated fibres/MAPP/PP com-
posites (Micro CT Images kindly provided by NDSU)
162
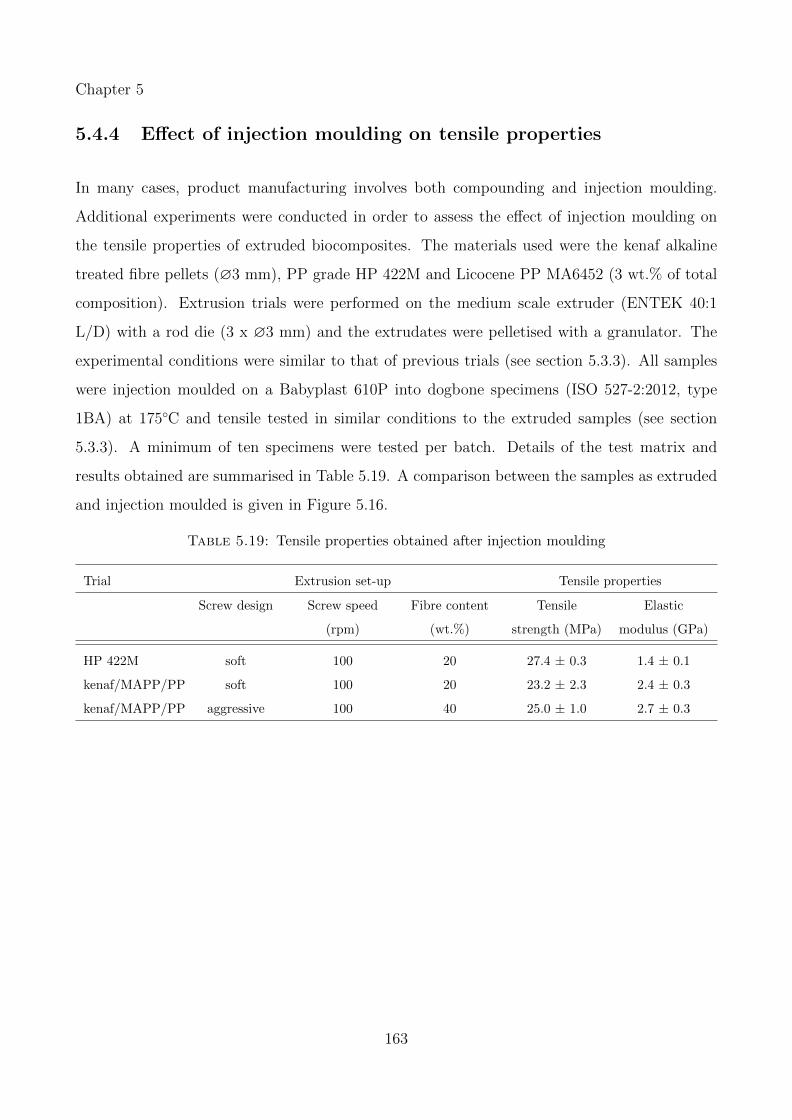
Chapter 5
5.4.4 Effect of injection moulding on tensile properties
In many cases, product manufacturing involves both compounding and injection moulding.
Additional experiments were conducted in order to assess the effect of injection moulding on
the tensile properties of extruded biocomposites. The materials used were the kenaf alkaline
treated fibre pellets (∅3 mm), PP grade HP 422M and Licocene PP MA6452 (3 wt.% of total
composition). Extrusion trials were performed on the medium scale extruder (ENTEK 40:1
L/D) with a rod die (3 x ∅3 mm) and the extrudates were pelletised with a granulator. The
experimental conditions were similar to that of previous trials (see section 5.3.3). All samples
were injection moulded on a Babyplast 610P into dogbone specimens (ISO 527-2:2012, type
1BA) at 175◦C and tensile tested in similar conditions to the extruded samples (see section
5.3.3). A minimum of ten specimens were tested per batch. Details of the test matrix and
results obtained are summarised in Table 5.19. A comparison between the samples as extruded
and injection moulded is given in Figure 5.16.
Table 5.19: Tensile properties obtained after injection moulding
Trial Extrusion set-up Tensile properties
Screw design Screw speed
(rpm)
Fibre content
(wt.%)
Tensile
strength (MPa)
Elastic
modulus (GPa)
HP 422M soft 100 20 27.4 ± 0.3 1.4 ± 0.1
kenaf/MAPP/PP soft 100 20 23.2 ± 2.3 2.4 ± 0.3
kenaf/MAPP/PP aggressive 100 40 25.0 ± 1.0 2.7 ± 0.3
163
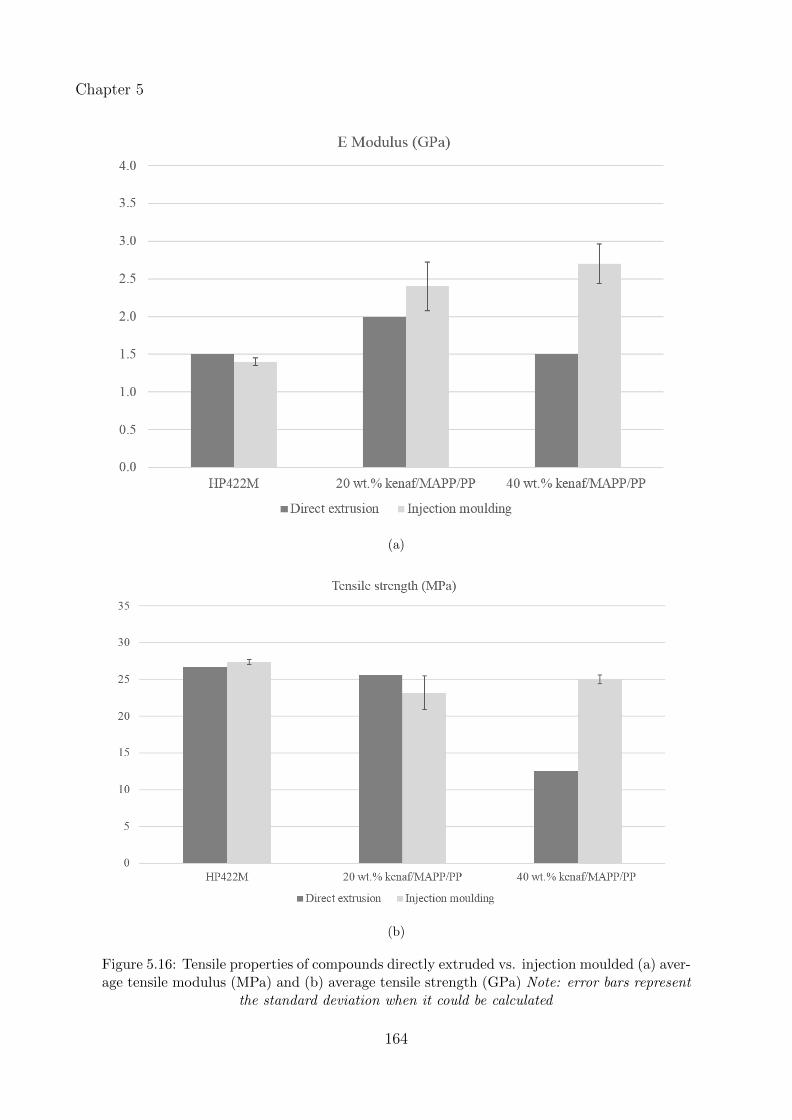
Chapter 5
(a)
(b)
Figure 5.16: Tensile properties of compounds directly extruded vs. injection moulded (a) aver-age tensile modulus (MPa) and (b) average tensile strength (GPa) Note: error bars represent
the standard deviation when it could be calculated
164
Chapter 5
Injection moulding had a negligible effect on the polypropylene samples; tensile strength in-
creased by about 3% and the tensile modulus decreased by less than 7%. On the other hand,
the injection moulded biocomposites displayed higher elastic modulus than those tested di-
rectly post extrusion and the effect amplified at higher fibre content: E modulus increased by
20% and by 100% for the 20 wt.% kenaf/MAPP/PP and 40 wt.% kenaf/MAPP/PP samples
respectively (Figure 5.16a). This was most likely due to the loss in porosity during injection
moulding, which may also have enabled better stress transfer from the matrix to the fibres.
The effect on the tensile strength was less consistent: the 20 wt.% kenaf/MAPP/PP samples
showed slightly lower values (by about 10%) whereas that of 40 wt.% kenaf/MAPP/PP in-
creased by 100% but still lower than the pure polymer. The lower tensile strength for 20 wt.%
kenaf/MAPP/PP could result from a change in fibre orientation and fibre distribution due to
injection moulding. On the other hand, at higher fibre load, the loss in porosity meant that
injection moulding most likely compensated for this effect. This explains the increase in tensile
strength for the 40 wt.% kenaf/MAPP/PP injection moulded composites compared to that of
directly extruded composites (see Figure 5.11b).
When compared to polypropylene, the injection moulded biocomposites showed a considerable
increase in elastic modulus whilst tensile strength hardly equalled that of polypropylene. This
trend is similar to that generally observed on extruded biocomposites and highlights the real
challenge for these materials that is to achieve acceptable tensile strength.
165
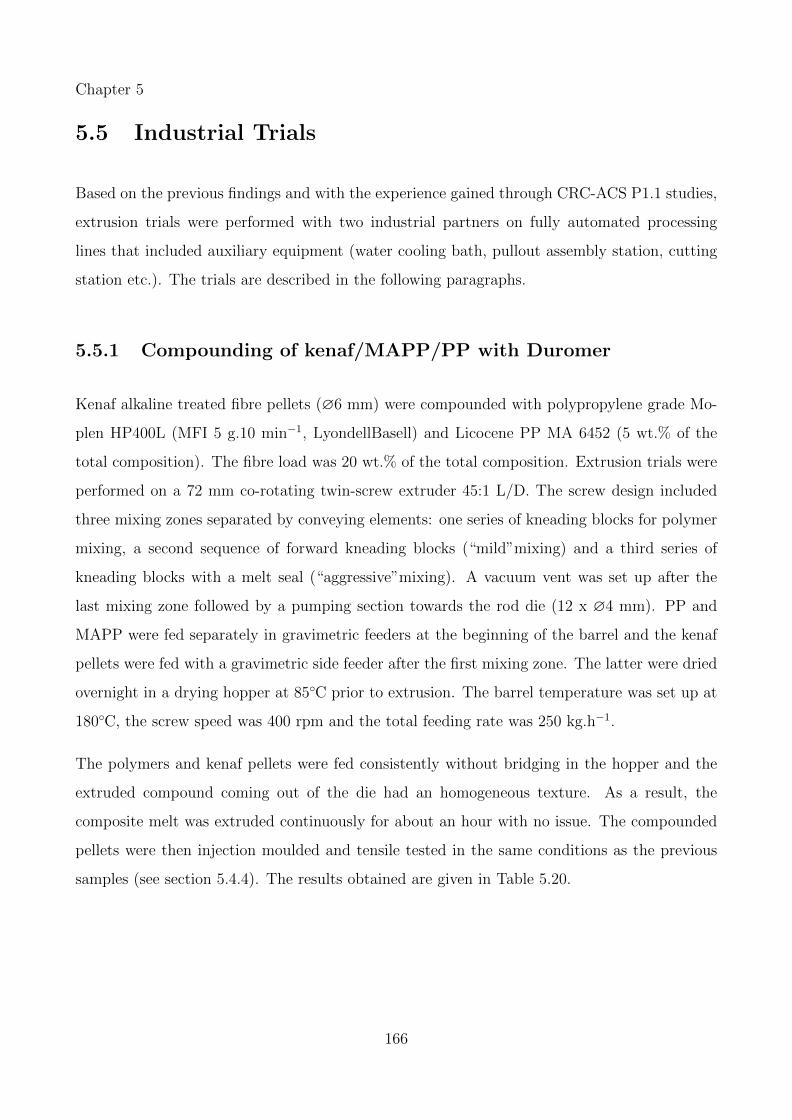
Chapter 5
5.5 Industrial Trials
Based on the previous findings and with the experience gained through CRC-ACS P1.1 studies,
extrusion trials were performed with two industrial partners on fully automated processing
lines that included auxiliary equipment (water cooling bath, pullout assembly station, cutting
station etc.). The trials are described in the following paragraphs.
5.5.1 Compounding of kenaf/MAPP/PP with Duromer
Kenaf alkaline treated fibre pellets (∅6 mm) were compounded with polypropylene grade Mo-
plen HP400L (MFI 5 g.10 min−1, LyondellBasell) and Licocene PP MA 6452 (5 wt.% of the
total composition). The fibre load was 20 wt.% of the total composition. Extrusion trials were
performed on a 72 mm co-rotating twin-screw extruder 45:1 L/D. The screw design included
three mixing zones separated by conveying elements: one series of kneading blocks for polymer
mixing, a second sequence of forward kneading blocks (“mild”mixing) and a third series of
kneading blocks with a melt seal (“aggressive”mixing). A vacuum vent was set up after the
last mixing zone followed by a pumping section towards the rod die (12 x ∅4 mm). PP and
MAPP were fed separately in gravimetric feeders at the beginning of the barrel and the kenaf
pellets were fed with a gravimetric side feeder after the first mixing zone. The latter were dried
overnight in a drying hopper at 85◦C prior to extrusion. The barrel temperature was set up at
180◦C, the screw speed was 400 rpm and the total feeding rate was 250 kg.h−1.
The polymers and kenaf pellets were fed consistently without bridging in the hopper and the
extruded compound coming out of the die had an homogeneous texture. As a result, the
composite melt was extruded continuously for about an hour with no issue. The compounded
pellets were then injection moulded and tensile tested in the same conditions as the previous
samples (see section 5.4.4). The results obtained are given in Table 5.20.
166
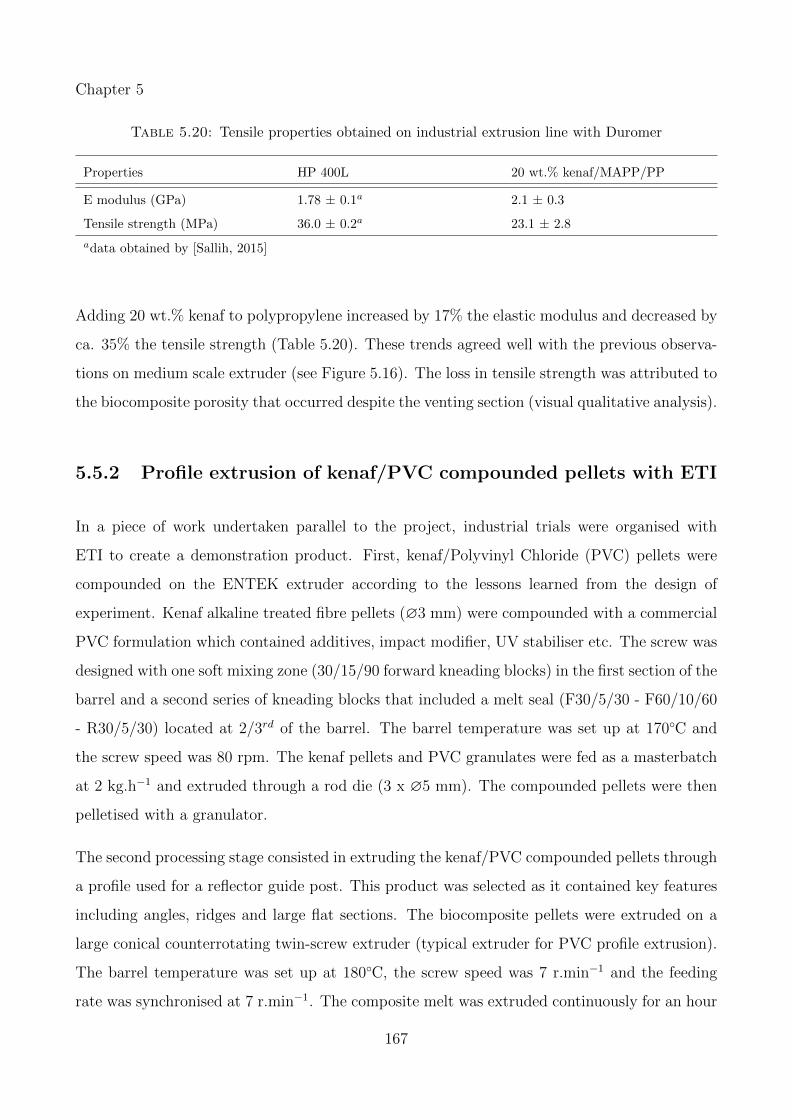
Chapter 5
Table 5.20: Tensile properties obtained on industrial extrusion line with Duromer
Properties HP 400L 20 wt.% kenaf/MAPP/PP
E modulus (GPa) 1.78 ± 0.1a 2.1 ± 0.3
Tensile strength (MPa) 36.0 ± 0.2a 23.1 ± 2.8
adata obtained by [Sallih, 2015]
Adding 20 wt.% kenaf to polypropylene increased by 17% the elastic modulus and decreased by
ca. 35% the tensile strength (Table 5.20). These trends agreed well with the previous observa-
tions on medium scale extruder (see Figure 5.16). The loss in tensile strength was attributed to
the biocomposite porosity that occurred despite the venting section (visual qualitative analysis).
5.5.2 Profile extrusion of kenaf/PVC compounded pellets with ETI
In a piece of work undertaken parallel to the project, industrial trials were organised with
ETI to create a demonstration product. First, kenaf/Polyvinyl Chloride (PVC) pellets were
compounded on the ENTEK extruder according to the lessons learned from the design of
experiment. Kenaf alkaline treated fibre pellets (∅3 mm) were compounded with a commercial
PVC formulation which contained additives, impact modifier, UV stabiliser etc. The screw was
designed with one soft mixing zone (30/15/90 forward kneading blocks) in the first section of the
barrel and a second series of kneading blocks that included a melt seal (F30/5/30 - F60/10/60
- R30/5/30) located at 2/3rd of the barrel. The barrel temperature was set up at 170◦C and
the screw speed was 80 rpm. The kenaf pellets and PVC granulates were fed as a masterbatch
at 2 kg.h−1 and extruded through a rod die (3 x ∅5 mm). The compounded pellets were then
pelletised with a granulator.
The second processing stage consisted in extruding the kenaf/PVC compounded pellets through
a profile used for a reflector guide post. This product was selected as it contained key features
including angles, ridges and large flat sections. The biocomposite pellets were extruded on a
large conical counterrotating twin-screw extruder (typical extruder for PVC profile extrusion).
The barrel temperature was set up at 180◦C, the screw speed was 7 r.min−1 and the feeding
rate was synchronised at 7 r.min−1. The composite melt was extruded continuously for an hour
167
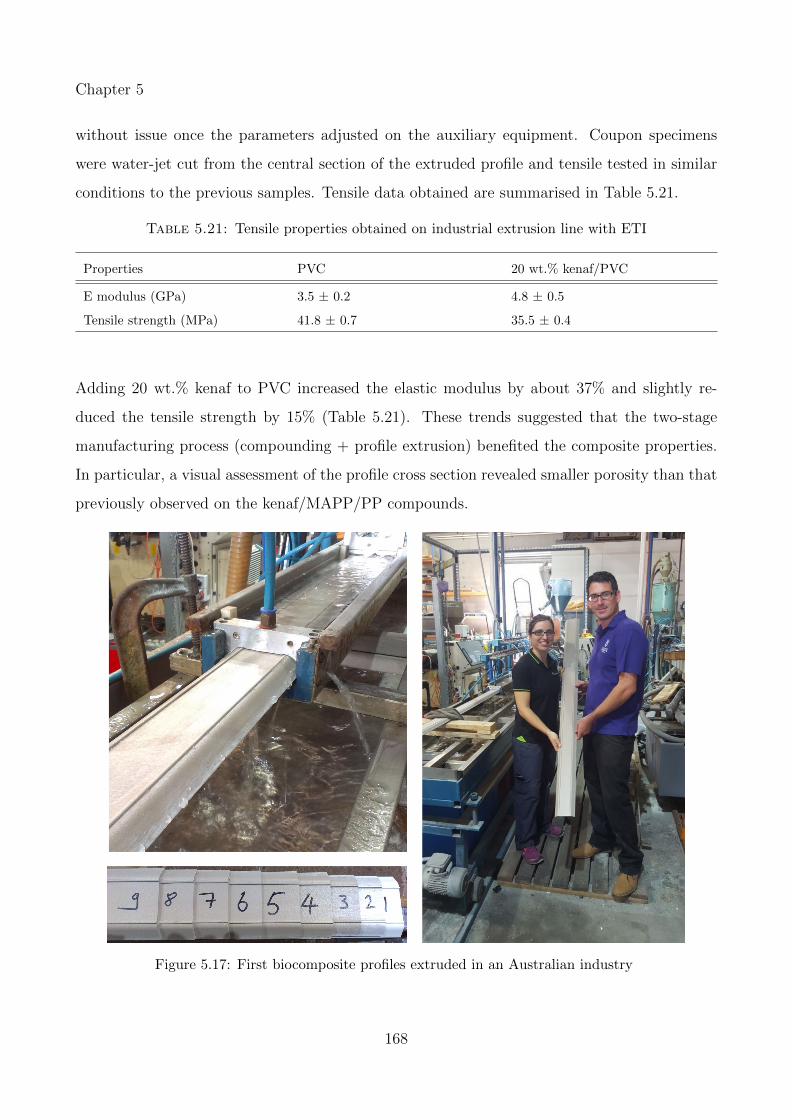
Chapter 5
without issue once the parameters adjusted on the auxiliary equipment. Coupon specimens
were water-jet cut from the central section of the extruded profile and tensile tested in similar
conditions to the previous samples. Tensile data obtained are summarised in Table 5.21.
Table 5.21: Tensile properties obtained on industrial extrusion line with ETI
Properties PVC 20 wt.% kenaf/PVC
E modulus (GPa) 3.5 ± 0.2 4.8 ± 0.5
Tensile strength (MPa) 41.8 ± 0.7 35.5 ± 0.4
Adding 20 wt.% kenaf to PVC increased the elastic modulus by about 37% and slightly re-
duced the tensile strength by 15% (Table 5.21). These trends suggested that the two-stage
manufacturing process (compounding + profile extrusion) benefited the composite properties.
In particular, a visual assessment of the profile cross section revealed smaller porosity than that
previously observed on the kenaf/MAPP/PP compounds.
Figure 5.17: First biocomposite profiles extruded in an Australian industry
168
Chapter 5
5.6 Conclusions
The design of experiment performed at medium scale confirmed the findings from previous stud-
ies on bench top extruders and brought new insights on the feasibility of large scale biocomposite
extrusion. Statistical analysis with ANOVA methods showed a significant interdependence be-
tween all factors and particularly between the screw speed and the screw design. At both
scales, fibre content was the dominant factor for the tensile strength and elastic modulus whilst
screw speed and screw design affected to a lower degree the tensile properties. Overall, the
performance achieved agreed well with the general trends observed in literature. Considerable
porosity revealed by Micro CT largely contributed to low tensile strength.
The series of experiments performed demonstrated the necessity to work with well characterised
fibres as their surface properties and physical characteristics are determinant for the final com-
posite properties. For instance, the alkaline treated fibre reinforced polypropylene composites
under-performed compared to the water washed fibre polypropylene composites although the
former had a surface more energetically homogeneous and less polar. It is assumed that the
higher fibre aspect ratio of the water washed fibres and their homogeneous fibre length distri-
bution largely contributed to increase the composite performance. Unfortunately, XRD and
SFTT conventional set-ups were unsuitable for the characterisation of short processed fibres.
Capability and methodology development are needed in the future to assess short fibre proper-
ties.
Injection moulding post compounding increased the Youngs’ Modulus and slightly decreased
the tensile strength of biocomposites whereas pure polypropylene compounds maintained their
properties. This trend confirmed the challenge to achieve acceptable tensile strength in short
fibre biocomposites.
The properties achieved on a medium scale extruder were similar to that obtained by Duromer
on an industrial extrusion line. Such results demonstrate that the up-scaling process was
successful and validated the development of biocomposites on a medium scale extruder prior to
industrial extrusion line. Furthermore, fibre attrition and size effects are less problematic on
a large L/D extruder compared to a small extruder where the kneading elements have similar
dimension to the fibres.
169
Chapter 5
Throughout the trials a significant amount of porosity was noticed in the extruded samples. This
is an aspect which the project failed to overcome and has unfortunately resulted in mechanical
properties lower than expected. Further work is required to overcome this issue, and the author
believes that the two key areas that need to be addressed are the drying of the fibres prior to
feeding and the development of screw configuration which allow moisture extraction by the use
of alternating high/low pressure sections and vacuum venting. The industrial trials have shown
that drying natural fibres is challenging on a industrial scale considering the high humidity
in Queensland, the large volume of fibres to handle and the rapid moisture uptake of natural
fibres. Whilst the porosity detected in the samples questions the industrial-usefulness of some
of the results, the contribution of this thesis to the development of natural fibre compounding
capability at The University of Queensland was immense. The methodology presented in this
chapter and the lessons learned will undoubtedly be used to further optimise the extrusion
process and produce better biocomposite materials.
170

Chapter 6
Conclusions & Recommendations
This thesis focused on key aspects of biocomposite development for industrial application that
is the triad of natural fibre properties, the techniques for natural fibre grading and the extrusion
process (Figure 6.1). The first objective was to characterise natural fibres with advanced sur-
face techniques in order to resolve the chemistry and physical properties of the fibres’ surface.
This included the evaluation of existing techniques and capability development of inverse gas
chromatography. The second main objective was to optimise the extrusion process for biocom-
posites and to study the feasibility of large volume production by up-scaling. Finally, this thesis
aimed to establish a correlation between the fibre properties and the composite properties with
respect to the fibres’ surface characteristics and the processing variables. Chapter 3 showed
the potential of the in-lens SEM technique to characterise natural fibre surface morphology
and to obtain surface contrast mapping, which is limited with conventional SEM. XPS analysis
has also been pushed further than a comparison based on the average composition, with peak
fitting of high resolution spectra and systematic cross-correlation to ensure coherent data inter-
pretation. Chapter 4 demonstrated the potential of IGC as a grading technique to investigate
the surface energy of plant fibres, in particular, the effect of surface treatment on the energy
profile and the surface polarity. Finally, a feasibility study for large scale production of short
fibre biocomposites was performed via a series of design of experiments from laboratory scale
up to industrial processing lines, and is reported in Chapter 5. This final chapter summarises
the main messages delivered through the thesis followed by recommendations for future work.
171
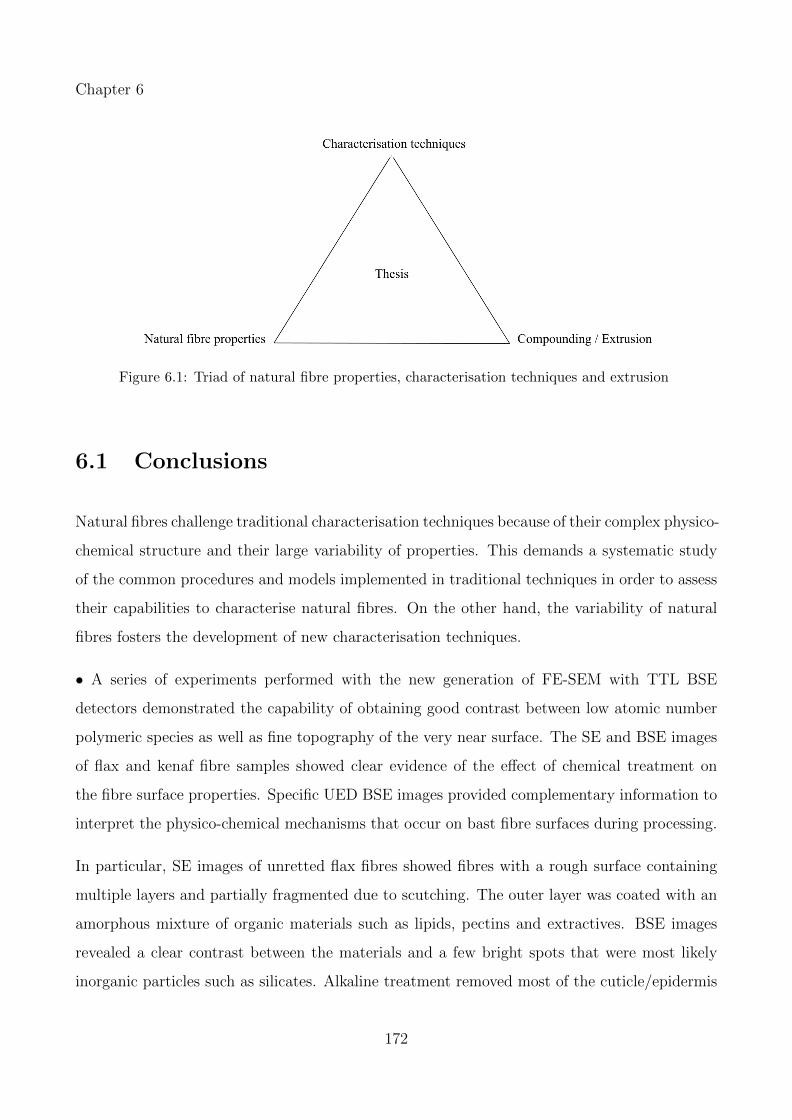
Chapter 6
Figure 6.1: Triad of natural fibre properties, characterisation techniques and extrusion
6.1 Conclusions
Natural fibres challenge traditional characterisation techniques because of their complex physico-
chemical structure and their large variability of properties. This demands a systematic study
of the common procedures and models implemented in traditional techniques in order to assess
their capabilities to characterise natural fibres. On the other hand, the variability of natural
fibres fosters the development of new characterisation techniques.
• A series of experiments performed with the new generation of FE-SEM with TTL BSE
detectors demonstrated the capability of obtaining good contrast between low atomic number
polymeric species as well as fine topography of the very near surface. The SE and BSE images
of flax and kenaf fibre samples showed clear evidence of the effect of chemical treatment on
the fibre surface properties. Specific UED BSE images provided complementary information to
interpret the physico-chemical mechanisms that occur on bast fibre surfaces during processing.
In particular, SE images of unretted flax fibres showed fibres with a rough surface containing
multiple layers and partially fragmented due to scutching. The outer layer was coated with an
amorphous mixture of organic materials such as lipids, pectins and extractives. BSE images
revealed a clear contrast between the materials and a few bright spots that were most likely
inorganic particles such as silicates. Alkaline treatment removed most of the cuticle/epidermis
172
Chapter 6
outer layer and revealed kinks and nodes on single fibres’ surface. Some patches scattered on
the surface were most likely residual lignins.
Imaging of field retted kenaf fibres showed fibres covered with an amorphous layer and scattered
with adhering particulates, likely organic compounds. Typical features of the epidermal tissues
were also visible on the surface which suggested that water exposure solely was insufficient to
remove lignins, pectins and waxes from the surface. BSE images confirmed that the surface
contained mostly lignins and waxes, with traces of extractives non dissolved during field retting.
The fibres appeared much cleaner and relatively smooth after water washing. SEI and BSE
images revealed no major contrast except a few bright spots that were most likely inorganic
materials deposited during the water washing or projected when the fibres were milled. Nature
of the surface was similar to field retted fibres which was expected as both batches underwent
water exposure only. Finally, alkaline treated fibres had a rough surface partially covered with
an amorphous layer rich in lignins and waxes. Trace of extractives were still visible on the
surface whilst the surface underneath contained more cellulose, hemicellulose and pectins.
• A set of bast fibres were further investigated by XPS to identify the nature of the compounds
present on the fibres’ surface and to quantify the elemental chemical composition. All fibres
showed O/C ratios much lower than that of theoretical pure cellulose (O/C= 0.83) and that
of bacterial cellulose (O/C = 0.73) that were used as a reference. Hemp fibres had an O/C of
0.32, kenaf fibres had O/C ratios of 0.26 and 0.28 and flax linseed had an O/C of 0.25 and flax
linen of 0.15. Surprisingly, commercial synthesised cellulose fibres BioMid R© displayed similar
values with an average O/C of 0.31. Fibres subject to milling had their O/C ratio increased by
ca. 35% that was assumed to be due to fibre breaking and defibrillation. Chemical treatment
affected as well the surface chemistry. All specimens had an increased O/C of more than 50% on
hemp fibres and up to 125% on flax fibres post alkaline treatment, which confirms the surfaces
contained less amorphous substances such as lignins, pectins, waxes. However the O/C ratios
were still much lower than the theoretical value of cellulose: hemp fibres had an O/C of 0.49
and kenaf 0.44 compared to 0.83 for pure cellulose. This agrees well with the SEM results that
showed in both cases alkaline treated fibre surfaces were still rich in lignins and extractives.
Further analysis was performed with high resolution scans to identify the functional groups
present on the kenaf fibre surface and to investigate the effect of alkaline treatment on the
173
Chapter 6
surface chemistry. High resolution scans on carbon (C1s), oxygen (O1s) and nitrogen (N1s)
confirmed that the very near surface of alkaline treated fibres was rich in lignins and poor in
cellulose. Specific peaks of the functional groups present in lignins, hemicellulose and pectins
were identified (ester group, methoxy substitutions and Pi-Pi* shake up bands). Strong C-C
peaks confirmed the presence of lignins, waxes and extractives. On the other hand, the fibres
contained proportionally more cellulose and hemicellulose than water washed fibres and fibres
as received. The peaks’ amplitude also suggested that the surface contained less fatty acids
which was expected as NaOH was more efficient in removing fatty acids than water washing.
The experimental data agrees well with SEM analysis and confirmed that the water wash
and alkaline treatment cleaned the fibre surface and removed most of the epidermal tissues.
However, the treatments were too gentle to remove lignins and pectins and the fibres’ surface
remained rich in lignins and oxygenated species, and poor in cellulose.
• IGC proved to be a promising technique for studying the surface energy of natural fibres.
Because it is a relatively new technique for natural fibre characterisation, systematic studies
needed to be performed. In this study, the critical parameters to determine the BET surface
area values were identified and a protocol applicable to natural fibres was proposed. The BET
specific surface area of kenaf and flax fibres differed, with an average of 0.51 m2.g−1 vs. 1.35
m2.g−1 respectively and the kenaf fibres showed similar BET value to cellulose fibres (ca. 0.54
m2.g−1). Bast fibres had larger batch-to-batch variability than synthesised cellulose fibres,
which is a consequence of natural fibre structural irregularities and heterogeneous properties.
The BET values obtained by IGC SEA showed a noticeable dependence on the elutant properties
which was attributed to the effect of molecular orientation. Sample packing also affected the
BET surface area values but no clear trend could be established.
Surface energy measurements were performed at finite concentration to obtain more realistic
values than those obtained in infinite dilution. The surface energy distribution profiles of the
dispersive and the acid-base components provided key complementary information to the over-
all surface energy profile of natural fibres and highlighted their specificity. For instance, γLWS
profiles showed that the kenaf fibres’ surface contained active sites with energy levels spread
more than those of flax and cellulose fibres’ surface. In addition, γLWSmean(kenaf) 6 γLWSmean(flax)
174
Chapter 6
6 γLWSmean(BioMid R©) which was coherent with the assumption that the unretted flax fibres con-
tained more waxy substances than the field retted kenaf fibres. The γABS distribution profiles
were similar to that of γLWS with BioMid R© fibres being the least polar and the most homo-
geneous. Flax fibre surface contained polar groups of lower energy than that of kenaf fibres
which assumed that the latter comprised more Lewis acid-base functional groups, for instance,
pectins, lignins and extractives. The acid-base energy component contribution to the total
surface energy values was significant in particular for the kenaf fibres. The latter had a po-
larity index (γABSmean/γ
TOTSmean) of 0.24 compared to 0.15 and 0.09 for flax and BioMid R© fibres
respectively.
Finally, investigation of the effect of fibre treatment on the surface energy profiles of kenaf
fibres provided new insights, in particular the change in polarity and the distribution of the
energetic active sites. Both the water wash and alkaline treatments induced a shift to higher
average γLWS values suggesting the fibres’ surface became more hydrophobic. The evolution of
γLWS profiles indicated an increase in the number of high energetic sites and/or an increase in
energy levels of the active sites. Logically, γABS profile shifted to lower values, as the surface
became less polar. Both treatments only slightly affected the overall surface energy value of
the fibres: γTOTSmin = 48.9 mJ.m−2, 48.8 mJ.m−2 and 47 mJ.m−2 for the kenaf as received, water
washed and alkaline treated fibres respectively. However, the polarity index showed that both
treatments reduced the surface polarity: kenaf fibres as received had a polarity index of 0.24
compared to 0.20 and 0.17 for the water retted and alkaline treated fibres respectively. Water
wash and alkaline treatment also rendered the surface energetically more homogeneous than
the fibres as received.
These experimental data highlight the structural heterogeneity between different species of bast
fibres, in terms of both chemical and physical properties. Further data acquisition on natural
fibres is necessary to strengthen these models and extend the database to get consistent refer-
ences. However, the current results have demonstrated the potential of IGC for characterisation
of natural fibre surfaces. Combined, XPS, in-lens SEM and IGC offer a unique complementarity
to unravel natural fibre surface properties.
175
Chapter 6
• Compounding short fibre biocomposites is challenging due to the multiple variables involved
and the specific issues that arise when working with natural fibres. A series of experiments
leading towards large scale processing have been performed and brought new insights on the
feasibility of large scale biocomposite extrusion. Statistical analysis with ANOVA methods
showed a significant interdependence between all factors and particularly between the screw
speed and the screw design. At both bench top and medium scale, fibre content was the
dominant factor for the tensile strength and elastic modulus whilst screw speed and screw design
affected to a lower degree the tensile properties. The composites had higher tensile modulus
than the pure polymer whilst the improvement in tensile strength was marginal. Injection
moulding post compounding increased the composite Youngs’ Modulus and slightly decreased
their tensile strength. These trends agreed well with the published literature and confirmed the
challenge to achieve acceptable tensile strength in short fibre biocomposites.
The series of experiments also demonstrated the necessity to work with well characterised fibres
as their surface properties and physical characteristics determine the final composite properties.
Fibre length distribution is important and may compromise the effect of fibre treatment. For
instance, alkaline treated kenaf fibre reinforced polypropylene composites under-performed the
water washed kenaf fibre polypropylene composites although the former had a surface more
energetically homogeneous and less polar. It is assumed that the higher fibre aspect ratio of
the water washed fibres and their homogeneous fibre length distribution largely contributed to
increase the composite performance.
Finally, extrusion at industrial scale has been successfully performed and represents a major
achievement of the thesis. However, a significant amount of porosity was noticed in the extruded
samples throughout the trials and further work is required to overcome this issue. Whilst the
porosity detected in the samples questions the industrial-usefulness of some of the results,
the contribution of this thesis to the development of natural fibre compounding capability
at The University of Queensland was immense. The methodology and the lessons learned will
undoubtedly be used to further optimise the extrusion process and produce better biocomposite
materials.
176
Chapter 6
6.2 Recommendations
• Surface Characterisation
The multi-scale characterisation performed in this work demonstrated the complementarity of
advanced surface characterisation techniques. The case studies presented brought new insights
on bast fibre surface properties, in particular on the effect of alkaline treatment on the surface
chemistry and energetic profile. Although the results were consistent and most of the hypothesis
formulated could be confirmed through the thesis, several areas still need to be addressed.
Further experimental work with FE-SEM TTL should be performed to identify the nature of
the amorphous substances on the fibre surface. A method developed by Fromm et al. [2003] that
consists in staining the lignin with potassium permanganate KMnO4 enables the detection of the
presence of lignins on the fibre surface. KMnO4 oxidises lignins and reduces the permanganate
to MnO2. Previous authors successfully labelled lignin with this technique [Day et al., 2005,
Neto et al., 1996, Truss et al., 2015]. In addition, elemental analysis using Energy Dispersive
X-Ray Spectroscopy (EDX) would help identifying the nature of the inorganic compounds.
The main challenge of XPS remains data interpretation. Peak fitting and cross-correlation
enabled the identification of some of the functional groups present on the fibres’ surface but
some peaks remain unsolved. Whilst the complexity of peak fitting is typical of natural fibres
and will unlikely be simplified in the future, building reference spectra could help identifying
the specific functional groups. Recommendations for future work involve XPS analysis of the
different types of lignins (H-lignin, S-lignin, G-lignin) from softwoods and hardwoods to build
the respective XPS high resolution spectra. The spectra of pectins and plant waxes would
also help differentiating some of the functional groups, however, these substances are more
challenging to analyse due to sample preparation. Little work has been reported so far on these
compounds.
Inverse Gas Chromatography is a versatile technique and a palette of experiments should be con-
sidered in a future work in order to extend the knowledge on surface energy of plant materials.
In particular, evolution of the surface energy values with different conditions of temperature
and humidity is of interest to better understand the fibre behaviour in the processing stage
177
Chapter 6
and to improve fibre storage and conditioning. Investigation of the surface energy profiles of
polymer matrices would enable the study of compatibility between plant fibres and matrices
to be explored allowing optimisation of fibre/matrix systems. Finally, further research should
be performed on natural fibres to extend the database and validate the preliminary findings
presented in the thesis. In particular, the relevance of acid/base properties and the dependence
of surface energy values on the solvents used.
• Compounding
Several areas still need to be addressed to optimise the extrusion process en route to industrial
processing volumes. The next objective is to reduce porosity in the final product. It is also
advisable to include in the formulation a fire retardant, a UV-stabiliser and other additives that
would be necessarily added in commercial formulations such as impact modifiers etc. These
components may change the rheological behaviour of the melt and therefore it is necessary to
integrate them to the formulation as early as possible in the development phase.
Compound characterisation with Micro CT is a promising technique to investigate the fibre
distribution, the fibre orientation and the fibre dispersion in extruded products. Quantification
of these parameters and estimation of the total porosity constitute the next challenges for Micro
CT technology. These involve the development of image numerical processing tools combined
with volume rendering. Finally, evaluation of the long term performances is sine qua non of
the feasibility study. These include durability and biodegradability as well as fire resistance. A
series of design of experiments that integrate all the novelties aforementioned is the next step
towards a real business case.
178
Bibliography
H. Akil, M. Omar, A. Mazuki, S. Safiee, Z. Ishak, and A. A. Bakar. Kenaf fiber reinforced
composites: a review. Materials & Design, 32(8):4107–4121, 2011.
D. E. Akin. Linen most useful: perspectives on structure, chemistry, and enzymes for retting
flax. ISRN biotechnology, 2012.
D. E. Akin, L. L. Rigsby, and W. Perkins. Quality properties of flax fibers retted with enzymes.
Textile research journal, 69(10):747–753, 1999.
D. E. Akin, J. A. Foulk, R. B. Dodd, and D. D. McAlister. Enzyme-retting of flax and charac-
terization of processed fibers. Journal of Biotechnology, 89(2):193–203, 2001.
M. Alcock, L. Van Loon, C. Karunakaran, S. Huo, S. Potter, and C. Ulven. High resolution char-
acterisation of biofibre/resin interface bonds of thermoset composites through synchrotron
illumination. ECCM15, 15th European Conference on Composite Materials, Italy, 24-28 June
2012, 2012.
A. Alemdar, H. Zhang, M. Sain, G. Cescutti, and J. Mussig. Determination of fiber size
distributions of injection moulded polypropylene/natural fibers using x-ray microtomography.
Advanced Engineering Materials, 10(1-2):126–130, 2008.
V. A. Alvarez and A. Vazquez. Influence of fiber chemical modification procedure on the
mechanical properties and water absorption of materbi-y/sisal fiber composites. Composites
Part A: Applied Science and Manufacturing, 37(10):1672–1680, 2006.
J. Anderson. Mechanical performance of thermoplastic matrix natural-fibre composites. Prop-
erties and Performance of Natural-Fibre Composites, page 402, 2008.
179
Bibliography
M. Andresen, L.-S. Johansson, B. S. Tanem, and P. Stenius. Properties and characterization
of hydrophobized microfibrillated cellulose. Cellulose, 13(6):665–677, 2006. ISSN 0969-0239.
A. Arbelaiz, B. Fernandez, J. Ramos, A. Retegi, R. Llano-Ponte, and I. Mondragon. Mechanical
properties of short flax fibre bundle/polypropylene composites: Influence of matrix/fibre
modification, fibre content, water uptake and recycling. Composites Science and Technology,
65(10):1582–1592, 2005.
M. A. Arsene, K. Bilba, H. Savastano Junior, and K. Ghavami. Treatments of non-wood plant
fibres used as reinforcement in composite materials. Materials Research, 16:903–923, 2013.
ISSN 1516-1439.
K. Artyushkova. Art or black magic of curvefitting xps spectra. 2010.
S. Asahina, T. Togashi, O. Terasaki, S. Takami, T. Adschiri, M. Shibata, and N. Erdman.
High-resolution low-voltage scanning electron microscope study of nanostructured materials.
Microsc. Analysis, 26:S12–14, 2012.
A. Ashori. Wood-plastic composites as promising green-composites for automotive industries!
Bioresource Technology, 99(11):4661 – 4667, 2008. ISSN 0960-8524. Exploring Horizons in
Biotechnology: A Global Venture.
A. Ashori, M. Ornelas, S. Sheshmani, and N. Cordeiro. Influence of mild alkaline treatment on
the cellulosic surfaces active sites. Carbohydrate Polymers, 88(4):1293–1298, 2012.
A. Askin and C. Bilgic. Thermodynamics of adsorption of hydrocarbons on molecular sieves
nay and cay by inverse gas chromatography. Chemical Engineering Journal, 112(1):159–165,
2005. ISSN 1385-8947.
B. G. Ayre, K. Stevens, K. D. Chapman, C. L. Webber, K. L. Dagnon, and N. A. D’Souza.
Viscoelastic properties of kenaf bast fiber in relation to stem age. Textile research journal,
79(11):973–980, 2009.
C. Baillie. Green Composites - Polymer Composites and the Environment. Woodhead Publish-
ing, 2004. ISBN 978-1-85573-739-6.
180
Bibliography
C. Baley. Analysis of the flax fibres tensile behaviour and analysis of the tensile stiffness
increase. Composites Part A: Applied Science and Manufacturing, 33(7):939 – 948, 2002.
ISSN 1359-835X.
C. Baley, F. Busnel, Y. Grohens, and O. Sire. Influence of chemical treatments on surface
properties and adhesion of flax fibre–polyester resin. Composites Part A: Applied Science
and Manufacturing, 37(10):1626–1637, 2006.
G. Beamson and D. Briggs. High resolution XPS of organic polymers: the Scienta ESCA300
database, 1992. 1992.
J. Beaugrand and F. Berzin. Lignocellulosic fiber reinforced composites: Influence of com-
pounding conditions on defibrization and mechanical properties. Journal of Applied Polymer
Science, 128(2):1227–1238, 2013.
R. A. Beebe, J. B. Beckwith, and J. M. Honig. The determination of small surface areas by
krypton adsorption at low temperatures. Journal of the American Chemical Society, 67(9):
1554–1558, 1945.
M. Belgacem, G. Czeremuszkin, S. Sapieha, and A. Gandini. Surface characterization of cellu-
lose fibres by xps and inverse gas chromatography. Cellulose, 2(3):145–157, 1995.
M. N. Belgacem and A. Gandini. Inverse gas chromatography as a tool to characterize dispersive
and acid-base properties of the surface of fibers and powders. Surfactant science series, pages
41–124, 1999.
M. Bengtsson, M. Le Baillif, and K. Oksman. Extrusion and mechanical properties of highly
filled cellulose fibre–polypropylene composites. Composites Part A: Applied Science and
Manufacturing, 38(8):1922–1931, 2007.
A. Bismarck, A. K. Mohanty, I. Aranberri-Askargorta, S. Czapla, M. Misra, G. Hinrichsen,
and J. Springer. Surface characterization of natural fibers; surface properties and the water
up-take behavior of modified sisal and coir fibers. Green chemistry, 3(2):100–107, 2001.
A. Bismarck, I. Aranberri-Askargorta, J. Springer, T. Lampke, B. Wielage, A. Stamboulis,
I. Shenderovich, and H.-H. Limbach. Surface characterization of flax, hemp and cellulose
181
Bibliography
fibers; surface properties and the water uptake behavior. Polymer Composites, 23(5):872–
894, 2002. ISSN 1548-0569.
A. Bismarck, S. Mishra, and T. Lampke. Plant fibers as reinforcement for green composites,
natural fibers, biopolymers and biocomposites, 2005.
A. Bledzki and J. Gassan. Composites reinforced with cellulose based fibres. Progress in polymer
science, 24(2):221–274, 1999.
A. Bledzki, S. Reihmane, and J. Gassan. Properties and modification methods for vegetable
fibers for natural fiber composites. Journal of Applied Polymer Science, 59(8):1329–1336,
1996.
A. Bledzki, H.-P. Fink, and K. Specht. Unidirectional hemp and flax ep-and pp-composites:
Influence of defined fiber treatments. Journal of Applied Polymer Science, 93(5):2150–2156,
2004.
A. K. Bledzki, M. Letman, A. Viksne, and L. Rence. A comparison of compounding processes
and wood type for wood fibre-pp composites. Composites Part A: Applied Science and
Manufacturing, 36(6):789–797, 2005. ISSN 1359-835X.
D. H. Blount. Catalytic reaction of silicoformic acid, silicic acid and lignin, Sept. 27 1977. US
Patent 4,051,115.
W. Bowyer and M. Bader. On the re-inforcement of thermoplastics by imperfectly aligned
discontinuous fibres. Journal of Materials Science, 7(11):1315–1321, 1972.
E. Brendle and E. Papirer. A new topological index for molecular probes used in inverse gas
chromatography for the surface nanorugosity evaluation. Journal of colloid and interface
science, 194(1):207–216, 1997.
D. Briggs and G. Beamson. Primary and secondary oxygen-induced c1s binding energy shifts in
x-ray photoelectron spectroscopy of polymers. Analytical chemistry, 64(15):1729–1736, 1992.
D. J. Brookman and D. T. Sawyer. Specific interactions affecting gas chromatographic retention
for modified alumina columns. Analytical Chemistry, 40(1):106–110, 1968.
182
Bibliography
O. S. Carneiro, J. A. Covas, and B. Vergnes. Experimental and theoretical study of twin-screw
extrusion of polypropylene. Journal of applied polymer science, 78(7):1419–1430, 2000.
N. C. Carpita and D. M. Gibeaut. Structural models of primary cell walls in flowering plants:
consistency of molecular structure with the physical properties of the walls during growth.
The Plant Journal, 3(1):1–30, 1993.
F. S. Chakar and A. J. Ragauskas. Review of current and future softwood kraft lignin process
chemistry. Industrial Crops and Products, 20(2):131–141, 2004.
K. Charlet, C. Baley, C. Morvan, J. Jernot, M. Gomina, and J. Breard. Characteristics of
hermes flax fibres as a function of their location in the stem and properties of the derived
unidirectional composites. Composites Part A: Applied Science and Manufacturing, 38(8):
1912 – 1921, 2007. ISSN 1359-835X.
B. Charmas and R. Leboda. Effect of surface heterogeneity on adsorption on solid surfaces:
Application of inverse gas chromatography in the studies of energetic heterogeneity of adsor-
bents. Journal of Chromatography A, 886:133–152, 2000. ISSN 0021-9673.
V. S. Chevali and C. A. Ulven. Effect of extrusion screw speed on biocomposite thermo-
mechanical properties. International Journal of Sustainable Engineering, 5(1):38–46, 2012.
G. Chinga-Carrasco, O. Solheim, M. Lenes, and A. Larsen. A method for estimating the fibre
length in fibre-pla composites. Journal of microscopy, 250(1):15–20, 2013.
D. Clark, D. Adams, A. Dilks, J. Peeling, and H. Thomas. Some aspects of shake-up phenomena
in some simple polymer systems. Journal of Electron Spectroscopy and Related Phenomena,
8(1):51–60, 1976. ISSN 0368-2048.
G. Collins. A surface tension method for measuring the perimeters of fibres and the contact
angle of liquids against fibres. Journal of the Textile Institute Transactions, 38(2):T73–T77,
1947.
N. Cordeiro, C. Gouveia, and M. J. John. Investigation of surface properties of physico-
chemically modified natural fibres using inverse gas chromatography. Industrial Crops &
Products, 33(1):108–115, 2011a. ISSN 0926-6690.
183
Bibliography
N. Cordeiro, C. Gouveia, A. Moraes, and S. Amico. Natural fibers characterization by inverse
gas chromatography. Carbohydrate Polymers, 84(1):110 – 117, 2011b. ISSN 0144-8617.
N. Cordeiro, M. Ornelas, A. Ashori, S. Sheshmani, and H. Norouzi. Investigation on the
surface properties of chemically modified natural fibers using inverse gas chromatography.
Carbohydrate Polymers, 87(4):2367–2375, 2012. ISSN 0144-8617.
D. J. Cosgrove. Assembly and enlargement of the primary cell wall in plants. Annual review of
cell and developmental biology, 13(1):171–201, 1997.
H. Cox. The elasticity and strength of paper and other fibrous materials. British journal of
applied physics, 3(3):72, 1952.
E. Csiszar, E. Fekete, A. Toth, . Bandi, B. Koczka, and I. Sajo. Effect of particle size on the
surface properties and morphology of ground flax. Carbohydrate Polymers, 94(2):927–933,
2013.
C. C. Curtis N. Chemicals and Soils. 1998.
M. Danks. Pelletising natural fibres for optimisation of a biocomposite extrusion process.
Bachelor of Engineering thesis, The University of Queensland, 2014.
N. N. Das, S. C. Das, A. K. Sarkar, and A. K. Mukherjee. Lignin-xylan ester linkage in mesta
fiber (hibiscus cannabinus). Carbohydrate research, 129:197–207, 1984.
A. Day, K. Ruel, G. Neutelings, D. Cronier, H. David, S. Hawkins, and B. Chabbert. Lignifi-
cation in the flax stem: evidence for an unusual lignin in bast fibers. Planta, 222(2):234–245,
2005.
N. Defoirdt, S. Biswas, L. De Vriese, J. Van Acker, Q. Ahsan, L. Gorbatikh, A. Van Vuure,
I. Verpoest, et al. Assessment of the tensile properties of coir, bamboo and jute fibre. Com-
posites Part A: applied science and manufacturing, 41(5):588–595, 2010.
C. Della Volpe and S. Siboni. Some reflections on acid–base solid surface free energy theories.
Journal of Colloid and Interface Science, 195(1):121–136, 1997.
184
Bibliography
D. B. Dittenber and H. V. GangaRao. Critical review of recent publications on use of natural
composites in infrastructure. Composites Part A: Applied Science and Manufacturing, 43(8):
1419–1429, 2012.
G. Dolan. Bio-tribology of plant cell walls. Confirmation Report, School of Chemical Engineer-
ing, UQ, March 2014.
A. M. Donald. The use of environmental scanning electron microscopy for imaging wet and
insulating materials. Nature materials, 2(8):511–516, 2003.
S. Dong, M. Brendle, and J. Donnet. Study of solid surface polarity by inverse gas chromatog-
raphy at infinite dilution. Chromatographia, 28(9-10):469–472, 1989.
J. Donnet, S. Park, and H. Balard. Evaluation of specific interactions of solid surfaces by inverse
gas chromatography. Chromatographia, 31(9-10):434–440, 1991.
J.-B. Donnet, R.-Y. Qin, and M.-J. Wang. A new approach for estimating the molecular areas
of linear hydrocarbons and their derivatives. Journal of colloid and interface science, 153(2):
572–577, 1992.
G. Dorris and D. Gray. surface analysis of paper and wood fibres by esca. ii. surface composition
of mechanical pulps. Cellulose chemistry and technology, 1978a.
G. M. Dorris and D. G. Gray. The surface analysis of paper and wood fibers by esca-electron
spectroscopy for chemical analysis-i. applications to cellulose and lignin. Cellulose Chemistry
and Technology, 12:9–23, 1978b.
G. M. Dorris and D. G. Gray. Adsorption, spreading pressure, and london force interactions of
hydrocarbons on cellulose and wood fiber surfaces. Journal of Colloid and Interface Science,
71(1):93–106, 1979. ISSN 0021-9797.
G. M. Dorris and D. G. Gray. Adsorption of n-alkanes at zero surface coverage on cellulose
paper and wood fibers. Journal of Colloid and Interface Science, 77(2):353–362, 1980.
J. Dove, G. Buckton, and C. Doherty. A comparison of two contact angle measurement methods
and inverse gas chromatography to assess the surface energies of theophylline and caffeine.
International journal of pharmaceutics, 138(2):199–206, 1996.
185
Bibliography
D. Dupeyre, M. Vignon, et al. Fibres from semi-retted hemp bundles by steam explosion
treatment. Biomass and Bioenergy, 14(3):251–260, 1998.
A. Duval, A. Bourmaud, L. Augier, and C. Baley. Influence of the sampling area of the stem
on the mechanical properties of hemp fibers. Materials letters, 65(4):797–800, 2011.
A. M. Edeerozey, H. M. Akil, A. Azhar, and M. Z. Ariffin. Chemical modification of kenaf
fibers. Materials Letters, 61(10):2023–2025, 2007.
A. Espert, F. Vilaplana, and S. Karlsson. Comparison of water absorption in natural cellulosic
fibres from wood and one-year crops in polypropylene composites and its influence on their
mechanical properties. Composites Part A: Applied science and manufacturing, 35(11):1267–
1276, 2004.
A. Etaati, S. Pather, Z. Fang, and H. Wang. The study of fibre/matrix bond strength in
short hemp polypropylene composites from dynamic mechanical analysis. Composites Part
B: Engineering, 62:19–28, 2014.
A. V. J. C. Eva Dıaz, Salvador Ordonez. Adsorption characterisation of different volatile organic
compounds over alumina, zeolites and activated carbon using inverse gas chromatography.
Journal of chromatography A, 1049(1):139–146, 2004.
O. Faruk, A. K. Bledzki, H.-P. Fink, and M. Sain. Biocomposites reinforced with natural fibers:
2000–2010. Progress in Polymer Science, 37(11):1552–1596, 2012.
J. M. Felix and P. Gatenholm. The nature of adhesion in composites of modified cellulose fibers
and polypropylene. Journal of Applied Polymer Science, 42(3):609–620, 1991.
M. E. A. Fidelis, T. V. C. Pereira, O. d. F. M. Gomes, F. de Andrade Silva, and R. D.
Toledo Filho. The effect of fiber morphology on the tensile strength of natural fibers. Journal
of Materials Research and Technology, 2(2):149–157, 2013.
F. M. Fowkes. Attractive forces at interfaces. Industrial & Engineering Chemistry, 56(12):
40–52, 1964.
186

Bibliography
P. M. Froass, A. J. Ragauskas, and J. E. Jiang. Nmr studies part 3: Analysis of lignins
from modern kraft pulping technologies. Holzforschung-International Journal of the Biology,
Chemistry, Physics and Technology of Wood, 52(4):385–390, 1998.
J. Fromm, B. Rockel, S. Lautner, E. Windeisen, and G. Wanner. Lignin distribution in wood
cell walls determined by tem and backscattered sem techniques. Journal of structural biology,
143(1):77–84, 2003.
S.-Y. Fu, B. Lauke, E. Mader, C.-Y. Yue, and X. Hu. Tensile properties of short-glass-fiber-and
short-carbon-fiber-reinforced polypropylene composites. Composites Part A: Applied Science
and Manufacturing, 31(10):1117–1125, 2000.
J. A. F. Gamelas. The surface properties of cellulose and lignocellulosic materials assessed by
inverse gas chromatography: a review. Cellulose, 20(6):2675–2693, 2013. ISSN 0969-0239.
G. Gamon, P. Evon, and L. Rigal. Twin-screw extrusion impact on natural fibre morphology
and material properties in poly (lactic acid) based biocomposites. Industrial Crops and
Products, 46:173–185, 2013.
J. Gassan and A. K. Bledzki. Alkali treatment of jute fibers: Relationship between structure
and mechanical properties. Journal of Applied Polymer Science, 71(4):623–629, 1999a. ISSN
1097-4628.
J. Gassan and A. K. Bledzki. Possibilities for improving the mechanical properties of jute/epoxy
composites by alkali treatment of fibres. Composites Science and Technology, 59(9):1303–
1309, 1999b.
F. Gellerstedt and P. Gatenholm. Surface properties of lignocellulosic fibers bearing carboxylic
groups. Cellulose, 6(2):103–121, 1999. ISSN 0969-0239.
J. George, M. Sreekala, and S. Thomas. A review on interface modification and characterization
of natural fiber reinforced plastic composites. Polymer Engineering & Science, 41(9):1471–
1485, 2001.
H. F. Giles Jr, E. M. Mount III, and J. R. Wagner Jr. Extrusion: the definitive processing guide
and handbook. William Andrew, 2004.
187
Bibliography
K. Goda, M. Sreekala, A. Gomes, T. Kaji, and J. Ohgi. Improvement of plant based natural
fibers for toughening green composites-effect of load application during mercerization of ramie
fibers. Composites Part A: Applied Science and Manufacturing, 37(12):2213 – 2220, 2006.
ISSN 1359-835X.
J. Goldstein, D. E. Newbury, P. Echlin, D. C. Joy, A. D. Romig Jr, C. E. Lyman, C. Fiori,
and E. Lifshin. Scanning electron microscopy and X-ray microanalysis: a text for biologists,
materials scientists, and geologists. Springer Science & Business Media, 2012.
T. Gorshkova, V. Salnikov, N. Pogodina, S. Chemikosova, E. Yablokova, A. Ulanov, M. Ageeva,
J. Van Dam, and V. Lozovaya. Composition and distribution of cell wall phenolic compounds
in flax (linum usitatissimum l.) stem tissues. Annals of Botany, 85(4):477–486, 2000.
A. H. Grigoriou and G. A. Ntalos. The potential use of ricinus communis l.(castor) stalks as
a lignocellulosic resource for particleboards. Industrial crops and products, 13(3):209–218,
2001.
G. Guhados, W. Wan, and J. L. Hutter. Measurement of the elastic modulus of single bacterial
cellulose fibers using atomic force microscopy. Langmuir, 21(14):6642–6646, 2005.
D. Gulati and M. Sain. Surface characteristics of untreated and modified hemp fibers. Polymer
Engineering & Science, 46(3):269–273, 2006.
J. Gustafsson, L. Ciovica, and J. Peltonen. The ultrastructure of spruce kraft pulps studied by
atomic force microscopy (afm) and x-ray photoelectron spectroscopy (xps). Polymer, 44(3):
661–670, 2003. ISSN 0032-3861.
A. Gutierrez Suarez, G. Marques, J. Rencoret, and J. C. d. Rıo Andrade. Evaluation of the
chemical composition of different non-woody plant fibers used for pulp and paper manufac-
turing. The Open Agriculture Journal, 101:93–101, 2010.
T. Hanninen, A. Thygesen, S. Mehmood, B. Madsen, and M. Hughes. Mechanical processing
of bast fibres: The occurrence of damage and its effect on fibre structure. Industrial Crops
and Products, 39:7–11, 2012.
188
Bibliography
J. He, Y. Tang, and S. Wang. Differences in morphological characteristics of bamboo fibres and
other natural cellulose fibres: Studies on x-ray diffraction, solid state13c-cp/mas nmr, and
second derivative ftir spectroscopy data. Iranian Polymer Journal, 16(12):807, 2007.
J. Y. Y. Heng, D. F. Pearse, F. Thielmann, T. Lampke, and A. Bismarck. Methods to determine
surface energies of natural fibres: A review. Composite Interfaces, 14(7-9):581–604, 2007.
P. Herrera-Franco and A. Valadez-Gonzalez. A study of the mechanical properties of short
natural-fiber reinforced composites. Composites Part B: Engineering, 36(8):597–608, 2005.
J. Holbery and D. Houston. Natural-fiber-reinforced polymer composites in automotive appli-
cations. JOM, 58(11):80–86, 2006. ISSN 1047-4838.
M. Huda, L. Drzal, D. Ray, A. Mohanty, and M. Misra. Natural-fibre composites in the
automotive sector. Properties and performance of natural-fibre composites, pages 256–261,
2008.
M. Iguchi, S. Yamanaka, and A. Budhiono. Bacterial cellulose - a masterpiece of nature’s arts.
Journal of Materials Science, 35(2):261–270, 2000.
P. N. Jacob and J. C. Berg. Acid-base surface energy characterization of microcrystalline
cellulose and two wood pulp fiber types using inverse gas chromatography. Langmuir, 10(9):
3086–3093, 1994.
L.-S. Johansson. Monitoring fibre surfaces with xps in papermaking processes. Microchimica
Acta, 138(3-4):217–223, 2002.
L.-S. Johansson and J. Campbell. Reproducible xps on biopolymers: cellulose studies. Surface
and interface analysis, 36(8):1018–1022, 2004.
L.-S. Johansson, J. Campbell, K. Koljonen, and P. Stenius. Evaluation of surface lignin on
cellulose fibers with xps. Applied Surface Science, 144:92–95, 1999.
L.-S. Johansson, J. Campbell, K. Koljonen, M. Kleen, and J. Buchert. On surface distributions
in natural cellulosic fibres. Surface and interface analysis, 36(8):706–710, 2004. ISSN 1096-
9918.
189
Bibliography
M. J. John and R. D. Anandjiwala. Recent developments in chemical modification and charac-
terization of natural fiber-reinforced composites. Polymer composites, 29(2):187, 2008.
D. C. Joy and C. S. Joy. Study of the dependence of e2 energies on sample chemistry. Microscopy
and Microanalysis, 4(05):475–480, 1998.
D. P. Kamdem, H. Jiang, W. Cui, J. Freed, and L. M. Matuana. Properties of wood plastic
composites made of recycled hdpe and wood flour from cca-treated wood removed from
service. Composites Part A: Applied Science and Manufacturing, 35(3):347–355, 2004.
R. Karnani, M. Krishnan, and R. Narayan. Biofiber-reinforced polypropylene composites. Poly-
mer Engineering & Science, 37(2):476–483, 1997.
M. Karus and M. Kaup. Natural fibres in the european automotive industry. Journal of
Industrial Hemp, 7(1):119–131, 2002.
T. Keener, R. Stuart, and T. Brown. Maleated coupling agents for natural fibre composites.
Composites part A: applied science and manufacturing, 35(3):357–362, 2004.
A. Keller. Compounding and mechanical properties of biodegradable hemp fibre composites.
Composites Science and Technology, 63(9):1307–1316, 2003.
A. Kelly and a. W. Tyson. Tensile properties of fibre-reinforced metals: copper/tungsten and
copper/molybdenum. Journal of the Mechanics and Physics of Solids, 13(6):329–350, 1965.
H. A. Khalil, M. Tehrani, Y. Davoudpour, A. H. Bhat, M. Jawaid, and A. Hassan. Natural
fiber reinforced poly (vinyl chloride) composites: A review. Journal of Reinforced Plastics
and Composites, 32(5):330–356, 2013.
K. Koljonen, M. Osterberg, L.-S. Johansson, and P. Stenius. Surface chemistry and morphol-
ogy of different mechanical pulps determined by esca and afm. Colloids and Surfaces A:
Physicochemical and Engineering Aspects, 228(1):143–158, 2003.
A. Kondor, D. Williams, and D. Burnett. Determination of acid-base component of the surface
energy by inverse gas chromatography. iGC SEA Application Note 227, Surface Measurement
Systems, 2014.
190
Bibliography
L. Kroon-Batenburg and J. Kroon. The crystal and molecular structures of cellulose i and ii.
Glycoconjugate journal, 14(5):677–690, 1997.
J. Laine, P. Stenius, G. Carlsson, and G. Strom. Surface characterization of unbleached kraft
pulps by means of esca. Cellulose, 1(2):145–160, 1994. ISSN 0969-0239.
H. Lau, S. Bhattacharya, and G. Field. Melt strength of polypropylene: Its relevance to
thermoforming. Polymer Engineering and Science, 38(11):1915, 1998.
A. Le Duigou, A. Bourmaud, E. Balnois, P. Davies, and C. Baley. Improving the interfacial
properties between flax fibres and plla by a water fibre treatment and drying cycle. Industrial
Crops and Products, 39:31–39, 2012.
M. Le Troedec, A. Rachini, C. Peyratout, S. Rossignol, E. Max, O. Kaftan, A. Fery, and
A. Smith. Influence of chemical treatments on adhesion properties of hemp fibres. Journal
of colloid and interface science, 356(1):303–310, 2011.
H. L. Lee and P. Luner. Analysis of the adsorption of alkanes on high surface area cellulose
by inverse gas chromatography. Journal of Wood Chemistry and Technology, 13(1):127–144,
1993. ISSN 0277-3813.
A. Lefeuvre, A. L. Duigou, A. Bourmaud, A. Kervoelen, C. Morvan, and C. Baley. Analysis
of the role of the main constitutive polysaccharides in the flax fibre mechanical behaviour.
Industrial Crops and Products, 76:1039 – 1048, 2015. ISSN 0926-6690.
A. Legras, R. W. Truss, C. Chaleat, and M. T. Heitzmann. A practical toolbox to overcome
the multiple challenges of biocomposites extrusion. In Composites Australia and CRC-ACS
Conference 2015, a.
A. Legras, R. W. Truss, S. Rao, D. Bhattacharyya, N. Soatthiyanon, A. Crosky, and M. T.
Heitzmann. Optimisation of the twin-screw compounding process for short fibre bio-
composites. In Composites Australia and CRC-ACS Conference 2014, b.
Y. Lei, Q. Wu, F. Yao, and Y. Xu. Preparation and properties of recycled hdpe/natural fiber
composites. Composites Part A: applied science and manufacturing, 38(7):1664–1674, 2007.
191
Bibliography
X. Li, L. G. Tabil, and S. Panigrahi. Chemical treatments of natural fiber for use in natural
fiber-reinforced composites: a review. Journal of Polymers and the Environment, 15(1):
25–33, 2007.
J. Liu. High-resolution and low-voltage fe-sem imaging and microanalysis in materials charac-
terization. Materials characterization, 44(4):353–363, 2000.
W. Liu, A. K. Mohanty, P. Askeland, L. T. Drzal, and M. Misra. Influence of fiber surface
treatment on properties of indian grass fiber reinforced soy protein based biocomposites.
Polymer, 45(22):7589–7596, 2004.
H. Livingston. The cross-sectional areas of molecules adsorbed on solid surfaces. Journal of
colloid science, 4(5):447–458, 1949.
J. Lu, P. Askeland, and L. T. Drzal. Surface modification of microfibrillated cellulose for epoxy
composite applications. Polymer, 49(5):1285–1296, 2008.
B. Mano, J. Araujo, M. Spinace, and M.-A. De Paoli. Polyolefin composites with curaua
fibres: effect of the processing conditions on mechanical properties, morphology and fibres
dimensions. Composites Science and Technology, 70(1):29–35, 2010.
S. D. Mansfield, H. Kim, F. Lu, and J. Ralph. Whole plant cell wall characterization using
solution-state 2d nmr. Nature protocols, 7(9):1579–1589, 2012.
G. Marsh. Next step for automotive materials. Materials Today, 6(4):36 – 43, 2003. ISSN
1369-7021.
A. T. Martınez, J. Rencoret, G. Marques, A. Gutierrez, D. Ibarra, J. Jimenez-Barbero, and
C. Jose. Monolignol acylation and lignin structure in some nonwoody plants: a 2d nmr study.
Phytochemistry, 69(16):2831–2843, 2008.
M. Martins, L. Forato, L. Mattoso, and L. Colnago. A solid state 13 c high resolution nmr
study of raw and chemically treated sisal fibers. Carbohydrate polymers, 64(1):127–133, 2006.
N. McIntyre, S. Sunder, D. Shoesmith, and F. Stanchell. Chemical information from
xps—applications to the analysis of electrode surfaces. Journal of Vacuum Science & Tech-
nology, 18(3):714–721, 1981.
192
Bibliography
V. Mediavilla, M. Leupin, and A. Keller. Influence of the growth stage of industrial hemp on
the yield formation in relation to certain fibre quality traits. Industrial Crops and Products,
13(1):49–56, 2001.
A. Miettinen, C. L. L. Hendriks, G. Chinga-Carrasco, E. K. Gamstedt, and M. Kataja. A
non-destructive x-ray microtomography approach for measuring fibre length in short-fibre
composites. Composites Science and Technology, 72(15):1901–1908, 2012.
D. Mikkelsen and M. Gidley. Formation of cellulose-based composites with hemicelluloses and
pectins using gluconacetobacter fermentation. In Z. A. Popper, editor, The Plant Cell Wall,
volume 715 of Methods in Molecular Biology, pages 197–208. Humana Press, 2011.
R. H. Mills. Development of a Ligno-Cellulosic Polymeric and Reinforced Sheet Molding Com-
pound (SMC). PhD thesis, The University of Maine, 2009.
R. H. Mills, D. J. Gardner, and R. Wimmer. Inverse gas chromatography for determining the
dispersive surface free energy and acid–base interactions of sheet molding compound—part ii
14 ligno-cellulosic fiber types for possible composite reinforcement. Journal of applied polymer
science, 110(6):3880–3888, 2008.
S. Mohammadi-Jam and K. E. Waters. Inverse gas chromatography applications: A review.
Advances in Colloid and Interface Science, 212(0):21–44, 2014. ISSN 0001-8686.
A. Mohanty, M. Misra, and L. Drzal. Surface modifications of natural fibers and performance
of the resulting biocomposites: an overview. Composite Interfaces, 8(5):313–343, 2001.
A. K. Mohanty, M. Misra, and L. T. Drzal. Natural fibers, biopolymers, and biocomposites.
CRC Press, 2005.
S. Mohanty, S. Nayak, S. Verma, and S. Tripathy. Effect of mapp as a coupling agent on
the performance of jute–pp composites. Journal of reinforced plastics and composites, 23(6):
625–637, 2004.
S. Mohanty, S. K. Verma, and S. K. Nayak. Dynamic mechanical and thermal properties of
mape treated jute/hdpe composites. Composites Science and Technology, 66(3):538–547,
2006.
193
Bibliography
J. I. Moran, V. A. Alvarez, V. P. Cyras, and A. Vazquez. Extraction of cellulose and preparation
of nanocellulose from sisal fibers. Cellulose, 15(1):149–159, 2008.
D. J. Morgan. X-ray photoelectron spectroscopy (xps): An introduction. Cardiff Catalysis
Institue, 2014.
M. J. Morrison and A. G. Andre. Processing apparatus and methods, Jan. 14 2005. US Patent
App. 10/586,194.
C. Morvan, C. Andeme-Onzighi, R. Girault, D. S. Himmelsbach, A. Driouich, and D. E. Akin.
Building flax fibres: more than one brick in the walls. Plant physiology and biochemistry, 41
(11):935–944, 2003.
A. Mukherjee, P. K. Ganguly, and D. Sur. Structural mechanics of jute: The effects of hemi-
cellulose or lignin removal. The Journal of The Textile Institute, 84(3):348–353, 1993.
P. Mukherjee and K. Satyanarayana. Structure and properties of some vegetable fibres. Journal
of materials science, 21(1):51–56, 1986.
P. Mukhopadhyay and H. Schreiber. Aspects of acid-base interactions and use of inverse gas
chromatography. Colloids and Surfaces A: Physicochemical and Engineering Aspects, 100:47
– 71, 1995. ISSN 0927-7757.
R.-J. Muller. Biodegradability of polymers: Regulations and methods for testing. Biopolymers
Online, 2005.
J. Mussig and K. Haag. Naturfaser pellet produktion- vorstellung der teschnischen analyse.
Abschlussbericht, Hochschule Bremen, Juni 2012.
M. L. Nelson and R. T. O’Connor. Relation of certain infrared bands to cellulose crystallinity
and crystal lattice type. part ii. a new infrared ratio for estimation of crystallinity in celluloses
i and ii. Journal of Applied Polymer Science, 8(3):1325–1341, 1964a.
M. L. Nelson and R. T. O’Connor. Relation of certain infrared bands to cellulose crystallinity
and crystal latticed type. part i. spectra of lattice types i, ii, iii and of amorphous cellulose.
Journal of applied polymer science, 8(3):1311–1324, 1964b.
194
Bibliography
C. P. Neto, A. Seca, D. Fradinho, M. Coimbra, F. Domingues, D. Evtuguin, A. Silvestre, and
J. Cavaleiro. Chemical composition and structural features of the macromolecular compo-
nents of hibiscus cannabinus grown in portugal. Industrial Crops and Products, 5(3):189–196,
1996.
R. Newman and J. Hemmingson. Determination of the degree of cellulose crystallinity in wood
by carbon-13 nuclear magnetic resonance spectroscopy. Holzforschung-International Journal
of the Biology, Chemistry, Physics and Technology of Wood, 44(5):351–356, 1990.
S. Y. Oh, D. I. Yoo, Y. Shin, H. C. Kim, H. Y. Kim, Y. S. Chung, W. H. Park, and J. H.
Youk. Crystalline structure analysis of cellulose treated with sodium hydroxide and carbon
dioxide by means of x-ray diffraction and ftir spectroscopy. Carbohydrate Research, 340(15):
2376–2391, 2005a.
S. Y. Oh, D. I. Yoo, Y. Shin, and G. Seo. Ftir analysis of cellulose treated with sodium hydroxide
and carbon dioxide. Carbohydrate Research, 340(3):417–428, 2005b.
K. Oksman, M. Skrifvars, and J. F. Selin. Natural fibres as reinforcement in polylactic acid (pla)
composites. Composites Science and Technology, 63(9):1317–1324, 2003. ISSN 0266-3538.
OpTest. HiRes Fiber Quality Analyzer Brochure, 2010.
M. Ostenson, H. Jarund, G. Toriz, and P. Gatenholm. Determination of surface functional
groups in lignocellulosic materials by chemical derivatization and esca analysis. Cellulose, 13
(2):157–170, 2006. ISSN 0969-0239.
A. C. O’Sullivan. Cellulose: the structure slowly unravels. Cellulose, 4(3):173–207, 1997. ISSN
0969-0239.
U. Panzer and H. P. Schreiber. On the evaluation of surface interactions by inverse gas chro-
matography. Macromolecules, 25(14):3633–3637, 1992.
E. Papirer, E. Brendle, F. Ozil, and H. Balard. Comparison of the surface properties of graphite,
carbon black and fullerene samples, measured by inverse gas chromatography. Carbon, 37
(8):1265–1274, 1999.
195
Bibliography
M. T. Paridah, A. B. Basher, S. SaifulAzry, and Z. Ahmed. Retting process of some bast plant
fibres and its effect on fibre quality: A review. BioResources, 6(4):5260–5281, 2011.
S. Park, J. O. Baker, M. E. Himmel, P. A. Parilla, and D. K. Johnson. Research cellulose
crystallinity index: measurement techniques and their impact on interpreting cellulase per-
formance. Biotechnol Biofuels, 3(10), 2010.
C. Pavithran, P. Mukherjee, M. Brahmakumar, and A. Damodaran. Impact properties of
natural fibre composites. Journal of Materials Science Letters, 6(8):882–884, 1987. ISSN
0261-8028.
R. H. Perry, D. W. Green, and J. O. Maloney. Perry s chemical engineers handbook. McGraw
Hill, New York, 1997.
K. Pickering. Properties and performance of natural-fibre composites. Elsevier, 2008.
A. Pietak, S. Korte, E. Tan, A. Downard, and M. P. Staiger. Atomic force microscopy char-
acterization of the surface wettability of natural fibres. Applied Surface Science, 253(7):
3627–3635, 2007.
M. Pommet, J. Juntaro, J. Y. Heng, A. Mantalaris, A. F. Lee, K. Wilson, G. Kalinka, M. S.
Shaffer, and A. Bismarck. Surface modification of natural fibers using bacteria: depositing
bacterial cellulose onto natural fibers to create hierarchical fiber reinforced nanocomposites.
Biomacromolecules, 9(6):1643–1651, 2008.
M. Preisner, W. Wojtasik, A. Kulma, M. Zuk, and J. Szopa. Flax fiber. Kirk-Othmer Ency-
clopedia of Chemical Technology, 2014.
D. Puglia, A. Terenzi, S. E. Barbosa, and J. M. Kenny. Polypropylene-natural fibre composites.
analysis of fibre structure modification during compounding and its influence on the final
properties. Composite Interfaces, 15(2-3):111–129, 2008.
M. R. Rahman, M. Hasan, M. M. Huque, and M. N. Islam. Physico-mechanical properties of jute
fiber reinforced polypropylene composites. Journal of Reinforced Plastics and Composites,
29(3):445–455, 2010.
196
Bibliography
J. Ralph, R. D. Hatfield, F. Lu, J. H. Grabber, H. G. Jung, J. S. Han, and S. A. Ralph.
Kenaf’s amazing lignin. In Proceedings of the 8th International Symposium on Wood and
Pulping Chemistry, Helsinki. Finland, volume 2, page 125, 1995.
E. C. Ramires and E. Frollini. Tannin–phenolic resins: synthesis, characterization, and ap-
plication as matrix in biobased composites reinforced with sisal fibers. Composites Part B:
Engineering, 43(7):2851–2860, 2012.
A. Rana, A. Mandal, and S. Bandyopadhyay. Short jute fiber reinforced polypropylene com-
posites: effect of compatibiliser, impact modifier and fiber loading. Composites Science and
Technology, 63(6):801–806, 2003.
S. Rao and D. Bhattacharyya. Pre-extrusion compounding and analysis. Technical report,
CRC-ACS, TR13053, 2013.
R. Rasch, A. Stricher, and R. W. Truss. Energy filtered low voltage “in lens detector” sem and
xps of natural fiber surfaces. Journal of Applied Polymer Science, 131(9), 2014.
B. D. Ratner and D. G. Castner. Electron spectroscopy for chemical analysis. Surface Analysis-
The Principal Techniques, 2nd Edition, pages 47–112, 2009.
D. Ray, B. K. Sarkar, A. Rana, and N. R. Bose. The mechanical properties of vinylester
resin matrix composites reinforced with alkali-treated jute fibres. Composites Part A: applied
science and manufacturing, 32(1):119–127, 2001.
M. Z. Rong, M. Q. Zhang, Y. Liu, H. M. Yan, G. C. Yang, and H. M. Zeng. Interfacial interaction
in sisal/epoxy composites and its influence on impact performance. Polymer composites, 23
(2):182–192, 2002.
A. J. Rosenberg. Rapid, precise measurements of krypton adsorption and the surface area of
coarse particles. Journal of the American Chemical Society, 78(13):2929–2934, 1956.
W. Rudzinski and D. H. Everett. Adsorption of gases on heterogeneous surfaces. Academic
Press, 2012.
197
Bibliography
C. Saint Flour and E. Papirer. Gas-solid chromatography: a quick method of estimating surface
free energy variations induced by the treatment of short glass fibers. Journal of Colloid and
Interface Science, 91(1):69–75, 1983.
T. Sakai, T. Sakamoto, J. Hallaert, and E. J. Vandamme. Pectin, pectinase and protopectinase:
production, properties, and applications. Advances in applied microbiology, 39:213, 1993.
N. Sallih. Manufacturing and evaluation of kenaf/ polypropylene honeycombe cores. The
University of Auckland, Unpublished thesis, 2015.
P. A. Santos, M. A. Spinace, K. K. Fermoselli, and M.-A. De Paoli. Polyamide-6/vegetal fiber
composite prepared by extrusion and injection molding. Composites Part A: Applied Science
and Manufacturing, 38(12):2404–2411, 2007.
R. B. Santos, P. Hart, H. Jameel, and H.-m. Chang. Wood based lignin reactions important to
the biorefinery and pulp and paper industries. BioResources, 8(1):1456–1477, 2013.
K. Satyanarayana, J. Guimaraes, and F. Wypych. Studies on lignocellulosic fibers of brazil.
part i: Source, production, morphology, properties and applications. Composites Part A:
Applied Science and Manufacturing, 38(7):1694 – 1709, 2007. ISSN 1359-835X.
K. G. Satyanarayana, G. G. Arizaga, and F. Wypych. Biodegradable composites based on
lignocellulosic fibers—an overview. Progress in Polymer Science, 34(9):982–1021, 2009.
J. Schultz, L. Lavielle, and C. Martin. The role of the interface in carbon fibre-epoxy composites.
The Journal of Adhesion, 23(1):45–60, 1987.
A. M. Seca, J. A. Cavaleiro, F. M. Domingues, A. J. Silvestre, D. Evtuguin, and C. Pascoal Neto.
Structural characterization of the bark and core lignins from kenaf (hibiscus cannabinus).
Journal of Agricultural and Food Chemistry, 46(8):3100–3108, 1998.
D. Sedan, C. Pagnoux, T. Chotard, A. Smith, D. Lejolly, V. Gloaguen, and P. Krausz. Effect
of calcium rich and alkaline solutions on the chemical behaviour of hemp fibres. Journal of
Materials Science, 42(22):9336–9342, 2007.
198
Bibliography
L. Segal, J. Creely, A. Martin, and C. Conrad. An empirical method for estimating the degree
of crystallinity of native cellulose using the x-ray diffractometer. Textile Research Journal,
29(10):786–794, 1959.
N. Sgriccia, M. Hawley, and M. Misra. Characterization of natural fiber surfaces and natural
fiber composites. Composites Part A: Applied Science and Manufacturing, 39(10):1632–1637,
2008.
H. S. Sharma, T. W. Fraser, D. McCall, N. Shields, and G. Lyons. Fine structure of chemically
modified flax fibre. The Journal of The Textile Institute, 86(4):539–548, 1995.
H. Shen, S. Nutt, and D. Hull. Direct observation and measurement of fiber architecture
in short fiber-polymer composite foam through micro-ct imaging. Composites Science and
Technology, 64(13):2113–2120, 2004.
B. Siaotong, L. Tabil, S. Panigrahi, and W. Crerar. Extrusion compounding of flax-fiber-
reinforced polyethylene composites: Effects of fiber content and extrusion parameters. Jour-
nal of Natural Fibers, 7(4):289–306, 2010.
K. Sing. The use of nitrogen adsorption for the characterisation of porous materials. Colloids
and Surfaces A: Physicochemical and Engineering Aspects, 187:3–9, 2001.
L. Sobczak, R. W. Lang, and A. Haider. Polypropylene composites with natural fibers and
wood–general mechanical property profiles. Composites Science and Technology, 72(5):550–
557, 2012.
N. Sombatsompop and M. Panapoy. Effect of screw rotating speed on polymer melt temperature
profiles in twin screw extruder. Journal of materials science, 35(24):6131–6137, 2000.
M. Sreekala, M. Kumaran, S. Joseph, M. Jacob, and S. Thomas. Oil palm fibre reinforced
phenol formaldehyde composites: influence of fibre surface modifications on the mechanical
performance. Applied Composite Materials, 7(5-6):295–329, 2000.
P. Sriamornsak. Chemistry of pectin and its pharmaceutical uses: A review. Silpakorn Univer-
sity International Journal, 3(1-2):206–228, 2003.
199
Bibliography
S. Stock. X-ray microtomography of materials. International Materials Reviews, 44(4):141–164,
1999.
J. E. Stone and A. M. Scallan. Effect of component removal upon the porous structure of the
cell wall of wood. Journal of Polymer Science Part C: Polymer Symposia, 11(1):13–25, 1965.
ISSN 1935-3065.
A. Stricher. Natural fibres composites, chemical modification of fibres’ surface to improve fibre/
matrix interactions. Technical report, The University of Queensland, 2012.
T. Stuart, Q. Liu, M. Hughes, R. McCall, H. Sharma, and A. Norton. Structural biocom-
posites from flax—part i: Effect of bio-technical fibre modification on composite properties.
Composites Part A: Applied Science and Manufacturing, 37(3):393–404, 2006.
J. Summerscales, N. P. Dissanayake, A. S. Virk, and W. Hall. A review of bast fibres and
their composites. part 1–fibres as reinforcements. Composites Part A: Applied Science and
Manufacturing, 41(10):1329–1335, 2010.
Y. Tahery, N. Shukor, H. Abdul-Hamid, et al. Growth characteristics and biomass production
of kenaf. African Journal of Biotechnology, 10(63):13756–13761, 2013.
F. Thielmann. Introduction into the characterisation of porous materials by inverse gas chro-
matography. Journal of Chromatography A, 1037:115–123, 2004. ISSN 0021-9673.
J. Thomason and M. Vlug. Influence of fibre length and concentration on the properties of glass
fibre-reinforced polypropylene: 1. tensile and flexural modulus. Composites Part A: Applied
science and manufacturing, 27(6):477–484, 1996.
A. Thumm and A. R. Dickson. The influence of fibre length and damage on the mechanical
performance of polypropylene/wood pulp composites. Composites Part A: Applied Science
and Manufacturing, 46:45–52, 2013.
M. M. Thwe and K. Liao. Durability of bamboo-glass fiber reinforced polymer matrix hybrid
composites. Composites Science and Technology, 63(3):375–387, 2003.
R. W. Truss, B. Wood, and R. Rasch. Quantitative surface analysis of hemp fibers using xps,
conventional and low voltage in-lens sem. Journal of Applied Polymer Science, 2015.
200
Bibliography
J. Trygg and P. Fardim. Enhancement of cellulose dissolution in water-based solvent via
ethanol–hydrochloric acid pretreatment. Cellulose, 18(4):987–994, 2011.
V. Tserki, N. Zafeiropoulos, F. Simon, and C. Panayiotou. A study of the effect of acetylation
and propionylation surface treatments on natural fibres. Composites Part A: applied science
and manufacturing, 36(8):1110–1118, 2005.
M. A. Tshabalala. Determination of the acid-base characteristics of lignocellulosic surfaces by
inverse gas chromatography. Journal of applied polymer science, 65(5):1013–1020, 1997.
W. T. Y. Tze, M. E. P. Walinder, and D. J. Gardner. Inverse gas chromatography for studying
interaction of materials used for cellulose fiber/polymer composites. Journal of Adhesion
Science and Technology, 20(8):743–743, 2006. ISSN 0169-4243.
S. Ugbolue. Structure/property relationships in textile fibres. Textile Progress, 20(4):1–43,
1990.
A. Valadez-Gonzalez, J. Cervantes-Uc, R. Olayo, and P. Herrera-Franco. Chemical modification
of henequen fibers with an organosilane coupling agent. Composites Part B: Engineering, 30
(3):321–331, 1999.
C. Van Oss, R. Good, and M. Chaudhury. Additive and nonadditive surface tension components
and the interpretation of contact angles. Langmuir, 4(4):884–891, 1988.
T. Villmow, B. Kretzschmar, and P. Potschke. Influence of screw configuration, residence time,
and specific mechanical energy in twin-screw extrusion of polycaprolactone/multi-walled car-
bon nanotube composites. Composites Science and Technology, 70(14):2045–2055, 2010.
A. S. Virk, W. Hall, and J. Summerscales. Multiple data set (mds) weak-link scaling analysis of
jute fibres. Composites Part A: Applied Science and Manufacturing, 40(11):1764–1771, 2009.
A. S. Virk, W. Hall, and J. Summerscales. Failure strain as the key design criterion for fracture
of natural fibre composites. Composites Science and Technology, 70(6):995–999, 2010.
P. Wambua, J. Ivens, and I. Verpoest. Natural fibres: can they replace glass in fibre reinforced
plastics? Composites Science and Technology, 63(9):1259 – 1264, 2003. ISSN 0266-3538.
Eco-Composites.
201
Bibliography
W. Wang, Q. Hua, Y. Sha, D. Wu, S. Zheng, and B. Liu. Surface properties of solid materials
measured by modified inverse gas chromatography. Talanta, 112:69–72, 2013.
Y. Wang, F.-B. Chen, and K.-C. Wu. Twin-screw extrusion compounding of polypropy-
lene/organoclay nanocomposites modified by maleated polypropylenes. Journal of applied
polymer science, 93(1):100–112, 2004.
J. O. Warwicker and P. Hallam. 6-the effect of alkaline and acid swelling agents on the me-
chanical properties of cotton fibres. The Journal of The Textile Institute, 61(2):61–76, 1970.
D. Williams. Inverse gas chromatography. Characterisation of Composite Materials. London,
UK: Butterworth-Heinemann, pages 80–104, 1994.
D. Williams. Particle engineering in pharmaceutical solids processing: surface energy consider-
ations. Current pharmaceutical design, 21(19):2677–2694, 2015.
Y. Xie, C. A. Hill, Z. Xiao, H. Militz, and C. Mai. Silane coupling agents used for natural
fiber/polymer composites: A review. Composites Part A: Applied Science and Manufacturing,
41(7):806–819, 2010.
Y. Xu, Q. Wu, Y. Lei, F. Yao, and Q. Zhang. Natural fiber reinforced poly(vinyl chloride) com-
posites: Effect of fiber type and impact modifier. Journal of Polymers and the Environment,
16(4):250–257, 2008. ISSN 1566-2543.
H. Yang, R. Yan, H. Chen, D. H. Lee, and C. Zheng. Characteristics of hemicellulose, cellulose
and lignin pyrolysis. Fuel, 86(12):1781–1788, 2007.
P. P. Yla-Maihaniemi, J. Y. Y. Heng, F. Thielmann, and D. R. Williams. Inverse gas chro-
matographic method for measuring the dispersive surface energy distribution for particulates.
Langmuir : the ACS journal of surfaces and colloids, 24(17):9551–9557, 2008. ISSN 0743-
7463.
N. Zafeiropoulos, D. Williams, C. Baillie, and F. Matthews. Engineering and characterisation
of the interface in flax fibre/polypropylene composite materials. part i. development and
investigation of surface treatments. Composites part A: applied science and manufacturing,
33(8):1083–1093, 2002.
202
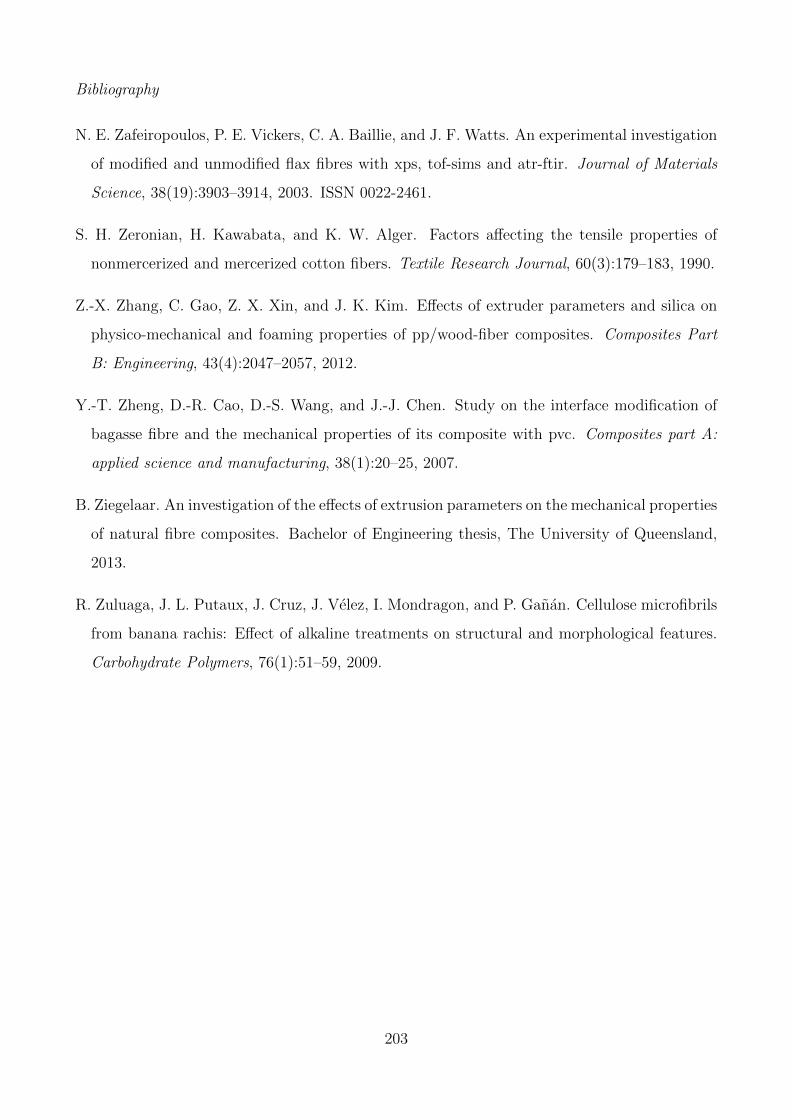
Bibliography
N. E. Zafeiropoulos, P. E. Vickers, C. A. Baillie, and J. F. Watts. An experimental investigation
of modified and unmodified flax fibres with xps, tof-sims and atr-ftir. Journal of Materials
Science, 38(19):3903–3914, 2003. ISSN 0022-2461.
S. H. Zeronian, H. Kawabata, and K. W. Alger. Factors affecting the tensile properties of
nonmercerized and mercerized cotton fibers. Textile Research Journal, 60(3):179–183, 1990.
Z.-X. Zhang, C. Gao, Z. X. Xin, and J. K. Kim. Effects of extruder parameters and silica on
physico-mechanical and foaming properties of pp/wood-fiber composites. Composites Part
B: Engineering, 43(4):2047–2057, 2012.
Y.-T. Zheng, D.-R. Cao, D.-S. Wang, and J.-J. Chen. Study on the interface modification of
bagasse fibre and the mechanical properties of its composite with pvc. Composites part A:
applied science and manufacturing, 38(1):20–25, 2007.
B. Ziegelaar. An investigation of the effects of extrusion parameters on the mechanical properties
of natural fibre composites. Bachelor of Engineering thesis, The University of Queensland,
2013.
R. Zuluaga, J. L. Putaux, J. Cruz, J. Velez, I. Mondragon, and P. Ganan. Cellulose microfibrils
from banana rachis: Effect of alkaline treatments on structural and morphological features.
Carbohydrate Polymers, 76(1):51–59, 2009.
203
Appendix A
Tensile properties of natural fibres:
reference data
204
Appendix A.
Au
tho
rF
ibre
sM
atr
ixF
ibre
tre
atm
en
tC
ou
pli
ng
ag
en
tF
ibre
co
nte
nt
(wt%
)
Pro
cess
ing
Te
nsi
le s
tre
ng
th (
MP
a)
E m
od
ulu
s (G
Pa
)
40
33
.32
56
.2
50
29
.91
63
.4
60
24
.91
34
.8
40
43
.21
82
50
49
.71
75
60
50
.81
73
.5
40
31
.71
91
.3
50
32
.61
82
.5
60
25
.21
29
.6
40
43
.22
11
50
51
.61
53
.2
60
47
.91
82
.1
02
9.4
Ext
rusi
on
+ c
om
pre
ssio
n m
ou
ldin
g1
80
.9
Tw
o-r
oll
mil
l +
co
mp
ress
ion
mo
uld
ing
22
0.7
5
Hig
h s
pe
ed
mix
er
+ c
om
pre
ssio
n m
ou
ldin
g1
50
.8
Ext
rusi
on
+ c
om
pre
ssio
n m
ou
ldin
g2
51
.2
Tw
o-r
oll
mil
l +
co
mp
ress
ion
mo
uld
ing
Hig
h s
pe
ed
mix
er
+ c
om
pre
ssio
n m
ou
ldin
g2
21
01
10
1.9
20
2.5
30
3
40
3.5
50
5
60
6.3
10
1.5
20
1.6
30
2.1
40
2.4
50
2.8
60
3.9
10
1.5
20
1.6
30
2.1
40
2.6
50
2.8
60
3.9
02
8.4
1.2
42
.1
20
26
.92
.74
3.8
40
27
.12
.83
9.9
60
27
.43
.03
3.4
20
32
.72
.94
7.6
40
41
.23
.44
1.4
60
53
.84
.13
8.7
20
38
.13
.25
0.1
40
49
.44
.34
3.9
60
61
.25
.13
9.2
sila
ne
20
42
.53
.35
4.6
So
urc
eM
ate
ria
ls
Imp
act
en
erg
y
Ma
nu
fact
ure
Co
mp
osi
te p
rop
ert
ies
HD
PE
Mix
ing
+ c
om
pre
ssio
n m
ou
ldin
g
MA
PP
2w
t%
MA
PP
5w
t%
Ce
llu
lose
He
mp
Ha
rdw
oo
d f
ibre
s Li
gn
oce
l
Ha
rdw
oo
d f
lou
r A
Ha
rdw
oo
d f
lou
r B
Be
ng
tsso
n e
t a
l.
20
07
Ble
dzk
i e
t a
l. 2
00
5
Fa
cca
et
al.
20
06
Ka
rna
ni
et
al.
19
97
Ke
na
f
Ext
rusi
on
+ c
om
pre
ssio
n m
ou
ldin
gJ/
m
PP
MA
PP
5w
t%
50
PP
ble
ach
ed
kra
ft c
ell
ulo
se f
ibre
s
ble
ach
ed
su
lfit
e c
ell
ulo
se f
ibre
s
MA
PP
3w
t%
MA
PP
3w
t%
PP
Ext
rusi
on
+ i
nje
ctio
n m
ou
ldin
gJ/
m
Fig
ure
A.1
:L
iter
atu
rere
vie
won
bio
com
pos
ite
pro
per
ties
(1)
205

Appendix A.
03
2.6
12
.3
21
.44
.9
MA
PE
1.5
wt%
30
.65
.7
MA
PE
3.0
wt%
29
.85
.9
MA
PE
4.5
wt%
27
.25
.82
23
.56
.1
MA
PE
10
.6 w
t%3
2.6
5.8
7
MA
PE
1.2
wt%
32
.66
.74
MA
PE
1.8
wt%
34
.96
.67
MA
PE
2.4
wt%
36
.16
.09
01
3.5
no
tre
atm
en
t1
3.8
alk
ali
13
.9
sila
ne
14
01
9.5
no
tre
atm
en
t2
0.1
alk
ali
20
.4
sila
ne
20
.5
01
3.3
10
14
.2
20
15
.5
30
17
28
ma
x va
lue
2.4
ma
x
24
min
va
lue
2.0
min
31
ma
x3
.4m
ax
27
min
3.1
min
02
0.8
23
2.5
7
10
23
.47
40
.82
15
25
.68
46
.73
30
27
.24
51
.28
45
22
45
.8
MA
PE
0.5
%3
6.4
45
6.2
3
MA
PE
1%
40
.14
65
.69
MA
PE
2%
37
.10
63
.33
30
27
-39
3.4
-3.8
18
2-1
87
/ 3
4-5
8
40
31
-43
4-5
.51
83
-19
4/
38
-64
50
28
-44
4.5
-6.3
18
5-2
10
/ 4
1-8
2
30
26
13
40
30
6.8
14
50
35
23
Co
ir1
01
.32
2
He
mp
52
6.8
25
Jute
30
3.5
15
Sis
al
30
5.3
27
30
40
10
Pin
e f
lou
r
Fla
x
Lei e
t a
l. 2
00
7
Li e
t a
l. 2
00
9
kJ/m
²
LLD
PE
HD
PE
LLD
PE
Tw
in-s
cre
w e
xtru
sio
n
J/m
PP
MA
PP
1w
t% +
imp
act
mo
dif
ier
Ra
na
et
al.
20
03
Wa
mb
ua
et
al.
20
03
Ba
ga
sse
Ma
no
et
al.
20
10
Mo
ha
nty
et
al.
20
06
Cu
rau
a
Jute
Jute
Ke
na
f
PP
20
Tw
in-s
cre
w e
xtru
sio
n +
inje
ctio
n m
ou
ldin
g
RH
DP
E
30
Co
mp
ress
ion
mo
uld
ing
HD
PE
10
no
tre
atm
en
t
Mix
ing
+ in
ject
ion
mo
uld
ing
PP
Co
mp
ress
ion
mo
uld
ing
kJ/m
²
un
-no
tch
ed
/no
tch
ed
J/m
Mix
ing
+ c
om
pre
ssio
n m
ou
ldin
gH
DP
E
Fig
ure
A.2
:L
iter
atu
rere
vie
won
bio
com
pos
ite
pro
per
ties
(2)
206
Appendix A.
1. M. Bengtsson, M. Le Baillif, and K. Oksman, Extrusion and mechanical properties of
highly filled cellulose fibre–polypropylene composites, Composites Part A: Applied Science
and Manufacturing, 38 (8):1922-1931, 2007. ISSN 1359-835X.
2. A. K. Bledzki, M. Letman, A. Viksne and L. Rence, A comparison of compounding pro-
cesses and wood type for wood fibre-PP composites, Composites Part A: Applied Science
and Manufacturing, 36 (6):789-797, 2005. ISSN 1359-835X.
3. A. G. Facca, M. T. Kortschot and N. Yang, Predicting the elastic modulus of natural
fibre reinforced thermoplastics, Composites Part A: Applied Science and Manufacturing,
37 (10):1660-1671, 2006. ISSN 1359-835X.
4. R. Karnani, M. Krishnan and R. Narayan, Biofiber reinforced polypropylene composites,
Polymer Engineering & Science, 37 (2):476-483, 1997. ISSN 1548-2634.
5. Y. Lei, Q. Wu, F. Yao and Y. Xu, Preparation and properties of recycled HDPE/natural
fiber composites, Composites Part A: applied science and manufacturing, 38 (7):1664-1674,
2007. ISSN 1359-835X.
6. X. Li, S. Panigrahi and L. G. Tabil, A study on flax fiber-reinforced polyethylene biocom-
posites, Applied Engineering in Agriculture, 25 (4):525-531, 2009. ISSN 0883-8542.
7. B. Mano, J. R. Araujo, M. A. S. Spinace and M. -A. De Paoli, Polyolefin composites with
curaua fibres: Effect of the processing conditions on mechanical properties, morphology
and fibres dimensions, Composites Science and Technology, 70 (1):29-35, 2010. ISSN
0266-3538.
8. S. Mohanty, S. K. Verma and S. K. Nayak, Dynamic mechanical and thermal properties of
MAPE treated jute/HDPE composites, Composites Science and Technology, 66 (3-4):538-
547, 2006. ISSN 0266-3538.
9. A. K. Rana, A. Mandal and S. Bandyopadhyay, Short jute fiber reinforced polypropylene
composites: effect of compatibiliser, impact modifier and fiber loading,Composites Science
and Technology, 63 (6):801-806, 2003. ISSN 0266-3538.
207

Appendix A.
10. P. Wambua, J. Ivens and I. Verpoest, Natural fibres: can they replace glass in fibre re-
inforced plastics?, Composites Science and Technology, 63 (9):1259-1264, 2003. ISSN
0266-3538.
208