RETINA NERVE FIBRE LAYER
12
Detection of Macular Ganglion Cell Loss in Glaucoma by Fourier-Domain Optical Coherence Tomography Ou Tan, PhD, 1 Vikas Chopra, MD, 1 Ake Tzu-Hui Lu, PhD, 1 Joel S. Schuman, MD, 2 Hiroshi Ishikawa, MD, 2 Gadi Wollstein, MD, 2 Rohit Varma, MD, MPH, 1 David Huang, MD, PhD 1 Purpose: To map ganglion cell complex (GCC) thickness with high-speed Fourier-domain optical coherence tomography (FD-OCT) and compute novel macular parameters for glaucoma diagnosis. Design: Observational, cross-sectional study. Participants: One hundred seventy-eight participants in the Advanced Imaging for Glaucoma Study, divided into 3 groups: 65 persons in the normal group, 78 in the perimetric glaucoma group (PG), and 52 in the preperimetric glaucoma group (PPG). Methods: The RTVue FD-OCT system was used to map the macula over a 76 mm region. The macular OCT images were exported for automatic segmentation using software we developed. The program measured macular retinal (MR) thickness and GCC thickness. The GCC was defined as the combination of nerve fiber, ganglion cell, and inner plexiform layers. Pattern analysis was applied to the GCC map and the diagnostic powers of pattern-based diagnostic parameters were investigated. Results were compared with time-domain (TD) Stratus OCT measurements of MR and circumpapillary nerve fiber layer (NFL) thickness. Main Outcome Measures: Repeatability was assessed by intraclass correlation, pooled standard deviation, and coefficient of variation. Diagnostic power was assessed by the area under the receiver operator character- istic (AROC) curve. Measurements in the PG group were the primary measures of performance. Results: The FD-OCT measurements of MR and GCC averages had significantly better repeatability than TD-OCT measurements of MR and NFL averages. The FD-OCT GCC average had significantly (P 0.02) higher diagnostic power (AROC 0.90) than MR (AROC 0.85 for both FD-OCT and TD-OCT) in differentiating between PG and normal. One GCC pattern parameter, global loss volume, had significantly higher AROC (0.92) than the overall average (P 0.01). The diagnostic powers of the best GCC parameters were statistically equal to TD-OCT NFL average. Conclusions: The higher speed and resolution of FD-OCT improved the repeatability of macular imaging compared with standard TD-OCT. Ganglion cell mapping and pattern analysis improved diagnostic power. The improved diagnostic power of macular GCC imaging is on par with, and complementary to, peripapillary NFL imaging. Macular imaging with FD-OCT is a useful method for glaucoma diagnosis and has potential for tracking glaucoma progression. Financial Disclosure(s): Proprietary or commercial disclosure may be found after the references. Ophthalmology 2009;116:2305–2314 © 2009 by the American Academy of Ophthalmology. Glaucoma is characterized by loss of retinal ganglion cells (RGCs) and their respective axons, which comprise the retinal nerve fiber layer (RNFL), on pathologic examina- tion. 1–5 RGC loss cannot be seen on slit-lamp ophthalmic examination. Likewise, nerve fiber layer (NFL) bundle de- fects are difficult to detect on clinical examination, and red-free fundus photography to identify and characterize them is rarely used in clinical practice. Thus, glaucoma is diagnosed based on characteristic optic nerve cupping with corresponding visual field (VF) deficits. However, because a significant loss to RGC population can occur before de- tectable VF deficits and that structural loss can precede detectable function loss by up to 5 years, 6–9 developing methods to quantify RGC-related glaucomatous changes could lead to glaucoma detection at an earlier stage and more accurate tracking of glaucoma progression. A significant proportion of RGC population resides in the macula, but is clinically undetectable on ophthal- moscopic examination. Reduced macular thickness in glaucoma was initially described by Zeimer et al 10 using the slit-scanning Retinal Thickness Analyzer (Talia Tech- nology Ltd., Neve-Ilan, Israel). Since the introduction of optical coherence tomography (OCT) by Huang et al, 11 it has proven useful for measuring circumpapillary NFL thickness for glaucoma detection. However, total macular retinal (MR) thickness measurement using OCT has 2305 © 2009 by the American Academy of Ophthalmology ISSN 0161-6420/09/$–see front matter Published by Elsevier Inc. doi:10.1016/j.ophtha.2009.05.025
Transcript of RETINA NERVE FIBRE LAYER

Detection of Macular Ganglion Cell Loss inGlaucoma by Fourier-Domain OpticalCoherence Tomography
Ou Tan, PhD,1 Vikas Chopra, MD,1 Ake Tzu-Hui Lu, PhD,1 Joel S. Schuman, MD,2 Hiroshi Ishikawa, MD,2
Gadi Wollstein, MD,2 Rohit Varma, MD, MPH,1 David Huang, MD, PhD1
Purpose: To map ganglion cell complex (GCC) thickness with high-speed Fourier-domain optical coherencetomography (FD-OCT) and compute novel macular parameters for glaucoma diagnosis.
Design: Observational, cross-sectional study.Participants: One hundred seventy-eight participants in the Advanced Imaging for Glaucoma Study, divided
into 3 groups: 65 persons in the normal group, 78 in the perimetric glaucoma group (PG), and 52 in thepreperimetric glaucoma group (PPG).
Methods: The RTVue FD-OCT system was used to map the macula over a 7�6 mm region. The macularOCT images were exported for automatic segmentation using software we developed. The program measuredmacular retinal (MR) thickness and GCC thickness. The GCC was defined as the combination of nerve fiber,ganglion cell, and inner plexiform layers. Pattern analysis was applied to the GCC map and the diagnostic powersof pattern-based diagnostic parameters were investigated. Results were compared with time-domain (TD)Stratus OCT measurements of MR and circumpapillary nerve fiber layer (NFL) thickness.
Main Outcome Measures: Repeatability was assessed by intraclass correlation, pooled standard deviation,and coefficient of variation. Diagnostic power was assessed by the area under the receiver operator character-istic (AROC) curve. Measurements in the PG group were the primary measures of performance.
Results: The FD-OCT measurements of MR and GCC averages had significantly better repeatability thanTD-OCT measurements of MR and NFL averages. The FD-OCT GCC average had significantly (P � 0.02) higherdiagnostic power (AROC � 0.90) than MR (AROC � 0.85 for both FD-OCT and TD-OCT) in differentiatingbetween PG and normal. One GCC pattern parameter, global loss volume, had significantly higher AROC (0.92)than the overall average (P � 0.01). The diagnostic powers of the best GCC parameters were statistically equalto TD-OCT NFL average.
Conclusions: The higher speed and resolution of FD-OCT improved the repeatability of macular imagingcompared with standard TD-OCT. Ganglion cell mapping and pattern analysis improved diagnostic power. Theimproved diagnostic power of macular GCC imaging is on par with, and complementary to, peripapillary NFLimaging. Macular imaging with FD-OCT is a useful method for glaucoma diagnosis and has potential for trackingglaucoma progression.
Financial Disclosure(s): Proprietary or commercial disclosure may be found after the references.Ophthalmology 2009;116:2305–2314 © 2009 by the American Academy of Ophthalmology.
Glaucoma is characterized by loss of retinal ganglion cells(RGCs) and their respective axons, which comprise theretinal nerve fiber layer (RNFL), on pathologic examina-tion.1–5 RGC loss cannot be seen on slit-lamp ophthalmicexamination. Likewise, nerve fiber layer (NFL) bundle de-fects are difficult to detect on clinical examination, andred-free fundus photography to identify and characterizethem is rarely used in clinical practice. Thus, glaucoma isdiagnosed based on characteristic optic nerve cupping withcorresponding visual field (VF) deficits. However, becausea significant loss to RGC population can occur before de-tectable VF deficits and that structural loss can precede
detectable function loss by up to 5 years,6–9 developing© 2009 by the American Academy of OphthalmologyPublished by Elsevier Inc.
methods to quantify RGC-related glaucomatous changescould lead to glaucoma detection at an earlier stage andmore accurate tracking of glaucoma progression.
A significant proportion of RGC population residesin the macula, but is clinically undetectable on ophthal-moscopic examination. Reduced macular thickness inglaucoma was initially described by Zeimer et al10 usingthe slit-scanning Retinal Thickness Analyzer (Talia Tech-nology Ltd., Neve-Ilan, Israel). Since the introduction ofoptical coherence tomography (OCT) by Huang et al,11 ithas proven useful for measuring circumpapillary NFLthickness for glaucoma detection. However, total macular
retinal (MR) thickness measurement using OCT has2305ISSN 0161-6420/09/$–see front matterdoi:10.1016/j.ophtha.2009.05.025

Ophthalmology Volume 116, Number 12, December 2009
not been nearly as accurate a diagnostic parameter asNFL.12–14
Two recent studies from our group found that glaucomadiagnostic accuracy could be improved if macular measure-ments by OCT are focused on the inner retinal layers.15,16
Glaucoma preferentially affects the 3 innermost retinal lay-ers: the nerve fiber, ganglion cell, and inner plexiformlayers, which contain, respectively, the axons, cell bodies,and dendrites of the ganglion cells. Therefore, we refer tothe combination of these 3 layers as the ganglion cell complex(GCC; Fig 1).
In this study, we investigate the diagnostic potential ofmacular GCC thickness mapping and analysis using a newerFourier-domain (FD)-OCT17–20 system (also called spectralor spectral domain OCT21–27). The FD-OCT system hashigher resolution and speed compared with the time-domain(TD) OCT system we previously studied. The higher speedenables mapping of the macula over a wider area with manymore sampling points. The higher resolution facilitates de-lineation of GCC from the rest of retina. The potential forimproved repeatability and diagnostic power was assessedin a cross-sectional clinical study.
Methods
Clinical Study
Participants in the prospective, longitudinal Advanced Imaging forGlaucoma Study (AIGS) between 2003 and 2007 were included.The earliest available FD-OCT scans for each participant, alongwith the TD-OCT taken at the same visit, were used in theanalysis. Participants in the following 3 groups were analyzed:normal, perimetric glaucoma (PG), and preperimetric glaucoma(PPG). The eligibility criteria for the 3 groups analyzed are brieflydescribed below, but were also described in our previous publica-tion.16 Further description of the AIG Study protocol can be foundin the AIGS Manual of Procedures (http://www.aigstudy.net/index.php?id�12; accessed March 18, 2009).
The normal group participants had intraocular pressure of �21mmHg for both eyes, a normal Humphrey SITA 24-2 standard VF(mean deviation [MD] and pattern standard deviation within 95%limits of the normal reference and a glaucoma hemifield test within97% limits), a central corneal thickness �500 �m, a normal-
Figure 1. Vertical optical coherence tomography (OCT) cross-section ofthe macula. The image was acquired using the RTVue Fourier-domain(FD)-OCT system. The ganglion cell complex (GCC) consists of 3 layers:the nerve fiber layer (NFL), ganglion cell layer (GCL), and inner plexi-form layer (IPL). The 3 boundaries on the image are inner limitingmembrane (ILM), outer IPL boundary and inner segment/outer segment(IS/OS) junction. The GCC thickness is measured from the ILM to theouter IPL boundary. The retinal thickness is measured from the ILM to theIS/OS junction.
appearing optic nerve head, a normal NFL, an open anterior
2306
chamber angle by gonioscopy, and no history of chronic ocular orsystemic corticosteroid use.
The PG group participants had �1 eye that fulfilled the fol-lowing criteria: glaucomatous (abnormal) VF loss (pattern stan-dard deviation [P�0.05] or glaucoma hemifield test [P�1%] out-side normal limits in a consistent pattern on both qualifying VFs)and optic nerve head changes such as diffuse or localized rimthinning, disc (splinter) hemorrhage, vertical cup-to-disc ratiogreater than the fellow eye by �0.2, or notch in the rim detectedon baseline dilated fundus examination and confirmed by maskedreading of stereo disc photographs.
The PPG group participants had same criteria for optic nervehead change as defined for the PG group, but did not have the VFloss criteria need to meet eligibility for the PG group.
Exclusion criteria for all groups in the AIGS are best-correctedvisual acuity �20/40; age �40 or �79 years; spherical equivalentrefractive error ��3.00 or ��7.00 diopters; diabetic retinopathyor other diseases that could cause VF loss or optic disc abnormalities;or previous intraocular surgery other than an uncomplicated cataractextraction with posterior chamber intraocular lens implantation.
The research was conducted in accordance with the Declarationof Helsinki. Informed consent was obtained from all participantsafter the goals of the study and consequences of participation hadbeen discussed. The institutional review board of each institutioninvolved in the study approved the research protocol.
Fourier-Domain Optical Coherence Tomography
Study participants were scanned using the RTVue FD-OCT sys-tem (Optovue, Inc., Fremont, CA), which acquires 26,000 axialscans (a-scans) per second and has a 5-�m depth resolution (fullwidth, half maximum) in tissue. With the FD-OCT, we devised3-dimensional scans of the macular region called the GCC scanthat samples the macula with 14 928 a-scans over a 7-mm squarearea in 0.6 seconds (Fig 2). We chose to limit the scan time to 0.6second to reduce the problems of eye movement and cornealdrying associated with long scan time. The scan pattern consists of1 horizontal line and 15 vertical lines at 0.5-mm intervals. Thecenter of the GCC scan is shifted 0.75 mm temporally to improvesampling of the temporal periphery.
Figure 2. The ganglion cell complex scan pattern consists of 15 vertical and
1 horizontal scan lines shown overlaid on a red-free fundus photograph.
Tan et al � FD-OCT Mapping of Macular Ganglion Cell Loss for Glaucoma Diagnosis
Image Acquisition
All participants were scanned 3 times with the GCC scan (formerlycalled MM7 scan on software versions 3.0 and earlier). RTVuesoftware versions 1.0 to V3.0 were used for acquisition. Thephotographers rejected scans with motion artifacts (discontinuousjump). The photographers did not look for signal strength (SS) orsegmentation error because the processing software was not avail-able at the time the study started. The OCT images were exportedusing the XML export function of RTVue version 3.0 software.The exported image set included 16 B-scans (cross-sectional im-ages), each with 640X933 (depth�width) pixels and 3�7.5 mi-cron pixel size. The entire set contains 9 553 920 pixels.
Participants were also scanned with the Stratus TD-OCT sys-tem (Carl Zeiss Meditec, Dublin, CA), which acquires 400 a-scansper second and has a 10-�m resolution. Stratus OCT imaging wasperformed by the same photographer at the same visit using thefast RNFL scan and the fast macular thickness map scan. TheRNFL scan consists of three 3.4-mm circles around the optic disc.The fast macular thickness map scan contains six 6-mm radialscans. Both patterns contain 768 a-scans completed in 2 seconds.Two sets of both scans were taken in each eye. According to theAIGS protocol, the photographer rejected scans with motion arti-facts, segmentation error (�15% consecutive or �20% cumulativenumber of A-scans with wrong boundary by visual inspection) orSS �5 during the imaging session and took more scans to satisfythe criteria. For the purpose of this article, images with SS �6were further excluded. Using the standard Stratus 4.0 software, theoverall averages of circumpapillary NFL thickness and MR thick-nesses were calculated.
Glaucoma severity was staged by MD and pattern standarddeviation according to the Glaucoma Staging System 2.28
Image Processing
We developed automated software to map GCC. First, the 15vertical OCT cross-section images (Fig 3A; available online at http://aaojournal.org) were aligned in the z-dimension (depth axis) to thehorizontal image by cross correlation to build a registered 3-dimensional (3D) image set. To suppress background and specklenoises, each image was smoothed with a median filter.
To improve the speed and robustness of boundary detection, aprogressive refinement procedure was applied. The procedure startswith boundary detection on a low-resolution (highly low-pass fil-tered) 3D data set and then progressively refines the boundary onprogressively higher resolution (less filtered) data. A 2-dimensinoalversion of this procedure was described in our previous work16 andextended to 3D in the current algorithm.
The boundary detection algorithm starts with the photoreceptorpigment epithelium complex (PPC) band, which includes the brightbands of the photoreceptor inner segment-outer segment (IS/OS)junction and the retinal pigment epithelium. The PPC was detected asthe second (counting from the inner side) maximum intensity peak ina low-resolution image (Fig 3B; available online at http://aaojournal.org). The IS/OS junction was then detected as the first maximumintensity peak within the PPC in the original resolution. Smallportions of the PPC had low signal owing to shadowing fromoverlying blood vessels; these shadowed a-scans were replaced byadjacent a-scans to avoid interruption of boundary detection. Theimages were aligned at the IS/OS junction to facilitate lateralsmoothing. The gradient image was then obtained by appliedgradient operator to smoothed intensity image in depth direction.
The inner limiting membrane (ILM) was identified as the firstpositive gradient peak of each a-scan. Neighbor constraint and aknowledge model were used to distinguish the ILM peak from
spurious noise or detached vitreous face. The outer plexiform layer(OPL) were detected as the first intensity peak above (inner to) theIS/OS. Then the outer boundary of the inner plexiform layer wasidentified as the negative gradient peak above the OPL peak (Fig3C; available online at http://aaojournal.org). The accuracy of thesegmentation was visually confirmed by one author (OT) on everyB-scan. If the segmentation of ILM, OPL, or IS/OS boundary wasoff by �5 pixels in more than 1/6 of any B-scan, the GCC scanwas excluded. Based on the experience from visual inspection, wedecided to reject images with SS index (SSI) �38 because seg-mentation errors were too common below the SSI threshold.
The GCC thickness was measured from the ILM to the outerinner plexiform layer boundary. Retinal thickness was measuredfrom the ILM to the IS/OS junction. The GCC (Fig 3D; availableonline at http://aaojournal.org) and MR maps were computed byinterpolation of the thickness profiles from the 15 vertical B-scansin the 3D dataset. The interpolated map contains 933�933 points,which was interpolated from 933 a-scans�15 B-scans (eachB-scan contained 933 a-scans). The interpolation used cubicspline interpolation function in MATLAB. Finally, the position ofthe foveal depression was identified on the MR map and used torecenter the vertical position of the maps. The fovea center wasidentified as the location of minimal retinal thickness on the low-pass filtered map within 0.5 mm of fixation. The maps were croppedto remove peripheral areas where segmentation was less reliable. Theremaining areas are those within a 7-mm diameter circle andwithin 3 mm from the central horizontal line. For the GCC map(Fig 3E; available online at http://aaojournal.org), the area within0.75 mm of the foveal center (1.5-mm diameter circle) was alsoexcluded because the GCC is too thin to be reliably measured in thatregion. The GCC maps of all eyes in the normal group were averaged,point by point, to obtain the normal reference GCC map (Fig 3F;available online at http://aaojournal.org). The reference map is impor-tant for the calculation of GCC loss maps and pattern-based diagnos-tic parameters. The reference GCC map had a root-mean-square SDof 10 �m and standard error of 0.9 �m.
Derivation of Diagnostic ParametersWe computed several glaucoma diagnostic parameters based on theGCC map (Fig 4A). The simplest was the overall average thickness(GCC-AVG). The difference between superior and inferior hemi-spheric averages (GCC-SID) was also computed.
To extract even more diagnostic information from the GCC map,we developed methods of analyzing the pattern of GCC loss. To dothis, we computed maps of GCC loss as the fractional deviation (FD)map and the pattern deviation (PD) map. The FD map (Fig 4B) is theGCC map minus the normal reference map divided by the normalreference map. The pattern map is the GCC thickness map normalized(divided) by its own overall average. The PD map (Fig 4C) is thepattern map under consideration minus the normal reference pattern.The FD map shows the percentage of GCC loss. The PD map showshow the GCC pattern differs from normal.
Three pattern-based diagnostic parameters were then computedfrom the 2 derivative maps. The focal loss volume (FLV) is the sumFD in the region where there is significant focal loss. Significant focalloss is defined as PD �1.65 SD below the normal average (below thefifth percentile of normal distribution). Global loss volume (GLV) isthe sum of FD in areas where FD is negative. Pattern coefficient ofvariation (PCV) is the root mean square of the PD map.
The image processing and diagnostic parameter calculations wereprogrammed in MATLAB 7.0 (The MathWorks, Natick, MA).
Statistical AnalysesBoth eyes of each participant were analyzed. The study sample
was viewed as a clustered sample. The intereye correlation was2307
sponded with the inferior GCC loss and disc rim thinning.
Ophthalmology Volume 116, Number 12, December 2009
accounted for in statistical tests by the use of a generalized esti-mating equation (GEE)29 approach, linear mixed model,30 or for-mulae derived for clustered samples.31–33
To compare the means, a generalized linear model34 with aGEE approach was used to evaluate the mean difference betweengroups. The P-values for mean comparisons were based on a Waldtest.35 The model allows for non-Gaussian distributions in additionto Gaussian distributions for fitting the dependent variables. Thenormality of distribution was verified by inspection of histogramand a Kolmogorov–Smirnov test. We noticed that some partici-pants had 1 eye in PPG and the other eye in PG groups. To avoidthe off calculation in model parameter estimation, we comparedPPG versus normal and PG versus normal, respectively. The testswere performed in a 1-tailed manner because we hypothesize that themeans in the diseased groups are lower than in the normal group.
Intraclass correlation (ICC),36 pooled SD,37 and coefficients ofvariation (CV) were used to evaluate the reproducibility of diag-nostic parameters. These indices were computed from linear mixedmodels in which the variance components for subject and eyevariation were included to account for intrasubject correlation. Tocompare pooled SD or CV between diagnostic parameters, wegenerated the pooled SD or CV for each eye and used GEE paired
t-tests for comparisons.2308
Figure 5. The average ganglion cell complex fractional deviation map of
Figure 4. A perimetric glaucoma case example. All of the ganglion cellcomplex (GCC) parameters were abnormal (average � 71 �m;P�0.5%; focal loss volume � 12.6%; P�0.5%; global loss volume �26.5%; P�0.5%; pattern coefficient of variation � 21%; P�0.5%;superior–inferior difference � 17.0 �m; P�0.5%). A, The GCC map.B, Fractional deviation map with areas of significant focal loss marked byred hatching. C, GCC pattern deviation (PD) map. D, Disc photo show-ing inferotemporal rim loss. E, Visual field (VF) PD map. The VF wasabnormal (pattern standard deviation � 16.5 dB; P�0.5%); the glaucomahemifield test was outside normal limits. The elliptical dashed line showsthe area corresponding to the GCC maps. The superior VF defect corre-
the perimetric glaucoma group.
Tan et al � FD-OCT Mapping of Macular Ganglion Cell Loss for Glaucoma Diagnosis
Area under the receiver operating characteristic (AROC) curvewas used to compare diagnostic power. To account for intereyecorrelation, the AROC was computed based on the formula ofObuchowski,33 which extended the nonparametric method ofDeLong et al38 as applied to clustered data. The same methodhas been used in previous studies in ophthalmology16,39 tohandle intereye correlation.
To adjust for age imbalance between the normal, PG, andPPG groups, a logistic regression model with age and diagnos-tic parameter in covariates was used to generate the AROC.This method of compensating for age imbalance has been usedin a previous ophthalmology study.40 A GEE approach wasadded to the logistic regression model to account for the inter-eye correlation in the study sample.
For sensitivity and specificity, we computed thresholds for 5thand 1st percentiles. For a Gaussian distributed parameter, thepercentiles can be formulated as meanN � Z�SDN, where meanN
and SDN are the mean and SD of the normal group, Z� � �1.65for the 5th percentile cutoff, and Z� � �2.33 for the first percen-tile cutoff. The parametric distribution of a non-Gaussian param-eter was estimated based on 10 000 replicates, in which 1 eye wasrandomly selected from each participant. The SDN and the stan-dard error of sensitivity and specificity were computed based onthe formulae for clustered data31,32; this method has been used inprevious studies in ophthalmology.16,39
The AROC calculations were written in MATLAB 7.0 softwareand the other statistical calculations were performed with the SAS 9.1software. The critical � level of statistical significance was set at 0.05.
Results
A total of 183 participants (328 eyes) with available RTVue GCCand Stratus scans were identified from the AIG central database. Atotal of 849 GCC scans were screened, 48 were excluded for lowsignal and 41 were excluded owing to segmentation error. Theaverage SSI of the accepted GCC scans was 39.8. A total of 622Stratus scans were screened; 12 scans were excluded owing to lowSS. The average SS of the accepted Stratus scans was 8.3. Stratusscans that had segmentation error were rejected and retaken by thephotographer so a failure rate was not available. Finally, 18 eyeswere excluded owing to lack of valid FD-OCT or TD-OCT data.The remaining 310 eligible eyes from 178 participants were ana-
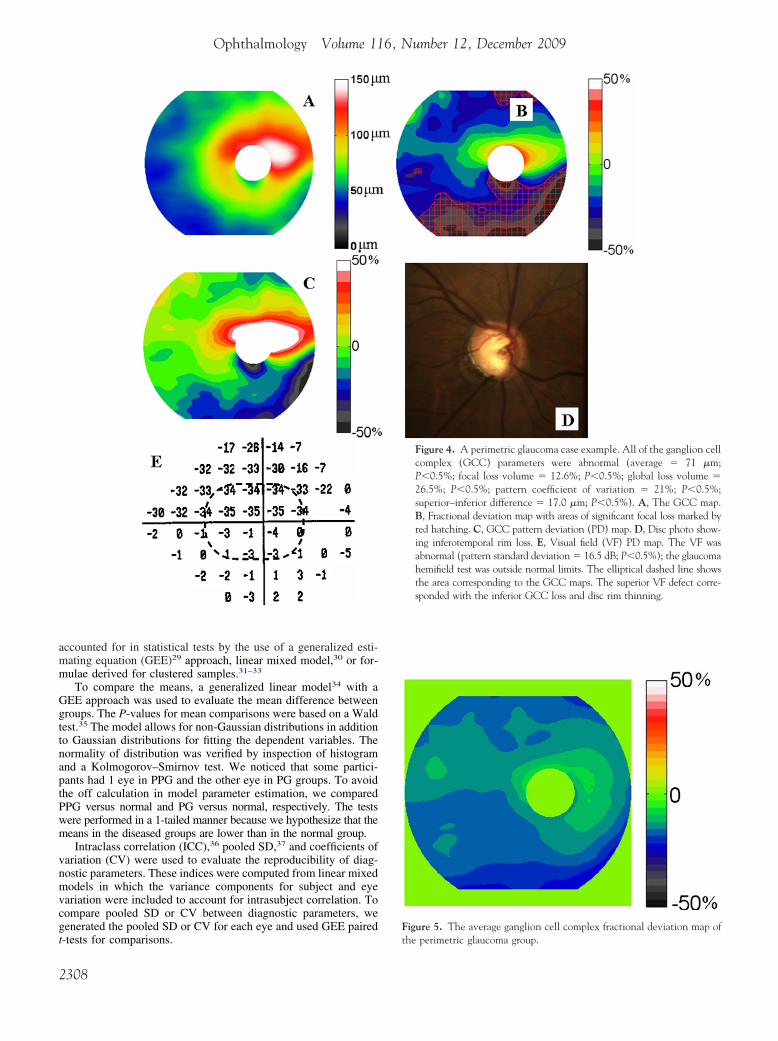
Table 1. Characteristi
Group Normal Preperimetric Glau
No. of participants‡ 65 52No. of eyes 125 76Age (yrs)§ 52.9�8.9 60.4�9.7Female (% total) 68% 56%Race (% Caucasian) 88% 79%MD (dB)§ �0.1�1.0 �0.5�1.4PSD (dB)§ 1.5�0.2 1.9�1.0IOP (mmHg)§ 14.7�2.5 16.4�3.3CCT (�m)§ 561.3�36.8 560.0�32.4
CCT � central corneal thickness; dB � decibels; IOP � intraocular pre(visual field).*P values for comparing normal and PPG groups.†P values for comparing normal and PG groups.‡Some participants have 1 eye diagnosed as PPG and the other eye diagn§Mean value � standard deviation.
lyzed. The demographic and clinical information for each group
were summarized in Table 1. Preperimetric glaucoma and PGparticipants were both significantly older than normal participantsby approximately 7 years. The potential overestimation of AROCdue to the age imbalance was removed using a logistic regressionmodel as stated in Methods. There were more Caucasians in thenormal group compared with the PG group. However, there was nosignificant difference between the racial groups in terms of themeans of diagnostic parameters in the normal group. The PG grouphad central corneal thickness that were significantly thinner thanthe normal group, and the PPG group had significantly higherintraocular pressure than the normal group. Both PG and PPGgroups had significantly worse VF parameters than the normalgroup. All participants had open angles by gonioscopy except 1participant with narrow angles in the PPG group.
According Glaucoma Staging System 2 system, the 109 PGeyes were classified into stage 0 (18 eyes), borderline (14 eyes),stage 1 (20 eyes), stage 2 (17 eyes), stage 3 (20 eyes), stage 4 (16eyes), and stage 5 (4 eyes). Forty-one eyes had localized defects,24 eyes have mixed defects, and 12 eyes have generalized defects.Seventy-nine eyes (70.5%) had MD ��6.0 dB, 25 eyes (22.3%)had MD between �6.01 to �12.0 dB, and 8 eyes (7.1%) MD��12 dB.
Table 2 summarizes the distribution statistics of each diagnos-tic parameter by group. All parameters were significantly worse inthe PPG and PG groups compared with the normal group(P�0.001). Because SID, PCV, FLV, and GLV had nonnormaldistributions (gamma distributions), these parameters were com-pared using the Wald test as described in Methods.
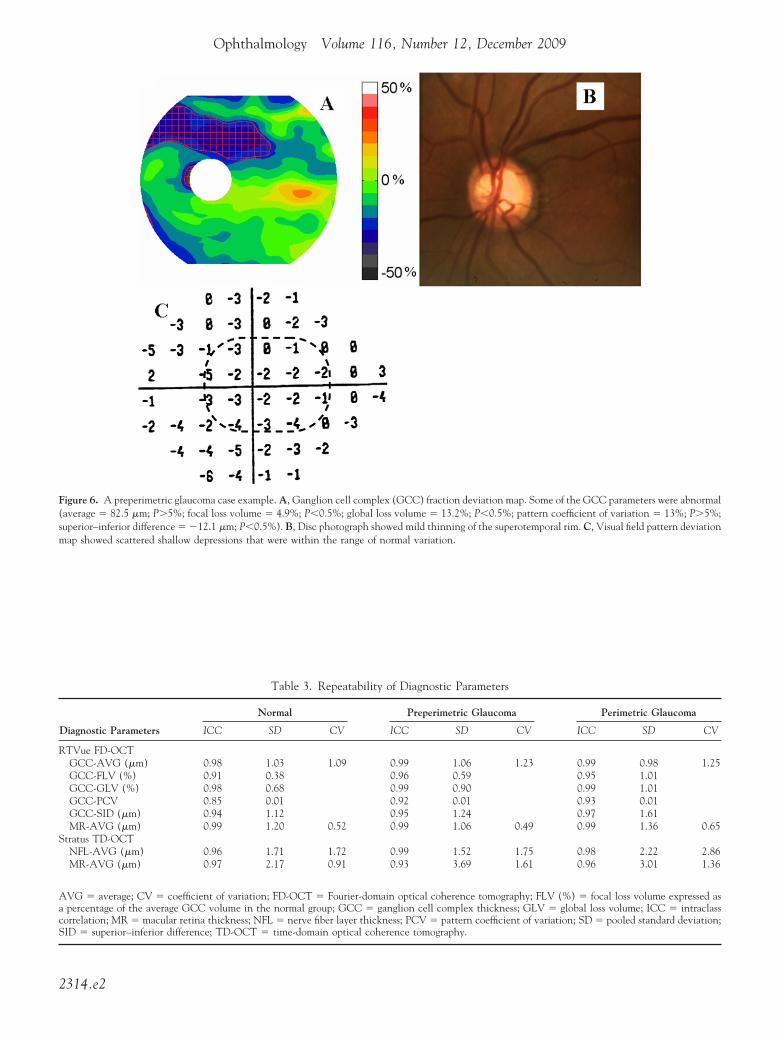
Repeatability was assessed by 3 measures: ICC, pooled SD,and CV of repeated measures (Table 3; available online at http://aaojournal.org) during the same session. The repeatability in thePPG and PG groups is important because it provides an indicationof how well a parameter can track progression through stages ofthe disease. Because glaucoma primarily affects the GCC (inner 3retinal layers), it should affect GCC thickness and MR thickness inparallel fashion, matching micrometer by micrometer. Thus, theirrelative precision in tracking glaucoma can be gauged by thepooled SD. The pooled SDs of FD-OCT GCC were significantlysmaller than TD-OCT MR in the normal (P � 0.005) and PG(P�0.02) groups. The pooled SDs of FD-OCT MR were alsosignificantly smaller than TD-OCT MR in the normal (P�0.002)and PG (P�0.048) groups. In PPG group, the P-values were closeto statistical significance (0.08 for GCC and 0.07 for MR). We
the Study Population
P* Perimetric Glaucoma P†
— 78 —— 109 —
�0.0001 60.5�8.4 �0.00010.2 56% 0.20.2 73% 0.030.01 �4.6�4.4 �0.00010.001 6.0�4.4 �0.00010.004 15.2�3.5 0.30.7 541.9�35.8 0.007
MD � mean deviation (visual field); PSD � pattern standard deviation
as PG.
cs of
coma
ssure;
osed
cannot assume that glaucoma would affect GCC and NFL the same
2309

Ophthalmology Volume 116, Number 12, December 2009
micrometer by micrometer, but their loss might be roughly pro-portional. Therefore, CV could provide an approximate compari-son between the repeatability of GCC and NFL. The CVs ofFD-OCT GCC were significantly smaller than TD-OCT NFL inthe normal (P � 0.0002) and PG (P�0.001) groups, but not in thePPG group (P � 0.11). To compare the repeatability of all FD-OCT parameters, it is best to use the ICC because the patternparameters (FLV, GLV, PCV, SID) have mean values close to zero(therefore, CVs are not meaningful) and have different units(therefore, SDs are not comparable). The FD-OCT GCC-AVG,GCC-GLV, and MR-AVG all have the highest ICC values of 0.99in the PG and PPG groups and therefore may be the best param-eters to watch for the tracking of glaucoma progression.
The AROC (Table 4) provided a summary measure of theaccuracy of diagnosing glaucoma against the normal referencegroup. The MR average measured by FD-OCT and TD-OCT had
Table 2. The Distribution of
Diagnostic Parameter
Normal
Mean � SD Range
RTVue FD-OCTGCC-AVG (�m) 94.8�7.5 76.6–119.8GCC-FLV (%) �0.7�1.9 �17.0 to 0.0001GCC-GLV (%) �4.3�4.3 �21.1 to 0.001 �GCC-PCV 0.076�0.036 0.041–0.360GCC-SID (�m) 3.4�2.9 0.02–15.8MR-AVG (�m) 228.5�13.2 203.1–261.6
Stratus TD-OCTNFL-AVG (�m) 98.9�8.3 79.5–131.4MR-AVG (�m) 238.3�13.0 208.0–264.2
AVG � average; FD-OCT � Fourier-domain optical coherence tomograpvolume in the normal group; GCC � ganglion cell complex thickness; Glayer thickness; PCV � pattern coefficient of variation; SD � standard dcoherence tomography.
Table 4. Diagnostic Accuracy of Diagnostic Parameters
DiagnosticParameter
PerimetricGlaucoma
AROC (SE)
PreperimetricGlaucoma
AROC (SE)
RTVue FD-OCTGCC-AVG (�m) 0.90 (0.02) 0.78 (0.05)GCC-FLV (%) 0.92 (0.02) 0.73 (0.05)GCC-GLV (%) 0.92 (0.02) 0.79 (0.04)GCC-PCV 0.90 (0.02) 0.72 (0.05)GCC-SID (�m) 0.80 (0.03) *MR-AVG (�m) 0.85 (0.03) 0.76 (0.05)
Stratus TD-OCTNFL-AVG (�m) 0.92 (0.02) 0.80 (0.05)MR-AVG (�m) 0.85 (0.03) 0.76 (0.05)
AVG � average; AROC � area under the receiver operating curve;FD-OCT � Fourier-domain optical coherence tomography; FLV (%) �focal loss volume expressed as a percentage of the average GCC volume inthe normal group; GCC � ganglion cell complex thickness; GLV � globalloss volume; MR � macular retina thickness; NFL � nerve fiber layerthickness; PCV � pattern coefficient of variation; SE � standard error;SID � superior–inferior difference; TD-OCT � time-domain opticalcoherence tomography.The accuracy of diagnosing PG and PPG against the reference normalgroup was assessed by the area under the receiver operating curve.
*The AROC was not significantly better than 0.5 and was omitted.2310
equivalent AROC values. By isolating the inner retina, GCC-AVGsignificantly improved the diagnosis of PG (AROC � 0.90) com-pared with MR (P � 0.021). The pattern parameter GCC-GLV(P � 0.01) performed even better in diagnosing PG than GCC. Themacular parameters GCC-AVG, GCC-FLV, and GCC-GLV hadstatistically equal (P�0.1) diagnostic power compared with NFL-AVG. For the diagnosis of PPG (versus normal), we found nosignificant difference between GCC parameters and MR. Diagnos-tic accuracy is also shown in the form of diagnostic sensitivities at1st and 5th percentile cutoff thresholds (Table 5).
The odds ratio of having glaucoma for every 10 �m loss oftissue was 7.45 (95% confidence interval [CI], 4.14–13.40) forGCC-AVG, 5.06 (2.58, 9.92) for NFL and 2.69 (95% CI, 1.96–3.67), and 2.53 (95% CI, 1.84–3.47) for FD-OCT and TD-OCTMR, respectively. We note that, for each 10-�m of tissue loss,GCC predicts a significantly greater (3-fold) increase in theodds ratio than the loss of MR.
We chose a PG case with a very asymmetric VF to show howthe locations of VF and disc rim defects correlated with GCC loss(Fig 4). The predominantly inferior GCC loss correlated with theinferior disc rim loss and superior VF defect.
The pattern of GCC loss averaged over the PG group (Fig 5)showed sparing of the maculopapillar bundle, which was tilted inaccordance with the fact that the fovea is below the level of thedisc. The severest fractional loss occurred at the superior andinferior edges of the map, corresponding with the locations of thesuperior and inferior arcuate NFL bundles.
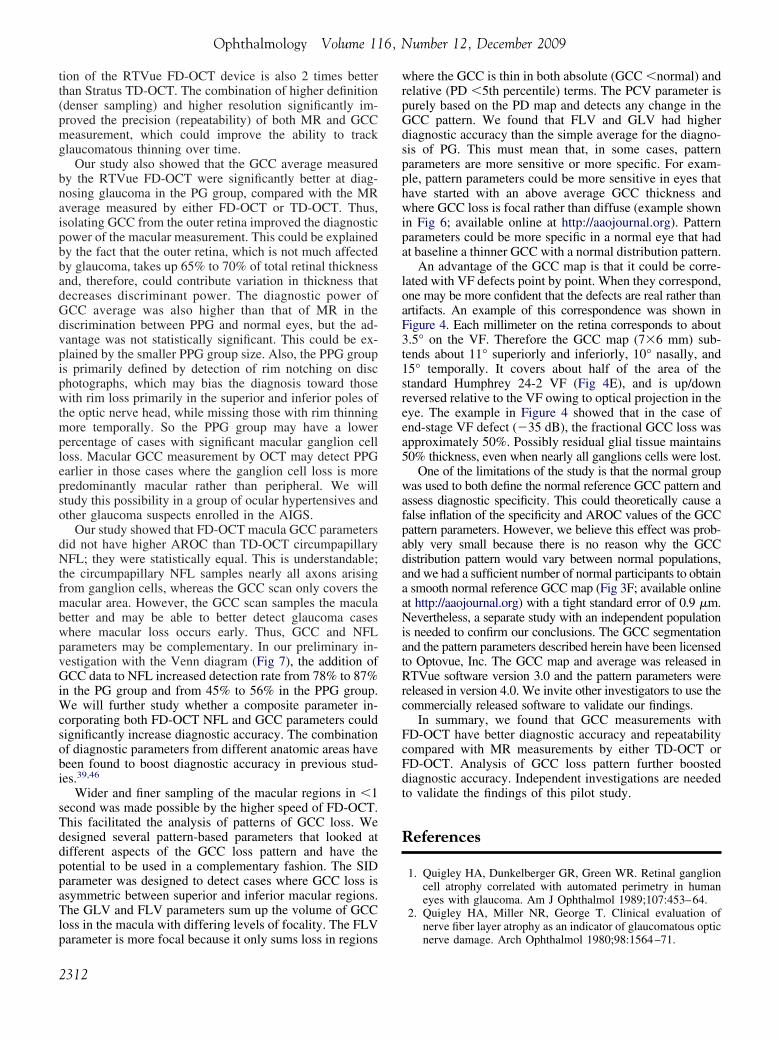
We chose a PPG case (Fig 6; available online at http://aaojournal.org) where the average GCC was within normal and the patternparameters were abnormal to investigate how such a situationcould arise. In this case, the GCC loss was localized primarily toan area above the fovea, and the abnormality was easily picked upby the pattern-based parameters. But the GCC was actually thickerthan average in the maculopapillar area, which contributed towardan average GCC thickness that was still within the normal range.The focal loss of GCC in the superior macula was as much as 30%,corresponding to a mild thinning of the superotemporal disc rim,whereas the VF was essentially normal.
To investigate whether GCC can help to detect glaucomatousabnormalities not picked up by NFL, we constructed Venn dia-grams of GCC and NFL abnormalities in both the PG and PPGgroups (Fig 7). We combined the 3 best GCC parameters—GCCabnormality was defined as GCC-AVG, FLV, or GLV below the
nostic Parameters by Group
Preperimetric Glaucoma Perimetric Glaucoma
� SD Range Mean � SD Range
�9.3 68.6–114.6 79.4�10.4 53.6–99.1�2.7 �12.5 to 0.0001 �6.4�4.3 �14.5–0.0001�7.0 �26.6 to �0.1 �17.5�9.7 �42.1 to �1.0�0.034 0.051–0.240 0.133�0.046 0.051–0.227�4.0 0.1–21.5 7.2�6.0 0.1–24.9�12.1 194.9–252.3 212.1�12.4 180.9–237.0
�13.1 60.2, 114.4 77.5�14.8 43.5, 127.5�14.5 205.3–269.7 221.7�14.6 180.0–252.5
V (%) � focal loss volume expressed as a percentage of the average GCCglobal loss volume; MR � macular retina thickness; NFL � nerve fiber
on; SID � superior–inferior difference; TD-OCT � time-domain optical
Diag
Mean
87.0�2.310.2
0.0904.2
218.9
87.7229.1
hy; FLLV �eviati
percentile of the normal reference. Abnormal NFL was defined by

Tan et al � FD-OCT Mapping of Macular Ganglion Cell Loss for Glaucoma Diagnosis
NFL-AVG below the 5th percentile; GCC detected an additional 9%of PG cases and 11% of PPG cases that were not detected by NFL.
Discussion
Although glaucoma is clinically defined as optic disc cup-ping with corresponding VF defects, the underlying diseaseprocess in glaucoma is the loss of RGC.1–3 Approximatelyone third of the RGC population resides within the posteriorpole. In the macula, the RGC layer is �1 cell layer thickwith an RGC body diameter 10 to 20 times larger comparedwith their axons. In addition, the central retina has lessvariability in cell density compared with peripheral retina.41
Thus, detecting RGC loss in the macula may allow earlierdetection of glaucoma in some cases.
Ishikawa et al15 developed a software algorithm to per-form automatic retinal layer segmentation in the macula forthe commercially available Stratus TD-OCT and reportedthat macular inner retinal layer thickness measurementscould indeed be used to discriminate normal from glauco-matous eyes. They found that the outer retinal layers werenot affected in glaucoma. However, one of the limitations ofthe study was variable scan quality. More than one third oftheir scans on glaucomatous eyes had to be excluded fromsegmentation analysis owing to poor quality scans related tospeckle noise and uneven tissue reflectivity. The authorssuggested that higher resolution and improved signal quality(higher signal-to-noise ratio), as provided by FD-OCT, maybe needed for better quality image acquisition to allowaccurate retinal layer segmentation.
Leung et al42 used the Stratus TD-OCT to evaluatemacular NFL thinning in glaucoma using the 3.4-mm di-ameter circular scan pattern (fast RNFL scan). They re-ported a reduction in macular NFL thickness in glaucoma-tous eyes compared with normal eyes. However, they foundthat measurement of macular NFL thickness offered noadvantage over measurement of total macular thickness forglaucoma detection. In their study, circumpapillary NFL
Table 5. Sensitivity and Spe
Threshold Parameter
5th Percentile
Sensitivity (PG) Sensitivity (PPG)
RTVue FD-OCTGCC-AVG 0.61 (0.05) 0.34 (0.06)GCC-FLV 0.72 (0.05) 0.30 (0.05)GCC-GLV 0.63 (0.06) 0.33 (0.06)GCC-PCV 0.6 (0.05) 0.17 (0.05)GCC-SID 0.28 (0.04) 0.09 (0.04)MR-AVG 0.36 (0.05) 0.2 (0.06)
Stratus TD-OCTNFL-AVG 0.75 (0.04) 0.39 (0.06)MR-AVG 0.37 (0.05) 0.26 (0.06)
AVG � average; FD-OCT � Fourier-domain optical coherence tomograpvolume in the normal group; GCC � ganglion cell complex thickness; Glayer thickness; PCV � pattern coefficient of variation; PG � perimetric gdifference; TD-OCT � time-domain optical coherence tomography.
thickness outperformed macular NFL and total macular
thickness in the ability to detect glaucoma and correlatewith visual function.
Greenfield et al43 reported that OCT-derived macularthickness was well correlated with changes in visual func-tion and RNFL structure in moderately advanced glau-coma. They reported a strong correlation between meanmacular thickness and VF MD (r2 � 0.47; P�0.001), andsuggested that reduced macular thickness could be a surro-gate for loss of RGCs in glaucoma.
Our study confirmed that MR thickness by either FD-OCT or Stratus TD-OCT was a less accurate parameter forglaucoma detection than Stratus NFL thickness. Other in-vestigators, including Wollstein et al,13 Guedes et al,44 andMedeiros et al45 have also reported higher AROC values forStratus NFL compared with Stratus MR for glaucoma detec-tion. Our AROC values for MR by TD-OCT (AROC 0.85) andFD-OCT (AROC 0.85) were slightly higher than values pre-viously reported by Medeiros et al (AROC 0.75–0.81).45
In the current study, we report on the development ofnovel diagnostic parameters using FD-OCT to look forglaucoma in the macula. The faster speed of FD-OCT (65�Stratus TD-OCT) allows high-density scanning over a largeregion of the macula with less motion artifact. The resolu-
Figure 7. Venn diagrams showing the overlap between abnormal nervefiber layer (NFL) and ganglion cell complex (GCC) thicknesses in bothperimetric glaucoma (PG) and preperimetric glaucoma (PPG) groups.
ity of Diagnostic Parameters
1st Percentile
ecificity Sensitivity (PG) Sensitivity (PPG) Specificity
5 (0.02) 0.43 (0.05) 0.13 (0.04) 0.99 (0.01)5 (0.02) 0.36 (0.05) 0.04 (0.03) 0.99 (0.01)5 (0.02) 0.46 (0.05) 0.11 (0.03) 0.98 (0.01)7 (0.02) 0.41 (0.05) 0.05 (0.03) 0.98 (0.01)4 (0.02) 0.16 (0.04) 0.04 (0.02) 0.99 (0.01)7 (0.02) 0.14 (0.04) 0.01 (0.01) 1 (0)
7 (0.02) 0.6 (0.05) 0.3 (0.06) 0.98 (0.02)7 (0.02) 0.21 (0.05) 0.05 (0.03) 0.99 (0.01)
V (%) � focal loss volume expressed as a percentage of the average GCCglobal loss volume; MR � macular retina thickness; NFL � nerve fiber
ma group; PPG � preperimetric glaucoma group; SID � superior–inferior
cific
Sp
0.90.90.90.90.90.9
0.90.9
hy; FLLV �lauco
Abnormalities were detected at the 5 percentile level.
2311
Ophthalmology Volume 116, Number 12, December 2009
tion of the RTVue FD-OCT device is also 2 times betterthan Stratus TD-OCT. The combination of higher definition(denser sampling) and higher resolution significantly im-proved the precision (repeatability) of both MR and GCCmeasurement, which could improve the ability to trackglaucomatous thinning over time.
Our study also showed that the GCC average measuredby the RTVue FD-OCT were significantly better at diag-nosing glaucoma in the PG group, compared with the MRaverage measured by either FD-OCT or TD-OCT. Thus,isolating GCC from the outer retina improved the diagnosticpower of the macular measurement. This could be explainedby the fact that the outer retina, which is not much affectedby glaucoma, takes up 65% to 70% of total retinal thicknessand, therefore, could contribute variation in thickness thatdecreases discriminant power. The diagnostic power ofGCC average was also higher than that of MR in thediscrimination between PPG and normal eyes, but the ad-vantage was not statistically significant. This could be ex-plained by the smaller PPG group size. Also, the PPG groupis primarily defined by detection of rim notching on discphotographs, which may bias the diagnosis toward thosewith rim loss primarily in the superior and inferior poles ofthe optic nerve head, while missing those with rim thinningmore temporally. So the PPG group may have a lowerpercentage of cases with significant macular ganglion cellloss. Macular GCC measurement by OCT may detect PPGearlier in those cases where the ganglion cell loss is morepredominantly macular rather than peripheral. We willstudy this possibility in a group of ocular hypertensives andother glaucoma suspects enrolled in the AIGS.
Our study showed that FD-OCT macula GCC parametersdid not have higher AROC than TD-OCT circumpapillaryNFL; they were statistically equal. This is understandable;the circumpapillary NFL samples nearly all axons arisingfrom ganglion cells, whereas the GCC scan only covers themacular area. However, the GCC scan samples the maculabetter and may be able to better detect glaucoma caseswhere macular loss occurs early. Thus, GCC and NFLparameters may be complementary. In our preliminary in-vestigation with the Venn diagram (Fig 7), the addition ofGCC data to NFL increased detection rate from 78% to 87%in the PG group and from 45% to 56% in the PPG group.We will further study whether a composite parameter in-corporating both FD-OCT NFL and GCC parameters couldsignificantly increase diagnostic accuracy. The combinationof diagnostic parameters from different anatomic areas havebeen found to boost diagnostic accuracy in previous stud-ies.39,46
Wider and finer sampling of the macular regions in �1second was made possible by the higher speed of FD-OCT.This facilitated the analysis of patterns of GCC loss. Wedesigned several pattern-based parameters that looked atdifferent aspects of the GCC loss pattern and have thepotential to be used in a complementary fashion. The SIDparameter was designed to detect cases where GCC loss isasymmetric between superior and inferior macular regions.The GLV and FLV parameters sum up the volume of GCCloss in the macula with differing levels of focality. The FLV
parameter is more focal because it only sums loss in regions2312
where the GCC is thin in both absolute (GCC �normal) andrelative (PD �5th percentile) terms. The PCV parameter ispurely based on the PD map and detects any change in theGCC pattern. We found that FLV and GLV had higherdiagnostic accuracy than the simple average for the diagno-sis of PG. This must mean that, in some cases, patternparameters are more sensitive or more specific. For exam-ple, pattern parameters could be more sensitive in eyes thathave started with an above average GCC thickness andwhere GCC loss is focal rather than diffuse (example shownin Fig 6; available online at http://aaojournal.org). Patternparameters could be more specific in a normal eye that hadat baseline a thinner GCC with a normal distribution pattern.
An advantage of the GCC map is that it could be corre-lated with VF defects point by point. When they correspond,one may be more confident that the defects are real rather thanartifacts. An example of this correspondence was shown inFigure 4. Each millimeter on the retina corresponds to about3.5° on the VF. Therefore the GCC map (7�6 mm) sub-tends about 11° superiorly and inferiorly, 10° nasally, and15° temporally. It covers about half of the area of thestandard Humphrey 24-2 VF (Fig 4E), and is up/downreversed relative to the VF owing to optical projection in theeye. The example in Figure 4 showed that in the case ofend-stage VF defect (�35 dB), the fractional GCC loss wasapproximately 50%. Possibly residual glial tissue maintains50% thickness, even when nearly all ganglions cells were lost.
One of the limitations of the study is that the normal groupwas used to both define the normal reference GCC pattern andassess diagnostic specificity. This could theoretically cause afalse inflation of the specificity and AROC values of the GCCpattern parameters. However, we believe this effect was prob-ably very small because there is no reason why the GCCdistribution pattern would vary between normal populations,and we had a sufficient number of normal participants to obtaina smooth normal reference GCC map (Fig 3F; available onlineat http://aaojournal.org) with a tight standard error of 0.9 �m.Nevertheless, a separate study with an independent populationis needed to confirm our conclusions. The GCC segmentationand the pattern parameters described herein have been licensedto Optovue, Inc. The GCC map and average was released inRTVue software version 3.0 and the pattern parameters werereleased in version 4.0. We invite other investigators to use thecommercially released software to validate our findings.
In summary, we found that GCC measurements withFD-OCT have better diagnostic accuracy and repeatabilitycompared with MR measurements by either TD-OCT orFD-OCT. Analysis of GCC loss pattern further boosteddiagnostic accuracy. Independent investigations are neededto validate the findings of this pilot study.
References
1. Quigley HA, Dunkelberger GR, Green WR. Retinal ganglioncell atrophy correlated with automated perimetry in humaneyes with glaucoma. Am J Ophthalmol 1989;107:453–64.
2. Quigley HA, Miller NR, George T. Clinical evaluation ofnerve fiber layer atrophy as an indicator of glaucomatous optic
nerve damage. Arch Ophthalmol 1980;98:1564–71.
Tan et al � FD-OCT Mapping of Macular Ganglion Cell Loss for Glaucoma Diagnosis
3. Sommer A, Miller NR, Pollack I, et al. The nerve fiber layer inthe diagnosis of glaucoma. Arch Ophthalmol 1977;95:2149–56.
4. Sommer A, Quigley HA, Robin AL, et al. Evaluation of nervefiber layer assessment. Arch Ophthalmol 1984;102:1766–71.
5. Pederson JE, Anderson DR. The mode of progressive disccupping in ocular hypertension and glaucoma. Arch Ophthal-mol 1980;98:490–5.
6. Sommer A, Katz J, Quigley HA, et al. Clinically detectablenerve fiber atrophy precedes the onset of glaucomatous fieldloss. Arch Ophthalmol 1991;109:77–83.
7. Quigley HA, Katz J, Derick RJ, et al. An evaluation of opticdisc and nerve fiber layer examinations in monitoring pro-gression of early glaucoma damage. Ophthalmology 1992;99:19 –28.
8. Airaksinen PJ, Drance SM, Douglas GR, et al. Diffuse andlocalized nerve fiber loss in glaucoma. Am J Ophthalmol1984;98:566–71.
9. Harwerth RS, Carter-Dawson L, Shen F, et al. Ganglion celllosses underlying visual field defects from experimental glau-coma. Invest Ophthalmol Vis Sci 1999;40:2242–50.
10. Zeimer R, Asrani S, Zou S, et al. Quantitative detection ofglaucomatous damage at the posterior pole by retinal thicknessmapping: a pilot study. Ophthalmology 1998;105:224–31.
11. Huang D, Swanson EA, Lin CP, et al. Optical coherencetomography. Science 1991;254:1178–81.
12. Bagga H, Greenfield DS, Knighton RW. Macular symmetrytesting for glaucoma detection. J Glaucoma 2005;14:358–63.
13. Wollstein G, Schuman JS, Price LL, et al. Optical coherencetomography (OCT) macular and peripapillary retinal nervefiber layer measurements and automated visual fields. Am JOphthalmol 2004;138:218–25.
14. Lederer DE, Schuman JS, Hertzmark E, et al. Analysis ofmacular volume in normal and glaucomatous eyes using op-tical coherence tomography. Am J Ophthalmol 2003;135:838–43.
15. Ishikawa H, Stein DM, Wollstein G, et al. Macular segmen-tation with optical coherence tomography. Invest OphthalmolVis Sci 2005;46:2012–7.
16. Tan O, Li G, Lu AT, et al. Mapping of macular substructureswith optical coherence tomography for glaucoma diagnosis.Ophthalmology 2008;115:949–56.
17. Wojtkowski M, Srinivasan V, Fujimoto JG, et al. Three-dimensional retinal imaging with high-speed ultrahigh-resolution optical coherence tomography. Ophthalmology2005;112:1734 – 46.
18. Leitgeb R, Hitzenberger CK, Fercher AF. Performance ofFourier domain vs. time domain optical coherence tomogra-phy. Opt Express [serial online] 2003;11:889–94. Availableat: http://www.opticsinfobase.org/oe/abstract.cfm?uri�oe-11-8-889. Accessed May 3, 2009.
19. Choma MA, Sarunic MV, Yang C, Izatt JA. Sensitivity ad-vantage of swept-source and Fourier domain optical coherencetomography. Opt Express [serial online] 2003;11:2183–9.Available at: http://www.opticsinfobase.org/oe/abstract.cfm?uri�oe-11-18-2183. Accessed May 3, 2009.
20. Wojtkowski M, Leitgeb R, Kowalczyk A, et al. In vivo humanretinal imaging by Fourier domain optical coherence tomog-raphy. J Biomed Opt 2002;7:457–63.
21. Wojtkowski M, Kowalczyk A, Leitgeb R, Fercher AF. Fullrange complex spectral optical coherence tomography tech-nique in eye imaging. Opt Lett 2002;27:1415–7.
22. de Boer JF, Cense B, Park BH, et al. Improved signal-to-noiseratio in spectral-domain compared with time-domain opticalcoherence tomography. Opt Lett 2003;28:2067–9.
23. Wojtkowski M, Bajraszewski T, Targowski P, Kowalczyk A.
Real-time in vivo imaging by high-speed spectral opticalcoherence tomography. Opt Lett 2003;28:1745–7.
24. Yun SH, Tearney GJ, Bouma BE, et al. High-speed spectral-domain optical coherence tomography at 1.3 mum wave-length. Opt Express [serial online] 2003;11:3598–604. Avail-able at: http://www.opticsinfobase.org/oe/abstract.cfm?uri�oe-11-26-3598. Accessed May 3, 2009.
25. Nassif N, Cense B, Park BH, et al. In vivo human retinalimaging by ultrahigh-speed spectral domain optical coherencetomography. Opt Lett 2004;29:480–2.
26. Nassif NA, Cense B, Park BH, et al. In vivo high-resolutionvideo-rate spectral-domain optical coherence tomography ofthe human retina and optic nerve. Opt Express [serial online]2004;12:367–76. Available at: http://www.opticsinfobase.org/oe/abstract.cfm?uri�oe-12-3-367. Accessed May 3, 2009.
27. Chen TC, Cense B, Pierce MC, et al. Spectral domain opticalcoherence tomography: ultra-high speed, ultra-high resolutionophthalmic imaging. Arch Ophthalmol 2005;123:1715–20.
28. Brusini P, Filacorda S. Enhanced Glaucoma Staging System(GSS 2) for classifying functional damage in glaucoma. JGlaucoma 2006;15:40–6.
29. Liang KY, Zeger SL. Longitudinal data analysis using gener-alized linear models. Biometrika 1986;73:13–22.
30. Laird NM, Ware JH. Random-effects models for longitudinaldata. Biometrics 1982;38:963–74.
31. Williams RL. A note on robust variance estimation for cluster-correlated data. Biometrics 2000;56:645–6.
32. Rao JN, Scott AJ. A simple method for the analysis of clus-tered binary data. Biometrics 1992;48:577–85.
33. Obuchowski NA. Nonparametric analysis of clustered ROCcurve data. Biometrics 1997;53:567–78.
34. McCullagh P, Nelder J. Generalized Linear Models. 2nd ed.London: Chapman and Hall; 1989:21–44. Monographs onStatistics and Applied Probability. vol. 37.
35. Snijders T, Bosker R. Multilevel Analysis: An Introduction toBasic and Advanced Multilevel Modeling. London: Sage;1999:86.
36. Cinelli RA, Tozzini V, Pellegrini V, et al. Coherent dynamicsof photoexcited green fluorescent proteins. Phys Rev Lett2001;86:3439–42.
37. Warmke J, Drysdale R, Ganetzky B. A distinct potassiumchannel polypeptide encoded by the Drosophila eag locus.Science 1991;252:1560–2.
38. DeLong ER, DeLong DM, Clarke-Pearson DL. Comparingthe areas under two or more correlated receiver operatingcharacteristic curves: a nonparametric approach. Biometrics1988;44:837–45.
39. Lu AT, Wang M, Varma R, et al, Advanced Imaging forGlaucoma Study Group. Combining nerve fiber layer param-eters to optimize glaucoma diagnosis with optical coherencetomography. Ophthalmology 2008;115:1352–7.
40. Deleon-Ortega JE, Arthur SN, McGwin G Jr, et al. Dis-crimination between glaucomatous and nonglaucomatouseyes using quantitative imaging devices and subjectiveoptic nerve head assessment. Invest Ophthalmol Vis Sci2006;47:3374 – 80.
41. Glovinsky Y, Quigley H, Pease ME. Foveal ganglion cell lossis size dependent in experimental glaucoma. Invest Ophthal-mol Vis Sci 1993;34:395–400.
42. Leung CK, Chan WM, Yung WH, et al. Comparison ofmacular and peripapillary measurements for the detection ofglaucoma: an optical coherence tomography study. Ophthal-mology 2005;112:391–400.
43. Greenfield DS, Bagga H, Knighton RW. Macular thicknesschanges in glaucomatous optic neuropathy detected using optical
coherence tomography. Arch Ophthalmol 2003;121:41–6.2313

Ophthalmology Volume 116, Number 12, December 2009
44. Guedes V, Schuman JS, Hertzmark E, et al. Optical coher-ence tomography measurement of macular and nerve fiberlayer thickness in normal and glaucomatous human eyes.Ophthalmology 2003;110:177– 89.
45. Medeiros FA, Zangwill LM, Bowd C, et al. Evaluation of
retinal nerve fiber layer, optic nerve head, and macular thick-support - Optovue, Inc.; Patent royalty - Zeiss Meditec, Inc.
2314
ness measurements for glaucoma detection using opticalcoherence tomography. Am J Ophthalmol 2005;139:44–55.
46. Zangwill LM, Chan K, Bowd C, et al. Heidelberg retina tomo-graph measurements of the optic disc and parapapillary retina fordetecting glaucoma analyzed by machine learning classifiers.
Invest Ophthalmol Vis Sci 2004;45:3144–51.Footnotes and Financial Disclosures
Originally received: July 7, 2008.Final revision: May 12, 2009.Accepted: May 13, 2009.Available online: September 10, 2009. Manuscript no. 2008-820.1 Doheny Eye Institute and Department of Ophthalmology, Keck School ofMedicine, University of Southern California, Los Angeles, California.2 Department of Ophthalmology, University of Pittsburgh School of Med-icine, Pittsburgh, Pennsylvania.
Financial Disclosure(s):David Huang - Patent royalty, stock options, travel support, and grant
Joel S. Schuman – Lecturer - Optovue, Inc.; Patent royalty, travel support,and grant - Carl Zeiss Meditec, Inc.
Ou Tan - Patent royalty, grant support - Optovue, Inc.
Vikas Chopra - Travel support - Optovue, Inc.
Supported by NIH grants R01 EY013516 and P30 EY03040, a grant fromResearch to Prevent Blindness, and a grant from Optovue, Inc.
Vikas Chopra and Ake Lu made equal contributions to the manuscript.
Correspondence:Ou Tan, PhD, Doheny Eye Institute, DVRC160-C, 1355 San Pablo Street,
Los Angeles, CA 90033. E-mail: [email protected].
Tan et al � FD-OCT Mapping of Macular Ganglion Cell Loss for Glaucoma Diagnosis
Figure 3. Image processing steps in the automated measurement of gangtomography (OCT) cross-section from the GCC scan is shown. B, The Ospeckle and speed processing. The photoreceptor pigment epithelium cojunction (blue line) was detected from within the PPC. The inner limited(yellow line) were also detected. Blood vessel shadowed axial-scans (a-sboundary lines. D, Macular GCC thickness map was obtained by interpopattern. E, The GCC map was recentered on the foveal depression. Unreinclude the foveal area (1.5 mm diameter), top and bottom 0.5 mm, andGCC map is averaged from all eyes in the normal group.
lion cell complex (GCC) and retinal thickness. A, Vertical optical coherenceCT image was low-pass filtered and resampled at lower definition to suppress
mplex (PPC, blue line) was identified. C, The inner segment/outer segmentmembrane (ILM; green line) and outer boundary of the outer plexiform layer
cans; red circle) were replaced with adjacent a-scans to avoid interruption oflation of the GCC profiles from the 16 OCT cross-sections in the GCC scanliable portions of the map were removed (cropped out on map shown). Thesethe corner regions with distance from map center �3.5 mm. F, The reference
2314.e1
Ophthalmology Volume 116, Number 12, December 2009
Figure 6. A preperimetric glaucoma case example. A, Ganglion cell complex (GCC) fraction deviation map. Some of the GCC parameters were abnormal(average � 82.5 �m; P�5%; focal loss volume � 4.9%; P�0.5%; global loss volume � 13.2%; P�0.5%; pattern coefficient of variation � 13%; P�5%;superior–inferior difference � �12.1 �m; P�0.5%). B, Disc photograph showed mild thinning of the superotemporal rim. C, Visual field pattern deviation
map showed scattered shallow depressions that were within the range of normal variation.Table 3. Repeatability of Diagnostic Parameters
Diagnostic Parameters
Normal Preperimetric Glaucoma Perimetric Glaucoma
ICC SD CV ICC SD CV ICC SD CV
RTVue FD-OCTGCC-AVG (�m) 0.98 1.03 1.09 0.99 1.06 1.23 0.99 0.98 1.25GCC-FLV (%) 0.91 0.38 0.96 0.59 0.95 1.01GCC-GLV (%) 0.98 0.68 0.99 0.90 0.99 1.01GCC-PCV 0.85 0.01 0.92 0.01 0.93 0.01GCC-SID (�m) 0.94 1.12 0.95 1.24 0.97 1.61MR-AVG (�m) 0.99 1.20 0.52 0.99 1.06 0.49 0.99 1.36 0.65
Stratus TD-OCTNFL-AVG (�m) 0.96 1.71 1.72 0.99 1.52 1.75 0.98 2.22 2.86MR-AVG (�m) 0.97 2.17 0.91 0.93 3.69 1.61 0.96 3.01 1.36
AVG � average; CV � coefficient of variation; FD-OCT � Fourier-domain optical coherence tomography; FLV (%) � focal loss volume expressed asa percentage of the average GCC volume in the normal group; GCC � ganglion cell complex thickness; GLV � global loss volume; ICC � intraclasscorrelation; MR � macular retina thickness; NFL � nerve fiber layer thickness; PCV � pattern coefficient of variation; SD � pooled standard deviation;
SID � superior–inferior difference; TD-OCT � time-domain optical coherence tomography.2314.e2