Effect of nerve graft porosity on the refractory period of regenerating nerve fibers
13
Electrophysiology and morphometry of the Aa- and Ah-fiber populations in the normal and regenerating rat sciatic nerve Carmen L.A.M. Vleggeert-Lankamp, a, * Rutgeris J. van den Berg, b Hans K.P. Feirabend, a Egbert A.J.F. Lakke, a Martijn J.A. Malessy, a and Ralph T.W.M. Thomeer a a Neuroregulation Group, Department of Neurosurgery, Leiden University Medical Centre (LUMC), NL-2300 RC Leiden, The Netherlands b Department of Neurophysiology, Leiden University Medical Centre (LUMC), NL-2300 RC Leiden, The Netherlands Received 14 August 2003; revised 12 January 2004; accepted 22 January 2004 Available online 2 April 2004 Abstract We studied electrophysiological and morphological properties of the Aa- and Ah-fibers in the regenerating sciatic nerve to establish whether these fiber types regenerate in numerical proportion and whether and how the electrophysiological properties of these fiber types are adjusted during regeneration. Compound action potentials were evoked from isolated sciatic nerves 12 weeks after autografting. Nerve fibers were gradually recruited either by increasing the stimulus voltage from subthreshold to supramaximal levels or by increasing the interval between two supramaximal stimuli to obtain the cumulative distribution of the extracellular firing thresholds and refractory periods, respectively. Thus, the mean conduction velocity (MCV), the maximal charge displaced during the compound action potential ( Q max ), the mean firing threshold (V 50 ), and the mean refractory period (t 50 ) were determined. The number of myelinated nerve fibers and their fiber diameter frequency distributions were determined in the peroneal nerve. Mathematical modeling applied to fiber recruitment and diameter distributions allowed discrimination of the Aa- and Ah-fiber populations. In regenerating nerves, the number of Aa-fibers increased fourfold while the number of Ah-fibers did not change. In regenerating Aa- and Ah-fibers, the fiber diameter decreased and V 50 and t 50 increased. The regenerating Aa-fibers’ contribution to Q max decreased considerably while that of the Ah-fibers remained the same. Correlation of the electrophysiological data to the morphological data provided indications that the ion channel composition of both the Aa- and Ah-fibers are altered during regeneration. This demonstrates that combining morphometric and electrophysiological analysis provides better insight in the changes that occur during regeneration. D 2004 Elsevier Inc. All rights reserved. Keywords: Regeneration; Nerve graft; Electrophysiology; Morphometry; Transplant; Aa- and Ah-fibers Introduction The evaluation of the efficacy of the experimental repair of peripheral nerve lesions often focuses on the presence of regenerating nerve fibers in the distal nerve stump. The number of regenerated nerve fibers, whether or not com- bined with the nerve fiber diameter, is generally considered to be the decisive factor for the success of nerve repair. Although it is generally presumed that regenerating nerve fibers are able to conduct an action potential, research in this area is only performed parsimoniously. Though it is well known that during regeneration the mean conduction veloc- ity decreases, little is known about other electrophysiolog- ical parameters like firing threshold and refractory period in general (Fields and Ellisman, 1986a; Smith, 1978), and nothing is known about these parameters with respect to the Aa- and Ah-fibers. Studies that relate morphological to electrophysiological data are likewise scarce (Archibald et al., 1995; Chamberlain et al., 1998; Fields and Ellisman, 1986a, 1986b; Keeley et al., 1993). In regenerating rat sciatic nerves, the number of nerve fibers either increases (Ansselin et al., 1997; Chamberlain et al., 2000; Francel et al., 1997, 2003; Wang et al., 2001; Yoshii et al., 2001) or remains the same (Evans et al., 1999; Keeley et al., 1993; Le Beau et al., 1988) while the average 0014-4886/$ - see front matter D 2004 Elsevier Inc. All rights reserved. doi:10.1016/j.expneurol.2004.01.019 * Corresponding author. Neuroregulation Group, Department of Neurosurgery, Leiden University Medical Centre, PO Box 9600, NL- 2300 RC Leiden, The Netherlands. Fax: +31-71-524-8221. E-mail address: [email protected] (C.L.A.M. Vleggeert-Lankamp). www.elsevier.com/locate/yexnr Experimental Neurology 187 (2004) 337 – 349
-
Upload
independent -
Category
Documents
-
view
3 -
download
0
Transcript of Effect of nerve graft porosity on the refractory period of regenerating nerve fibers

www.elsevier.com/locate/yexnr
Experimental Neurology 187 (2004) 337–349
Electrophysiology and morphometry of the Aa- and Ah-fiber populationsin the normal and regenerating rat sciatic nerve
Carmen L.A.M. Vleggeert-Lankamp,a,* Rutgeris J. van den Berg,b Hans K.P. Feirabend,a
Egbert A.J.F. Lakke,a Martijn J.A. Malessy,a and Ralph T.W.M. Thomeera
aNeuroregulation Group, Department of Neurosurgery, Leiden University Medical Centre (LUMC), NL-2300 RC Leiden, The NetherlandsbDepartment of Neurophysiology, Leiden University Medical Centre (LUMC), NL-2300 RC Leiden, The Netherlands
Received 14 August 2003; revised 12 January 2004; accepted 22 January 2004
Available online 2 April 2004
Abstract
We studied electrophysiological and morphological properties of the Aa- and Ah-fibers in the regenerating sciatic nerve to establish
whether these fiber types regenerate in numerical proportion and whether and how the electrophysiological properties of these fiber types are
adjusted during regeneration.
Compound action potentials were evoked from isolated sciatic nerves 12 weeks after autografting. Nerve fibers were gradually recruited
either by increasing the stimulus voltage from subthreshold to supramaximal levels or by increasing the interval between two supramaximal
stimuli to obtain the cumulative distribution of the extracellular firing thresholds and refractory periods, respectively. Thus, the mean
conduction velocity (MCV), the maximal charge displaced during the compound action potential (Qmax), the mean firing threshold (V50), and
the mean refractory period (t50) were determined. The number of myelinated nerve fibers and their fiber diameter frequency distributions
were determined in the peroneal nerve.
Mathematical modeling applied to fiber recruitment and diameter distributions allowed discrimination of the Aa- and Ah-fiberpopulations. In regenerating nerves, the number of Aa-fibers increased fourfold while the number of Ah-fibers did not change. In
regenerating Aa- and Ah-fibers, the fiber diameter decreased and V50 and t50 increased. The regenerating Aa-fibers’ contribution to Qmax
decreased considerably while that of the Ah-fibers remained the same. Correlation of the electrophysiological data to the morphological data
provided indications that the ion channel composition of both the Aa- and Ah-fibers are altered during regeneration. This demonstrates that
combining morphometric and electrophysiological analysis provides better insight in the changes that occur during regeneration.
D 2004 Elsevier Inc. All rights reserved.
Keywords: Regeneration; Nerve graft; Electrophysiology; Morphometry; Transplant; Aa- and Ah-fibers
Introduction area is only performed parsimoniously. Though it is well
The evaluation of the efficacy of the experimental repair
of peripheral nerve lesions often focuses on the presence of
regenerating nerve fibers in the distal nerve stump. The
number of regenerated nerve fibers, whether or not com-
bined with the nerve fiber diameter, is generally considered
to be the decisive factor for the success of nerve repair.
Although it is generally presumed that regenerating nerve
fibers are able to conduct an action potential, research in this
0014-4886/$ - see front matter D 2004 Elsevier Inc. All rights reserved.
doi:10.1016/j.expneurol.2004.01.019
* Corresponding author. Neuroregulation Group, Department of
Neurosurgery, Leiden University Medical Centre, PO Box 9600, NL-
2300 RC Leiden, The Netherlands. Fax: +31-71-524-8221.
E-mail address: [email protected] (C.L.A.M. Vleggeert-Lankamp).
known that during regeneration the mean conduction veloc-
ity decreases, little is known about other electrophysiolog-
ical parameters like firing threshold and refractory period in
general (Fields and Ellisman, 1986a; Smith, 1978), and
nothing is known about these parameters with respect to
the Aa- and Ah-fibers. Studies that relate morphological to
electrophysiological data are likewise scarce (Archibald et
al., 1995; Chamberlain et al., 1998; Fields and Ellisman,
1986a, 1986b; Keeley et al., 1993).
In regenerating rat sciatic nerves, the number of nerve
fibers either increases (Ansselin et al., 1997; Chamberlain et
al., 2000; Francel et al., 1997, 2003; Wang et al., 2001;
Yoshii et al., 2001) or remains the same (Evans et al., 1999;
Keeley et al., 1993; Le Beau et al., 1988) while the average
C.L.A.M. Vleggeert-Lankamp et al. / Experimental Neurology 187 (2004) 337–349338
diameter decreases (Ansselin et al., 1997; Chamberlain et
al., 2000; Evans et al., 1999; Francel et al., 1997, 2003;
Keeley et al., 1993; Le Beau et al., 1988; Wang et al. 2001,
Yoshii et al. 2001). The increase in the number of fibers is
generally attributed to branching, but it is not known
whether Aa- and Ah-fibers regenerate and branch propor-
tionally. Previous studies in control nerves demonstrate that
the diameter of nerve fibers is inversely related to the firing
threshold (Blair and Erlanger, 1933, Fields and Ellisman,
1986a, 1986b) and to the refractory period (Blair and
Erlanger, 1933, Paintal, 1966). As the diameter decreases
during nerve regeneration, changes of firing threshold and
refractory period are to be expected. In the present study, we
specifically aimed to establish whether the number of Aa-
fibers (comprising both the a-motoneuronal axons and the
Ia/b sensory afferent axons) in the regenerating nerve
increased in proportion to the number of Ah-fibers and
whether and how the electrophysiological properties of
these fiber types are altered during regeneration.
We investigated changes in the composition of the
regenerating nerve with respect to its constituent fiber types,
both electrophysiologically and morphologically. The extra-
cellular firing threshold, refractory period, and charge dis-
placement during a compound action potential in the rat
sciatic nerve were related to the number and diameter of
nerve fibers, both in control and autografted nerves. Math-
ematical models were applied to the electrophysiological
and morphometrical data to separate the contribution of the
Aa- and Ah-fibers.
Materials and methods
Animal model
Female Wistar rats (HsdCpb:WU), weighing 220–240 g
and housed in flat-bottomed cages in a central animal care
facility, were maintained on a 12-h light cycle regime at a
controlled temperature of 22jC. Standard rat chow and
water were available ad libitum. Autograft experiments were
performed on the left sciatic nerve. Unoperated rats served
as controls. All experiments were performed in accordance
with international and local laws governing the protection of
animals used for experimental purposes (UDEC 99105).
Autograft procedure
For the grafting procedure, rats were given a general
inhalation anesthesia of isoflurane in a 1:1 mixture of O2
and N2O. To improve anesthesia and to diminish postoper-
ative pain, buprenorphine (0.1 ml of 0.3 mg/ml; TemgesicR,Schering-Plough, Maarssen, The Netherlands) was injected
intraperitoneally. All animals were operated in the same
time span by the same surgeon. Under aseptic conditions,
the left sciatic nerve was exposed and isolated at the
midthigh level via a dorsal approach and a 6-mm nerve
segment was resected. This nerve segment was reversed
longitudinally and grafted into the gap with four epineurial
sutures (10–0 monofilament nylon) at each end. The
postoperative survival period was 12 weeks.
Electrophysiological analysis
To collect the control (n = 12) and autografted (n = 12)
nerves, the rats were anaesthetized as described above. As
long as possible, a segment of the (autografted) sciatic nerve
was resected and the animals were euthanized. The isolated
(autografted) nerve was immersed in a standard solution
(see below) on a cooled (4jC) glass plate and cleaned under
a dissection microscope. The epineurium was carefully
resected. In the autografted nerves, we choose to remove
only 5–10 mm of epineurium from the proximal and distal
ends and to leave the graft, located entirely in the middle
pool (see below), intact.
The nerve was mounted across the five pools of the five
compartment moist chamber (Van den Berg et al., 1994).
The pools were filled with standard solution composed of
140 mM NaCl, 3.0 mM KCl, 1.5 mM CaCl2, 1.25 mM
MgSO4, 11.0 mM glucose, and 5.0 mM Tris buffer (pH 7.4,
20jC). The proximal nerve crossed pools 1 and 2 and the
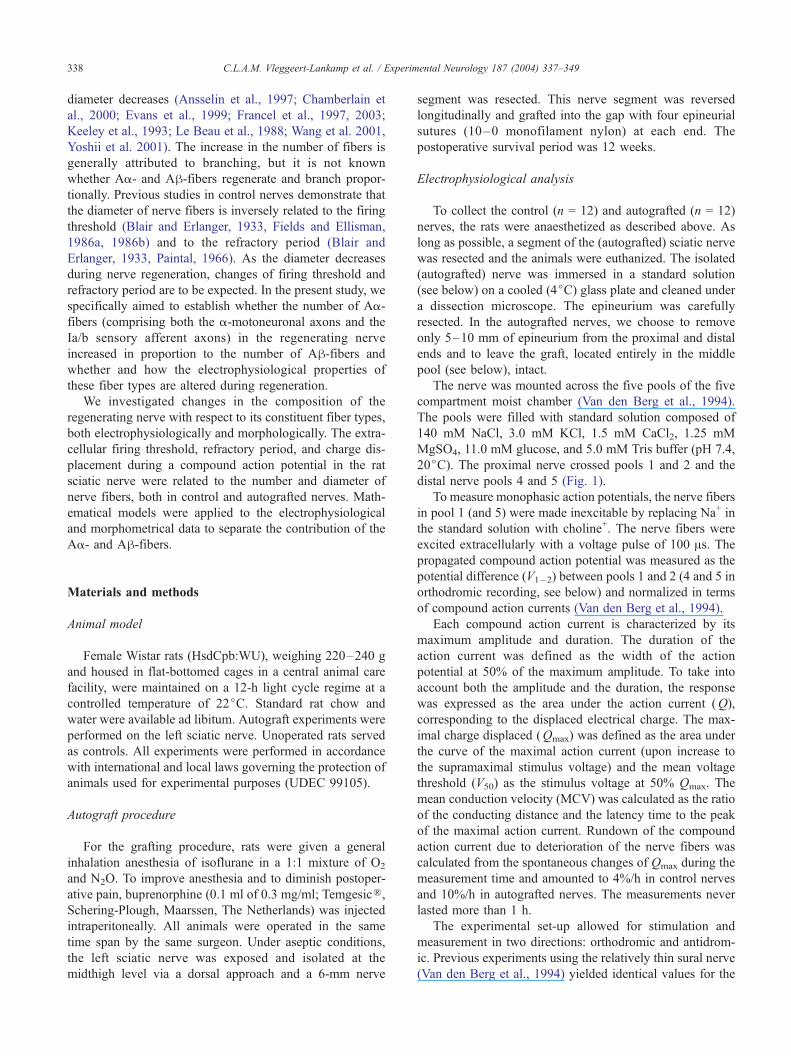
distal nerve pools 4 and 5 (Fig. 1).
To measure monophasic action potentials, the nerve fibers
in pool 1 (and 5) were made inexcitable by replacing Na+ in
the standard solution with choline+. The nerve fibers were
excited extracellularly with a voltage pulse of 100 As. Thepropagated compound action potential was measured as the
potential difference (V1–2) between pools 1 and 2 (4 and 5 in
orthodromic recording, see below) and normalized in terms
of compound action currents (Van den Berg et al., 1994).
Each compound action current is characterized by its
maximum amplitude and duration. The duration of the
action current was defined as the width of the action
potential at 50% of the maximum amplitude. To take into
account both the amplitude and the duration, the response
was expressed as the area under the action current (Q),
corresponding to the displaced electrical charge. The max-
imal charge displaced (Qmax) was defined as the area under
the curve of the maximal action current (upon increase to
the supramaximal stimulus voltage) and the mean voltage
threshold (V50) as the stimulus voltage at 50% Qmax. The
mean conduction velocity (MCV) was calculated as the ratio
of the conducting distance and the latency time to the peak
of the maximal action current. Rundown of the compound
action current due to deterioration of the nerve fibers was
calculated from the spontaneous changes of Qmax during the
measurement time and amounted to 4%/h in control nerves
and 10%/h in autografted nerves. The measurements never
lasted more than 1 h.
The experimental set-up allowed for stimulation and
measurement in two directions: orthodromic and antidrom-
ic. Previous experiments using the relatively thin sural nerve
(Van den Berg et al., 1994) yielded identical values for the

Fig. 1. Moist chamber schematic. The diagram on the left depicts the five compartments of the moist chamber drawn to scale. A nerve, crossing the five baths,
is drawn to demonstrate its position. The pools are numbered 1–5. The proximal end of the sciatic nerve segment crosses pools 1 and 2, the grafted segment is
entirely in pool 3, and the distal end of the sciatic nerve segment, which branches into the peritoneal and tibial nerves, crosses pools 4 and 5. The electrical
circuit is configured for antidromic stimulation. The electrodes are represented by solid circles. The stimulus voltage is the output of a voltage-driven high-
voltage amplifier, applied between pools 4 (cathode) and 5. The central pool, 3, is clamped at ground potential by a feedback amplifier. Electrodes connect
pools 1 and 2 to the preamplifiers (triangles), which outputs are fed into a differential amplifier to measure the voltage difference between the two pools, and
this signal is digitized by the ADC of the Digidata 1200 interface (Axon Instruments). With another pair of electrodes, a current from a voltage-driven current
source (intertwined circles) can be injected through pools 1 and 2 to measure the magnitude of the resistance R1– 2. Both the current source and the high-voltage
amplifier are driven by the DAC of the Digidata 1200. The adjacent photograph depicts a control nerve positioned over the pools of the moist chamber. Its ‘S’
shape is clearly visible and corresponds to that within the highlighted central section of the previous diagram.
C.L.A.M. Vleggeert-Lankamp et al. / Experimental Neurology 187 (2004) 337–349 339
action current conducted either ortho- or antidromically.
Stimulation of the thick proximal end of the sciatic nerve
(orthodromic) resulted in a large capacitive current artifact.
In control nerves, the artifact partially overlapped with the
action currents. In autografted nerves, where the action
current appeared later thus allowing better separation from
the stimulus artifact, both directions of stimulation yielded
comparable values for Qmax (P = 0.061) and MCV (P =
0.377). The distal nerve stump of the sciatic nerve is
branched into the peroneal and tibial nerve, resulting in a
lower resistance between the recording pools, hence in a
worse signal to noise ratio in orthodromic stimulation. We
therefore choose to base our observations on the measure-
ments of Q after antidromic stimulation, as did other authors
using a similar experimental paradigm (Fugleholm et al.,
1994; Kakinoki et al., 1998; Rosen et al., 1992).
Stimulus–recruitment
To gain insight in the fiber type composition of the
nerves, the constituent fibers were gradually recruited by
increasing the stimulus voltage from subthreshold to supra-
maximal levels. The extracellular firing threshold of nerve
fibers is inversely proportional to the fiber diameter (Blair
and Erlanger, 1933; Jack et al., 1983; Rushton, 1951).
Although the recruitment order will also be influenced by
the geometrical spread of the Ranvier nodes, it was shown
in rat nerves that the thicker nerve fibers are likely to be
recruited before the thinner ones upon gradual increase of
the stimulus (Veltink et al., 1988).
To derive the contributions of the Aa- and Ah-fibers tothe compound action current, we adopted the method of
Van den Berg et al. (1994). The gradual recruitment of the
Aa-fibers (comprising both the a-motoneuronal axons and
the Ia/b sensory afferent axons) as a function of the
stimulus voltage (stimulus–recruitment relation) is de-
scribed by the cumulative normal distribution of the Aa
threshold voltages
QaðV Þ ¼1
2Qmax;a 1þ erf
ðV � V50;aÞka
� �ð1Þ
where Qa(V) is the integral of the Aa action current, and
Qmax,a is the value of Qa(V) at supramaximal stimulus. The
parameter V50,a (the mean firing threshold or, more pre-
cisely, the mean threshold voltage) is the stimulus voltage at
50% Qmax,a. The ka reflects the slope of the recruitment

C.L.A.M. Vleggeert-Lankamp et al. / Experimental Neurology 187 (2004) 337–349340
curve at V50,a. The recruitment of the Ah-fibers can be
described by the same equation. An ‘‘erf’’ function is an
error function encountered in integrating a normal distribu-
tion (Abramowitz and Stegun, 1965).
At short conduction distances, when the Aa- and Ah-action currents are overlapping, the contributions of Aa-
and Ah-fibers can be derived from the compound action
current by fitting the sum of two cumulative normal
distributions of voltage thresholds to the stimulus–recruit-
ment curve (Van den Berg et al., 1994):
QðV Þ ¼ 1
2Qmax;a 1þ erf
ðV � V50;aÞka
� ��
þ Qmax;h 1þ erfðV � V50;hÞ
kh
� ��ð2Þ
Q(V) is the integral of the compound action current. Fitting
Eq. (2) to the data recorded in the stimulus–recruitment
experiments yielded the values of Qmax,a, Qmax,h, V50,a,
and V50,h.
To evaluate the validity of fitting with Eq. (2) instead of
Eq. (1), Akaike’s Information Criterium (AIC) was used.
The AIC adjudges a numerical value to the fit, which is a
measure for the quality of the fit. The lower the value, the
better the fit. Moreover, residual values of the fittings were
determined to illustrate the quality of the fit.
Interpulse time–recruitment
To study the refractory period, we applied a similar
approach. Compound action currents were recorded at
increasing time intervals between two identical supramax-
imal voltage pulses (100 As). At short intervals, most to all
nerve fibers are refractory and will not fire in response to a
second stimulus. However, when the time span between
pulses (interpulse time) gradually increases, progressively
more nerve fibers will have recovered from refractoriness
and can contribute to the second action current. The mean
refractory period (t50) was defined as the stimulus interval at
which the area under the curve of the second action current
amounted to 50% of the area under the curve at the supra-
maximal stimulus voltage.
The contribution of Aa- and Ah-fibers could also be
derived from the second compound action current in re-
sponse to gradually increasing stimulus intervals. The re-
fractory period of nerve fibers is inversely proportional to
the conduction velocity and thus to the fiber diameter
(Paintal, 1966). Depending on the stimulus interval, the
second action current will thus be composed of varying
contributions of Aa- and Ah-fibers. After the shorter
stimulus intervals, predominantly the thicker Aa-fibers will
be excited, whereas after larger intervals both the Aa- and
Ah-fibers will be excited. Thus, in analogy to stimulus–
recruitment, the order of recruitment will be reflected in the
interpulse time–recruitment relation. Contrary to stimulus–
recruitment, the spread of the Ranvier nodes at the stimu-
lation site does not play a role as only supramaximal stimuli
are applied.
Assuming there is a gaussian distribution of the refractory
periods of both the Aa- and Ah-fibers (cf. Kimura, 1981),
the relation between Q and the interpulse time Dt (interpulse
time–recruitment relation) should be described by
QðDtÞ ¼ 1
2Qmax;a 1þ erf
ðDt � t50;aÞra
� ��
þ Qmax;h 1þ erfðDt � t50;hÞ
rh
� ��ð3Þ
where Q(Dt) is the integral of the second action current
evoked at interpulse time Dt. Qmax,a and Qmax,h represent the
values ofQa and Qh, respectively, when all Aa- or Ah-fibersare recruited at the maximum stimulus interval; and t50,a and
t50,h represent the mean refractory periods. The ra and rhreflect the slope of the recruitment curve at t50,a and t50,h,
respectively. Eq. (3) was fitted to the data recorded in the
interpulse time–recruitment experiments, and the values of
Qmax,a, Qmax,h, t50,a, and t50,h were estimated. Our descrip-
tion with Eq. (3) was compared with fittings with a function
containing a single erf-function using the AIC.
Morphometrical analysis
As the ratio of myelinated and unmyelinated fibers and
the ratio of myelinated motor and sensory fibers are almost
equal in the sciatic, tibial, and peroneal nerve (Schmalbruch,
1986), we elected to analyze the peroneal nerve only. Since
upon regeneration across sciatic nerve gap lesions of less
than 8 mm, the ratio of myelinated and unmyelinated fibers
remains the same in the sciatic nerve branches (Jenq and
Coggeshall, 1985), the composition of the peroneal nerve
will arguably remain representative for the composition of
the sciatic nerve.
After the electrophysiological recordings, the sciatic
nerve was stored in a 4% formaldehyde solution. Subse-
quently, 5–10 mm long peroneal nerve samples were
dissected out for morphometric analysis. The immersion
fixation was continued for some days in a modified Kar-
novsky fixative, containing 2% paraformaldehyde and
1.25% glutaraldehyde (Feirabend et al., 1994, 1998). The
tissue samples were osmicated in 1% solution of osmium
tetroxide for 2 h under constant agitation. Before and after
osmication, the tissue was repeatedly rinsed in 0.1 M
phosphate-buffered saline at pH 7.2. After gradual dehydra-
tion in ethanol, the osmicated nerve samples were embed-
ded in EponR (Merck, Amsterdam, The Netherlands).
Transverse 1 Am sections were cut on a Reichert ultrami-
crotome (Leica, Rijswijk, The Netherlands) and stained with
a 1% toluidine blue/1% borax solution (Feirabend et al.,
1998). In the autografted group, all peroneal nerves were
evaluated (n = 12) while in the control group aselectly
chosen peroneal nerves were analyzed (n = 4).

C.L.A.M. Vleggeert-Lankamp et al. / Experimental Neurology 187 (2004) 337–349 341
Microscopic video images covering three sample areas of
approximately 21,000 Am2 each (i.e., 50–75% of the total
area of the nerve) were taken at a magnification of �40. All
light microscopically identifiable myelinated fibers in the
sample areas were counted (number of fibers), and their
profile areas (fiber areas) as well as the total surface of the
nerve (nerve area) were measured automatically using a
Zeiss Kontron KS-400 image analyser (Carl Zeiss, Weesp,
The Netherlands) at a magnification of �890. The fiber area
included the area of both the axon and the myelin sheath
profile. The fiber diameter {calculated from the imaginary
circle corresponding to the fiber area [2 M (fiber area / p)]},
Fig. 2. Stimulus– recruitment relations. (A and B) Typical examples of the time co
control (A) and an autografted nerve (B). In each graph, the curves from bottom
voltages. Stimulus artifacts were erased. Due to the virtual cathode effect (Krarup
moves closer to the stimulus artifact. (C and D) Stimulus– recruitment graphs corr
Continuous lines represent the fitted curves. The separate curves of the Aa- and A
fit, small graphs below each main graph demonstrate the differences between me
the mean fiber area (sum of fiber areas per sample / number
of nerve fibers per sample), the fiber density (number of
nerve fibers per 1000 Am2), and the relative area of
interspace [(sample area � the sum of fiber areas per
sample) � 100% / sample area] were calculated. The total
number of fibers per nerve was estimated [nerve area �(number of nerve fibers per sample / sample area)].
Diameters of the nerve fibers were distributed into 180
classes of 0.1 Am each and plotted versus the percentage of
the number of fibers present in that class. The frequency
distribution of the fiber diameters may reflect the two fiber
populations identified by our electrophysiologic recordings.
urse of compound action currents as a function of stimulus voltage of both a
to top represent compound action currents, evoked by increasing stimulus
et al., 1992), upon increasing the voltage stimuli, the onset of the current
esponding to the data given in A and B. Solid circles represent data points.
h-fibers were calculated according to Eq. (2). To illustrate the quality of the
asured and calculated data (residual values).

C.L.A.M. Vleggeert-Lankamp et al. / Experimental Neurology 187 (2004) 337–349342
Given the gaussian distribution of firing thresholds together
with the inverse relation between threshold and fiber diam-
eter, a skewed frequency distribution of diameters for a
single population of nerve fibers can be expected. There-
fore, a log-normal function is likely to describe the distri-
bution of fiber diameters (Feirabend, 1983, Feirabend et al.,
1996). To evaluate the possible contributions of the Aa- and
Ah-fiber populations, the sum of two log-normal functions
was fitted to the fiber diameter size distributions:
FðdÞ ¼ Fmax;ae�
ln2ðd=dFmax;a Þ
2w2a þ Fmax;h e�
ln2ðd=dFmax;hÞ
2w2h ð4Þ
where F(d) is the fiber diameter class frequency, dFmax,athe
fiber diameter most frequently present in the Aa-fiber
population, Fmax,a the fiber diameter class frequency at
dFmax,a, and wa the exponent related to the spread in diameter
of the Aa-fiber population. The description according to Eq.
(4) was compared to fittings with a single log-normal
function using the AIC.
Finally, the area under the resulting fiber diameter
frequency distribution curves for the Aa- and Ah-fiberpopulations was calculated to estimate the percentage and
subsequently the number of nerve fibers in each population.
Statistics
The means of all parameters were calculated and shown
with standard deviations (SD). Paired and unpaired Stu-
dent’s t tests were applied to the means to compare param-
eters. Differences between AICs derived from fits using two
functions and fits using one function were tested for
significance using paired t tests. Kolmogorov–Smirnow
tests were applied to the different nerves and to the different
Table 1
Electrophysiological parameters
Stimulus– recruitment
Control (n = 12) Au
MCV (m/s) 38.7 F 9.0 12
Qmax (pC) 1007 F 262 49
V50 (V) 0.8 F 0.2 2
a h Pah a
Qmax,a/h (pC) 760 F 310 247 F 146 0.001 28
V50,a/h (V) 0.7 F 0.1 1.4 F 0.3 <10�4 1.
Interpulse time– recruitment
Control (n = 12) Au
Qmax (pC) 832 F 182 43
t50 (ms) 2.0 F 0.3 4.
a h Pah a
Qmax,a/h (pC) 640 F 177 193 F 65 <10�4 29
t50,a/h (ms) 1.8 F 0.3 4.0 F 0.4 <10�4 2.
Values are represented as mean F SD. The significance of the differences betwee
fiber classes relevant to the comparison. Unpaired Student’s t tests were applied to
Pah values. Abbreviations used are listed separately.
samples per nerve for comparison of size distributions
(Kolmogorov, 1941; Smirnow, 1948). The SPSS statistical
program, version 10.0, and Origin, version 5.0, were used
for statistical analysis. P values of less than 0.050 were
regarded as significant.
Results
Gross examination
All autografted nerves exhibited a graft in continuity at
12 weeks after surgery. Each autografted nerve was exam-
ined macroscopically and displayed a slight attenuation in
diameter of the grafted part. The proximal and distal nerves
appeared firm and shiny white, and the distal stump did not
display the softening one would expect after wallerian
degeneration (Seckel et al., 1984). Some connective tissue
was present around the coaptation sites; nevertheless, the
autografted nerves could be resected easily.
Electrophysiology
Stimulus–recruitment
Typical examples of the extracellular action currents
measured in control and autografted nerves are represented
in Figs. 2A and B. In response to increasing stimulus
voltages, the amplitude of the monophasic action current
gradually increased until a maximum amplitude was
reached. Both control and autografted nerves displayed this
behavior.
In autografted nerves, the action currents started later
and the latency to the peak action current was longer. As a
tograft (n = 12) P
.5 F 2.6 <10�4
4 F 195 <10�4
.9 F 1.0 <10�4
h Pah Paa Phh
1 F 100 213 F 135 0.125 <10�4 0.571
9 F 0.6 3.8 F 1.1 <10�4 <10�4 <10�4
tograft (n = 12) P
8 F 162 <10�4
9 F 0.7 <10�4
h Pah Paa Phh
2 F 116 146 F 59 0.001 <10�4 0.093
3 F 0.4 6.9 F 1.2 <10�4 0.002 <10�4
n the values is represented as Pah, Paa, and Phh; the subscript indicates the
obtain Paa and Phh values and paired Student’s t tests were applied to obtain

C.L.A.M. Vleggeert-Lankamp et al. / Experimental Neurology 187 (2004) 337–349 343
result, MCV was about three times smaller in autografted
nerves (Table 1). The amplitude of the peak action current
was smaller and the duration of the action current was
longer in autografted nerves at supramaximal stimulus.
Nevertheless, the value of Qmax was less than half the
control value.
The corresponding stimulus–recruitment curves exhibit-
ed two limbs: a steeply rising limb at low levels of the
stimulus voltage, reflecting the excitation of the Aa-fibers,
and a less steeply rising limb at higher stimulus voltages,
reflecting the excitation of the Ah-fibers (Van den Berg et
Fig. 3. Interpulse time–recruitment relations. (A and B) Typical examples of t
supramaximal voltage stimuli, with increasing interpulse times. The data were obta
In each graph, the leftmost curve represents the first action current and the follow
second stimulus at increasing stimulus intervals. Stimulus artifacts were erased. (C
in A and B. Solid circles represent data points. Continuous lines represent the fi
according to Eq. (3). The theoretical data set (Dt = 0, Q = 0) was added to the data
graphs, which illustrates the negligible differences between our own measuremen
al., 1994) (Figs. 2C and D). The curves of the autografted
nerves were conspicuously different from those of the
control nerves: (i) there was a shift to the right, to higher
stimulus voltages; (ii) the initial limb of the curve was less
steep, (iii) and, as mentioned earlier, Qmax was more than
halved. The mean voltage threshold (V50) was higher in
autografted nerves.
Fitting Eq. (3) to the data, it demonstrated that in control
nerves the contribution of the Aa-fibers toQmax (Qmax,a) was
larger than Qmax,h and that the mean threshold voltage of the
Aa-fibers (V50,a) was approximately half of V50,h (Table 1).
he time course of compound action currents, evoked by two consecutive
ined from the same control and autografted nerves as represented in Fig. 2.
ing curves from left to right represent the action currents resulting from the
and D) Interpulse time– recruitment graphs corresponding to the data given
tted curves. The separate curves of the Aa- and Ah-fibers were calculated
. The quality of the fit is shown in the small graphs below each of the main
ts and the calculated data (residual values).

Fig. 4. Light microscopic cross sections of the peroneal nerve of control and
autografted nerves. Transverse 1-Am sections of peroneal nerves were
stained with toluidine blue. Panel A displays the entire cross section of a
control nerve, and panel B displays an enlarged sample of this nerve section
(square), demonstrating the morphology of the nerve in detail. Accordingly,
panel C displays a regenerating nerve and panel D shows this nerve in
detail. The rotation of the samples is indicated with an asterisk in the corner.
C.L.A.M. Vleggeert-Lankamp et al. / Experimental Neurology 187 (2004) 337–349344
In autografted nerves, the Aa-fibers’ contribution to
Qmax (Qmax,a) decreased notably, even becoming compara-
ble to Qmax,h, while Qmax,h did not decrease significantly
(Table 1). As in control nerves, V50,h was about two times
Table 2
Morphometrical parameters
Nerve morphometry
Control (n = 4)
Total no. of fibers 1721 F 37
Fiber diameter (Am) 7.25 F 0.39
Fiber diameter full range (Am) 1.65–15.87
Nerve area (Am2) 1.78�105 F 0.19
Mean fiber area (Am2) 47.93 F 5.05
Mean fiber area full range (Am) 2.13–197.77
Fiber density (no./1000) (Am�2) 9.77 F 1.00
Relative area of interspace (%) 53.5 F 2.0
a h Pah
Fmax,a/h (%) 0.78 F 0.15 1.1 F 0.04 0.003
dFmax,a/h(Am) 9.00 F 0.22 4.36 F 0.25 <10�4
wa/h 0.23 F 0.03 0.46 F 0.05 <10�4
Fiber number 691 1030
The sum of the number of measured fibers in the samples that were used for th
regenerating nerves. Values are represented as mean F SD. The significance of th
The subscript indicates the fiber classes relevant to the comparison. Additionally,
values of the regenerating nerve for the Aa-fiber population, and the significan
significant differences for all parameters ( P < 10�4).
higher than V50,a. However, both values more than doubled
compared to control values.
Both in control and in autografted nerves, the AIC
proved to be smaller (P < 10�4) for two populations
compared to one, and the residual values were small
(Fig. 2C, bottom).
Interpulse time–recruitment
Figs. 3A and B represent the measured action currents as
a function of the interval between two supramaximal volt-
age stimuli in the same control and autografted nerves as
represented in Fig. 2. At increasing interpulse times, the
amplitude of the second action current gradually increased
to a maximum while its duration decreased. Nevertheless,
the area under the curve of the second action current
increased progressively. Both control and autografted nerves
displayed this behavior.
In autografted nerves, initiation of recruitment occurred
at a longer interpulse time. The value of Qmax was half the
value of Qmax in control nerves, in accordance with the
results obtained from the stimulus–recruitment curves
(Table 1).
Figs. 3C and D demonstrate the corresponding interpulse
time–recruitment curves for the control and autografted
nerves. As did the stimulus–recruitment curves, the inter-
pulse time–recruitment curves clearly exhibited two limbs:
a steeply rising limb at short stimulus intervals, reflecting
the excitation of the Aa-fibers, and a less steeply rising limb
at longer stimulus intervals, reflecting the excitation of the
Ah-fibers. The interpulse time–recruitment curve of the
autografted nerves was clearly different from the curve of
the control nerves: (i) there was a shift to the right, to larger
interpulse times; (ii) the initial limb of the curve was less
steep, and (iii), as stated earlier, Qmax was halved. The
Autograft (n = 12) P
3811 F 1079 0.002
3.37 F 0.30 <10�4
1.35–12.95
1.68�105 F 0.70 0.662
10.36 F 2.02 <10�4
1.53–131.77
20.99 F 5.83 0.002
77.8 F 8.6 <10�4
a h Pah Paa Phh Pah2
2.88 F 0.61 1.69 F 1.03 0.001 <10�4 0.141 0.054
2.97 F 0.30 2.09 F 0.05 <10�4 <10�4 <10�4 <10�4
0.35 F 0.04 0.23 F 0.04 <10�4 <10�4 <10�4 0.5
3023 792
e evaluations described is 2421 for the control nerves and 15,560 for the
e differences between the values is represented as Pah, Paa, Phh, and Pah2.
the values of the control nerve Ah-fiber population were compared with the
ce of differences was represented as Pah2. Vice versa comparison yielded

Fig. 5. Frequency distributions of nerve fiber diameter of the peroneal
nerve. Typical examples of peroneal nerve fiber diameter frequency
distributions from control (A) and autografted (B) rats. The data were
obtained from the same control and autografted nerves as represented in
Figs. 2 and 3. For each graph, the diameters of the nerve fibers were
distributed into 180 classes of 0.1 Am each and plotted against the number
of fibers present in that class. The dots represent the number of fibers per
diameter class, the solid line represents the fitted total curve, the dashed line
the Aa-fiber population, and the dotted line the Ah-fiber population.
C.L.A.M. Vleggeert-Lankamp et al. / Experimental Neurology 187 (2004) 337–349 345
response in the autografted nerves was characterized by a
larger mean refractory period (t50) compared to control
nerves (Table 1). Fitting Eq. (3) to the data, it demonstrated
that in control nerves Qmax,a was significantly larger than
Qmax,h (Table 1) and that the mean refractory period of the
Aa-fibers (t50,a) was less than half of t50,h. In autografted
nerves, Qmax,a was notably decreased but still significantly
larger than Qmax,h while Qmax,h remained the same (Table
1). The mean refractory period of the regenerating Ah-fibers(t50,h) was three times higher than t50,a, as in control nerves.
Moreover, both values were more than a factor 1.5 higher
compared to control nerves.
Both in control and in autografted nerves, the AIC
proved to be smaller (P < 10�4) for two populations
compared to one, and the residual values were small (Fig.
2C, bottom).
Morphometry
Light microscopy of sections demonstrated that regen-
erating nerves were vascularized and enclosed in a
connective tissue sheath. They contained many myelinat-
ed axons, abundant endoneurial collagen, and blood
vessels. It is demonstrated in Fig. 4 that the area of
the regenerating nerve (Fig. 4C) was comparable to the
area of the control nerve (Fig. 4A). The nerve fibers in
regenerating nerves (Fig. 4D) were obviously more abun-
dant in number but much smaller in diameter compared
to control nerves (Fig. 4B). The myelin sheath of the
nerve fibers was thinner in regenerating nerves. The
morphometric analysis demonstrated that in regenerating
nerves, the number of nerve fibers was doubled and that
the fiber diameters were halved, while the areas of the
control and autografted nerves were comparable (Table
2). Therefore, the fiber density and the relative interspace
between the nerve fibers were larger in the regenerating
nerve while the fiber area was smaller. The Kolmo-
gorov–Smirnow test revealed a homogeneous fiber size
distribution throughout control nerves and a homogeneous
fiber size distribution within individual control nerves. In
the regenerating nerves, both heterogeneity and homoge-
neity in fiber size distributions between nerves and within
individual nerves were encountered.
Fitting Eq. (4) to the fiber diameter frequency distribu-
tions demonstrated two maxima at approximately 4 and 9
Am in control nerves (Fig. 5A) and at 2 and 3 Am in
regenerating nerves (Fig. 5B). In control nerves, the contri-
bution of the Ah-fibers to the total number of fibers was
higher (60%) compared to the contribution of the Aa-fibers
(40%). Additionally, the value of dFmax,hwas half the value of
dFmax,a. However, in regenerating nerves, the Ah-fiber pop-
ulation was much smaller in number, about one fourth,
compared to the Aa-fiber population. The values of dFmax,a
and dFmax,hwere only slightly, though significantly, different.
Consequently, the diameter distributions of both populations
overlapped considerably.
In both control and regenerating nerves, the AIC was
lower for fitting the sum of two compared to one log-normal
function.
Discussion
Twelve weeks after sciatic nerve autografting, the
number of nerve fibers in the peroneal nerve was doubled
and the fiber diameter was halved. In vitro electrophysi-
ology of the grafted sciatic nerve demonstrated that the
mean conduction velocity decreased to one third, the mean

C.L.A.M. Vleggeert-Lankamp et al. / Experimental Neurology 187 (2004) 337–349346
firing threshold quadrupled, the mean refractory period
doubled, and the total charge displaced during the com-
pound action potential halved. Of these parameters, only
the number and diameter of the nerve fibers and the mean
conduction velocity can be compared against previous
results. There are no comparable data in literature for the
other parameters.
The number of nerve fibers, the diameter most frequently
present, and its range in the peroneal nerves of control and
autografted animals were similar to those reported by others
(Chamberlain et al., 2000; Fields and Ellisman, 1986b;
Meek et al., 2001; Mira, 1979), though some reported that
the number of fibers in autografted nerves did not change
(Evans et al., 1999; Le Beau et al., 1988).
In control nerves, we measured an MCV of 39 m/s in
vitro at room temperature, comparable to the 30 m/s
described by van den Berg (Van den Berg et al., 1994).
In autografts, we measured an MCV of 12.5 m/s, represent-
ing a reduction to 30% of the control value. This reduction
is in accordance to results reported by others (Foidart-
Dessalle et al., 1997; Maeda et al., 1993) (normal nerves)
(Dubuisson et al., 1997) (autografted nerves). The smaller
fiber diameters and thinner myelin sheaths that we observed
in regenerating nerves, as well as the decreased internodal
distance (Querfurth et al., 1987), largely account for the
decrease in MCV.
To relate the morphological data to the electrophysiolog-
ical data, we will use the empirical inverse relations be-
tween extracellular firing threshold and diameter (cf. Blair
and Erlanger, 1933; Rushton, 1951) and refractory period
and diameter (Paintal, 1966). The expected relation between
Qmax and the number of nerve fibers (N) and the fiber
diameter (d) is given below. In normal nerves, the amplitude
of the monophasic action current is expected to be propor-
tional to the square of the axon diameter (Rushton, 1951).
Since the displaced charge is given by the product of the
height of the action current and its duration, the dependence
of duration on fiber diameter is important. Rushton’s (1951)
theory predicts that spike duration is independent of fiber
diameter, but Paintal’s data seem to show a weak inverse
relation (cf. Paintal, 1973). However, it was argued that
such a relation could have artifactually resulted from the
recording of a crushed nerve end (Ritchie, 1982). Therefore,
we take the ‘‘constancy of the duration of the spikes of all
fibers of the A group’’ as found by Gasser and Grundfest
(1939) for granted. Thus, Q can be taken proportional to the
square of the axon diameter and consequently to the square
of the fiber diameter (Rushton, 1951). Assuming that each
fiber of a particular diameter contributes an equal amount of
charge, the total charge by that fiber group would be
proportional to the total number of fibers present (N). Taken
together for a particular fiber group, we expect that the
displaced charge is proportional to the product of N and d2.
Since only diameter and number are involved, this relation
should also hold for the regenerating nerve. It should be
noted, however, that the Nd2 relation is valid only as long as
other determiners of the electrophysiological properties of
the regenerating nerve fiber, like its ion channel expression,
remain unchanged.
Aa- and Ab-fibers in control nerves
In control nerves, two fiber populations were distin-
guished by fitting the sum of two erf functions (Eq. (2))
to the stimulus–recruitment curves and by fitting the sum of
two log-normal functions (Eq. (4)) to the fiber diameter
distribution curve. The presence of two peaks at 4 and 9 Amwas in agreement with the peaks described by Chamberlain
et al. (1998). Since the range of the conduction velocities of
our control nerves fell within the range of the faster
myelinated nerve fibers, we designated these two popula-
tions as the Aa- and the Ah-fiber populations (Liu et al.,
2000). The dFmax,aand dFmax,h
differed by a factor two, in
perfect agreement with the ratio of the firing thresholds of
the two populations. The number of the Ah-fibers was
about 1.5 times the number of the Aa-fibers. Consequently,
the ratio of Qmax,a and Qmax,h was proportional to
Na(dFmax,a)2 / Nh(dFmax,h
)2, as predicted.
Two fiber populations were also distinguished by fitting
the sum of two erf functions (Eq. (3)) to the interpulse
time–recruitment curves. The identity of the two sets of
fiber populations was confirmed by the equality of the
second, independent estimates of Qmax,a and Qmax,h to those
derived from the stimulus–recruitment curves. This equality
strongly supports the validity of the model. The value of
t50,h was twice the value of t50,a, in agreement with the ratio
of the Aa- and the Ah-fiber diameters.
The agreement of the values of V50, t50, and Qmax with
the predictions based on number of fibers and fiber diam-
eters supports the view that the two populations envisioned
electrophysiologically are identical to the populations dis-
tinguished morphometrically. Moreover, it signifies that the
Aa- and Ah-fibers differ only in diameter and number and
that their ion channel composition is equal.
Aa- and Ab-fibers in autografted nerves
The two populations that were distinguished in the
autografted nerves differed by a factor two in mean thresh-
old and a factor three in mean refractory period. Since the
range of the conduction velocities still conformed to the
range of the faster myelinated nerve fibers, we designated
these populations again as Aa- and Ah-fibers. Two pop-
ulations could also be distinguished morphometrically in
agreement with literature (Archibald et al., 1995; Gutmann
and Sanders, 1943; Mira, 1979). The nerve fibers with the
largest diameter were considered to represent the Aa-fibers,
and those with the smallest diameter the Ah-fibers. Thevalues of dFmax,a
and dFmax,hwere 3 and 2 Am, respectively.
Neither the ratio of the firing thresholds of the Aa- and Ah-fibers nor their refractory periods are inversely proportional
to the ratio of their fiber diameters in the autografted nerve.

C.L.A.M. Vleggeert-Lankamp et al. / Experimental Neurology 187 (2004) 337–349 347
The values of Qmax,a and Qmax,h estimated from the
stimulus–recruitment data were equal, but Qmax,h estimated
from the interpulse time–recruitment data was only half the
corresponding value of Qmax,a. As the separation of the Aa-
and Ah-fiber populations is larger in the interpulse time–
recruitment experiment (compare t50,h /t50,a and V50,h /V50,a)
and as the standard deviation of Qmax,a and Qmax,h as
estimated from the interpulse time–recruitment data is
smaller, we consider the value of Qmax,h derived from this
experiment the most trustworthy. The increase in the number
of nerve fibers was exclusively caused by a fourfold increase
in the number of Aa-fibers, while the number of Ah-fibersremained the same. Consequently, the ratio of Qmax,a and
Qmax,h was never proportional to Na(dFmax,a)2 /Nh(dFmax,h
)2,
neither as estimated from the stimulus–recruitment data nor
from the interpulse time–recruitment data. However, V50, t50,
and Qmax would only solely be dictated by number and
diameter if the electrical properties of the regenerating nerve
fibers were unchanged.
Comparison of Aa- and Ab-fibers in control and
autografted nerves
The regenerating Aa-fibers demonstrated a threefold
increase in V50, in excellent agreement with the threefold
decrease in their dFmax,a. Furthermore, compared to the
Qmax,a of the control nerves, the Qmax,a of autografted
nerves is proportional to Na,control(dFmax ,a, c on t r o l)2 /
Na,grafted(dFmax,a,grafted)2, as predicted. These facts support
the presumption that this population indeed represents
the Aa-fibers of the autografted nerve. The value of t50,ain the autografted nerve, however, increased only with a
factor 1.3, less than expected from the threefold decrease
in their dFmax,a. Up-regulation of the Nav1.3 channels as
observed in spinal sensory neurons after axotomy (Wax-
man, 2001) would shorten the refractory period (Cum-
mins and Waxman, 1997). A comparable up-regulation in
the regenerating Aa-fibers would cause t50,a to increase
less than predicted from their decreased diameter only. A
study into cat ventral spinal root regeneration demonstrat-
ed, however, that the number of sodium channels per
node remained normal or was only slightly increased 16–
45 weeks after cryoaxotomy (Querfurth et al., 1987).
Concomitantly, we expect that the expression of the
Nav1.3 channels in the Aa-fibers will eventually decrease;
and in a separate study, we indeed established that the
Nav1.3 channel expression is only temporarily up-regulat-
ed in the sciatic nerve after crush lesions (Wolfs et al.,
2003).
In the regenerating Ah-fibers, to the contrary, t50,h did
change proportional to the value of dFmax,h. The value of t50,h
of the regenerating Ah-fibers doubled, in agreement with the
twofold decrease in their value of dFmax,h. The value of V50,h
increased almost threefold, more than expected based on the
twofold increase of the value of dFmax,h. The firing threshold of
the Ah-fibers may be significantly affected by adjustments in
the types of sodium channel that are expressed at the Ranvier
nodes of regenerated nerve fibers. For instance, a decrease in
the number density of the sodium channel Nav1.6, predomi-
nantly present in the nodal membrane of peripheral nerves
(Caldwell et al., 2000), would be expected to increase the
firing threshold. In the DRG neuron, such decreases have
indeed been found for the sodium channel isoforms Nav1.8and Nav1.9 (Sleeper et al., 2000) after transection of the rat
sciatic nerve. A comparable down-regulation of the Nav1.6channel may explain the fact that V50,h increased more than
expected on basis of diameter only. In a separate study, we
established that after crush lesions of the sciatic nerve, not
only the Nav1.6 expression at the nodal membrane decreases,
but moreover the expression of the potassium channel iso-
formsKv1.1 andKv1.2 increases at the nodal membrane (Wolfs
et al., 2003). Increased potassium channel expression at the
nodal membrane will also contribute to the increase of the
firing threshold. The value of Qmax,h remained the same, in
contrast to the fivefold lower value of Qmax,h predicted by
Nh,control(dFmax,h,control)2 /Nh,grafted(dFmax,h,grafted
)2. Repetitive firing
of regenerating Ah-fibers, as has been demonstrated to occur
after applying single pulse stimuli, probably arises from
adjustments in the ratio of sodium and potassium channels
(Amir et al., 2002). Repetitive firing may have increased the
measured value of Qmax,h.
In summary, mathematical functions were fitted to elec-
trophysiological and morphometrical data sets of normal
and autografted nerves, and parameters were derived
(charge displaced, fiber number, fiber diameter, firing
threshold, and refractory period), which described subpo-
pulations of the nerve fibers present in the sciatic nerve.
Given the remarkable consistency of the control nerve
parameters with predictions based on simple geometrical
and numerical considerations, we concluded that these
subpopulations could only be the Aa- and Ah-fiber pop-
ulations. Surprisingly, the increase of the number of nerve
fibers present 12 weeks after autografting was exclusively
caused by an increase of the Aa-fibers, indicating that at
least the Aa-fibers branch extensively. In regenerating
nerves, Qmax,a, V50,a, and t50,h changed proportional to
changes of their respective fiber number and diameter. In
contrast, the values of Qmax,h, V50, h, and t50,a in the
regenerating nerve were different from the predicted values.
Thus, in vitro electrophysiological evaluation of the
sciatic nerve yields parameters that discriminate normal
from autografted nerves. These parameters alone will be
useful to estimate the quality of regeneration in, for
instance, synthetic nerve conduits. However, the applica-
tion of mathematical models to the electrophysiological
data furthermore allows to estimate the values of these
same parameters for the Aa- and Ah-fiber populations.
Based on established empirical relations, these data can be
correlated with similarly analyzed morphometrical data,
enabling deduction of specific changes that have occurred
in the regenerating Aa- and Ah-fibers. This demonstrates
that the combination of electrophysiological and morpho-

C.L.A.M. Vleggeert-Lankamp et al. / Experimental Neurology 187 (2004) 337–349348
metrical evaluation methods yields a more profound in-
sight into the quality of regeneration than morphometrical
analysis alone.
Acknowledgments
We wish to thank Dr. S. LeCessie and Dr. P. Eilers for
help with the statistical analysis of the data, A. Abrahams-
Sutton for correction of the manuscript, and H. Choufoer for
technical assistance.
References
Abramowitz, M., Stegun, I.A., 1965. Handbook of Mathematical Func-
tions. U.S. National Bureau of Standards (1964), Dover, NY.
Amir, R., Michaelis, M., Devor, M., 2002. Burst discharge in primary
sensory neurons: triggered by subthreshold oscillations, maintained by
depolarizing after potentials. J. Neurosci. 22, 1187–1198.
Ansselin, A.D., Fink, T., Davey, D.F., 1997. Peripheral nerve regeneration
through nerve guides seeded with adult Schwann cells. Neuropathol.
Appl. Neurobiol. 23, 387–398.
Archibald, S.J., Shefner, J., Krarup, C., Madison, R.D., 1995. Monkey
median nerve repaired by nerve graft or collagen nerve guide tube.
J. Neurosci. 15, 4109–4123.
Blair, E.A., Erlanger, J., 1933. A comparison of the characteristics of
axons through their individual electrical responses. Am. J. Physiol.
106, 524–564.
Caldwell, J.H., Schaller, K.L., Lasher, R.S., Peles, E., Levinson, S.R., 2000.
Sodium channel Na(v)1.6 is localized at nodes of Ranvier, dendrites, and
synapses. Proc. Natl. Acad. Sci. U. S. A. 97, 5616–5620.
Chamberlain, L.J., Yannas, I.V., Hsu, H.P., Strichartz, G., Spector, M.,
1998. Collagen-GAG substrate enhances the quality of nerve regen-
eration through collagen tubes up to level of autograft. Exp. Neurol.
15, 315–329.
Chamberlain, L.J., Yannas, I.V., Hsu, H.P., Strichartz, G.R., Spector, M.,
2000. Near-terminus axonal structure and function following rat sciatic
nerve regeneration through a collagen-GAG matrix in a ten-millimeter
gap. J. Neurosci. Res. 60, 666–677.
Cummins, T.R., Waxman, S.G., 1997. Downregulation of tetrodotoxin-re-
sistant sodium currents and upregulation of a rapidly repriming tetro-
dotoxin-sensitive sodium current in small spinal sensory neurons after
nerve injury. J. Neurosci. 17, 3503–3514.
Dubuisson, A.S., Foidart-Dessalle, M., Reznik, M., Grosdent, J.C., Steve-
naert, A., 1997. Predegenerated nerve allografts versus fresh nerve
allografts in nerve repair. Exp. Neurol. 148, 378–387.
Evans, P.J., MacKinnon, S.E., Midha, R., Wade, J.A., Hunter, D.A., Nakao,
Y., Hare, G.M., 1999. Regeneration across cold preserved peripheral
nerve allografts. Microsurgery 19, 115–127.
Feirabend, H.K.P., 1983. Anatomy and development of longitudinal pat-
terns in the architecture of the cerebellum of the white leghorn
(Gallus domesticus) (280 pp. Thesis, University of Leiden, Leiden,
The Netherlands.
Feirabend, H.K.P., Kok, P., Choufoer, H., Ploeger, S., 1994. Preserva-
tion of myelinated fibers for electron microscopy: a qualitative com-
parison of aldehyde fixation, microwave stabilisation and other
procedures all completed by osmication. J. Neurosci. Methods 55,
137–153.
Feirabend, H.K.P., Choufoer, H., Voogd, J., 1996. White matter of the
cerebellum of the chicken (Gallus domesticus): a quantitative light
and electron microscopic analysis of myelinated fibers and fiber com-
partments. J. Comp. Neurol. 369, 236–251.
Feirabend, H.K.P., Choufoer, H., Ploeger, S., 1998. Preservation and stain-
ing of myelinated nerve fibers. Methods 15, 123–131.
Fields, R.D., Ellisman, M.H., 1986a. Axons regenerated through silicone
tube splices: I. Conduction properties. Exp. Neurol. 92, 48–60.
Fields, R.D., Ellisman, M.H., 1986b. Axons regenerated through silicone
tube splices: II. Functional morphology. Exp. Neurol. 92, 61–74.
Foidart-Dessalle, M., Dubuisson, A., Lejeune, A., Severyns, A., Manas-
sis, Y., Delree, P., Crielaard, J.M., Bassleer, R., Lejeune, G., 1997.
Sciatic nerve regeneration through venous or nervous grafts in the rat.
Exp. Neurol. 148, 236–246.
Francel, P.C., Francel, T.J., MacKinnon, S.E., Hertl, C., 1997. Enhancing
nerve regeneration across a silicone tube conduit by using interposed
short-segment nerve grafts. J. Neurosurg. 87, 887–892.
Francel, P.C., Smith, K.S., Stevens, F.A., Kim, S.C., Gossett, J.,
Gossett, C., Davis, M.E., Lenaerts, M., Tompkins, P., 2003.
Regeneration of rat sciatic nerve across a LactoSorb bioresorbable
conduit with interposed short-segment nerve grafts. J. Neurosurg. 99,
549–554.
Fugleholm, K., Schmalbruch, H., Krarup, C., 1994. Early peripheral nerve
regeneration after crushing, sectioning, and freeze studied by implanted
electrodes in the cat. J. Neurosci. 14, 2659–2673.
Gasser, H.S., Grundfest, H., 1939. Axon diameters in relation to the spike
dimensions and the conduction velocity in mammalian A fibers. Am. J.
Physiol. 127, 393–414.
Gutmann, E., Sanders, F.K., 1943. Recovery of fibre numbers and
diameters in the regeneration of peripheral nerves. J. Physiol. 101,
489–518.
Jack, J.J.B., Noble, D., Tsien, R.W., 1983. Electric Current Flow in Excit-
able Cells. Oxford Univ. Press, Oxford.
Jenq, C.B., Coggeshall, R.E., 1985. Numbers of regenerating axons in
parent and tributary peripheral nerves in the rat. Brain Res. 326,
27–40.
Kakinoki, R., Nishijima, N., Ueba, Y., Oka, M., Yamamuro, T., Nakamura,
T., 1998. Nerve regeneration over a 20-mm gap through a nerve conduit
containing blood vessels in rats: the influence of interstump distance on
nerve regeneration. J. Neurosurg. Sci. 42, 11–21.
Keeley, R., Atagi, T., Sabelman, E., Padilla, J., Kadlcik, S., Keeley, A.,
Nguyen, K., Rosen, J., 1993. Peripheral nerve regeneration across 14-
mm gaps: a comparison of autograft and entubulation repair methods in
the rat. J. Reconstr. Microsurg. 9, 349–358.
Kimura, J., 1981. Refractory period measurement in the clinical domain.
Adv. Neurol. 31, 239–265.
Kolmogorov, A., 1941. Confidence limits for an unknown distribution
function. Ann. Meth. Stat. 12, 461–463.
Krarup, C., Horowitz, S.H., Dahl, K., 1992. The influence of the stimulus
on normal sural nerve conduction velocity: a study of the latency of
activation. Muscle Nerve 15, 813–821.
Le Beau, J.M., Ellisman, M.H., Powell, H.C., 1988. Ultrastructural and
morphometric analysis of long-term peripheral nerve regeneration
through silicone tubes. J. Neurocytol. 17, 161–172.
Liu, C.N., Wall, P.D., Ben-Dor, E., Michaelis, M., Amir, R., Devor, M.,
2000. Tactile allodynia in the absence of C-fiber activation: altered
firing properties of DRG neurons following spinal nerve injury. Pain
85, 503–521.
Maeda, T., MacKinnon, S.E., Best, T.J., Evans, P.J., Hunter, D.A., Midha,
R.T., 1993. Regeneration across ‘stepping-stone’ nerve grafts. Brain
Res. 618, 196–202.
Meek, M.F., Robinson, P.H., Stokroos, I., Blaauw, E.H., Kors, G., den
Dunnen, W.F., 2001. Electronmicroscopical evaluation of short-term
nerve regeneration through a thin-walled biodegradable poly(DLLA-
epsilon-CL) nerve guide filled with modified denatured muscle tissue.
Biomaterials 22, 1177–1185.
Mira, J.C., 1979. Quantitative studies of the regeneration of rat
myelinated nerve fibres: variations in the number and size of
regenerating fibres after repeated localized freezings. J. Anat. 129,
77–93.
Paintal, A.S., 1966. The influence of diameter of medullated nerve fibres of

C.L.A.M. Vleggeert-Lankamp et al. / Experimental Neurology 187 (2004) 337–349 349
cats on the rising and falling phases of the spike and its recovery.
J. Physiol. 184, 791–811.
Paintal, A.S., 1973. Conduction in mammalian nerve fibers. In: Desmedt,
J.F. (Ed.), New Developments in Electromyography and Clinical Neu-
rophysiology, Vol. 2. Karger, Basel, pp. 19–41.
Querfurth, H.W., Armstrong, R., Herndon, R.M., 1987. Sodium channels
in normal and regenerated feline ventral spinal roots. J. Neurosci. 7,
1705–1716.
Ritchie, J.M., 1982. On the relation between fibre diameter and conduction
velocity in myelinated nerve fibres. Proc. R. Soc. Lond. Biol. Sci. 217,
29–35.
Rosen, J.M., Padilla, J.A., Nguyen, K.D., Siedman, J., Pha, H.N., 1992.
Artificial nerve graft using glycolide trimethylene carbonate as a nerve
conduit filled with collagen compared to sutured autograft in a rat
model. J. Rehabil. Res. 29, 1–12.
Rushton, W.A.H., 1951. A theory of the effects of fiber size in medullated
nerve. J. Physiol. 115, 101–122.
Schmalbruch, H., 1986. Fiber composition of the rat sciatic nerve. Anat.
Rec. 215, 71–81.
Seckel, B.R., Chiu, T.H., Nyilas, E., Sidman, R.L., 1984. Nerve regener-
ation through synthetic biodegradable nerve guides: regulation by the
target organ. Plast. Reconstr. Surg. 74, 173–181.
Sleeper, A.A., Cummins, T.R., Dib-Hajj, S.D., Hormuzdiar, W., Tyrrell, L.,
Waxman, S.G., Black, J.A., 2000. Changes in expression of two tetro-
dotoxin-resistant sodium channels and their currents in dorsal root gan-
glion neurons after sciatic nerve injury but not rhizotomy. J. Neurosci.
20, 7279–7289.
Smirnow, N.V., 1948. Table for estimating the goodness of fit of empirical
distributions. Ann. Meth. Stat. 19, 279–281.
Smith, K.J., 1978. A method to represent the spectrum of refractory peri-
ods of transmission of the constituent fibres of a nerve. J. Physiol. 278,
7P–9P.
Van den Berg, R.J., Versluys, C.A., de Vos, A., Voskuyl, R.A., 1994. Nerve
fiber size-related block of action currents by phenytoin in mammalian
nerve. Epilepsia 35, 1279–1288.
Veltink, P.H., Van Alste, J.A., Boom, H.B., 1988. Influences of stimulation
conditions on recruitment of myelinated nerve fibers: a model study.
IEEE Trans. Biomed. Eng. 35, 917–924.
Wang, S., Wan, A.C., Xu, X., Gao, S., Mao, H.Q., Leong, K.W., Yu, H.,
2001. A new nerve guide conduit material composed of a biodegradable
poly(phosphoester). Biomaterials 22, 1157–1169.
Waxman, S.G., 2001. Transcriptional channelopathies: an emerging class
of disorders. Nat. Rev. Neurosci. 2, 652–659.
Wolfs, J.F.C., Vleggeert-Lankamp, C.L.A.M., Lakke, E.A.J.F., Thomeer,
R.T.W.M., 2003. Ion channel redistribution over time in crushed rat
sciatic nerve. Program No 41.4. Abstract Viewer/Itinerary Planner. So-
ciety for Neuroscience, Washington, DC.
Yoshii, S., Oka, M., Ikeda, N., Akagi, M., Matsusue, Y., Nakamura, T.,
2001. Bridging a peripheral nerve defect using collagen filaments.
J. Hand Surg. [Am.] 26, 52–59.