Torsional deformations in incompressible fibre-reinforced cylindrical pipes
Upload
khangminh22Category
view
1download
0
DEVELOPMENT OF FRP BASED COMPOSITE FIBRE FOR FIBRE
REINFORCED CEMENTITIOUS COMPOSITES
by
Mohammed Farooq
B.E. (Civil Engineering), B.M.S. College of Engineering, Bangalore, 2013
A THESIS SUBMITTED IN PARTIAL FULFILLMENT OF
THE REQUIREMENTS FOR THE DEGREE OF
MASTER OF APPLIED SCIENCE
in
THE FACULTY OF GRADUATE AND POSTDOCTORAL STUDIES
(Civil Engineering)
THE UNIVERSITY OF BRITISH COLUMBIA
(Vancouver)
April 2016
© Mohammed Farooq, 2016
ii
Abstract
This thesis describes a method of development of a novel fibre based on fibre reinforced polymers
(FRP), for use fibre reinforcement in concrete. Thermosetting epoxy resin matrix were reinforced
with E-glass, S-glass, and Carbon fibre to produce different types of composite fibres. The FRP
panels were produced using the Vacuum Infusion technique, and then cut to different fibre sizes.
The volume fractions of reinforcements within the FRP fibre were controlled by using woven and
unidirectional fabrics. The number of layers of reinforcing fibres were also changed, to obtain the
optimal thickness of the fibres.
The FRP material was characterized by means of tensile tests and microscope image analysis. Four
different compositions of FRP were produced with tensile strengths ranging from 195 MPa to 950
MPa. The different combinations in geometry broadened the total number of fibres investigated
to 12. Single fibre pullout tests were performed to obtain the fundamental fibre-matrix interfacial
bond parameters for the different FRP fibres. The FRP fibres, being hydrophilic, along with having
a unique rough surface texture, showed a good bond with cement matrix. A bond strength superior
to industrially available straight steel fibres and crimped polypropylene fibres has been observed.
The 3 best fibres were then chosen to examine the flexural behaviour FRP fibre reinforced concrete
beams.
The optimized FRP fibres, one each of Glass FRP and Carbon FRP were then further investigated
to study the effect of matrix maturity, temperature, fibre inclination, and loading rate on the fibre-
matrix interfacial behaviour using single fibre pullout tests. Scanning Electron Microscope (SEM)
analysis was carried out to identify the effect of above-mentioned factors on the surface
characteristics of the fibre. An attempt was also made to optimize the fibre-matrix interface to
achieve an optimized failure mechanism by coating the fibre with oil.
The ability of the fibre to transfer stresses across a cracked section over extended periods has been
investigated by means of fibre-relaxation tests. Finally, to assess durability, the fibres were
conditioned at high pH and high temperature after which single fibre pullout, direct tension tests,
& SEM analysis were conducted.

iii
Preface
This thesis presents the original, unpublished and independent work carried out by the author,
Mohammed Farooq, under the supervision of Dr. Nemy Banthia. The fibre and specimen have
been produced, and tested by the author, some testing procedures of which have been developed
by Dr. Nemy Banthia.

iv
Table of Contents
Abstract .................................................................................................................... ii
Preface .................................................................................................................... iii
Table of Contents ..................................................................................................... iv
List of Tables ............................................................................................................. x
List of Figures .......................................................................................................... xii
Acknowledgements ................................................................................................ xix
Chapter 1: Introduction ............................................................................................. 1
1.1 Understanding the study and its importance ............................................ 1
1.2 Outline of the thesis ............................................................................... 4
Chapter 2: Literature Review and Background Studies ................................................. 8
2.1 Fibre reinforced cementitious composites ................................................ 8
2.2 Current status of fibre reinforced concrete ............................................... 9
2.3 Mechanism of fibre reinforcement & failure theory ................................ 13
2.3.1 Stress transfer ....................................................................................... 14
2.3.2 Failure types and crack bridging mechanism .......................................... 17
2.3.3 Factors affecting fibre pullout ............................................................... 23
2.4 FRP composites in construction and repair industry ............................... 24
2.5 FRP fibre for FRC ................................................................................. 27
2.5.1 Review of prospective materials ........................................................... 27

v
Reinforcing materials: .................................................................................. 27
Matrix materials: ......................................................................................... 32
2.5.2 Parameters of FRP composite fibre ........................................................ 33
2.6 Review of FRP manufacture techniques ................................................. 35
2.6.1 Wet lay-up ........................................................................................... 37
2.6.2 Pre-preg lay-up .................................................................................... 37
2.6.3 Spray up .............................................................................................. 38
2.6.4 Liquid composite moulding (LCM) ........................................................ 38
Vacuum infusion (VI)................................................................................... 39
Resin transfer moulding (RTM) ................................................................... 39
Light resin transfer moulding (LRTM) .......................................................... 39
2.6.5 Compression moulding (CM) ................................................................ 39
2.6.6 Bladder moulding................................................................................. 40
2.6.7 Pultrusion ............................................................................................ 40
2.6.8 Filament winding and tube rolling ........................................................ 40
2.6.9 Automated fibre placement .................................................................. 41
2.7 Choice of manufacturing technique ....................................................... 41
Chapter 3: Materials and Mix Designs ....................................................................... 43
3.1 FRP materials and consumables ............................................................. 43
3.1.1 Reinforcing fibres ................................................................................. 43
Woven glass fabric ...................................................................................... 44

vi
Unidirectional glass fibre ............................................................................. 44
Woven carbon fibre .................................................................................... 44
Unidirectional carbon fabric ........................................................................ 44
3.1.2 FRP resin .............................................................................................. 45
3.1.3 Release agent ....................................................................................... 45
3.1.4 Peel ply, vacuum bag & flow medium ................................................... 46
3.1.5 Tacky tape ........................................................................................... 46
3.1.6 Plastic tube & spiral wrap tube .............................................................. 46
3.1.7 Moulds ................................................................................................ 46
3.2 Tabbing Materials for FRP tests ............................................................. 46
3.3 Materials for Cementitious Composites ................................................. 47
3.3.1 Cement ................................................................................................ 47
3.3.2 Aggregates ........................................................................................... 47
3.3.3 Water .................................................................................................. 47
3.3.4 Mould release agent ............................................................................. 47
3.3.5 Moulds ................................................................................................ 47
3.3.6 Glass fibres ........................................................................................... 48
3.4 Mix designs .......................................................................................... 48
3.4.1 Mortar ................................................................................................. 48
3.4.2 Concrete .............................................................................................. 48
Chapter 4: Manufacture of Fibre and Characterization ............................................... 49
vii
4.1 Manufacture of FRP composite fibre ..................................................... 49
4.1.1 Manufacture of FRP panel: vacuum infusion technique .......................... 49
4.1.2 Adaptation of technique to our requirements ........................................ 52
4.1.3 Cutting FRP panels to make FRP fibre ................................................... 52
4.2 Characterization of FRP panel and fibre ................................................ 53
4.2.1 Methods and experimental setup .......................................................... 53
Volume fractions ......................................................................................... 53
Microscopic images ..................................................................................... 54
Tensile behaviour ........................................................................................ 55
Single fibre pullout ...................................................................................... 57
Flexural test (ASTM C1609) .......................................................................... 61
4.2.2 Results and discussion ........................................................................... 65
Volume fractions ......................................................................................... 65
Microscopic images ..................................................................................... 66
Tensile behaviour ........................................................................................ 69
Single fibre pullout ....................................................................................... 71
Flexural test (ASTM C1609) ......................................................................... 83
Chapter 5: Study of some factors affecting fibre-matrix interfacial behaviour. ............... 91
5.1 Methods and experimental setup .......................................................... 91
5.1.1 Effect of matrix maturity ....................................................................... 91
5.1.2 Effect of temperature ............................................................................ 91

viii
5.1.3 Effect of fibre inclination....................................................................... 92
5.1.4 Effect of loading rate ............................................................................ 93
5.1.5 Influence of oil coating ......................................................................... 94
5.2 Results and discussion ........................................................................... 95
5.2.1 Effect of matrix maturity ....................................................................... 95
5.2.2 Effect of temperature ............................................................................ 99
5.2.3 Effect of fibre inclination..................................................................... 104
5.2.4 Effect of loading rate ........................................................................... 110
5.2.5 Influence of oil coating ........................................................................ 114
Chapter 6: Performance of fibre under sustained loading & deteriorating conditions ... 120
6.1 Method and experimental setup ......................................................... 120
6.1.1 Relaxation of FRP fibre ....................................................................... 120
6.1.2 Durability studies ................................................................................. 121
Tensile test after subjecting to accelerated deterioration .............................. 121
Single fibre pullout after subjecting to accelerated deterioration .................. 121
SEM-EDX image analysis of accelerated deterioration ................................. 122
6.2 Results and discussion ......................................................................... 122
6.2.1 Studies of relaxation of FRP fibre ........................................................ 122
6.2.2 Durability studies ................................................................................ 124
Tensile test after subjecting to accelerated deterioration ............................. 124
Single fibre Pullout after subjecting to accelerated deterioration ................. 126

ix
SEM-EDX image analysis of accelerated deterioration ................................. 129
Chapter 7: Conclusions and Recommendations for Future Work ............................... 132
7.1 Conclusions ........................................................................................ 132
7.2 Recommendation for future work ....................................................... 134
References ............................................................................................................ 136
x
List of Tables
Table 2-1 Some of the earliest accounts of various fibres used in the construction industry........... 9
Table 2-2 Composition of Glass fibres, % by weight ................................................................. 29
Table 3-1 Mix design for concrete ............................................................................................. 48
Table 4-1 Specifications & Settings of the SEM used ................................................................... 54
Table 4-2 Specific Gravity of FRP fibres ..................................................................................... 62
Table 4-3 Summary of volume fractions of FRP panels produced. ............................................. 65
Table 4-4 Summary of Tensile behaviour of FRP strips .............................................................. 69
Table 4-5 Summary of different single fibre pullout tests ........................................................... 73
Table 4-6 Summary of different fibres behaviour in single fibre pullout tests ............................. 80
Table 4-7 Composition of FRP fibre reinforced concrete used for flexural tests .......................... 83
Table 4-8 Summary of parameters of flexural response of FRP fibre reinforced concrete ........... 84
Table 4-9 Comparison of size effect of fibre on fibre distribution .............................................. 90
Table 5-1 Summary of effect of curing age on bond parameters of GFRP and CFRP single fibre
pullout ..................................................................................................................................... 96
Table 5-2 Summary of single fibre pullout bond parameters at different temperatures.............. 100
Table 5-3 Summary of inclination angles .................................................................................. 107
Table 5-4 Summary of Single fibre inclined pullout .................................................................. 107
Table 5-5 Rates of loading used in the tests .............................................................................. 111
Table 5-6 Summary of bond parameters of single FRP fibre pullout at different loading rates .... 111
Table 5-7 Summary of coated and uncoated fibres pullout ........................................................ 115

xi
Table 5-8 Comparison of geometry & oil content of PVA fibre and FRP fibre ........................... 119
Table 6-1 Summary of tensile tests conducted after accelerated deterioration ........................... 124
Table 6-2 Summary of single fibre pullout tests of FRP fibre after accelerated deterioration...... 126

xii
List of Figures
Figure 2-1 Geometry of fibre pullout .......................................................................................... 14
Figure 2-2 Fibre-Matrix Interfacial Stress transfer theory in an uncracked section (Bartos, 1981 [104])
................................................................................................................................................. 16
Figure 2-3 Fibre-Matrix Stress transfer theory in a cracked section (Bartos, 1981 [104]) ............... 16
Figure 2-4 Sketch of typical fibre pullout process ........................................................................ 18
Figure 2-5 Sketch of typical fibre crack bridging ......................................................................... 18
Figure 2-6 Sketch of typical fibre-matrix debonding failure ......................................................... 19
Figure 2-7 Sketch of typical fibre fracture failure ........................................................................ 19
Figure 2-8 Sketch of typical matrix cracking .............................................................................. 20
Figure 2-9 Sketch of typical fibre-matrix damage ....................................................................... 20
Figure 2-10 Sketch showing typical bearing action in deformed fibres ......................................... 21
Figure 2-11 Sketch showing plastic deformation of deformed fibre.............................................. 21
Figure 2-12 Sketch showing matrix crushing due to snubbing friction action .............................. 22
Figure 2-13 Use of FRP composites in Civil Engineering, (Hollaway 2003, [126]) ...................... 25
Figure 2-14 Sketch of 3-D structure of Carbon fibre (Sethi S et al. [166], Bennett SC et al. [167]) 30
Figure 2-15 3-D molecular structure of different forms of carbon (Rudolf N. [168]) .................. 30
Figure 3-1 Reinforcing fabrics used in the project (a) woven glass fabric, (b) woven carbon fabric,
(c) unidirectional glass fibre tape, & (d) unidirectional carbon fibre tape .................................. 43
Figure 4-1 Steps involved in Vacuum infusion process ................................................................. 51
Figure 4-2 Cutting the FRP panels to fibre size .......................................................................... 53
Figure 4-3 Preparation of specimen for tensile testing. (All dimensions are in mm) .................... 56

xiii
Figure 4-4 (a) Friction grips for tensile tests of (b) GFRP and (c) CFRP strips .............................. 57
Figure 4-5 Schematics of dogbone sample ................................................................................. 58
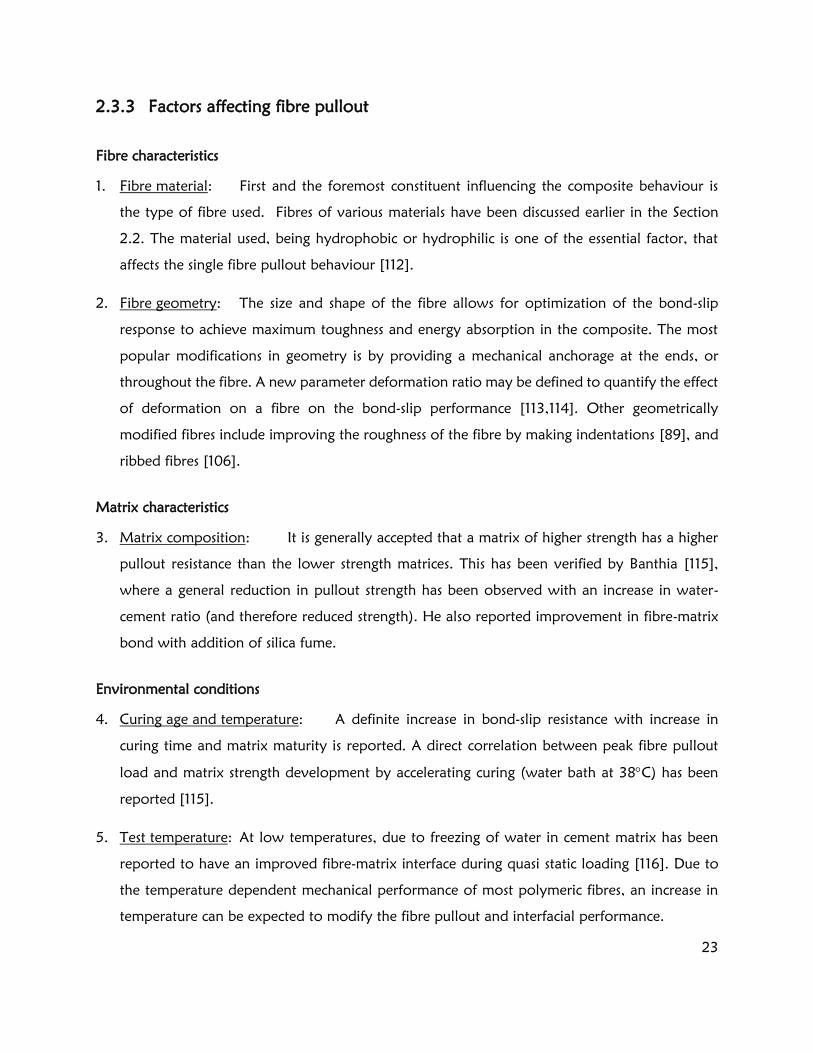
Figure 4-6 Pictures of steps involved in casting of dogbone specimen ........................................ 59
Figure 4-7 Horizontal setup for single fibre pullout tests............................................................ 60
Figure 4-8 Third point bending test as per ASTM C1609 ........................................................... 63
Figure 4-9 Schematics of flexural beam tested as per ASTM C1609. ........................................... 63
Figure 4-10 Microscopic images of the surface of (a) CFRP and (b) GFRP fibres ........................ 66
Figure 4-11 Microscopic image of the Longitudinal profile of CFRP fibre.................................... 66
Figure 4-12 Microscopic image of the cut section of the CFRP fibre, focusing on the edge ......... 67
Figure 4-13 SEM Images of GFRP fibres at (a) 200x, (b) 500x & (c) 2000x magnifications ......... 67
Figure 4-14 SEM Images of CFRP fibres at (a) 200x, (b) 500x & (c) 2000x magnifications ......... 68
Figure 4-15 SEM image at lower magnification of 50x with 3D mode lighting. Left: Undamaged
CFRP fibre, Right: Damaged GFRP fibre .................................................................................... 68
Figure 4-16 Average tensile response of woven FRP panels ....................................................... 69
Figure 4-17 Average tensile response of unidirectional FRP panels ............................................. 70
Figure 4-18 Different failure types in single fibre pullout test specimen, (a) fibre fracture, (b) fibre
fracture after partial pullout, and (c) complete fibre pullout ...................................................... 72
Figure 4-19 Single fibre pullout curves of CFRP fibres ................................................................ 77
Figure 4-20 Single fibre pullout curves of GFRP fibres ............................................................... 77
Figure 4-21 Sketch of the fibre-matrix interface .......................................................................... 78
Figure 4-22 Simplified idealized single FRP fibre pullout curve .................................................. 78
Figure 4-23 SEM image of CFRP Fibre-Matrix interface in the interior of the dogbone specimen
after fibre pullout test. .............................................................................................................. 79

xiv
Figure 4-24 Comparison of bond-slip behaviour of different fibres ............................................. 81
Figure 4-25 Comparison of peak bond stress and equivalent bond strengths of different fibres ... 81
Figure 4-26 Standard deviation of bond strength of single fibre pullout test at different fibre slip
with different fibres .................................................................................................................. 82
Figure 4-27 Coefficient of Variation of single fibre pullout test at different fibre slip with different
fibres ........................................................................................................................................ 82
Figure 4-28 Average load-deflection curves of flexural response of FRP fibre reinforced concrete
................................................................................................................................................ 83
Figure 4-29 Inclined fibres at crack section ................................................................................ 85
Figure 4-30 Magnified sketch of inclined fibre at crack Left: Development of shear stresses; Right:
Development of bending stresses. ............................................................................................. 86
Figure 4-31 Fibre distribution in GFRP fibre 0.5% reinforced beam specimen ............................ 87
Figure 4-32 Fibre distribution in GFRP fibre 1% reinforced beam specimen ............................... 87
Figure 4-33 Fibre distribution in CFRP fibre 1% reinforced beam specimen ............................... 87
Figure 4-34 Fibre distribution in Glass fibre 1% reinforced beam specimen ................................ 88
Figure 4-35 Fibre distribution at cracked section at 1% volume fraction of fibres. Left: Glass fibre,
Right: CFRP fibre ...................................................................................................................... 88
Figure 4-36 Nomograph relating fibre count to the size of fibre and volume fraction [44] ........ 89
Figure 5-1 Casting of inclined fibre pullout dogbone specimen .................................................. 92
Figure 5-2 Dynamic single fibre pullout setup ............................................................................ 94
Figure 5-3 Oil coating on FRP fibres ......................................................................................... 95
Figure 5-4 Average bond stress-slip graphs of GFRP fibres pullout at different curing ages ......... 97
Figure 5-5 Average bond stress-slip graph of CFRP fibre pullout at different curing ages ............ 97
xv
Figure 5-6 Comparision of peak and equivalent bond strength of GFRP and CFRP fibres at different
curing ages ................................................................................................................................ 98
Figure 5-7 Average Compressive and Tensile strengths of mortar used in the fibre pullout tests . 98
Figure 5-8 Average bond stress-slip graphs of GFRP fibre pullout at different temperatures ....... 101
Figure 5-9 Average bond stress-slip graphs of CFRP fibre pullout at different temperatures ....... 101
Figure 5-10 Comparison of peak and equivalent bond strength of GFRP and CFRP fibres at different
temperatures ........................................................................................................................... 102
Figure 5-11 FRP fibres after 7 days at 80 C Left: CFRP fibre, Right: GFRP fibre ........................ 103
Figure 5-12 FRP fibres after 7 days at 130 C Left: CFRP fibre, Right: GFRP fibre ...................... 103
Figure 5-13 Sketch of reinforcing fibres inside a bent FRP fibre ................................................. 105
Figure 5-14 Left: Vertically inclined fibres, Right: Horizontally inclined fibres............................ 106
Figure 5-15 Average bond stress-slip graphs of GFRP single fibre pullout at different angles of
inclination ............................................................................................................................... 108
Figure 5-16 Average bond stress-slip graphs of CFRP single fibre pullout at different angles of
inclination ............................................................................................................................... 108
Figure 5-17 Comparison of peak and equivalent bond stress of FRP fibres at different inclinations
............................................................................................................................................... 109
Figure 5-18 Sketch of inclined fibre pullout ................................................................................ 110
Figure 5-19 Average bond stress-slip graphs of GFRP fibre pullout at different rates of loading .. 112
Figure 5-20 Average bond stress-slip graphs of CFRP fibre pullout at different rates of loading . 112
Figure 5-21 Comparison of peak bond stress and equivalent bond strength of FRP fibres at different
rates of loading ......................................................................................................................... 113
Figure 5-22 Average bond stress-slip graphs of coated & uncoated vertically inclined FRP fibres 116

xvi
Figure 5-23 Average bond stress-slip graphs of coated & uncoated horizontally inclined FRP fibres
................................................................................................................................................ 116
Figure 5-24 Average bond stress-slip graphs of coated & uncoated FRP aligned fibre pullout ..... 117
Figure 5-25 Comparison of peak bond stress of coated and uncoated FRP fibre pullout ............ 117
Figure 5-26 Comparison of Equivalent bond strength of coated and uncoated FRP fibres ......... 118
Figure 6-1 Average fibre relaxation curves at room temperature, not corrected for machine
relaxation ................................................................................................................................ 123
Figure 6-2 Average fibre relaxation curves at room temperature, not corrected for machine
relaxation ................................................................................................................................ 123
Figure 6-3 Tensile behaviour of GFRP strips after accelerated deterioration .............................. 125
Figure 6-4 Tensile behaviour of CFRP strips after accelerated deterioration .............................. 125
Figure 6-5 Average bond stress-slip graphs of GFRP fibre pullout after different stages of accelerated
deterioration ........................................................................................................................... 127
Figure 6-6 Average bond stress-slip graphs of CFRP fibre pullout after different stages of accelerated
deterioration ........................................................................................................................... 127
Figure 6-7 Comparison of peak bond stress and equivalent bond strength of FRP fibres after
different levels of accelerated deterioration ............................................................................. 128
Figure 6-8 images of Unconditioned (Left) and Conditioned (Right) CFRP fibres at 200x
magnification ........................................................................................................................... 129
Figure 6-9 SEM images of Unconditioned (Left) and Conditioned (Right) CFRP fibres at 2000x
magnification ........................................................................................................................... 130
Figure 6-10 SEM images of Unconditioned (Left) and Conditioned (Right) GFRP fibres at 200x
magnification ........................................................................................................................... 130
Figure 6-11 SEM images of Unconditioned (Left) and Conditioned (Right) GFRP fibres at 2000x
magnification ............................................................................................................................ 131

xvii
List of Abbreviations
ASTM : American Standards for Testing and Measurement
CFRP : Carbon Fibre Reinforced Polymer
C-H : Calcium Hydroxide
CM : Compression Moulding
CMC : Ceramic Matrix Composite
C-S-H : Calcium Silicate Hydrate
CTE : Coefficient of Thermal Expansion
ECC : Engineered Cementitious Composites
EDX : Energy Dispersive X-ray Spectroscopy
FC : Fibre count
FSS : Fibre specific surface
FRC : Fibre Reinforced Concrete
FRP : Fibre Reinforced Polymer
GFRP : Glass Fibre Reinforced Polymer
GPC : Geo-polymer Concrete
GPC : Geo-polymer Concrete
HMPE : High molecular weight polyethylene
HPPE : High-performance polyethylene
ITZ : Interfacial Transition Zone
LCM : Liquid Composite Moulding
LVDT : Linear Variable Differential Transformer
NCC : Nano-crystalline cellulose

xviii
OM : Optical Microscope
PA or PPA : Polyamide or High performance polyamide
PAN : Polyacrylonitrile
PE : Polyethylene
PEEK : Polyether ether ketone
PEI : Polyethylenimine
PET : Polyethylene terephthalate
PMC : Polymer Matrix Composite
PP : Polypropylene
PTFE : Polytetrafluoroethylene
PVA : Polyvinyl Alcohol
PVC : Polyvinyl Chloride
RTM : Resin Transfer Moulding
SEM : Scanning Electron Microscope
UHMWPE : Ultrahigh molecular weight polyethylene
VARTM : Vacuum Assisted Resin Transfer Moulding
VI or VIP : Vacuum Infusion or Vacuum infusion process

xix
Acknowledgements
Begin with the name of God, the most Gracious, the most Merciful
I would like to express profound gratitude to my supervisor, Dr. Nemy Banthia for his invaluable
support throughout the project. I am thankful for his motivation, freedom, and trusting me with
this project. It has been a privilege to work with him.
I would like to thank Dr. Anoush Poursartip, Dr. Navid Zobeiry and Dr. Casey Keulen at the
Composites Research Network for their guidance and support. I would also like to thank Dr. Frank
Ko and Dr. Addie Bahi at the Advanced Fibrous Materials lab for their valuable insights and advice.
My sincere appreciation to Ms. Jane Wu for all the technical support, and providing a positive
environment in the laboratory. Mr. Harald Schrempp, Mr. John Wong, Mr. David Robert, Mr.
Scott Jackson, and Ms. Paula Parkinson have patiently listened to me and made the experiments
possible. Many thanks to them for providing effective solutions to problems encountered
throughout the project.
This project would not have been possible without the financial assistance from the partnership of
Tri-Con Concrete finishing Co. Ltd. and Natural Science and Engineering Research Council of
Canada (NSERC).
I also acknowledge the support of everyone in the Materials Research Group for the numerous
discussions, brainstorming sessions, and advice during my stay. Thanks to my friends for the
unending memories, making me feel at home.
Special thanks to my father Imthiyaz, mother Asma, and my sister Ayesha, for supporting me and
standing by me through thick and thin.
I would like to once again thank the Almighty, for guiding me through life.

xx
“If things are not failing, you are not innovating enough”
– Elon Musk

1
Chapter 1: Introduction
1.1 Understanding the study and its importance
The study begins with the development of a fibre reinforced polymer (FRP) based composite fibre
to be used as a short random discrete reinforcement in concrete. Concrete which contain fibres as
one of the key ingredients are referred to as fibre reinforced concrete, commonly abbreviated as
FRC throughout the world. The use of FRC in the construction industry is well documented; the
contribution of fibre in enhancement of cracking resistance, toughness, strength, fatigue life, impact
resistance is well known to us by now [1]. The increase ductility along with the aforementioned
properties, due the addition of randomly distributed fibres is also observed [2].
The concept of short fibre reinforcement is not new to the engineering world, and the civil
construction industry is not the only industry to use these kinds of reinforcements in structures.
Several materials, in which, a type of polymer, mostly plastic, is reinforced with short reinforcing
fibres to enhance its properties exist. These are referred to as Polymer Matrix Composites or PMC,
and are widely used in the marine, automotive, and aerospace industries. The automotive industry
also makes use of Ceramic Matrix Composites (CMC), in which high strength carbon fibres are used
to increase the toughness of a very strong but brittle ceramic matrix such as silicon carbide. Carbon
fibre reinforced silicon carbide is used in making brake pads of sports cars such as Mercedes-Benz
C215, Bugatti Veyron, Corvette ZR1, Ferrari 430, and so on.
The fundamental understanding of the word composite is a material made up of different parts or
elements. In the context of engineering materials, a composite can be defined as a material that is
made from two or more constituent materials which independently have significantly different
properties, when combined together make a material whose properties different from the
constituent materials. For instance consider a composite of a plastic matrix such as thermosetting
polyester reinforced with glass fibre. The glass fibre as we know is flexible and brittle, and the
polyester matrix is flexible and has an elasto-plastic constitutive response. The composite made by
the combination of these two constituent material, also commonly referred to as Fibre Reinforced
Polymer (FRP) is stiff and brittle. Cement paste, mortar, plain concrete, and fibre reinforced
2
concrete (FRC) are all composites, however only fibre reinforced concrete falls under the fibre
reinforced composites category. FRC, CMC and PMC are all fibre reinforced composites, the
difference lies only in the choice of matrix and reinforcing fibre.
The use of various “continuous” fibres as continuous reinforcements in different polymer,
cementitious, or other matrices open up a whole new world. Continuous fibre reinforced
composites are used to a much greater extent than discrete fibre reinforced composites across all
industries. However, the mechanism of strengthening the matrix is different in the case of
continuous reinforcements, and therefore the applications of continuous fibre reinforcements and
random discrete fibre reinforcement are different and case specific. The study conducted in
presented in this thesis limits its study and discussion to short discrete fibre reinforced concrete.
A large variety of fibres are used in concrete worldwide, some of the prominent ones used widely
are steel, polyester, polypropylene and glass. While all these fibres have consistently performed
well, they have certain drawbacks. The fibres, their mechanism, and performance are briefly
discussed in the Section 2.3. This study is an attempt to develop an innovative fibre based on Fibre
Reinforced Polymers. The idea is to reinforce a relatively low strength unsaturated resin matrix
such as epoxy with a high performance fibre such as glass. The ample matrix and reinforcing
materials to choose from, and varying their composition in the composite provide great
opportunity to design and manufacture fibres of varying geometries, elastic, physical and chemical
properties. The right combination of materials could result in a fibre that could potentially be a
game changer in the field of fibre reinforced concrete. The single engineered fibre could enhance
the mechanical properties such as toughness, ductility, strength, fatigue life, impact strength;
enhance the durability of FRC by reducing shrinkage and permeability of water and other chemical
ions; improve fire resistance whilst keeping the overall cost low.
FRP fibre reinforced FRC offers interesting possibilities in the structural and non-structural design
of concrete, especially in areas of high seismic activity where the ductility, toughness and energy
absorption are of critical importance. The use of these novel materials could also be extended to
repair materials and shotcrete. The recent studies emphasising the importance of compatibility of
repair material with that of the substrate have in a way influenced and changed our perception of
high performance cement based repairs. The compatibility of FRP fibre with cementitious matrix is
expected to be much better in a way that the properties, such as modulus can be matched with

3
that of the repair material and the substrate. The low specific gravity of FRP fibre compared to
steel fibres used extensively in shotcrete means that the specific gravity of the FRP fibres is relatively
close to the specific gravity of the other constituents of shotcrete. Steel has a much higher
momentum when travelling at the same velocity as the other constituents of shotcrete, resulting in
losses due to rebound, and possibly even damage to the substrate. FRP fibre with a more
compatible specific gravity is expected to embed well in the shotcrete, reducing rebound loss and
the damage to substrate.
When we talk of FRC, the general impression that comes to mind is use of fibres in concrete made
of hydraulic cement. Fibres can also be used in clay or lime bricks to enhance their properties. They
may also be used to increase the stiffness or modulus of flexible pavements made of asphalt. FRP
fibres open up prospects for use in polymer concrete, in particular heat cured geopolymer concrete
(GPC). FRP requires curing at high temperature to develop, if partly cured FRP fibres can be
introduced in GPC and cured together, we might be able to get a strong bond between the
completely cured resin and GPC. In FRC, some of the bond strength comes from the interfacial van
der Waals forces between cementitious matrix and fibre, which comes as a result of a good adhesive
nature of the interface between C-S-H and fibre. If we can make use of the adhesive nature of
cementitious matrix and the adhesive nature of resin matrix of the FRP fibre, the efforts towards
bond formation could be enhanced. Because the cementitious matrix is water based, it is important
that the resin of the FRP fibre be hydrophilic. With a hydrophobic resin, we would fail to use the
adhesive nature of cementitious matrix as well as that of the resin. The surface characteristics of the
fibre essentially dictate the fibre-matrix interaction while fibre is in fresh state. This fresh state
interaction influences the mature behaviour.
The potential of this kind innovative fibre is immense and could lead to numerous possibilities.
This research tries to lay a foundation for a novel application of FRP fibres in civil engineering, and
pave a way for developing a unique, commercially viable and technologically pioneering FRP
fibres.

4
1.2 Outline of the thesis
The fundamental goal of the project is to develop an innovative macro fibre based on fibre
reinforced polymer material for the application as a short random discrete fibre in fibre reinforced
concrete. The principal purpose of the fibre would be to enhance the mechanical properties of
concrete. The improvement in performance of concrete with respect to durability by reduced
shrinkage would be an additional accompanying benefit.
Objective I Review and Establish method of development of fibre; determine its bond
parameters, and study the flexural response.
Objective II Investigate various factors affecting single fibre pullout.
Objective III Assess the performance of fibre under sustained loading and deterioration.
The objectives are further divided into smaller milestones for an effective progress tracking. The
chapters 4, 5, & 6 of the thesis are outlined based on the aforementioned 3 significant objectives
of the project.
Chapter 1 Introduction.
Chapter 2 Literature review and background studies.
Chapter 3 Materials and mix designs.
Chapter 4 Manufacture of Fibre, and Characterization.
Chapter 5 Study of some factors affecting fibre pullout.
Chapter 6 Performance of fibre under Sustained loading and deteriorating conditions.
Chapter 7 Conclusion and Recommendations for future work.
Chapter 1, Introduction
A short chapter, which starts with providing us an underlying idea behind the research work, and
discusses the need for the study. The chapter also outlines the project goals and objectives.
Chapter 2, Literature review and background studies,
This chapter acts as a foundation for understanding the concepts and forms the basis of many
decisions taken throughout the course of the research. The first half of the chapter provides a

5
literature survey, starting with the definition of fibre reinforced concrete to discussing an extensive
list of fibres currently being used, their popularity, their advantages, and limitations. The second
half of the chapter consists of background studies relevant to the research. The concept of fibre
reinforced polymers, their use in the construction and repair industry, parameters and the design
process of the FRP panels and fibres are then introduced. Discussion on the feasibility of the
manufacture of FRP fibre, its materials, and manufacturing techniques conclude this chapter.
Chapter 3, Materials and mix designs
This chapter lists all of the materials used throughout the course of the project. The choice of
material used to manufacture the fibre affects the performance of the fibre, the materials used to
evaluate the performance of the fibre affect the conditions and behaviour of the experiments, and
may influence outcome of the tests. The mix designs used in the project are also given in this
chapter.
Chapter 4, Manufacture of fibre and characterization
This chapter is based on working towards the first objective of the project, as mentioned earlier.
This involves choosing the material, the manufacturing technique, and designing the fibre
reinforced polymer composite to suite the requirements. Such composite fibres are not used in the
construction industry, neither any other industry makes use of a similar fibre, hence were needed
to be manufactured in the lab facility. Some of the characterization tests are conducted as per ASTM
guidelines, and some others which have been developed in the lab, have been discussed in detail.
The procedure of mixing, placing and casting the specimen, the test conditions, rate of loading,
curing conditions, specifications of the testing machine, and their effect on the test outcomes are
also discussed. Direct tensile tests were done on different sizes of the FRP panel to determine the
effect of size on the tensile properties.
Once the materials and techniques are decided, the geometry and design of the fibre needs to be
optimized with the help of single fibre pullout tests to determine the bond parameters and obtain
an efficient fibre. The bond between the different FRP fibres and cementitious matrix were tested
through single fibre pullout tests. Based on their material composition, and geometry 15 different
fibre types were tested, with each series having 10 replicates to get a reliable set of data. The study
was limited to a single mortar mix of normal strength.

6
Test for Flexural toughness was taken as a test for determining the mechanical behaviour of the
FRP fibre reinforced FRC. A single concrete mix of normal strength concrete was used to cast beams
of size 100mm x 100mm x 350mm. The beams were cast and tested in accordance with ASTM
C1609. Three different FRP fibres based on the composition were tested, at 2 different volume
fractions. Unreinforced, and glass fibre reinforced concrete specimen were also cast and tested for
reference. The results from the various tests are discussed along with the mechanisms of failure.
Chapter 5, Study of some factors affecting fibre-matrix interfacial behaviour,
The fibres performing best in the earlier section, one each of Glass FRP and Carbon FRP were used
in further investigated for service life performance.
For effect of matrix maturity, in terms of matrix curing age, the tests at 1, 3, 7, & 28 days after
casting were conducted.
For effect of temperature conditioning, 7 different temperatures in the environmental ranging from
-20 C to 130 C were tested.
For effect of fibre inclination and orientation, 2 angles each of inclination were tested.
For effect of dynamic loading on fibre pullout, 2 dynamic, and 3 quasi-static rates of loading were
investigated.
Chapter 6, Performance of fibre under sustained loading and deteriorating conditions
This chapter looks at FRP fibres from a durability point of view. Fibre relaxation tests, which
constitute the first half of the chapter, involve assessing the ability of the fibre to continue to transfer
loads in a cracked section after an initial crack opening, thus preventing a sudden brittle failure (or
collapse).
To examine the resistance of the FRP fibre under the alkaline environment of concrete, the fibres
were subjected to accelerated deteriorating conditions by immersing in a high pH solution at high
temperature. These samples were observed under an optical microscope, a scanning electron
microscope (SEM) and energy dispersive x-ray spectroscopy (EDX) analysis was done to see any
change in the physical structure on the surface of the fibre. Tensile tests were conducted on the FRP
strips to assess any drop in strength. Single fibre pullout tests were also conducted to see if there is
any effect of deterioration of fibres on the bond performance.

7
Chapter 7, Conclusions and Recommendations for future work
This chapter presents the conclusion of the research project, and proposes recommendations for
future work.

8
Chapter 2: Literature Review and Background Studies
2.1 Fibre reinforced cementitious composites
In the most general sense, a concrete which contains fibre as one of the ingredients may be called
fibre reinforced concrete. Bentur and Mindess [2] have defined fibre reinforced cement as a
material made from hydraulic cement and discrete, discontinuous fibres but containing no coarse
aggregate. Fibre reinforced concrete on the other hand has been defined as a material made with
hydraulic cement, and aggregates of various sizes, incorporating discrete, discontinuous fibres.
Fibres have been probably been used since the ancient time, with one of its earliest written account
occurring in Exodus 5:6 “And Pharaoh commanded the same day the taskmasters of the people,
and their officers, saying, Ye shall no more give the people straw to make brick, as heretofore: let
them go and gather straw for themselves”. Use of fibre as reinforcement have also been mentioned
as early as 5000 years back when Egyptians used straw to reinforce mud bricks [1].
In the modern times, with the origin of cement and concrete, the first interest in Fibre Reinforced
Concrete was in the 1960’s. Asbestos, Glass and Steel are the few of the earliest fibres to be used
for short discrete reinforcements. The first accounts of random fibre reinforcement was by Dr.
Romualdi, Dr. Batson, and Dr. Mandel; the pioneering work of wire reinforced concrete, presented
in 1963 and 1964 [3,4]. The earliest documentation of glass fibre for concrete also took place
around the same time [5]. Fibre reinforced concrete has come a long way since.
The improvement of fracture toughness of concrete by reinforcement with fibres of various
materials has resulted in gradual acceptance of fibre reinforced concrete as a mainstream
construction and repair material. The benefits of fire reinforcement of concrete in areas of fracture
toughness, energy absorption capacity, long term durability, impact resistance and fatigue
endurance are well recognized [1,2]. The advantages of fibres towards improving the electric [6],
magnetic [7], and thermal changes [8,9] have also been documented.
In addition to benefits of fibre reinforcement during high impact loading [10,11], seismic loading
[12–14] and blast [15,16], the benefits of fibre reinforcement extend to improve the resistance of

9
the structure to fires, especially in the case of high strength concrete columns, to mitigate fire related
accidents and terrorist incidents [17–19].
The use of recycled materials in the production of fibres has further garnered a lot of interest from
the sustainability point of view [20].
2.2 Current status of fibre reinforced concrete
It has been over 50 years from the time when fibre reinforcement was first introduced in cement
based matrices. As of today, there are more than 60 different materials such as steel, polypropylene
and polyester are used for making fibres for concrete. Below is a list of some of the earliest reports
of various materials used for making fibre in the construction industry.
Table 2-1 Some of the earliest accounts of various fibres used in the construction industry
Year Type Category Note Reference
1962 Steel Wire Metallic Welded wires like a
mesh [4]
1968 Steel Metallic
[21]
1968 Asbestos Mineral
1968 Plastics Synthetic [22]
1971
Nylon Synthetic
[23] Coir Natural
Jute Natural
1971 Fibreglass Rod Composite Rod as primary
reinforcement [24]
1971 Chopped steel wire and fibreglass Metallic &
Mineral [25]
1972 Steel fibre Metallic [26,27]
1972 Polycrystalline Alumina Mineral [28]

10
Year Type Category Note Reference
1974 Glass Mineral [29]
1975 Steel fibre Metallic [30]
1975
Polypropylene Synthetic
[31]
Asbestos Mineral
1975 Polyester Synthetic [32]
1976 Steel fibre Metallic [33]
1976 Akwara Natural Vegetable fibre [34]
1978 Carbon fibre Synthetic [35]
1979 Kevlar Synthetic [36]
1979
Water reed Natural
[37]
Elephant grass Natural
Plantain Natural
Musamba Natural
1979 Wood Natural [38]
1984 Polyester Synthetic [39]
1987 Polyacrylonitrile Synthetic [40]
1989
Polyethylene Synthetic
[41] Nylon Synthetic
Aramid Synthetic Kevlar 49 & Kevlar 149
1991
Acrylic Synthetic
[42]
Rayon Synthetic
1995 Polyvinyl Alcohol Synthetic [43]
1995 Sisal & Bagasse Natural [44]
1993 Cellulose Natural [45]
1993 Fibre Reinforced Polymer Composite As continuous rods [46]
1993 Wollastonite fibre Mineral CaSiO3 mineral [47]
1993 Calcium/Alumina fibre Mineral [48]
1995 Glass Fibre Reinforced Polymer Composite As continuous rods [49]

11
Year Type Category Note Reference
2000 Polyolefin Synthetic [50]
2000 Ceramic Composite [51]
2000 Kraft pulp fibre Natural [52]
2003
PP + Carbon Hybrid
Introduction of Hybrid
fibre reinforcement
systems
[53] Carbon + Steel Hybrid
Steel + PP Hybrid
2004 Brucite fibre Mineral Magnesium mineral [54]
2005-
2007 Recycled PET
Recycled/
Synthetic [55,56]
2011
Banana leaves Natural
[57]
Palm leaves Natural
2010 Nano & Micro cellulose Natural [58]
2013
Recycled nylon Recycled/
Synthetic
[59]
Expanded Polystyrene Synthetic
2013 Copolymer
Polypropylene/polyethylene
Composite
Synthetic
Blended macro
synthetic fibre [60]
2013 Loofah fibre Natural Natural fibre [61]
2013 Basalt fibre Mineral Extruded basalt rock [62]
2014 Expanded Vermiculite Mineral Si mineral [63]
While numerous fibres, many of which have been listed in the Table above, have been tried out,
only a handful of them are suitable for fibre reinforced applications and an even smaller number
is used in practice owing to the economical and sustainability consideration. While steel fibres are
the most widely used fibre, especially in structural applications, their widespread use has been
restricted by the hardships involved in handling. Their susceptibility to corrosion is another issue
that needs to be addressed, and may be a major issue for slab on grade, bridge decks, and industrial
floors where there is a high chance of chemical attack from de-icing salts and ground water [64].
Consider a reinforcing steel rod of diameter 12mm and length 1000mm, and a steel fibre of

12
diameter 1mm and length 50mm. The surface area of the steels fibres equivalent to the volume of
the steel rod is about 240 times the surface area of the steel rod. In other words, steel fibres are
roughly 240 times more likely to corrode than a steel rod for the same volume. Apart from
corrosion, the susceptibility of steel fibres interaction with the electromagnetic fields, and a lower
specific strength compared to the polymer fibres further have restricted the use of steel fibres.
The excellent bond of glass fibre with cementitious material gives the composite an excellent
strengthening effect [65]. While most mineral glass fibres exhibit high mechanical properties, and
hence are used for various structural and non-structural applications, some concerns with durability
and alkaline stability exist. A number of attempts at improving the alkaline stability with alkali
resistant glass and application of alkali resistant coating have been reported [66,67].
Another mineral fibre that is gaining popularity is Basalt fibre. The structure and manufacture of
basalt fibres is similar to that of glass fibre, but with lesser energy consumed and no additives,
making it a lower cost material compared to glass or carbon [68,69]. Improvement in mechanical
properties such as flexural strength, fracture energy, and abrasion resistance in cement concrete and
geopolymer concrete have been reported [68,70–73] Similar to the glass fibres, the basalt fibres
have shown susceptibility to alkaline environment, undergoing chemical degradation leading to
loss of strength [74].
Various natural fibres such as wood, sisal, coconut, sugarcane bagasse, palm, and vegetable fibres,
among many others have been tried. However, their durability, and varying quality remain major
causes for concern [75]. This has given rise to development of a large assortment of synthetic fibres
of a variety properties. Some of which are polyolefin, acrylic, aramid, and carbon fibres. In order
to achieve adequate reinforcement, the fibres should have a high tensile strength and tensile
modulus [76]. Synthetic Polymer fibres from the polyolefin family such as polypropylene (PP) and
polyethylene (PE), along with fibres from polyester family such as polyethylene terephthalate (PET)
have gained much popularity of late because of their comparatively simple manufacture, low cost,
and ease of handling. Many polymeric fibres are in fact made out of recycled plastics such as
polyethylene terephthalate (PET)[77–79] and polypropylene (PP) [76,80], making the concrete
system a little more sustainable [20]. The polymeric fibres are used largely in non-structural
application, to prevent propagation, and bridging of cracks caused most commonly due to
shrinkage, and creep in concrete. Polypropylene fibres are also used to some extent where

13
enhancement in mechanical properties and structural strengthening is required [81–84]. Of late,
polyvinyl alcohol (PVA) polymer fibres have gained popularity, with development of engineered
cementitious composites (ECC) [85–87]. PVA fibres however, coming as a product from the
petroleum industry, are quite expensive. The need for coating the PVA fibres to prevent fibre
fracture in many cases increases the overall cost of fibre, limiting its use to some demanding
applications.
There has been a fair share of innovation in modifying the geometry of the fibres to increase the
resistance to fibre pullout. The most common ones are hooked, sinusoidal, and crimped; however,
many others like flat ends, cone ends, twisted, sinusoidal ends etc. also exist [88]. Several embossing
techniques have also been successfully tried out in order to improve the frictional resistance to fibre
pullout [78,89]. Numerous surface modification techniques such as plasma treatments [90–95]
surface coating [66,96–98], and other surface modifications [99] etc. have also been examined.
2.3 Mechanism of fibre reinforcement & failure theory
In a brittle matrix composite, such as fibre reinforced cementitious composite, the matrix has a low
strain capacity. In the case of tensile or flexural loading, due to the low strain capacity of the brittle
matrix, it cracks early in the process, immediately transferring the load to the fibres, which are then
expected to carry the load. If the load on the member is exceeding the capacity of the fibre
reinforcements, the fibres would start pulling out of the matrix at the cracked section, consuming
energy in the process, preventing a catastrophic failure. If the composite isn’t well designed, and
the fibres are excessively well bonded, it may result in fibres fracturing immediately when the
stresses are transferred. Therefore, the bond-slip mechanism of the composite is of prime
importance. Two key aspects emerge: one, the stress transfer mechanism during fibre pullout, and
second, different failure mechanisms that may take place once the stresses have crossed their
respective limits. Several bond failure mechanisms, depending on the fibre characteristics, matrix
characteristics, interfacial characteristics and stress states may come into play.

14
2.3.1 Stress transfer
The most widely accepted fibre-matrix stress transfer mechanism is based on the shear lag theory,
as described by Greszczuk [100]. The shear lag theory assumes that the extensional stresses in the
matrix are negligible relative to those in the fibre and that the shear stresses in the fibre are small
compared to those in the matrix [101]. Greszczuk’s theory states that the complete fibre-matrix
debonding of a sudden catastrophic nature takes place when the maximum interfacial stress exceeds
the interfacial bond strength. Assuming idealized stress distribution, the interfacial bond strength
can be computed by using the formula:
𝑚𝑎𝑥 = 𝑃𝑓,𝑚𝑎𝑥
𝜋 ∗ 𝑑𝑓 ∗ 𝑙𝑒 Equation 2-1
Where 𝑚𝑎𝑥 is the maximum idealized bond stress
𝑃𝑓,𝑚𝑎𝑥 is the maximum load at which debonding takes place
𝑑𝑓 is the diameter of the fibre, and
𝑙𝑒 is the length of the fibre embedded in the matrix (the embedded length)
Figure 2-1 Geometry of fibre pullout
However, in reality, the debonding is not sudden or catastrophic. The theory by Lawrence & Laws
et al. [102,103] considers a frictional resistance, which is solely responsible for resistance to pullout
after the initial debonding has taken place, which can contribute significantly to the total resistance

15
of fibre pullout. In other words, the initial resistance to fibre pullout is offered by the elastic bond
between the fibre and matrix; the elastic bond is broken as a result of fibre pullout (or fibre slip),
which point onwards, the resistance to pullout is by frictional resistance. In such cases, interfacial
bond shear strength may be calculated as a function of amount of fibre pullout (or fibre slip x) by
modifying the above Equation 2-1 to get:
𝑥 = 𝑃𝑓,𝑥
𝜋 ∗ 𝑑𝑓 ∗ 𝑙𝑒 Equation 2-2
Where 𝑥 is the idealized bond stress at slip x
𝑃𝑓,𝑥 is the load at slip x
𝑑𝑓 is the diameter of the fibre, and
𝑙𝑒 is the length of the fibre embedded in the matrix (the embedded length)
The stress distribution at the interface, based on both, complete debonding, and partial debonding
may be graphically represented as shown in the Figure 2.2 below [104].
Figure 2-2 (a) describes the uncracked section, the fibre enters the matrix at the two ends.
Figure 2-2 (b) & (c) represents the pure elastic bond, and pure frictional bond of completely
debonded fibre-matrix interface respectively.
Figure 2-2 (d) & (e) represents the combination of elastic and frictional bond active after partial
debonding. Figure 2.2 (d) represents a scenario when the elastic bond
strength is larger than the frictional bond strength in debonded region, and
Figure 2.2 (e) represents the scenario where the elastic bond is smaller than
the frictional bond strength.
The Figure 2-3 below shows the stress transfer distribution in a cracked section. The non-liner elastic
bond stress distribution is the maximum at the point where the fibre enters the crack surface.

16
Figure 2-2 Fibre-Matrix Interfacial Stress transfer theory in an uncracked section (Bartos, 1981
[104])
Figure 2-3 Fibre-Matrix Stress transfer theory in a cracked section (Bartos, 1981 [104])
(a)
(b)
(c)
(d)
(e)

17
While the above holds good in a general sense, in some fibres systems in which it is difficult to
define the perimeter, such as in the case of a bundle of glass fibres, or with fibres of non-uniform
cross section, a shear flow, i.e. a shear force per unit length may be used in place of shear stress.
Debonding thus occurs when the maximum elastic shear flow exceeds the shear resistance per unit
length of the fibre bond. Any suitable theoretical model of fibre pullout process may be used for
such fibres, by considering concepts of shear flow and shear flow resistance [101].
Laws [105] further went on to add that in principle, it is possible to calculate the bond parameters
from pull out tests, but the results only apply to the conditions of pull out and not necessarily
reflect or predict the behaviour of the composite. The single fibre pullout tests therefore are only
to understand the fundamental behaviour of the fibre-matrix interface. While a fibre may show
excellent performance in terms of interfacial bond strength, it may or may not be reflected in the
performance of the composite. However, superior performance of a composite requires a good
fibre-matrix interfacial bond. A good single fibre pullout response may therefore be considered as
a pre-requisite to a worthy composite response.
2.3.2 Failure types and crack bridging mechanism
The crack arrest mechanism for FRC is similar to the aggregate, when the crack tip approaches the
aggregate, the aggregate absorbs energy and arrests the crack. Similarly, the fibre arrests the crack,
and even acts as crack bridges, thereby absorbing energy till failure.
The failure and energy absorption mechanisms are briefly described below.
Fibre pullout:
When the interfacial shear stress between the matrix and fibre exceeds the bond shear
capacity of the straight fibre-matrix system, additional energy absorption occurs. This
however takes place only when the tensile stress in the fibre has not reached the tensile
capacity of the fibre. It is possible that the fibre may undergo partial pullout, and still
be able to transmit some reduced load, which may in turn prevent collapse. If the
composite is to fail, this is the most preferable mode of failure, as it absorbs the
maximum amount of energy before failure or collapse.

18
Figure 2-4 Sketch of typical fibre pullout process
Fibre bridging:
As seen from Figure 2-5, the fibre bridging mechanism is responsible for arresting the
progress of the crack and controlling crack width. The stresses responsible for causing
the propagation of crack are then partially carried by the bridging fibre. The external
stress that is either responsible for the crack, or is a result of the crack, may be absorbed
by slippage of fibre.
Figure 2-5 Sketch of typical fibre crack bridging
Fibre-matrix debonding:
This type of failure is most often encountered with polymer matrix composites, as
opposed to cementitious composites, and is often a result of incompatibility of the fibre
and matrix. In either brittle matrix composites, or ductile matrix composites, when there
is a large mismatch in modulus or strain capacity, and when the load is applied in the
direction of alignment of fibres, the chances of fibre-matrix debonding occurs.
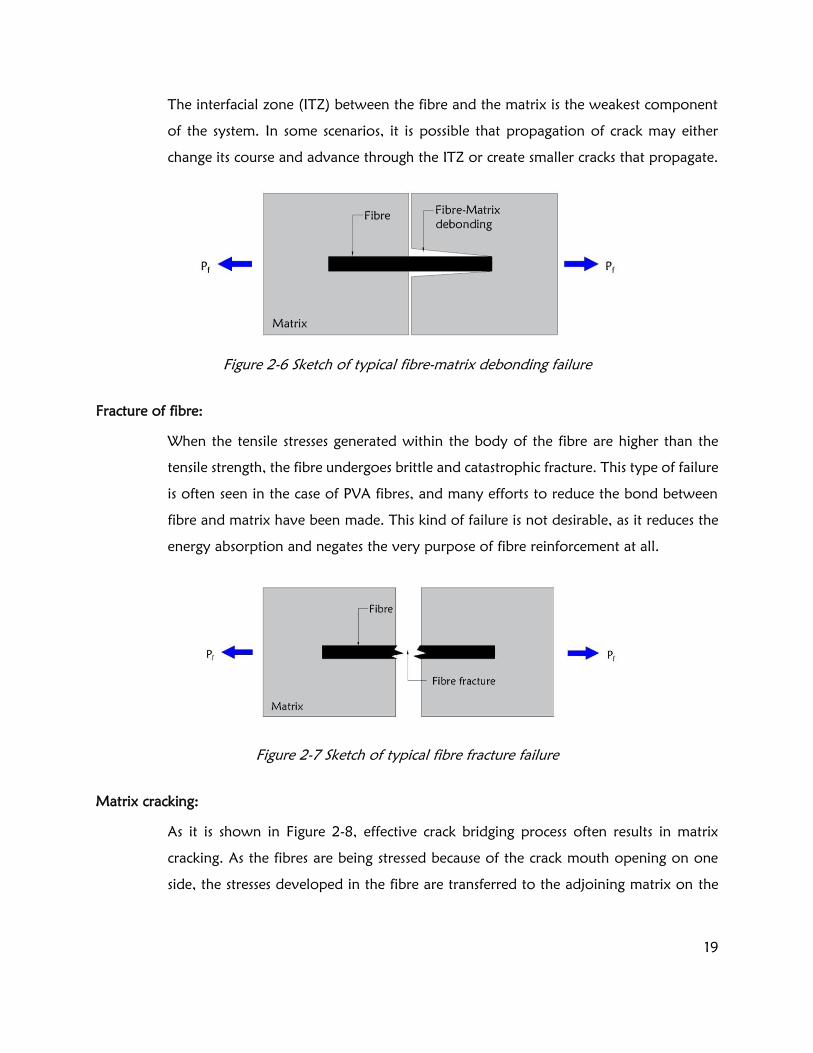
19
The interfacial zone (ITZ) between the fibre and the matrix is the weakest component
of the system. In some scenarios, it is possible that propagation of crack may either
change its course and advance through the ITZ or create smaller cracks that propagate.
Figure 2-6 Sketch of typical fibre-matrix debonding failure
Fracture of fibre:
When the tensile stresses generated within the body of the fibre are higher than the
tensile strength, the fibre undergoes brittle and catastrophic fracture. This type of failure
is often seen in the case of PVA fibres, and many efforts to reduce the bond between
fibre and matrix have been made. This kind of failure is not desirable, as it reduces the
energy absorption and negates the very purpose of fibre reinforcement at all.
Figure 2-7 Sketch of typical fibre fracture failure
Matrix cracking:
As it is shown in Figure 2-8, effective crack bridging process often results in matrix
cracking. As the fibres are being stressed because of the crack mouth opening on one
side, the stresses developed in the fibre are transferred to the adjoining matrix on the

20
other side of the fibre. These stresses transferred to the adjoining matrix are generally
tensile in nature, which undergo micro-cracking, absorbing energy in the process.
Figure 2-8 Sketch of typical matrix cracking
Fibre-matrix damage:
Often with deformed fibres, or fibres with a rough surface such as ribbed steel fibres,
the pullout is accompanied by abrasion damage to the adjoining matrix [106]. The
cracking and micro-cracking of the adjoining matrix as shown in Figure 2-9, absorbs
energy in the process.
Another form of matrix damage has been observed in PVA fibres, in which the adjoining
matrix damages the softer fibre due to abrasion causing delamination within the fibrils
of the fibre [98]. Although the abrasion of fibre does involve energy absorption, and is
often considered a good sign with respect to compatibility of fibre with the matrix,
excessive abrasion can damage the fibre and reduce its capacity, and cause stress
concentrations that can rupture the fibre before complete pullout.
Figure 2-9 Sketch of typical fibre-matrix damage

21
Bearing & anchorage action:
Among the different attempts to improve the performance of fibre reinforced
composites, geometric deformations have been the most efficient, which is reflected in
their widespread use and popularity. In the case of deformed fibres as shown in Figure
2-10, the deformation in the fibre acts as a bearing surface which provides the anchorage
holding the fibre and resisting pullout.
Figure 2-10 Sketch showing typical bearing action in deformed fibres
Plastic deformation:
The ductile nature of steel fibres, and most polymeric fibres, allows for the fibre to
deform as it is being pulled out of concrete, as shown in Figure 2-11 [106–110]. While
fibres with hooked ends deform only till the hook is straightened, the crimped fibres
undergo plastic deformation till the entire fibre is pulled out. Energy is consumed during
the plastic deformation. This is true in the case of straight steel & polymeric fibres as
well, when they are being pulled out an inclined angle from the crack surface.
Figure 2-11 Sketch showing plastic deformation of deformed fibre

22
Snubbing friction:
In the case of fibres that are inclined to the cracked surface, a large snubbing friction at
the point where fibre enters the cement matrix is generated. Snubbing friction in turn
develops tensile stress in the matrix in the close vicinity of the point where fibre enters
the matrix. This large snubbing friction causes cracks in the matrix, and sometimes the
stresses generated are high enough to cause matrix crushing. While these cracking and
crushing do absorb energy, they also reduce the contact area holding the fibre in place,
and may cause a sudden failure.
Figure 2-12 Sketch showing matrix crushing due to snubbing friction action
The type of fracture depends not only on the surface characteristics, but may also be governed by
the length of the embedment [111]. Finally, the performance of a cracked fibre reinforced composite
in terms of load transfer can be said to depend primarily on two aspects, [44]:
(1) There is adequate resistance or energy absorption by the fibres to pull-out.
(2) There are adequate number of fibres to participate in the stress transfer process.
23
2.3.3 Factors affecting fibre pullout
Fibre characteristics
1. Fibre material: First and the foremost constituent influencing the composite behaviour is
the type of fibre used. Fibres of various materials have been discussed earlier in the Section
2.2. The material used, being hydrophobic or hydrophilic is one of the essential factor, that
affects the single fibre pullout behaviour [112].
2. Fibre geometry: The size and shape of the fibre allows for optimization of the bond-slip
response to achieve maximum toughness and energy absorption in the composite. The most
popular modifications in geometry is by providing a mechanical anchorage at the ends, or
throughout the fibre. A new parameter deformation ratio may be defined to quantify the effect
of deformation on a fibre on the bond-slip performance [113,114]. Other geometrically
modified fibres include improving the roughness of the fibre by making indentations [89], and
ribbed fibres [106].
Matrix characteristics
3. Matrix composition: It is generally accepted that a matrix of higher strength has a higher
pullout resistance than the lower strength matrices. This has been verified by Banthia [115],
where a general reduction in pullout strength has been observed with an increase in water-
cement ratio (and therefore reduced strength). He also reported improvement in fibre-matrix
bond with addition of silica fume.
Environmental conditions
4. Curing age and temperature: A definite increase in bond-slip resistance with increase in
curing time and matrix maturity is reported. A direct correlation between peak fibre pullout
load and matrix strength development by accelerating curing (water bath at 38C) has been
reported [115].
5. Test temperature: At low temperatures, due to freezing of water in cement matrix has been
reported to have an improved fibre-matrix interface during quasi static loading [116]. Due to
the temperature dependent mechanical performance of most polymeric fibres, an increase in
temperature can be expected to modify the fibre pullout and interfacial performance.

24
Loading conditions
6. Loading rate: The improved mechanical properties of the constituent materials, the
cementitious matrix, and fibre under dynamic loading conditions are well known to us. A
definite increase in fibre-matrix interfacial strength using different rates of dynamic loading,
different types of fibres have been reported by various researchers [109,115,117–119].
7. Loading angle: due to the random 3-D orientation of fibres at cracked surface, several
studies have been done to investigate the inclined pullout behaviour of fibres from cementitious
matrix [120–122]. Attempts have been made to use the inclined fibre pullout performance to
predict the flexural behaviour of fibre reinforced concrete [123–125].
2.4 FRP composites in construction and repair industry
The construction industry may be considered as a late adopter of the fibre reinforced polymer
(FRP) technology. The comparatively sluggish incorporation of FRP composites in the construction
industry has been attributed largely on the lack of investment in research and development post
the world war years [14,126,127]. The aerospace & aviation industry, along with the defence
industry are seen as the pioneers in development and addition of FRP technology in their use. Early
introduction of polymer composites began in the 1960’s, with the production of specific resins,
catalysts, and accelerators and technologies were developed to facilitate manufacture of composites
by relatively straightforward open mould methods [14]. The key changes that were instrumental
in use of FRP in civil engineering were [127]:
a) Development of techniques such as Pultrusion, resin transfer moulding, semi-automatic
manufacturing of large components leading to possibility of low cost FRP manufacturing.
b) Reduced material demand in the defence industry.
c) Design of new FRP elements in conjunction with conventional structural materials.
d) Need for non-corrosive reinforcement.
Soon after, the industry started to accept FRP as a viable building material, and used it in select
projects such as a sandwich polymer composite / aluminium skeletal dome manufactured in the
UK, for erection in Benghazi, Libya in 1968, and an all polymer composite roof structure for Dubai

25
airport in 1972 [14]. During the early days, FRP was used essentially for innovative structural shapes,
for innovative roof shapes in particular, that were not possible using the conventional materials
such as concrete, and semi load bearing partition walls. By mid-1980s, the aspiration to use FRP
materials as a structural component to replace conventional materials in aggressive and hostile
environment had begun [126].
One of the first iconic FRP constructions was the Aberfeldy footbridge in Scotland, completed in
1992, which apart from the aluminium connections required to attach the stay cables to the deck,
is entirely made of FRP. The bridge was strengthened in 1997, for additional load carrying capacity,
is standing tall, showing no signs of structural deficiency. However, smaller impact loads have had
localized damage, exposing the fibres, which could potentially be a cause for accelerated
deterioration of reinforcing glass fibres if left unattended [128]. Since then, numerous bridges have
been constructed, either as all composite FRP systems, or as hybrid systems. Many of these bridges
built have been discussed by Keller [129].
Figure 2-13 Use of FRP composites in Civil Engineering, (Hollaway 2003, [126])

26
FRP has garnered a lot of interest as rehabilitation and retrofit material owing to the resin’s
excellent adhesion bond with old concrete, and high specific strength/modulus. The FRP
components are either used in the form of an externally bonded plate, or as a near surface mounted
FRP rod to strengthening RC beams in flexure [130–134]. Several research articles, books, state-of-
the-art papers, and review papers by leading researchers, Meier [130], Nanni et al. [135], Teng et
al. [132,133], Hollaway et al. [131], Rizkalla et al. [134], and many others [136–138] exist.
FRP as primary rod is a comparatively new system, with a lot of ongoing work. Most FRP rebar,
with cost in mind, are made by pultrusion of glass fibres through a polyester resin. Due to the low
hydrophilicity of resin, generally, some form of surface or geometric modification is needed to
improve the bond with cementitious matrix, the most common of which are listed below:
a) Ribbed
b) Sandblasted
c) Spirally wound
For use of FRP as reinforcing bars, because it is inside the concrete, making it impossible for visual
observation for degradation or damage, durability and stability of GFRP rods are of the main
concern. Good amount of research has been done in the field of durability analysis of FRP bars.
Extensive amount of independent works by leading researchers Nanni et al. [46,139], Benmokrane
et al. [49,140], Uomoto [141], Davalos et al. [142,143], Bakis et al. [144], review paper by Ceroni
et al. [145], and collaborative work at SIMTReC (Centre for Structural innovation and monitoring
technologies, formerly known as ISIS Intelligent sensing for innovative structures), led by Mufti et
al. [146–149], among many others on the durability [139,150–153] and applicability of FRP rebar
in concrete are available [154–156].
FRP hybrid systems are those in which a system comprising of FRP composites and traditional
materials such as concrete/steel etc. are combined optimally [126]. A hybrid beam with concrete in
the compression area with FRP composite material in the tension area has been developed and is
regarded one of the key future materials [157,158]. Another type of hybrid material is a hollow
FRP tube which is filled with concrete, for use as columns without any internal reinforcement [159–
161].

27
2.5 FRP fibre for FRC
The macro fibres used in FRC are roughly about 30 to 60 mm in length and about 400-1000 µm
in diameter. It is also well known across disciplines that a fibre with higher aspect ratio performs
better, as there is more surface for surface activity such as bonding. Keeping these in mind, in this
research, the target dimensions of FRP fibre were decided to be about 50mm in length, and about
0.5mm in diameter.
2.5.1 Review of prospective materials
A large collection of materials, both for reinforcing the FRP fibre as well as the matrix of the FRP
fibre exist. A discussion of advantages and limitations of an extensive set of materials has been done
in this section.
Reinforcing materials:
E glass family
E glass is a material of calcia-alumina-silicate glass family, and the commonly made glass
fibre is by extruding alumina-borosilicate glass. It is the most popular reinforcing fibre used
in the composites industry owing to its good engineering properties and relatively low cost.
However, the properties of E glass can vary depending on the manufacturer, composition,
diameter, and geometry; and has a strength of anywhere between 2000 MPa to 3500 MPa
and elastic modulus of around 70 GPa. For example, while the website of AZO materials
[162] list the strength of the E glass at 1950 to 2050 MPa, the data sheet of E glass
manufactured by Saint Gobain Vetrotex lists the filament tensile strength to be 3400 MPa
[163]. The impregnated strand tensile strength (calculated on fibre cross section) of the same
fibre manufactured by Saint Gobain Vetrotex is 2400 MPa. Hence it should be well
understood before the commencement of the project, that the same E glass fibre would
behave in different way depending on testing conditions, and the behavior of composite
will be different from the behavior of individual yarns or fibres.

28
E glass is used widely in many industries, for not only its elastic properties, but also for
thermal and electrical insulation. The versatile application, good compatibility with resin
matrices at a relatively very low cost makes it so popular.
E glass fibre is many times referred to as just glass fibre, and is used widely in marine
industries, manufacture of insulating walls and as discrete fibres in concrete (Glass Fibre
Reinforced Concrete).
The only issue with E glass is its susceptibility to deterioration in alkaline environments.
Environmental attack of moisture for example has been reported to degrade the strength
of glass fibre, initiate micro-cracks in the resin, degrade the fibre matrix interface and also
cause swelling of the composite [153]. The loss in mechanical properties of glass fibres
independently as well as in composites in concrete has also been well documented
[142,145,151,164]. Efforts have been made towards making a new kind of glass fibre that is
resistant to corrosion and other durability issues in presence of an alkaline environment.
Such glass fibres are Alkali resistant glass, E-CR glass (Electrical Chemical Resistance glass), C-
glass (Corrosion resistant glass) etc.
S glass family
S glass stands for high strength glass, sometimes is also considered to stand for stiff glass. It
is very similar to E glass in the way that it visually looks and handles similar to E glass, but
is made of a slightly different chemical composition. The surface properties of S glass fibres
are also identical to E glass, meaning they will have an as good bond with Polyester, Vinyl
ester, or Epoxy resin matrices. The difference between E glass and S glass lies in their elastic
properties. S glass is considered to have about 15-20% greater modulus and about 30-40%
higher tensile strength than E glass. The commonly available S glass is actually S-2 glass to
be precise, but these terms are often used interchangeably. S-2 glass is second generation S-
glass.
The comparison of glass fibre compositions is shown in Table 2-2 below [165].

29
Table 2-2 Composition of Glass fibres, % by weight
Component E Glass S Glass
Silicon dioxide 52-56% 64-66%
Calcium oxide 16-25% Trace
Aluminum oxide 12-16% 24-26%
Boron oxide 5-10% -
Sodium and Potassium oxides 0-2 % Trace
Magnesium oxide 0-5% 9-11%
Carbon fibre
Carbon fibre, also known as graphite fibre is a high strength high modulus fibre, about 5-
10 um in diameter and composed of mainly carbon atoms. The atomic structure of carbon
fibre is similar to that of graphite, both of which are made of graphene sheets. Graphene is
a thin layer of pure carbon that are bonded to each other in a hexagonal arrangement.
While in graphite, the graphene sheets are linked to each other with weak Van der Waals
forces, on the case of carbon fibre, the graphene sheets are haphazardly folded or crumpled
together (Figure 2-15).
The cost of carbon fibres still remains very high, which restricts the use in different
applications. In the market, it is available for roughly ten times the price of E glass, which
makes carbon much less popular among low to medium strength applications, however, is
the material of choice for high performance parts such as in the aerospace and aviation,
automobile, high performance sports goods, etc.

30
Figure 2-14 Sketch of 3-D structure of Carbon fibre (Sethi S et al. [166], Bennett SC et al. [167])
Figure 2-15 3-D molecular structure of different forms of carbon (Rudolf N. [168])
Once again, as in the case of glass, the strength does depend on the manufacturer,
depending on the quality of precursor PAN used, which also affects the cost of the final
product. Carbon fibres are also classified on the basis of their relative tensile modulus,
ranging from low modulus carbon fibre at around 200GPa to intermediate modulus carbon
fibre around 250-350 GPa, to ultra-high modulus carbon fibre above 450 GPa. However,
the most readily available carbon fibre have strength ranging from 2500 MPa to 4000 MPa,
and have modulus ranging from 230GPa to 450 GPa.
Aramid fibres (Kevlar)
Kevlar is the most popular of the organic Aramid fibres developed by DuPont. Other
Aramid fibres, which also have similar properties are Nomex which is also developed by
DuPont. Twaron and Technora are other similar aramids developed in Japan by Teijin.

31
Kevlar or other Aramid fibres are like glass and carbon, high strength, and high modulus
fibres. While the strength of Kevlar is similar to carbon and glass, the modulus of Kevlar is
roughly between the higher modulus carbon fibre and lower modulus glass fibres.
The cost of Kevlar is higher than glass, which again restricts the use to specific high
performance applications such as ballistics, sports gear, automobiles etc.
Aramid fibres tend to absorb moisture, and are susceptible to ultra-violet radiation, raising
durability concerns. In the case where an aramid fibre reinforced panel is damaged, and the
fibres are surfaced and open to moisture, the fibre likely is attacked by moisture, and
undergoes degradation.
Polyethylene (Spectra or Dyneema)
Ultra-high molecular weight polyethylene (UHMWPE), also referred to as high-
performance polyethylene (HPPE) or high modulus polyethylene (HMPE), are a new series
of organic fibres developed under the brand names Spectra and Dyneema. It is composed
of extremely long chains of polyethylene, the molecular weight of the chains reach up to 6
million atomic mass units. The major advantage of these polyethylene fibres are that they
possess a very high resistance to abrasion. It also is very smooth to touch with a very low
coefficient of friction, which makes the fibres slightly tricky to handle. The other crucial
property of UHMWPE is its very low specific gravity of as low as 0.97. Strength of
UHMWPE can be up to 2500 MPa, compared to the steel of highest strength, which has a
strength of up to 1600 MPa. The low specific gravity of the Dyneema fibre, compared to
steel which as a specific gravity of 7.85, makes the specific strength of Dyneema much
higher, as much as 10 to 15 times as that of steel. Its high specific strength has fascinated its
use in ballistic resistant armour, ballistic resistant vehicles, bullet proof vests etc.
Other fibres such as boron fibre, and basalt fibre are also considered, but due to their limited
availability, only the 5 fibres described above were emphasised upon. Other new innovative fibres
such as lignin carbon fibre, nano-crystalline cellulose (NCC) were also considered. However, these
fibres are still in the research phase, and have not been made available commercially in the market.

32
Matrix materials:
Epoxy resin
Epoxy is the most commonly used resin system in the composites industry, including the
aerospace, aviation, automobile, recreational and high performance sports goods, among
many others. The good understanding of uncured and cured resin properties, good
compatibility with most fibres, metals, and other materials makes it a material of choice for
most applications. It also has excellent adhesion and resistance to chemicals and other solvents.
However, the costs involved are on the higher side, as compared to other resins.
Polyester (Thermoset)
Polyester is the second most widely used resin, after epoxy. It is cheap, and has a flexible
cure process, meaning a reasonably good degree of cure can be achieved even if the ideal
conditions such as an autoclave or oven are not available. This makes it a good choice for
large components such as turbine blades, boats, water slides, water pools, pipes etc.
While the cost is low, the material properties are lower than that of epoxy resin. It also has
a higher shrinkage as compared to epoxy, and is seldom used with carbon fibre.
There are health and safety concerns with the use of polyester resin, which is why, in most
cases, the manufacture of polyester parts is restricted to factories, where health and safety
issues are dealt with, compared to epoxy, which is often also used by individuals. The
polyester resin generally requires a fume hood or such, because of the styrene emissions,
which pose a health and environment hazard.
Vinyl ester (Thermoset)
Vinyl ester occupies the space in between epoxy and polyester, in terms of material
properties, and cost. Vinyl ester has a lower viscosity as compared epoxy and polyester,
and a faster cure cycle as well, and hence can be used in components or parts in which
speedy manufacturing cycles are required.
Like the polyesters, there also have health and safety concerns with the emission of styrene,
and therefore, the use is restricted to factories or industries with appropriate facilities.

33
Other thermoplastic resins
Thermoplastic resins make up roughly about 10% of all the resin used in the composites
industry. They are rather cheap, and have a higher ductility or strain to failure, as compared
to most thermosetting resins. The ductile nature increases its toughness, and imparts an
improved impact resistance.
Their application is limited by the temperature sensitivity, often very high viscosity, and
susceptibility of certain thermoplastics towards chemical attacks. The change of state from
a liquid phase to a solid phase involves no chemical reaction, and is only rearrangement of
molecules depending on the temperature. Therefore theoretically, the production cycles
are much faster and continuous. However, the setup costs and operating costs are often
quite high.
Several thermoplastic resins such as high performance polyamide (PA or PPA, nylon),
polyether ether ketone (PEEK), polyethylenimine (PEI), polypropylene (PP), polyethylene
(PE), polyethylene terephthalate (PET), polycarbonate etc. have been considered for this
project.
2.5.2 Parameters of FRP composite fibre
To characterize the composition of a composite material, the parameters often used are volume
fraction of fibres in the composite, and the volume fraction of resin. Although volume fraction of
voids has shown to of some importance, for the ease of calculations, it is generally not considered.
Also for ease of calculation, a full transfer of stress from the resin the reinforcing fibres is considered.
They are generally referred as –
Vf – volume of fibres vf – volume fraction of fibres
Vm – volume of matrix vm – volume fraction of matrix
Vv – volume of voids vv – volume fraction of voids
V – Volume of composite part or panel

34
𝒗𝒇 = 𝒗𝒐𝒍𝒖𝒎𝒆 𝒐𝒇 𝒇𝒊𝒃𝒓𝒆𝒔
𝒕𝒐𝒕𝒂𝒍 𝒗𝒐𝒍𝒖𝒎𝒆 𝒐𝒇 𝒑𝒂𝒏𝒆𝒍=
𝑽𝒇
𝑽𝒑
Equation 2-3
𝒗𝒎 = 𝒗𝒐𝒍𝒖𝒎𝒆 𝒐𝒇 𝒎𝒂𝒕𝒓𝒊𝒙
𝒕𝒐𝒕𝒂𝒍 𝒗𝒐𝒍𝒖𝒎𝒆 𝒐𝒇 𝒑𝒂𝒏𝒆𝒍=
𝑽𝒎
𝑽𝒑
Equation 2-4
𝒗𝒗 = 𝒗𝒐𝒍𝒖𝒎𝒆 𝒐𝒇 𝒗𝒐𝒊𝒅
𝒕𝒐𝒕𝒂𝒍 𝒗𝒐𝒍𝒖𝒎𝒆 𝒐𝒇 𝒑𝒂𝒏𝒆𝒍=
𝑽𝒗
𝑽𝒑
Equation 2-5
If Vv is considered 0, (ideal case) i.e. there are no voids in the panel (which although unlikely, is
often negligible), the panel consists of fibres and matrix alone.
𝑽𝒇 + 𝑽𝒎 = 𝑽𝒑 Equation 2-6
𝒗𝒇 + 𝒗𝒎 = 𝟏 Equation 2-7
The volume fractions is limited by the material type and manufacturing technique. A basic lay-up
technique makes a panel of low fibre volume fractions, in the range of 15-20%, while to increase
the volume fraction of fibre to up to 50-60%, a much improved and sophisticated compression
moulding or autoclave curing may be required.
Along with the volume fractions, the direction of fibres reinforcement is the other key parameter
that defines the performance of the composite part. This orthotropic quality of composite materials
sets it apart from other building materials, making it possible to tailor fit the material depending
on the applications; inserting reinforcement where required.
The direction of the reinforcing fibre may be limited by primarily the materials being used. For
instance for tubular pressure vessels, where the loading is essentially radial, a unidirectional
reinforcing mat is best suited. In the construction of the hull of a boat, woven fabrics with near
equal reinforcements in two perpendicular directions are used, to resist the complex loading that
it may encounter during its service life. On a Table top or counter top, a chopped strand mat may
be used, where the stresses expected are low and in arbitrary directions. Many at times, in a
complex structural element, a hybrid of different reinforcing materials are used to optimize the
capacity to suite the requirements. In a structural I-beam for example, unidirectional fabrics are
primarily used in the flanges, where the stresses are mostly tensile or compressive, and the web

35
may made of woven fabrics cast at 45˚ to maximize the shear capacity. Some woven fabrics may
also be used in the flanges in addition to the regular unidirectional fabrics for added stiffness where
required, especially in cases where torsional loads are expected.
Generally, a composite panel is made of a set of layers, and the properties are met as a designed
combination of these layers. In thin sections, addition or removal of one layer makes a significant
difference to the performance of the composite panel. The exceptions are in assembly of the thick
fuselage sections of the jet aircrafts (Boeing 787), where automated fibre placement technique is
used, in which case the thin layers of fibres are negligible when compared to the overall thickness
of the part. In these cases, the fibre may be oriented in the desired directions to a desired thickness.
It might also be noteworthy to know that the stress distribution within the cross section of the
panel is not equal, owing to the non-homogenous cross section. For example, a mere increase in
cross section area of the member does not imply an increase in the load carrying capacity in the
same proportion. For a given volume fraction of reinforcing fibres, the change in cross sectional
area is due to the addition or removal of one or more layers of reinforcing fabric. In such cases,
the axial strength and stiffness remain same, although the load carrying capacity of the panel
changes. Any change in the cross section without a change in number of reinforcing layers, the
change in area must come from the change in matrix volume thereby changing the volume fractions
of the panel, which in turn changes the axial strength and stiffness of the panel.
The properties of a laminate can be estimated if we know the properties of the constituent fibre
and matrix materials. The most widely used method is the rule of mixtures, although in recent
times with the advent of high computational power, complex finite element models are also used
for important applications. For the purpose of this research, rule of mixtures provides a sufficiently
good estimate.
2.6 Review of FRP manufacture techniques
An FRP composite is manufactured in a number of ways, depending essentially on the requirements
of the finished product, starting from the simple wet layup technique to the complex automated

36
fibre placement technique. Some of these popular techniques and their applicability in this project
are described below:
Simple Techniques:
o Wet lay-up
o Pre-preg lay-up
o Spray-up
Complex Techniques:
o Liquid composite moulding
Resin transfer moulding
Vacuum infusion
Light resin transfer moulding
o Compression moulding
o Bladder moulding
o Pultrusion
o Filament winding
o Automated Fibre Placement
The time and requirements of curing depends on the type of resin, and degree of polymerization
required. Generally curing is done in one of the following conditions:
1. At room temperature, at atmospheric pressure
2. In an oven, at high temperature and atmospheric pressure
3. In an autoclave, at high temperature and high pressure.

37
2.6.1 Wet lay-up
In the wet lay-up process, the mould, which is generally a flat aluminum or glass plate is first coated
with release agent and sometimes with a gel coat (for better quality finish of the composite panel).
The reinforcing fibres, generally in the form of mats or fabrics, both of woven and unidirectional
kind, are placed on the mould. The resin is poured on the fibre reinforcements, and the wet
composite is rolled or wiped with a squeegee to spread the resin uniformly throughout, and
eliminate voids. Care is taken such that the squeegee is used uniformly over the area, gently pushing
outward from the centre, so we are not introducing new air pockets towards the centre but pushing
them away from the edges. Ample amount of resin is poured to ensure complete saturation of the
fabric. When a composite of relatively high thickness is required, it is recommended to first saturate
some layers of the fabric, then add more layers. Once the panel is cured, it may be easily peeled
off of the mould.
Although this is a fairly simple technique, the removal of voids using a squeegee is dependent on
the skill of the worker. This hinders consistency within the panel, and its reproducibility.
2.6.2 Pre-preg lay-up
Pre-preg fibres are those fibres or fabrics which are pre-impregnated with a B-stage resin. B-stage
resin is a partially cured resin, enough to have some structural stability, but remaining flexible
enough to be able to be draped in complex shapes. The totally uncured resin, also known as the
green stage resin is in the form of a liquid and would seep out of the fabric, and therefore only
partially cured fabrics are used.
Similar to the wet layup, these are placed on moulds coated with release agents. A squeegee is
often used to remove the voids, and sometimes vacuum is applied to compact the Prepreg and
squeeze out the air voids to a greater degree. Excessive resin may also be removed by squeezing
or vacuuming technique.
Pre-preg fabrics require special attention, since they consist of partially cured resin. Care must be
taken that the B-stage resin does not cure, and therefore the Pre-preg fabrics have a limited shelf

38
life, and are required to be kept in cold storage. The manufacturing technique is very simple and
we can get good uniformity among the panels, however the high cost limits its application to very
high performance parts.
2.6.3 Spray up
As the name suggests, in the spray up technique, the fibre and unsaturated liquid resin are sprayed
simultaneously over the mould. It is one of the techniques used in manufacture of boats, canoes,
etc. This technique is widely used in marine industry and in manufacture of precast products where
the parts do not have very high mechanical requirements. The performance is similar in all
directions, however structural performance is low due to the use of random alignment of short
discontinuous fibres as opposed to aligned continuous ones. This method has also been adapted
for used in the construction industry for repair and retrofit of structures [169–174]. The significant
difference in spray up is that chopped short fibres are used, instead of continuous fabrics or mats
used in other techniques described above. While the spraying velocity of the materials does offer
some compaction, additional compaction may be achieved by rolling using a squeegee. This is a
fast process, although a highly skilled operator is required to spray the material. This process also
poses some health safety and environment concerns.
2.6.4 Liquid composite moulding (LCM)
Liquid Composite Moulding refers to the manufacturing technique in which the liquid unsaturated
resin is injected into a dry fabric which is placed between a mould and a counter mould, with the
help of an external force such as injection pressure, vacuum pressure, or a combination of both.
LCM can be broadly classified into 3 categories, (a) Vacuum infusion, (b) Resin transfer moulding,
and (c) Light resin transfer moulding, depending on the mould and resin injection method.

39
Vacuum infusion (VI)
In vacuum infusion technique, dry fabric is placed between a solid mould, generally made of a
metal or an alloy, and a membrane counter mould, generally made of nylon or sometimes
polyethylene. The vacuum bag is sealed at the edges, and resin is drawn from an inlet pipe(s),
under vacuum suction applied at the outlet end. In this method, to prevent the consumables such
vacuum bag & pipes to get attached to the composite part, a peel ply is used, which can be easily
peeled off after curing.
Resin transfer moulding (RTM)
In RTM, both the mould and counter mould are made of a rigid metal or alloy. The dry fabric is
placed between the mould and counter mould, and the resin is pushed through an inlet pipe under
a high pressure of around ~100-700 kPa (~15-100 psi). A peel ply is not required in the process,
and therefore the composite part has a smooth surface on both sides. Sometimes additional vacuum
pressure is applied at the outlet to assist with the flow of resin.
Light resin transfer moulding (LRTM)
LRTM adapts principles from vacuum infusion and resin transfer moulding. It uses a semi rigid tool
such as in vacuum infusion process, and a semi flexible counter mould, which is sealed off at the
edges. The injection pressure is lesser than in the case of RTM, at typically range from 1-2
atmospheres (~ 100-200 kPa or ~15-30 psi). LRTM has advantages over RTM and VI process, that
the processing costs are lower, and composite part has two finished smooth surfaces.
2.6.5 Compression moulding (CM)
Compression Moulding is similar to RTM, in the way that they both have rigid moulds, except in
the case of compression moulding, the edges are not sealed. After the reinforcement fabric is placed
on the mould, resin is poured. The mould and counter mould are then pressed together against
each other, causing the excess resin along with the air voids to be removed from the unsealed side
edges.

40
2.6.6 Bladder moulding
Bladder moulding is a process that uses an inflatable bladder and an outside mould to create a part,
typically using a pre impregnated reinforcements.
2.6.7 Pultrusion
In Pultrusion, the dry reinforcing material, which maybe either tow of fibres or a woven fabric, are
pulled through a resin bath. Once passed through the resin bath, the reinforcing material
impregnated with resin is pulled through an orifice, which gives the composite it’s cross sectional
shape, to the heated die chamber, where the resin cures and polymerizes. The pultruded composite
may then be cut to the desired length.
This type of manufacturing is very well suited for the mass production of a composite FRP bars. It
is slightly more complex than the techniques described in earlier sections, and involves a high cost
for the setup of the system. But once the machinery is setup, composites can be produced
continuously and uniformly.
2.6.8 Filament winding and tube rolling
In the filament winding technique, a reinforcing tape or tow is continuously wound around a
mandrel in a controlled pattern. The dry reinforcement may either be wound around the mandrel,
and then saturated with resin after winding is complete, known as the dry-winding process, or the
reinforcement may be saturated in resin just before winding, known as the wet-winding process.
Tube rolling process typically involves wrapping of a pre-impregnated reinforcement around a
circular mandrel.

41
2.6.9 Automated fibre placement
Automated fibre placement is an advanced technique used widely in the aviation & aerospace
industry. The fibre placed using a head mounted either on a robotic arm or a gantry system, to
reinforce a large composite part wholly, which would not be possible by hand lay-up. This
technique generally uses prepreg fibres or prepreg fabrics, which can be precisely placed at the
required position. Curing generally requires an autoclave. The cost of setup of such machinery
incurs very high cost, limiting its use mainly to the aerospace industry.
2.7 Choice of manufacturing technique
The consideration of the different manufacturing techniques in reference to the requirements of the
FRP fibre envisioned are discussed below:
Wet lay-up: No control over thickness or volume fractions, high void content, and poses
health and safety concerns.
Pre-preg lay-up: Expensive, low shelf life and demanding storage requirements.
Spray-up: Low volume fractions in the direction of loading.
Vacuum infusion: Low setup cost, Uniform and reproducible composite parts.
RTM: High setup costs, suitable for complex shapes. More than necessary to make
a flat composite panel.
LRTM: Setup costs slightly higher than vacuum infusion process.
Compression
moulding:
High setup costs, suitable for complex shapes. More than necessary to make
a flat composite panel.
Bladder moulding: Suitable for hollow shapes. More than necessary to make a flat composite
panel.

42
Pultrusion: High setup costs.
Faster and better quality control, compared to others.
Possibility of higher volume fractions compared to others mentioned above.
Filament winding: Suitable for prismatic shapes. More than necessary to make a flat composite
panel.
Automated fibre
placement:
Very high setup costs, suitable for complex shapes. More than necessary to
make a flat composite panel.
Boutier et al. [175] in their experimental study have compared the different LCM techniques in
detail, based on their performance, setup and operational costs, production scale, and size. While
Pultrusion may be the better way of manufacturing the fibre at a large scale, a quick, relatively low
cost vacuum infusion technique could be used to produce the fibres at a small scale in the
laboratory.

43
Chapter 3: Materials and Mix Designs
3.1 FRP materials and consumables
3.1.1 Reinforcing fibres
A total of 4 types of reinforcing fibres, as shown in Figure 3-1 were used to make the FRP panels.
Figure 3-1 Reinforcing fabrics used in the project (a) woven glass fabric, (b) woven carbon fabric,
(c) unidirectional glass fibre tape, & (d) unidirectional carbon fibre tape
(a) (b)
(c) (d)

44
Woven glass fabric
Woven E glass fabric, of the type generally referred to in the market as style E 3733, shown in
Figure 3-1 (a) was the first fabric to be used as the reinforcing fabric for FRP panels. These are the
lowest cost FRP reinforcing fibres available. The style E 3733 refers to loose plain type of weaving.
The technical specifications of the fabric are as follows –
1. Thickness – 0.0078” or ~0.2mm
2. Areal density – 5.8 oz/sq.yd. or ~200gsm
3. Weave type – 18 X 18 plain
Unidirectional glass fibre
Unidirectional S glass tape of width 12 inches as shown in Figure 3-1 (c) was used for making FRP
panels. The technical specifications of the fabric are as follows –
1. Thickness – 0.009” or ~0.23mm
2. Areal density – 4 oz/sq.yd. or ~135gsm
3. Weave type – Unidirectional with fine spider web of polymer fibrils holding the fibre in
place.
Woven carbon fibre
Woven carbon fibre with twill weaving pattern, as shown in Figure 3-1 (b) was used for making
the FRP panels. The basic technical specifications of the fabric re as follows:
1. Thickness – 0.012” or ~0.32mm
2. Areal density – 5.7 oz/sq.yd or ~195gsm
3. Weave type – 2 X 2 twill with 3k carbon fibres.
Unidirectional carbon fabric
Unidirectional carbon fibre tape of width 12 inches, as shown in Figure 3-1 (d) was used to cast
FRP panels. The basic technical specifications area as follows –

45
1. Thickness – 0.01” or ~0.26mm
2. Areal density – 4.8 oz/yd2 or ~ 165 gsm
3. Weave type – Unidirectional with fine spider web of polymer fibrils holding the fibre in
place.
3.1.2 FRP resin
Epoxy was chosen was the only resin used as the matrix for the FRP panels. The multifunctional
epoxy resin with cycloaliphatic amine based hardener was manufactured by Rhino Linings
Corporation.
The trade name of the resin-hardener system used is Rhino epoxy 1411 resin with hardener rhino
4111, which was used in the ratio 100:30 (Resin: Hardener).
The basic properties of cured neat resin, as provided by the manufacturer are as follows:
1. Glass transition temperature Tg: 90C
2. Tensile strength: 10.3 ksi ~ 70 MPa
3. Tensile modulus: 465 ksi ~ 3.2 GPa
4. Ultimate elongation: 7.4% to 7.5 %
3.1.3 Release agent
Water based Polytetrafluoroethylene (PTFE) (Teflon like) release agent was used on the Aluminium
moulds for easy peeling off of the FRP panel. The release agent is manufactured by Airtech
international incorporated, and is sold by the name commercial Release all® Safelease 30, rated
to 450F (~232C) curing temperature.

46
3.1.4 Peel ply, vacuum bag & flow medium
Nylon based peel ply pre-coated with silicone release agent having thickness 0.0045” (~0.11mm),
manufactured by Airtech International Incorporated was used. The product is sold by the name
Bleeder lease® B, and is rated to temperature of 450F (~232C).
Nylon based vacuum bag of high elasticity having thickness 0.002” (~0.05mm), manufactured by
Airtech International Incorporated was used for manufacturing the FRP panels. The product is sold
by the name Ipplon® KM1300, and is rated to the temperature 420F (~212C).
Polypropylene based flow medium, manufactured by Airtech International Incorporated has been
used. It is sold by the name Greenflow 75, and is rated to temperature 302F (~150C).
3.1.5 Tacky tape
A multipurpose sealant tape with high tack, manufactured by Airtech International incorporated
has been used for sealing the sides of the vacuum bag during the production of the FRP panels.
3.1.6 Plastic tube & spiral wrap tube
Spiral wrap of diameter 3/8th inch, and plastic tube of diameter 3/8
th inch made out of food grade
polyethylene was used in manufacturing the FRP panels. The tape is sold by the name AT-200Y,
and is rated to maximum cure temperature of 400F (~204C).
3.1.7 Moulds
A flat Aluminum mould was used to cast the FRP panel on.
3.2 Tabbing Materials for FRP tests
Two types of materials have been used for two different sizes of FRP samples.

47
Aluminium sheets of thickness 1/32” (~0.8mm) were used for tabbing the fibre sized FRP specimen.
Electrical grade fiberglass laminate (GPO3), also known as polyester-grade industrial laminate of
thickness 1/16” (~1.6mm) was used to tab FRP strips for tensile strength tests. These laminates are
rated to a temperature of 265F (~130C), and have tensile strength in the range of 10-15 ksi (~70-
105MPa).
Epoxy glue of make JB weld, rated to a temperature of 600F (~315C) was used for tabbing.
3.3 Materials for Cementitious Composites
3.3.1 Cement
General purpose Type 10 of make Quikrete was used for all the tests.
3.3.2 Aggregates
River sand was used as fine aggregate to cast mortar and concrete specimen. The fine aggregate
had a specific gravity of 2.62.
Crushed natural stone nominal maximum size 12mm was used as coarse aggregate for casting
concrete specimen. The coarse aggregate had a specific gravity of 2.7.
3.3.3 Water
Clean potable tap water was used as the water for mixing.
3.3.4 Mould release agent
Organic biodegradable, canola based, reactive form release agent of make Green Release was used
to coat the moulds prior to casting the mortar and concrete specimen.
3.3.5 Moulds
All the moulds were made of PVC material.

48
3.3.6 Glass fibres
Glass fibre used for comparison were Alkali resistant glass chopped strands from OCV
Reinforcements of the following properties:
Length: 35 mm
Thickness: 0.2 mm
Width: 1.1 mm
Specific Gravity: 2.58
3.4 Mix designs
3.4.1 Mortar
Mortar with water to cement ratio of 0.35, with equal parts of cement and sand were used for
casting the specimen. The mortar had a compressive strength of 60 MPa at 7 days.
3.4.2 Concrete
Concrete with the following mix design was used for casting the specimen.
Table 3-1 Mix design for concrete
Water Cement Fine Aggregate Coarse Aggregate
199.0 kg/m3 360.8 kg/m
3 869.6 kg/m
3 911.5 kg/m
3
The concrete had a compressive strength of 25 MPa at 7 days, and 35 MPa at 28 days.
No chemical or mineral admixtures were used, for mortar or concrete specimen.

49
Chapter 4: Manufacture of Fibre and Characterization
4.1 Manufacture of FRP composite fibre
Various FRP manufacturing techniques have been discussed earlier in the Section 2.7. The vacuum
infusion technique, limitations and improvisations associated with our project requirements in
particular are discussed in this section. While Pultrusion is perhaps the only way of manufacturing
a composite part which extends essentially in one direction, the simplest form that can be made
using other techniques including the vacuum infusion technique is a flat FRP panel. These panels
need to be cut or trimmed to a size suitable for being used as a short discrete fibre in fibre reinforced
concrete.
The target fibre dimensions were:
Diameter: 0.5mm
Length: 50 mm
4.1.1 Manufacture of FRP panel: vacuum infusion technique
Stepwise procedure of the vacuum infusion technique is described below:
1. The flat aluminum or alloy mould is cleaned, so that there aren’t even small dust particles.
This is essential in creating a leak free vacuum bag.
2. The mould release agent applied, in order to prevent the epoxy resin to stick to the mould.
(Fig 4-1 (a)).
3. The reinforcing fabric and a layer of peel play are placed on the mould in the regular
infusion process. In this project, an extra layer of peel ply was placed between the mould
and the reinforcements (Fig 4-1 (b), 4-1 (c)). Sometimes an additional flow medium is also
placed at the top in cases when the thickness of the reinforcements is small. The flow
medium assists the flow of resin (Fig. 4-1(d)).

50
4. Inlet & outlet tubes are placed at the two edges as shown in Figure 4-1 (d). The entire setup
is then covered with vacuum bag which acts as the counter-mould. Spiral wrap is used to
allow for uniform flow into and out of the reinforcements.
5. The vacuum bag is then sealed off using a tacky tape. The outlet is connected to the catch
pot, which is in turn connected to a vacuum pump (Fig. 4-1 (e)).
6. A vacuum test is done to check for leaks. This is done by pinching off the inlet tube. The
vacuum pump is then switched on, to create a vacuum inside the bag. Once vacuum is
created, the vacuum pump is switched off, and the change in pressure inside the vacuum is
measured for about 10 minutes (Fig. 4-1 (e)).
7. Once vacuum is setup in the system, the degassed resin and hardener are mixed in the resin
pot and introduced through the inlet. The resin is drawn under vacuum pressure, and infuses
into the reinforcing fabric (Fig. 4-1 (f), 4-1 (g)).
8. Once the resin has saturated the reinforcing fabric, the inlet channel is pinched off. The
outlet is still connected to the catch pot, the setup still under vacuum.
9. The setup is left undisturbed for 24 hours, after which it is separated from resin pot and
catch pot. It is cured in the oven at 65 C for 4 hours and 85 C for another 2 hours.
10. Once cured, the peel plies on both sides are then peeled off carefully ensuring no damage
to the FRP panel.

51
Figure 4-1 Steps involved in Vacuum infusion process
(a) (b)
(c) (d)
(e) (f)
(g)

52
4.1.2 Adaptation of technique to our requirements
While the target was to produce a fibre of a circular cross section, the vacuum infusion technique
produces a flat panel which is cut to fibre sizes, giving the fibre a rectangular cross section. The
thickness of the fibre is governed by the amount of reinforcing material and the technique of
manufacture. In this project, the thickness of the fibres of different compositions varies from 0.3mm
to 0.9mm. The width of the fibre depends on the ability to cut the fibre. Practically, the lowest
width possible is about 1.2 to 1.5 mm.
As mentioned in the earlier section, a layer of peel ply was placed between the mould and the
reinforcements, which is not placed in the regular infusion processes. The peel ply gives a rough
finish to the surface of the composite part, and in most applications, a rough surface is not desired.
Often the surface is polished with epoxy to give the part a glossy look. In our case however, a
rough surface means a better bond behaviour with cementitious material. To get a rough surface
on both sides, the reinforcing fabric is placed between two peel plies, instead of having just the
one peel ply on top of the reinforcing fabric.
4.1.3 Cutting FRP panels to make FRP fibre
2 types of panels were manufactured using the infusion technique. The first one was using a woven
fabric, which have fibres running in both the directions. The effort for cutting the panel is moderate
in both directions. The second type of panel was made using a unidirectional fabric. For these
panels, the effort required for cutting along the direction of fibres is less, but the effort for cutting
perpendicular to the direction of fibres is high.
Also both, woven as well as unidirectional panels were cast using 2 types of materials, glass and
carbon. The effort required for cutting the carbon fibre reinforced polymer panel (CFRP panel)
was higher than glass fibre reinforced polymer panel (GFRP panel).
Several tools were tried for cutting the panels. Even the sharp blades were found to be difficult for
making narrow cuts. Besides, without a precise guiding mechanism, it is not possible to cut in a
straight line. A mechanical saw was used for cutting the FRP panel. While the cuts were very clean,

53
the effort required to make a single fibre was high. Practically not a feasible option. A pair of good
quality scissors were also tried, while cutting was possible, making precise cuts was not possible.
A stack paper cutter as shown in Figure 4-2 (a) was tried, and worked well with most of the panels.
Sheet metal scissors also known as sheet metal snips or shears were used to cut the unidirectional
panels in the direction perpendicular to the fibres into 50 mm wide strips. These strips were then
cut into fibre sizes using the paper stack cutter.
Figure 4-2 Cutting the FRP panels to fibre size
4.2 Characterization of FRP panel and fibre
4.2.1 Methods and experimental setup
Volume fractions
Vacuum infusion can produce FRP panels of good quality with reasonable consistency among
different batches. There may however be minor variation caused because of inconsistent vacuum
compression among different batches, and in different regions of the same batch. The volume
fraction of the composite may be calculated using the formula:
𝑉𝑓 =
𝑠
𝑓 ∗ 𝑡
Equation 4-1
(b)
(a)

54
Where 𝑠 = superficial density or areal weight of the reinforcement in gsm or g/m2
𝑓 = density of fibre material in g/m3
𝑡 = thickness of FRP panel in m
Microscopic images
The fibre samples were observed under an optical and scanning electron microscope.
Optical microscope
An optical microscope of make Meiji, mounted on an arm boom was used to observe the FRP
fibres under a magnifications ranging from 2x to 4.5x. A 2 megapixel camera mounted on the axis
of the microscope was used to take pictures, using the Motic Image plus 2.0 ML Software. The
measurements such as fibre width were made using the Motic live imaging module. The source of
external light was by using lamps attached to an 18” flex arm, the setup of which was made by
Fiber Optic Company.
Scanning electron microscope (SEM)
A Hitachi SU1510 Scanning electron microscope was used to take microscopic images of fibres and
interface samples. The specifications of the SEM are as defined below:
In addition to the SEM, the Energy-Dispersive X-Ray Spectroscopy comes with the same machine.
Table 4-1 Specifications & Settings of the SEM used
Specifications of the SEM
Resolution
Secondary electron
resolution
3 nm @ 30kV (High Vacuum mode)
15 nm @ 3kv (High Vacuum mode)
Back-Scattered electron
resolution 4 nm @ 30kV (Variable Pressure mode)

55
Magnification 5x to 300,00x
Accelerating voltage 0.3 kV to 30 kV
Pressure range 6 Pa to 270 Pa
Operating System Windows 7
Room Temperature 20 to 25 C
Humidity 70% RH or less
Setting used for taking pictures of fibres (For Section 4.2.2.2 & Section 6.2.2.3)
Working distance 15mm
Current 60 mA
Voltage 15 kV
Lighting Component
Pressure used 30 Pa
Mode BSE imaging
Tensile behaviour
Specimen preparation
The performance of the composite or FRP was measured by means of a tensile test. Tensile loading,
along with some shear loading are the two predominant kinds of loading that we can expect on
the fibre in concrete. The thickness of each panel ranges from 0.3mm to 0.7mm, which makes it is
difficult to keep the sample held in between the jaws of the regular friction grips. There is also a
chance of causing damage to the FRP panel at the grips. Therefore, commercially available
Aluminum or Fibreglass sheets are often used as tabbing material, which are then secured in place
by the friction grips. Fibreglass tabbing is preferred compared to Aluminum, as the rough fibreglass
surface can be easily glued using epoxy glue onto the FRP panels produced in the laboratory.
Electrical grade fibreglass of thickness 1/16” (~1.6mm) was used for tabbing. The tabbing process is
described with the help of the Figure 4-3 below.

56
1. The 1/16” (~1.6mm) thick fibreglass sheet (tabbing material) is cut into strips of 1” or 2.5
cm using a saw or shears.
2. These strips are then glued onto the edge of the FRP sheet produced, such that the strips
are perpendicular to the direction of fibres or the direction of loading as shown in
Figure 4-3 (a). A clear gauge length of 10cm is maintained between the two tabs.
3. The circular Table saw is used to cut the FRP panel with fibreglass tabs to narrow strips of
width about 1cm as shown in Figure 4-3 (b).
Figure 4-3 Preparation of specimen for tensile testing. (All dimensions are in mm)
b
c
a

57
Test setup and procedure
The tests were performed on a vertically mounted strain controlled Instron universal testing
machine in accordance with ASTM D3039-14 [176]. The hydraulic powered Instron machine was
equipped with a load cell of 250 kN. The tests were conducted at a constant displacement rate of
0.035 mm/sec (2mm/minute). The displacement was measured by measuring the cross-arm
displacement. A DASYlab program was used to acquire the data and store it in asci format. The
data is further analysed to obtain the strength, strain, and other elastic properties.
Inevitably due to the nature of the test, there arises some eccentricity due to misalignment in the
machine while placing the specimen in the grips. Misalignment and eccentricity can cause high
variations in the data, and even result in premature failures in the FRP specimen. Care is taken to
minimize the misalignment, by visually aligning the long axis of the specimen with the axis of the
machine. At least 10-12 specimen were tested to obtain the average tensile response of the FRP
specimen. The Figure 4-4 below show the grips used for the test.
Figure 4-4 (a) Friction grips for tensile tests of (b) GFRP and (c) CFRP strips
Single fibre pullout
Specimen preparation
Single fibre pullout tests were performed to assess the bond of the fibre with cementitious matrix.
To test the bond, dogbone shaped specimen as shown in Figure 4-3 below were cast and tested.
(a) (b) (c)

58
A mortar of normal strength, using equal parts of general purpose cement and fine river sand, with
water to cement ratio of 0.35 was used for all tests. The mixing and placing the cement mortar
was as per ASTM C305 [177]. Water is first poured into the mixing bowl, after which cement is
added. They are mixed for about 30 seconds to get a consistent cement paste, after which gradually
sand is added while the mixer is rotating. Once all the sand is added, it is allowed to mix for
another 30 seconds. The speed of the mixer is then increased, and mixing continued for about 30
seconds. The mixer is then stopped, the excess mortar collected on the sides is scraped off and
allowed to stand for another minute. Mixing is resumed, and the process is completed after another
60 seconds of mixing ensuring a uniform mortar is obtained.
Figure 4-5 Schematics of dogbone sample
The dogbone shaped specimen, as shown in Figure 4-5, consists of two halves, which are separated
by a 0.5 mm thick plastic separator. The fibre is pierced through this thin plastic separator, which
holds the fibre in position. The plastic sheet in turn is secured in the grooves in the mould dividing
the dogbone specimen in two equal halves. The moulds were made of poly vinyl chloride (PVC),
and were oiled prior to pouring the mortar. Mortar is then poured carefully in both halves of the
dogbone to fill about half the height. The moulds are vibrated slightly on a Table vibrator for
about 20-30 seconds, care is taken so that the fibre is still in position and alignment during and
after vibration. Mortar is then poured to fill up the dogbone shaped specimen to fill up, then
vibrated lightly for about 60-90 seconds. The specimen are then covered with a plastic film
immediately after casting to avoid any loss of moisture while in plastic state. They are de-moulded
59
the next day, labelled and moist cured in a curing room at 23˚ and 95% relative humidity for 6
days.
The only means of connection of the two halves of the dogbone specimen are through the bond
with the fibre. The two ends are pulled, the stresses are transferred from the matrix to the fibre in
the form of shear stress acting on the bonding surface of the fibre. This bond shear stress induces
tensile stress in the body of the fibre. Failure of these dogbone specimen can be considered when
there is zero or minimal resistance to separation of the two ends of the dogbone specimen. Among
the failure types discussed in Section 2.3.2, the dogbones failed in predominantly the following
types:
a) Fibre pullout
b) Fibre fracture
c) Matrix spalling (in inclined fibre pullout only)
(c)
(a) (b)
Figure 4-6 Pictures of steps involved in casting of dogbone specimen

60
Test setup and procedure
The tests were conducted on an electric powered screw driven horizontally mounted machine
equipped with a 2000 lbs (~900 N) load cell. An LVDT was used to measure the displacement or
the crack width opening. The grips of machine are designed in the shape of a dogbone, as shown
in Figure 4-7, such that the points of contact were away from the point where fibre enters the
matrix. This is important, since the point where fibre enters the matrix is of critical importance,
therefore must be kept free of interferences [115].
Figure 4-7 Horizontal setup for single fibre pullout tests
The quasi-static pullout test was conducted with pullout rate of 2.4 mm/minute. A DASYlab
program was used to acquire the load and slip data in asci format which is later processed to obtain
the pullout load-slip curve.
Bond stress is computed by distributing the experimentally determined load over the area of
bonding of the FRP fibre with the matrix. Experimentally obtained pullout load-slip curves are
integrated to quantify the total pullout energy dissipated by the fibre-matrix interface during the
pullout process. Once the pullout energy is known, the equivalent bond strength is calculated using
the following [178]:
𝜏𝑒𝑞 = 8 ∗ 𝐸𝑝
𝜋 ∗ 𝑑𝑓 ∗ 𝐿𝑓2 Equation 4-2

61
Where 𝜏𝑒𝑞 is the equivalent bond strength, 𝐸𝑝 is the fibre pullout energy, 𝑑𝑓 is equivalent
diameter of fibre and 𝐿𝑓 is the total length of the fibre.
For fibres that are non-circular in diameter, a generalized equation may be used
𝜏𝑒𝑞 = 8 ∗ 𝐸𝑝
𝑃 ∗ 𝐿𝑓2 Equation 4-3
Where P is the perimeter of the fibre.
The equation may also be modified to change the circular perimeter Pcir=π*df to rectangular
perimeter Prec=2*(t+w) where w is fibre width and t is fibre thickness. The equation therefore
becomes
𝜏𝑒𝑞 = 8 ∗ 𝐸𝑝
2 ∗ (𝑡 + 𝑤) ∗ 𝐿𝑓2 Equation 4-4
8-10 specimen were tested to obtain the average curves shown in the results and discussion section.
Flexural test (ASTM C1609)
Flexural tests were done in accordance with ASTM C1609 [179]. At least 3 beams of size
100mm x 100mm x 350mm were tested.
Specimen preparation
A normal strength concrete of compressive strength 40 MPa was used throughout. Type 10 General
use (ASTM Type I), cement, fine river sand, and crushed stone coarse aggregate of maximum
nominal size 10mm (0.4”) were used. No chemical admixtures or secondary cementitious material
were used.
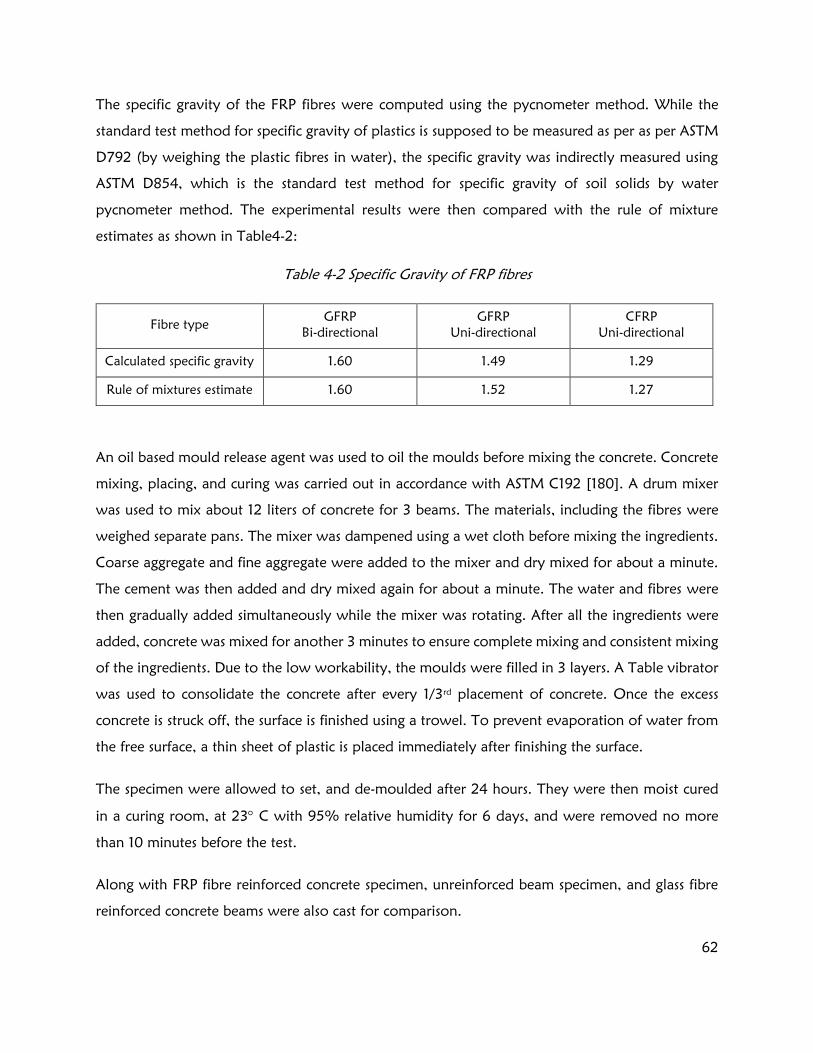
62
The specific gravity of the FRP fibres were computed using the pycnometer method. While the
standard test method for specific gravity of plastics is supposed to be measured as per as per ASTM
D792 (by weighing the plastic fibres in water), the specific gravity was indirectly measured using
ASTM D854, which is the standard test method for specific gravity of soil solids by water
pycnometer method. The experimental results were then compared with the rule of mixture
estimates as shown in Table4-2:
Table 4-2 Specific Gravity of FRP fibres
Fibre type GFRP
Bi-directional
GFRP
Uni-directional
CFRP
Uni-directional
Calculated specific gravity 1.60 1.49 1.29
Rule of mixtures estimate 1.60 1.52 1.27
An oil based mould release agent was used to oil the moulds before mixing the concrete. Concrete
mixing, placing, and curing was carried out in accordance with ASTM C192 [180]. A drum mixer
was used to mix about 12 liters of concrete for 3 beams. The materials, including the fibres were
weighed separate pans. The mixer was dampened using a wet cloth before mixing the ingredients.
Coarse aggregate and fine aggregate were added to the mixer and dry mixed for about a minute.
The cement was then added and dry mixed again for about a minute. The water and fibres were
then gradually added simultaneously while the mixer was rotating. After all the ingredients were
added, concrete was mixed for another 3 minutes to ensure complete mixing and consistent mixing
of the ingredients. Due to the low workability, the moulds were filled in 3 layers. A Table vibrator
was used to consolidate the concrete after every 1/3rd placement of concrete. Once the excess
concrete is struck off, the surface is finished using a trowel. To prevent evaporation of water from
the free surface, a thin sheet of plastic is placed immediately after finishing the surface.
The specimen were allowed to set, and de-moulded after 24 hours. They were then moist cured
in a curing room, at 23 C with 95% relative humidity for 6 days, and were removed no more
than 10 minutes before the test.
Along with FRP fibre reinforced concrete specimen, unreinforced beam specimen, and glass fibre
reinforced concrete beams were also cast for comparison.

63
Test setup and procedure
The specimen were tested after moist curing after 7 days in a closed loop Instron universal testing
machine as per ASTM C1609 as shown in Figure 4-8 & 4-9 below:
Figure 4-8 Third point bending test as per ASTM C1609
Figure 4-9 Schematics of flexural beam tested as per ASTM C1609.

64
An average of 2 LVDT measurements were used for determining the mid-span deflection. The rate
of loading was set to
0.05 mm/minute up to a deflection of L/600
0.10 mm/minute from a deflection of L/600 to a deflection of L/300
0.15 mm/minute from a deflection of L/300 to a deflection of L/150 or failure whichever
occurred earlier
Where L = clear span of the beam = 300mm in our case
From the data acquired, the peak load, and residual loads at a deflection of L/600 and L/150 were
determined. The flexural strength corresponding to the above deflections are calculated as per the
formula:
𝑓 =𝑃 ∗ 𝐿
𝑏 ∗ 𝑑2 Equation 4-5
Where 𝑓 = Flexural strength
𝑃 = Load
𝐿 = Clear Span
𝑏 = average width of beam
𝑑 = average depth of beam
The load deflection curve is then integrated from deflection 0 to deflection L/150 to obtain the
area under the curve, which gives us the flexural toughness of the beam. In other words, it gives us
the energy absorbed by the fibre reinforced concrete specimen during the duration of the test from
mid-span deflection 0 to L/150.
The equivalent flexural strength ratio % is obtained by using the following formula:

65
𝑅𝑇,150𝐷 =
150 ∗ 𝑇150𝐷
𝑓 ∗ 𝑏 ∗ 𝑑2∗ 100% Equation 4-6
Where: 𝑅𝑇,150𝐷
= Equivalent flexural strength ratio
𝑇150𝐷
= Flexural toughness
4.2.2 Results and discussion
Volume fractions
A reasonable consistency was observed in most of the FRP panels. The volume fractions for the 4
kinds of FRP panels produced are described in the Table 4-3.
Table 4-3 Summary of volume fractions of FRP panels produced.
GFRP
Bi-directional
GFRP
Uni-directional
CFRP
Bi-directional
CFRP
Uni-directional
Thickness (mm) 0.28 & 0.7 0.35-0.5 0.45 0.4-0.6
Volume Fraction of Fibre Vf (%) 31% 22-30% 25% 18-25%
Effective Vf (%) 16% 22-30% 13% 18-25%
Specific Gravity 1.67 1.33
The unidirectional fabrics, especially unidirectional S-Glass fibre had varying thickness and even
some gaps in between. In such cases, we can expect a greater variation in thickness and volume
fractions. The difference in volume fractions does change in the elastic properties of FRP which are
discussed further in Section 4.2.2.3.

66
Microscopic images
Optical microscope
The unique surface texture shown in Figures 4-10 & 4-11 comes as a result of the production
technique. The rough pattern comes from the peel ply we used in the manufacturing process.
During infusion, the peel ply are wetted by the resin completely. When peel ply are peeled off of
the FRP panel, it leaves an impression on the panel, thereby creating the pattern on the FRP panel.
Figure 4-12 shows the edge of the Unidirectional CFRP fibre. As we can see, there is minimal
damage to the fibre at the edges in the cutting process.
Figure 4-11 Microscopic image of the Longitudinal profile of CFRP fibre
(a) (b
Figure 4-10 Microscopic images of the surface of (a) CFRP and (b) GFRP fibres

67
Figure 4-12 Microscopic image of the cut section of the CFRP fibre, focusing on the edge
Scanning electron microscope
SEM images were taken on GFRP and CFRP unidirectional fibres at the 200x, 500x and 2000x
magnifications. The images are shown below:
Figure 4-13 SEM Images of GFRP fibres at (a) 200x, (b) 500x & (c) 2000x magnifications
The SEM images are at a higher magnification and more detailed than the OM images. The pattern
on the surface observed in the OM images can be more clearly seen in the SEM images. Because of
the natural lighting, shadow & reflection in the OM images, we get a better depth perception in
OM images as compared to the SEM images.
(b) (c) (a)

68
Figure 4-14 SEM Images of CFRP fibres at (a) 200x, (b) 500x & (c) 2000x magnifications
As we can see, there is no distinct difference between the GFRP and CFRP fibres on the surface. No
distinct difference is expected, as the manufacturing technique is identical. Shown below are FRP
fibres at a lower magnification, and a different lighting to emphasize the depth perception and
show a 3D effect.
For the CFRP fibre in the above Figure 4-15 (left), we can see the crater like depressions, consistent
with the OP image of the profile of the fibre, shown in Figure 4-10. We can also see some exposed
fibres at the edges. In the Figure 4-15 (right), is the SEM image of a GFRP fibre which was damaged
earlier. Note the separation of fibres along the length of the crack.
(b) (c) (a)
Figure 4-15 SEM image at lower magnification of 50x with 3D mode lighting. Left: Undamaged
CFRP fibre, Right: Damaged GFRP fibre

69
Tensile behaviour
Average tensile response of CFRP and GFRP specimen are shown in the Figures 4-15 and 4-16, and
have been summarized in the Table 4-4
Table 4-4 Summary of Tensile behaviour of FRP strips
Glass-Bi Glass-Uni Carbon-Bi Carbon-Uni
Effective Vf in
direction of loading (%) 16% 22-30% 13% 22-30%
Strength (MPa) 194 578 398 953
Modulus (GPa) 4.0 9.9 6.6 19.9
We can see that the CFRP panel is roughly twice as strong and about twice as stiff as the GFRP
panel, both in the unidirectional and bidirectional FRP panels. Furthermore, the unidirectional FRP
strips have roughly twice the number of reinforcing fibres in the direction of loading as compared
to the woven FRP strips. Consequently, for both GFRP and CFRP, the unidirectional FRP strips are
twice as strong and have twice the elastic modulus as the woven FRP strips.
Figure 4-16 Average tensile response of woven FRP panels
0
100
200
300
400
500
0% 1% 2% 3% 4% 5% 6% 7% 8% 9% 10%
Stre
ss (
Mp
a)
Strain (%)
GFRP-Bi CFRP-Bi

70
Figure 4-17 Average tensile response of unidirectional FRP panels
The response of FRP specimen are generally lower than the values estimated by the rule of mixtures,
as rule of mixtures does not take into account the voids and defects in the composite. The strength
and moduli, as expected are slightly lower than the values estimated with the rule of mixtures.
Additionally, the drop in strength can also be attributed to the eccentricity that might have
developed during the test process. Another reason might be the fact that the matrix of the panel
might get slightly damaged while making the cut with the saw.
The third reason for the inconsistent strength, especially in the case of unidirectional GFRP panel
might be the fact that the reinforcing fibre is of uneven pattern and thickness. A woven fabric is
often of a very uniform pattern making a uniform thickness of the fabric and thereby the panel.
The unidirectional fabric on the other hand, is generally held in place with the help of very thin
organic film which during manufacture gel into the resin. Sometimes these plastic films are not
strong enough to hold firmly in place the unidirectional fibres. This lack of uniformity in thickness
causes variability in volume fractions of the composite resulting in variable tensile response. The
variations in thickness of the FRP panel can be easily rectified in case of large scale production,
where a better quality control over the manufacturing technique is possible.
0
200
400
600
800
1000
0% 1% 2% 3% 4% 5% 6% 7% 8% 9% 10%
Stre
ss (
Mp
a)
Strain (%)
CFRP GFRP

71
Single fibre pullout
To assess the interfacial properties of FRP fibre reinforced cementitious composites, series of single
fibre pullout tests were conducted to determine the bond parameters comprising of peak bond
strength, pullout energy, and average equivalent bond strengths. The woven fabric FRP panels are
considerably easier to produce and handle, thus the initial tests were conducted on FRP fibres made
of woven GFRP and CFRP panels. Almost all the specimen made using fibres made out of woven
glass or carbon fibre reinforced composite underwent fibre fracture before initiating a pull out. The
fibres would experience normal stresses exceeding the strength before the interfacial stresses could
attain large enough shear stresses to initiate pullout. The Figures 4-18 (a) & (b) show the specimen
which underwent fibre fracture and fibre fracture after partial pullout respectively. Various cross
sectional geometries have been tried out with the intention of initiating pullout, but barring one
or two specimen, premature failure has been observed in all of the woven GFRP and woven CFRP
based fibres. As a result of fibre fracture, the energy absorption of the pullout process is very low,
and therefore wouldn’t completely serve the purpose of fibre reinforcement in concrete. These
however are the characteristics of pullout testing, not necessarily indicating the fibre would undergo
premature failure in a fibre reinforced cementitious composite.
Fibre pullout in this kind of specimen could be initiated by using different materials and
manufacturing processes to increase the volume fraction of reinforcing fabric, thereby increasing
the strength and modulus. On the upside, fibre fracture indicated that the interfacial bond between
fibre and cementitious matrix is considerably strong; stronger than that of other popular polymeric
and steel fibres.
Unidirectional fabrics were then used to produce FRP panels, which result in panels with
significantly superior performance in the direction of alignment of fibres. The rough surface of the
fibre seen under the microscope in Figures 4-10 to Figure 4-15, is one of the vital contributors to
the superior interfacial behaviour of the fibre-matrix interface comes from the manufacturing
technique. Hence, the manufacturing technique is not changed.

72
Figure 4-18 Different failure types in single fibre pullout test specimen, (a) fibre fracture, (b) fibre
fracture after partial pullout, and (c) complete fibre pullout
The increase in tensile capacity of the FRP fibre allowed for development of higher interfacial
stresses between the fibre and matrix, allowing the study of bond-slip behaviour in detail. Complete
fibre pullout is observed in all of the unidirectional CFRP based single fibre dogbone specimen and
most GFRP based single fibre dogbone specimen.
Table 4-5 illustrates some of single fibre pullout curves.
We can see from test samples S2 to test sample S11, that all exhibit premature failure due to fibre
fracture. In one of the specimen in test sample S7, a fibre pullout is observed. However, the
geometry of the fibre, 0.7mm thickness, 2.8mm width and 50mm length is rather impractical. An
exceedingly high volume fraction of fibres would have to be used to get sufficient number of crack-
bridging fibres in the fibre reinforced cementitious composites. The idea behind trying such sizes
were to establish roughly the peak and post peak bond strength. The maximum bond strength can
then be used to estimate a minimum tensile strength that is required to avoid premature fibre
fracture.
(a) (c) (b)

73
Table 4-5 Summary of different single fibre pullout tests
Sample S2
Material: E Glass,
Bidirectional
Dimensions
(mm): 0.7 * 1.6 * 50
Max Interfacial
Stress: 1.96 MPa
Failure Type:
All fractured
Sample S6
Material: E Glass, Bidirectional
Dimensions
(mm): 0.28 * 2.5 * 50
Max Interfacial
Stress: 1.06 MPa
Failure Type:
All fractured
Sample S7
Material: E Glass, Bidirectional
Dimensions
(mm): 0.7 * 2.8 * 50
Max Interfacial
Stress: 2.18 MPa
Failure Type:
All but one fractured
0.0
0.5
1.0
1.5
2.0
2.5
3.0
0 1 2 3 4
0.0
0.5
1.0
1.5
0 1 2 3 4
0.0
0.5
1.0
1.5
2.0
2.5
3.0
0 1 2 3 4

74
Sample S8
Material: E Glass, Bidirectional
Dimensions
(mm): 0.28 * 1.5 * 50
Max Interfacial
Stress: 0.66 MPa
Failure Type:
All fractured
Sample S9
Material: E Glass, Bidirectional
Dimensions
(mm): 0.25 * 1.35 * 30
Max Interfacial
Stress: 1.15 MPa
Failure Type:
All fractured
Sample S11
Material: Carbon,
Bidirectional
Dimensions
(mm): 0.45 * 1.8 * 50
Max Interfacial
Stress: 3.24 MPa
Failure Type:
All fractured
0.0
0.2
0.4
0.6
0.8
1.0
0 1 2 3 4
0.0
0.5
1.0
1.5
0 0.5 1 1.5 2 2.5 3 3.5 4
0.0
1.0
2.0
3.0
4.0
0 1 2 3 4
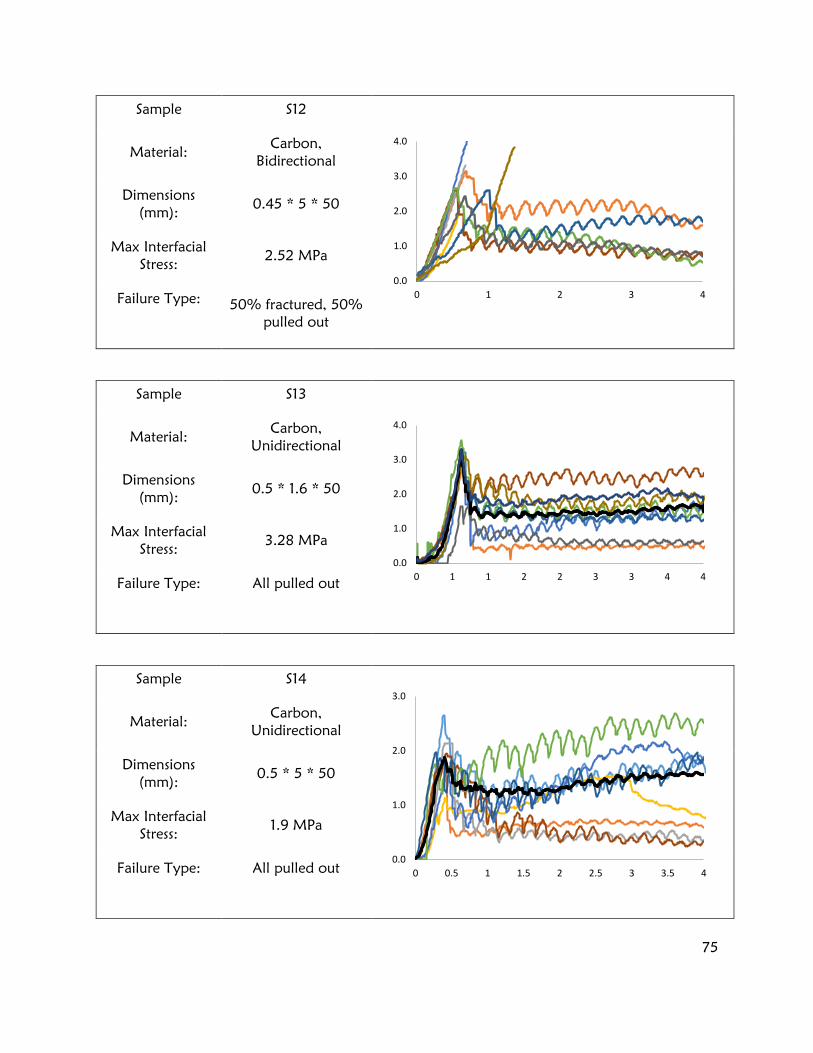
75
Sample S12
Material: Carbon,
Bidirectional
Dimensions
(mm): 0.45 * 5 * 50
Max Interfacial
Stress: 2.52 MPa
Failure Type:
50% fractured, 50%
pulled out
Sample S13
Material: Carbon,
Unidirectional
Dimensions
(mm): 0.5 * 1.6 * 50
Max Interfacial
Stress: 3.28 MPa
Failure Type:
All pulled out
Sample S14
Material: Carbon,
Unidirectional
Dimensions
(mm): 0.5 * 5 * 50
Max Interfacial
Stress: 1.9 MPa
Failure Type:
All pulled out
0.0
1.0
2.0
3.0
4.0
0 1 2 3 4
0.0
1.0
2.0
3.0
4.0
0 1 1 2 2 3 3 4 4
0.0
1.0
2.0
3.0
0 0.5 1 1.5 2 2.5 3 3.5 4

76
Sample S15
Material: S Glass,
Unidirectional
Dimensions
(mm): 0.4 * 1.5 * 50
Max Interfacial
Stress: 3.28 MPa
Failure Type:
20% fractured, 80
% pulled out
Sample S16
Material: S Glass,
Unidirectional
Dimensions
(mm): 0.4 * 1.5 * 30
Max Interfacial
Stress: 2.83 MPaa
Failure Type:
All pulled out
Samples S13 to S16, all of which are composed of unidirectional carbon and unidirectional S glass
fibres show a pullout behaviour. The pullout curves of S13 and S15 are discussed further with the
help of Figure 4-19 and 4-20.
0.0
1.0
2.0
3.0
4.0
0 0.5 1 1.5 2 2.5 3 3.5 4
0.0
1.0
2.0
3.0
4.0
5.0
0 1 2 3 4

77
Figure 4-19 Single fibre pullout curves of CFRP fibres
Figure 4-20 Single fibre pullout curves of GFRP fibres
The wavelike curves seen in the above Figures 4-19 & 4-20 are unique to FRP fibres. Other steel
and polymeric fibres tested using the same setup do not show such undulations. A closer
examination of these undulations reveal that the peak to peak length of the undulations is roughly
about 250µm. This is most likely caused because of the rough but uniform surface of the fibre,
0.0
0.5
1.0
1.5
2.0
2.5
3.0
3.5
4.0
0 2 4 6 8 10 12 14
Bo
nd
Str
ess
(MP
a)
Slip (mm)
0.0
0.5
1.0
1.5
2.0
2.5
3.0
3.5
4.0
0 2 4 6 8 10 12
Bo
nd
Str
ess
(MP
a)
Slip (mm)

78
illustrated in the Figure 4-21. To concur, we found that the crest to crest length on the surface of
the fibre is about 250µm as well. The Figure 4-21 below shows a sketch of the magnified section
of the fibre-matrix interface.
Figure 4-21 Sketch of the fibre-matrix interface
The Figure 4-22 illustrates an idealized and simplified single fibre pullout response of the of the
FRP fibres produced in this project. The load is generally normalized with respect to the bond area
to obtain bond stress as described in Section 4.2.1.4 of this document. We can relate the simplified
idealized FRP fibre pullout to the different failure scenarios observed with our samples.
Figure 4-22 Simplified idealized single FRP fibre pullout curve
As we can see from Figure 4-23 below, the roughness or the deformity helps in additional
anchorage at the micro level. For smooth surface fibres, the area 1 shown in the Figure 4-22 above,
represents the energy absorbed due to the resistance in fibre pullout because of the elastic bond

79
between the fibre and the matrix, much similar to the elastic bond that exists between the matrix
and aggregate. In the case of FRP fibres produced in this project, the area 1 denotes of a
combination of an elastic bond between the matrix and the fibre, and a micro-bearing mechanism
due to surface deformation of the fibre. Figure 4-23 shows an SEM image of the interior of the
dogbone specimen having a unidirectional CFRP fibre Note the surface roughness leading to a
bearing type of action, which can also be seen using an optical microscope shown in Figure 4-11.
Also note the damage on the fibre and interface due to abrasion during fibre pullout.
Figure 4-23 SEM image of CFRP Fibre-Matrix interface in the interior of the dogbone specimen
after fibre pullout test.
The samples S2 to S11 undergo a failure during this mechanism, when the normal tensile stress in
the fibre exceeds the strength, while the interfacial stress is still lower bond strength.
Once the interfacial stresses reach the elastic capacity, there is a sudden release in energy
accompanied by a sudden relaxation in the fibre. However, this relaxation occurs only for a fraction
of the second, after which the frictional component of the fibre pullout stresses the fibre again. This
is represented by the area 2 in the Figure 4-23.
Surface
roughn
Abrasio
n

80
Once the load exceeds the peak interfacial elastic limit, the frictional resistance to slip is offered.
The chemical behavior, fibre surface interaction with fresh cement matrix are also of importance
as they determine the quality of microstructure in the immediate vicinity of the fibre. We can expect
the hydrophobic fibres to have a wider and more porous ITZ compared to hydrophilic fibre, and
the hydrophilic nature of epoxy used in the FRP fibres produced in this project helps the interfacial
bond in the elastic and to some extent the frictional regions by densification of the ITZ
microstructure. The surface deformation of the fibre adds to the frictional resistance, giving it a
unique stick-slip kind of response during fibre pullout.
Table 4-6, Figures 4-24 & 4-25 describe the behaviour of FRP fibres in comparison to commercially
available steel and polypropylene fibres.
Table 4-6 Summary of different fibres behaviour in single fibre pullout tests
Instances of
Fibre Fracture Pullout Energy
Peak bond
stress
Equivalent
bond stress
St-Straight 0% 726 0.78 0.61
GFRP 30% 1040 3.32 0.94
PP-Crimped 0% 1051 2.16 1.22
CFRP 0% 2022 3.1 1.6
St-Hooked 0% 1459 3.38 2.1
We can see, the performance of FRP fibres is far superior to straight steel fibres, and at par with
the deformed polypropylene fibres. Although it may appear the hooked steel fibre has a higher
energy absorption, the peak performance of the FRP fibres, and the energy absorption at low crack
openings match the hooked steel fibres. It is evident, much can be gained by optimizing the
composition and geometry of the FRP fibres, perhaps surpassing steel fibres in both mechanical and
durability aspects.

81
Figure 4-24 Comparison of bond-slip behaviour of different fibres
Figure 4-25 Comparison of peak bond stress and equivalent bond strengths of different fibres
The variability observed in single fibre pullout tests conducted using FRP fibres made in this project
and other industrially available fibres are shown below in Figure 4-26 & Figure 4-27. The standard
deviation of bond stress of FRP fibres is comparable to the standard deviation of bond stress
industrially produced steel and polypropylene fibres.
0.0
0.5
1.0
1.5
2.0
2.5
3.0
3.5
4.0
0 2 4 6 8 10 12
Bo
nd
Str
ess
(MP
a)
Slip (mm)
Steel-Straight Steel-Hooked PP-Crimped
GFRP-Straight CFRP-Straight0
.78
3.3
2
2.1
6
3.1 3
.38
St-Str GFRP PP-Crimp CFRP St-Hook
Peak bond stress
0.6
1 0.9
4 1.2
2
1.6
2.1
St-Str GFRP PP-Crimp CFRP St-Hook
Equivalet bond strength

82
Figure 4-26 Standard deviation of bond strength of single fibre pullout test at different fibre slip
with different fibres
Figure 4-27 Coefficient of Variation of single fibre pullout test at different fibre slip with different
fibres
Due to the higher average value of bond stress in hooked steel fibres, we see a corresponding
decrease in coefficient of variation, due to a larger denominator. Similarly, due to a low value of
average bond stress at large slip of 10mm, the coefficient of variation of is higher for all fibres. The
cause of variation include slight misalignment, variation in ingredients, variation in size of fibre,
variation in curing conditions and human error while casting. While the above reason are valid for
all fibre types, for FRP fibre in particular the variation in fibre quality and fibre size is most
significatnt.
0.0
0.1
0.2
0.3
0.4
0.5
0.6
0.7
Peak 3mm 5mm 10mm
Stan
dar
d d
evia
tio
n (
MP
a)Steel-Straight CFRP GFRP PP-Crimped Steel-Hooked
0%
10%
20%
30%
40%
50%
60%
70%
Peak 3mm 5mm 10mm
Co
effi
cien
t o
f V
aria
tio
n
Steel-Straight CFRP GFRP PP-Crimped Steel-Hooked

83
Flexural test (ASTM C1609)
Three different sets of beam specimen using 3 different kinds of FRP fibres were tested for assessing
the flexural behavior of FRP fibre reinforced concrete. Additionally, unreinforced beams and beams
reinforced with glass fibres were also cast. The composition of the 5 sets of specimen are:
Table 4-7 Composition of FRP fibre reinforced concrete used for flexural tests
Batch 1 Batch 2 Batch 3 Batch 4 Batch 5
Name UR GFRP-0.5% GFRP-1% CFRP-1% Glass Fibre 1%
Fibre type Unreinforced Bi-directional
GFRP
Uni-directional
GFRP
Uni-directional
CFRP AR Glass fibre
Volume
fraction 0% 0.5% 1% 1% 1%
Figure 4-28 Average load-deflection curves of flexural response of FRP fibre reinforced concrete
0
2
4
6
8
10
12
14
16
18
0 0.25 0.5 0.75 1 1.25 1.5 1.75 2
Load
(kN
)
Deflection (mm)
UR GFRP 0.5%
CFRP 1% GFRP 1%
Glass fibre 1%

84
Table 4-8 Summary of parameters of flexural response of FRP fibre reinforced concrete
Pmax fmax P600 f600 P150 f150 T150 RT,150
kN MPa kN MPa kN MPa N-mm %
UR 12.923 3.877 0.542 0.163 0.050 0.015 1389 5%
GFRP 0.5% 16.930 5.079 0.645 0.194 0.094 0.028 1909 6%
GFRP 1% 14.084 4.225 1.615 0.484 0.733 0.220 3975 14%
CFRP 1% 14.320 4.296 3.369 1.011 1.646 0.494 6879 24%
Glass fibre 1% 16.120 4.835 8.054 2.416 3.973 1.192 13355 41%
Where Pmax = Maximum load
fmax = Maximum flexural strength
P600 = Residual load at deflection of L/600
f600 = Residual strength at deflection of L/600
P150 = Residual load at deflection of L/150
F150 = Residual strength at deflection of L/150
T150 = Area under the load vs. net deflection of curve 0 to L/150.
This area represents the energy absorbed by the specimen during the test.
RT, 150 = Equivalent flexural strength ratio
It can be seen from the Figure 4-28 and Table 4-8, there is an improvement in flexural toughness
in terms of energy absorption in the case of FRP fibre reinforced specimen over unreinforced
specimen. There is an increase of about 200% in flexural toughness by addition of 1% GFRP fibres,
and about 400% in flexural toughness by addition of 1% CFRP fibres. However, one may reason
that the success of FRP fibre reinforcement in increasing the flexural toughness is rather
unsatisfactory, in contrast to the impressive single fibre bond slip response. The flexural response is

85
quite evidently inferior to the glass fibre reinforced concrete at the same volume fractions, and
possibly inferior to some of the synthetic polypropylene and PET fibres, in spite of the bond
strength of FRP fibres being higher than that of synthetic fibres.
The three most decisive factors that distinguish the performance of FRP fibre reinforced concrete
as compared to steel and other synthetic fibre reinforced concrete lie in the intrinsic properties of
fibre.
Due to the random orientation of the fibres in the cross section of the fibres, there are practically
no fibres that are aligned perfectly in the directional perpendicular to the crack. In other words,
almost all of the fibres are inclined at an angle to the crack surface.
The Figure 4-29 below is a sketch of the pullout process when the fibre is at an angle to the crack
surface and the direction of loading. This inclination of the fibre causes a very high amount of
snubbing friction at the point A where the fibre meets the crack surface. In the plane A-B, due to
the bending in the fibre and angular loading, large bending and shear stress are developed. This
snubbing friction and bending action damages the fibre. The effect of inclination of FRP fibres are
further discussed in the Section 5.2.3.
Figure 4-29 Inclined fibres at crack section
The two key elements that come into play are ductility and flexibility. Every part of the fibre
embedded inside the cement matrix is required to pass through the set path undergoing bending.
Steel and other thermoplastic polymer fibres such as polypropylene, polyester, nylon etc. are both
ductile and flexible, which allows for the fibre to deform and slip out. As a result of the ductile
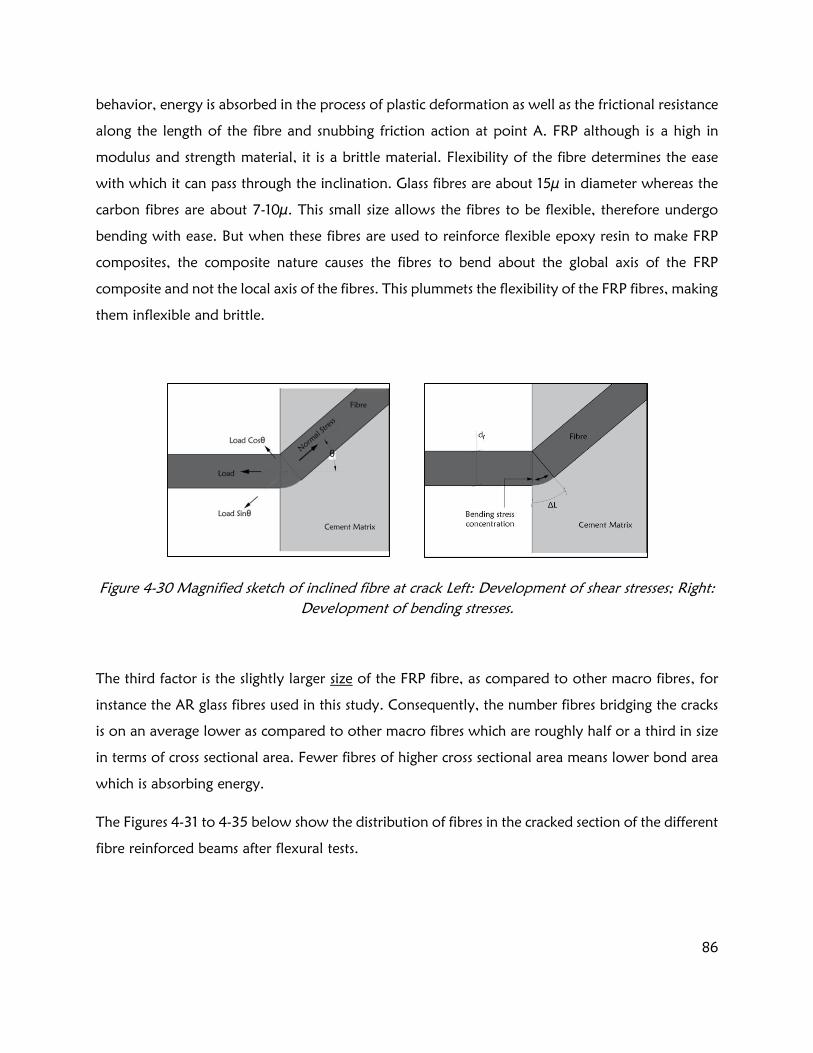
86
behavior, energy is absorbed in the process of plastic deformation as well as the frictional resistance
along the length of the fibre and snubbing friction action at point A. FRP although is a high in
modulus and strength material, it is a brittle material. Flexibility of the fibre determines the ease
with which it can pass through the inclination. Glass fibres are about 15µ in diameter whereas the
carbon fibres are about 7-10µ. This small size allows the fibres to be flexible, therefore undergo
bending with ease. But when these fibres are used to reinforce flexible epoxy resin to make FRP
composites, the composite nature causes the fibres to bend about the global axis of the FRP
composite and not the local axis of the fibres. This plummets the flexibility of the FRP fibres, making
them inflexible and brittle.
Figure 4-30 Magnified sketch of inclined fibre at crack Left: Development of shear stresses; Right:
Development of bending stresses.
The third factor is the slightly larger size of the FRP fibre, as compared to other macro fibres, for
instance the AR glass fibres used in this study. Consequently, the number fibres bridging the cracks
is on an average lower as compared to other macro fibres which are roughly half or a third in size
in terms of cross sectional area. Fewer fibres of higher cross sectional area means lower bond area
which is absorbing energy.
The Figures 4-31 to 4-35 below show the distribution of fibres in the cracked section of the different
fibre reinforced beams after flexural tests.

87
Figure 4-31 Fibre distribution in GFRP fibre 0.5% reinforced beam specimen
Figure 4-32 Fibre distribution in GFRP fibre 1% reinforced beam specimen
Figure 4-33 Fibre distribution in CFRP fibre 1% reinforced beam specimen

88
Figure 4-34 Fibre distribution in Glass fibre 1% reinforced beam specimen
Figure 4-35 Fibre distribution at cracked section at 1% volume fraction of fibres. Left: Glass fibre,
Right: CFRP fibre
At this point, the effect of size of the fibres can be estimated by bringing in the two parameters
fibre count (FC) and fibre specific surface (FSS). The fibre count is the number of fibres per unit
volume of FRC at particular volume fraction. The fibre specific surface is the surface area of the
fibres present in a unit volume of FRC at a particular volume fraction. The fibre count can be
estimated using the nomograph shown in Figure 4-36 below [44]:
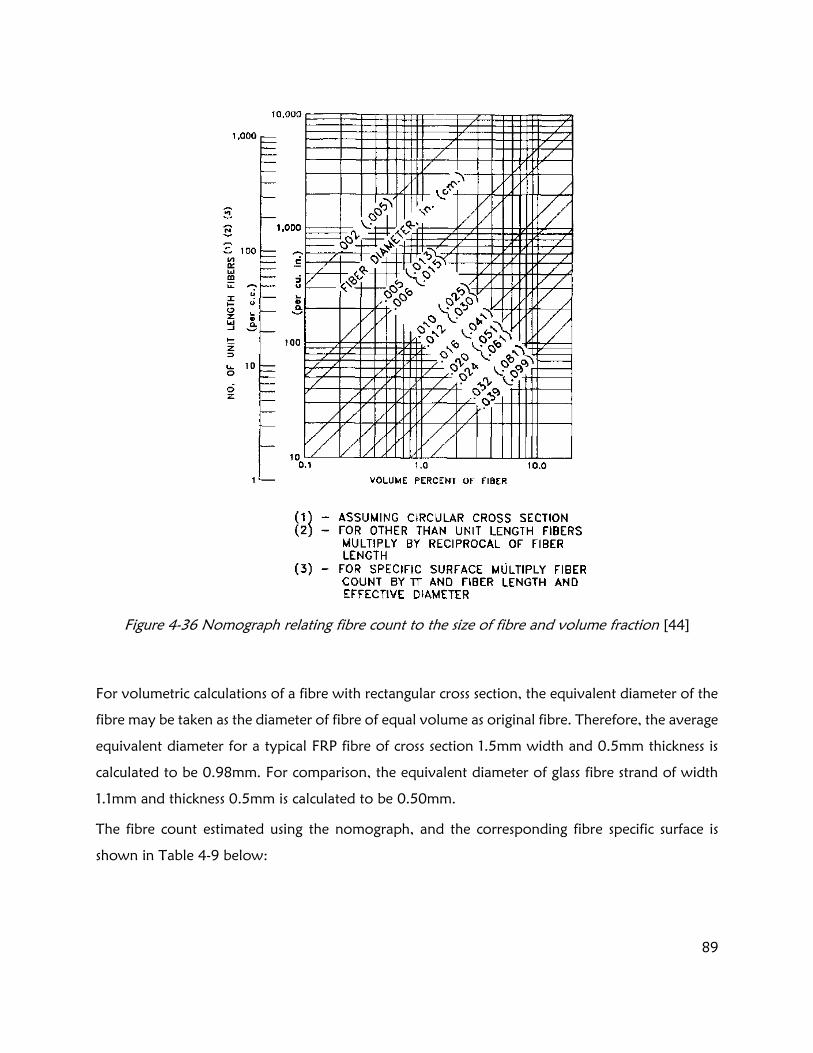
89
Figure 4-36 Nomograph relating fibre count to the size of fibre and volume fraction [44]
For volumetric calculations of a fibre with rectangular cross section, the equivalent diameter of the
fibre may be taken as the diameter of fibre of equal volume as original fibre. Therefore, the average
equivalent diameter for a typical FRP fibre of cross section 1.5mm width and 0.5mm thickness is
calculated to be 0.98mm. For comparison, the equivalent diameter of glass fibre strand of width
1.1mm and thickness 0.5mm is calculated to be 0.50mm.
The fibre count estimated using the nomograph, and the corresponding fibre specific surface is
shown in Table 4-9 below:
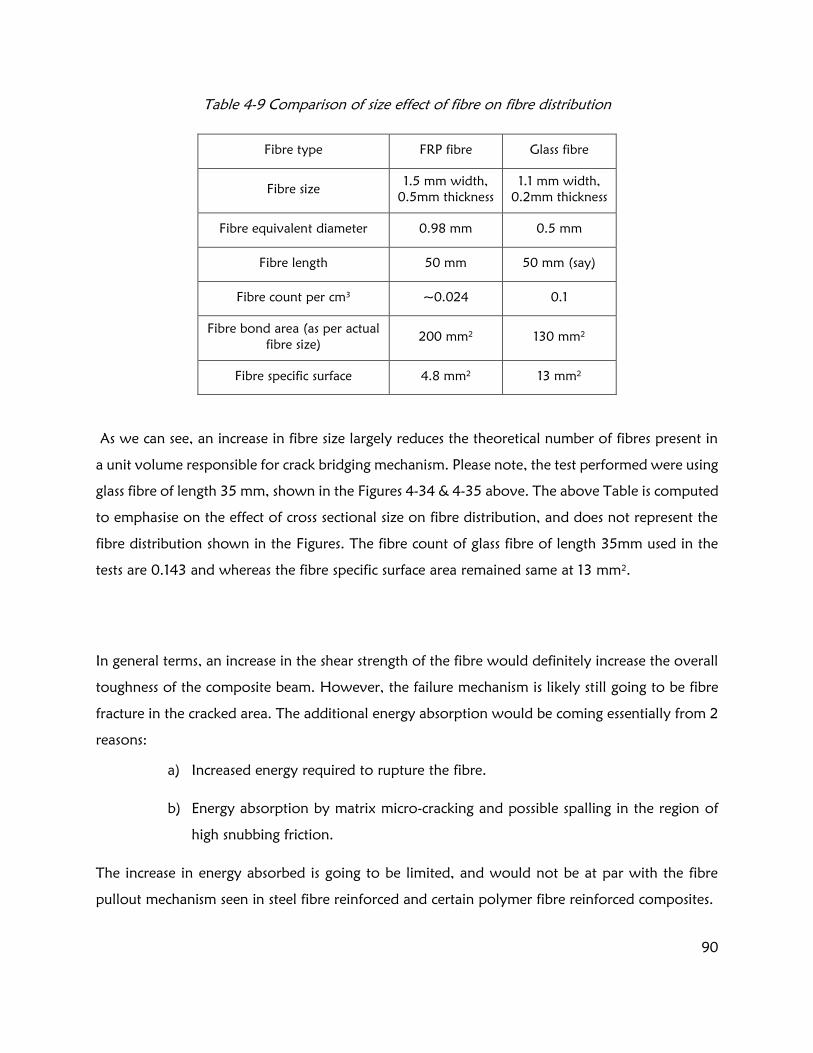
90
Table 4-9 Comparison of size effect of fibre on fibre distribution
Fibre type FRP fibre Glass fibre
Fibre size 1.5 mm width,
0.5mm thickness
1.1 mm width,
0.2mm thickness
Fibre equivalent diameter 0.98 mm 0.5 mm
Fibre length 50 mm 50 mm (say)
Fibre count per cm3 ~0.024 0.1
Fibre bond area (as per actual
fibre size) 200 mm
2 130 mm
2
Fibre specific surface 4.8 mm2 13 mm
2
As we can see, an increase in fibre size largely reduces the theoretical number of fibres present in
a unit volume responsible for crack bridging mechanism. Please note, the test performed were using
glass fibre of length 35 mm, shown in the Figures 4-34 & 4-35 above. The above Table is computed
to emphasise on the effect of cross sectional size on fibre distribution, and does not represent the
fibre distribution shown in the Figures. The fibre count of glass fibre of length 35mm used in the
tests are 0.143 and whereas the fibre specific surface area remained same at 13 mm2.
In general terms, an increase in the shear strength of the fibre would definitely increase the overall
toughness of the composite beam. However, the failure mechanism is likely still going to be fibre
fracture in the cracked area. The additional energy absorption would be coming essentially from 2
reasons:
a) Increased energy required to rupture the fibre.
b) Energy absorption by matrix micro-cracking and possible spalling in the region of
high snubbing friction.
The increase in energy absorbed is going to be limited, and would not be at par with the fibre
pullout mechanism seen in steel fibre reinforced and certain polymer fibre reinforced composites.
91
Chapter 5: Study of some factors affecting fibre-matrix
interfacial behaviour.
5.1 Methods and experimental setup
5.1.1 Effect of matrix maturity
Regular dogbone specimen, as described in Section 4.2.1.4 were prepared. While all the other tests
are done after curing the specimen for 7 days at 23 C at 95% relative humidity, additional tests
were conducted at 1, 3, & 28 days.
The strength gain of the matrix was also studied for the period in the form of split tensile strength,
and compressive strength of cylinders of size 75mm diameter and 150mm height.
5.1.2 Effect of temperature
To investigate the effect of temperature on fibre-matrix bond behaviour, regular dogbone
specimen, as described in Section 4.2.1.4 were cast and cured for 7 days. After 7 day curing, the
specimen were transferred to oven (or freezer) for 7 days. Keeping the specimen in the oven (or
freezer) for 7 days gives ample time for the temperature to take significant effect on the matrix,
the fibre, and the fibre-matrix interface. Each specimen was removed from the oven, just before
the tests, which were conducted at room temperature. Each dogbone pullout test takes about 12-
15 minutes. It is assumed that the change in temperature at the fibre-matrix interface is negligible
during the time of the test. The temperatures used in this study are -20˚, 20˚ (room temperature),
50˚, 80˚, 100˚, and 130˚ Celsius.
Additionally, fibre samples were kept in the oven at 80˚ and 130˚ Celsius, and observed under an
optical microscope and SEM to investigate any changes in epoxy on the surface of the fibres.

92
5.1.3 Effect of fibre inclination
In a fibre reinforced concrete specimen, the fibres are randomly oriented. The chances of the fibre
being aligned normal to the crack surface are close to none. Most of the fibres are embedded at an
inclination to the crack surface, the pullout mechanism of which is considerably different from a
straight fibre pullout. This has been discussed earlier in detail while discussing the mechanism of
failure in the fibre reinforced concrete beam in the Section 4.2.2.5. Tests were therefore done to
investigate the behaviour fibres pullout at different angles to the crack surface.
Dogbone specimen similar to those used in the other tests were cast, except the fibres were
inclined to the loading direction, instead of being aligned. The casting and testing of the regular
dogbone specimen (with fibres aligned in the direction of loading, normal to the crack surface)
have been discussed in detail in the Section 4.2.1.4.
Figure 5-1 Casting of inclined fibre pullout dogbone specimen
In this case however, a polystyrene foam part (packing peanut) was used to hold the fibre at the
required inclination, as shown in Figure 5-1 (b). Mortar was then carefully poured into one half of
(a)
(b)
(c)
(d)
(e)

93
the dogbone piece, up to about half the height and vibrated to ensure the position of the fibre is
as desired. Mortar was then poured to fill up one half of the dogbone, vibrated, and allowed to
set overnight, as shown in Figure 5-1 (c). Next day, the polystyrene foam parts used to hold on to
the fibres were removed, and the mortar was placed in 2 layers, as placed with the other half of
the dogbone to ensure similar level of compaction. Figure 5-1 (d) & (e) show a closer look at the
dogbone specimen cast on one side; the inclination as we can see, is maintained well.
The specimen were cured and tested at 7 days, in the same manner as regular dogbone specimen
are tested, as described in the Section 4.2.1.4.
5.1.4 Effect of loading rate
To investigate the effect of loading rate, 3 quasi static tests and 2 dynamic tests were conducted.
The quasi static tests were conducted at 0.008 mm/sec (slow quasi-static), 0.04 mm/sec (regular
quasi-static) and 0.08 mm/sec (fast quasi static). These tests were performed on the same
horizontally mounted machine, as described in the Section 4.2.1.4, the speed of the loading head
being controlled by the motor.
Dynamic fibre pullout tests were conducted on vertically mounted machine which uses air pressure
in a pressurised chamber to generate a dynamic force. The speed of the test depends on the pressure
inside the chamber and to some extent on the feedback experienced from the pullout process.
Dogbone shaped grips, similar to the horizontally mounted machine were used to grip the
specimen in the dynamic setup as well. A high precision laser displacement meter was mounted on
the grips to obtain the fibre slip. The pressure inside the chamber was set between 2 and 20 bar
(200 kPa to 2000 kPa), to obtain the two dynamic loading rates. The displacement rates were
maintained at ~750-800 mm/sec and ~2200-2400 mm/sec.
For both quasi static and dynamic tests, regular dogbone specimen as described in Section 4.2.1.4
were used.
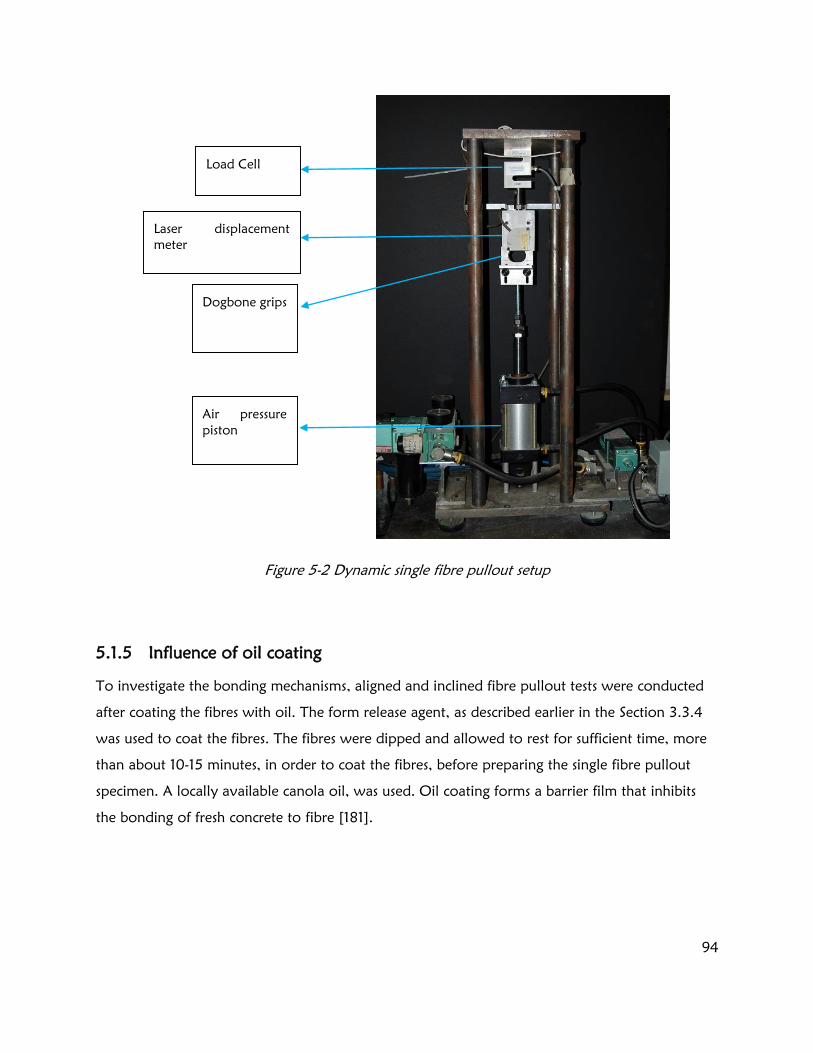
94
Figure 5-2 Dynamic single fibre pullout setup
5.1.5 Influence of oil coating
To investigate the bonding mechanisms, aligned and inclined fibre pullout tests were conducted
after coating the fibres with oil. The form release agent, as described earlier in the Section 3.3.4
was used to coat the fibres. The fibres were dipped and allowed to rest for sufficient time, more
than about 10-15 minutes, in order to coat the fibres, before preparing the single fibre pullout
specimen. A locally available canola oil, was used. Oil coating forms a barrier film that inhibits
the bonding of fresh concrete to fibre [181].
Load Cell
Laser displacement
meter
Dogbone grips
Air pressure
piston

95
Figure 5-3 Oil coating on FRP fibres
Only preliminary tests were done to assess the change in bond-slip performance of FRP fibres,
and hence only one set of fibres, fully saturated (surface coated) were examined. Figure 5-3
below shows the oil coating process. The fibres were fully dipped in the oil, allowed for the
surface to saturate them, and then placed on soft tissue kimwipes, to absorb the excess oil just
before being placed in the dogbone specimen.
5.2 Results and discussion
5.2.1 Effect of matrix maturity
It is well known that the bond between the fibre and the matrix depends on the intrinsic properties
of the matrix itself. A number of tests have been done to study the effect of matrix characteristics
on the bond performance [89,115,182,183]. Tests were conducted at 1, 3, 7 and 28 days; the
average results obtained from 10 specimen are shown in Figures 5-4, 5-5 & 5-6 and Table 5-1
below:
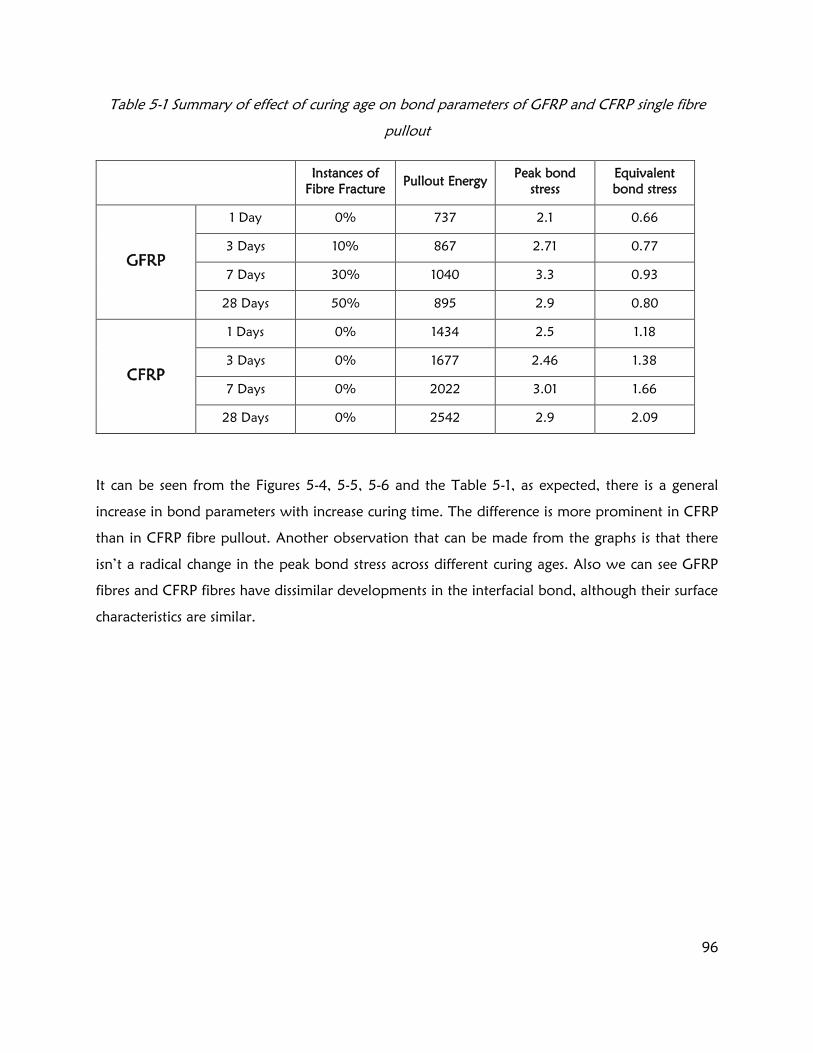
96
Table 5-1 Summary of effect of curing age on bond parameters of GFRP and CFRP single fibre
pullout
Instances of
Fibre Fracture Pullout Energy
Peak bond
stress
Equivalent
bond stress
GFRP
1 Day 0% 737 2.1 0.66
3 Days 10% 867 2.71 0.77
7 Days 30% 1040 3.3 0.93
28 Days 50% 895 2.9 0.80
CFRP
1 Days 0% 1434 2.5 1.18
3 Days 0% 1677 2.46 1.38
7 Days 0% 2022 3.01 1.66
28 Days 0% 2542 2.9 2.09
It can be seen from the Figures 5-4, 5-5, 5-6 and the Table 5-1, as expected, there is a general
increase in bond parameters with increase curing time. The difference is more prominent in CFRP
than in CFRP fibre pullout. Another observation that can be made from the graphs is that there
isn’t a radical change in the peak bond stress across different curing ages. Also we can see GFRP
fibres and CFRP fibres have dissimilar developments in the interfacial bond, although their surface
characteristics are similar.

97
Figure 5-4 Average bond stress-slip graphs of GFRP fibres pullout at different curing ages
Figure 5-5 Average bond stress-slip graph of CFRP fibre pullout at different curing ages
In the case of GFRP fibres, we can see from the graphs, there isn’t a much difference in the
performance of specimen on next day of casting compared to mature specimen. We know from
earlier tests, GFRP fibres are stressed to their maximum. This is evident from the fact that about
30% of GFRP single fibre pullouts after 7 days of curing show fibre fracture.
0.0
0.5
1.0
1.5
2.0
2.5
3.0
3.5
0 2 4 6 8 10 12
Bo
nd
Str
ess
(MP
a)
Slip (mm)
GFRP-1D GFRP-3D
GFRP-7D GFRP-28D
0.0
0.5
1.0
1.5
2.0
2.5
3.0
3.5
0 2 4 6 8 10 12
Bo
nd
Str
ess
(Mp
a)
Slip (mm)
CFRP-1D CFRP-3D
CFRP-7D CFRP-28D
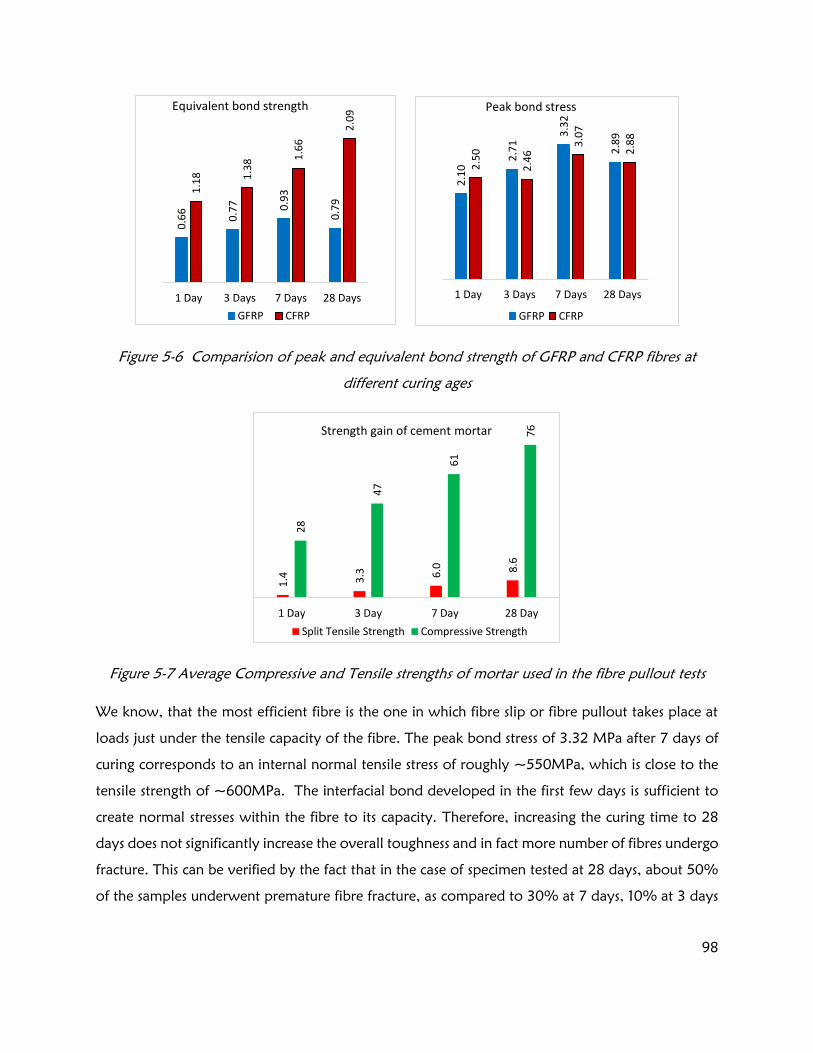
98
Figure 5-6 Comparision of peak and equivalent bond strength of GFRP and CFRP fibres at
different curing ages
Figure 5-7 Average Compressive and Tensile strengths of mortar used in the fibre pullout tests
We know, that the most efficient fibre is the one in which fibre slip or fibre pullout takes place at
loads just under the tensile capacity of the fibre. The peak bond stress of 3.32 MPa after 7 days of
curing corresponds to an internal normal tensile stress of roughly ~550MPa, which is close to the
tensile strength of ~600MPa. The interfacial bond developed in the first few days is sufficient to
create normal stresses within the fibre to its capacity. Therefore, increasing the curing time to 28
days does not significantly increase the overall toughness and in fact more number of fibres undergo
fracture. This can be verified by the fact that in the case of specimen tested at 28 days, about 50%
of the samples underwent premature fibre fracture, as compared to 30% at 7 days, 10% at 3 days
1.4 3.3 6.0 8.6
28
47
61
76
1 Day 3 Day 7 Day 28 Day
Strength gain of cement mortar
Split Tensile Strength Compressive Strength
0.6
6
0.7
7 0.9
3
0.7
9
1.1
8 1.3
8 1.6
6
2.0
9
1 Day 3 Days 7 Days 28 Days
Equivalent bond strength
GFRP CFRP
2.1
0
2.7
1
3.3
2
2.8
9
2.5
0
2.4
6
3.0
7
2.8
8
1 Day 3 Days 7 Days 28 Days
Peak bond stress
GFRP CFRP

99
and none of the specimen underwent premature fibre fracture at 1 day. The development of fibre-
matrix bond in this case is therefore limited by the strength of the fibre.
With CFRP fibres on the other hand, even after 28 days of curing, samples do not show any fibre
fractures, thereby illustrating that an increase in intrinsic properties of the matrix improves the bond
between the fibre and matrix, and increases the pullout energy. Contrary to the GFRP fibres, CFRP
fibres show a steady improvement in equivalent bond strength and pullout energy, with curing
age. In the case of CFRP fibres, the fibres in all scenarios do not exceed two thirds of the tensile
capacity. The overall bond performance in this case is not limited by the strength of the fibre, but
by the fibre-matrix interface. An improvement in the fibre-matrix interface would therefore
improve the overall bond performance of the composite.
In general, the performance of the fibre does increase with an increase in curing time for the first
few days, which has been seen earlier in the case of surface deformed polymeric fibres reported by
Singh et al. [89]. After the first few days, the development of strength is dependent on the
properties of fibre. There isn’t a major change in the peak bond stress, indicating there isn’t any
major improvement in the interface. The superior performance comes essentially from the post
peak region, due to the strengthening of the microstructure in close surrounding of fibre.
5.2.2 Effect of temperature
To study the effects of environmental conditions on the fibre-matrix bond, a series of tests were
conducted. Many tests have been conducted by various researchers to assess the effect of
temperature on fibre-matrix bond [89,116]. The summary of our test results (average of 10
specimen) are shown in Table 5-2 and Figures 5-8, 5-9, & 5-10 below.
At -20°C (-4˚ F), the overall performance of cementitious-composites is improved, largely due to
the freezing of the capillary and gel pores [184] [185]. Better bond between concrete and steel
reinforcement has also been reported in [186]. A similarly superior response can be seen from
Figure 5-8, 5-9, & 5-10, and Table 5-2 indicating a considerable increase in bond strength and
energy absorption. A greater failure resistance can be expected by the strengthening of the interface
due to the freezing of capillary water near the ITZ. Due to freezing of pore water, microstructure
in the close vicinity of the fibre is strengthened due to reduced porosity, resulting in a greatly
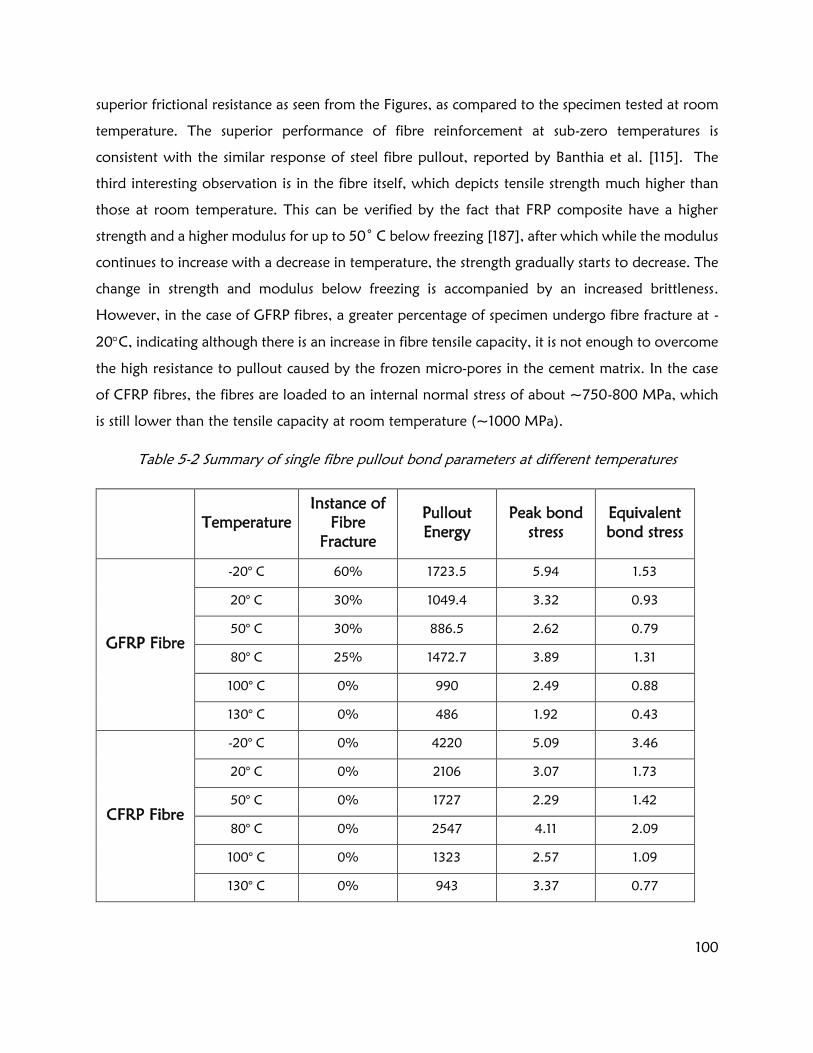
100
superior frictional resistance as seen from the Figures, as compared to the specimen tested at room
temperature. The superior performance of fibre reinforcement at sub-zero temperatures is
consistent with the similar response of steel fibre pullout, reported by Banthia et al. [115]. The
third interesting observation is in the fibre itself, which depicts tensile strength much higher than
those at room temperature. This can be verified by the fact that FRP composite have a higher
strength and a higher modulus for up to 50˚ C below freezing [187], after which while the modulus
continues to increase with a decrease in temperature, the strength gradually starts to decrease. The
change in strength and modulus below freezing is accompanied by an increased brittleness.
However, in the case of GFRP fibres, a greater percentage of specimen undergo fibre fracture at -
20C, indicating although there is an increase in fibre tensile capacity, it is not enough to overcome
the high resistance to pullout caused by the frozen micro-pores in the cement matrix. In the case
of CFRP fibres, the fibres are loaded to an internal normal stress of about ~750-800 MPa, which
is still lower than the tensile capacity at room temperature (~1000 MPa).
Table 5-2 Summary of single fibre pullout bond parameters at different temperatures
Temperature
Instance of
Fibre
Fracture
Pullout
Energy
Peak bond
stress
Equivalent
bond stress
GFRP Fibre
-20° C 60% 1723.5 5.94 1.53
20° C 30% 1049.4 3.32 0.93
50° C 30% 886.5 2.62 0.79
80° C 25% 1472.7 3.89 1.31
100° C 0% 990 2.49 0.88
130° C 0% 486 1.92 0.43
CFRP Fibre
-20° C 0% 4220 5.09 3.46
20° C 0% 2106 3.07 1.73
50° C 0% 1727 2.29 1.42
80° C 0% 2547 4.11 2.09
100° C 0% 1323 2.57 1.09
130° C 0% 943 3.37 0.77

101
Figure 5-8 Average bond stress-slip graphs of GFRP fibre pullout at different temperatures
Figure 5-9 Average bond stress-slip graphs of CFRP fibre pullout at different temperatures
0.0
1.0
2.0
3.0
4.0
5.0
6.0
0 2 4 6 8 10 12
Bo
nd
str
ess
(MP
a)
Slip (mm)
GFRP -20°C GFRP 20°C GFRP 50°C
GFRP 100°C GFRP 80°C GFRP 130°C
0.0
1.0
2.0
3.0
4.0
5.0
6.0
0 2 4 6 8 10 12
Bo
nd
str
ess
(MP
a)
Slip (mm)
CFRP -20°C CFRP 20°C CFRP 50°C
CFRP 80°C CFRP 100°C CFRP 130°C

102
Figure 5-10 Comparison of peak and equivalent bond strength of GFRP and CFRP fibres at
different temperatures
At elevated temperatures on the other hand, the extent of the effect of temperature is considerably
less as compared to the low temperatures mentioned earlier. While at high temperatures, there is
a reduction in the mechanical properties of concrete itself, there is also a considerable degradation
to the fibre. The glass transition temperature of epoxy used for making the FRP fibres is 90 C.
From the Figures and Table above, we can see that there are practically no differences in bond
responses at 50 C and at room temperatures which was around 20 C. As we increase the
temperature further to 80 C, very close to the glass transition temperature of epoxy, we see an
improvement in bond performance in both the case of GFRP fibres as well as CFRP fibres. This may
be because of thermal expansion of the fibre, allowing for a better adhesion with the matrix.
Another reason could simply be the accelerated hydration reaction at the elevated temperature.
The beneficial effect starts to diminish as we increase the temperature further. At 130 C, there is a
distinct decline of bond performance. This can be explained by the deterioration of the fibre at
such high temperatures, which can be observed in the Figures5-11 & 5-12. The chemical breakdown
in concrete at 130˚ C and loss of bound water in the matrix, near the ITZ in particular, could also
add to the reduced performance of the fibre-matrix bond.
5.9
4
3.3
2
2.6
2
3.8
7
2.4
9
1.9
2
5.0
9
3.0
7
2.2
9
4.1
1
2.5
7
3.3
7
-20° C 20° C 50° C 80° C 100° C 130° C
Peak bond stress
GFRP CFRP
1.5
3
0.9
3
0.7
9
1.3
1
0.8
8
0.4
3
3.4
6
1.7
3
1.4
2
2.0
9
1.0
9
0.7
7
-20° C 20° C 50° C 80° C 100° C 130° C
Equivalent bond strength
GFRP CFRP

103
Figure 5-11 FRP fibres after 7 days at 80 C Left: CFRP fibre, Right: GFRP fibre
Figure 5-12 FRP fibres after 7 days at 130 C Left: CFRP fibre, Right: GFRP fibre
Further, to understand the effect of temperature on fibres, the fibres were observed under a
microscope after subjecting to an elevated temperature of 80C and 130C in the oven for 7 days.
The SEM images of FRP fibres kept in the oven at 80C for 7 day clearly show in Figure 5-11, micro-
cracking on the surface. Note that this is only a surface crack in the matrix, and there isn’t any
separation of reinforcing fibres. This is different from the cracking seen after damage, as seen in
Figure 4-14 in Section 4.2.2.2. The micro-cracks in the FRP fibres kept at 130C in the oven, as seen
in Figure 5-12 are considerably wider. The widest crack observed was 34 microns wide, observed
on CFRP fibre after 130C heat.

104
Another vital point to note is that the FRP fibres kept at 130C appear flatter, and the depth of
roughness is much reduced. This is consistent with the glass transition temperature of epoxy used,
which was about 90C. once the glass transition temperature is crossed, the epoxy starts to behave
like a gel, and gets moulded into a flatter shape. This flatness of the fibre further explains the drop
in bond strength as discussed earlier.
It was also observed that while the fibres in the specimen subjected to a temperature of 130˚ C
had turned black, become very soft and flimsy, the specimen subjected to -20˚ C had become stiff
and brittle. Another observation that can be made is that cracks propagate mostly at the free edges
at the ends of the fibre samples. We know, there is a large difference in coefficient of thermal
expansion (CTE) of epoxy and the reinforcing fibres. While epoxy expands at about 45-65 micro-
strains/C, Glass fibre expands at about 1.5-3 (S Glass) and ~5 micro-strains/C. Carbon fibre has
near zero CTE, ranging around -0.6 micro-strains/C. Therefore, the cracks are observed only in
the direction parallel to the fibre reinforcement, as a result of restraining action of the reinforcing
fibres in direction perpendicular to the reinforcements [188].
5.2.3 Effect of fibre inclination
We know that fibre orientations in fibre reinforced cementitious composites are 3-D random in
nature. Therefore, the likelihood of fibres being aligned normal to the crack opening is rather low.
The aligned fibre pullout is perhaps not the best representative of the crack bridging mechanism in
the full scale structures. This has encouraged several researchers to study the behaviour of inclined
fibre pullout from cement matrix [120–122]. The studies on effect of fibre inclination has been used
by various researchers to predict the flexural behaviour of the fibre reinforced cementitious
composites [123–125]. The inclination of the fibre has briefly been discussed earlier in the Section
4.2.2.5 as well. To validate the theory of fibre fracture discussed in the Section 4.2.2.5, inclined
fibre pullout tests were conducted.
The pullout behaviour of inclined fibre depends not only on the fibre-matrix interface, but also on
the elastic properties of the fibre. The two key elements being flexibility and ductility. Fibre
reinforced polymers are very well known to be brittle materials. While the reinforcing fibres, be it
glass fibre or carbon fibre, are very flexible due to their small diameter (7-15 µm). However, when

105
the composite is subjected to bending, the reinforcing fibres are bent about the global axis of the
composite as shown in Figure 5-13. This turns the flexible fibres and flexible epoxy resin to act as
an essentially rigid composite part. The Reinforcing Fibres 1 and 2 as shown in the figure are bent
about the global axis of bending, which is the centre line of the FRP composite. This causes the
reinforcing fibres to experience very large elastic strains, and lead to local failures as shown in the
Figure 5-13.
Figure 5-13 Sketch of reinforcing fibres inside a bent FRP fibre
The flexibility of the fibre can be associated as a function of its elastic modulus (E), and moment of
inertia (or second moment of area) (I).
𝑩𝒆𝒏𝒅𝒊𝒏𝒈 𝑹𝒊𝒈𝒊𝒅𝒊𝒕𝒚 ∝ 𝑬 ∗ 𝑰 Equation 5-1
Having a flexible (low bending rigidity) fibre, the fibre would be able to slip out of the cementitious
matrix at varying angles undergoing elastic deformation, as in the case of glass and carbon micro-
fibres.
The other way for fibre pullout would be for the fibre to be ductile, in which case, the fibre would
slip out of the cementitious matrix at varying angles undergoing plastic deformation, as in the case
of most polymeric and steel fibres.
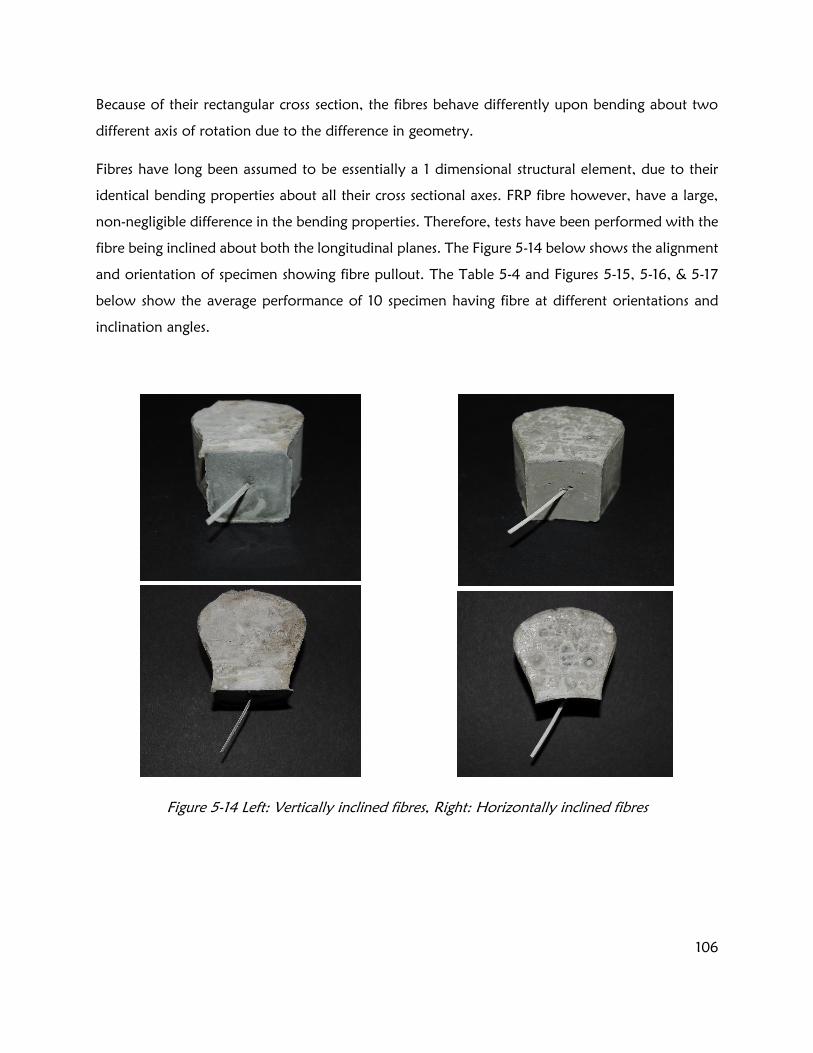
106
Because of their rectangular cross section, the fibres behave differently upon bending about two
different axis of rotation due to the difference in geometry.
Fibres have long been assumed to be essentially a 1 dimensional structural element, due to their
identical bending properties about all their cross sectional axes. FRP fibre however, have a large,
non-negligible difference in the bending properties. Therefore, tests have been performed with the
fibre being inclined about both the longitudinal planes. The Figure 5-14 below shows the alignment
and orientation of specimen showing fibre pullout. The Table 5-4 and Figures 5-15, 5-16, & 5-17
below show the average performance of 10 specimen having fibre at different orientations and
inclination angles.
Figure 5-14 Left: Vertically inclined fibres, Right: Horizontally inclined fibres

107
Table 5-3 Summary of inclination angles
Aligned Low Inclination Inclined Horizontally Inclined Vertically
0 20-25 40-45 about the width
of fibre
40-45 about the
thickness of fibre
Table 5-4 Summary of Single fibre inclined pullout
Instances of
Fibre
Fracture
Pullout
Energy
Peak bond
stress
Equivalent
bond stress
GFRP
fibre
Aligned 30% 1050 3.32 0.93
Low Inclination
20-25 30% 1053 3.19 0.94
Inclined Horizontally
40-45 90% 675 3.32 0.60
Inclined Vertically
40-45 100% 594 3.29 0.53
CFRP
fibre
Aligned 0% 2106 3.30 1.73
Low Inclination
20-25 0% 2401 4.17 1.97
Inclined Horizontally
40-45 100% 1219 3.77 1.00
Inclined Vertically
40-45 100% 999 3.93 0.82

108
Figure 5-15 Average bond stress-slip graphs of GFRP single fibre pullout at different angles of
inclination
Figure 5-16 Average bond stress-slip graphs of CFRP single fibre pullout at different angles of
inclination
0.0
0.5
1.0
1.5
2.0
2.5
3.0
3.5
0 2 4 6 8 10 12
Bo
nd
Str
ess
(MP
a)
Slip (mm)
Aligned-GFRP Inc.-Hor.-GFRP
Inc.-Ver.-GFRP Low Inclination
0.0
0.5
1.0
1.5
2.0
2.5
3.0
3.5
4.0
0 2 4 6 8 10 12
Bo
nd
Str
ess
(MP
a)
Slip (mm)
Aligned-GFRP Inc.-Hor.-CFRP
Inc.-Ver.-GFRP Low Inclination

109
Figure 5-17 Comparison of peak and equivalent bond stress of FRP fibres at different inclinations
We can see from the graphs, at low inclinations, the effect of inclination is minimal, and the fibres
pullout the same manner as an aligned fibre would pullout. When the inclination is increased to
about 45, a change in failure mechanism can be seen. The fibres are undergoing premature fibre
fracture. This is different from fibre fracture that we have observed in aligned fibre pullout specimen
of bi-directional (woven) glass and carbon FRP fibres, which have a lower tensile strength, as
discussed in Section 4.2.2.4. In the earlier case, the fibres would fracture in the early stage, when
the fibre is held in the matrix by the elastic bond. However, in the unidirectional glass and carbon
FRP fibres used throughout the project, when subjected to fibre pullout at an inclination, the fibre
fracture is often after it has crossed the elastic limit. In other words, the fibre fractures in most cases,
after initiating pullout. This is accompanied by matrix spalling in the region C, as shown in the
Figure 5-18 below.
The matrix spalling is a result of a high snubbing friction at the point at which the fibre enters the
matrix. Due to the angle of loading, and confinement of the cementitious matrix, the plane AB on
the fibre, as sown in Figure above is subjected to large bending and shear stresses.
3.3
2
3.1
9
3.3
2
3.2
9
3.3
0
4.1
7
3.7
7
3.9
3
Aligned LowInclination
InclinedHorizontally
InclinedVertically
Peak bond stress
GFRP CFRP
0.9
3
0.9
4
0.6
0
0.5
3
1.7
3 1.9
7
1.0
0
0.8
2
Aligned LowInclination
InclinedHorizontally
InclinedVertically
Equivalent bond strength
GFRP CFRP

110
Figure 5-18 Sketch of inclined fibre pullout
In the case of horizontally inclined fibres, in which the inclination is about the thickness of the fibre,
the modulus of rigidity is much higher, as both, the elastic modulus and the moment of inertia are
high. This fibre due to its elastic properties, is therefore expected to offer the maximum resistance
to inclined fibre pullout. The vertically inclined fibres, in which the fibres are inclined about their
thickness, have a lower bending stiffness, and thus are more flexible. While it is expected the fibres
will slip out with lesser effort, the rough surface characteristics come into play. As a result of the
rough texture, there is a high resistance to pullout, which can be seen from the results obtained.
While low inclination of 20-25 has no effect on pullout, irrespective of the orientation, when the
inclination is increased to about 40-45, almost all the specimen, GFRP, CFRP, horizontally
inclined, vertically inclined, all undergo a brittle fibre fracture, thus reducing the average energy
absorbed, and equivalent bond strength.
5.2.4 Effect of loading rate
The enhanced load bearing response of concrete under high strain rates is well known to us. The
increase in compressive strength, modulus of elasticity, and flexural strength are some of the key
areas in consideration during seismic design of structures [189,190]. A number of studies have been
carried out to assess the behaviour of fibre reinforcement under impact and dynamic loading [191],
including low dynamic loading rates [115], different fibre types under dynamic loading rates
[110,192], and high strength fibres [193]. An improved interfacial bond performance has been
C

111
correlated to the improvements in flexural and tensile responses at higher loading rates. Single fibre
pullout tests have been conducted using the FRP fibres produced in this project to understand the
effect of loading rates on bond behaviour. Apart from an increased rate of loading as in the
dynamic case, a lower quasi static loading rate has also been used. The results have been shown in
Table 5-6 and Figures 5-19, 5-20, & 5-21 below.
Table 5-5 Rates of loading used in the tests
X 5x 10x 10,000x 30,000x
0.008 mm/s 0.04 mm/s 0.08 mm/s 800 mm/s 2,400 mm/s
Table 5-6 Summary of bond parameters of single FRP fibre pullout at different loading rates
Loading
Rate
Instances of
Fibre
Fracture
Pullout
Energy
Peak Bond
stress
Equivalent
bond
strength
GFRP fibre
x 20% 1031 2.93 0.92
5x 20% 1049 3.32 0.93
10x 30% 1054 2.78 0.94
10,000x 0% 1539 5.42 1.37
30,000x 0% 1175 5.80 1.04
CFRP fibre
x 0% 2725 2.66 2.24
5x 0% 2096 3.07 1.72
10x 0% 1736 3.10 1.42
10,000x 0% 2642 4.39 2.17
30,000x 0% 1219 4.74 1.00

112
Figure 5-19 Average bond stress-slip graphs of GFRP fibre pullout at different rates of loading
Figure 5-20 Average bond stress-slip graphs of CFRP fibre pullout at different rates of loading
The regular rate of loading used for quasi static tests, is represented in this section as speed 10x,
which corresponds to 0.08 mm/second. 2 higher and 2 lower loading rates were used in the tests,
0.0
1.0
2.0
3.0
4.0
5.0
6.0
0 2 4 6 8 10 12
Bo
nd
Str
ess
(MP
a)
Slip (mm)
0.1 0.5 1
10,000 30,000
0.0
1.0
2.0
3.0
4.0
5.0
0 2 4 6 8 10 12
Bo
nd
Str
ess
(MP
a)
Slip (mm)
0.1 0.5 1
10,000 30,000

113
as represented in the Table 5-5 above. Because the dynamic pullout test is performed using a setup
that air in a pressurized chamber to apply a sudden uniaxial load, the rate of loading is dependent
on the feedback from the test specimen experienced by the loading head. Thus, even though the
same pressure was maintained, there was a slight variation in loading rates, of up to about 15%.
Therefore, a much higher number of specimen, around 50 for each fibre type were used to get
reliable data.
Figure 5-21 Comparison of peak bond stress and equivalent bond strength of FRP fibres at
different rates of loading
We can see there is a definite increase in peak bond performance in both, GFRP and CFRP fibres
under dynamic loading conditions. Interestingly, the number of fibres undergoing premature fibre
fracture also were reduced to zero, in spite of the normal stresses in the fibres being in the order
of 900 MPa, considerably higher than the tensile capacity of the GFRP fibres of around 600 MPa
under quasi static conditions. The increased tensile strength of the FRP fibres under dynamic loading
conditions, is consistent with the literature [194–196]. As seen with polymeric and steel fibres
[110,115,122,191–193], a superior interfacial performance is observed in the case of dynamic loading
rates. This is beneficial, as a low crack opening performance is a key factor towards performance
based seismic design of structures, aimed at preventing collapse. While the two dynamic loading
rates demonstrate similar performances at low crack widths, we observe a drop in the total energy
2.9
3
3.3
2
2.7
8
5.4
2
5.8
0
2.6
6
3.0
7
3.1
0
4.3
9
4.7
4
x 5x 10x 10,000x 30,000x
Peak bond stress
GFRP CFRP
0.9
2
0.9
3
0.9
4
1.3
7
1.0
4
2.2
4
1.7
2
1.4
2
2.1
7
1.0
0
x 5x 10x 10,000x 30,000x
Equivalent bond strength
GFRP CFRP

114
absorbed (or equivalent bond strength) very high loading rates, although there are no specimen
undergoing fibre fracture.
At the other end of the spectrum, when the loading rate was lowered, there was a steady increase
in the equivalent bond strength (or total energy absorbed), due to an increased load carrying
capacity at high crack widths in the case of CFRP fibre pullout specimen. No such change was
noticed in GFRP fibre pullout, which showed identical response in all three quasi-static loading
rates.
Overall, GFRP shows considerable change in peak bond stress with change in loading rates, whereas
the equivalent bond strength values are similar. On the other hand, CFRP fibres show smaller, but
steady increase in peak bond strength with increase in loading rate, and have a lower variation in
the equivalent bond strength values.
5.2.5 Influence of oil coating
It is well known that in most common polymer fibre – cementitious composite systems, the
interfacial chemical bond between the fibre and cementitious matrix is low, and ample resources
have been spent to develop numerous techniques to improve the interface. The situation where
fibre fracture has been most famously observed in the case of PVA fibres. The situation of FRP fibres
is quite similar in the sense of failure mechanism, where many fibres are rupturing before pullout is
initiated. Particularly in the case of inclined fibres, fibre rupture is the predominant cause of failure.
The key lies in the optimization of the interface between the fibre and the cementitious matrix.
Several successful attempts have been made to change the mechanism of failure of PVA fibres from
brittle fibre fracture to a tough fibre pullout, improving by far the mechanical properties of the
cementitious composites [86,96,98,197].
The average response obtained from 10 samples for single FRP fibre pullout are shown in Table 5-
7, and Figures 5-22 to Figure 5-26 below.
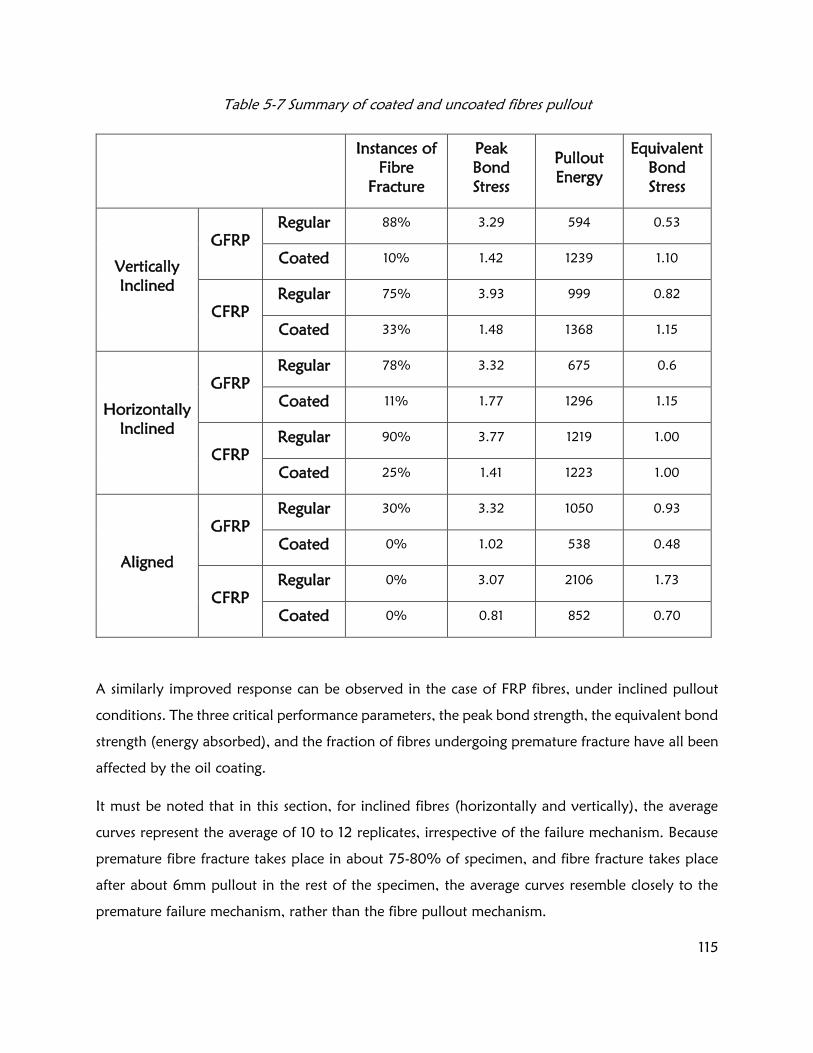
115
Table 5-7 Summary of coated and uncoated fibres pullout
Instances of
Fibre
Fracture
Peak
Bond
Stress
Pullout
Energy
Equivalent
Bond
Stress
Vertically
Inclined
GFRP
Regular 88% 3.29 594 0.53
Coated 10% 1.42 1239 1.10
CFRP
Regular 75% 3.93 999 0.82
Coated 33% 1.48 1368 1.15
Horizontally
Inclined
GFRP
Regular 78% 3.32 675 0.6
Coated 11% 1.77 1296 1.15
CFRP
Regular 90% 3.77 1219 1.00
Coated 25% 1.41 1223 1.00
Aligned
GFRP
Regular 30% 3.32 1050 0.93
Coated 0% 1.02 538 0.48
CFRP
Regular 0% 3.07 2106 1.73
Coated 0% 0.81 852 0.70
A similarly improved response can be observed in the case of FRP fibres, under inclined pullout
conditions. The three critical performance parameters, the peak bond strength, the equivalent bond
strength (energy absorbed), and the fraction of fibres undergoing premature fracture have all been
affected by the oil coating.
It must be noted that in this section, for inclined fibres (horizontally and vertically), the average
curves represent the average of 10 to 12 replicates, irrespective of the failure mechanism. Because
premature fibre fracture takes place in about 75-80% of specimen, and fibre fracture takes place
after about 6mm pullout in the rest of the specimen, the average curves resemble closely to the
premature failure mechanism, rather than the fibre pullout mechanism.

116
Figure 5-22 Average bond stress-slip graphs of coated & uncoated vertically inclined FRP fibres
Figure 5-23 Average bond stress-slip graphs of coated & uncoated horizontally inclined FRP fibres
0.00
0.50
1.00
1.50
2.00
2.50
3.00
3.50
4.00
0 2 4 6 8 10 12 14 16 18 20
Bo
nd
Str
ess
(Mp
a)
Slip (mm)
GFRP GFRP-C
CFRP CFRP-C
0.00
0.50
1.00
1.50
2.00
2.50
3.00
3.50
4.00
0 2 4 6 8 10 12 14 16 18 20
Bo
nd
Str
ess
(Mp
a)
Slip (mm)
GFRP GFRP-C
CFRP CFRP-C

117
Figure 5-24 Average bond stress-slip graphs of coated & uncoated FRP aligned fibre pullout
It can be seen from Figures 5-22 to 5-26, and Table 5-7, that in the case of inclined fibres, the
average equivalent bond strength (and average energy) absorbed by the coated fibres is
considerably higher than the uncoated fibres. This is of particular interest, as in fibre reinforced
cementitious cracked section, where the fibres are randomly oriented, almost all fibres are stressed
at an angle. Both in the case of horizontally inclined, and vertically inclined pullout specimen, the
equivalent bond strength has been increased by almost a factor of 2 in the case of GFRP fibres.
Figure 5-25 Comparison of peak bond stress of coated and uncoated FRP fibre pullout
0.00
0.50
1.00
1.50
2.00
2.50
3.00
3.50
0 2 4 6 8 10 12 14
Bo
nd
str
ess
(Mp
a)
Slip (mm)
GFRP GFRP-C CFRP CFRP-C3
.29
1.4
2
3.9
3
1.4
8
Regular Coated
Peak bond stress, Vertically incliend pullout
GFRP CFRP
3.3
2
1.7
7
3.7
7
1.4
1
Regular Coated
Peak bond stress, Horizontally incliend pullout
GFRP CFRP
3.3
2
1.0
2
3.0
7
0.8
1
Regular Coated
Peak bond stress, Aligned pullout
GFRP CFRP

118
Figure 5-26 Comparison of Equivalent bond strength of coated and uncoated FRP fibres
Almost all the specimen with oil coating resulted in a tougher fibre pullout response, instead of a
brittle (and sudden) fibre fracture, thereby, serving the purpose of fibre reinforcement. The
application of the particular type of oil, the reaction between the hydroxides in the concrete, to
form a barrier film that inhibits the bonding of fresh concrete, should theoretically eliminate the
chemical bond between the fibre and cementitious matrix. Either case, the film reduced the
snubbing friction resisting the pullout of the inclined fibre. The reduction in snubbing friction also
eliminated matrix splitting at the point of entry of the fibre.
The film, in addition to reducing or eliminating the chemical bond between the fibre and matrix,
also reduced the frictional resistance, allowing the fibre to pull out easily. This can be seen more
prominently in the case of aligned fibre pullout, where the peak bond stress, and post peak
behaviour of oil coated fibres is considerable lower than that of uncoated fibres.
The optimal oil content used in the references [86,96,98,197] is in the range of 1.2% to 2% by
weight of the fibres. Another key parameter to consider is the surface area of the fibres, or more
precisely, the surface are to volume ratio, which is often used to assess the surface activity of fibres.
A quick comparison of the geometry of PVA fibres and FRP fibres is carried out in the Table 5-8
below.
0.5
3
1.1
0
0.8
2
1.1
5
Regular Coated
Equivalent bond strength, Vertically inclined pullout
GFRP CFRP
0.6
1.1
5
1.0
0
1.0
0
Regular Coated
Equivalent bond strength, Horizontally inclined pullout
GFRP CFRP
0.9
3
0.4
8
1.7
3
0.7
0
Regular Coated
Equivalent bond strength, Aligned pullout
GFRP CFRP

119
Table 5-8 Comparison of geometry & oil content of PVA fibre and FRP fibre
Fibre type PVA fibre FRP fibre
Lateral dimension 39 micron diameter
1.5 mm wide, 0.5 mm thick
(Equivalent dia: 0.98mm)
Length 12 mm 50 mm
Surface Area 1.48 mm2 200 mm2
Volume 0.01433 mm3 37.5 mm3
Surface area to Volume ratio
(Specific surface) 103 4
Aspect ratio (L/deq) ~300 ~50
Oil Content 1.2% to 2% by weight Surface saturated
The oil content in the coated PVA fibres is considerably less than the single attempt made here to
coat FRP fibres, which further magnifies considering the vast differences in surface area to volume
ratios of the two fibres. The performance of FRP fibres in these tests may be regarded as the worst,
in regards to the excess oil on the surface of the fibres; and these fibres still perform better than the
uncoated fibres at inclined fibre pullout tests.
These tests are a proof of concept to demonstrate the feasibility of oil coating the FRP fibres to
improve mechanism and performance of the fibres, and possibly improve the overall performance
of FRP fibre reinforced cementitious materials.

120
Chapter 6: Performance of fibre under sustained loading &
deteriorating conditions
6.1 Method and experimental setup
6.1.1 Relaxation of FRP fibre
Once deformed beyond matrix cracking, the loads carried by the fibres bridging the matrix relax
with time. We understand the relaxation and creep behaviour of the fibre and the matrix
individually, but in a composite, the relaxation is largely at the interface. To assess the relaxation
of the fibre-matrix interface, a series of tests were conducted at room temperature and at an
elevated temperature of 60˚C.
To investigate the relaxation of the fibre, a dogbone specimen, moist cured for 7-10 days was used.
The tests were done in the horizontally mounted screw driven electric motor powered dogbone
pullout machine, the same one used in earlier single fibre pullout tests. The specimen is subjected
to axial tensile loading, till the load reached about 250 N (~55-60 lbs). This is about 70-80% of
the average peak pullout load. Once this load is reached, the motor was immediately stopped. The
fibre slip was sustained, while the fibre carried a load about 70-80% of its peak load. The specimen
was kept at this stage for about 3 days, giving ample time for the specimen to relax. The motor is
then switched on again, to observe a trend, if any, in the post relaxation performance of the fibre-
matrix bond. With time, the fibre tends to lose the load transferring ability, due to the relaxation
in the fibre, and the fibre-matrix interface. The drop in load carried by the dogbone specimen, at
a sustained slip is recorded, and relaxation graph is plotted.
It may be noted that unavoidably there is also machine relaxation in the process, which is added
on to the fibre-matrix bond relaxation. Therefore the data acquired by the data acquisition system
is a combination of the relaxation of fibre-matrix bond and the relaxation of the machine [198,199].
To isolate the machine relaxation, the test is conducted using a rigid dogbone shaped mortar
specimen at loads identical to the ones used in fibre dogbone specimen. Assuming that the
relaxation of machine and relaxation of fibre-matrix bond are independent of each other, at a

121
given load, the total relaxation measured would be a simple summation of relaxation of fibre-
matrix bond and relaxation of the machine.
Relaxation of deformed polypropylene fibres were also tested as a comparison to the FRP fibres.
6.1.2 Durability studies
For assessing the durability of the FRP samples, a series of tests were performed after subjecting it
to accelerated deterioration. Samples were kept immersed in a solution of high pH of ~12.4 at an
elevated temperature of 50 degrees Celsius. A supersaturated solution of limewater was used as a
high pH solution, maintaining a pH of ~12.4, covered with plastic wrap, to seal any loss in
moisture, kept in the oven at 50˚ Celsius. The fibres were allowed to condition, and were tested
at 7 and 28 days.
Tensile test after subjecting to accelerated deterioration
The specimen used were similar as that discussed in Section 4.2.1.3. Once the samples were tabbed
at the ends and ready for testing, they were immersed in high pH limewater in a tray, sealed off
using plastic wrap and kept in the oven at 50˚ Celsius. The specimen are removed after 7 or 28
days of conditioning, wiped dry and tested.
The Instron machine with vertical arrangement of capacity 250kN, same as one used in Section
4.2.1.3 was used. The test was conducted in accordance to the standard ASTM D3039 with rate of
loading, as discussed earlier, at 2mm/minute.
Single fibre pullout after subjecting to accelerated deterioration
The fibres were subjected to accelerated deterioration by immersion in high pH limewater in a tray
kept sealed in the oven at 50˚ Celsius, as discussed earlier. The fibres were allowed to deteriorate
for 7, and 28 days, after which they were removed from the immersed high pH solution and dried
using paper towels. The fibres were kept in the oven for another 2 hours to ensure they were

122
surface dry, similar to other fibres not subjected to deterioration. This was done so that there is no
excess surface water on the FRP fibre, which could influence the fibre-matrix interaction and
behaviour. In the results section (section 6.2.2), these fibres are referred to as “GFRP 7 Day-Fibre”
meaning GFRP as fibre type, conditioned for 7 days as fibre specimens.
In addition to conditioning the fibres, strips of FRP panels were also subjected to accelerated
deterioration in identical conditions as described. In the results section (Section 6.2.2), these fibres
are referred to as “GFRP-7Day-Panel” meaning GFRP type of fibre, conditioned for 7 days as a
panel sized specimen. After 7 days, the strips were towel dried, and cut to fibre sized specimen.
These tests were conducted to assess the influence of surface deterioration and edge deterioration.
The FRP specimen conditioned as fibres, and FRP specimen conditioned as strips, were also used
for identical single fibre pullout tests. Dogbone specimen similar to the ones discussed in Section
4.2.1.4 were cast and tested after 7 days of moist curing. The same test setup with the same settings
and rate of loading, similar to the rest of the tests, as discussed in Section 4.2.1.4 was used to
conduct the tests.
SEM-EDX image analysis of accelerated deterioration
The SEM-EDX image analysis was done using the same machine as described in Section 4.2.1.2,
using the same settings used for SEM-EDX image analysis for characterization. The setting has
already been described in the same Section 4.2.1.2.
6.2 Results and discussion
6.2.1 Studies of relaxation of FRP fibre
The relaxation behaviour of single FRP fibre reinforced composites at room temperature are shown
below in Figures 6-1 & 6-2. The tests were performed on a strain controlled screw driven machine.
The fibres, PP, GFRP, and CFRP were all strained till the load in the specimen reached to 50 ±5lbs,
at which time strain was kept constant and sustained for the next 3 days. The Figure 6-1 clearly
shows the relaxation of polypropylene fibres, FRP fibres, and the relaxation of the machine.

123
Figure 6-1 Average fibre relaxation curves at room temperature, not corrected for machine
relaxation
Figure 6-2 Average fibre relaxation curves at room temperature, not corrected for machine
relaxation
The machine relaxation was subtracted from the total relaxation to get the net relaxation of the
fibre relaxation specimen, and is shown in Figure 6-2. It can be seen from the Figure 6-2, that the
loss of load carrying capacity is the highest in polypropylene fibres, and least in CFRP fibres. The
0%
10%
20%
30%
40%
50%
60%
70%
80%
90%
100%
0 6 12 18 24 30 36 42 48
Res
idu
al L
oad
(%
)
Time (Hours)
PP GFRP CFRP Machine
0%
10%
20%
30%
40%
50%
60%
70%
80%
90%
100%
0 6 12 18 24 30 36 42 48
Res
idu
al L
oad
(%
)
Time (Hours)
PP GFRP CFRP

124
FRP fibres show hardly any relaxation or loss in transmissibility of load, as compared to the
polypropylene fibres, which lose more than half of their capacity in the first few hours.
Polypropylene fibre, even though crimped, have a smooth surface. First of all, the chemical bond
in polypropylene fibres is rather low, and most resistance to pullout comes from the bearing areas
of the crimped geometry. Secondly, once pullout is initiated, due to the smooth surface of the
fibre, the frictional resistance to pullout is low. Therefore, when the high strains are sustained for
long periods, slippage occurs which enhances relaxation of the fibre. In the case of FRP fibres, the
required interfacial stresses are developed before any fibre pullout has taken place. The micro-
bearing anchorage holds the fibres in place, preventing fibre slippage and minimizing any relaxation
at the interface. If the micro-bearing anchorage completely prevents any relaxation at the fibre-
matrix interface, the relaxation of the setup is likely coming entirely from relaxation of the fibre.
The relatively high tensile modulus of FRP fibres further supports continuous load transmission
extended periods after crack opening.
6.2.2 Durability studies
Tensile test after subjecting to accelerated deterioration
The most fundamental property to be investigated for durability of the fibre is with the test to
assess the loss in tensile strength of the FRP material after accelerated deterioration. The average
response of 10-12 specimen of tensile tests of FRP strips after subjecting to accelerated deterioration
are shown below in Figures 6-3 and 6-4.
Table 6-1 Summary of tensile tests conducted after accelerated deterioration
Average Tensile Strength (MPa)
Regular 7 Day 28 Day
GFRP 578 455 387
CFRP 955 975 1020

125
Figure 6-3 Tensile behaviour of GFRP strips after accelerated deterioration
Figure 6-4 Tensile behaviour of CFRP strips after accelerated deterioration
We can see from the Figures, there is a definite decrease in strength in the case of GFRP fibres after
accelerated deterioration. After 7 days of accelerated deterioration, there is about a 20% drop in
tensile strength, which increases to 33% after 28 days of accelerated deterioration. Glass fibre is
known to be susceptible to moisture, hydroxides, [62,153,200,201] and seawater [202]. The drop
0
100
200
300
400
500
600
0% 1% 2% 3% 4% 5% 6% 7% 8% 9% 10%
Stre
ngt
h (
Mp
a)
Strain (%)
GFRP- Regular
GFRP-7 Dday
GFRP-28D
0
200
400
600
800
1000
1200
0% 2% 4% 6% 8% 10%
Stre
ngt
h (
Mp
a)
Strain (%)
CFRP-Regular
CFRP-7D
CFRP-28D

126
in strength is therefore in GFRP strips is not surprising. CFRP fibres on the other hand, show no
change in tensile properties after deterioration.
The FRP material conditioned to accelerated deterioration at a high pH of 12.4 kept at an elevated
temperature of 50C; conditions which the fibres will likely not experience during their service life.
However, further tests are required to assess long term durability of the fibres.
Single fibre Pullout after subjecting to accelerated deterioration
In the previous section, we have seen the influence of accelerated deterioration on the intrinsic
elastic properties of FRP composites. The interfacial bond behaviour between the FRP fibre and
the cementitious matrix depends on the surface characteristics of the fibre, apart from the tensile
behaviour of the fibre. To assess the surface modification or surface deterioration due to an alkaline
attack on epoxy of the FRP composite, single fibre pullout tests were conducted. The average of
pullout response of 10 replicates the results are shown in Table 6-2, Figures 6-5, 6-6, & 6-7.
Table 6-2 Summary of single fibre pullout tests of FRP fibre after accelerated deterioration
Fibre
Fracture
Pullout
Energy
Peak bond
stress
Equivalent
bond stress
GFRP
Regular 30% 1053 3.32 0.94
7 Day-Panel 40% 1224 2.23 1.09
7 Day-Fibre 40% 1269 3.76 1.13
28 Day-Fibre 10% 823.5 3.38 0.73
CFRP
Regular 0% 2096 3.07 1.73
7 Day-Panel 0% 1706 2.28 1.40
7 Day-Fibre 0% 1677 2.41 1.38
28 Day-Fibre 0% 1521 2.58 1.25

127
Figure 6-5 Average bond stress-slip graphs of GFRP fibre pullout after different stages of
accelerated deterioration
Figure 6-6 Average bond stress-slip graphs of CFRP fibre pullout after different stages of
accelerated deterioration
0.0
0.5
1.0
1.5
2.0
2.5
3.0
3.5
4.0
0 2 4 6 8 10 12
Bo
nd
Str
ess
(MP
a)
Slip (mm)
GFRP-Regular GFRP-Panel-7d
GFRP-Fibre-7d GFRP-Fibre-28d
0.0
0.5
1.0
1.5
2.0
2.5
3.0
3.5
0 2 4 6 8 10 12
Bo
nd
Str
ess
(MP
a)
Slip (mm)
CFRP-Regular CFRP-Panel-7d
CFRP-Fibre-7d CFRP-Fibre-28d
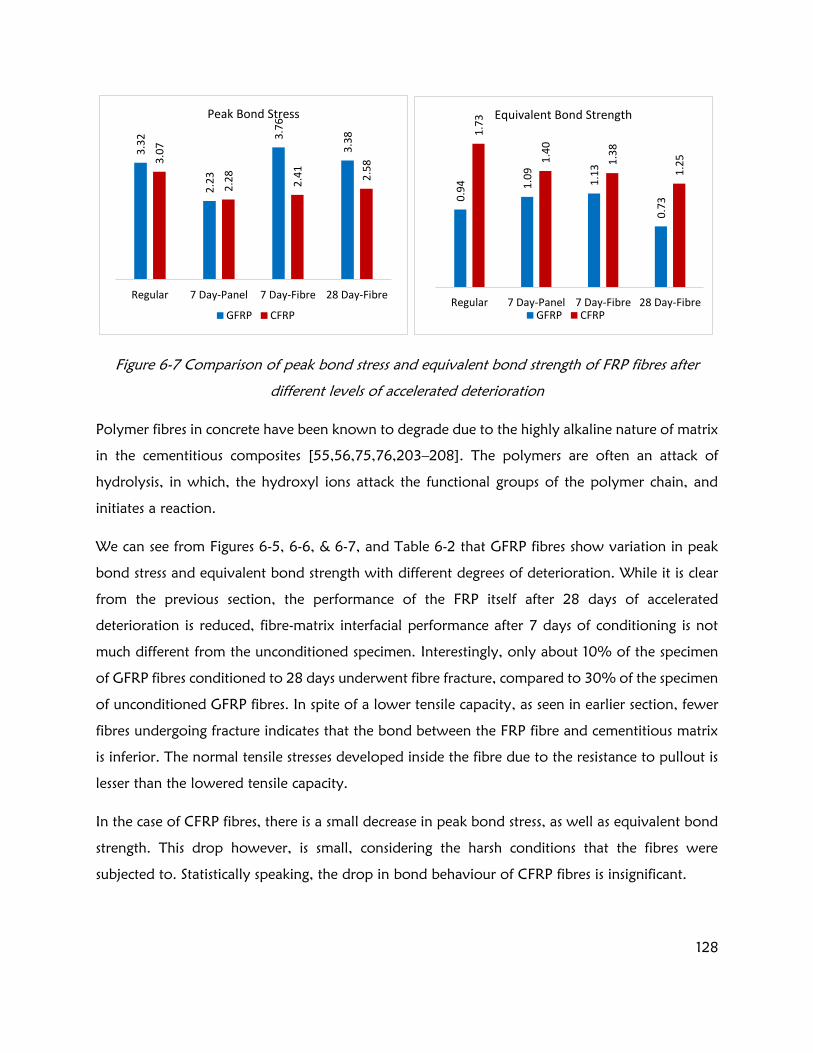
128
Figure 6-7 Comparison of peak bond stress and equivalent bond strength of FRP fibres after
different levels of accelerated deterioration
Polymer fibres in concrete have been known to degrade due to the highly alkaline nature of matrix
in the cementitious composites [55,56,75,76,203–208]. The polymers are often an attack of
hydrolysis, in which, the hydroxyl ions attack the functional groups of the polymer chain, and
initiates a reaction.
We can see from Figures 6-5, 6-6, & 6-7, and Table 6-2 that GFRP fibres show variation in peak
bond stress and equivalent bond strength with different degrees of deterioration. While it is clear
from the previous section, the performance of the FRP itself after 28 days of accelerated
deterioration is reduced, fibre-matrix interfacial performance after 7 days of conditioning is not
much different from the unconditioned specimen. Interestingly, only about 10% of the specimen
of GFRP fibres conditioned to 28 days underwent fibre fracture, compared to 30% of the specimen
of unconditioned GFRP fibres. In spite of a lower tensile capacity, as seen in earlier section, fewer
fibres undergoing fracture indicates that the bond between the FRP fibre and cementitious matrix
is inferior. The normal tensile stresses developed inside the fibre due to the resistance to pullout is
lesser than the lowered tensile capacity.
In the case of CFRP fibres, there is a small decrease in peak bond stress, as well as equivalent bond
strength. This drop however, is small, considering the harsh conditions that the fibres were
subjected to. Statistically speaking, the drop in bond behaviour of CFRP fibres is insignificant.
3.3
2
2.2
3
3.7
6
3.3
8
3.0
7
2.2
8
2.4
1
2.5
8
Regular 7 Day-Panel 7 Day-Fibre 28 Day-Fibre
Peak Bond Stress
GFRP CFRP
0.9
4 1.0
9
1.1
3
0.7
3
1.7
3
1.4
0
1.3
8
1.2
5
Regular 7 Day-Panel 7 Day-Fibre 28 Day-Fibre
Equivalent Bond Strength
GFRP CFRP

129
In both, CFRP and GFRP fibres, pullout response of both types, fibre sized specimen, and panel
specimen, after 7 days of identical deterioration show similar equivalent bond strength (energy
absorbed). Therefore, assumptions of deterioration at the edge of the FRP fibres, where glass and
carbon reinforcing fibres are exposed, are not confirmed.
SEM-EDX image analysis of accelerated deterioration
The fibre specimen, after accelerated deterioration of 28 days were observed under the SEM
microscope to examine any morphological changes on the surface of the fibres. To represent the
true nature of the fibres after deterioration, the specimen were only cleaned using a stirrer in a
water bath for about 20 minutes, in order to remove the particles that are lightly adhered to the
surface of fibres. The fibres were not cleaned in an ultrasonic water bath, to make sure we are not
missing any damaged particles from the fibre.
The SEM images, as seen in Figures 6-8 to Figure 6-11, show the surface in the middle of the fibre.
Figure 6-8 images of Unconditioned (Left) and Conditioned (Right) CFRP fibres at 200x
magnification

130
Figure 6-10 SEM images of Unconditioned (Left) and Conditioned (Right) GFRP fibres at 200x
magnification
Figure 6-9 SEM images of Unconditioned (Left) and Conditioned (Right) CFRP fibres at
2000x magnification

131
Figure 6-11 SEM images of Unconditioned (Left) and Conditioned (Right) GFRP fibres at 2000x
magnification
In Figure 6-8, & Figure 6-10, FRP fibres at low magnification (200x), we see many adhered particles
which appear as white amorphous particles or white fluffy balls. With EDX confirmation, it was
determined these are lime (calcium oxide/calcium hydroxide) particles adhered to the surface of
the fibres.
A higher magnification (2000x), as seen in Figures 6-9 & 6-11, show no change in microstructure or
morphology. The particle seen in Figure 6-9 (left), is a flake of pure carbon that is attached to the
fibre, as confirmed by the EDX spot analysis. The white amorphous particles on the conditioned
fibres are adhered particles of lime, the same as seen at lower magnification. In the unconditioned
GFRP fibre seen at high magnification (in Figure 6-11: left), notice some contaminants which appear
as white spots, adhered to the surface around and under the flake of epoxy. The surface of the
same fibre shows a kind of sheet adhered to it, EDX analysis on which showed the chemical
composition identical to the chemical composition of epoxy.
Overall, the SEM images show some lime particles adhered to all the conditioned fibres, but do
not show any effects of alkaline attack on the surface.

132
Chapter 7: Conclusions and Recommendations for Future
Work
7.1 Conclusions
The purpose of this study was to develop a composite macro-fibre based on FRP, which is able to
provide structural and non-structural benefits by an effective crack bridging mechanism. GFRP and
CFRP fibres were successfully made by cutting the FRP panels produced using vacuum infusion
technique to the required size. Different compositions leading to strengths ranging from 195MPa
to 950 MPa were produced. Single fibre pullout tests were conducted to investigate the FRP fibre-
matrix interfacial bond performance. The effects of matrix maturity, temperature, angle of fibre
inclination, rate of loading and oil-coating on the fibre-matrix interfacial bond performance has
also been investigated. Post-crack load-carrying ability of the fibre reinforced composite has been
studied with fibre relaxation tests. Finally, to assess the durability of the FRP fibres, change in tensile
strength and bond strength after accelerated deterioration has been examined.
The findings of the project have been accomplishing and encouraging.
a) A composite FRP can be effectively made using simple and readily available ingredients.
While in the laboratory, an effective volume fraction of fibre of up to 30% leading to a
tensile strength in comparison to steel was achieved, the fibres can be mass produced with
superior uniform quality.
b) The single fibre pull-out performance of FRP fibres has been superior to commercially
available straight fibres, and matches up with widely used deformed fibres. The unique
texture contributes with a micro-bearing action in the pre-pullout stage. The same texture
contributes to improving the frictional resistance during fibre pullout.
c) The superior single fibre pullout was been successfully translated to flexural response. The
inability to initiate fibre pullout at the cracked section leads to fibre fractures resulting in a
low flexural response. To confirm the response of fibre at loading other than the alignment
of fibre, further investigation of inclined fibre pullout tests were done. We observe brittle

133
fibre fracture in most specimen, which explains the lacklustre flexural post-crack response.
The fibre fracture may be attributed to a combination of a low shear strength, poor
flexibility and ductility, and a high snubbing friction owing to the rough texture.
d) The premature fracture of the fibre before pullout can be rectified by interface modification
between the fibre and the cementitious matrix. A coating of oil has been used to successfully
change the mechanism from a brittle fibre fracture to a tough, energy absorbing fibre
pullout. The overall energy absorption of oil-coated specimen in spite of losing most part
of chemical bond between fibre and matrix is still better than non-coated specimen
subjected to an inclined pullout.
e) The FRP fibre pullout is largely unaffected by changes in temperature. The performance at
low temperatures of -20˚C is superior than at room temperature, however, GFRP fibres
showed a brittle fibre fracture in many specimen. On the other end of the spectrum, the
fibres performed well till 100˚C, after which there was a drop in bond performance. The
SEM and OM images also showed slight deterioration near the edge on the surface of fibres
after 7 days exposure at 130˚C.
f) At dynamic rates of loading, interestingly, not only does resistance to pullout increase by
up to 2 times, the tensile capacity of the fibre itself increases. The performance of the fibre
and its cementitious composites may be expected to better under dynamic loading as
compared to quasi static loading.
g) As a result of mechanical anchorage and a relatively high tensile modulus, the relaxation of
the fibre is a minimum and about 3 times lesser than that of a deformed polypropylene
fibre. This opens up applications in the mining industry.
h) High resistance to deterioration in harsh alkaline environments, and performance
independent of temperatures well above 20C gives the FRP fibres a clear advantages over
other commercially available polymeric fibres. The susceptibility of steel fibres to corrosion
leaves a void in applicability of FRC in many scenarios such marine environments. The FRP
fibres are ideal in such cases.

134
The fibre places itself in between steel and other polymer fibres in terms of tensile properties, and
along with one of a kind surface texture, the fibre will hold an exclusive position in the market.
The invention and commercialization of such fibres provides an excellent business opportunity.
7.2 Recommendation for future work
The FRP fibre has performed above expectations is majority of the criteria investigated but needs
additional work. The advancements made during the project in the last 2 years have been fulfilling
and promising. The project has laid the foundation for a novel application for FRP composites in
civil engineering, and has paved the way for innovation in developing unique, commercially viable
and technologically pioneering FRP fibres.
Some of the recommendations for future work are listed below:
a) Pultruded FRP fibre
The Pultrusion manufacturing technique may be able to solve more than one problem that
we have encountered in this study.
The concern of low flexibility of the FRP fibre can to some extent be alleviated using the
Pultrusion technique for manufacturing the fibre. The minimal size to which FRP fibres could
be made using the vacuum infusion technique have been made in this study, which is still
quite large. The geometry of the fibre can be optimized using the Pultrusion technique.
A higher volume fraction of fibre can be employed using the Pultrusion technique, which
would lead to a more compact, highly uniform, superior quality fibre.
The third advantage of Pultrusion is in optimization of the fibre-matrix interface. The rough
texture hinders fibre pullout, leading to a brittle fracture, especially in the case of inclined
fibre pullout.
b) Interface optimization
The bond between the FRP fibre and cementitious matrix as we have seen is exceptional.
In the case of GFRP fibres especially, the high resistance to pullout at times leads to brittle

135
fracture. We have seen in most inclined pullout cases, fibre fracture is the predominant
mode of failure. This problem can be mitigated by optimizing the interface to suit the
capacity of the fibres. Oil-coating has proven to be an effective measure in optimizing the
interface. We have seen many such cases with PVA fibres, where a brittle fibre fracture type
of failure has been successfully changed to tough energy absorbing ductile mechanism as
seen in ECC. The preliminary studies in this project have shown promising results with oil-
coating. A slip hardening response may be obtained by an optimized interface.
c) Alternate materials
As we know, carbon fibre is one among the most expensive high performance fibres. A
search for a more sustainable and economically viable alternative must be in place. Glass
fibre, which has been tried out in this project has shown promising results.
A polyester resin matrix would change the surface interaction between the FRP fibre and
cementitious matrix, whilst reducing the overall cost. A polyester resin, which is
hydrophobic in nature could very well solve the issue with having too strong a bond with
cementitious matrix.
d) Thermoplastic resin FRP fibre
Like the polyester resins, other thermoplastic resin systems such as polypropylene,
polyethylene terephthalate, polycarbonate, etc. are all hydrophobic and will modify the
interfacial interaction between FRP fibre and cementitious matrix. However, these
thermoplastic resins require special manufacturing techniques, and hence are often limited
to factories. Possibly, the ductile elasto-plastic nature of these thermoplastic resins may be
able to impart some amount of ductility onto the FRP fibre.

136
References
[1] Mehta PK, Monteiro P. Concrete: microstructure, properties, and materials. fourth edi.
McGraw-Hill Education; 2006.
[2] Bentur A, Mindess S. Fibre reinforced cementitious composites. 2006.
[3] Romualdi J, Batson G. Mechanics of crack arrest in concrete. J Eng Mech Div 1963;89:147–
68.
[4] Romualdi JJP, Mandel JA. Tensile Strength of concrete Affected by Uniformly Distributed
and Closely Spaced Short Lengths of wire Reinforcement. ACI J Proc 1964;61:657–72.
doi:10.14359/7801.
[5] Agbim CC. Concrete reinforced with glass fibres. Mag Concr Res 1964;16:195–202.
[6] Dai Q, Wang Z, Mohd Hasan MR. Investigation of induction healing effects on electrically
conductive asphalt mastic and asphalt concrete beams through fracture-healing tests. Constr
Build Mater 2013;49:729–37. doi:10.1016/j.conbuildmat.2013.08.089.
[7] Al-Mattarneh H. Electromagnetic quality control of steel fiber concrete. Constr Build Mater
2014;73:350–6. doi:10.1016/j.conbuildmat.2014.09.101.
[8] Sukontasukkul P, Pomchiengpin W, Songpiriyakij S. Post-crack (or post-peak) flexural
response and toughness of fiber reinforced concrete after exposure to high temperature.
Constr Build Mater 2010;24:1967–74. doi:10.1016/j.conbuildmat.2010.04.003.
[9] Kalifa P, Chéné G, Gallé C. High-temperature behaviour of HPC with polypropylene fibres
- From spalling to microstructure. Cem Concr Res 2001;31:1487–99. doi:10.1016/S0008-
8846(01)00596-8.
[10] Banthia N, Mindess S, Bentur a., Pigeon M. Impact testing of concrete using a drop-weight
impact machine. Exp Mech 1989;29:63–9. doi:10.1007/BF02327783.
[11] Xu H, Mindess S, Banthia N. THE IMPACT RESPONSE OF NORMAL AND VERY HIGH
STRENGTH FRC ROUND PANELS n.d.:1–8.
[12] Filiatrault A, Pineau S, Houde J. Seismic behavior of steel fiber reinforced concrete interior
beam-column joints. ACI Struct J 1995;92:543–52.
[13] Parra-Montesinos GJ. High-performance fiber-reinforced cement composites: An alternative
for seismic design of structures. ACI Struct J 2005;102:668–75.
[14] Hollaway LC. The evolution of and the way forward for advanced polymer composites in
the civil infrastructure. Constr Build Mater 2003;17:365–78. doi:10.1016/S0950-
0618(03)00038-2.
[15] Yi NH, Kim JHJ, Han TS, Cho YG, Lee JH. Blast-resistant characteristics of ultra-high strength
concrete and reactive powder concrete. Constr Build Mater 2012;28:694–707.
doi:10.1016/j.conbuildmat.2011.09.014.
[16] Sukontasukkul P, Mindess S, Banthia N. Penetration Resistance of Hybrid Fibre Reinforced
Concrete Under Low Velocity Impact Loading. 2nd Mater. Spec. Conf. Can. Soc. Civ. Eng.,

137
2002, p. 1–9.
[17] Bilodeau a., Kodur VKR, Hoff GC. Optimization of the type and amount of polypropylene
fibres for preventing the spalling of lightweight concrete subjected to hydrocarbon fire. Cem
Concr Compos 2004;26:163–74. doi:10.1016/S0958-9465(03)00085-4.
[18] Han CG, Hwang YS, Yang SH, Gowripalan N. Performance of spalling resistance of high
performance concrete with polypropylene fiber contents and lateral confinement. Cem
Concr Res 2005;35:1747–53. doi:10.1016/j.cemconres.2004.11.013.
[19] Kodur VKR, Cheng F-P, Wang T-C, Sultan MA. Effect of strength and fiber reinforcement on
fire resistance of high-strength concrete columns. J Struct Eng 2003;129:253.
doi:10.1061/(ASCE)0733-9445(2003)129:2(253).
[20] Siddique R, Khatib J, Kaur I. Use of recycled plastic in concrete: A review. Waste Manag
2008;28:1835–52. doi:10.1016/j.wasman.2007.09.011.
[21] Haynes HH. Investigation of fiber reinforcement methods for thin shell concrete. Port
Hueneme, California: 1968.
[22] Monfore GE. A review of fiber reinforcement of portland cement paste, mortar, and
concrete. J PCA Res Dev Lab 1968.
[23] Sridhara S, S K, Sinare MA. Fibre Reinforced Concrete. Indian Concr J 1971;45:428–30,433.
[24] Nawy EG, Neuwerth GE, Phillips CJ. Behaviour of fiber glass reinforced concrete beams. J
Struct Div Am Soc Civ Eng 1973;99:203–4.
[25] Flajsman F, Cahn DS, Phillips JC. Polymer impregnated fiber reinforced mortars. J Am Ceram
Soc 1971;54:129–30.
[26] Kar JN. Strength of Fiber-Reinforced Concrete. J Struct Div Am Soc Civ Eng 1972;98:1053–
68.
[27] Batson G, Jenkins E, Spatney R. Steel fibers as shear reinforcements in beams. Am Concr Inst
J Proc 1972;69.
[28] Bailey JE, Barker HA, Urbanowicz C. Alumina filament reinforced cement paste 1972:203–
10.
[29] Majumdar AJ. The role of the interface in glass fibre reinforced cement. Cem Concr Res
1974;4:247–68. doi:http://dx.doi.org/10.1016/0008-8846(74)90137-9.
[30] Swamy RN, Stavrides H. Some properties of high workability steel fibre concrete. RILEM
Symp., 1975, p. 197–208.
[31] Swamy R. Fibre reinforcement of cement and concrete. Matériaux Constr 1975;8:235–54.
[32] Jakel GR. US Patent 3899344. Fiber reinforced concrete products and their formation, 1975.
[33] Batson G. Stel fiber reinforced concrete. Mater Sci Eng 1976;25:53–8.
[34] Uzomaka OJ. Characteristics of akwara as a reinforcing fibre. Mag Concr Res 1976;28:162–
7.
[35] Pairaudeau RD, Turnbull D, Bevan LG. United States Patent 411171. Method of incorporating
138
carbon fibers into cement to produce reinforced structures having improved flexural
strengths, 1981.
[36] Majumdar AJ, Laws V. Fibre cement composites: research at BRE. Composites 1979;10:17–
27. doi:10.1016/0010-4361(79)90348-3.
[37] Lewis G, Premalal M. Natural vegetable fibres as reinforcement in cement sheets. Mag Concr
Res 1979;31:104–8.
[38] Coutts RSP, Campbell MD. Coupling agents in wood fibre- reinforced cement composites.
Composites 1979;10:228–32. doi:10.1016/0010-4361(79)90024-7.
[39] Naaman AE. Fiber reinforced concrete under dynamic loading. Am Concr Inst Spec Publ
1984;81:169–86.
[40] Hahne H, Karl S, Worner JD. Properties of polyacrylonitrile fiber reinforced concrete. Am
Concr Inst Spec Publ 1987;105:211–24.
[41] Wang Y, Li VC, Backer S. Tensile properties of synthetic fiber reinforced mortar. Cem Concr
Compos 1990;12:29–40. doi:10.1016/0958-9465(90)90033-T.
[42] Parameswaran VS. Fiber-Reinforced Concrete - a Versatile Construction Material. Build
Environ 1991;26:301–5. doi:10.1016/0360-1323(91)90054-f.
[43] Betterman LR, Ouyang C, Shah SP. Fiber-matrix interaction in microfiber-reinforced mortar.
Adv Cem Based Mater 1995;2:53–61. doi:10.1016/1065-7355(95)90025-X.
[44] Zollo RF. Fiber-reinforced concrete: an overview after 30 years of development. Cem Concr
Compos 1997;19:107–22. doi:10.1016/S0958-9465(96)00046-7.
[45] Sargaphuti M, Shah SP, Vinson KD. Shrinkage Cracking and Durability Characteristics of
Cellulose Fiber Reinforced Concrete. ACI Mater J 1993;90:309–18.
[46] Nanni A. Flexural Behavior and Design of RC Members Using FRP Reinforcement. J Struct
Eng 1995;121:916–7. doi:10.1061/(ASCE)0733-9445(1995)121:5(916.2).
[47] Low NMP, Beaudoin JJ. Flexural strength and microstructure of cement binders reinforced
with wollastonite micro-fibres. Cem Concr Res 1993;23:905–16. doi:10.1016/0008-
8846(93)90044-A.
[48] Yon K-Y, Mitchell B, Dunn S. Introduction of new reinforcement for cementitious materials-
-Calcia/alumina (CA) fibers formed by the inviscid melt-spinning (IMS) process. Cem Concr
1993;15:165–72. doi:10.1016/0958-9465(93)90005-T.
[49] Benmokrane B, Chaallal O, Masmoudi R. Glass fibre reinforced plastic (GFRP) rebars for
concrete structures. Constr Build Mater 1995;9:353–64. doi:10.1016/0950-0618(95)00048-
8.
[50] Banthia N, Van Cheng. Shrinkage cracking in polyolefin fiber-reinforced concrete. ACI Struct
J 2000;97:432–7.
[51] Ma Y, Zhu B, Tan M. Properties of ceramic fiber reinforced cement composites. Cem Concr
Res 2005;35:296–300. doi:10.1016/j.cemconres.2004.05.017.
[52] Savastano H, Warden PG, Coutts RSP. Brazilian waste fibres as reinforcement for cement-

139
based composites. Cem Concr Compos 2000;22:379–84. doi:10.1016/S0958-
9465(00)00034-2.
[53] Yao W, Li J, Wu K. Mechanical properties of hybrid fiber-reinforced concrete at low fiber
volume fraction. Cem Concr Res 2003;33:27–30. doi:10.1016/S0008-8846(02)00913-4.
[54] Kaiping L, Hewei C, Jing’en Z. Investigation of brucite-fiber-reinforced concrete. Cem Concr
Res 2004;34:1981–6. doi:10.1016/j.cemconres.2004.02.018.
[55] Silva DA, Betioli AM, Gleize PJP, Roman HR, Gómez LA, Ribeiro JLD. Degradation of
recycled PET fibers in Portland cement-based materials. Cem Concr Res 2005;35:1741–6.
doi:10.1016/j.cemconres.2004.10.040.
[56] Ochi T, Okubo S, Fukui K. Development of recycled PET fiber and its application as concrete-
reinforcing fiber. Cem Concr Compos 2007;29:448–55.
doi:10.1016/j.cemconcomp.2007.02.002.
[57] Awwad E, Mabsout M, Hamad B, Khatib H. Preliminary Studies on the Use of Natural Fibers
in Sustainable Concrete. Leban Sci J 2011;12:109–17.
[58] Peters SJ, Rushing TS, Landis EN, Cummins TK. Nanocellulose and Microcellulose Fibers for
Concrete. Transp Res Rec J Transp Res Board 2010;2142:25–8. doi:10.3141/2142-04.
[59] Haghi AK, Zaikov GE. Application of polymers in construction technology. Effects of
recycled polyamide fibers and expanded polystyrent on cement composites. Polym. Adv.
Technol. Process. Charact. Appl., 2013, p. 213.
[60] Çavdar A. The effects of high temperature on mechanical properties of cementitious
composites reinforced with polymeric fibers. Compos Part B Eng 2013;45:78–88.
doi:10.1016/j.compositesb.2012.09.033.
[61] Martínez-López M, Martínez-Barrera G, Martínez-Cruz E. Effect of the Loofah-fibers on the
mechanical properties of Polymer Concrete. IOP Conf Ser Mater Sci Eng 2013;45:012027.
doi:10.1088/1757-899X/45/1/012027.
[62] Wei B, Cao H, Song S. Tensile behavior contrast of basalt and glass fibers after chemical
treatment. Mater Des 2010;31:4244–50. doi:10.1016/j.matdes.2010.04.009.
[63] Gencel O, del Coz Diaz JJ, Sutcu M, Koksal F, Alvarez Rabanal FP, Martinez-Barrera G, et
al. Properties of gypsum composites containing vermiculite and polypropylene fibers:
Numerical and experimental results. Energy Build 2014;70:135–44.
doi:10.1016/j.enbuild.2013.11.047.
[64] Söylev TA, Özturan T. Durability, physical and mechanical properties of fiber-reinforced
concretes at low-volume fraction. Constr Build Mater 2014;73:67–75.
doi:10.1016/j.conbuildmat.2014.09.058.
[65] Tassew ST, Lubell a. S. Mechanical properties of glass fiber reinforced ceramic concrete.
Constr Build Mater 2014;51:215–24. doi:10.1016/j.conbuildmat.2013.10.046.
[66] Mader E, Plonka R, Schiekel M, Hempel R. Coatings on Alkali-Resistant Glass Fibres for the
Improvement of Concrete. J Ind Text 2004;33:191–207. doi:10.1177/1528083704039833.
[67] Liang W, Cheng J, Hu Y, Luo H. Improved properties of GRC composites using commercial

140
E-glass fibers with new coatings. Mater Res Bull 2002;37:641–6.
doi:http://dx.doi.org/10.1016/S0025-5408(02)00700-6.
[68] Jiang C, Fan K, Wu F, Chen D. Experimental study on the mechanical properties and
microstructure of chopped basalt fibre reinforced concrete. J Mater 2014;58:187–93.
doi:10.1016/j.matdes.2014.01.056.
[69] Deak T, Czigany T. Chemical Composition and Mechanical Properties of Basalt and Glass
Fibers : A Comparison. Text Res J 2009;79:645–51. doi:10.1177/0040517508095597.
[70] Dias DP, Thaumaturgo C. Fracture toughness of geopolymeric concretes reinforced with
basalt fibers. Cem Concr Compos 2005;27:49–54.
doi:10.1016/j.cemconcomp.2004.02.044.
[71] Kabay N. Abrasion resistance and fracture energy of concretes with basalt fiber. Constr Build
Mater 2014;50:95–101. doi:10.1016/j.conbuildmat.2013.09.040.
[72] Ayub T, Shafiq N, Nuruddin MF. Mechanical Properties of High-Performance Concrete
Reinforced with Basalt Fibers. Procedia Eng 2014;77:131–9.
doi:10.1016/j.proeng.2014.07.029.
[73] Li W, Xu J. Mechanical properties of basalt fiber reinforced geopolymeric concrete under
impact loading. Mater Sci Eng A 2009;505:178–86. doi:10.1016/j.msea.2008.11.063.
[74] Sim J, Park C, Moon DY. Characteristics of basalt fiber as a strengthening material for
concrete structures. Compos Part B Eng 2005;36:504–12.
doi:10.1016/j.compositesb.2005.02.002.
[75] Azwa ZN, Yousif BF, Manalo a. C, Karunasena W. A review on the degradability of
polymeric composites based on natural fibres. Mater Des 2013;47:424–42.
doi:10.1016/j.matdes.2012.11.025.
[76] Yin S, Tuladhar R, Combe M, Collister T, Jacob M, Shanks AR. Mechanical Properties of
Recycled Plastic Fibres for Reinforcing Concrete. Fibre Concr., 2013, p. 1–10.
[77] Irwan JM, Asyraf RM, Othman N, Koh HB, Annas MMK, Faisal SK. The Mechanical
Properties of PET Fiber Reinforced Concrete from Recycled Bottle Wastes. Adv Mater Res
2013;795:347–51. doi:10.4028/www.scientific.net/AMR.795.347.
[78] Kim JHJ, Park CG, Lee SW, Lee SW, Won JP. Effects of the geometry of recycled PET fiber
reinforcement on shrinkage cracking of cement-based composites. Compos Part B Eng
2008;39:442–50. doi:10.1016/j.compositesb.2007.05.001.
[79] Kim SB, Yi NH, Kim HY, Kim J-HJ, Song Y-C. Material and structural performance evaluation
of recycled PET fiber reinforced concrete. Cem Concr Compos 2010;32:232–40.
doi:10.1016/j.cemconcomp.2009.11.002.
[80] Yin S, Tuladhar R, Shi F, Combe M, Collister T, Sivakugan N. Use of macro plastic fibres in
concrete: A review. Constr Build Mater 2015;93:180–8.
doi:10.1016/j.conbuildmat.2015.05.105.
[81] Soroushian P, Khan A, Hsu J. Mechanical Properties of Concrete Materials Reinforced with
Polypropylene or Polyethylene Fibers. ACI Mater J 1993:535–40.

141
[82] Malhotra VM, Carette GG, Bilodeau A. Mechanical Properties and Durability of
Polypropylene Fiber Reinforced High-Volume Fly Ash Concrete for Shotcrete Applications.
ACI Mater J 1995:478–86.
[83] Chung DDL. Use of polymers for cement-based structural. J Mater Sci 2004;39:2973–8.
[84] Aglan H, Morsy M, Allie A, Fouad F. Evaluation of fiber reinforced nanostructured perlite-
cementitious surface compounds for building skin applications. Constr Build Mater
2009;23:138–45. doi:10.1016/j.conbuildmat.2008.01.010.
[85] Li VC, Wang S, Wu C. Tensile strain-hardening behavior or polyvinyl alcohol engineered
cementitious composite (PVA-ECC). ACI Mater J 2001;98:483–92.
[86] Wang S, Li VC. Engineered cementitious composites with high-volume fly ash. ACI Mater J
2007;104:233–41.
[87] Li VC. Reflections on the Research and Development of Engineered. JCI Int Work Ductile
Fiber Reinf Cem Compos (DFRCC)–Application Eval 2002:1–21.
[88] Oh BH, Kim JC, Choi YC. Fracture behavior of concrete members reinforced with structural
synthetic fibers. Eng Fract Mech 2007;74:243–57. doi:10.1016/j.engfracmech.2006.01.032.
[89] Singh S, Shukla A, Brown R. Pullout behavior of polypropylene fibers from cementitious
matrix. Cem Concr Res 2004;34:1919–25. doi:10.1016/j.cemconres.2004.02.014.
[90] Li VC, Wang Y, Backer S. Effect of inclining angle, bundling and surface treatment on
synthetic fibre pull-out from a cement matrix. Composites 1990;21:132–40.
doi:10.1016/0010-4361(90)90005-H.
[91] Sreekala MS, Kumaran MG, Thomas S. Oil palm fibers: Morphology, chemical composition,
surface modification, and mechanical properties. J Appl Polym Sci 1997;66:821–35.
doi:10.1002/(SICI)1097-4628(19971031)66:5<821::AID-APP2>3.0.CO;2-X.
[92] Poletti G, Orsini F, Raffaele-Addamo a., Riccardi C, Selli E. Cold plasma treatment of PET
fabrics: AFM surface morphology characterisation. Appl Surf Sci 2003;219:311–6.
doi:10.1016/S0169-4332(03)00703-7.
[93] Riccardi C, Barni R, Selli E, Mazzone G, Massafra MR, Marcandalli B, et al. Surface
modification of poly(ethylene terephthalate) fibers induced by radio frequency air plasma
treatment. Appl Surf Sci 2003;211:386–97. doi:10.1016/S0169-4332(03)00265-4.
[94] Sreekumar P a., Thomas SP, Saiter JM, Joseph K, Unnikrishnan G, Thomas S. Effect of fiber
surface modification on the mechanical and water absorption characteristics of
sisal/polyester composites fabricated by resin transfer molding. Compos Part A Appl Sci
Manuf 2009;40:1777–84. doi:10.1016/j.compositesa.2009.08.013.
[95] Hegemann D, Brunner H, Oehr C. Plasma treatment of polymers for surface and adhesion
improvement. Nucl Instruments Methods Phys Res Sect B Beam Interact with Mater Atoms
2003;208:281–6. doi:10.1016/S0168-583X(03)00644-X.
[96] Redon C, Li VC, Wu C, Hoshiro H, Saito T, Ogawa A. Measuring and modifying interface
properties of PVA fibers in ECC matrix. J Mater Civ Eng 2001;13:399–406.
[97] Li VC. Engineered Cementitious Composites (Ecc) – Tailored Composites through

142
Micromechanical Modeling. Can Soc Civ Eng 1997:1–38.
[98] Li VC, Wu C, Wang S, Ogawa A, Saito T. Interface tailoring for strain-hardening polyvinyl
alcohol-engineered cementitious composite (PVA-ECC). ACI Mater J 2002;99:463–72.
[99] Sayyar M, Soroushian P, Sadiq MM, Balachandra A, Lu J. Low-cost glass fiber composites
with enhanced alkali resistance tailored towards concrete reinforcement. Constr Build Mater
2013;44:458–63. doi:10.1016/j.conbuildmat.2013.03.055.
[100] Greszczuk LB. Theoretical studies on the mechanics of the fibre-matrix interface in
composites. Interfaces Compos., American Society for Testing and Materials; 1968, p. 42–
58. doi:10.1520/STP452-EB.
[101] Gray RJ. Analysis of the effect of embedded fibre length on fibre debonding and pull-out
from an elastic matrix - Part 2 Application to a steel fibre-cementitious matrix composite
system. J Mater Sci 1984;19:1680–91. doi:10.1007/BF00563066.
[102] Lawrence P. Some theoretical considerations of fibre pull-out from an elastic matrix. J Mater
Sci 1972;7:1–6. doi:10.1007/BF00549541.
[103] Laws V, et al. Reinforcement of brittle matrices by glass fibres. J Phys D Appl Phys
1973;6:523.
[104] Bartos P. Review paper: Bond in fibre reinforced cements and concretes. Int J Cem Compos
Light Concr 1981;3:159–77. doi:10.1016/0262-5075(81)90049-X.
[105] Laws V. Micromechanical aspects of the fibre-cement bond. Composites 1982;13:145–51.
doi:10.1016/0010-4361(82)90051-9.
[106] Bentur a., Mindess S, Diamond S. Pull-out processes in steel fibre reinforced cement. Int J
Cem Compos Light Concr 1985;7:29–37. doi:10.1016/0262-5075(85)90024-7.
[107] Robins P, Austin S, Jones P. Pull-out behaviour of hooked steel fibres. Mater Struct
2002;35:434–42. doi:10.1007/BF02483148.
[108] Naaman AE, Najm HS. Bond-Slip of Steel Fibers in Concrete. ACI Mater J 1991;88:135–45.
[109] Bindiganavile V, Banthia N. Polymer and steel fiber-reinforced cementitious composites
under impact loading - Part 2: Flexural Toughness. ACI Mater J 2001;98:17–24.
[110] Bindiganavile V, Banthia N. Polymer and steel fiber-reinforced cementitious composites
under impact loading - Part 1: Bond-slip response. ACI Mater J 2001;98:10–6.
[111] Bartoš P. Analysis of pull-out tests on fibres embedded in brittle matrices. J Mater Sci
1980;15:3122–8.
[112] Pakravan HR, Jamshidi M, Latifi M, Chehimi MM. Polymeric fibre adhesion to the
cementitious matrix related to the fibres type, water to cement ratio and curing time. Int J
Adhes Adhes 2012;35:102–7. doi:10.1016/j.ijadhadh.2012.02.006.
[113] Banthia N, Hingson RE, Dubey A. US5981630- fibers having improved sinusoidal
configuration, concrete reinfoirced therewith and related method, 1999.
[114] Banthia N, Krishnadev MR. US5443918 - Metal Fiber with Optimized Geometry for
Reinforcing Cement-Based Metals.pdf, 1995.

143
[115] Banthia N. A study of some factors affecting the fiber–matrix bond in steel fiber reinforced
concrete. Can J Civ Eng 1990;17:610–20. doi:10.1139/l90-069.
[116] Banthia N, Trottier J. Micromechanics of Steel Fiber Pull-Out : Rate Sensitivity at Very Low
Temperatures. Cem Concr Compos 1992;14:119–30.
[117] Banthia N, Trottier J-F. Defirned steek fibre cementitious matrix bond under impact. Cem
Concr Res 1991;21:158–68. doi:10.1016/0008-8846(91)90042-G.
[118] Gokoz UN, Naaman AE. Effect of strain-rate on the pull-out behaviour of fibres in mortar.
Intemational J Cem Compos 1981;3:187–202.
[119] Kim DJ, El-Tawil S, Naaman AE. Loading rate effect on pullout behavior of deformed steel
fibers. ACI Mater J 2008;105:576–84.
[120] Zhang J, Li VC. Effect of inclination angle on fiber rupture load in fiber reinforced
cementitious composites. Compos Sci Technol 2002;62:775–81. doi:10.1016/S0266-
3538(02)00045-3.
[121] Ouyang C, Pacios A, Shah S. Pullout of inclined fibers from cementitious matrix. J Eng Mech
1994;120:2641–59.
[122] Banthia N, Trottier JF. Concrete Reinforced with Deformed Steel Fibres. Part I: Bond-Slip
Mechanisms. ACI Mater J 1994;91:435–46. doi:10.14359/9765.
[123] Armelin HS, Banthia N. Predicting the flexural postcracking performance of steel fiber
reinforced concrete from the pullout of single fibers. ACI Mater J 1997;94:18–31.
[124] Prudencio L, Austin S a, Jones P a, Armelin H, Robins PJ. Prediction of steel fibre reinforced
concrete under flexure from an inferred fibre pull-out response. Mater Struct 2006;39:601–
10. doi:10.1617/s11527-006-9091-2.
[125] Jones P a, Austin S a, Robins PJ. Predicting the flexural load–deflection response of steel
fibre reinforced concrete from strain, crack-width, fibre pull-out and distribution data. Mater
Struct 2008;41:449–63. doi:10.1617/s11527-007-9327-9.
[126] Hollaway LC. A review of the present and future utilisation of FRP composites in the civil
infrastructure with reference to their important in-service properties. Constr Build Mater
2010;24:2419–45. doi:10.1016/j.conbuildmat.2010.04.062.
[127] Van Den Einde L, Xhao L, Seible F. Use of FRP composites in civil structural applications.
Constr Build Mater 2003;17:389–403. doi:10.1016/S0950-0618.
[128] Stratford T. The Condition of the Aberfeldy Footbridge after 20 Years in Service. Struct.
Faults Repair, Edinburgh: Edinburgh Research Explorer; 2012.
[129] Keller T. Recent all-composite and hybrid fibre-reinforced polymer bridges and buildings.
Prog Struct Eng Mater 2001;3:132–40. doi:10.1002/pse.66.
[130] Meier U. Strengthening of structures using carbon fibre / epoxy composites. Constr Build
Mater 1995;9:341–51. doi:10.1016/0950-0618(95)00071-2.
[131] Hollaway L, Teng J-G. Strengthening and rehabilitation of civil infrastructure using fibre
reinforced polymer composites. Cambridge: CRC Press; 2008.

144
[132] Teng J., Chen JF, Smith ST, Lam L. FRP: Strengthened RC Structures. Frontiers . Wiley; 2002.
[133] Chen JF, Smith ST, Lam L, Teng JG. Behaviour and strength of FRP-strengthened RC
structures: a state-of-the-art review. Proc ICE - Struct Build 2003;156:51–62.
doi:10.1680/stbu.2003.156.1.51.
[134] Hassan T, Horeczy G, Svecova D, Rizkalla S, Shehata E, Stewart D. Flexural strengthening of
post tensioned bridge slab using FRP. Int. Conf. Adv. Compos. Mater., 2000.
[135] Lorenzis L de, Nanni A. Characterization of FRP Rods as Near-Surface Mounted
Reinforcement. J Compos Constr 2001;5:114–21. doi:10.1061/(ASCE)1090-
0268(2001)5:2(114).
[136] Pantazopoulou, S., Bonacci, J., Sheikh, S., Thomas, M., and Hearn N. Repair of Corrosion-
Damaged Columns with FRP Wraps. J Compos Constr 2001;5:3–11.
[137] Sheikh S a., Li Y. Design of FRP confinement for square concrete columns. Eng Struct
2007;29:1074–83. doi:10.1016/j.engstruct.2006.07.016.
[138] Banthia N, Abdolrahimzadeh A, Demers M, Mufti A, Sheikh S. Durability of FRP-Concrete
bond in FRP-strengthened bridges. Concr Int 2010;32.
doi:10.1017/CBO9781107415324.004.
[139] Micelli F, Nanni A. Durability of FRP rods for concrete structures. Constr Build Mater
2004;18:491–503. doi:10.1016/j.conbuildmat.2004.04.012.
[140] Karbhari VM, Chin JW, Hunston D, Benmokrane B, Juska T, Morgan R, et al. Durability gap
analysis for fibre-reinforced polymer composites in civil infrastructure. Reinf Plast 2008;3:1–
15. doi:10.1016/j.conbuildmat.2007.03.023.
[141] Uomoto T. Durability consideratins for FRP reinforcements. Non-Metalic Reinf. Concr.
Struct., Cambridge: 2001.
[142] Davalos JF, Chen Y, Ray I. Long-term durability prediction models for GFRP bars in concrete
environment. J Compos Mater 2011;46:1899–914. doi:10.1177/0021998311427777.
[143] Davalos JF, Chen Y, Ray I. Effect of FRP bar degradation on interface bond with high
strength concrete. Cem Concr Compos 2008;30:722–30.
doi:10.1016/j.cemconcomp.2008.05.006.
[144] Bakis CE, Bank LC, Brown VL, Cosenza E, Davalos JF, Lesko JJ, et al. Fiber-Reinforced
Polymer Composites for Construction—State-of-the-Art Review. J Compos Constr
2002;6:73–87. doi:10.1061/(ASCE)1090-0268(2002)6:2(73).
[145] Ceroni F, Cosenza E, Gaetano M, Pecce M. Durability issues of FRP rebars in reinforced
concrete members. Cem Concr Compos 2006;28:857–68.
doi:10.1016/j.cemconcomp.2006.07.004.
[146] Mufti A, Benmokrane B, BOULFIZA M, Bakht B, Breyy P, Brett P. Field study on durability
of GFRP Reinforcement. Int Bridg Deck Work Winnipeg, Manitoba, Canada 2005:14–5.
[147] Mufti A, Onofrei M, Benmokrane B, Banthia N, Boulfiza M, Newhook J, et al. Durability of
GFRP reinforced concrete in field structures. Proc 7th Int Symp Fiber Reinf Polym Reinf
Concr Struct - FRPRCS-7 2005:889–95.

145
[148] Mufti A, Onofrei M, Benmokrane B, BaNthia N, Boulfiza M, Newhook J, et al. Report on
the studies of GFRP durability in concrete from field demonstration structures. Proc 3rd Int
Conf Compos Constr - CCC 2005 2005:11–3.
[149] Mufti A a, Neale KW. State-of-the-Art of FRP and SHM Applications in Bridge Structures in
Canada. Compos Res J 2008;2:60–9.
[150] Chen Y, Davalos JF, Ray I, Kim H-Y. Accelerated aging tests for evaluations of durability
performance of FRP reinforcing bars for concrete structures. Compos Struct 2007;78:101–11.
doi:10.1016/j.compstruct.2005.08.015.
[151] Correia J, Cabral-Fonseca S. Durability of glass fibre reinforced polyester (GFRP) pultruded
profiles used in civil engineering applications. Third Int Conf Compos Constr 2005:1–9.
[152] Schutte CL. Reports : A Review Journal Environmental durability of glass-fiber composites
1994;13:265–323.
[153] Schutte CL. Environmental durability of glass-fiber composites. Mater Sci Eng R Reports
1994;13:265–323. doi:10.1016/0927-796X(94)90002-7.
[154] Bakis CE, Bank LC, Brown VL, Cosenza E, Davalos JF, Lesko JJ, et al. Fiber-Reinforced
Polymer Composites for Construction State-of-the-Art Review. J Compos Constr
2002;6:73–87.
[155] Harris HG, Somboonsong W, Ko FK. New Ductile Hybrid FRP Reinforcing Bar for Concrete
Structures. J Compos Constr 1998:28–37.
[156] Focacci F, Nanni A, Bakis CE. Local bond-slip relationship for FRP reinforcement in concrete.
J Compos Constr 2000;4:24–31. doi:10.1061/(ASCE)1090-0268(2000)4:1(24).
[157] Deskovic N, Triantafillou TC, Meier U. Innovative design of FRP combined with concrete:
Short term behavior. J Struct Eng 1995;121:1069–78.
[158] Hulatt J, Hollaway L, Thorne a. The use of advanced polymer composites to form an
economic structural unit. Constr Build Mater 2003;17:55–68. doi:10.1016/S0950-
0618(02)00093-4.
[159] Mirmiran A, Shahawy M, Nanni A, Karbhari VM, Yalim B, Kalayci AS. Recommended
construction specifications and process control manual for repair and retrofit of concrete
structures using bonded FRP composites. Transportation research board; 2008.
[160] Mirmiran A. Stay-In-Place FRP Form for Concrete Columns. Adv Struct Eng 2003;6:231–41.
[161] Mirmiran A, Shahawy M, Samaan M, El Echary H, Mastrapa JC, Pico O. Effect of column
parameters on FRP confined concrete. J Compos Constr 1998;2:175–85.
[162] Azom materials E-glass fibre properties website n.d.
http://www.azom.com/properties.aspx?ArticleID=764 (accessed December 15, 2014).
[163] Saint Gobain Vetrotex Glass fibre properties data sheet n.d.
http://glassproperties.com/glasses/E_R_and_D_glass_properties.pdf (accessed December 15,
2014).
[164] Purnell P, Beddows J. Durability and simulated ageing of new matrix glass fibre reinforced
concrete. Cem Concr Compos 2005;27:875–84. doi:10.1016/j.cemconcomp.2005.04.002.

146
[165] Sweet Composites website 2011. http://sweetcomposites.com/Fabric.html (accessed
December 1, 2014).
[166] Sethi S, Ray BC. Mechanical Behavior of Polymer Composites at Cryogenic Temperatures.
Plymers Cryog. Temp., 2013. doi:10.1007/978-3-642-35335-2.
[167] Bennet S, Johnson D. Structural heterogeneity in carbon fibers. Proc. 5th London carbon
Graph. Conf., 1979, p. 377–86.
[168] Rudolph N. If You Can See It, It’s Not Nano: Working with Numbers at the Extremes n.d.
http://teachers.yale.edu/curriculum/viewer/initiative_10.05.07_u (accessed February 1,
2016).
[169] Talukdar S. Strengthening of timber beams using externally-bonded sprayed fibre reinforced
polymers. 2008.
[170] Banthia N, Boyd AJ. Sprayed fibre-reinforced polymers for repairs 2000;915:907–15.
[171] Boyd AJ, Banthia N, Mindess S. Retrofit of shear strength deficient RC beams with sprayed
GFRP. Proc. theInternationsl Symp. Brittle Matrix Compos. 9, 2009, p. 1–10.
[172] Mortazavi SR. Experimental and finite element analysis of a damaged reinforced concrete
bridge strengthened with sprayed glass fiber reinforced polymers. 2004.
[173] Talukdar S, Banthia N. Performance of Sprayed Fiber Reinforced Polymer Strengthened
Timber Beams 2010;2010. doi:10.1155/2010/498378.
[174] Banthia N, Nandakumar N, Boyd AJ. Sprayed Fiber-Reinforced Polymers: From Laboratory
to a Real Bridge. Concr Int 2002;24:47–52.
[175] Boutier S, Fourel J, Sanial P. How to make a choice between liquid composite molding
processes ? 9th Int. Conf. Flow Process. Compos. Mater., vol. 9, 2008.
[176] ASTM D3039/D3039M-14. Standard Test Method for Tensile Properties of Polymer Matrix
Composite Materials. ASTM Int n.d. doi:10.1520/D3039.
[177] ASTM C305-12. Standard Practice for Mechanical Mixing of Hydraulic Cement Pastes and
Mortars of Plastic Consistency. ASTM Int n.d. doi:10.1520/C0305-12.2.
[178] Kim DJ, El-Tawil S, Naaman AE. Rate-dependent tensile behavior of high performance fiber
reinforced cementitious composites. Mater Struct 2009;42:399–414. doi:10.1617/s11527-
008-9390-x.
[179] ASTM C1609/C1609M-12. Standard Test Method for Flexural Performance of Fiber-
Reinforced Concrete (Using Beam With Third-Point Loading). ASTM Int n.d.
doi:10.1520/C1609.
[180] ASTM C192/C192M-06. Standard Practice for Making and Curing Concrete Test Specimens
in the Laboratory. ASTM Int 2006;04:3–10.
[181] Green Release website n.d. http://www.greenrelease.ca/ (accessed March 15, 2015).
[182] Pakravan HR, Jamshidi M, Latifi M, Chehimi MM. Polymeric fibre adhesion to the
cementitious matrix related to the fibres type , water to cement ratio and curing time. Int J
Adhes Adhes 2012;35:102–7. doi:10.1016/j.ijadhadh.2012.02.006.

147
[183] Gray RJ, Johnston CD. The influence of fibre-matrix interfacial bond strength on the
mechanical properties of steel fibre reinforced mortars. Int J Cem Compos Light Concr
1987;9:43–55. doi:10.1016/0262-5075(87)90036-4.
[184] Marzouk HM, Hussein A. Properties of High Strength Concrete at Low Temperatures. ACI
Mater J 1991:167–71.
[185] Rostasy FS, Wiedemann G, Schneider U. Behaviour of mortar and concrete at extremely low
temperatures. Cem Concr Res 1979;9:365–76.
[186] Lee G, Shih T, Chang K. Mechanical properties of concrete at low temperatures. J Cold Reg
Eng 1988;2:13–24.
[187] Kim M, Kang S, Kim C. Tensile response of graphite / epoxy composites at low temperatures.
Compos Struct 2007;79:84–9. doi:10.1016/j.compstruct.2005.11.031.
[188] McElroy DL, Weaver FJ, Bridgman C. Thermal expansion of epoxy-fiberglass composite
specimens. Int J Thermophys 1988;9:233–43. doi:10.1007/BF00504243.
[189] Fu HC, Erki M a, Seckin M. Review of effects of loading rate on reinforced concrete. J Struct
Eng 1991;117:3660–79.
[190] Fu HC, Erki MA, Seckin M. Review of effects of loadding rate on concrete in compression.
J Struct Eng 1991;117:3645–59.
[191] Banthia N, Trottier J. Deformed steel fiber-cementitious matrix bond under impact. Cem
Concr Res 1991;21:158–68. doi:10.1016/0008-8846(91)90042-G.
[192] Bindiganavile V, Banthia N. Impact response of the fiber-matrix bond in concrete. Can J Civ
Eng 2005;32:924–33. doi:10.1139/l05-039.
[193] Kim DJ, El-Tawil S, Naaman AE. Loading rate effect on pullout behavior of deformed steel
fibers. ACI Mater J 2008;105:576–84.
[194] Naik NK, Yernamma P, Thoram NM, Gadipatri R, Kavala VR. High strain rate tensile
behavior of woven fabric E-glass/epoxy composite. Polym Test 2010;29:14–22.
doi:10.1016/j.polymertesting.2009.08.010.
[195] Shokrieh MM, Omidi MJ. Tension behavior of unidirectional glass/epoxy composites under
different strain rates. Compos Struct 2009;88:595–601.
doi:10.1016/j.compstruct.2008.06.012.
[196] Gilat A, Goldberg RK, Roberts GD. Experimental study of strain-rate-dependent behavior of
carbon/epoxy composite. Compos Sci Technol 2002;62:1469–76. doi:10.1016/S0266-
3538(02)00100-8.
[197] Wang S, Li VC. Polyvinyl alcohol fiber reinforced engineered cementitious composites:
material design and performances. In: Fischer G, Li VC, editors. Int. RILEM Work. HPFRCC
Struct. Appl., RILEM Publicatinos SARL; 2005, p. 65–73.
[198] Banthia N, Krishnadev MR. Steel fiber cementitious matrix load relaxation studies using a
screw driven testing machine. Exp Tech 1990;14:41–3.
[199] Banthia N, Pigeon M. Load relaxation in steel fibres embedded in cement matrices. Int J
Cem Compos Light Concr 1989;11:229–34. doi:10.1016/0262-5075(89)90103-6.

148
[200] Loos AC, Springer GS, Sanders B a., Tung RW. Moisture Absorption of Polyester-E Glass
Composites. J Compos Mater 1980;14:142–54. doi:10.1177/002199838001400206.
[201] Assarar M, Scida D, El Mahi A, Poilane C, Ayad R. Influence of water ageing on mechanical
properties and damage events of two reinforced composite materials: Flax-fibres and glass-
fibres. Mater Des 2011;32:788–95. doi:10.1016/j.matdes.2010.07.024.
[202] Wei B, Cao H, Song S. Degradation of basalt fibre and glass fibre/epoxy resin composites in
seawater. Corros Sci 2011;53:426–31. doi:10.1016/j.corsci.2010.09.053.
[203] Alani AM, Beckett D. Mechanical properties of a large scale synthetic fibre reinforced
concrete ground slab. Constr Build Mater 2013;41:335–44.
doi:10.1016/j.conbuildmat.2012.11.043.
[204] Won J-P, Jang C-I, Lee S-W, Lee S-J, Kim H-Y. Long-term performance of recycled PET fibre-
reinforced cement composites. Constr Build Mater 2010;24:660–5.
doi:10.1016/j.conbuildmat.2009.11.003.
[205] Fraternali F, Spadea S, Berardi VP. Effects of recycled PET fibres on the mechanical properties
and seawater curing of Portland cement-based concretes. Constr Build Mater 2014;61:293–
302. doi:10.1016/j.conbuildmat.2014.03.019.
[206] Alamshahi V, Taeb A, Ghaffarzadeh R, Rezaee MA. Effect of composition and length of PP
and polyester fibres on mechanical properties of cement based composites. Constr Build
Mater 2012;36:534–7. doi:10.1016/j.conbuildmat.2012.06.005.
[207] da Costa HM, Ramos VD, de Oliveira MG. Degradation of polypropylene (PP) during
multiple extrusions: Thermal analysis, mechanical properties and analysis of variance. Polym
Test 2007;26:676–84. doi:10.1016/j.polymertesting.2007.04.003.
[208] Ha KH, Kim MS. Application to refrigerator plastics by mechanical recycling from
polypropylene in waste-appliances. Mater Des 2012;34:252–7.
doi:10.1016/j.matdes.2011.08.014.
Copyright © 2022 FDOKUMEN