Ultrahigh-Speed Optical Coherence Tomography for Three-Dimensional and En Face Imaging of the Retina...
17
Ultrahigh-Speed Optical Coherence Tomography for Three- Dimensional and En Face Imaging of the Retina and Optic Nerve Head Vivek J. Srinivasan 1 , Desmond C. Adler 1 , Yueli Chen 1,2 , Iwona Gorczynska 1,2 , Robert Huber 1,3 , Jay S. Duker 2 , Joel S. Schuman 4 , and James G. Fujimoto 1 1 Department of Electrical Engineering and Computer Science and Research Laboratory of Electronics, Massachusetts Institute of Technology, Cambridge, Massachusetts 2 New England Eye Center, Tufts Medical Center, Tufts University, Boston, Massachusetts 3 Lehrstuhl für BioMolekulare Optik, Ludwig-Maximilians-Universität München, Fakultät für Physik, Munich, Germany 4 UPMC Eye Center, Department of Ophthalmology, University of Pittsburgh, School of Medicine, Pittsburgh, Pennsylvania Abstract Purpose—To demonstrate ultrahigh-speed optical coherence tomography (OCT) imaging of the retina and optic nerve head at 249,000 axial scans per second and a wavelength of 1060 nm. To investigate methods for visualization of the retina, choroid, and optic nerve using high-density sampling enabled by improved imaging speed. Methods—A swept-source OCT retinal imaging system operating at a speed of 249,000 axial scans per second was developed. Imaging of the retina, choroid, and optic nerve were performed. Display methods such as speckle reduction, slicing along arbitrary planes, en face visualization of reflectance from specific retinal layers, and image compounding were investigated. Results—High-definition and three-dimensional (3D) imaging of the normal retina and optic nerve head were performed. Increased light penetration at 1060 nm enabled improved visualization of the choroid, lamina cribrosa, and sclera. OCT fundus images and 3D visualizations were generated with higher pixel density and less motion artifacts than standard spectral/Fourier domain OCT. En face images enabled visualization of the porous structure of the lamina cribrosa, nerve fiber layer, choroid, photoreceptors, RPE, and capillaries of the inner retina. Conclusions—Ultrahigh-speed OCT imaging of the retina and optic nerve head at 249,000 axial scans per second is possible. The improvement of ∼5 to 10× in imaging speed over commercial spectral/Fourier domain OCT technology enables higher density raster scan protocols and improved performance of en face visualization methods. The combination of the longer wavelength and ultrahigh imaging speed enables excellent visualization of the choroid, sclera, and lamina cribrosa. Corresponding author: James G. Fujimoto, Department of Electrical Engineering and Computer Science and Research Laboratory of Electronics, Massachusetts Institute of Technology 77 Massachusetts Avenue, Cambridge, MA 02139; [email protected]. Presented at the annual meeting of the Association for Research in Vision and Ophthalmology, Fort Lauderdale, Florida, May 2007. Disclosure: V.J. Srinivasan, None; D.C. Adler, None; Y. Chen, None; I. Gorczynska, None; R. Huber, LightLab Imaging (P); J.S. Duker, None; J.S. Schuman, Carl Zeiss Meditec (P), LightLab Imaging (P); J.G. Fujimoto, Carl Zeiss Meditec (P), LightLab Imaging (P), Optovue (C, I) NIH Public Access Author Manuscript Invest Ophthalmol Vis Sci. Author manuscript; available in PMC 2009 September 14. Published in final edited form as: Invest Ophthalmol Vis Sci. 2008 November ; 49(11): 5103–5110. doi:10.1167/iovs.08-2127. NIH-PA Author Manuscript NIH-PA Author Manuscript NIH-PA Author Manuscript
-
Upload
independent -
Category
Documents
-
view
2 -
download
0
Transcript of Ultrahigh-Speed Optical Coherence Tomography for Three-Dimensional and En Face Imaging of the Retina...
Ultrahigh-Speed Optical Coherence Tomography for Three-Dimensional and En Face Imaging of the Retina and Optic NerveHead
Vivek J. Srinivasan1, Desmond C. Adler1, Yueli Chen1,2, Iwona Gorczynska1,2, RobertHuber1,3, Jay S. Duker2, Joel S. Schuman4, and James G. Fujimoto11Department of Electrical Engineering and Computer Science and Research Laboratory ofElectronics, Massachusetts Institute of Technology, Cambridge, Massachusetts2New England Eye Center, Tufts Medical Center, Tufts University, Boston, Massachusetts3Lehrstuhl für BioMolekulare Optik, Ludwig-Maximilians-Universität München, Fakultät für Physik,Munich, Germany4UPMC Eye Center, Department of Ophthalmology, University of Pittsburgh, School of Medicine,Pittsburgh, Pennsylvania
AbstractPurpose—To demonstrate ultrahigh-speed optical coherence tomography (OCT) imaging of theretina and optic nerve head at 249,000 axial scans per second and a wavelength of 1060 nm. Toinvestigate methods for visualization of the retina, choroid, and optic nerve using high-densitysampling enabled by improved imaging speed.
Methods—A swept-source OCT retinal imaging system operating at a speed of 249,000 axial scansper second was developed. Imaging of the retina, choroid, and optic nerve were performed. Displaymethods such as speckle reduction, slicing along arbitrary planes, en face visualization of reflectancefrom specific retinal layers, and image compounding were investigated.
Results—High-definition and three-dimensional (3D) imaging of the normal retina and optic nervehead were performed. Increased light penetration at 1060 nm enabled improved visualization of thechoroid, lamina cribrosa, and sclera. OCT fundus images and 3D visualizations were generated withhigher pixel density and less motion artifacts than standard spectral/Fourier domain OCT. En faceimages enabled visualization of the porous structure of the lamina cribrosa, nerve fiber layer, choroid,photoreceptors, RPE, and capillaries of the inner retina.
Conclusions—Ultrahigh-speed OCT imaging of the retina and optic nerve head at 249,000 axialscans per second is possible. The improvement of ∼5 to 10× in imaging speed over commercialspectral/Fourier domain OCT technology enables higher density raster scan protocols and improvedperformance of en face visualization methods. The combination of the longer wavelength andultrahigh imaging speed enables excellent visualization of the choroid, sclera, and lamina cribrosa.
Corresponding author: James G. Fujimoto, Department of Electrical Engineering and Computer Science and Research Laboratory ofElectronics, Massachusetts Institute of Technology 77 Massachusetts Avenue, Cambridge, MA 02139; [email protected] at the annual meeting of the Association for Research in Vision and Ophthalmology, Fort Lauderdale, Florida, May 2007.Disclosure: V.J. Srinivasan, None; D.C. Adler, None; Y. Chen, None; I. Gorczynska, None; R. Huber, LightLab Imaging (P); J.S.Duker, None; J.S. Schuman, Carl Zeiss Meditec (P), LightLab Imaging (P); J.G. Fujimoto, Carl Zeiss Meditec (P), LightLab Imaging(P), Optovue (C, I)
NIH Public AccessAuthor ManuscriptInvest Ophthalmol Vis Sci. Author manuscript; available in PMC 2009 September 14.
Published in final edited form as:Invest Ophthalmol Vis Sci. 2008 November ; 49(11): 5103–5110. doi:10.1167/iovs.08-2127.
NIH
-PA Author Manuscript
NIH
-PA Author Manuscript
NIH
-PA Author Manuscript

Optical coherence tomography (OCT) is an emerging optical imaging modality for biomedicalresearch and clinical medicine.1 In the eye, OCT can provide detailed images of retinal diseasesincluding diabetic retinopathy, age-related macular degeneration, and glaucoma.2,3 Thecommercial StratusOCT instrument (Carl Zeiss Meditec, Inc., Dublin, CA), with 8- to 10-μmaxial image resolution, has become a standard in the diagnosis and monitoring of diseases suchas wet age-related macular degeneration, diabetic macular edema, and glaucoma.
Recent work in the field of ophthalmic OCT has demonstrated that spectral/Fourier domaindetection methods4–7 enable OCT imaging with dramatically improved speed and sensitivityover conventional time domain methods.8–10 Spectral/Fourier domain OCT uses a broadbandlight source and a spectrometer to measure the interference spectrum. Light backscattered orbackreflected from different positions in the sample is measured simultaneously, rather thansequentially, improving the imaging speed. The improved speed enables three-dimensional(3D) and high-definition imaging of the retina and enhanced visualization of retinal diseases.11–14 Several companies have developed clinical spectral/Fourier domain OCT instrumentsfor retinal imaging. These instruments operate at speeds of 20,000 to 40,000 axial scans persecond, 50 to 100 times faster than previous OCT instruments.
Despite the dramatically improved performance of spectral/Fourier domain OCT, there areseveral important limitations. First, spectral/Fourier domain detection utilizes a high-speedcamera and spectrometer for detection, which increases system size and complexity. Second,because of spectrometer and camera resolution limits, detection sensitivity and axial resolutionchange as a function of axial position or imaging depth.7,8,15 This sensitivity decrease mayadversely affect the reproducibility of quantitative measurements. Finally, spectrometer lossesand camera read out rates limit the maximum imaging speed.
Therefore, although 3D imaging with spectral/Fourier domain OCT is possible, motion artifactsprevent reliable acquisition of 3D data sets when high sampling density is desired. For example,at an acquisition speed of 25,000 axial scans per second, a raster scan of the macula consistingof 512 × 512 axial scans would require >10 seconds. Current ophthalmic systems solve thisproblem by sacrificing sampling density along one axis of the raster scan or individuallyacquiring densely sampled data sets from different portions of the retina. The first approachdoes not adequately sample the retina, and the second approach requires the precise acquisitionand registration of multiple data sets, which may be time-consuming and cumbersome insubjects with poor fixation. Some commercially available, high-end OCT instruments provideactive eye motion tracking that enables long acquisition times and high-density data sets.However, eye tracking requires an additional optical system to determine eye motion andactuators to correct for eye motion, both of which increase system complexity and cost.
Swept-source OCT10,16–19 is another approach for high-speed OCT imaging which possessesspeed and sensitivity advantages similar to those of spectral/Fourier domain OCT. Bothmethods measure interference as a function of optical frequency or wavelength. However,swept-source OCT uses a frequency swept laser that enables measurement of interference atdifferent optical frequencies or wavelengths sequentially over time. Swept-source OCTimaging of the retina was first demonstrated in 2006 at 18,800 axial scans per second and 14-μm axial resolution in air, using a 1050-nm frequency swept laser.20 Swept-source OCTimaging of the human retina was also demonstrated at 43,200 axial scans per second and 13μm axial resolution in air, using an 850-nm frequency swept laser,21 and 16,000 axial scansper second and 9.5-μm axial resolution in air using an 850-nm frequency swept laser.22
Recently, swept-source OCT imaging of the human retina was demonstrated at 28,000 axialscans per second and 14.4-μm axial resolution in air with a 1050-nm frequency swept laser.23 Our group previously demonstrated swept-source OCT imaging at 236,000 axial scans persecond and 19-μm axial resolution in air with a 1060-nm Fourier domain mode locked (FDML)
Srinivasan et al. Page 2
Invest Ophthalmol Vis Sci. Author manuscript; available in PMC 2009 September 14.
NIH
-PA Author Manuscript
NIH
-PA Author Manuscript
NIH
-PA Author Manuscript

frequency swept laser.24 In this article, OCT imaging of the retina and optic nerve head at249,000 axial scans per second and 11-μm axial resolution in air (8 μm in the retina) aredemonstrated.
MethodsFigure 1A illustrates the concept of swept-source OCT. An optical frequency sweep is incidenton the Michelson interferometer and split between the sample and reference arms. In thisexample, the optical frequency varies linearly over time. Because of the path length difference2ΔL between the two arms of the interferometer, the frequency sweep reflected from the samplearm (Fig. 1, dotted line) is delayed relative to the frequency sweep reflected from the referencearm (Fig. 1, dashed line). The two frequency sweeps interfere on the detector, which detectsthe average intensity as a function of time. Because the two frequency sweeps are delayed withrespect to each other, there is a frequency difference between light from the sample arm andlight from the reference arm, which results in a beat frequency in the intensity. For a linearfrequency sweep, the beat frequency is proportional to the path length delay; therefore, theecho time delay can be measured by Fourier transforming this beat frequency signal.
All frequency swept lasers consist of a gain element, a tunable filter, and a feedbackmechanism. For conventional swept laser designs, the sweep speed is limited because whenthe laser is tuned to a new frequency, it is necessary to build up lasing from amplifiedspontaneous emission at the new frequency and attenuate light at the old frequency.25 Toovercome these limitations, a new approach called Fourier domain mode locking (FDML) hasbeen developed that enables a dramatic increase in OCT imaging speeds.26 FDML lasersachieve improved performance compared with conventional swept lasers by using an opticalfiber delay line in the laser cavity and synchronizing the sweep speed of the tunable filter inthe laser to the roundtrip time of the light inside the laser cavity.
Figure 1B shows a schematic of the FDML laser. A fiberoptic Fabry-Perot tunable filter (FFP-TF; Micron Optics, Inc. Atlanta, GA) with a line width of 0.08 nm is used to filter the lightpropagating in the cavity. A semiconductor optical amplifier (InPhenix, Livermore, CA) isused as the gain element; 825 m of optical fiber is used as the cavity. The fiber is on a spool,and the entire laser can be made compact. The filter is tuned at the round-trip frequency of∼124.5 kHz. As described previously, the semiconductor optical amplifier (SOA) is turned offduring the forward (short- to long-wavelength) sweep, and an extra-cavity unbalanced Mach-Zehnder is used to double the repetition rate.24 The new features of the laser reported hereininclude the sigma ring cavity with a Faraday mirror (FM) and circulator (CIRC), and theintracavity unbalanced Mach-Zehnder. This new design enables improved noise performance,stability, and image quality, as well as improved imaging speed and resolution.
The OCT system schematic is shown in Figure 1C. The frequency sweep is split between theOCT interferometer, a reference Mach-Zehnder interferometer (MZI) used to recalibrate theacquired fringes in software, and an optical spectrum analyzer (OSA), used to monitor the time-averaged spectrum. The OCT interferometer consists of a slit lamp platform for imaging theretina and a reference path. Dual-balanced detection was used to cancel excess intensity noise.To enable continuous data acquisition, the 14-bit, 200-MHz acquisition card (GaGeCompuScope 14,200) was triggered only once at the beginning of data acquisition to eliminatethe downtime required for trigger rearming. The long record was divided into individual sweepsby postprocessing software. The axial resolution was 11 μm in air (8 μm in tissue), and thesensitivity was 91 dB for an incident power of 1.2 mW. The incident exposure levels wereconsistent with the safe exposure determined by ANSI standards.
Srinivasan et al. Page 3
Invest Ophthalmol Vis Sci. Author manuscript; available in PMC 2009 September 14.
NIH
-PA Author Manuscript
NIH
-PA Author Manuscript
NIH
-PA Author Manuscript

For this study, two normal subjects (one 27-year-old man and one 35-year-old man) wereimaged at the Massachusetts Institute of Technology (MIT). The study was approved by theMIT Institutional Review Board. Written informed consent was obtained from all subjectsbefore OCT imaging was performed. The research adhered to the tenets of the Declaration ofHelsinki.
Several scan protocols were used. The first generated single high-definition cross-sectionalimages with 16,000 axial scans. Each image could be acquired in approximately 0.064 seconds.The second was a 3D raster pattern with 512 images × 425 axial scans per frame and required1 second. The third was a 3D raster pattern with 512 images × 850 axial scans per image andrequired 2 seconds. For raster scans, the fast scan axis was the horizontal (temporal-nasal) one,and the slow axis was the vertical (inferior-superior) one. In addition, imaging was performedwith two different transverse resolutions, by using two different ocular lenses with focal lengthsof 25 and 50 mm, resulting in beam diameters of 1.4 and 2.9 mm on the cornea, respectively.For the 1.4-mm beam diameter, the transverse resolution for retinal imaging was approximately21 μm, whereas for the 2.9-mm beam diameter, the transverse resolution was approximately10 to 15 μm, depending on the ocular aberrations.27 The captions for Figures 2–7 indicate thebeam diameter and scan protocol used.
Various visualization and image processing methods were investigated for viewing retinalanatomy. Three-dimensional rendering, image slicing at arbitrary planes, filtering to reducespeckle, and en face visualization of selected retinal layers were investigated. Three-dimensional rendering and image slicing were performed (Amira 3.1; Mercury ComputerSystems, Inc., Chelmsford, MA) rendering software. For raster scans of the macula and opticnerve head, 3D OCT data sets were corrected for axial motion by cross-correlation ofconsecutive images from the raster scan. Axial motion during acquisition of a single cross-sectional image was assumed to be negligible.
For en face visualization, the inner segment/outer segment junction (IS/OS) and vitreoretinalinterface were first detected by software. The nerve fiber layer (NFL) around the fovea wasvisualized by computing the median reflectance from the vitreoretinal interface to the region30-μm posterior to the vitreoretinal interface. The retinal vessels in the ganglion cell layer(GCL) were visualized by using a surface to approximate the contour of the ganglion cell layer.To compute the retinal vessel image, each axial scan was multiplied by a Gaussian window(σ = 25 μm) centered on this layer, and a maximum projection filter was applied along the axialdirection. The capillaries of the inner nuclear layer were visualized by using a surface toapproximate the contour of the inner nuclear layer. To compute the capillary image, each axialscan was multiplied by a Gaussian window (σ = 25 μm) centered on this layer, and a maximumprojection filter was applied along the axial direction. The foveal avascular zone was detectedbased on the foveal contour and excluded from the image. The photoreceptors, RPE, andchoroid were also visualized by axial integration over the corresponding regions.20 Specklereduction was accomplished by up-sampling the complex images from a 3D OCT data set inthe axial direction by a factor of 4, computing the absolute value, correlating consecutive framesto remove relative displacements, and forming a filtered image consisting of the median of theabsolute values of the individual images.
ResultsFigure 2 shows high definition images of the retina consisting of 16,000 axial scans per image.The foveal image (Fig. 2A) shows all major retinal layers. The image of the optic nerve head(Fig. 2B) shows light penetration to the deeper structures of the optic nerve head. Both imagesshow excellent visualization of the choroid. Figure 3 shows 3D OCT fundus imaging,28–30
and image slicing along arbitrary planes, with and without motion correction. Figure 3A shows
Srinivasan et al. Page 4
Invest Ophthalmol Vis Sci. Author manuscript; available in PMC 2009 September 14.
NIH
-PA Author Manuscript
NIH
-PA Author Manuscript
NIH
-PA Author Manuscript

an OCT fundus image of the macular region, exhibiting no apparent transverse motion artifacts.Figure 3B shows a nasal–temporal image, parallel to the fast axis of the raster scan, whichtakes approximately 0.0034 seconds to acquire. Because of the rapid acquisition, no axialmotion artifacts are visible. Figure 3C shows an orthogonal slice through the 3D OCT dataalong the inferior–superior direction, parallel to the slow axis of the raster scan. Axial motionartifacts are evident. Figure 3D shows the same image after high-frequency motion correction.Although this image is interpolated from the 3D OCT data set, the high sampling density yieldsan image comparable to the fast axis image (Fig. 3B). Figure 3E shows an OCT fundus imageof the optic nerve head, without motion correction, again exhibiting no apparent transversemotion artifacts. Figure 3F shows an oblique slice through the 3D OCT data set, after correctingfor axial motion.
Figure 4 shows en face visualization of the inner retina. A foveal image (Fig. 4A) and parafovealimage (Fig. 4B) are shown with the boundaries delineated. By using the boundaries to processthe 3D OCT data set, as described in the Methods section, the NFL (Fig. 4C, 4F), GCL vessels(Fig. 4D, 4G), and inner nuclear layer capillaries (Fig. 4E, 4H) are visualized. Figure 5 showsen face visualization of the outer retina and choroid. An OCT cross-sectional image is shownwith a white line outlining the contour of Bruch's membrane (Fig. 5A). Different layers arevisualized by axial integration of the signal amplitude over different ranges relative to thiscontour (Figs. 5B–D). Figure 6 shows the effects of image compounding by median filtering.While intraretinal layers are visible in a single cross-sectional image (Fig. 6A), they are notclearly delineated due to speckle. The results of compounding of 2 (Fig. 6B), 6 (Fig. 6C), and12 (Fig. 6D) images are shown. Although a significant improvement is seen betweencompounding one image (Fig. 6A) and compounding two images (Fig. 6B), after compoundingsix images (Fig. 6C) a point of diminishing returns is reached. Little difference is seen between6 (Fig. 6C) and 12 (Fig. 6D) images.
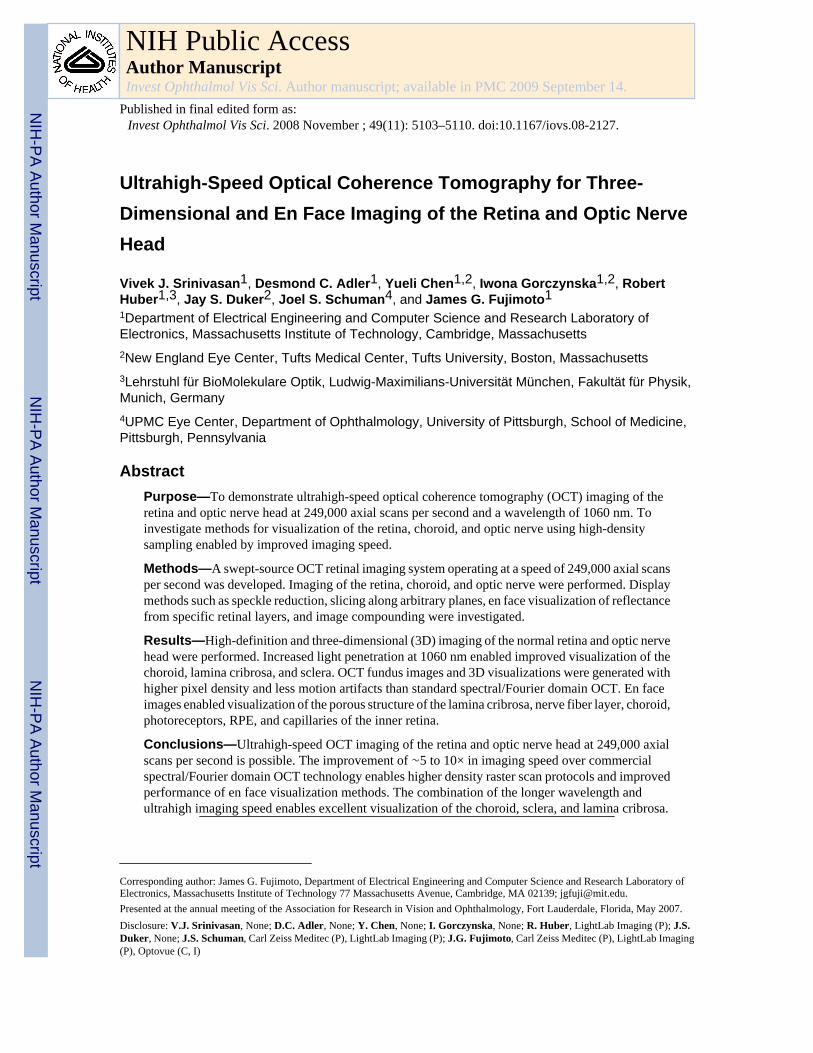
Figures 7A–B show visualization of the lamina cribrosa by interpolating 3D OCT data ontoen face planes. Figure 7B shows a trend of decreasing pore size with increasing depth relativeto the RPE, larger pore size in the superior and inferior portions of the lamina relative to theother portions, and increasing pore size with increasing distance from the center of the opticdisc. All trends are consistent with known anatomy.31,32 Figure 7C shows a single image fromthe median filtering six consecutive images along the slow axis. The lamina cribrosa (LC) isclearly visible in this cross-sectional image.
DiscussionAlthough spectral/Fourier domain OCT technology operates at speeds of 20,000 to 40,000axial scans per second, imaging performance is limited in practice by the relatively long timesneeded to acquire dense 3D OCT data sets. In this study, OCT imaging speeds of 249,000 axialscans per second were demonstrated, which is almost an order of magnitude faster thancommercial spectral/Fourier domain OCT systems.
Several papers have demonstrated applications of high-speed imaging including 3D imaging,high-definition imaging, and quantitative mapping.11–14,33 The advances in imaging speedreported herein have the potential to improve the performance of these scan protocols in theophthalmology clinic. The demonstrated improvements in imaging speed will reduce motionartifacts significantly in patients with tear film dysfunction, short attention, excessive blinking,or gross tremor. The 1060-nm center wavelength should improve imaging through dense oropaque media, and enhance visualization of the choroid, an effect first demonstrated with time-domain OCT34,35 and later with spectral/Fourier domain OCT.36 An added benefit of the longerwavelength is that the beam scanning on the retina is virtually invisible to the subject andtherefore does not pose a distraction. Although water absorption in the ocular media has the
Srinivasan et al. Page 5
Invest Ophthalmol Vis Sci. Author manuscript; available in PMC 2009 September 14.
NIH
-PA Author Manuscript
NIH
-PA Author Manuscript
NIH
-PA Author Manuscript

potential to reduce sensitivity for retinal imaging, permissible exposure levels are higher at1060 nm compared with 800 nm and help to offset water absorption.
In addition to improving performance of existing scan patterns, the advances in imaging speedpresented herein enable very dense raster scanning protocols. The OCT fundus image generatedfrom these dense raster scanning protocol has excellent quality due to the high transverse pixeldensity, as shown in Figures 3A and 3E. The results illustrate that axial motion is present in3D OCT data sets (Fig. 3C). However, with axial motion correction it is possible to achievehigh quality cross-sections at any orientation (Figs. 3D, 3F).
3D OCT data sets in Figure 3 were corrected for axial motion by cross-correlation ofconsecutive images from the raster scan. This approach is similar to the approach of theStratusOCT instrument, which cross-correlates consecutive axial scans. Cross-correlation ofconsecutive images improves motion correction compared with correlation of consecutiveaxial scans. In an ultrahigh-speed, densely sampled 3D OCT data set, consecutive images areacquired in a short period and are highly correlated due to their close transverse spacing. Cross-correlation corrects local motion artifacts well, effectively removing undulations in thevitreoretinal interface and RPE caused by eye motion, as shown in Figures 3D and 3F.However, cross-correlation may not recover the larger scale retinal contour in the verticaldirection. Retinal contour is preserved in the horizontal direction, because the imaging speedis so rapid that negligible eye motion occurs during acquisition of a single cross-sectionalimage. Alternative approaches to motion correction are possible, such as the use of verticalregistration scans perpendicular to the fast horizontal axis of the raster scan. In the future, theperformance of different eye motion correction algorithms must be clinically validated in eyeswith retinal diseases.
Image compounding by median filtering can be used to reduce speckle and improvevisualization of the outer retina as shown in Figure 6. In addition, it can be used to improvevisualization of deeper structures in the optic nerve head, such as the lamina cribrosa (Fig. 7C).Although previous studies have demonstrated the use of retinal tracking and image averagingto reduce speckle,37 they depend on small eye movements to decorrelate speckle in multipleimages. In this study, due to the ultrahigh imaging speed, multiple images can be rapidlyacquired at different transverse positions before the eye has moved significantly, which shouldenable more controlled and repeatable speckle reduction.
The 3D data can also be processed in various ways to generate en face images. High-qualityen face visualizations require very high-density 3D OCT data sets since each pixel in the enface image requires one axial scan. The advantage of en face images is that they condenseinformation from the 3D OCT data set, and enable assessment of microstructure which wouldnot otherwise be visible. En face visualization of the NFL bundles (Figs. 4C, F), GCL vessels(Figs. 4D, G), INL capillary network (Figs. 4E, 4H), photoreceptors and RPE (Fig. 5B), choroid(Figs. 5C, 5D) and the lamina cribrosa (Fig. 7B) was demonstrated. In addition to this study,previous spectral/Fourier domain OCT studies have demonstrated similar methods of en facevisualization of individual retinal layers12,20,30,38 (Ishikawa H, et al. IOVS 2008;49:ARVO E-Abstract 1886). These methods differ from traditional en face OCT, which is a time-domainmethod providing en face images of the retina.39–43 En face OCT typically acquires individualtransverse priority images at one axial depth, which may intersect multiple layers of the retinadepending on how the retina is tilted. Swept source/Fourier domain OCT imaging speed enablesacquisition of a densely sampled volumetric data set that can be processed to create en faceimages by using flexible image-processing methods to increase the contrast of or selectivelydisplay the layers of interest.
Srinivasan et al. Page 6
Invest Ophthalmol Vis Sci. Author manuscript; available in PMC 2009 September 14.
NIH
-PA Author Manuscript
NIH
-PA Author Manuscript
NIH
-PA Author Manuscript

One hypothesis for the pathogenesis of glaucoma is that intraocular pressure causes stress andstrain resulting in mechanical failure of the connective tissues of the lamina cribrosa, scleralcanal wall, and peripapillary sclera.44 Therefore, in vivo measurements of the lamina cribrosaand connective tissues may aid in the understanding of glaucoma pathogenesis. Our resultsshow that the longer wavelength and capability for image compounding enabled by ultrahighimaging speeds may improve visualization of these structures.
Typically, the lamina cribrosa is not visible in normal eyes in standard fundus photographs. Inglaucoma, neural damage exposes more of the lamina cribrosa surface, which makes the laminafunduscopically visible. This enables quantification of parameters such as pore size and shapein standard clinical photographs. A recent longitudinal study showed that individual pore size(mean pore-to-disc area ratio) decreased between baseline and follow-up (3.9 ± 0.7 years)measurements of glaucomatous eyes.45 Although it is possible to evaluate the inner surface ofthe lamina cribrosa funduscopically, the outer layers of this structure may have differentmorphology. Therefore, a method of 3D imaging is required. In addition, it is desirable tovisualize structures such as the scleral canal and flange tissue, the sclera, and pial sheath.46
This requires an imaging method with high sensitivity and capability to image the deeperportions of the sclera and lamina cribrosa.
Scanning laser ophthalmoscopes (SLO) have been used to perform morphometricmeasurements on the lamina cribrosa in normal and glaucomatous eyes.47–49 The SLO usesconfocal detection to suppress light backscattered from axial positions outside of the focalplane. With standard implementations of this technology, confocality is limited by ocularaberrations. The adaptive optics SLO has therefore been used to achieve improved axial(longitudinal) resolution and image contrast in the presence of ocular aberrations.50 OCT, bycomparison, achieves axial resolution by using low coherence interferometry, and typicallyachieves larger penetration depths than confocal detection alone. The lamina cribrosa has beenvisualized using en face OCT with dynamic focusing.51 Although this method achieves highspeed and transverse resolution, consecutive en face images may not be precisely registereddue to axial eye motion, and therefore 3D morphology is difficult to assess. The 3D imagingcapability demonstrated herein enables visualization of the laminar morphology at depthsprecisely registered to the RPE (Fig. 7B), which may eventually facilitate quantitativevolumetric measurements.
Although motion artifacts are reduced at imaging speeds of 249,000 axial scans per second,the data sets are still not free from eye motion. Eye motion can result from tremor, drifts, andmicrosaccades.52 Tremor and drifts have small amplitudes of <50 μm, whereas microsaccadescan cause rapid displacements of several hundred micrometers in 25 ms. Microsaccadesgenerally occur at <5-Hz frequency, but are dependant on conditions. Axial motion is alsoclearly present in the 3D OCT data sets, as shown in Figure 3C. Therefore, furtherimprovements in imaging speed are desirable to reduce motion artifacts. By increasinginterferometer detection efficiency and increasing the average power incident on the cornea toapproximately 3.3 mW35 swept-source OCT technology will scale to 500,000 to 1,000,000axial scans per second with comparable sensitivity. Presently, higher speed line scan CCDcameras are becoming available with speeds of 300 kHz, and therefore spectral/Fourier domainOCT may be an alternative method of achieving ultrahigh imaging speeds. However, swept-source OCT has the potential to achieve more efficient detection and better sensitivity, whichmay ultimately make it the preferred technology for imaging at very high speeds.
In conclusion, OCT imaging of the retina was demonstrated at 249,000 axial scans per second,a factor of ∼5 to 10 times higher speed than commercial spectral/Fourier domain OCTtechnology. The results presented herein demonstrate that high-quality imaging of the retinais possible even at ultrahigh imaging speeds. The ultrahigh imaging speeds enable high-density
Srinivasan et al. Page 7
Invest Ophthalmol Vis Sci. Author manuscript; available in PMC 2009 September 14.
NIH
-PA Author Manuscript
NIH
-PA Author Manuscript
NIH
-PA Author Manuscript

sampling for improved en face visualization of the architectural morphology of the retina andoptic nerve head such as the nerve fiber layer bundles, intraretinal layer blood vessels andcapillary network, photoreceptors, RPE, and the lamina cribrosa. The combination of the longerwavelength and ultrahigh imaging speed enables excellent visualization of the choroid, sclera,and lamina cribrosa.
AcknowledgmentsSupported by National Eye Institute Grants R01-EY11289-21, R01-EY13178-07, and P30-EY008098; NationalScience Foundation Grant BES-0522845; Air Force Office of Scientific Research, Medical Free Electron LaserProgram Contract FA9550-07-1-0101; Massachusetts Lions Eye Research Fund; The Eye and Ear Foundation ofPittsburgh; and a Research to Prevent Blindness unrestricted grant. VS was supported by a National Science FoundationGraduate Research Fellowship. DCA received support from the Natural Sciences and Engineering Research Councilof Canada. RH was supported by the Emmy Noether program of the German Foundation (DFG) HU 1006/2-1.
References1. Huang D, Swanson EA, Lin CP, et al. Optical coherence tomography. Science 1991;254(5035):1178–
1181. [PubMed: 1957169]2. Puliafito CA, Hee MR, Lin CP, et al. Imaging of macular diseases with optical coherence tomography.
Ophthalmology 1995;102(2):217–229. [PubMed: 7862410]3. Schuman, JS.; Puliafito, CA.; Fujimoto, JG. Optical Coherence Tomography of Ocular Diseases. Vol.
2nd. Thorofare, NJ: Slack Inc.; 2004.4. Fercher AF, Hitzenberger CK, Kamp G, Elzaiat SY. Measurement of intraocular distances by
backscattering spectral interferometry. Opt Commun 1995;117(1–2):43–48.5. Häusler G, Lindner MW. “Coherence radar” and “spectral radar”: new tools for dermatological
diagnosis. J Biomed Opt 1998;3(1):21–31.6. Wojtkowski M, Bajraszewski T, Targowski P, Kowalczyk A. Real-time in vivo imaging by high-speed
spectral optical coherence tomography. Opt Lett 2003;28(19):1745–1747. [PubMed: 14514087]7. Nassif NA, Cense B, Park BH, et al. In vivo high-resolution video-rate spectral-domain optical
coherence tomography of the human retina and optic nerve. Opt Express 2004;12(3):367–376.[PubMed: 19474832]
8. Leitgeb R, Hitzenberger CK, Fercher AF. Performance of Fourier domain vs. time domain opticalcoherence tomography. Opt Express 2003;11(8):889–894. [PubMed: 19461802]
9. de Boer JF, Cense B, Park BH, et al. Improved signal-to-noise ratio in spectral-domain compared withtime-domain optical coherence tomography. Opt Lett 2003;28(21):2067–2069. [PubMed: 14587817]
10. Choma MA, Sarunic MV, Yang C, Izatt J. Sensitivity advantage of swept source and Fourier domainoptical coherence tomography. Opt Express 2003;11(18):2183–2189. [PubMed: 19466106]
11. Schmidt-Erfurth U, Leitgeb RA, Michels S, et al. Three-dimensional ultrahigh-resolution opticalcoherence tomography of macular diseases. Invest Ophthalmol Vis Sci 2005;46(9):3393–3402.[PubMed: 16123444]
12. Wojtkowski M, Srinivasan V, Fujimoto JG, et al. Three-dimensional retinal imaging with high-speedultrahigh-resolution optical coherence tomography. Ophthalmology 2005;112(10):1734–1746.[PubMed: 16140383]
13. Chen TC, Cense B, Pierce MC, et al. Spectral domain optical coherence tomography: ultra-high speed,ultra-high resolution ophthalmic imaging. Arch Ophthalmol 2005;123(12):1715–1720. [PubMed:16344444]
14. Srinivasan VJ, Wojtkowski M, Witkin AJ, et al. High-definition and 3-dimensional imaging ofmacular pathologies with high-speed ultrahigh-resolution optical coherence tomography.Ophthalmology 2006;113(11):2054, e1–e14. [PubMed: 17074565]
15. Wojtkowski M, Srinivasan VJ, Ko TH, et al. Ultrahigh-resolution, high-speed, Fourier domain opticalcoherence tomography and methods for dispersion compensation. Opt Express 2004;12(11):2404–2422. [PubMed: 19475077]
Srinivasan et al. Page 8
Invest Ophthalmol Vis Sci. Author manuscript; available in PMC 2009 September 14.
NIH
-PA Author Manuscript
NIH
-PA Author Manuscript
NIH
-PA Author Manuscript

16. Golubovic B, Bouma BE, Tearney GJ, Fujimoto JG. Optical frequency-domain reflectometry usingrapid wavelength tuning of a Cr4+: forsterite laser. Opt Lett 1997;22(22):1704–1706. [PubMed:18188341]
17. Chinn SR, Swanson EA, Fujimoto JG. Optical coherence tomography using a frequency-tunableoptical source. Opt Lett 1997;22(5):340–342. [PubMed: 18183195]
18. Yun SH, Tearney GJ, de Boer JF, Iftimia N, Bouma BE. High-speed optical frequency-domainimaging. Opt Express 2003;11(22):2953–2963. [PubMed: 19471415]
19. Yun SH, Boudoux C, Pierce MC, et al. Extended-cavity semiconductor wavelength-swept laser forbiomedical imaging. IEEE Photon Technol Lett 2004;16(1):293–295.
20. Lee ECW, de Boer JF, Mujat M, Lim H, Yun SH. In vivo optical frequency domain imaging of humanretina and choroid. Opt Express 2006;14(10):4403–4411. [PubMed: 19516592]
21. Lim H, Mujat M, Kerbage C, et al. High-speed imaging of human retina in vivo with swept-sourceoptical coherence tomography. Opt Express 2006;14(26):12902–12908. [PubMed: 19532183]
22. Srinivasan VJ, Huber R, Gorczynska I, et al. High-speed, high-resolution optical coherencetomography retinal imaging with a frequency swept laser at 850 nm. Opt Lett 2007;32(4):361–363.[PubMed: 17356653]
23. Yasuno Y, Hong YJ, Makita S, et al. In vivo high-contrast imaging of deep posterior eye by 1-mu mswept source optical coherence tomography and scattering optical coherence angiography. OptExpress 2007;15(10):6121–6139. [PubMed: 19546917]
24. Huber R, Adler DC, Srinivasan VJ, Fujimoto JG. Fourier domain mode locking at 1050 nm for ultra-high-speed optical coherence tomography of the human retina at 236,000 axial scans per second. OptLett 2007;32(14):2049–2051. [PubMed: 17632639]
25. Huber R, Wojtkowski M, Taira K, Fujimoto JG, Hsu K. Amplified, frequency swept lasers forfrequency domain reflectometry and OCT imaging: design and scaling principles. Opt Express2005;13(9):3513–3528. [PubMed: 19495256]
26. Huber R, Wojtkowski M, Fujimoto JG. Fourier Domain Mode Locking (FDML): a new laser operatingregime and applications for optical coherence tomography. Opt Express 2006;14(8):3225–3237.[PubMed: 19516464]
27. Donnelly WJ, Roorda A. Optimal pupil size in the human eye for axial resolution. J Opt Soc Am AOpt Image Sci Vis 2003;20(11):2010–2015. [PubMed: 14620328]
28. Hitzenberger CK, Trost P, Pak-Wai L, Qienyuan Z. Three-dimensional imaging of the human retinaby high-speed optical coherence tomography. Opt Express 2003;11(21):2753–2761. [PubMed:19471390]
29. Wojtkowski M, Bajraszewski T, Gorczynska I, et al. Ophthalmic imaging by spectral opticalcoherence tomography. Am J Ophthalmol 2004;138(3):412–419. [PubMed: 15364223]
30. Jiao SL, Knighton R, Huang XR, Gregori G, Puliafito CA. Simultaneous acquisition of sectional andfundus ophthalmic images with spectral-domain optical coherence tomography. Opt Express 2005;13(2):444–452. [PubMed: 19488371]
31. Dandona L, Quigley HA, Brown AE, Enger C. Quantitative regional structure of the normal humanlamina cribrosa: a racial comparison. Arch Ophthalmol 1990;108(3):393–398. [PubMed: 2310342]
32. Jonas JB, Mardin CY, Schlotzer-Schrehardt U, Naumann GO. Morphometry of the human laminacribrosa surface. Invest Ophthalmol Vis Sci 1991;32(2):401–405. [PubMed: 1993592]
33. Gabriele ML, Ishikawa H, Wollstein G, et al. Peripapillary nerve fiber layer thickness profiledetermined with high speed, ultrahigh resolution optical coherence tomography high-densityscanning. Invest Ophthalmol Vis Sci 2007;48(7):3154–3160. [PubMed: 17591885]
34. Povazay B, Bizheva K, Hermann B, et al. Enhanced visualization of choroidal vessels using ultrahighresolution ophthalmic OCT at 1050 nm. Opt Express 2003;11(17):1980–1986. [PubMed: 19466083]
35. Unterhuber A, Povazay B, Hermann B, et al. In vivo retinal optical coherence tomography at 1040nm-enhanced penetration into the choroid. Opt Express 2005;13(9):3252–3258. [PubMed:19495226]
36. Povazay B, Hermann B, Unterhuber A, et al. Three-dimensional optical coherence tomography at1050 nm versus 800 nm in retinal pathologies: enhanced performance and choroidal penetration incataract patients. J Biomed Opt 2007;12(4):041211. [PubMed: 17867800]
Srinivasan et al. Page 9
Invest Ophthalmol Vis Sci. Author manuscript; available in PMC 2009 September 14.
NIH
-PA Author Manuscript
NIH
-PA Author Manuscript
NIH
-PA Author Manuscript

37. Ferguson RD, Hammer DX, Paunescu LA, Beaton S, Schuman JS. Tracking optical coherencetomography. Opt Lett 2004;29(18):2139–2141. [PubMed: 15460882]
38. Hangai M, Jima Y, Gotoh N, et al. Three-dimensional imaging of macular holes with high-speedoptical coherence tomography. Ophthalmology 2007;114(4):763–773. [PubMed: 17187861]
39. Podoleanu AG, Jackson DA. Combined optical coherence tomograph and scanning laserophthalmoscope. Electron Lett 1998;34(11):1088–1090.
40. Rogers JA, Podoleanu AG, Dobre GM, Jackson DA, Fitzke FW. Topography and volumemeasurements of the optic nerve using en-face optical coherence tomography. Opt Express 2001;9(10):533–545. [PubMed: 19424371]
41. Podoleanu AG, Dobre GM, Cucu RG, et al. Combined multiplanar optical coherence tomographyand confocal scanning ophthalmoscopy. J Biomed Opt 2004;9(1):86–93. [PubMed: 14715059]
42. Podoleanu AG, Dobre GM, Cucu RG, Rosen RB. Sequential optical coherence tomography andconfocal imaging. Opt Lett 2004;29(4):364–366. [PubMed: 14971754]
43. van Velthoven ME, Verbraak FD, Yannuzzi LA, et al. Imaging the retina by en face optical coherencetomography. Retina 2006;26(2):129–136. [PubMed: 16467666]
44. Burgoyne CF, Downs JC, Bellezza AJ, Suh JK, Hart RT. The optic nerve head as a biomechanicalstructure: a new paradigm for understanding the role of IOP-related stress and strain in thepathophysiology of glaucomatous optic nerve head damage. Prog Retin Eye Res 2005;24(1):39–73.[PubMed: 15555526]
45. Tezel G, Trinkaus K, Wax MB. Alterations in the morphology of lamina cribrosa pores inglaucomatous eyes. Br J Ophthalmol 2004;88(2):251–256. [PubMed: 14736786]
46. Burgoyne CF, Downs JC, Bellezza AJ, Hart RT. Three-dimensional reconstruction of normal andearly glaucoma monkey optic nerve head connective tissues. Invest Ophthalmol Vis Sci 2004;45(12):4388–4399. [PubMed: 15557447]
47. Bhandari A, Fontana L, Fitzke FW, Hitchings RA. Quantitative analysis of the lamina cribrosa invivo using a scanning laser ophthalmoscope. Curr Eye Res 1997;16(1):1–8. [PubMed: 9043817]
48. Fontana L, Bhandari A, Fitzke FW, Hitchings RA. In vivo morphometry of the lamina cribrosa andits relation to visual field loss in glaucoma. Curr Eye Res 1998;17(4):363–369. [PubMed: 9561827]
49. Maeda H, Nakamura M, Yamamoto M. Morphometric features of laminar pores in lamina cribrosaobserved by scanning laser ophthalmoscopy. Jpn J Ophthalmol 1999;43(5):415–421. [PubMed:10580665]
50. Vilupuru AS, Rangaswamy NV, Frishman LJ, et al. Adaptive optics scanning laser ophthalmoscopyfor in vivo imaging of lamina cribrosa. J Opt Soc Am A Opt Image Sci Vis 2007;24(5):1417–1425.[PubMed: 17429488]
51. Pircher M, Gotzinger E, Hitzenberger CK. Dynamic focus in optical coherence tomography for retinalimaging. J Biomed Opt 2006;11(5):054013. [PubMed: 17092162]
52. Martinez-Conde S, Macknik SL, Hubel DH. The role of fixational eye movements in visualperception. Nat Rev Neurosci 2004;5(3):229–240. [PubMed: 14976522]
Srinivasan et al. Page 10
Invest Ophthalmol Vis Sci. Author manuscript; available in PMC 2009 September 14.
NIH
-PA Author Manuscript
NIH
-PA Author Manuscript
NIH
-PA Author Manuscript

Figure 1.(A) Principles of swept-source OCT detection. (B) Diagram of a FDML laser used as thefrequency swept light source. (C) Schematic of interferometer and OCT data acquisition usedfor retinal imaging. PC, polarization controller; ISO, isolator; CIRC, circulator; FM, Faradaymirror; FFP-TF, fiber Fabry-Perot tunable filter; SOA, semiconductor optical amplifier; PD,photodiode; OSA, optical spectrum analyzer; MZI, Mach-Zehnder interferometer; DAQ, dataacquisition; NDF, neutral density filter.
Srinivasan et al. Page 11
Invest Ophthalmol Vis Sci. Author manuscript; available in PMC 2009 September 14.
NIH
-PA Author Manuscript
NIH
-PA Author Manuscript
NIH
-PA Author Manuscript

Figure 2.High-definition imaging of (A) the retina and (B) the optic nerve head. Beam diameter atcornea, 1.4 mm. Axial scans per image, 16,000. NFL, nerve fiber layer; GCL, ganglion celllayer; IPL, inner plexiform layer; INL, inner nuclear layer; OPL, outer plexiform layer; ONL,outer nuclear layer; ELM, external limiting membrane; IS/OS, photoreceptor inner segment/outer segment junction; PR OS, photoreceptor outer segments; RPE, retinal pigmentepithelium; CH, choroid.
Srinivasan et al. Page 12
Invest Ophthalmol Vis Sci. Author manuscript; available in PMC 2009 September 14.
NIH
-PA Author Manuscript
NIH
-PA Author Manuscript
NIH
-PA Author Manuscript

Figure 3.(A) OCT fundus image of the retina, without motion correction. (B) Slice through 3D OCTdata set along the fast axis. (C) Slice through 3D OCT data set along the slow axis, showingthe severity of axial motion. (D) Slice through 3D OCT data set along the slow axis, aftercorrecting for axial motion. (E) OCT fundus image of the optic nerve head, without motioncorrection. (F) Oblique slice through 3D OCT data set, after correcting for axial motion. Beamdiameter at cornea, 1.4 mm (A–D) and 2.9 mm (E–F). 512 × 850 axial scans.
Srinivasan et al. Page 13
Invest Ophthalmol Vis Sci. Author manuscript; available in PMC 2009 September 14.
NIH
-PA Author Manuscript
NIH
-PA Author Manuscript
NIH
-PA Author Manuscript

Figure 4.En face visualization of retinal layers. Processing a 3D OCT data set makes enhancedvisualization of individual intraretinal layers possible. (A, B) Different layers or boundariesare delineated and used to enhance visualization of anatomy. Imaging was performed over a 3× 3-mm (C–E) and a 2 × 2-mm (F–H) field of view. En face visualizations of the (C, F) nervefiber layer (NFL), (D, G) blood vessels in the ganglion cell layer (GCL), and (E, H) capillarynetwork of the inner nuclear layer (INL) is shown. Inner retinal vasculature images (D, E, G,H) are displayed with an inverted grayscale. Beam diameter at cornea, 2.9 mm. 512 × 850 axialscans.
Srinivasan et al. Page 14
Invest Ophthalmol Vis Sci. Author manuscript; available in PMC 2009 September 14.
NIH
-PA Author Manuscript
NIH
-PA Author Manuscript
NIH
-PA Author Manuscript

Figure 5.En face visualization of the outer retina and choroid in the macular region by axial integrationof 3D OCT data. (A) Cross-sectional image showing the contour of Bruch's membrane (whiteline), and the axial integration ranges for (B–D). Shown are en face images of (B) thephotoreceptors and RPE; (C) the choroid showing predominantly smaller vessels; (D) of thechoroid showing predominantly larger vessels. Beam diameter at cornea: 1.4 mm. 512 × 850axial scans.
Srinivasan et al. Page 15
Invest Ophthalmol Vis Sci. Author manuscript; available in PMC 2009 September 14.
NIH
-PA Author Manuscript
NIH
-PA Author Manuscript
NIH
-PA Author Manuscript

Figure 6.(A–D) Median filtering of OCT images improves visualization of the details of retinal layers.Although a dramatic improvement in visualization of intraretinal detail is seen by compoundingtwo images (B) versus no compounding (A), little improvement is obtained by compounding12 images (D) versus compounding 6 images (C). Beam diameter at cornea: 1.4 mm. 512 ×850 axial scans.
Srinivasan et al. Page 16
Invest Ophthalmol Vis Sci. Author manuscript; available in PMC 2009 September 14.
NIH
-PA Author Manuscript
NIH
-PA Author Manuscript
NIH
-PA Author Manuscript
Figure 7.Imaging of the lamina cribrosa. (A) Images are interpolated onto en face planes through the3D OCT data set at different depths relative to the RPE. (B) Interpolated images show theporous structure of the lamina cribrosa. Depths relative to Bruch's membrane are shown. (C)A series of six consecutive images compounded by median filtering along the slow axis showsenhanced visualization of deeper structures. The lamina cribrosa (LC) is clearly visible. Beamdiameter at cornea: 1.4 mm. 512 × 450 axial scans.
Srinivasan et al. Page 17
Invest Ophthalmol Vis Sci. Author manuscript; available in PMC 2009 September 14.
NIH
-PA Author Manuscript
NIH
-PA Author Manuscript
NIH
-PA Author Manuscript