Clozapine potentiation of GABA mediated cortical inhibition in treatment resistant schizophrenia
GABA-ergic Pathways in the Goldfish Retina ROBERT E. MARC,' * WILLIAM K. STELL,' DEAN BOK AND DOMINIC M. K. LAM ' Jules Stein Eye Institute, UCLA School of Medicine, Los Anaeles, California 90024 and Cullen Eye Institute, Baylor College of Medicine, Houston, Texas 77030
ABSTRACT A high-affinity uptake mechanism for IgH1-y-aminobutyric acid (GABA) has been localized to type H1 cone horizontal cells and type Ab pyriform amacrine cells in the retina of the goldfish by light and electron mi- croscope autoradiography. By stimulating isolated retinas with colored lights during incubation we have been able to use PHI-GABA uptake as a probe of light-evoked changes in membrane potential. All colors of lights increase and darkness decreases PHI-GABA uptake by H1 cone horizontal cells. Our model of voltage dependence of GABA uptake predicts that all colors of light should hyperpolarize H1 cone horizontal cells and other investigators have shown by intracellular recording and dye-marking that type H1 cone horizontal cells hyperpolarize to all wavelengths of light. We have also obtained evidence that dark-induced depolarization of cone horizontal cells leads to release of GABA. Type Ab pyriform amacrine cells show maximal PHI-GABA uptake in darkness and when exposed to green or blue lights, but red lights dramatically suppress uptake. We predict these neurons to be red-depolarizing, and recent intracellu- lar recordings and dye-marking by Famiglietti et al. ('77) support our conclu- sions. Synaptic relations of apparently GABA-ergic neurons were investigated in the electron microscope. We propose type H1 cone horizontal cells to be both pre- and post-synaptic to red-sensitive cones and type Ab pyriform amacrine cells to be both pre- and post-synaptic to red-sensitive center-depolarizing bipo- lar cells.
Retinal horizontal and amacrine cells are strategically positioned to influence t h e transmission of visual signals along the photo- receptor-to-bipolar cell-to-ganglion cell chain by conducting signals laterally through the outer and inner plexiform layers.
Although the circuitry of teleostean retinas is being intensively investigated by conven- tional physiological and anatomical methods, few precise correlations of physiological and anatomical data have been achieved; specific synaptic interactions, neurotransmitter iden- tities and actions, and the ultrastructures of sites of synaptic transfer are still largely unknown. This paper describes studies of the morphology and physiology of apparently GABA-ergic horizontal and amacrine cells in the goldfish retina by employing autoradi- ographic analysis of high-affinity L3H1-y- aminobutyric acid (GABA) uptake under con- trolled stimulus conditions. Our goal is to show that certain horizontal and amacrine
J. COMP. NEUR. (1978) 182: 221-246
cells may use GABA as a neurotransmitter, and to show how these neurons fit into the cir- cuitry of the cyprinid retina.
Goldfish photoreceptors include rods and morphologically distinguishable red-, green-, and blue-sensitive cones arranged in a mosaic (Marc and Sperling, '76a,b; Stell and Harosi, '76). Goldfish horizontal cells (HCs) and bipo- lar cells make color-specific contacts with cones, and morphological differences among cells within each of these neuronal classes have thus far proven to be diagnostic for spe- cific patterns of neuron-cone connectivity (Stell and Lightfoot, '75; Stell, '76; Stell et al., '77). An excellent example is the systematic variation in layering and dendritic arboriza- tion of cyprinid cone HCs that permits the division of the cell class into three functional types: type H1 contacts red-, green-, and blue-
' Present Address: University Texas Health Science Center, Sen- sory Sciences Center, 6420 Lamar Fleming Avenue, Houston. Texas 77025.
221

222 R. E. MARC, W. K. STELL, D. BOK AND D. M. K. LAM
sensitive cones and is spectrally monophasic; type H2 contacts green- and blue-sensitive cones and is spectrally biphasic; type H3 con- tacts blue-sensitive cones and is spectrally triphasic (Stell and Lightfoot, '75; Stell et al., '75; see also Mitari et al., '74; Hashimoto et al., '76). We wish to add neurochemical infor- mation in a morphological framework (via autoradiography) in order to define the con- nectivity between functionally, chemically and anatomically defined neurons in the same preparation.
Lam and Steinman ('71) demonstrated by light microscope autoradiography tha t some goldfish HCs accumulated LJHI-GABA more rapidly when incubated in the presence of a flickering white light rather than in dark- ness. This finding raised the possibility t ha t detailed autoradiographic analysis of ['HI- GABA uptake could simultaneously provide data concerning (1) the morphologies and syn- aptic connections of neurons using GABA as a neurotransmitter and (2) the physiological re- sponses of these neurons. [,'HI-GABA uptake by goldfish retinal neurons is high affinity (METHODS) and sodium-dependent (Lam and Marc, in preparation). An important feature of such a transport system is t ha t i t may exhibit voltage dependence. Briefly, high-af- finity, sodium-dependent amino acid uptake systems exhibit enhanced net observed uptake when neuronal membranes are hyperpolarized and diminished net observed uptake when neuronal membranes are depolarized. These relations a re consistent with the notion tha t uptake systems serve as inactivating mecha- nisms by rapidly clearing the synaptic cleft of neurotransmitter when depolarization of the pre-synaptic terminal ceases (Iverson, '72). Furthermore, a direct corollary of the voltage dependence of high-affinity uptake is tha t net observed uptake may indicate relative mem- brane potential: viz., high uptake levels should indicate relative hyperpolarization and low uptake levels should indicate relative depolarization. We have used autoradio- graphic analysis of [JHI-GABA uptake to de- duce some possible light-evoked changes in membrane potentials of certain retinal neu- rons.
In this paper we shall show tha t only one kind of HC (type H1) and at least one kind of amacrine cell exhibit L3H1-GABA uptake. Since uptake of [3H1-GABA by H l s and their axon terminal expansions (HlATs) is en- hanced by light of all wavelengths, H l s and
HlATs should hyperpolarize to lights of all wavelengths, i.e., their responses should be spectrally monophasic. Hashimoto e t al. ('76) and Mitari e t al. ('74) have previously shown by intracellular recording and dye injection tha t H l s and HlATs are indeed spectrally monophasic. A class of pyriform amacrine cells, which shows maximal PHI-GABA up- take in darkness and reduced uptake upon red light exposure, is consequently predicted to be red-depolarizing. Red-depolarizing amacrine cells of similar morphology have recently been described by intracellular recordings with dye injection in the retina of the carp (Famiglietti e t al., '77). These observations support our belief tha t the identities and response proper- ties of certain neurons may be investigated by analyzing stimulus-induced variations in neu- rotransmitter uptake systems.
METHODS Uptake experiments
Retinas were analyzed for light-modulated L3H]-GABA uptake by a standardized pro- cedure. Common and comet varieties of Ca- rassius auratus (10-15 cm from nose to base of tail) obtained from Ozark Fisheries, Stout- land, Missouri were maintained in an aerated aquarium and dark adapted overnight. For each experiment a n animal was killed by cer- vical transection, one eye enucleated and the anterior half removed under visualization with infra-red image converters. The elec- troretinogram (ERG) to a 2 Hz square-wave full-field 650 nm light (1 x lo5 quanta. sec- ' . pm-2) was recorded wi th Ag-AgC1- saline wick electrodes feeding into a simple DC amplifier (Analog Devices 405, gain = 100) and then into a Gould-Brush 220 re- corder. After recording the ERG for about 30 seconds the flickering red light was continued for another 30 seconds, then the retina was isolated under infra-red light and immersed in 100 pl of a salinePH1-GABA medium within a sealed chamber with 100% oxygen flowing over the surface of the mediilm. The saline contained 159 mM NaC1, 3 mM KC1, 2.2 mM CaC12, 1.8 mM MgS04, 1.4 mM NaHC03, 0.5 mM NaH,PO,, 1.6 mM glucose and 100 FCi/ml 13H1-GABA. PHI-GABA was obtained from New England Nuclear (#NET-191), dried in a Buchler flash evaporator, then re-dissolved in the saline. The specific activities for various lots of [3HI-GABA ranged from 35-43 Ci/mM; thus the concentration of GABA in the me- dium was 2-3 FM. By using the kinetic param-

GABA-ERGIC PATHWAYS IN THE GOLDFISH RETINA 223
eters available for high-affinity GABA trans- port in frog retina (Voaden et al., '74) and high-and-low affinity GABA transport in frog brain (Davidoff and Adair, '76) it is possible to calculate that a t 2 to 3 pM GABA, high af- finity transport is responsible for over 95% of observed uptake (Martin, '76). The retina was incubated for 15 minutes in darkness or stim- ulated with spectral lights obtained from a tungsten source (infra-red blocked) and a Jar- rell-Ash monochromator (half-peak band- width == 20 nm). Calibrations of flux densities were made with a United Detector Technology PIN-1OD photodiode placed in the position of the retina. Stimuli were either constant or 2 Hz square wave stimuli at wavelengths of 650 nm (1 X l o5 quanta. sec-l. pm-'), 530 nm (8 X lo4 quanta. sec-'. pm-') or 465 nm (2 X lo4 quanta. sec-I. pm-2); these experimental con- ditions shall be referred to as red, green or blue light experiments. After incubation the retina was returned to its eyecup and the ERG was rapidly measured, usually taking less than 15 seconds of stimulus exposure; the cri- teria for acceptance of the preparation were that the a-wave retain two-thirds of its origi- nal amplitude and the b-wave inflection per- sist (fig. 1). The light-modulated events we re- port are from 20 experiments meeting these criteria. With our current methods the vari-
pre a-
$1 F
500 ms Fig. 1 Goldfish electroretinogram to a 2 Hz square-
wave, 100% modulated 650 n m light (1 X lo5 quan- ta. sec-'. *m-*). Signals from top to bottom are: (i) photo- diode trace; (ii) ERG from eyecup before incubation; (iii) ERG from eyecup after incubation; (iv) ERG from an eyecup in which the b-inflection was abolished during in- cubation. The b-inflection can also be abolished by appli. cation of 2 mM Co".
ance of a single experiment is large and per- mits only qualitative comparisons of light- modulated 13H1-GABA uptake with spectral response data obtained by intracellular re- cording. We tried to maximize detection of changes in f3HI-GABA uptake by using the brightest spectral lights our stimulator could provide. Substantial improvements in incuba- tion and physiological monitoring will have to be achieved before quantitative comparisons of uptake data vis a vis physiological data can be attempted.
After the post-incubation ERG, retinas were washed in unlabeled saline for 100 sec- onds and fixed in 1% paraformaldehyde, 2.5% glutaraldehyde, 3% sucrose in 60 mM sodium cacodylate buffer (pH 7.4) for 15 minutes a t room temperature, then overnight a t 4°C. Specimens were post-fixed in 1% OsO, in cacodylate buffer and stained en bloc with 1% uranyl acetate in maleate buffer. Dehydration ensued using cold graded methanols and pro- pylene oxide followed by infiltration and embedment in a soft Epon mixture (Stell and Lightfoot, '75).
Release experiments Release of accumulated [3H1-GABA was
evaluated by loading a hemisected retina with [3HI-GABA under the same conditions speci- fied for uptake experiments and subsequently incubating in an unlabeled saline. A single dark-adapted retina was hemisected and incu- bated in the standard oxygenated PHI-GABA medium for ten minutes under flickering red light. After the loading period, one hemiretina was placed in an unlabeled saline in darkness for five minutes and the other hemiretina placed in an unlabeled saline under flickering red light for five minutes. Three such experi- ments were performed; fixation and proc- essing were as previously described. No ERGS were performed for these experiments.
Histology Ribbons of 0.5-pm sections were cut with
glass knives on a Sorvall MT2-B ultrami- crotome, floated onto beads of distilled water on clean glass slides and dried a t 200°F. The slides were coated with a 50% aqueous solu- tion of Kodak NTB-2 emulsion and exposed at 4OC for precisely seven days. A 7-day exposure provided the maximum range of cell labeling for quantitative analysis. Light microscope autoradiographs (ARGs) were developed a t 17°C in full strength Kodak Dektol. Sections
224 R. E. MARC, W. K. STELL, D. BOK AND D. M. K. LAM
were stained by placing a small droplet of freshly mixed 0.05% toluidine blue (two parts), 1% sodium borate (one part) directly over the sections and drying a t 200°F. U1- trathin sections were cut on a Reichert OmU I11 or Sorvall MT2-B ultramicrotome with dia- mond knives and transferred to celloidin coated slides for EM-ARGs or onto formvar- coated 200 mesh grids or slot grids for conven- tional electron microscopy. Specimens were stained with uranyl acetate and lead citrate and carbon coated. EM-ARGs were exposed for 100 to 300 days and processed as described by Bok and Young ('72).
Micros copy Light microscopy was performed primarily
with 40 x planapochromatic and 63 x neofluar phase contrast oil immersion objec- tives. Panatomic-X 35-mm film was used for photomicrography. Magnitude of PHI-GABA uptake was expressed as grain density; den- sities were determined by manual counting of silver grains in a 3.7 pm diameter counting area, centered inside the somas of HCs and amacrine cells. The term "label" will here- after mean number of g ra ind l l . 6 pm2. Thin sections were examined in Siemens 1 and JEOL JEM-100C electron microscopes; elec- tron micrographs were made on 70 mm roll film or 3-1/4" X 4" cut film. Relative positions of elements in the retina are indicated by the terms proximal (meaning closer to the brain, e.g., ganglion cells) and distal (meaning fur- ther from the brain, e.g., photoreceptor cells).
Correla ti ue experiments Preliminary experiments using PHI-glycine
and [3H1-dopamine as neurotransmitter candi- dates were performed in the same manner a s I3HI-GABA uptake experiments, using activ- ities of 100 &i/ml.
RESULTS
Horizontal cell PHI-GABA uptake Upon stimulation with red, green or blue
lights, r3H-GABAI uptake was shown by the distal layer of cone HC somas and dendrites (figs. 2, 5, 7 , 15, 18). On the basis of layering alone, it is possible to identify the labeled HCs as H 1 somas; more proximal HCs, such as H2s, H3s and rod HCs (RHs) never exhibited PHI- GABA uptake. The pedicles of almost all cones are invaded by labeled processes, but rod spherules never contain label (figs. 4, 7, 8) . Even with LM-ARGS (fig. 4) it is apparent
tha t the labeled processes line the synaptic cavities of cones rather than coursing through the centers. Specific localization of the label in or near HC dendrites is shown in the EM- ARGs of figures 7 and 8. Quantitative evalua- tions of grain distribution supports localiza- tion of t he emitting source in HC dendrites (APPENDIX). We conclude tha t ["HI-GABA uptake by HCs is limited to type H1 cone horizontal cells, which contact all spectral classes of cones; H2s and H3s, which fail to contact certain types of cones, and RHs, which contact only rods, show no i3HI-GABA uptake. Specifically, only those HCs which contact red-sensitive cones show 13HI-GABA uptake.
Stell ('75) has shown tha t the large, anucle- a te cylindrical processes found in the inner nuclear layer (INL) are the axon terminal ex- pansions of cone horizontal cells (HCATs). Many but not all of these structures show ["HI-GABA accumulation (figs. 2, 6, 13, 15, 18, 191, probably because only some of the HCATs are connected to Hls . A total of 422 HCATs were counted in horizontal sections from five preparations; 53% t 6% of the HCATs were la- beled. I t appears t ha t H l s could constitute half of all cone HCs, which compares favora- bly with an estimate of == 67% based on cen- ter-to-center spacings of Golgi-impregnated pairs of Hls , H2s and H3s (Stell and Lightfoot, '75).
Membrane specializations indicative of gap junctions have been reported between somas of external HCs in the carp retina (Yamada and Ishikawa, '65; Witkovsky and Dowling, '69). In the goldfish retina, we find gap junc- tions between HC somas, between dendrites, between soma and dendrite, and between HCATs (figs. 9-11). EM-ARGs reveal t ha t gap junctions occur only between pairs of labeled
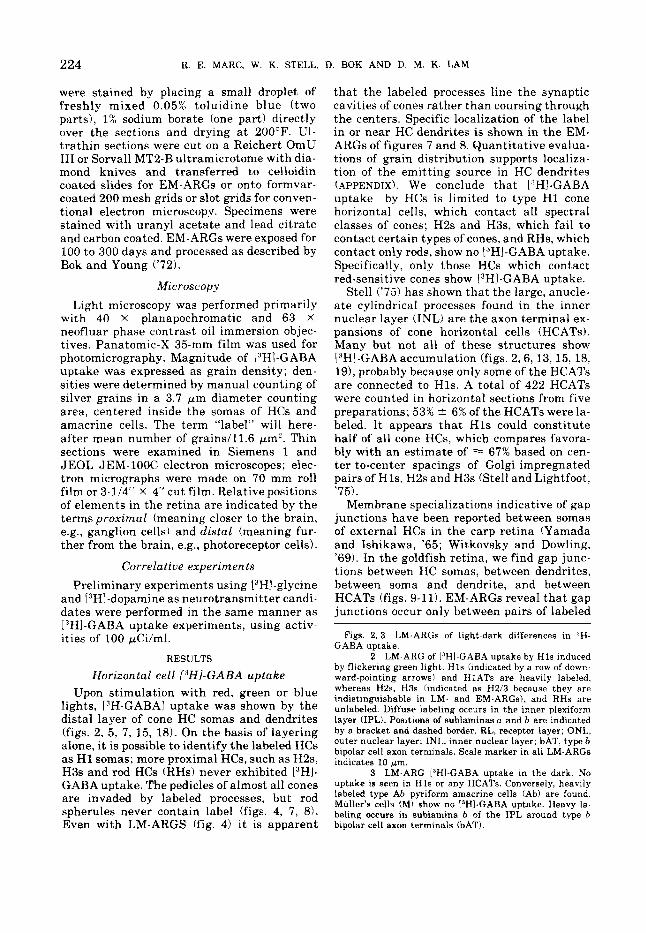
Figs. 2, 3 LM-ARGs of light-dark differences in 3H- GABA uptake.
LM-ARG of 13HI-GABA uptake by H l s induced by flickering green light. HIS (indicated by a row of down- ward-pointing arrows) and HlATs are heavily labeled, whereas H2s, H3s (indicated as H213 because they are indistinguishable in LM- and EM-ARGs), and RHs are unlabeled. Diffuse labeling occurs in the inner plexiform layer (IPL). Positions of sublaminas a and b are indicated by a bracket and dashed border. RL, receptor layer; ONL, outer nuclear layer; INL, inner nuclear layer; bAT, type b bipolar cell axon terminals. Scale marker in all LM-ARCS indicates 10 *m.
3 LM-ARG PHI-GABA uptake in the dark. No uptake is seen in H l s or any HCATs. Conversely, heavily labeled type Ab pyriform amacrine cells (Ab) are found. Muller's cells (M) show no PHI-GABA uptake. Heavy la- beling occurs in sublamina b of the IPL around type b bipolar cell axon terminals (bAT).
2
GABA-ERGIC PATHWAYS I N THE GOLDFISH RETINA 225

226 K. E. MARC, W. K. STELL, D. BOK A N D D. M. K. LAM
GABA-ERGIC PATHWAYS IN THE GOLDFISH RETINA 227
profiles (figs. 12, 13) or between pairs of unlabeled profiles, consequently we have ana- tomical evidence for electrotonic coupling within the type H1 cone horizontal cell popu- lation. I t is also possible tha t other cone HCs are similarly coupled, i.e., H2s coupled to H2s and H3s coupled t o H3s. Although RHs show extensive spatial summation (Kaneko and Ya- mada, ’721, no morphological evidence of gap junctions has yet been obtained for RHs. Gap junctions are frequently encountered in thin sections of HCs indicating tha t the degree of electrotonic coupling may be substantial. Sim- ilarly, Nagy and Stell (in preparation) have observed large patches of P-face particles characteristic of gap junctions on goldfish HC membranes after freeze-fracture.
The correlation between HCs classified as type H 1 by Stell and Lightfoot (’75) and r3H1- GABA accumulating HCs can be extended to the physiological domain. That is, the light- induced voltage responses of H l s are always hyperpolarizing and [3HI-GABA uptake is always increased by light; both light-induced voltage changes and uptake changes are spectrally “monophasic.” Specific conditions must prevail to induce a controlled light-dark difference in [3HI-GABA uptake, however. Differences in L3H1-GABA uptake between retinas incubated in light and those incubated in darkness were found only when retinas were exposed to light prior to incubation (METHODS). While most retinas were pre-ex- posed with flickering lights, i t was found tha t constant lights would suffice. Retinas tha t were pre-exposed showed little or no uptake by H l s when incubated in darkness; fully dark adapted retinas which were not exposed in this fashion showed substantial L3HI-GABA uptake by H l s upon incubation in darkness. We do not know why such pre-conditioning is necessary, bu t it does suggest t ha t the beha-
Figs. 4-6 LM-ARGs of PHI-GABA uptake by Hls. 4 Horizontal section through the plane of photo-
receptor synaptic terminals in a red light experiment. Almost all cone pedicles show a ring of silver grains a t the perimeter of the synaptic cavity. Pairs of pedicles from double cones (arrows). each of which is comDosed of a red-
viors of neurons are strongly influenced by the state of adaptation. In any event, “dark” ex- periments will refer hereafter only to those in which retinas were light exposed prior to in- cubation in the dark.
Table 1 is a summary of red, green and blue light versus dark experiments; “label” refers to the number of silver grains in a 3.7 pm di- ameter counting circle. There were 12 light and 8 dark experiments; a minimum of 10 HCs were counted per experiment and the data pooled. In all cases the light-stimulated ex- periments induced much more uptake than dark experiments, all differences being statis- tically significant (P < 0.001, two-tailed Stu- dent-t-test). The stimuli used should have evoked large, nearly saturated voltage re- sponses in goldfish HCs. Because the mag- nitudes of uptake induced by blue, green and red lights were not very different i t appears tha t the flux densities used nearly saturate L3H1-GABA uptake as well as light-evoked re- sponses. Among the labeled HCATs, label den- sity was linearly related t o H I soma label den- sity with a slope of 0.75. This is shown in figure 14 where the mean labels of four H l s and four HCATs, all located within 500 pm of each other, were determined (8 dark experi- ments, 1 2 light experiments, 8 experiments where the ionic composition of the medium was varied; results of these ionic studies a re not reported in this paper). This result is con- sistent with the view tha t labeled axon termi- nals may actually be HlATs, and although the evidence is not conclusive we will hereafter tentatively refer to labeled HCATs as HlATs.
Of the 12 light experiments, 4 used constant lights (2 red, 1 green, 1 blue) and the rest used light flickered a t 2 Hz (100% modulated square wave, 50% duty cycle). No significant differences in uptake occurred between the two conditions, as expected for cyprinid H l s because their gain shows little or no attenua- tion when stimulated with sinusoidally modu- lated lights a t frequencies of 2 Hz or less (Toyoda, ’74; Toyoda and Kondo, ’76).
An important functional correlate of high- affinity amino acid uptake by neurons is the
sensitive and a green-sensitive member, both show la- ability of the neurons t o release accumulated beling. Clusters of rod spherules (circled) show no label. neurotransmitter. T~ determine if H~~ were
5 Oblique section of a green light experiment showing the distal layer of heavily labeled H1 somas. capab1e Of GABA under appropriate Abutting the proximal surfaces of Hls are the somas of stimulus conditions, we loaded them with HZs, H3s and RHs (arrows). [3Hl-GABA for ten minutes in red light, and
incubated in an unlabeled saline medium for five minutes. One hemiretina was incubated in unlabeled saline under a red flickering light
6 Horizontal section through the middle of the INL in a green light experiment. The tuberous form of HCATs is easily discerned; labeled HlATs course among unlabeled H2/3ATs and clusters of bipolar cell nuclei.
a m
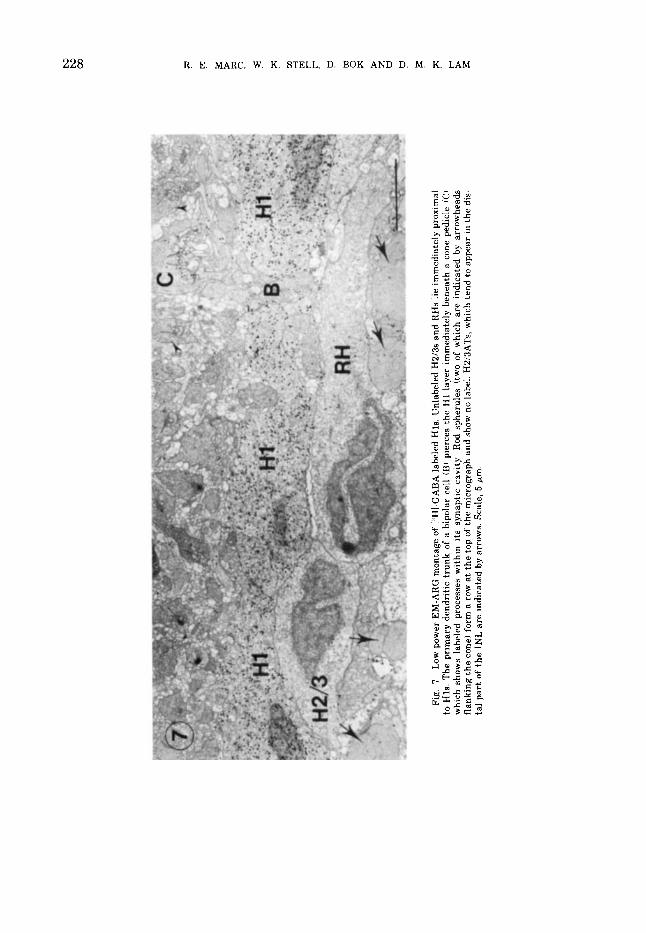
Fig
. 7
Low
pow
er E
M-A
RG
mon
tage
of
['H
I-G
AB
A la
bele
d H
ls. U
nlab
eled
HZ
3s a
nd R
Hs
lie i
mm
edia
tely
pro
xim
al
to H
ls. T
he p
rim
ary
dend
riti
c tr
unk
of a
bip
olar
cel
l (B
l pi
erce
s th
e H1 l
ayer
im
med
iate
ly b
enea
th a
con
e pe
dicl
e (C
) w
hich
sho
ws
labe
led
proc
esse
s w
ithi
n it
s sy
napt
ic c
avit
y. R
od s
pher
ules
(tw
o of
whi
ch a
re i
ndic
ated
by
arro
whe
ads
flan
king
the
cone
) fo
rm a
row
at
the
top
of t
he m
icro
grap
h an
d sh
ow n
o la
bel.
H2/
3AT
s, w
hich
ten
d to
app
ear
in t
he d
is-
tal
part
of
the
INL
are
indi
cate
d by
arr
ows.
Sca
le, 5
pm
.
W
0
7:
GABA-EKGI(' P A T H W A Y S I N THE GOLDFISH RETINA 229
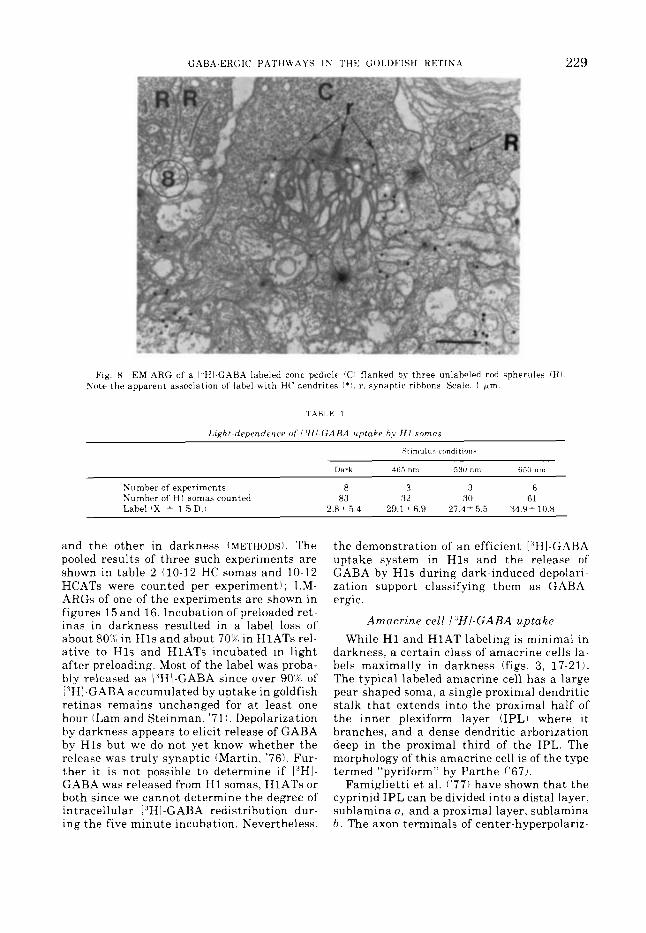
Fig. 8 EM ARG of a I'HI GABA labeled cone pedicle CCi flanked by three unlabeled rod spherules iRi Note the apparent association of label w i t h HC dendrites ( * I . r. synaptic rihhons Scale. 1 p m
'l.Af3l.E 1
Light-deprndrncr of I 'HI -GARA uptake hv H 1 somas
S t i r n u l u i conditioni
n a r k 4RS n m m n m tixi nrll
Number of experiments Number of H1 somas counted Label lx i- 1 S D
8 3 3 6 83 32 30 61
2.81- 5 4 29.1 2 6.9 27 4 Z 5 5 34 9 2 10 8
and the other in darkness (METHODS). The pooled results of three such experiments are shown in table 2 (10-12 HC somas and 10-12 HCATs were counted per experiment); LM- ARGs of one of the experiments are shown in figures 15 and 16. Incubation of preloaded re t - inas in darkness resulted in a label loss of about 80% in H l s and about 70%) in HlATs rel- ative to H l s and HlATs incubated in light after preloading. Most of the label was proba- bly released as I.'HI-GABA since over 90%) of ['HI-GABA accumulated by uptake in goldfish retinas remains unchanged for a t least one hour (Lam and Steinman, '71). Depolarization by darkness appears to elicit release of GABA by H l s but we do not yet know whether the release was truly synaptic (Martin, '76). Fur- ther it is not possible to determine if ['HI- GABA was released from H1 somas, HlATs or both since we cannot determine the degree of intracellular IJHI-GABA redistribution dur- ing the five minute incubation. Nevertheless,
the demonstration of an efficient ['HI-GABA uptake system in H l s and the release of GABA by H l s during dark-induced depolari- zation support classifying them as GABA- ergic.
Amacrine cell ['HI-GABA uptake While H1 and HlAT labeling is minimal in
darkness, a certain class of amacrine cells la- bels maximally in darkness (figs. 3, 17-21). The t.ypical labeled amacrine cell has a large pear-shaped soma, a single proximal dendritic stalk tha t extends into the proximal half of the inner plexiform layer (IPL) where i t branches, and a dense dendritic arborization deep in the proximal third of the IPL. The morphology of this amacrine cell is of t he type termed "pyriform" by Parthe ( '67) .
Famiglietti et al. ( ' 7 7 ) have shown tha t the cyprinid IPL can be divided into a distal layer, sublamina a, and a proximal layer, sublamina b . The axon terminals of center-hyperpolariz-
230 K. E. MARC, W. K. STELL, D. BOK AND D M. K. LAM
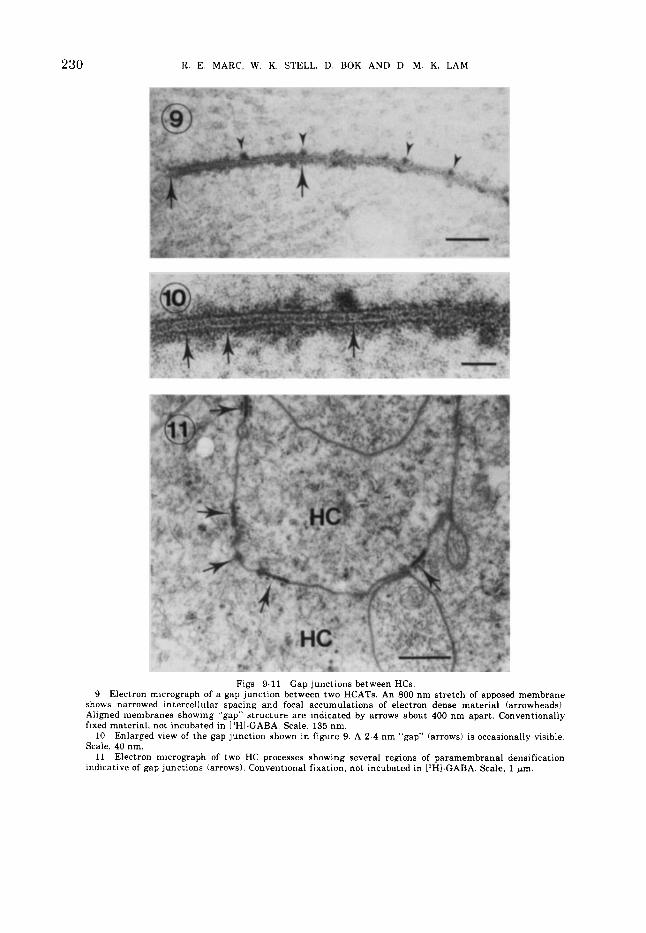
Figs. 9-11 Gap junctions between HCs. 9 Electron micrograph of a gap junction between two HCATs. An 800 nm stretch of apposed membrane
shows narrowed intercellular spacing and focal accumulations of electron dense material (arrowheads), Aligned membranes showing “gap” structure are indicated by arrows about 400 nm apart. Conventionally fixed material, not incubated in [3H1-GABA. Scale, 135 nm.
Enlarged view of the gap junction shown in figure 9. A 2-4 nm “gap” (arrows) is occasionally visible. Scale, 40 nm.
Electron micrograph of two HC processes showing several regions of paramembranal densification indicative of gap junctions (arrows). Conventional fixation, not incubated in 13HI-GABA. Scale, 1 pm.
10
11
GABA-ERGIC PATHWAYS IN THE GOLDFISH RETINA 231
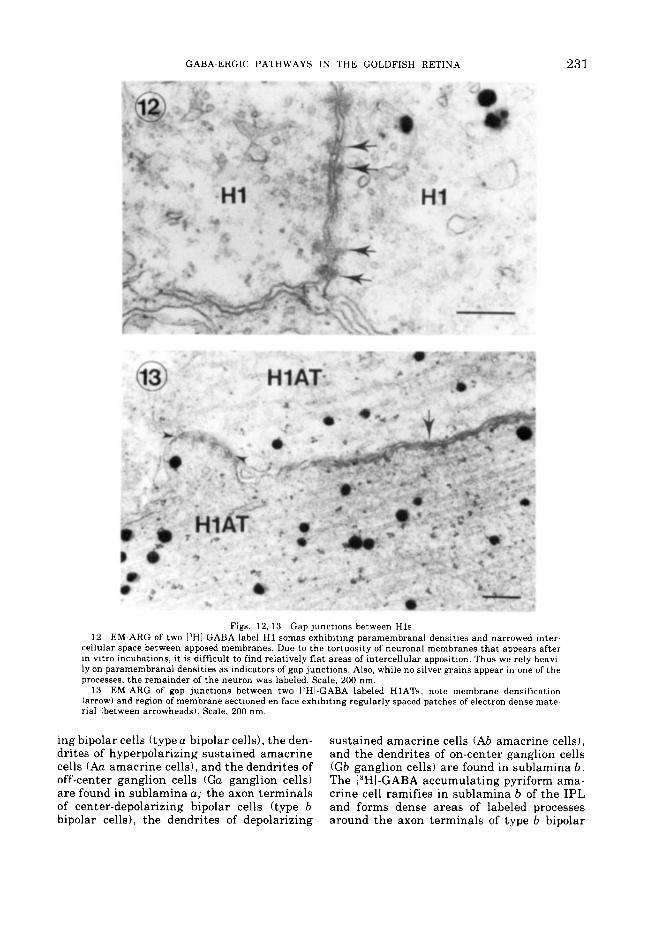
Figs. 12, 13 Gap junctions between Hls . EM-ARG of two llHI-GABA label H1 somas exhibiting paramembranal densities and narrowed inter-
cellular space between apposed membranes. Due to the tortuosity of neuronal membranes that appears after in vitro incubations, it is difficult to find relatively flat areas of intercellular apposition. Thus we rely heavi~ ly on paramembranal densities as indicators of gap junctions. Also, while no silver grains appear in one of the processes, the remainder of the neuron was labeled. Scale, 200 nm.
13 EM-ARG of gap junctions between two 13H1~GABA labeled HlATs; note membrane densification (arrow) and region of membrane sectioned en face exhibiting regularly spaced patches of electron dense mate- rial (between arrowheads). Scale, 200 nm.
12
ing bipolar cells (type a bipolar cells), the den- drites of hyperpolarizing sustained amacrine cells (Aa amacrine cells), and the dendrites of off-center ganglion cells (Gu ganglion cells) a re found in sublamina a; the axon terminals of center-depolarizing bipolar cells (type b bipolar cells), the dendrites of depolarizing
sustained amacrine cells (Ab amacrine cells), and the dendrites of on-center ganglion cells (Gb ganglion cells) are found in sublamina b . The VHl-GABA accumulating pyriform ama- wine cell ramifies in sublamina b of the IPL and forms dense areas of labeled processes around the axon terminals of type b bipolar
232
30 J W
J
tn a $ 2o
2 5 K W I- ’* 2 0 x
0 a
R. E. MARC, W. K. STELL. D. BOK AND D. M. K. LAM
HI m.0.75 r.0.98
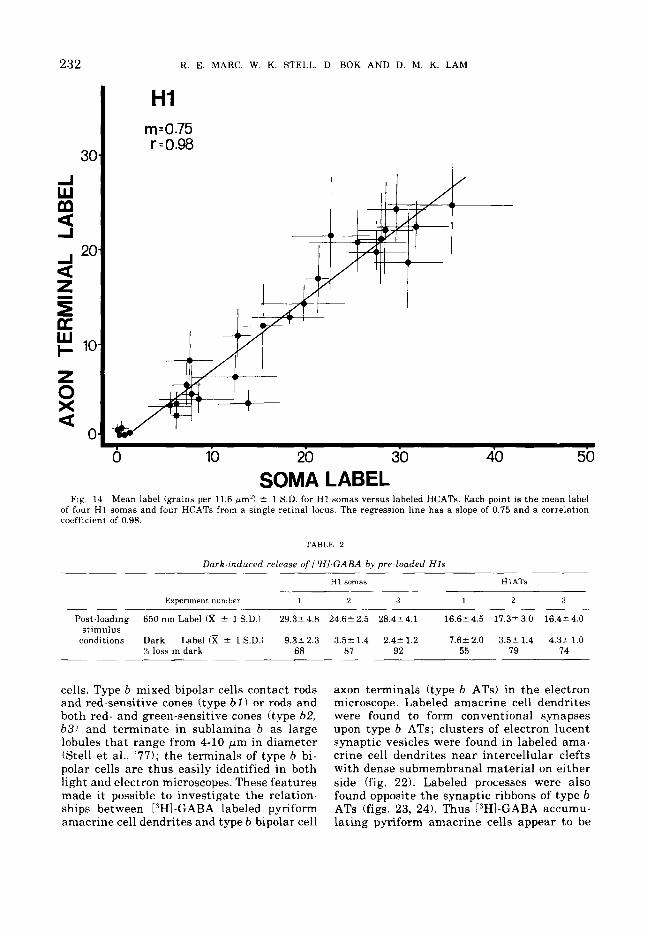
Fig. 14 Mean label (grains per 11.6 pm2) -+ 1 S.D. for H1 somas versus labeled HCATs. Each point is the mean label of four H1 somas and four HCATs from a single retinal locus. The regression line has a slope of 0.75 and a correlation coefficient of 0.98.
TABLE 2
Dark-induced release of IJHI-GABA by pre-loaded H I S
H1 somas H 1 ATs
Experiment number 1 2 3 1 2 3
Post-loading 650 nm Label Cx 2 1 S.D.) 29.32 4.8 24 6t 2.5 28.42 4.1 16.62 4.5 17.32 3.0 16.42 4.0
conditions Dark Label CR 2 1 S.D.) 9 . 3 1 2.3 3.52 1.4 2.4A 1.2 7.6k 2.0 3.55 1.4 4.3r 1.0 stimulus
% loss in dark 68 a7 92 55 79 74
cells. Type b mixed bipolar cells contact rods and red-sensitive cones (type b l ) or rods and both red- and green-sensitive cones (type 62, b31 and terminate in sublamina b as large lobules tha t range from 4-10 Fm in diameter (Stell et al., ’77); the terminals of type b bi- polar cells a re thus easily identified in both light and electron microscopes. These features made it possible to investigate the relation- ships between [‘HI-GABA labeled pyriform amacrine cell dendrites and type b bipolar cell
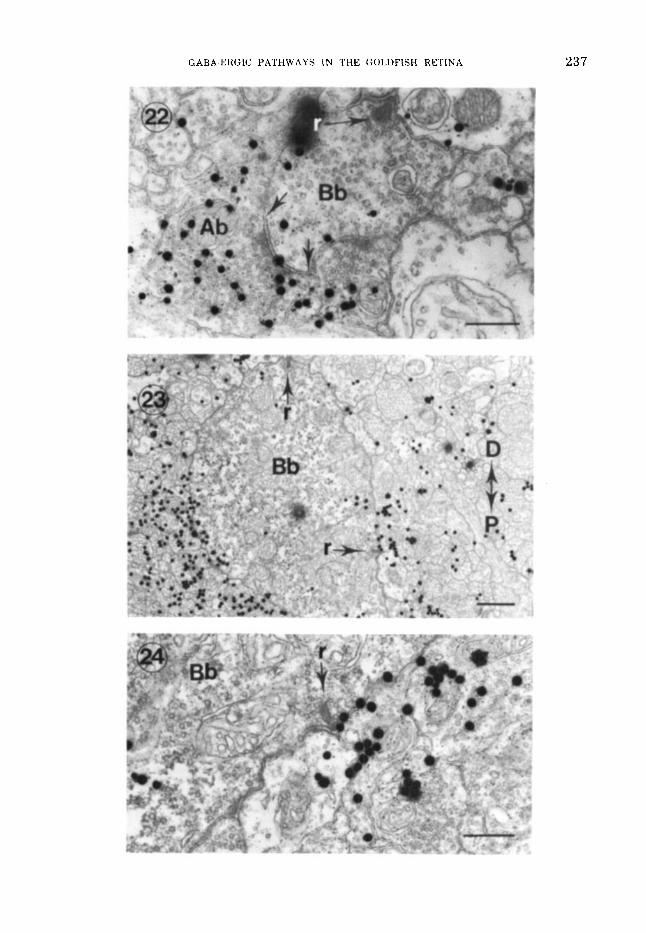
axon terminals (type b ATs) in the electron microscope. Labeled amacrine cell dendrites were found to form conventional synapses upon type b ATs; clusters of electron lucent synaptic vesicles were found in labeled ama- crine cell dendrites near intercellular clefts with dense submembranal material on either side (fig. 22). Labeled processes were also found opposite t he synaptic ribbons of type b ATs (figs. 23, 24). Thus PHI-GABA accumu- lating pyriform amacrine cells appear to be
GABA-ERGIC PATHWAYS IN THE GOLDFISH RETINA 233
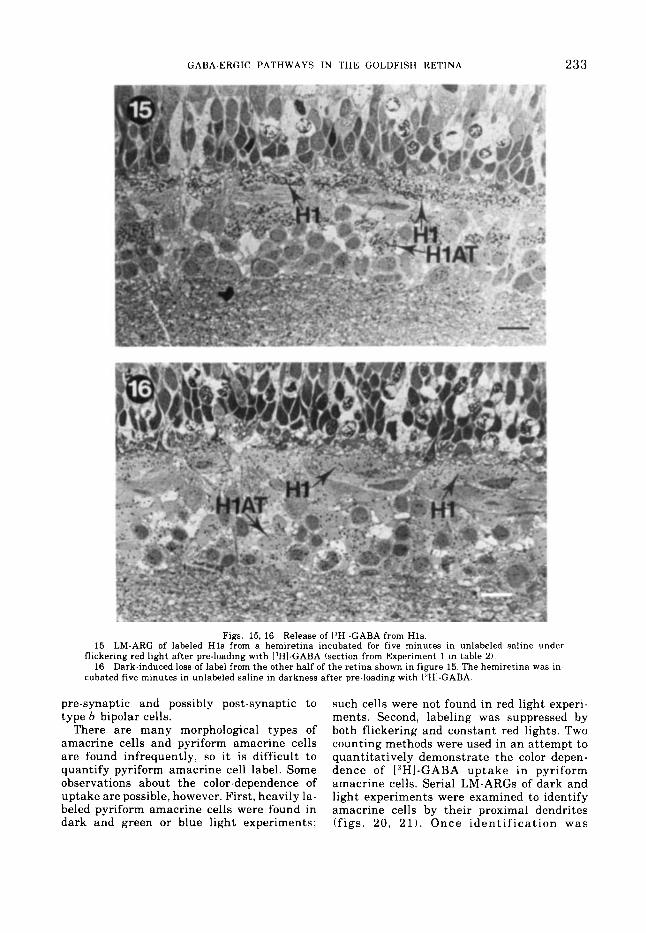
Figs. 15, 16 Release of 13H1-GABA from H l s . 15 LM-ARG of labeled Hl s from a hemiretina incubated for five minutes in unlabeled saline under
16 Dark-induced loss of label from the other half of the retina shown in figure 15. The hemiretina was in^ flickering red light after pre-loading with ['HI-GABA (section from Experiment 1 in table 2).
cubated five minutes in unlabeled saline in darkness after pre-loading with ['HI-GABA.
pre-synaptic and possibly post-synaptic to type b bipolar cells.
There are many morphological types of amacrine cells and pyriform amacrine cells are found infrequently, so i t is difficult to quantify pyriform amacrine cell label. Some observations about the color-dependence of uptake are possible, however. First, heavily la- beled pyriform amacrine cells were found in dark and green or blue light experiments;
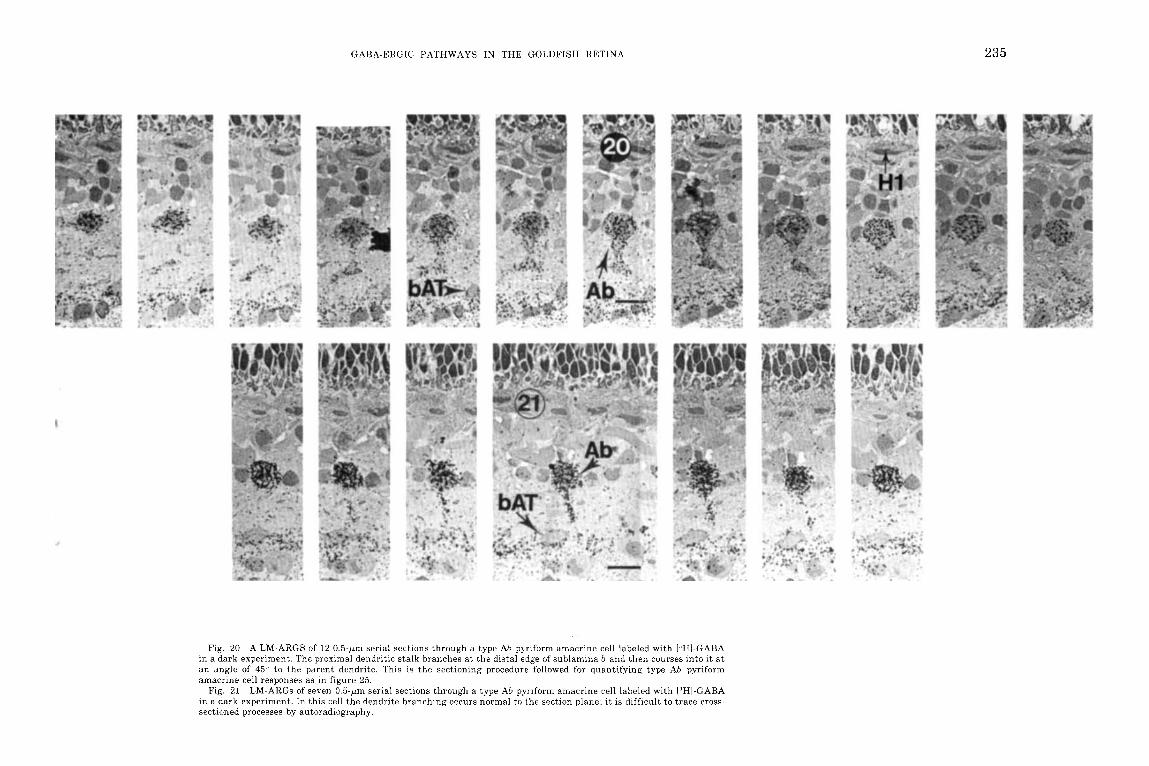
such cells were not found in red light experi- ments. Second, labeling was suppressed by both flickering and constant red lights. Two counting methods were used in a n attempt to quantitatively demonstrate the color depen- dence of 13HI-GABA uptake in pyriform amacrine cells. Serial LM-ARGs of dark and light experiments were examined to identify amacrine cells by their proximal dendrites (figs. 20, 21) . Once iden t i f i ca t ion was
234
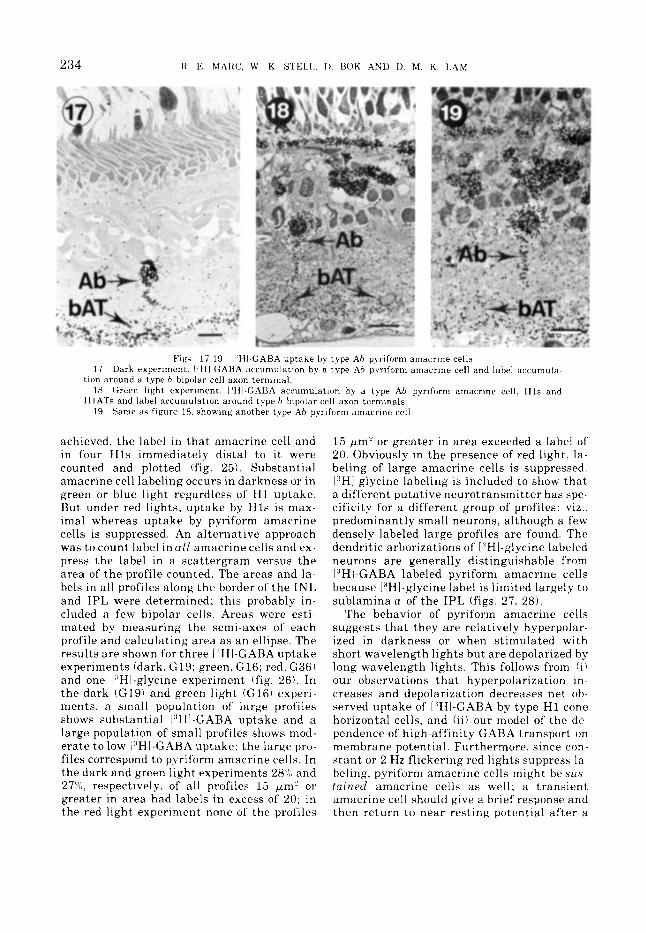
Figs 17 19 \ 'HI GAHA uptake tly type Ah pyrifiirm amarrine cells. 17 Dark rxperiment I'F11 GABA accumulation by a type Ah pyriform amacrine cell and label accumula-
18 Green light experiment. IJHI-GABA accumulation by a type Ah pyriform amacrine cell, H l s and
19
tion around a type h bipolar cell axon terminal.
H l A T s and lahel accumulation around type h hipolar cell axon terminals. Same as figure 18. showing another type Ah pyriform amacrine cell.
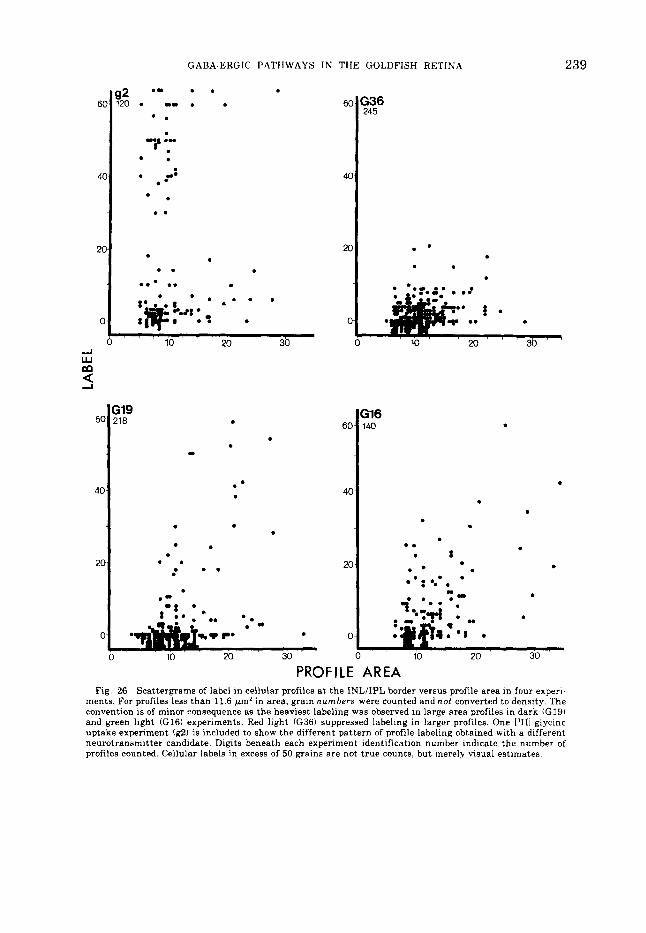
achieved, the label in tha t amacrine cell and in four H l s immediately distal to i t were counted and plotted ifig. 25). Substantial amacrine cell labeling occurs in darkness or in green or blue light regardless of 111 uptake. But under red lights. uptake by H l s is max- imal whereas uptake by pyriform amacrine cells is suppressed. An alternative approach was to count label i na l l amacrine cells and ex- press the label in a scattergram versus the area of t he profile counted. The areas and la- hels in all profiles along the border of t he I N L and IPL were determined; this probably in- cluded a few bipolar cells. Areas were esti- mated by measuring the semi-axes of each profile and calculating area as an ellipse. The results a r e shown for three [.'HI-GARA uptake experiments (dark. G19; green, G16; red, G36) and one I"H1-glycine experiment ifig. 26) . In the dark iG19) and green light (GI61 experi- ments. a small population of large profiles shows substantial I"H1-GABA uptake and a large population of small profiles shows mod- erate to low I,'HI-GARA uptake; t he large pro- files correspond to pyriform amacrine cells. In the dark and green light experiments 28% and 27%. respectively. of all profiles 15 pm' o r greater in area had labels in excess of 20; in the red light experiment none of the profiles
15 pm' or greater in area exceeded a label of 20. Obviously in the presence of red light, la- beling of large amacrine cells is suppressed. 1,'HI-glycine labeling is included to show tha t a different putative neurotransmitter has spe- cificity for a different group of profiles: viz . . predominantly small neurons, although a few densely labeled large profiles are found. The dendritic arborizations of ["HI-glycine labeled neurons a re generally distinguishable from I"H1-GABA labeled pyriform amacrine cells because I,'HI-glycine label is limited largely to sublamina a of the IPL (figs. 27, 28).
The behavior of pyriform amacrine cells suggests t ha t they are relatively hyperpolar- ized in darkness or when stimulated with short wavelength lights but a re depolarized by long wavelength lights. This follows from ( i ) our observations tha t hyperpolarization in- creases and depolarization decreases net ob- served uptake of ["HI-GABA by type H1 cone horizontal cells, and h i ) our model of the de- pendence of high-affinity GABA transport on membrane potential. Furthermore, since con- s tan t or 2 Hz flickering red lights suppress la - beling, pyriform amacrine cells might be s u s - tained amacrine cells as well; a transient amacrine cell should give a brief response and then return to near resting potential after a
GABA-ERGIC PATHWAYS IN THE GOLDFISH RETINA
Fig. 20 A LM-ARGS of 1 2 0.5-pm serial sections through a type Ah pqriform amacrine cell labeled with I 'HI-GABA in a dark experiment. The proximal dendritic stalk branches a t the distal edge of sublamina b and then courses into it a t an angle of 45" to the parent dendrite. This is the sectioning procedure followed for quantifying type Ab pyriform amacrine cell responses as in figure 25.
LM-ARGs of seven 0.5-pm serial sections through a type Ah pyriform amacrine cell labeled with IW-GABA in a dark experiment. In this cell the dendrite branching occurs normal to the section plane; i t is difficult to trace cross- sectioned processes by autoradiography.
Fig. 21
235
236 R E M z \ \ K C ' . fi K S'SELL D BOK AND D M K LAM
step from darkness to a constant red light, whereas it should show vigorous repeated depolarizations to a flickering light. [,'HI- GARA accumulating pyriform amacrine cells are morphologically similar to the red-depo- larizing sustained amacrine cells described by Famiglietti et al. ('77) and the depolarizing sustained amacrine cells (stimulated with white light only) described by Murakami and Shimoda ( '77) . All of these neurons ramify in sublamina b of the IPL, near the terminals of type b bipolar cells. Consistent with current terminology (Famiglietti et al.. '77) we shall refer to ("HI-GABA accumulating pyriform amacrine cells as Ab amacrine cells. It is in- triguing tha t Voaden et al. ('74) also noted a population of amacrine cells in the frog retina tha t accumulated I 'HI-GABA in darkness but not in light; further more label was found in the proximal part of sublamina b .
In the goldfish retina we sometimes find many lightly 1,'HI-GABA labeled cell bodies (as depicted in the scattergrams of fig. 26); we do not know whether these neurons a re truly GABA-ergic and we have failed to optimally enhance GARA transport or whether they ac- cumula te GABA inefficiently because of cross-specificity of the uptake system for their natural transmitter. Due to the great dif- ficulty in analyzing amacrine cell populations it was not possible to demonstrate unequivo- cal GABA release for Ab amacrines; our only evidence for claiming these neurons to be GABA-ergic is the presence of a high-affinity GABA transport system.
Correlutive studies of other neurotransmitter cundidutes
Preliminary incubations were done with ("HI-glycine and i3H-dopamine. I"H1-glycine labels amacrine cells that ramify predomi- nantly in sublamina a of the IPL (fig. 281; mostly small neurons a re labeled but a few pyriform-like cells have been found tha t ex- tend a single dendritic stalk to the middle of sublamina a before branching. ["HI-dopamine labels a class of sparsely distributed arnacrine cell somas; diffuse label is found surrounding HCs in the OPL. These putatively dopa- minergic neurons resemble interplexiform cells that show dopamine fluorescence in- duced by the Falck-Hillarp technique in perch and goldfish retinas (Ehinger et al., '69; Dow- ling and Ehinger, '75). The unequivocal dem- onstration tha t IW-GABA. I'HI-glycine and [3H!-dopamine label morphologically distinct
neurons in the goldfish retina strengthens our advocacy of uptake systems as useful probes of circuitry in the goldfish retina.
DISCUSSION
GABA as a retinal neurotransmitter GABA and its associated synthetic and deg-
radative enzymes have been detected in gold- fish and frog retinas (Lam, '72, '75, '76; Graham e t al., '70; Graham, '72; Starr, '73). We have identified neurons responsible for ISHI-GARA uptake in the goldfish retina (type H1 cone horizontal cells and type Ah amacrine cells) and provided evidence for release of ("HI-GABA by type H1 cone horizontal cells. While immunocytochemical localization of the GABA synthetic enzyme glutamate decar- boxylase (GAD) in ectotherm nervous systems has not been achieved, two lines of evidence indicate some ectotherm HCs and amacrine cells may contain GAD: (1) high levels of GAD activity in the frog retina a re found near the OPL, in the INL (where somas of HCs and bipolar cells lie) and the IPL (Graham, '72); (21 some isolated goldfish HCATs synthesize GABA from L-glutamate (Lam, '75). Lam ('76) found the specific activity of GAD in pools of 150 to 300 isolated goldfish HCATs t o be 1.33 2 0.47 pmoles GABA formed/hr/g wet weight, only slighter greater than whole reti- na (0.86 -t 0.22 pmoles GABA formed/hr/g wet weight). If we assume tha t only HlATs, which constitute about half of all HCATs, show GAD activity, a corrected specific activ- ity would be 2.7 @moles GABA formed/hr/g wet weight, or three times greater than that found in whole retina. Thus it appears that the specific activity of GAD in Hl s could ap- proach that found in known inhibitory neu- rons (Hall et al., '70). I t is conceivable tha t
Figs. 22-24 EM-ARGs of 13H!-GABA labeled t j p e Ab amacrine cell processes
EM-ARG of a labeled amacrine cell terminal (Ab) which is pre~synaptic to a small lobe of a type b bipo- lar cell (Bb). The amacrine cell terminal contains elec- tron-lucent synaptic vesicles, 40-50 nm in diameter, close to the plasmalemma and diffuse paramembronal electron- dense material. The synaptic cleft (between arrows) is about 25 nm wide. with densification along amacrine and bipolar cell membranes. r , synaptic ribbon. Scale. 500 nm.
23 A type b bipolar cell axon terminal (Bb) cupped about its proximal surface by many presumably GABA-ergic amacrine cell processes. D, distal; P, prox- imal. r, Yynaptic ribbons. Scale, 1 pm.
Enlarged view of synaptic ribbon (r) shown a t lower right of figure 23. While it is not possible to assign the label to a particular profile, i t is evident that type Ab amacrine cells could be post-synaptic to type b bipolar cells (Bb). Scale, 500 nm.
22
24
GABA-ERCIC PATHWAYS 1N THE GOLDFISH RETINA 237

238 R. E. MARC, W. K. STELL, D. BOK A N D D. M. K. LAM
PAC LABEL Fig. 25 Type Ab pyriform amacrine cell labeling ver-
sus H I labeling for dark (d) and red (r), green (g) and blue (b) light experiments. Each point is the label (grains per 11.6 *mi) of a single amacrine cell, serially sectioned to identify its proximal dendrite, plotted versus the mean la- bel ? 1 S.D. of four H l s immediately distal to it. Hls la- bel well in any light but poorly in darkness; type Ab pyriform amacrine cells label well in darkness and green or blue light, but poorly in red light.
higher GAD activity occurs in H1 somas, which have not yet been analyzed. The evi- dence for (i) GAD localization in the ecto- therm OPL, INL and IPL, (ii) uptake of ['Hl- GABA by H l s and Ab amacrine cells, (iii) syn- thesis of GABA by HCATs, and (iv) t he re- lease of GABA by H l s constitute reasonable grounds for considering these neurons to be GABA-ergic. Lam, Lasater and Naka (per- sonal communication) now have evidence tha t catfish cones may possess GABA-sensitive re- ceptor sites which could constitute another criterion for identification of GABA as a neu- rotransmitter, i.e., evidence of postsynpatic action.
Neurotransmitter uptake as a physiological probe
A growing body of literature suggests tha t net observed amino acid neurotransmitter uptake will increase with membrane hyper- polarization and decrease with membrane depolarization (Bennet e t al., '72; Ham- merstadt and Cutler, '72; Levy et al., '73; White, '76; Davidoff and Adair, '76; Martin, '76; Johnston, '77). A formal model of the
dependence of high-affinity GABA transport on transmembrane potential proposed by Mar- t i n ('76) explicitly predicts t h a t a high [GABAI in/[GABAI out ratio can be main- tained at resting membrane potential, tha t t he ratio increases with hyperpolarization and decreases with depolarization. Our results constitute a direct test of these predictions: hyperpolarization of Hls by light enhances GABA uptake; depolarization of H l s by dark- ness decreases uptake. Since the relationship between membrane potential and uptake is valid for Hls , the light dependence of 13H1- GABA uptake in Ab amacrines should predict the relative changes in membrane potential induced by light. In this case the uptake indi- cates some Ab amacrine cells to be red- depolarizing, and recent dye-injection studies (Famiglietti et al., '77) showed tha t most if not all type Ab amacrines a re indeed red- depolarizing. The modulation of amino acid transport systems by natural stimuli could serve as a probe of membrane potential in neu- ral systems other than retina.
GABA-ergic circuits in the goldfish retina Type H1 cone horizontal cells and Ab
amacrine cells appear to constitute red-sensi- tive GABA-ergic lateral pathways in the OPL and I P L of t h e goldfish r e t ina (shown schematically in fig. 29) . Several sources of evidence indicate tha t spectrally monophasic red-dominated HCs form sign-inverting syn- apses on cones: (i) hyperpolarizing currents injected into turtle "luminosity" HCs induce depolarizing voltage responses in nearby cones (Baylor et al., '72); (ii) cones in the reti- nas of turt le and perch posses red-dominated antagonistic surrounds tha t appear to be gen- erated by HCs (Fuortes et al., '74; Burkhardt, '77) ; (iii) t he frequency response characteris- tic of cone HCs in catfish retina (Naka et al., '75; Chan, '76; Naka, '77) and carp retina (Fukurotani et al., '75) is spatially dependent and indicative of a sign-inverting HC-to-cone feedback path. Furthermore, catfish external HCs show PHI-GABA uptake and the time course of the external HC voltage response to large spots of light is drastically and reversi- bly slowed by application of micromolar quan- tities of bicuculline methochloride (Lam, Las- a te r and Naka, personal communication). Bic- uculline methochloride is a selective GABA antagonist (Johnston, '76) which inhibits GABA binding by isolated GABA receptors in
GABA-ERGIC PATHWAYS IN THE GOLDFISH RETINA 239
6
4
21
(
A Lu m 4
6C
40
za
0
. . . . . ..- .. . 20
0
i19 . 60 18 . . .. . . . 4c
. . . . . . 2c . . . . . . .- -. .
. 0 . -
I 10 20 30
236 245
. * . . .
;I6 40 .
. . . . . . 0 . . t . . . . . * .
: 5 . . .
10 20 30
PROFILE AREA Fig. 26 Scattergrams of label in cellular profiles a t the INL/IPL border versus profile area in four experi-
ments. For profiles less than 11.6 Wm' in area, grain numbers were counted and not converted to density. The convention is of minor consequence as the heaviest labeling was observed in large area profiles in dark (G19) and green light ((316) experiments. Red light (G36) suppressed labeling in larger profiles. One PHI-glycine uptake experiment (g2) is included to show the different pattern of profile labeling obtained with a different neurotransmitter candidate. Digits beneath each experiment identification number indicate the number of profiles counted. Cellular labels in excess of 50 grains are not true counts, but merely visual estimates.
240 R E MARC. W. K STEI.1.. D BOK AND D. M K. LAM
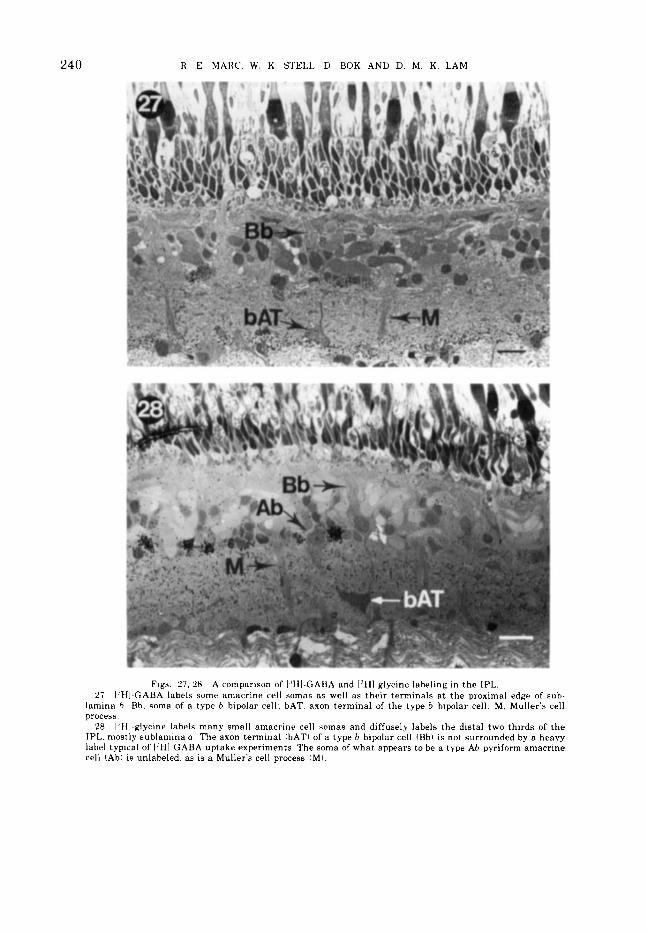
Figs. 27. 28 A comparison of IJHI-GABA and ['HI-glycine labeling in the IPL. 27 I'HI-GABA labels some amacrine cell somas as well as their terminals a t the proximal edge of sub-
lamina h Rh. soma of a type b bipolar cell: bAT. axon terminal of the type b bipolar cell; M, Muller's cell process.
28 I 'HI-glycine labels many small amacrine cell snmas and diffusely labels the distal two thirds of t he IPL. mostly sublamina a. The axon terminal (bATI of a type h bipolar cell (Bbl is not surrounded by a heavy label typical of I 'HI-GABA uptake experiments. The soma of what appears to be a type Ah pyriform amacrine cell (Ah) is unlabeled. as is a Muller's cell process (MI.

GABA-ERGIC PATHWAYS IN THE GOLDFISH RETINA 241
a strictly competitive fashion (Peck et al., '76a; Peck et al., '76b). The increased response time induced in catfish external HCs by bicu- culline methochloride indicates suppression of negative feedback from HCs to cones (Naka et al., '75).
A model has been proposed for the genera- tion of monophasic, biphasic and triphasic spectral response functions in cyprinid HCs tha t involved a cascade of sign-inverting syn- apses. If H l s a re truly GABA-ergic, the red component of H2 and H3 spectral response curves should be attenuated by application of a suitable GABA antagonist. At present, we do not know which neurons in the goldfish OPL a re GABA sensitive, although i t appears likely tha t some cones, at t he very least, possess post-synaptic GABA receptors. No convincing morphological evidence of HC-to- cone feedback synapses has been obtained. In fact, like most investigators, we have not been able to identify pre-synaptic accumulations of synaptic vesicles in cyprinid HCs and HCATs. While Witkovsky and Dowling ('69) have shown vesicle aggregations in presumed HC processes and we ourselves occasionally ob- serve vesicle profiles in HC dendrites, the infrequency of these observations compels us to conclude tha t either: (i) conventional fixa- tion procedures do not reliably preserve pre- synaptic specializations in cyprinid HCs; (ii) vesicles are not necessary in HC synaptic transmission (see Hammerstadt and Cutler, '72; Cutler and Dudzinski, '74; Martin, '76 for evidence the GABA release in brain can be mediated by non-vesicular facilitated trans- port). Similarly, we have not yet seen a con- ventional synaptic specialization in goldfish HCATs, which generate light-evoked voltage responses as large or larger than those of HC somas (Kaneko, '70; Naka, '75; Hashimoto et al., '76). Naka (personal communication) has reported seeing conventional synapses formed by catfish HCATs, so there is at least some possibility t ha t similar structures may be found in the goldfish a s well. We do not know which cells in the INL are post-synaptic to HCATs.
We have interpreted the observation tha t HC gap junctions are found between pairs of labeled profiles to mean tha t H l s are coupled exclusively to Hls , which is consistent with the observation tha t t he spectral response curves of H l s and HlATs are monophasic everywhere in their receptive fields (Hasi- mot0 e t al., '76). Thus the apparent exclusivity
of H1-to-H1 gap junctions and possibly H2-to- H2 and H3-to-H3 gap junctions provides a morphological basis for the large receptive fields of cyprinid HCs (Norton et al., '68; Spekreijse and Norton, '70; Kaneko, '70; Fu- kurotani et al., '75; Hashimoto et al., '76).
GABA-ergic pyriform amacrine cells in the retina of the goldfish appear to be sustained red-depolarizing. Likewise intracellular re- cording and dye injection in the carp retina shows tha t most type Ab amacrine cells are sustained red-depolarizing (Murakami and Shimoda, '77; Famiglietti e t al., '77. This does not mean tha t all type Ab amacrine cells are GABA-ergic; fur thermore t h e location of amacrine cell dendritic trees in our experi- ments appear to be slightly more proximal within sublamina b than the dendrites of ama- crine cells dye-injected by Famiglietti et al. ('77). The composition of the amacrine cell population is far from resolved a t this time.
Blue and green light fail to suppress [lH1- GABA uptake in type Ab amacrine cells. We may have been further from saturation of Ab amacrine cell light-evoked voltage responses than we were for H l s or some GABA-ergic Ab amacrine cells could have short wavelength hyperpolarizing (inhibitory) input. Color-op- ponency has been reported for some sustained amacrine cells in the carp retina (Famiglietti e t al., '77) but a t present we have no candi- dates for the neurons which might mediate a short wavelength input to these cells.
GABA-ergic Ab amacrine cells appear to be post-synaptic to type b (depolarizing) bipolar cells, and this can account for red light- induced depolarization of Ab amacrine cells, if we assume tha t bipolar cell-to-Ab amacrine cell transmission is sign conserving. Naka ('77) has shown tha t bipolar cell-to-ganglion cell transmission is always sign conserving. At the very least, a most general assumption would allow some Ab amacrine cells to be depolarized even if others are hyperpolarized.
GABA-ergic Ab amacrine cells make syn- apses upon type b bipolar cell ATs, and these synapses could generate an antagonistic sur- round in type b bipolar cells comparable to the action of HCs on cones in the OPL, but inde- pendent of and in addition to i t . Surround antagonism in hyperpolarizing bipolar cells of the turtle retina persists after blocking HC responses with atropine (Piccolino and Gerschenfeld, '77). Amacrine cells could medi- a te surround antagonism under these condi- tions and it is likely that depolarizing (type b)
242 R. E. MARC, W. K. STELL, D. BOK AND D. M. K. LAM
II . . . . . . . . . ..;At;.:; _ . . . . I 7 ..._.
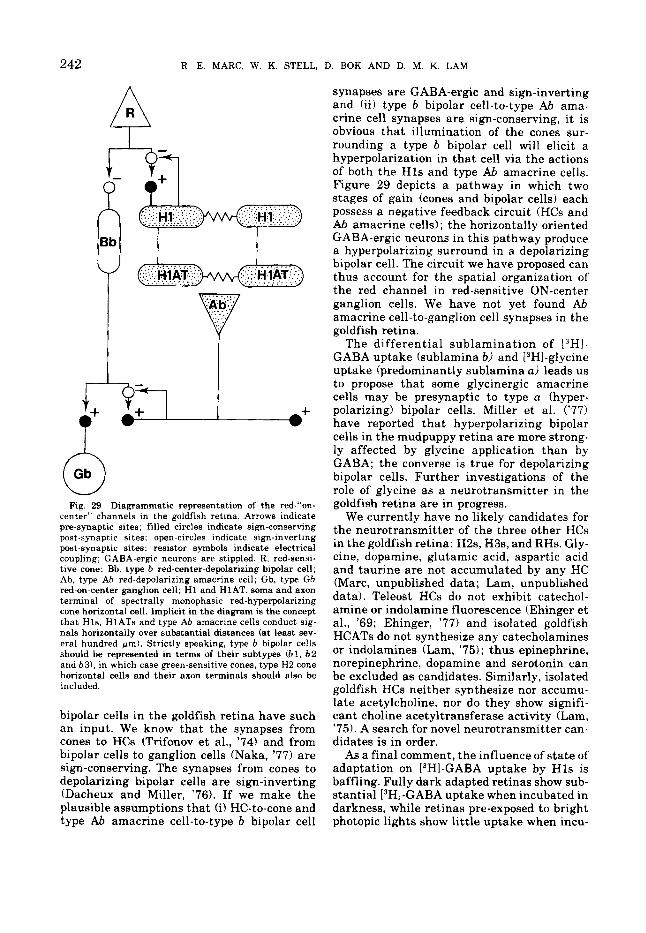
Fig. 29 Diagrammatic representation of the red-"on- center" channels in the goldfish retina. Arrows indicate pre-synaptic sites; filled circles indicate sign-conserving post-synaptic sites: open-circles indicate sign-inverting post-synaptic sites; resistor symbols indicate electrical coupling; GABA-ergic neurons are stippled. R, red-sensi- tive cone; Bb, type b red-center-depolarizing bipolar cell; Ab, type Ab red-depolarizing amacrine cell; Gb, type Gb red-on-center ganglion cell; H1 and HIAT, soma and axon terminal of spectrally monophasic red-hyperpolarizing cone horizontal cell. Implicit in the diagram is the concept that Hls, HlATs and type Ab amacrine cells conduct sig- nals horizontally over substantial distances (at least sev- eral hundred pm). Strictly speaking, type b bipolar cells should be represented in terms of their subtypes (61, b 2 and b3), in which case green.sensitive cones, type H2 cone horizontal cells and their axon terminals should also be included.
bipolar cells in the goldfish retina have such an input. We know that the synapses from cones to HCs (Trifonov et al., '74) and from bipolar cells to ganglion cells (Naka, '77) are sign-conserving. The synapses from cones to depolarizing bipolar cells are sign-inverting (Dacheux and Miller, '76). If we make the plausible assumptions that (i) HC-to-cone and type Ab amacrine cell-to-type b bipolar cell
synapses are GABA-ergic and sign-inverting and (ii) type b bipolar cell-to-type Ab ama- crine cell synapses are sign-conserving, it is obvious that illumination of the cones sur- rounding a type b bipolar cell will elicit a hyperpolarization in that cell via the actions of both the Hls and type Ab amacrine cells. Figure 29 depicts a pathway in which two stages of gain (cones and bipolar cells) each possess a negative feedback circuit (HCs and Ab amacrine cells) ; the horizontally oriented GABA-ergic neurons in this pathway produce a hyperpolarizing surround in a depolarizing bipolar cell. The circuit we have proposed can thus account for the spatial organization of the red channel in red-sensitive ON-center ganglion cells. We have not yet found Ab amacrine cell-to-ganglion cell synapses in the goldfish retina.
The differential sublamination of [3H1- GABA uptake (sublamina b) and PHI-glycine uptake (predominantly sublamina a) leads us to propose that some glycinergic amacrine cells may be presynaptic to type a (hyper- polarizing) bipolar cells. Miller et al. ('77) have reported that hyperpolarizing bipolar cells in the mudpuppy retina are more strong- ly affected by glycine application than by GABA; the converse is true for depolarizing bipolar cells. Further investigations of the role of glycine as a neurotransmitter in the goldfish retina are in progress.
We currently have no likely candidates for the neurotransmitter of the three other HCs in the goldfish retina: H2s, H3s, and RHs. Gly- cine, dopamine, glutamic acid, aspartic acid and taurine are not accumulated by any HC (Marc, unpublished data; Lam, unpublished data). Teleost HCs do not exhibit catechol- amine or indolamine fluorescence (Ehinger et al., '69; Ehinger, '77) and isolated goldfish HCATs do not synthesize any catecholamines or indolamines (Lam, '75) ; thus epinephrine, norepinephrine, dopamine and serotonin can be excluded as candidates. Similarly, isolated goldfish HCs neither synthesize nor accumu- late acetylcholine, nor do they show signifi- cant choline acetyltransferase activity (Lam, '75). A search for novel neurotransmitter can- didates is in order.
As a final comment, the influence of state of adaptation on VHI-GABA uptake by Hls is baffling. Fully dark adapted retinas show sub- stantial PHI-GABA uptake when incubated in darkness, while retinas pre-exposed to bright photopic lights show little uptake when incu-
GABA-ERGIC PATHWAYS IN THE GOLDFISH RETINA 243
bated in darkness. Teleologically there is some sense in the observation, for there is no obvi- ous reason for Hls to release inhibitory neu- rotransmitter onto cones when the mean quantum flux is several log units below cone threshold. All bipolar cells which contact rods in the goldfish retina also contact cones (Stell, ’67; Stell et al., ’771, consequently near rod threshold the release of neurotransmitter by cones would constitute a background level against which the light responses of rods would be superimposed. In effect the mixed rod-cone bipolar cells would be performing a neurochemical increment threshold task, which is not conducive to maintaining the high sensitivity expected in rod channels. The implication of our uptake data is that Hls, and by extension cones, are actually hyperpo- larized after prolonged dark adaptation and that this tonic hyperpolarization is released when the mean quantum flux reaches cone threshold. Until this idea has been tested elec- trophysiologically, we shall remain uncertain of the effect of light- and dark-adaptation on the operation of type H1 cone horizontal cells.
ACKNOWLEDGMENTS
We wish to thank David Lightfoot and Caryl Schechter for technical assistance, Andrew Ishida for discussions and editorial assistance, and Joyce Whatley for typing the manuscript. This research was supported in part by NIH Post-doctoral Fellowship EY07024 awarded to REM; NIH Research Grants EY02576 (REM), EY01190 (WKS), EY00444 (DB) and EY02423 (DMKL); a Research Career Development Award to DMKL; and NIH Research Center Grant EY0331 to the Jules Stein Eye Insti- tute, Bradley R. Straatsma, Principle Investi- gator.
LITERATURE CITED
Baylor, D. A., M. G. F. Fuortes and P. M. O’Bryan 1972 Re- ceptive fields of cones in the retina of the turtle. J. Physiol., 214: 265-295.
Bennett, Jr. J. P., W. J. Logan and S. H. Snyder 1973 Amino acids as central nervous transmitters: the influence of ions, amino acid analogues, and ontogeny on transport systems for L-glutamic and L-aspartic acids and glycine into central nervous synaptosomes of the rat. J. Neu- rochem., 21: 1533-1550.
Bok, D., and R. W. Young 1972 The renewal of diffusely distributed protein in the outer segments of rods and cones. Vision Res., 12: 161-168.
Burkhardt, D. A. 1977 Respnses and receptive-field or- ganization of cones in perch retinas. J. Neurophysiol., 40: 53-62.
Chan, R. Y. 1976 Spatial Dynamics of Vertebrate Reti- nal Neurons. Doctoral thesis, California Institute of
Cutler, R. W. P., and D. S. Dudzinski 1974 Effect of pen- toharbitol on uptake and release of 13HI-GABA and I’T- glutamate by brain slices. Brain Res., 67: 546.548.
Dacheux, R. F., and R. F. Miller 1976 Photoreceptor-bipolar cell transmission in the perfused retina eyecup of the mudpuppy. Science, 191: 963-964.
Davidoff, R. A., and R. Adair 1976 GABA and glycine transport in frog CNS: high affinity uptake and potassium-evoked release in uttro. Brain Res., 118: 403-415.
Dowling, J. E., and B. Ehinger 1975 Synaptic organization of the amine-containing interplexiform cells of the goldfish and Cebus monkey retinas. Science, 188: 270-273.
Ehinger, B., B. Falck and A. M. Laties 1969 Adrenergic neurons in teleost retina. 2. Zellforsch, 97: 285-297.
Ehinger, B., and L. Nordenfelt 1977 Destruction of retinal dopamine-containing neurons in rabbit and goldfish. Exp. Eye Res., 24: 179-187.
Famiglietti, Jr., E. V., A. Kaneko and M. Tachibana 1977 Neuronal architecture of on and off pathways to ganglion cells in carp. Science, 196: 1267-1269.
Fukuortani, K., K. -I. Hara and Y. Oomura 1975 Dynamic characteristics of the receptive field of L-cells in the carp retina. Vision Res., 15: 1403-1406.
Fuortes, M. G. F., E. A. Schwartz and E. J.Simon 1973 Col- our-dependence of cone responses in the turtle retina. J. Physiol., 234: 199-216.
Gerschenfeld, H. M., and M. Piccolino 1977 Muscarinic antagonists block cone to horizontal cell transmission in the retina. Nature, 268: 257-259.
Graham, L. J. 1972 lntraretinal distribution of GABA content and GAD activity. Brain Res., 36: 476-479.
Graham, L. J., C. F. Baxter and R. N. Lolley 1970 In uiuo in- fluence of light and darkness on the GABA system in the retina of the frog (Ranapipiensi Brain Res., 20: 379-388.
Hall Z. W., M. D. Bownds and E. A. Kravitz 1970 The me- tabolism of y-aminobutyric acid in the lobster nervous system. J. Cell Biol., 46: 290-299.
Hammerstad, J. P., and R. W. P. Cutler 1972 Efflux of amino acid neurotransmitters from brain slices: role of membrane transport. Eur. J. Pharmacol., 20: 118-121.
Hashimoto, Y., A. Kata, M. Inokuchi and K. Watanabe 1976 Re-examination of horizontal cells in the carp retina with procion yellow electrode. Vision Res., 16: 25-30.
Iverson, L. L. 1971 Role of transmitter uptake mecha- nisms in synaptic neurotransmission. Brit. J. Pharmacol., 41: 571-591.
Iverson, L. L., and M. J. Neal 1968 The uptake of 1 % - GABA by slices of rat cerebral cortex. J. Neurochem., 15: 1141- 1149.
Johnston, G. A. R. 1976 Physiologic pharmacology of GABA and its antagonists in the vertebrate nervous sys- tem. In: GABA in Nervous System Function. Kroc Foun- dation Series. Vol. 5. E. Roberts, T. N. Chase and D. Tower, eds. Raven Press, New York, pp. 395-412.
Effects of calcium on the potassium-stimu- lated release of radioactive p-alanine and y-aminobutyric acid from slices of rat cerebral cortex and spinal cord. Brain Res., 121: 179-181.
Kaneko, A. 1970 Physiological and morphological iden- tification of horizontal, bipolar and amacrine cells in goldfish retina. J. Physiol., 207: 623-633.
Kaneko, A., and M. Yamada 1972 S-potentials in the dark adapted retina of the carp. J. Physiol., 227: 261-273.
Lam, D. M. K. The biosynthesis and content of y- aminobutyric acid in the goldfish retina. J. Cell qiol., 54: 225-231.
1977
1972
Technology. 1975 Biosynthesis of y-aminobutyric acid by iso-
244 R. E. MARC, W. K. STELL. D. BOK AND D. M. K. LAM
lated axons of cone horizontal cells in the goldfish retina. Nature. 254. 345-347.
Synaptic chemistry of identified cells in the vertebrate retina. In: Cold Spring Harbor Symp. Quant. Biol.. Vol. 40. Cold Spring Harbor Laboratory, Cold Spring Harbor. New York. pp. 571-579.
Lam, D. M. K.. and L. Steinman 1971 The uptake of Iy-jHI aminobutyric acid in the goldfish retina. Proc. Nat. Acad. Sci. (U.S.A.), 68: 2771~2781.
Levy. W. B , D. A Redburn and C. W. Cotman 1973 Stimu- lus-coupled secretion of y-aminobutyric acid from rat brain synaptosomes. Science. 181: 676-678.
Marc. R. E.. and H. G. Serling 1976a Color receptor iden- tities of goldfish cones. Science, 191. 487-489.
The chromatic organization of the gold- fish cone mosaic Vision Res.. 26: 1211-1224.
Martin. D. L. 19'76 Carrier-mediated transport and re- moval of GABA from synaptic reBons. In: GABA in Ner- vous System Function. Kroc Foundation Series. Vol. 5. E. Roberts. T N Chase and D. Tower. eds. Raven Press, New York. pp. 34'7-386.
Miller. R F.. R. F. Dacheux and T. E. Frumkes 1977 Amacrine cells in Necturus retina: evidence for indepen~ dent y- aminobutyric acid- and glycine-releasing new Tons. Science. 198: 748-750.
Mitari. G.. T Asano and Y. Miyake 1974 Identification of five types of S-potential and their corresponding generat- ing sites in horizontal cells of the carp retina. Jap. J . Opthalmol.. 28: 161-176.
Murakami. M , and Y. Shimoda 1977 Identification of amacrine and ganglion cells in the carp retina. J. Physiol.. 264: 801-818.
Naka. K.-I. 1977 Functional organization of catfish reti- na. J . Neurophysiol.. 40: 26-43.
Naka, K. -I., P. Z. Marmarelis and R. Y. Chan 1975 Morpho- logxal and functional identifications of catfish retinal neurons. 111. Functional identification. J. Neurophysiol.. 38: 92-131.
Norton. A. L.. H. Spekreijse. M. Wolbarsht and H. G. Wagner 1968 Receptive-field organization of the S- potential. Science, 260: 1021-1022.
Parthe. V. 1967 Celulas horizontales y amacrinas de la retina Acta Cient. Venezolana. (Suppl.). 3; 240-249.
Peck. Jr.. E. J.. J . M. Schaeffer, A. J . Miller and J . H. Clark 1976 Analysis of receptive sites in synaptosomal f r a c ~ tions. In: Neurotransmitters. Hormones and Receptors: Novel Approaches. J . A. Ferrendelli, B. S. McEwen, S. H. Snyder. eds. Society for Neuroscience. Bethesda. Mary- land. pp. 1-27.
Peck. Jr . . E. J.. J. M. Schaeffer and J . H Clark 1976b In pursuit of the GABA receptor. In: GABA in Nervous Sys- tem Function. Kroc Foundation Series. Vol. 5. E. Roberts.
1976
1976b
T. N. Chase and D. Tower, eds. Raven Press, New York, pp. 319-336.
Piccolino, M.. and H. M. Gerschenfeld 1977 Lateral in- teractions in the outer plexiform layer of turtle retinas after atropine block of horizontal cell. Nature, 268: 259-261.
Spekreijse, H., and A. L. Norton 1970 The dynamic charac~ teristics of color-coded S-potentials. J. Gen. Physiol., 56. 1-15.
Starr, M. S. Effect of dark adaptation on the GABA system in the retina. Brain Res., 59: 331-338.
Stell, W. K. 1967 The structure and relationships of horizontal cells and photoreceptor-bipolar synaptic com- plexes in goldfish retina. Am. J. Anat.. 122: 401-423.
Horizontal cell axons and axon terminals in goldfish retina. J. Comp. Neur., 159: 503-519.
Functional polarization of horizontal cell dendrites in goldfish retina. Invest. Opthalmol., 15: 895-908.
Stell, W. K., and F. 1. Harosi 1976 Cone structure and visual pigment content in the retina of the goldfish. Vision Res., 16: 647-657.
Stell, W. K., A. T. Ishida and D. 0. Lightfoot 1977 Struc- tural basis for on- and off-center response in retinal bipo- lar cells. Science, 198: 1269-1271.
Stell. W. K., and D. 0. Lightfoot 1975 Color-specific inter- connections of cones and horizontal cells in the retina of the goldfish. J. Comp. Neur.. 159: 473-502.
Stell, W. K., D. 0. Lightfoot. T. G. Wheeler and H. F. Leeper 1975 Goldfish retina: functional polarization of horizon- tal cell dendrites and synapses. Science, 190: 989-990.
Toyoda, J -I. 19'74 Frequency characteristics of retinal neurons in the carp. J. Gen. Physiol., 63: 214-234.
Toyoda. J.-I., and H. Kondo 1976 Comparison of frequency characteristics of photopic and scotopic S-potentials in the carp. Jap. J. Physiol., 26: 591-601.
Trifonov, Yu. A., A. L. Byzov and L. M. Chailahian 1974 Electrical properties of subsynaptic and nonsynaptic membranes of horizontal cells in fish retina. Vision Res.. 14: 229-241.
Voaden. M. J., J. Marshall and N. Murani 1974 The uptake of 13HI-y-amino-butyric acid and [JHl-glycine by the iso- lated retina of the frog. Brain Res., 67: 115-132.
White, T. D. 1976 Models for neuronal noradrenalin uptake. In: The Mechanism of Neuronal and Ex- traneuronal Transport of Catecholamines. D. M. Paton, ed. Raven Press, New York, pp. 175-193.
Witkovsky, P., and J. E. Dowling 1969 Synaptic relation- ships in the plexiform layers of the carp retina. 2. Zellforsch., 100: 60-82.
Yamada, E., and T. Ishikawa 1965 Fine structure of the horizontal cells in some vertebrate retinae. Cold Spring Harbor Symp. Quant. Biol., 30: 383-392.
1973
1975
1976
GABA-ERGIC PATHWAYS IN THE GOLDFISH RETINA
APPENDIX
245
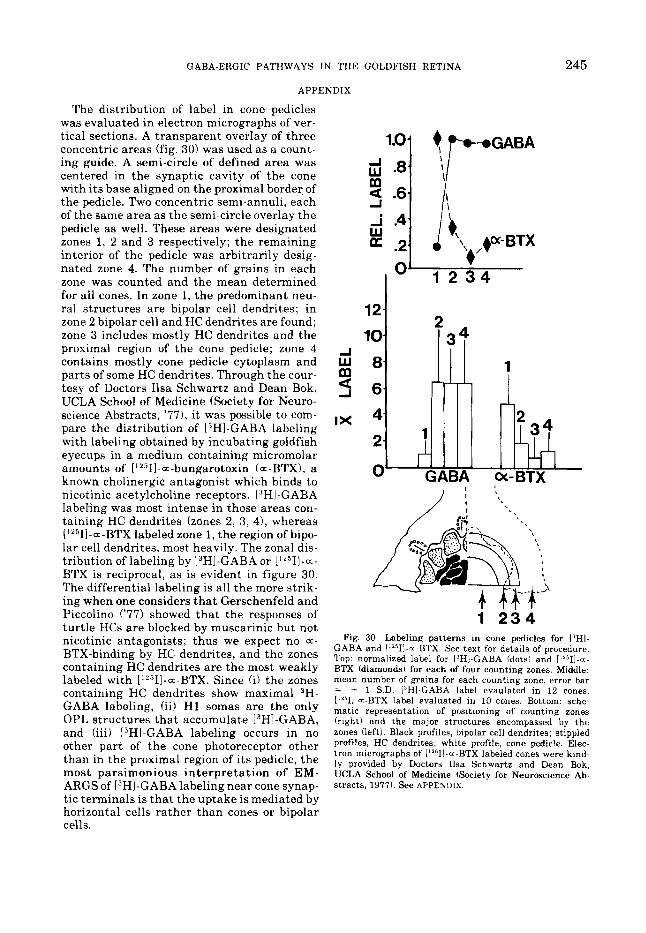
The distribution of label in cone pedicles was evaluated in electron micrographs of ver- tical sections. A transparent overlay of three concentric areas (fig. 30) was used as a count- ing guide. A semi-circle of defined area was centered in the synaptic cavity of the cone with i ts base aligned on the proximal border of the pedicle. Two concentric semi-annuli, each of the same area as the semi-circle overlay the pedicle as well. These areas were designated zones 1, 2 and 3 respectively; t he remaining interior of the pedicle was arbitrarily desig- nated zone 4. The number of grains in each zone was counted and the mean determined for all cones. In zone 1, the predominant neu- ral structures are bipolar cell dendrites; in zone 2 bipolar cell and HC dendrites are found; zone 3 includes mostly HC dendrites and the proximal region of the cone pedicle; zone 4 contains mostly cone pedicle cytoplasm and parts of some HC dendrites. Through the cour- tesy of Doctors Ilsa Schwartz and Dean Bok, UCLA School of Medicine (Society for Neuro- science Abstracts, '771, it was possible to com- pare the distribution of "HI-GABA labeling with labeling obtained by incubating goldfish eyecups in a medium containing micromolar amounts of [ ' '511-a-bungarotoxin (= -BTX), a known cholinergic antagonist which binds to nicotinic acetylcholine receptors. 13H1-GABA labeling was most intense in those areas con- taining HC dendrites (zones 2, 3, 41, whereas ["511-a-BTX labeled zone 1, t he region of bipo- lar cell dendrites, most heavily. The zonal dis- tribution of labeling by 13HI-GABA or 1"511-a- BTX is reciprocal, as is evident in figure 30. The differential labeling is all the more strik- ing when one considers t ha t Gerschenfeld and Piccolino ('77) showed tha t the responses of turtle HCs are blocked by muscarinic but not nicotinic antagonists; thus we expect no a-
BTX-binding by HC dendrites, and the zones containing HC dendrites a re the most weakly labeled with ['L511-=-BTX. Since (i) the zones containing HC dendrites show maximal 3H- GABA labeling, (ii) H 1 somas are the only OPL structures tha t accumulate [3HI-GABA, and (iii) PHI-GABA labeling occurs in no other part of t he cone photoreceptor other than in the proximal region of i ts pedicle, the most parsimonious in te rpre ta t ion of EM- ARGS of [3HI-GABA labeling near cone synap- tic terminals is tha t the uptake is mediated by horizontal cells rather than cones or bipolar cells.
.8 9 -6
i .4
a .2
-I
W
I i 1 2 3 4
1
1 2 3 4 Fig. 30 Labeling patterns in cone pedicles for PHI-
GABA and I'2511-~-BTX. See text for details of procedure. Top: normalized label for ['HI-GABA (dots) and [''511-m- BTX (diamonds) for each of four counting zones. Middle: mean number of grains for each counting zone, error bar = + 1 S.D. 13Hl-GABA label evaulated in 12 cones, ['''II-a-BTX label evaluated in 10 cones. Bottom: sche- matic representation of positioning of counting zones (right) and the major structures encompassed by the zones (left), Black profiles, bipolar cell dendrites; stippled profiles, HC dendrites; white profile, cone pedicle. Elec- tron micrographs of I"'II-.--BTX labeled cones were kind- ly provided by Doctors Ilsa Schwartz and Dean Bok, UCLA School of Medicine (Society for Neuroscience Ab- stracts, 1977). See APPENDIX.
Copyright © 2022 FDOKUMEN