Analysis of Spontaneous MEG Activity in Mild Cognitive ... - GIB
Upload
independentCategory
view
6download
0
GABA-ergic Modulation of Prefrontal Spatio-temporalActivation Pattern during Emotional Processing:
A Combined fMRI/MEG Study with Placeboand Lorazepam
Georg Northoff1,2, Thomas Witzel2, Andre Richter2,Matthias Gessner2, Florian Schlagenhauf 2,3, Jurgen Fell2,
Frank Baumgart4, Thomas Kaulisch4, Claus Tempelmann2,Alexander Heinzel1,2, Rolf Kotter3, Tilman Hagner2, Bela Bargel2,Hermann Hinrichs2, Bernhard Bogerts2, Henning Scheich4, and
Hans-Jochen Heinze2
Abstract
& Various prefrontal cortical regions have been shown to beactivated during emotional stimulation, whereas neurochem-ical mechanisms underlying emotional processing in theprefrontal cortex remain unclear. We therefore investigatedthe influence of the GABA-A potentiator lorazepam onprefrontal cortical emotional–motor spatio-temporal activationpattern in a combined functional magnetic resonance imaging/magnetoencephalography study. Lorazepam led to the reversalin orbito-frontal activation pattern, a shift of the early magnetic
field dipole from the orbito-frontal to medial prefrontal cortex,and alterations in premotor/motor cortical function duringnegative and positive emotional stimulation. It is concludedthat negative emotional processing in the orbito-frontal cortexmay be modulated either directly or indirectly by GABA-Areceptors. Such a modulation of orbito-frontal cortical emo-tional function by lorazepam has to be distinguished from itseffects on cortical motor function as being independent fromthe kind of processing either emotional or nonemotional. &
INTRODUCTION
Several imaging studies have demonstrated strongactivation in the orbito-frontal, lateral prefrontal, andpremotor cortex in healthy subjects during emotionalprocessing (Northoff, Richter, et al., 2000; Buchel, Mor-ris, Dolan, & Friston, 1998; LaBar, Gatenby, Gore, Le-Doux, & Phelps, 1998; Baker, Frith, & Dolan, 1997;Imaizumi et al., 1997; Irwin et al., 1997; Lane, Reimann,Ahern, Schwartz, & Davidson, 1997; Lane, Reimann,Bradley, et al., 1997; Paradiso et al., 1997; Phillips et al.,1997; Morris et al., 1996, 1998; George et al., 1995;Pardo, Pardo, & Raichle, 1993). Most studies reportactivation of different cortical regions during negativeand positive emotional processing (Northoff, Richter,et al., 2000; Baker et al., 1997; Imaizumi et al., 1997;Irwin et al., 1997; Lane, Reimann, Ahern, et al., 1997;Lane, Reimann, Bradley, et al., 1997; Morris et al., 1996,1998; George et al., 1995) whereas only some authorspostulate similar neuroanatomical substrates for pro-
cessing of negative and positive emotions in the pre-frontal cortex (Beauregard et al., 1998) and/or amygdala(Phelps, LaBar, Gatenby, O’Connor, & Gore, 1998;Breiter et al., 1996). Several authors found activation(i.e., positively correlated activity) in the orbito-frontalcortex during negative emotional stimulation as well asactivation in the lateral prefrontal cortex in positiveemotions (Northoff, Richter, et al., 2000; Mayberg et al.,1999; Morris et al., 1998; Baker et al., 1997; Irwin et al.,1997; Paradiso et al., 1997; Philipps et al., 1997; Georgeet al., 1995; Pardo et al., 1993). In a study conducted byour own group (Northoff, Richter, et al., 2000) we founda high proportion of decreases in signal (i.e., negativelycorrelated activity) in the orbito-frontal cortex duringpositive emotions whereas in negative emotions signaldecreases were most pronounced in the lateral pre-frontal cortex. Depending on the interpretation ofsignals decreases (i.e., negatively correlated activity;see Methodological Limitations), these findings wouldbe in accordance with PET studies reporting increasesand decreases in activity in similar regions. Baker et al.(1997) found increased orbito-frontal and decreasedlateral prefrontal cortical activity during negative emo-
1Harvard University, 2Otto-von-Guericke University of Magde-burg, 3University of Dusseldorf, 4Leibnitz Institute for Neuro-biology
D 2002 Massachusetts Institute of Technology Journal of Cognitive Neuroscience 14:3, pp. 348–370
tional stimulation, which has been supported by otherstudies (Mayberg et al., 1999; Paradiso et al., 1997;George et al., 1995). In contrast, positive emotionalstimulation led to decreased orbito-frontal (Paradiso etal., 1997) and increased lateral prefrontal (Baker et al.,1997) cortical activity.
Considering such patterns of concurrent increasesand decreases in signals in the orbito-frontal and lateralprefrontal cortex, the question for the mechanisms oftheir apparently reciprocal functional regulation arises.Since emotional processing, especially negativeemotional processing, seems to be closely related toGABA-A receptors in both animals (Corda et al., 1997;Crestani et al., 1999) and humans (Ferrara et al., 1999;Spanaki et al., 1999; Northoff, Krill, Eckert, Russ, & Pflug,1998; Northoff, Steinke, Czerwenka, Danos, & Bogerts,1999; Garcia et al., 1997), it may be hypothesized thatsuch patterns of concurrent signal increases and de-creases may be modulated (or even at least partiallyregulated) by substances, such as benzodiazepines, act-ing on GABA-A receptors (Raichle, 1998). There hasbeen a study with midazolam, a benzodiazepine, show-ing dose-dependent decrease of regional cerebralblood flow (rCBF) in the orbito-frontal cortex (Veselis,Reinsel, & Feshchenko, 1998). However, modulation ofregional prefrontal cortical function during emotionalprocessing by benzodiazepines has never been demon-strated in humans. We therefore investigated theinfluence of a benzodiazepine, lorazepam, whichshows a particularly strong anxiolytic effect (Northoffet al., 1999), on prefrontal cortical (see Figure 1)activity pattern during negative and positive emotionalprocessing in a double-blind placebo-controlled studydesign.
RESULTS
Behavioral Data
Placebo
Reaction times are shown in Table 1. Variance analysisdid not show any significant differences ( p = .735)among the four conditions.
Preexperimental psychological states as measuredwith the Befindlichkeitsskala (BFs, see Methods) re-vealed a value of 13.33 ± 5.01 indicating no major stressin the actual psychological state. Ratings of valence,dominance, and arousal of pictures from InternationalAffective Picture System (IAPS, see Methods) in healthysubjects did not differ from ratings in the already inves-tigated healthy population (Lang, Bradley, & Cuthbert,1997; Hamm & Vaitl, 1993).
Lorazepam
Reaction times are shown in Table 1. There were nosignificant differences ( p = .821) among the four con-
ditions within each group. However, analysis of variance(ANOVA) revealed a significant effect for group (F = 4.2,p = .036) with post hoc t tests showing significantdifferences between lorazepam and placebo subjectsin negative ( p = .023), positive ( p = .021), and neutral( p = .032) conditions.
Preexperimental states as measured with the BFsbefore application of lorazepam showed no significantdifferences (14.56 ± 6.4) compared to subjects withplacebo. Ratings of valence, dominance, and arousal ofpictures from IAPS (see Methods) in healthy subjectswith lorazepam did not differ from ratings in subjectswith placebo.
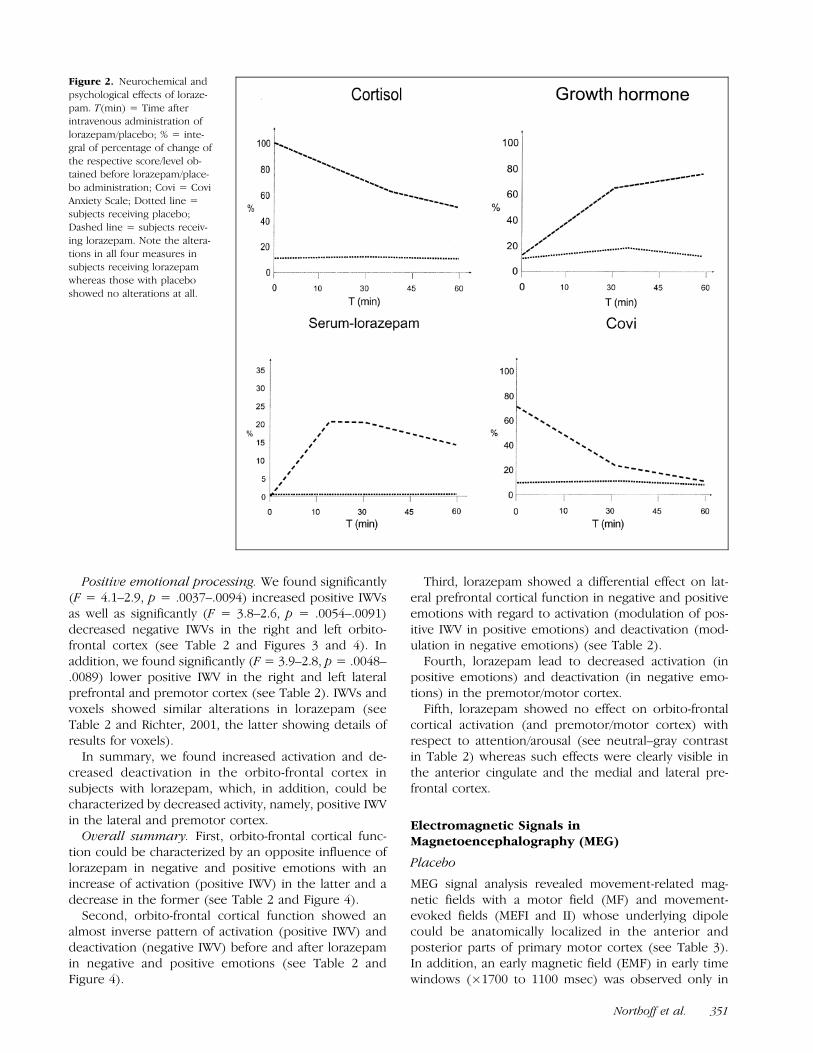
Physiological and psychological measures of the effi-cacy of lorazepam/placebo can be seen in Figure 2. Onlysubjects with lorazepam showed alterations in all meas-ures corresponding to findings by other authors (Hom-mer et al., 1986), whereas subjects receiving placeboshowed no alterations at all.
In summary, subjects with lorazepam showed signifi-cantly longer reaction times in negative, positive, andneutral conditions than subjects receiving placebo.
Cortical Activation in Functional MagneticResonance Imaging (fMRI)
Placebo
Negative and positive emotional pictures led to differentactivation patterns in the orbito-frontal, lateral prefron-tal, and premotor cortex. Negative emotional picturesinduced strong signal increases in both magnitude andextent [i.e., positively correlated intensity weighted vol-ume (IWVs) and voxels] in the medial orbito-frontalcortex and concomitant marked signal decreases (i.e.,negatively correlated activity) in the lateral prefrontalcortex, whereas positive emotional processing could becharacterized by an inverse pattern with strong signalincrease in the lateral prefrontal cortex and markedsignal decrease in the orbito-frontal cortex (see Table 2and Figures 3 and 4 as well as Richter, 2001; Northoff,Richter, et al., 2000, for further details).
Lorazepam
Group � Region interaction as calculated by multivariateANOVA (MANOVA) was (marginally) significant in theorbito-frontal (F = 4.1, p = .021), lateral prefrontal (F =2.3, p = .051), and premotor (F = 3.9, p = .013) cortex.
Negative emotional processing. We found signifi-cantly (F = 4.8–2.7, p = .0021–.0098) lower positiveIWV in the right and left orbito-frontal cortex in thenegative–gray and negative–positive contrasts in loraze-pam compared to placebo (see Table 2 and Figures 3and 4). Furthermore, we found significantly (F = 3.9–3.1, p = .0036–.0089) decreased negative IWVs in theanterior cingulate, right and left lateral prefrontal, pre-
Northoff et al. 349

motor, and motor cortex in the negative contrasts (seeTable 2). IWVs and voxels showed similar alterations inlorazepam (see Table 2 and Richter, 2001, the lattershowing details of results for voxels).
In summary, we found significantly decreased posi-tively correlated activity in the orbito-frontal cortex aswell as significantly decreased negatively correlatedactivity in the lateral and premotor cortex in lorazepam.
Figure 1. Placement of slices
and determination of regions of
interest (ROIs). Midsagittal viewof slice placement (T1-weighted
spin-echo sequences). Five
images of contiguous oblique–
axial planes with slice thicknessof 8 mm and 64 � 64 voxels in
plane were obtained from the
whole frontal lobe. Slice angleswere approximately 408 relative
to the AC–PC line. In each slice,
different anatomical ROIs were
outlined anatomically withoutfunctional overlays. Regions
were defined by landmarks ac-
cording to Talairach coordi-
nates (Talairach & Tounoux,1988) covering the orbito-fron-
tal, lateral prefrontal, medial
prefrontal, cingular, premotor,
and motor areas. Numberswithin the different regions
show the respective Brod-
mann’s area. The two lower-most slices, as indicated with an
arrow in A, are shown with their
respective ROIs.
Table 1. Reaction Times (msec) in Subjects With Placebo (n = 8) and Lorazepam (n = 8)
Subjects/Condition Negative Positive Neutral Gray
Placebo 516.84 ± 161.29 521.38 ± 177.89 533.61 ± 186.30 452.09 ± 140.36
Lorazepam 848.35 ± 287.11* 785.12 ± 240.18* 769.98 ± 206.61* 593.23 ± 127.44
*Significant difference (p < .05, corrected) between placebo and lorazepam.
350 Journal of Cognitive Neuroscience Volume 14, Number 3
Positive emotional processing. We found significantly(F = 4.1–2.9, p = .0037–.0094) increased positive IWVsas well as significantly (F = 3.8–2.6, p = .0054–.0091)decreased negative IWVs in the right and left orbito-frontal cortex (see Table 2 and Figures 3 and 4). Inaddition, we found significantly (F = 3.9–2.8, p = .0048–.0089) lower positive IWV in the right and left lateralprefrontal and premotor cortex (see Table 2). IWVs andvoxels showed similar alterations in lorazepam (seeTable 2 and Richter, 2001, the latter showing details ofresults for voxels).
In summary, we found increased activation and de-creased deactivation in the orbito-frontal cortex insubjects with lorazepam, which, in addition, could becharacterized by decreased activity, namely, positive IWVin the lateral and premotor cortex.
Overall summary. First, orbito-frontal cortical func-tion could be characterized by an opposite influence oflorazepam in negative and positive emotions with anincrease of activation (positive IWV) in the latter and adecrease in the former (see Table 2 and Figure 4).
Second, orbito-frontal cortical function showed analmost inverse pattern of activation (positive IWV) anddeactivation (negative IWV) before and after lorazepamin negative and positive emotions (see Table 2 andFigure 4).
Third, lorazepam showed a differential effect on lat-eral prefrontal cortical function in negative and positiveemotions with regard to activation (modulation of pos-itive IWV in positive emotions) and deactivation (mod-ulation in negative emotions) (see Table 2).
Fourth, lorazepam lead to decreased activation (inpositive emotions) and deactivation (in negative emo-tions) in the premotor/motor cortex.
Fifth, lorazepam showed no effect on orbito-frontalcortical activation (and premotor/motor cortex) withrespect to attention/arousal (see neutral–gray contrastin Table 2) whereas such effects were clearly visible inthe anterior cingulate and the medial and lateral pre-frontal cortex.
Electromagnetic Signals inMagnetoencephalography (MEG)
Placebo
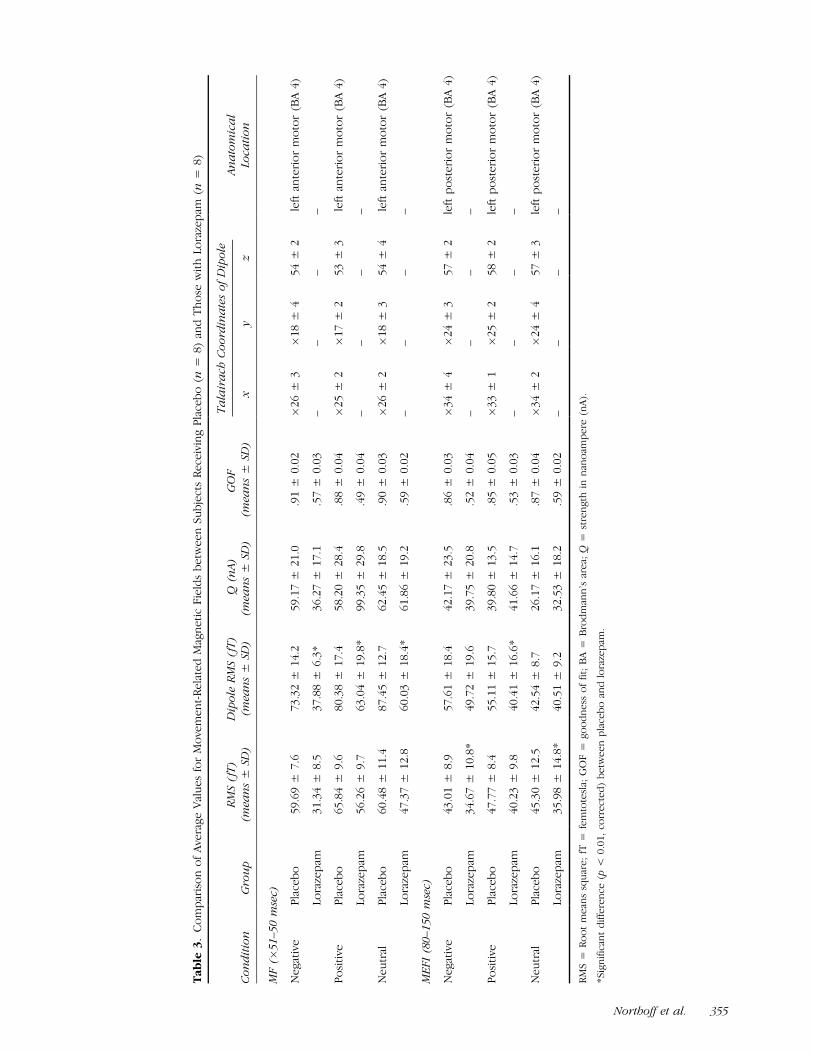
MEG signal analysis revealed movement-related mag-netic fields with a motor field (MF) and movement-evoked fields (MEFI and II) whose underlying dipolecould be anatomically localized in the anterior andposterior parts of primary motor cortex (see Table 3).In addition, an early magnetic field (EMF) in early timewindows (�1700 to 1100 msec) was observed only in
Figure 2. Neurochemical and
psychological effects of loraze-
pam. T(min) = Time afterintravenous administration of
lorazepam/placebo; % = inte-
gral of percentage of change of
the respective score/level ob-tained before lorazepam/place-
bo administration; Covi = Covi
Anxiety Scale; Dotted line =subjects receiving placebo;
Dashed line = subjects receiv-
ing lorazepam. Note the altera-
tions in all four measures insubjects receiving lorazepam
whereas those with placebo
showed no alterations at all.
Northoff et al. 351

Tab
le2.
Gro
up
Me
ans
of
Act
ivit
yin
the
Pre
fro
nta
lC
ort
ical
Re
gio
ns
du
rin
gN
eg
ativ
ean
dP
osi
tive
Em
oti
on
sin
fMR
Iin
Su
bje
cts
wit
hP
lace
bo
and
Lora
zep
am
Orb
ito
-Fro
nta
l(B
A1
1,1
2)
An
teri
or
Cin
gula
te(B
A2
4,2
)
Med
ial
Pre
fro
nta
l(B
A8
,9,1
0)
Late
ral
Pre
fro
nta
l(B
A9
,45
,46
,47
)P
rem
oto
r(B
A6
)M
oto
r(B
A4
)
Gro
up
Rig
ht
Left
Rig
ht
Left
Rig
ht
Left
Rig
ht
Left
Rig
ht
Left
Ne
gat
ive
em
oti
on
s
Ne
g–
Ne
ut
Pla
ceb
o8
7/�
11
07
4/�
17
34
6/�
17
25
2/�
93
55
/�1
33
14
1/�
20
51
55
/�3
59
61
/�6
85
9/�
66
25
/�3
72
9/�
47
Lora
zep
am8
1/�
86
65
/�1
12
42
/�1
25
61
/�6
87
4/�
40
90
/�1
90
15
1/�
15
0*
57
/�2
1*
60
/�3
55
4/�
39
64
/�2
8
Ne
g–
gra
yP
lace
bo
28
8/�
24
82
39
/�3
14
13
6/�
24
91
41
/�1
68
19
0/�
18
33
17
/�6
81
33
6/�
77
81
00
/�2
98
14
7/�
32
51
30
/�1
36
14
8/�
15
5
Lora
zep
am1
33
*/2
02
11
9*
/�2
09
87
/�1
14
*1
21
/�1
25
14
4/�
51
26
5/�
22
4*
34
3/�
22
6*
15
6/�
64
*1
68
/�4
7*
13
6/�
54
*1
30
/�5
3*
Po
siti
vee
mo
tio
ns
Po
s–N
eu
tP
lace
bo
67
/�1
53
63
/�1
47
74
/�6
01
18
/�6
61
04
/�6
83
14
/�2
13
51
8/�
26
02
56
/�3
33
32
/�4
61
00
/�4
31
08
/�5
4
Lora
zep
am1
68
*/�
13
22
45
*/�
11
3*
16
3*
/�1
64
*1
14
/�1
28
17
7/�
11
02
08
*/�
23
64
65
/�3
53
59
*/�
59
87
*/�
68
50
/�2
49
1/�
47
Po
s–g
ray
Pla
ceb
o1
23
/�2
24
10
9/�
15
89
5/�
49
16
1/�
99
16
5/�
87
50
8/�
26
76
79
/�2
31
33
9/�
48
43
4/�
57
12
2/�
90
12
3/�
81
Lora
zep
am2
11
*/�
10
4*
18
1*
/�1
59
15
2*
/�4
61
87
/�8
21
61
/�5
13
45
*/�
85
*4
83
*/�
13
01
40
*/�
19
12
3*
/�2
31
24
/�1
11
22
/�5
0
Ne
g–
Po
sP
lace
bo
17
5/�
10
71
31
/�1
46
52
/�8
89
0/�
11
57
0/�
15
51
39
/�3
12
15
0/�
50
02
9/�
19
64
1/�
24
35
5/�
73
35
/�8
5
Lora
zep
am6
6*
/�1
03
44
*/�
15
15
6/�
14
43
6/�
10
63
5/�
55
50
/�1
58
*1
32
/�2
10
*1
1/�
26
*2
3/�
27
*1
9/�
44
36
/�2
5
Ne
ut–
gra
yP
lace
bo
84
/�6
27
2/�
48
40
/�3
88
6/�
49
93
/�3
31
34
/�1
62
19
9/�
19
35
1/�
42
10
4/�
80
15
/�2
91
7/�
61
Lora
zep
am9
2/�
57
82
/�5
61
71
*/�
57
18
3/�
74
16
5/�
55
42
1*
/�1
15
45
9*
/�1
67
75
/�3
48
9/�
47
70
/�3
53
5/�
85
+=
po
siti
vely
corr
ela
ted
IWV
s;�
=n
eg
ativ
ely
corr
ela
ted
IWV
s;IW
V=
inte
nsi
tyw
eig
hte
dvo
lum
e(p
rod
uct
of
pe
rce
nta
ge
of
acti
vati
on
sign
alan
dvo
lum
e,m
l);
BA
=B
rod
man
n’s
are
a;N
eg
=n
eg
ativ
eem
oti
on
alp
ictu
res;
Po
s=
po
siti
veem
oti
on
alp
ictu
res;
Neu
t=
neu
tral
pic
ture
s;G
ray
=gra
yp
ictu
res.
*S
ign
ific
ant
dif
fere
nce
(p<
.01
)b
etw
ee
np
lace
bo
and
lora
zep
am.
352 Journal of Cognitive Neuroscience Volume 14, Number 3

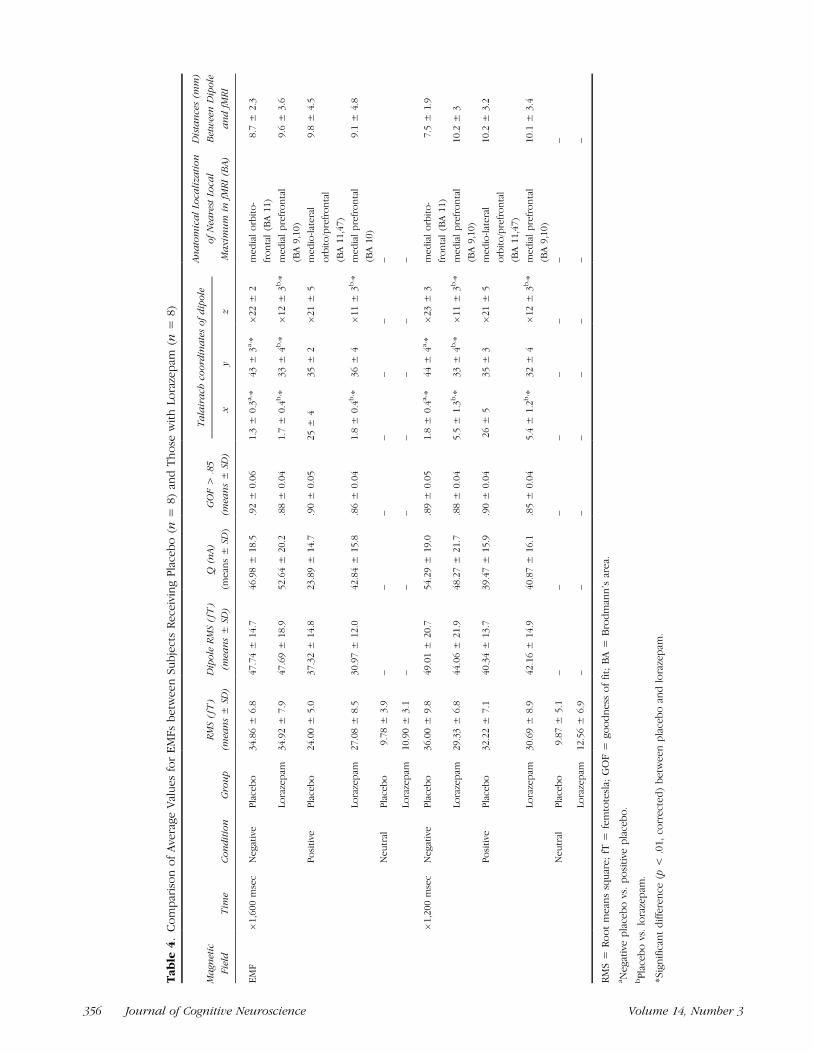
positive and negative emotional processing (see Table 4and Figures 5 and 6) but not in either of the controlconditions (neutral, gray). EMF showed an earlier onset,a higher strength, and a more medially oriented orbito-frontal location of underlying dipole in negative picturesthan in positive pictures where a later onset, lowerstrength, and a more laterally orbito-frontal/prefrontalcortical anatomical localization of the underlying dipolewas observed (see Northoff, Richter, et al., 2000, forfurther details).
Lorazepam
Movement-related magnetic field. Subjects with loraze-pam showed significantly lower strength (RMS, dipole
RMS) in MF and MEFI and II in all four conditionsindependent of emotional or non-emotional stimulation(see Table 3). Dipole RMS in the MF were significantlylower in negative (F = 2.8, p = .023) and positive (F =3.2, p = .031) pictures as well as in motor-evoked fields(MEF) in positive (F = 2.9, p = .034) pictures (seeTable 3).
EMF. No differences in strength of EMFs were foundbetween the placebo and the lorazepam group (seeTable 4).
Dipole source analysis. Dipoles for MF and MEFIshowed quite low goodness-of-fit (GOF) so that, un-like in subjects receiving placebo, no satisfactory di-poles could be obtained in subjects with lorazepam.The dipole underlying the EMF in the negative andpositive pictures was no longer located in the orbito-
Figure 3. Localization of fMRI
activity and the dipole of the
EMF from MEG each matchedinto the same individual anato-
mical MRI image in a subject
with lorazepam. (A) Activated
areas and dipole of EMF innegative emotions in a subject
with placebo. (B) Activated
areas and dipole of EMF innegative emotions in a subject
with lorazepam. (1) Lowermost
slice (see also Figure 1). (2)
Second lowermost slice (seealso Figure 1). White pixels =
positively-correlated voxels;
Black pixels = negatively-corre-
lated voxels; Squares = dipoleof the EMF. The fMRI activity
and the EMF dipoles are loca-
lized in adjacent brain areas.
EMF dipoles and nearest localmaximum of regional activation
in fMRI are separated by 7.2 mm
in the subject with placebo (A)and by 7.9 mm in the subject
with lorazepam (B). Note the
shift of localization of fMRI
signals and dipoles from EMF inthe subject with lorazepam.
Northoff et al. 353

frontal cortex as in subjects with placebo but rathermore superior and posterior in the medial prefrontalcortex (BA 8,10) in subjects receiving lorazepam (seeTable 4 and Figures 3, 6, and 7). We found statisticallysignificant differences (F = 9.3–2.8, p = .000012–.032)between placebo and lorazepam in negative emotionsin all three coordinates (x, y, z) at �1600 and �1200msec (see Table 4 and Figure 7). In positive emo-tions, dipole location differed significantly (F = 7.5–3.2, p = .000023–.010) in x and Z coordinates be-tween placebo and lorazepam at �1600 and �1200msec (see Table 4 and Figure 7). In addition, wefound significant (F = 6.8–3.4, p = .00045–.036)differences in dipole location (x, y) between negativeand positive emotions in placebo that were not foundin subjects receiving lorazepam (see Table 4 andFigure 7).
In summary, subjects receiving lorazepam were char-acterized by a significantly different dipole localization ofEMFs in the medial prefrontal cortex (and no longer inthe orbito-frontal cortex as in subjects with placebo) as
well as by significantly reduced strength in movement-related magnetic fields.
Correlations Between MRI/MEG Signals andBehavioral Measures
Placebo
Significant correlations were found only in negativeemotional processing but not in contrasts involvingpositive emotional pictures. In the negative–gray con-trast, significant positive correlations among reactiontime and right medial prefrontal (r = .714/p = .049)and right motor (r = .679/p = .044) cortical signalincreases were obtained (i.e., the longer the reactiontime, the more signal increases). In addition, reactiontime in negative emotional processing correlated signifi-cantly (r = .934/.879, p = .021/.031) with magnetic fieldstrength (RMS/dipole RMS) in EMF (the longer thereaction time, the higher magnetic field strength)whereas such significant correlations were not foundin any other condition (positive, neutral, gray).
Figure 4. Means and SD of activity in the orbito-frontal cortex during negative and positive emotions in subjects with placebo and lorazepam in
fMRI. (1) Negative emotions; (2) Positive emotions. (a) Activation (positive IWV). (b) Deactivation (negative IWV). *Significant difference (p < .05,
corrected, Mann–Whitney U tests) between subjects with placebo and lorazepam. IWV = Intensity weighted volumes (product of the absolute
number of voxels and average signal change in each ROI in all slices; Positive IWV = positively-correlated activity, i.e., IWV (positive numbers,probably reflecting activation); Negative IWV = negatively-correlated activity, i.e., IWV (negative numbers, probably reflecting deactivation). Note
first the opposite influence of lorazepam on activation (positive IWV) in the orbito-frontal cortex in negative and positive emotions and, second, an
almost reversed pattern of orbito-frontal cortical activation and deactivation in negative and positive emotions in subjects with placebo and
lorazepam.
354 Journal of Cognitive Neuroscience Volume 14, Number 3
Tab
le3.
Co
mp
aris
on
of
Ave
rag
eV
alu
es
for
Mo
vem
en
t-R
ela
ted
Mag
ne
tic
Fie
lds
be
twe
en
Su
bje
cts
Re
ceiv
ing
Pla
ceb
o(n
=8
)an
dT
ho
sew
ith
Lora
zep
am(n
=8
)
Ta
lair
ach
Co
ord
ina
tes
of
Dip
ole
Co
nd
itio
nG
rou
p(m
ean
s±
SD)
(mea
ns
±SD
)(m
ean
s±
SD)
(mea
ns
±SD
)x
yz
Loca
tio
n
MF
(�5
1–
50
mse
c)
Ne
gat
ive
Pla
ceb
o5
9.6
9±
7.6
73
.32
±1
4.2
59
.17
±2
1.0
.91
±0
.02
�2
6±
3�
18
±4
54
±2
left
ante
rio
rm
oto
r(B
A4
)
Lora
zep
am3
1.3
4±
8.5
37
.88
±6
.3*
36
.27
±1
7.1
.57
±0
.03
––
––
Po
siti
veP
lace
bo
65
.84
±9
.68
0.3
8±
17
.45
8.2
0±
28
.4.8
8±
0.0
4�
25
±2
�1
7±
25
3±
3le
ftan
teri
or
mo
tor
(BA
4)
Lora
zep
am5
6.2
6±
9.7
63
.04
±1
9.8
*9
9.3
5±
29
.8.4
9±
0.0
4–
––
–
Ne
utr
alP
lace
bo
60
.48
±1
1.4
87
.45
±1
2.7
62
.45
±1
8.5
.90
±0
.03
�2
6±
2�
18
±3
54
±4
left
ante
rio
rm
oto
r(B
A4
)
Lora
zep
am4
7.3
7±
12
.86
0.0
3±
18
.4*
61
.86
±1
9.2
.59
±0
.02
––
––
ME
FI
(80
–1
50
mse
c)
Ne
gat
ive
Pla
ceb
o4
3.0
1±
8.9
57
.61
±1
8.4
42
.17
±2
3.5
.86
±0
.03
�3
4±
4�
24
±3
57
±2
left
po
ste
rio
rm
oto
r(B
A4
)
Lora
zep
am3
4.6
7±
10
.8*
49
.72
±1
9.6
39
.75
±2
0.8
.52
±0
.04
––
––
Po
siti
veP
lace
bo
47
.77
±8
.45
5.1
1±
15
.73
9.8
0±
13
.5.8
5±
0.0
5�
33
±1
�2
5±
25
8±
2le
ftp
ost
eri
or
mo
tor
(BA
4)
Lora
zep
am4
0.2
3±
9.8
40
.41
±1
6.6
*4
1.6
6±
14
.7.5
3±
0.0
3–
––
–
Ne
utr
alP
lace
bo
45
.30
±1
2.5
42
.54
±8
.72
6.1
7±
16
.1.8
7±
0.0
4�
34
±2
�2
4±
45
7±
3le
ftp
ost
eri
or
mo
tor
(BA
4)
Lora
zep
am3
5.9
8±
14
.8*
40
.51
±9
.23
2.5
3±
18
.2.5
9±
0.0
2–
––
–
RM
S=
Ro
ot
me
ans
squ
are
;fT
=fe
mto
tesl
a;G
OF
=g
oo
dn
ess
of
fit;
BA
=B
rod
man
n’s
are
a;Q
=st
ren
gth
inn
ano
amp
ere
(nA
).
*S
ign
ific
ant
dif
fere
nce
(p<
0.0
1,co
rrect
ed
)b
etw
een
pla
ceb
oan
dlo
raze
pam
.
RM
S(f
T)
Dip
ole
RM
S(f
T)
Q(n
A)
GO
FA
na
tom
ica
l
Northoff et al. 355
Tab
le4.
Co
mp
aris
on
of
Ave
rag
eV
alu
es
for
EM
Fs
be
twe
en
Su
bje
cts
Re
ceiv
ing
Pla
ceb
o(n
=8
)an
dT
ho
sew
ith
Lora
zep
am(n
=8
)
Ma
gnet
ic
Fie
ldT
ime
Co
nd
itio
nG
rou
p
RM
S(
fT)
(mea
ns
±SD
)
Dip
ole
RM
S(
fT)
(mea
ns
±SD
)
Q(n
A)
(mean
s±
SD)
GO
F>
.85
(mea
ns
±SD
)
An
ato
mic
al
Loca
liza
tio
n
of
Nea
rest
Loca
l
Ma
xim
um
infM
RI
(BA
)
Dis
tan
ces
(mm
)
Bet
wee
nD
ipo
le
an
dfM
RI
EM
F�
1,6
00
mse
cN
egat
ive
Pla
ceb
o34.8
6±
6.8
47.7
4±
14.7
46.9
8±
18.5
.92
±0.0
61.3
±0.3
a, *
43
±3
a, *
�22
±2
med
ial
orb
ito
-
fro
nta
l(B
A11)
8.7
±2.3
Lora
zep
am34.9
2±
7.9
47.6
9±
18.9
52.6
4±
20.2
.88
±0.0
41.7
±0.4
b, *
33
±4
b, *
�12
±3
b, *
med
ial
pre
fro
nta
l
(BA
9,1
0)
9.6
±3.6
Po
siti
veP
lace
bo
24.0
0±
5.0
37.3
2±
14.8
23.8
9±
14.7
.90
±0.0
525
±4
35
±2
�21
±5
med
io-l
atera
l
orb
ito
/pre
fro
nta
l
(BA
11,4
7)
9.8
±4.5
Lora
zep
am27.0
8±
8.5
30.9
7±
12.0
42.8
4±
15.8
.86
±0.0
41.8
±0.4
b, *
36
±4
�11
±3
b, *
med
ial
pre
fro
nta
l
(BA
10)
9.1
±4.8
Neu
tral
Pla
ceb
o9.7
8±
3.9
––
––
––
–
Lora
zep
am10.9
0±
3.1
––
––
––
–
�1,2
00
mse
cN
egat
ive
Pla
ceb
o36.0
0±
9.8
49.0
1±
20.7
54.2
9±
19.0
.89
±0.0
51.8
±0.4
a, *
44
±4
a, *
�23
±3
med
ial
orb
ito
-
fro
nta
l(B
A11)
7.5
±1.9
Lora
zep
am29.3
3±
6.8
44.0
6±
21.9
48.2
7±
21.7
.88
±0.0
45.5
±1.3
b, *
33
±4
b, *
�11
±3
b, *
med
ial
pre
fro
nta
l
(BA
9,1
0)
10.2
±3
Po
siti
veP
lace
bo
32.2
2±
7.1
40.3
4±
13.7
39.4
7±
15.9
.90
±0.0
426
±5
35
±3
�21
±5
med
io-l
atera
l
orb
ito
/pre
fro
nta
l
(BA
11,4
7)
10.2
±3.2
Lora
zep
am30.6
9±
8.9
42.1
6±
14.9
40.8
7±
16.1
.85
±0.0
45.4
±1.2
b, *
32
±4
�12
±3
b, *
med
ial
pre
fro
nta
l
(BA
9,1
0)
10.1
±3.4
Neu
tral
Pla
ceb
o9.8
7±
5.1
––
––
––
––
Lora
zep
am12.5
6±
6.9
––
––
––
––
RM
S=
Ro
ot
me
ans
squ
are
;fT
=fe
mto
tesl
a;G
OF
=g
oo
dn
ess
of
fit;
BA
=B
rod
man
n’s
are
a.aN
eg
ativ
ep
lace
bo
vs.
po
siti
vep
lace
bo
.bP
lace
bo
vs.
lora
zep
am.
*S
ign
ific
ant
dif
fere
nce
(p<
.01,
corr
ect
ed
)b
etw
een
pla
ceb
oan
dlo
raze
pam
.
Ta
lair
ach
coo
rdin
ate
so
fd
ipo
le
xy
z
356 Journal of Cognitive Neuroscience Volume 14, Number 3
In summary, subjects receiving placebo showed sig-nificantly positive correlations of reaction time withsignal increases in right medial prefrontal/motor cortexand EMF strength only in negative emotional processingbut not in any other condition.
Lorazepam
Reaction time correlated significantly negative with sig-nals in the lateral prefrontal cortex in gray–neutral(signal decrease in right hemisphere: r = �.821, p =.023), gray–positive (signal decrease in right hemi-sphere: r = �.786, p = .036), and gray–negative (signalincrease in left hemisphere: r = �.786, p = .036)contrasts (i.e., the longer reaction time, the less signals(increases or decreases) in the lateral prefrontal cortex).In addition, reaction time correlated significantly nega-tive with signal decreases in right orbito-frontal cortex(neutral–negative: r = �.857, p = .014) and left motorcortex (positive–negative: r = �.793, p = .033) (i.e., the
longer reaction time, the less signal decreases). Reactiontimes correlated significantly negative with strength(RMS/dipole RMS) of MF and MEF in positive (r =�.876–.912, p = .034–.049), negative (r = �.821–.895,p = .033–.045), and neutral (r = �.899–.902, p = .021–.032) conditions (i.e., the longer reaction time, the lowermagnetic field strength).
In summary, subjects receiving lorazepam showedsignificantly negative correlations of reaction time withsignal decreases in the orbito-frontal, lateral prefrontal,orbito-frontal, and motor cortex as well as with strengthof movement-related magnetic fields.
DISCUSSION
We investigated the influence of lorazepam in a double-blind study design on prefrontal cortical spatio-temporalactivation pattern during negative and positive emo-tional processing combining fMRI and MEG. We ob-tained the following main findings: (1) Reversal of
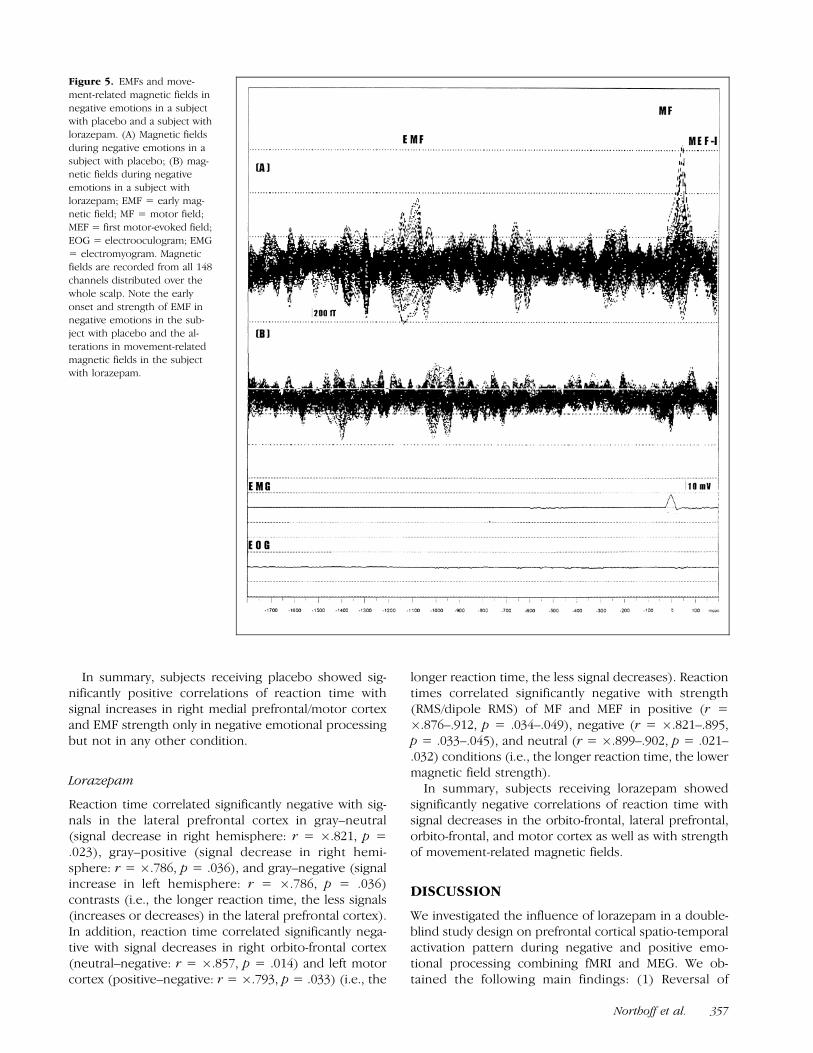
Figure 5. EMFs and move-
ment-related magnetic fields in
negative emotions in a subjectwith placebo and a subject with
lorazepam. (A) Magnetic fields
during negative emotions in a
subject with placebo; (B) mag-netic fields during negative
emotions in a subject with
lorazepam; EMF = early mag-netic field; MF = motor field;
MEF = first motor-evoked field;
EOG = electrooculogram; EMG
= electromyogram. Magneticfields are recorded from all 148
channels distributed over the
whole scalp. Note the early
onset and strength of EMF innegative emotions in the sub-
ject with placebo and the al-
terations in movement-related
magnetic fields in the subjectwith lorazepam.
Northoff et al. 357
orbito-frontal cortical activity (i.e., signal increases) infMRI with low activity in negative pictures and highactivity in positive pictures by lorazepam; (2) inductionof a shift in location of dipole underlying the emotionallyrelated EMF from orbito-frontal to medial prefrontalcortex in positive and negative emotional processingby lorazepam; (3) alteration in cortical motor function
as reflected in lower premotor/motor cortical signals andreduced strength in movement-related magnetic field insubjects receiving lorazepam.
Results in the present study confirm our initial hy-pothesis of a relationship between orbito-frontal corticalactivity and GABA-ergic neurotransmission during neg-ative and positive emotional processing. The exact kind
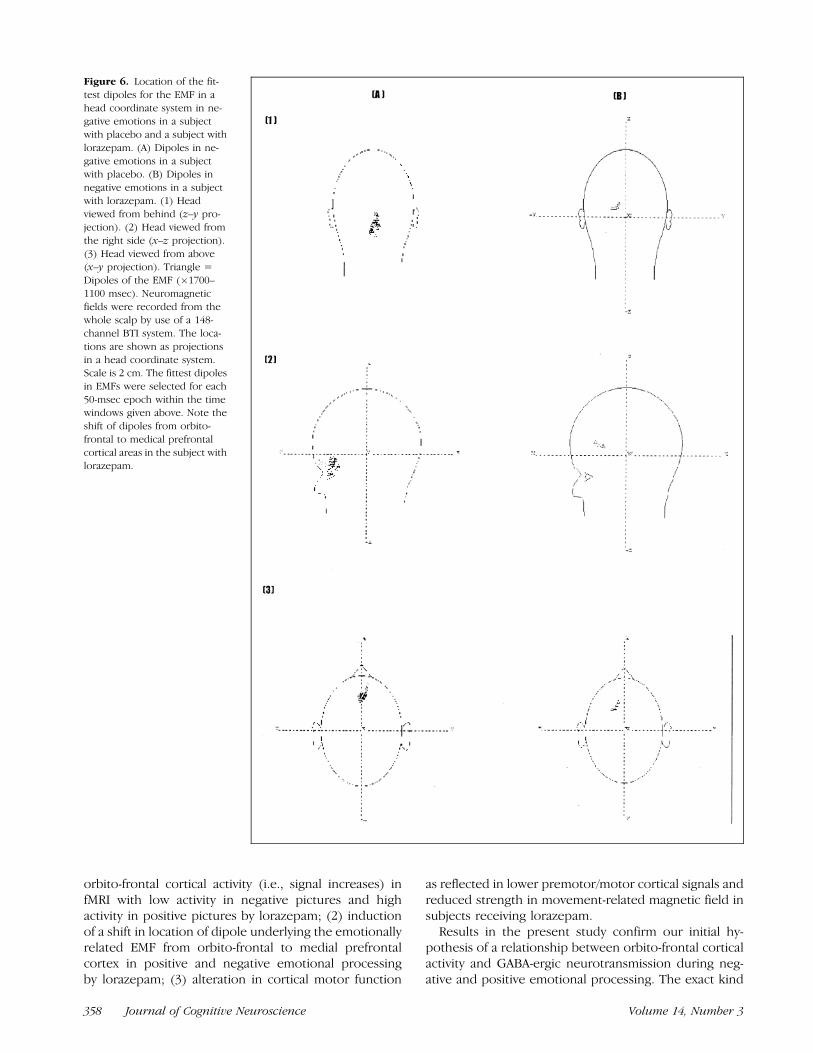
Figure 6. Location of the fit-
test dipoles for the EMF in a
head coordinate system in ne-gative emotions in a subject
with placebo and a subject with
lorazepam. (A) Dipoles in ne-
gative emotions in a subjectwith placebo. (B) Dipoles in
negative emotions in a subject
with lorazepam. (1) Headviewed from behind (z–y pro-
jection). (2) Head viewed from
the right side (x–z projection).
(3) Head viewed from above(x–y projection). Triangle =
Dipoles of the EMF (�1700–
1100 msec). Neuromagnetic
fields were recorded from thewhole scalp by use of a 148-
channel BTI system. The loca-
tions are shown as projections
in a head coordinate system.Scale is 2 cm. The fittest dipoles
in EMFs were selected for each
50-msec epoch within the timewindows given above. Note the
shift of dipoles from orbito-
frontal to medical prefrontal
cortical areas in the subject withlorazepam.
358 Journal of Cognitive Neuroscience Volume 14, Number 3

of relationship as well as underlying physiological mech-anisms, which however remain unclear, will be furtherdiscussed in the following sections.
In addition to orbito-frontal cortical modulation dur-ing emotional processing, results revealed alterations incortical motor function in subjects receiving lorazepam.One may consequently assume both emotional andmotor effects of lorazepam, which however may bedifficult to disentangle entirely in physiological terms.
GABA-ergic Modulation of Orbito-Frontal CorticalEmotional Processing
As has been demonstrated in healthy subjects withoutany application of benzodiazepines (Northoff, Richter,et al., 2000; Mayberg et al., 1999), negative and positiveemotional processing led to an almost inverse pattern ofconcurrent increases and decreases of signals in theorbito-frontal and lateral prefrontal cortex. The orbito-frontal and lateral prefrontal cortex could be character-ized by opposite kinds of activity with strong signalincreases in one region and concurrent strong signaldecreases in the other. Comparing negative and positiveemotional processing, one could find an inverse pattern
with regard to signal increases and decreases in bothregions. Consequently, one may assume that such op-posite kinds of activity in the orbito-frontal and lateralprefrontal cortex may be mutually dependent on eachother—such an assumption has been supported also bya review of several studies implicating both regions(Drevets & Raichle, 1998). However, mechanisms andfunctional regulation of such a mutual dependenceremain unclear. Since concurrent increases and de-creases of signals in the orbito-frontal and lateral pre-frontal cortex during emotional processing may bemodulated neurochemically by GABA-A receptors, weinvestigated the influence of lorazepam on these pat-terns of activity.
Our results reveal that the pattern of signal increasesand decreases in the orbito-frontal cortex was reversedalmost completely by lorazepam whereas such a reversalwas not obtained in the lateral prefrontal cortex. It is thisreversal of the pattern of signal increases and decreasesrather than the increases/decreases themselves that mustapparently be considered as specific for orbito-frontalcortical modulation by lorazepam. Though lorazepaminduced signal increases and decreases in other prefron-tal cortical regions as well as in the lateral prefrontal and
Figure 7. Plot of Talairach coordinates (x,y) (x,z) in negative and positive emotions for individual subjects with placebo (n = 8) and lorazepam
(n = 8) in MEG. (1) x–y Talairach coordinates. (2) x–z Talairach coordinates.
aSignificant difference in Talairach coordinates between placebo and lorazepam in negative emotions.bSignificant difference in Talairach coordinates between placebo and lorazepam in positive emotions.cSignificant difference in Talairach coordinates between negative and positive emotions in subjects with placebo.dSignificant difference in Talairach coordinates between negative and positive emotions in subjects with lorazepam..p < .05 (corrected).
Note first the distinction in localization between negative and positive emotions in subjects receiving placebo that is longer present in subjects with
lorazepam. Second, the influence of lorazepam on localization of dipoles in both negative and positive emotions is clearly visible.
Northoff et al. 359

premotor/motor cortex, such a reversal of the pattern ofincreases/decreases was observed in the orbito-frontalcortex exclusively. Assumption of specific relationshipbetween orbito-frontal cortical function and GABA-ergicmodulation by lorazepam is further supported by thefollowing findings: (1) Absence of any effects of loraze-pam on medial prefrontal cortical function; (2) shift ofdipole underlying the EMF from orbito-frontal cortex tomedial prefrontal cortex in subjects receiving lorazepam.
However, a relationship between orbito-frontal corti-cal function and GABA-ergic modulation by lorazepamdoes not necessarily imply that this relationship is spe-cific for emotional processing as in contrast to nonemo-tional processing. The following results do support theassumption that GABA-ergic modulation in the orbito-frontal cortex may be related rather with emotionalprocessing than with nonemotional processing: (1) Sig-nificant alterations in signal increases and decreases inthe orbito-frontal cortex in emotional contrasts espe-cially in positive emotions; (2) observation of orbito-frontal cortical reversal of signal increases and decreases(see above) only in emotional conditions (negative andpositive) whereas such a reversal could not be obtainedin nonemotional (neutral, gray) conditions; (3) changeof dipole location in both emotional conditions in sub-jects receiving lorazepam. One may, however, argue thateffects of lorazepam cannot be specifically related withemotional processing since changes in reaction time,premotor/motor cortex, and movement-related mag-netic fields occurred in both emotional and nonemo-tional conditions. These changes concern primarilyeffects of lorazepam on cortical motor function thatmay indeed be independent from the kind of processingeither emotional or nonemotional (see below for furtherdiscussion of these effects). One may consequently dis-tinguish between specific emotional orbito-frontal andnonspecific emotional premotor/motor cortical effects oflorazepam. However, emotional and motor effects oflorazepam may be difficult to disentangle in physiolog-ical terms, for example, in case of the lateral prefrontalcortex as being apparently involved in both kinds ofeffects. Although our results must be considered aspreliminary awaiting further empirical confirmation, thepresent results nevertheless present some evidence forthe assumption of particular involvement of orbito-fron-tal cortical function in emotional effects of lorazepam.
The orbito-frontal cortex, especially its medial part,receives strong afferents from the basal nucleus of theamygdala (Carmichael & Price, 1996; Barbas, 1995; More-craft, Geula, & Mesulam, 1992; Morecraft & Van Hoesen,1998), which by itself is closely related to negativeemotional processing (Breiter et al., 1996; Damasio,1997; Irwin et al., 1996, 1997, 1998; Morris et al., 1996,1998). Both the amygdala and the orbito-frontal cortexshow high densities of GABA-A receptors in certainsubregions (Carmichael & Price, 1994; Davis & RainnieCassell, 1994). Such anatomical and neurochemical fea-
tures of the orbito-frontal cortex could probably accountfor relationship between orbito-frontal signals and neu-rochemical stimulation with the GABA-A potentiatorlorazepam during negative and positive emotional stim-ulation as demonstrated in the present study. In addi-tion, the assumption of such a relationship betweenorbito-frontal signals and GABA-A receptors is furthersupported by Vesilis et al. (1998). They demonstrateddose-dependent decrease of rCBF in the orbito-frontalcortex after the application of midazolam (anotherbenzodiazepine more or less similiar to lorazepam)(Veselis et al., 1998).
The exact nature of the relationship between orbito-frontal signals and GABA-A receptors remains unclearsince relationship may be either direct or indirect.Assumption of a direct relationship would imply thatorbito-frontal cortical signals during emotional process-ing are directly modulated by GABA-A receptors. GABA-Areceptors exert an inhibitory influence on regional cer-ebral flow (Spanaki et al., 1999; Kelly & McCulloch,1983) and neuronal activity (Crestani et al., 1999). There-fore, one may assume that lorazepam, as a GABA-Apotentiator, may lead to an increase in neuronal inhib-ition in the orbito-frontal cortex. Assumption of a directand therefore causal relationship between GABA-A re-ceptors and emotional processing is supported by ani-mal studies showing alteration of neuronal activity in theamygdala, hippocampus, and cortical regions duringapplication of benzodiazepines (Crestani et al., 1999;Kalynchuk, Pearson, Pinel, & Meaney, 1999; Benarehaet al., 1998; Corda et al., 1997). In humans, it could bedemonstrated that benzodiazepines in healthy subjectslead to alteration in perception and subjective experi-ence of emotions (Ferrara et al., 1999; Garcia et al.,1997). Clinicotherapeutically, benzodiazepines, espe-cially lorazepam, show an almost immediate and dra-matic anxiolytic effect in diseases with strong orbito-frontal cortical alterations such as obsessive–compulsivedisorder (Coplan & Lydiard, 1998), panic disorder (Gor-man, Kent, Sullivan, & Coplan, 2000), and catatonia(Northoff, Wenke, Demisch, & Pflug, 1995; Northoff, inpress). The exact relationship between neuronal inhib-ition and the BOLD effect underlying generation ofsignals in fMRI remains however unclear since currentlythe exact relationship of BOLD signal to pre- and post-synaptic mechanisms of neurotransmission is not fullyunderstood (Raichle, 1998). Thus, it is conceivable thatincreases in fMRI signals may be related to eitherincreased excitatory or inhibitory mechanisms. Sincethe functional mechanisms between the BOLD effectunderlying fMRI signals and GABA-A receptors remainunclear (see Kelly & McCulloch, 1983) the assumption ofsuch a direct, namely, potentially causal relationshipbetween orbito-frontal signals and GABA-A receptorshas not been proven in humans yet.
Another potential mechanism by which lorazepammay influence orbito-frontal signals during emotional
360 Journal of Cognitive Neuroscience Volume 14, Number 3

processing may be the alteration of regional cerebralperfusion, which, via the BOLD effect, may then alterorbito-frontal signals. It has been demonstrated that theinhibition of GABA-A receptors by picrotoxin, a GABA-Ainhibitor, led to an increase in rCBF in rats (Formanet al., 1998). In accordance with these results, loraze-pam, as a GABA-A potentiator, and other GABA-ergicdrugs lead to the reduction of both regional (especiallyin the prefrontal cortex) and global cerebral blood flow(Spanaki et al., 1999; Wang et al., 1996; Matthew et al.,1995). Therefore, concomitant investigation of emotion-al/motor activation, rCBF, and GABA-A receptors wouldbe necessary in order to directly relate orbito-frontalcortical emotional processing with GABA-ergic control inhumans.
Alternatively, one may assume an indirect relation-ship between orbito-frontal cortical signals and GABA-Areceptors. For example, lorazepam may modulate neu-ronal networks implicated in attention as has beendemonstrated recently in the case of noradrenaline(Coull, Buchel, Friston, & Frith, 1999). Since lorazepammodulates attentional function (Ferrara et al., 1999),which by themselves may influence emotional process-ing, such an indirect effect of lorazepam on orbito-frontal cortical signals via attention cannot be excluded.Subjects receiving lorazepam showed peculiarities inthe gray–neutral contrast (see Results), which may berelated to an altered level of arousal/attention. Theseeffects were predominant in the anterior cingulate,lateral prefrontal cortex, and medial prefrontal cortex,whereas they were not observed in the orbito-frontalcortex (and premotor/motor cortex). Therefore, modu-lation of the orbito-frontal cortical activity by lorazepammay rather be related with emotional processing thanwith attentional/arousal effects. Although psychologicalstudies support the assumption of distinct and dissoci-able effects of lorazepam on emotional, attentional/arousal, and motor function (Ferrara et al., 1999; Garciaet al., 1997; Garcia, Micallef, Philoppot, Jouve, & Blin,2000), further imaging studies are needed to disentan-gle the respective underlying anatomo-physiologicaldetails.
Another possibility of an indirect relationship betweenorbito-frontal signals and GABA-A receptors would beGABA-ergic modulation in the occipital cortex whereGABA-A receptors show the highest density in the brain(see Northoff et al., 1999; Schroder, Bubeck, & Demisch,1997). Lorazepam may have bound to GABA-A receptorsand thus modulate neuronal activity in the occipitalcortex and may then, via functional connectivity, leadto consecutive alterations in signals in the amygdala andorbito-frontal/prefrontal cortex. Since we could not in-clude the occipital cortex in our fMRI measurements wecan neither verify nor falsify such an assumption. Otherregions such as the brain stem may be involved as wellsince it shows strong connections to both amygdala andorbito-frontal cortex. Finally, orbito-frontal cortical sig-
nals during emotional processing may be primarilymodulated by other transmitter systems than GABA,e.g., by serotoninergic (5-HT1a, 5-HT2a, etc.) or gluta-matergic (NMDA, Kainat, etc.) receptors that may inter-act with GABA-A receptors.
GABA-ergic Modulation of Premotor/MotorCortical Processing
In addition to alterations in orbito-frontal cortical acti-vation/deactivation pattern, we found significantchanges in the cortical motor function in subjects re-ceiving lorazepam, which is reflected in the followingresults: (1) Significantly lower signal increase and de-crease in the lateral prefrontal, premotor, and motorcortex in the lorazepam group; (2) significantly reducedstrength in movement-related magnetic fields in subjectswith lorazepam; (3) significantly longer reaction times insubjects receiving lorazepam than in those with placebo(see Preston, Ward, Broks, Traub, & Stahl, 1989; File &Lister, 1985); (4) significant correlation of reaction timeswith lateral prefrontal/motor cortical signal decrease andmovement magnetic field strength in the lorazepamgroup. In contrast to orbito-frontal cortical functionduring lorazepam, these changes in motor function wereindependent from the kind of condition either emo-tional or nonemotional.
Cortical motor function including planning, prepara-tion, initiation, and execution of movements has beenshown to be closely related with lateral prefrontal,premotor, and motor cortical activity (Jahanshahiet al., 1995). In addition, it has been demonstrated thatcortical motor function in these areas can be influencedby benzodiazepines (Northoff, Pfennig, et al., 2000) andare apparently modulated by GABA-ergic neurotransmis-sion (Kubota, 1996; Kurata & Hoffmann, 1994; Hikosaka,Tanaka, Sakamoto, & Iwamura, 1985). Therefore, ourfinding of alteration of cortical motor function by lor-azepam is in full accordance with these results.
Methodological Limitations
First, we applied several strategies to minimize arousaland attention effects, which, however, cannot be ex-cluded entirely in our activation paradigm. Positive,negative, and neutral pictures were matched for con-tent, dominance, and arousal (see Methods). Psycholog-ical states as measured with the BFs (see Methods) andsubjective evaluation of emotional pictures in our sub-jects did not differ from those of the respective normalpopulations. Consequently, differences between condi-tions in fMRI/MEG signals can neither be accounted forby increased preexperimental arousal nor by alteredemotional perception/attention in our subjects. In orderto exclude attentional/arousal effects related to switchesbetween different conditions, we eliminated all fMRI/MEG signals from analysis that were associated with the
Northoff et al. 361

first and last picture within each block. In addition, weincluded two nonemotional control conditions, gray andneutral pictures, accounting for potential effects ofarousal and attention by visual stimulation. Present fMRIresults suggest that emotional effects of lorazepam arereflected predominantly in modulation of orbito-frontalcortical function. In contrast, attentional/arousal effectsof lorazepam may rather be related with the anteriorcingulate and medial and lateral prefrontal cortex (seeabove). However, further studies are certainly necessaryto disentangle anatomo-physiological details of atten-tional/arousal and emotional effects of lorazepam.
Second, we did not investigate test–retest reliability,which, due to fast habituation processes as shown in aprevious study (Buchel et al., 1998; Whalen et al., 1998;Breiter et al., 1996), may methodologically be problem-atic. In order to avoid habituation of emotional stimula-tion in fMRI and MEG, both investigations wereundertaken in a random sequence, and blocks werecounterbalanced across fMRI/MEG investigations avoid-ing potential order effects.
Third, measurements in fMRI covered only the frontallobe whereas other regions of potential interest, forexample, the amygdala, could not be included. We usedslow but less noisy sequences in fMRI in order to avoidfurther additional stress as well as interference withemotional stress. The orbito-frontal cortex is close toregions with a high potential for magnetic susceptibilityartifact. Given the unpredictable effects on T2-weightedsignal change from regions with high susceptibility, we,based on the work of Breiter et al. (1996, 1997), checkedand confirmed that the activations seen in our experi-ment did not overlap regions of susceptibility artifact onthe functional images, otherwise (i.e., if the artifact wasas high or even higher than the stimulus-correlatedactivity) they were excluded from analysis. We includedonly stimulus-correlated variation in signal intensity thatis more or less independent of overall signal intensity. Inaddition, susceptibility artifacts may rather reduce thedetection of stimulus-correlated variation in signal in-tensity, which supports the assumption that orbito-frontal activity as detected in negative emotions couldnot be accounted for by artifacts. Even if we cannotexclude differences in signal-to-noise ratios betweendifferent regions entirely, we nevertheless comparedstandard deviations of activity between the orbito-frontalcortex and other regions of interest (ROIs). Orbito-frontal activity showed no higher standard deviationsthan other regions so that there seems to be no majordifference in this regard.
Fourth, we found a high proportion of negativelycorrelated activity in fMRI that can be interpreted inseveral ways. Negatively correlated activity in fMRI,which was particularly strong in negative emotions,could reflect a decrease of neuronal activity with neuralinhibition in the activation condition, an increase ofneuronal activity in the control condition, or an altered
coupling mechanism between oxygen consumption andrCBF. Several PET studies found concomitant increasesand decreases in rCBF during emotional stimulation(Drevets & Raichle, 1998; Baker et al., 1997; Lane,Reimann, Ahern, et al., 1997; Lane, Reimann, Bradley,et al., 1997; Paradiso et al., 1997; Reimann et al., 1997;George et al., 1995) so that it seems quite plausible, atleast in the present study, to relate such signal decreasesas negatively correlated voxels to decreased regionalactivity in either of the two conditions within therespective contrast. Regions that are activated duringnegative emotions, for example, the orbito-frontal cor-tex, may be suppressed (or deactivated) in neural pro-cessing of positive pictures and vice versa (see Drevets &Raichle, 1998).
Fifth, we did not explicitly investigate visual atten-tional functions that could be related to EMFs. However,our findings of considerable differences in strength ofEMF between negative and neutral emotional picturesmakes such an explanation rather unlikely since bothkind of pictures differed only in emotional valence butneither in dominance nor in arousal (see Methods). Eyemovements cannot account for EMF since electrooculo-gram (EOG) was measured in MEG (but not in fMRI; seeMethods) with rejection of contaminated electromag-netic signals so that electroocular artifacts were ex-cluded from analysis. In addition, all subjects had tofixate on a central fixation point during the presentationof each picture in MEG and fMRI in order to avoid eyemovements. Even if eye movements were present, theywould rather lead to activation in the superior medialprefrontal cortex (BA 6 and 8) (Bodis-Wollner et al.,1997; Darby et al., 1996) than in the orbito-frontal andinferior prefrontal cortex as obtained in the presentstudy. Alterations in EEG induced by emotions havebeen shown in several studies before (Aftanas et al.,1998; Pizzagalli, Koenig, Regard, & Lehmann, 1998;Pihan, Altenmuller, & Ackermann, 1997; Schupp, Cuth-bert, Bradley, Birbaumer, & Lang, 1997; Naumann, Bar-tussek, Diedrich, & Laufer, 1992; Naumann, Bartussek,Diedrich, Vogelbacher, & Mehrtens, 1993), which fur-ther support our assumption of a specific relationship ofthe EMF with emotional stimulation (see also Northoff,Richter, et al., 2000). Nevertheless, the exact interpreta-tion of the EMF remains unclear. Since it occurred 400–500 msec (subtraction of reaction time from the time ofonset of the movements, which was used as a trigger)before the appearance of a new picture, one mayinterpret the EMF as a sort of contingent negativevariance (CNV). However, a CNV should have been oflonger temporal duration until the appearance of thenext picture, which was not the case.
Sixth, in investigating the prefrontal cortical spatio-temporal activation pattern, we combined fMRI andMEG. Techniques with high spatial (fMRI) and hightemporal (MEG) resolution have been advantageouslycombined before (Northoff, Richter, et al., 2000; Heinze
362 Journal of Cognitive Neuroscience Volume 14, Number 3

et al., 1994), particularly in movements (Joliot et al.,1998; Stippich et al., 1998; Sanders, Lewine, & Orrison,1996). Though there are several methodological prob-lems applying two techniques with different neurophy-siological substrates, blood oxygenic (fMRI) andelectromagnetic (MEG) activity, the above-cited studieshave nevertheless shown high coincidence betweenboth kinds of signals (Northoff, Richter, et al., 2000;Joliot et al., 1998; Stippich et al., 1998; Sanders et al.,1996; Heinze et al., 1994). Consequently, combiningspatial and temporal measures with fMRI and MEGmay further reveal similarities and differences in physio-logical mechanisms in negative and positive emotionalprocessing. In addition, neurochemical activation stud-ies have been performed successfully in either PET(Veselis et al., 1998) or fMRI (Breiter et al., 1997),demonstrating significant alterations compared to pla-cebo, so that these techniques are apparently sensitiveto neurochemical modulation.
METHODS
Subjects
Two groups of healthy controls (each group n = 8) withcomparable age (means ± SD: 25.1 ± 6.2 and 24.7 ± 5.4years; all right-handed) and sex (four women and fourmen in each group) were investigated. Subjects with ahistory of psychiatric, neurological, or other seriousphysical illness, drug or alcohol abuse, or first-degreerelatives with a history of major psychiatric or neuro-logical disorders were excluded. No subject was takingregular medication.
Ethics approval and permission were obtained fromthe Ethics Committee of the University of Magdeburg.After a complete and detailed description of the studyto the subjects, written informed consent was obtained.
Design
Affective Stimulation
Affective stimulation was performed with pictures fromthe IAPS (Lang et al., 1997), which was validated also ona German population (Hamm & Vaitl, 1993). Based onthe large-sample valence (positive–negative) ratings,pictures were selected as negative (e.g., a mutilatedface) or positive (e.g., smiling baby). Neutral (e.g., abook) and purely gray (i.e., entirely colored with differ-ent tones of gray) pictures served as control conditionsin order to control for potentially confounding featuresof the emotion-generating pictures such as emotionallyirrelevant visual stimulation and attentional effects. Slidesets were matched for content/properties (scenery, ob-jects, colors, people, faces, animals), dominance (ac-cording to subjective ratings provided by IAPS), andarousal (according to subjective ratings provided byIAPS). Though such matching is not available by the
IAPS itself, we nevertheless tried to match pictures asmuch as possible in accordance with the method ap-plied by Irwin et al. (1997). Even if the same content orscenery was not exactly available in another valence, wenevertheless tried to match the respective picture with apicture containing a somehow related content or scen-ery. For example, a book was not matched with a pictureincluding people or animals or vice versa. Subsequently,pictures differed only in emotional valence (positive,neutral, negative) but not in dominance or arousal.
We employed 100 pictures from each condition (100negative, 100 positive, 100 neutral, 100 gray) and pre-sented them under computer control. Pictures werepresented for 6 sec, respectively, in blocks with 10valence constant pictures (positive, negative, neutral,and gray blocks). Between the blocks, there was a breakof 3 sec. The order of blocks was counterbalanced withregard to emotional valence as well as between fMRI andMEG in order to control for potential order effects.Subsequently, 40 blocks, each consisting of 10 valenceconstant pictures, were presented in a counterbalancedorder so that positive, negative, neutral, and gray blockswere alternating. Blocks were counterbalanced betweensubjects as well as across fMRI/MEG investigations. Eachpicture was presented for 6 sec, appeared on a screenwith a central fixation point (in both fMRI and MEG inorder to avoid eye movements; see also below), and wasswitched automatically to the next picture. Subjects (allright-handed) had to press a touch switch by means ofabduction of the right index finger as soon as a newpicture appeared so that simple reaction time could bemeasured (see below).
Paradigm Implementation
For both MRI and MEG, the visual stimuli were projectedautomatically via a computer and a back-projectiontelevision system. Paradigm implementation was similarto the study of Northoff, Pfennig, et al. (2000) andNorthoff, Richter, et al. (2000), where they are explainedin full detail.
Subject Instruction
The experiment took place in four sessions. Sessions 1acquainted subjects with the scanners in fMRI and MEG.Sessions 2 and 3 were the actual scanning sessions. Theorder of investigations (first MEG, then fMRI, or reverse)was counterbalanced for subjects within each groupcontrolling for potential order effects. Fifteen minutesbefore each investigation, subjects received either pla-cebo (i.e., saline) or lorazepam (i.e., 1 mg) intravenouslyin a double-blind study design. In both investigations,subjects received the same substance (placebo or lor-azepam). Such a design relying on intersubject compar-ison with regard to the application of placebo andlorazepam in different subjects was chosen in order to
Northoff et al. 363
avoid repetition effects concerning picture presentationthat could have not been ruled out entirely in a designthat relies on intrasubjective comparison since eachsubject would have then undergone the experimentfour times (fMRI and MEG, respectively, before and afterlorazepam). In Session 4, subjects made ratings of thepictures to which they were exposed receiving againplacebo or lorazepam, respectively.
Prior to all sessions, subjects were told that theywould view various pictures with different emotionalcontents. Furthermore, they were informed that theywould receive an intravenous injection before fMRI/MEGto which both they and the experimenters were blind.Injections would either be saline or 1 mg lorazepam.The doses and timing of lorazepam were chosen basedon the ability of lorazepam to displace (endogenous orexogenous) ligands from the benzodiazepine subunit ofthe GABA-A receptor (Schroder et al., 1997) as well aswith regard to the therapeutically effective dose inpatients with strong and uncontrollable anxieties(Northoff et al., 1998, 1999; Coplan & Lydiard, 1998).
Details of further instructions given in order to avoidmotion artifacts, and so on, are explained in Northoff,Richter, et al. (2000) in full detail.
Behavioral, Psychological, and PhysiologicalMonitoring
Behavioral monitoring was accounted for by reactiontime. Reaction time was defined as the time subjectsneeded to press a button (mouse click) as soon as anovel picture appeared on the screen. They had topress the button without making any further decisionabout the nature of the stimuli by emotion so that wemeasured simple reaction time. For analysis, we calcu-lated the means of reaction time for each condition(i.e., positive, negative, neutral, gray) and comparedthem statistically using Friedman and Wilcoxon testsfor dependent samples. We chose reaction time as abehavioral measure for emotional valence and effect oflorazepam. It is known that the time necessary formovement preparation and initiation depends on therespective functional context (other movements, con-comitant visual stimuli, etc.), the more complex thecontent (and the movement), the longer the reactiontime (Naito et al., 1998; Kristeva, Cheyne, & Deecke,1991; Kristeva-Feige et al., 1997). Hence, we expecteddifferences in reaction times among negative, positive,and neutral (i.e., more complex) pictures on the onehand and gray (i.e., less complex) pictures on theother hand. Assuming different correlation patternsbetween both emotional conditions, we in additionperformed correlational analysis between subjectiveratings of the pictures and reaction times for eachcondition (negative, positive, neutral, gray) usingSpearman correlation analysis with Bonferroni correc-tion (significance level of p = .0042). In addition, it is
known that lorazepam prolongs reaction times (Pres-ton et al., 1989; File & Lister, 1985) so that reactiontime can be used as a behavioral measure of the effectof lorazepam.
In order to control for preexperimental psychologicalstates, which might influence emotional induction, allsubjects had to fill out the BFs (Zerssen, 1976), a well-validated instrument for self-evaluation of the actualpsychological state.
Pictures from the IAPS were subjectively rated forvalence, dominance, and arousal with the Self-Assess-ment Manikin (Lang et al., 1997). Ratings of IAPS weredone after fMRI/MEG investigations. Subjective ratings ofthe different conditions were compared with thoseobtained by Lang et al. (1997), which were also validatedfor a German population (Hamm & Vaitl, 1993).
Effects of lorazepam/placebo were monitored bothpsychologically and neurochemically during the laterrating session. We used the Covi Anxiety Scale (Gold-berg & Finnerty, 1982) for psychological monitoringbefore and after (10, 20, 30, 45, and 60 min post-injection) the application of lorazepam/placebo. Neu-rochemically, serum concentrations of lorazepam(according to the method by Greenblatt, Franke, &Shader, 1978), cortisol, and growth hormone weremeasured before and after (10, 20, 30, 45, and 60min postinjection) the application of lorazepam duringthe later rating session in order to correlate them withpsychological effects. Cortisol and growth hormonewere determined since it is known that both areinfluenced by benzodiazepines (increase of growthhormone, decrease of cortisol; Hommer et al., 1986).For interindividual comparisons, scores in the Covi-Anxiety Scale and serum levels of lorazepam, cortisol,and growth hormone are given as the percent changeof the respective score/level obtained before loraze-pam/placebo administration. For data analysis, inte-grals of the respective values were calculated suchthat baselines (before lorazepam/placebo) and altera-tions after lorazepam/placebo (in percent change)could be compared between both groups.
Due to the influence of magnetic fields in MEG/fMRI, we were unfortunately unable to obtain vegeta-tive measures of emotional responses (skin resistance,etc.) during scanning. Only the heart rate, showing nosignificant differences between conditions and groups(mean heart rate during scanning, that is, 45 min: 73.3± 4.5 min in negative pictures; 69.5 ± 3.6 in positivepictures; 68.8 ± 3.8 min in neutral pictures; 62.3 ±3.6 min in gray pictures) could be obtained duringMEG but not during fMRI.
fMRI
Data Acquisition
The images were acquired in a Bruker Biospec 3-T/60-cmhead scanner equipped with a quadrupolar birdcage
364 Journal of Cognitive Neuroscience Volume 14, Number 3

head coil. Before scanning, the nasion and the right andleft preauricular points were marked with paramagneticmarkers in order to project dipoles from the MEG to theanatomical and fMRI images. The subjects’ heads wereimmobilized with a vacuum cushion with attached ear-muffs. An imaging session started with low-noise (soundpressure level, SPL, 62 dB A), low-contrast FLASH imagesin sagittal and coronal directions. The use of a FLASHsequence offers the possibility to slow down the gra-dient switching. Together with an optimized excitationpulse and modified spoiler gradients, the final ‘‘low-noise’’ imaging sequence, focused on a few slices,produced a noise peak level of 58 dB SPL at the positionof the ear.
Five contiguous axial planes of the whole frontal lobeincluding the medial and lateral frontal cortex, themotor and premotor cortex, the orbito-frontal cortex,and the anterior cingulate (i.e., from orbito-frontal cor-tex and ventricles up to central sulcus) were chosen forfunctional imaging (i.e., thickness of 8 mm, 160 mm fieldof view, and 64 � 64 matrix size) (see Figure 1). Twohundred forty functional images for each slice werecollected using a low-noise conventional gradient-echosequence (SPL, 58 dB A; TE, 40 msec; TR, 313 msec; flipangle, 88) with medium high resolution (2.5 � 2.5 � 8mm) within 45 min. For each block of visual stimuli (i.e.,10 valence constant pictures each presented for 6 secresulting in a total duration of one block of 1 min; seeabove), six images (i.e., each including all five slices)were acquired (i.e., each image lasted 10 sec), resultingin a total acquisition time of 1 min (i.e., 6 � 10 sec) perblock. Consequently, 60 images were acquired for eachcondition (i.e., 10 blocks of positive, negative, neutral,and gray pictures, respectively), resulting in a total of240 images, an acquisition time of 40 min, and, due tobreaks between blocks, a total duration of 45 min.
High T1-contrast imaging (MDEFT) was used to ob-tain anatomical landmarks with 3-D high resolution andimmediately followed fMRI with the following parame-ters: 256 mm field of view, 2.25 mm slice thickness, 64slices, and 256 � 256 in-plane matrix size. On the basis ofthese anatomical images, the localization of slices/activ-ity in fMRI and dipoles from MEG were determined.
Image and Statistical Analyses
Data were analyzed as follows: First, subject movementwas monitored using the AIR package. Data were se-lected for further analysis on the basis of the absence ofmotion artifacts. Based on the standard (Sanders et al.,1996; Bandettini, Jesmanowicz, Wong, & Hyde, 1993),subjects with head movements >2 mm and or >18 wereexcluded from initial analysis. We unfortunately had toexclude two persons (one receiving lorazepam, onereceiving placebo) from analysis that finally includedeight subjects with lorazepam and eight subjects withplacebo as described above. In order to exclude eye
movement artifacts (see Lang et al., 1998; Irwin et al.,1997), we finally checked vertical and horizontal EOG asmeasured in MEG (see below) in all subjects. None ofthe subjects entering final analysis showed any eyemovements in EOG (see Figure 5).
All subjects entering into final and statistical analysiswere checked for eye movements artifacts (see Irwinet al., 1997) as revealed in vertical and horizontal EOG asmeasured in MEG. None of the subjects entering finalanalysis showed any eye movement artifacts (see Figure4). Second, activation analysis was performed by com-puting the correlation coefficients between voxel timeresponse and boxcar waveform representing the stim-ulation. Irrespective of their actual serial position in thesequence, all negative and positive blocks were modeledas ‘‘on,’’ whereas all neutral and gray blocks weredefined as ‘‘off.’’ Voxels having correlation coefficientswith a statistical significance p > .01 (corrected) wererejected. Then the functional images were superim-posed on the individual anatomic reference images(Gaschler-Markewski et al., 1997).
In each slice, different anatomical ROIs were outlinedon the respective anatomical MRI without separate func-tional overlay for each individual subject. For eachsubject, 11 brain regions (see Figure 1) were definedindividually by landmarks (i.e., the respective gyri withupper orbital gyrus, inferior, middle, and superior fron-tal gyri, cingulate gyrus, and medial frontal gyrus) andmanually delineated on the T1-weighted images (seeKammer et al., 1997, for a similar method). Fiducialmarks were then made on the anterior and posteriorcommissures, midsaggital point, and on the most ante-rior, posterior, superior, inferior, left, and right points ofthe brain that were used to standardize each partici-pant’s anatomy in a normalized space so that the variousbrain regions could be identified based on the atlas ofTalairach and Tournoux (1988) and characterized by thecorresponding Brodmann’s areas. The correspondingregions on adjacent slices were aggregated and thendefined as the upper part (exclusion of lower part) ofthe orbito-frontal cortex (BA upper 11 and 12), lateralprefrontal (BA 9, 45, 46, 47), medial prefrontal (BA8,9,10), premotor (BA 6), and motor (BA 4) cortex onthe right and left side, respectively, and anterior cingu-late cortex (BA 24, 32) bilaterally (see Kammer et al.,1997, for a similar method). Since the orbito-frontalcortex is close to regions with a high potential formagnetic susceptibility artifacts, we, based on Breiteret al. (1996, 1997), checked that orbito-frontal activa-tions did not overlap regions of susceptibility artifact,otherwise (i.e., if artifacts were as high or even higherthan stimulus-correlated activity) they were excludedfrom analysis (n = 2, which were identical with thoseexcluded on the basis of movement artifacts; see above)so that the number of placebo subjects (n = 8) andlorazepam subjects (n = 8) entering into final analyseswas not further reduced by analysis of susceptibility
Northoff et al. 365

artifacts (see also methodological limitations). Even ifthe determination of ROIs according to Talairach andTournoux (1988) has considerable shortcomings (espe-cially with regard to the ventral prefrontal cortex), wenevertheless applied it since most current imaging stud-ies use it for anatomical determination, making ourlocalizations comparable with other studies. In addition,the determination of ROIs proved to be helpful incomparing localizations obtained in fMRI with thosefrom MEG (see below).
Activity in these ROIs in both hemispheres was ana-lyzed by correlation analysis (Bandettini et al., 1993) toobtain a statistical parametric map. Such a map displaysthe spatial distribution of the Z score for each of thedifferences or ‘‘constrasts’’ positive–negative, positive–neutral, positive–gray, negative–neutral, negative–gray,and neutral–gray. Then these functional t maps werethresholded (Z = 3.09 or p < .01, corrected for multiplecomparisons) and constrained to include four contigu-ous voxels in the final map, which effectively reduces therate of false positives. Constraining the final maps on thebasis of cluster size allows fMRI analyses to control formultiple comparisons without the concomitant loss ofpower that would occur with a Bonferroni correctionmethod. Finally, t statistic maps were overlaid onto ouranatomical template image to attribute each activationfocus to an anatomical area. The number of voxels andthe percentages of significantly activated voxels and IWV(product of the absolute number of voxels and averagesignal change in each ROI in all slices) were determinedfor positive (positive IWV probably reflecting activation)and negative (negative IWV probably reflecting deactiva-tion; see Methodological Limitations) correlated activa-tions (Gaschler-Markewski et al., 1997). The number ofvoxels and IWVs were calculated for each region forevery individual subject in all conditions, which thenentered into statistical analyses for comparison of con-ditions between groups and correlation analyses (withreaction times) as described below in further detail (seeStatistical Analyses).
MEG
Experimental Procedure
A 148-channel (i.e., arranged in a helmet-like configu-ration) DC-SQUID neuromagnetometer (Magnes 2500WH, Biomagnetic Technologies, San Diego, CA), cover-ing the whole scalp, recorded the brain’s magneticfields. The EOG was recorded using Ag/AgCl electrodes.To monitor eye movements and the possible spread ofbrain activity below the orbit, one measurement be-tween the right/left infraorbital and the right/left mastoidwas adopted in addition to the conventional vertical andhorizontal EOGs from both eyes. Surface EMG associ-ated with abduction of the index finger was recordedfrom two electrodes placed about 2 cm apart over theright first dorsal interosseus muscle.
A subset of MEG channels, EOG, and EMG weredisplayed on a screen continuously, so that the taskperformance and the vigilance of the subject could bemonitored.
A three-dimensional Cartesian head coordinate sys-tem was defined for each subject based on three ana-tomical landmarks: left and right preauricular points aswell as nasion. In this three-dimensional head coordi-nate system, the positive x-axis passed through thenasion (anterior–posterior direction) and the positivey-axis through the left preauricular point (medial–lateraldirection) whereas the z-axis (representing the inferior–superior direction) was perpendicular to the point ofbisection between the x- and y-axes. The position andorientation of the sensor as well as the head shape withrespect to this coordinate system were measured with a3-D digitizer before and after each recording session.
Signal Analysis
The recording passband was 0–50 Hz for MEG, 0.01–100Hz for EOG (6 dB points), and 30–3000 Hz for EMG. Thesignals were digitized at 254.31 Hz and afterwardssegmented into stimulus-locked epochs of 2.0-sec dura-tion (1,800 msec pretrigger interval). Offline reductionof environmental noise was performed through subtrac-tion of the weighted signals from three reference chan-nels. Automatic rejection level of field amplitudes largerthan 3 pT/cm was used for excluding magnetic artifacts;for EOG, the rejection level was 100 mV. Spontaneousactivity was continuously stored on a magneto-opticaldisk for later off-line analysis. The averaged epochs werefinally filtered with a 45-Hz low pass in combination witha 50-Hz Notzh filter.
Off-Line Analysis of Data
Signals as obtained in MEG and filtered in the above-explained way were analyzed off-line in order to gener-ate isocontour maps and source identification relying ona single-dipole model (see Northoff, Richter, et al., 2000,for details).
First, all trials were visually inspected for artifacts(ocular, other movements, etc.) so that only those trialscontaining movements with the same abrupt onset risetime and the same shape as seen on EMG were utilizedfor further analyses. A total of at least 70 artifact-freetrials for averaged for each conditions, respectively.There were no significant differences between condi-tions in terms of artifacts.
Second, after digital low-pass filtering at 45 Hz and a 50-Hz Notzh filter, the signals were subjected to amplitudemeasurements within epochs of 50 msec within a timewindow of analyses of 2200 msec (�2000–200 msec), ofwhich the first 200 msec were used for determining thebaseline. These data were used for the construction ofisocontour maps and dipole source location. Thereby,
366 Journal of Cognitive Neuroscience Volume 14, Number 3
occipital channels were excluded for analyses in order toavoid interference between visuo-emotional processingin the visual regions (see Lang et al., 1998) and earlyemotional processing in the prefrontal cortex.
Third, isocontour maps of the field amplitude wereconstructed at the above-selected latencies using linearinterpolation. To identify underlying sources signal dis-tributions were modeled using the model of movingdipole (MD) embedded in a homogenous sphericalvolume conductor. The center of the volume conductorwas evaluated by approximating the surface of the scalpunderneath the gradiometer system by the abovemen-tioned sphere. The model parameters (strength, posi-tion, and orientation) were optimized by means of aniterative least-square procedure. The MD analyses wereperformed for each 50-msec epoch within the timewindow of analyses. Only MDs accounting for 60% ofthe field variance and with a GOF value >85–90% wereaccepted. For each 50-msec epoch within the timewindow of analyses, the MD with the best GOF valuewas taken as the representative one.
Fourth, dipole locations were projected onto thecorresponding three-dimensional anatomical MRI thatwas marked (nitro capsules) by three markers (nasion,both preauricular points). These markers could be easilyidentified in MRI and serve as reference points for thelocalization of estimated dipole locations. Functionalimages were matched on anatomical images as well tocompare anatomical localization between dipoles andfMRI signals. The nearest local maximum (as describedin millimeter) between dipole and fMRI signal wasdetermined based on the method described by Sanderset al. (1996).
Statistical Analyses
Comparison Between Groups
Statistical analyses of the various fMRI and MEG param-eters between conditions within groups (i.e., compar-ison of conditions within each group) as well as betweengroups within conditions (comparison of each conditionbetween groups) were made with Kruskal–Wallis/Fried-man analysis and Mann–Whitney U/Wilcoxon tests apply-ing Bonferroni correction for multiple comparisons. Inaddition, we performed MANOVA with two factors con-cerning group (placebo, lorazepam) and region.
Correlation Between Variables
First, in an exploratory way, we correlated regionalactivities in fMRI and amplitudes and latencies in MEGwith behavioral measures using Spearman correlationwith Bonferroni correction for multiple comparisons.Following the recommendations by Curtin and Schulz(1998), only those fMRI/MEG parameters were selectedfor correlational analyses that showed significant differ-ences between both groups in order to reduce thenumber of comparisons. Second, we performed partial
correlations to control for effects of age on those testsfor which correlations were significant since increasesand decreases of signals during emotional processingmay be age-dependent (Lane, Reimann, Ahern, et al.,1997; Lane, Reimann, Bradley, et al., 1997; Lang et al.,1997). If correlations turned out to be significant in bothkinds of analyses (i.e., we found no differences innumbers and kind of relations between correlation andpartial correlation), they were considered as relevantrelationships between variables so that only these arementioned in the Results section.
Acknowledgments
We thank the staff in the Department of Neurology II and inLeibnitz Institute for Neurobiology for their skillful assistance.Furthermore, we are grateful to all subjects who participated inthis quite complex study for their good collaboration. The studywas financially supported by the German Research Foundation(Heisenberg Grant No. SFB 426/7 and No. 401/1-1) and theNovartis Foundation.
Reprint request should be sent to G. Northoff, HarvardUniversity, Department of Neurology, Section of BehavioralNeurology, Beth Israel Deaconess Medical Center, KirsteinBuilding KS 454, 330 Brookline Avenue, 02215 Boston, MA,USA, or via e-mail: [email protected].
The data reported in this experiment have been deposited inthe fMRI Data Center (http://www.fmridc.org). The accessionnumber is 2-2001-112D3.
REFERENCES
Aftanas, L., Lotova, N., Koshkarov, V., Makhnev, V., Mordvint-sev, Y., & Popov, S. (1998). Non-linear dynamic complexityof the human EEG during evoked emotions. InternationalJournal of Psychophysiology, 4, 324–328.
Baker, S. C., Frith, C. D., & Dolan, R. J. (1997). The interactionbetween mood and cognitive function studied with PET.Psychological Medicine, 27, 565–578.
Bandettini, P. A., Jesmanowicz, A., Wong, E. C., & Hyde, J. S.(1993). Processing strategies for time-course data sets infunctional MRI of the human brain. Magnetic Resonance inMedicine, 30, 161–173.
Barbas, H. (1995). Anatomic basis of cognitive–emotionalinteractions in the primate prefrontal cortex. Neuroscienceand Biobehavioral Reviews, 19, 499–510.
Beauregard, M., Karama, S., Leroux, J. M., Lecours, A. R.,Beaudoin, G., & Bourgouin, P. (1998). The functionalneuroanatomy of amusement, disgust and sexual arousal.Neuroimage, 7, S909.
Benareha, R., Araujo, F., Ruano, D., Driscoll, P., Tobena, A., &Vitorica, J. (1998). Pharmacological properties of the GABA-Areceptor complex from brain regions of hypoemotionalRoman high- and (hyperemotional) low-avoidance rats.European Journal of Pharmacology, 345, 91–98.
Bodis-Wollner, I., Bucher, S., Seelos, K., Paulus, W., Reiser, M.,& Oertel, W. (1997). Functional MRI mapping of occipitaland frontal cortical activity during voluntary and imaginedsaccades. Neurology, 49, 416–420.
Breiter, H. C., Etcoff, N., Whalen, P. J., Kennedy, W. A., Rauch,S., Buckner, R. L., Strauss, M., Hyman, S. E., & Rosen, B. R.(1996). Response and habituation of the human amygdala
Northoff et al. 367
during visual processing of facial expression. Neuron, 17,875–887.
Breiter, H. C., Gollub, R. L., Weisskoff, R. M., Kennedy, D. N.,Makris, N., Berke, J. D., Goodman, J. M., Kantor, H. L.,Gastfirend, D. R., Riorden, J. P., Mathew, T., Rosen, B. R., &Hyman, S. E. (1997). Acute effects of cocaine on humanbrain activity and emotion. Neuron, 19, 591–611.
Buchel, C., Morris, J., Dolan, R. J., & Friston, K. J. (1998). Brainsystems mediating aversive conditioning: An event-relatedfMRI study. Neuron, 20, 947–957.
Carmichael, S. T., & Price, J. L. (1994). Architectonicsubdivision of the orbital and medial prefrontal cortex in themacaque monkey. Journal of Comparative Neurology, 346,366–402.
Carmichael, S. T., & Price, J. L. (1996). Limbic connections ofthe orbital and medial prefrontal cortex of macaquemonkeys. Journal of Comparative Neurology, 363, 615–641.
Coplan, J. D., & Lydiard, B. (1998). Brain circuits in panicdisorder. Biological Psychiatry, 44, 1264–1276.
Corda, M., Lecca, D., Piras, G., Chiara, C., & Giorgi, O. (1997).Biochemical parameters of dopaminergic and GABAergicneurotransmission in the CNS of roman high- and lowavoidance rats. Behavioral Genetics, 27, 527–536.
Coull, J. T., Buchel, C., Friston, K. J., & Frith, C. D. (1999).Noradrenergically mediated plasticity in a human attentionalneuronal network. Neuroimage, 10, 705–715.
Crestani, F., Lorez, M., Essrich, C., Benke, D., Laurent, J.,Belzung, C., Luscher. B., & Mohler, H. (1999). DecreasedGABA-A receptor clustering results in enhanced anxiety anda bias for threat cues. Nature Neuroscience, 2, 833–839.
Curtin, F., & Schulz P. (1998). Multiple correlations andBonferroni’s correction. Biological Psychiatry, 44, 775–777.
Damasio, A. R. (1997). Towards a neuropathology of emotionand mood. Nature, 386, 769–770.
Darby, D., Nobre, A., Thangaraj, V., Edelman, R., Mesulam, M.,& Warach, S. (1996). Cortical activation in the human brainduring lateral saccades using EPISTAR functional magneticresonance imaging. Neuroimage, 3, 53–62.
Davis, M., & Rainnie Cassell, M. (1994). Neurotransmission inthe rat amygdala related to fear and anxiety. Trends inNeuroscience, 17, 208–214.
Drevets, W. C., & Raichle, M. E. (1998). Reciprocal suppressionof regional cerebral blood flow during emotional versushigher cognitive processes: Implications for interactionsbetween emotion and cognition. Cognition and Emotion,12, 353–385.
Ferrara, S. D., Giorgetti, R., Zancaner, S., Orlando, R.,Tagliabracci, A., Cavarzeran, F., & Palatini, P. (1999). Effectsof a single dose of gamma-hydroxybutyric acid andlorazepam on psychomotor performance and subjectivefeelings in healthy volunteers. European Journal of ClinicalPharmacology, 54, 821–827.
File, S., & Lister, R. G. (1985). A comparison of the effects oflorazepam with those of propanolol on experimentally-induced anxiety and performance. British Journal ofClinical Pharmacology, 19, 445–451.
Forman, S., Silva, A., Dedousis, N., Barbier, E., Fernstrom, J., &Koretsky, A. (1998). Simultaneous glutamate and perfusionfMRI responses to regional brain stimulation. Journal ofCerebral Blood Flow and Metabolism, 18, 1064–1070.
Garcia, C., Micallef, J., Philoppot, P., Jouve, E., & Blin, O.(2000). Effects of lorazepam on emotional reactivity, per-formance and vigilance in subjects with high and low anxi-ety. Journal of Clinical Psychopharmacology, 20, 226–233.
Garcia, C., Philippot, P., Lacarelle, B., Valli, M., Rime, B., & Blin,O. (1997). Effects of lorazepam on film-induced differen-tiated emotions in healthy volunteers. Fundamental &Clinical Pharmacology, 11, 466–475.
Gaschler-Markewski, B., Baumgart, F., Tempelmann, C.,Schindler, F., Stiller, D., Heinze, H. J., & Scheich, H. (1997).Statistical methods in functional magnetic resonanceimaging with respect to non-stationary time series: Auditorycortex activity. Magnetic Resonance in Medicine, 38,811–820.
George, M. S., Ketter, T., Parekh, P., Horwitz, B., Herscovitch,P., & Post, R. (1995). Brain activity during transient sadnessand happiness in healthy women. American Journal ofPsychiatry, 152, 341–351.
Goldberg, H. L., & Finnerty, R. (1982). Comparison of buspironin two separate studies. Journal of Clinical Psychiatry, 43,87–91.
Gorman, J., Kent, J., Sullivan, G., & Coplan, J. (2000). Neuroa-natomical hypothesis and panic disorder, revised. AmericanJournal of Psychiatry, 157, 493–505.
Greenblatt, D., Franke, K., & Shader, R. (1978). Analysisof lorazepam and its glucuronide metabolite byelectron-capture gas liquid chromatography. Journal ofChromatography, 146, 311–320.
Hamm, A. O., & Vaitl, D. (1993). Emotionsinduktion durchvisuelle Reize: Validierung einer Stimulationsmethode aufdrei Reaktionsebenen. Psychologische Rundschau, 44,143–161.
Heinze, H. J., Mangun, G. R., Burchert, W., Hinrichs, H., Scholz,M., Munte, T. F., Gos, A., Scherg, M., Johannes, S.,Hundeshagen, H., Gazzaniga, M. S., & Hillyard, S. A. (1994).Combined spatial and temporal imaging of brain activityduring visual selective attention in humans. Nature, 372,543–546.
Hikosaka, O., Tanaka, M., Sakamoto, M., & Iwamura Y. (1985).Deficits in manipulative behaviors induced by local injec-tions of muscimol in the first somatosensory cortex of theconscious monkey. Brain Research, 325, 375–380.
Hommer, D. W., Matuso, V., Wolkowitz, O., Chrousos, G.,Greenblatt, D. J., Weingartner, H., & Paul, S. M. (1986).benzodiazepine sensitivity in normal human subjects.Archives of General Psychiatry, 43, 542–551.
Imaizumi, S., Mori, K., Kiritani, S., Kawashima, R., Sugiura, M.,Fukuda, H., Itoh, K., Kato, T., Nakamusa, A., Hatano, K.,Kojima, S., & Nakamura, K. (1997). Vocal identification ofspeaker and emotion activates different brain regions.NeuroReport, 8, 2809–2812.
Irwin, W., Davidson, R. J., Lowe, M. J., Mock, B. J., Sorenson,J. A., & Turski, P. A. (1996). Human amygdala activationdetected with echo-planar functional magnetic resonanceimaging. NeuroReport, 7, 1765–1769.
Irwin, W., Mock, B. J., Sutton, S. K., Anderle, M., Kalin, N. H.,Sorenson, J. A., Turski, P. A., & Davidson, R. J. (1998). Ratingsof affective stimulus characteristics and measures of affectivereactivity predict MR signal change in the human amygdala.Neuroimage, 7, S908.
Irwin, W., Mock, B. J., Sutton, S. K., Orendi, J. L., Sorenson,J. A., Turski, P. A., Kalin, N. H., & Davidson, R. J. (1997).Positive and negative affective responses: Neural circuitryrevealed using FMRI. Society for Neuroscience Abstracts, 23,1318.
Jahanshahi, M., Jenkins, I. C. H., Brown, R. G., Marsden, C.D., Passingham, R. E., & Brooks, D. J. (1995). Self-initiatedversus externally triggered movements. Brain, 118,913–933.
Joliot, M., Crivello, F., Badier, J. M., Diallo, B., Tzourio, N., &Mazoyer, B. (1998). Anatomical congruence of metabolicand electromagnetic activation signals during a self-pacedmotor task: A combined PET–MEG study. Neuroimage, 7,337–351.
Kalynchuk, L., Pearson, D., Pinel, J., & Meaney, M. (1999).Effect of amygdala kindling on emotional behavior and
368 Journal of Cognitive Neuroscience Volume 14, Number 3

benzodiazepine receptor binding in rats. Annals of NewYork Academy of Sciences, 877, 737–741.
Kammer, T., Bellemann, M., Guckel, F., Brix, G., Gass, A.,Schlemmer, H., & Spitzer M. (1997). Functional, M. R.,imaging of the prefrontal cortex: Specific activation in aworking memory task. Magnetic Resonance Imaging, 15,879–889.
Kelly, P., & McCulloch, J. (1983). The effects of the GABAergicagonist muscimol upon the relationship between localcerebral blood flow and glucose utilization. Brain Research,258, 338–342.
Kristeva, R., Cheyne, D., & Deecke, L. (1991). Neuromagneticfields accompanying unilateral and bilateral voluntarymovements: Topography and analysis of cortical sources.Electroencephalography and Clinical Neurophysiology, 81,284–298.
Kristeva-Feige, R., Rossi, S., Feige, B., Mergner, T., Lucking. C.,& Rossini, P. M. (1997). The bereitschaftspotential paradigmin investigating voluntary movement organization in humanusing magnetoencephalography. Brain Research Protocols,1, 13–22.
Kubota, K. (1996). Motor cortical muscimol injectiondisrupts forelimb movement in freely moving monkeys.NeuroReport, 7, 2379–2384.
Kurata, K., & Hoffman, D. (1994). Differential effects ofmuscimol microinjection into dorsal and ventral aspectsof the premotor cortex of monkeys. Journal ofNeurophysiology, 71, 1151–1164.
LaBar, K. S., Gatenby, C., Gore, J., LeDoux, J. E., & Phelps, E.(1998). Human amygdala activation during conditioned fearacquisition and extinction: A mixed-trial fMRI study. Neuron,20, 937–945.
Lane, R. D., Reimann, E. M., Ahern, G. L., Schwartz, G. E., &Davidson, R. J. (1997). Neuroanatomical correlates ofhappiness, sadness, and disgust. American Journal ofPsychiatry, 154, 926–933.
Lane, R. D., Reimann, E. M., Bradley, M., Lang, P. J., Attern,G. L., Davidson, R. J., & Schwartz, G. E. (1997).Neuroanatomical correlates of pleasant and unpleasantemotion. Neuropsychologia, 35, 1437–1444.
Lang, P. J., Bradley, M. M., & Cuthbert, B. N. (1997). Interna-tional Affective Picture System (IAPS): Technical manualand affective ratings. Gainesville, FL: University of Florida,Center for Research in Psychophysiology.
Matthew, E., Andreason, P., Pettigrew, K., Carson, R.,Herscovitch, P., King, C., Greenblatt, D., & Paul S.(1995). Benzodiazepine receptors mediate regionalcerebral blood flow changes in the living human brain.Proceedings of the National Academy of Sciences, U.S.A.,92, 2775–2779.
Mayberg, H., Liotti, M., Brannan, S. K., McGinnis, S., Mahurin,R. K., Jerabek, P. A., Silva, J. A., Tekell, J. L., Martin, C. C.,Lancaster, J. L., & Fox, P. T. (1999). Reciprocal limbic–corticalfunction and negative mood: Converging PET findings indepression and normal sadness. American Journal ofPsychiatry, 156, 675–682.
Morecraft, R. J., Geula, C., & Mesulam, M. (1992). Cytoarchi-tecture and neural afferents of orbitofrontal cortex in thebrain of the monkey. Journal of Comparative Neurology,323, 341–358.
Morecraft, R. J., & Van Hoesen, G. (1998). Convergence oflimbic input to the cingulate motor cortex in the rhesusmonkey. Brain Res Bulletin, 45, 209–232.
Morris, J. S., Friston, K. J., Buchel, C., Frith, C. D., Young, A. W.,Calder, A. J., & Dolan, R. J. (1998). A neuromodulatory rolefor the human amygdala in processing emotional facialexpressions. Brain, 121, 47–57.
Morris, J. S., Frith, C. D., Perrett, D. I., Rowland, D., Young,
A. W., Calder, A. J., & Dolan, R. J. (1996). A differential neuralresponse in the human amygdala to fearful and happy facialexpressions. Nature, 383, 812–815.
Naito, E., Kinomura, S., Kawashima, R., Geyer, S., Zilles, K., &Roland, P. E. (1998). Correlation of the rCBF in anteriorcingulate cortex with reaction time. Neuroimage, 7, S948.
Naumann, E., Bartussek, D., Diedrich, O., & Laufer, E. (1992).Assessing cognitive and affective information processingfunctions of the brain by means of the late positive complexof the event-related potential. Journal of Psychophysiology,6, 285–298.
Naumann, E., Bartussek, D., Diedrich, O., Vogelbacher, D., &Mehrtens, S. (1993). Emotionality and the late positivecomplex of the event-related potential. In H. J. Heinze, T. F.Munte, & G. R. Mangun (Eds.), New development in event-related potentials (pp. 23–35). Boston: Birkhauser.
Northoff, G. (in press). What catatonia can tell us about top-down modulation? Behavioral and Brain Science.
Northoff, G., Krill, W., Eckert, J., Russ, M., & Pflug, B. (1998).Major differences in subjective experience of akinetic statesin catatonic and parkinsonic patients. Cognitive Neuropsy-chiatry, 3, 161–178.
Northoff, G., Pfennig, A., Krug, M., Danos, P., Schwarz, A., &Bogerts, B. (2000). Delayed onset of late movement-relatedcortical potentials and abnormal response to lorazepam incatatonia. Schizophrenia Research, 44, 193–211.
Northoff, G., Richter, A., Gessner, M., Baumgart, F., Kotter, R.,Stephan, K. E., Schlagenhauf, F., Hagner, T., Hinrichs, H.,Bogerts, B., Scheich, H., & Heinze, H. J. (2000). Functionaldissociation between medial and lateral prefrontal corticalspatiotemporal activation in negative and positive emotions:A combined FMRI/MEG study. Cerebral Cortex, 10, 93–107.
Northoff, G., Steinke, R., Czerwenka, C., Danos, P., &Bogerts, B. (1999). Decreased density of GABA-Areceptors in the left sensorimotor cortex in akineticcatatonia: Investigation of in vivo benzodiazepine receptorbinding. Journal of Neurology, Neurosurgery andPsychiatry, 67, 445–450.
Northoff, G., Wenke, J., Demisch, L., & Pflug, B. (1995). Cata-tonia: Short-term response to lorazepam and dopaminergicmetabolism. Psychopharmacology, 122, 82–86.
Paradiso, S., Johnson, D. L., Andreasen, N. C., O’Leary, D. S.,Arndt, S., Cizadlo, T., Ponto, L. L. B., Watkins, G. L., &Hichwa, R. D. (1997). Left amygdala and prefrontal activationduring conscious evaluation of emotional valence of visualstimuli. Neuroimage, 5, S116.
Pardo, J., Pardo, P. J., & Raichle, M. E. (1993). Neural correlatesof self-induced dysphoria. American Journal of Psychiatry,150, 713–719.
Phelps, E. A., LaBar, K. S., Gatenby, J. C., O’Connor, K. J., & Gore,J. C. (1998). fMRI of amygdala activation related to positiveand negative emotional scenes. Neuroimage, 7, S899.
Phillips, M. L., Young, A. W., Senior, C., Brammer, M., Andrew,C., Calder, A. J., Bullmore, E. T., Perret, D. I., Rowland, D.,Williams, S. C. R., Gray, J. A., & David, A. S. (1997). A specificneural substrate for perceiving facial expressions of disgust.Nature, 389, 495–498.
Pihan, H., Altenmuller, E., & Ackermann, H. (1997). The cor-tical processing of perceived emotion: A DC potential onaffective speech prosody. NeuroReport, 8, 623–627.
Pizzagalli, D., Koenig, T., Regard, M., & Lehmann D. (1998).Faces and emotions: Brain electric field sources duringcovert emotional processing. Neuropsychologia, 36,323–332.
Preston, G. C., Ward, C. E., Broks, P., Traub, M., & Stahl, S. M.(1989). Effects of lorazepam on memory, attention andsedation in man: Antagonism by Ro 15-1788. Psychophar-macology, 97, 222–227.
Northoff et al. 369

Raichle, M. (1998). Behind the scenes of functional brainimaging: A historical and physiological perspective.Proceedings of the National Academy of Sciences, U.S.A.,95, 765–772.
Reimann, E. M., Lane, R. D., Ahern, G., Schwartz, G., Davidson,R. J., Friston, K. J., Yun, L., & Chen, K. (1997). Neuroanato-mical correlates of externally and internally generatedemotions. American Journal of Psychiatry, 154, 918–925.
Richter, A. (2001). Funktionelle Kernspintomographie (FMRI)bei emotionaler Stimulation mit und ohne Lorazepam beiGesunden und Katatonie. PhD thesis, University of Magde-burg, Germany.
Sanders, J. A., Lewine, J. D., & Orrison, W. W. (1996). Com-parison of primary motor cortex localization using functionalmagnetic resonance imaging and magnetoencephalography.Human Brain Mapping, 4, 47–57.
Schroder, J., Bubeck, B., & Demisch, S. (1997). Benzodiazepinereceptor distribution and diazepam binding in schizophre-nia: An exploratory study. Psychiatry Research and Neu-roimaging, 65, 125–131.
Schupp, H., Cuthbert, B., Bradley, M., Birbaumer, N., & Lang, P.(1997). Probe P3 and blinks: Two measures of affectivestartle modulation. Psychophysiology, 34, 1–7.
Spanaki, M. V., Siegel, H., Kopylev, L., Fazilat, S., Dean, A.,
Liow, K., Gaillard, W., & Theodore, W. (1999). The effect ofvigabatrin (y-vinyl GABA) on cerebral blood flow andmetabolism. Neurology, 53, 1518–1522.
Stippich, C., Freitag, P., Kassubek, J., Soros, P., Kamada, K.,Kober, H., Scheffler, K., Hopfengartner, R., Bilecen, D., Radu,E., & Vieth, J. (1998). Motor, somatosensory and auditorycortex localization by FMR and MEG. NeuroReport, 9,1953–1957.
Talairach, J., & Tournoux, P. (1988). Co-planar stereotaxicatlas of the human brain. Stuttgart: Thieme.
Veselis, R. A., Reinsel, R. A., & Feshchenko, V. A. (1998).Midazolam decreases cerebral blood flow in left prefrontalcortex in a dose-dependent fashion. Neuroimage, 7, S244.
Wang, G., Volkow, N., Overall, J., Hitzemann, R., Pappas, N.,Pascani, K., & Fowler J. (1996). Reproducibility of regionalbrain metabolic responses to lorazepam. Journal of NuclearMedicine, 37, 1609–1613.
Whalen, P. J., Rauch, S. L., Etcoff, N. L., McInerney, S. C., Lee,M. B., & Jenike, M. A. (1998). Masked presentations ofemotional facial expressions modulate amygdala activitywithout explicit knowledge. Journal of Neuroscience, 18,411–418.
Zerssen, D. V. (1976). Die Befindlichkeitsskala. Weinheim:Beltz.
370 Journal of Cognitive Neuroscience Volume 14, Number 3
Copyright © 2022 FDOKUMEN