Fatal familial insomnia and dysautonomia with selective degeneration of thalamic nuclei
Upload
khangminh22Category
view
0download
0
Molecular Psychiatryhttps://doi.org/10.1038/s41380-020-0756-y
ARTICLE
Thalamic and prefrontal GABA concentrations but not GABAAreceptor densities are altered in high-functioning adults with autismspectrum disorder
Lawrence K. Fung 1● Ryan E. Flores1 ● Meng Gu2 ● Kevin L. Sun1
● David James1 ● Rachel K. Schuck1 ● Booil Jo1 ●
Jun Hyung Park2 ● Byung Chul Lee3 ● Jae Ho Jung4● Sang Eun Kim3
● Manish Saggar1 ● Matthew D. Sacchet1 ●
Geoff Warnock5 ● Mohammad Mehdi Khalighi2 ● Daniel Spielman2● Frederick T. Chin2
● Antonio Y. Hardan1
Received: 23 June 2019 / Revised: 11 March 2020 / Accepted: 23 April 2020© The Author(s), under exclusive licence to Springer Nature Limited 2020
AbstractThe gamma aminobutyric acid (GABA) neurotransmission system has been implicated in autism spectrum disorder (ASD).Molecular neuroimaging studies incorporating simultaneous acquisitions of GABA concentrations and GABAA receptordensities can identify objective molecular markers in ASD. We measured both total GABAA receptor densities by using [18F]flumazenil positron emission tomography ([18F]FMZ-PET) and GABA concentrations by using proton magnetic resonancespectroscopy (1H-MRS) in 28 adults with ASD and 29 age-matched typically developing (TD) individuals. Focusing on thebilateral thalami and the left dorsolateral prefrontal cortex (DLPFC) as our regions of interest, we found no differences inGABAA receptor densities between ASD and TD groups. However, 1H-MRS measurements revealed significantly higherGABA/Water (GABA normalized by water signal) in the left DLPFC of individuals with ASD than that of TD controls.Furthermore, a significant gender effect was observed in the thalami, with higher GABA/Water in males than in females.Hypothesizing that thalamic GABA correlates with ASD symptom severity in gender-specific ways, we stratified bydiagnosis and investigated the interaction between gender and thalamic GABA/Water in predicting Autism-SpectrumQuotient (AQ) and Ritvo Autism Asperger’s Diagnostic Scale–Revised (RAADS-R) total scores. We found that gender is asignificant effect modifier of thalamic GABA/Water’s relationship with AQ and RAADS-R scores for individuals with ASD,but not for TD controls. When we separated the ASD participants by gender, a negative correlation between thalamicGABA/Water and AQ was observed in male ASD participants. Remarkably, in female ASD participants, a positivecorrelation between thalamic GABA/Water and AQ was found.
Introduction
Autism spectrum disorder (ASD) is a highly heterogeneousneurodevelopmental disorder associated with over 900genes [1] and many environmental factors [2]. There are noproven common pathophysiologic pathways that link thesegenetic and environmental factors. A pathophysiologicalmodel of ASD that has accumulated much evidence sug-gests that this condition is a result of an imbalance betweenexcitation (E) and inhibition (I) in key neural systems [3].While the major neurotransmitter involved in excitation isglutamate, the most abundant inhibitory neurotransmitter isgamma aminobutyric acid (GABA). Various animal modelsof ASD have been associated with evidence converging ona reduction of parvalbumin-positive GABAergic inter-neurons [4], which serve important neural functionsincluding generation of γ oscillations [5] and mediation of
These authors contributed equally: Frederick T. Chin, AntonioY. Hardan
* Lawrence K. [email protected]
1 Department of Psychiatry and Behavioral Sciences, StanfordUniversity, Stanford, CA 94305, USA
2 Department of Radiology, Stanford University, Stanford, CA94305, USA
3 Department of Nuclear Medicine, Seoul National UniversityBundang Hospital, Seoul National University College ofMedicine, Seongnam, Seoul, South Korea
4 Bio Imaging Korea Seoul, Co., Ltd., Seoul, South Korea5 PMOD Technologies Ltd, Zürich, Switzerland
Supplementary information The online version of this article (https://doi.org/10.1038/s41380-020-0756-y) contains supplementarymaterial, which is available to authorized users.
1234
5678
90();,:
1234567890();,:

synchrony of neural circuits [6]. Examination of post-mortem brain samples of young adults with ASD andintellectual disability revealed decreased densities ofGABAA and/or GABAB receptors in the anterior cingulatecortex (ACC) [7–9], hippocampus [10], fusiform gyrus [8],and superior frontal cortex (BA9), which contains part ofthe dorsolateral prefrontal cortex (DLPFC) [11–13]. Acti-vation of the DLPFC is reduced in people with ASD as theyperform spatial working memory [14] and executive func-tion [15] tasks, suggesting that there could be an E/Iimbalance in this region.
To interrogate the GABAergic system at the neuro-transmitter receptor level in vivo, recent studies haveemployed positron emission tomography (PET). Using[11C]Ro15-4513, a radiotracer which binds selectively to α5subunit-containing GABAA receptors, Horder et al. reportedno differences in GABAA α5 subunit availability in anybrain region of high-functioning men with ASD comparedto age-matched and IQ-matched typically developing males[16]. Furthermore, using [11C]flumazenil, a radiotracer thatbinds to the α1, α2, α3, and α5 subunits of the GABAA
receptor [17], the Horder group also reported that there wereno differences in GABAA receptor availability in any brainregion of adults with ASD compared to age-matched andIQ-matched typically developing adults [16].
In addition to the GABAA receptor, another crucialcomponent of the GABAergic system is the neuro-transmitter GABA. GABA concentrations have been mea-sured successfully in individuals with ASD by protonmagnetic resonance spectroscopy (1H-MRS) [18–23], andregion-specific trends have emerged. GABA has beenshown to be lower in the frontal lobes [19, 23], auditorycortex [21, 22], and motor cortex [21] of children andadolescents with ASD compared to typically developing(TD) controls. Other brain regions, such as the ACC [24],occipital cortex [25], and visual cortex [21], have shown nodifference in GABA levels in ASD. Furthermore, none ofthe studies recently reviewed by Ajram et al. reported anyregional differences in GABA levels in adults [26]. Lookingat the relationship between neurotransmitter levels and ASDsymptom severity, Cochran et al. revealed that GABA-to-creatine ratios in the ACC correlated positively with thesocial cognition subscale of the Social ResponsivenessScale, Second Edition (SRS-2) and negatively with theReading the Mind in the Eyes score in adolescents withASD [20]. Furthermore, Robertson et al. recently demon-strated an important relationship between GABA levels inthe visual cortex and binocular rivalry (a basic visualfunction that is thought to rely on the E-I balance in thevisual cortex) in neurotypical controls but not in adolescentsand adults with ASD [18]. Collectively, these accumulatinglines of evidence support the importance of the GABAergicsystem in the pathophysiology of ASD.
In addition to the differences in the GABAergic systemin the cortical regions, we hypothesize that the GABAergicsystem in subcortical regions such as the thalamus is alsoaberrant. The thalamus is an anatomical structure thatcoordinates the synchronization of circuits connected to it.Aberrant GABAergic neurotransmission in thalamocorticalcircuits is supported by electroencephalogram (EEG) stu-dies which revealed significantly shorter phase shift dura-tion in the gamma frequency band in ASD subjects, ascompared to age-matched control participants [27]. Altera-tions in connectivity between the thalami and various cor-tical regions have recently been found in high-functioningchildren with ASD by functional MRI and diffusion tensorimaging studies [28]. Furthermore, hyper-connectivitybetween the thalamus and parietal sensorimotor systemwere found in an analysis of 360 individuals with ASD(compared with 403 neurotypical controls) [29]. Althoughevidence of thalamocortical differences, as well asGABAergic dysfunction, in ASD is increasing, there hasnot yet been direct evaluation of the GABAergic system(i.e., GABA concentrations and GABAA receptor densities)in the thalamocortical network.
Sex/gender also impacts the function of the GABAergicsystem. The menstrual cycle has been shown to affectGABA levels in the prefrontal [30] and occipital cortices[31]. Furthermore, GABA in the DLPFC and the GABAA
receptor α1 subunit in the superior temporal gyrus are bothdecreased in neurotypical women compared to men[32, 33]. Evidence suggests that these sex differences in theGABAergic system may also be relevant to ASD sympto-matology. Focusing on adults with ASD, Kirkovski et al.found a positive correlation between GABA concentrationin the superior temporal sulcus and ASD-related socialimpairments in women but not men [34]. These resultssuggest that there may be sex differences in the way theGABAergic system is impacted in ASD, and that thesedifferences are region-specific.
Accordingly, the objectives of this innovative study areto determine simultaneously the GABAA receptor densitiesand GABA levels in the thalami and left DLPFC of adultswith ASD using a state-of-the-art integrated PET-MRimaging system. Simultaneous PET-MR imaging allowsfor improvement in spatial alignment, temporal co-regis-tration, and motion artifacts that would not be possible withsequential PET and MRI. Furthermore, GABA levels andGABAA receptor densities can change with time, and thus,the simultaneous acquisition of PET and MRS data canprovide a more accurate assessment of the GABAergicsystem. To our knowledge, no previous study in the field ofautism has been published examining receptor density andGABA levels in the same sample. We hypothesize that theGABAergic tone (GABAA receptor densities and/or GABAconcentrations) in these regions will be different in
L. K. Fung et al.
individuals with ASD, compared to IQ-matched, age-mat-ched, and gender-matched typically developing (TD) con-trols. We test our hypothesis through the simultaneousacquisition of GABAA receptor binding potentials (BPND)by [18F]flumazenil-PET ([18F]FMZ-PET) and GABA con-centrations by 1H-MRS. Furthermore, we explore the rolesof gender and specific brain regions in the GABAergicsystem of individuals with ASD.
Materials and methods
Participants
Twenty-eight individuals with ASD (mean[SD] 26.6[8.3]years; 11 females; IQ 102.1[16.5]) and 29 IQ-matched,gender-matched, and age-matched typically developing(TD; 27.7[7.4] years; 10 females; IQ 112.1[13.1]) indi-viduals (Table 1) were recruited. Methodology of thestudy was approved by the Institutional Review Board ofStanford University. All participants provided writteninformed consent. Inclusion criteria for the ASD groupincluded: (a) Diagnosis of ASD based on DSM-5 criteriaas confirmed by a qualified clinician, and the adminis-tration of Autism Diagnostic Interview-Revised (ADI-R)[35] and Autism Diagnostic Observation Schedule, Sec-ond Edition-2 (ADOS-2) [36]. (b) Age 18 to 55. (c)Adults who are physically healthy. (d) No significantcurrent psychosocial stressors per history. (e) Full scaleIQ ≥ 70. Exclusion criteria for the ASD group included: (f)Pre-term birth (<34 weeks’ gestation). (g) Low birthweight (<2000g). (h) DSM-5 diagnosis of other severepsychiatric disorder such as bipolar disorder or schizo-phrenia. (i) Current use of benzodiazepines. (j) Use ofother medications that directly modulate the binding ofGABAA receptor [37] (e.g., flumazenil, zolpidem, zale-plon, eszopiclone) and active transport of GABA (e.g.,tiagabine) within 4 weeks of scanning. (k) History ofalcoholism or current substance abuse. (l) Active medicalproblems such as unstable seizures, congenital heart dis-ease, endocrine disorders. (m) Significant sensoryimpairments such as blindness or deafness. (n) Contra-indication for MRI or PET. (o) Pregnancy. (p) Evidence ofany genetic syndrome. Inclusion criteria for the TD groupincluded: Criteria (b) thru (e), as above. Exclusion Cri-teria: Criteria (f) thru (p). Additional exclusion criteria forthe TD group included: (1) Current or past neurologicaldisorders. (2) Current or past psychiatric disorders on thebasis of clinical psychiatric evaluation. (3) History ofsignificant perinatal difficulties or abnormal develop-mental milestones. In addition to the above inclusion andexclusion criteria, due to the effects of progesterone onthe menstrual cycle, all female participants were scanned
in the follicular phase when the progesterone level is lowand stable. The follicular phase was estimated from theparticipants’ histories of menstrual cycles. All subjectswere physically healthy post-pubertal adults.
Socio-communicative functioning was assessed by theAQ, Ritvo Autism Asperger’s Diagnostic Scale–Revised(RAADS-R) [38], and SRS-2 [39]. Based on a recent sys-tematic review of screening and diagnostic tools for adultswith ASD of mean normal intelligence, AQ and RAADS-Rwere found to provide the most satisfactory psychometricproperties [40]. Therefore, we have focused on these twomeasures in this report. Other emotional domains weremeasured by using the Berkeley Expressivity Questionnaire(BEQ) [41] and Social Phobia Anxiety Inventory (SPAI)[42]. Repetitive behaviors were assessed by the RepetitiveBehavior Scale–Revised (RBS-R) [43]. The RBS-R is arating scale completed by parents.
Among the 28 participants with ASD, 20 were taking atleast 1 psychotropic medication, including serotonin reup-take inhibitors (N= 13), stimulants (N= 8), atypical anti-psychotics (N= 4), non-stimulants (N= 3), and othermedications (melatonin (N= 3), bupropion (N= 2), oxcar-bazepine (N= 2), duloxetine (N= 1), hydroxyzine (N= 1)).Among the 29 TD participants, one was taking melatonin;another participant was taking a stimulant. Because of thisgroup difference, psychotropic medication usage wasincluded as a binary co-variate in generalized linear model(GLM) analyses (see “Statistical Analysis” section). Noparticipants took benzodiazepines or other medications thatdirectly modulate the binding of GABAA receptor within4 weeks of the study.
Power analysis
When this study was first designed, there was no available[18F]FMZ-PET data measuring GABAA receptor BPND inthe DLPFC or thalami of individuals with ASD. However,postmortem examination of the superior frontal cortexrevealed lower levels of γ subunit of GABAA receptors inadults with ASD (0.255 ± 0.137), compared to neurotypicalcontrols (0.198 ± 0.050) [12]. Using these results andassuming an α value of 0.05, 30 subjects per group wouldbe needed to yield a power of 70% in a 1-way analysis ofvariance (ANOVA). Based on GABA data reported byHarada et al. [23], the GABA levels in the frontal lobe were1.1 ± 0.23 and 1.5 ± 0.25. Using these results and assumingan α value of 0.05, 6 subjects per group would be needed toyield a power of 80% in a 2-way ANOVA. This number ofparticipants needed was much lower than that estimated forthe PET component of this study (N= 30 per group).Overall, we predicted that 30 participants would be neededto demonstrate significant group differences in BPND andGABA concentrations in the DLPFC.
Thalamic and prefrontal GABA concentrations but not GABAA receptor densities are. . .

Neuroimaging data acquisition
Acquisition of PET data with concurrent 1H-MRS andstructural MRI was performed using a state-of-the-artsimultaneous hybrid PET/MR imaging system (SIGNAPET/MR, GE Healthcare, Waukesha, WI) [44, 45]. Theradiotracer employed for binding GABAA receptors was[18F]flumazenil ([18F]FMZ) [46]. Dynamic PET data wereused in combination with 3D T1-weighted structural MRdata to acquire the BPND of [18F]FMZ for the GABAA
receptors [46]. The Ichise’s Original Multilinear ReferenceTissue Model (MRTM0) [47] was employed for kineticmodeling. More detailed information on the synthesis ofclinical grade [18F]FMZ, dynamic PET image acquisition,and PET data analyses can be found in supplementarymaterials.
In addition to region-based PET data analyses, we alsoperformed whole-brain analyses. During PET data acquisi-tion, a series of MR sequences were run, including a 3D T1-weighted protocol [repetition time (TR)= 7.9 ms; echo time
Table 1 Demographic data and selected findings from neuropsychological assessments in high-functioning adults with autism spectrum disorder(ASD) and typically developing adults (TD).
ASD(N= 28)
TD (N= 29) ASD male(N= 17)
ASD female(N= 11)
TD male(N= 19)
TD female(N= 10)
ANOVA F ANOVA P
Age (years) 26.6 ± 8.3 27.4 ± 7.4 22.6 ± 4.1 32.7 ± 9.7 26.7 ± 7.2 28.6 ± 7.9 4.69 0.006**
FSIQ 102.1 ± 16.5 112.1 ± 13.1 102.3 ± 16.8 101.7 ± 16.8 114.3 ± 12.6 108.5 ± 13.8 2.39 0.080
VIQ 104.4 ± 18.2 110.4 ± 14.1 99.1 ± 17.0 102.3 ± 21.1 112.9 ± 13.4 106.4 ± 14.9 1.00 0.402
NVIQ 99.8 ± 14.5 113.4 ± 11.9 105.7 ± 16.9 101.1 ± 13.1 115.4 ± 10.8 110.0 ± 13.3 4.54 0.007**
AQ–Total 31.8 ± 6.5 17.3 ± 8.3 29.4 ± 5.3 35.5 ± 6.7 19.3 ± 9.1 13.5 ± 4.7 23.40 <0.0001**
AQ–Social skills 6.8 ± 2.5 3.0 ± 2.5 6.4 ± 2.5 7.3 ± 2.5 3.4 ± 2.8 2.3 ± 2.0 11.16 <0.0001**
AQ–Attention switching 7.4 ± 1.8 4.7 ± 2.3 6.6 ± 1.5 8.5 ± 1.6 5.1 ± 2.3 3.9 ± 2.0 12.42 <0.0001**
AQ–Attention to details 6.5 ± 2.4 5.1 ± 2.4 6.1 ± 2.3 7.1 ± 2.6 5.4 ± 2.4 4.7 ± 2.5 1.99 0.127
AQ–Communication 6.6 ± 2.2 2.5 ± 2.2 6.2 ± 1.9 7.2 ± 2.5 2.8 ± 2.6 1.8 ± 1.3 17.65 <0.0001**
AQ–Imagination 4.6 ± 2.0 2.1 ± 1.8 4.1 ± 2.1 5.4 ± 1.7 2.7 ± 1.9 0.8 ± 0.9 13.52 <0.0001**
RAADS-R–Total 126.6 ± 36.5 50.6 ± 39.5 116.5 ± 37.0 142.3 ± 31.1 59.6 ± 45.0 33.5 ± 17.2 22.79 <0.0001**
RAADS-R–Social relatedness 61.1 ± 20.2 25.3 ± 21.5 56.1 ± 21.8 68.8 ± 15.4 30.6 ± 24.6 15.2 ± 7.4 17.32 <0.0001**
RAADS-R–Circumscribedinterest
24.7 ± 9.6 9.6 ± 6.8 22.6 ± 8.1 28.0 ± 11.1 11.1 ± 7.2 6.6 ± 5.1 18.61 <0.0001**
RAADS-R–Language 10.4 ± 4.2 4.8 ± 4.2 9.9 ± 4.4 11.1 ± 4.1 5.4 ± 4.7 3.7 ± 2.9 8.77 <0.0001**
RAADS-R–Sensory motor 30.2 ± 12.1 10.6 ± 10.0 27.8 ± 12.1 34.1 ± 11.5 12.5 ± 11.4 7.0 ± 5.5 16.80 <0.0001**
SRS-2–Total 69.3 ± 8.6 50.8 ± 9.3 68.5 ± 8.2 70.5 ± 9.4 53.3 ± 10.5 46.0 ± 3.2 22.95 <0.0001**
SRS-2–Social awareness 63.4 ± 9.0 49.3 ± 10.2 63.9 ± 8.9 62.5 ± 9.5 51.1 ± 11.4 46.0 ± 6.6 10.75 <0.0001**
SRS-2–Social cognition 64.4 ± 10.0 49.9 ± 8.7 61.0 ± 8.9 69.0 ± 10.2 52.1 ± 9.3 45.8 ± 5.9 15.22 <0.0001**
SRS-2–Social communication 67.4 ± 8.8 48.9 ± 9.4 67.4 ± 9.1 67.6 ± 8.8 51.7 ± 10.5 43.4 ± 2.8 22.85 <0.0001**
SRS-2–Social motivation 67.4 ± 10.5 54.4 ± 10.0 66.5 ± 10.8 68.9 ± 10.4 56.1 ± 10.9 51.3 ± 7.8 8.18 0.00014**
SRS-2–Repetitive behaviors 73.1 ± 11.2 51.8 ± 8.7 72.5 ± 10.7 74.9 ± 12.4 54.2 ± 9.4 47.3 ± 4.7 23.18 <0.0001**
SRS-2–Social informationprocessing
67.6 ± 8.4 50.8 ± 9.3 66.6 ± 8.0 69.3 ± 9.0 53.1 ± 10.7 45.8 ± 3.0 20.07 <0.0001**
RBS-R–Total 40.3 ± 35.7 N/A 51.1 ± 35.7 10.2 ± 7.6 N/A N/A N/A N/A
RBS-R–Stereotyped behavior 5.4 ± 5.2 N/A 7.1 ± 4.9 0.4 ± 0.5 N/A N/A N/A N/A
RBS-R–Self-injurious behavior 6.1 ± 6.3 N/A 8.0 ± 6.3 0.6 ± 0.9 N/A N/A N/A N/A
RBS-R–Compulsive behavior 7.6 ± 6.9 N/A 9.3 ± 7.1 3.0 ± 3.3 N/A N/A N/A N/A
RBS-R–Ritualistic behavior 5.7 ± 4.6 N/A 7.0 ± 4.7 2.0 ± 1.2 N/A N/A N/A N/A
RBS-R–Sameness 11.0 ± 9.9 N/A 13.9 ± 9.9 2.6 ± 3.0 N/A N/A N/A N/A
RBS-R–Restricted behavior 4.6 ± 4.1 N/A 5.7 ± 4.2 1.6 ± 1.1 N/A N/A N/A N/A
BEQ–Negative emotionality 23.7 ± 8.4 21.6 ± 6.0 23.7 ± 6.0 23.6 ± 11.6 19.7 ± 5.1 25.1 ± 6.2 1.66 0.188
BEQ–Positive emotionality 19.5 ± 5.8 21.5 ± 5.0 17.9 ± 5.8 21.9 ± 4.9 20.7 ± 4.9 22.9 ± 4.9 2.34 0.084
BEQ–Impulse strength 29.6 ± 9.3 26.1 ± 7.7 25.7 ± 9.2 35.6 ± 5.4 23.7 ± 8.0 30.7 ± 4.5 6.88 0.0005**
BEQ–Emotional expressivity 72.8 ± 19.2 69.1 ± 15.6 67.3 ± 18.1 81.2 ± 18.6 64.1 ± 15.0 78.7 ± 12.3 3.62 0.019*
SPAI–Social phobia 110.8 ± 37.8 69.3 ± 40.1 106.7 ± 35.9 115.9 ± 41.3 73.0 ± 43.5 63.1 ± 35.2 3.78 0.017*
SPAI–Agoraphobia 27.6 ± 18.0 16.3 ± 15.0 27.6 ± 20.6 27.6 ± 14.9 16.5 ± 14.9 16.0 ± 16.1 1.82 0.157
SPAI–Difference 83.2 ± 34.4 53.0 ± 32.4 79.1 ± 30.3 88.3 ± 40.0 56.5 ± 37.5 47.1 ± 22.1 3.54 0.022*
Note: Values reported are mean ± SD. One-way ANOVA was performed between the four Diagnosis+Gender groups.
*P < 0.05, **P < 0.01.
FSIQ Full-scale IQ, VIQ Verbal IQ, NVIQ Non-verbal IQ, AQ Autism-Spectrum Quotient, RAADS-R Ritvo Autism Asperger Diagnostic Scale-Revised, SRS-2 Social Responsiveness Scale, 2nd Edition, RBS-R Repetitive Behavior Scale-Revised, BEQ Berkeley Expressivity Questionnaire,SPAI Social Phobia and Anxiety Inventory.
L. K. Fung et al.

(TE)= 2.9 ms; field of view (FOV)= 240 mm × 192 mm;matrix= 220 × 160; flip angle (FA)= 12°; axial plane; slicethickness (TH)= 1.4 mm; 128 slices] and two single-voxel1H-MRS sequencing prescribed at the left DLPFC andbilateral thalami (Supplementary Fig. 1). The T1 was usedfor planning the positioning of the target voxels. Thedetermination of brain levels of GABA and othermetabolites was achieved by an Improved MEGA-SPECIAL sequence [TE= 80 ms; TR= 2000 ms; voxelsize ~15 cm3; 15 min acquisition time] [48]. Based on 1DImage-Selected in Vivo Spectroscopy (ISIS) spatial locali-zation and single spin echo, this editing technique allowsmuch longer (30 ms) and more selective editing pulses thanthose used in MEGA-PRESS, enabling B0-inhomogeneity-insensitive GABA editing with macromolecule suppression.To reduce susceptibility and motion artifacts in the ISISdirection, out-of-voxel suppression was achieved using a1D echo planar (EP) gradient during readout [48]. A fulloptimization of the acquisition of 1H-MRS data usingImproved MEGA-SPECIAL performed in a 3T MR scannerwithout PET detector was recently reported [48]. Thismethod was demonstrated to effectively suppress the mac-romolecule signal that typically interferes with the GABAsignal. In this study, we employed the Improved MEGA-SPECIAL as the pulse sequence to acquire 1H-MRS data inthe hybrid PET-MR scanner. In contrast to standalone MRscanners where the bed position is fixed within a pulsesequence but can be moved between pulse sequences,simultaneous PET and MR data acquisitions require that theposition of the scanner bed be fixed during the PET scan.
Spectra of editing ON and editing OFF were recon-structed and the GABA edited spectrum was obtained bysubtracting the editing OFF spectrum from the editing ONspectrum [48]. Total Cr (Cr+ PCr), NAA, Cho, myoino-sitol (mI), and sum of glutamate (Glu) and glutamine (Gln)[Glx=Glu+Gln] were quantified from the editing OFFspectrum using LCModel and referenced to both the total Cr(Cr+ PCr) and the unsuppressed water. Only spectra withCRLB lower than or equal to 20% for Cr+ PCr, NAA, andCho were included in the analysis. GABA levels wereestimated from the integration of the 3ppm peak in theedited spectrum and were also referenced to both the totalCr (Cr+ PCr) and the unsuppressed water.
The percentages of white matter, gray matter, and cere-brospinal fluid between ASD and TD groups were statisti-cally indistinguishable (Supplementary Table 1); therefore,we chose to report concentrations of the metabolites withoutadjusting for tissue composition.
Primary hypotheses
We hypothesize that both BPND and GABA concentrationin the DLPFC and thalamus will be reduced in ASD. We
also hypothesize that there exists a correlation between bothof these parameters and ASD symptom severity that may bemodified by sex.
Statistical analysis
All analyses were run in R version 3.5.3. Participants’demographic and neuropsychological assessment data werecompared between the four Diagnosis + Gender groups—TD Male, ASD Male, TD Female, ASD Female—with one-way analysis of variance (ANOVA). Significance was set atP < 0.05. Demographic variables with significant groupdifferences were identified as possible confounders andincluded as co-variates in subsequent analyses. Post-hoccomparisons to identify specific group-mean differenceswere performed using Tukey’s HSD test, with significanceset at adjusted P < 0.05. To assess whether group differ-ences in socio-communicative function could be driven bymood and anxiety differences in those same groups, Pear-son’s correlations were run between AQ/RAADS-R/SRS-2total scores and BEQ/SPAI scores.
For the MRS data, quality control parameters for mag-netic resonance spectra determined from LCModel werecompared between ASD and TD groups with Welch two-sample T-tests. Mean GABA/Water concentration at each ofthe two MRS voxels—bilateral thalami and left DLPFC—was compared between groups with two-way ANOVA thatused Diagnosis and Gender as between-subject variables.Post-hoc analysis was run with a GLM at each of thevoxels, using the significant Diagnosis, Gender, and/orinteraction terms, as well as the demographic co-variates, asindependent variables, and mean GABA/Water concentra-tion as the dependent variable. Significance of the maineffects or interaction effects was set at P < 0.05.
For the PET data, in an exploratory fashion, the meanBPND of [18F]FMZ at every PET region were comparedbetween groups with the same two-way ANOVA as above.Findings from the PET regions that correspond to the MRSvoxels—left thalamus, right thalamus, and left middlefrontal gyrus—are reported.
To investigate possible correlations between MRS mea-surements of GABA levels and PET measurements ofreceptor density, Pearson’s correlation analysis was runbetween thalamic GABA/Water concentrations and [18F]FMZ BPND of both sides of the thalamus, as well asbetween GABA/Water at the left DLPFC and [18F]FMZBPND of the left middle frontal gyrus.
To investigate associations of GABA concentrationswith AQ and RAADS-R total scores, participants werestratified by Diagnosis, then GLMs were run for the regionsof interest that were identified by MRS to have significantgroup differences in GABA concentrations. The indepen-dent variables were Gender, GABA/Water concentration,
Thalamic and prefrontal GABA concentrations but not GABAA receptor densities are. . .

the interaction term between Gender and GABA/Waterconcentration, and the demographic co-variates; thedependent variables were AQ and RAADS-R total scores.Significance was set at a P value less than 0.0125 to correctfor 4 GLMs. Simple correlation coefficients (r) for each ofthe four Diagnosis+Gender groups’ trendlines in Fig. 3 arereported.
Results
Demographics and clinical assessments
Table 1 shows the demographics of the participants andfindings from neuropsychological assessments. Using one-way ANOVAs to compare means between the four groupsseparated by diagnosis and gender, we found significantgroup differences in age (F(3,53)= 4.69, P= 0.006) andnon-verbal IQ (F(3,49)= 4.54, P= 0.007), as well as anear-significant group difference in full-scale IQ (F(3,49) =2.39, P= 0.080). To account for possible confoundingfactors, we included age and full-scale IQ, along withmedication usage, as co-variates in subsequent GLM ana-lyses. Post-hoc comparisons with Tukey HSD demonstratedthat ASD males were significantly younger than ASDfemales (P= 0.003); no other group differences in age weresignificant. Furthermore, ASD males had significantly lowernon-verbal IQ than TD males (P= 0.008); no other groupdifferences in non-verbal IQ were significant.
As expected, one-way ANOVA also revealed significantgroup differences in socio-communicative function (P <0.0001 for AQ, RAADS-R, and SRS-2 total scores andalmost all sub-scales). Post-hoc comparisons with TukeyHSD demonstrated that these significant group differenceswere not attributable to gender. There were no significantdifferences when comparing ASD males with ASD females,or when comparing TD males with TD females, with theone exception of AQ: Imagination (TD male vs. TD femaleadjusted P= 0.034). Instead, the diagnosis of ASD drovegroup differences. TD females differed significantly fromASD males and ASD females on all AQ, RAADS-R, andSRS-2 subscales (adjusted P < 0.01), except for AQ-Attention to Details and AQ-Imagination. TD males dif-fered significantly from ASD males and ASD females on allAQ, RAADS-R, and SRS-2 subscales (adjusted P < 0.05),except for AQ: Attention to Details, Imagination, andAttention Switching.
In terms of other co-morbid symptoms, mood andanxiety were associated with both gender and diagnosis.Preliminary ANOVA identified significant group differ-ences in BEQ-Impulse Strength (F(3,53)= 6.88, P=0.0005) and BEQ-Emotional Expressivity (F(3,53)= 3.62,P= 0.019). Post-hoc comparisons with Tukey HSD
demonstrated that ASD females scored significantly higheron BEQ-Impulse Strength than TD males (P < 0.001) andASD males (P= 0.006), as well as significantly higher onBEQ-Emotional Expressivity than TD males (P= 0.037).No other significant group differences on the BEQ werefound. ANOVA also identified significant group differencesin SPAI-Social Phobia (F(3,45)= 3.78, P= 0.017) andSPAI-Difference (F(3,45)= 3.54, P= 0.022). Using TukeyHSD, we found only one significant difference in means:ASD females scored significantly higher on SPAI-Difference than TD females (P= 0.045).
To assess whether differences in socio-communicativefunction in ASD females could be driven by their under-lying mood and anxiety differences, we used Pearson’scorrelations to investigate if BEQ-Impulse Strength, BEQ-Emotional Expressivity, and SPAI-Difference scores cor-related with the total scores of AQ, RAADS-R, and SRS-2.Importantly, we found no significant correlations (P > 0.10for all). Therefore, any brain correlates of socio-communicative function in individuals with ASD descri-bed below were specific and not driven by underlyinganxiety.
1H-MRS GABA concentrations
Figure 1 and Supplementary Fig. 1 show the location ofvoxel placements in the bilateral thalami and left DLPFC, aswell as their corresponding proton magnetic resonancespectra. The mean concentrations of GABA/Water mea-sured by 1H-MRS in these two regions are graphed bydiagnosis and gender. In addition to GABA/Water, theconcentrations of all other MRS-measured metabolites arepresented in Table 2.
In the thalami, two-way ANOVA using diagnosis andgender as between-subject variables did not identify a sig-nificant interaction, but did identify an effect of gender(F(3,36)= 2.78, P= 0.049). Post-hoc GLM analysis thatincluded gender, age, medication usage, and FSIQ as theindependent variables identified significantly higher GABA/Water in males than in females (F(4,34)= 2.19, P= 0.043).
In the left DLPFC, two-way ANOVA identified a sig-nificant Diagnosis × Gender interaction effect (F(3,34)=4.18, P= 0.041) and a significant main effect of diagnosis(P= 0.027). Post-hoc GLM analysis adjusting for medica-tion usage and IQ retained the significance of the interaction(F(5,30)= 2.39, P= 0.046); however, including age in themodel made the term insignificant.
PET GABAA receptor densities
We investigated GABAA receptor densities, as representedby BPND of [18F]FMZ, in both left and right thalami, as wellas left middle frontal gyrus (within which lies the left
L. K. Fung et al.

DLPFC), using two-way ANOVA. We found no significantdifferences between participants grouped by diagnosis andgender (Fig. 2b).
The BPND’s of other regions of interest were also comparedbetween groups with exploratory two-way ANOVA, and nosignificant differences were found (Supplementary Table 2).Whole-brain voxel-based analysis of BPND’s also revealedneither any significant main effects of Diagnosis (Fig. 2a) orGender, nor a Diagnosis × Gender interaction effect.
Possible correlations between MRS measurements ofGABA levels and PET measurements of receptor density
at the thalami and left DLPFC / left middle frontal gyruswere investigated using Pearson’s correlation analysis.No significant correlations between GABA/Water con-centrations and [18F]FMZ BPND were found at theseregions.
Gender modifies thalamic GABA–symptom severityrelationship
Having shown that thalamic GABA/Water concentrationsdiffer between genders, we tested the hypothesis that
Fig. 1 Proton magnetic resonance spectroscopy (1H-MRS) dataacquisition in adults with autism spectrum disorder (ASD) andtypically developing (TD) controls. Location of 1H-MRS voxelplacement at the (a) bilateral thalami and (b) left DLPFC. ImprovedMEGA-SPECIAL spectra and corresponding edited spectra are shownfor the (c) thalami and (d) left DLPFC. Group-mean GABA/Waterconcentrations by diagnosis and gender are shown for the (e) bilateral
thalami and (f) left DLPFC. Error bars represent ± 1 SEM. Significantmain effects of diagnosis or gender (P < 0.05 in primary two-wayANOVAs) are starred (*). After covarying for age, psychotropicmedication usage, and IQ, the gender difference in thalamic GABAremained significant. The TD vs. ASD difference in DLPFC GABAremained significant after covarying for medication usage and IQ, butnot after adjusting for age.
Thalamic and prefrontal GABA concentrations but not GABAA receptor densities are. . .

Table2a.
Con
centratio
nsof
metabolitesby
grou
p,as
measuredby
proton
magnetic
resonancespectroscopy
(1H-M
RS)in
bilateralthalam
iandleftDLPFC.
ASD
TD
ASD
male
ASD
female
TD
male
TD
female
Maineffect
ofdiagno
sisP
Maineffect
ofgend
erP
Interaction
effect
P
Primaryanalyses
Thalami
NN
NN
NN
GABA/W
ater
(×10
−5 )
194.57
±0.77
214.85
±1.16
124.62
±0.83
74.50
±0.74
125.33
±0.64
94.21
±1.41
0.49
0.04
9*0.11
LeftDLPFC
GABA/W
ater
(×10
−5 )
184.34
±1.25
203.25
±1.29
104.85
±1.24
83.71
±1.00
133.04
±1.26
73.63
±1.34
0.02
7*0.51
0.04
1*
Secon
dary
analyses
Thalami
NN
NN
NN
GABA/Cr+
PCr
195.08
±0.81
215.44
±1.51
125.06
±0.78
75.12
±0.93
125.70
±1.07
95.09
±1.96
GABA/Glx
185.73
±0.81
145.97
±2.33
115.67
±1.43
75.84
±1.61
75.56
±1.64
76.38
±2.94
NAA/Cr+
PCr
261.54
±0.21
261.49
±0.31
151.61
±0.17
111.45
±0.24
161.43
±0.32
101.58
±0.27
Glx/Cr+
PCr
210.98
±0.34
171.00
±0.29
121.06
±0.43
90.88
±0.13
101.05
±0.22
70.94
±0.37
Cr+
PCr(×10
8 )27
1.49
±0.80
261.45
±0.59
161.37
±0.75
111.66
±0.88
161.46
±0.64
101.44
±0.54
LeftDLPFC
GABA/Cr+
PCr
183.39
±0.99
202.92
±1.71
103.51
±1.07
83.23
±0.92
132.41
±1.13
73.87
±2.26
GABA
/Glx
142.83
±1.06
182.04
±1.12
92.88
±1.08
52.72
±1.13
121.82
±1.22
62.47
±0.86
NAA/Cr+
PCr
241.42
±0.23
241.32
±0.37
141.39
±0.25
101.46
±0.22
161.28
±0.41
81.41
±0.25
Glx/Cr+
PCr
181.30
±0.33
212.14
±2.73
121.32
±0.39
61.25
±0.19
141.71
±0.89
73.02
±4.66
Cr+
PCr(×10
8 )26
1.82
±1.05
281.72
±0.80
161.75
±1.06
101.93
±1.08
181.73
±0.72
101.70
±0.98
b.Qualitycontrolparametersformagnetic
resonancespectradeterm
ined
from
LCMod
el
Cramer
Rao
lower
boun
d(CRLB)
Thalami
ASD
TD
P
Cho
3.95
±1.28
4.25
±2.02
0.58
8
Glx
21.24±10
.55
21.01±18
.83
0.79
8
mI
23.71±11
.65
18.78±8.52
0.08
1
NAA
6.86
±3.90
6.75
±3.53
0.93
2
Cr+
PCr
4.24
±1.09
4.94
±3.77
0.42
3
LeftDLPFC
Cho
5.29
±2.39
5.93
±3.39
0.60
6
Glx
15.82±12
.10
19.95±20
.76
0.24
1
mI
14.41±7.23
15.29±7.35
0.93
5
NAA
8.41
±4.62
7.27
±3.69
0.27
2
Cr+
PCr
4.12
±1.90
5.00
±2.90
0.34
1
L. K. Fung et al.

thalamic GABA correlates with ASD symptom severity ingender-specific ways. Stratifying by diagnosis—thedominant predictor of AQ and RAADS—we used fourtotal GLMs covarying for age, medication usage, and IQin order to investigate the interaction between gender andthalamic GABA/Water in predicting AQ and RAADS-Rtotal scores.
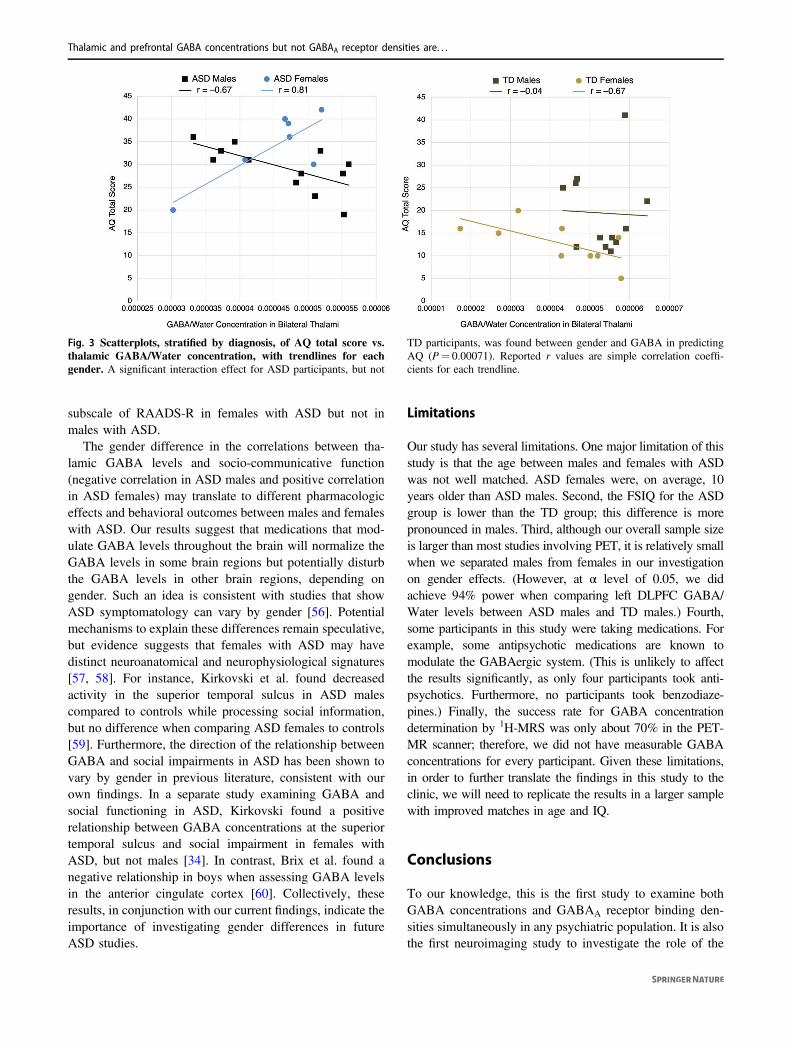
For ASD participants, a significant interaction effect wasnoted between gender and thalamic GABA in predictingAQ total score (F(6,12)= 4.76, P= 0.00071) and RAADS-R total score (F(6,12)= 4.76, P= 0.0019). For TD parti-cipants, on the other hand, there was no significant inter-action effect for either behavioral measure. Figure 3presents scatterplots of the relationships between AQ totalscore and thalamic GABA/Water concentrations, with par-ticipants separated by diagnosis and gender.
Discussion
In a comprehensive manner, we studied both GABAA
receptor densities and GABA concentrations in the leftDLPFC and bilateral thalami in high-functioning adults(HFA) with ASD. Our results provide evidence for region-dependent and gender-specific differences in GABA con-centrations, but not GABAA receptor binding densities,between HFA with ASD and TD adults. The latter resultfurther replicated the findings in a recent report [16], whichexamined GABAA receptor densities but not GABAconcentrations.
While previous studies have reported lower GABAlevels in cortical regions (frontal lobes [19, 23], auditorycortex [21, 22], and motor cortex [21]) in children andadolescents with ASD as compared to age-matched TDcontrols, this study found higher GABA levels in the leftDLPFC of HFA with ASD as compared to TD adults. It isnot clear what contributes to the discrepancy in GABAlevels in the cortical regions. However, higher restinglevels of GABA have been shown to negatively correlatewith the BOLD response in various brain regions [49–51],including the DLPFC [52]. Increased GABAergic (inhi-bitory) tone in the DLPFC could thus explain why thisregion exhibits decreased activation during workingmemory tasks in adults with ASD [14]. We also speculatethat higher cortical GABA levels may be the result ofcompensation for primary defects occurring elsewhere inthe GABAergic signaling pathway. Compensatory modelshave been proposed to explain why, for instance, despitehaving alterations in the E-I ratio, several mouse modelsof ASD have relatively normal synaptic depolarizationand spiking [53]. One possibility is that increased neu-rotransmitter production could compensate for abnorm-alities in GABA receptor function or localization ratherS
ignal-to-noise
ratio
(SNR)andfullwidth
athalfmaxim
um(FWHM)
Thalami
ASD
TD
P
SNR
16.59±6.65
15.59±6.11
0.55
9
FWHM
0.07
1±0.01
80.07
7±0.02
60.27
0
LeftDLPFC
SNR
15.56±6.35
17.75±8.09
0.29
9
FWHM
0.09
6±0.02
90.11
4±0.04
30.10
5
Note:
a:Valuesrepo
rted
aremean±SD.Pvalues
repo
rted
arefrom
two-way
ANOVAs:Thalami:F(3,36)
=2.78
;LeftDLPFC:F(3,34)
=4.18
.*P
<0.05
.
TD
typically
developing
,Cr+PCrcreatin
eandph
osph
ocreatine,
GABAgammaam
inob
utyric
acid,Glx
glutam
ineandglutam
ate,
mImyo
-ino
sitol,NAAN-acetylaspartate.
Note:b:
Valuesrepo
rted
aremean±SD.P
values
arefrom
Welch
two-sampleT-testp
erform
edbetweenASDandTDgrou
ps.C
hocholine,Glxsum
ofglutam
ineandglutam
ate,mImyo
-ino
sitol,
NAAN-acetylaspartate,Cr+PCrcreatin
e+ph
osph
ocreatine.
Thalamic and prefrontal GABA concentrations but not GABAA receptor densities are. . .

than density, as seen in cerebellar basket cells in ASD[54]. Although we did not find group differences inGABAA receptor density, our study cannot rule out thatGABAA receptors are functionally impaired in ASD, asprior studies have suggested [12]. Furthermore, our studydoes not examine GABAB receptors, and several studieshave indicated that this receptor subtype may be dys-functional in ASD [8, 13, 55].
Compared to the cortical regions, sub-cortical brainregions have been studied much less. Harada et al. reportedthat the GABA levels in the lenticular nucleus of the basalganglia of children and adolescents with ASD and age-matched controls were statistically indistinguishable [23].This study represents the first study investigating theGABA levels in the thalami of adults with ASD. When allparticipants were included, we found no group difference
in thalamic GABA levels. It is interesting to find region-specific differences in GABA levels. We speculate thatcortical regions tend to be more plastic and are thereforemore able to compensate for the deficits in GABAergictone by increasing the levels of GABA over time. How-ever, the thalami may not be as plastic as the corticalregions.
In addition to region-dependent GABA concentrationalterations, we also found region-dependent and gender-specific correlations between GABA concentrations andsocio-communicative function. Our findings complementprevious research on the relationship between GABA in theright superior temporal sulcus (STS) and socio-communicative function [34]. Specifically, Kirkovski et al.found a significant positive correlation between GABAconcentrations at the right STS and social relatedness
Fig. 2 Positron emission tomography (PET) imaging with [18F]flumazenil in adults with autism spectrum disorder (ASD)and typically developing (TD) individuals. a Group-mean parametricmaps derived from PET data in standard MNI space. Color barrepresents non-displaceable binding potential (BPND) of [18F]
flumazenil. Mean parametric maps do not differ significantly betweengroups. b Group-mean BPND of [18F]flumazenil in the thalami and leftDLPFC, as detected by PET. Error bars represent ±1 SEM. MeanBPND in these regions of interest do not differ significantly betweengroups.
L. K. Fung et al.
subscale of RAADS-R in females with ASD but not inmales with ASD.
The gender difference in the correlations between tha-lamic GABA levels and socio-communicative function(negative correlation in ASD males and positive correlationin ASD females) may translate to different pharmacologiceffects and behavioral outcomes between males and femaleswith ASD. Our results suggest that medications that mod-ulate GABA levels throughout the brain will normalize theGABA levels in some brain regions but potentially disturbthe GABA levels in other brain regions, depending ongender. Such an idea is consistent with studies that showASD symptomatology can vary by gender [56]. Potentialmechanisms to explain these differences remain speculative,but evidence suggests that females with ASD may havedistinct neuroanatomical and neurophysiological signatures[57, 58]. For instance, Kirkovski et al. found decreasedactivity in the superior temporal sulcus in ASD malescompared to controls while processing social information,but no difference when comparing ASD females to controls[59]. Furthermore, the direction of the relationship betweenGABA and social impairments in ASD has been shown tovary by gender in previous literature, consistent with ourown findings. In a separate study examining GABA andsocial functioning in ASD, Kirkovski found a positiverelationship between GABA concentrations at the superiortemporal sulcus and social impairment in females withASD, but not males [34]. In contrast, Brix et al. found anegative relationship in boys when assessing GABA levelsin the anterior cingulate cortex [60]. Collectively, theseresults, in conjunction with our current findings, indicate theimportance of investigating gender differences in futureASD studies.
Limitations
Our study has several limitations. One major limitation of thisstudy is that the age between males and females with ASDwas not well matched. ASD females were, on average, 10years older than ASD males. Second, the FSIQ for the ASDgroup is lower than the TD group; this difference is morepronounced in males. Third, although our overall sample sizeis larger than most studies involving PET, it is relatively smallwhen we separated males from females in our investigationon gender effects. (However, at α level of 0.05, we didachieve 94% power when comparing left DLPFC GABA/Water levels between ASD males and TD males.) Fourth,some participants in this study were taking medications. Forexample, some antipsychotic medications are known tomodulate the GABAergic system. (This is unlikely to affectthe results significantly, as only four participants took anti-psychotics. Furthermore, no participants took benzodiaze-pines.) Finally, the success rate for GABA concentrationdetermination by 1H-MRS was only about 70% in the PET-MR scanner; therefore, we did not have measurable GABAconcentrations for every participant. Given these limitations,in order to further translate the findings in this study to theclinic, we will need to replicate the results in a larger samplewith improved matches in age and IQ.
Conclusions
To our knowledge, this is the first study to examine bothGABA concentrations and GABAA receptor binding den-sities simultaneously in any psychiatric population. It is alsothe first neuroimaging study to investigate the role of the
Fig. 3 Scatterplots, stratified by diagnosis, of AQ total score vs.thalamic GABA/Water concentration, with trendlines for eachgender. A significant interaction effect for ASD participants, but not
TD participants, was found between gender and GABA in predictingAQ (P= 0.00071). Reported r values are simple correlation coeffi-cients for each trendline.
Thalamic and prefrontal GABA concentrations but not GABAA receptor densities are. . .

GABAergic system in regions of the thalamocortical net-work, as it relates to HFA with ASD. We show that, despiteno group differences in GABAA receptor densities, GABAconcentrations in the left DLPFC are higher in HFA withASD, compared to TD controls. Furthermore, GABA con-centrations in the thalami correlate with AQ and RAADS-Rscores in a gender-specific manner in HFA with ASD, butnot in TD controls. Remarkably, higher thalamic GABAconcentrations are associated with lower socio-communicative symptom severity in males with ASD, andwith higher symptom severity in females with ASD. Weconclude that thalamic and prefrontal GABA levels arealtered in a region-dependent and gender-specific manner inHFA with ASD. Our findings are important steps towardidentifying molecular neuroimaging markers of socio-communicative function in individuals with ASD, thusaiding the development of assessment tools to evaluateneural circuits and interventions targeting core symptomsof ASD.
Acknowledgements We thank Bin Shen and Jessa Castillo for syn-thesizing the radiotracer [18F]flumazenil, Harsh Gandhi and DawnHolley for acquiring the PET and MR data, and Dr. Praveen Gulakafor coordinating the acquisition of the PET and MR data. Dr. ShyamSrinivas was the nuclear medicine physician supporting this project.Dr. Greg Zaharchuk provided useful comments on the acquisition ofMR data. Research reported in this publication was supported by theNational Institute of Mental Health (K08MH111750 awarded to LKF;R01MH110683 awarded to DS), American Academy of Child andAdolescent Psychiatry (awarded to LKF), National Institute of Childand Human Development (R01HD084214 awarded to FTC), and GEHealthcare (awarded to FTC).
Compliance with ethical standards
Conflict of interest The authors declare that they have no conflict ofinterest.
Publisher’s note Springer Nature remains neutral with regard tojurisdictional claims in published maps and institutional affiliations.
References
1. Vorstman JAS, Parr JR, Moreno-De-Luca D, Anney RJL, Nurn-berger JI Jr., Hallmayer JF. Autism genetics: opportunities andchallenges for clinical translation. Nat Rev Genet. 2017;18:362–76.
2. Hertz-Picciotto I, Schmidt RJ, Krakowiak P. Understandingenvironmental contributions to autism: causal concepts and thestate of science. Autism Res. 2018;11:554–86.
3. Rubenstein JL, Merzenich MM. Model of autism: increased ratioof excitation/inhibition in key neural systems. Genes Brain Behav.2003;2:255–67.
4. Gogolla N, Leblanc JJ, Quast KB, Sudhof TC, Fagiolini M,Hensch TK. Common circuit defect of excitatory-inhibitory bal-ance in mouse models of autism. J Neurodev Disord. 2009;1:172–81.
5. Tamas G, Buhl EH, Lorincz A, Somogyi P. Proximally targetedGABAergic synapses and gap junctions synchronize corticalinterneurons. Nat Neurosci. 2000;3:366–71.
6. Bonifazi P, Goldin M, Picardo MA, Jorquera I, Cattani A, Bian-coni G, et al. GABAergic hub neurons orchestrate synchrony indeveloping hippocampal networks. Science. 2009;326:1419–24.
7. Oblak A, Gibbs TT, Blatt GJ. Decreased GABA(A) receptors andbenzodiazepine binding sites in the anterior cingulate cortex inautism. Autism Res. 2009;2:205–19.
8. Oblak AL, Gibbs TT, Blatt GJ. Decreased GABA(B) receptors inthe cingulate cortex and fusiform gyrus in autism. J Neurochem.2010;114:1414–23.
9. Oblak AL, Gibbs TT, Blatt GJ. Reduced GABAA receptors andbenzodiazepine binding sites in the posterior cingulate cortex andfusiform gyrus in autism. Brain Res. 2011;1380:218–28.
10. Blatt GJ, Fitzgerald CM, Guptill JT, Booker AB, Kemper TL,Bauman ML. Density and distribution of hippocampal neuro-transmitter receptors in autism: an autoradiographic study. JAutism Dev Disord. 2001;31:537–43.
11. Fatemi SH, Reutiman TJ, Folsom TD, Thuras PD. GABA(A)receptor downregulation in brains of subjects with autism. JAutism Dev Disord. 2009;39:223–30.
12. Fatemi SH, Reutiman TJ, Folsom TD, Rustan OG, Rooney RJ,Thuras PD. Downregulation of GABAA receptor protein subunitsalpha6, beta2, delta, epsilon, gamma2, theta, and rho2 in superiorfrontal cortex of subjects with autism. J Autism Dev Disord.2014;44:1833–45.
13. Fatemi SH, Folsom TD, Reutiman TJ, Thuras PD. Expression ofGABA(B) receptors is altered in brains of subjects with autism.Cerebellum. 2009;8:64–69.
14. Luna B, Minshew NJ, Garver KE, Lazar NA, Thulborn KR, EddyWF, et al. Neocortical system abnormalities in autism: an fMRIstudy of spatial working memory. Neurology. 2002;59:834–40.
15. Sawa T, Kodaira M, Oiji A, Sasayama D, Iwadare Y, Ushijima H,et al. Dysfunction of orbitofrontal and dorsolateral prefrontalcortices in children and adolescents with high-functioning perva-sive developmental disorders. Ann Gen Psychiatry. 2013;12:31.
16. Horder J, Andersson M, Mendez MA, Singh N, Tangen A,Lundberg J, et al. GABAA receptor availability is not altered inadults with autism spectrum disorder or in mouse models. SciTransl Med 2018;10:pii: eaam8434.
17. Sieghart W. Structure and pharmacology of gamma-aminobutyricacid A receptor subtypes. Pharm Rev. 1995;47:181–234.
18. Robertson CE, Ratai EM, Kanwisher N. Reduced GABAergicaction in the autistic brain. Curr Biol. 2016;26:80–85.
19. Kubas B, Kulak W, Sobaniec W, Tarasow E, Lebkowska U,Walecki J. Metabolite alterations in autistic children: a 1H MRspectroscopy study. Adv Med Sci. 2012;57:152–6.
20. Cochran DM, Sikoglu EM, Hodge SM, Edden RA, Foley A,Kennedy DN, et al. Relationship among glutamine, gamma-aminobutyric acid, and social cognition in autism spectrum dis-orders. J Child Adolesc Psychopharmacol. 2015;25:314–22.
21. Gaetz W, Bloy L, Wang DJ, Port RG, Blaskey L, Levy SE, et al.GABA estimation in the brains of children on the autism spec-trum: measurement precision and regional cortical variation.Neuroimage. 2014;86:1–9.
22. Rojas DC, Singel D, Steinmetz S, Hepburn S, Brown MS.Decreased left perisylvian GABA concentration in children withautism and unaffected siblings. Neuroimage. 2014;86:28–34.
23. Harada M, Taki MM, Nose A, Kubo H, Mori K, Nishitani H, et al.Non-invasive evaluation of the GABAergic/glutamatergic systemin autistic patients observed by MEGA-editing proton MR spec-troscopy using a clinical 3 tesla instrument. J Autism Dev Disord.2011;41:447–54.
24. Brix MK, Ersland L, Hugdahl K, Dwyer GE, Grüner R, Noeske R,et al. Within- and between-session reproducibility of GABAmeasurements with MR spectroscopy. J Magn Reson Imaging.2017;46:421–30.
L. K. Fung et al.
25. Drenthen GS, Barendse EM, Aldenkamp AP, van VeenendaalTM, Puts NA, Edden RA, et al. Altered neurotransmitter meta-bolism in adolescents with high-functioning autism. PsychiatryRes Neuroimaging. 2016;256:44–49.
26. Ajram LA, Pereira AC, Durieux AMS, Velthius HE, PetrinovicMM, McAlonan GM. The contribution of [1H] magneticresonance spectroscopy to the study of excitation-inhibition inautism. Prog Neuropsychopharmacol Biol Psychiatry. 2019;89:236–44.
27. Thatcher RW, North DM, Neubrander J, Biver CJ, Cutler S,Defina P. Autism and EEG phase reset: deficient GABA mediatedinhibition in thalamo-cortical circuits. Dev Neuropsychol.2009;34:780–800.
28. Nair A, Treiber JM, Shukla DK, Shih P, Muller RA. Impairedthalamocortical connectivity in autism spectrum disorder: a studyof functional and anatomical connectivity. Brain. 2013;136(Pt6):1942–55.
29. Di Martino A, Yan CG, Li Q, Denio E, Castellanos FX, Alaerts K,et al. The autism brain imaging data exchange: towards a large-scale evaluation of the intrinsic brain architecture in autism. MolPsychiatry. 2014;19:659–67.
30. De Bondt T, De Belder F, Vanhevel F, Jacquemyn Y, Parizel PM.Prefrontal GABA concentration changes in women-Influence ofmenstrual cycle phase, hormonal contraceptive use, and correla-tion with premenstrual symptoms. Brain Res. 2015;1597:129–38.
31. Epperson CN, Haga K, Mason GF, Sellers E, Gueorguieva R,Zhang W, et al. Cortical gamma-aminobutyric acid levels acrossthe menstrual cycle in healthy women and those with premenstrualdysphoric disorder: a proton magnetic resonance spectroscopystudy. Arch Gen Psychiatry. 2002;59:851–8.
32. Pandya M, Palpagama TH, Turner C, Waldvogel HJ, Faull RL,Kwakowsky A. Sex- and age-related changes in GABA signalingcomponents in the human cortex. Biol Sex Differ. 2019;10:5.
33. O’Gorman RL, Michels L, Edden RA, Murdoch JB, Martin E. Invivo detection of GABA and glutamate with MEGA-PRESS:reproducibility and gender effects. J Magn Reson Imaging.2011;33:1262–7.
34. Kirkovski M, Suo C, Enticott PG, Yucel M, Fitzgerald PB. Shortcommunication: sex-linked differences in gamma-aminobutyricacid (GABA) are related to social functioning in autism spectrumdisorder. Psychiatry Res Neuroimaging. 2018;274:19–22.
35. Lord C, Rutter M, Le Couteur A. Autism diagnostic interview-revised: a revised version of a diagnostic interview for caregiversof individuals with possible pervasive developmental disorders. JAutism Dev Disord. 1994;24:659–85.
36. Lord C, Rutter M, DiLavore PC, Risi S, Gotham K, Bishop SL.Autism diagnostic observation schedule. 2nd edn. Los Angeles:Western Psychological Services; 2012.
37. Leggio L, Kenna GA, Swift RM. New developments for thepharmacological treatment of alcohol withdrawal syndrome. Afocus on non-benzodiazepine GABAergic medications. ProgNeuropsychopharmacol Biol Psychiatry. 2008;32:1106–17.
38. Ritvo RA, Ritvo ER, Guthrie D, Ritvo MJ, Hufnagel DH,McMahon W, et al. The Ritvo Autism Asperger Diagnostic Scale-Revised (RAADS-R): a scale to assist the diagnosis of AutismSpectrum Disorder in adults: an international validation study. JAutism Dev Disord. 2011;41:1076–89.
39. Constantino JN, Davis SA, Todd RD, Schindler MK, Gross MM,Brophy SL, et al. Validation of a brief quantitative measure ofautistic traits: comparison of the social responsiveness scale withthe autism diagnostic interview-revised. J Autism Dev Disord.2003;33:427–33.
40. Baghdadli A, Russet F, Mottron L. Measurement properties ofscreening and diagnostic tools for autism spectrum adults of meannormal intelligence: a systematic review. Eur Psychiatry. 2017;44:104–24.
41. Gross JJ, John OP. Revealing feelings: facets of emotionalexpressivity in self-reports, peer ratings, and behavior. J PersonalSoc Psychol. 1997;72:435–48.
42. Beidel DC, Borden JW, Turner SM, Jacob RG. The social phobiaand anxiety inventory: concurrent validity with a clinic sample.Behav Res Ther. 1989;27:573–6.
43. Bodfish JW, Symons FJ, Lewis MH. The repetitive behaviorscale: a test manual. 1998.
44. Grant AM, Deller TW, Khalighi MM, Maramraju SH, Delso G,Levin CS. NEMA NU 2-2012 performance studies for the SiPM-based ToF-PET component of the GE SIGNA PET/MR system.Med Phys. 2016;43:2334.
45. Levin CS, Maramraju SH, Khalighi MM, Deller TW, Delso G,Jansen F. Design features and mutual compatibility studies of thetime-of-flight PET capable GE SIGNA PET/MR system. IEEETrans Med Imaging. 2016;35:1907–14.
46. Odano I, Halldin C, Karlsson P, Varrone A, Airaksinen AJ, Krasi-kova RN, et al. [18F]flumazenil binding to central benzodiazepinereceptor studies by PET–quantitative analysis and comparisons with[11C]flumazenil. NeuroImage. 2009;45:891–902.
47. Ichise M, Ballinger JR, Golan H, Vines D, Luong A, Tsai S, et al.Noninvasive quantification of dopamine D2 receptors with iodine-123-IBF SPECT. J Nucl Med. 1996;37:513–20.
48. Gu M, Hurd R, Noeske R, Baltusis L, Hancock R, Sacchet MD,et al. GABA editing with macromolecule suppression using animproved MEGA-SPECIAL sequence. Magn Reson Med.2018;79:41–47.
49. Northoff G, Walter M, Schulte RF, Beck J, Dydak U, Henning A,et al. GABA concentrations in the human anterior cingulate cortexpredict negative BOLD responses in fMRI. Nat Neurosci.2007;10:1515–7.
50. Donahue MJ, Near J, Blicher JU, Jezzard P. Baseline GABAconcentration and fMRI response. Neuroimage. 2010;53:392–8.
51. Bednařík P, Tkáč I, Giove F, DiNuzzo M, Deelchand DK, EmirUE, et al. Neurochemical and BOLD responses during neuronalactivation measured in the human visual cortex at 7 Tesla. J CerebBlood Flow Metab. 2015;35:601–10.
52. Michels L, Martin E, Klaver P, Edden R, Zelaya F, Lythgoe DJ,et al. Frontal GABA levels change during working memory. PLoSONE. 2012;7:e31933.
53. Antoine MW, Langberg T, Schnepel P, Feldman DE. Increasedexcitation-inhibition ratio stabilizes synapse and circuit excit-ability in four autism mouse models. Neuron. 2019;101:648–61.e644.
54. Yip J, Soghomonian JJ, Blatt GJ. Increased GAD67 mRNAexpression in cerebellar interneurons in autism: implications forPurkinje cell dysfunction. J Neurosci Res. 2008;86:525–30.
55. Silverman JL, Pride MC, Hayes JE, Puhger KR, Butler-StrubenHM, Baker S, et al. GABAB receptor agonist R-baclofen reversessocial deficits and reduces repetitive behavior in two mousemodels of autism. Neuropsychopharmacology. 2015;40:2228–39.
56. Moseley RL, Hitchiner R, Kirkby JA. Self-reported sex differ-ences in high-functioning adults with autism: a meta-analysis. MolAutism. 2018;9:33.
57. Ferri SL, Abel T, Brodkin ES. Sex differences in autism spectrumdisorder: a review. Curr Psychiatry Rep. 2018;20:9.
58. Kirkovski M, Enticott PG, Fitzgerald PB. A review of the role offemale gender in autism spectrum disorders. J Autism Dev Disord.2013;43:2584–603.
59. Kirkovski M, Enticott PG, Hughes ME, Rossell SL, FitzgeraldPB. Atypical neural activity in males but not females with autismspectrum disorder. J Autism Dev Disord. 2016;46:954–63.
60. Brix MK, Ersland L, Hugdahl K, Gruner R, Posserud MB,Hammar A, et al. Brain MR spectroscopy in autism spectrumdisorder-the GABA excitatory/inhibitory imbalance theory revis-ited. Front Hum Neurosci. 2015;9:365.
Thalamic and prefrontal GABA concentrations but not GABAA receptor densities are. . .
Copyright © 2022 FDOKUMEN