INTERACTION OF GABAA RECEPTORS WITH PURINERGIC ...
72
INTERACTION OF GABA A RECEPTORS WITH PURINERGIC P2X 2 RECEPTORS Doctoral Thesis at the Medical University of Vienna For Obtaining the Academic Degree Doctor of Philosophy Submitted by Amulya Nidhi Shrivastava Supervisor Univ. Prof. Dr. Werner Sieghart Department of Biochemistry and Molecular Biology Center for Brain Research Medical University of Vienna Spitalgasse 4, Vienna, AUSTRIA Vienna 09 August` 2010
-
Upload
khangminh22 -
Category
Documents
-
view
1 -
download
0
Transcript of INTERACTION OF GABAA RECEPTORS WITH PURINERGIC ...

INTERACTION OF GABAA RECEPTORS WITH
PURINERGIC P2X2 RECEPTORS
Doctoral Thesis at the Medical University of Vienna
For Obtaining the Academic Degree
Doctor of Philosophy
Submitted by
Amulya Nidhi Shrivastava
Supervisor
Univ. Prof. Dr. Werner Sieghart
Department of Biochemistry and Molecular Biology
Center for Brain Research
Medical University of Vienna
Spitalgasse 4, Vienna, AUSTRIA
Vienna 09 August` 2010

2
Dedicated to my parents and sisters

3
ACKNOWLEDGEMENT
UNIV. PROF. Dr. WERNER SIEGHART
Center for Brain Research, MUW, WIEN
Dr. ISABELLA SARTO-JACKSON
Dr. Margot Ernst
Mirjana Stojanovic
Elisabeth Dögl
Institut de Biologie, ENS, PARIS
Prof. ANTOINE TRILLER
Géraldine Gouzer
Dr. Damien Alcor
Dr. Marianne Renner
Center for Biomolecular Medicine and Pharmacology, MUW, WIEN
Univ. Prof. Michael Freissmuth
Univ. Prof. Stefan Böhm
Colleagues & Friends
Karoline Fuchs, Verena Tretter, Ingrid Lumbar, Peter Altrichter, Kathrina Grote, Joachim
Ramerstorfer, Ivan Milenkovic, Stefan Radner, Milos Vasiljevic, Giri Kumar Chandaka, Marco
Treven, Rakhi Sharma, Manoj Kumar, Nishamol Geetha, Deepa Ganesh Chandaka, Revu Alexander
and Subhodeep Sarker
I sincerely thank the “Cell Communication in Health and Disease” program of the FWF and MUW
for financial support and for giving me the opportunity to work in Austria.

4
INDEX
1. ABSTRACT (ENGLISH)-------------------------------------------------------------------------------------------------- ---------05
2. ABSTRACT (GERMAN)--------------------------------------------------------------------------------------------------- --------06
3. INTRODUCTION
3.1. GABAA receptors--------------------------------------------------------------------------------------------- ------------------07
3.2. GABAA receptor interaction with other neurotransmitter receptors-----------------------------------------------------09
3.3. P2X2 receptors --------------------------------------------------------------------------------------------------- ---------------09
4. MATERIALS AND METHODS
4.1. Culture of HEK cells for transfection----------------------------------------------------------------------------------------12
4.2. Transfection of HEK cells -----------------------------------------------------------------------------------------------------13
4.3. Rat primary hippocampal neurons: culture and transfection--------------------------------------------------------------15
4.4. Culture and transfection of mouse primary spinal cord neurons ---------------------------------------------------------19
4.5. Co-immunoprecipitation of receptors from HEK293 cells----------------------------------------------------------------22
4.6. Co-precipitation of cell surface receptors------------------------------------------------------------------------------------25
4.7. Protein electrophoresis and western blotting--------------------------------------------------------------------------------26
4.8. Fluorescence resonance energy transfer (FRET)----------------------------------------------------------------------------31
4.9. Immunocytochemistry----------------------------------------------------------------------------------------------------------33
4.10. Confocal microscopy and image analysis-----------------------------------------------------------------------------------35
4.11. Live cell staining and quantum dot imaging--------------------------------------------------------------------------------37
4.12. Single-particle tracking and analysis-----------------------------------------------------------------------------------------40
4.13. Antibodies---------------------------------------------------------------------------------------------------------- -------------41
4.14. List of plasmids-------------------------------------------------------------------------------------------------- ---------------42
5. RESULTS
5.1. Agonist-independent intracellular oligomerization and co-trafficking of GABAARs and P2X2Rs-------------------43
5.2. Intracellular and surface co-localization and FRET between GABAARs and P2X2Rs------------------------------ --45
5.3. Extrasynaptic co-localization of GABAARs and P2X2Rs in spinal cord neurons---------------------------------------49
5.4. Modulation of GABAAR and P2X2R distribution by purinergic drugs in spinal cord neurons------------------------52
5.5. Regulation of GABAAR diffusion dynamics by drugs acting on purinergic receptors---------------------------------53
5.6. Modulation of P2X2R diffusion properties by purinergic drugs-----------------------------------------------------------55
5.7. Modulation of GABAAR and P2X2R interaction by purinergic drugs----------------------------------------------------57
6. DISCUSSION
6.1. Intracellular association & co-trafficking of GABAARs & P2X2Rs ensures specific targeting of P2X2Rs---------59
6.2. Purinergic transmission decreases GABAergic inhibition in spinal cord neurons--------------------------------------60
6.3. Blocking P2XRs as a dual therapeutic strategy for spinal pain processing----------------------------------------------61
7. REFERENCES------------------------------------------------------------------------------------------------------------- -----------63
8. CURRICULUM VITAE-------------------------------------------------------------------------------------------------------------72

5
1. ABSTRACT (ENGLISH)
GABAARs in the spinal cord are evolving as an important target for drug development against pain.
Purinergic P2X2Rs are also expressed in spinal cord neurons and are known to cross-talk with
GABAARs. Here we investigated a possible “dynamic” interaction between GABAARs and P2X2Rs
using co-immunoprecipitation and FRET studies in HEK cells along with co-localization and single
particle tracking studies in spinal cord neurons. Our results suggest that a significant proportion of
P2X2Rs forms a transient complex with GABAARs inside the cell, thus stabilizing these receptors and
using them for co-trafficking to the cell surface. P2X2Rs and GABAARs are then co-inserted into the
cell membrane and are primarily located extra-synaptically. Furthermore, agonist induced activation of
P2X2Rs results in disassembly of the receptor complex and destabilization of GABAARs whereas
P2X2Rs are stabilized and form larger clusters. Antagonist-induced blocking of P2XRs results in co-
stabilization of this receptor complex at the cell surface. These results suggest a novel mechanism
where association of P2XRs with other receptors could be used for specific targeting to the neuronal
membrane, thus providing an extrasynaptic receptor reserve that could regulate the excitability of
neurons. We further conclude that blocking the excitatory activity of excessively released ATP under
diseased state by P2XR antagonists could simultaneously enhance synaptic inhibition mediated by
GABAARs.
6
2. ABSTRACT (GERMAN)
GABAA Rezeptoren im Rückenmark werden zu einem immer wichtigeren Angriffspunkt für die
Entwicklung von Arzneimittel gegen den Schmerz. Purinerge P2X2 Rezeptoren finden sich ebenfalls
im Rückenmark und es ist bekannt, dass sie in direkter Wechselwirkung (Cross-talk) mit GABAA
Rezeptoren stehen. Hier untersuchten wir eine mögliche „dynamische“ Interaktion zwischen GABAA
Rezeptoren und P2X2 Rezeptoren mittels Co-Immunopräzipitation und FRET Studien in HEK Zellen
sowie mittels Co-Lokalisationsstudien und „Single Particle Tracking“ Untersuchungen in
Rückenmarksneuronen. Unsere Resultate weisen darauf hin, dass ein signifikanter Anteil von P2X2
Rezeptoren einen intrazellulären, transienten Komplex mit GABAA Rezeptoren bilden, indem sie diese
zur Stabilisation und zum gemeinsamen Transport nutzen. GABAA Rezeptoren und P2X2 Rezeptoren
werden anschließend gemeinsam in die Zellmembran eingebaut, wo sie vor allem extrasynaptisch
lokalisiert sind. Darüber hinaus konnten wir zeigen, dass eine durch Agonisten induzierte Aktivierung
von P2X2 Rezeptoren zu einer Dissoziation des Komplexes und einer Destabilisierung von GABAA
Rezeptoren führt, während P2X2 Rezeptoren stabilisiert werden und größere Cluster bilden. Eine durch
Antagonisten induzierte Blockierung von P2X2 Rezeptoren führt zu einer Stabilisierung der
GABAA/P2X2 Rezeptor-Komplexe an der Zelloberfläche. Diese Resultate zeigen einen neuen
Mechanismus auf, bei dem die Assoziation von P2X2 Rezeptoren mit anderen Rezeptoren für einen
spezifischen, zielgerichteten Transport zur neuronalen Zellmembran genutzt werden kann. Damit steht
ein Reservepool an extrasynaptischen Rezeptoren zur Verfügung, der zur Regulation der neuronalen
Erregbarkeit beitragen kann. Die vorliegenden Ergebnisse lassen auch den Schluss zu, dass P2X
Rezeptor Antagonisten nicht nur die erregenden Aktivität von krankheits-bedingt im Überschuss
freigesetztem ATP blockieren, sondern gleichzeitig auch zu einer verstärkten synaptischen Inhibierung
durch GABAA Rezeptoren beitragen können.

7
3. INTRODUCTION
3.1. GABAA RECEPTORS
GABAA receptors (GABAARs) are the major inhibitory transmitter receptors in the central nervous
system and the site of action of benzodiazepines, barbiturates, neuroactive steroids, anesthetics and
convulsants. They are ligand gated chloride channels composed of five subunits that can belong to
different subunit classes. Each subunit has a large N-terminal extracellular domain and four
transmembrane domains (TMs) and a large intracellular loop between TM3 and TM4. Though many
possible subunit compositions have been demonstrated, the majority of these receptors is composed of
one γ, 2α and 2ß subunits (Fig. 1) (Sieghart, 1995; Olsen and Sieghart, 2008, 2009).
Fig 1. Structure of GABAA receptors (Jacob et al., 2008)
The diverse functions of GABAARs are not only mediated by the heterogeneity of the receptors but
also by complex trafficking mechanism and protein-protein interactions that regulate and maintain
receptor cell surface localization (Fig. 2) (Jacob et al., 2008). Several such proteins, such as gephyrin
(Jacob et al., 2005), radixin (Loebrich et al., 2006), PLIC1 (Bedford et al., 2001), GABARAP (Wang
et al., 1999) and many others, are now known to directly interact with GABAARs and to regulate their
function. Of these proteins gephyrin is known to be primarily involved in regulating clustering of
GABAARs at synapses. Gephyrin was first identified to be directly associated with glycine receptor´s

8
intracellular domain thus stabilizing them at inhibitory synapses in spinal cord (Pfeiffer et al., 1982;
Meyer et al., 1995). Recent studies on GABAARs have
Fig 2. GABAA receptor trafficking and associated proteins (Jacob et al., 2008)

9
demonstrated that gephyrin is also one of the key molecules regulating clustering and synaptic
stabilization of these receptors at synapses (Tretter et al., 2008).
The complex interactome of GABAARs suggests a highly dynamic nature of these receptors. The
number of synaptic receptors are determined by exchange between synaptic and extrasynaptic
receptors by lateral diffusion (Choquet and Triller, 2003; Triller and Choquet, 2005, 2008). The
membrane dynamics of surface receptors is further dependent on interaction with scaffold proteins,
adhesion molecules and other resident proteins. In contrast, the number of surface receptors is
determined by their rate of recycling between surface and intracellular receptor pool as well as by
receptor turnover and trafficking through the early secretory pathway (Fig. 2).
3.2. GABAA RECEPTOR INTERACTION WITH OTHER NEUROTRANSMITTER
RECEPTORS
Recently, evidence has accumulated indicating that GABAARs are also able to complex selectively
with other receptors by direct protein-protein interaction and that this physical association enables
mutually inhibitory functional interaction between these receptor systems. Such interactions have been
demonstrated for GABAARs and dopamine D5 receptors (Liu et al., 2000) as well as for rho1-
GABARs and P2X2 (Boué-Grabot et al., 2004a), GABAARs and P2X2Rs (Sokolova et al., 2001; Boué-
Grabot et al., 2004b), GABAARs and GABABRs (Balasubramanian et al., 2004). Not only GABAARs,
but also several different other neurotransmitter receptors seem to interact with other receptors.
However, the mechanism behind such interactions has been studied only for a few interactions, namely
between dopamine D1 and NMDA (Lee et al., 2002, Pei et al., 2004) and dopamine D2 and AMPA
receptors (Zou et al., 2004), but never investigated for pentameric channels such as GABAARs or
nicotinic receptors. Endocytosis of the receptors, direct coupling of the receptors, and coupling
possibly mediated through a protein complex are some of the proposed mechanisms governing such
interactions.
3.3. P2X2 RECEPTORS
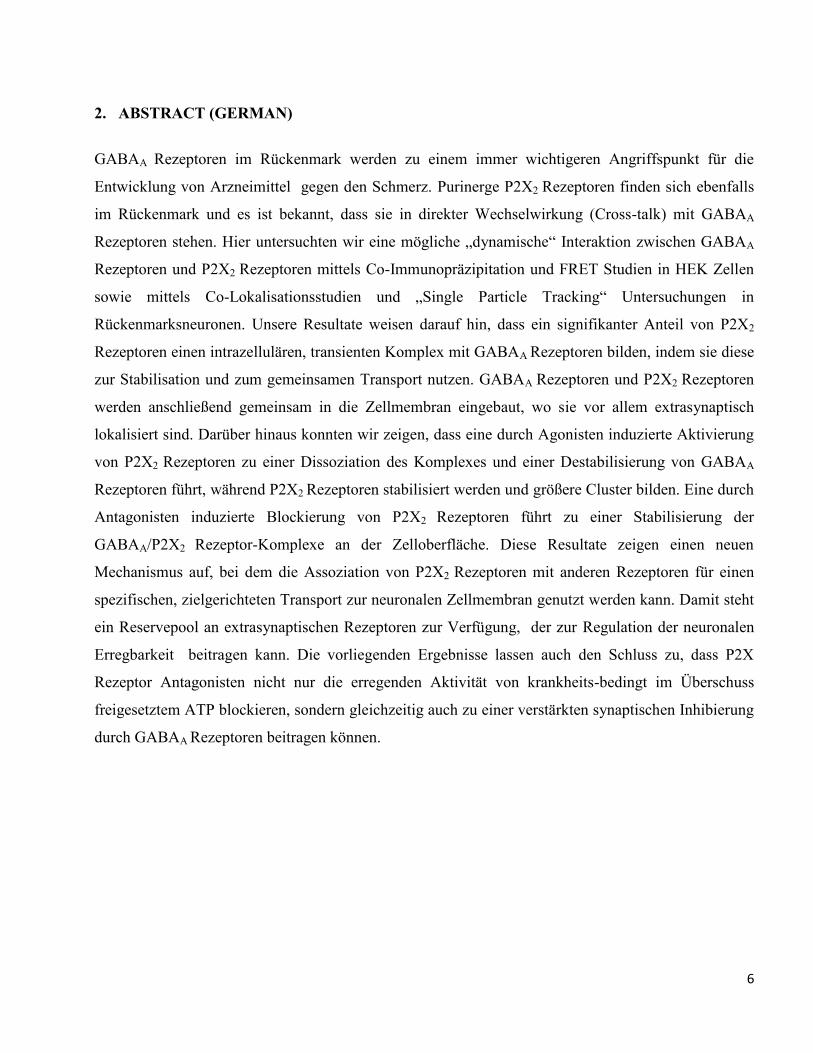
P2X receptors are ATP gated ion channels that are permeable to Ca2+
, Na+, and K
+. The receptors are
trimeric in structure with each subunit having two transmembrane domains, separated by an
extracellular domain (approximately 280 amino acids) (Fig. 3). The P2X receptor super family
comprises seven different subunits (P2X1-P2X7) which are 40-50% identical in their amino acid
10
sequence (Burnstock and Knight, 2004). One of the important and abundant subunits of the P2X
receptor family is P2X2, that mainly forms homo-trimeric P2X2Rs but also assembles with P2X3
subunits to form hetero-trimeric P2X2/3 receptors (P2X2/3Rs) (Gever et al., 2006). Among the various
subtypes, P2X2R and P2X3R are enriched in spinal cord (Collo G et al., 1996; Wirkner et al., 2007),
where they play a role in sensory transmission and modulation of synaptic function.
Fig 3. P2X receptor subunit (Wikipedia)
P2X2Rs have been demonstrated previously to be localized in excitatory synapses of the brain. They
are especially localized at the periphery of postsynaptic densities where AMPA receptor subunits are
present at low density (Rubio and Soto, 2001). It is presumed that the location of P2XRs to the
periphery of postsynaptic densities arises from specific protein interactions: one such protein that co-
localizes and interacts with P2X2Rs in postsynaptic membranes is Fe65 (Masin et al., 2006), better
known as a partner to ß-amyloid precursor protein. Possibly the number of synaptic P2X channels
depends critically on the rates of insertion and removal by regulated trafficking (Khakh and North,
2006).
Even though the reported distribution of P2X2Rs and GABAARs suggests a non-overlapping function
of these two receptor proteins in brain, these two receptors have been demonstrated to be co-localized
and to functionally interact with each other in the spinal cord dorsal root ganglion (Labrakakis et al.,
2003; Sokolova et al., 2001). Simultaneous activation of GABAARs and P2X2Rs resulted in non-
additive current or “cross-talk” of the receptors (Sokolova et al., 2001; Boué-Grabot et al., 2004b;

11
Karanjia et al., 2006). Interestingly, a similar cross-talk has been observed between P2X2Rs and other
members of the cys-loop receptor family (Köles et al., 2008 and references therein).
In this study, we investigated a possible interaction of P2X2Rs with GABAARs. We demonstrate that
these two receptors interact with each other and that the interaction regulates the trafficking and
membrane dynamics of GABAARs.

12
4. MATERIALS AND METHODS
4.1. CULTURE OF HEK CELLS FOR TRANSFECTION
Human Embryonic Kidney cells (also called HEK cells, HEK 293 or 293 cells) are an epithelial cell
line generated by transformation of normal human embryonic kidney cell cultures with adenovirus 5
DNA in the laboratory of Frank Graham in the late 1970s. These cells are easy to work with, and thus
are widely-used in cell biology research.
4.1.1. REQUIREMENTS
A. Culture Media
Reagent Stock
Solution
Working
Solution Volume
DMEM
(Dulbecco´s Modified Eagle Medium) -- -- 500ml
FBS (Fetal Bovine Serum) -- -- 50ml
Penicillin-Streptomycin Solution 1:1 -- 5ml
L-Glutamine, 200mM 100X 1X 5ml
MEM (Non-Essential Amino Acids) 100X 1X 5ml
B. Trypsin-EDTA
C. Phosphate-Buffered Saline (PBS), 1X
Reagent Final Conc.
NaCl 140mM
KCl 2.7mM
KH2PO4 1.5mM
Na2HPO4.2H2O 4.3mM
Adjust pH to 7.3, Autoclave & store at RT
4.1.2. PROTOCOL
A. Start the laminar flow at least 15 minutes before working.
B. Thaw all the culture media components in a 37°C water bath.

13
C. Prepare the culture media as per the recipe and leave it inside the hood.
D. Take a culture dish with highly confluent cells.
E. Remove the medium and rapidly wash once with 10 ml 1X PBS.
F. Add 1ml trypsin and leave it for 3-4 min until cells detach.
G. Mix the cells/trypsin suspension using a sterilized Pasteur pipette.
H. Stop the trypsin reaction by diluting with 10 ml culture media.
I. Mix well but gently using a pipette.
J. Transfer the contents to a falcon.
K. Count the cells and plate as follows:
Biochemistry 2.1 X 10⁶
cells/9cm dish
FRET 0.15 X 10⁶
cells/well in 6 well dish on top of 24mm cover slip
Live Imaging 0.10 X 10⁶
cells/well in 12 well dish on top of 12mm cover slip
L. Transfer the dishes into the incubator at 37°C with 5% CO2.
M. Perform transfection 24 hours after plating.
4.2. TRANSFECTION OF HEK CELLS
HEK cells are transfected using calcium phosphate transfection method (Chen and Okayama, 1988).
The principle involves mixing of DNA in a phosphate buffer with calcium chloride. The resulting
calcium-phosphate-DNA complexes adhere to the cell membrane and enter the cytoplasm by
endocytosis. The critical factor in the transfection using Ca3(PO4)2 co-precipitation is the pH of the
solutions. High transfection efficiencies can be obtained in some cell lines by generating a glycerol
shock. It may be performed 4-16 hours after transfection; but the cells should not be left in glycerol for
more than 2 minutes.
4.2.1. REQUIREMENTS
A. 1X PBS (refer section 3.1.1)
B. 2.5 M CaCl2

14
C. HEBS (HEPES Buffered Saline) Buffer
D. 15% Glycerol in 1XPBS
4.2.2. PROTOCOL (TRANSFECTION FOR BIOCHEMISTRY)
A. Measure the cell density for transfection. 2.0-2.8 X 10⁶ cells per plate are transfected with 20µg
DNA in 40µl volume per dish.
B. Take 500µl HEBS buffer in one 15ml falcon, and in other mix 50µl CaCl2 with 40µl DNA mix
and 410µl H2O. Using Pasteur pipette transfer drop wise DNA-CaCl2-H2O mix to HEBS buffer
while constantly bubbling latter using a pipette man. This ensures efficient mixing. The final
volume is now 1000µl.
C. Vortex for a few seconds.
D. Leave for ~6 min at room temperature.
E. Invert twice, and then transfer 950µl DNA-CaCl2-H2O-HEBS mix evenly over culture dish.
F. Swivel the culture dish gently for uniform mixing, transfer it back to incubator.
G. Perform glycerol-shock four hours after transfection.
Remove culture media from transfected dish.
Add 1ml 15% glycerol solution from side for maximum of 1 min.
Gently add 10ml 1X PBS from side to wash off glycerol.
Remove the glycerol-PBS solution from dish.
Add 10ml pre-warmed culture medium and transfer the dish back to the incubator.
H. Perform the experiments 48 hours post transfection.
Reagent Final Conc.
Na2HPO4 2mM
NaCl 280mM
HEPES 50mM
Adjust pH to 7.08,
Filter and sterilize. Store at -20°C

15
4.2.3. PROTOCOL (TRANSFECTION FOR FRET AND LIVE-CELL IMAGING)
A. Transfection is performed 20-24 hours after plating when cells are 60-80% confluent.
B. Dilute plasmid DNA to 1µg/µl.
C. Take 100µl HEBS buffer in a microfuge tube. In another tube, mix 86µl autoclaved water, 12µl
CaCl2 and 2µg plasmids.
D. Transfer drop wise DNA-CaCl2-H2O mix to HEBS buffer while tapping the bottom of the tube
gently. This ensures efficient mixing of the complex.
E. Leave the mix at room temperature for 6 min.
F. Mix the content again and transfer 180µl/6-well dish or 90µl/12-well dish.
G. After 4 hours of transfection, remove the medium, wash once with 1X PBS and then add 3ml
pre-warmed culture medium.
H. Transfer the culture dish back to the incubator. Experiments can be typically performed 24-48
hours after transfection.
4.3. RAT PRIMARY HIPPOCAMPAL NEURONS: CULTURE AND TRANSFECTION
Primary cultures of hippocampal neurons are prepared from the hippocampus of embryonic day 18
(E18) rats. At this age, the generation of pyramidal neurons, which begins in the rat at about E15, is
essentially complete, but the generation of dentate granule cells, which largely occurs postnatally,
scarcely has begun. The tissue is still easy to dissociate, the meninges are removed readily, and the
number of glial cells still is relatively modest. The protocol is adapted from the Goslin, Assmussen &
Banker chapter on “Rat hippocamal neurons in low-density culture” (Culturing Nerve Cells, 2nd
edition; edited by Garry Banker & Kimberly Goslin).
4.3.1. REQUIREMENTS
A. The list of materials and equipments and suppliers are tabulated below:
MATERIAL CATALOG SUPPLIER
Dumont #5 Forceps, Straight 11cm 11254-020 FST
(Fine Science
Tools)
Dumont #7 Forceps, Curved 11.5cm 11274-020
Westcott Spring Scissors, 11 cm 15015-11
Mayo Scissors, Straight, 15 cm 14010-15

16
Standard Pattern Forceps, 12 cm 11000-12
MEM-EARLES & L-Glut 31095-029
Invitrogen
Horse Serum, Heat Inactivated 26050-088
Sodium Pyruvate MEM, 100 mM 11360-039
Neurobasal medium (1X) 21103-049
B27 Supplement (50X) 17504-044
HBSS w/o Ca2+
& Mg2+
(10X) 14180-046
HEPES Buffer (1M) 15630-056
Trypsin (2.5%), 10X 15090-046
L-Glutamine, 200 mM (100X) 25030-024
Penicillin/Streptomycin 15140-122
Trypan Blue 15250-061
D-(+) Glucose, 45% liquid G8769
Sigma-Aldrich Deoxyribonuclease I (Bovine) DN25
Poly-L-Lysine Hydrobromide P2636
Rat Neuron Nucleofector kit VPG-1003 Amaxa
Cover slips 1943-10012 BELLCO
Double Spatula Type Chattaway 3141 BOCHEM®
LABORBEDARF
6cm Petri-dishes Dishes Nunclon™
Polystyrene with sterile lid 150288 Nunc
Thick glass dishes
(for dry heating cover slips) -- --
Boric Acid 1.00165.1000 Merck
B. Neuronal Plating Medium
Reagent Volume
MEM-EARLES & L-Glut 500 ml
Horse Serum, Heat Inactivated 50 ml
Sodium Pyruvate MEM, 100 mM 5 ml

17
(Pyruvic Acid)
D-(+) Glucose, 45% liquid 6.6 ml
C. Neuronal Maintenance Medium
Reagent Volume
Neurobasal medium (1X) 500 ml
L-Glutamine, 200mM (100X) 5 ml
Penicillin/Streptomycin 5 ml
D-(+) Glucose, 45% liquid 6.6 ml
B27 Supplement (50X) 10 ml
D. Dissection Medium [1X CMF-HBSS (Ca2+
and Mg2+
free-HBSS)]
Reagent Volume
10X HBSS w/o Ca2+
& Mg2+
(10X) 50ml
HEPES Buffer (1M) 5ml
FINAL VOLUME with ddH2O 500ml
E. Borate Buffer (0.1M) (for dissolving poly-L-lysine)
Dissolve 0.62 g of Boric Acid (MW. 61.14) in 90 ml water.
Adjust the pH to 8.0 with 5M NaOH.
Add water to make it 100 ml.
Autoclave before use.
F. Trypsin (2.5%)
Aliquot 5ml in falcon and store at -20°C.
G. Poly-L-Lysine solution (PLL)
Dissolve 100 mg of poly-L-lysine powder in 100 ml borate buffer.
Filter in falcon using 0.20 µm syringe filter.
Aliquot 5 ml in falcons and store at 4°C.

18
4.3.2. PROTOCOL
A. Sterilize the cover slips by heating at 160°C for 4 hours in a thick glass dish.
B. Keep the cover slips inside the laminar air flow (once sterilized, can be stored for few weeks).
C. Transfer sterilized cover slips on to a culture dish (6 cm dish/12-well dish).
D. Prepare working solution (0.5µg/ml) of PLL by diluting the stock (1µg/ml) with autoclaved
water.
E. Coat the cover slips with PLL by covering the top with few drops of the working solution.
F. Leave it at room temperature inside the hood overnight.
G. Following day, wash the cover slips twice with autoclaved water; let them remain in water until
the hippocampus is dissected and trypsinized.
H. Thaw one aliquot of the 2.5% trypsin on ice before beginning the preparation.
I. Dissect out hippocampus:
(The whole process should ideally take ~2.5 hours for best preparation)
Kill the rat as per the guidelines.
Sterilize the abdomen with ethanol.
Cut out the upper skin.
Carefully cut the abdomen with a sterilized scissor.
Take out the embryos on a sterile dish placed over ice.
Carefully take out the small pubs and place them on ice.
Dissect the head and place over ice-cold 1X HBSS buffer.
Carefully remove the upper skin starting from nose, and take out the brain in fresh 1X
HBSS buffer.
Now use the brains to dissect out hippocampus carefully in 1X HBSS buffer.
Transfer the dissected hippocampus to a falcon using a pipette.
J. Centrifuge at 1500 rpm for 2 minutes.
K. Discard supernatant and then add another 4.5 ml fresh cold 1X HBSS & 500µl 2.5 % Trypsin.
L. Incubate the cells in 37°C, CO2 incubator for 15 minutes. This dissociates the cells.
M. Wash 3 times with cold buffer, re-suspend in 1 ml HBSS.
N. Use flame to reduce the diameter of a Pasteur pipette. Use this pipette to homogenize the
trypsinized hippocampus. Avoid air bubbles.

19
O. Reduce the diameter of 2nd
Pasteur pipette such that it just allows the flow of the suspension.
Homogenize few more times.
P. Count the cells using a haemocytometer by diluting 5µl cell suspension with 40µl 1X HBSS and
5µl trypan-blue.
Q. Plating without Transfection:
Drain off the water from the dish having cover slips.
Add 5 ml of pre-warmed Neuronal plating medium per dish.
Plate 250,000 cells per 6 cm dish or 60,000 cells per 12-well dish.
R. Plating after transfection:
Transfection was performed using AMAXA nucleofactor kit.
Mix 2.5 X 10⁶ cells with 3-4 µg plasmids DNA.
Add 100 µl of the transfection buffer.
Run Program 3 (Suitable for rat neurons).
Transfer the transfected cell-suspension onto a 6 cm dish.
4.4. CULTURE AND TRANSFECTION OF MOUSE PRIMARY SPINAL CORD NEURONS
Spinal motor neurons are highly differentiated post-mitotic cells that normally do not enter mitosis in
adults. The culture was performed using embryonic day 15 pubs from mRFP-gephyrin knock-in mice
(Machado and Triller, unpublished). Whole spinal cord is dissected and dissociated out from the pups,
so there is no separation between dorsal and ventral part.
4.4.1. REQUIREMENTS
A. Poly-L-Ornithine solution
B. Coating Medium
Reagent Volume
MEM 50ml
Fetal Calf Serum 2.5ml
Glutamine (200mM) 0.5ml
Sodium Pyruvate (100mM) 0.5ml
20
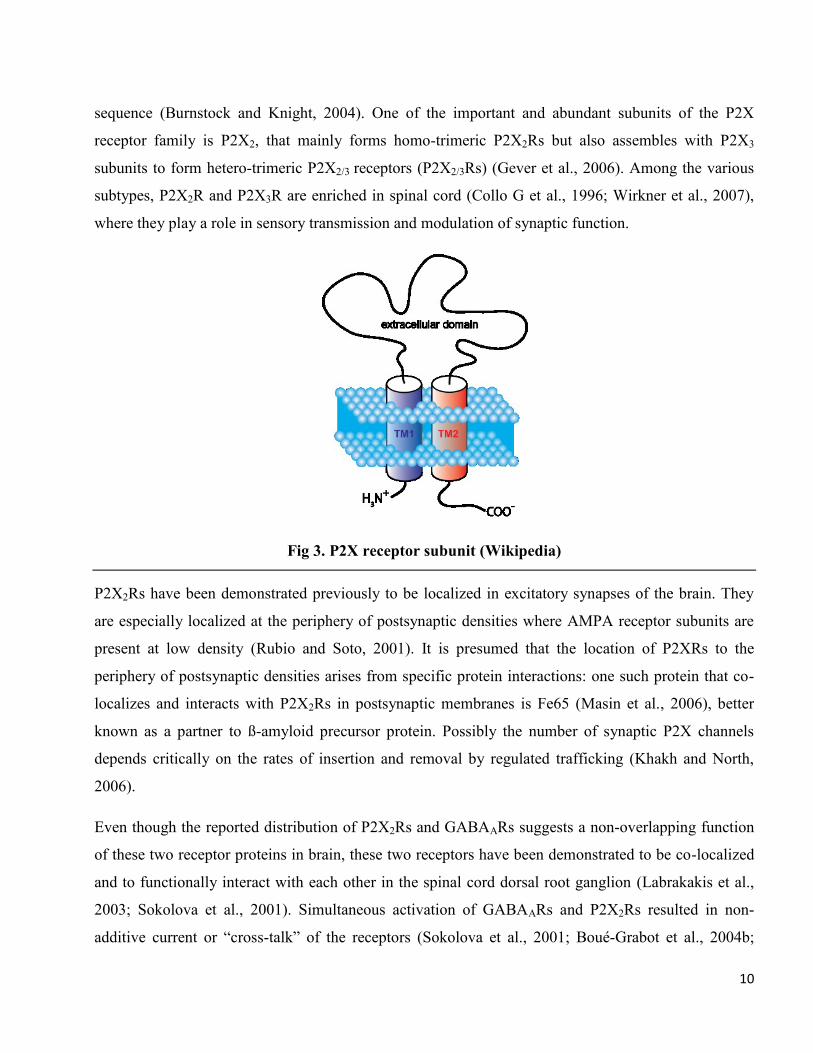
C. HBSS-Glucose Medium
Reagent Volume
Autoclaved water 30ml
Glucose (20X) 1.5ml
HBSS (10X) 3ml
HEPES (1M) 0.6ml
D. Neurobasal Complete Medium
Reagent Volume
Neurobasal 50ml
B27 (50X) 1ml
Glutamine (200mM) 0.5ml
Pen/Strep 25µl
E. 20X PBS-Glucose
Reagent Volume
Glucose 6g
1X PBS 50ml
Filter and store at 4°C
F. 20X H2O-Glucose
Reagent Volume
Glucose 6g
Autoclaved water 50ml
Filter and store at 4°C
G. DNAse
H. 4% BSA

21
4.4.2. PROTOCOL
A. Coat 18mm cover slips with ~200µl poly-L-ornithine (15-80µg/ml) in 12-well dish.
B. Transfer the cover slips to an incubator maintained at 37°C overnight.
C. Next day, aspirate completely the poly-L-ornithine.
D. Let it dry in the hood.
E. Add coating medium in each well and incubate it in a CO2 incubator maintained at 37°C for 2-3
hours before plating.
F. Prepare 80ml 1X PBS-Glucose solution in 1X PBS.
G. Dissect out spinal cord and make several pieces (8-9) of the tissue.
H. Transfer the tissue from a maximum of four spinal cords to a 15ml falcon.
I. Wash tissue thrice using 6ml 1X PBS-Glucose.
J. Discard the solution leaving tissue in 1ml solution.
K. Add 20µl trypsin and incubate at 37°C for 10 min (longer incubation damages the cell).
L. Completely remove the trypsin solution and wash thrice with 6ml HBSS-Glucose medium.
M. Dissociate the tissue using a solution of 900µl HBSS-Glucose medium, 100µl 4%BSA and 50µl
DNAse. Triturate 6 times using 1000µl tip to get single cell suspension.
N. Repeat the step but with 20µl DNAse. Triturate 9 times using 1000µl tip.
O. Transfer the dissociated cells to a 15ml falcon containing 6ml HBSS-Glucose.
P. Centrifuge for 5s at 900 rpm. Transfer the supernatant in another falcon.
Q. Add 4% BSA cushion (between 1.5-2ml) to the bottom of the tube containing dissociated cells
(very gently with a Pasteur pipette; without mixing cell & BSA).
R. Centrifuge at 1000 rpm for 9 mins. Discard supernatant.
S. Re-suspend cell pellet in 1 ml Neurobasal complete medium and 15 µl Dnase.
T. Count the cells.
U. Aspirate off coating medium from the top of cover slips leaving 100-200µl in the well.
V. Plate 160,000 cells/12-well dish.
W. Change medium every 4-5 days.
4.4.3. TRANSFECTION OF SPINAL CORD NEURONS USING LIPOFECTAMINE-2000
REAGENT
A. Pre-heat the heating plate to 37°C inside a laminar flow.

22
B. Pre-warm neurobasal medium in a water bath maintained at 37°C.
C. Dilute plasmid DNA to 1µg/µl.
D. Mix 0.5µg DNA in 50µl neurobasal medium (Invitrogen) in a microfuge tube.
E. In another tube mix 2µl lipofectamine-2000 (Invitrogen) in 50µl neurobasal medium.
F. Incubate both solutions separately for 10 min at room temperature.
G. Gently mix DNA-neurobasal solution to lipofectamine-neurobasal while tapping at the
bottom of the tube.
H. Incubate the mix at room temperature for 15 min.
(During incubation period take out the culture dish out of the incubator and keep it on top
of the heating plate maintained at 37°C. Immediately replace (and collect in a falcon) the
conditioned medium (in which cells are growing) and add 500µl pre-warmed neurobasal
medium in each well. Transfer the cells back to the incubator until next step and keep the
conditioned medium in a water bath (37°C)).
I. After the 15 min incubation is over, take the cells out of incubator again and then add
100µl lipofectamine-DNA mix on to the cells (600µl total volume). Transfer the cells back
to the incubator for another 30 min.
J. After 30 min, remove the medium and wash cells twice with 1ml pre-warmed neurobasal
medium.
K. Add 2 ml conditioned medium (from step H) on the cells and transfer the cells to the
incubator.
L. Experiments can be performed 24-48 hours after transfection.
4.5. CO-IMMUNOPRECIPITATION OF RECEPTORS FROM HEK293 CELLS
Immunoprecipitation is a technique for extracting an antigen (protein of interest) from a protein
solution. A specific antibody is added to the protein mixture containing the antigen allowing the
antibody to bind to the antigen. Following this, the antibody-antigen complex is pulled down using
Protein A or Protein G. Protein A is a 40-60 kD surface protein originally found in the cell wall of the
bacteria Staphylococcus aureus. It has found use in biochemical research because of its ability to bind
immunoglobulins. It binds proteins from many mammalian species, most notably IgG’s. It binds with
the Fc region of immunoglobulins through interaction with the heavy chain.

23
N.B. Our lab uses PANSORBIN® Cells to pull down the antibody-antigen complex. These cells are
heat-killed, formalin-fixed Staphylococcus aureus cells that have a coat of protein A.
4.5.1. REQUIREMENTS
A. Extraction Buffer
Reagent Conc. Volume
Polyoxyethylene-10 lauryl ether 1 % 100µl
Phosphatidylcholine 0.18 % 18mg
NaCl, 3M 150 mM 500µl
EDTA, 0.5M 5 mM 100µl
Tris-HCl, 1M (pH 7.4) 50 mM 500µl
Autoclaved water -- 8.8ml
Dissolve for few hours at 4°C. Add protease inhibitor before use.
B. IP-Low Buffer
Reagent Concentration
Tris 50mM
Triton X-100 0.2%
NaCl 150mM
EDTA 1mM
Dissolve at RT, then cool at 4°C
When cold (4°C), adjust the pH to 8.0 with HCl
C. Immunoprecipitin
Centrifuge 1ml formalin fixed Staphylococcus aureus cells (Immunoprecipitin; Life
Technologies Inc.) at 9000g at 4 °C.
Re-suspend the pellet in 900µl of buffer (3% SDS & 10% ß-mercaptoethanol in PBS).
Heat the suspension at 95°C for 30 min.
Centrifuge at 8000g. Wash the pellet thrice with IP Low Buffer.

24
Re-suspend the pellet finally in 900 µl IP low buffer containing 100 mg/l bacitracine, 1
mM Benzamidine, & 0.3 mM PMSF.
D. 5 % Non-Fat Dry Milk Powder (in IP Low Buffer)
E. NuPAGE Sample Buffer
Reagent Final Conc.
LDS Sample Buffer (4X) 1X
Reducing Agent (10X) 1X
Dissolve in autoclaved water
4.5.2. PROTOCOL
A. Harvest the cells using a cell scrapper and transfer to a 15ml tube. The cells can be stored at -
80°C for later use. It is recommended to use 4 dishes per sample to compensate for
heterogeneity in transfection efficiency.
B. Thaw the harvested cells stored at -80 °C at room temperature for 5 min or take the freshly
harvested cells.
C. Add 1ml extraction buffer to the cell pellet and leave it shaking vigorously overnight at 4°C.
D. Transfer the suspension into ultra-centrifuge tubes and spin at 45.000 rpm, 4°C for 20 min.
E. Transfer the supernatant in 2ml tubes.
F. Incubate the samples with appropriate antibody for 4 hrs shaking at 4°C.
G. Add 20µl immunoprecipitin and 40µl 5% milk powder in IP-Low buffer.
H. Incubate for 2 hrs shaking at 4°C.
I. Centrifuge at 7000 rpm, 4°C for 5 min; discard the supernatant and re-suspend the pellet in 1 ml
IP-low buffer. Repeat the washing step thrice.
J. Dry the pellet and then re-suspend in 20-40 µl NuPAGE sample buffer.
K. Denature the proteins by heating for 15 min at 65°C.
L. Spin down the pellet for 1 min at 13.000 rpm using a bench centrifuge.
M. Collect the supernatant in a fresh microfuge tube. Sample can be used immediately for western
blotting or can be stored at -20°C for later use.

25
4.6. CO-PRECIPITATION OF CELL SURFACE RECEPTORS
The underlying principle of cell surface precipitation is similar to immunoprecipitation apart from the
fact that only cell surface receptors are precipitated in this case. The cell surface proteins are first
labeled with saturating concentration of antibodies followed by removing the free antibodies by
washing, extraction of proteins, and precipitation of antibody-bound receptors by protein A. The initial
antibody binding step ensures that only surface proteins are pulled down.
4.6.1. REQUIREMENTS
A. 1X PBS (refer section 4.1.1.)
B. 5mM EDTA in PBS solution
C. DMEM Culture medium (refer section 4.1.1.)
D. IP-Low buffer (refer section 4.5.1.)
E. 1% Triton-X100 in IP-Low buffer
F. Immunoprecipitin (refer section 4.5.1.)
G. 5% Non-fat dry milk powder in IP-Low buffer (refer section 4.5.1.)
H. Sample buffer (refer section 4.5.1.)
4.6.2. PROTOCOL
A. Remove the medium from 4 culture dishes.
B. Wash once with 2ml 1X PBS.
C. Add 2.5ml 5mM EDTA/PBS solution to detach the cells from the dish. Leave the cells in
EDTA for maximum 5 min.
D. Immediately add 5ml pre-chilled DMEM and make a cell suspension by gently pipetting
without damaging the cells.
E. Transfer the cell suspension to a falcon. Centrifuge for 5 min at 1500 rpm, 4°C.
F. Discard the supernatant, and re-suspend the pellet in 3ml chilled DMEM.
G. Transfer the cell suspension on to a 6 cm dish.

26
H. Incubate with saturating concentration of appropriate antibodies for 45 min at 4°C.
I. Gently shake the dish every 15 min to ensure efficient binding of the antibodies.
J. Collect the suspension into a 15 ml falcon tube.
K. Centrifuge at 1500 rpm, 5 min, and 4°C.
L. Discard the supernatant and wash thrice with 6ml 1X PBS.
M. Extract the proteins using 1ml Triton-X-100 solution for 1 hour shaking vigorously at 4°C.
N. Transfer the contents to an ultracentrifuge tube and spin at 45,000 rpm, 4°C for 20 min;
collect the supernatant.
O. Add 20µl immunoprecipitin and 40µl 5% milk powder blocking buffer.
P. Incubate for 2 hrs at 4°C shaking gently.
Q. Centrifuge for 5 min at 7000 rpm at 4°C. Discard the supernatant and re-suspend the pellet
in 1 ml IP-low buffer. Repeat washing with IP-low thrice.
R. Dry the pellet as good as possible and re-suspend in 20-40 µl NuPAGE sample buffer.
S. Denature by heating at 65°C for 15 min.
T. Spin at 13,000 rpm for 1 minute and collect the supernatant. Sample can be used
immediately for western blotting or can be stored at -20°C for later use.
4.7. PROTEIN ELECTROPHORESIS AND WESTERN BLOTTING
The basic principle of SDS-PAGE (Sodium Dodecyl Sulphate-Polyacrylamide Gel Electrophoresis) is
the separation of proteins according to their molecular masses by electrophoretic migration through a
polyacrylamide gel.
Polyacrylamide gels are formed through the polymerization of acrylamide monomers into long
polymers that are cross-linked together by bis-acrylamide. This gives rise to a gel matrix, the porosity
of which is directly related to acrylamide concentration. Therefore, as acrylamide concentration
increases the pore size decreases. Polyacrylamide gels are used as medium through which proteins are
allowed to migrate according to charge. Proteins are denatured and dissociated by boiling in SDS and a
reducing agent. The SDS gives the protein a uniform negative charge and binds in proportion to the
size of the protein. Treated proteins are loaded into wells and current is applied. This results in
migration of proteins towards anode. The relative mobility of each protein is determined by the

27
porosity of the gel that acts as molecular sieve, and therefore low molecular mass proteins migrate
more quickly than high molecular mass proteins.
After the protein components have been sufficiently separated by electrophoresis, they are transferred
to a PVDF (polyvinylidene difluoride) or nitrocellulose membrane.
4.7.1. REQUIREMENTS
A. 4X Separating Gel Buffer
Dissolve 156.9g bis-tris in 500ml Milli-Q water.
Adjust the pH to 8.4 with HCl.
B. 4X Stacking Gel Buffer
Dissolve 26.2g bis-tris in 250ml Milli-Q water.
Adjust the pH to 6.4 with HCl.
C. 30% Acrylamide/Bis
D. 10% SDS
E. 10% APS (Ammonium Persulfate)
Dissolve 100mg APS per ml Milli-Q water.
Store as aliquots at -20°C.
F. TEMED (Tetramethylethylenediamine)
G. Gel Cassettes (Invitrogen)
H. 0.1% SDS
I. 20X MOPS Buffer
Reagent Conc. Volume
MOPS 1M 418.5g
Tris 1M 242.3g
EDTA 20mM 14.9g

28
SDS 2% 40g
Milli-Q water -- Up to 2l
Solution should reach a pH of 7.7 automatically
J. 10X Transfer Buffer
Reagent Conc. Volume
Tris 479mM 116g
Glycin 386mM 242.3g
SDS 0.5% 10g
Milli-Q water -- Up to 2l
K. 1X Transfer Buffer
Solution Volume
10X Transfer Buffer 200ml
Methanol 200ml
Milli-Q water 1600ml
L. 10X PBS
Reagent Conc. Volume
NaCl 1369mM 160g
KCl 26.8mM 4g
KH2PO4 18mM 4.9g
Na2HPO4.2H2O 100mM 35.6g
Milli-Q water -- Up to 2l
Solution should reach a pH of 7.4 automatically. Autoclave
M. Anti-oxidant (Invitrogen)
N. Blocking Buffer:
Dissolve 15g not fat dry milk powder in 1L 1X PBS.
Add 1ml tween-20 to the solution.

29
O. Assay Buffer
Dissolve 250µl 1M MgCl2 and 2.4 ml diethanolamine in around 200ml Milli-Q water.
Adjust the pH to 10. Adjust volume to 10ml.
4.7.2. PROTOCOL: CASTING OF SEPARATING GELS
A. Mix all the ingredients, except 10% APS as per the table below.
10% Separating Gel
20 ml 40 ml 50 ml 80 ml
4x Separating-Buffer 5 ml 10 ml 12.5 ml 20 ml
30% Acrylamide/Bis 6.6 ml 13.2 ml 16.5 ml 26.4 ml
10% SDS 200 µl 400 µl 500 µl 800 µl
Milli-Q H2O 8.0 ml 16.0 ml 20.0 ml 32.0 ml
TEMED 20 µl 40µl 50 µl 80 µl
10% APS 200 µl 400 µl 500 µl 800 µl
B. Prepare empty gel casting.
C. Add 10% APS to the solution, mix well, and cast the gel.
D. Cover the gel by spraying 0.1% SDS. This ensures formation of smooth surface.
E. Polymerize for nearly 4 hours.
F. Fill with 0.1% SDS, and store at 4˚C in a vacuum bag.
G. Gels can be stored air-tight for up to 3 weeks. If the gel top gets dried, it should be discarded.
4.7.3. PROTOCOL: CASTING OF STACKING GELS
A. This is the top gel layer and is casted on top of separating layer (1/4 gel volume, ~2 ml
solution).
B. Discard the SDS over pre-cast separating gel.
C. Wash the cassette thrice with 1X Stacking buffer.
D. Drain out remaining liquid using vacuum pump.
E. Mix all the ingredients, as in table. Add APS to the mixture just before casting.

30
5% Stacking Gel
5 ml 10 ml 15 ml 20 ml
4x Stacking-Buffer 1,25 ml 2,5 ml 3,75 ml 5 ml
30% Acrylamide/Bis 850 µl 1,7 ml 2,55 ml 3,4 ml
10% SDS 50 µl 100 µl 150 µl 200 µl
Milli-Q H2O 2,8 ml 5,6 ml 8,4 ml 11,2 ml
TEMED 5 µl 10 µl 15 µl 20 µl
10% APS 75 µl 150 µl 225 µl 300
F. Cast the stacking gel on top of separating gel.
G. Insert the comb immediately. Prevent bubbles below the comb.
H. After 20-30 min, gently remove the comb from the stacking gel.
I. The gel is ready for loading.
4.7.4. PROTOCOL: PERFORMING ELECTROPHORESIS
A. Remove the white strip at the back bottom of the gel cassette.
B. Place the cassettes in the electrophoresis unit, and set the unit.
C. Prepare 1X MOPS running buffer (600 ml per chamber).
D. To 200ml 1X MOPS, add 500µl anti-oxidant. It prevents re-oxidation of proteins and maintains
them in a reduced state.
E. Fill the inner chamber with anti-oxidant containing 1X MOPS buffer.
F. Check for any possible leakage.
G. Pour remaining buffer in the outer chamber.
H. Load the samples and then run the gel at fixed voltage (200V) and current being 130mA/gel for
40-45 min.
I. When the run is over, turn off the current, break open the cassette and keep the gel in transfer
buffer for 15 min. Proceed with blotting.
4.7.5. WESTERN BLOTTING
A. Equilibrate the PVDF membrane in methanol for 15 sec followed by washing for 2 min in
milli-Q water and finally in transfer buffer for 10 min.

31
B. Wet filter paper to be used for transfer.
C. Setup the blot:
a. Wet the surface of blotter with transfer buffer.
b. Put one filter paper over it gently.
c. Remove any air bubbles by rolling a glass pipette on top of it.
d. Add few drops of transfer buffer (this should be done in every step to prevent drying).
e. Then gently transfer the membrane on top of the filter paper preventing any air bubble.
f. Add a few drops of buffer on top to prevent drying of membrane.
g. Now place the gel over the membrane and then finally cover it with another filter paper.
h. Remove air bubbles by gently rolling a glass pipette over it.
D. Run the blot for a maximum of 20 V, 58 mA/gel for 1 hour.
[(Blot Area) X 1.2 mA; optimum for most of our proteins]
[(Blot Area) X 1.5 mA; optimum for high molecular weight protein]
E. After transfer, place the membrane in blocking buffer shaking gently for 1 hr.
F. Incubate the membrane overnight with primary antibody in blocking buffer.
G. Next morning, wash the membrane three times 15 min with blocking buffer.
H. Incubate with secondary antibody conjugated to alkaline-phosphatase (AP) for 1 hour.
I. Wash three times 15 min with blocking buffer.
J. Wash three times 5 min with assay buffer.
K. Prepare substrate for detection of alkaline phosphatase by mixing 10 µl CDP-Star reagents in
1ml assay buffer (per membrane). CDP-Star Reagent is a 1,2-dioxetane compound utilized in
Phototope® alkaline phosphatase-based chemiluminescent detection assays. Light production
resulting from chemical decomposition exhibits an initial delay followed by a persistent glow
that lasts as long as free substrate is available.
L. Add assay buffer over membranes and develop the image.
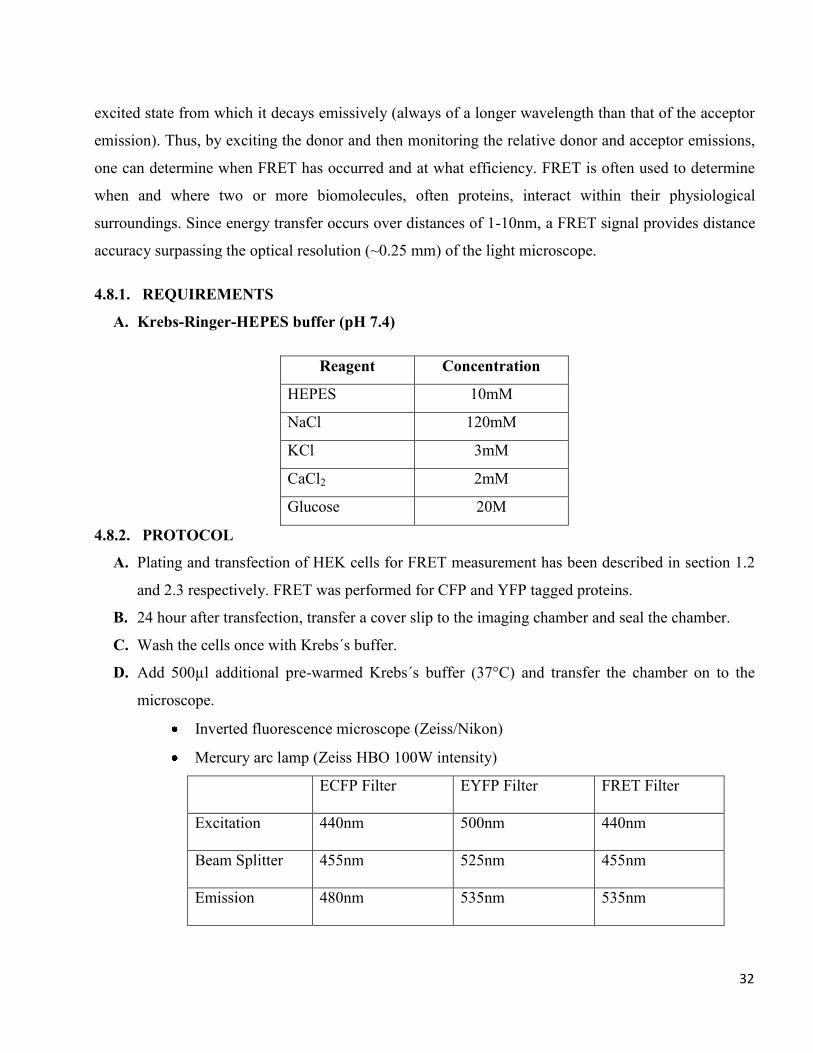
4.8. FLUORESCENCE RESONANCE ENERGY TRANSFER (FRET)
FRET also called as Förster Resonance Energy Transfer, is an microscopy technique used to measure
the proximity of two fluorophores. Resonance energy transfer occurs only over very short distances,
typically within 10nm, and involves the direct transfer of excited state energy from the donor
fluorophore to an acceptor fluorophore. Upon transfer of energy, the acceptor molecule enters an
32
excited state from which it decays emissively (always of a longer wavelength than that of the acceptor
emission). Thus, by exciting the donor and then monitoring the relative donor and acceptor emissions,
one can determine when FRET has occurred and at what efficiency. FRET is often used to determine
when and where two or more biomolecules, often proteins, interact within their physiological
surroundings. Since energy transfer occurs over distances of 1-10nm, a FRET signal provides distance
accuracy surpassing the optical resolution (~0.25 mm) of the light microscope.
4.8.1. REQUIREMENTS
A. Krebs-Ringer-HEPES buffer (pH 7.4)
Reagent Concentration
HEPES 10mM
NaCl 120mM
KCl 3mM
CaCl2 2mM
Glucose 20M
4.8.2. PROTOCOL
A. Plating and transfection of HEK cells for FRET measurement has been described in section 1.2
and 2.3 respectively. FRET was performed for CFP and YFP tagged proteins.
B. 24 hour after transfection, transfer a cover slip to the imaging chamber and seal the chamber.
C. Wash the cells once with Krebs´s buffer.
D. Add 500µl additional pre-warmed Krebs´s buffer (37°C) and transfer the chamber on to the
microscope.
Inverted fluorescence microscope (Zeiss/Nikon)
Mercury arc lamp (Zeiss HBO 100W intensity)
ECFP Filter EYFP Filter FRET Filter
Excitation 440nm 500nm 440nm
Beam Splitter 455nm 525nm 455nm
Emission 480nm 535nm 535nm

33
E. Manually select the cells and then capture the images using Metamorph software.
4.8.3. QUANTIFICATION
FRET with the three-filter set system was quantified according to the method introduced by Xia
and Liu (2001) to normalize the FRET intensity to ECFP and EYFP concentrations in each region
of interest (ROI). ImageJ plugin PixFRET was used to generate FRET images after bleedthrough
correction according to the following formula:
NFRET = [IFRET – (a)ICFP-(b)IYFP]
(ICFP X IYFP)1/2
NFRET: is normalized FRET intensity value
a: Percentage of CFP contribution to FRET intensity
b: Percentage of YFP contribution to FRET intensity.
IFRET: Intensity of FRET channel
ICFP: Intensity of CFP channel
IYFP: Intensity of YFP channel
4.9. IMMUNOCYTOCHEMISTRY
Immunocytochemistry is a technique used to detecting the presence of proteins in cell by the use of a
specific antibody. The bound antibodies are then detected using fluorescently labeled secondary
antibodies. Cells are stained after fixation to a solid support to allow easy handling in subsequent
procedures. This is primarily achieved by using paraformaldehyde (PFA). PFA treatment leads to the
establishment of chemical cross-links between free amino groups. When the cross-links join different
molecules, a latticework of interactions occurs that holds the overall architecture of the cell together.
For intracellular staining, permeabilization is done which permits the immunoglobulin to bind to
intracellularly localized epitopes.
4.9.1. REQUIREMENTS
A. 1X PBS (Refer section 4.1.1.)

34
B. 16% (w/v) Paraformaldehyde (PFA)
Dilute to 4% with 1X PBS before use.
C. 1% (v/v) Triton-X-100 in 1X PBS
D. Blocking Solution
Dissolve 2.5g bovine serum albumin (BSA) in cold 1X PBS to make 5% BSA blocking
buffer.
Store at 4°C.
E. 0.1% Triton Blocking Solution
Dissolve 1 ml 1% triton-100 in 9 ml blocking buffer.
F. Mowiol mounting medium
Mowiol is a high quality anti-fade medium. It hardens and has the same refractive index as
immersion oil. The preparation of mowiol mounting medium is described below:
Requirements:
Mowiol 4-88
Glycerol
Tris-Cl (0.2 M, pH 8.5)
1,4-Diazabicyclo-[2,2,2]-octane (DABCO)
Day 1:
1. Add 2.4 g of Mowiol 4-88 to 6 g of glycerol in a clean sterilized glass beaker.
2. Stir to mix for 10 minutes.
3. Add 6 ml of H2O and leave for several hours at room temperature (overnight).
Day 2:
4. Add 12 ml of 0.2 M Tris-Cl (pH 8.5).
(DABCO works best at this pH of Tris)
5. Heat to 50°C for 10 minutes with occasional mixing.
6. After the Mowiol dissolves, clarify by centrifugation at 5000g for 15 minutes.

35
7. For fluorescence detection, add 1, 4-diazabicyclo-[2,2,2]-octane (DABCO) to 2.5%
to
reduce fading at 37°C.
8. Aliquot in airtight containers and store at -20°C. Stock is stable at room temperature
for several weeks after thawing.
4.9.2. PROTOCOL
A. Transfer the cover slips from culture medium on to a parafilm base. All steps are performed at
room temperature.
B. Wash rapidly by adding 1X PBS rapidly.
C. Fix the cells in 4% PFA for 10 min.
D. Wash three times 5 min each with 1X PBS.
E. Permeabilize the cells with 0.1% triton-X-100 blocking solution for 3 min. Skip this step if not
required.
F. Block the cells in 5% BSA blocking solution for 30 min.
G. Prepare primary antibodies in 5% BSA blocking solution. 100µl/cover slip is sufficient.
H. Add antibodies on cells and incubate for 2 hours.
I. Wash three times 5 min with 1X PBS. Prepare secondary antibody in 5% BSA in the meantime.
J. Add secondary antibodies and incubate for 45 min.
K. Wash three times 10 min each using 1X PBS. Thaw an aliquot of mowiol mounting medium
meanwhile.
L. Put 5-7µl/cover slip on an ethanol wiped glass slide. Take a cover slip, dip it once in Milli-Q
water to remove salts from PBS, dry the edges using a soft tissue and then mount the cover slip
on the slides with cells facing the slide.
M. Leave the slides at 4°C in dark for overnight.
4.10. CONFOCAL MICROSCOPY AND IMAGE ANALYSIS
4.10.1. LIVE CELL CONFOCAL IMAGING
Confocal microscopy allows controllable depth of field image acquisition, elimination of out-of-focus
information, and collection of serial optical sections. These are achieved by the use of spatial filtering
to eliminate out-of-focus light in specimens that are thicker than the plane of focus.

36
A. Live Cells
Prepare HEK cells (Refer section 4.1.2.)
Transfect the cells (Refer section 4.2.3.)
24 hours after transfection, perform imaging. In our case cells expressing ECFP and
EYFP tagged receptors were imaged
B. Microscope
Zeiss Axiovert 200-LSM 510 confocal microscope
Laser: Argon laser, 30mW; Helium/Neon laser, 1mW
Objective: Zeiss Plan-Neofluar ×63/1.3
ECFP excitation: 458nm
EYFP excitation: 488nm
C. Software
Zeiss LSM Image Browser
4.10.2. SPINNING DISK CONFOCAL MICROSCOPY
A spinning disk confocal scanner uses a pair of rotating disks with thousands of pinholes in a spiral
Archimedes. As light is projected on to the disk the holes trace concentric arcs of excitation light
across the sample. Fluorescent light from the specimen returns along the same path through the
objective lens and the pinhole, and reflected by the dichroic mirror through a relay lens to the detector.
As the whole field of view is scanned in this way during a single camera exposure a high quality
confocal image is formed very quickly, allowing the capture of quality confocal images at incredibly
high speed. The spinning disk confocal microscope collects multiple points simultaneously rather than
scanning a single point at a time, which means that the technology is both faster and hits the sample
with a lower dose of laser light. A high sensitivity CCD camera leads to the possibility of incredibly
fast frame rates.
A. Microscope
Leica DM5000B Spinning Disk Microscope
Lasers: Cobolt calypso, 50mW; Cobolt jive, 50mW; Coherent cube, 25mW

37
B. Image Acquisition and Analysis
Images were captured, processed and analyzed using Metamorph software (Meta Imaging,
Downington, PA). For quantitative analysis, fluorescent images were processed with
multidimensional image analysis (MIA) interface which employs 2D object segmentation by
wavelet transformation (Racine et al., 2007). Objects composed of ≥ 3 pixels are defined as
clusters. Receptor clusters were considered synaptic when at least 1 pixel overlaps with mRFP-
gephyrin clusters.
4.11. LIVE CELL STAINING AND QUANTUM DOT IMAGING
Quantum dot (QD) nanocrystals are fluorophores that exhibit some important differences as compared
to traditional fluorophores such as organic fluorescent dyes and naturally fluorescent proteins. QDs are
nanometer-scale (10-20 nm, roughly protein-sized) atom clusters, containing from a few hundred to a
few thousand atoms of a semiconductor material (cadmium mixed with selenium or tellurium), which
has been coated with an additional semiconductor shell (zinc sulfide) to improve the optical properties
of the material. These are extremely efficient machines for generating fluorescence; their intrinsic
brightness and photostability is often many times that observed for other classes of fluorophores.
4.11.1. REQUIREMENTS
A. Borate Buffer Stock
Dissolve 0.5g Na2B4O7.10H2O in 100 ml sterile (culture) water.
Add 1.221g H2BO3 and dissolve for 20 min.
Adjust pH to 8 with 5M NaOH.
Add up water to a final volume of 125 ml.
Check pH again, adjust it to 8 with HCl.
The solution can be stored for up to a year.
B. Sucrose (1.43M):
Dissolve 4.9 g sucrose in 10 ml sterile water. Store at 4°C.
C. QDot Binding Buffer

38
Dissolve 400mg BSA (SIGMA A2153) in 5 ml borate buffer stock solution for 10 min
at 37°C.
Add 50 µl 20% NaN3 (Sodium Azide).
Add 15 ml sterile water.
Filter using 0.22 µm filter and store at 4°C for up to 6 months.
D. Imaging Medium (MEMair)
Reagent Conc. Volume
1M HEPES, pH 7.4 20mM 1 ml
200mM glutamine 2mM 500 µl
Sodium Pyruvate 1mM 500 µl
B27 1X 1 ml
20X Glucose-MEM
(6gm in 100 ml)
33mM 2.5 ml
MEM + Eagle -- 44.5 ml
FINAL VOLUME 50 ml
E. Quantum Dots
Qdot®655.
4.11.2. PROTOCOL
A. Turn on the 37° heating plate and place a parafilm over it.
B. Prepare the primary antibody in 100µl MEMair.
C. Transfer a cover slip on to the parafilm.
D. Wash once with MEMair (~250µl).
E. Incubate the cover slip with primary antibody for 3-5 min. The incubation time needs to be
optimized for the antibodies.
F. Prepare biotinylated secondary antibody in 100µl meanwhile. Use 1:2000 concentrations for
most of antibodies from Jackson Immunoresearch.
G. Wash primary antibody four times with MEMair.
H. Incubate with secondary antibody for 5 minutes.

39
I. Prepare quantum dot for labeling as:
Dilute stock quantum dot solution 1:10 in quantum dot binding buffer to prepare
working solution (1µl QD + 9µl QBB).
In another tube, mix 85µl QBB with 15µl 1.43M Sucrose and 2µl QD working
solution.
J. Wash another four times with MEMair.
K. Incubate with quantum dots for 1 min.
L. Wash for at least 10-12 times to ensure all unbound quantum dots are washed away.
M. Optional (In case of non-gephyrin-knock-in mice):
For synapse labeling, incubate the cells with 2µM FM4-64 in MEMair + KCl for 25 sec.
(FM4-64 does not cross the cell membrane. Upon depolarization using KCl, the dye enters
the vesicles that have fused transiently with the membrane. Vesicles that are loaded with
this dye will then release the dye when they next fuse with the membrane; i.e. when the
membrane is next depolarized.)
Wash four times with MEMair.
N. Carefully place the coverslip in recording chamber and add 500µl MEMair with/without
drugs.
O. Perform the recording. The movement of QDs on the dendrites was recorded with an
integration time of 75ms with 500 consecutive frames (37.5 s). The recording was done up to
20 min following drug addition.
4.11.3. Microscope
Olympus inverted microscope, IX71.
Objective: Olympus, 60×, NA 1.45
Xenon lamp
Cooled CCD camera Cascade+128 (Roper Scientific)
Heating chamber maintained at 37°C.
Filter sets:
QD: D455/70x and HQ655/20
GFP: HQ500/20 and HQ535/30
mRFP: D535/50 and E590lpv2

40
4.12. SINGLE-PARTICLE TRACKING AND ANALYSIS
Tracking and analysis of QDs has been well described recently (Renner et al. 2009; Bannai et al.
2009). Briefly, QDs were detected by cross-correlating the image with a Gaussian model of the point
spread function, and the diffusion parameters were calculated using custom software (Bonneau et al.
2005, Charrier et al., 2006, Ehrensperger et al., 2007) using Matlab (The Mathworks Inc., Natick,
MA). Single QDs were identified by intermittent fluorescence (i.e. blinking). The spots in a given
frame were connected with the maximum likely trajectories estimated on previous frames of the image
sequence. Only trajectories with at least 15 consecutive frames were used for further analysis. Synaptic
area was defined by processing mRFP-gephyrin images with the MIA interface. GABAA receptor QDs
were classified as “synaptic” when the trajectories overlapped with synaptic area. The trajectories were
considered “extrasynaptic” when they are ≥ 2 pixels away from the synapse. P2X2 receptor QDs were
rarely observed at/near mRFP-gephyrin clusters, so the analysis was performed independent of
inhibitory-synapse localization. The mean square displacement (MSD) was calculated using MSD(ndt)
= (N – n)–1
i = 1
N – n
((xi + n – xi)2 + ((yi + n – yi)
2),
where xi and yi are the coordinates of an object on
frame i, N is the total number of steps in the trajectory, dt is the
time interval between two successive
frames, and ndt is the time interval over which displacement is averaged. The diffusion
coefficient D
was calculated by fitting the first two to five points of the MSD plot versus time with the equation
MSD(t) = 4D2–5t + 4 x
2, where x is the spot localization accuracy
in one direction (Ehrensperger et
al., 2007). Given the resolution, trajectories with D < 10
4 µm
2/s
for QDs were
classified as immobile.
The size of the average confinement area was calculated fitting the average MSD plot
with the equation
proposed by Kusumi et al., 1993. Dwell time was calculated as in the study by Charrier et al., 2006.
41
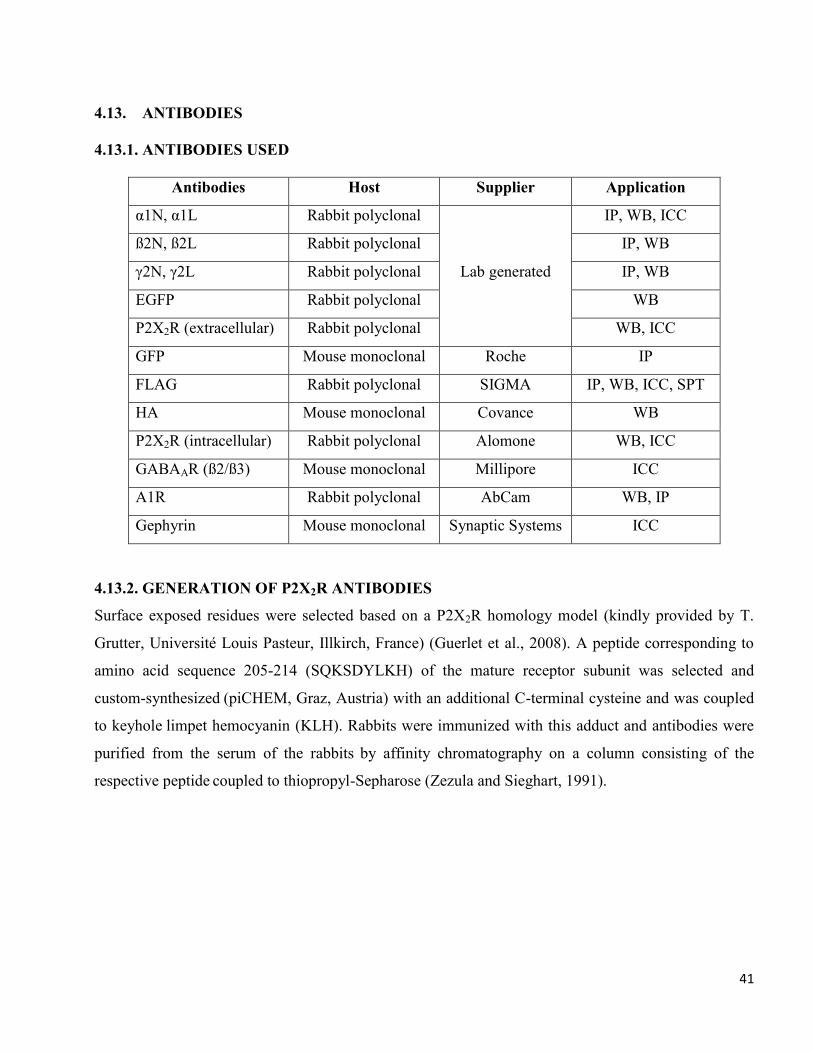
4.13. ANTIBODIES
4.13.1. ANTIBODIES USED
Antibodies Host Supplier Application
α1N, α1L Rabbit polyclonal
Lab generated
IP, WB, ICC
ß2N, ß2L Rabbit polyclonal IP, WB
γ2N, γ2L Rabbit polyclonal IP, WB
EGFP Rabbit polyclonal WB
P2X2R (extracellular) Rabbit polyclonal WB, ICC
GFP Mouse monoclonal Roche IP
FLAG Rabbit polyclonal SIGMA IP, WB, ICC, SPT
HA Mouse monoclonal Covance WB
P2X2R (intracellular) Rabbit polyclonal Alomone WB, ICC
GABAAR (ß2/ß3) Mouse monoclonal Millipore ICC
A1R Rabbit polyclonal AbCam WB, IP
Gephyrin Mouse monoclonal Synaptic Systems ICC
4.13.2. GENERATION OF P2X2R ANTIBODIES
Surface exposed residues were selected based on a P2X2R homology model (kindly provided by T.
Grutter, Université Louis Pasteur, Illkirch, France) (Guerlet et al., 2008). A peptide corresponding to
amino acid sequence 205-214 (SQKSDYLKH) of the mature receptor subunit was selected and
custom-synthesized (piCHEM, Graz, Austria) with an additional C-terminal cysteine and was coupled
to keyhole limpet hemocyanin (KLH). Rabbits were immunized with this adduct and antibodies were
purified from the serum of the rabbits by affinity chromatography on a column consisting of the
respective peptide coupled to thiopropyl-Sepharose (Zezula and Sieghart, 1991).

42
4.14. LIST OF PLASMIDS
Plasmid Comment
α1-pCI Lab
Generated in Lab
ß2-pCI Lab
γ2-pCI Lab
α1-(A160C)-pCI Point mutation in α1-subunit
α1-pEYFP-C1 EYFP in intracellular loop
α1- pECFP-C1 ECFP in intracellular loop
ß2-pEYFP-C1 EYFP in intracellular loop
ß2-pECFP-C1 ECFP in intracellular loop
γ2-pEYFP-C1 EYFP in intracellular loop
γ2-pECFP-C1 ECFP in intracellular loop
α1-IL-pCI Intracellular loop of α1-subunit
ß2-IL-pCI Intracellular loop of ß2-subunit
γ2-IL-pCI Intracellular loop of γ2-subunit
P2X2-pcDNA1 David Julius, UCSF, USA
P2X2-EYFP-N1 Florentina Soto, WU, St. Louis, USA
P2X2-ECFP-N1 Florentina Soto, WU, St. Louis, USA
P2X2-EGFP-N1 Ruth Murrell-Lagnado, Cambridge, UK
P2X1-EGFP-N1 Wolfgang Junger, Harvard Medical School, USA
P2X4-EGFP-N1 Florentina Soto, WU, St. Louis, USA
P2X5-EGFP-N1 Wolfgang Junger, Harvard Medical School, USA

43
5. RESULTS
5.1. AGONIST-INDEPENDENT INTRACELLULAR OLIGOMERIZATION AND CO-
TRAFFICKING OF GABAARS AND P2X2RS
We first investigated whether GABAARs and P2X2Rs are able to interact directly and in an agonist-
independent way. For that, receptors were extracted from HEK cells transfected as indicated in Fig. 4A
and were subjected to immunoprecipitation using antibodies against the α1 subunit of GABAARs.
Precipitated receptors were subjected to SDS-PAGE and Western blot analysis. Since the 1
antibodies were not able to directly precipitate ß2 or γ2 subunits (experiments not shown), co-
precipitation of ß2 and γ2 subunits indicated their assembly with α1 subunits. (Fig. 4A, lane 1). The α1
antibodies did not directly precipitate EYFP-labeled P2X2Rs (Fig. 4A, lane 2). Their precipitation from
cells co-transfected with GABAARs and EYFP-tagged P2X2Rs (Fig. 4A, lane 3) thus indicates an
association of these receptors with GABAARs. Interestingly, however, the total amount of GABAARs
precipitated by α1-antibodies was increased on co-expression with P2X2Rs (Fig. 4A, lanes 1 and 3).
In parallel experiments, the extracted receptors were immunoprecipitated with mouse monoclonal anti-
GFP antibodies. These antibodies did not directly precipitate GABAAR subunits (Fig. 4A, lane 4). Co-
precipitation of α1, ß2 and γ2 subunits (Fig. 4A, lane 6), thus again indicates association of GABAARs
with EYFP-tagged P2X2Rs. Interestingly, the amount of P2X2Rs precipitated was comparable in the
absence or presence of GABAARs (Fig. 4A, lanes 5 and 6). It is also important to note that only a very
small fraction of GABAARs was associated with P2X2Rs and vice versa (Fig. 4A, lane 3 and 6). To
investigate whether the two receptors also interact at the cell surface, receptors were first labeled with
antibodies directed against the extracellular N-terminus of the GABAAR α1 subunit or against the
FLAG-tag in the extracellular loop of P2X2Rs (P2X2-FLAG-EGFP) followed by protein extraction and
precipitation of the antibody-labeled receptors by immunoprecipitin. Results from a typical experiment
are shown in Fig. 4B. Western blotting indicated that GABAARs expression were reduced at the cell
surface by 25.6 ± 0.7% (mean ± SE, p<0.0001, n=4 independent experiments; Fig. 4B, lane 1 and 2)
when P2X2Rs were co-expressed even though we observed an increase in total GABAARs under these
conditions (Fig. 4A). P2X2Rs and GABAARs could also be co-precipitated at the cell surface when
antibodies against the extracellular FLAG-tag were used (Fig. 4B, lane 5). In contrast to GABAARs,
we observed no significant change in the surface expression of P2X2Rs on co-expression of GABAARs
(Surface level reduced by 5.3 ± 3.3%, mean ± SE, p=0.14, n= 4 independent experiments; Fig. 4B,
44
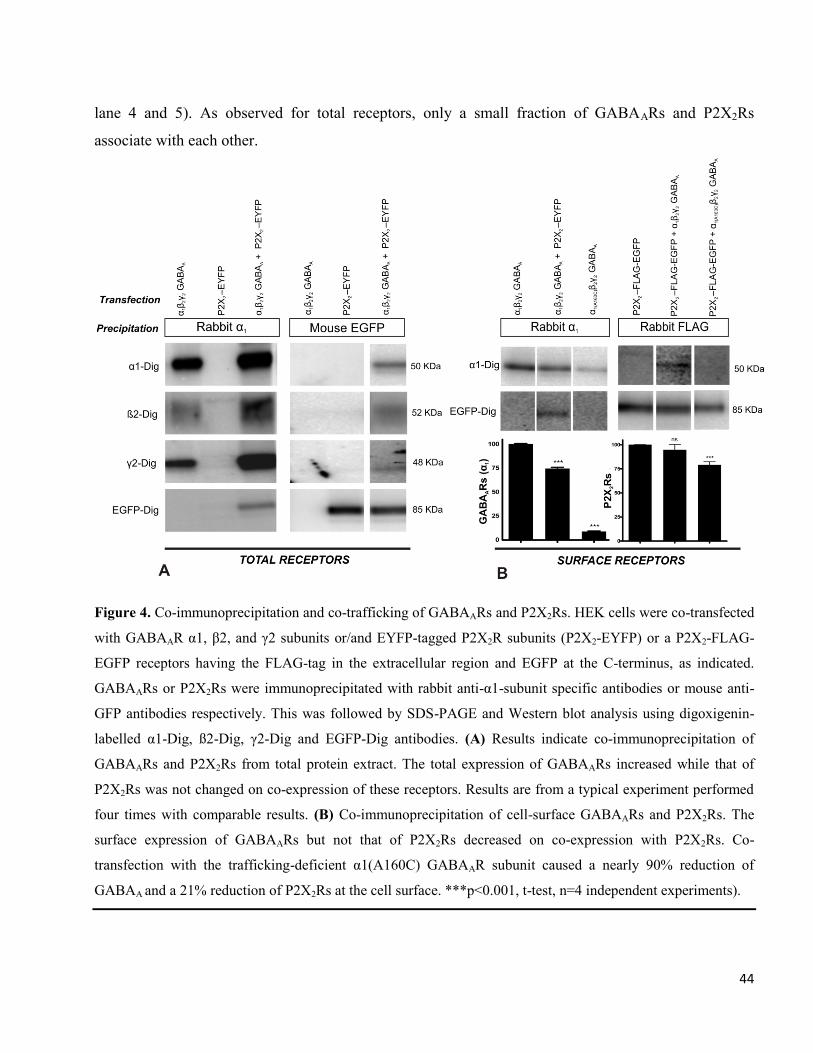
lane 4 and 5). As observed for total receptors, only a small fraction of GABAARs and P2X2Rs
associate with each other.
Figure 4. Co-immunoprecipitation and co-trafficking of GABAARs and P2X2Rs. HEK cells were co-transfected
with GABAAR α1, β2, and γ2 subunits or/and EYFP-tagged P2X2R subunits (P2X2-EYFP) or a P2X2-FLAG-
EGFP receptors having the FLAG-tag in the extracellular region and EGFP at the C-terminus, as indicated.
GABAARs or P2X2Rs were immunoprecipitated with rabbit anti-α1-subunit specific antibodies or mouse anti-
GFP antibodies respectively. This was followed by SDS-PAGE and Western blot analysis using digoxigenin-
labelled α1-Dig, ß2-Dig, γ2-Dig and EGFP-Dig antibodies. (A) Results indicate co-immunoprecipitation of
GABAARs and P2X2Rs from total protein extract. The total expression of GABAARs increased while that of
P2X2Rs was not changed on co-expression of these receptors. Results are from a typical experiment performed
four times with comparable results. (B) Co-immunoprecipitation of cell-surface GABAARs and P2X2Rs. The
surface expression of GABAARs but not that of P2X2Rs decreased on co-expression with P2X2Rs. Co-
transfection with the trafficking-deficient α1(A160C) GABAAR subunit caused a nearly 90% reduction of
GABAA and a 21% reduction of P2X2Rs at the cell surface. ***p<0.001, t-test, n=4 independent experiments).
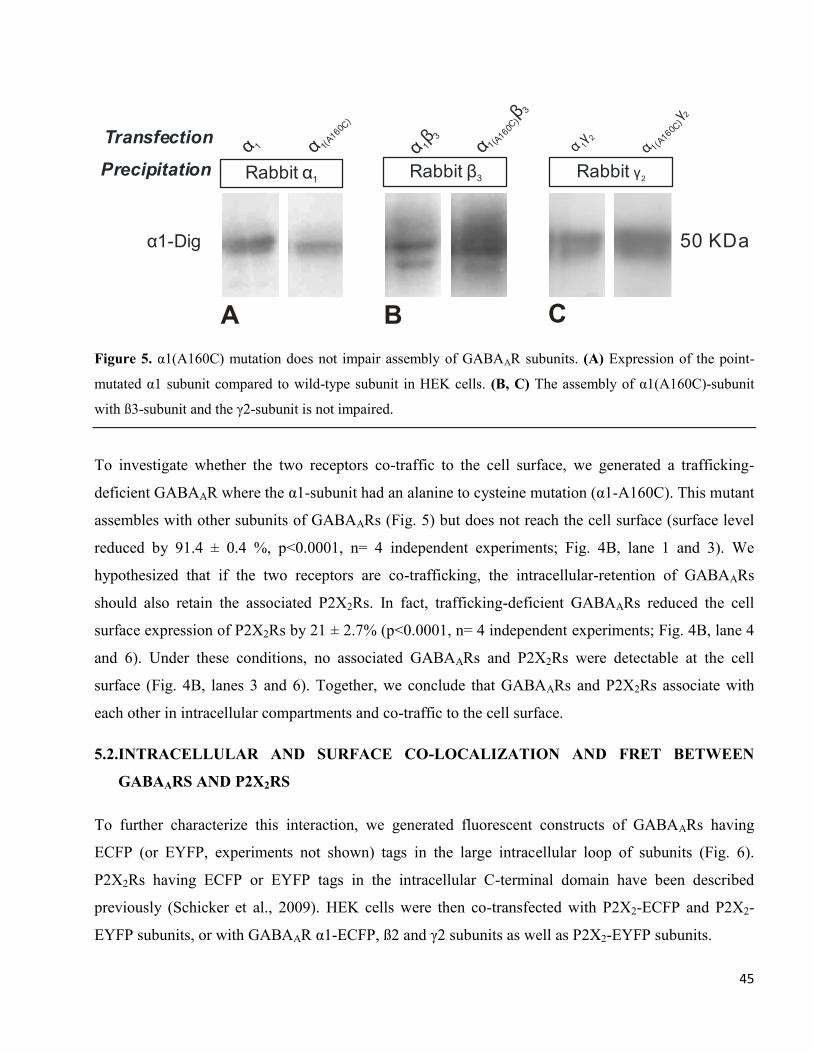
45
Figure 5. α1(A160C) mutation does not impair assembly of GABAAR subunits. (A) Expression of the point-
mutated α1 subunit compared to wild-type subunit in HEK cells. (B, C) The assembly of α1(A160C)-subunit
with ß3-subunit and the γ2-subunit is not impaired.
To investigate whether the two receptors co-traffic to the cell surface, we generated a trafficking-
deficient GABAAR where the α1-subunit had an alanine to cysteine mutation (α1-A160C). This mutant
assembles with other subunits of GABAARs (Fig. 5) but does not reach the cell surface (surface level
reduced by 91.4 ± 0.4 %, p<0.0001, n= 4 independent experiments; Fig. 4B, lane 1 and 3). We
hypothesized that if the two receptors are co-trafficking, the intracellular-retention of GABAARs
should also retain the associated P2X2Rs. In fact, trafficking-deficient GABAARs reduced the cell
surface expression of P2X2Rs by 21 ± 2.7% (p<0.0001, n= 4 independent experiments; Fig. 4B, lane 4
and 6). Under these conditions, no associated GABAARs and P2X2Rs were detectable at the cell
surface (Fig. 4B, lanes 3 and 6). Together, we conclude that GABAARs and P2X2Rs associate with
each other in intracellular compartments and co-traffic to the cell surface.
5.2.INTRACELLULAR AND SURFACE CO-LOCALIZATION AND FRET BETWEEN
GABAARS AND P2X2RS
To further characterize this interaction, we generated fluorescent constructs of GABAARs having
ECFP (or EYFP, experiments not shown) tags in the large intracellular loop of subunits (Fig. 6).
P2X2Rs having ECFP or EYFP tags in the intracellular C-terminal domain have been described
previously (Schicker et al., 2009). HEK cells were then co-transfected with P2X2-ECFP and P2X2-
EYFP subunits, or with GABAAR α1-ECFP, ß2 and γ2 subunits as well as P2X2-EYFP subunits.
Transfection
Precipitation
α1-Dig
Rabbit α1
50 KDa
α 1 α 1(A160C
)
αβ
1
3
α 1(A160C
)β 3
αγ1
2
α
γ 2
1(A160C
)
Rabbit β3 Rabbit γ2
A B C

46
Figure 6. Generation and characterization of the GABAAR α1-ECFP construct. (A) Location of ECFP tag in the
intracellular loop (between amino acids 343 and 344) of the α1-subunit of GABAARs. (B) The presence of
ECFP-tag did not impair the assembly with ß2 and γ2-subunits of the receptor. (C) The α1-ECFP alone
aggregated in the endoplasmic reticulum; once co-assembled with ß2 and γ2-subunits, it is trafficked to the cell
surface.
24 hours after transfection, receptor expression and distribution in living cells was imaged using a
confocal microscope (Fig. 7). As expected, P2X2-ECFP and P2X2-EYFP subunits were strongly co-
localized at the cell membrane, as well as in intracellular compartments. For cells expressing GABAA-
ECFP and P2X2-EYFP receptors, we also observed co-localization in the intracellular compartment as
well as at the cell surface.
Transfection
Precipitation Rabbit α1
52 KDa
α β γ1 2 2-ECFP
α -Dig1
β2-Dig
γ2-Dig
75 KDa
48 KDa
A B C
α -ECFP1
α β γ1 2 2-ECFP
Transfection
Precipitation Rabbit α1
52 KDa
α β γ1 2 2-ECFP
α -Dig1
β2-Dig
γ2-Dig
75 KDa
48 KDa
A B C
α -ECFP1
α β γ1 2 2-ECFP

47
Figure 7. Intracellular and membrane co-localization of receptors in living cells. HEK cells were co-transfected
with P2X2-ECFP and P2X2-EYFP or GABAAR (α1-ECFP, β2, γ2) and P2X2-EYFP subunits. P2X2-ECFP and
P2X2-EYFP assembled to form homo-trimeric receptors which are enriched at the cell membrane. Co-
expression of GABAA-ECFP and P2X2-EYFP receptors resulted in co-localization in both intracellular and
membrane regions.
To investigate a possible direct interaction of GABAARs and P2X2Rs, we performed FRET
(fluorescence resonance energy transfer) on appropriately transfected HEK. FRET images obtained
were processed using pixFRET plugin of ImageJ to visualize FRET signal in pseudo-color (Fig. 8A).
Co-transfection of P2X2-ECFP and P2X2-EYFP subunits generated homo-trimeric P2X2Rs where the
donor (ECFP) and the acceptor (EYFP) are sufficiently close to result in an intense FRET signal
(Khakh et al., 2005). Similarly, an intense FRET signal was observed for the GABAA-ECFP/P2X2-
EYFP pair whereas a negligible signal was observed when ECFP and EYFP were co-transfected
without being bound to receptor subunits (Fig. 8A). Similar to previous observation from confocal-
imaging, FRET between P2X2-ECFP/P2X2-EYFP pair was not only observed at cell membranes
P2X -ECFP 2 P2X -EYFP 2 OVERLAY
GABA -ECFP A P2X -EYFP 2 OVERLAY

48
(identified by their intense signal at the border of the cells) but also in intracellular regions (identified
by a diffuse signal distributed within the cell).
Figure 8. Intracellular and surface FRET between GABAARs and P2X2Rs. HEK cells were co-transfected with
P2X2-ECFP and P2X2-EYFP, pECFP and pEYFP, or α1-ECFP, β2, γ2 and P2X2-EYFP subunits. (A) FRET
images obtained are depicted in pseudo-color code. Results indicate a clear FRET signal between P2X2-ECFP
and P2X2-EYFP, or GABAA-ECFP and P2X2-EYFP subunits. Examples of region of interest (white) on cell
surface to compute FRET are shown (B) The average FRET intensity (± SE) for P2X2-ECFP/P2X2-EYFP
receptors is not-significantly different at the cell membrane and in the intracellular compartment (ns, p=0.922,
n=48 cells, t-test). Similarly, a strong FRET signal was measured for GABAA-ECFP/P2X2-EYFP receptors at
the cell membrane and in the intracellular compartment (ns, p=0.992, n=48 cells, t-test) (C, D) Cell-by-cell
analysis indicated that the FRET intensity at the membrane of individual cells and in their intracellular
compartment did not vary significantly for cells transfected with P2X2-ECFP/P2X2-EYFP receptors (ns,
p=0.429, n=38 cells, paired t-test) and GABAA-ECFP/P2X2-EYFP receptors (ns, p=0.197, n=38 cells, paired t-
test).

49
The average FRET intensity (± SE) measured for P2X2-ECFP/P2X2-EYFP pair in the cytosol (130.9 ±
5.1 arbitrary units, n=48 cells) and at cell membranes (131.6 ± 5.4 arbitrary units, n=48 cells) was
similar (p=0.9, t-test). Similarly, FRET between donor protein, GABAA-ECFP and acceptor P2X2-
EYFP was observed at cell membranes as well as in intracellular compartments. The FRET intensities
for GABAA-ECFP/P2X2-EYFP receptors in the cytosol (104.4 ± 5.3 arbitrary units, n=46 cells) and at
the cell surface (104.9 ± 4.2 arbitrary units, n=46 cells) were comparable (p=0.9, t-test) (Fig. 8B). The
FRET intensity measured for cells expressing ECFP/EYFP was negligible (not shown, Fig. 8A).
To rule out that the similar FRET intensity values resulted from averaging data from different cells, we
performed cell-by-cell FRET intensity analysis. This allowed us to calculate possible changes in FRET
intensity between cytosol and membrane receptors due to a change in distance between fluorophores
during co-trafficking. However, cell-by-cell intensity analysis revealed no significant difference
between intracellular and membrane FRET for both P2X2-ECFP/P2X2-EYFP pair (p=0.9, n=38, paired
t-test) and GABAA-ECFP/ P2X2-EYFP pair (p=1.0, n=38, paired t-test) (Fig. 8C and D). Altogether,
these results suggest that GABAARs associate with P2X2Rs before reaching the cell surface, possibly
in the endoplasmic reticulum. Moreover, the comparable FRET intensity in the cytosol and at the cell
membrane suggests that there was no significant change in the distance between the donor and
acceptor during trafficking from the cytosol to the cell membrane.
5.3. EXTRASYNAPTIC CO-LOCALIZATION OF GABAARS AND P2X2RS IN SPINAL
CORD NEURONS
P2X2Rs are highly expressed in spinal cord either as homo-trimeric P2X2Rs or as hetero-trimeric
P2X2/3Rs. To study whether these receptors interact with endogenous GABAARs, we performed
immunolabeling of receptors at the surface of spinal cord neurons. Such neurons were cultured from
mRFP-gephyrin knock-in mice (Calamai et al. 2009) where the inhibitory synapses can be identified
by visualizing mRFP-gephyrin clusters. 10-11 DIV old neurons were stained using anti-rabbit
antibodies against the extracellular region of P2X2Rs (Fig. 9) and mouse monoclonal anti-ß2/ß3
subunit specific antibodies to label the extracellular domain of ß2/ß3 subunits of GABAARs.
Immunostaining was performed in the absence of detergent to label only surface receptors. The images
were acquired by a spinning-disk confocal microscope using a 63X magnification objective. Cells
showing good fluorescence signal for both P2X2Rs and GABAARs were imaged and acquisition
conditions were kept constant during the experiment.
50
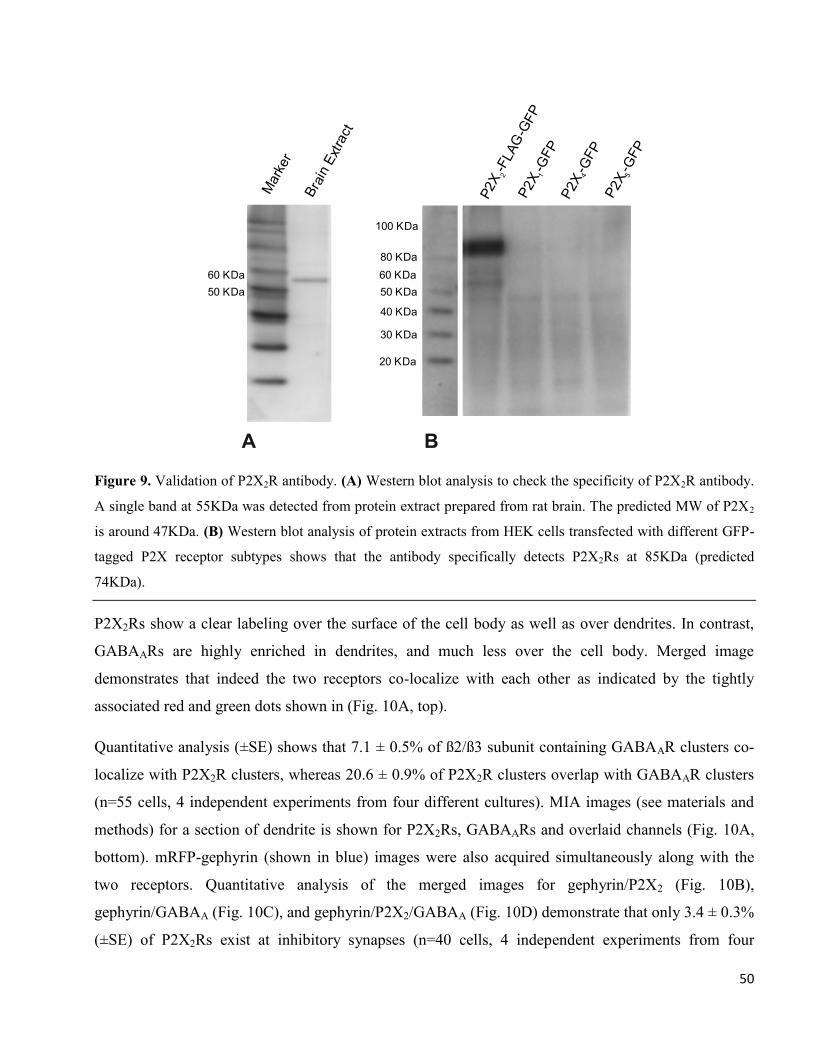
Figure 9. Validation of P2X2R antibody. (A) Western blot analysis to check the specificity of P2X2R antibody.
A single band at 55KDa was detected from protein extract prepared from rat brain. The predicted MW of P2X2
is around 47KDa. (B) Western blot analysis of protein extracts from HEK cells transfected with different GFP-
tagged P2X receptor subtypes shows that the antibody specifically detects P2X2Rs at 85KDa (predicted
74KDa).
P2X2Rs show a clear labeling over the surface of the cell body as well as over dendrites. In contrast,
GABAARs are highly enriched in dendrites, and much less over the cell body. Merged image
demonstrates that indeed the two receptors co-localize with each other as indicated by the tightly
associated red and green dots shown in (Fig. 10A, top).
Quantitative analysis (±SE) shows that 7.1 ± 0.5% of ß2/ß3 subunit containing GABAAR clusters co-
localize with P2X2R clusters, whereas 20.6 ± 0.9% of P2X2R clusters overlap with GABAAR clusters
(n=55 cells, 4 independent experiments from four different cultures). MIA images (see materials and
methods) for a section of dendrite is shown for P2X2Rs, GABAARs and overlaid channels (Fig. 10A,
bottom). mRFP-gephyrin (shown in blue) images were also acquired simultaneously along with the
two receptors. Quantitative analysis of the merged images for gephyrin/P2X2 (Fig. 10B),
gephyrin/GABAA (Fig. 10C), and gephyrin/P2X2/GABAA (Fig. 10D) demonstrate that only 3.4 ± 0.3%
(±SE) of P2X2Rs exist at inhibitory synapses (n=40 cells, 4 independent experiments from four
A B
Mark
er
Bra
in E
xtra
ct
P2X
-FLA
G-G
FP
2
P2X
-GFP
1
P2X
-GFP
4
P2X
-GFP
5
20 KDa
30 KDa
40 KDa
50 KDa
60 KDa
80 KDa
100 KDa
60 KDa
50 KDa

51
different cultures). Altogether, we demonstrate co-existence of GABAAR/P2X2R clusters in cultured
spinal cord neurons. Further, as P2X2Rs are very rare at inhibitory synapses, we conclude that
GABAARs and P2X2Rs co-localize mainly at extrasynaptic localizations.
Figure 10. Extrasynaptic co-localization of P2X2Rs and GABAARs in spinal cord neurons. Cultured spinal cord
neurons (10-11 DIV) from mrfp-gephyrin knock-in mice were stained for P2X2Rs and GABAARs (ß2/ß3-
subunit) without permeabilization. P2X2Rs (green-FITC), GABAARs (red-cy5) and gephyrin (blue-mRFP) were
visualized using a spinning-disk confocal microscope. (A) P2X2Rs are expressed both over the surface of the
cell body as well as over the dendrites, whereas GABAARs are mainly enriched over dendrites. Lower panel
represents a section of a dendrite (boxed region) after multidimensional image analysis (MIA, See Materials and
Methods). Two-representative co-localized clusters depict GABAARs and P2X2Rs co-localize at synaptic (line
arrow) and extrasynaptic (block arrow) location. (B, C, D) Overlaid images for P2X2Rs and gephyrin,
GABAARs and gephyrin and all three channels. Line arrow represents all three proteins co-localized while other
arrows depict co-localization of only two proteins. Scale bar: 10 µm.

52
5.4.MODULATION OF GABAAR AND P2X2R DISTRIBUTION BY PURINERGIC DRUGS IN
SPINAL CORD NEURONS
Previous studies on GABAAR and P2X2R interaction was performed in the presence of agonists and all
our results so far suggest agonist independent interaction between the two receptors. We were
interested to see if activation or deactivation of P2X2Rs has any effect on the strength of this
association. 10-11 DIV spinal cord neurons were first incubated with the P2XR agonist 2MeS-ATP, or
the antagonist TNP-ATP, for two hours followed by immunostaining. A section of dendrites stained
for GABAARs ß2/ß3 subunit (red) and P2X2Rs (green) is shown for all conditions (Fig. 11A).
Figure 11. Regulation of GABAA and P2X2Rs immunoreactivity by purinergic drugs. Spinal cord neurons (10-
11 DIV) were treated for 2hrs with 2MeS-ATP (100µM) or TNP-ATP (100µM) and stained for GABAARs
(ß2/ß3-subunit, red-cy5) and P2X2Rs (green-FITC). Inhibitory synapses were identified based on gephyrin

53
clusters. (A) A representative dendrite is shown for different conditions. (B) The normalized fluorescence
intensity demonstrates that 2MeS-ATP has no significant effect on the immunoreactivity of synaptic and
extrasynaptic GABAARs whereas it significantly increased the fluorescence intensity of P2X2Rs. In contrast,
TNP-ATP treatment significantly elevated the fluorescent intensity of both receptors. The normalized
fluorescence intensity value (± SE) for total GABAARs: Control: 0.81 ± 0.02, n=43; 2MeS-ATP: 0.81 ± 0.02,
n=44 (ns, p=0.205); TNP-ATP: 0.90 ± 0.02, n=44 (**, p<0.001), for synaptic GABAARs: Control: 0.85 ± 0.02,
n=15; 2MeS-ATP: 0.85 ± 0.03 (n=15; ns, p=0.851); TNP:ATP: 0.93 ± 0.03, n=15 (*, p<0.05), for extrasynaptic
GABAARs: Control: 0.90 ± 0.02, n=15; 2MeS-ATP: 0.91 ± 0.03, n=15 (ns, p=0.948); TNP-ATP: 1.04 ± 0.02,
n=15 (***, p<0.0001), for total P2X2Rs: Control: 0.76 ± 0.05, n=24, 2MeS-ATP: 1.25 ± 0.06, n=30 (***,
p<0.0001); TNP-ATP: 1.24 ± 0.05, n=31 (***, p<0.0001). Scale bar: 10 µm
2MeS-ATP treatment had no visible effect on GABAAR fluorescence intensity but at the same time
P2X2R clusters showed increased fluorescence intensity (Fig. 11A, second row). Quantitative analysis
indicated no significant change in the intensity of both synaptic and extrasynaptic GABAARs, but a
significant up regulation of the fluorescence intensity of total P2X2Rs (Fig. 11B). On the other hand,
the competitive antagonist TNP-ATP strongly elevated the fluorescence signal for both GABAARs and
P2X2Rs (Fig. 11A, third row).Quantitative analysis of fluorescence intensity of GABAAR and P2X2R
clusters shows that TNP-ATP treatment significantly enhanced the fluorescence intensity of both the
receptors (Fig. 11B). Even though pharmacological modulation resulted in re-distribution of
GABAARs and P2X2Rs, we observed no significant change in the percentage of co-localized receptor
clusters (not shown). Together, these results suggest that purinergic receptors can directly modulate the
distribution of not only P2X2Rs but also of GABAARs.
5.5. REGULATION OF GABAAR DIFFUSION DYNAMICS BY DRUGS ACTING ON
PURINERGIC RECEPTORS
We performed single particle tracking using the quantum dot technique to evaluate the effects of P2XR
agonists or antagonists on the lateral diffusion of GABAARs. The experiments were performed on
spinal cord neurons from mRFP-gephyrin knock-in mice allowing the direct visualization of inhibitory
synapses. The drugs were added to the imaging medium after labeling the receptors with quantum dots
(GABAAR-QD). The effect of drugs on receptor diffusion could be evaluated from the area explored
by GABAAR-QD trajectories. The activation of P2XRs by 2MeS-ATP (100µM) increased, whereas
the antagonist, TNP-ATP (100µM) decreased the surface explored by GABAARs (Fig. 12A). The
cumulative frequency distribution of diffusion

54
Figure 12. Modulation of GABAAR membrane dynamics by purinergic drugs. The γ2-subunit of GABAARs
was labeled with QD in spinal cord neurons (DIV 11-12) from mrfp-gephyrin mice. (A) Examples of surface
exploration by GABAAR-QDs (green) for 38.4s in presence of 2MeS-ATP (100µM) and TNP-ATP (100µM).
mRFP-gephyrin (red clusters) represents inhibitory synapses. Notably, GABAAR-QDs explored a larger surface
area in presence of agonist, while their surface exploration is greatly diminished in the presence of antagonist.
(B) Cumulative frequency distribution of diffusion coefficient D for GABAAR-QD trajectories in the synapse
(control, n= 293; 2MeS-ATP, n=279; TNP-ATP, n=150) and outside the synapse (control, n= 858; 2MeS-ATP,
n=1016; TNP-ATP, n=1206). Agonist accelerated extrasynaptic receptors, while antagonist slowed down both
synaptic and extrasynaptic receptors. Values are from four independent experiments from four different
cultures, (*p < 0.05, ***p < 0.005; Kolmogorov-Smirnov test). (C) Average (± SE) MSD over time for
GABAAR-QDs at synaptic and extrasynaptic sites. (D) The average confinement size (µm) of synaptic and
extrasynaptic GABAAR-QDs indicates that TNP-ATP treated extrasynaptic receptors were more confined in a
micro domain. (E) Percentage of immobile (D < 10-4
µm2/s) synaptic and extrasynaptic receptors. The number
of immobile (± SEM) synaptic receptors was 8.3 ± 3.4% for control (n=134), 9.4 ± 3.8% for 2MeS-ATP
(n=139) and 5.2 ± 2.7% for TNP-ATP (n=97) treated cells and extrasynaptic receptors was 11.8 ± 0.9% for
control (n=858), 11.7 ± 1.9% for 2MeS-ATP (n=1016) and 18.1 ± 1.9% for TNP-ATP (n=1377) treated cells.
Note that the agonist had no distinct effect on the proportion of immobile GABAAR-QDs, whereas the
antagonist significantly increased the number of immobile extrasynaptic GABAAR-QDs. (***, p<0.001, t-test).
Scale: 5 µm.
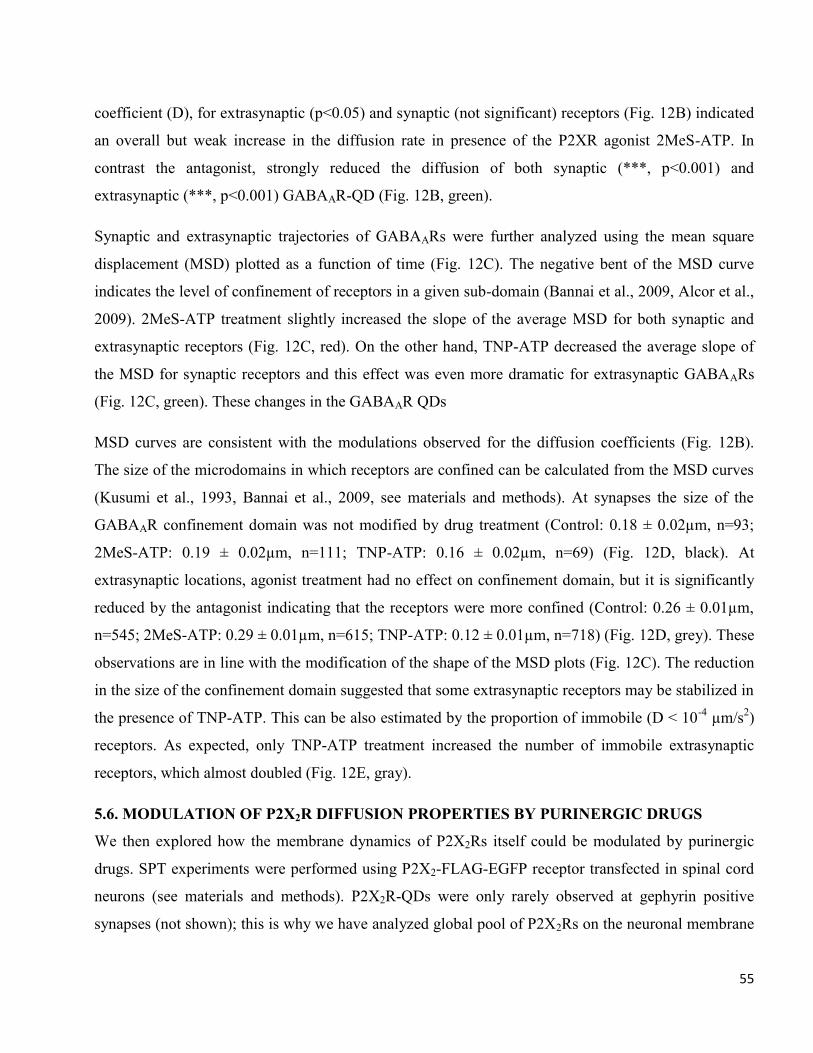
55
coefficient (D), for extrasynaptic (p<0.05) and synaptic (not significant) receptors (Fig. 12B) indicated
an overall but weak increase in the diffusion rate in presence of the P2XR agonist 2MeS-ATP. In
contrast the antagonist, strongly reduced the diffusion of both synaptic (***, p<0.001) and
extrasynaptic (***, p<0.001) GABAAR-QD (Fig. 12B, green).
Synaptic and extrasynaptic trajectories of GABAARs were further analyzed using the mean square
displacement (MSD) plotted as a function of time (Fig. 12C). The negative bent of the MSD curve
indicates the level of confinement of receptors in a given sub-domain (Bannai et al., 2009, Alcor et al.,
2009). 2MeS-ATP treatment slightly increased the slope of the average MSD for both synaptic and
extrasynaptic receptors (Fig. 12C, red). On the other hand, TNP-ATP decreased the average slope of
the MSD for synaptic receptors and this effect was even more dramatic for extrasynaptic GABAARs
(Fig. 12C, green). These changes in the GABAAR QDs
MSD curves are consistent with the modulations observed for the diffusion coefficients (Fig. 12B).
The size of the microdomains in which receptors are confined can be calculated from the MSD curves
(Kusumi et al., 1993, Bannai et al., 2009, see materials and methods). At synapses the size of the
GABAAR confinement domain was not modified by drug treatment (Control: 0.18 ± 0.02µm, n=93;
2MeS-ATP: 0.19 ± 0.02µm, n=111; TNP-ATP: 0.16 ± 0.02µm, n=69) (Fig. 12D, black). At
extrasynaptic locations, agonist treatment had no effect on confinement domain, but it is significantly
reduced by the antagonist indicating that the receptors were more confined (Control: 0.26 ± 0.01µm,
n=545; 2MeS-ATP: 0.29 ± 0.01µm, n=615; TNP-ATP: 0.12 ± 0.01µm, n=718) (Fig. 12D, grey). These
observations are in line with the modification of the shape of the MSD plots (Fig. 12C). The reduction
in the size of the confinement domain suggested that some extrasynaptic receptors may be stabilized in
the presence of TNP-ATP. This can be also estimated by the proportion of immobile (D < 10-4
µm/s2)
receptors. As expected, only TNP-ATP treatment increased the number of immobile extrasynaptic
receptors, which almost doubled (Fig. 12E, gray).
5.6. MODULATION OF P2X2R DIFFUSION PROPERTIES BY PURINERGIC DRUGS
We then explored how the membrane dynamics of P2X2Rs itself could be modulated by purinergic
drugs. SPT experiments were performed using P2X2-FLAG-EGFP receptor transfected in spinal cord
neurons (see materials and methods). P2X2R-QDs were only rarely observed at gephyrin positive
synapses (not shown); this is why we have analyzed global pool of P2X2Rs on the neuronal membrane

56
independent of inhibitory synaptic localization. The surface explored by QDs over the acquisition
period emphasizes the effects of the drug on lateral diffusion (Fig. 13A) and showed that the overall
explored surface area was reduced with both the agonist and the antagonist (Fig. 13A). The
distribution of diffusion coefficient, D was not significantly different between the 2MeS-ATP and the
control experiments (ns, p=0.226, n=495 for control and n=481 for 2MeS-ATP, KS test) (Fig. 13B,
blue and red).
Figure 13. Regulation of P2X2R diffusion dynamics by purinergic drugs. Spinal cord neurons (DIV 9) were
transfected with P2X2-FLAG-EGFP receptors having the FLAG-tag in the extracellular region and EGFP at the
C-terminus. EGFP was used to identify transfected cells and single particle QD tracking of P2X2Rs was
performed by labeling the FLAG-tag of the receptor. (A) Examples of surface explored by P2X2R-QDs (red)
over transfected cell (green) for different conditions. (B) Cumulative frequency distribution of diffusion for
P2X2R-QDs trajectories shows no significant change in receptor diffusion on agonist treatment whereas
antagonist treatment significantly slowed down the receptors (***p < 0.001, Kolmogorov-Smirnov test). (C)
Average MSD plot for trajectories of P2X2R-QDs shows that 2MeS-ATP as well TNP-ATP increased the
confinement of the P2X2Rs. These are typical results from three independent experiments.

57
However, as indicated by the MSD plot, the confinement of P2X2R-QDs increased in presence of
2MeS-ATP compared to the control (Fig. 13C, blue and red). The antagonist treatment lowered the
diffusion of P2X2R-QDs (***, p < 0.005, n=495 for control and n=475 for TNP-ATP) (Fig. 13B, blue
and green) and also increased the confinement (Fig. 13C, blue and green).
Thus, the mechanisms leading to reduced diffusion of P2X2Rs in presence of 2MeS-ATP or TNP-ATP
are different (Holcman and Triller, 2006). In both cases there is an increase in confinement, but
decrease in diffusion coefficient was observed only for latter. In case of 2MeS-ATP, this indicates that
the diffusion rate was not affected by the binding of agonist, but that the surface area in which
diffusion take place was reduced. This is in favor of multiple binding events of short dwell time with
unbiased diffusion between them. In case of TNP-ATP, the antagonist rather led to long binding events
which reduced the overall lateral diffusion and increase the confinement.
5.7. MODULATION OF GABAAR AND P2X2R INTERACTION BY PURINERGIC DRUGS
SPT experiments suggested that an agonist of P2X2Rs increased, while an antagonist decreased the
mobility of extrasynaptic GABAARs at the cell surface. To further study this effect, we investigated
whether pharmacological regulation of P2X2Rs by purinergic drug alters the amount of associated
GABAARs at the surface of HEK cells. Cell surface co-immunoprecipitation was performed as
described in Fig. 4. Cells expressing GABAAR α1, ß2 and γ2 subunits as well as P2X2-EYFP subunits
were incubated with either 2MeS-ATP (30µM) or TNP-ATP (10µM) for 1 hr. Surface GABAARs were
immunolabeled by α1-subunit specific antibodies followed by extraction and precipitation of antibody-
labeled receptors by adding immunoprecipitin. The remaining intracellular GABAARs were
subsequently precipitated by incubating with α1-subunit specific antibodies. Changes in surface levels
of GABAA receptors following drug treatment were then measured by Western blotting. 2MeS-ATP
treatment reduced the level of surface GABAARs and at the same time, we observed an increased
degradation of intracellular receptors (Fig. 14, lanes 1 and 2). The co-associated P2X2Rs were detected
using digoxigenin-labeled anti-EGFP-antibodies. Similar to previous observation (Fig. 4B, lane 2), we
observed a very weak association of P2X2Rs with GABAARs for control and 2MeS-ATP treated cells.
(Fig. 14, lane 1 and 2) .In contrast, TNP-ATP treatment had no effect on the surface level of
GABAARs but highly up regulated the associated P2X2Rs (Fig. 14, lane 1 and 3). Taken together we

58
demonstrate here that agonist binding on P2X2Rs reduce the surface expression of GABAARs and
targets it for degradation whereas antagonist binding highly stabilizes the interaction.
Figure 14. Modulation of direct association of GABAARs and P2X2Rs by purinergic drugs. HEK cells were co-
transfected with GABAAR α1, β2, and γ2 subunits and EYFP-tagged P2X2R subunits. 48 hours after
transfection, cells were treated with either 2MeS-ATP (30µM) or TNP-ATP (10µM) for 1 hour followed by
surface precipitation of GABAAR using α1-subunit specific antibodies. Precipitated GABAARs were detected
using digoxigenin-labelled α1 antibodies and co-precipitated P2X2Rs were detected using digoxigenin-labelled
EGFP antibodies. 2MeS-ATP, but TNP-ATP treatment, decreased the surface the level of GABAARs. While we
detected very weak association of P2X2Rs with GABAARs for control and agonist treated cells, we observed a
very strong association when the cells were treated with TNP-ATP.

59
6. DISCUSSION
6.1. INTRACELLULAR ASSOCIATION AND CO-TRAFFICKING OF GABAARS AND
P2X2RS ENSURES SPECIFIC TARGETING OF P2X2RS
Several lines of evidence indicate that GABAARs and P2X2Rs directly associate with each other in the
endoplasmic reticulum in an agonist independent way: First, both receptors could be co-
immunoprecipitated from the cell surface or from a total extract of appropriately transfected HEK
cells, using antibodies directed against either one of these receptors (Fig. 4); Second, both receptors are
co-localized in membranes and the cytoplasm of HEK cells co-transfected with ECFP-tagged
GABAARs and EYFP-tagged P2X2Rs as demonstrated by confocal microscopy (Fig. 7). Third, FRET
experiments performed in these cells resulted in a similar FRET signal in the cytosol and at the
membrane, suggesting that the same type of association of the GABAA/P2X2R complex is observed in
these compartments (Fig. 8). Fourth, transfecting HEK cells with P2X2Rs and a trafficking deficient
GABAAR mutant resulted in 90% reduction of GABAARs and a 21% reduction of P2X2Rs at the cell
surface, providing direct evidence for co-trafficking of these receptors (Fig. 4B). Fifth, co-localization
of endogenous GABAA and P2X2Rs in the endoplasmic reticulum (Protein disulfide isomerase, PDI) or
Golgi apparatus (Golgi-matrix protein, GM130), the two crucial check-points of forward trafficking, was
demonstrated in neurons (experiments not shown).
Interestingly, co-expression of P2X2Rs resulted in a 3-fold up-regulation in the expression of
GABAARs in HEK cells (Fig. 1A), whereas the number of P2X2Rs expressed was not significantly
influenced by the co-expression of GABAARs. This seems to indicate that P2X2Rs might have a
stabilizing or chaperone function on a GABAAR subpopulation, preventing them from degradation.
Such an intracellular function of P2X2Rs is supported by the fact that these receptors are highly
enriched in the cytoplasm of the cell body of spinal cord neurons (not shown). Once associated, the
complex is then co-trafficked to the cell surface and inserted extrasynaptically, where we observed
them to be co-localized (Fig. 7). Interestingly, previously it was demonstrated that co-expression of
P2X2Rs resulted in distal targeting of GABAC and GABAARs (Boué-Grabot et al., 2004a, 2004b).
Together with our results, this indicates that GABAARs stabilized by P2X2 receptors help to traffic
these receptors to specific localizations at the cell surface.

60
6.2. PURINERGIC TRANSMISSION DECREASES GABAERGIC INHIBITION IN SPINAL
CORD NEURONS
It was possible that GABAARs and P2X2Rs co-inserted into the cell membrane became enriched at
inhibitory synapses. Actually, however, we observed only a very small fraction of co-localized
receptors at inhibitory synapses (Fig. 14). This is consistent with previous studies indicating that
P2X2Rs are mainly enriched at glutamatergic synapses in the brain (Rubio and Soto, 2001; Masin et
al., 2006). These observations indicate that the two associated receptors either function at extrasynaptic
regions or they dissociate and subsequently exhibit functions independent from each other. In fact,
several lines of evidence indicate that upon activation of P2X2Rs by an agonist, the co-associated
GABAARs dissociate and are internalized and degraded whereas P2X2Rs are stabilized. First,
application of the P2X2R agonist 2MeS-ATP increased the mobility of extrasynaptically located
GABAARs (Fig. 12), but did not change the mobility of P2X2Rs and on the contrary, increased their
confinement (Fig. 13) and cluster size (Fig.11). This is consistent with a previous study where it was
reported that ATP treatment resulted in hot-spots of P2X2-GFP receptors (Khakh et al., 2001). Second,
immunoprecipitation of receptors at the surface and intracellular compartments of HEK cells co-
transfected with GABAA and P2X2Rs indicated that incubation with 2MeS-ATP reduced the number
of GABAARs at the cell surface and increased the formation of GABAAR degradation products in the
cytosol (Fig. 14). The amount of P2X2Rs was not changed under these conditions (Fig. 14), indicating
that the increased clustering of these receptors (Fig. 11) on 2MeS-ATP treatment was not caused by
newly incorporated receptors but by an increased confinement (Fig. 13) of freely diffusing P2X2Rs at
pre-existing P2X2R clusters. And third, co-transfection of HEK cells with GABAARs and P2X2Rs
increased the expression of GABAARs in intracellular compartments, but caused a reduction of
GABAARs at the cell surface (Fig. 4). Since there was no change in the number of P2X2Rs in
intracellular compartments and at the cell surface under these conditions, the increased amount of
GABAARs in the intracellular compartments did not result in an increase of P2X2R incorporation into
the cell membrane. The reduced number of GABAARs at the cell membrane then probably was caused
by a dissociation of GABAARs from the associated P2X2Rs mediated by endogenous ATP present in
the cell culture medium, followed by their internalization and degradation.
Dissociation of GABAARs from associated P2X2Rs can either be elicited by an ATP-induced
conformational change in P2X2Rs, or by the subsequent P2X2R-mediated Ca2+
influx into the cell.
61
Although it was demonstrated that GABAAR dynamics was unaltered by NMDA-elicited changes of
the intracellular Ca2+
concentration in spinal cord neurons (Lévi et al., 2008), we cannot exclude
conformational changes elicited by local Ca2+
influx via associated P2X2Rs. Rapid dissociation and
internalization of GABAARs of course could be one of the mechanisms playing a role in the cross-talk
of GABAA and P2X2Rs. But this for sure is not the only mechanism involved and it has to be
emphasized that the present results describe the effects of 2MeS-ATP on GABAA and P2X2R
distribution in neurons or HEK cells after 2 h treatment with high drug concentrations. In addition, the
single particle tracking experiments were also performed over a time period of 5-20 min during drug
application. These data, thus, describe long term effects of drugs and cannot necessarily provide
explanations for a possible mechanism of the cross-talk between GABAA and P2X2Rs.
As members from P2XR family have been demonstrated to show cross-talk with not only GABAARs
(Sokolova et al., 2001; Boué-Grabot et al., 2004b; Karanjia et al., 2006; Toulmé et al., 2007) but also
with several other members of cys-loop receptors which includes 5-HT3 receptors (Zhou and Galligan,
1998; Boué-Grabot et al., 2003) GABAC receptors (Boué-Grabot et al., 2004a) and nACh receptors
(Khakh et al., 2000; Khakh et al., 2005), association of P2X2Rs with other receptors and co-trafficking
to specific locations at the cell surface in fact may be a general phenomenon. Indeed, such cys-loop
receptor mediated recruitment to the cell surface is possibly not restricted to P2X2Rs as several other
members of P2XR family are now known to interact with GABAARs (P2X1, P2X4 and P2X5:
experiments not shown; P2X3: Sokolova et al., 2001; Toulmé et al., 2007) and nicotinic receptors
(P2X2, P2X3 and P2X4: Decker and Galligan, 2009). Such a receptor-mediated targeting of P2XRs
becomes further important due to a lack of specifically defined synapses for these receptors. In any
case, in the absence of P2X2R-selective drugs we cannot exclude that part of the agonist or antagonist-
induced changes observed were elicited via other P2XR subtypes present in spinal cord.
6.3. Blocking P2XRs as a dual therapeutic strategy for spinal pain processing
Inflammatory diseases and neuropathic injury are frequently accompanied by severe and debilitating
pain. Loss of synaptic inhibition by GABAergic and glycinergic spinal dorsal horn neurons has been
proposed as one of the key pathways in propagation of nociceptive and neuropathic information
(Knabl et al., 2008; Zeilhofer and Zeilhofer, 2008; Zeilhofer et al., 2009). A key molecule involved in
spinal pain processing is ATP. It was established long back that exogenously applied ATP can induce
pain sensation (Bleehen and Keele, 1977; Nagagawa et al., 2007) by activating P2XRs in lamina II of

62
spinal cord (Bardoni et al., 1997; Jo and Schlicter, 1999; Souslova et al., 2000). Our study
demonstrates that the two pathways mediated by P2X and GABAARs overlap and a fine balance
between the two systems is essential to maintain homeostasis. Excess ATP released in diseased states
will not only activate P2XR, but also result in a dissociation, internalization and degradation of P2XR-
associated surface GABAARs, thus further strengthening of P2XR activity by spinal dis-inhibition.
Further experiments with spinal cord slices will have to strengthen this hypothesis.
The present finding that treatment with the competitive P2XR antagonist, TNP-ATP (Trujillo et al.,
2006) resulted in increased clustering and slowing down of both GABAARs and P2X2Rs (Fig. 11, 12,
13), in cultures suggests a dual mechanism of action: blockade of the excitatory actions of P2XRs and
strengthening of GABAergic inhibition by preventing degradation (Fig. 14). In fact, TNP-ATP has
been shown to suppress the ATP induced effect in acute inflammatory or visceral pain following injury
(Jarvis et al., 2001; Honore et al., 2002). The short half-life of TNP-ATP, however, does not make it
suitable for therapeutic studies (Ding et al., 2000). P2X2R antagonists exhibiting a longer half-life,
however, might be useful candidates for preventing spinal-excitation as well as GABAergic
disinhibition.

63
7. REFERENCES
Alcor D, Gouzer G, Triller A (2009) Single-particle tracking methods for the study of membrane
receptors dynamics. Eur J Neurosci 30:987-997.
Balasubramanian S, Teissére JA, Raju DV, Hall RA (2004) Hetero-oligomerization between GABAA
and GABAB receptors regulates GABAB receptor trafficking. J Biol Chem 279:18840-18850.
Bannai H, Lévi S, Schweizer C, Dahan M, Triller A (2006) Imaging the lateral diffusion of membrane
molecules with quantum dots. Nat Protoc 1:2628-2634.
Bannai H, Lévi S, Schweizer C, Inoue T, Launey T, Racine V, Sibarita JB, Mikoshiba K, Triller A
(2009) Activity-dependent tuning of inhibitory neurotransmission based on GABAAR diffusion
dynamics. Neuron 62:670-682.
Bardoni R, Goldstein PA, Lee CJ, Gu JG, MacDermott AB (1997) ATP P2X receptors mediate fast
synaptic transmission in the dorsal horn of the rat spinal cord. J Neurosci 17:5297-5304.
Bartholomäus I, Milan-Lobo L, Nicke A, Dutertre S, Hastrup H, Jha A, Gether U, Sitte HH, Betz H,
Eulenburg V (2008) Glycine transporter dimers: evidence for occurrence in the plasma membrane. J
Biol Chem 283:10978-10991.
Bedford FK, Kittler JT, Muller E, Thomas P, Uren JM, Merlo D, Wisden W, Triller A, Smart TG,
Moss SJ (2001) GABA(A) receptor cell surface number and subunit stability are regulated by the
ubiquitin-like protein Plic-1. Nat Neurosci 4:908-916.
Bleehen T, Keele CA (1977) Observations on the algogenic actions of adenosine compounds on the
human blister base preparation. Pain 3:367-377.
Bobanovic LK, Royle SJ, Murrell-Lagnado RD (2002) P2X receptor trafficking in neurons is subunit
specific. J Neurosci 22:4814-4824.
Bogdanov Y, Michels G, Armstrong-Gold C, Haydon PG, Lindstrom J, Pangalos M, Moss SJ (2006)
Synaptic GABAA receptors are directly recruited from their extrasynaptic counterparts. EMBO J
25:4381-4389.
Bonneau S, Dahan M, Cohen LD (2005) Single quantum dot tracking based on perceptual grouping
using minimal paths in a spatiotemporal volume. IEEE Trans Image Process 14:1384-1395.
Boué-Grabot E, Barajas-López C, Chakfe Y, Blais D, Bélanger D, Emerit MB, Séguéla P (2003)
Intracellular cross talk and physical interaction between two classes of neurotransmitter-gated
channels. J Neurosci 23:1246-1253.
64
Boué-Grabot E, Emerit MB, Toulmé E, Séguéla P, Garret M (2004a) Cross-talk and co-trafficking
between rho1/GABA receptors and ATP-gated channels. J Biol Chem 279:6967-6975.
Boué-Grabot E, Toulmé E, Emerit MB, Garret M (2004b) Subunit-specific coupling between gamma-
aminobutyric acid type A and P2X2 receptor channels. J Biol Chem 279:52517-52525.
Burnstock G, Knight GE (2004) Cellular distribution and functions of P2 receptor subtypes in
different systems. Int Rev Cytol 240:31-304.
Calamai M, Specht CG, Heller J, Alcor D, Machado P, Vannier C, Triller A (2009) Gephyrin
oligomerization controls GlyR mobility and synaptic clustering. J Neurosci 29:7639-7648.
Charrier C, Ehrensperger MV, Dahan M, Lévi S, Triller A (2006) Cytoskeleton regulation of glycine
receptor number at synapses and diffusion in the plasma membrane. J Neurosci 26:8502-8511.
Chen CA, Okayama H (1988) Calcium phosphate-mediated gene transfer: a highly efficient
transfection system for stably transforming cells with plasmid DNA. BioTechniques 6:632–638.
Choquet D, Triller A (2003) The role of receptor diffusion in the organization of the postsynaptic
membrane. Nat Rev Neurosci 4:251-265.
Collo G, North RA, Kawashima E, Merlo-Pich E, Neidhart S, Surprenant A, Buell G (1996) Cloning
OF P2X5 and P2X6 receptors and the distribution and properties of an extended family of ATP-gated
ion channels. J Neurosci 16:2495-2507.
Decker DA, Galligan JJ (2009) Cross-inhibition between nicotinic acetylcholine receptors and P2X
receptors in myenteric neurons and HEK-293 cells. Am J Physiol Gastrointest Liver Physiol 296:1267-
1276.
Ding Y, Cesare P, Drew L, Nikitaki D, Wood J (2000) ATP, P2X receptors and pain pathways. J
Auton Nerv Syst 81:289-294.
Ehrensperger MV, Hanus C, Vannier C, Triller A, Dahan M (2007) Multiple association states
between glycine receptors and gephyrin identified by SPT analysis. Biophys J 92:3706-3718.
Feige JN, Gelman L, Tudor C, Engelborghs Y, Wahli W, Desvergne B (2005a) Fluorescence imaging
reveals the nuclear behavior of peroxisome proliferator-activated receptor/retinoid X receptor
heterodimers in the absence and presence of ligand. J Biol Chem 280:17880-17890.
Feige JN, Sage D, Wahli W, Desvergne B, Gelman L (2005b) PixFRET, an ImageJ plug-in for FRET
calculation that can accommodate variations in spectral bleed-throughs. Microsc Res Tech 68:51-58.
Gever JR, Cockayne DA, Dillon MP, Burnstock G, Ford AP (2006) Pharmacology of P2X channels.
Pflugers Arch 452:513-537.

65
Guerlet G, Taly A, Prado de Carvalho L, Martz A, Jiang R, Specht A, Le Novère N, Grutter T (2008)
Comparative models of P2X2 receptor support inter-subunit ATP-binding sites. Biochem Biophys Res
Commun 375:405-409.
Holcman D, Triller A (2006) Modeling synaptic dynamics driven by receptor lateral diffusion.
Biophys J 91:2405-2415.
Honore P, Mikusa J, Bianchi B, McDonald H, Cartmell J, Faltynek C, Jarvis MF (2002) TNP-ATP, a
potent P2X3 receptor antagonist, blocks acetic acid-induced abdominal constriction in mice:
comparison with reference analgesics. Pain 96:99-105.
Horton RM, Ho SN, Pullen JK, Hunt HD, Cai Z, Pease LR (1993) Gene splicing by overlap extension.
Methods Enzymol 217:270-279.
Jacob TC, Bogdanov YD, Magnus C, Saliba RS, Kittler JT, Haydon PG, Moss SJ (2005) Gephyrin
regulates the cell surface dynamics of synaptic GABAA receptors. J Neurosci 25:10469-10478.
Jacob TC, Moss SJ, Jurd R (2008) GABA(A) receptor trafficking and its role in the dynamic
modulation of neuronal inhibition. Nat Rev Neurosci 9:331-343.
Jarvis MF, Wismer CT, Schweitzer E, Yu H, van Biesen T, Lynch KJ, Burgard EC, Kowaluk EA
(2001) Modulation of BzATP and formalin induced nociception: attenuation by the P2X receptor
antagonist, TNP-ATP and enhancement by the P2X(3) allosteric modulator, cibacron blue. Br J
Pharmacol 132:259-269.
Jo YH, Schlichter R (1999) Synaptic corelease of ATP and GABA in cultured spinal neurons. Nat
Neurosci. 2:241-245.
Karanjia R, García-Hernández LM, Miranda-Morales M, Somani N, Espinosa-Luna R, Montaño LM,
Barajas-López C (2006) Cross-inhibitory interactions between GABAA and P2X channels in
myenteric neurones. Eur J Neurosci 23:3259-3268.
Khakh BS, Zhou X, Sydes J, Galligan JJ, Lester HA (2000) State-dependent cross-inhibition between
transmitter-gated cation channels. Nature 406:405-410.
Khakh BS, Smith WB, Chiu CS, Ju D, Davidson N, Lester HA (2001) Activation-dependent changes
in receptor distribution and dendritic morphology in hippocampal neurons expressing P2X2-green
fluorescent protein receptors. Proc Natl Acad Sci U S A 98:5288-5293.
Khakh BS, Fisher JA, Nashmi R, Bowser DN, Lester HA (2005) An angstrom scale interaction
between plasma membrane ATP-gated P2X2 and alpha4beta2 nicotinic channels measured with

66
fluorescence resonance energy transfer and total internal reflection fluorescence microscopy. J
Neurosci 25:6911-6920.
Khakh BS, North RA (2006) P2X receptors as cell-surface ATP sensors in health and disease. Nature
442:527-532.
Klausberger T, Fuchs K, Mayer B, Ehya N, Sieghart W (2000) GABA(A) receptor assembly.
Identification and structure of gamma(2) sequences forming the intersubunit contacts with alpha(1)
and beta(3) subunits. J. Biol Chem 275:8921–8928.
Knabl J, Witschi R, Hösl K, Reinold H, Zeilhofer UB, Ahmadi S, Brockhaus J, Sergejeva M, Hess A,
Brune K, Fritschy JM, Rudolph U, Möhler H, Zeilhofer HU (2008) Reversal of pathological pain
through specific spinal GABAA receptor subtypes. Nature 451:330-334.
Köles L, Gerevich Z, Oliveira JF, Zadori ZS, Wirkner K, Illes P (2008) Interaction of P2 purinergic
receptors with cellular macromolecules. Naunyn Schmiedebergs Arch Pharmacol 377:1-33.
Kusumi A, Sako Y, Yamamoto M (1993) Confined lateral diffusion of membrane receptors as studied
by single particle tracking (nanovid microscopy). Effects of calcium-induced differentiation in cultured
epithelial cells. Biophys J 65:2021–2040.
Labrakakis C, Tong CK, Weissman T, Torsney C, MacDermott AB (2003) Localization and function
of ATP and GABAA receptors expressed by nociceptors and other postnatal sensory neurons in rat. J
Physiol 549:131-142.
Lee FJ, Xue S, Pei L, Vukusic B, Chéry N, Wang Y, Wang YT, Niznik HB, Yu XM, Liu F (2002)
Dual regulation of NMDA receptor functions by direct protein-protein interactions with the dopamine
D1 receptor. Cell 111:219-230.
Lévi S, Schweizer C, Bannai H, Pascual O, Charrier C, Triller A (2008). Homeostatic regulation of
synaptic GlyR numbers driven by lateral diffusion. Neuron 59:261-273.
Liu F, Wan Q, Pristupa ZB, Yu XM, Wang YT, Niznik HB (2000) Direct protein-protein coupling
enables cross-talk between dopamine D5 and gamma-aminobutyric acid A receptors. Nature 403:274-
280.
Loebrich S, Bähring R, Katsuno T, Tsukita S, Kneussel M (2006) Activated radixin is essential for
GABAA receptor alpha5 subunit anchoring at the actin cytoskeleton. EMBO J 25:987-999.
Masin M, Kerschensteiner D, Dümke K, Rubio ME, Soto F (2006) Fe65 interacts with P2X2 subunits
at excitatory synapses and modulates receptor function. J Biol Chem 281:4100-4108.

67
Meier J, Vannier C, Sergé A, Triller A, Choquet D (2001) Fast and reversible trapping of surface
glycine receptors by gephyrin. Nat Neurosci 4:253-260.
Meyer G, Kirsch J, Betz H, Langosch D (1995) Identification of a gephyrin binding motif on the
glycine receptor beta subunit. Neuron 15:563-572.
Milan-Lobo L, Gsandtner I, Gaubitzer E, Rünzler D, Buchmayer F, Köhler G, Bonci A, Freissmuth M,
Sitte HH (2009) Subtype-specific differences in corticotropin-releasing factor receptor complexes
detected by fluorescence spectroscopy. Mol Pharmacol 76:1196-1210
Moss SJ, Smart TG (2001) Constructing inhibitory synapses. Nat Rev Neurosci 2:240-250.
Nakagawa T, Wakamatsu K, Zhang N, Maeda S, Minami M, Satoh M, Kaneko S (2007) Intrathecal
administration of ATP produces long-lasting allodynia in rats: differential mechanisms in the phase of
the induction and maintenance. Neuroscience 147:445-455.
Olsen RW, Sieghart W (2009) GABA A receptors: subtypes provide diversity of function and
pharmacology. Neuropharmacology 56:141-148.
Olsen RW, Sieghart W (2008) International Union of Pharmacology. LXX. Subtypes of gamma-
aminobutyric acid (A) receptors: classification on the basis of subunit composition, pharmacology, and
function. Update. Pharmacol Rev 60:243-260.
Pfeiffer F, Graham D, Betz H (1982) Purification by affinity chromatography of the glycine receptor
of rat spinal cord. J Biol Chem 257:9389-9393.
Pirker S, Schwarzer C, Wieselthaler A, Sieghart W, Sperk G (2000) GABA(A) receptors:
immunocytochemical distribution of 13 subunits in the adult rat brain. Neuroscience 101:815-850.
Pei L, Lee FJ, Moszczynska A, Vukusic B, Liu F (2004) Regulation of dopamine D1 receptor function
by physical interaction with the NMDA receptors. J Neurosci 24(5):1149-1158.
Racine V, Sachse M, Salamero J, Fraisier V, Trubuil A, Sibarita JB (2007) Visualization and
quantification of vesicle trafficking on a three-dimensional cytoskeleton network in living cells. J
Microsc 225:214-228.
Renner M, Specht CG, Triller A (2008) Molecular dynamics of postsynaptic receptors and scaffold
proteins. Curr Opin Neurobiol 18:532-540.
Renner M, Choquet D, Triller A (2009) Control of the postsynaptic membrane viscosity. J Neurosci
29:2926-2937.
Rubio ME, Soto F (2001) Distinct Localization of P2X receptors at excitatory postsynaptic
specializations. J Neurosci 21:641-53.
68
Sarto I, Klausberger T, Ehya N, Mayer B, Fuchs K, Sieghart W (2002) A novel site on gamma 3
subunits important for assembly of GABA(A) receptors. J Biol Chem 277:30656–30664.
Sarto-Jackson I, Ramerstorfer J, Ernst M, Sieghart W (2006) Identification of amino acid residues
important for assembly of GABA receptor alpha1 and gamma2 subunits. J Neurochem 96:983-995.
Sarto-Jackson I, Furtmueller R, Ernst M, Huck S, Sieghart W (2007) Spontaneous cross-link of
mutated alpha1 subunits during GABA(A) receptor assembly. J Biol Chem 282:4354-4363.
Schicker K, Hussl S, Chandaka GK, Kosenburger K, Yang JW, Waldhoer M, Sitte HH, Boehm S
(2009) A membrane network of receptors and enzymes for adenine nucleotides and nucleosides.
Biochim Biophys Acta 1793:325-334.
Sieghart W (1995) Structure and pharmacology of gamma-aminobutyric acid A receptor subtypes.
Pharmacol Rev 47:181-234.
Sokolova E, Nistri A, Giniatullin R (2001) Negative cross talk between anionic GABAA and cationic
P2X ionotropic receptors of rat dorsal root ganglion neurons. J Neurosci 21:4958-4968.
Souslova V, Cesare P, Ding Y, Akopian AN, Stanfa L, Suzuki R, Carpenter K, Dickenson A, Boyce S,
Hill R, Nebenuis-Oosthuizen D, Smith AJ, Kidd EJ, Wood JN (2000) Warm-coding deficits and
aberrant inflammatory pain in mice lacking P2X3 receptors. Nature 407:1015-1017.
Sperk G, Schwarzer C, Tsunashima K, Fuchs K, Sieghart W (1997) GABA(A) receptor subunits in the
rat hippocampus I: immunocytochemical distribution of 13 subunits. Neuroscience 80:987-1000.
Todd AJ, Watt C, Spike RC, Sieghart W (1996) Colocalization of GABA, glycine, and their receptors
at synapses in the rat spinal cord. J Neurosci 16:974-982.
Toulmé E, Blais D, Léger C, Landry M, Garret M, Séguéla P, Boué-Grabot E (2007) An intracellular
motif of P2X(3) receptors is required for functional cross-talk with GABA(A) receptors in nociceptive
DRG neurons. J Neurochem 102:1357-1368.
Tretter V, Ehya N, Fuchs K, Sieghart W (1997) Stoichiometry and assembly of a recombinant
GABAA receptor subtype. J. Neurosci 17: 2728–2737.
Triller A, Choquet D (2005) Surface trafficking of receptors between synaptic and extrasynaptic
membranes: and yet they do move! Trends Neurosci 28:133-139.
Triller A, Choquet D (2008) New concepts in synaptic biology derived from single-molecule imaging.
Neuron 59:359-374.

69
Trujillo CA, Nery AA, Martins AH, Majumder P, Gonzalez FA, Ulrich H (2006) Inhibition
mechanism of the recombinant rat P2X(2) receptor in glial cells by suramin and TNP-ATP.
Biochemistry 45:224-233.
Wang H, Bedford FK, Brandon NJ, Moss SJ, Olsen RW (1999) GABA(A)-receptor-associated protein
links GABA(A) receptors and the cytoskeleton. Nature 397:69-72.
Wirkner K, Sperlagh B, Illes P (2007) P2X3 receptor involvement in pain states. Mol Neurobiol
36:165-183.
Xia Z, Liu Y (2001) Reliable and global measurement of fluorescence resonance energy transfer using
fluorescence microscopes. Biophys J 81:2395-2402.
Zeilhofer HU, Zeilhofer UB (2008) Spinal dis-inhibition in inflammatory pain. Neurosci Lett 437:170-
174.
Zeilhofer HU, Möhler H, Di Lio A (2009) GABAergic analgesia: new insights from mutant mice and
subtype-selective agonists. Trends Pharmacol Sci 30:397-402.
Zezula J, Sieghart W (1991) Isolation of type I and type II GABAA benzodiazepine receptors by
immunoaffinity chromatography. FEBS Lett 284:15-18.
Zhou X, Galligan JJ (1998) Non-additive interaction between nicotinic cholinergic and P2X purine
receptors in guinea-pig enteric neurons in culture. J Physiol 513:685-697.
Zou S, Li L, Pei L, Vukusic B, Van Tol HH, Lee FJ, Wan Q, Liu F (2004) Protein-protein
coupling/uncoupling enables dopamine D2 receptor regulation of AMPA receptor-mediated
excitotoxicity. J Neurosci 25:4385-4395.

70
CURRICULUM VITAE

AMULYA NIDHI SHRIVASTAVA
Center for Brain Research,
Medical University of Vienna
Spitalgasse 4, Vienna, 1090, Austria
Ph: (+43)(0)6505420301
Education & Training:
Jan 2007-Nov 2010 (expected): PhD (Medical University of Vienna, Austria)
Thesis: Cellular & Molecular Neuroscience (Prof. Werner Sieghart´s group)
Successfully carried two independent research projects as part of thesis.
Experience in training students, giving lectures and presentations.
Developed collaboration with national and international labs.
July 2009-Dec 2009: Visiting student (Ecolé Normale Supérieure, Paris, France)
Project: Advanced Microscopy (Prof. Antoine Triller´s group)
Performed a part of PhD thesis project with high productivity.
Jan 2003-Dec 2006: Bachelor of Engineering (Birla Institute of Technology, Mesra, India)
Thesis: Biotechnology
Consistently scored above 85% in all eight semesters (aggregate 89.4%).
2nd rank in department after four years of study.
Excellent curriculum provided training in biological sciences, chemical
engineering, and basic engineering studies.
May 2006-July 2006: Summer Internship (National Center for Biological Sciences, India)
Project: Behavior Neuroscience (Prof. Obaid Siddiqi´s group)
Among five applicants selected for summer internship.
Completed a short summer project in due time.
May 2005-June 2005: Summer Internship, (National Institute of Oceanography, Goa, India)
Project: Marine Pollution (Prof. Anupam Sarkar´s group)
First exposure to scientific research.
Efficient and rapid performance resulted in a scientific publication.
Mar 1999-July 2001: Senior Secondary School (D.A.V. Public School, Jhinkpani, India)
Subjects: Physics/Chemistry/Biology/Mathematics
School topper with 83.6% marks

72
Academic Achievements:
(2010) Selected for International Federation of Societies for Microscopy´s travel grant to
attend 17th International Microscopy Congress in Rio de Janeiro, Brazil.
(2008-2010) Member of organizing committee, 1st-3rd International workshop on “Cell
Communication in Health & Disease”, Vienna, Austria
(2006) Selected for prestigious international PhD program, Vienna, Austria
(2006) Selected as PhD student at Manchester centre for integrative systems biology, UK
(2006) Selected as junior software engineer in Accenture, India
(2003) Selected among top 50 candidates for engineering admission at BIT Mesra, India
(2001) Examination center topper in mathematics & physics Olympiad, India
Scientific Presentations:
Sep´10 (Oral): 17th International Microscopy Congress, Rio de Janeiro, Brazil
Oct´09 (Oral): 39th Annual Neuroscience Meeting, Chicago, USA.
Jun´09 (Poster): 5th Young Scientist Association Meeting, Vienna, Austria.
May´08 (Poster): 4th Young Scientist Association Meeting, Vienna, Austria.
Dec´07 (Poster): New York Academy of Science Meeting, London, UK.
Jun´07 (Poster): 3rd Young Scientist Association Meeting, Vienna, Austria.
Scientific Publication:
Shrivastava AN, Triller A, Sieghart W and Sarto-Jackson I; Regulation of GABAA receptor
dynamics by interaction with P2X2 receptors. Submitted (2010).
Sarkar A, Ray D, Shrivastava AN and Sarker S; Molecular Biomarkers: Its significance
and application in Marine Pollution Monitoring. Ecotoxicology. 2006 May; 15(4):333-40.
Personal Details:
Date of Birth: 21st September 1983
Nationality: INDIAN
Sex: Male
Interests: I like photographing a mix between nature and human creation.
(http://www.flickr.com/photos/shriv/)