The Role of Purinergic P2X7 Receptor in Inflammation ... - MDPI
Upload
independentCategory
view
1download
0
ORIGINAL PAPER
Acute Restraint Stress in Zebrafish: Behavioral Parametersand Purinergic Signaling
Angelo L. Piato • Denis B. Rosemberg • Katiucia M. Capiotti •
Anna M. Siebel • Ana P. Herrmann • Gabriele Ghisleni •
Monica R. Vianna • Maurıcio R. Bogo • Diogo R. Lara • Carla D. Bonan
Accepted: 12 May 2011 / Published online: 21 May 2011
� Springer Science+Business Media, LLC 2011
Abstract Despite the extensive knowledge about the
effects of acute restraint stress (ARS) in rodents, zebrafish
research is still elementary in this field, and the conse-
quences of stress on purinergic system are unclear.
Therefore, we evaluated the effects of ARS on behavior,
biochemical, and molecular parameters in zebrafish brain.
Animals were submitted to a 90 min ARS protocol and
tested for anxiety levels, exploratory behavior, and mem-
ory performance. Furthermore, we analyzed ectonucleoti-
dase and adenosine deaminase activities and their gene
expression profile, as well as transcription of adenosine
receptors. ARS increased anxiety, but did not impair
locomotion or cognition. ARS significantly increased ATP
hydrolysis, decreased cytosolic ADA activity, and changed
the entpd and adora gene expression. In conclusion, ARS
disturbed zebrafish behavior, and we hypothesize that the
augmentation in adenosine-mediated signaling may be a
strategy to reestablish homeostasis and normal behavior
after a stressful event.
Keywords Zebrafish � Acute restraint stress (ARS) �Behavior � Memory � Nucleotide hydrolysis � Adenosine
A. L. Piato (&) � K. M. Capiotti � A. M. Siebel � G. Ghisleni �D. R. Lara � C. D. Bonan
Laboratorio de Neuroquımica e Psicofarmacologia,
Departamento de Biologia Celular e Molecular, Programa de
Pos-Graduacao em Biologia Celular e Molecular, Faculdade de
Biociencias, Pontifıcia Universidade Catolica do Rio Grande do
Sul, Avenida Ipiranga, 6681, Predio 12D, sala 340, Porto Alegre,
RS 90619-900, Brazil
e-mail: [email protected]
A. L. Piato � D. R. Lara
Programa de Pos-Graduacao em Medicina e Ciencias da Saude,
Pontifıcia Universidade Catolica do Rio Grande do Sul, Avenida
Ipiranga, 6690, Porto Alegre, RS 90610-000, Brazil
D. B. Rosemberg � A. P. Herrmann
Programa de Pos-Graduacao em Bioquımica, Departamento de
Bioquımica, Instituto de Ciencias Basicas da Saude,
Universidade Federal do Rio Grande do Sul, Rua Ramiro
Barcelos 2600-Anexo, Porto Alegre, RS 90035-003, Brazil
M. R. Vianna
Laboratorio de Biologia e Desenvolvimento do Sistema
Nervoso, Departamento de Biologia Celular e Molecular,
Programa de Pos-Graduacao em Biologia Celular e Molecular,
Faculdade de Biociencias, Pontifıcia Universidade Catolica do
Rio Grande do Sul, Avenida Ipiranga, 6681, Porto Alegre,
RS 90619-900, Brazil
M. R. Bogo
Laboratorio de Biologia Genomica e Molecular, Departamento
de Biologia Celular e Molecular, Programa de Pos-Graduacao
em Biologia Celular e Molecular, Faculdade de Biociencias,
Pontifıcia Universidade Catolica do Rio Grande do Sul, Avenida
Ipiranga, 6681, Porto Alegre, RS 90619-900, Brazil
D. B. Rosemberg
Instituto Nacional de Ciencia e Tecnologia em Excitotoxicidade
e Neuroprotecao (INCT-EN), Porto Alegre, RS 90035-003,
Brazil
K. M. Capiotti � A. M. Siebel � M. R. Vianna �M. R. Bogo � C. D. Bonan
Instituto Nacional de Ciencia e Tecnologia Translacional em
Medicina (INCT-TM), Porto Alegre, RS 90035-003, Brazil
123
Neurochem Res (2011) 36:1876–1886
DOI 10.1007/s11064-011-0509-z
Introduction
Zebrafish (Danio rerio) is a prominent model organism
widely used in neurobiology studies [1–3]. Larval and
especially adult zebrafish display a complex repertoire of
behaviors, making their characterization particularly rele-
vant. In contrast to other laboratory vertebrate models,
zebrafish is a naturally social species that show preference
for shoaling and depend on mutual responses to environ-
mental cues and challenges [4]. Moreover, since zebrafish
genes have a syntenic relationship with those of humans [5,
6], this complementary vertebrate model represents an
excellent organism to probe the genetics of behavior [7, 8].
In this species, behavior can be easily observed and
quantified in controlled environments [25, 63, 64]. The
behavioral repertoire of zebrafish is diversified and enables
the development of a series of behavioral parameters [28, 65,
66], which has led to increasing interest for zebrafish as a
model organism in behavioral and pharmacological
research. A number of anxiety-related behaviors has been
characterized in this species [4, 25–27]. For example, zeb-
rafish have a natural tendency to initially remain at the bot-
tom of a novel environment (e.g., a test tank) and then
gradually, over a few minutes, explore the higher portions of
the test tank [25, 27]. The anxiety response of zebrafish also
includes forming stronger shoal cohesion and freezing [7, 28,
67]. Besides, Gerlai et al. [28] reported that increased color
intensity was associated with aggressiveness. Recently,
Gebauer et al. [62] and Piato et al. [24] developed the Group
Behavior Task protocol. This protocol allows to simulta-
neously evaluate shoal cohesion, height in the tank and
locomotion, which are parameters related to anxiety in
zebrafish. These simple behavioral parameters present the
ability to detect distinct and common behavioral changes
induced by different anxiolytic drugs, and therefore are
useful to assess anxiety in zebrafish. Furthermore, the char-
acterization of zebrafish behavior is important to the gener-
ation of large-scale behavioral screenings and to investigate
how different events may affect behavior, adding to the study
of brain function. Finally, it is important to investigate
whether complex behavioral repertories, such as anxiety,
exploration, social cohesion, and memory are influenced by
stress, as well as to verify which neurotransmitter signaling
systems could be related to acute stress responses.
The involvement of several neurotransmitter systems has
been studied in animals subjected to restraint stress in dif-
ferent protocols, immobilization frequencies and intensi-
ties, among other factors [9]. The relationship between
purinergic system and restraint stress has been widely
studied in rodents [10–13]. In the purinergic system, ATP
and its metabolites ADP and adenosine produce a wide
range of physiological effects that are not necessarily
related with their role in energy metabolism. It has become
clear that purines participate in both the central and
peripheral nervous system signaling. Extracellular nucleo-
tides and adenosine act on purinergic receptors that are
divided into two classes, P1 and P2. The P1 receptors are G
protein-coupled receptors (GPCRs) while P2 receptors
consist both of P2X receptors, which are ligand-gated ion
channels, and of P2Y receptors, which are GPCRs [14–16].
Once released in the synaptic cleft, extracellular nucleotides
can be hydrolyzed by a variety of soluble or cell-surface-
located enzymes known as ectonucleotidases [17]. Tri- and
diphosphonucleosides may be hydrolyzed by ectonucleo-
side triphosphate diphosphohydrolase (E-NTPDase) family
members, whereas ecto-50-nucleotidase cleaves AMP into
the nucleoside adenosine [18]. In this way, ectonucleotidase
cascade plays a pivotal role in controlling the availability of
ligands (ATP, ADP, AMP and adenosine) for both nucle-
otide and nucleoside receptors and, consequently, the extent
and duration of receptor activation [19]. Therefore, this is
an enzymatic pathway with a dualistic function: removing
one signaling molecule, ATP, and generating a second one,
adenosine, a well-known neuromodulator [18, 20, 21].
Adenosine acts via P1 metabotropic receptors (A1, A2A, A2B
and A3), reducing excessive neuronal activity through
inhibitory A1 receptors [22, 23].
Despite widespread knowledge of the stress responses in
mammals, data concerning the relationship between acute
stress and its effects on purinergic signaling are limited.
Moreover, the acute response to restraint stress in zebrafish
is still unclear. Therefore, the purpose of this study was to
evaluate the effects of acute restraint stress (ARS) on
behavioral parameters and purinergic signaling in zebrafish.
Experimental Procedure
Animals and Housing
Adult male wild type (short fin) zebrafish (D. rerio)
(6–8 months-old) were obtained from a commercial sup-
plier (Red Fish, Porto Alegre, Brazil) and were acclimated
for at least 14 days in the experimental room. Animals
were housed in groups of 20 fish in 15 l thermostated
(26 ± 2�C) tanks kept under constant chemical and
mechanical water filtration. Fish were maintained under a
14–10 h day/night photoperiod cycle and fed three times a
day with commercial flakes (TetraMin�, NC, USA) and
supplemented with live brine shrimp. All protocols were
approved by the Institutional Animal Care Committee
(09/00126, CEUA–PUCRS) and followed Brazilian legis-
lation, the guidelines of the Brazilian Collegiums of Ani-
mal Experimentation (COBEA), and the Canadian Council
for Animal Care (CCAC) Guide on the Care and Use of
Fish in Research, Teaching, and Testing.
Neurochem Res (2011) 36:1876–1886 1877
123
Chemicals
Trizma Base, ammonium molybdate, polyvinyl alcohol,
Malachite Green, nucleotides, EDTA, EGTA, sodium cit-
rate, Coomassie Blue G, bovine serum albumin, and cal-
cium chloride were purchased from Sigma (St. Louis, MO,
USA). TRIzol, SuperScriptTM III First-Strand Synthesis
SuperMix, Taq Platinum, GelRed and Low DNA Mass
Ladder were purchased from Invitrogen (Carlsbad, CA,
USA). All other reagents used were of high analytical
grade.
Acute Restraint Stress Protocol
Following the habituation period, fish were submitted to
the ARS protocol. This experiment consisted in keeping
each animal enclosed into microcentrifuge plastic tubes of
2 ml with the cap closed and small openings in both ends to
allow free water circulation inside the tube and completely
avoid fish locomotion. A control group was maintained in
the same experimental conditions with no restraint stress.
Aeration (8 ppm, Labcom Test�—Camboriu, SC, Brazil)
and water temperature (26 ± 2�C) were controlled
throughout the test. In preliminary experiments, groups of
animals were submitted to different time periods of ARS
(15, 45, 60 or 90 min) for protocol standardization. Since
crf gene expression was altered only after 90 min of con-
finement, all experiments were performed using this time
interval, which also showed an increase in whole-body
cortisol levels (unpublished data). Separated sets of control
and restrained animals were used to perform behavioral,
biochemical, and molecular analyses. Stressed animals
were tested immediately after ARS on behavioral tasks. On
each session, control and stressed animals were gently
captured from the housing tank using a 6 cm wide fine
nylon mesh fish net and those undergoing stress were
carefully placed in the behavioral apparatus.
Behavioral Apparatus
Immediately after ARS, 4 groups of three fish (n = 12)
were subjected for 10 min to the Group Behavior Task
(GBT) [24]. GBT consists in simultaneously analyzing
height in the tank, locomotion, color, and shoal cohesion.
The behavioral apparatus consisted in a 2.7 l tank (dimen-
sions of 24 9 8 9 20 cm—length 9 width 9 height) with
15 cm of water level. ARS procedure was executed by a
researcher and scores were attributed by another two
trained blind observers (inter-reliability rate C0.90) at min
1, 2, 3, 4, 5, and 10. The mean value of the scores in the
10 min period was calculated for each fish. Water tem-
perature was constantly regulated by thermostats. To
reduce the influence of the surrounding area and also to
facilitate observation, the lateral and back sides of the tank
were visually blocked with a white opaque self-adhesive
plastic film. One week after stress, all fish were retested in
the behavioral apparatus aiming to evaluate the potential
residual effect of stress in the animals.
Behavioral Scores in the Group Behavior Task
Height in the Tank
The position (bottom x middle x upper levels) was con-
sidered an index of anxiety, similar to the position near the
wall versus the center of the open field test performed with
rodents [25–27]. Fish position in the experimental tank was
noted according to the following scores during 1 min
observations: 1—only in the bottom third of the tank;
2—preference for the lower two thirds of the tank;
3—similar times exploring the three thirds; 4—preference
for the upper two thirds; 5—only in the upper third. This
score has a 0.90 correlation (Spearman test) with an
objective measure using stopwatch performed by separate
and independent observers blinded to each other results.
Locomotion
Locomotor activity was used as a general index of
behavioral excitation/inhibition. Activity was evaluated by
comparing to control fish, using the following scores:
1—virtually immobile; 2—slower than normal; 3—normal;
4—increased locomotion; 5—intense locomotion. This
score has a 0.50 correlation (Spearman test) with an
objective measure using crossing counts (frontal area of the
tank divided in 9 rectangles) performed by separate and
independent observers blinded to each others’ results.
Color
Zebrafish change their color in response to certain stimuli.
Fish that exhibit signs of fear (e.g., freezing or erratic
movements) quickly become pale, especially when the
background is light. When fish are more stressed or
aggressive, they become more chatoyant [28]. Fish color
was rated visually by comparing to control fish and scored
as follows: 1—pale; 2—lighter than normal but not pale;
3—normal; 4—darker than normal but not chatoyant with
dark-blue stripes; 5—chatoyant with dark-blue stripes.
Shoal Cohesion
Zebrafish display a preference for swimming in groups and
fish aggregation is termed shoal cohesion [4, 29, 30]. This
behavioral strategy is thought to be effective against pre-
dators in several fish species [28, 31]. In contrast to other
1878 Neurochem Res (2011) 36:1876–1886
123
studies using only a single fish during experiments, a group
of three animals was tested in the experimental tank, which
allows the maintenance of their natural shoal behavior.
Shoal cohesion was measured by comparing to control fish
according to the following scores: 1—complete lack of
group cohesion or fish interaction; 2—loose or partial
shoaling behavior; 3—normal distance and shoaling
behavior; 4—increased shoal cohesion. This score has a
-0.81 correlation (Spearman test) with an objective mea-
sure of distance between the 3 fish (using Image J software)
in pictures extracted from video recordings every 15 s for
5 min. This analysis was performed by separate and inde-
pendent observers blinded to each others’ results.
Inhibitory Avoidance Protocol
Long-term memory was evaluated by using the inhibitory
avoidance (IA) protocol previously described in detail [32].
Immediately after ARS, another set of animals (control and
restrained groups, n = 12) were individually trained and
tested in a white/dark compartment IA apparatus, followed
by memory extinction. Briefly, on each session, animals
were gently placed in the white tank compartment while
the sliding partition between both compartments was
closed. After 1 min of habituation and orientation, the
partition was raised, allowing fish to cross to the dark side
of the tank through a 1 cm high opening. On training
session, the sliding partition was closed immediately after
crossing to the dark compartment and a pulsed electric
shock of 3 ± 0.2 V AC administered for 5 s, after which
fish were removed from the apparatus. Twenty-four hours
after training, animals were submitted to a test session that
repeated the training protocol except that no shock was
administered and the sliding partition was kept open,
allowing animals to freely explore the apparatus for 1 min
after crossing to the dark side for the first time, initiating
memory extinction. The test session was followed by two
identical extinction sessions with a 24 h-interval each. The
latency to enter the dark compartment was measured in all
sessions and the test and extinction latencies were used as
an index of retention and extinction, respectively.
Biochemical and Molecular Analyses
Sample Preparation
Immediately after the ARS, groups of animals (control and
stressed fish) were cryoanaesthetized and euthanized [33].
The brains were removed by dissection and added to 60
volumes (v/w) of chilled Tris-citrate buffer (50 mM Tris-
citrate, 2 mM EDTA, 2 mM EGTA, pH 7.4, adjusted with
citric acid) for NTPDase and ecto-50-nucleotidase assays
[34, 35]. For ADA activity experiments, brains were
homogenized in 20 volumes (v/w) of chilled phosphate
buffered saline (PBS), with 2 mM EDTA, 2 mM EGTA,
pH 7.4 [36]. Each independent experiment was performed
using biological preparations consisted by a ‘‘pool’’ of five-
whole brains. The preparation of brain membranes was
according to a previously described method [37]. Briefly,
samples were homogenized on ice in a motor-driven Tef-
lon-glass homogenizer. The preparations were centrifuged
at 800 g for 10 min at 4�C to remove the nuclei and cell
debris and the supernatant fractions were subsequently
centrifuged at 40,000 g for 25 min. The resultant super-
natant and the pellet obtained corresponded to the cytosolic
and membrane fractions, respectively. For soluble ADA
activity experiments, the supernatant was collected and
kept on ice for enzyme assays. The pellets of both mem-
brane preparations were frozen in liquid nitrogen, thawed,
resuspended with the respective buffers and centrifuged at
40,000 g for 20 min. This freeze–thaw-wash procedure
was used to ensure the lysis of the brain vesicles mem-
branes. The final pellets were resuspended and used for the
measurements of ectonucleotidase and ecto-ADA activi-
ties. All cellular fractions were maintained at 2–4�C
throughout preparation and they were immediately used for
enzyme assays.
Nucleotide Hydrolysis Assays
Ectonucleotidase activities were determined as previously
described [34, 35]. Brain membranes (3–5 lg protein) were
added to the reaction mixture containing 50 mM Tris–HCl
(pH 8.0) and 5 mM CaCl2 (for NTPDase activities) and
50 mM Tris–HCl (pH 7.2) and 5 mM MgCl2 (for ecto-50-nucleotidase activity) in a final volume of 200 ll. The
samples were preincubated for 10 min at 37�C before
starting the reaction with the addition of substrate (ATP,
ADP or AMP) to a final concentration of 1 mM. The
reactions were stopped after 30 min with the addition of
trichloroacetic acid at a final concentration of 5% and
immediately placed on ice for 10 min. The inorganic
phosphate (Pi) released was determined by colorimetric
assay using Malachite Green reagent [38] and KH2PO4 as
standard. To ensure that the concentration of Pi was within
the linear range, dilutions of 1:8 and 1:2 to a volume of
400 ll were performed for the assessment of ATP and
ADP hydrolysis, respectively. Samples were mixed to 1 ml
of Malachite Green solution and nucleotide hydrolysis was
determined spectrophotometrically at 630 nm after 20 min.
Controls with the addition of the enzyme preparation after
incubation period were used to correct non-enzymatic
hydrolysis of substrates. Incubation times and protein
concentrations were chosen to ensure the linearity of the
reactions. NTPDase and ecto-50-nucleotidase activities
were expressed as nmol Pi min-1 mg protein-1.
Neurochem Res (2011) 36:1876–1886 1879
123
Adenosine Deaminase Activity
Ecto and cytosolic ADA activities were determined as
previously reported [36]. The membrane and cytosolic
fractions (5–10 lg protein) were added to the reaction
mixture containing 50 mM sodium acetate buffer (pH 5.0)
and 50 mM sodium phosphate buffer (pH 7.0), respec-
tively, in a final volume of 200 ll. The samples were
preincubated for 10 min at 37�C and the reaction was
started with the addition of adenosine to a final concen-
tration of 1.5 mM. After incubation for 120 min (mem-
branes) and 75 min (cytosolic fraction), reactions were
terminated with 500 ll of phenol-nitroprusside reagent
(50.4 mg of phenol and 0.4 mg of sodium nitroprusside/
ml). All samples were immediately mixed to 500 ll of
alkaline-hypochlorite reagent (sodium hypochlorite to
0.125% available chlorine, in 0.6 M NaOH) and vortexed,
followed by an incubation period of 15 min at 37�C. The
ammonia produced over a fixed time by the Berthelot
reaction was determined in a spectrophotometer at 635 nm.
Controls with the addition of the enzyme preparation after
incubation period were used to correct non-enzymatic
hydrolysis of the nucleoside. Incubation times and protein
concentrations were chosen to ensure the linearity of the
reactions. Both ecto and cytosolic ADA activities were
expressed as nmol NH3 min-1 mg protein-1.
Protein Measurement
Protein concentration was measured by the Coomassie blue
method [39], with bovine serum albumin as a protein
standard.
Primer Design and RT–PCR Experiments
Specific entpd1, entpd2, entpd2a.1, entpd2a.2, entpd3,
nt5e, and ada1 primers were designed and used as descri-
bed previously by our group [40–42]. The well known
adenosine receptor sequences (ADORA) from human and
mouse were used as queries to search homologous zebra-
fish protein-related sequences. The GenBank data base
allowed the identification of four orthologues genes
(adora1, adora2a.1, adora2a.2, and adora2b), which were
aligned using the ClustalX program. Regions with low
scores for similarity among the sequences were used to
search for specific primers, which were designed using the
program Oligos 9.6. The primer specificities were checked
by comparing each primer with the zebrafish genome to
confirm that it would recognize only its specific target
sequence. Thus, the strategy adopted to design the primers
avoided cross-amplification. The b-actin primers used here
were previously described [43] and the optimal PCR con-
ditions for amplifications were determined (Table 1).
After euthanasia, zebrafish brains were dissected under
sterile conditions and immediately subjected to a total
RNA extraction by the TRIzol method according to the
manufacturer’s instructions. The purity of the RNA was
spectrophotometrically quantified by calculating the ratio
between absorbance values at 260 and 280 nm and its
integrity was confirmed by electrophoresis through a 1%
agarose gel. All samples were adjusted to 160 ng/ll and
cDNA species were synthesized using SuperScriptTM III
First-Strand Synthesis SuperMix.
PCR conditions were optimized in order to determine
the number of cycles that would allow product detection
within the linear phase of band intensities analyzed. The
reactions were performed in a final volume of 20 ll, using
0.1 lM primers (Table 1), 0.2 lM dNTP, 2 mM MgCl2and 0.5 U Taq Platinum for b-actin and nt5e amplification.
The same conditions were employed for the PCR of ent-
pd2-related genes and entpd3, with the addition of 1 M
betain used for amplification of the entpd2 genes. For
entpd1 reaction, 3 mM MgCl2 and 1 M betain were used.
The ada1 PCR assays were carried out using 0.08 lM
primers, 0.2 lM dNTP, 3 mM MgCl2, 1 M betain, and 1 U
Taq Platinum, in a final volume of 25 ll. The same con-
ditions were adopted for evaluating the relative gene
expression of adenosine receptors (adora), except that
2.5 mM MgCl2 was employed. All PCR experiments were
performed using 1 ll of template cDNA.
The following PCR conditions were used: 1 min at
94�C, 1 min at the annealing temperature (see Table 1),
and 1 min at 72�C for 35 cycles with a further post-
extension cycle at 72�C for 10 min. For each set of PCR
experiment, a negative control was included. The amplified
products were separated on a 1% agarose gel with GelRed
109 staining and visualized with ultraviolet light. The
fragment lengths expected for the reactions were checked
using Low DNA Mass Ladder and b-actin amplification
was used as an internal standard. In order to confirm cDNA
sequences amplified in RT–PCR reactions, the putative
genes products were sequenced in both directions using
Mega Base 1000 automatic sequencer. Resulting chro-
matograms were analyzed and cDNA sequences were also
blasted using NCBI-BLAST searches of GenBank, con-
firming the identity and specificity of each sequence
amplified (data not shown). Band intensities were analyzed
by optical densitometry using the software Image J 1.37 for
Windows after running all PCR products in a single gel.
Statistical Analysis
Behavioral scores in GBT were expressed as medians
[interquartile ranges] and evaluated by Kruskal–Wallis non-
parametric analysis of variance. Comparisons between two
specific groups were performed by Mann–Whitney U test.
1880 Neurochem Res (2011) 36:1876–1886
123
Inhibitory avoidance data were expressed as mean ±
S.E.M and analyzed by independent Student t test. Bio-
chemical and molecular assays were performed in triplicate
and mean ± S.E.M. of at least three independent experi-
ments were presented. Data were analyzed by Student t test.
In all comparisons, significance was set at P \ 0.05. All
data were evaluated by SPSS 18.0 for Windows.
Results
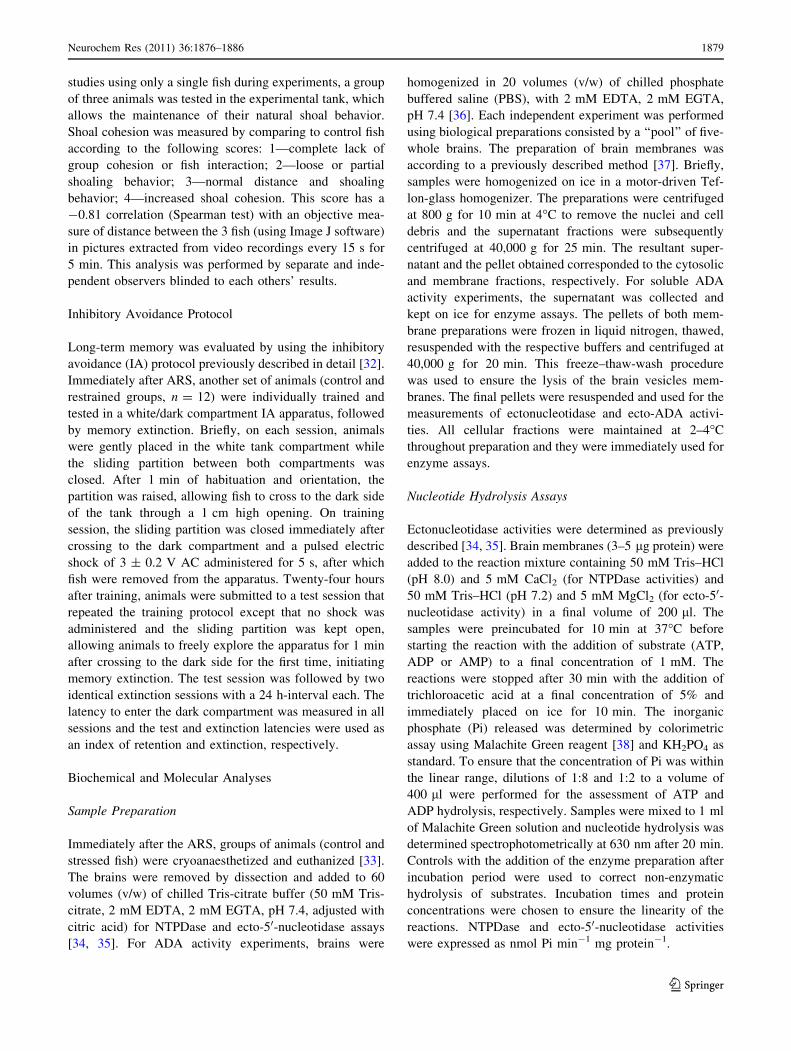
After the ARS protocol, the GBT (Fig. 1) demonstrated
that stressed animals showed a lower score of height in the
tank as compared to the control group during 10 min of
analysis (Kruskal–Wallis test, P \ 0.0001, n = 12). In
addition, stressed fish were significantly darker than control
(Kruskal–Wallis test, P \ 0.0001, n = 12). On the other
hand, locomotion and shoaling scores did not differ
between experimental groups. One week after the ARS, all
GBT parameters were normalized, with height in the tank,
locomotion, color, and shoal cohesion scores similar to
basal levels (data not shown).
Table 1 PCR primers design for entpd, nt5e, ada1, adora, -actin genes and GeneBank protein ID
Gene Primer sequences (5’-3’) Annealing PCR fragment (bp) Protein ID
entpd1 CCCATGGCACAGGCCGGTTG (forward) 54 380 AAH78240
GCAGTCTCATGCCAGCCGTG (reverse)
entpd2a GGAAGTGTTTGACTCGCCTTGCACG (forward) 62 554 XP_697600
CAGGACACAAGCCCTTCCGGATC (reverse)
entpd2a.1b GCTCATTTAGAGGACGCTGCTCGTG (forward) 62 263 AAH78419
GCAACGTTTTCGGCAGGCAGC (reverse)
entpd2a.2c CCAGCGGATTTAGAGCACGCTG (forward) 62 313 XP_687722
GAAGAACGGCGGCACGCCAC (reverse)
entpd3 TACTTTCTTTGGACAGAGCAACCCTG (forward) 62 424 ABR15509
AAGCATATAGCCCAGGGACCAGG (reverse)
nt5e ACCTCCGAGGAGTGTCGCTTTCG (forward) 54 433 NP_957226
CCTTGTTGGGGACCAGCGGTTC (reverse)
ada1 CAGGTCCATTCTGTGCTGCATGCGTC (forward) 58 283 AAH76532
AAGTGTGTGGTATCCGTGCCCAATGC (reverse)
adora1 ACAAGAAGGTGTCCAGTCATTCGGAACC (forward) 62 312 CAQ15299
TATCAGGAGGCGGAGCTTCCTTGC (reverse)
adora2a.1 AAAGTCAACGGTCTGGTGCGCGAAC (forward) 62 284 AAX63345
AGAGCTGATTTAATATGAAGCGGCGAG (reverse)
adora2a.2 CAATGGGAGGCATGACAGCGTCGTCG (forward) 62 364 AAX63346
AGATGAGTTGCTTGTTCTTACGGGCATC (reverse)
adora2a.b GCCTCTCCTCATCATGCTGGGCATC (forward) 62 343 AAX63347
CCTAAAAGTGACTCTGAACTCCCGAATGC (reverse)
-actin* GTCCCTGTACGCCTCTGGTCG (forward) 54 678 AAC13314
GCCGGACTCATCGTACTCCTG (reverse)
a Encode NTPDase2_mg, b NTPDase2_mv, and c NTPDase2_mq protein sequences [40–42]
* PCR primer sequences previously described [43]
Fig. 1 Group Behavior Task (GBT) in zebrafish. The behavioral
analyses were performed by evaluating three animals from each group
(control and restraint stress) at the same time in a single a novel tank
divided into three vertical areas during a 10 min period. Represen-
tative scores were attributed for each parameter assessed: height in the
tank, locomotion, color intensity, and shoal behavior. Graphsrepresent median [interquartile ranges] (n = 12). Data were analyzed
by Kruskal–Wallis non-parametric analysis of variance and compar-
isons between two specific groups were performed by Mann–Whitney
U-test, considering P \ 0.05 as significant. *Significant differences
compared to the respective control group
Neurochem Res (2011) 36:1876–1886 1881
123
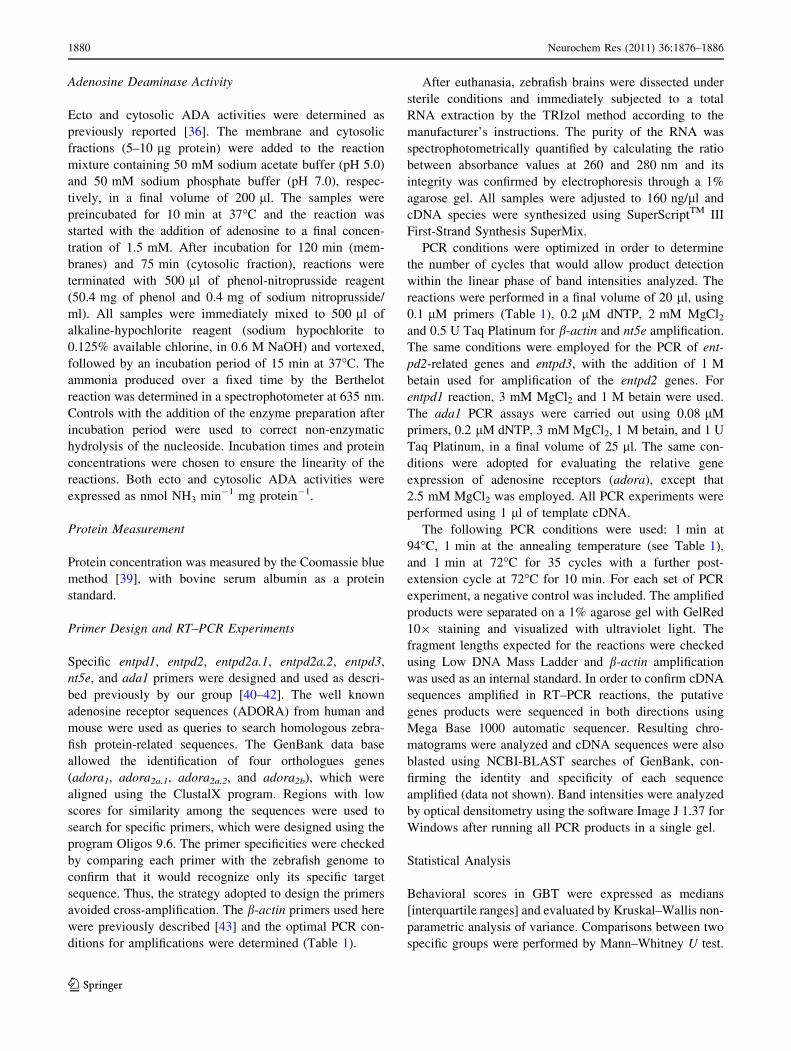
Concerning the IA task (Fig. 2), control and restrained
groups showed significant long-term memory retention
when training and test sessions were compared (P \ 0.01).
Both experimental groups were able to extinct aversive
memory 3 days after training, when latencies reached
levels as low as those of training session. The results also
demonstrated that ARS did not interfere with animals
natural tendency to seek dark environments, evaluated
during the training session (P [ 0.05) when no significant
difference between groups was observed.
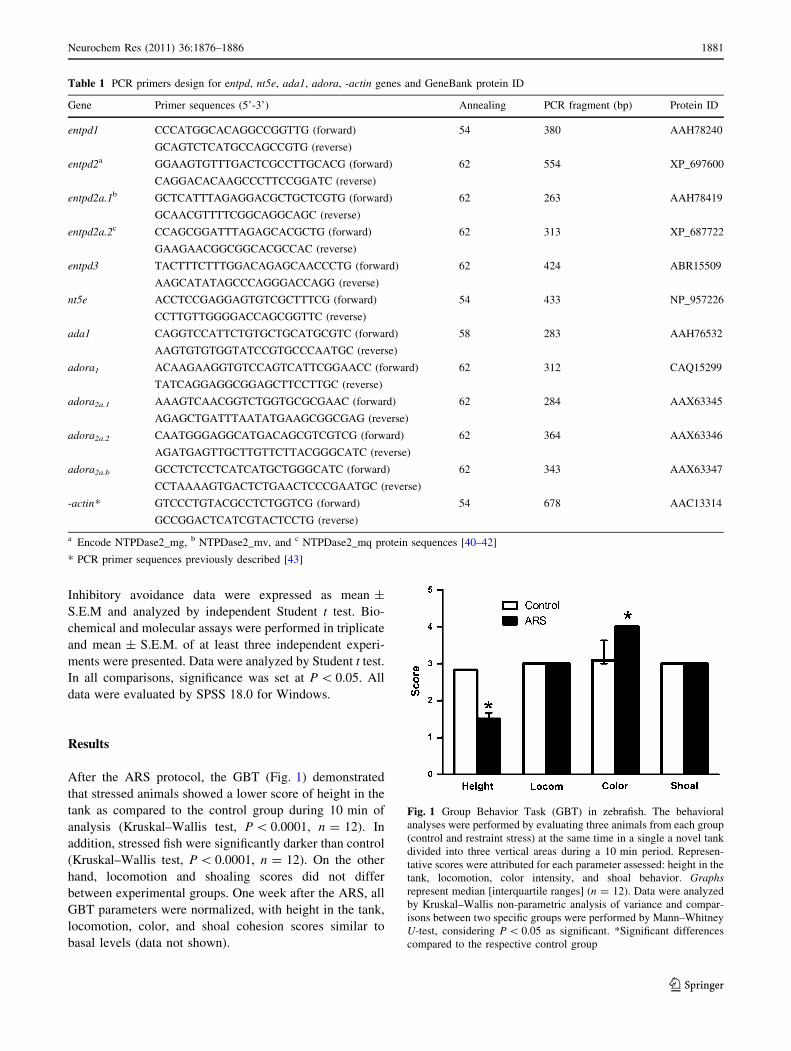
As shown in Fig. 3, ARS promoted a significant increase
on ATP hydrolysis (47%, n = 7) in zebrafish brain mem-
branes after 90 min of confinement. In contrast, ADP and
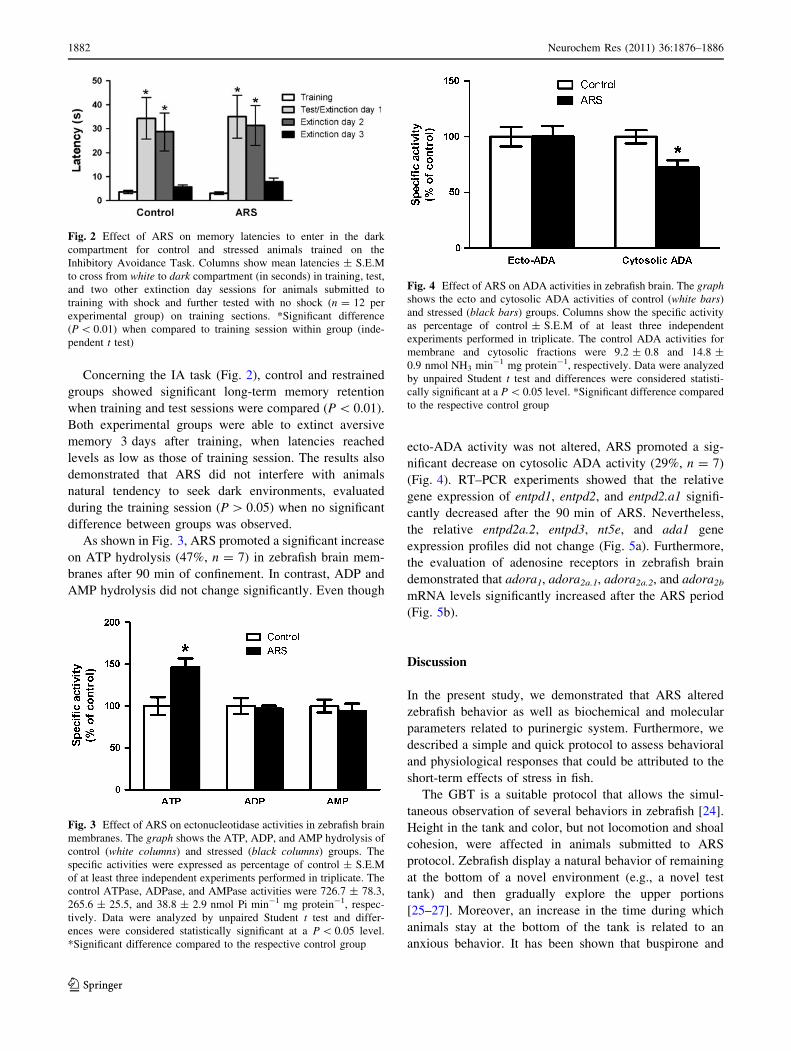
AMP hydrolysis did not change significantly. Even though
ecto-ADA activity was not altered, ARS promoted a sig-
nificant decrease on cytosolic ADA activity (29%, n = 7)
(Fig. 4). RT–PCR experiments showed that the relative
gene expression of entpd1, entpd2, and entpd2.a1 signifi-
cantly decreased after the 90 min of ARS. Nevertheless,
the relative entpd2a.2, entpd3, nt5e, and ada1 gene
expression profiles did not change (Fig. 5a). Furthermore,
the evaluation of adenosine receptors in zebrafish brain
demonstrated that adora1, adora2a.1, adora2a.2, and adora2b
mRNA levels significantly increased after the ARS period
(Fig. 5b).
Discussion
In the present study, we demonstrated that ARS altered
zebrafish behavior as well as biochemical and molecular
parameters related to purinergic system. Furthermore, we
described a simple and quick protocol to assess behavioral
and physiological responses that could be attributed to the
short-term effects of stress in fish.
The GBT is a suitable protocol that allows the simul-
taneous observation of several behaviors in zebrafish [24].
Height in the tank and color, but not locomotion and shoal
cohesion, were affected in animals submitted to ARS
protocol. Zebrafish display a natural behavior of remaining
at the bottom of a novel environment (e.g., a novel test
tank) and then gradually explore the upper portions
[25–27]. Moreover, an increase in the time during which
animals stay at the bottom of the tank is related to an
anxious behavior. It has been shown that buspirone and
Fig. 2 Effect of ARS on memory latencies to enter in the dark
compartment for control and stressed animals trained on the
Inhibitory Avoidance Task. Columns show mean latencies ± S.E.M
to cross from white to dark compartment (in seconds) in training, test,
and two other extinction day sessions for animals submitted to
training with shock and further tested with no shock (n = 12 per
experimental group) on training sections. *Significant difference
(P \ 0.01) when compared to training session within group (inde-
pendent t test)
Fig. 3 Effect of ARS on ectonucleotidase activities in zebrafish brain
membranes. The graph shows the ATP, ADP, and AMP hydrolysis of
control (white columns) and stressed (black columns) groups. The
specific activities were expressed as percentage of control ± S.E.M
of at least three independent experiments performed in triplicate. The
control ATPase, ADPase, and AMPase activities were 726.7 ± 78.3,
265.6 ± 25.5, and 38.8 ± 2.9 nmol Pi min-1 mg protein-1, respec-
tively. Data were analyzed by unpaired Student t test and differ-
ences were considered statistically significant at a P \ 0.05 level.
*Significant difference compared to the respective control group
Fig. 4 Effect of ARS on ADA activities in zebrafish brain. The graphshows the ecto and cytosolic ADA activities of control (white bars)
and stressed (black bars) groups. Columns show the specific activity
as percentage of control ± S.E.M of at least three independent
experiments performed in triplicate. The control ADA activities for
membrane and cytosolic fractions were 9.2 ± 0.8 and 14.8 ±
0.9 nmol NH3 min-1 mg protein-1, respectively. Data were analyzed
by unpaired Student t test and differences were considered statisti-
cally significant at a P \ 0.05 level. *Significant difference compared
to the respective control group
1882 Neurochem Res (2011) 36:1876–1886
123
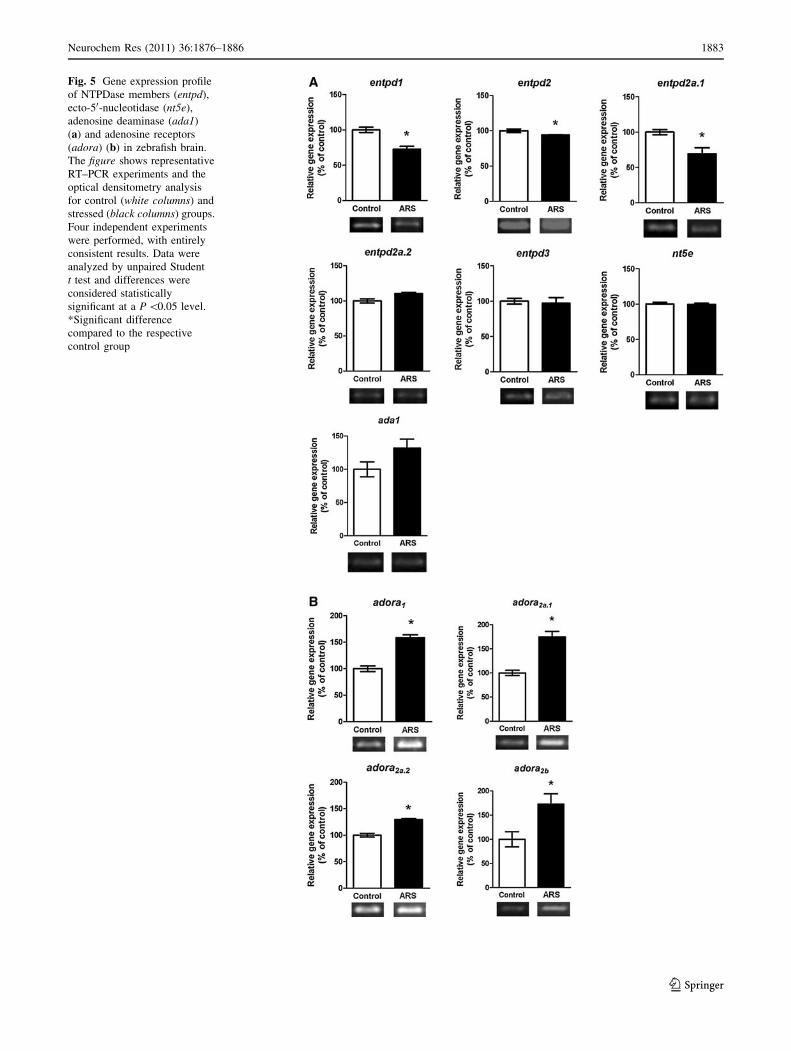
Fig. 5 Gene expression profile
of NTPDase members (entpd),
ecto-50-nucleotidase (nt5e),
adenosine deaminase (ada1)
(a) and adenosine receptors
(adora) (b) in zebrafish brain.
The figure shows representative
RT–PCR experiments and the
optical densitometry analysis
for control (white columns) and
stressed (black columns) groups.
Four independent experiments
were performed, with entirely
consistent results. Data were
analyzed by unpaired Student
t test and differences were
considered statistically
significant at a P \0.05 level.
*Significant difference
compared to the respective
control group
Neurochem Res (2011) 36:1876–1886 1883
123
diazepam-treated zebrafish spent less time in the bottom of
the tank when compared to control, whereas chlordiaz-
epoxide was devoid of effects [26]. Ethanol and fluoxetine
exerted an anxiolytic effect expressed as increased total
time on top; the anxiogenic drug caffeine significantly
decreased this behavior [27]. Our results strongly suggest
that acute restraint stress increased anxiety-like behavior in
zebrafish, since fish remained most of the time at the bot-
tom of the tank.
Gerlai et al. [28] reported that increased color intensity
is associated with aggressiveness in zebrafish despite the
background environment color, while fear/anxiety was
associated with decreased color intensity. Furthermore,
body color changes are rather unspecific responses
observed in several conditions in zebrafish, ranging from
fear to anxiety and aggressiveness. In the present study,
stressed animals showed an increase in color intensity,
becoming darker than normal but not chatoyant with dark-
blue stripes, but aggression parameters were not directly
evaluated. The underlying mechanisms of body color
changes in zebrafish are not yet completely understood, but
could be related to general HPI activation.
The effect of acute stress increasing locomotion has
previously been shown [44]. In that study, adult zebrafish
were submitted to restraint stress (net handling for 15 min)
and later the pattern of exploration was verified. Stressed
fish crossed significantly more squares than non-stressed
control. In our protocol, there was no difference between
control and stressed fish regarding locomotion. This vari-
ation in locomotion is likely due to differing experimental
protocols used in each study. In rodents, the exploratory
behavior after restraint stress also seems to be inconsistent,
with reports of increased [45] and decreased [46, 47]
exploratory activity.
Zebrafish has an innate behavior to form schools and
this partnership is related with predator avoidance, forag-
ing, and mating [25, 48, 49]. In a situation that may gen-
erate anxiety in zebrafish, for example the attack of a
predator, the group response is to increase social cohesion
possibly as an adaptive group behavior to respond more
adequately to stressors [50–52]. Previously published
works used 5 animals to evaluate social interaction [28];
however results obtained in our group using 3 fish [24, 62]
were robust and consistent, showing that 3 fish only were
adequate to induce shoaling behavior in a reliable way.
Although the results showed here clearly indicate an
increase in anxiety levels in zebrafish (increase in bottom-
dwelling behavior), the protocol was not able to change the
social cohesion in the GBT. This is in contrast with
unpredictable chronic stress protocol (UCS), which
increases social cohesion after 1 week and decreases after
2 weeks of UCS [24]. Therefore, the neurobiological
pathways modulated by acute or chronic stress seem to be
distinct and, consequently, different behavioral parameters
may be observed.
The impact of acute stressors on memory depends on the
levels of glucocorticoid alteration, with small increases
resulting in enhanced hippocampus-mediated learning and
memory, and larger, prolonged elevations impairing hip-
pocampal function in mammals [53]. Inhibitory avoidance
memory is a very rapidly acquired trace, based on the
association of very distinct stimulus and seen as a robust
response underlied by evolutionary conserved mechanisms.
In a previous study developed in our laboratory, 90 min of
ARS increased cortisol levels and decreased crf gene
expression (unpublished data). However, our IA results
suggest that such responses are not sufficient to hinder
aversive memory formation and extinction, since there was
no difference between groups in training or subsequent
sessions.
Our experiments showed that ARS increased ATP
hydrolysis in zebrafish brain membranes. Furthermore, the
cytosolic ADA activity was significantly decreased in
stressed fish. These data suggest that the acute restraint
stress could alter adenosine levels in zebrafish brain. In this
sense, the decreased cytosolic ADA activity could lead to
an increase on extracellular adenosine levels via bidirec-
tional nucleoside transport. It is known that this nucleoside
may control the neuronal activity by acting through specific
P1 receptors [15]. Therefore, we suggest that the modula-
tory effect on these purinergic signaling parameters could
be related to a compensatory mechanism in order to
achieve homeostasis. Since adenosine has an anxiolytic
effect [54, 55], the increased levels of this nucleoside could
play a role in counteracting the stress, in which ARS
induced anxious behavioral phenotypes in zebrafish.
Interestingly, the results demonstrated that the relative
gene expression levels of some NTPDase members (ent-
pd1, entpd2, and entpd2a.1) were significantly decreased
after the ARS, suggesting that the increase of ATP
hydrolysis observed is probably not directly related to a
higher entpd gene expression. The transcription machinery
is continuously controlled by a complex signaling system,
creating a set of signals able to adjust gene expression
profile of the cell. This signal transduction can be exerted
by proteins, products of enzyme reactions or even toxins
able to regulate transcription factors [57]. The phenomenon
known as negative feedback loop [57, 58], which is situ-
ated at the interface of genetic and metabolic networks,
could explain, at least in part, the simultaneous increase of
ATP hydrolysis and the decrease of entpd transcripts in
zebrafish brain after the ARS protocol.
Regarding the relative gene expression of adenosine
receptors, we verified an increase in mRNA transcripts of
adora1, adora2a.1, adora2a.2 and adora2b receptors in zeb-
rafish brain after ARS. The A1 receptors are negatively
1884 Neurochem Res (2011) 36:1876–1886
123
coupled to adenylate cyclase, whereas A2A and A2B
receptors are positively coupled to adenylate cyclase,
exerting facilitatory effects on CNS [15, 18, 55]. The rel-
evance of these findings is uncertain, but could be related
to two distinct effects. While the higher relative adora2
gene expression might be a consequence of the stress, the
increase on adora1 gene expression profile could be an
important compensatory mechanism to return to basal
levels. It has been shown that activation of A1 receptors is
triggered by extracellular adenosine mainly provided by
bidirectional transport, playing protective roles against
excitotoxicity [60, 61]. In comparison to A2 receptors, it
was demonstrated that A1 receptors have a widespread
distribution in brain regions, whereas A2 expression is
mainly related to certain brain structures [60]. Therefore,
the regulation of adenosine receptors gene expression
profile could be an important aspect related to ARS and
further studies are still required in order to clarify the
functional roles of A1, A2A.1, A2A.2, and A2B receptors in
zebrafish brain.
The augmentation in adenosine signaling may be part of
the stress responses of the organism as an attempt to
reestablish homeostasis and normal behavior after a
stressful event. Since this complementary vertebrate model
may be a suitable alternative with a better cost/benefit
relationship compared to other animal models, small space
for maintenance, and the possibility of large-scale trials, it
is relevant to study characteristics of the neurobiology and
the effects of acute stress on distinct behavioral phenotypes
and neurotransmitter systems.
Acknowledgments This work was supported by DECIT/SCTIE-MS
through Conselho Nacional de Desenvolvimento Cientıfico e Tec-
nologico (CNPq) and Fundacao de Amparo a Pesquisa do Estado do
Rio Grande do Sul (FAPERGS—10/0036-5, conv. No. 700545/2008
and ARD- 003/2009 processo 0902678) and by Coordenacao de
Aperfeicoamento de Pessoal de Nıvel Superior (CAPES).
Conflict of interest The authors report no conflicts of interest.
References
1. Mackiewicz M, Naidoo N, Zimmerman JE et al (2008) Molecular
mechanisms of sleep and wakefulness. Ann NY Acad Sci
1129:335–349
2. Gerlai R (2010) Zebrafish antipredatory responses: a future for
translational research? Behav Brain Res 207:223–231
3. Norton W, Bally-Cuif L (2010) Adult zebrafish as a model
organism for behavioural genetics. BMC Neurosci 11:90
4. Miller N, Gerlai R (2007) Quantification of shoaling behavior in
zebrafish (Danio rerio). Behav Brain Res 184:157–166
5. Barbazuk WB, Korf I, Kadavi C et al (2000) The syntenic rela-
tionship of the zebrafish and human genomes. Genome Res
10:1351–1358
6. Lieschke GJ, Currie PD (2007) Animal models of human disease:
zebrafish swim into view. Nat Rev Genet 8:353–367
7. Gerlai R (2003) Zebra fish: an uncharted behavior genetic model.
Behav Genet 33:461–468
8. Gerlai R (2010) High-throughput behavioral screens: the first step
towards finding genes involved in vertebrate brain function using
zebrafish. Molecules 15:2609–2622
9. Buynitsky T, Mostofsky DI (2009) Restraint stress in bio
behavioral research: recent developments. Neurosci Biobehav
Rev 33:1089–1098
10. Latini S, Pedata F (2001) Adenosine in the central nervous sys-
tem: release mechanisms and extracellular concentrations.
J Neurochem 79:463–484
11. Torres ILS, Buffon A, Silveira PP et al (2002) Effect of chronic
and acute stress on ecto-nucleotidase activities in spinal cord.
Physiol Behav 75:1–5
12. Bohmer AE, Furstenau CR, Torres IL et al (2003) The effect of
stress upon hydrolysis adenine nucleotides in blood serum of rats.
Pharmacol Biochem Behav 75:467–471
13. Fontella FU, Bruno AN, Crema LM et al (2004) Acute and chronic
stress alter ecto-nucleotidase activities in synaptosomes from the
rat hippocampus. Pharmacol Biochem Behav 78:341–347
14. Burnstock G (2004) Cotransmission. Curr Opin Pharmacol 4:
47–52
15. Burnstock G (2007) Purine and pyrimidine receptors. Cell Mol
Life Sci 64:1471–1483
16. Pankratov Y, Lalo U, Krishtal OA et al (2009) P2X receptors and
synaptic plasticity. Neuroscience 158:137–148
17. Zimmermann H (2001) Ectonucleotidases: some recent devel-
opments and a note on nomenclature. Drug Dev Res 52:44–56
18. Abbracchio MP, Burnstock G, Verkhratsky A et al (2009) Puri-
nergic signalling in the nervous system: an overview. Trends
Neurosci 32:19–29
19. Chen W, Guidotti G (2001) Soluble apyrases release ADP
during ATP hydrolysis. Biochem Biophys Res Commun 282:
90–95
20. Zimmermann H (2006) Ectonucleotidases in the nervous system.
Novartis Found Symp 276:113–128
21. Burnstock G, Verkhratsky A (2009) Evolutionary origins of the
purinergic signalling system. Acta Physiol 195:415–447
22. Fredholm BB, Ijzerman AP, Jacobson KA et al (2001) Interna-
tional union of pharmacology. XXV. Nomenclature and classifi-
cation of adenosine receptors. Pharmacol Rev 53:527–552
23. Sebastiao AM, Ribeiro JA (2009) Adenosine receptors and the
central nervous system. Handb Exp Pharmacol 193:471–534
24. Piato AL, Capiotti KM, Tamborski AR et al (2011) Unpredictable
chronic stress model in Zebrafish (Danio rerio): behavioral and
physiological responses. Prog Neuro-Psychopharmacol Biol
Psychiatry 35:561–567
25. Levin ED, Bencan Z, Cerutti DT (2007) Anxiolytic effects of
nicotine in zebrafish. Physiol Behav 90:54–58
26. Bencan Z, Sledge D, Levin ED (2009) Buspirone, chlordiaz-
epoxide and diazepam effects in a zebrafish model of anxiety.
Pharmacol Biochem Behav 94:75–80
27. Egan RJ, Bergner CL, Hart PC et al (2009) Understanding
behavioral and physiological phenotypes of stress and anxiety in
zebrafish. Behav Brain Res 205:38–44
28. Gerlai R, Lahav M, Guo S et al (2000) Drinks like a fish: zebra
fish (Danio rerio) as a behavior genetic model to study alcohol
effects. Pharmacol Biochem Behav 67:773–782
29. Engeszer RE, Patterson LB, Rao AA et al (2007) Zebrafish in the
wild: a review of natural history and new notes from the field.
Zebrafish 4:21–40
30. Saverino C, Gerlai R (2008) The social zebrafish: behavioral
responses to conspecific, heterospecific, and computer animated
fish. Behav Brain Res 191:77–87
31. Detrich HW, Westerfield M, Zon LI (1999) Overview of the
zebrafish system. Methods Cell Biol 59:3–10
Neurochem Res (2011) 36:1876–1886 1885
123
32. Blank M, Guerim LD, Cordeiro RF (2009) A one-trial inhibitory
avoidance task to zebrafish: rapid acquisition of an NMDA-
dependent long-term memory. Neurobiol Learn Mem 92:529–534
33. Wilson JM, Bunte RM, Carty AJ (2009) Evaluation of rapid
cooling and tricaine methanesulfonate (MS222) as methods of
euthanasia in zebrafish (Danio rerio). J Am Assoc Lab Anim Sci
48:785–789
34. Rico EP, Senger MR, Fauth MG et al (2003) ATP and ADP
hydrolysis in brain membranes of zebrafish (Danio rerio). Life
Sci 73:2071–2082
35. Senger MR, Rico EP, Dias RD et al (2004) Ecto-50-nucleotidase
activity in brain membranes of zebrafish (Danio rerio). Comp
Biochem Physiol B Biochem Mol Biol 139:203–207
36. Rosemberg DB, Rico EP, Senger MR et al (2008) Kinetic char-
acterization of adenosine deaminase activity in zebrafish (Daniorerio) brain. Comp Biochem Physiol B Biochem Mol Biol
151:96–101
37. Barnes JM, Murphy PA, Kirkham D (1993) Interaction of
guanine nucleotides with [3H]kainate and 6-[3H]cyano-7-nitro-
quinoxaline-2, 3-dione binding in goldfish brain. J Neurochem
61:1685–1691
38. Chan KM, Delfert D, Junger JD (1986) Direct colorimetric
assay for Ca2 ? -stimulated ATPase activity. Anal Biochem 157:
375–380
39. Bradford MM (1976) A rapid and sensitive method for the
quantification of microgram quantities of protein utilizing the
principle of protein-sye binding. Anal Biochem 72:248–254
40. Rico EP, Rosemberg DB, Senger MR et al (2006) Methanol alters
ectonucleotidases and acetylcholinesterase in zebrafish brain.
Neurotox Teratol 28:489–496
41. Rosemberg DB, Rico EP, Guidoti MR et al (2007) Adenosine
deaminase-related genes: molecular identification, tissue expres-
sion pattern and truncated alternative splice isoform in adult
zebrafish (Danio rerio). Life Sci 81:1526–1534
42. Rosemberg DB, Rico EP, Langoni AS et al (2010) NTPDase
family in zebrafish: nucleotide hydrolysis, molecular identifica-
tion and gene expression profiles in brain, liver and heart. Comp
Biochem Physiol B Biochem Mol Biol 155:230–240
43. Chen HQ, Tian W, Chen YS, Li L et al (2004) Effect of steady
and oscillatory shear stress on F-actin content and distribution in
neutrophils. Biorheology 41:655–664
44. Champagne DL, Hoefnagels CC, de Kloet RE et al (2010)
Translating rodent behavioral repertoire to zebrafish (Danio re-rio): relevance for stress research. Behav Brain Res 214:332–342
45. Perhach JL Jr, Barry H 3rd (1970) Stress responses of rats to
acute body or neck restraint. Physiol Behav 5:443–448
46. Cabib S, Kempf E, Schleef C et al (1988) Different effects of
acute and chronic stress on two dopamine-mediated behaviors in
the mouse. Physiol Behav 43:223–227
47. Zafar HM, Pare WP, Tejani-Butt SM (1997) Effect of acute or
repeated stress on behavior and brain norepinephrine system in
Wistar-Kyoto (WKY) rats. Brain Res Bull 44:289–295
48. Rehnberg BG, Smith RJ (1988) The influence of alarm substance
and shoal size on the behaviour of zebra danios, Brachydaniorerio (Cyprinidae). J Fish Biol 3:155–163
49. Pitcher TJ, Parrish JK (1993) Functions of shoaling behaviour in
teleosts. In: Pitcher TJ (ed) Behaviour of teleost fishes. Chapman
& Hall, London, pp 363–439
50. Landeau L, Terborgh J (1986) Oddity and the ‘confusion effect’
in predation. Anim Behav 34:1372–1380
51. Ryer CH, Olla BL (1991) Agonistic behavior in a schooling fish:
form, function, and ontogeny. Environ Biol Fish 31:355–363
52. Wright D (2006) Repeated measures of shoaling tendency in
zebrafish (Danio rerio) and other small teleost fishes. Nat Protoc
1:1828–1831
53. Diamond DM, Bennett MC, Fleshner M et al (1992) Inverted-U
relationship between the level of peripheral corticosterone and
the magnitude of hippocampal primed burst potentiation. Hip-
pocampus 2:421–430
54. Jain N, Kemp N, Adeyemo O et al (1995) Anxiolytic activity
of adenosine receptor activation in mice. Br J Pharmacol 116:
2127–2133
55. Florio C, Prezioso A, Papaioannou A (1998) Adenosine A1
receptors modulate anxiety in CD1 mice. Psychopharmacology
136:311–319
56. Krishna S, Andersson AM, Semsey S (2006) Structure and
function of negative feedback loops at the interface of genetic and
metabolic networks. Nucleic Acids Res 34:2455–2462
57. Salgado H, Santos-Zavaleta A, Gama-Castro S et al (2001)
Regulon DB (version 3.2): transcriptional regulation and operon
organization in Escherichia coli K-12. Nucleic Acids Res 29:
72–74
58. Keseler IM, Collado-Vides J, Gama-Castro S et al (2005) Eco-
Cyc: a comprehensive database resource for Escherichia coli.Nucleic Acids Res 1:334–337
59. Cunha RA (2005) Neuroprotection by adenosine in the brain:
From A1 receptor activation to A2A receptor blockade. Purinergic
Signal 1:111–134
60. Cunha RA (2001) Adenosine as a neuromodulator and as a
homeostatic regulator in the nervous system: different roles, dif-
ferent sources and different receptors. Neurochem Int 38:107–125
61. Malva JO, Silva AP, Cunha RA (2003) Presynaptic modulation
controlling neuronal excitability and epileptogenesis: role of ka-
inate, adenosine and neuropeptide Y receptors. Neurochem Res
28:1501–1515
62. Gebauer DL, Pagnussat N, Piato AL, Schaefer IC, Bonan CD,
Lara DR. Effects of anxiolytic in zebrafish: similarities and dif-
ferences between benzodiazepines, buspirone and ethanol. Phar-
macol Biochem Behav (in press)
63. Beis D, Stainier DY (2006) In vivo cell biology: following the
zebrafish trend. Trends Cell Biol 16(2):105–112
64. Miklosi A, Andrew R (2006) The zebrafish as a model for
behavioral studies. Zebrafish 3(2):227–234
65. Zon LI, Peterson RT (2005) In vivo drug discovery in the zeb-
rafish. Nat Rev Drug Discov 4(1):35–44
66. Rosemberg DB, Rico EP, Mussulini BH, Piato AL, Calcagnotto
ME, Bonan CD, Dias RD, Blaser RE, Souza DO, de Oliveira DL
(2011) Differences in spatio-temporal behavior of zebrafish in the
open tank paradigm after a short-period confinement into dark
and bright environments. Plos One 6:19397
67. Rehnberg BG, Smith RF (1988) The influence of alarm substance
and shoal size on the behaviour of zebra danios, BrachyDaniorerio (Cyprinidae). J Fish Biol 33:155–163
1886 Neurochem Res (2011) 36:1876–1886
123
Copyright © 2022 FDOKUMEN