Effect of Montmorillonite on Nonylphenol Enrichment in Zebrafish
39
1 Effect of Montmorillonite on Nonylphenol Enrichment in Zebrafish 1 2 Qian Kun 1 , Jiang Xiaofeng 2 , Sun Laiyu 1 , Zhou Guoqing 1 , Ge Haixia 1 ,Fang Xinqiang 1 , 3 Xiao Li 1 ,Wu Qiong 1 . 4 1. Huzhou University, Huzhou, Zhejiang, 313000, People’s Republic of China. 5 2. College of Life Science, Zhejiang Sci-Tech University, Hangzhou Zhejiang, 310018, 6 People’s Republic of China. 7 8 To whom correspondence may be addressed: Qian Kun, College of Life Sciences, 9 Huzhou University, Huzhou 313000, China. Tel.: +86 (572) 2321166; Fax: +86 (572) 10 2321166. Email:[email protected]. 11 The authors’ Email Address: Qian Kun,[email protected]; Jiang Xiaofeng, 12 [email protected]; Sun Laiyu, [email protected]; 13 Zhou Guoqing, [email protected]; Ge Haixia, [email protected]; Fang Xinqiang, 14 [email protected]; Xiao Li, [email protected], Wu Qiong, 15 [email protected] 16 17 Abstract: To investigate the effect of montmorillonite on nonylphenol enrichment in 18 a zebrafish model. The AB strain zebrafish were used as the animal subjects and three 19 concentration gradients were set for both nonylphenol and montmorillonite, according 20 to their actual concentrations in aquaculture water in Huzhou city. A group treated 21 with nonylphenol alone was also set, adding up to 12 experimental groups. 22 Preprints (www.preprints.org) | NOT PEER-REVIEWED | Posted: 26 April 2018 doi:10.20944/preprints201804.0330.v1 © 2018 by the author(s). Distributed under a Creative Commons CC BY license. Peer-reviewed version available at Int. J. Environ. Res. Public Health 2018, 15, 1217; doi:10.3390/ijerph15061217
-
Upload
khangminh22 -
Category
Documents
-
view
0 -
download
0
Transcript of Effect of Montmorillonite on Nonylphenol Enrichment in Zebrafish
1
Effect of Montmorillonite on Nonylphenol Enrichment in Zebrafish 1
2
Qian Kun1, Jiang Xiaofeng2, Sun Laiyu1, Zhou Guoqing1, Ge Haixia1,Fang Xinqiang1, 3
Xiao Li1,Wu Qiong1. 4
1. Huzhou University, Huzhou, Zhejiang, 313000, People’s Republic of China. 5
2. College of Life Science, Zhejiang Sci-Tech University, Hangzhou Zhejiang, 310018, 6
People’s Republic of China. 7
8
To whom correspondence may be addressed: Qian Kun, College of Life Sciences, 9
Huzhou University, Huzhou 313000, China. Tel.: +86 (572) 2321166; Fax: +86 (572) 10
2321166. Email:[email protected]. 11
The authors’ Email Address: Qian Kun,[email protected]; Jiang Xiaofeng, 12
[email protected]; Sun Laiyu, [email protected]; 13
Zhou Guoqing, [email protected]; Ge Haixia, [email protected]; Fang Xinqiang, 14 [email protected]; Xiao Li, [email protected], Wu Qiong, 15
17
Abstract: To investigate the effect of montmorillonite on nonylphenol enrichment in 18
a zebrafish model. The AB strain zebrafish were used as the animal subjects and three 19
concentration gradients were set for both nonylphenol and montmorillonite, according 20
to their actual concentrations in aquaculture water in Huzhou city. A group treated 21
with nonylphenol alone was also set, adding up to 12 experimental groups. 22
Preprints (www.preprints.org) | NOT PEER-REVIEWED | Posted: 26 April 2018 doi:10.20944/preprints201804.0330.v1
© 2018 by the author(s). Distributed under a Creative Commons CC BY license.
Peer-reviewed version available at Int. J. Environ. Res. Public Health 2018, 15, 1217; doi:10.3390/ijerph15061217
2
Concentrations of nonylphenol enriched in the liver, muscle, and gill of zebrafish 23
were detected by solid phase microextraction–high performance liquid 24
chromatography at Day 7, 15, and 30, respectively. Besides, the relative enzymatic 25
activity of Superoxide dismutase (SOD) and the Glutathione S-transferase (GST) 26
were also been detected, and the data were statistically analyzed. The results showed 27
that the concentrations of nonylphenol in zebrafish peaked at Day 7 and gradually 28
decreased afterwards for all the experimental groups. And the montmorillonite 29
reduces short-term accumulation of nonylphenol in gills, and the high concentration 30
of nonylphenol facilitates its enrichment in liver and muscle while the low 31
concentration of nonylphenol doesn’t. Meanwhile, the low concentration of 32
nonylphenol in liver exerts an influence on the inductive effect of SOD and GST 33
while the high concentration of nonylphenol shows the inhibiting effect of SOD and 34
GST. 35
Key words: Nonylphenol; Montmorillonite; Zebrafish; Enrichment; Enzyme activity. 36
37
Abbreviations: Montmorillonite (MMT); Nonylphenol (NP). 38
39
Introduction 40
Environmental endocrine disrupting compounds (EDCs) interfere with the 41
synthesis, release, transport, metabolism, binding, action, or elimination of 42
endogenous hormones, and then impact the normal endocrine system of organisms, 43
Preprints (www.preprints.org) | NOT PEER-REVIEWED | Posted: 26 April 2018 doi:10.20944/preprints201804.0330.v1
Peer-reviewed version available at Int. J. Environ. Res. Public Health 2018, 15, 1217; doi:10.3390/ijerph15061217
3
leading to reproduction and immune dysfunctions[1]. In addition to the reversible or 44
irreversible biological effects on the organisms, the offspring, or the population, EDCs 45
also compromise the disease resistance of the body[2,3] and even cause diseases and 46
cancer[4-7]. For instance, nonylphenol (NP), a common industrial raw material, is a 47
typical phenolic environmental hormone and mainly accumulates in water bodies with 48
a solubility of 5.43 mg/L[8]. This chemical presents genotoxicity, developmental 49
toxicity, immunotoxicity, and neurotoxicity[9-13]. And it may deposit in living 50
organisms and exhibit biological effects via the water body as well as through the 51
food chain, and the effect of environmental EDCs might be more harmful after 52
enrichment by the food chain[14,15]. 53
The dose of environmental EDCs is generally low in nature and the correlation 54
between their effect and dose is complex, for example, the toxicity of bisphenol A is 55
stronger at low dose than at high dose[16,17]. The application of biomarkers is a 56
common method to evaluate and analyze toxic effects of toxicants. The antioxidant 57
enzymes of zebrafish are commonly used biomarkers[18-20]. However, the dose used 58
in current study of the dose-effect relationship is basically the dose of toxicants 59
exposed to the environment, and the study of the concentration-effect relationship 60
between toxicant concentrations and markers in tissues or organs of zebrafish has 61
rarely been reported. The situation is more complicated in actual nature environment, 62
where a variety of substances, especially some nanoparticles in the water, modify the 63
biological effects of environmental EDCs, and impact the adsorption, transport, 64
enrichment, and even the toxicity of EDCs[21-23]. Montmorillonite (MMT) is a 65
Preprints (www.preprints.org) | NOT PEER-REVIEWED | Posted: 26 April 2018 doi:10.20944/preprints201804.0330.v1
Peer-reviewed version available at Int. J. Environ. Res. Public Health 2018, 15, 1217; doi:10.3390/ijerph15061217

4
typical layered aluminosilicate mineral that is adsorptive, hydrophilic, electrically 66
charged, dispersedly suspended, and swells in water[24-26], therefore it is widely 67
used in medicine, aquaculture, and sewage treatment[27-32]. MMT, as a common 68
nanoparticle in water body, has the potential to enhance the toxicity of harmful 69
substances and meanwhile reduces the accumulation of harmful substances and 70
exhibits detoxification function in aquatic animals[33-36]. Few studies have reported 71
the role of MMT in specific water environment. In the present study, the effect of 72
MMT on NP accumulation in zebrafish was investigated in water environment using 73
NP as a specific toxic substance, in addition, the relationship between the 74
concentration of NP in liver and the enzyme activity of SOD and GST had also been 75
analyzed. 76
77
1. Materials and methods: 78
1.1 Instruments and experimental materials 79
HPLC (high performance liquid chromatograph, LC-20AT, Shimadzu 80
Corporation), solid phase microextraction (Supelco, 75 μm PDMS/DVB). Zebrafish 81
(Danio rerio) AB strain (purchased from local fish market), both sex, weighing 82
approximately 1.5–2 g and having the body length of 2.5–3.5 cm, were kept in 83
recirculating water at 28 °C under standard laboratory conditions for two weeks. 84
Nonylphenol (NP, analytically pure, 98 %. Purchased from Shanghai Ziyi Reagent 85
Company). The pharmaceutical grade montmorillonite (MMT) was purchased from 86
Preprints (www.preprints.org) | NOT PEER-REVIEWED | Posted: 26 April 2018 doi:10.20944/preprints201804.0330.v1
Peer-reviewed version available at Int. J. Environ. Res. Public Health 2018, 15, 1217; doi:10.3390/ijerph15061217

5
Gaoyu Bentonite Company (Anji, China). The SOD and GST Assay Kits were 87
purchased from Jiancheng Bioengineering Institute (Nanjing, China). 88
All animal care and experimental procedures were approved by the Committee 89
on Animal Care and Use and the Committee on the Ethic of Animal Experiments of 90
Huzhou University and Zhejiang Sci-Tech University. And all methods were 91
performed in accordance with the relevant guidelines and regulations. 92
1.2 Experimental methods 93
1.2.1 HPLC parameter settings 94
Chromatographic column: Waters Symmetry C18 (4.6×150 mm,5 μm); Mobile 95
phase: Methyl alcohol:H2O=26:74; Detection wavelength: 225 nm; Flow velocity: 1.0 96
mL·min-1; The column temperature was at 35 °C; Inlet sample quantity: 20 μL. 97
1.2.2 The methodology of NP detection based on HPLC method 98
(1) Accuracy: 6 parallel samples of NP with the identical concentration, the 99
concentration of each sample was 2.092×10³ μg/L according to the HPLC detection. 100
The RSD (relative standard deviation) was also been calculated. 101
(2) The confirmation of quantitation limit (LOQ) and detection limit (LOD): The 102
standard NP samples were diluted, then the LOQ and LOD were set as S/N=10:1 and 103
S/N=3:1, respectively. 104
(3) The recoveries of NP: The zebrafish tissue samples of liver, muscle and gill, 105
as well as water sample, were added the NP to the final concentration of 2.092×101, 106
Preprints (www.preprints.org) | NOT PEER-REVIEWED | Posted: 26 April 2018 doi:10.20944/preprints201804.0330.v1
Peer-reviewed version available at Int. J. Environ. Res. Public Health 2018, 15, 1217; doi:10.3390/ijerph15061217

6
2.092×10², 2.092×10³ μg/L, respectively. The water sample was processed in 107
accordance with chapter 1.2.3, the zebrafish tissue samples were processed in 108
accordance with chapter 1.2.5. The processed samples were analysized by HPLC and 109
the recoveries of NP were acquired. 110
(4) Standard curve: The zebrafish tissue samples of liver, muscle and gill, as well 111
as water sample, were added the NP to the final concentration of 2.092, 2.092×51, 112
2.092×52, 2.092×53, 2.092×54 and 1.046×55 μg/L, respectively. The water sample was 113
processed in accordance with chapter 1.2.3 (Under the optimum condition), the 114
zebrafish tissue samples were processed in accordance with chapter 1.2.5. The 115
processed samples were analysized by HPLC and the absorption peak areas were 116
measured. Next, the linear equation between the concentration and the absorbance of 117
NP has been established. 118
1.2.3 The conditions of solid phase microextraction (SPME) 119
The water samples derived from aquaculture water was filtered by microfiltration 120
membrane (0.45 μm), and assembly of the adsorption time (60, 40, 30 and 20 min) of 121
SPME and the resolution time (40, 30, 20, 10, 9, 7, 5 and 3 min) of SPME can be 122
confirm the optimal adsorptional analytical conditions through the HPLC analysis, 123
and the experimental procedure of SPME was according to the introductions.. 124
1.2.4 Exposure measurement and grouping 125
(1) Determination of exposure concentration of NP 126
A total of 10 typical aquaculture water samples in Huzhou area were selected, 127
Preprints (www.preprints.org) | NOT PEER-REVIEWED | Posted: 26 April 2018 doi:10.20944/preprints201804.0330.v1
Peer-reviewed version available at Int. J. Environ. Res. Public Health 2018, 15, 1217; doi:10.3390/ijerph15061217
7
with the average concentration of NP detected by high performance liquid 128
chromatography regarded as 1× exposure concentration of NP . 129
(2) Determination of MMT concentration 130
The accumulation in 7 consecutive days was calculated as 1× exposure 131
concentration of MMT on the basis that the depth of the aquaculture water system was 132
1.2-1.7m, the annual input of commercial feed per mu was 350-500kg and 2-5 kg of 133
MMT in aquatic feed per ton was added, and the result was 2.949×10⁻⁵g/L. 134
(3) Exposure test grouping 135
The samples were divided into 17 experimental groups, respectively 1×, 10× and 136
100× NP exposure group, 1/100, 1× and 100× MMT exposure group, 9 pairwise 137
combinations between 1/100, 1× and 100× MMT exposure concentration and 1×, 10× 138
and 100× NP exposure concentration, organic solvent group (with 1ml ethanol added) 139
and test water group, with 3 parallel tests in each group. NP with different amounts in 140
the experimental groups were dissoluted with 1ml ethanol. 141
1.2.5 The treatment of zebrafish tissue samples 142
Each of 25 zebrafish were raised in a 20L-water-filled tank, with the pH 7.0±0.5 143
(adjusted by NaHCO3). Fluorescent lamp was chosen to simulate the natural light, 144
replace half of the aquaculture water in every 24 h. Fed the zebrafish with the 145
commercial feeds (without MMT), fish maintenance and the feeding protocol have 146
been described by Lee et al[37]. After raised for 7, 15 and 30 d, 6 fish were randomly 147
selected from each tank, respectively. The tissue samples of liver, muscle and gill 148
Preprints (www.preprints.org) | NOT PEER-REVIEWED | Posted: 26 April 2018 doi:10.20944/preprints201804.0330.v1
Peer-reviewed version available at Int. J. Environ. Res. Public Health 2018, 15, 1217; doi:10.3390/ijerph15061217
8
were extracted and storage at -20°C. 149
Tissue samples derived from 2 fish were classified into one group, the tissue 150
homogenates were added 10 mM/L HCl up to 9 mL, storage at 4°C for 24 h, then each 151
group was centrifuged for 10 min (6000 rpm at 4°C). The supernate was filtered by 152
0.45 μm filter membrane and was diluted by ultrapure water to 15 mL. Then the 153
diluent was processed in accordance with chapter 1.2.3 (Under the optimum 154
condition). 155
1.2.6 Determination of the concentrations of NP in tissues and data analysis 156
The concentrations of NP in treated samples were detected by HPLC in 157
accordance with chapter 1.2.1. Statistical evaluations of the significant differences 158
among the means of experimental groups were performed using Student’s t test (MS 159
Excel 2010). 160
1.2.7 Measurements of enzymatic activity 161
The liver samples were derived from 2 fish of each experimental groups, the 162
sampling and the enzymatic activity determinations of SOD and GST were according 163
to the Kit instructions. 164
2. Results 165
2.1 Parameters of NP testing methodology 166
2.1.1 LOQ and LOD of NP 167
LOQ: NP concentration of 1.046 μg/L; LOD: NP concentration of 0.4184 μg/L. 168
Preprints (www.preprints.org) | NOT PEER-REVIEWED | Posted: 26 April 2018 doi:10.20944/preprints201804.0330.v1
Peer-reviewed version available at Int. J. Environ. Res. Public Health 2018, 15, 1217; doi:10.3390/ijerph15061217

9
2.1.2 Accuracy 169
NP concentration of 2.092×10³ μg/L with the RSD 2.25% (n=6). 170
2.1.3 Recovery 171
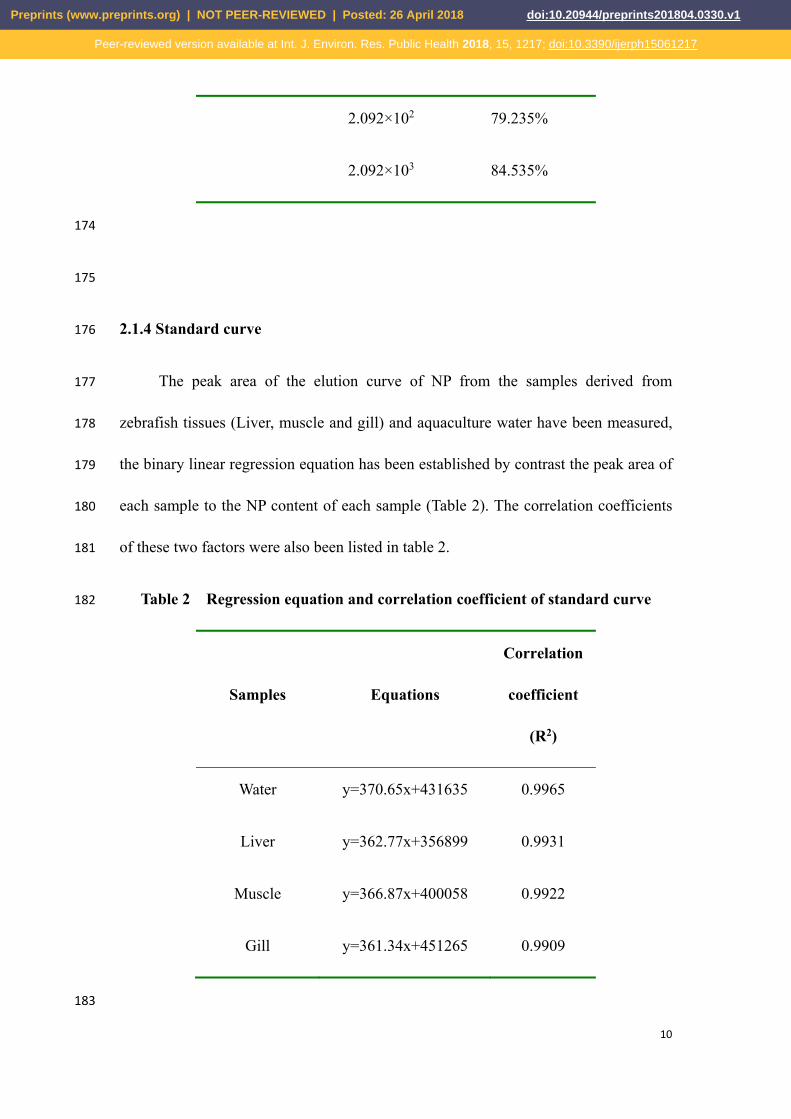
The recovery rate of NP were among 77.797 %–89.274 % (Table 1). 172
Table 1 Average recovery rate of NP 173
Samples Content (μg/L) Average recovery
rate % (n=3)
Water
2.092×101 77.797%
2.092×10² 78.359%
2.092×10³ 89.274%
Liver
2.092×101 78.539%
2.092×10² 78.695%
2.092×10³ 81.126%
Muscle
2.092×101 85.467%
2.092×10² 79.503%
2.092×10³ 82.031%
Gill 2.092×101 77.998%
Preprints (www.preprints.org) | NOT PEER-REVIEWED | Posted: 26 April 2018 doi:10.20944/preprints201804.0330.v1
Peer-reviewed version available at Int. J. Environ. Res. Public Health 2018, 15, 1217; doi:10.3390/ijerph15061217
10
2.092×10² 79.235%
2.092×10³ 84.535%
174
175
2.1.4 Standard curve 176
The peak area of the elution curve of NP from the samples derived from 177
zebrafish tissues (Liver, muscle and gill) and aquaculture water have been measured, 178
the binary linear regression equation has been established by contrast the peak area of 179
each sample to the NP content of each sample (Table 2). The correlation coefficients 180
of these two factors were also been listed in table 2. 181
Table 2 Regression equation and correlation coefficient of standard curve 182
Samples Equations
Correlation
coefficient
(R2)
Water y=370.65x+431635 0.9965
Liver y=362.77x+356899 0.9931
Muscle y=366.87x+400058 0.9922
Gill y=361.34x+451265 0.9909
183
Preprints (www.preprints.org) | NOT PEER-REVIEWED | Posted: 26 April 2018 doi:10.20944/preprints201804.0330.v1
Peer-reviewed version available at Int. J. Environ. Res. Public Health 2018, 15, 1217; doi:10.3390/ijerph15061217
11
2.2 Optimum condition for SPME 184
Extraction processed by 75 μm PDMS/DVB, the optimal adsorption time is 20 185
min, resolution time is 5 min. 186
2.3 Exposure dose of NP 187
The mean NP contents of 10 measured water samples is 3.2133 μg/L, while the 188
exposure doses of NP are 3.2133 μg/L, 32.133 μg/L and 321.33 μg/L, respectively. 189
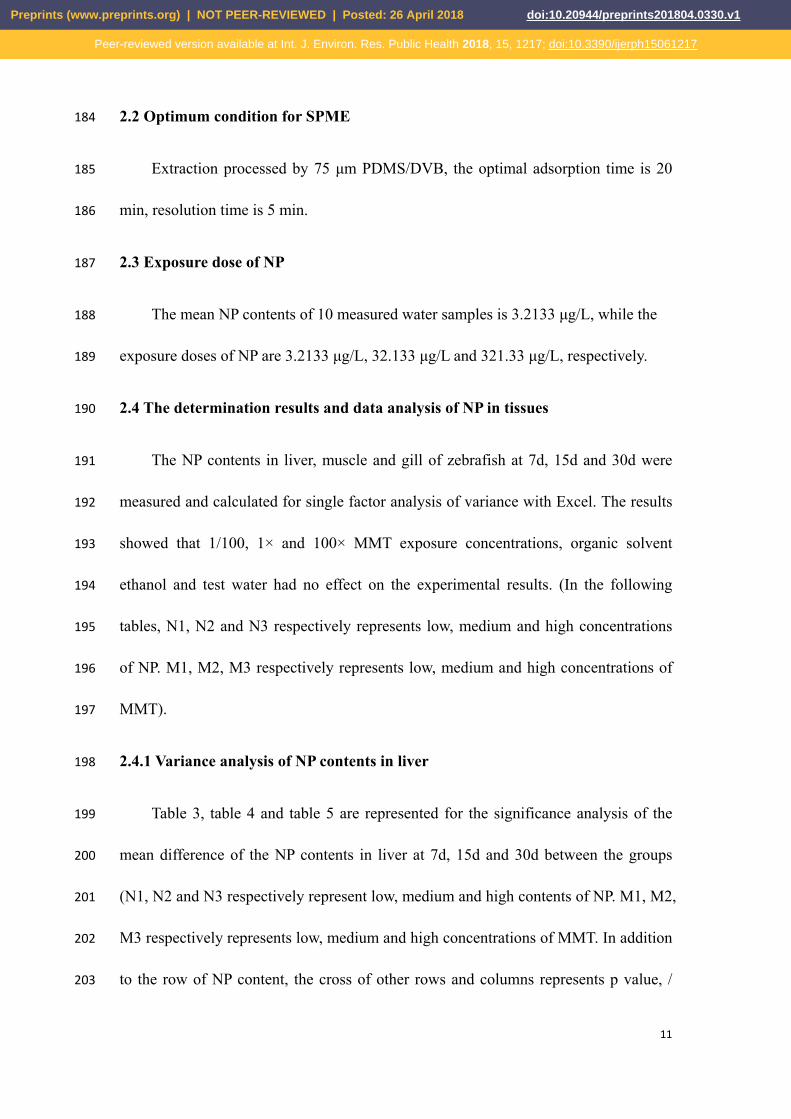
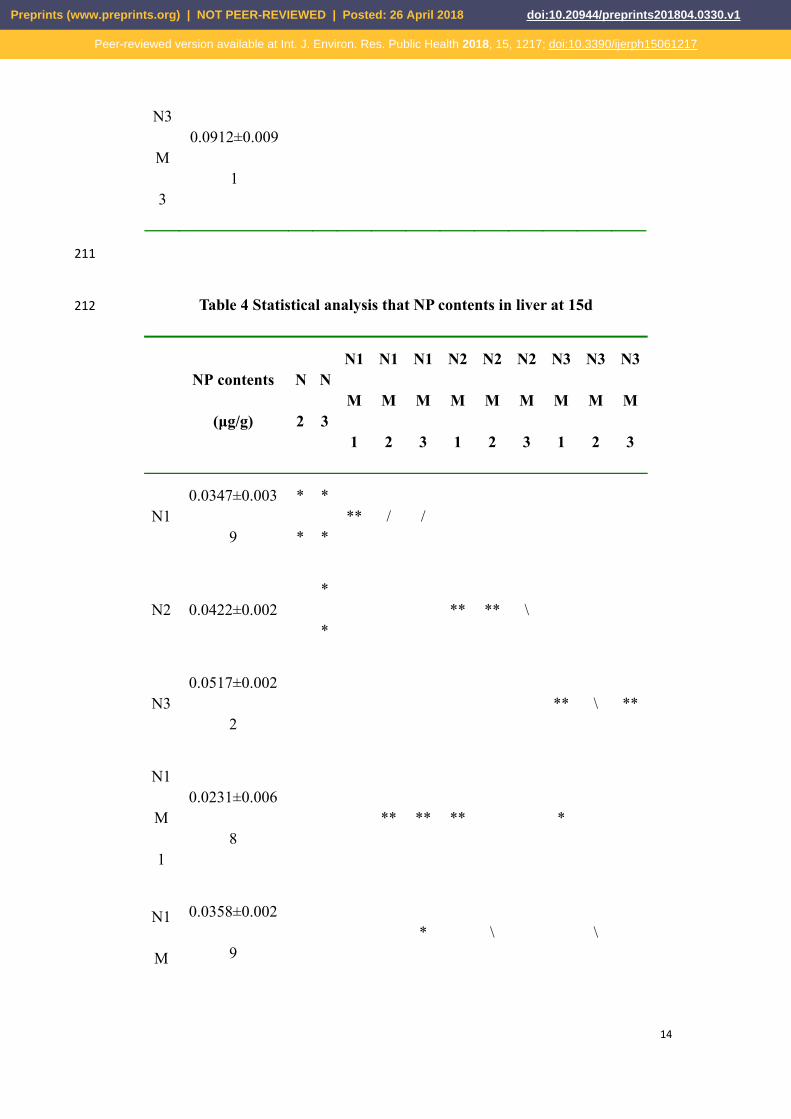
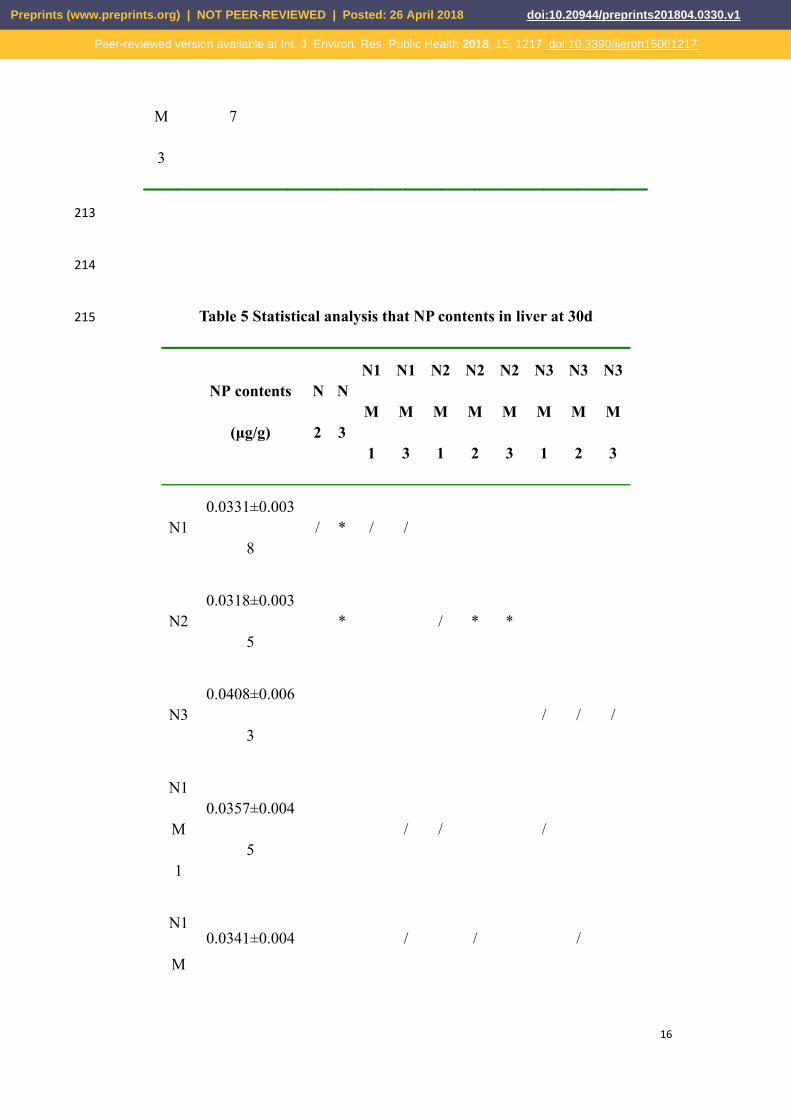
2.4 The determination results and data analysis of NP in tissues 190
The NP contents in liver, muscle and gill of zebrafish at 7d, 15d and 30d were 191
measured and calculated for single factor analysis of variance with Excel. The results 192
showed that 1/100, 1× and 100× MMT exposure concentrations, organic solvent 193
ethanol and test water had no effect on the experimental results. (In the following 194
tables, N1, N2 and N3 respectively represents low, medium and high concentrations 195
of NP. M1, M2, M3 respectively represents low, medium and high concentrations of 196
MMT). 197
2.4.1 Variance analysis of NP contents in liver 198
Table 3, table 4 and table 5 are represented for the significance analysis of the 199
mean difference of the NP contents in liver at 7d, 15d and 30d between the groups 200
(N1, N2 and N3 respectively represent low, medium and high contents of NP. M1, M2, 201
M3 respectively represents low, medium and high concentrations of MMT. In addition 202
to the row of NP content, the cross of other rows and columns represents p value, / 203
Preprints (www.preprints.org) | NOT PEER-REVIEWED | Posted: 26 April 2018 doi:10.20944/preprints201804.0330.v1
Peer-reviewed version available at Int. J. Environ. Res. Public Health 2018, 15, 1217; doi:10.3390/ijerph15061217

12
represents p≥0.05, * represents p<0.05, **represents p<0.01 and blank represents no 204
comparison). The changes of NP contents of each experimental group at 7d, 15d and 205
30d were shown in figure 1 (* and / at the top of the figure: the first row represents 206
analysis of difference significance between NP contents at 7d and 15d, the second row 207
represents analysis at 7d and 30d and the third row represents analysis at 15d and 208
30d). 209
Table 3 Statistical analysis that NP contents in liver at 7d 210
NP contents
(μg/g)
N
2
N
3
N1
M
1
N1
M
2
N1
M
3
N2
M
1
N2
M
2
N2
M
3
N3
M
1
N3
M
2
N3
M
3
N1 0.1224±0.009
6
*
*
*
* ** ** **
N2 0.0714±0.006
6 / / ** **
N3 0.0711±0.001
4 ** ** **
N1
M
1
0.0699±0.009
9 * ** / /
N1 0.085±0.0129 * * /
Preprints (www.preprints.org) | NOT PEER-REVIEWED | Posted: 26 April 2018 doi:10.20944/preprints201804.0330.v1
Peer-reviewed version available at Int. J. Environ. Res. Public Health 2018, 15, 1217; doi:10.3390/ijerph15061217

13
M
2
N1
M
3
0.099±0.0073 / /
N2
M
1
0.0747±0.006 ** ** /
N2
M
2
0.1001±0.008 / **
N2
M
3
0.1021±0.012
1 /
N3
M
1
0.0787±0.003
5 / *
N3
M
2
0.0834±0.006
6 /
Preprints (www.preprints.org) | NOT PEER-REVIEWED | Posted: 26 April 2018 doi:10.20944/preprints201804.0330.v1
Peer-reviewed version available at Int. J. Environ. Res. Public Health 2018, 15, 1217; doi:10.3390/ijerph15061217
14
N3
M
3
0.0912±0.009
1
211
Table 4 Statistical analysis that NP contents in liver at 15d 212
NP contents
(μg/g)
N
2
N
3
N1
M
1
N1
M
2
N1
M
3
N2
M
1
N2
M
2
N2
M
3
N3
M
1
N3
M
2
N3
M
3
N1 0.0347±0.003
9
*
*
*
* ** / /
N2 0.0422±0.002 *
* ** ** \
N3 0.0517±0.002
2 ** \ **
N1
M
1
0.0231±0.006
8 ** ** ** *
N1
M
0.0358±0.002
9 * \ \
Preprints (www.preprints.org) | NOT PEER-REVIEWED | Posted: 26 April 2018 doi:10.20944/preprints201804.0330.v1
Peer-reviewed version available at Int. J. Environ. Res. Public Health 2018, 15, 1217; doi:10.3390/ijerph15061217

15
2
N1
M
3
0.0401±0.002
1 \ *
N2
M
1
0.0253±0.006
6 * ** *
N2
M
2
0.0346±0.005
3 * \
N2
M
3
0.0425±0.003
3 **
N3
M
1
0.0338±0.004
2 \ **
N3
M
2
0.0349±0.004 **
N3 0.0465±0.006
Preprints (www.preprints.org) | NOT PEER-REVIEWED | Posted: 26 April 2018 doi:10.20944/preprints201804.0330.v1
Peer-reviewed version available at Int. J. Environ. Res. Public Health 2018, 15, 1217; doi:10.3390/ijerph15061217
16
M
3
7
213
214
Table 5 Statistical analysis that NP contents in liver at 30d 215
NP contents
(μg/g)
N
2
N
3
N1
M
1
N1
M
3
N2
M
1
N2
M
2
N2
M
3
N3
M
1
N3
M
2
N3
M
3
N1 0.0331±0.003
8 / * / /
N2 0.0318±0.003
5 * / * *
N3 0.0408±0.006
3 / / /
N1
M
1
0.0357±0.004
5 / / /
N1
M0.0341±0.004 / / /
Preprints (www.preprints.org) | NOT PEER-REVIEWED | Posted: 26 April 2018 doi:10.20944/preprints201804.0330.v1
Peer-reviewed version available at Int. J. Environ. Res. Public Health 2018, 15, 1217; doi:10.3390/ijerph15061217

17
2
N1
M
3
0.0344±0.005
5 / *
N2
M
1
0.0354±0.003
4 / / /
N2
M
2
0.0389±0.006
2 / /
N2
M
3
0.0366±0.004
0 *
N3
M
1
0.0325±0.007
7 / *
N3
M
2
0.0368±0.003
6 *
N3 0.0436±0.004
Preprints (www.preprints.org) | NOT PEER-REVIEWED | Posted: 26 April 2018 doi:10.20944/preprints201804.0330.v1
Peer-reviewed version available at Int. J. Environ. Res. Public Health 2018, 15, 1217; doi:10.3390/ijerph15061217

18
M
3
6
216
Figure 1. Statistical analysis of the content variation of NP in liver at 7d, 15d and 30d. 217
218
2.4.2 Variance analysis of NP contents in muscle 219
The NP contents in zebrafish muscle at 7d, 15d and 30d were listed in table 6, 220
table 7 and table 8, respectively. Significance analysis of the means of all 221
experimental groups was also demonstrated in these tables. The content variation of 222
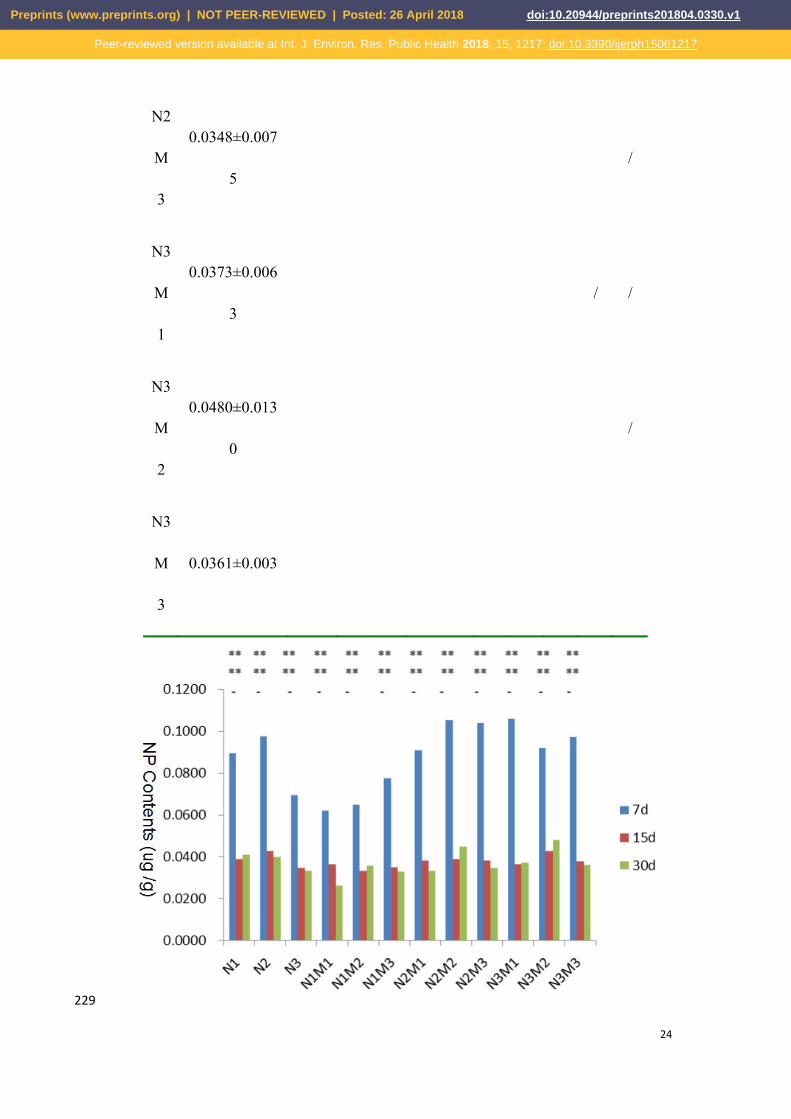
NP in every experimental group at 7d, 15d and 30d were illustrated in figure 2. 223
Table 6 Statistical analysis that NP contents in muscle at 7d 224
NP contents N N N1 N1 N1 N2 N2 N2 N3 N3 N3
Preprints (www.preprints.org) | NOT PEER-REVIEWED | Posted: 26 April 2018 doi:10.20944/preprints201804.0330.v1
Peer-reviewed version available at Int. J. Environ. Res. Public Health 2018, 15, 1217; doi:10.3390/ijerph15061217

19
(μg/g) 2 3 M
1
M
2
M
3
M
1
M
2
M
3
M
1
M
2
M
3
N1 0.0894±0.006
2 /
*
* ** ** *
N2 0.0976±0.011
8
*
* / / /
N3 0.0696±0.007
2 ** ** **
N1
M
1
0.0620±0.002
8 / ** ** **
N1
M
2
0.0649±0.002
0 ** ** **
N1
M
3
0.0776±0.007
0 ** *
N2
M
1
0.0909±0.002
2 ** * *
Preprints (www.preprints.org) | NOT PEER-REVIEWED | Posted: 26 April 2018 doi:10.20944/preprints201804.0330.v1
Peer-reviewed version available at Int. J. Environ. Res. Public Health 2018, 15, 1217; doi:10.3390/ijerph15061217
20
N2
M
2
0.1054±0.009
1 / /
N2
M
3
0.1039±0.009
7 /
N3
M
1
0.1062±0.012
5 / /
N3
M
2
0.0888±0.011
3 /
N3
M
3
0.0971±0.014
225
Table 7 Statistical analysis that NP contents in muscle at 15d 226
NP contents
(μg/g)
N
2
N
3
N1
M
1
N1
M
2
N1
M
3
N2
M
1
N2
M
2
N2
M
3
N3
M
1
N3
M
2
N3
M
3
Preprints (www.preprints.org) | NOT PEER-REVIEWED | Posted: 26 April 2018 doi:10.20944/preprints201804.0330.v1
Peer-reviewed version available at Int. J. Environ. Res. Public Health 2018, 15, 1217; doi:10.3390/ijerph15061217

21
N1 0.0390±0.002
2 *
*
* / / *
N2 0.0430±0.003
3
*
* / / /
N3 0.0348±0.001
5 / / /
N1
M
1
0.0363±0.004
6 / / / /
N1
M
2
0.0332±0.007
1 / / /
N1
M
3
0.0349±0.003
6 / /
N2
M
1
0.0384±0.004
8 / / /
N2
M
0.0388±0.003
4 / /
Preprints (www.preprints.org) | NOT PEER-REVIEWED | Posted: 26 April 2018 doi:10.20944/preprints201804.0330.v1
Peer-reviewed version available at Int. J. Environ. Res. Public Health 2018, 15, 1217; doi:10.3390/ijerph15061217

22
2
N2
M
3
0.0383±0.007
3 /
N3
M
1
0.0365±0.006
0 / /
N3
M
2
0.0426±0.008
6 /
N3
M
3
0.038±0.0085
227
Table 8 Statistical analysis that NP contents in muscle at 30d 228
NP contents
(μg/g)
N
2
N
3
N1
M
1
N1
M
2
N1
M
3
N2
M
1
N2
M
2
N2
M
3
N3
M
1
N3
M
2
N3
M
3
N1 0.0410±0.006 / / * / *
Preprints (www.preprints.org) | NOT PEER-REVIEWED | Posted: 26 April 2018 doi:10.20944/preprints201804.0330.v1
Peer-reviewed version available at Int. J. Environ. Res. Public Health 2018, 15, 1217; doi:10.3390/ijerph15061217

23
5
N2 0.0399±0.005
7 / / / /
N3 0.0333±0.011
4 / / /
N1
M
1
0.0263±0.012
1 / / / /
N1
M
2
0.0357±0.007
3 / / /
N1
M
3
0.0328±0.004
8 / /
N2
M
1
0.0333±0.010
1 / / /
N2
M
2
0.0448±0.011
7 / /
Preprints (www.preprints.org) | NOT PEER-REVIEWED | Posted: 26 April 2018 doi:10.20944/preprints201804.0330.v1
Peer-reviewed version available at Int. J. Environ. Res. Public Health 2018, 15, 1217; doi:10.3390/ijerph15061217
24
N2
M
3
0.0348±0.007
5 /
N3
M
1
0.0373±0.006
3 / /
N3
M
2
0.0480±0.013
0 /
N3
M
3
0.0361±0.003
229
Preprints (www.preprints.org) | NOT PEER-REVIEWED | Posted: 26 April 2018 doi:10.20944/preprints201804.0330.v1
Peer-reviewed version available at Int. J. Environ. Res. Public Health 2018, 15, 1217; doi:10.3390/ijerph15061217

25
Figure 2. Statistical analysis of the content variation of NP in muscle at 7d, 15d and 230
30d. 231
232
2.4.3 Variance analysis of NP contents in gill 233
The NP contents in zebrafish gill at 7d, 15d and 30d and the significance analysis 234
of the means of all experimental groups were demonstrated in table 6, table 7 and 235
table 8, respectively. The content variation of NP in every experimental group at 7d, 236
15d and 30d were illustrated in figure 3. 237
Table 9 Statistical analysis that NP contents in gill at 7d 238
NP contents
(μg/g)
N
2
N
3
N1
M
1
N1
M
2
N1
M
3
N2
M
1
N2
M
2
N2
M
3
N3
M
1
N3
M
2
N3
M
3
N1 0.0988±0.007 / *
* ** ** **
N2 0.1090±0.019
5 / * ** /
N3 0.1281±0.012
2 * / /
N1 0.0687±0.004 / / * **
Preprints (www.preprints.org) | NOT PEER-REVIEWED | Posted: 26 April 2018 doi:10.20944/preprints201804.0330.v1
Peer-reviewed version available at Int. J. Environ. Res. Public Health 2018, 15, 1217; doi:10.3390/ijerph15061217

26
M
1
6
N1
M
2
0.0759±0.010
4 / / /
N1
M
3
0.0759±0.008
9 ** *
N2
M
1
0.0833±0.010
3 / / /
N2
M
2
0.0824±0.004
2 ** /
N2
M
3
0.0932±0.006
1 /
N3
M
1
0.0885±0.007
5 / /
Preprints (www.preprints.org) | NOT PEER-REVIEWED | Posted: 26 April 2018 doi:10.20944/preprints201804.0330.v1
Peer-reviewed version available at Int. J. Environ. Res. Public Health 2018, 15, 1217; doi:10.3390/ijerph15061217
27
N3
M
2
0.0817±0.011
1 /
N3
M
3
0.0859±0.006
2
239
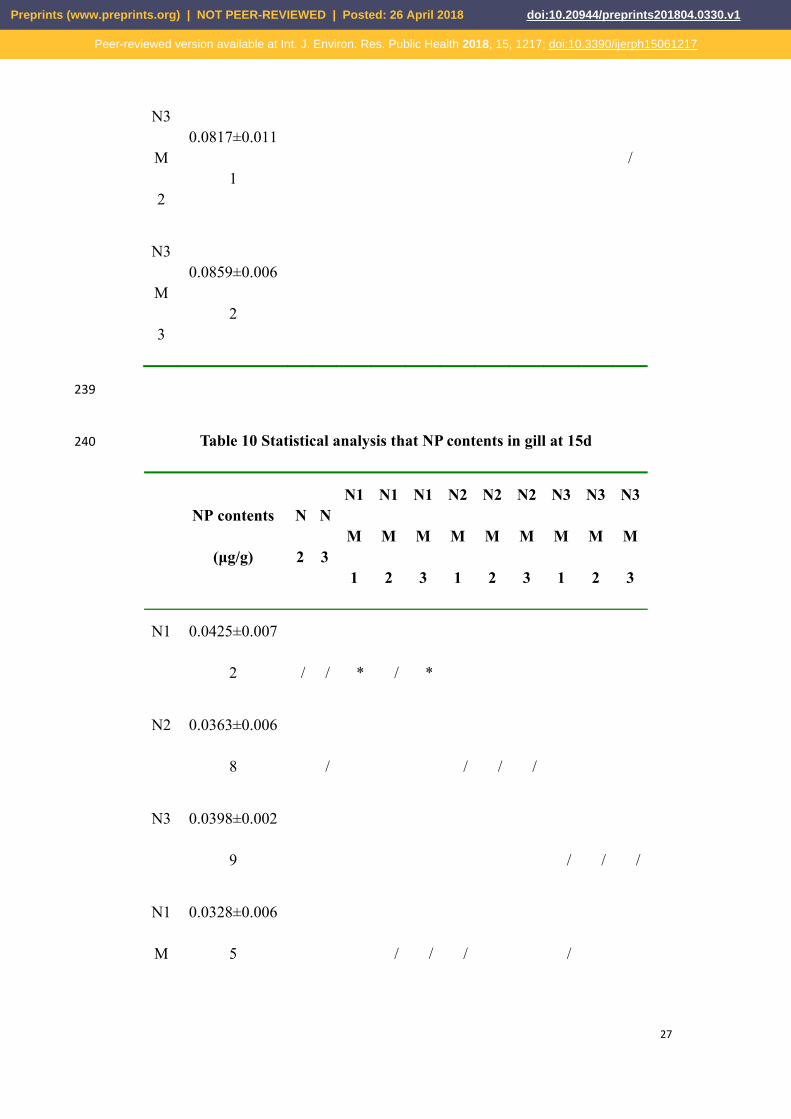
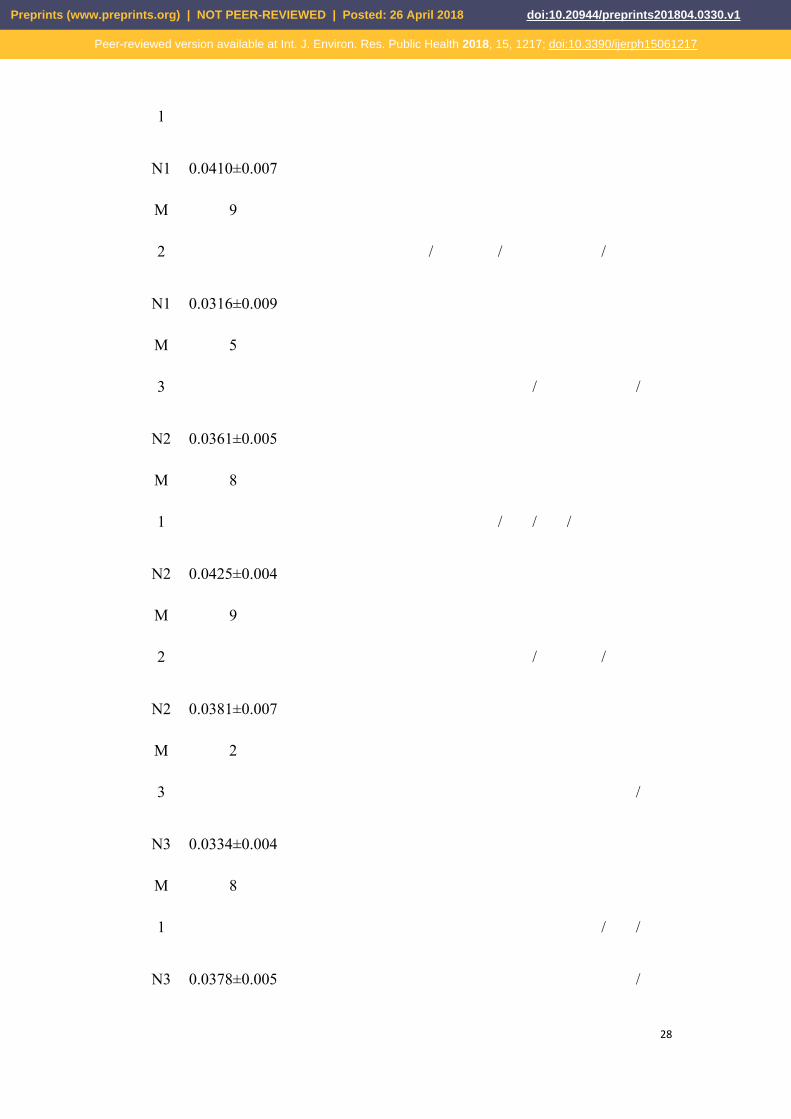
Table 10 Statistical analysis that NP contents in gill at 15d 240
NP contents
(μg/g)
N
2
N
3
N1
M
1
N1
M
2
N1
M
3
N2
M
1
N2
M
2
N2
M
3
N3
M
1
N3
M
2
N3
M
3
N1 0.0425±0.007
2 / / * / *
N2 0.0363±0.006
8 / / / /
N3 0.0398±0.002
9 / / /
N1
M
0.0328±0.006
5 / / / /
Preprints (www.preprints.org) | NOT PEER-REVIEWED | Posted: 26 April 2018 doi:10.20944/preprints201804.0330.v1
Peer-reviewed version available at Int. J. Environ. Res. Public Health 2018, 15, 1217; doi:10.3390/ijerph15061217
28
1
N1
M
2
0.0410±0.007
9
/ / /
N1
M
3
0.0316±0.009
5
/ /
N2
M
1
0.0361±0.005
8
/ / /
N2
M
2
0.0425±0.004
9
/ /
N2
M
3
0.0381±0.007
2
/
N3
M
1
0.0334±0.004
8
/ /
N3 0.0378±0.005 /
Preprints (www.preprints.org) | NOT PEER-REVIEWED | Posted: 26 April 2018 doi:10.20944/preprints201804.0330.v1
Peer-reviewed version available at Int. J. Environ. Res. Public Health 2018, 15, 1217; doi:10.3390/ijerph15061217

29
M
2
1
N3
M
3
0.0392±0.005
4
241
Table 11 Statistical analysis that NP contents in gill at 30d 242
NP contents
(μg/g)
N
2
N
3
N1
M
1
N1
M
2
N1
M
3
N2
M
1
N2
M
2
N2
M
3
N3
M
1
N3
M
2
N3
M
3
N1 0.0414±0.004
8 / / * * /
N2 0.0398±0.009
8 / / / /
N3 0.0430±0.003
6 * / /
N1
M
1
0.0309±0.008
6 / * / /
Preprints (www.preprints.org) | NOT PEER-REVIEWED | Posted: 26 April 2018 doi:10.20944/preprints201804.0330.v1
Peer-reviewed version available at Int. J. Environ. Res. Public Health 2018, 15, 1217; doi:10.3390/ijerph15061217
30
N1
M
2
0.0302±0.009
9 / / /
N1
M
3
0.0400±0.005
2 / /
N2
M
1
0.0308±0.005
4 / * *
N2
M
2
0.0398±0.010
3 / /
N2
M
3
0.0374±0.003
5 /
N3
M
1
0.0378±0.003
4 / /
N3
M
0.0385±0.005
7 /
Preprints (www.preprints.org) | NOT PEER-REVIEWED | Posted: 26 April 2018 doi:10.20944/preprints201804.0330.v1
Peer-reviewed version available at Int. J. Environ. Res. Public Health 2018, 15, 1217; doi:10.3390/ijerph15061217

31
2
N3
M
3
0.0406±0.007
2
243
Figure 3. Statistical analysis of the content variation of NP in gill at 7d, 15d and 30d. 244
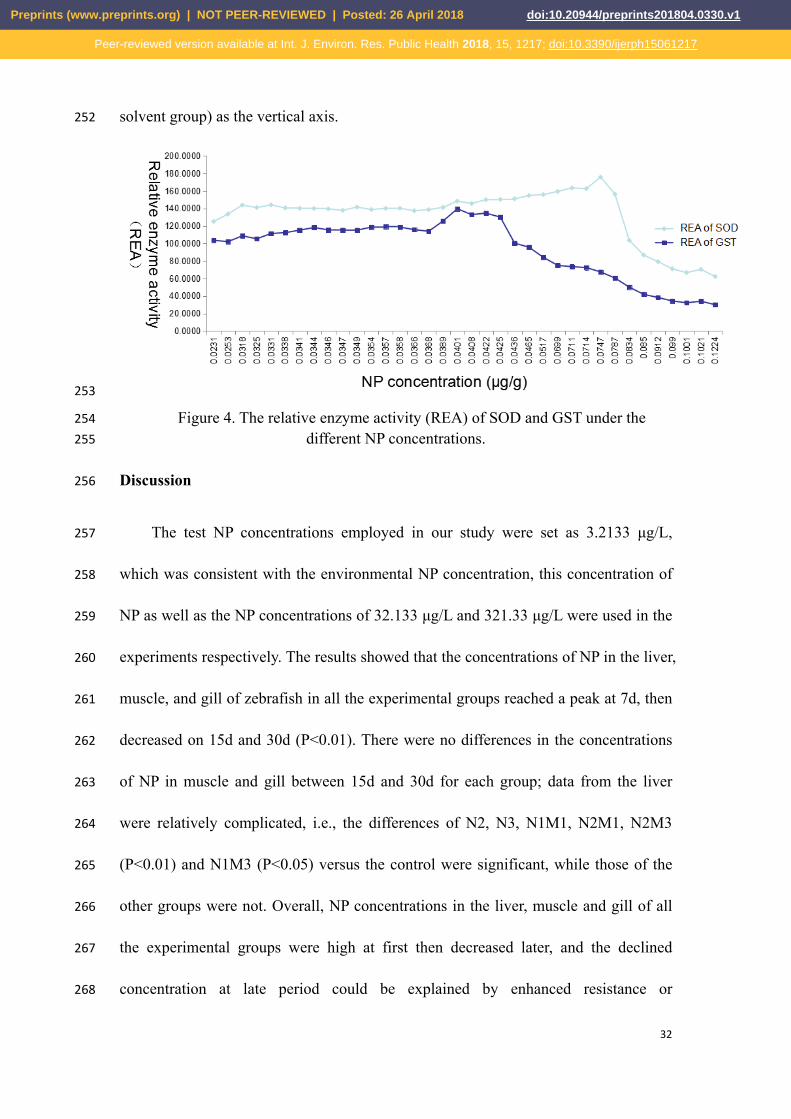
2.5 Enzymatic activity determinations 245
The average enzymatic activity of SOD and GST of zebrafish within aquaculture 246
water group, MMT group and organic solvent group in each time spots were detected 247
and data were analyzed. The results suggested that the MMT and the organic solvent 248
have no effect on the enzyme activity of SOD and GST (Figure 4). In figure 4, we set 249
the liver NP as the horizontal axis, the relative enzymatic activity (The average 250
enzymatic activity of experimental groups/The average enzymatic activity of organic 251
Preprints (www.preprints.org) | NOT PEER-REVIEWED | Posted: 26 April 2018 doi:10.20944/preprints201804.0330.v1
Peer-reviewed version available at Int. J. Environ. Res. Public Health 2018, 15, 1217; doi:10.3390/ijerph15061217
32
solvent group) as the vertical axis. 252
253
Figure 4. The relative enzyme activity (REA) of SOD and GST under the 254 different NP concentrations. 255
Discussion 256
The test NP concentrations employed in our study were set as 3.2133 μg/L, 257
which was consistent with the environmental NP concentration, this concentration of 258
NP as well as the NP concentrations of 32.133 μg/L and 321.33 μg/L were used in the 259
experiments respectively. The results showed that the concentrations of NP in the liver, 260
muscle, and gill of zebrafish in all the experimental groups reached a peak at 7d, then 261
decreased on 15d and 30d (P<0.01). There were no differences in the concentrations 262
of NP in muscle and gill between 15d and 30d for each group; data from the liver 263
were relatively complicated, i.e., the differences of N2, N3, N1M1, N2M1, N2M3 264
(P<0.01) and N1M3 (P<0.05) versus the control were significant, while those of the 265
other groups were not. Overall, NP concentrations in the liver, muscle and gill of all 266
the experimental groups were high at first then decreased later, and the declined 267
concentration at late period could be explained by enhanced resistance or 268
Preprints (www.preprints.org) | NOT PEER-REVIEWED | Posted: 26 April 2018 doi:10.20944/preprints201804.0330.v1
Peer-reviewed version available at Int. J. Environ. Res. Public Health 2018, 15, 1217; doi:10.3390/ijerph15061217
33
decomposition by the zebrafish. In the absence of MMT, enrichment of NP in the liver 269
at 7d was more significant at a lower dose of NP, namely N1 > N2 > N3 (P<0.01), 270
while at 15d and 30d, a higher enrichment effect was observed at higher dose; 271
accumulation of NP in the muscle at 7d and 15d was higher at N1 and N2 than at N3 272
(P < 0.01); while enrichment of NP in gills was not highly correlated to its 273
concentration. In the presence of MMT, enrichment of NP in the liver was 274
significantly decreased at 7d in all N1 groups (P<0.01), but such decreased 275
accumulation at N1 was only observed in N1M1 at 15d. Accumulation of NP was 276
enhanced in all N2 and N3 groups except for the N2M1 group (P<0.01), but such 277
enhanced accumulation was observed only in the N2M2 group till 30d. In the muscle, 278
enrichment of NP at 7d was reduced by MMT at N1 but increased by MMT at N2 and 279
N3, and the altered enrichment was maintained till 30d only in the N1M3 group. 280
Concentration of NP in gills was influenced by MMT, reduced in all the experimental 281
groups, but the difference was significant in only a few groups. In summary, as long 282
as there was significant difference, higher concentrations of MMT or NP always led to 283
higher accumulation of NP when the other was constant. 284
It can be speculated from the above-mentioned results that MMT exhibits 285
different enrichment effect on NP in zebrafish. MMT adsorbs NP and reduces the 286
actual concentration of NP by flocculation in water, and this effect is directly reflected 287
in the water-contacted gills, in which the short-term enrichment of NP is reduced by 288
MMT; once NP is ingested by the zebrafish, MMT contributes to the short-term 289
accumulation of NP in the liver at both medium and high doses and in the muscle at 290
Preprints (www.preprints.org) | NOT PEER-REVIEWED | Posted: 26 April 2018 doi:10.20944/preprints201804.0330.v1
Peer-reviewed version available at Int. J. Environ. Res. Public Health 2018, 15, 1217; doi:10.3390/ijerph15061217
34
high dose as well, but not to the accumulation of NP in the liver and muscle at low 291
dose. Analysis of experimental data also showed that the effects of MMT on NP 292
enrichment decrease gradually over time. Due to the limitation of this study that only 293
three time points were designed for each experimental group, further research is 294
required to identify the time points when maximum concentration of NP is achieved. 295
The enzyme activity of liver SOD and GST were affected by the organic NP 296
content. While the concentration of NP is lower than 0.00747 μg/g, the activity of 297
SOD would be induced. By contrast, the activity of SOD would be inhibited when the 298
concentration of NP is higher than 0.00747 μg/g, the inductive and inhibiting effect 299
would be increased with the increase of the concentration of NP; The concentration of 300
NP had a similar effect on the enzyme activity of GST while the critical concentration 301
is 0.0401 μg/g. The induced enzyme activity of SOD could reach 175.82 % compared 302
with the control enzyme activity, while the GST could only reach 139.65 % of the 303
control enzyme activity, which of these results suggested that the SOD is more 304
sensitive to the toxic effect of internal NP, and the NP has a more effective regulatory 305
mechanism on the enzyme activity of SOD. 306
Conclusion 307
According to our results, in the short term, MMT could possibly reduce the 308
enrichment of nonyl phenol in gill, and the high concentration of nonyl phenol is 309
benefit of enrich itself in liver and muscle, while the low concentration of nonyl 310
phenol would be against its enrichment. The enzymatic activity of SOD and GST 311
Preprints (www.preprints.org) | NOT PEER-REVIEWED | Posted: 26 April 2018 doi:10.20944/preprints201804.0330.v1
Peer-reviewed version available at Int. J. Environ. Res. Public Health 2018, 15, 1217; doi:10.3390/ijerph15061217
35
would exert inductive effect when the concentration of nonyl phenol in liver was 312
reduced, by contrast, the enzymatic activity of SOD and GST would exert inhibiting 313
effect while high-concentration of nonyl phenol was gathered in liver. 314
315
316
Conflict of interest: 317
The authors declare that they have no conflict of interest. 318
319
Acknowledgement: 320
This work was supported by the grant from Huzhou science and technology planning 321
project [grant number:2016GY04]. 322
323
References 324
1. Huihui Liu, Xianhai Yang, Cen Yin, Mengbi Wei, Xiao He. Development of 325
predictive models for predicting binding affinity of endocrine disrupting chemicals to 326
fish sex hormone-binding globulin. Ecotoxicology and Environmental Safety, 2017, 327
136: 46-54. 328
2. Kabir, E.R., Rahman, M.S., Rahman, I. A review on endocrine disruptors and their 329
possible impacts on human health. Environ. Toxicol. Pharmacol. 2015,40:241–258. 330
Kumar, V., Johnson, A.C., Trubiroha, A., Tumova, J., Ihara, M., Grabic, R., Kloas, W., 331
3. Tanaka, H., Kroupova, H.K.. The challenge presented by progestins in 332
ecotoxicological research: a critical review. Environ. Sci. Technol. 2015, 49: 2625–333
Preprints (www.preprints.org) | NOT PEER-REVIEWED | Posted: 26 April 2018 doi:10.20944/preprints201804.0330.v1
Peer-reviewed version available at Int. J. Environ. Res. Public Health 2018, 15, 1217; doi:10.3390/ijerph15061217
36
2638. 334
4. Sona Scsukova, Eva Rollerova, Alzbeta Bujnakova Mlynarcikova. Impact of 335
endocrine disrupting chemicals on onset and development of female reproductive 336
disorders and hormone-related cancer. Reproductive Biology. 2016, 16 :243-254. 337
5. Susan L. Teitelbaum, Fiorella Belpoggi, Les Reinlib. Advancing research on 338
endocrine disrupting chemicals in breast cancer: Expert panel recommendations. 339
Reproductive Toxicology. 2015, 54:141-147. 340
6. Paromita Deb, Arunoday Bhan, Imran Hussain, Khairul I. Ansari, Samara A. 341
Bobzean, Tej K. Pandita, Linda I. Perrotti, Subhrangsu S. Mandal. Endocrine 342
disrupting chemical, bisphenol-A, induces breast cancer associated gene HOXB9 343
expression in vitro and in vivo. Gene. 2016, 590:234-243. 344
7. Hu WY, Shi GB, Hu DP, Nelles JL, Prins GS. Actions of estrogens and endocrine 345
disrupting chemicals on human prostate stem/progenitor cells and prostate cancer risk. 346
Mol Cell Endocrinol. 2012, 354(1-2):63-73. 347
8. Ashley J, Moore A, Stapleton H.Sedimentary nonylphenol contamination in an 348
urbanized industrialized segment of the Delaware River Estuary. USA Bull 349
Environ.Contam.Toxicol, 2003, 5(70): 978-954. 350
9. Jin-Sung, ChoiJung-Hwa, OhHan-Jin, ParkMi-Sun, ChoiSe-Myo, ParkSeung-Jun, 351
KangMoon-Ju, OhSeung, Jun KimSeung, Yong HwangSeokjoo Yoon. miRNA 352
regulation of cytotoxic efects in mouse Sertoli cells exposed to nonylphenol. 353
Reproductive Biology and Endocrinology. 2011, 9(1):126. 354
10. Aly HA, Domench O, Banjar ZM.Effect of nonylphenol on male reproduction: 355
analysis of rat epididymal biochemical markers and antioxidant defense enzymes. 356
Toxicology and Applied Pharmacology. 2012, 261(2):134-141. 357
11. Genhong Yao, Y ali Hu, Junfeng Liang, Yali Hou.Nonylphenol-induced thymocyte 358
apoptosis is related to Fas/FasL pathway. Life Set. 2005,77:3306-3320. 359
12. Po-Ling Yu, Han-Wei Lin, Shyi-Wu Wang, Paulus S. Wang. Effects of 360
nonylphenol on the production of progesterone on the rats granulosa cells. Journal of 361
Cellular Biochemistryl Biochem. 2011, 112(9):2627-2636. 362
13. Lagos CR, Moreno RD. Contribution of environmental pollutants to male infertily: 363
Preprints (www.preprints.org) | NOT PEER-REVIEWED | Posted: 26 April 2018 doi:10.20944/preprints201804.0330.v1
Peer-reviewed version available at Int. J. Environ. Res. Public Health 2018, 15, 1217; doi:10.3390/ijerph15061217

37
a working model of germ cell apoptosis induced by plasticizers. Biological research. 364
2012,45(1):5-14. 365
14. Takahashi A, Higashitani T, Yakou Y, Saitou M, Tamamoto H, Tanaka H. 366
Evaluating bioaccumulation of suspected endocrine disruptors into periphytons 367
andbenthos in the Tama River. Water Sci Technol, 2003, 47(9): 71-83. 368
15. Zou E M. Current status of environmental endocrine disruption in selected aquatic 369
invertebrate. Acta Zool Sin, 2003, 49(5): 551-565. 370
16. Calabrese E.J, Baldwin L.A Hormesis. U-shaped dose responses and their 371
centrality in toxicology. Trends in Pharmacological Science, 2001, 22(6):285-291. 372
17. Calabrese E.J, Baldwin L.A. Toxicology rethinks its central belief: Hormesis 373
demands a reappraisal of the way risks are assessed. Nature 2003, 421:691-692. 374
18. Shi X, Gu A, Ji G, et al. Developmental toxicity of cypermethrin in embryo-larval 375
stages of zebrafish. Chemosphere, 2011,85(6):1010-1016. 376
19. Lin T, Yu S, Chen Y, et al. Integrated biomarker responses in zebrafish exposed to 377
sulfonamides. Environ Toxicol Pharmacol, 2014,38( 2):444-452. 378
20. Wu H, Gao C, Guo Y, et al. Acute toxicity and sublethal effects of fipronil on 379
detoxification enzymes in juvenile zebrafish ( Danio rerio) . Pestic Biochem Physiol, 380
2014,115: 9-14. 381
21. Chen G, Qing CS, Chen TH, Li XX, Song YX, Peng SC. Study on decoloration of 382
acidic scarlet GR by pyrolusite oxidation under an acid condition. Acta Geologic 383
Sinica-English Edition. 2006,80:257-261. 384
22. Wang DM, Hu J, Irons MS, Wang JM. Synergistic toxic effect of nano-TiO2 And 385
As(V) on Ceriodaphnia dubia. Sci Total Environ. 2011,409:1351-1356. 386
23. Wei HR, Deng SB, Huan Q, Nie Y, Wang B, Huang J, Yu G. Degenerable granular 387
carbon nanotubes/alumina hybrid adsorbents for declofenac sodium and 388
carbamazepine removal from aqueous solution. Water Res. 2013, 47:4139-4147. 389
24. Tomb CZE, Szekeres M. Surface charge heterogeneity of kaolinite in aqueous 390
suspension in comparison with montmorillonite. Applied Clay Science. 391
2006,34(1):105-124. 392
Preprints (www.preprints.org) | NOT PEER-REVIEWED | Posted: 26 April 2018 doi:10.20944/preprints201804.0330.v1
Peer-reviewed version available at Int. J. Environ. Res. Public Health 2018, 15, 1217; doi:10.3390/ijerph15061217

38
25. Qin F, Shan X Q. Adsorption of Cu2+ on montmorillonite as affected by 393
2,4-dichlorophenocyacetic acid(2,4-D). Bulletin of Environmnetal Contamination and 394
Toxicology, 2006, 76(1): 179-186. 395
26. Wang Y J, Zhou D M, Luo X S. Cadmium adsorption in montmorillonite sa 396
afected by glyphosate. Jouroal ofEnviron-mental Sciences. 2004, 16(6): 881-884. 397
27. Xia M, Hu C, Xu Z. Effects of copper-bearing montmorillonite on growth 398
performance, digestive enzyme activities, and intestinal microflora and morphology of 399
male broiler. Poultry Science. 2004,83(11):1868-1875. 400
28. M L. Microflora of the digestive tract: critical factors and consequences for 401
poultry. Worlds Poultry Science Journal, 2006, 62(3):499-511. 402
29. YH Shi, ZR Xu, JL Feng, CZ Wang. Efficacy of modified montmorillonite 403
nanocomposite to reduce the toxicity of aflatoxin in broiler chicks. Animal Feed 404
Science and Technology. 2006, 129 (1): 138-148. 405
30. Dolf van Wijk, Mirjam Gyimesi-van den Bos, Irmgard Garttener-Arends, Marc 406
Geurts, Jorke Kamstra, Paul Thomas. Bioavailability and detoxification of cationics: I. 407
Algal toxicity of alkyltrimethyl ammonium salts in the presence of suspended 408
sediment and humic acid . Chemosphere. 2009,75 (3) :303-309. 409
31. Rivera-Jimenez. SM, Lehner. MM, Cabrera-Lafaurie.WA, Hernandez-Maldonado. 410
AJ. Removal of Naproxen, Salicylic Acid, Clofibric Acid, and Carbamazepine by 411
Water Phase Adsorption onto Inorganic-Organic-Intercalated Bentonites Modified 412
with Transition Metal Cations. Environmental engineering science. 2011, 28 (3): 413
171-182. 414
32. Gaspar Banfalvi. Removal of insoluble heavy metal sulfides from water. 415
Chemospbere, 2006, 63:1231-1234. 416
33. Wei Daia, Huahua Du, Linglin Fu, Huitao Liu, Zirong Xu. Effect of 417
montmorillonite on dietary lead (Pb) accumulation in tissues of tilapia (Oreochromis 418
niloticus). Applied Clay Science. 2010, 47(3):193-195. 419
34. Wei Dai, Linglin, FuHuahua, DuHuitao, LiuZirong Xu. Effects of 420
Montmorillonite on Pb Accumulation, Oxidative Stress, and DNA Damage in Tilapia 421
(Oreochromis niloticus) Exposed to Dietary Pb. Biological Trace Element Research. 422
2010, 136(1):71-78. 423
Preprints (www.preprints.org) | NOT PEER-REVIEWED | Posted: 26 April 2018 doi:10.20944/preprints201804.0330.v1
Peer-reviewed version available at Int. J. Environ. Res. Public Health 2018, 15, 1217; doi:10.3390/ijerph15061217

39
35. A.J. Ramos, E. Hernández. In vitro aflatoxin adsorption by means of a 424
montmorillonite silicate. A study of adsorption isotherms. Animal Feed Science and 425
Technology. 1996, 62(2): 263-269. 426
36. CA Bailey, G. W. Latimer, AC Barr, L. F. Kubena. Efficacy of Montmorillonite 427
Clay (NovaSil PLUS) for Protecting Full-Term Broilers from Aflatoxicosis. The 428
Journal of Applied Poultry Research. 2006,15(2):198-206. 429
37. Lee S M, Cho S H, Kim D J. Effects of feeding frequency and dietary energy level 430
on growth and body composition of juvenile flounder, Paralichthys olivaceus 431
(Temminck & Schlegel). Aquac Res, 2002, 31: 917-921. 432
Preprints (www.preprints.org) | NOT PEER-REVIEWED | Posted: 26 April 2018 doi:10.20944/preprints201804.0330.v1
Peer-reviewed version available at Int. J. Environ. Res. Public Health 2018, 15, 1217; doi:10.3390/ijerph15061217