Abnormal relationship between GABA, neurophysiology and impulsive behavior in neurofibromatosis type...
15
Research report Abnormal relationship between GABA, neurophysiology and impulsive behavior in neurofibromatosis type 1 Maria J. Ribeiro a,* , In ^ es R. Violante a , In ^ es Bernardino a , Richard A.E. Edden b,c and Miguel Castelo-Branco a a IBILI e Faculty of Medicine, University of Coimbra, Portugal b Russell H. Morgan Department of Radiology and Radiological Science, The Johns Hopkins University School of Medicine, Baltimore, MD, USA c F.M. Kirby Center for Functional Brain Imaging, Kennedy Krieger Institute, Baltimore, MD, USA article info Article history: Received 10 January 2014 Reviewed 7 July 2014 Revised 4 August 2014 Accepted 27 October 2014 Action editor Ahmad R. Hariri Published online 11 November 2014 Keywords: Electroencephalography Impulse control disorders Prefrontal cortex Magnetic resonance spectroscopy Gamma-aminobutyric acid Neurofibromatosis type 1 abstract Neurofibromatosis type 1 (NF1) is a neurodevelopmental disorder characterized by a broad spectrum of cognitive deficits. In particular, executive dysfunction is recognized as a core deficit of NF1, including impairments in executive attention and inhibitory control. Yet, the neural mechanisms behind these important deficits are still unknown. Here, we studied inhibitory control in a visual go/no-go task in children and adolescents with NF1 and age- and gender-matched controls (n ¼ 16 per group). We applied a multi- modal approach using high-density electroencephalography (EEG), to study the evoked brain responses, and magnetic resonance spectroscopy (MRS) to measure the levels of GABA and glutamate þ glutamine in the medial frontal cortex, a brain region that plays a pivotal role in inhibitory control, and also in a control region, the occipital cortex. Finally, we run correlation analyses to identify the relationship between inhibitory control, levels of neurotransmitters, and EEG markers of neural function. Individuals with NF1 showed impaired impulse control and reduced EEG correlates of early visual processing (parieto-occipital P1) and inhibitory control (frontal P3). MRS data revealed a reduction in medial frontal GABAþ/tCr (total Creatine) levels in the NF1 group, in parallel with the already reported reduced occipital GABA levels. In contrast, glutamate þ glutamine/tCr levels were normal, suggesting the existence of abnormal in- hibition/excitation balance in this disorder. Notably, medial frontal but not occipital GABA levels correlated with general intellectual abilities (IQ) in NF1, and inhibitory control in both groups. Surprisingly, the relationship between inhibitory control and medial frontal GABA was reversed in NF1: higher GABA was associated with a faster response style whereas in controls it was related to a cautious strategy. * Corresponding author. IBILI e Faculty of Medicine, University of Coimbra, Az. de Sta Comba, 3000-548 Coimbra, Portugal. E-mail addresses: [email protected] (M.J. Ribeiro), [email protected] (I.R. Violante), [email protected] (R.A.E. Edden), [email protected] (M. Castelo-Branco). Available online at www.sciencedirect.com ScienceDirect Journal homepage: www.elsevier.com/locate/cortex cortex 64 (2015) 194 e208 http://dx.doi.org/10.1016/j.cortex.2014.10.019 0010-9452/© 2014 Elsevier Ltd. All rights reserved.
Transcript of Abnormal relationship between GABA, neurophysiology and impulsive behavior in neurofibromatosis type...

www.sciencedirect.com
c o r t e x 6 4 ( 2 0 1 5 ) 1 9 4e2 0 8
Available online at
ScienceDirect
Journal homepage: www.elsevier.com/locate/cortex
Research report
Abnormal relationship between GABA,neurophysiology and impulsive behaviorin neurofibromatosis type 1
Maria J. Ribeiro a,*, Ines R. Violante a, Ines Bernardino a,Richard A.E. Edden b,c and Miguel Castelo-Branco a
a IBILI e Faculty of Medicine, University of Coimbra, Portugalb Russell H. Morgan Department of Radiology and Radiological Science, The Johns Hopkins University School of
Medicine, Baltimore, MD, USAc F.M. Kirby Center for Functional Brain Imaging, Kennedy Krieger Institute, Baltimore, MD, USA
a r t i c l e i n f o
Article history:
Received 10 January 2014
Reviewed 7 July 2014
Revised 4 August 2014
Accepted 27 October 2014
Action editor Ahmad R. Hariri
Published online 11 November 2014
Keywords:
Electroencephalography
Impulse control disorders
Prefrontal cortex
Magnetic resonance spectroscopy
Gamma-aminobutyric acid
Neurofibromatosis type 1
* Corresponding author. IBILI e Faculty of ME-mail addresses: [email protected] (
[email protected] (M. Castelo-Branco).http://dx.doi.org/10.1016/j.cortex.2014.10.0190010-9452/© 2014 Elsevier Ltd. All rights rese
a b s t r a c t
Neurofibromatosis type 1 (NF1) is a neurodevelopmental disorder characterized by a broad
spectrum of cognitive deficits. In particular, executive dysfunction is recognized as a core
deficit of NF1, including impairments in executive attention and inhibitory control. Yet, the
neural mechanisms behind these important deficits are still unknown.
Here, we studied inhibitory control in a visual go/no-go task in children and adolescents
with NF1 and age- and gender-matched controls (n ¼ 16 per group). We applied a multi-
modal approach using high-density electroencephalography (EEG), to study the evoked
brain responses, and magnetic resonance spectroscopy (MRS) to measure the levels of
GABA and glutamate þ glutamine in the medial frontal cortex, a brain region that plays a
pivotal role in inhibitory control, and also in a control region, the occipital cortex. Finally,
we run correlation analyses to identify the relationship between inhibitory control, levels
of neurotransmitters, and EEG markers of neural function.
Individuals with NF1 showed impaired impulse control and reduced EEG correlates of
early visual processing (parieto-occipital P1) and inhibitory control (frontal P3). MRS data
revealed a reduction in medial frontal GABAþ/tCr (total Creatine) levels in the NF1 group, in
parallel with the already reported reduced occipital GABA levels. In contrast,
glutamate þ glutamine/tCr levels were normal, suggesting the existence of abnormal in-
hibition/excitation balance in this disorder. Notably, medial frontal but not occipital GABA
levels correlated with general intellectual abilities (IQ) in NF1, and inhibitory control in
both groups. Surprisingly, the relationship between inhibitory control and medial frontal
GABA was reversed in NF1: higher GABA was associated with a faster response style
whereas in controls it was related to a cautious strategy.
edicine, University of Coimbra, Az. de Sta Comba, 3000-548 Coimbra, Portugal.M.J. Ribeiro), [email protected] (I.R. Violante), [email protected] (R.A.E. Edden),
rved.

c o r t e x 6 4 ( 2 0 1 5 ) 1 9 4e2 0 8 195
Abnormal GABAergic physiology appears, thus, as an important factor underlying
impaired cognition in NF1, in a level and region dependent manner.
© 2014 Elsevier Ltd. All rights reserved.
1. Introduction
Neurofibromatosis type 1 (NF1) is a multisystem neuro-
developmental disorder caused by mutations in the NF1 gene
(Tonsgard, 2006). In particular, NF1 affects the structure,
function and neurochemistry of the central nervous system,
leading to learning impairments (Payne, Moharir, Webster, &
North, 2010; Violante, Ribeiro, Edden, et al., 2013). In-
dividuals with NF1 present increased white matter volume,
particularly within the frontal lobe and the corpus callosum,
as well as increased grey matter volume, particularly in the
thalamus and right caudate nucleus (Duarte et al., 2014; Payne
et al., 2010; Violante, Ribeiro, Silva, & Castelo-Branco, 2013).
Reduced integrity of whitemattermicrostructure is also found
in NF1, suggesting a reduction in effective structural connec-
tivity (Karlsgodt et al., 2012). Functional magnetic resonance
imaging (fMRI) studies have suggested functional deficits in
several brain regions including deficient visually evoked
activation of occipital, temporal and parietal brain regions
(Clements-Stephens, Rimrodt, Gaur, & Cutting, 2008; Violante
et al., 2012) and abnormal engagement of the frontal lobe
(Billingsley et al., 2004; Clements-Stephens et al., 2008; Shi-
lyansky et al., 2010; Violante et al., 2012). Furthermore, mag-
netic resonance spectroscopy (MRS), an in vivo tool capable of
non-invasively measuring brain metabolites, has revealed
neurochemical anomalies in patients with NF1 (Nicita et al.,
2014; Violante, Ribeiro, Edden, et al., 2013). In particular,
GABA levels have been shown to be significantly reduced in
the occipital cortex of individuals with NF1 (Violante, Ribeiro,
Edden, et al., 2013). This finding is important because research
in NF1 mice models suggests that abnormal GABAergic
neurotransmission is the main cause of NF1 cognitive deficits
(Costa et al., 2002; Li et al., 2005).
The distributed structural and functional neural anomalies
observed in NF1 are consistent with the lack of consensus
regarding the NF1 cognitive profile. Indeed, deficits in visual
abilities, attention, memory, motor skills, language and ex-
ecutive function indicate a broad cognitive phenotype
(Descheemaeker, Ghesquiere, Symons, Fryns, & Legius, 2005;
Hyman, Shores, & North, 2005; Levine, Materek, Abel,
O'Donnell, & Cutting, 2006; Ozonoff, 1999). Nevertheless, ex-
ecutive dysfunction is increasingly recognized as a core deficit
in NF1 with difficulties in response inhibition commonly
observed (Ferner, Hughes, & Weinman, 1996; Gilboa et al.,
2011; Huijbregts, Swaab, & de Sonneville, 2010; Rowbotham,
Pit-ten Cate, Sonuga-Barke, & Huijbregts, 2009). Deficient
inhibitory control has been associated with low quality of life
and poor academic and job achievements (Diamond, 2013). In
NF1, impaired inhibitory control is related with social and
emotional problems (Huijbregts & de Sonneville, 2011). Yet,
the neural mechanisms behind impaired inhibitory control in
NF1 are still unknown.
Being one of the most common monogenic disorders
affecting brain function, NF1 provides a unique genetic model
to identify and dissectmechanistically the neurochemical and
brain functional bases underlying cognitive dysfunction. The
main aim of this study was to characterize the neural corre-
lates of impaired response inhibition in NF1 by examining
both neurochemistry and the neurophysiologic responses in
relation to a behavioral experimental model of impulsivity e a
visual go/no-go task. Go/no-go tasks involve the ability to
control impulsive behavior and the performance metrics
correlate with symptoms of inattention, hyperactivity and
impulsivity (Epstein et al., 2003). Given the previously
described deficit in response inhibition in NF1, we hypothe-
sized that individuals with NF1 would show difficulties in
inhibiting the motor response in no-go trials. fMRI, electro-
encephalography (EEG) and lesion studies suggest the
involvement of the medial frontal cortex including the ante-
rior cingulate and pre-supplementary motor area in go/no-go
task performance (Huster, Westerhausen, Pantev, & Konrad,
2010; Picton et al., 2007; Rubia et al., 2001; Simmonds, Pekar,
& Mostofsky, 2008). Reduced activity within a medial frontal
cluster comprising the supplementary motor area and the
anterior cingulate cortex, has been linkedwith poor inhibitory
control in patients with attention-deficit/hyperactivity disor-
der (ADHD) (Hart, Radua, Nakao, Mataix-Cols, & Rubia, 2013).
Moreover, several studies show that disruption of the activity
of superior medial frontal cortex affects inhibitory control
(Chen, Muggleton, Tzeng, Hung, & Juan, 2009; Obeso, Robles,
Marron, & Redolar-Ripoll, 2013). Interestingly, during adoles-
cence, poor go/no-go performance in healthy individuals has
been shown to be related with lower GABA levels in the
anterior cingulate cortex (Silveri et al., 2013). Thus, the region
of the medial frontal cortex comprising the anterior cingulate
cortex, the pre-supplementary motor area and the supple-
mentary motor area appears as a fundamental part of the
circuit underlying inhibitory control. Given the GABAergic
deficits already described in NF1, we sought to determine
whether abnormal GABA levels in the medial frontal cortex,
comprising the anterior cingulate cortex and the pre-
supplementary motor area, might underlie inhibitory deficits
in NF1. We hypothesized that the role of GABA in inhibitory
control is region specific and therefore we also tested whether
reduced levels of GABA in a control region, the occipital cor-
tex, correlated with inhibitory control. The study of GABA
levels in these two brain regions, allowed the investigation of
the regional specificity of GABAergic alterations and their
contribution to behavioral deficits. The EEG recordings aimed
at determining if the GABA levels were related with the
bioelectrical responses thus linking biochemistry to brain
functional measures. In addition, the EEG data enabled the
analysis of the spatiotemporal dynamics of the different
stages of sensorimotor processing elicited during go/no-go
c o r t e x 6 4 ( 2 0 1 5 ) 1 9 4e2 0 8196
task performance. In particular, we analyzed the neural cor-
relates of sensory processing, stimulus evaluation and
response inhibition. To assess sensory processing, we studied
the visual evoked potentials (VEPs) P1 and N1 over parieto-
occipital scalp sites. These responses are sensitive to low-
level stimulus properties, as well as attentional control
including selective attention to task-relevant stimuli and state
of arousal (Codispoti, Ferrari, Junghofer, & Schupp, 2006;
Dockree, Kelly, Robertson, Reilly, & Foxe, 2005; Vogel & Luck,
2000). Evaluation of task-relevant stimuli is reflected in P3b,
a late positive deflection observed over the parietal scalp (Kok,
2001; Polich, 2007). Thus, to assess cognitive stimulus evalu-
ation processes, we compared the amplitudes of the P3b
response of both groups. Finally, to study the neural correlates
of response inhibition, we studied the fronto-central N2 and
P3 responses. These two event-related potentials (ERPs) have
been implicated in response inhibition processes and are
believed to originate from regions within the medial frontal
cortex (Huster, Enriquez-Geppert, Lavallee, Falkenstein, &
Herrmann, 2013; Huster et al., 2010; Nieuwenhuis, Yeung, van
den Wildenberg, & Ridderinkhof, 2003).
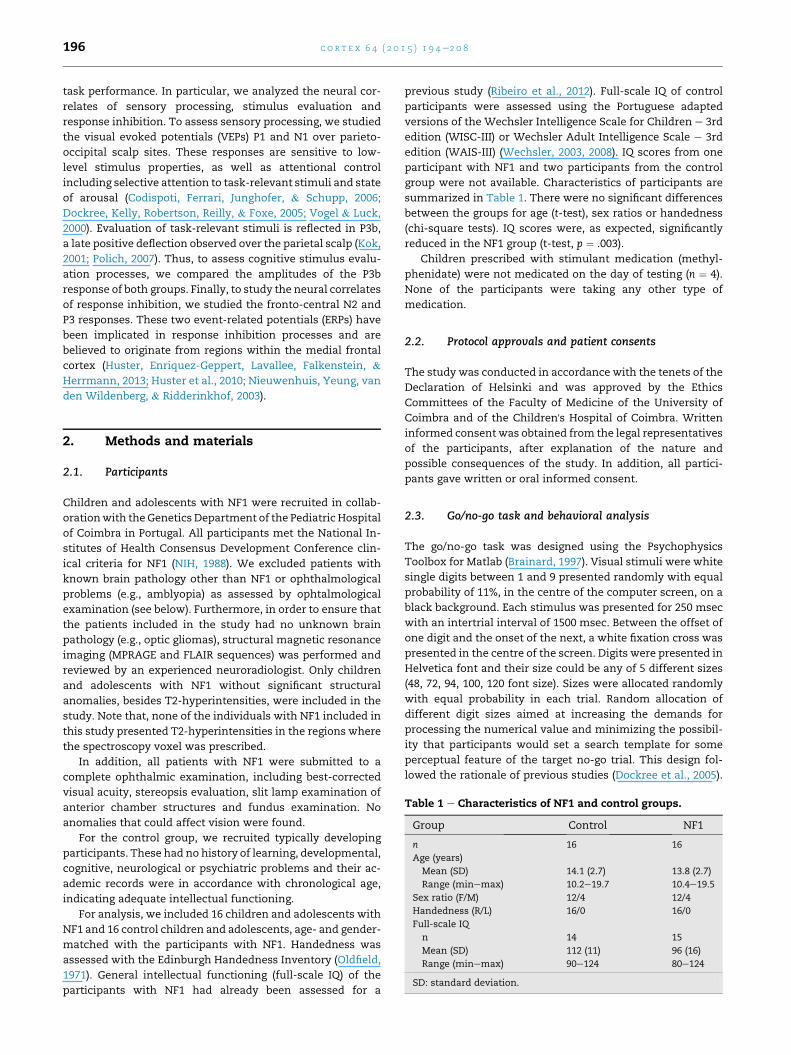
Table 1 e Characteristics of NF1 and control groups.
Group Control NF1
n 16 16
Age (years)
Mean (SD) 14.1 (2.7) 13.8 (2.7)
Range (minemax) 10.2e19.7 10.4e19.5
Sex ratio (F/M) 12/4 12/4
Handedness (R/L) 16/0 16/0
Full-scale IQ
n 14 15
Mean (SD) 112 (11) 96 (16)
Range (minemax) 90e124 80e124
SD: standard deviation.
2. Methods and materials
2.1. Participants
Children and adolescents with NF1 were recruited in collab-
orationwith the Genetics Department of the Pediatric Hospital
of Coimbra in Portugal. All participants met the National In-
stitutes of Health Consensus Development Conference clin-
ical criteria for NF1 (NIH, 1988). We excluded patients with
known brain pathology other than NF1 or ophthalmological
problems (e.g., amblyopia) as assessed by ophtalmological
examination (see below). Furthermore, in order to ensure that
the patients included in the study had no unknown brain
pathology (e.g., optic gliomas), structural magnetic resonance
imaging (MPRAGE and FLAIR sequences) was performed and
reviewed by an experienced neuroradiologist. Only children
and adolescents with NF1 without significant structural
anomalies, besides T2-hyperintensities, were included in the
study. Note that, none of the individuals with NF1 included in
this study presented T2-hyperintensities in the regions where
the spectroscopy voxel was prescribed.
In addition, all patients with NF1 were submitted to a
complete ophthalmic examination, including best-corrected
visual acuity, stereopsis evaluation, slit lamp examination of
anterior chamber structures and fundus examination. No
anomalies that could affect vision were found.
For the control group, we recruited typically developing
participants. These had no history of learning, developmental,
cognitive, neurological or psychiatric problems and their ac-
ademic records were in accordance with chronological age,
indicating adequate intellectual functioning.
For analysis, we included 16 children and adolescents with
NF1 and 16 control children and adolescents, age- and gender-
matched with the participants with NF1. Handedness was
assessed with the Edinburgh Handedness Inventory (Oldfield,
1971). General intellectual functioning (full-scale IQ) of the
participants with NF1 had already been assessed for a
previous study (Ribeiro et al., 2012). Full-scale IQ of control
participants were assessed using the Portuguese adapted
versions of the Wechsler Intelligence Scale for Children e 3rd
edition (WISC-III) or Wechsler Adult Intelligence Scale e 3rd
edition (WAIS-III) (Wechsler, 2003, 2008). IQ scores from one
participant with NF1 and two participants from the control
group were not available. Characteristics of participants are
summarized in Table 1. There were no significant differences
between the groups for age (t-test), sex ratios or handedness
(chi-square tests). IQ scores were, as expected, significantly
reduced in the NF1 group (t-test, p ¼ .003).
Children prescribed with stimulant medication (methyl-
phenidate) were not medicated on the day of testing (n ¼ 4).
None of the participants were taking any other type of
medication.
2.2. Protocol approvals and patient consents
The study was conducted in accordance with the tenets of the
Declaration of Helsinki and was approved by the Ethics
Committees of the Faculty of Medicine of the University of
Coimbra and of the Children's Hospital of Coimbra. Written
informed consent was obtained from the legal representatives
of the participants, after explanation of the nature and
possible consequences of the study. In addition, all partici-
pants gave written or oral informed consent.
2.3. Go/no-go task and behavioral analysis
The go/no-go task was designed using the Psychophysics
Toolbox for Matlab (Brainard, 1997). Visual stimuli were white
single digits between 1 and 9 presented randomly with equal
probability of 11%, in the centre of the computer screen, on a
black background. Each stimulus was presented for 250 msec
with an intertrial interval of 1500 msec. Between the offset of
one digit and the onset of the next, a white fixation cross was
presented in the centre of the screen. Digits were presented in
Helvetica font and their size could be any of 5 different sizes
(48, 72, 94, 100, 120 font size). Sizes were allocated randomly
with equal probability in each trial. Random allocation of
different digit sizes aimed at increasing the demands for
processing the numerical value and minimizing the possibil-
ity that participants would set a search template for some
perceptual feature of the target no-go trial. This design fol-
lowed the rationale of previous studies (Dockree et al., 2005).

c o r t e x 6 4 ( 2 0 1 5 ) 1 9 4e2 0 8 197
Participants were asked to respond to all digits except “3” by
pressing a buttonwith the right index finger. Thus, digits “1, 2”
and “4e9”were the go stimuli and digit “3” the no-go stimulus,
and no-go probability was 11%. The presence or absence of a
button-press was assessed for each trial, as well as the reac-
tion time for go trials. No-go trials (trials where the digit “3”
was presented) were considered correct withholds when there
was no button press or errors of commission (failures to with-
hold the motor response) when there was a button-press. Go
trials with no button press were considered errors of omission.
The experimental procedure consisted of two runs of
5.63 min each. Each run contained 225 trials including 25 no-
go trials and 200 go trials. Behavioral and EEG data of both
runs were appended together for analysis.
2.4. EEG acquisition and analysis
EEG signal was recorded using a 64-channel Neuroscan sys-
tem with scalp electrodes placed according to the Interna-
tional 10e20 electrode placement standard andwith reference
between the electrodes CPZ and CZ and ground between FPZ
and FZ. Acquisition rate was 1000 Hz. Vertical and horizontal
electrooculograms were recorded in order to correct and/or
reject artifacts caused by blinking and eye movements. A
trigger pulse was generated at the onset of each stimulus and
at every button-press.
EEG data analysis was performed with Analyzer 2.0 from
Brain Products GmbH. The data from the two runs were
appended together and downsampled to 256 Hz, re-referenced
to average reference and bandpass filtered using the Butter-
worth Zero Phase Filter with cutoff frequencies of .5 and
100 Hz and attenuation of 12 dB/octave. Ocular artifacts were
corrected using an independent component analysis-based
correction process. The continuous data were cut into seg-
ments locked with the stimuli onset and segments contami-
nated with muscle activity were rejected using a semi-
automatic routine. A baseline was set from �200 msec to
stimulus onset. For quantification and topography assess-
ment, the EEG segments were transformed to current source
density (CSD) (Perrin, Pernier, Bertrand, & Echallier, 1989). The
CSD transform produces reference-free signals and spatial
enhancement of the recorded EEG activity, which is important
Table 2 e Summary of neuroelectric responses.
Peak Latency window Electrodes
Early sensory responses
P1 109e149 msec Left: O1, PO3, PO5
Right: O2, PO4, PO6
N1 164e204 msec Left: PO5, P5, P3 �Right: PO6, P6, P4
Sensory evaluation
P3b 520e620 msec Pz, CPz, Cz
Inhibitory control
N2 380e420 msec F1, Fz, F2
P3 450e550 msec FC1, FCz, FC2
SE: standard error.
for a reliable topography analysis (Yordanova, Kolev,
Hohnsbein, & Falkenstein, 2004).
We compared the CSD responses between go and no-go
stimuli. The number of segments averaged in the go condi-
tion was equated to the number of segments averaged in the
no-go condition for each participant by randomly selecting
segments from artifact-free go trials. The number of segments
averaged was not significantly different across the groups
[mean number of trials averaged (standard deviation, SD):
NF1 ¼ 46 (4), CNT ¼ 47 (2); data normally distributed; t-test
comparisons between groups, n.s.].
The control grand-average CSD waveforms were visually
inspected to delineate the latency windows of the ERPs of
interest and determine the scalp-sites of maximal amplitude
for each response (Dockree et al., 2005; Wylie, Javitt, & Foxe,
2003). The standard VEPs P1 and N1 were observed over
parieto-occipital scalp sites; the classical N2/P3 complex was
detected over fronto-central midline scalp sites (Huster et al.,
2013) and P3b over centro-parietal scalp (Polich, 2007). For
analysis, we chose the three electrodes that best represented
the maximal topography of the peak of interest (Wylie et al.,
2003). Peak amplitude measures for each electrode were
derived by calculating the area under the average CSD wave-
form (compared to the baseline) within a latency window
centered on the mean peak latency (as determined through
inspection of grand average waveforms). The width of the
latency window was chosen depending on the duration and
spatial extent of each peak (Dockree et al., 2005; Wylie et al.,
2003). The time windows and electrodes chosen for analysis
are shown in Table 2. VEPs P1 and N1 showed bilateral re-
sponses and thus 3 homologous electrodes in each hemi-
sphere were chosen for analysis.
2.5. Acquisition of MRI data
The MRI data described here was acquired as part of a larger
study, part of which has already been published (Violante,
Ribeiro, Edden, et al., 2013). The MRI acquisition session con-
sisted of a T1-weighted MPRAGE sequence 1 mm3 isotropic
voxel, repetition time (TR) 2.3 sec, echo time (TE) 2.98 msec,
inversion time (TI) 900 msec, flip angle (FA) 9�, field of view
(FOV) 256 � 256, 160 slices, GRAPPA acceleration factor ¼ 2, a
Control amplitude values NF1 amplitude values
Mean (SE) mV/m2 Mean (SE) mV/m2
Go No-go Go No-go
28.8 (6.5) 23.4 (6.9) 13.2 (3.6) 10.3 (3.9)
16.2 (4.7) �19.6 (4.1) �7.8 (6.5) �11.0 (6.3)
8.3 (3.5) 37.2 (8.0) 4.9 (3.7) 34.3 (7.7)
�9.2 (2.9) �10.8 (3.2) �14.2 (4.2) �13.2 (4.7)
3.5 (2.7) 16.3 (6.2) �7.5 (3.5) 1.9 (5.7)

c o r t e x 6 4 ( 2 0 1 5 ) 1 9 4e2 0 8198
T2-weighted FLAIR sequence, 1 mm3 isotropic voxel, TR 5 sec,
TE 2.98 msec, TI 1.8 sec, FOV 250 � 250, 160 slices, GRAPPA
acceleration factor ¼ 2, a functional MRI acquisition and two
GABA-edited magnetic resonance spectra using the MEGA-
PRESS method (Edden & Barker, 2007; Mescher, Merkle,
Kirsch, Garwood, & Gruetter, 1998), one spectrum positioned
within the occipital cortex, as described in (Violante, Ribeiro,
Edden, et al., 2013) and the other positioned within the
medial frontal cortex. The medial frontal voxel was placed
over the midline in a region comprising the bilateral dorsal
anterior cingulate cortex, between the cingulate and the per-
icallosal sulci. Both voxels were (3 cm)3 isotropic, TE 68 msec,
TR 1.5 sec, 196 averages, 1024 data points. During odd number
acquisitions a frequency-selective inversion pulse was
applied to the GABA-C3 resonance at 1.9 ppm (“On reso-
nance”). During even number acquisitions the pulse was
applied at 7.5 ppm (“Off resonance”). In this manuscript, we
present the MRS data acquired within the medial frontal
cortex. T1-weighted images were used for MRS voxel place-
ment and image segmentation.
2.6. Brain structural MRI data analysis
Segmentation of T1-weighted imageswas performed using in-
house software written in Matlab7 (The MathWorks Inc) and
the VBM8 toolbox in SPM8 (http://www.fil.ion.ucl.ac.uk/spm)
and applied to determine the relative proportions of grey
matter, white matter and cerebrospinal fluid in the voxel.
2.7. MRS data analysis
Spectra from all subjects were inspected for movement arti-
facts. A difference spectrum was generated for each partici-
pant (“On resonance”-“Off resonance”). Using the Gannet
software written in Matlab (Edden, Puts, Harris, Barker, &
Evans, 2014), we applied 4 Hz exponential line broadening to
all spectra. Peak integration was used to quantify GABAþ(3 ppm) and the combined glutamate plus glutamine peaks
(Glx; 3.75 ppm) in the difference spectra and total creatine
peak (tCr; 3 ppm) in the summed spectra. In this manuscript
the signal corresponding to GABA is labeled GABA þ rather
than GABA to indicate the potential contribution of macro-
molecules and homocarnosine at 3.02 ppm (Rothman, Behar,
Prichard, & Petroff, 1997).
Integrals of GABAþ, Glx and tCr peaks were automatically
calculated using a linear fit of the baseline and Gaussian
(GABAþ), Gaussian doublet (Glx) and Lorentzian (tCr) models
to fit the peaks. GABAþ and Glx peaks were well edited for
most participants. Spectra with poor signal to noise ratio due
to participants' movement during MRS acquisition were
excluded from spectroscopic analysis (medial frontal cortex
MRS e 3 control participants and 3 individuals with NF1; oc-
cipital cortex MRS e 1 control participant). Therefore, for
medial frontal MRS analysis, we included 13 control partici-
pants and 13 children and adolescents with NF1 and for oc-
cipital cortex MRS analysis, we included 15 control
participants and 16 children and adolescents with NF1.
Ratios of GABAþ/tCr and Glx/tCr were calculated for each
subject. GABAþ/tCr provides reliable GABA concentration es-
timates and reduces inter-subject variability attributable to
differences in signal-to-noise ratio and cerebrospinal fluid
fraction within the voxel (Bogner et al., 2010).
Analyses of GABAþ/tCr and Glx/tCr within the occipital
cortex were presented in our previous study in the context of
early visual processing (Violante, Ribeiro, Edden, et al., 2013). In
here,we reanalyzed thesedata in relation to inhibitory control.
2.8. Statistics
All statistical analyses were performed with IBM SPSS Statis-
tics version 19 software. We verified the normality assump-
tion for the different parameters using the ShapiroeWilk test.
All measureswere normally distributed except the percentage
of errors of omission. We used, as appropriate, repeated-
measures analysis of variance (ANOVA), parametric t-tests,
ManneWhitney test and partial correlation analyses. When
the data did not meet assumptions of sphericity, the
Greenhouse-Geisser correction was used, with original de-
grees of freedom and corrected confidence probabilities (p)
being reported.
To investigate the influence of general intellectual ability
(full-scale IQ) on the behavioral measures, we used the gen-
eral linear model including IQ as a covariate. Correlation an-
alyses between behavioral measures (errors of commission
and reaction time) were performed controlling for the effect of
age, gender and full-scale IQ, as these factors can affect go/no-
go task performance (Conners, Epstein, Angold, & Klaric,
2003).
Given that the grey matter content in the MRS voxel may
affect GABA concentration measurements (Jensen, Frederick
Bde, & Renshaw, 2005), comparisons of GABAþ/tCr and Glx/
tCr levels between groups were performed using the general
linear model with percentage of grey matter in the spectros-
copy voxel as covariate. Correlation analyses between IQ and
GABA levels were controlled for grey matter content in the
spectroscopy voxel. Correlation analysis between go/no-go
task performance and GABAþ/tCr levels were controlled for
age, gender, full-scale IQ, and grey matter content, as these
factors have been shown to affect GABA levels and inhibitory
control (Conners et al., 2003; Gao et al., 2013; Jensen et al.,
2005).
According to our previous study (Violante, Ribeiro, Edden,
et al., 2013), to assess the effect of genotype on GABA levels,
we first transformed GABAþ/tCr measurements of all partic-
ipants to Z-scores and performed a multiple regression anal-
ysis using a forced entry model, in which all predictors are
forced into the model simultaneously. Predictors included
age, gender and grey matter content (factors known to affect
GABA levels) and predictors constructed from categorical
variables relative to the type of NF1 mutation (non-sense,
missense, splice-site andmutation not found in theNF1 gene).
For the analyses of the amplitude of each CSD peak,
repeated-measures analyses were performed with trial type
(go vs no-go) and Electrode (the three electrodes chosen for
analysis) as within-subjects factors and Group (NF1 vs control)
as between-subjects factor. For parietal peaks (P1 and N1)
Hemisphere (left vs right) was also included as a within-
subjects factor.
Correlations analyses between behavioral measures and
CSD amplitude measures were performed controlling for the

c o r t e x 6 4 ( 2 0 1 5 ) 1 9 4e2 0 8 199
effect of age, gender, and full-scale IQ as these factors might
affect bothmeasures (Conners et al., 2003; van Dinteren, Arns,
Jongsma, & Kessels, 2014).
Data were inspected for outliers (jz-scorej > 3). Outliers
were found in P1 amplitude data (1 NF1), N2 amplitude data (1
control and 1 NF1) and P3 amplitude data (1 NF1). These data
points were removed from the statistical analyses.
3. Results
3.1. Behavioral performance
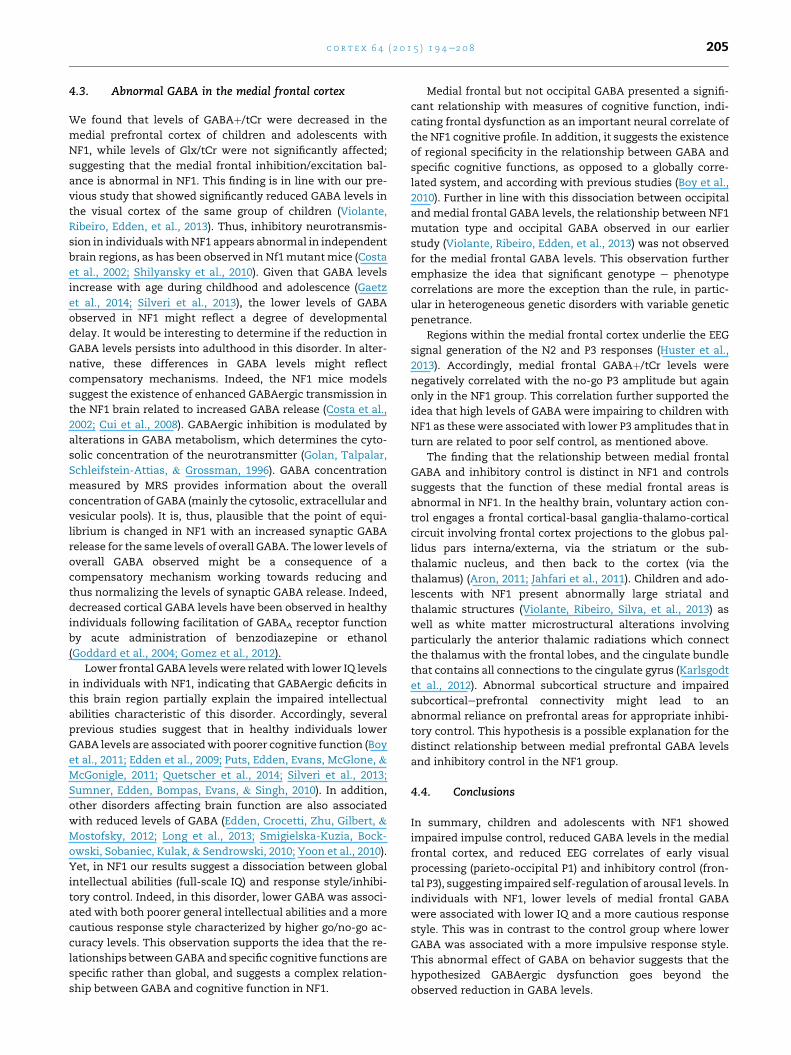
In comparison with control participants, children and ado-
lescents with NF1 committed a significantly higher number of
commission errors, i.e., failed to inhibit the button press in no-
go trials [mean percentage of errors (standard error, SE):
control, 33.6 (5.5); NF1, 56.6 (6.0); p ¼ .008; Fig. 1A]. Errors of
omission (failures to respond to go stimuli) were rare (less
than 3% on average). Nevertheless, these were significantly
higher in the NF1 group than in the control group [mean
percentage of errors (SE): control, .53 (.15); NF1, 2.36 (.50);
p ¼ .001; Fig. 1B]. In addition, individuals with NF1 responded
significantly faster to go stimuli than control subjects [mean
reaction time (SE): control, .46 (.10) sec; NF1, .39 (.09) sec;
p ¼ .05; Fig. 1C]. Importantly, reaction times to go stimuli were
strongly negatively correlated with the number of errors of
commission, so that individuals that responded slower to go
stimuli were better at inhibiting the response to no-go stimuli
(r ¼ �.852, p < .001; Fig. 1D). In order to investigate the rela-
tionship between general intellectual ability (full-scale IQ) and
inhibitory control, we performed correlation analyses. The
control group presented a significant correlation between IQ
and number of commission errors (r ¼ �.698, p ¼ .005) with
A B
C D
Fig. 1 e Individuals with NF1 committedmore errors and respon
of commission (failures to inhibit the response to no-go stimuli)
go stimuli). (C) Reaction time of the correct responses to go stimu
group e white bars; NF1 group e black bars. *p < .05, **p < .01. (D
and IQ between reaction time and number of errors of commis
higher IQ related to better inhibitory control. Yet, this rela-
tionship was not observed in the NF1 group (p ¼ .990), indi-
cating that poorer intellectual abilities and inhibitory deficits
are dissociated in this disorder. In fact, after controlling for full
scale-IQ, the two groups still differed significantly in the
number of commission errors (p ¼ .018), and reaction time
(p ¼ .006), further supporting the idea that the deficit in
inhibitory control observed in NF1 is independent of deficits in
general intellectual abilities.
3.2. GABA levels and go/no-go performance
We measured GABAþ/tCr and Glx/tCr levels in two brain re-
gions: a posterior medial prefrontal region known to be rele-
vant for the correct performance of go/no-go tasks (Huster
et al., 2013) and the occipital cortex, where GABA levels have
been shown to correlate with basic visual processing (Edden,
Muthukumaraswamy, Freeman, & Singh, 2009; Violante,
Ribeiro, Edden, et al., 2013; Yoon et al., 2010) (Fig. 2A and B).
We found that, in these brain regions, GABAþ/tCr levels were
significantly reduced in children and adolescents with NF1
when compared with control levels [estimated marginal
means (SE): control frontal GABAþ/tCr, .115 (.004); NF1 frontal
GABAþ/tCr, .100 (.004); F(1, 25)¼ 5.601, p¼ .027; control occipital
GABAþ/tCr, .148 (.004); NF1 occipital GABAþ/tCr, .137 (.003);
F(1, 30) ¼ 3.950, p ¼ .057; Fig. 2C], while Glx/tCr levels were not
significantly modulated [estimated marginal means (SE):
control frontal Glx/tCr, .135 (.005); NF1 frontal Glx/tCr, .125
(.005); F(1, 25) ¼ 2.046, p ¼ .166; control occipital Glx/tCr, 127
(.005); NF1 occipital Glx/tCr, 123 (.005); F(1, 30) ¼ .284, p ¼ .599].
Next, we investigated the relationship between GABA and
full-scale IQ. In the NF1 group, frontal GABAþ/tCr correlated
positively with IQ (r ¼ .685, p ¼ .020; Fig. 2D) suggesting that
decreased GABA levels in that brain region in these patients
ded faster than control participants. (A) Percentage of errors
. (B) Percentage of errors of omission (failures to respond to
li. (A, B and C) Data are represented as mean ± 1 SE. Control
) Partial correlation controlled for the effect of age, gender,
sion.

Fig. 2 e The GABAþ/total creatine (tCr) levels of the medial frontal and occipital cortices of individuals with NF1 were
significantly reduced. (A) Localization of the two MRS voxels (white squares) in the medial frontal and occipital cortices of a
representative participant. (B) Edited MRS spectrum from a representative participant showing clearly resolved peaks for
c o r t e x 6 4 ( 2 0 1 5 ) 1 9 4e2 0 8200

c o r t e x 6 4 ( 2 0 1 5 ) 1 9 4e2 0 8 201
lead to deficits in a global set of intellectual functions. No
correlation was observed in the control group or for the oc-
cipital GABAþ/tCr levels. As expected, the GABA group dif-
ferences were abolished after correcting for IQ levels, further
emphasizing the close link between frontal GABA and intel-
lectual abilities.
Furthermore, we sought to determine if, beyond the rela-
tionship with general intellectual abilities, GABA levels were
specifically related to go/no-go behavioral performance, and
whether this relationship was specific to medial frontal GABA
or if inhibitory control was also related to occipital GABA. In
the control group, frontal GABAþ/tCr levels correlated nega-
tively with the number of commission errors (r ¼ �.783,
p ¼ .037; Fig. 2D) and positively with reaction time (r ¼ .830,
p ¼ .021; Fig. 2D), indicating that higher levels of frontal GABA
were associated with a more cautious response style. How-
ever, surprisingly, the opposite relationships were observed in
individuals with NF1, with an association with a less cautious
response style: medial frontal GABAþ/tCr levels correlated
positively with the number of commission errors (r ¼ .761,
p ¼ .028; Fig. 2D) and negatively with reaction time (r ¼ �.719,
p ¼ .044; Fig. 2D). Occipital GABAþ/tCr levels did not correlate
with inhibitory control in either group indicating that the in-
fluence of GABA on cognitive performance is region specific.
3.3. GABA levels and NF1 mutational profile
In our previous study, occipital GABAþ/tCr levels were found
to be significantly related to NF1 mutation type (Violante,
Ribeiro, Edden, et al., 2013). In here, we performed a similar
analysis to determine if NF1 mutation type also explained
medial frontal GABA levels. The NF1 mutations found in our
cohort of patients have been described before (Violante,
Ribeiro, Edden, et al., 2013). In particular, the 16 patients
included in this study presented 4 non-sense mutations, 6
splice-site mutations and 2 missense mutations. In 4 patients
no mutation was found by whole-gene sequencing. These
individuals are likely to have a mutation missed by whole-
gene sequencing but affecting gene expression, given that
the criteria for diagnosis were fulfilled. We did not observe a
significant relationship between mutation type and frontal
GABA. This finding is in line with the idea that other factors,
like gene expression and epigenetic factors, need to be taken
in consideration to fully explain phenotypic heterogeneity.
3.4. Neuroelectric responses
CSD analyses of the EEG data enabled the characterization of
the different stages of neural processing associated with go/
no-go task performance: early visual processing, cognitive
stimulus evaluation, and inhibitory control.
GABAþ and glutamine þ glutamate (Glx). (C) GABAþ/tCr and Glx
spectroscopy voxels, for the control (white bars) and NF1 (black
#p ¼ .057. (D) Upper graphs, partial correlations between levels o
of grey matter within the spectroscopy voxel. Middle and lower
GABAþ/tCr and number of errors of commission (middle) and be
(bottom), controlled for the effect of age, gender, IQ, and grey ma
data are shown on the left, control data are shown on the right
3.4.1. Early visual processingP1 and N1 parieto-occipital peaks were observed bilaterally in
both groups of participants reflecting early visual processing.
P1 amplitude was significantly reduced in the NF1 group [F(1,
29) ¼ 4.548, p ¼ .042; Fig. 3A and B; Table 2]. Interestingly, P1
was also sensitive to trial type being significantly smaller in
no-go trials [F(1, 29) ¼ 4.275, p ¼ .048; Table 2]. There was no
interaction between the effects of trial type and group indi-
cating that amplitude reduction observed in no-go trials was
preserved in the NF1 group (Fig. 3B). Furthermore, P1 pre-
sented a significant effect of electrode [F(2, 58) ¼ 11.44, p < .001],
a significant interaction between electrode and hemisphere
[F(1, 29) ¼ 12,35, p < .001] and a significant 3-way interaction
between hemisphere, electrode and group [F(2, 58) ¼ 4.590,
p ¼ .014] suggesting that the topography of the signal was
affected in the NF1 group. N1 amplitude did not show a sig-
nificant effect of group [F(1, 30) ¼ 1.987, p ¼ .169] but showed, as
for P1, a significant effect of trial type [F(1, 30) ¼ 7.113, p ¼ .012;
Fig. 3A and B; Table 2]. These modulations with trial type of
both P1 and N1 amplitudes appeared as a push of P1 and N1
amplitudes towards negative values and resembled the
negative deflection over temporo-occipital regions associated
with engagement of feature-based attentional mechanisms
(Codispoti et al., 2006). Importantly, in both peaks, there was
no interaction between trial type and group suggesting that
this modulation is not significantly affected in NF1. N1
amplitude showed a significant interaction between trial type
and hemisphere [F(1, 30) ¼ 5.46, p ¼ .026] reflecting the stronger
modulation observed in the right hemisphere in comparison
with the left (Fig. 3A and B). There was no 3-way interaction
with group indicating that this lateralization effect was pre-
served in children with NF1.
3.4.2. Cognitive stimulus evaluationNo-go stimuli elicited a positive late response over centro-
parietal scalp sites that we interpreted as the P3b wave eli-
cited by deviant events (Polich, 2007). This positive deflection
was virtually absent in go trials (Fig. 4). Accordingly, P3b
amplitude showed a very significant effect of trial type [F(1,
30) ¼ 65,14, p < .001; Table 2]. P3b did not show an effect of
group or interaction between trial type and group, indicating
that this neural responsewas not significantly affected in NF1.
3.4.3. Inhibitory controlThe N2/P3 complexwas visible over frontalmidline scalp sites
(Fig. 5A). These two peaks have been associated with go/no-go
and stop signal tasks performance (Huster et al., 2013). As
expected, N2 showed highest absolute amplitude values over
midline frontal electrodes (Table 2). Statistical analyses of its
amplitude effects did not reveal a significant effect of group,
any group interactions or significant effect of trial type [see
/tCr levels adjusted for the percentage of grey matter in the
bars) groups. Data are represented as mean ± 1 SE. *p < .05
f medial frontal GABAþ/tCr and IQ, controlled for the effect
graphs, partial correlations between levels of medial frontal
tween levels of medial frontal GABAþ/tCr and reaction time
tter within the spectroscopy voxel. Graphs presenting NF1
.

c o r t e x 6 4 ( 2 0 1 5 ) 1 9 4e2 0 8202
Table 2 formean (SE) values; Fig. 5A and B]. In contrast, P3 was
significantly reduced in the NF1 group [F(1,29) ¼ 6.384, p ¼ .017;
Table 2; Fig. 5A and C] and presented a significant effect of trial
type [F(1,29) ¼ 15.011, p ¼ .001; Fig. 5C]. The effect of trial type
did not show a significant interaction with group [F(1,29) ¼ .330,
p¼ .570], indicating that although with reduced amplitude the
NF1 response was equally sensitive to no-go stimuli.
3.4.4. Relation between neuroelectric responses, full-scale IQ,GABA and behaviorNext, we investigated if the amplitude reduction of frontal P3
neuroelectric signal might be related to the reduced early vi-
sual response (P1). We found no correlation between these
two signals suggesting independent neuronal mechanisms. In
addition, IQ did not correlate with any of the electrophysio-
logical deficits observed. Nevertheless, reduced GABA levels in
the medial frontal cortex observed in individuals with NF1
might be related to the electrophysiological deficits. Previous
studies have suggested that the generators of the frontal N2
and P3 EEG signals are localized within medial frontal regions
(Huster et al., 2010). The reduction of P3 amplitude in NF1
might, thus, be related to the reduction in GABA levels
observed in this region. Correlation analyses revealed a sig-
nificant negative correlation between GABAþ/tCr levels and
no-go P3 amplitude, but only in the NF1 group (r ¼ �.754,
p ¼ .019), suggesting that impaired activation of these brain
regions might be related to the abnormal GABA system. This
correlation was, however, no longer significant when IQ was
included as a covariate. No correlation was found between
GABAþ/tCr levels and N2 amplitude or between the behav-
ioral measures and the amplitude of the ERPs studied (P1, N1,
P3b, N2 and P3).
4. Discussion
In this study, we investigated the neural correlates of
impaired inhibitory control in children and adolescents with
NF1. Behaviorally, individuals with NF1 showed increased
number of errors of commission (false alarms) and faster re-
action times in go trials indicating an impulsive response
style. We studied the neural correlates of this impairment by
examining both medial frontal and occipital neurochemistry
and neurophysiologic responses.We found that GABA, but not
Glx, was significantly reduced in the medial frontal and oc-
cipital cortices of children and adolescents with NF1. Notably,
in individuals with NF1, medial frontal (but not occipital)
GABAþ/tCr levels correlated with general intellectual abilities
(IQ) indicating an important relationship between regional
GABA dysfunction and the cognitive profile of these patients.
Furthermore, the relationship between GABA and inhibitory
control was found to be changed in NF1. Indeed, whilst in the
control group higher levels of medial frontal GABAþ/tCr levels
were related with a more cautious response style, in NF1 this
relationship was reversed: higher levels of frontal GABAþ/tCr
were related with faster and less accurate responses. These
findings suggest an abnormal link between GABA and
behavior in NF1. Furthermore, occipital GABAþ/tCr levels did
not correlate with IQ or task performance indicating regional
specificity for the relation between GABA and cognitive
functions. Our EEG/CSD analyses focused on the study of the
neural correlates of basic visual processing, conflict moni-
toring/inhibitory control and cognitive stimulus evaluation.
Two correlates were found impaired: parieto-occipital P1,
reflecting abnormal early visual processing, and frontal P3, a
correlate of response inhibition. In contrast, frontal N2, a
signal that has been implicated with inhibitory control, and
P3b, a correlate of stimulus categorization, were not affected.
4.1. Behavioral deficit in go/no-go task performance
The faster reaction times observed in the NF1 group are un-
likely to reflect differences in motor function, as previous
studies found either slowing of visuomotor responses or no
impairments in simple finger tapping tasks (Huijbregts et al.,
2010; Rowbotham et al., 2009). Instead, faster responses indi-
cate differences in response styles with patients adopting a
less cautious, more impulsive strategy, thus suggesting defi-
cits in impulse control.
4.2. The spatiotemporal pattern of sensorimotorprocessing
Our CSD findings revealed a distributed pattern of brain
functional deficits in NF1 associated with go/no-go task
performance.
The earliest deficit was a reduction in the amplitude of
visual P1 observed over occipito-parietal scalp sites. This
deficit in visual cortex activation is compatible with fMRI
findings from earlier reports (Clements-Stephens et al., 2008;
Violante et al., 2012) and might be related to deficits in basic
visual processing or, alternatively, deficient allocation of
spatial attention (Hillyard & Anllo-Vento, 1998) or reduced
arousal levels (Vogel & Luck, 2000). Interestingly, the visual
responses P1 and N1 showed significant modulations with
trial type (go vs no-go) resembling the selection negativity, a
correlate of feature-based attention (Codispoti et al., 2006;
Hillyard & Anllo-Vento, 1998; Zhang & Luck, 2009). Given the
right lateralization of the N1 modulation with trial type, it is
likely that this response reflects engagement of the right
ventral frontoparietal network associated with target (no-go)
detection (Corbetta & Shulman, 2002). Notably, P1 and N1
modulations with trial type were preserved in the NF1 group
suggesting that the cortical mechanisms of feature-based
attentional control and target detection are not significantly
affected in these children.
N2 amplitude did not show a significant modulation with
trial type and was not affected in NF1. N2 is a frontal midline
negative deflection that has been extensively studied in the
context of go/no-go tasks (Huster et al., 2013). This electro-
physiological response is thought to be an important signal
regarding the success of response inhibition (Falkenstein,
Hoormann, & Hohnsbein, 1999). However, the cognitive
function subserved by the N2 response is still a subject of
debate. N2 might underlie motor response inhibition,
response selection/conflict monitoring or context updating/
revision (Huster et al., 2013; Nieuwenhuis et al., 2003; Ouyang,
Schacht, Zhou, & Sommer, 2013; Smith, Smith, Provost, &
Heathcote, 2010). Alternatively, N2 might reflect the detec-
tion of a mismatch between the stimulus perceptual features

Fig. 3 e (A) Reference-free CSD (mV/m2) control and NF1 grand average traces showing the P1eN1 complex for go and no-go
trials. Waveforms shown were pooled across electrodes used in the N1 analysis (left: PO5, P5, P3; right: PO6, P6, P4). (B)
Graphs represent mean and SEs of the P1 (left) and N1 (right) CSD amplitudes calculated at each electrode site.
c o r t e x 6 4 ( 2 0 1 5 ) 1 9 4e2 0 8 203
and a mental template set to match the most frequently
presented stimulus (Naatanen, Kujala, & Winkler, 2011). This
alternative model would explain why no-go N2 depends on
the probability of no-go trials (Bruin & Wijers, 2002;
Nieuwenhuis et al., 2003) and on the perceptual overlap be-
tween go and no-go stimuli (Nieuwenhuis, Yeung, & Cohen,
2004). Notably, the perceptual mismatch model might
explain the lack of N2 modulation in our study. In contrast to
the more common go/no-go paradigms that use one stimulus
for go trials and another for no-go trials, we used a high
number of equiprobable visual stimuli (single digits between 1
and 9 presented in 5 different sizes allocated randomly in each
trial). The difference in go/no-go probability was achieved by
assigning only one number to the no-go condition and eight
numbers to the go condition. The perceptual differences be-
tween the different go stimuli were the same as the perceptual
differences between any of the go and the no-go stimulus.
Thus, if N2 reflects the detection of perceptual differences
then, under these conditions, go and no-go trials should elicit
N2 signals with similar amplitude. This was what we found.
Notably, a similar lack of N2 go/no-go modulation was
observed by Smith, Jamadar, Provost, and Michie (2013) using
a similar design to ours, with five different equiprobable visual
stimuli (Smith et al., 2013). Importantly, the fact that N2
amplitude was not affected in individuals with NF1, but
inhibitory control was, further suggests that this signal is not
directly related with response inhibition. This has also been
suggested by several other studies (Smith et al., 2013; Smith
et al., 2010; Wiersema & Roeyers, 2009).
Late positive deflections were clearly observed in our data
in response to no-go stimuli over parietal and frontal sites.We
interpreted these signals as part of the P300 complex
(Falkenstein et al., 1999; Huster et al., 2013; Kok, 2001; Polich,
2007). This complex consists of a parietal component that
appears in response to rare task relevant stimuli (P3b) and a
fronto-central component (P3a or no-go P3) that is elicited by
rare and/or novel stimuli when no response is required,
including no-go stimuli in go/no-go tasks (Goldstein, Spencer,
& Donchin, 2002; Huster et al., 2013; Polich, 2007). In our
analysis, frontal no-go P3 and parietal P3b displayed different
time courses and different group effects. Parietal P3b pre-
sented a very significant effect of trial type but no significant
effect of group or interaction between group and trial type,
suggesting that the cognitive function subserved by this
neuroelectric signal is not affected in NF1. P3b is considered to
be a correlate of allocation of attention during event-
categorization, i.e., a correlate of the awareness that the
stimulus perceived belongs to a task-relevant category (Kok,
2001). Therefore, the lack of group effect indicates that the
difficulties in inhibitory control observed in children and ad-
olescentswithNF1were not relatedwith impaired recognition
and/or categorization of no-go stimuli, i.e., individuals with
NF1 were able to recognize the no-go trials yet failed to inhibit
the response. The frontal peak (P3) also showed a significant

Fig. 4 e (A) Reference-free CSD (mV/m2) grand average
traces detected over centro-parietal electrodes, showing
the P3b positive deflection highly enhanced in no-go trials.
Waveforms shown are pooled across the electrodes used
for statistical analysis (Cz, CPz, and Pz). (B) Graph
represents means and SEs of the P3b CSD amplitudes
calculated at each electrode site for each condition.
Fig. 5 e (A) Reference-free CSD (mV/m2) grand average
traces detected over midline frontal electrodes, showing
the N2/P3 frontal complex. Waveforms shown were pooled
across the electrodes used for P3 statistical analysis (FC1,
FCz, FC2). (B and C) Graphs representing mean and SEs of
the CSD amplitudes calculated at each electrode site for
each CSD peak. (B) Frontal N2. (C) Frontal P3.
c o r t e x 6 4 ( 2 0 1 5 ) 1 9 4e2 0 8204
modulation with trial type, yet, in contrast to P3b, it was
significantly reduced in the NF1 group in response to both go
and no-go stimuli. Importantly, reduction in early visual re-
sponses (P1 amplitude) did not explain the reduction in frontal
P3 amplitude suggesting that these two deficits are indepen-
dent. Frontal P3 has been associated with inhibition of the
motor response. It is more prominent when a motor response
has been inhibited (Smith et al., 2013; Smith, Johnstone, &
Barry, 2008) and it correlates negatively with the number of
commission errors (Wiersema & Roeyers, 2009). Furthermore,
in stop-signal tasks successful motor inhibition, in compari-
son with failed motor inhibition trials, elicits a frontal P3 with
higher amplitude (Dimoska, Johnstone, & Barry, 2006). In
contrast, the parietal P3b response does not modulate with
the success of the response inhibition (Dimoska et al., 2006).
Importantly, in children, the amplitude of no-go P3 correlates
with the outcomes of questionnaires on effortful control,
persistence, impulsive behavior and attention focusing
(Wiersema & Roeyers, 2009). Accordingly, go/no-go P3 ampli-
tude increases with increasedmotivational incentives (Groom
et al., 2010). Thus, P3 appears to be a correlate of motivational
state and self-regulation of arousal. Also, children scoring
high on ADHD symptoms show smaller no-go P3 amplitudes
(Fallgatter et al., 2004; Groom et al., 2010;Wiersema& Roeyers,
2009). Thus, reduced frontal P3 amplitude in NF1 might reflect
impairments in self-regulation.
c o r t e x 6 4 ( 2 0 1 5 ) 1 9 4e2 0 8 205
4.3. Abnormal GABA in the medial frontal cortex
We found that levels of GABAþ/tCr were decreased in the
medial prefrontal cortex of children and adolescents with
NF1, while levels of Glx/tCr were not significantly affected;
suggesting that the medial frontal inhibition/excitation bal-
ance is abnormal in NF1. This finding is in line with our pre-
vious study that showed significantly reduced GABA levels in
the visual cortex of the same group of children (Violante,
Ribeiro, Edden, et al., 2013). Thus, inhibitory neurotransmis-
sion in individuals withNF1 appears abnormal in independent
brain regions, as has been observed in Nf1mutantmice (Costa
et al., 2002; Shilyansky et al., 2010). Given that GABA levels
increase with age during childhood and adolescence (Gaetz
et al., 2014; Silveri et al., 2013), the lower levels of GABA
observed in NF1 might reflect a degree of developmental
delay. It would be interesting to determine if the reduction in
GABA levels persists into adulthood in this disorder. In alter-
native, these differences in GABA levels might reflect
compensatory mechanisms. Indeed, the NF1 mice models
suggest the existence of enhanced GABAergic transmission in
the NF1 brain related to increased GABA release (Costa et al.,
2002; Cui et al., 2008). GABAergic inhibition is modulated by
alterations in GABA metabolism, which determines the cyto-
solic concentration of the neurotransmitter (Golan, Talpalar,
Schleifstein-Attias, & Grossman, 1996). GABA concentration
measured by MRS provides information about the overall
concentration of GABA (mainly the cytosolic, extracellular and
vesicular pools). It is, thus, plausible that the point of equi-
librium is changed in NF1 with an increased synaptic GABA
release for the same levels of overall GABA. The lower levels of
overall GABA observed might be a consequence of a
compensatory mechanism working towards reducing and
thus normalizing the levels of synaptic GABA release. Indeed,
decreased cortical GABA levels have been observed in healthy
individuals following facilitation of GABAA receptor function
by acute administration of benzodiazepine or ethanol
(Goddard et al., 2004; Gomez et al., 2012).
Lower frontal GABA levels were relatedwith lower IQ levels
in individuals with NF1, indicating that GABAergic deficits in
this brain region partially explain the impaired intellectual
abilities characteristic of this disorder. Accordingly, several
previous studies suggest that in healthy individuals lower
GABA levels are associatedwith poorer cognitive function (Boy
et al., 2011; Edden et al., 2009; Puts, Edden, Evans, McGlone, &
McGonigle, 2011; Quetscher et al., 2014; Silveri et al., 2013;
Sumner, Edden, Bompas, Evans, & Singh, 2010). In addition,
other disorders affecting brain function are also associated
with reduced levels of GABA (Edden, Crocetti, Zhu, Gilbert, &
Mostofsky, 2012; Long et al., 2013; Smigielska-Kuzia, Bock-
owski, Sobaniec, Kulak,& Sendrowski, 2010; Yoon et al., 2010).
Yet, in NF1 our results suggest a dissociation between global
intellectual abilities (full-scale IQ) and response style/inhibi-
tory control. Indeed, in this disorder, lower GABA was associ-
ated with both poorer general intellectual abilities and a more
cautious response style characterized by higher go/no-go ac-
curacy levels. This observation supports the idea that the re-
lationships betweenGABA and specific cognitive functions are
specific rather than global, and suggests a complex relation-
ship between GABA and cognitive function in NF1.
Medial frontal but not occipital GABA presented a signifi-
cant relationship with measures of cognitive function, indi-
cating frontal dysfunction as an important neural correlate of
the NF1 cognitive profile. In addition, it suggests the existence
of regional specificity in the relationship between GABA and
specific cognitive functions, as opposed to a globally corre-
lated system, and according with previous studies (Boy et al.,
2010). Further in line with this dissociation between occipital
and medial frontal GABA levels, the relationship between NF1
mutation type and occipital GABA observed in our earlier
study (Violante, Ribeiro, Edden, et al., 2013) was not observed
for the medial frontal GABA levels. This observation further
emphasize the idea that significant genotype e phenotype
correlations are more the exception than the rule, in partic-
ular in heterogeneous genetic disorders with variable genetic
penetrance.
Regions within the medial frontal cortex underlie the EEG
signal generation of the N2 and P3 responses (Huster et al.,
2013). Accordingly, medial frontal GABAþ/tCr levels were
negatively correlated with the no-go P3 amplitude but again
only in the NF1 group. This correlation further supported the
idea that high levels of GABA were impairing to children with
NF1 as these were associated with lower P3 amplitudes that in
turn are related to poor self control, as mentioned above.
The finding that the relationship between medial frontal
GABA and inhibitory control is distinct in NF1 and controls
suggests that the function of these medial frontal areas is
abnormal in NF1. In the healthy brain, voluntary action con-
trol engages a frontal cortical-basal ganglia-thalamo-cortical
circuit involving frontal cortex projections to the globus pal-
lidus pars interna/externa, via the striatum or the sub-
thalamic nucleus, and then back to the cortex (via the
thalamus) (Aron, 2011; Jahfari et al., 2011). Children and ado-
lescents with NF1 present abnormally large striatal and
thalamic structures (Violante, Ribeiro, Silva, et al., 2013) as
well as white matter microstructural alterations involving
particularly the anterior thalamic radiations which connect
the thalamus with the frontal lobes, and the cingulate bundle
that contains all connections to the cingulate gyrus (Karlsgodt
et al., 2012). Abnormal subcortical structure and impaired
subcorticaleprefrontal connectivity might lead to an
abnormal reliance on prefrontal areas for appropriate inhibi-
tory control. This hypothesis is a possible explanation for the
distinct relationship between medial prefrontal GABA levels
and inhibitory control in the NF1 group.
4.4. Conclusions
In summary, children and adolescents with NF1 showed
impaired impulse control, reduced GABA levels in the medial
frontal cortex, and reduced EEG correlates of early visual
processing (parieto-occipital P1) and inhibitory control (fron-
tal P3), suggesting impaired self-regulation of arousal levels. In
individuals with NF1, lower levels of medial frontal GABA
were associated with lower IQ and a more cautious response
style. This was in contrast to the control group where lower
GABA was associated with a more impulsive response style.
This abnormal effect of GABA on behavior suggests that the
hypothesized GABAergic dysfunction goes beyond the
observed reduction in GABA levels.

c o r t e x 6 4 ( 2 0 1 5 ) 1 9 4e2 0 8206
This study contributes towards the understanding of how
in disorders of brain function changes in the balance between
excitatory and inhibitory neurotransmission relate to cogni-
tive performance. Importantly, although reduction in the
levels of GABA appears to be a feature of several disorders
(Rojas, Singel, Steinmetz, Hepburn,&Brown, 2014; Smigielska-
Kuzia et al., 2010; Yoonet al., 2010), our findings indicate that in
NF1 the relationship between GABA levels and performance
are dependent on the type of cognitive function. This suggests
that therapies increasing GABAergic function might not
necessarily be appropriate to improve all cognitive functions.
Funding
This work was funded by the Portuguese Foundation for Sci-
ence and Technology (grants: SFRH/BPD/34392/2006, SFRH/
BD/41348/2007, PIC/IC/83155/2007 and Compete e PTDC/SAU-
ORG/118380/2010, CENTRO-07-ST24-FEDER-00205 From mol-
ecules to man: novel diagnostic imaging tools in neurological
and psychiatric disorders, FP7-HEALTH-2013-INNOVATION-1
e 602186 e BRAINTRAIN, PEst-C/SAU/UI3282/2013).
Acknowledgments
We thank all the volunteers and their families for
participating.
r e f e r e n c e s
Aron, A. R. (2011). From reactive to proactive and selectivecontrol: developing a richer model for stopping inappropriateresponses. Biological Psychiatry, 69(12), e55e68.
Billingsley, R. L., Jackson, E. F., Slopis, J. M., Swank, P. R.,Mahankali, S., & Moore, B. D. (2004). Functional MRI of visual-spatial processing in neurofibromatosis, type I.Neuropsychologia, 42(3), 395e404.
Bogner, W., Gruber, S., Doelken, M., Stadlbauer, A., Ganslandt, O.,Boettcher, U., et al. (2010). In vivo quantification ofintracerebral GABA by single-voxel (1)H-MRS-Howreproducible are the results? European Journal of Radiology,73(3), 526e531.
Boy, F., Evans, C. J., Edden, R. A., Lawrence, A. D., Singh, K. D.,Husain, M., et al. (2011). Dorsolateral prefrontal gamma-aminobutyric acid in men predicts individual differences inrash impulsivity. Biological Psychiatry, 70(9), 866e872.
Boy, F., Evans, C. J., Edden, R. A., Singh, K. D., Husain, M., &Sumner, P. (2010). Individual differences in subconsciousmotor control predicted by GABA concentration in SMA.Current Biology, 20(19), 1779e1785.
Brainard, D. H. (1997). The psychophysics toolbox. Spatial Vision,10(4), 433e436.
Bruin, K. J., & Wijers, A. A. (2002). Inhibition, response mode, andstimulus probability: a comparative event-related potentialstudy. Clinical Neurophysiology, 113(7), 1172e1182.
Chen, C. Y., Muggleton, N. G., Tzeng, O. J., Hung, D. L., &Juan, C. H. (2009). Control of prepotent responses by thesuperior medial frontal cortex. NeuroImage, 44(2), 537e545.
Clements-Stephens, A. M., Rimrodt, S. L., Gaur, P., & Cutting, L. E.(2008). Visuospatial processing in children withneurofibromatosis type 1. Neuropsychologia, 46(2), 690e697.
Codispoti, M., Ferrari, V., Junghofer, M., & Schupp, H. T. (2006).The categorization of natural scenes: brain attention networksrevealed by dense sensor ERPs. NeuroImage, 32(2), 583e591.
Conners, C. K., Epstein, J. N., Angold, A., & Klaric, J. (2003).Continuous performance test performance in a normativeepidemiological sample. Journal of Abnormal Child Psychology,31(5), 555e562.
Corbetta, M., & Shulman, G. L. (2002). Control of goal-directed andstimulus-driven attention in the brain. Nature ReviewsNeuroscience, 3(3), 201e215.
Costa, R. M., Federov, N. B., Kogan, J. H., Murphy, G. G., Stern, J.,Ohno, M., et al. (2002). Mechanism for the learning deficits in amouse model of neurofibromatosis type 1. Nature, 415(6871),526e530.
Cui, Y., Costa, R. M., Murphy, G. G., Elgersma, Y., Zhu, Y.,Gutmann, D. H., et al. (2008). Neurofibromin regulation of ERKsignaling modulates GABA release and learning. Cell, 135(3),549e560.
Descheemaeker, M. J., Ghesquiere, P., Symons, H., Fryns, J. P., &Legius, E. (2005). Behavioural, academic andneuropsychological profile of normally giftedNeurofibromatosis type 1 children. Journal of IntellectualDisability Research, 49(Pt 1), 33e46.
Diamond, A. (2013). Executive functions. Annual Review ofPsychology, 64, 135e168.
Dimoska, A., Johnstone, S. J., & Barry, R. J. (2006). The auditory-evoked N2 and P3 components in the stop-signal task: indicesof inhibition, response-conflict or error-detection? Brain andCognition, 62(2), 98e112.
van Dinteren, R., Arns, M., Jongsma, M. L., & Kessels, R. P. (2014).P300 development across the lifespan: a systematic reviewand meta-analysis. PLoS One, 9(2), e87347.
Dockree, P. M., Kelly, S. P., Robertson, I. H., Reilly, R. B., & Foxe, J. J.(2005). Neurophysiological markers of alert responding duringgoal-directed behavior: a high-density electrical mappingstudy. NeuroImage, 27(3), 587e601.
Duarte, J. V., Ribeiro, M. J., Violante, I. R., Cunha, G., Silva, E., &Castelo-Branco, M. (2014). Multivariate pattern analysisreveals subtle brain anomalies relevant to the cognitivephenotype in neurofibromatosis type 1. Human Brain Mapping,35(1), 89e106.
Edden, R. A., & Barker, P. B. (2007). Spatial effects in the detectionof gamma-aminobutyric acid: improved sensitivity at highfields using inner volume saturation. Magnetic Resonance inMedicine, 58(6), 1276e1282.
Edden, R. A., Crocetti, D., Zhu, H., Gilbert, D. L., & Mostofsky, S. H.(2012). Reduced GABA concentration in attention-deficit/hyperactivity disorder. Archives of General Psychiatry, 69(7),750e753.
Edden, R. A., Muthukumaraswamy, S. D., Freeman, T. C., &Singh, K. D. (2009). Orientation discrimination performance ispredicted by GABA concentration and gamma oscillationfrequency in human primary visual cortex. Journal ofNeuroscience, 29(50), 15721e15726.
Edden, R. A., Puts, N. A. J., Harris, A. D., Barker, P. B., & Evans, C. J.(2014). Gannet: a batch-processing tool for the quantitativeanalysis of gamma-aminobutyric acid e edited MRspectroscopy spectra. Journal of Magnetic Resonance Imaging, 40,1445e1452.
Epstein, J. N., Erkanli, A., Conners, C. K., Klaric, J., Costello, J. E., &Angold, A. (2003). Relations between Continuous PerformanceTest performance measures and ADHD behaviors. Journal ofAbnormal Child Psychology, 31(5), 543e554.
Falkenstein, M., Hoormann, J., & Hohnsbein, J. (1999). ERPcomponents in Go/Nogo tasks and their relation to inhibition.Acta Psychologica (Amsterdam), 101(2e3), 267e291.
Fallgatter, A. J., Ehlis, A. C., Seifert, J., Strik, W. K., Scheuerpflug, P.,Zillessen, K. E., et al. (2004). Altered response control and

c o r t e x 6 4 ( 2 0 1 5 ) 1 9 4e2 0 8 207
anterior cingulate function in attention-deficit/hyperactivitydisorder boys. Clinical Neurophysiology, 115(4), 973e981.
Ferner, R. E., Hughes, R. A., & Weinman, J. (1996). Intellectualimpairment in neurofibromatosis 1. Journal of the NeurologicalSciences, 138(1e2), 125e133.
Gaetz, W., Bloy, L., Wang, D. J., Port, R. G., Blaskey, L., Levy, S. E.,et al. (2014). GABA estimation in the brains of children on theautism spectrum: measurement precision and regionalcortical variation. NeuroImage, 86, 1e9.
Gao, F., Edden, R. A., Li, M., Puts, N. A., Wang, G., Liu, C., et al.(2013). Edited magnetic resonance spectroscopy detects anage-related decline in brain GABA levels. NeuroImage, 78,75e82.
Gilboa, Y., Rosenblum, S., Fattal-Valevski, A., Toledano-Alhadef, H., Rizzo, A. S., & Josman, N. (2011). Using a virtualclassroom environment to describe the attention deficitsprofile of children with neurofibromatosis type 1. Research inDevelopmental Disabilities, 32(6), 2608e2613.
Goddard, A. W., Mason, G. F., Appel, M., Rothman, D. L.,Gueorguieva, R., Behar, K. L., et al. (2004). Impaired GABAneuronal response to acute benzodiazepine administration inpanic disorder. American Journal of Psychiatry, 161(12),2186e2193.
Golan, H., Talpalar, A. E., Schleifstein-Attias, D., & Grossman, Y.(1996). GABA metabolism controls inhibition efficacy in themammalian CNS. Neuroscience Letters, 217(1), 25e28.
Goldstein, A., Spencer, K. M., & Donchin, E. (2002). The influenceof stimulus deviance and novelty on the P300 and novelty P3.Psychophysiology, 39(6), 781e790.
Gomez, R., Behar, K. L., Watzl, J., Weinzimer, S. A., Gulanski, B.,Sanacora, G., et al. (2012). Intravenous ethanol infusiondecreases human cortical gamma-aminobutyric acid and N-acetylaspartate as measured with proton magnetic resonancespectroscopy at 4 tesla. Biological Psychiatry, 71(3), 239e246.
Groom, M. J., Scerif, G., Liddle, P. F., Batty, M. J., Liddle, E. B.,Roberts, K. L., et al. (2010). Effects of motivation andmedication on electrophysiological markers of responseinhibition in children with attention-deficit/hyperactivitydisorder. Biological Psychiatry, 67(7), 624e631.
Hart, H., Radua, J., Nakao, T., Mataix-Cols, D., & Rubia, K. (2013).Meta-analysis of functional magnetic resonance imagingstudies of inhibition and attention in attention-deficit/hyperactivity disorder: exploring task-specific, stimulantmedication, and age effects. JAMA Psychiatry, 70(2), 185e198.
Hillyard, S. A., & Anllo-Vento, L. (1998). Event-related brainpotentials in the study of visual selective attention. Proceedingsof the National Academy of Sciences of the United States of America,95(3), 781e787.
Huijbregts, S., Swaab, H., & de Sonneville, L. (2010). Cognitive andmotor control in neurofibromatosis type I: influence ofmaturation and hyperactivity-inattention. DevelopmentalNeuropsychology, 35(6), 737e751.
Huijbregts, S. C., & de Sonneville, L. M. (2011). Does cognitiveimpairment explain behavioral and social problems ofchildren with neurofibromatosis type 1? Behavior Genetics,41(3), 430e436.
Huster, R. J., Enriquez-Geppert, S., Lavallee, C. F., Falkenstein, M.,& Herrmann, C. S. (2013). Electroencephalography of responseinhibition tasks: functional networks and cognitivecontributions. International Journal of Psychophysiology, 87(3),217e233.
Huster, R. J., Westerhausen, R., Pantev, C., & Konrad, C. (2010).The role of the cingulate cortex as neural generator of theN200 and P300 in a tactile response inhibition task. HumanBrain Mapping, 31(8), 1260e1271.
Hyman, S. L., Shores, A., & North, K. N. (2005). The nature andfrequency of cognitive deficits in children withneurofibromatosis type 1. Neurology, 65(7), 1037e1044.
Jahfari, S., Waldorp, L., van den Wildenberg, W. P., Scholte, H. S.,Ridderinkhof, K. R., & Forstmann, B. U. (2011). Effectiveconnectivity reveals important roles for both the hyperdirect(fronto-subthalamic) and the indirect (fronto-striatal-pallidal)fronto-basal ganglia pathways during response inhibition.Journal of Neuroscience, 31(18), 6891e6899.
Jensen, J. E., Frederick Bde, B., & Renshaw, P. F. (2005). Grey andwhite matter GABA level differences in the human brain usingtwo-dimensional, J-resolved spectroscopic imaging. NMR inBiomedicine, 18(8), 570e576.
Karlsgodt, K. H., Rosser, T., Lutkenhoff, E. S., Cannon, T. D.,Silva, A., & Bearden, C. E. (2012). Alterations in white mattermicrostructure in neurofibromatosis-1. PLoS One, 7(10), e47854.
Kok, A. (2001). On the utility of P3 amplitude as a measure ofprocessing capacity. Psychophysiology, 38(3), 557e577.
Levine, T. M., Materek, A., Abel, J., O'Donnell, M., & Cutting, L. E.(2006). Cognitive profile of neurofibromatosis type 1. Seminarsin Pediatric Neurology, 13(1), 8e20.
Li, W., Cui, Y., Kushner, S. A., Brown, R. A., Jentsch, J. D.,Frankland, P. W., et al. (2005). The HMG-CoA reductaseinhibitor lovastatin reverses the learning and attentiondeficits in a mouse model of neurofibromatosis type 1. CurrentBiology, 15(21), 1961e1967.
Long, Z., Medlock, C., Dzemidzic, M., Shin, Y. W., Goddard, A. W.,& Dydak, U. (2013). Decreased GABA levels in anteriorcingulate cortex/medial prefrontal cortex in panic disorder.Progress In Neuro-Psychopharmacology & Biological Psychiatry,44C, 131e135.
Mescher, M., Merkle, H., Kirsch, J., Garwood, M., & Gruetter, R.(1998). Simultaneous in vivo spectral editing and watersuppression. NMR in Biomedicine, 11(6), 266e272.
Naatanen, R., Kujala, T., & Winkler, I. (2011). Auditory processingthat leads to conscious perception: a unique window tocentral auditory processing opened by the mismatchnegativity and related responses. Psychophysiology, 48(1),4e22.
Nicita, F., Di Biasi, C., Sollaku, S., Cecchini, S., Salpietro, V.,Pittalis, A., et al. (2014). Evaluation of the basal ganglia inneurofibromatosis type 1. Child’s Nervous System, 30(2),319e325.
Nieuwenhuis, S., Yeung, N., & Cohen, J. D. (2004). Stimulusmodality, perceptual overlap, and the go/no-go N2.Psychophysiology, 41(1), 157e160.
Nieuwenhuis, S., Yeung, N., van den Wildenberg, W., &Ridderinkhof, K. R. (2003). Electrophysiological correlates ofanterior cingulate function in a go/no-go task: effects ofresponse conflict and trial type frequency. Cognitive, Affective,& Behavioral Neuroscience, 3(1), 17e26.
NIH. (1988).Neurofibromatosis conference statement, national institutes ofhealth consensus development conference. From http://www.ncbi.nlm.nih.gov/entrez/query.fcgi?cmd¼Retrieve&db¼PubMed&dopt¼Citation&list_uids¼3128965.
Obeso, I., Robles, N., Marron, E. M., & Redolar-Ripoll, D. (2013).Dissociating the role of the pre-SMA in response inhibitionand switching: a combined online and offline TMS approach.Frontiers in Human Neuroscience, 7, 150.
Oldfield, R. C. (1971). The assessment and analysis of handedness:the Edinburgh inventory. Neuropsychologia, 9(1), 97e113.
Ouyang, G., Schacht, A., Zhou, C., & Sommer, W. (2013).Overcoming limitations of the ERP method with ResidueIteration Decomposition (RIDE): a demonstration in go/no-goexperiments. Psychophysiology, 50(3), 253e265.
Ozonoff, S. (1999). Cognitive impairment in neurofibromatosistype 1. American Journal of Medical Genetics, 89(1), 45e52.
Payne, J. M., Moharir, M. D., Webster, R., & North, K. N. (2010).Brain structure and function in neurofibromatosis type 1:current concepts and future directions. Journal of NeurologyNeurosurgery and Psychiatry, 81(3), 304e309.

c o r t e x 6 4 ( 2 0 1 5 ) 1 9 4e2 0 8208
Perrin, F., Pernier, J., Bertrand, O., & Echallier, J. F. (1989). Sphericalsplines for scalp potential and current density mapping.Electroencephalography and Clinical Neurophysiology, 72(2),184e187.
Picton, T. W., Stuss, D. T., Alexander, M. P., Shallice, T.,Binns, M. A., & Gillingham, S. (2007). Effects of focal frontallesions on response inhibition. Cerebral Cortex, 17(4), 826e838.
Polich, J. (2007). Updating P300: an integrative theory of P3a andP3b. Clinical Neurophysiology, 118(10), 2128e2148.
Puts, N. A., Edden, R. A., Evans, C. J., McGlone, F., &McGonigle, D. J. (2011). Regionally specific human GABAconcentration correlates with tactile discriminationthresholds. Journal of Neuroscience, 31(46), 16556e16560.
Quetscher, C., Yildiz, A., Dharmadhikari, S., Glaubitz, B., Schmidt-Wilcke, T., Dydak, U., et al. (2014). Striatal GABA-MRS predictsresponse inhibition performance and its corticalelectrophysiological correlates. Brain Structure & Function [Epubahead of print].
Ribeiro, M. J., Violante, I. R., Bernardino, I., Ramos, F., Saraiva, J.,Reviriego, P., et al. (2012). Abnormal achromatic and chromaticcontrast sensitivity in neurofibromatosis type 1. InvestigativeOphthalmology & Visual Science, 53(1), 287e293.
Rojas, D. C., Singel, D., Steinmetz, S., Hepburn, S., & Brown, M. S.(2014). Decreased left perisylvian GABA concentration inchildren with autism and unaffected siblings. NeuroImage, 86,28e34.
Rothman, D. L., Behar, K. L., Prichard, J. W., & Petroff, O. A. (1997).Homocarnosine and the measurement of neuronal pH inpatients with epilepsy. Magnetic Resonance in Medicine, 38(6),924e929.
Rowbotham, I., Pit-ten Cate, I. M., Sonuga-Barke, E. J., &Huijbregts, S. C. (2009). Cognitive control in adolescents withneurofibromatosis type 1. Neuropsychology, 23(1), 50e60.
Rubia, K., Russell, T., Overmeyer, S., Brammer, M. J.,Bullmore, E. T., Sharma, T., et al. (2001). Mapping motorinhibition: conjunctive brain activations across differentversions of go/no-go and stop tasks. NeuroImage, 13(2),250e261.
Shilyansky, C., Karlsgodt, K. H., Cummings, D. M.,Sidiropoulou, K., Hardt, M., James, A. S., et al. (2010).Neurofibromin regulates corticostriatal inhibitory networksduring working memory performance. Proceedings of theNational Academy of Sciences of the United States of America,107(29), 13141e13146.
Silveri, M. M., Sneider, J. T., Crowley, D. J., Covell, M. J.,Acharya, D., Rosso, I. M., et al. (2013). Frontal lobe gamma-aminobutyric acid levels during adolescence: associationswith impulsivity and response inhibition. Biological Psychiatry,74(4), 296e304.
Simmonds, D. J., Pekar, J. J., & Mostofsky, S. H. (2008). Meta-analysis of Go/No-go tasks demonstrating that fMRI activationassociated with response inhibition is task-dependent.Neuropsychologia, 46(1), 224e232.
Smigielska-Kuzia, J., Bockowski, L., Sobaniec, W., Kulak, W., &Sendrowski, K. (2010). Amino acid metabolic processes in thetemporal lobes assessed by proton magnetic resonancespectroscopy (1H MRS) in children with Down syndrome.Pharmacological Reports, 62(6), 1070e1077.
Smith, J. L., Jamadar, S., Provost, A. L., & Michie, P. T. (2013). Motorand non-motor inhibition in the Go/NoGo task: an ERP andfMRI study. International Journal of Psychophysiology, 87(3),244e253.
Smith, J. L., Johnstone, S. J., & Barry, R. J. (2008). Movement-relatedpotentials in the Go/NoGo task: the P3 reflects both cognitiveand motor inhibition. Clinical Neurophysiology, 119(3), 704e714.
Smith, J. L., Smith, E. A., Provost, A. L., & Heathcote, A. (2010).Sequence effects support the conflict theory of N2 and P3 inthe Go/NoGo task. International Journal of Psychophysiology,75(3), 217e226.
Sumner, P., Edden, R. A., Bompas, A., Evans, C. J., & Singh, K. D.(2010). More GABA, less distraction: a neurochemical predictorof motor decision speed. Nature Neuroscience, 13(7), 825e827.
Tonsgard, J. H. (2006). Clinical manifestations and managementof neurofibromatosis type 1. Seminars in Pediatric Neurology,13(1), 2e7.
Violante, I. R., Ribeiro, M. J., Cunha, G., Bernardino, I., Duarte, J. V.,Ramos, F., et al. (2012). Abnormal brain activation inneurofibromatosis type 1: a link between visual processingand the default mode network. PLoS One, 7(6), e38785.
Violante, I. R., Ribeiro, M. J., Edden, R. A., Guimaraes, P.,Bernardino, I., Rebola, J., et al. (2013). GABA deficit in the visualcortex of patients with neurofibromatosis type 1: genotype-phenotype correlations and functional impact. Brain, 136(Pt 3),918e925.
Violante, I. R., Ribeiro, M. J., Silva, E. D., & Castelo-Branco, M.(2013). Gyrification, cortical and subcortical morphometry inneurofibromatosis type 1: an uneven profile of developmentalabnormalities. Journal of Neurodevelopmental Disorders, 5(1), 3.
Vogel, E. K., & Luck, S. J. (2000). The visual N1 component as anindex of a discrimination process. Psychophysiology, 37(2),190e203.
Wechsler, D. (2003). Manual for intelligence scale for children. Lisbon:Cegoc-Tea.
Wechsler, D. (2008). Manual for intelligence scale for adults. Lisbon:Cegoc-Tea.
Wiersema, J. R., & Roeyers, H. (2009). ERP correlates of effortfulcontrol in children with varying levels of ADHD symptoms.Journal of Abnormal Child Psychology, 37(3), 327e336.
Wylie, G. R., Javitt, D. C., & Foxe, J. J. (2003). Task switching: a high-density electrical mapping study. NeuroImage, 20(4),2322e2342.
Yoon, J. H., Maddock, R. J., Rokem, A., Silver, M. A.,Minzenberg, M. J., Ragland, J. D., et al. (2010). GABAconcentration is reduced in visual cortex in schizophrenia andcorrelates with orientation-specific surround suppression.Journal of Neuroscience, 30(10), 3777e3781.
Yordanova, J., Kolev, V., Hohnsbein, J., & Falkenstein, M. (2004).Sensorimotor slowing with ageing is mediated by a functionaldysregulation of motor-generation processes: evidence fromhigh-resolution event-related potentials. Brain, 127(Pt 2),351e362.
Zhang, W., & Luck, S. J. (2009). Feature-based attention modulatesfeedforward visual processing. Nature Neuroscience, 12(1),24e25.