Generalized metabolic bone disease in Neurofibromatosis type I
14
Generalized Metabolic Bone Disease in Neurofibromatosis Type I Nicola Brunetti-Pierri, M.D. 1 , Stephen B. Doty, Ph.D. 2 , John Hicks, M.D., Ph.D. 3 , Kelly Phan 1 , Roberto Mendoza-Londono, M.D. 1 , Maria Blazo, M.D. 1 , Alyssa Tran 1 , Susan Carter 1,4 , Richard Alan Lewis, M.D. 1,5,6 , Sharon E. Plon, M.D., Ph.D. 1,6 , William A. Phillips, M.D. 7 , E. O’Brian Smith, Ph.D. 6,8 , Kenneth J. Ellis, Ph.D. 6,8 , and Brendan Lee, M.D., Ph.D. 1,4 1 Department of Molecular and Human Genetics, Baylor College of Medicine, Houston, TX 2 Hospital for Special Surgery, New York, New York 3 Department of Pathology, Baylor College of Medicine, Houston, TX 4 Howard Hughes Medical Institute, Baylor College of Medicine, Houston, TX 5 Department of Ophthalmology, Baylor College of Medicine, Houston, TX 6 Department of Pediatrics, Baylor College of Medicine, Houston, TX 7 Department of Orthopedic Surgery, Baylor College of Medicine 8 Children’s Nutrition Research Center, Baylor College of Medicine, Houston, TX Abstract Skeletal abnormalities are a recognized component of Neurofibromatosis type I (NF1) but a generalized metabolic bone defect in NF1 has not been fully characterized thus far. The purpose of this study was to characterize at the densitometric, biochemical and pathological level the bone involvement in NF1 patients. Using dual energy X-ray absorptiometry (DXA) we analyzed bone status in 73 unselected NF1 subjects, 26 males and 47 females, mainly children and adolescents (mean age: 16.6 years). In a subgroup of subjects with low bone mass, we measured indices of calcium-phosphate metabolism, bone turnover, and bone density before and after vitamin D and calcium treatment. We found statistically significant and generalized reduction in bone mass with the mean lumbar bone mineral density (BMD) z-score being −1.38 ± 1.05 (CI 95% −1.62 to −1.13), and whole body bone mineral content (BMC) z-score −0.61 ± 1.19 (CI 95% −0.94 to −0.29), both significantly reduced compared to normal controls (p<.001). PTH was moderately elevated and after 4 months of supplemental therapy with calcium and vitamin D, it decreased to the normal range. However, BMD z-scores did not significantly improve after two years of follow-up. Histological analysis of bone samples from NF1 patients revealed substantial alteration of bone microarchitecture due mainly to reduced trabecular bone. Our observations are consistent with a generalized bone metabolic defect due to loss of the function of neurofibromin. Early identification of patients with osteoporosis may permit more timely and aggressive treatments to prevent the likely substantial morbidity associated with increased fracture risk later in life. Correspondence to Dr. Brendan Lee, M.D., Ph.D. at the Department of Molecular and Human Genetics, Baylor College of Medicine, One Baylor Plaza, Rm 635E Houston, TX 77030 or at: [email protected]; Phone 713-798-8835. Fax 713-798-5168. Publisher's Disclaimer: This is a PDF file of an unedited manuscript that has been accepted for publication. As a service to our customers we are providing this early version of the manuscript. The manuscript will undergo copyediting, typesetting, and review of the resulting proof before it is published in its final citable form. Please note that during the production process errors may be discovered which could affect the content, and all legal disclaimers that apply to the journal pertain. Published as: Mol Genet Metab. 2008 May ; 94(1): 105–111. HHMI Author Manuscript HHMI Author Manuscript HHMI Author Manuscript
-
Upload
independent -
Category
Documents
-
view
1 -
download
0
Transcript of Generalized metabolic bone disease in Neurofibromatosis type I

Generalized Metabolic Bone Disease in Neurofibromatosis Type I
Nicola Brunetti-Pierri, M.D.1, Stephen B. Doty, Ph.D.2, John Hicks, M.D., Ph.D.3, KellyPhan1, Roberto Mendoza-Londono, M.D.1, Maria Blazo, M.D.1, Alyssa Tran1, SusanCarter1,4, Richard Alan Lewis, M.D.1,5,6, Sharon E. Plon, M.D., Ph.D.1,6, William A. Phillips,M.D.7, E. O’Brian Smith, Ph.D.6,8, Kenneth J. Ellis, Ph.D.6,8, and Brendan Lee, M.D., Ph.D.1,4
1 Department of Molecular and Human Genetics, Baylor College of Medicine, Houston, TX
2 Hospital for Special Surgery, New York, New York
3 Department of Pathology, Baylor College of Medicine, Houston, TX
4 Howard Hughes Medical Institute, Baylor College of Medicine, Houston, TX
5 Department of Ophthalmology, Baylor College of Medicine, Houston, TX
6 Department of Pediatrics, Baylor College of Medicine, Houston, TX
7 Department of Orthopedic Surgery, Baylor College of Medicine
8 Children’s Nutrition Research Center, Baylor College of Medicine, Houston, TX
AbstractSkeletal abnormalities are a recognized component of Neurofibromatosis type I (NF1) but ageneralized metabolic bone defect in NF1 has not been fully characterized thus far. The purpose ofthis study was to characterize at the densitometric, biochemical and pathological level the boneinvolvement in NF1 patients. Using dual energy X-ray absorptiometry (DXA) we analyzed bonestatus in 73 unselected NF1 subjects, 26 males and 47 females, mainly children and adolescents(mean age: 16.6 years). In a subgroup of subjects with low bone mass, we measured indices ofcalcium-phosphate metabolism, bone turnover, and bone density before and after vitamin D andcalcium treatment. We found statistically significant and generalized reduction in bone mass withthe mean lumbar bone mineral density (BMD) z-score being −1.38 ± 1.05 (CI 95% −1.62 to −1.13),and whole body bone mineral content (BMC) z-score −0.61 ± 1.19 (CI 95% −0.94 to −0.29), bothsignificantly reduced compared to normal controls (p<.001). PTH was moderately elevated and after4 months of supplemental therapy with calcium and vitamin D, it decreased to the normal range.However, BMD z-scores did not significantly improve after two years of follow-up. Histologicalanalysis of bone samples from NF1 patients revealed substantial alteration of bone microarchitecturedue mainly to reduced trabecular bone.
Our observations are consistent with a generalized bone metabolic defect due to loss of the functionof neurofibromin. Early identification of patients with osteoporosis may permit more timely andaggressive treatments to prevent the likely substantial morbidity associated with increased fracturerisk later in life.
Correspondence to Dr. Brendan Lee, M.D., Ph.D. at the Department of Molecular and Human Genetics, Baylor College of Medicine,One Baylor Plaza, Rm 635E Houston, TX 77030 or at: [email protected]; Phone 713-798-8835. Fax 713-798-5168.Publisher's Disclaimer: This is a PDF file of an unedited manuscript that has been accepted for publication. As a service to our customerswe are providing this early version of the manuscript. The manuscript will undergo copyediting, typesetting, and review of the resultingproof before it is published in its final citable form. Please note that during the production process errors may be discovered which couldaffect the content, and all legal disclaimers that apply to the journal pertain.
Published as: Mol Genet Metab. 2008 May ; 94(1): 105–111.
HH
MI Author M
anuscriptH
HM
I Author Manuscript
HH
MI Author M
anuscript
KeywordsNeurofibromatosis type I; NF1; osteoporosis; osteopenia
INTRODUCTIONNeurofibromatosis type 1 (NF1) is the most common autosomal dominant disease and itpresents with progressive clinical manifestations involving the cutaneous, nervous, vascular,and skeletal systems [1,2]. Skeletal problems are common in NF1 patients especially duringchildhood. Although highly variable, these problems can include scoliosis, pseudoarthrosis,and short stature. The osseous dysplasia result from disturbed bone growth, perhaps secondaryto a mineralization disturbance [3–5]. While these findings indicate defects of localized skeletalsegments, the ubiquitous expression and pleiotropic functions of neurofibromin raises thepossibility of systemic skeletal or bone disease in individuals with NF1 [6].
Reduced bone mineral mass is emerging as an important complication of NF1. Reduced bonemineral density (BMD) in NF1 patients was initially recognized by Illes et al. [7]. Based onthe intraoperative findings of poor vertebral bone quality, they measured the BMD of thelumbar spine in 12 young (mean age of 19.1 years) NF1 patients with severe scoliosis requiringsurgical correction and found a significant reduction in the BMD (mean z-score = −2.5) at thelumbar spine which was inversely correlated with the severity of scoliosis. Following this initialreport, recent studies have confirmed a decreased bone mass in NF1 patients including children[8–12]. Lammert et al. performed a cross-sectional study on 104 adults with NF1, usingquantitative ultrasonometry (QUS) and found that BMD was significantly lower in NF1patients than in the normal population and similarly to Illes et al. the decrease in BMD appearedto be more pronounced in patients with severe scoliosis [9]. Subsequently, Stevenson et al.using DXA in a group of 5–18 year-old NF1 patients found decreased localized and generalizedreduction compared to a local control population of subjects without NF1 [10]. These findingshave been further confirmed in small cohorts of pediatric patients using DXA [11,12].
Osteoporosis is a common disease with substantial morbidity and mortality. The densitometriccriteria for osteoporosis are well established for the diagnosis in postmenopausal women as apredictor of fracture risk. While useful for evaluation of fracture risk in adults, T-scores arederived from reference populations of young-adult women and are not applicable to thediagnosis of osteoporosis in children. The diagnosis of osteoporosis in children is moredifficult: densitometric data have been compared with age-matched control populations, i.e.,z-scores. It is generally agreed that z-scores <−1.5 are indicative of low bone mass, and thatosteoporosis is suspected strongly with z-scores <−2, especially with history of fracture.Recently z-score <− 2 have been proposed to define low bone density in children [13]. Analysisof both BMD and bone mineral content (BMC) in growing children may be the most accuratein the assessment of skeletal status and none of the previous studies have provided concurrentanalyses of both these parameters.
In the present study, we investigated the bone mineral status, and the bone metabolic markersin a group of prospectively non-selected subjects with NF1. In addition, we evaluated at thehistological and ultrastructural levels the alterations present in the NF1 bone.
METHODSThe study was approved by the Institutional Review Board for Human Subject Research atBaylor College of Medicine. Informed, written consent was obtained from all enrolled subjectsor from parents as appropriate.
Brunetti-Pierri et al. Page 2
Mol Genet Metab. Author manuscript; available in PMC 2009 January 23.
HH
MI Author M
anuscriptH
HM
I Author Manuscript
HH
MI Author M
anuscript

SubjectsThe participants in the study were 73 NF1 subjects (26 males, 47 females) attending theNeurofibromatosis Clinic at Texas Children’s Hospital, Houston, Texas. Average age was 16.0years (range: 2.8–58.9 years). Unlike most of the previous studies, these subjects wereunselected for skeletal problems. This population included different ethnicities representativeof the region and the diversity of the NF Clinic population: Caucasian (n = 46), African-American (n = 10), Hispanic (n = 15), Asiatic (n = 2). Among all subjects, the diagnosis wasestablished clinically with the presence of two or more classic diagnostic criteria according tothe NIH Consensus Conference [14]. Height was measured with a stadiometer to ± 0.5 cm, andweight (± 0.1 kg) was measured on a standard clinical balance. The body mass index (BMI)was calculated as weight/height2 (kg/m2). Dietary calcium intake was assessed by detailedfood frequency questionnaire about dairy products [15]. Total calcium intake from all sourceswas categorized as <500 mg/d, 500–1000 mg/d, and >1000 mg/d. Habitual physical activitywas measured by questionnaire [16]. Drug intake and fracture history were also included inthe questionnaires administered to the subjects. Questionnaires were completed by 67 of the73 participants of this study.
Densitometric analysesBMC and areal density measurements were obtained with a Hologic Delphi-A instrument withfan-beam technology (Software version 11.2). Total body and regional measurements of bonewere obtained. The following bone parameters were recorded: BMC, bone area, and BMD forwhole body, lumbar spine, trochanter and femoral neck. Z-scores for BMC and BMD werecalculated from the reference values provided by the Body Composition Laboratory of theChildren’s Nutrition Research Center [17].
Bone pathologyBone samples from three NF1 patients with reduced bone mass were obtained from the spinevertebrae during surgical correction of scoliosis. The histopathological examinations werecompared to a bone specimen from the same site of healthy, age-, sex-, and gender-matchedsubject obtained at autopsy.
Bone samples were preserved in glutaraldehyde for 18–24 hours and small pieces of calcifiedbone were post-fixed in 1% osmium tetraoxide, dehydrated in graded ethyl alcohols, andembedded in epoxy resin (Epon 812; Polysciences). Thin sections were obtained with adiamond knife and collected on water containing one drop of bromthymol blue, with pHadjusted to 8.0. This prevented decalcification of the section while floating on water duringsectioning. Sections approximately 80 nm in thickness were collected and stained with uranylacetate in 70% alcohol and aqueous basic lead citrate.
Statistical methodsWe used SPSS 11.5 (SPSS Inc., Chicago, Illinois, USA) for statistical analysis. Comparisonof z-score mean with the zero mean reference value was made with the one sample t-test.95th centile confidence intervals were calculated: results are shown as mean ± SD. Linearregression assessed the relationship between dependent variables (whole body BMC z-score,lumbar spine BMD z-score) and independent variables (calcium intake, physical activity).
RESULTSSubjects
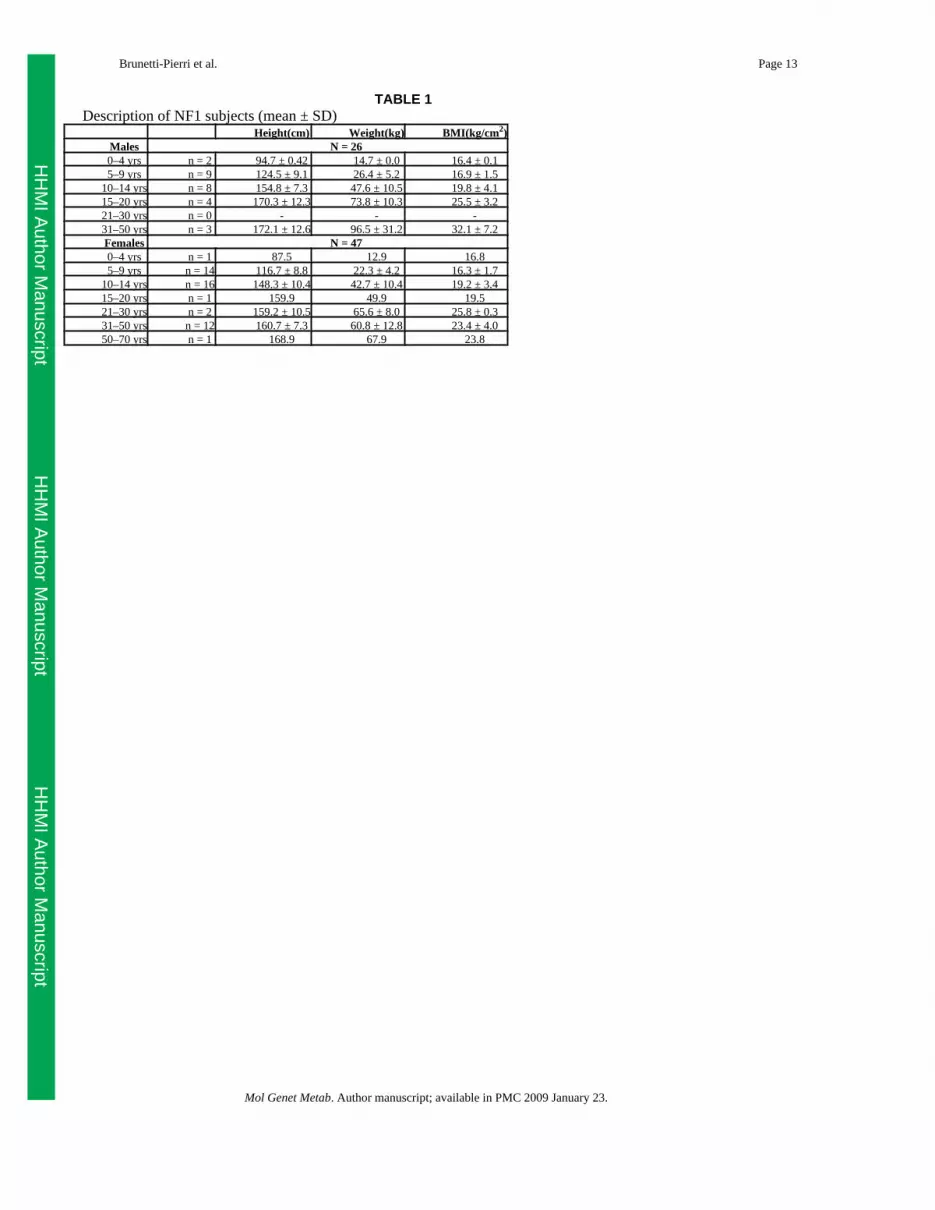
The anthropometric characteristics of our population are summarized in Table 1. Ourpopulation is composed of children, adolescents, and young adults (54 out of 73 participants
Brunetti-Pierri et al. Page 3
Mol Genet Metab. Author manuscript; available in PMC 2009 January 23.
HH
MI Author M
anuscriptH
HM
I Author Manuscript
HH
MI Author M
anuscript
were less than 20 years old); the mean age is 16.0 ± 12.2 years. As expected [18], the meanheight is reduced, as indicated by height z-score which is on average ≈ −0.40. The mean BMIwas 20.1 ± 5.0. The mean calcium intake was 1356 ± 736mg/day.
Total calcium intake was less than 500 mg/d in 8 subjects, 500–1000 mg/d in 15 subjects, and>1000 mg/d in 44 subjects. Linear regression assessed the relationship between dependentvariables (whole body BMC z-score, lumbar spine BMD z-score) and independent variables(calcium intake, physical activity). When two extreme outliers (subjects with low whole bodyBMC z-score and high calcium intake) are excluded from analysis, no statistical relationshipexisted between calcium intake and whole body BMC or lumbar BMD z-scores. Likewise, thelevel of physical activity was not correlated with whole body BMC and lumbar spine BMD z-scores. None of the subjects enrolled were taking corticosteroids at the time of the study. Inour cohort fractures occurred in 52% of the patients with 33.3% with more than one fracture.
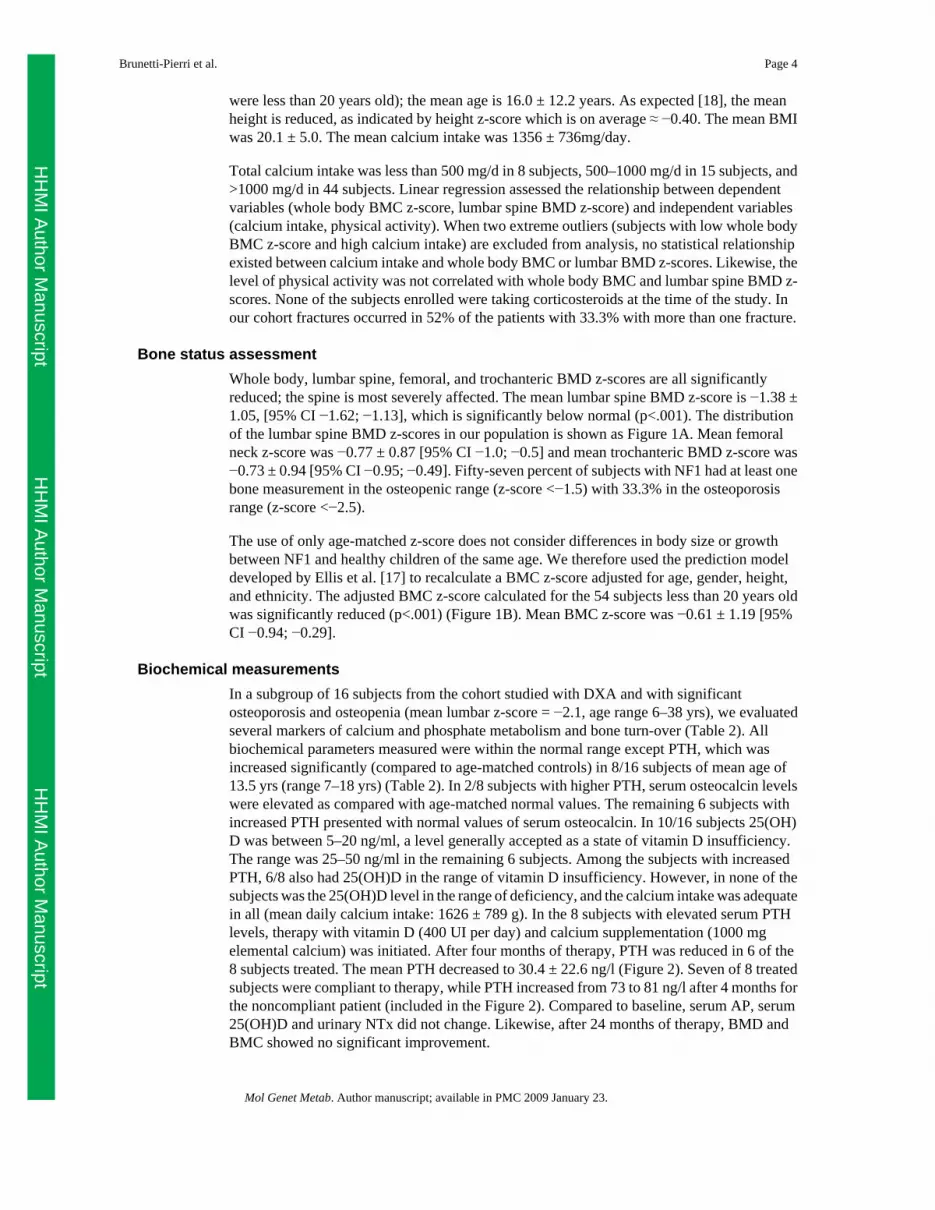
Bone status assessmentWhole body, lumbar spine, femoral, and trochanteric BMD z-scores are all significantlyreduced; the spine is most severely affected. The mean lumbar spine BMD z-score is −1.38 ±1.05, [95% CI −1.62; −1.13], which is significantly below normal (p<.001). The distributionof the lumbar spine BMD z-scores in our population is shown as Figure 1A. Mean femoralneck z-score was −0.77 ± 0.87 [95% CI −1.0; −0.5] and mean trochanteric BMD z-score was−0.73 ± 0.94 [95% CI −0.95; −0.49]. Fifty-seven percent of subjects with NF1 had at least onebone measurement in the osteopenic range (z-score <−1.5) with 33.3% in the osteoporosisrange (z-score <−2.5).
The use of only age-matched z-score does not consider differences in body size or growthbetween NF1 and healthy children of the same age. We therefore used the prediction modeldeveloped by Ellis et al. [17] to recalculate a BMC z-score adjusted for age, gender, height,and ethnicity. The adjusted BMC z-score calculated for the 54 subjects less than 20 years oldwas significantly reduced (p<.001) (Figure 1B). Mean BMC z-score was −0.61 ± 1.19 [95%CI −0.94; −0.29].
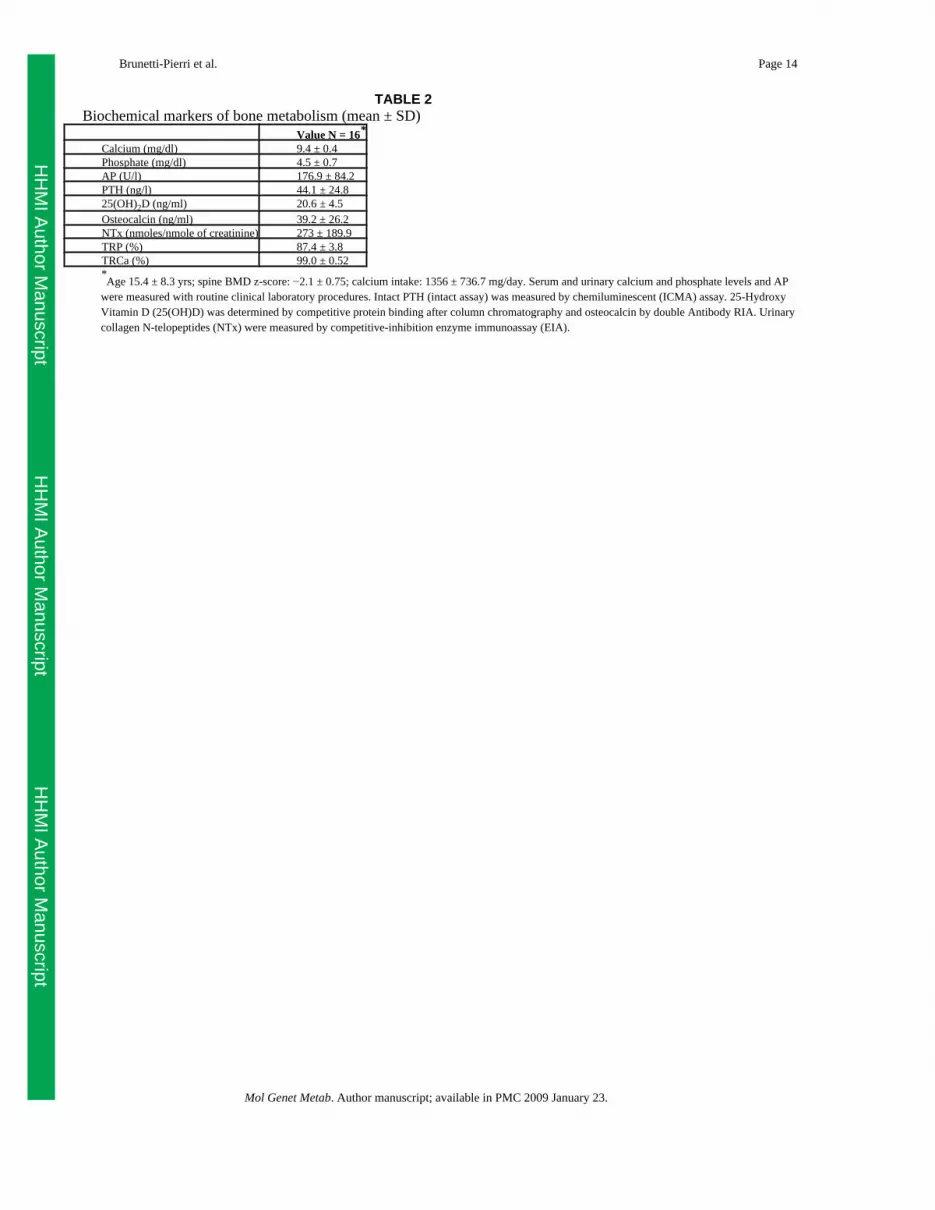
Biochemical measurementsIn a subgroup of 16 subjects from the cohort studied with DXA and with significantosteoporosis and osteopenia (mean lumbar z-score = −2.1, age range 6–38 yrs), we evaluatedseveral markers of calcium and phosphate metabolism and bone turn-over (Table 2). Allbiochemical parameters measured were within the normal range except PTH, which wasincreased significantly (compared to age-matched controls) in 8/16 subjects of mean age of13.5 yrs (range 7–18 yrs) (Table 2). In 2/8 subjects with higher PTH, serum osteocalcin levelswere elevated as compared with age-matched normal values. The remaining 6 subjects withincreased PTH presented with normal values of serum osteocalcin. In 10/16 subjects 25(OH)D was between 5–20 ng/ml, a level generally accepted as a state of vitamin D insufficiency.The range was 25–50 ng/ml in the remaining 6 subjects. Among the subjects with increasedPTH, 6/8 also had 25(OH)D in the range of vitamin D insufficiency. However, in none of thesubjects was the 25(OH)D level in the range of deficiency, and the calcium intake was adequatein all (mean daily calcium intake: 1626 ± 789 g). In the 8 subjects with elevated serum PTHlevels, therapy with vitamin D (400 UI per day) and calcium supplementation (1000 mgelemental calcium) was initiated. After four months of therapy, PTH was reduced in 6 of the8 subjects treated. The mean PTH decreased to 30.4 ± 22.6 ng/l (Figure 2). Seven of 8 treatedsubjects were compliant to therapy, while PTH increased from 73 to 81 ng/l after 4 months forthe noncompliant patient (included in the Figure 2). Compared to baseline, serum AP, serum25(OH)D and urinary NTx did not change. Likewise, after 24 months of therapy, BMD andBMC showed no significant improvement.
Brunetti-Pierri et al. Page 4
Mol Genet Metab. Author manuscript; available in PMC 2009 January 23.
HH
MI Author M
anuscriptH
HM
I Author Manuscript
HH
MI Author M
anuscript
Bone pathology analysesThe NF1 bone had marked reduction in the number and thickness of the bony trabecula andappropriate cement lines and viable osteocytes (Figure 3D, E, F) as compared with bonespecimen from the same site of healthy, age-, sex-, and gender-matched subject (Figure 3A,B, C). A Von Kossa stain showed normal mineralization of the bone (not shown). At theultrastructural level, we observed on the bone surface of two bone samples from two distinctNF1 patients the presence of numerous lining cells which have replaced well differentiatedosteoblasts (Figures 4A and B). As a control, we used a sample from a osteogenesis imperfecta(OI) patient (Figure 4C) which shows osteoblasts with abundant endoplasmic reticulum andwell differentiated cytoplasmic structures. In contrast, the lining cells in the NF1 bone samples(Figures 4A and B) are not well differentiated and show few cytoplasmic structures thatresemble active osteoblasts. The nature of these cells is unclear and they were not found in theOI bone sample. Further studies are needed to determine the identity of these cells. In addition,electron microscopy of the mineralized matrix in NF1 patients shows a severe reduction inmineral content.
DISCUSSIONIncreased risks for osteoporosis are emerging as complications among selected genetic diseasepopulations. Early diagnosis in the pediatric population is especially important since the highestcontribution to peak bone mass is attained in the first three decades. A primary goal of thisstudy was to evaluate the bone mineral status and biochemical markers of bone metabolism inpediatric and young adult subjects affected by NF1, the most common dominantly inheritedgenetic disorders.
NF1 may have diverse skeletal abnormalities usually present in childhood [19]. They includescoliosis, pseudoarthrosis, limb length discrepancy, macrocephaly, and sphenoid wingdysplasia. Our study is the first to systematically investigate the bone status of NF1 subjectsthrough a multi-level (DXA, biochemical and histological) analysis. For adults, clinicalevaluations of bone status are usually based only on BMD. However, this approach may beinsufficient in children because both BMC and bone area are changing during growth and theirtemporal rates of changes are not necessarily coupled [20]. When only BMD is used, the relativedensity of smaller bones can be systemically underestimated while that of larger bones isoverestimated, thus confounding interpretation especially for values obtained during growth.
For children, height, age, gender, and ethnicity must be accounted. For the children includedin this study, we have used the pediatric-based prediction model for whole BMC as reportedby Ellis et al.[17], which is based on a convenient sample of over 2300 children and adolescentsfrom the same geographic area as our NF1 subjects [17].
Our results indicate that the mean lumbar and whole body BMD z-scores were in the range ofosteopenia and osteoporosis in 35/73 (48%) and 18/73 (25%) subjects, respectively. BMD wasreduced at multiple bone sites, the lumbar spine being more severely affected. The lumbarspine contains mainly trabecular bone which is metabolically active and is sensitive toderangements of the mineralization process, particularly in young subjects [21,22].Interestingly, the prevalence of this bone complication is higher compared to the other boneproblems reported in NF1 patients. Bone histological analysis performed in patients confirmedthe severe involvement of trabecular bone. However, these results need to be interpreted withcaution since the three patients from whom the samples were obtained exhibited a more severebone involvement.
In the subgroup of 16 subjects with significant osteopenia/osteoporosis, we found eight subjectswith mild serum PTH elevation. Osteocalcin concentrations are elevated during skeletal growth
Brunetti-Pierri et al. Page 5
Mol Genet Metab. Author manuscript; available in PMC 2009 January 23.
HH
MI Author M
anuscriptH
HM
I Author Manuscript
HH
MI Author M
anuscript
and in various conditions characterized by increased bone turnover, includinghyperparathyroidism. However, it was elevated in only two subjects with secondaryhyperparathyroidism and levels were normal in the remaining subjects including six subjectswith hyperparathyroidism. In the six subjects with higher levels of PTH, the normal levels ofosteocalcin should be considered as inappropriately low and the absence of a compensatoryincrease of osteocalcin may suggest an insufficiency of osteoblastic activity. Serum 25(OH)Dis the best indicator of vitamin D status, although it is still debated as to the threshold levelsindicating vitamin D deficiency [23][24]. Therefore, we cannot rule out vitamin D insufficiencyas contributing to the hyperparathyroidism in the subjects we analyzed. In the present studyvitamin D treatment and calcium supplement resulted in the normalization of PTH in 6/8subjects substantiating the secondary nature of the hyperparathyroidism. However, levels of25(OH)D and both lumbar spine BMD and whole body BMC remained unchanged even afternormalization of PTH levels.
In summary, we demonstrated that, on a population basis, young NF1 subjects have reducedbone mass; the lumbar spine having the most severe involvement. More than half the subjectsof our NF1 population have at least one regional site in the osteopenic range, and one-third hasat least one regional site in the osteoporotic range.
The finding of a mild PTH increase in the face of normal bone turnover indices suggests thatNF1 may be associated with a disturbance in bone metabolism. The neurofibromin protein,independent of its RasGTPase-activating activity, can modulate adenyl cyclase activity andprotein kinase A (PKA) [25–27]. Since cAMP and PKA are primary signaling pathwaysregulating osteoblast and osteoclast cell function in response to PTH, it is plausible thathaploinsufficiency of NF1 in humans can result in both decreased bone formation (osteoblasticactivity) and/or osteoclastic activity and the clinical picture of adynamic bone [28].
Recent studies investigating neurofibromin have suggested multiple essential roles in skeletaldevelopment and growth. Nf1 inactivation in murine undifferentiated mesenchymal cells leadsin fact to bowing of the tibia and diminished growth associated with decreased stability of thecortical bone, high degree of porosity, decreased stiffness and reduction in the mineral content.At the cellular level, osteoblasts showed an increase in proliferation and a decreased ability todifferentiate and mineralize in vitro [29]. In addition to an osteblastic defect, Nf1(+/−) micewere found to contain elevated numbers of osteoclasts with increased survival, proliferation,migration, adhesion, and resorptive activity. These gains of function were even morepronounced in ovariectomized mice [30].
Although the long-term consequence of reduced bone mass in childhood in NF1 patients isunknown, the findings of our study will have important implications for the follow-up andprevention of osteopenia/osteoporosis in this common genetic disease. As suggested by ourresults, intervention with vitamin D and calcium in NF1 patients may correct mild PTHincrease, although long-term effects on bone accretion are unknown. At least in this subgroupof subjects, normalization of PTH levels did not result in improved BMD or BMC over a twoyear period. Prospective clinical trials to determine whether more aggressive interventions suchas bisphosphonates will translate into increased bone mass in NF1 young adults are needed.
AcknowledgementsDr. Lewis is a Senior Scientist of Research to Prevent Blindness, New York, New York. We are grateful to theindividuals and families reported here for their willing and generous cooperation in these investigations. Part of thiswork was carried out at the Analytical Microscopy Core laboratory at Hospital for Special Surgery.
Brunetti-Pierri et al. Page 6
Mol Genet Metab. Author manuscript; available in PMC 2009 January 23.
HH
MI Author M
anuscriptH
HM
I Author Manuscript
HH
MI Author M
anuscript

AbbreviationsNF1
Neurofibromatosis type 1
DXA dual energy X-ray absorptiometry
BMD bone mineral density
BMC bone mineral content
GAP GTPase-activating proteins
QUS quantitative ultrasonometry
References1. Friedman JM. Epidemiology of neurofibromatosis type 1. Am J Med Genet 1999;89:1–6. [PubMed:
10469430]2. Carey JC, Viskochil DH. Neurofibromatosis type 1: A model condition for the study of the molecular
basis of variable expressivity in human disorders. Am J Med Genet 1999;89:7–13. [PubMed:10469431]
3. Crawford AH Jr, Bagamery N. Osseous manifestations of neurofibromatosis in childhood. J PediatrOrthop 1986;6:72–88. [PubMed: 3079778]
4. Riccardi VM. Von Recklinghausen neurofibromatosis. N Engl J Med 1981;305:1617–1627. [PubMed:6796886]
5. Stevenson DA, Zhou H, Ashrafi S, Messiaen LM, Carey JC, D'Astous JL, Santora SD, Viskochil DH.Double inactivation of NF1 in tibial pseudarthrosis. Am J Hum Genet 2006;79:143–148. [PubMed:16773574]
6. Alwan S, Tredwell SJ, Friedman JM. Is osseous dysplasia a primary feature of neurofibromatosis 1(NF1)? Clin Genet 2005;67:378–390. [PubMed: 15811002]
7. Illes T, Halmai V, de Jonge T, Dubousset J. Decreased bone mineral density in neurofibromatosis-1patients with spinal deformities. Osteoporos Int 2001;12:823–827. [PubMed: 11716184]
8. Yilmaz K, Ozmen M, Bora Goksan S, Eskiyurt N. Bone mineral density in children withneurofibromatosis 1. Acta Paediatr 2007;96:1220–1222. [PubMed: 17608828]
9. Lammert M, Kappler M, Mautner VF, Lammert K, Storkel S, Friedman JM, Atkins D. Decreased bonemineral density in patients with neurofibromatosis 1. Osteoporos Int 2005;16:1161–1166. [PubMed:15988556]
10. Stevenson DA, Moyer-Mileur LJ, Murray M, Slater H, Sheng X, Carey JC, Dube B, Viskochil DH.Bone mineral density in children and adolescents with neurofibromatosis type 1. J Pediatr2007;150:83–88. [PubMed: 17188620]
11. Kuorilehto T, Poyhonen M, Bloigu R, Heikkinen J, Vaananen K, Peltonen J. Decreased bone mineraldensity and content in neurofibromatosis type 1: lowest local values are located in the load-carryingparts of the body. Osteoporos Int 2005;16:928–936. [PubMed: 15551055]
12. Dulai S, Briody J, Schindeler A, North KN, Cowell CT, Little DG. Decreased bone mineral densityin neurofibromatosis type 1: results from a pediatric cohort. J Pediatr Orthop 2007;27:472–475.[PubMed: 17513973]
13. Writing Group for the ISCD Position Development Conference. Diagnosis of osteoporosis in men,premenopausal women, and children. J Clin Densitom 2004;7:17–26. [PubMed: 14742884]
Brunetti-Pierri et al. Page 7
Mol Genet Metab. Author manuscript; available in PMC 2009 January 23.
HH
MI Author M
anuscriptH
HM
I Author Manuscript
HH
MI Author M
anuscript

14. Neurofibromatosis. Conference statement. National Institutes of Health Consensus DevelopmentConference. Arch Neurol 1988;45:575–578. [PubMed: 3128965]
15. Angus RM, Sambrook PN, Pocock NA, Eisman JA. A simple method for assessing calcium intakein Caucasian women. J Am Diet Assoc 1989;89:209–214. [PubMed: 2915093]
16. Bertelloni S, Baroncelli GI, Battini R, Perri G, Saggese G. Short-term effect of testosterone treatmenton reduced bone density in boys with constitutional delay of puberty. J Bone Miner Res1995;10:1488–1495. [PubMed: 8686504]
17. Ellis KJ, Shypailo RJ, Hardin DS, Perez MD, Motil KJ, Wong WW, Abrams SA. Z score predictionmodel for assessment of bone mineral content in pediatric diseases. J Bone Miner Res 2001;16:1658–1664. [PubMed: 11547835]
18. Szudek J, Birch P, Friedman JM. Growth charts for young children with neurofibromatosis 1 (NF1).Am J Med Genet 2000;92:224–228. [PubMed: 10817659]
19. Vitale MG, Guha A, Skaggs DL. Orthopaedic manifestations of neurofibromatosis in children: anupdate. Clin Orthop 2002:107–118. [PubMed: 12151887]
20. Bass S, Delmas PD, Pearce G, Hendrich E, Tabensky A, Seeman E. The differing tempo of growthin bone size, mass, and density in girls is region-specific. J Clin Invest 1999;104:795–804. [PubMed:10491415]
21. Bonnick, S. Bone densitometry in clinical practice. Humana Press Inc; Totowa (NJ): 1998. p. 31-64.22. Gluer CC, Faulkner KG, Estilo MJ, Engelke K, Rosin J, Genant HK. Quality assurance for bone
densitometry research studies: concept and impact. Osteoporos Int 1993;3:227–235. [PubMed:8400603]
23. Thomas MK, Lloyd-Jones DM, Thadhani RI, Shaw AC, Deraska DJ, Kitch BT, Vamvakas EC, DickIM, Prince RL, Finkelstein JS. Hypovitaminosis D in medical inpatients. N Engl J Med1998;338:777–783. [PubMed: 9504937]
24. Vieth R, Chan PC, MacFarlane GD. Efficacy and safety of vitamin D3 intake exceeding the lowestobserved adverse effect level. Am J Clin Nutr 2001;73:288–294. [PubMed: 11157326]
25. Andersen LB, Fountain JW, Gutmann DH, Tarle SA, Glover TW, Dracopoli NC, Housman DE,Collins FS. Mutations in the neurofibromatosis 1 gene in sporadic malignant melanoma cell lines.Nat Genet 1993;3:118–121. [PubMed: 8499944]
26. Johnson MR, Look AT, DeClue JE, Valentine MB, Lowy DR. Inactivation of the NF1 gene in humanmelanoma and neuroblastoma cell lines without impaired regulation of GTP.Ras. Proc Natl Acad SciU S A 1993;90:5539–5543. [PubMed: 8516298]
27. The I, Murthy AE, Hannigan GE, Jacoby LB, Menon AG, Gusella JF, Bernards A. Neurofibromatosistype 1 gene mutations in neuroblastoma. Nat Genet 1993;3:62–66. [PubMed: 8490657]
28. Coen G. Adynamic bone disease: an update and overview. J Nephrol 2005;18:117–22. [PubMed:15931639]
29. Kolanczyk M, Kossler N, Kuhnisch J, Lavitas L, Stricker S, Wilkening U, Manjubala I, Fratzl P,Sporle R, Herrmann BG, Parada LF, Kornak U, Mundlos S. Multiple roles for neurofibromin inskeletal development and growth. Hum Mol Genet 2007;16:874–886. [PubMed: 17317783]
30. Yang FC, Chen S, Robling AG, Yu X, Nebesio TD, Yan J, Morgan T, Li X, Yuan J, Hock J, IngramDA, Clapp DW. Hyperactivation of p21ras and PI3K cooperate to alter murine and humanneurofibromatosis type 1-haploinsufficient osteoclast functions. J Clin Invest 2006;116:2880–28891.[PubMed: 17053831]
Brunetti-Pierri et al. Page 8
Mol Genet Metab. Author manuscript; available in PMC 2009 January 23.
HH
MI Author M
anuscriptH
HM
I Author Manuscript
HH
MI Author M
anuscript
Figure 1.A. Lumbar spine BMD z-score. Distribution of BMD z-score in NF1 compared to a normaldistribution. B. Whole body BMC z-score. Distribution of BMC z-score in NF1 compared toa normal distribution.The y axis represents the percentage of patients and z-scores are shown on the x axis.Comparison of z-score mean with the zero mean reference value was made with the one samplet-test using SPSS 11.5 (SPSS Inc., Chicago, Illinois, USA). 95th centile confidence intervalswere calculated: results are shown as mean ± SD.
Brunetti-Pierri et al. Page 9
Mol Genet Metab. Author manuscript; available in PMC 2009 January 23.
HH
MI Author M
anuscriptH
HM
I Author Manuscript
HH
MI Author M
anuscript

Figure 2.Serum level of PTH before (pre) and after (post) 4 months of vitamin D and calcium therapy.
Brunetti-Pierri et al. Page 10
Mol Genet Metab. Author manuscript; available in PMC 2009 January 23.
HH
MI Author M
anuscriptH
HM
I Author Manuscript
HH
MI Author M
anuscript

Figure 3.Representative section of the bone biopsies from controls (A, B, C) and from three subjectswith NF1 (D, E, F) (H&E, decalcified section). The bony trabeculae are reduced in numberand thickness. The control bone samples from healthy age-, and gender-matched childdemonstrate the typical trabecular structure of a vertebral body and a marrow space occupiedby typical bone marrow elements (H&E, decalcified section).
Brunetti-Pierri et al. Page 11
Mol Genet Metab. Author manuscript; available in PMC 2009 January 23.
HH
MI Author M
anuscriptH
HM
I Author Manuscript
HH
MI Author M
anuscript

Figure 4.Electron microscopy of the bone from two NF1 patients. Examples of the numerous round cellsadjacent to the bone surface observed in two independent bone samples from two distinct NF1patients are shown in A and B. These cells were not detected in the bone sample obtained froma patient with osteogenesis imperfecta used for comparison in C.
Brunetti-Pierri et al. Page 12
Mol Genet Metab. Author manuscript; available in PMC 2009 January 23.
HH
MI Author M
anuscriptH
HM
I Author Manuscript
HH
MI Author M
anuscript
HH
MI Author M
anuscriptH
HM
I Author Manuscript
HH
MI Author M
anuscript
Brunetti-Pierri et al. Page 13
TABLE 1Description of NF1 subjects (mean ± SD)
Height(cm) Weight(kg) BMI(kg/cm2)Males N = 260–4 yrs n = 2 94.7 ± 0.42 14.7 ± 0.0 16.4 ± 0.15–9 yrs n = 9 124.5 ± 9.1 26.4 ± 5.2 16.9 ± 1.5
10–14 yrs n = 8 154.8 ± 7.3 47.6 ± 10.5 19.8 ± 4.115–20 yrs n = 4 170.3 ± 12.3 73.8 ± 10.3 25.5 ± 3.221–30 yrs n = 0 - - -31–50 yrs n = 3 172.1 ± 12.6 96.5 ± 31.2 32.1 ± 7.2Females N = 470–4 yrs n = 1 87.5 12.9 16.85–9 yrs n = 14 116.7 ± 8.8 22.3 ± 4.2 16.3 ± 1.7
10–14 yrs n = 16 148.3 ± 10.4 42.7 ± 10.4 19.2 ± 3.415–20 yrs n = 1 159.9 49.9 19.521–30 yrs n = 2 159.2 ± 10.5 65.6 ± 8.0 25.8 ± 0.331–50 yrs n = 12 160.7 ± 7.3 60.8 ± 12.8 23.4 ± 4.050–70 yrs n = 1 168.9 67.9 23.8
Mol Genet Metab. Author manuscript; available in PMC 2009 January 23.
HH
MI Author M
anuscriptH
HM
I Author Manuscript
HH
MI Author M
anuscript
Brunetti-Pierri et al. Page 14
TABLE 2Biochemical markers of bone metabolism (mean ± SD)
Value N = 16*Calcium (mg/dl) 9.4 ± 0.4Phosphate (mg/dl) 4.5 ± 0.7AP (U/l) 176.9 ± 84.2PTH (ng/l) 44.1 ± 24.825(OH)2D (ng/ml) 20.6 ± 4.5Osteocalcin (ng/ml) 39.2 ± 26.2NTx (nmoles/nmole of creatinine) 273 ± 189.9TRP (%) 87.4 ± 3.8TRCa (%) 99.0 ± 0.52*Age 15.4 ± 8.3 yrs; spine BMD z-score: −2.1 ± 0.75; calcium intake: 1356 ± 736.7 mg/day. Serum and urinary calcium and phosphate levels and AP
were measured with routine clinical laboratory procedures. Intact PTH (intact assay) was measured by chemiluminescent (ICMA) assay. 25-HydroxyVitamin D (25(OH)D) was determined by competitive protein binding after column chromatography and osteocalcin by double Antibody RIA. Urinarycollagen N-telopeptides (NTx) were measured by competitive-inhibition enzyme immunoassay (EIA).
Mol Genet Metab. Author manuscript; available in PMC 2009 January 23.