
Polymer electro-optic modulators - Research Collection
150
ETH Library Polymer electro-optic modulators materials and devices Doctoral Thesis Author(s): Liakatas, Ilias Publication date: 2000 Permanent link: https://doi.org/10.3929/ethz-a-004083244 Rights / license: In Copyright - Non-Commercial Use Permitted This page was generated automatically upon download from the ETH Zurich Research Collection . For more information, please consult the Terms of use .
-
Upload
khangminh22 -
Category
Documents
-
view
2 -
download
0
Transcript of Polymer electro-optic modulators - Research Collection

ETH Library
Polymer electro-optic modulatorsmaterials and devices
Doctoral Thesis
Author(s):Liakatas, Ilias
Publication date:2000
Permanent link:https://doi.org/10.3929/ethz-a-004083244
Rights / license:In Copyright - Non-Commercial Use Permitted
This page was generated automatically upon download from the ETH Zurich Research Collection.For more information, please consult the Terms of use.

Diss. ETHNo. 13994
POLYMER ELECTRO-OPTIC MODULATORS:
MATERIALS AND DEVICES
A dissertation submitted to the
Swiss Federal Institute of Technology
Zurich
for the degree of Doctor of Natural Sciences
presented by
Tüas Liakatas
Dipl. Physicist, Aristoteles University of Thessaloniki
born May 26, 1972
citizen of Greece
accepted on the recommendation of
Prof. Dr. P. Günter, examiner
Prof. Dr. U. W. Suter, co-examiner
PD Dr. Ch. Bosshard. co-examuier
2000

"If you shed tears when you miss the sun, you also miss the stars"
Rubindranath Tagore, "Stray Birds"

1
Table of Content
Table of Content 1
Abstract 5
Zusammenfassung (Abstract in German) 7
FlepfAnijjn (Abstract in Greek) 9
1 Introduction 11
1.1 Motivation 11
1.1.1 Telecommunication and Electro-Optic Modulators 11
1.1.2 Electro-Optic Modulators Based on Organic Materials 11
1.2 Aim and Outline of This Work 12
1.3 Introduction to Nonlinear Optics 12
1.3.3 Basic Principle 12
1.3.4 Mathematical Description 13
1.3.5 Linear Electro-Optic Effect 13
1.3.6 Microscopic Nonhnearities in Organic Materials 14
1.3.7 Dispersion of Optical Nonlineantics 15
1.3.8 Relation Between Microscopic and Macroscopic Nonhnearities.16
1.4 Organic Nonlinear Optical Materials 17
1.4.9 Nonlinear Optical Molecules for Electro-Optics 17
A. Benzenes 20
B. (Azo-) Stilbencs 20
C. Tolanes 20
D. Thiophenes 21
E. Polyenes and Carotenoids 21
F. Lambda-Shape Molecules 22
G. Electron-Acceptor Groups 22
H. Electron-Donor Groups 22
1.4.10 Nonlinear Optical Polymers for Electro-Optics 28
1.5 Electro-Optic Modulators 39
1.5.11 Polymer-Based Electro-Optic Modulators 42
1.5.12 Overview of Presently Known Mach-Zehnder Electro-OpticModulators 44
Part A: Novel Nonlinear Optical Molecules for Electro-Optic Polymers 47
2 Nonlinear Optics of Molecules in Solution 48
2.1 Electric Field-Induced Second-Harmonic Generation (EFISH) 48
2.1.1 Theoretical Description 48
2.1.2 Experimental Description 51
2.2 Results on Molecular Nonhnearities of Synthesized Molecules 53
2.2.3 Molecular Nonhnearities of Zwitteriomc Molecules 53
2.2.4 Molecular Nonhnearities of Bithiophene Molecules 55
A. Dibithiophenes 55
P>. Phenylethenyl Bithiophenes 57
2.2.5 Molecular Nonhnearities of Phenyltetracnes 59
Table of Content

3 Nonlinear Optics of Molecules in Polymer Hosts 62
3.1 Experimental Methods 62
3.1.1 Determination of Nonlinear Optical Coefficients
(Maker-Fringe Measurements) 62
3.1.2 Determination of Electro-Optic Coefficients
(Ellipsometric Measurements) 63
i.2 Results on Macroscopic Nonhnearities 66
3.2.3 Nonlinear Optical Coefficients of Guest-Host PolymersBased on Zwitterionic Molecules 66
3.2.4 Electro-Optic Coefficients of Guest-Host PolymersBased on Bithiophene and Phenyltetraene Molecules 67
3.3 Competition of Intermolecular Electrostatic and Poling-FieldInteractions in Defining Macroscopic Electro-Optic Activity 68
4 Discussion and Conclusions (Part A) 72
4.1 Discussion 72
4.2 Conclusions 76
Part B: UV-Photobleaching Mechanisms of Side-Chain Polyimide A-95.11 77
5 UV-Photoinduced Changes 78
5.1 Film Thickness Changes 78
5.2 Ultraviolet-Visible (UV-Vis) Absorption Spectrum. 78
5.3 Fourier Transform Infrared (FT-1R) Spectra 80
5.4 Refractive Index Changes 81
5.5 Scattering Losses 82
6 Photobleaching Model 84
7 Discussion and Conclusions (Part B) 89
7.1 Discussion 89
7.2 Conclusions 90
Part C: Polyimide-Based Electro-Optic Modulators 91
8 Theory of Optical Waveguides 92
8.1 Planar Waveguides 92
8.1.1 Ray Optics Theory of Planar Waveguides 92
8.1.2 Electromagnetic Theory of Planar Waveguides 94
A. TM Modes. . .
"
95
B. I'E Modes 96
8.2 Channel Waveguides 98
9 Electro-Optic Modulator Device Design 100
9.1 Buffer Layer Selection 100
9.2 Parameter Optimization 102
9.3 Beam Propagation Method (BPM) Simulations 105
10 Electro-Optic Modulator Device Fabrication 108
10.1 Substrate Preparation Ill

10.2 Spin-Coating of Polymer Multilayers Ill
10.2.1 Active Layer A-95.11 112
10.2.2 Buffer Layer PI-293 112
10.2.3 Buffer Layer Cyclotenc 113
10.3 Waveguide Structuring with UV-Pholobleaching 114
10.4 Photolithographic Electrode Structuring 115
10.5 Fabrication of End-Faces 116
10.6 Pohns of Polvmer Multilayers 117
11 Electro-Optic Modulator Device Characterization 118
11.1 Characterization methods 118
11.1.1 Determination of the Half-Wave Voltage 118
A. Experimental Set-Up for Phase Modulators 119
B. Experimental Set-Up for Mach-Zchnder Modulators....
120
11.1.2 Extinction Ratio 120
11.1.3 Optical Losses 121
11.2 Performance of Fabricated Electro-Optic Modulators 122
11.2.4 Phase Modulators 122
A. Modulator PMP 123
B. Modulator PMC 123
11.2.5 Mach-Zehndcr Modulators 123
A. Modulator MZC1 124
B. Modulators MZC2 and MZC3 124
12 Discussion and Conclusions (Part C) 128
12.1 Discussion 128
12.2 Conclusions 130
13 General Conclusions and Outlook 131
Appendix 134
A.l Microscopic Nonhnearities of Investigated Molecules 134
A.2 Macroscopic Nonhnearities of Investigated Molecules 135
A.3 Photobleaching Parameters of Polyimide A-95.11 135
A.4 Performance Characteristics of Fabricated EO Modulators 136
A.5 Conversion Between Electrostatic and SI Units 136
List of Publications 137
References 140
Acknowledgements 146
Curriculum Vitae 147

#*K
»jr ^ «.»'
Table of Content

5
Abstract
With the request for high speed data transmission through the information networks ever
increasing, conventional links are being pushed to their limits. Optical interconnection can pro¬
vide the required bandwidth but there is a vital need to better merge optics with existing elec¬
tronic technologies, and to do so at a very low cost. Polymers are very promising for this
integration of electronics and optics, especially in the encoding of information onto a light
stream as this is a critical aspect of any interconnection scheme. Polymer electro-optic modula¬
tors are the main alternative to the standard lithium niobatc based encoding approaches due to
their intrinsic potential for ultrafast modulation, their low cost, and their ability for integrationwith semiconductor electronics. For polymer based electro-optic modulators, however, to
replace current technologies, adequate performance and reliability has to be demonstrated.
Materials with appropriate optical, chemical, and mechanical properties arc needed and the
modulator fabrication technology has to be mastered. The goal of this thesis is to investigate
highly efficient and stable nonlinear optical molecules which offer the functionality to the
polymers, and to fabricate electro-optic waveguide devices based on polyimide materials.
The molecular optical nonhnearities of three series of novel molecules were investigated bymeans of electric-field-induced second harmonic generation (EFISFI) and their macroscopic
optical nonhnearities in polymer systems were determined mainly by measuring their electro-
optic response. Zwitterionic molecules (bearing an anion and a cation) have large ground state
dipole moments (u) but average first-order hyperpolarizabilities at infinite wavelength (ß0)resulting to moderate values for the figure of merit uß0. Dibithiophene molecules (bearingtwo bithiophene units) are identified to be photochemically unstable and soluble only in very
polar solvents. Their low figure of merit is attributed to the overcontribution of the charge-transfer state -at the expense of the ground state- to the first-order hyperpolarizability due to
the high solvent polarity and the low aromaticity of the ground state. A substantial improve¬ment is found in phenylethenyl bithiophene molecules with strong electron donor and acceptor
groups. Values of the figure of merit uß0 up to 9300x10'69 m5CVl (nine times larger than that
of the standard nonlinear optical molecule Disperse Red 1) and thermal stabilities up to 343 °C
were obtained. Thus, phenylethenyl bithiophene molecules are among the most efficient yet
stable nonlinear optical chromophores reported so far. Phenyltetraene molecules with speciallyattached bulky endgroups and carbon side-chains exhibit large molecular nonhnearities and
very good solubilities due to increased intermolecular distance and, therefore, decreased inter¬
molecular interactions.
The influence of intermolecular interactions to the nonhnearities of selected compounds is
discussed. Microscopic nonhnearities of molecules with hydroxy donor groups are enhanced
in oxygen-containing solvents due to the formation of intermolecular with a concurrent reduc¬
tion of intramolecular hydrogen bonds. Macroscopic nonhnearities deviate from the classical
linear dependence on the molecular number density. When intermolecular interactions, dipole
moment, molecular shape, and dimensions are taken into account, nonhnearities peak at a cer¬
tain concentration and measured values are better correlated to theoretically expected ones.
For the determination of macroscopic nonhnearities the ellipsometric experimental set-up
was modified to allow in-situ measurement of electro-optic coefficients 0"^) during poling.Selected molecules were investigated in two different polymers at telecommunication wave-
Abstract
6
lengths. Coefficients up to ;-33 - 24 pm/V at 1552 nm for a chromophore loading of 15 weight
% in polymethylmethacrylate are reported.
The very efficient side-chain polyimide A-95.11 was used to fabricate waveguide electro-
optic modulators. Optical waveguides were formed using the photobleaching technique. The
technique was investigated with respect to the photomduced changes of the material's optical
losses, refractive index, and absorption spectrum. The losses increase considerably after pho¬
tobleaching and a strong birefringence is observed. Absorption spectra indicate that the pho¬
tobleaching process consists of two parallel occurring steps; an isomerization from a trans-TH
state to a eis state and a decay of the eis state to a trans-TM and a stable state. The processes
are theoretically described and the time evolution of the absorption peaks is modeled to reveal
the absorption cross section ratio of the two isomer states and the material's bleaching constant
which is needed to calculate the refractive index profile of photobleached films. Fourier-trans¬
form infrared spectroscopy points out possible conformations of the phofostable state.
The design and fabrication of waveguide electro-optic modulators is described. Cyclotene
was selected among a number of passive polymers to form the buffer layers. Waveguide mode
analysis and the beam propagation method were used to determine layer thicknesses,
waveguide structure, and duration of photobleaching. Direct photolithographic structuring was
used for the formation of the driving electrodes and substrate cleaving was applied for the con¬
struction of smooth end-faces. Phase and Mach-Zehnder modulators were fabricated and char¬
acterized with respect to their losses, extinction ratio, and half-wave voltage. We drove a
Mach-Zehnder modulator with 50 V and obtained an extinction ratio of 13 dB at 1313 nm.
Effective poling of multilayer structures and optical losses are identified to be the main issues
to be addressed to achieve an improved performance.
Abstract

7
Zusammenfassung (Abstract in German)
Mit dem ständig steigenden Bedarf für Hochgeschwindigkeitsdatenübertragung durch die
Informationsnetze werden konventionelle Verbindungen an ihre Grenzen getrieben. Optische
Verbindungen hingegen können die geforderte Bandbreite zur Verfügung stellen. Dazu ist es
notwendig, die Optik mit existierenden elektronischen Technologien zu kombinieren, und
dabei die Kosten sehr niedrig zu halten. Polymere sind für diese Integration von Elektronik und
Optik vielversprechend, besonders für die Kodierung der Informationen auf einen Lichtstrahl,
da dies ein kritischer Aspekt aller diskutierten Verbindungsentwürfc ist. Wegen ihres inheren-
ten Potentials für ultraschnclle Modulation, ihrer niedrigen Kosten und ihrer Fähigkeit für die
Integration mit der Halbleiterelcktromk sind elektro-optische Polymermodulatoren die Haupt-alternativen zu den üblichen, auf Lithiumniobat basierten Modulatoren. Um jedoch die aktuel¬
len Technologien durch elektro-optische Polymermodulatoren zu ersetzen, muss zuerst deren
ausreichende Leistungsfähigkeit und Zuverlässigkeit demonstriert werden. Materialien mit
geeigneten optischen, chemischen, und mechanischen Eigenschaften sind erforderlich und die
Technologie zu Herstellung von Polymermodulatoren muss beherrscht werden. Das Ziel dieser
Dissertation ist es, leistungsfähige und stabile nichtlinear optisch aktive Moleküle zur Integra¬tion in passive Polymere zu untersuchen und elektro-optische Wellenleitermodulatoren basiert
auf Polyimid herzustellen.
Die molekularen optischen Nichtlinearitäten dreier Serien neuer Molekülen wurden mittels
feldinduzierter Harmonischen-Erzeugung (EFISH) untersucht. Der relevante Qualitätsfaktor
auf molekularer Ebene ist das Produkt aus Grundstandsdiplomoment (p) und Hyperpolarisier-
barkeit erster Ordnung, extrapoliert zu unendlicher Wellenlänge (ß0). Die makroskopischen
optischen Nichtlinearitäten in Polymersystemen wurden hauptsächlich durch das Messen ihrer
elektro-optisehen Antwort bestimmt. Zwitterionischc Moleküle (ein Anion und ein Kation tra¬
gend) haben grosse Grundzustanddipolmomente, aber nur durchschnittliche Werte für ß0, und
ergeben deshalb nur massige Werte für den Qualitätsfaktor uß0 . Dibithiophcnmoleküle (zwei
Bithiophen-Einheiten tragend) zeichnen sich dadurch aus, dass sie photochemisch instabil und
nur in sehr polaren Lösungsmitteln löslich sind. Ihr niedriger Qualitätsfaktor wird dem Über¬
höhten Beitrag vom "charge transfer''- Zustand (auf Kosten des Grundzustands) an die Hyper-
polarisierbarkeit erster Ordnung zugeschrieben, dieswegen der hohen Lösungsmittelspolaritätund der niedrigen Aromatizitàt des Grundzustandes. Erheblich besser sind die Phenylethenyl -
bithiophenmoleküle mit starken Elektronenclonor- und Akzeptorgruppen. Qualitätsfaktorwerte
bis zu pß0=9300xl0~69 m5CVl (neunmal grösser als die des Standardmatcrials Disperse Red
1) und einer Temperaturstabilität bis zu 343 °C wurden erreicht. Somit gehören Phenylethenyl -
bithiophenmoleküle zu den leistungsfähigsten und dennoch thermisch stabilen nichtlinear opti¬schen Molekülen, die bis jetzt synthetisiert worden sind. Phenyl tetraenmolekü le mit speziell
angehängten voluminösen Endgruppen und Kohlenstoffseitenketten haben grosse molekulare
Nichtlinearitäten und sehr gute Loslichkeiten, da sie erhöhte intermolekulare Abstände und
folglich verringerte intermolekulare Wechselwirkungen aufweisen.
In Weiteren wird in dieser Arbeit der Einfluss der intermolekularen Wechselwirkungen auf
die Nichtlinearitäten ausgewählter Molekülen diskutiert. Mikroskopische Nichtlinearitäten von
Molekülen mit Plydroxyl-Donorgruppen sinds in sauerstoffhaltigen Lösungsmitteln wegen der
Bildung von intermolekularen Wasserstoffbindungen bei einer gleichzeitigen Minderung der
intramolekularen Wasserstoffbindungen höher. Makroskopische Nichtlinearitäten weichen von
Zusammenfassung (Abstract in German)

8
der klassischen linearen Abhängigkeit von der molekularen Konzentration ab. Werden intermo¬
lekulare Wechselwirkungen, Dipolmomente, molekulare Form und Masse in Betracht gezogen,
so haben Nichtlinearitäten bei einer bestimmten Konzentration in der Polymermatrix ein Maxi¬
mum und gemessene Werte können besser mit theoretisch zu erwartenden Werten korreliert
werden.
Zur Bestimmung der makroskopischen optischen Nichtlinearitäten wurde die klassische
ellipsometrische experimentelle Anordnung geändert, um das m~situ Messen von elektro-opti-schen Koeffizienten (r^), d.h. während des Polungsvorgangs, zu ermöglichen. AusgewählteMoleküle wurden in zwei unterschiedlichen Polymeren bei Tclekommunikationwellenlängenuntersucht. Sehr grosse Koeffizienten bis zu r^ = 24 pm/V bei 1552 nm für eine molekulare
Konzertration von 15 Gewichtsprozent in Polymethylmethacrylat wurden bestimmt.
Das sehr leistungsfähige Seitenkettenpolyimid A-95.11 wurde verwendet, um elektro-
optische Wellenleitermodulatoren herzustellen. Optische Wellenleiter wurden mit der Photo-
bleichtechnik hergestellt. Zuerst wurde diese Technik in Bezug auf lichtinduzierte Veränderun¬
gen der optischen Verluste, des Brechungsindexes, und des Absorptionsspektrums des
Materials untersucht. Die Verluste nehmen nach dem Photobleichen beträchtlich zu und eine
starke Doppelbrechung wird beobachtet. Absorptionsspektren zeigen, dass der Photobleich-
prozess aus zwei parallel ablaufenden Schritten besteht; eine Isomerisierung von einem trans-
TE Zustand zu einem eis Zustand und ein Zerfall des eis Zustandes zu einem trans-'TM oder zu
einem stabilen Zustand. Die Prozesse werden theoretisch beschrieben und die zeitliche
Entwicklung der Absorptionsmaxima wird modelliert, um den Absorptionsquerschnitt der
zwei Isomerzustände und die Bleichkonstante des Materials zu bestimmen. Die Bleichkon¬
stante ist erforderlich, um das Brechungsindexprofil photogebleichter Filme zu berechnen.
Fouriertransformierte Infrarotspektroskopie deutet auf mögliche Konformationen des photo¬stabilen Endzustandes hin.
Desweitern werden in dieser Arbeit das Design und die Herstellung von clcktro-optischenWellenleitermodulatoren beschrieben. Cyclotene wurde unter einer Anzahl von passiven Poly¬meren ausgewählt, um die Pufferschichten zu bilden. Mit Hilfe einer Analyse der Wcllenleiter-
moden und eines Verfahrens zur Bestimmung der Lichtstrahlausbreitung wurden
Schichtdicken, Wellenleiterstruktur. und optimale Dauer des Photobleichprozesses bestimmt.
Die direkte photolithographische Strukturierung wird für den Aufbau der Steuerelcktroden ver¬
wendet. Glatte Endflächen, notwendig zur effizienten Einkopplung des Lichtes, erhielten wir
durch Brechen des Substrates ("cleaving"). Phasen- und Mach-Zehnder-Modulatoren wurden
hergestellt und bezüglich ihrer Verluste, Auslöschungverhältnis und Halbwellenspannung cha¬
rakterisiert. Wir betrieben einen Mach-Zehnder-Modulator mit 50 V und erreichten ein Auslö¬
schungverhältnis von 13 dB bei 1313 nm. Die bessere Polung der Mehrschichtigstrukturen und
die Reduzierung optischen Verluste sind die Hauptfaktoren, die berücksichtigt werden müssen.
um verbesserte Leistungen zu erzielen.
Zusammenfassung (Abstract in German)
9
nepfXnij/n (Abstract in Greek)
Ms xriv t/nxriGri Yia u\|/r|Xf|ç Ta%6xrrxaç psxd8oor| 8s8opsvcöv pÉoco xcov xriXeTTiKOivcoviaKcov
SiKxnaw va au^dvsxai oovs%coc, 01 oupßaxiKEc cuvSsaeiç syyuÇouv xa öpid xouç. Ta OTtxiKd
ôiKxua jLiTtopouv va 7xapdo%oDv to arcaiToupevo eupoç C,évr\ç aXXd sivai aTiapai'xnxo va
at)y%covsuxei' p onxiKii lib tt|v UTrdpyoooa riXeKxpoviKn xevvoXoyfa Kai ps öoo to 8uvaxöv
%apriXöxspo kooxoç. Ta TtoXnp&pn sivai TtoXXd uTtoayopsva uXiKd yia auxii xriv ouyycovsuori
OTTxiKriç Kai ri^sKXpoviKiiç iSiai'xspa axnv KCö5iKOTtoir|cr| TtXripcxpopicüv Ttdvco öe OTtxiKd arjuaxa,
F.va appavxiKÖ Koppdxi KdBs SiKXuaKpç ôidxaçxiÇ- Ol TioXupspiKoi liXeKTpooTixiKof 8iapop(pcûxsçei'vai il Kupia evaXXaKXiKT] Xuan évavxi xcöv KaGtspcopsvcov peOoScov KCoSiKOTioi'noric ßaoiopsvsc
oe KpuoxdXXouç vioßiKOu raXXi'ou Xöycö xriç eyyevoûç xouç 8uvaxoxr|xaç yia 710X6 ypfryopri
ôtapopcpcoarp xod %appXou kootouç, Kai xpç Suvaxoxpxac oXoKXipcooiic xouç ps xriv riXsKxpoviKp
xe%voXoyia npiaycoycov. flapa xaura, yia va avxiKaxacmiaouv 01 TroXupspiKof ôtapopcpcoxéç xpv
U7idp%ooöa xs%voXoyi'a TTpsTTEi va S7n8si%0e{ iKavoTcouixiKii Xeitoopyia Kai açioTtiaxia. YXucd ps
KaxaXXiiXsc otixikeç, %ripiKÉç, Kai pr)%aviKÉç i8ioxr|TEç ei'vai aTiapai'xrrra Kai r\ xe%voXoyia
KaxaoKsnnç Siapopcpcoxcov repérai va avan;xu%9ei oe ui|/r]Xö ernrreSo. Xxo%oç auxiiç xpç
8i8aKxopiKiiç 8iaxpißiic ei'vai il 8isps6vr|or| rroXo aTtoxeXsopaxtKcov Kai oxaBepcov uï| ypappiKcov
OTtxiKcov popicov, xa ortoia rcpoocpépouv xrjv XeixoupyiKOxiixa axa rcoXupepri, jcaGcoç Kai n
KaxaoKEUii TiXeKxpooTmKcov Siapopfpcoxcov ßaaiopsvcov oe otttikouç Kupaxo8riyouç Kai os
7ioXuïpi8iKd uXiKa.
Oi uopiaKEç pp ypappiKÉç iSioxpxsç xpicov eiôcov popicov sÇsxdoBiiKav %prioipo7ioicôvxaç
Ttapaycoyri 8suxspriç appoviKiiç ETtaycôpsvri anô nXsKxpiKO rceSi'o (FFISH) Kai 01 paKpooKomKÉç
pn ypappiKÉç otixikeç xouç iSioxrrxsç as ouoxiipaxa juoXupspcôv KaÖopioxpKav Kupi'coç pexpcôvxaç
xriv riÀEKXpooTixiKii xouç aTiÖKpior]. AuïoviKd pôpia (us sva aviöv Kai sva Kaxiöv) s%ouvs
psydXEç SitcoXiksç porcéç (p) aXXd pÉxptsç imepTioXcooipöxrixec Tipcôxiiç xdçiiç os artsipcnç peydXa
pfiKiT Kupaxoç (ßo) ps artoxéXsopa va s%ouv péxpiouç Ssikxsç Tioioxrrxaç pß0. Ol 8inXo8i9sio(pi'vsç
(pöpia ps 860 8i6sio(piviKo6ç 8aKXuX(ouç) yapaKxipiCovxai arro cpcoxo%npiKi'i aoxdOsia Kai eivai
8iaXuxd povo os 710X6 tîoXikouç 8iaXv3xsç. Oi xappXof xouç 8s(kxsç Tioioxrixaç a7ro8i6ovxai oxriv
uTiepöuvstötpopd xrrç oxdOpnç pExacpopdç cpoptiou. sic ßdpoc xi]ç ßaoiKiic oxdGppç. oxiiv
07isp7toXcaoip6xriTa Ttpcùxnç xd^riç Xdyca xnç i)\|/iiXriç TioXiKoxrixaç xod 8iaX6xri Kai xrrç xapnXfiç
apœpaxiKOxnxaç xnç ßaoiKi'ic axdOpriç. Mia aupavxiKii ßEXxicüoi] Tiapaxiipsixai os
(psviXsoivsXiKÉç 8iosio(piveç pr, toxupéç opdôsç napo%iiç Kai an:o8o%iiç iiXsKxpovimv. ïïapa-
xriptiBTiKav xipsç xoo 8si'kxîi rcoioxrixaç uß0 scoç Kai 9300x10 m5CV"' (svvéa (popsç
pEyaXikspsç a7to aoxr) xoo ouviiOiouévou pn ypappiKOu otixikou popi'ou Disperse Red I) Kai
OsppiKii sooxdOsia ecûç xouç 343 ßaOpouc KsXoio». 'Exoi 01 (psviXsOivsXiKsç 8i8Eio(pivEç sivai
psxa^o raw mo aTxoxsXsapaxiKcov Kai xauxö%pova oxaGepcôv up ypappiKcov ottxikcov %pœpo(popcûv
popicov raw Éyouv avaipepOsi scoç xépa. OsviXxEXpafvsç us siSiKd auvvripÉvsç oyKc68iiç aKpafsç
opdSsç Kai TiXaïvsç aXuoiSsç dvÖpaKa s%ouv psydXsç pn ypauuiKÉç ottxiksç iSioxiixeç Kai ttoXu
KaXsç 8iaXi)xoxnxsç Xôyro au^iipÉvcov öiapopiaKcov arcooxdoEcov Kai, coç sk xouxou, psimpsvcov
ôiapopiaKcôv aXXïiXsmSpdGECûv.
Xu^nxdxai i] sTii'Spaoii tcov SiauopiaKcôv aXXiiXsjuopdosaw 0x1c pri ypappiKÉç ottxiksç
i8ioxi]tsç STnXsypÉvcov popicov. Oi piKpooKOTtiKsç pn ypappiKÉç ottxikéç uSioxnxsç popicov ps
o8poÇo opd8sç rcapo%iîç pXsKxpovfmv au^dvovxai oe 8iaX6xeç tcou 7ispiÉ%ouv o^uyövo Xoyco
o%îipaxiopo6 8iapopiaK©v, sic ßdpoc tcov svôopopiaKcûv, Ssgucùv o8poyovoo. Oi paKpooKorciKÉç
pr| ypappiKÉç ottxikéç iSiorptsç artOKXivouv aTtö xnv KXaaaiKri ypappiKfi o%écm, pe. xiiv popiaKn
(Abstract in Greek)

10
ouyKÉvxpcoori. 'Oxav Xapßdvovxai unöi|/iv 01 8iapopiaKÉç aXXriXeni8pdaeiç, 01 8itioXikéç ponéç,
Kai 01 popiaKEç 8iaoxdoeiç, 01 pp ypappiKÉç otixikeç i8ioxrrrsç napouoidÇouv pÉyioxo ce pia
ouyKEKpipévti auyKÉvxpcocrri Kai 01 TiEipapaxiKÉç xipéç auo%exi'Çovxai KaXuxspa pe xiç BecopriTiKd
avapsvopsvEç.
Fia xov Ttpoo8iopiopo paKpooKortiKcov pn ypappiKcov otttikcûv i8ioxi'rrcov pexaxpanriKS
KaxaXXiiXcoç p sXXn|/opsxpiKn nsipapaxiKi) Sidxaçn KaGiaxcôvxaç 8uvaxov va psxpnOsf in-situ o
pXsKXpoooTixiKOç auvxeXsoxnç (i"3j). ErnXsypéva uöpia s^sxdoflriKav oe 660 SiacpopsriKd
TtoXopEpi) os xiiXsniKOivcoviaKa priKii Kupaxoç. Avacpépoups ouvxsXeoxsç ecoç Kai r33^24 pm/V
oxa 1552 nm yia popiaKiî ouyKÉvxpcûoii 15% Kaxd ßdpoc axo TtoXupEpéç PMMA.
To TtoXu artoxEXsopaxiKÖ rcoXuïpi8sç A-95.11 us TîXayioouvvripsvsç xpcopotpopsç opd8sç
XpriöipoTioniBriKs yia xpv KaxaoKEnii pXEKxpoonxiKcov 8iapop(pcoxcôv orrxiKév KupaxoSnycov.
OixiKof Kupaxo8iiyoi oyripafioxriKav pe xnv pe'0o8o xnç (pcoxoXsuKavonç. H pÉGoSoç SispsuviiGriKS
coç npoç xiç (pcoxosrtaycûpEVEç aXXayéç oxiç otixikeç ancoXsisc, xov Ssucxri 8id0Xacrnç, Kai xo
(pdopa artoppoqrnoriç xou uXikou. Ol arcéXsiEç au£,àvovxai oiipavxiKd Kai Trapaxipei'xai loyupii
8ia0XaoxiKÖxnxa. <Mopaxa artoppocppoiiç uttoSeikvuouv oti r\ SiaSiKaoï'a xpç (pcoxoXEikavonç
arcoxsXEi'xai and 860 xiapdXXnXa ßnpaxa, Évav loopspiopö arto xnv trans-TE Kaxdoxaori oe pia
eis Kaxdöxaop Kai pia Kaxdnxcoop xpç Kaxdoxaopc eis oe pia trans-TM Kai oe pi'a oxaGspfj
Kaxdoxaap. Ol 8ia8iKaöiec Kai i} xpoviKp eÇsXicpi xcov KOpucpcov arroppöcpporic Ttspiypdtpovxai
GEcoprrxiKd. npooSiopi'^ovxai 0 Xöyoc Siaxopcov artoppöcpnanc xeov 800 loopepcov Kttxaoxdoecov
Kai 0 öuvxsXsöxiic (pcoxoXsuKavoiiç 0 ortoioç ypnoipononixai yia xov onoXoyiopö xnç Kaxavopiiç
xou SsfKxn SuiGXaoïiç os upsvia nou s%ouv nnooxst (pcoxoXeuKavon. OaopaxooKOTti'a
psxaaxnpaxiopoi) Roupie unspuBpoo ava8eiKvu£i niBavouç G%npaxiopo6ç xpç (pcoxooxaBEpfrc
Kaxdoxacriç.
nspiypdcpexai 0 o%s8iaopoç Kai n KaxaoKsur'i ii^sKxpoonxiKcov Siapopfpcoxcov pe ottxikouç
Kupaxo8nyouç. To noXupepéç cyclotenc STiiXs%0pKS uexaÇu 8iacpopcov naGpxiKév noXupspcôv yia
xov o%ppaxiopo xcpooxaxeuxiKcôv axpcopdxcov. AvdXuoi] Kupaxo8iyycov Kai p péGo8oç SidSoorrç
Séopriç xpnotpoTtoniGiiKav yia xov KaGopiopo xou rcàyouç xcov oxpcopdxcov, xpv popcpi) xcov
Kupaxo8nyow, Kai xnv 8idpKsia xpç (pcoxoXeuKavonç. 11 xe%viKfj dpeonç (pcoxoXiOoypacpi'aç
XpriaipoTtoniGriKe yia xov o%npaxiopo rcov riXsKxpo8icov Kai opaXsç aKpai'sç xopéç o%ripaxi'oxiiKav
o%i'Çovxaç xo unöorpcopa. Aiapopcpcoxéç xdonç kcïi xuttou Mach-Zchnder KaxaoKeudoxriKav Kai
%apaKxppiaxpKav coç npoç xiç cxticoXeieç, xov ßaGpö Kaxdoßsoric, Kai xnv xdori npiöEOu Kupaxoç.
Aeixoupyeioape évav 8iapop(pcoxii Mach-Zehnder pe 50 V Kai srnxuyaps ßaGpö anöoßsoric 13 dB
oxa 1313 nm. Oi guvoXiksç arucoXeieç si'vai 25 dB Kai 0 svepyoç pXsKxpoonxiKOç öuvxsXsöxiic
eivai r33=5.l pm/V. H artoxeXeopaxiKii popiaKii euOuypdppicrn rcoXuoxpcopaxiKcov Siaxdçscov Kai
01 otixikeç artcoXsiEc KaGopi'çTwxai coç xa Kupia oripsia rcou itpénsi va avanxu%Gouv Ttspaixspco
yia va ertixeu%0ei ßeXxicopevp artöSoop,
(Abstract in Greek)

11
1 Introduction
1.1 Motivation
1.1.1 Telecommunication and Electro-Optic Modulators
The tremendous increase of the internet users, the huge amount of data transferred through
the information networks, and the increasing need for high quality voice and image transmis¬
sion set the demands to be met by the telecommunications industry of the future. A first break¬
through in telecommunications came about twenty years ago when the first transatlantic
undersea optical fiber was launched using light as information carrier over long distances. The
big advantage of optical fibers compared to electrical or radio frequency communication sys¬
tems is their wide bandwidth allowing a simultaneous transmission of 600'000 voice channels
which is 20 or 100 times more than what is possible with satellites or coaxial cables, respec¬
tively. In optical communication the unit information carriers arc neither only electrons, as in
electronics, nor only photons, as in optics, but both. In this mixed form, optoelectronics, both
electrons and photons can carry information and interact with each other. This interaction takes
place within electro-optic materials by exploiting the linear electro-optic effect, a special case
of nonlinear optics.
The linear electro-optic effect describes the change of the refractive index of a material when
a voltage is applied to it. This modified refractive index leads to a change of the phase of a light
beam passing through the material and this phase change is used to modulate, deflect, or atten¬
uate light. Amplitude modulation is currently the preferred method of transmitting data opti¬
cally in long-haul systems, and many optical circuit configurations are known for converting
the fundamental electro-optic phase modulation into amplitude modulation. Among these con¬
figurations are a polarization phase retarder combined with polarizers, spatial directional cou¬
plers, and Mach-Zehnder waveguide interferometers. The waveguide interferon! etric
modulators have been the most popular option because of their simplicity and versatility. They
also permit high modulation speed for a given drive voltage and a large extinction ratio at high
speed. Today, Mach-Zehnder electro-optic modulators, external or integrated onto the same
chip as the laser, are available and fabricated by LiNb()3 and InGaAsP technologies.
1.1.2 Electro-Optic Modulators Based on Organic Materials
Organic electro-optic materials offer potential advantages over inorganic materials by virtue
of their low dielectric constants and high electro-optic coefficients. The characteristic of having
low dielectric constants in organic systems is derived from their electronic origin of electro-
optic response. The dispersion of electronic polarizability from DC to optical frequencies is
low and as a result, the velocity mismatch between the radio frequency and optical waves is
almost negligible in organic materials. This is a key factor affecting the bandwidth and effi¬
ciency of an electro-optic modulator. Successful molecular designs of highly conjugated asym¬
metric rr-electron systems result m big improvements of the molecular nonlinearity and
consequently very low drive voltage electro-optic modulators.
Due to the difficulty of growing defect-free noncentrosymmetric crystals out of nonlinear
optical molecules, nonlinear optical polymers offer an alternative way to incorporate these
molecules into an optically transparent medium for electro-optic applications. Polymers have
Introduction

12
low fabrication costs and are compatible with very large scale integration (VLSI) semiconduc¬
tor electronics.
Much research effort has been made in the last decade, but for polymeric electro-optic
devices to be commercially established there arc still a number of challenges that have to be
met. These challenges include even higher nonlinear optical activity, photochemical stability of
the active chromophores, oricntational stability of poled polymer systems, low optical losses,
and reliable packaging.
1.2 Aim and Outline of This Work
This work aims at;
• Developing novel, highly nonlinear molecules for polymer electro-optic applications.• Investigating and modeling the ultraviolet photobleaching process used for waveguide
formation in the electro-optic side-chain polyimide A-95.1 I.
• Demonstrating a prototype Mach-Zehnder electro-optic modulator based on the elec¬
tro-optic side-chain polyimide A-95.11.
It consists of an extended introduction (Chapter 1) and three main parts (A, B, and C). In
Chapter 1 the basic principles of nonlinear optics with focus on organic materials are intro¬
duced (Section 1.3). Representative molecules and polymers for electro-optic applications are
presented and compared (Section 1.4). An introduction to polymer-based electro-optic modula¬
tors is given and reported modulators arc discussed (Section 1.5).
In Part A three series of novel nonlinear optical molecules (zwitterionic stilbenes,
bithiophenes, and phenyltetraenes) are investigated with respect to their nonlinear optical prop¬
erties in solution (Chapter 2) and in polymer matrices (Chapter 3). Results are discussed in
Chapter 4.
In Part B the photobleaching effect used for optical waveguide fabrication on the side-chain
polyimide A-95.11 is treated. The photoinduced changes of the material's optical properties are
handled in Chapter 5 and a model is developed in Chapter 6 to qualitatively and quantitativelydescribe the photochemical processes involved. Results are discussed in Chapter 7.
Part C deals with the fabrication of prototypes of polyimide-bascd electro-optic modulators.
After a short introduction to the theory of optical waveguides (Chapter 8), the design (Chapter
9). fabrication (Chapter 10). and characterization (Chapter 11) of polymer phase and Mach-
Zehnder electro-optic modulators are presented. Results arc discussed in Chapter 12.
In Chapter 13 the results of this work are summarized and conclusions are drawn. Keyresults are listed in the Appendix.
1.3 Introduction to Nonlinear Optics
1.3.1 Basic Principle
The usual classical treatment of the propagation of light presumes a linear relation between
the electromagnetic light field and the responding medium. But just as an oscillatory mechani¬
cal device can be driven into nonlinear response through the application of large enoughforces, also an intense beam of light can generate appreciable nonlinear optical effects.
The electric fields associated with light beams from ordinary or traditional sources are far
too small for such a behavior to be easily observable. Only the advent of the laser made largeelectric-field amplitudes available in the optical region of the spectrum and has made possible
Introduction
13
a wide range of important new nonlinear optical phenomena (such as optical rectification, opti¬cal harmonic generation, frequency mixing, electro-optic effect, and self-focusing of light) and
devices (such as optical parametric oscillators, electro-optic modulators, and blue laser sources
based on frequency doubling).
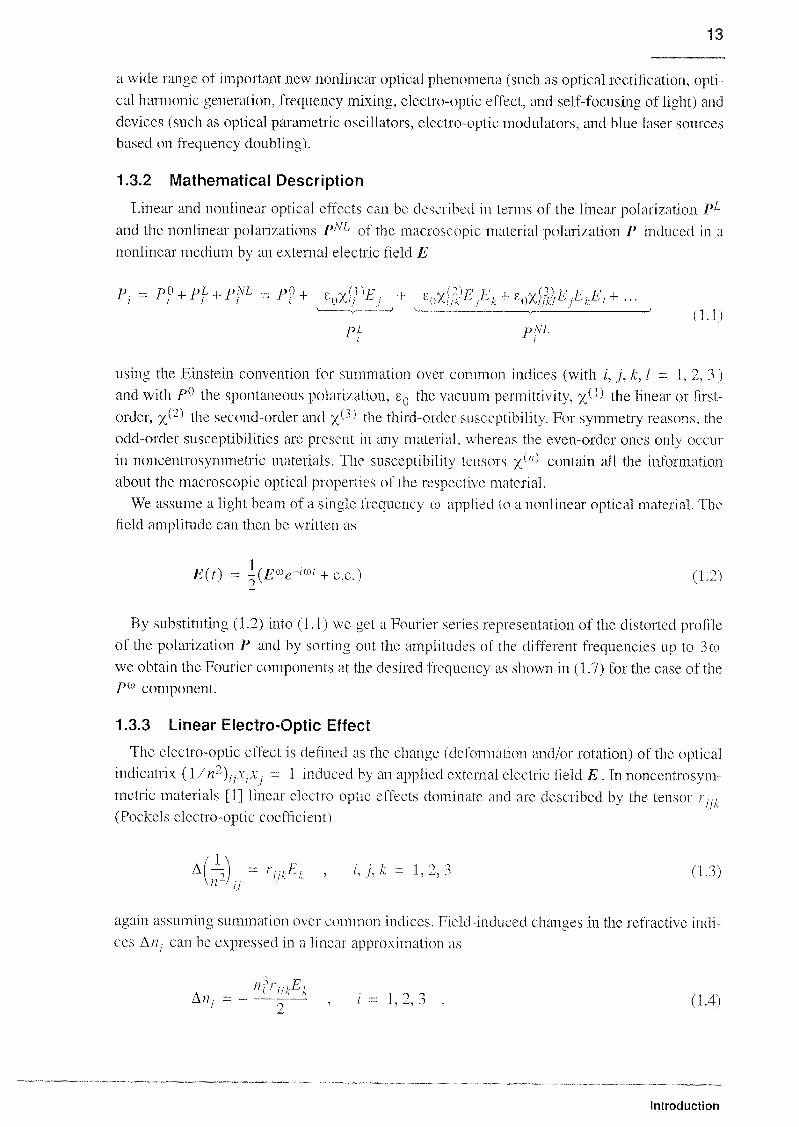
1.3.2 Mathematical Description
Linear and nonlinear optical effects can be described in terms of the linear polarization PL
and the nonlinear polarizations PNL of the macroscopic material polarization P induced in a
nonlinear medium by an external electric field E
'
'
' '' — ' —'
(I.I)pL pNL
i i
using the Einstein convention for summation over common indices (with i, j, k, I = I, 2, 3)
and with P° the spontaneous polarization, e0 the vacuum permittivity, %(J) the linear or first-
order, )<42) the second-order and %^ the third-order susceptibility. For symmetry reasons, the
odd-order susceptibilities are present in any material, whereas the even-order ones only occur
in noncentrosymmetric materials. The susceptibility tensors %(") contain all the information
about the macroscopic optical properties of the respective material.
We assume a light beam of a single frequency co applied to a nonlinear optical material. The
field amplitude can then be written as
E{t) = ^(Eae-mt + c.c.) (1.2)
By substituting (1.2) into (1.1) we get a Fourier series representation of the distorted profileof the polarization P and by sorting out the amplitudes of the different frequencies up to 3co
we obtain the Fourier components at the desired frequency as shown in (1.7) for the case of the
Pa component.
1.3.3 Linear Electro-Optic Effect
The electro-optic effect is defined as the change (deformation and/or rotation) of the opticalindicatrix ( l/«2),rvrv = 1 induced by an applied external electric field E. In noncentrosym¬
metric materials [1 ] linear electro-optic effects dominate and are described by the tensor r ,
(Pockels electro-optic coefficient)
a(1) = rl]kEk , i,j,k = 1,2,3 (1.3)\n I
,j
again assuming summation over common indices. Field-induced changes in the refractive indi¬
ces A/;,- can be expressed in a linear approximation as
An, = ^'^f-^ .i = 1,2,3 . (1.4)
Introduction

14
In the special case of poled polymers (see Section 1.4.2), the symmetry is »mm. Therefore
the first two indices of the electro-optic tensor can be combined and, taking into account the
Kleinmann symmetry, the tensor becomes
riik ~
0 0 rn
0 0 r13
0 0 r33
0 /13 u
0 0 0
(1.5)
with the optical axis being the 3-axis (c-axis) and lying parallel to the poling field. When an
external field is applied along this axis, a change of the refractive index /; is induced with
An ~
2 '-> ' (1.6)
with / = l for n{ and n0 and ;=3 for ;??.
In a more general view, the electro-optic effect is a special case of nonlinear optics. The
Pockcls effect arises from the nonlinear response of the polarization of a noncentrosymmetricmaterial when an electric field is applied. We consider the application of a static electric field
of frequency zero E° and of an optical beam of frequency en. The total field inserted into (l.l)
results in a Fourier component Pm of the polarization P of
po, = 80[(Xf--to:w) + 2x^^0))£p]£o) (1.7)
In (-co; to, 0), or denotes the frequency of the incoming optical beam, 0 the frequency of the
applied electric field, and -co the frequency of the outgoing optical beam. Equation (1.7) can
be interpreted as a change of the linear susceptibility by a term proportional to the appliedstatic field. Using the definition (1.3) one obtains for the linear electro-optic coefficient at light
frequency <o :
,ß
-2
"r"7xtf
co:io. 0)(1.8)
In the case of high frequency modulation (> 1 GHz) the electric field cannot be considered
as static and zero must be replaced by the modulation frequency Q, with Q « to .
1.3.4 Microscopic Nonlinearities in Organic Materials
Nonlinear optical properties m organic and polymer systems, unlike inorganic systems
where nonlinear phenomena arise from band structure effects and atomic bonds, originate in
the electron excitations occurring on the individual molecular units. The optical fields can eas¬
ily affect the motions of the electrons that take part in the delocalized, multicenter bonds char¬
acteristic of unsaturated organic compounds: the tc electrons. Because k electrons are not
Introduction

15
tightly bound to the individual positive nuclear sites, their paths, or orbitals, extend over long
distances (several angstroms).
Similarly to the macroscopic susceptibilities (1.1), the microscopic ones relate the induced
dipole moment p of the molecule to the applied external field E. Taking into account the local
field one gets:
P, =
VgI + W,rF, + OP,lkF,Fk + coy„UF,FLFl+- (L9)
with p„(= p) the ground state dipole moment, a the linear polarizability, ß the first-order
hyperpolarizability. y the second-order hyperpolarizability tensor, and F the local field at the
position of the molecule.
1.3.5 Dispersion of Optical Nonlinearities
For molecules with a single charge transfer axis the first-order hyperpolarizability is domi¬
nated by a single tensor clement ß Using the simple two level model [2J with one ground
state g and one excited state e, ß...... can be written as [3]
/ ^t')4„(3ü)2 + CO,C00-(0?)
>(-co-,;co,. co2) _.
< "x e" 1 I J
zzz~
-> r ~> "> \ /^ 7\/ ~> °\
3(f,Vif-
cor)(0)^-
i02^i0cg-
(0t)ßo (i-io)
for the case of sum-frequency generation. co„ff is the resonance frequency of the transition and
ß0 the static first-order hyperpolarizability reached when all three frequencies approach zero.
ß0 is given by
6^2 A u, p;
ß0 = ^~^. (1-11)
Ap = \xe- \i is the difference between excited state and ground state dipole moments, up?
the transition dipole moment between ground and excited state, and h is the Planck constant.
In the picture of classical physics the two-level model corresponds to a single oscillator with
resonance frequency loc„ .
From (1.10) we obtain for the first-order hyperpolarizability, responsible for the linear elec¬
tro-optic effect,
œ;L(3to2 -to2)ß(rco:oo,0) = ^^^p
, (U2)3(to-e -co-V
and in the case of second-harmonic generation we get
(to2, -(o:):((d^ -4to2)'ß^m,w)-;-r-^7lr-HT-^ßo
• (L13)
Equations (1.12) and (1.13) allow us to relate second-harmonic experiments to the linear
electro-optic effect. This relation is useful when estimating the expected linear electro-optic
effect from the result of a standard second-harmonic experiment in solution.
Introduction

16
1.3.6 Relation Between Microscopic and Macroscopic Nonlinearities
The task of linking the macroscopic coefficients to the microscopic ones is not a trivial prob¬
lem because of interactions between neighboring molecules. However, most often the macro¬
scopic second-order nonlinearities of organic materials can be well explained by the
nonlinearities of the constituent molecules using the oriented gas-model [4]. In this model,
except for local field corrections, all contributions to the optical nonlinearity clue to intermolec¬
ular interactions are neglected and only intramolecular contributions are taken into account.
For example, the electro-optic coefficient of an organic crystal can be expressed as:
M 9 "(#> 3
'""»» = - ^nïï^-)fî' fSf° 2 £ cose;, cose*,«,^, [,<,-•«> (1.I4)' '"
i i/k
where N is the number density of molecules. n(g) is the number of molecules in the unit cell,
n is the refractive index, /" are the local field factors (see eq. (1.15)], and 6/( is the angle
between the dielectric axis / and the molecular axis i of molecule s in the unit cell.
fw ='Jill (Lorenz) , f° =
îÏ!L±2à (0nsager) (1 l5)-5 /7~ + 2e
with c the static dielectric constant and n the optical index of refraction. The Onsager local
field factor takes into account the contribution of the reaction field from the induced dipole
moment of the molecule to the applied field. The Onsager factor is more appropriate for static
fields where orientation has also to be considered and in cases where molecules have a larger
dipole moment than the ambient medium [41. Note that at optical frequencies where r = n2
the Onsager local field factor is equal to the Lorenz factor.
The nonlinearity of a dye-doped polymer can be similarly modeled. In a doped polymer the
molecular orientations are isotropically distributed. The distribution of molecules is usually
represented by an orientational distribution function. Assuming a Maxwell-Boltzmann distri¬
bution of an assembly of one-dimensional (there is one dominant tensor clement ß......
(=ßtP);ü)' °)) of the first-order hyperpolarizability tensor), freely rotating molecules under the
influence of a static electric field abcwe the polymer's glass transition temperature (T ), the
two independent tensor components of the linear electro-optic coefficient (7-333 = ^r^\ 1^ â^ex
cooling the polymer below 77 arc given by
>m =iV^(/?)V?ß-<cos3e)(1.16)
with 0 the angle between the poling field and the chromophore principal axis, k the Boltz-
mann constant, T the poling temperature in Kehin, E the applied electric field, and p the
dipole moment and F the local field (field felt by the chromophores) which is related to the
external electric field E using the relation
Introduction

17
F o_
e(n2 + 2)f L» "
/72 + 2E ^(1.17)
The second part of equation (1.16) is valid only when intermolecular interactions are
neglected and when pF « LT. Expressions for the electro-optic coefficient as a function of
microscopic parameters for general cases including intermolecular interactions are given in
Section 3.3.
1.4 Organic Nonlinear Optical Materials
Organic materials (materials consisting of molecules containing a carbon backbone) are of
great interest for nonlinear optics. They offer a large number of design possibilities and largenonlinear optical effects can be reached.
The basic design of nonlinear optical molecules is based on JT-bond systems. n -bonds are
regions of delocalized electronic charge distribution resulting from the overlap of k orbitals.
This delocalization leads to a high mobility of the electron density. The electron distribution
can be distorted by substituents at the ends of the n bond system. The extent of the redistribu¬
tion is measured by the dipole moment, and the ease of redistribution in response to an exter¬
nally applied field by the hyperpolarizability. The optical nonlinearity of organic molecules can
be increased by either increasing the conjugation length or by using appropriate electron donor
and electron acceptor groups. The addition of the appropriate functionality at the ends of the rc
system can enhance the asymmetric electronic distribution in either or both the ground state
and excited state configurations.
D k bridge A
jc bridge
Fig I 1 Tvpical organic molecules foi second-oidci nonhneai optica! effects The electron clonoi
gioup (D) is connected to the election acceptoi group (A) thiough a n electron svstem The
most common swtcms cue those containing one benzene ung {benzene analogues) and those
containing two benzene i ings tstilbene analogues) Rj and R-, cue usually cciibon oi nitiogen.
1.4.1 Nonlinear Optical Molecules for Electro-Optics
During the last two decades, a large number of nonlinear optical molecules have been syn¬
thesized and investigated allowing scientists to gain insight into the chemistry and physics of
optical hyperpolarizabilities. Improvement of the size of the hypcrpolarizabilities, by usingnew electron donor and acceptor groups, led to new nonlinear optical materials. Molecules
assemble among others in crystals. Langmuir-Bloclgett films, and polymers. Measurements of
microscopic and macroscopic nonlinearities of these systems reveal new relationships betweenstructure and nonlinear optical properties.
Introduction
18
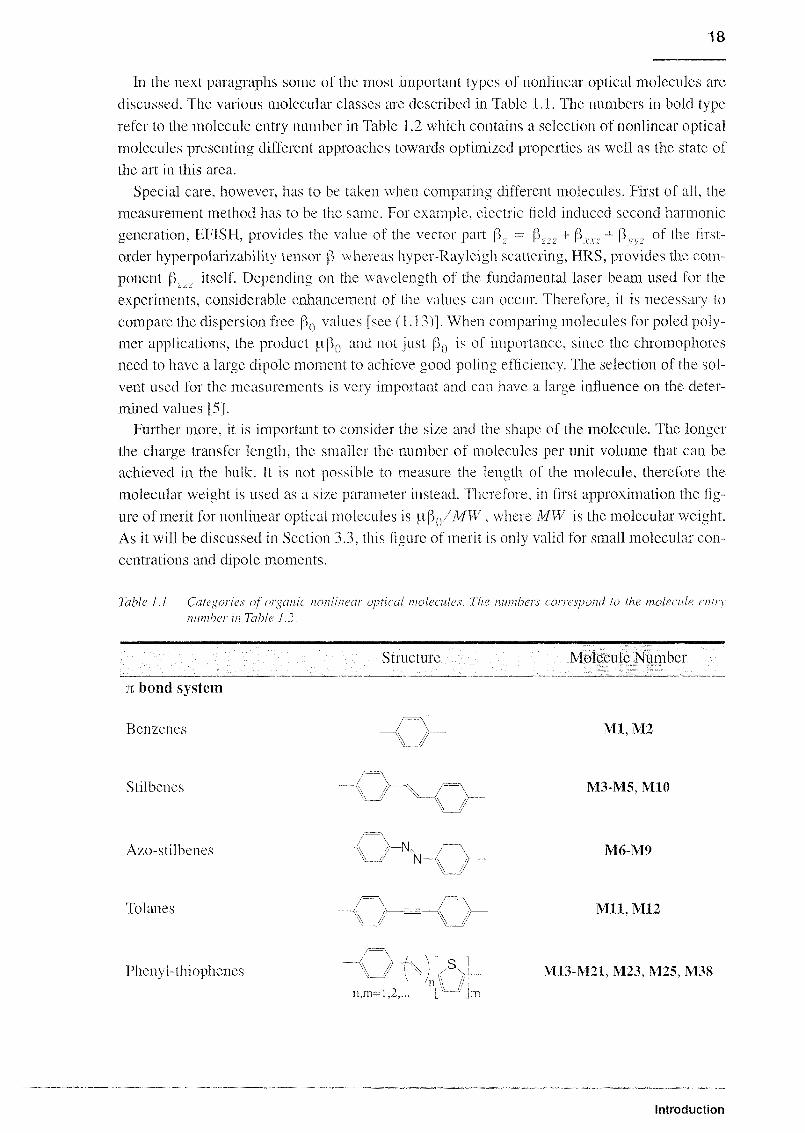
In the next paragraphs some of the most important types of nonlinear optical molecules are
discussed. The various molecular classes arc described in Table LI. The numbers in bold type
refer to the molecule entry number in Table 1.2 which contains a selection of nonlinear optical
molecules presenting different approaches towards optimized properties as well as the state of
the art in this area.
Special care, however, has to be taken when comparing different molecules. First of all, the
measurement method has to be the same. For example, electric field induced second harmonic
generation, EFISH. provides the value of the vector part ß„ = ß„zz + ßVY, + ßvv_ of the first-
order hyperpolarizability tensor ß whereas hyper-Ray lei gh scattering, HRS, provides the com¬
ponent ß. .
itself. Depending on the wavelength of the fundamental laser beam used for the
experiments, considerable enhancement of the values can occur. Therefore, it is necessary to
compare the dispersion free ß0 values [sec (1.13)1. When comparing molecules for poled poly¬
mer applications, the product pß0 and not just ß0 is of importance, since the chromophores
need to have a large dipole moment to achieve good poling efficiency. The selection of the sol¬
vent used for the measurements is very important and can have a large influence on the deter¬
mined values [5].
Further more, it is important to consider the size and the shape of the molecule. The longer
the charge transfer length, the smaller the number of molecules per unit volume that can be
achieved in the bulk. It is not possible to measure the length of the molecule, therefore the
molecular weight is used as a size parameter instead. Therefore, in first approximation the fig¬
ure of merit for nonlinear optical molecules is pß0/,M!T, where MW is the molecular weight.
As it will be discussed in Section 3.3, this figure of merit is only valid for small molecular con¬
centrations and dipole moments.
Table I I Categories of organic nonhneai optical molecules The numbeis conespond to the molecule entn
nunibei in Table I 2
Structure Molecule Number
n bond system
M1,M2
M3-M5, MIO
M6-M9
Mlt,M12
M13-M21, M23, M25, M38
Introduction
Benzenes
Stilbeneses
Azo-stilbenes
Tolanes
Phenyl-thiophenes
-RN—
J
n.m-1,2,... I —'Jni

19
Structure Molecule Number
Thiophenes
Fused thiophenes
n=0 t 2
<fi
M22
M24, M26. M27
Polyenes n-l 2 M28-M33
Caiotenoids M34, M35
Donors
Ammo
Dialkvlammo
H2N—
H2n+lCn\
H2m+lCmN— n m=l 2,
Ml, M2
M3.M5,M9-M13,M15,
M16, M18, M19, M21, M23,
M25-M28, M37, M38
Diphenylammo
H
XN-M4, M7. M8, M14, M17.
M20, M22
JeK-butyldimethylsilyl'
\__
-Çr-0
M31.M32
Ketone chthioacetal v^
luiolidinyl 'p-'y'yAcceptors
Nitio
Dicyanoethenyl
M24
M29, M30, M34, M35
^N0Ml-AI4.M6.M7, MIL M12
^ CN
CN
M5, M26, M31-M33,
M36-M38
Introduction
20
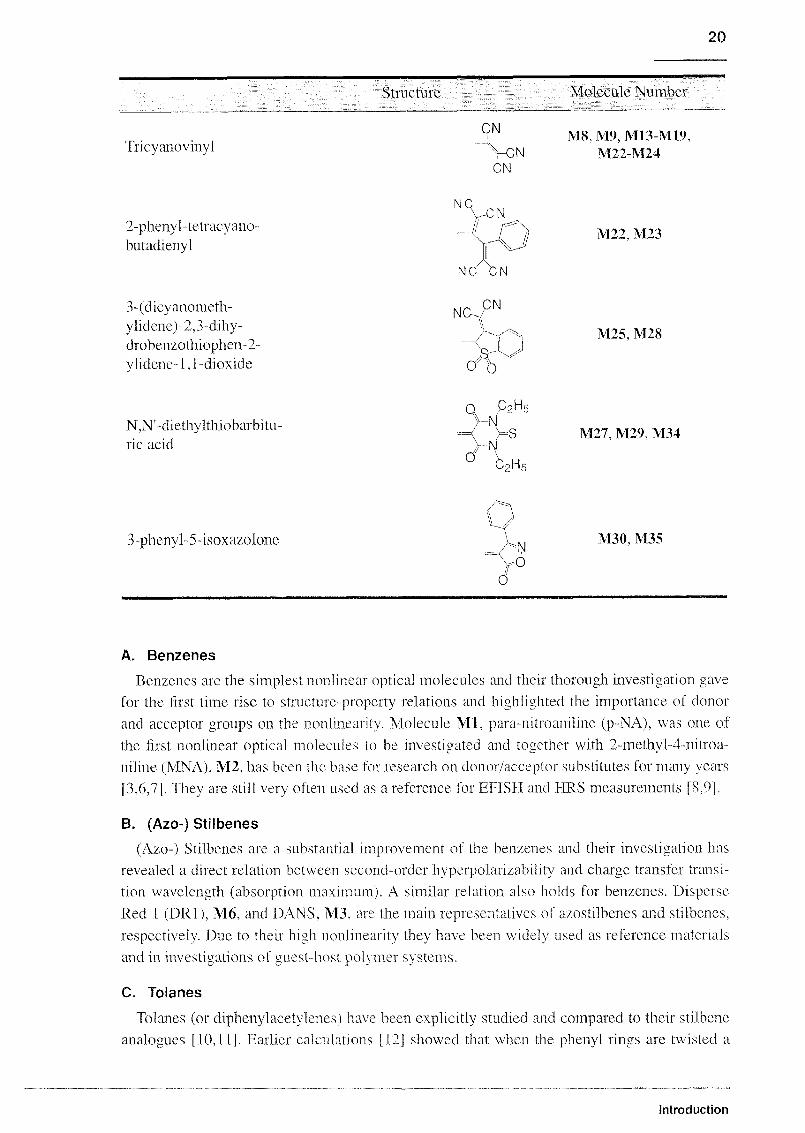
Structure Molecule Number
Tricyanovinyl
2-phenyl -letracyano-butadienyl
3-(dicyanometh-
ylidene)-2,3-dihy-
drobenzothiophen-2-
ylidene-1,1-dioxide
NoN'-diethylthiobarbituric acid
3-phcnyl-5-isoxazolone
A. Benzenes
Benzenes are the simplest nonlinear optical molecules and their thorough investigation gave
for the first time rise to structure-property relations and highlighted the importance of donor
and acceptor groups on the nonlinearity. Molecule ML para-nitroaniline (p-NA), was one of
the first nonlinear optical molecules to be investigated and together with 2-methyl-4-nitroa-
niline (MNA), M2, has been the base for research on donor/acceptor substitutes for many years
[3,6,7]. They are still very often used as a reference for EF1SH and HRS measurements [8,9].
B. (Azo-) Stilbenes
(Azo-) Stilbenes are a substantial improvement of the benzenes and their investigation has
revealed a direct relation between second-order hyperpolarizability and charge transfer transi¬
tion wavelength (absorption maximum). A similar relation also holds for benzenes. Disperse
Red I (DR1), M6. and DANS, M3. are the main representatives of azostilbcnes and stilbenes,
respectively. Due to their high nonlinearity they have been widely used as reference materials
and in investigations of guest-host pohmer systems.
C. Tolanes
Tolanes (or diphenylacctylenes) have been explicitly studied and compared to their stilbene
analogues [10.11]. Earlier calculations [121 showed that when the phenyl rings are twisted a
ycNCN
M8, M9, M13-M19,
M22-M24
CN
NC CN
M22, M23
NcJ*M25. M28
O
Cone
-Ni"
>-S
-AC2H5
M27, M29, M34
U/
vO
O
M30. M35
Introduction
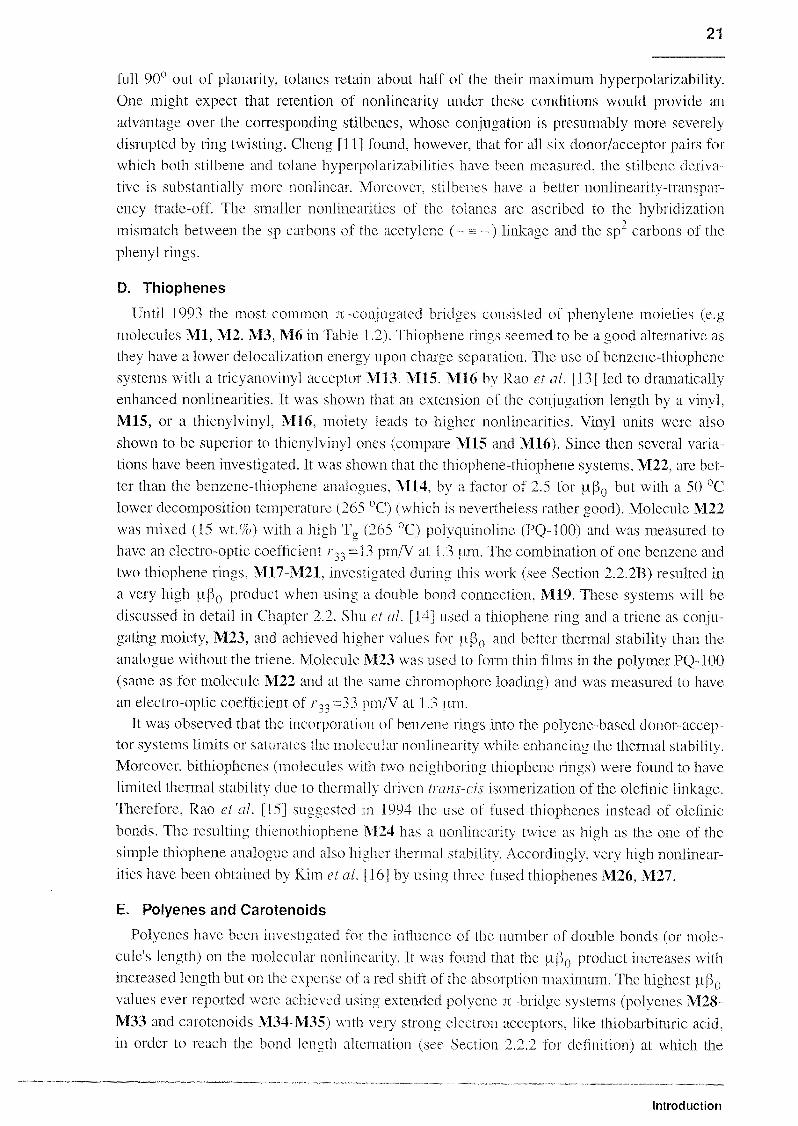
21
full 90° out of planarity, tolanes retain about half of the their maximum hyperpolarizability.One might expect that retention of nonlinearity under these conditions would provide an
advantage over the corresponding stilbenes, whose conjugation is presumably more severely
disrupted by ring twisting. Cheng [11] found, however, that for all six donor/acceptor pairs for
which both stilbene and tolane hyperpolarizabilities have been measured, the stilbene deriva¬
tive is substantially more nonlinear. Moreover, stilbenes have a better nonlinearity-transpar-
cncy trade-off. The smaller nonlinearities of the tolanes are ascribed to the hybridization
mismatch between the sp carbons of the acetylene (- = -) linkage and the sp" carbons of the
phenyl rings.
D. Thiophenes
Until 1993 the most common ;r-conjugated bridges consisted of phenylene moieties (e.g
molecules Ml, M2. M3, M6 in Table 1.2). Thiophene rings seemed to be a good alternative as
they have a lower delocalization energy upon charge separation. Hie use of benzene-thiophene
systems with a tricyanovinyl acceptor M13, M15, M16 by Rao et al. [13] led to dramatically
enhanced nonlinearities. It was shown that an extension of the conjugation length by a vinyl,
M15, or a thienylvinyl, M16, moiety leads to higher nonlinearities. Vinyl units were also
shown to be superior to thienylvinyl ones (compare M15 and M16). Since then several varia¬
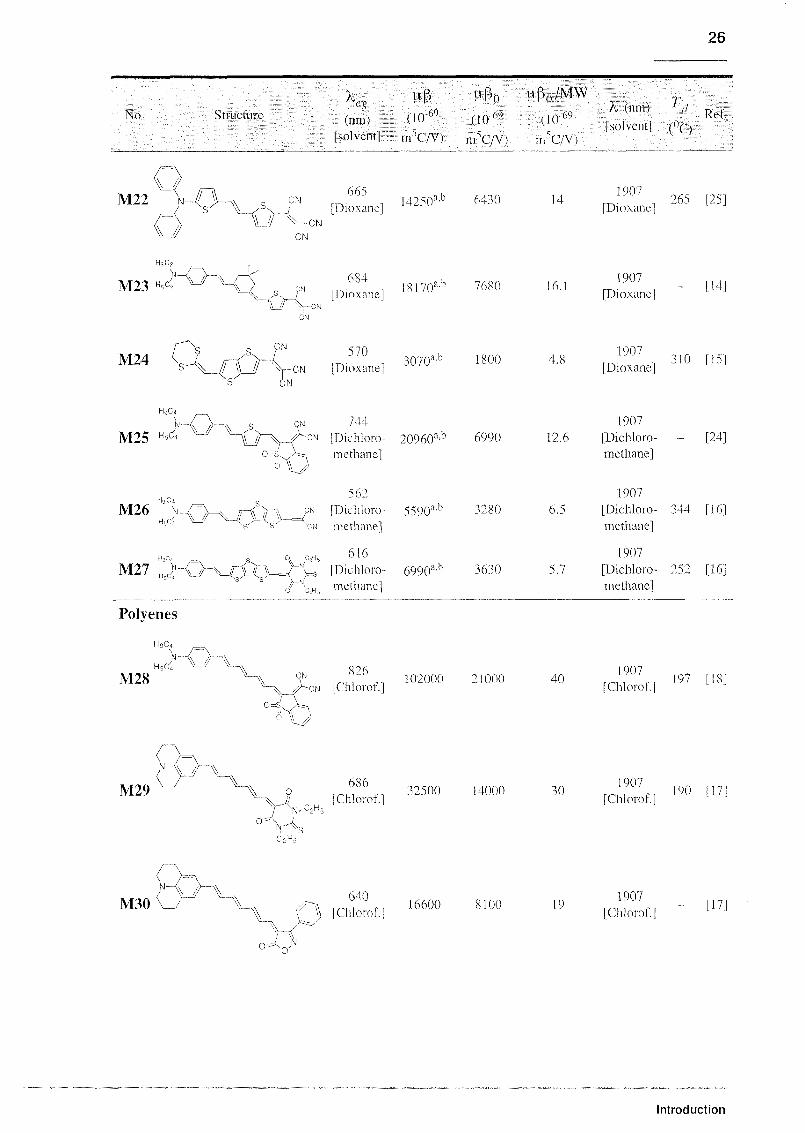
tions have been investigated. It was shown that the thiopheue-thiophene systems, M22, are bet¬
ter than the benzene-thiophene analogues, M14, by a factor of 2.5 for pß0 but with a 50 °C
lower decomposition temperature (265 °C) (which is nevertheless rather good). Molecule M22
was mixed (15 wt.%) with a high Ts (265 °C) polyquinoline (PQ-100) and was measured to
have an electro-optic coefficient r33 =13 pm/V at 1.3 urn. The combination of one benzene and
two thiophene rings, M17-M21, investigated during this work (see Section 2.2.2B) resulted in
a very high pß0 product when using a double bond connection, M19. These systems will be
discussed in detail in Chapter 2.2. Shu et al. [I4J used a thiophene ring and a triene as conju¬
gating moiety, M23, and achieved higher values for pß0 and better thermal stability than the
analogue without the triene. Molecule M23 was used to form thin films in the polymer PQ-100
(same as for molecule M22 and at the same chromophore loading) and was measured to have
an electro-optic coefficient of r33 =33 pm/V at 1.3 p.m.
It was observed that the incorporation of benzene rings into the polyene-based donor-accep¬tor systems limits or saturates the molecular nonlinearity while enhancing the thermal stability.
Moreover, bithiophenes (molecules with two neighboring thiophene rings) were found to have
limited thermal stability due to thermally driven trans-eis isomerization of the olefinic linkage.
Therefore, Rao et al. 115] suggested in 1994 the use of fused thiophenes instead of olefinic
bonds. The resulting thienothiophene A124 has a nonlinearity twice as high as the one of the
simple thiophene analogue and also higher thermal stability. Accordingly, very high nonlinear¬
ities have been obtained by Kim et al. [16] by using three fused thiophenes M26, M27.
E. Polyenes and Carotenoids
Polyenes have been investigated for the influence of the number of double bonds (or mole¬
cule's length) on the molecular nonlinearity. It was found that the uß0 product increases with
increased length but on the expense of a red shift of the absorption maximum. The highest pß0values ever reported were achieved using extended polyene n -bridge systems (polyenes M28-
M33 and carotenoids M34-M35) with very strong electron acceptors, like thiobarbituric acid,in order to reach the bond length alternation (see Section 2.2.2 for definition) at which the
Introduction
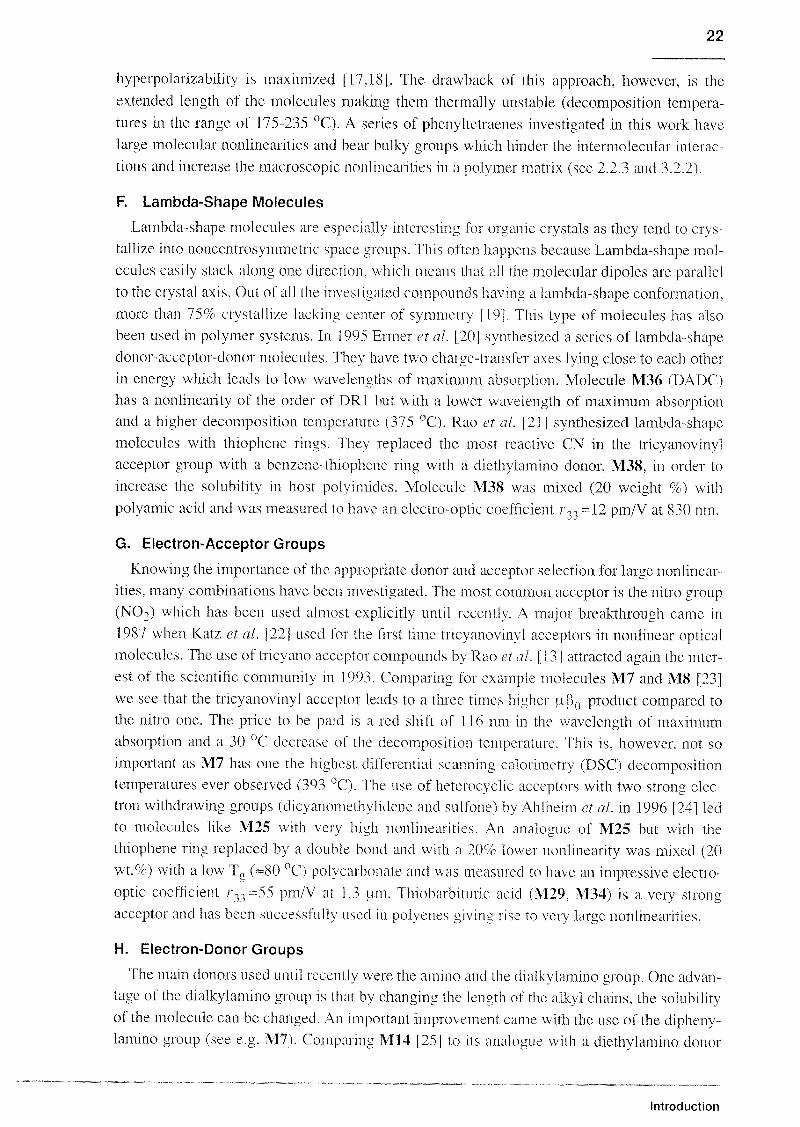
22
hyperpolarizability is maximized [17,18]. The drawback of this approach, however, is the
extended length of the molecules making them thermally unstable (decomposition tempera¬
tures in the range of 175-235 °C). A series of phenyltetraenes investigated in this work have
large molecular nonlinearities and bear bulky groups which hinder the intermolecular interac¬
tions and increase the macroscopic nonlinearities in a polymer matrix (see 2.2.3 and 3.2.2).
F. Lambda-Shape Molecules
Lambda-shape molecules are especially interesting for organic crystals as they tend to crys¬
tallize into noncentrosymmetric space groups. This often happens because Lambda-shape mol¬
ecules easily stack along one direction, which means that all the molecular dipoles are parallelto the crystal axis. Out of all the investigated compounds having a lambda-shape conformation,
more than 75% crystallize lacking center of symmetry [19|. This type of molecules has also
been used in polymer systems. In 1995 Ermer et al. [20] synthesized a series of lambda-shape
donor-acceptor-donor molecules. They have two charge-transfer axes lying close to each other
in energy which leads to low wavelengths of maximum absorption. Molecule M36 (DADC)
has a nonlinearity of the order of DR I but with a lower wavelength of maximum absorptionand a higher decomposition temperature (375 °C). Rao et al. [21] synthesized lambda-shapemolecules with thiophene rings. They replaced the most reactive CN in the tricyanovmyl
acceptor group with a benzene-thiophene ring with a diethylamino donor, M38, in order to
increase the solubility in host polyimides. Molecule M38 was mixed (20 weight %) with
polyamic acid and was measured to have an electro-optic coefficient r33 =12 pm/V at 830 nm.
G. Electron-Acceptor Groups
Knowing the importance of the appropriate donor and acceptor selection for large nonlinear¬
ities, many combinations have been investigated. The most common acceptor is the nitro group
(N02) which has been used almost explicitly until recently. A major breakthrough came in
1987 when Katz et al. [22] used for the first time tricyanovinyl acceptors in nonlinear opticalmolecules. The use of tricyano acceptor compounds by Rao et al. [13] attracted again the inter¬
est of the scientific community in 1993. Comparing for example molecules M7 and M8 [23]
we see that the tricyanovinyl acceptor leads to a three times higher uß0 product compared to
the nitro one. The price to be paid is a red shift of 116 nm m the wavelength of maximum
absorption and a 30 °C decrease of the decomposition temperature. This is, however, not so
important as M7 has one the highest differential scanning calorimetry (DSC) decomposition
temperatures ever observed (393 °C). The use of heterocyclic acceptors with two strong elec¬
tron withdrawing groups (dicyanomethylidene and sulfone) by Ahlheim et al. in 1996 |24] led
to molecules like M25 with very high nonlinearities. An analogue of M25 but with the
thiophene ring replaced by a double bond and with a 20% lower nonlinearity was mixed (20
wt.%) with a low T„ («80 °C) polycarbonate and was measured to have an impressive electro-
optic coefficient /'33=55 pm/V at 1.3 um. Thiobarbituric acid (M29. M34) is a very strong
acceptor and has been successful h used in polyenes giving rise to very large nonlinearities.
H. Electron-Donor Groups
The main donors used until recently were the amino and the dialkylamino group. One advan¬
tage of the dialkylamino group is that by changing the length of the alkyl chains, the solubilityof the molecule can be changed. An important improvement came with the use of the dipheny-lamino group (see e.g. M7). Comparing M14 [25] to its analogue with a diethylamino donor
Introduction

23
M13 [13] we notice an almost 50% decrease of the nonhnearity followed however by a 75 °C
increase of the decomposition temperature. Julolidinyl is a strong donor that has been used in
molecules with large nonlinearities (M29-M30).
In this work, we follow three different approaches for obtaining molecules with enhanced
nonlinear optical performance. In our first approach, the zwitteiionic molecules (M10), we aim
at increasing the molecule's ground state dipole moment by adding ions to the electron accep¬
tor end of the molecule and thus increasing the product pß0. Our second approach is the use of
two neighboring thiophene rings (bithiophene) m a phenyl-thiophene molecule (M17-M21) to
further decrease the delocalization energy of the conjugated bridge. The third approach does
not aim at increasing the nonlinearity by using stronger electron donors/acceptors or by using a
better conjugated bridge but by appropriately modifymg the molecule's shape (M31-M33) to
hinder intermolecular interactions.
In general, no ideal molecule yet exists although a large number of nonlinear optical mole¬
cules have been synthesized, a considerable insight into the physics and chemistry of molecu¬
lar hyperpolarizabilities has been gained, and basic structure-property relations have been
established. The reason is that, depending on the application, different requirements -and often
more than one-have to be fulfilled. For frequency doubling, a transparency at the wavelength
of the second-harmonic light is needed. For organic crystals, a noncentrosymmetric packing
and a favorable orientation for either frequency doubling or electro-optics is a strict condition.
For electro-optic polymers, the demand of molecules with large nonlinearity, limited size and
high thermal and photochemical stability is a real challenge for synthetic chemists. On the
other hand, the unlimited possibilities of structures to be synthesized form a fertile ground for
challenges like this to be met. Most of the efforts up to now were concentrated on the "largest"
nonlinearities "at all costs". The focal point for the future work, however, should be the word
"compromise". Effort should be focused on developing molecules for a specific application,
meeting all the necessary requirements and making an optimized compromise between them.
Table I 2 Selected chiomophoies fen secoiuboidei nonhneai optics X is the wavelength of the absoiptionpeak of the charge transfer band fs is the pist oulei hvpeipolanzahilih at the wavelength measured
(method clectiu-field-induced \econd haimonu generation, EFtSll), ß0 is the fusl-oidei
hvperpolanzahilih extrapolated to infinite wcnelength. u is the ground state dipole moment. MW is
the moleculcn weight of the molecule and T(/ is the tempo atui c of onset of decomposition All values
aie given m SI units Foi the detci mutation of ß the definition of (1 9) is used and foi the cultivation
dt |=0 1 pmfv at 1064 nm, du =0 28 pm/V at J356 nm and I5<<?0 nm, and du =0 277 pm/V at 1907
nm of quaitz is adopted [26J, unless indicated other wite To achiexe a common calibration, in fust
approximation i allies of ß u etc multiplied bv the appiopi late pic tot (e g bv 0 V0 5=0 6 if data using
a reference \alue of dn =0 s pm/V at 1064 nm were repotted)
X,
No Structure
pßeg
' i
(nm) (lO"61'(10'
[solvent] rrPC/V) m5C/V)
pß{) pß0/MWJ0
v69 (KT69
rrPCAO
X (nm) 7'd
[solvent] (OqRef.
Benzenes
Ml
p-NA
H2N-A^J>--N02i76
Acetone]no 105 0 8
1907
[Acetone][7]
Introduction

24
X, pß pß0 nß0/MWNo Stiuctuie
(nm) (1069 (1069 (10
MNA
69
[solvent] nTC/V) m^C/V) m^C/V)
X (nm) Fd
[solvent] (°qRel
N02
361
[Dioxine]92
(Azo-) Stilbenes
DANS
~NO<>
427
[Chloiot
75
840 640
05
24
1907
[Dio\ me][7]
1907
[Chloiof ;2S9 [7]
W //
M4 ^
436
\\ /r\j:w //
NO,
2501 06 358 [27J
M5 H3CN^ r~%V_/ V CN
192
[DMSO]2080 860
1 ^^A
29[DMSO]
~ r61
DRt
HbO,>
M6 ),HOHiC, VJf N <x /V-NO,
^09
[DMSO]85()D 320 1 [dmIo] 30S r61
45 s
[Dioxane]
t7 5
[Dioxane]
600 440
1700 1207
1 1
58
1907
[Dioxane)
1907
fDioxane]
[7]
[28]
M7^ //
486
N <\ /KNN—<\ />-NO
«01907
[Chloiot]' '
w //M8 N
^ //
602
N W \CN
CN
2600 5 8190/
[Chloiof[23]
H,C2
M9 WH /hNN,
,,
CN
-ON
5S2
[DMSO!
CN
3210 1270 361580
[DMSO][6]
H^4
M10H^ \J-H9C4 \_/~~Y
•>24
[Dioxane]^070 1950 4 6
1907
[Dioxane]207 [29]c
Introduction

25
No
Tolanes
Stiuctuie(nm) (1069 (1()69 (1069
[solvent] m5C/V) nAc/V) rn^C/V)
À, (nm)
[solvent] (°C)Ref
Mil ^-Q.
M12 HCV ^
402
\\ // N0^[Dioxane]
»970' 730
y ^ // W
Hi
IChloiof'
^84
V^g0 [Chloiof
(Fused and Phenyl-) Thiophenes
HnC
Ml 3N-
HcC,xv /r\ ^s.
;n 6 tO
\\ //^ycN fD,oxanci
CN
27
720 240 0 9
1670 710 19
8700lb 4220 if
106 1-
[Dioxane]
1907
IChloiof]
1064
[Chloiof ]
1907
[Dioxane]
H0J
- [7]
287 [30]
240 [13]
XN //601
M14 V/ V^\s
PN,r^.„,„„„i
t540lb"\_/sv / I Dioxane]
\J ApCNCN
19072470 5 4
r
'
,315 [25]
[Dioxane]
H5C?
Vi
M15 h,c2\\ f~\
.CN
662
A.axV-i [Dioxane]
\ // \ CN'
CN
12700lb 5800 14 51907
[Dioxane][13]
m 16 h=ctv^^ v
653
(H [Dioxane]10340lb 4850 1
c
l9070 4
m,
13
[Dioxane)
M17 Vt / V-a\s /n\ ÇN m )
'A^V // %-X Dioxane
CNÖ
5510 2910J 907
[Dioxane) L J
M18»*.w v-fjr <SAACN [Dioxane]
f 1740 66501907
13 4'
.,250 nip
[Dioxane]L '
// V
M19 n/; v/v ^
655
[Dioxane]19960 9300
190719 9
m 1238 [31f
[Dioxane] ' J
M20
l.,
575
[Dioxane]5760 3330
1907r-r, ,
W [3 IfDioxane
L '
M21y v^ >x 623
7 A [Dioxane]9550 5000
9078
,r> T25° [317
Dioxanel '
Introduction
26
No Stiuctuie
Id
Xeo M-ß M-ßo fiPo/MW.
(.
fnm)(io69
no69 no69{nm)
{ {[l) {lu[solventl (0C)
[solvent] mA/V) mV/V) n7C/V)
Ret
u
M22\.-// ^N-4 >—* s
CNm l
14250
\\ // ^-CNCN
665
[Dioxane]
ih1907
64*0 14 rTA .
265 [25][Dioxane]
h5co
M23 HA x-r'%- 684CN
V /n / [Dioxane]lT~a. cm
CN
1907
M24o
CN
'S' CN
570
s-\__£~fjT\-CN [Dioxane]3070
ib1907
1800 4 8._
y,310 [15]
LDioxane]
Hic4
M25 H
741
O^V-f^CN [Dichloio- 20960'lb 6990 12 6
methane]
1907
[Dichloio- [24]
methane]
H3C4
M26 *
H9C
562
L(VA|th ^CN [l)lchl01°- 5590''
^ s ~~^n methane!
1907
ât> 3280 6 5 [Dichloio- VH [16]
methane]
616
M27 ^ (}Kxil7v ^w [Dichloio- 6990'b
j H methane]
Polyenes
1907
3630 5 7 [Dichloio- 252 [16]
methane]
HjC,
~VA^
M28 CN826
A-CN IChloiof102000 21000
o-svo
190740 rr;
,.197 [18]
[Chloiof J
M29
,N~\ tA
N K^s
686
IChloiof!32500 14000
o -\ '
190730
*
,.190 [17]
[Chloiot ]
M30%J Y
V640
1 [Chloiot16600 8100
1907
[ChloioC17]
o ^..
Introduction

27
No StiuctiiieTd
7 trß ^ß0 fißo/MWro sr,
A. (nm)o) ^!°69 d°69 ooCT [JJ, (0c)
[solvent) „AG/V) mV/V) mV/V)V J
Rcf
M31 7-j,j-~va~\
o.649
IHF]181 tO 8620 101
1907
[THF]259 [57
M32r\ M A
\7
648
; rur]13500 6 H0 8 4
1907
[Tin ]275 [5f
M33Hd
A_AA../
"77650
IHF114300 6780 109
1907
[THF]254 [<5f
Carotenoids
M34 1 0\A [Chloiof]6UUUU A500 45
1907
[Chloiof77]
M35 ---^^-^^-x^^-x.\
"
647AY
rm i mW00°
7A [Chiotof ]
23000 43 81907
[Chlotof[17]
Lambda-shaped molecules
M36 I459
[NVfP]lH0lb 820 I \
1907
[Chloiof [375 [20]
H9C4
M37IhCi
X o If
CH,
- \ // ^" 500
[NMPJ2170lb 1460 2 4
1907
[Chloiof371 [20]
C Hb
HrC)
M38
C H,
\
"T H5
[Dioxane]
NO TN
J 820ib
1907700 2 2
'
n354 )21]
[Dioxane]
a Cahbiation leleience not lepoited
b Comention foi detimtion of ß 110t icpoitedc 1 his woik
Introduction

28
1.4.2 Nonlinear Optical Polymers for Electro-Optics
Polymers are an important class of nonlinear optical materials as they combine the nonlinear
optical properties of conjugated tc-electron systems with the feasibility of creating new materi¬
als with appropriate optical and structural properties. The incorporation of nonlinear optical
molecules in polymers is comparatively easy and can be done in different ways. The simplest
one is the mixing of the active molecules in a polymer matrix forming a guest-host system.
Alternatives are the covalent linking of the molecules lo a polymer backbone in the form of a
side-chain, their incorporation in the main chain, or their cross-linking between two polymer
chains. Table 1.3 gives a comparison of the advantages and disadvantages of these four types
of nonlinear optical polymers and in Table 1.4 the monomer units of the commonly used poly¬
mer types are depicted.
guest-host side-chain cross-linked main-chain
t— 1 polymer chain(__
Pddzl functional chromophore
linking functionality
Fig. I 2 Tvpes of nonlinear optical polvmers
Table 1 3 Advantages and di sadvantages of the different tvpes of poh mer s for nonlinear optics
Polymer type Advantages Disadvantages
Guest-host - unlimited selection of desired - decay of nonlinear optical activitynonlinear optical guests and due to orientational relaxation
polymer hosts - nonlinear optical activity limited
- ease of thin-film processing by solubility of nonlinear optical- inexpensive mass production molecules in polymer matrix
- high orientation order - scattering losses due to inhomoge-nities
- sublimation of nonlinear opticalmolecules at elevated tempera¬
tures
Introduction

Polymer type Advantages Disadvantages
Side-chain
Main-chain
Cross-linked
high concentration of nonlinear
optical molecules
tailoring of nonlinear optical
properties via chemical modifi¬
cations
increased orientâtional stabilitylow scattering losses
• higher photochemical stabilitythan in guest-host polymers
- high concentration of nonlinear
optical molecules
tailoring of nonlinear optical
properties via chemical modifi¬
cations
- increased orientational stability- low scattering losses
- tailoring of nonlinear optical
properties via chemical modifi¬
cation
• high orientational and photo¬chemical stability
molecules difficult to orient to
externally applied field
not applicable to every molecule
increased scattering losses
not applicable to every molecule
limited fabrication sequence
Tabic 1 4 Basic monomer units of polymers mostly used for nonlinear optical
applic citions
Name Structure
Polycarbonate
CH,
-c
CH
O
-o—c—o-
Polymethylmethacrylate
ch3
-CHj-C—--
o=c
OCH,
Polyimide
Introduction

30
Name Structure
Polyquin oline
Polyamide
Polyurethane
Polyester
Epoxy
Sol-eel
To show second order nonlinear optical effects a material has to be noncentrosymmetric. In a
polymer the molecules are randomly oriented leading to a centrosymmetric structure. The
symmetry can be broken by aligning the molecules m the direction of an applied strong electric
field. If the polymeric system is brought to a glassy state by raising the temperature while the
electric field is still applied, the opposing internal molecular forces decrease and a desired
dipolar alignment is induced. The temperature at which the polymer goes from the solid state
to the glassy state is called glass transition temperature, T„.
Note that in order to be poled the
nonlinear optical chromophores in the polymer have to have a permanent dipole moment. To
be successfully used in nonlinear optical applications, poled polymers need to meet the
requirements presented in Table 1.5.
The comparison of polymer systems should always be done according to the applicationconsidered. For second-harmonic generation applications the nonlinear optical coefficient
(c/33 ) has to be maximized at the fundamental wavelength. At the same time, the wavelength of
maximum absorption {Xc„) has to be kept far away from the wavelength of the second-har¬
monic light. For electro-optic applications the electro-optic coefficient (r^) has to be maxi¬
mized at the telecommunication wavelengths of 1.3 and 1.55 urn, between the absorption
peaks of the CH overtones of the pohmers. For both applications the glass transition tempera¬
ture (T ) has to be high to prevent orientational relaxation. Note, however, that higher glasstransition temperatures require poling at higher temperatures and, consequently, molecules
with better thermal stability. The chromophore concentration in the polymer, the method used
for poling the material, and the strength of the applied electric field should also be considered
when comparing different systems.
-C NH—
-R—0—C NH-
0
-0—c-
OH OH
-R NH-CH2-CH—R'—CH—CH2-NH-
SiO-N TiOo, other oxides
Introduction
31
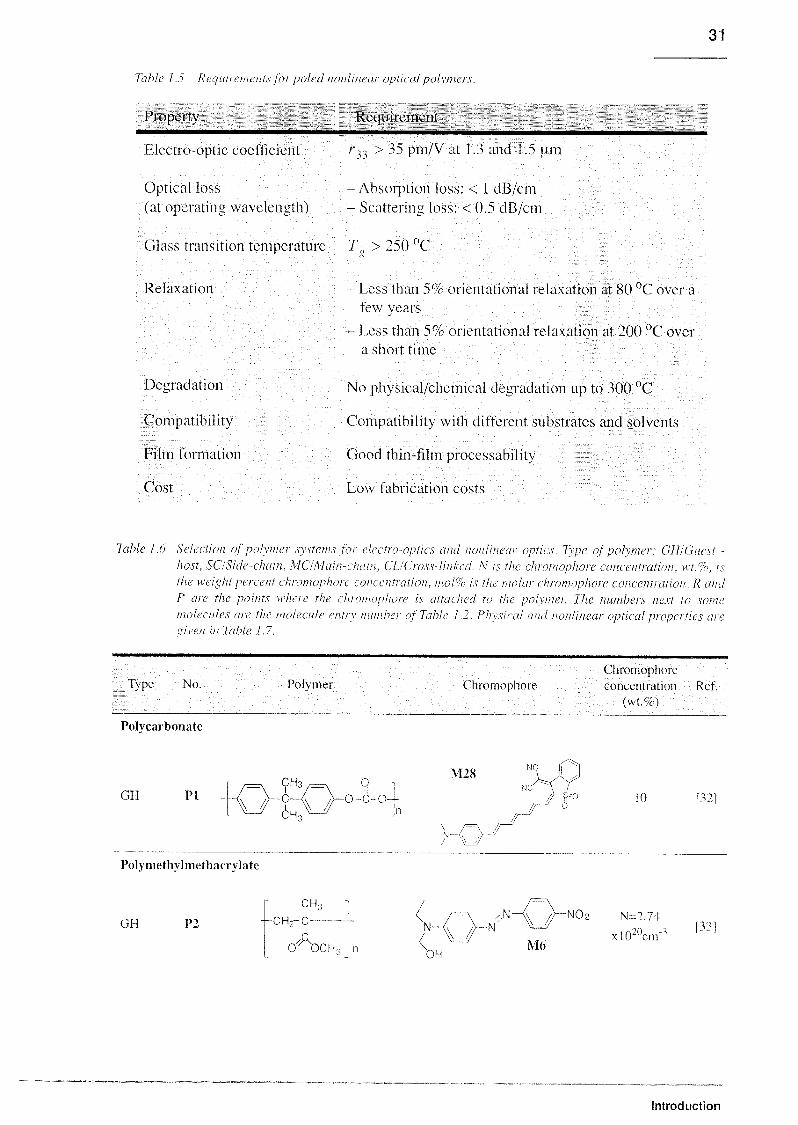
Table] 5 Requirements for poled nonlinear optical polymer s
Property Requirement
Electro-optic coefficient /•33 > 35 pm/V at 1.3 and 1.5 urn
Optical loss - Absoi ption loss: < 1 dB/cm
(at opeiating wavelength) - Scattenng loss: < 0.5 dB/cm
Glass transition temperature T„ > 250 °C
Relaxation - Less than 5% oi îentational lelaxation at 80 °C over a
few years
- Less than 5% orientational relaxation at 200 °C over
a shot t time
Degradation
Compatibility
Film formation
Cost
No physical/chemical degradation up to 300 °C
Compatibility with different substrates and solvents
Good thin-film processability
Low fabrication costs
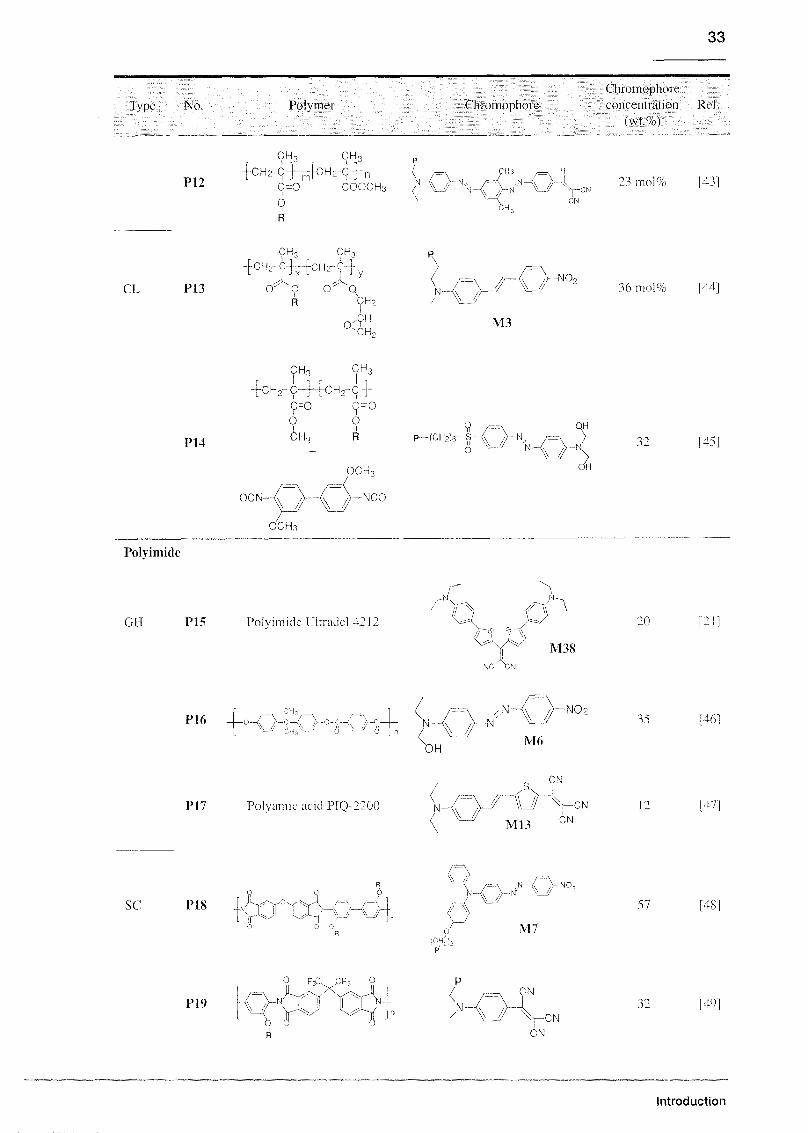
Table 1 6 Selection of pohmei systems for the tio optics and nonlincai optics type of pohmei GH/Gitcst -
host, SC/Side-cham, MC/Main chain CLICioss linked S is the chiomophore concentration wt% is
the weight percent c hromophore cone entration, moI% is the molar chiomophore concentiation, R and
P cue the points where the chiomophore is attached to the pohmei The numbers next to serine
molecules aie the molecule aim nuinba of Table 12 Plnsical and nonlincai optical piopci tics arc
g is en in Fable I 7
Type No
Polycarbonate
Polymei CluomophoteChiomophoieconcentiation Ret
(wt %)
GH PI . .—Q—7 \^Q~Q Q_
M28NC
nA~
7'
77 s=°
7r °10 P2]
Polymethylmethacrylate
GH P2
CH3
iJ
-CH2-C-
Q
O^OCH,
—A ..N-
OHM6
-NO2 N=2 74
upo 1 H71xlO cm
Introduction

32
Type No Polymei Chromophore
Chromophoieconcentration Ref.
(wl %)
P3
ÇH3-CHo-ÇÀ
O^ OCH-
CN
,N -
A //
-CN
M9
10 [34]
P4
CH3
id
-CHo-CC
!
er och.
>NC f
I J
-CM
S.
"\_7-\ Aa
W [35]
P5
CH3
ACHo-C—
Qc7 0CH3
NC M_^. ,y=N
V. 77 \
CH,
10 [36]
P6
CH3
-CH2-C—
0X/ OCH3 N~<\ 7/ \w
45 [37]
SC P7
CH3 CH3
[-CH2C-] [-CH?C-}
CT O1
R
A A
O OCH3
A(H2)b/^N-/
CN
W /A"~\-CNCN
M13
35 [38]
P8
CH3
-CH^-C—
c-o
0
R
/ CH
4 CH-^C-
C-0
O
cm
14 8mol% [39]
P9
CH3
-CH2-C -
A.CA OCH3
J—, \xIH C, O-CH )-N~/~W 15 140]
PK)
CH
-CH» C f
o
R
CH<!
CH2~C
7°o
CH
1 P"!
A 7 -NO,
Mil
H I41I
Pfl ~-CH?-C-
CH,
77Ox OCH3
H C
N <v ,VN
HOHA
.7 \\N=-8
V xl020cnACN
[42]
Introduction
33
Type No Polymei Chiomophoie
Chromophoieconcentration Rcf
(wt %)
P124CH2-C4^CH2-Cfn (
C O COOCH3
6R
?Hi
^
7h,
^ //23molA [A|
CL P13
ÇA ch3
-f-CH-r-C-]—]-CH-r-C-|>-,
y
c~r 0 C qR çh2
o'9HCH,
/NA\NO,
M3
36 mol% [411
P14
CH3 CH3
{ch2-c-44ch2-c-tc=o
!
o
CH3
OCN
c-o
oI
R
OCH3
-NCO
OCH3
Polyimide
9 r=-\p— (CH2)e- S~A //
o N—<
H
AOH
[\-
GH P15 PoKimideUltiadel 1212
v/*v M38
20 [21]
P16 o -c. > c^~"H <=— 1
N—
VOH
—N\7^7
M6
35 1-61
P17 Polvamic acid P1Q 2200 n-
S
M13
CN
\\ 7 "V-CNCN
12 [47]
SC P18
W //
r> ^>N0*
M7
57 [48]
P19
O F-L CI- 0
q »JXTAaKR
CN
-CN
CN
32 49|
Introduction

34
Type No Polyrnei Chiomophoie
Chiomophoieconcentration Ref
(wt %)
P20
o o
R N ÏM — J7 %_//
M3
NO?hO]
P21
O F,C. Oh, O
7 // V ^O O
R
N h N-<
71 N x
N-
N
M6
A 7N02
32 3 hn
P22
P
(N-
N-
N
NO?
CH3
M6 analogue
56 A2]
P23
P
<N -
\7 //
//N/ x
N0?
M6
A 7
P24
„Jj—-r——C H2—CH r
n U
p
(N
\
Polyqinnohne
PolvquinolinePQIOO
M6
—NO?
GH P25 X / \N < />
aX -JJ
s
^ y
Mis
NC
62
20
A4|
[55]
SC P26'
KS\ <X> \J/\ CN
CN
Polyamide
27 [56]
SC P27
7^7NH.^^ MC
O Q
Ri >~-CN
2 /N~\_/~ S°7CF,)8F
A/]
Introduction

35
type No Polymei Chiomophoie
Chiomophoieconcentiation Rel
(wt%)
P28 --NH-\( ACH2-
0 o -
-NHC R-C—
M^
[sSl
MC P29 COHN-R NHCO—(CH2)r O N
M3
Polvui ethane
SC P30
MB TD1
OR O C N 7\„HA
P cn \\
)P (CH y
<^AA"V % //
67 7 [A]
f 7 N=i2 3
xlOHI
* 7 mot cm
160]
PU
9„C
0
u
N° R^°
-N-h
7(CH)
(CHp
<AV^-CtHg
V ^ 7A 7/
68 [611
P32
H
N CH2 CHr 0-
-0 R
V7
M3
161
Ct P33 ,N-* P N
—a N -<x /> N02
M6
167
Polyestei
R. R
SC P34O
0 CH2T
W //
p p
NO? 144 [641
Introduction

36
Type No.
Epoxy
SC P35 _LU
Polymer
CL P36
N02
Maleimide copoly mer
SC P37
CH3
0=\>0NHc-o
Ö
R
Sol-gel
w^-rn^c-CH-n-
+
CH,
-_ch4-0 7 A=0 NH
ChromophoieChromophoreconcentration Ref.
(wt.%)
N-Ax /WN
CN
f^7jHcNCN
M9
[65]
63 [66]
[67]
GH P38 (Silica host) N-7 //
M-C V-N02
M6
40 [681
In Table 1.6 a selection of polymer systems for nonlinear optics is presented. Their physicaland nonlinear optical properties are presented in Table 1.7. In the following discussion the
numbers in bold refer to the entry numbers of Table 1.6. Guest-host systems, although not suit¬
able for reliable applications due to their fast orientational relaxation, are broadly used for two
reasons; either for checking the poling behavior of new molecules in standard polymers [usu¬
ally polymethylmethacrylate, PMAfA, P2-P6, or polycarbonate (PC), PI] or for checking the
poling behavior of new polymer backbones using standard chromophores [e.g. thiophenes P25,
or Disperse Red 1 (DRl). P16|. Lately, thermally stable, high Tq polyimides (PIQ-2200, P17,
Ultradel 4212, P15, TJ-100, P16) and polyqumolines (PQ-100. P25) are often used as hosts.
Very large electro-optic coefficients (rVi ) up to 38 and 45 pm/V at 1.3 urn have been obtained
by mixing molecules with high uß values like polyenes and thiophenes with polycarbonate,
PI, and polyquinoline, P25, hosts, respectively.The most common polymers for side-chain systems are the polyimides as they have high
glass transition temperatures leading to high thermal and temporal stabilities. Except systems
P19 and P20 all the other side-chain polyimides of'fable 1.6 use azo chromophores as nonlin¬
ear optical active material. Very good performances have been obtained for systems P21 and
P22 where electro-optic coefficients of r3^=25 pm/V and 733 = 14 pm/V at 1.3 j-im, respec¬
tively, and good temporal stabilities at elevated temperatures have been reported. Polymer P22
(A-95.11) developed by SANDOZ and ETLI has been used for the fabrication of a polarization-
introduction

37
independent integrated electro-optic phase modulator [69] and in this work for the fabrication
of phase and Mach-Zehnder electro-optic modulators (Chapter 10) and for photobleachingstudies (Chapter ).
The second group of polymers often used as a backbone are the mcthacrylates P7-P12.
Although they have generally low glass transition temperatures, large electro-optic coefficients
can be obtained either with thiophene (rr, =23 pm/V at 1.52 urn, P7) or with azo (r3] =26 pm/V at 1.32 um, PIO) chromophores. Polymer PIO (PAIMA-NAT) has been widely used for the
fabrication of phase modulators [411, Mach-Zehnder switches [70], and digital optical switches
[71]. Polymer P12 (3RDCVXY) bearing a diazo chromophorc has been used for the fabrica¬
tion of electro-optic channel waveguide modulators [72,73]. A polymethylmethacrylate-basedside-chain polymer with the nonlinear optical molecule 4-dimethylamino-4'-nitro-stilbene
(DANS) has been used for the fabrication of electro-optic modulators [71,74] and switches
[75]. Cross-linking of methacrylate-based polymers has been achieved at low temperatures
(150-250 °C) which made possible the use of chromophores that are stable at these tempera¬
tures and led to improved nonlinearities (P13, P14).
Polyamides have been also investigated by several research groups. The side-chain systems,
although exhibiting high glass transition temperatures, have a relatively poor nonlinear optical
performance (P27, P28). Main-chain polyamides, on the other hand, e.g. P29, have remarkable
orientational stability and large nonlinearities.
Side-chain polyurethancs P30-P32 have increased rigidity but show poor nonlinear optical
performance whereas the cross-linked ones (P33) are quite thermally stable and nonlinear opti¬
cally efficient. Polymer P33 (PUR-DR19) has been used for the fabrication of packaged Mach-
Zehnder modulators [76] and high frequency phase modulators [77-79]. Polyquinolines, P26,
and polyesters, P34, can have high glass transition temperatures and very good temporal stabil¬
ities. Side-chain, P35, and cross-linked, P36, epoxies have been also investigated but without
promising results.
The maleimide co-polymer P37 bearing a Disperse Red 1 analogue chromophorc and syn¬
thesized using a protecting group during the processing has both a substantially high glasstransition temperature ( f
„=255 °C) and a very large electro-optic coefficient (/--^ =30 pm/V at
1.3 urn).
Sol-gel matrices are hybrid inorganic-organic materials, e.g. P38, generated by a process at
moderate temperatures. In this process, a tetravalent oxide forming element (typically silicon)
substituted with reactive substituents such as halogen, acetate, etc., is allowed to react with
water usually in the presence of a catalyst. Hydrolysis of the monomers is followed by repeti¬tive condensation to higher molecular weight oligomers until ultimately gelation occurs. Prior
to gelation, organic materials can be added and films can often be produced by casting or spin¬
ning. In this case, the guest-host material is subject to problems of phase separation and shrink¬
age. It is possible, however, to achieve sol-gel matrices by using organically modified silicates,
where the organic moiety is bound to silicon before the polymerization, and thus achieve
higher chromophore loadings and good optical quality.In summary, no optimum electro-optic polymer exists at the moment. Methylmethacrylates
are very good hosts but have low glass transition temperatures. Polyimides and polyurethanescombine most of the essential characteristics of an electro-optic polymer and are mostly used
for applications. Polyquinolines are very promising as they can have high glass transition tem¬
peratures and at the same time successfully host highly nonlinear molecules.
Introduction
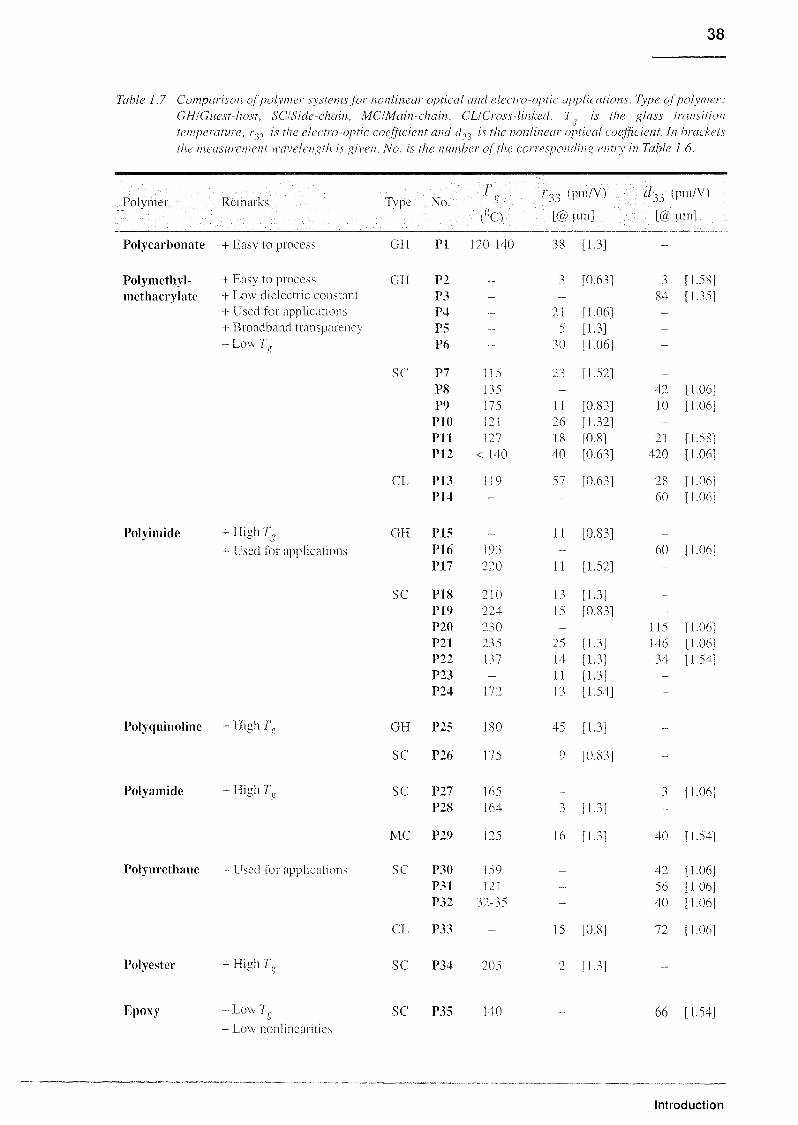
38
Table 1.7 Conipai ison of polymer systems for nonlinear optical and electro-optic applications. Type ofpolymer:
GHIGuest-host, SCISide-chain, MC/Main-chain, CLICross-linkecl. T is the glass transition
temperature, r^, is the electro-optic coefficient and c/-,3 is the nonlinear optical coefficient. In brackets
the measurement wavelength is given. No. is the number of the corresponding entry m Table 1 6.
Polymer Remarks Type No. -i/•33 (pm/V) d3i (pm/V)
(üO [@ lim 1 [<S> pm]
Polycarbonate + Easy to process GH PI J20-140 38 [1.3] -
Polymethyl¬ + Easy to process GH P2 „_ 3 [0.63] 3 [1.58]
methacrylate + Low dielectric constant P3 - _ 84 r L351
+ Used for applications P4 .... 21 [1.06] -
+ Broadband transparency P5 _ 5 [L3] -
-Low 77 P6 30 [1.06] -
SC P7 115 23 [1.521 —
PS 135 - 42 11.06]
P« 175 11 [0.83] 10 11.06]
PK) 121 26 [L32]
Pll 127 18 10.8] 21 [1.58]
P12 < 140 40 [0.63] 420 [1.061
CL P13
P14
119 57 [0.63] 28
60
[1.06]
[1.06]
Polyimide + High 7"„ Gil P15 11 [0.83]
+ Used for applications PI6 193 - 60 [1.06]
PL7 220 1J [1.52] -
SC Pt8
PI 9
210
224
13
15
[L31
[0.83]
-
P20 230 - 115 [1.061
P21 235 25 11.3] 146 [1.06|
P22 137 14 [L3] 34 11.54)
P23 - lf [1.3] -
P24 172 13 [L54] -
Polyquinoline + High T„ GH P25 180 45 [1.3] --
SC P26 175 9 [0.83] _
Polyamide + High 77 SC P27 165 _ 3 [1.06]P28 164 3 [1.3] _
MC P29 125 16 [1.3] 40 [1.54]
Polyurethane + Used for applications SC P30
P31
159
121
- 42
56
[1.06]
[1.06]
P32 32-35 - 40 [1.06]
CL P33 - 15 [0.8] 72 [1 06]
Polyester + High 7',, SC P34 205 2 11.3] .„
Epoxy Low T,j
Low nonhnearities
SC P35 140 66 [1.54]
Introduction

39
Polymer Remarks Type No.
(°C)
(pm/V) d,, (pm/V)33
[@ pm]
33
[@ pm]
CL P36 110 7 [0.53] 42 [1.06]
Maleimide
co-polymer
Sol-gel
+ High A
+ High nonlmeatities
+ Good optical quality
SC P37 255
GH P38
30 [1.3]
72 [106]
In this work, we investigated guest-host systems using polymethylmethacrylate (host of P2-
P6), polycarbonate (host of PI), and polyqumoline PQ100 (host of P25).
1.5 Electro-Optic Modulators
The application of nonlinear optical polymers that turned out to be the most important one in
the last few years is the electro-optic waveguide modulator. Electro-optic modulators are
needed in telecommunication applications to transmit information through an optical fiber at
very high bit rates. In order to reach bit rates of gigabits or terabits per second it is necessary to
develop modulators having a bandwidth of 100 GHz or more. Due to their intrinsically highdielectric constants this task is not yet possible to fulfill with inorganic materials like i.e. lith¬
ium niobate (LiNbO^). the material commercially used for electro-optic modulators up to
40 GHz. Even though it was demonstrated by Noguchi et cd. in 1994 [80] that it is possible to
reach 75 GHz by choosing special modulation electrode arrangements to reduce the effective
dielectric constant at microwave velocities, the cost effective limits seem to be reached
Optical signal
IN
Electrical signal
+>
S
*Electro-opticmodulator
a a aHïè
Modulated optical signal
OUT
Fig 13 Scheme of the clectio-optic modulation pi maple
Most work in the field of electro-optic modulators is performed using so called Mach-
Zehnder interferometric structures. A typical polymeric Mach-Zehnder interferometric electro-
optic modulator is shown in Fig. 1.4(a). The incoming light is split into two arms using a Y-
branch. In one arm the phase of the light can be changed by applying an electric field via the
electro-optic effect. If the induced phase change is jt,the overlap of the two branches vanishes
Introduction

40
after the second Y-branch. This constructive or destructive behavior of a Mach-Zehnder inter¬
ferometer output is illustrated in Fig. 1.4(b).
Top buffer layerTop electrode ^
Bottom buffer layer
Bottom electrode
_S.
ST^
b.
A(j)=0° A(l> = 180°
Fig I 4 (a) Typical str net 11/ e of pohmei -based Mach-Zehnder intei feiometr ic modiilatoi
(b) Amplitude modulation through elee tio-opticalh induced mteifeience m a Mach-Zehndei
inter ferometet
A parameter of interest is the half-wave voltage \n
[ 11. which is the voltage required to
induce a phase shift of tt in an appropriate modulator configuration with an electrode distance
dtot and a hght-clectrode interaction length / :
V =
Tt
X
n\\if
An dWtAN~1
An dtptlAN 1
(1.18)
where; -, is the effective electro-optic coefficient [;/= rv^ for a Mach-Zehnder modulator
and ref, — (2/3); ^ for a phase modulator because light is polarized at 45° with respect to
the poling direction (c-axis)] and AN / An is the modulation efficiency (see Section 9.2 for
details). Low modulation voltages require large geometry factors l/dtot as well as a high value
of n^i'eff which is achieved using the transverse electro-optic effect where the light propaga¬
tion direction is perpendicular to the electric field. The reduced half-wave voltage v is often
used as an intrinsic quantity for characterizing an electro-optic material.
Another important characteristic of an electro-optic modulator is its frequency response. A
parameter often used to quantify the frequency response is the (electrical -MB) bandwidth
which is defined as the modulation frequency at which the modulated output electrical power is
3 dB smallei, i.e. 50%, than the input electrical power at a fixed modulation depth of the output
Introduction

41
optical power. Differently expressed, bandwidth is the frequency at which the frequency
response Felc(f)
Frequency response = 20 log{oMY]
(m dBE) (1.19)
drops by 3 dBE, where Iout is the output light intensity.
The total losses of a modulator are defined as
Total losses = -lOlos
j max'
out
X7(in dB) (1.20)
where F^ff is the maximum of the output light intensity and Ijn is the input optical intensity.
The total losses include scattering, absorption, and coupling losses. For a detailed description
of the different loss mechanisms see Chapter 11.1.3.
CO
c
CD
CD
Total loss
Extinction ratio
Fig. J .5 Definitions of half-wave voltage, total losses, and extinction ratio.
Similarly the extinction ratio )} of a modulator is defined as
Extinction ratio = lOloa
/ rma\\1out
j min
V out J
(in clB) (1.21)
Introduction

42
where P'ff^ is the maximum light intensity output and V'} is the minimum intensity that the
optical output may be extinguished to. The definitions of half-wave voltage, total losses, and
extinction ratio are summarized in Fig. 1.5.
Electro-optic Mach-Zehnder interferometric modulators based on the inorganic crystal
LiNb03 arc commercially available. For the above mentioned reasons of higher bandwidth and
lower costs, much effort has been put b\ many research groups and the industry in the develop¬ment of modulators based on electro-optic polymers. Below we will describe how such devices
are fabricated and operated and what are the major challenges that have to be faced.
1.5.1 Polymer-Based Electro-Optic Modulators
In contrast to expensive LiNbCA waveguide technology electro-optic polymer modulators
are very cost effective and have made huge progress during the last few years. For example,
researchers at the University of California Los Angeles reported on an clectro-opttc phase
modulator having a bandwidth of 113 GHz [79] and lately one operating with driving voltages
less than 1 V [811. Such high bandwiclths are easily achievable from the material point of view
because the electro-optic effect in organic materials is mainly electronic in origin yielding sub-
picosecond response times and low dielectric constants.
Fabricating a Mach-Zehnder interferometric waveguide structure requires the electro-opti-
cally active guiding layer to be sandwiched between two buffer or cladding layers to prevent
optical losses occurring on metal surfaces. These cladding layers need to have a lower index of
refraction for the light to be confined inside the active layer. The choice of buffer layers is usu¬
ally limited by solvent compatibility with the active layer, i.e. taking care not to partially dis¬
solve the polymer film during spinning of the next layer. Furthermore, the buffer polymers also
have to show low losses since the field of the guided light partially extends into the buffers (sec
Fig. 8.5). To lind the appropriate buffer polymers is one of the main problems when creating
multilayer structures.
Chromiumstructure
a).Photolithographic mask
Guiding layerLower buffer layer
UV
Waveguide
\ Bleached area
A..,
Upper buffer layer
\jf*ssi*!i(»spj m»
1
b)
Photolithographic mask
Upper buffer layerGuiding layer
Lower buffer layer
UV
III!Waveguide
Bleached area
V
Fig 16 Schematic picsaitation of tin photobleaching tahmejue for the fabrication of channel
waxegiudes I he guiding Una is illuminated thtoiigh a photohthogiaphic mask eithei in
clued contact (at oi thiotigh the tippei buffer Icixa lb) \uth ultraviolet light The exposedcueas undergo photochemu al structmal modifications and then refractive index is reduced
foi nung a channel \\ ax eguide along the non-exposed patter in
Introduction
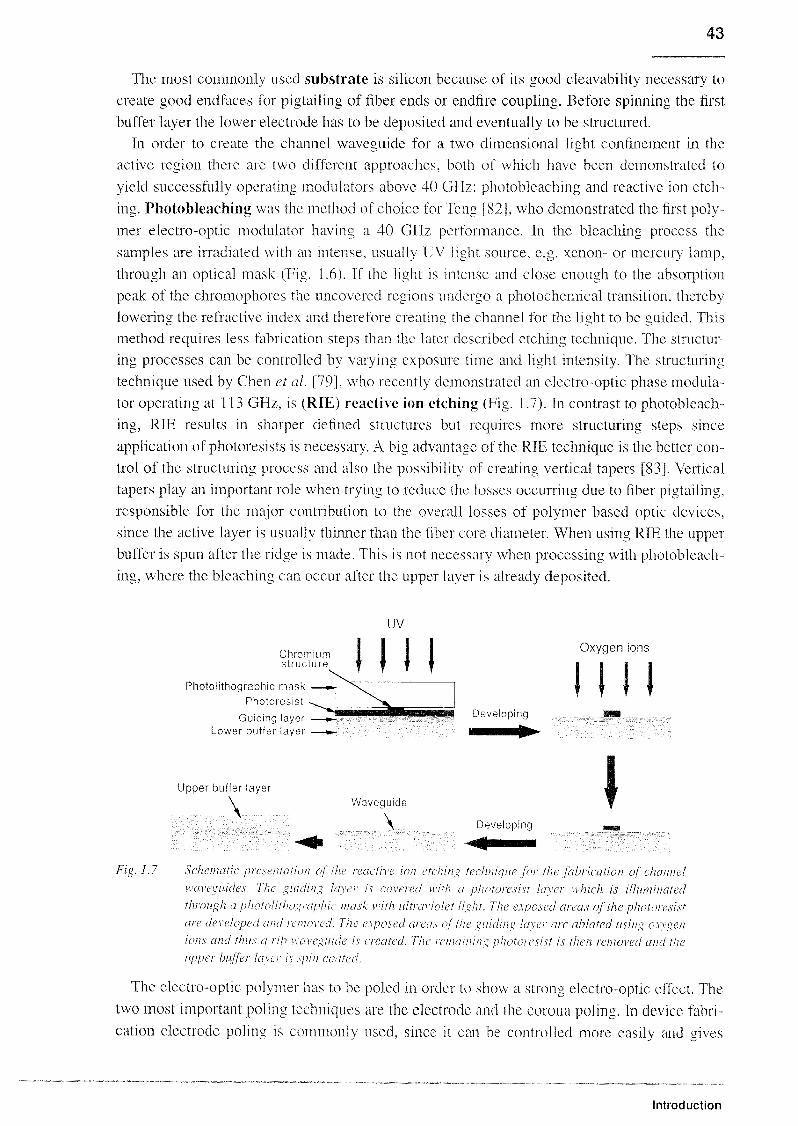
43
The most commonly used substrate is silicon because of its good cleavability necessary to
create good endfaces for pigtailing of fiber ends or endfire coupling. Before spinning the first
buffer layer the lower electrode has to be deposited and eventually to be structured.
In order to create the channel waveguide for a two dimensional light confinement in the
active region there are two different approaches, both of which have been demonstrated to
yield successfully operating modulators above 40 GHz; photobleaching and reactive ion etch¬
ing. Photobleaching was the method of choice for Teng [82], who demonstrated the first poly¬
mer electro-optic modulator having a 40 GHz performance. In the bleaching process the
samples are irradiated with an intense, usually UV light source, e.g. xenon- or mercury lamp,
through an optical mask (Fig. 1.6). If the light is intense and close enough to the absorption
peak of the chromophores the uncovered regions undergo a photochemical transition, thereby
lowering the refractive index and therefore creating the channel for the light to be guided. This
method requires less fabrication steps than the later described etching technique. The structur¬
ing processes can be controlled by varying exposure time and light intensity. The structuring
technique used by Chen et al. |79], who recently demonstrated an electro-optic phase modula¬
tor operating at 113 GHz, is (RIE) reactive ion etching (Fig. 1.7). In contrast to photobleach¬
ing, RIE results in sharper defined structures but requires more structuring steps since
application of photoresists is necessary. A big advantage of the RIE technique is the better con¬
trol of the structuring process and also the possibility of creating vertical tapers [83]. Vertical
tapers play an important role when trying to reduce the losses occurring due to fiber pigtailing,
responsible for the major contribution to the overall losses of polymer based optic devices,
since the active layer is usually thinner than the fiber core diameter. When using RIE the upper
buffer is spun after the ridge is made. This is not necessary when processing with photobleach¬
ing, where the bleaching can occur after the upper layer is already deposited.
UV
Chromiumstructure
Photolithographic mask
Photoresist
Guiding layerLower buffer layer
Upper buffer layer
\ Waveguide
\
Oxygen ions
II!Developing
\Developing
Fig. 1 7 Schematic presentation of the icactive ion etching technique for the fahiication of channel
waveguides "1 he guiding lasei is coveted \uth a photoresist lava which is illuminated
through a photobthogictphu mask with nltrcn lolet light. "I he exposed cueci.s of the photoiesistare developed and ieinen ed The exposed areas of the guultng laxa aie ablated using oxygen
ions and thus a nb ^enegunle i\ aeated. The icmaining photoresist is then removed and the
uppei buffei laxa is spin coated
The electro-optic polymer has to be poled in order to show a strong electro-optic effect. The
two most important poling techniques are the electrode and the corona poling. In device fabri¬
cation electrode poling is commonly used, since it can be controlled more easily and gives
Introduction

44
more reproducible results. Lately, however, corona poling was successfully used to fabricate
sub-1-volt halfwavc voltage electro-optic modulators [81]. Usually the poling electrodes are
larger than the later operating electrodes and have to be removed before depositing electrodes
for high frequency modulation. Electro-optic modulators operating at high frequencies, i.e.
1 GFIz and above, need to have a travelling wave electrode design, since the microwave wave¬
lengths become smaller than the modulator lengths. In order to match the characteristic imped¬ance ZQ of the device to the modulating source, the travelling wave electrode must have a Z0of 50 Q
.To achieve this, one has to design thin microstnp lines, whose impedance can be cal¬
culated taking into account capacitive and inductive resistances that depend mainly on the ratio
between the width of the microstrip line and the distance to the ground electrode.
1.5.2 Overview of Presently Known Mach-Zehnder Electro-Optic Modulators
For Mach-Zehnder modulators two configurations for modulating light are possible: single-arm or push-pull modulation. Schematic drawings for single-arm and push-pull modulators are
sketched in Fig. 1.8. In the push-pull configuration the two arms of the modulators have to be
poled in opposite directions in order to have opposite signs of the electro-optic coefficient. As
pointed out by 'Leng 184] the push-pull design for high frequencies docs not necessarily lead to
a reduction of the half-wave voltage V^ by a factor of two, since the ratio of microstrip width
and electrode distance has to be much smaller to receive an overall impedance of 50 Q,
because each arm needs to have 100 Q. This may result in a reduction of the overlap of
waveguide channel and microstrip line, therefore increasing again VK. The feasible decrease
of the V at high frequencies by using a push-pull configuration is determined by the electrode
design and is in a trade-off with the modulation bandwidth. In both configurations a bias volt¬
age is always necessary in order to set the working point in the center between minimum and
maximum transmission.
microstripline
biasingelectrode
MM MM
substiate
microstrip lines^ --I
Z=3 I I
MM MM
substrate
waveguide cross section
and chromophore align¬ment
ground electrode
waveguide cross section
and chromophore align¬ment
ground electrode
Fig I S Schematic diagram and aoss section for single-arm (a) and push-pull (b) Mach-Zehndei
electro-optic modulatoi s
Introduction

45
Teng used a single arm configuration for a P2ANS/MMA50/50" based 40 GHz modulator.
The operating voltage V'n was low, 6 V at 1.3 pm. The electro-optic coefficient ip3 of the
active polymer was 21 pm/V. Data on the stability of the nonlinearity was not given. In several
publications (e.g. [76]) it was pointed out that the used aminonitrostilbene chromophores suf¬
fer serious degradation clue to two-photon absorption. Information about the overall losses of
the modulator has not been provided. The extinction ratio was found to be 20 dB, i.e. 99%, for
the modulator of Teng.
Lee et al. [711 used a similar DANS/PMMA based side-chain polymer to report on a sin¬
gle arm Mach-Zehnder modulator with the highest extinction ratio of 31 dB up to date. The
7-33 value was 13 pm/V and the operating voltage In
of the device was 9 V The 3 dB electrical
bandwidth was around 2 GLIz. The structuring method to define the channel waveguide was
photobleaching, similar to Teng's modulator. The overall fiber to fiber losses, containing losses
from input and output coupling to the fiber, waveguide and Y-branch losses, turned out to be
13.2 dB. For comparison, the typical losses of commercially available LiNbO^ modulators are
around 4 dB.
Shi et al. gave in Ref. [76] a very nice overview on their push-pull high-speed polymer elec¬
tro-optic modulator. Fabrication, properties, as well as operating and stability issues concern¬
ing the modulator, are thoroughly discussed. The polymer of their choice was a thermally cross
linkable polyurethane-Disperse Red 19 side-chain polymer (P33). The thermal stability of the
second-order nonlinearity was tested using temperature dependent in situ second harmonic
generation experiments. A short time stability up to 110 °C and a long term-stability at 90 °C
have been observed. As already discussed in the paragraph about waveguide fabrication, Shi et
al, used RfE to perform the structuring. As modulation design they chose a push-pull arrange¬
ment resulting in a V'^ of 11 V The device was tested up to 60 GHz modulation frequency and
the overall total losses have been determined to be 13.5 dB. The extinction ratio was typicallybetween 15 and 20 dB. Furthermore they tested the optical power handling capability, which is
a serious problem in DANS polymers. The tests indicated no degradation in performance using
input powers of 10 mW at the operating wavelength of 1.32 uni. A high input power test with
150 mW resulted in evident photochemical degradation but still about two orders of magnitudeslower than in polymers with DANS chromophores. An even higher optical power handling
capability was achieved by Shi et al. |85| using a double end crosslinked polymer. An input
power of 250 mW, giving a peak intensity of about 0.9 MW/cra" resulted in no degradation,neither linear optical nor nonlinear optical, even after one week of exposure. Such high input
powers arc necessary for applications like externally modulated community access television
(CATV) using analog fiber optic transmitters.
The state-of-the-art in the field of polymeric electro-optic modulators in terms of halfwave
voltage is a push-pull modulator using molecule M32 30 wt.% in PMMA. This molecule was
specially modified to reduce the attenuation of electric field poling-induced electro-optic activ¬
ity caused by strong intermolecular electrostatic interactions (sec Sections 2.2.3, 3.2.2, and
3.3). The modulators fabricated had an average halfwave voltage of 0.82 V at 1318 nm [81].
For completeness it should be noted, that high speed Mach-Zehnder electro-optic modula¬
tors have also been built based on the semiconductors GaAs and AlGaAs. Spickermann et al.
[86] reported on such a modulator having a 3 dB electrical bandwidth larger than 40 GHz.
+ Molecule analogue to M3 of Table 1.2 attached to PMMA. No further information provided.-*"" Moleeule M3 of Table 1.2 attached to PMMA. No fuithei infoimation provided.
Introduction

46
Phase velocity matching was achieved using coplanar electrodes with a special slow wave
design. The half-wave voltage was 14 V and the extinction ratio 20 dB. Data on optical losses
were not provided.
In this work, we use the side-chain polyimide A-95.11 (P22) to fabricate prototype phaseand Mach-Zehnder electro-optic modulators using the photobleaching technique to form the
optical waveguides. The fabrication ptocedure and the obtained results arc presented in part C.
The results on electro-optic Mach-Zehnder modulators mentioned above are summarized in
Table 1.8.
Table 1 SMcitenal and clexiee paiameteis foi sex aal Mach-Zehnder electro-optic modulators Vx
is
the half-wax c xoltage and i] is the extinction icitio Data aie given foi X =J313nm
Material Bandwidth (GHz) v,(v) il (dB) Losses (dB) Ref.
P2ANS/MMA50/50 40 6 20 - [821
DANS/PMMA > 9 31 13.2 [71]
PL7DR19 60 11 20 13.5 [76[
CLD-1/PMMA _ 0.82 _ 9 [811
LiNb03 75 5 20 6 L80J
GaAs/AlGaAs >40 14 20 _ [86]
A-95.11 — 50 13 20 This work
Introduction
47
Part A: Novel Nonlinear Optical Molecules for
Electro-Optic Polymers
The first part of this work is focused on the development of highly nonlinear optical chro¬
mophores to be attached to a high glass transition temperature side-chain polymer. Our first
approach was based on stilbazolium based zwitteiionic chromophores bearing two ions and
exhibiting large ground state dipole moments. The second approach involved dibithiophenemolecules having four thiophenes as conjugating units. Our third approach was based on the
phenylbithiophenes using two thiophenes and one phenyl in the conjugating bridge. The fourth
approach was to improve the macroscopic optical nonlinearities of phenyltetraene molecules
not by improving their intrinsic molecular hyperpolarizability but by hindering their intermo¬
lecular interactions by changing the molecule's shape.
The microscopic optical nonlinearity of the molecules was determined by measuring their
p,ß product (ground state dipole moment u times first-order hyperpolarizability ß) usingelectric-field induced second-harmonic generation (EFISH) at 7=1907 nm. The macroscopic
optical nonlinearity of the molecules was determined by measuring the nonlinear optical coef¬
ficient d3{ using the Maker-fringe method and/or by measuring the electro-optic coefficient r^
using the reflection technique of thin films made of guest-host solutions of the molecules in a
polymer matrix such as polycarbonate, polymethylmethacrylate, and polyquinoline PQ100.
Additionally, the photobleaching process of the polyimide A-95.11 was studied with respect
to absorption spectra, waveguide losses, and refractive indices. Experimental results were com¬
bined and compared to a theoretical model which was developed to qualitatively as well as
quantitatively describe this process.

48
2 Nonlinear Optics of Molecules in Solution
Various techniques have been employed m the past foi the measurement of molecular hyper
polaiizabilities (e g , hypei-Rayleigh scatteiing [87] solvatochromism [9]) In this woik we
use the well established technique of electnc field induced second haimomc geneiation
(FFISH) [9]
Foi the définition of the nonhneai optical susceptibilities alternative conventions aie lie
quently used This has led to some confusion m the liteiatuic concerning the compaiison of
expeumentally determined values obtained with chltetent techniques as well as the compaiison
ol calculated and experimental values Lhe lact that most often the piecisc definition m use is
not cleatly stated complicates the compaiison ot optical hypeipolatizabihtres In this work we
follow the power sencs convention [88 89] where the molecular hypeipolanzabilities are
defined by the expansion of the moleculai dipole moment p as given in (1 9) and where the
macioscoptc nonhneai lty measured with LFISH is gi\en by (2 3)
As absolute measuiemenls of moleculai polan/abihties aie vei\ difficult to peifonn the sig
nais measuted aie usually lefetenccd to the one ol a quaitz ciystal Several absolute values foi
the nonhneai optical susceptibilité dn of quaitz varying fiom 0 3 to 0 5 pm/V have been
repotted [90 91] Although \alues of 0 4 and 0 5 pm/V ha\e been broadly used in the past the
one that is cuitently mostly accepted and used throughout this woik is dn = 03 pm/V at 1064
nm, d{ {= 0 28 pm/V at 1542 nm and dn = 0 277 pm/V at 1907 nm |26]
2.1 Electric Field-Induced Second-Harmonic Generation (EFISH)
2.1.1 Theoretical Description
Electnc-fteld-induced second-haimomc generation (EI IS II) is the most hequently used
method to measure nonhneai optical properties oi molecules It is based on measunng the he
queue} doubled light geneiated m a solution undei the influence of a static electnc field used
to break the isotiopy of the liquid FFISH is usually pet toimed using a Makei-fnnge techniquewheie the intensity oi the second-harmonic wave /2o geneiated m the sample shows oscilla¬
tions due to different phase velocities of the fundamental and fiequency doubled beams in the
material [9] A solution ol the material to be investigated is placed m a wedged cell which con
sists ot two glass windows positioned between two stainless steel electiodes wheie the static
electric field is applied (Fig 2 1) B\ translating the wedged liquid cell acioss the beam,
Makei-fringe amplitude oscillations ot the generated second harmonic aie obtained (Fig 2 2)
Fig 2 1 1/ISHccll
Nonlinear Optics of Molecules in Solution
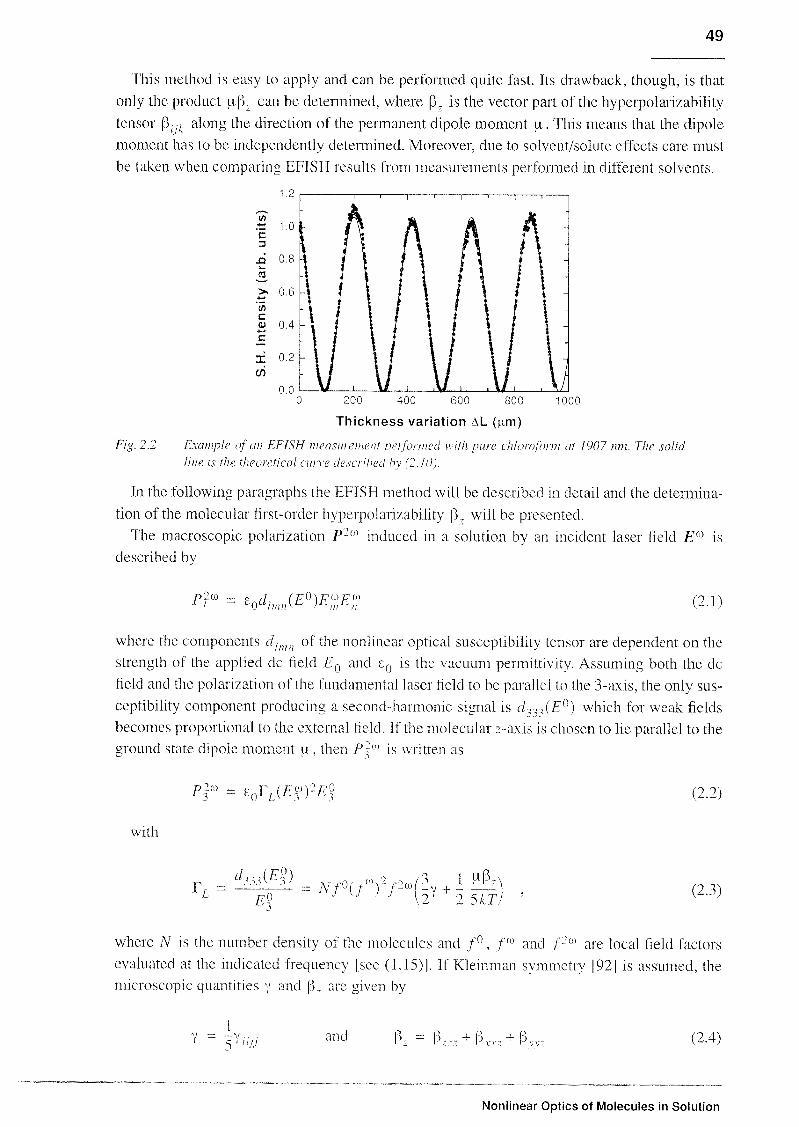
49
This method is easy to apply and can be performed quite fast. Its drawback, though, is that
only the product 1.1 ß. can be determined, where ß„ is the vector part of the hyperpolarizability
tensor ß , along the direction of the permanent dipole moment u.. This means that the dipolemoment has to be independently determined. Moreover, clue to solvent/solute effects care must
be taken when comparing EFISFI results from measurements performed in different solvents.
1 2
200 400 600 800
Thickness variation AL (urn)
1000
Fig. 2 2 Example of an FFISH measui orient performed m ith pure chloiof01 m at 1907 nm. The solid
line is the theoretical au \ e described by (2 10)
In the following paragraphs the EFISH method will be described in detail and the determina¬
tion of the molecular first-order hyperpolarizability ß. will be presented.
The macroscopic polarization P2co induced in a solution by an incident laser field EM is
described by
PfM = E0dlnJE^E-E CO
m"' n (2.1)
where the components dlmn of the nonlinear optical susceptibility tensor are dependent on the
strength of the applied dc field F() and e0 is the vacuum permittivity. Assuming both the dc
field and the polarization of the fundamental laser field to be parallel to the 3-axis, the only sus¬
ceptibility component producing a second-harmonic signal is d r^fF°) which for weak fields
becomes proportional to the external field. If the molecular r-axts is chosen to lie parallel to the
ground state dipole moment u,then P2(0 is written as
P2m = f0I\(/^)2£? (2.2)
with
I'l =
<*w(E°) 1 flß-N
/A
A- rfl/ A»\- rW-'* > PA=M°(f ) H2Y +2 577) ' (2.3)
where N is the number density of the molecules and f°. /'trt and /'2(0 are local field factors
evaluated at the indicated frequency [see (1.15)]. If Klein man symmetry [92] is assumed, the
microscopic quantities y and ß .are given by
= -v
5' "//
and ß.- = ß_„+ß„ +Pvv- (2.4)
Nonlinear Optics of Molecules in Solution

50
where ß„ is the vector part of the hyperpolarizability tensor ß . along the direction of the per¬
manent dipole moment p, which usually, but not always, is parallel to the charge transfer axis
of the molecule.
The intensity of the generated second harmonic signal after the liquid cell is given by
/2«(D = (it)rf(n = /viijrcarG7p 7vr,/(M2(£ü)(/°J)2/'(L) (2.5)
where /0) and /^(L) are the intensities of the fundamental and of the generated second-har¬
monic wave, respectively, (/fco)r is the envelope of the interference fringes (if no absorption
is present), and F° is the static field strength. The factor \}L = (AJ)4(r2w)2 contains Fresnel
transmission factors of the fundamental and the second-harmonic wave at the air/glass and the
glass/air interface, respectively. The factors TG 7and FL result from the electromagnetic
boundary conditions at the glass/liquid and liquid/glass interfaces. l[f and 1\ are the coherence
lengths of the glass and the liquid, respectively, and are given by
1G =
X
4(„2^»g)and il
=h_
c
4(//2«- "/")(2.6)
The constant K is
K =
IS
AA k--, (SI) (2.7)
Generally f(L) is given by
f{L) = -exp - c7° +a-
L x J cosh oA'-a2CD\
- COS'(Dl
1(2.8)
describing the well-known oscillations as the distance traveled in the liquid, L, is varied (Fig.
2.2). a0) and a2m are the absorption coefficients at the corresponding wavelengths. In the case
of negligible absorption f(L) is reduced to
f(E) = sin2(4\2lL
(2.9)
Fig. 2.2 shows an example of an EFISTI measurement performed with pure chloroform at
X = 1907 nm. The curve has been analyzed using a least squares fit of the form
/2co = /vin_, +_)+/,„IF
71 (2.10)
where the parameters p, and p4 are the coherence length and the phase offset, respectively.
p2 is the fringe minimum and p{ is the fringe amplitude. By comparing the measured curve to
(2.10) and by referencing to the signal of a standard solution (see Section 2.1.2), the macro¬
scopic third-order nonlinearity r; can be deduced for a specific solution.
Nonlinear Optics of Molecules in Solution

51
For a two component solution, FL is the sum of solute (index l) and solvent (index 0) con¬
tributions expressed as
rL = ^n/'«(/-(f)2/'(2wYo, + ^l/'i,(/'f)2/r("Yl' (2.11)
where the microscopic fliird-oider nonlinearity y' is defined as
1 !M7-v t-
2' 2 5kI(2.12)
Mostly Lorenz type local field factors (1.15) with A '= /r{,) are applied.
In order to minimize solvent-solvent and solute-solute interactions, an extrapolation proce¬
dure to infinite dilution is used. The nonlinearity VL is measured for different concentrations
(again using a reference for calibration) and b> using (2.11) and (2.12) the product uß, can be
deduced neglecting the term y. a reasonable approximation for molecules with large second-
order molecular nonlinearities.
2.1.2 Experimental Description
K = 1907nm X= 1064 nm
/\ hydrogen cell \
NdYAG trigger
F1
PR. F2
^fÂzlr-^-v-^d PM
sample,wedged cell on
translation stage
boxcar
integrator
HV
pulse
signal
Fig 2 3 Experimental EFIStl set-up Fl is a combination of a RG1000 filter two dielectric mirroisfoi1064 run, and a BG39 filtei. PR is a polarization lotatoi, F is a poletiizci aligned along the
applied high peld. I is a 200 mm lens, and F2 is a eewibirlatum Ufa watei cell, an inter fer crue
filtei a/9W nm and a neutral filter
The experiments were performed using a Q-switched NcfYAG laser (Coherent, Surelite)
operating at the fundamental wavelength of 7=1064 nm. The experimental set-up is shown in
Fig. 2.3. The repetition frequency of the laser was v = 10 Hz and the pulse width x=7 ns. The
energy of the laser was adjusted by inserting a 4 mm diameter pinhole into the cavity and b\
setting the Q-switch delay time to typically 260 us obtaining an energy of 240 mJ/puise. All
measurements were performed at 7 = 1907 nm. For the generation of this wavelength the beam
was focused into a 1 m long high pressure (ca. 25 bar) Raman cell filled with hydrogen. Due to
the Stokes shift of 4155 cm'ot the H2 gas part ot the fundamental beam is converted to the
different Stokes and anti-Stokes lines, the first Stokes line lying at 7 = 1907 nm. Using appro¬
priate optical filters (RG 1000) the \ isible anti-Stokes lines at 7=738 nm and at 7=565 nm as
well as the light from the laser flash lamp were blocked. The remaining 1064 nm radiation
Nonlinear Optics of Molecules in Solution

52
coming out of the Raman cell was blocked by two dichroic dielectric mirrors and an additional
long wave pass filter (BG 39). With a lens (f=250 mm) the beam was then focused into the
EFISLI cell. The generated second harmonic signal was detected with an infrared sensitive
photomultiplier. which was cooled to about -6 °C to reduce the thermal noise.
Table 2 1 Fiopaties of the icfeieiiec solution ol I wtr/c MN i m dioxane and of the epiaitz crystal, usedpvthe data anah sis of the h FISH nieasinements
Property
Nonlinearity TL of MNA
( 1 wfA solution in dioxane)
Coherence length lc of MNA
(1 wt% solution m dioxane)
Refractive index n of MNA
(1 wt% solution in dioxane)
Nonlinear optical coefficient dl,
of quartz
Value Wavelength X (nm)
1907
1907
1.414 953.5
7409 1907
8.AK722 nr/V2
103 urn
0.277 pm/V 1907
Table 2.2 Piopenties of the soheius used foi the PI IStPineasiiiements
Property Dioxane Chloroform THFa DMPUb
Molecular weight 88.12 119.38 72.1L 128.12
Density p (g/cmA 1.034 1.476 0.887 1.063
Absorption tx (cm"1)at 7 = 1907 nm
~> -i 0 1.83 1.87
Dielectric constant e
Refractive index0
2.21
I.4H
4.81
1.44
7.58
1.408
35.14
1.489
((ce AA75 nm) ((tf 953.5 nm) «a) 589.3 nm) (@ 589.3 nm)
a Tetiahcdtotuian
b lA-dimeth} 1-3.4.5 6-reti«iii\dio-2( llllpMiinicimonec This reiractive index was used loi (he evaluation ot the measuiements
The measurements were performed b\ translating the wedged liquid cell containing the
solutions to be investigated perpendicularly to the laset beam. The resulting Maker oscillations
were then observed at the second harmonic frequent'} 7=953.5 nm using an appropriate inter¬
ference filter. The liquid cell consisted of two glass windows (BK-7) positioned between two
stainless steel electrodes. The wedge angle was 5.45° and the interelectrocle distance was 5
mm. The high voltage applied to the glass cell was pulsed with a duration of about 3.5 ms in
Older to minimize electrochemical degradation of the samples and prevent current flowing
through the cell. The voltage was synclnonized with the laser pulses with the Q-switch trigger¬
ing the high voltage modulator. The applied voltage was typtcalK 6 kV.
Nonlinear Optics of Molecules in Solution

53
A 1A solution ot 2 metfiyl-4-nitioanihne (MNA molecule M2 m Iable 1 2) m 1 4-dioxane
was used as a lefcience Its nonlinearity is FL=8 4 10~"
m /V" dt 7 = 1907 nm This value was
obtained tiom measurements with a quartz crystal as a lefeieucc [9| and was collected to the
most recent value ot dn =0 277 pm/V at 7 = 1907 nm of quaitz [26)
Fot the deteimination of the dipole moment of the zwitteiionic senes (Section 2 2 1), the
dieleetiie constants oi solutions m dioxane with chtfeient concentialiens weie measuied as
desenbed m Ret [91 Foi the lest ot the molecules w e deteimmed only the value of the pioduct
uß which is the important paiatnefei tor pol\mei electio optic applications
2.2 Results on Molecular Nonlinearities of Synthesized Molecules
2.2.1 Molecular Nonlinearities of Zwitterionic Molecules
The cential part ot the zwitteiionic molecules Zl Z3 Z9 and Z10 is the same as in DASf
wheieas molecules Z7 and Z8 aie stilbazolium based, but with one benzene iing teplaced b\ a
thiophene iing (see Table 2 3) The solvatochiomic bchaviot of the stilbazolium ionic salts and
stilbazolium zwittenons is essentialh the same Theie is loi example a led shift (AX = 17
nm) foi the Z3 chiomophoie compaied to Z9 due to the dibutvlamino donor group, similai to
the behavtoi ot DAS I compared to the one ot BAST implying a highei molecular hypeipolai
izabihty An unusual mcicase ot the absoiption peak ot the chaige transfci band and a stiong
fluoiescence ol all chiomophoies m chloimated sohents have also been obseived
Table 2 ? Absorption peak of chaige transfer luind On run) of witlaionie chromophoie'; in solxents of
dif/aent noimali cd polai its peuameta L ( neu in brackets) Values of DAST and BASI cue
go en foi compaiison
Sohent Methanol \cetonrtnle Acetone
(0 762) (0 460) ((H55)
489 479 478
Z2 /K /Aa /=\* 49 3 485 480
Z3a Hoc7 ^ V_7~-\i 495 486 484
F , ( 30) is i commonK used indtc noi ot sohuit pol mtv It is dt(umined b\ the longest w welensth
tbsoiption mtximum of Reichudts d\e ["> 6 diphem] 4 (2 4 6 tiiphen\lp\ndinio)phenohtel (RD)
usina the toimuh £? (->0)-// \,\ -,(RD) uhue//is PI mek s tonst mt 1 is the velocity of ficht m
\ kuiuyi \t is the \\o*\dio s numbsi uul \
, V(RD) is the w iscnumbci coitespondmg to the longest
\\ welctuth ibsotption mixmium of Rtichudts dve [ 9 > | The noimahztd solvent poldut} is
l7 =[z/(30) 30 7] 32 1 i r(.0) e dues nvenheu net iken homRel |941
Nonlinear Optics of Molecules in Solution
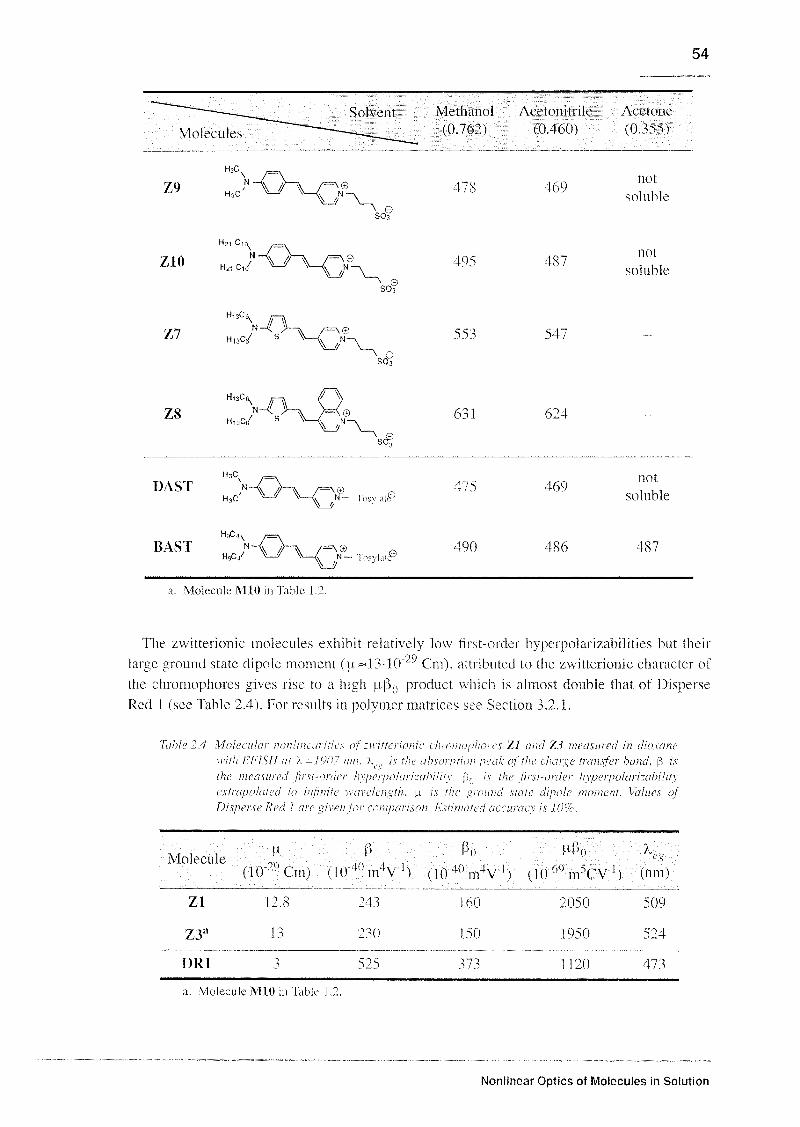
54
Solvent Methanol Acetonitule Acetone
(0.762) (0 460) (0 355)
Z7
Z8
S03
HisC/ s XN—<\ .N-
178
495
5s}
631
475
490
469
487
547
624
469
486
not
soluble
not
soluble
not
soluble
487
a Molecule MIO m TabL
The zwitteiionic molecules exhibit relatively low fust-oiclei h>peipolaiizabilities but then
huge giound state dipole moment (u~l 3 10 Cm) attiibuted to the zwitteiionic chaiactei of
the chiomophoies gives use to a high tiß0 pioduct which is almost double that of Disperse
Red t (see lable 2 4) lot îesults in polymei matrices see Section 3 2 1
[able 24 Moleetdai nonliiheii lies of witter tonn duomophons /I and Zî measured m dioxane
with 11ISII at > 1907 nm / is the abs ption peak of the elende transfer band ß is
the measured fi> \t oiaa Inpeipolaii abilits p-, \ the Ins! aula hxpapolaii ability
cxtiapolated lo infinite wenelen^lh u is tin lound slate dipole moment Xeilues of
Dispose Red 1 are gnu fv c wipaiison I \timated iicctiiaes is I0P
Molecule
(10
it
Cm)
ß
(1040m4V ') (10
ßo
40m4V')
uß0
(lÜ^irACV"1) (nm)
Zl
Z3a
12 8
n
241
2 A)
160
1A)
2050
1950
509
524
DR I 525 373 1120 47 3
a Molecule M10 m 1 ible I 2
Nonlinear Optics of Molecules in Solution

55
2.2.2 Molecular Nonlinearities of Bithiophene Molecules
A. Dibithiophenes
To understand the reasons win we turned to the bithiophene containing structures, we will
briefly discuss a theore which shows the directions to be followed to optimize the first-order
hyperpolarizability ß .A simple model has been proposed [2] in which ß is correlated with the
degree of ground-state polarization. The degree of ground-state polarization, that is. the degree
of charge separation in the ground state, depends pnmarih on the chemical structure (for
example, the structure of the ^-conjugated sestem, or the strength of the donor and acceptor
substituents), but it also depends on the surroundings of the molecule (for example the polarité
of the medium). In donor-acceptor polyenes, this variable is related to a geometrical parameter,
the bond-length alternation (BLA), which is defined as the average of the difference in lengthbetween adjacent carbon-carbon bonds in a polymethine chain [95]. The wavefunction of the
ground state is a linear combination of two limiting resonance structures: (1) a neutral form
characterized by a positive BLA, and (2) a charge-separated form characterized by a negative
BLA. The relative contribution of each limiting resonance to the ground-state structure of a
molecule is related to their relative energies. When the two resonance forms are very different
in energy the ground state structure will be dominated by the lower-energy form and the mole¬
cules will exhibit a large degree of BLA. In contrast, if the two structures are the same in
energy the molecule will exhibit eery little BLA (see Fig. 2.4). Increasing the strength of the
donor and acceptor end groups, and/or placing the molecule in a more polar solvent can lead to
stabilization of the charge-separated form. For molecules whose neutral forms arc aromatic,
charge separation will interrupt the aromalicity and yield structures with a higher-energy
quinoidal resonance form. This disruption of the aromaticity results in additional déstabilisa¬
tion due to the loss of aromatic stabilization, and in such systems the molecule will be further
biased towards the neutral resonance form.
An approach to increasing the degree of ground-state polarization and thereby decreasingthe magnitude of BLA is to replace strongly aromatic benzene rings with heteromatic ringsthat have smaller aromatic stabilization energies. This approach was successfully implemented
using low-aromaticity thiophene rings 113). In particular, it has been shown that the replace¬ment of both benzene rings in DANS (M3 in fable 1.2) with thiophene rings results in a two¬
fold increase in uß. Molecules using two thiophenes m the conjugating bridge were reportedto have larger nonlinearities than those using one thiophene and one phenyl [25]. Our first
attempt was to add one more thiophene at each side of the double bond to further increase the
polarizability of the molecules, fhe resulting dibithiophene molecules were soluble only in
very polar solvents, such as DAIPL1. and were very sensitive to light probably due to photooxi-dation. Results on molecular nonlinearities are presented in Table 2.5.
We note that their molecular nonhnearities in DMPU are even smaller than that of DisperseRed 1, in the same solvent, although large values were expected. We attribute this result to a
low degree of BLA clue to ver\ low aromaticity, as only thiophene rings are present, and due to
the use of the ver)- polar solvent DMPU. As shown in Fig. 2.4, most of the usual molecules for
electro-optic applications have large BLA and lie in the shaded area. Optimization aims at
approaching the peak by decreasing the BLA. In our case, however, it is very probable that the
BLA is so small that the peak is surpassed towards the right side of the peak and that ß is con-
Nonlinear Optics of Molecules in Solution

56
60sequently small. Note that u.ß() of BTCN (680-10-0' nACV ') is lower than that of BTNO
(790-10~69 m5CV l) because BTCN uses the tricyano acceptor which is stronger than the nitro
one and thus has a lower degiee of BLA. This is one mote indication that the di bithiophenes
are located on the right side of the peak of the ß vs. BLA curve of Fig. 2.4.
aromaticity of ground state
donor/acceptor strengthsolvent polarity
=3
cd
frig 24 Schematic time showing the ftist-oi da lixpeipolairability ß ver sus bond-length alternation
(BLA) Open aides lepiesent the ground state tcmtiibution wheieas the filed aides repre¬
sent the chaige-ti culpa state conti ihution I In shaded tnea indicates the legwnin xslmh die
usual molecules fen dec no optic applications lie
Table 2 5 Molecular nonlinearities of dibithiophene e Inomiiplioies measured m DMPU n ith
FhlSli at X =1907 nm X( i\ the absorption peak of tlie dial ge tiansfei band \\
is the measured ftist-oidei hxpei pohu uahilitx f>0 is the fust-oidet
lixper polar izabilitv exttapolated to infinite windengfh, u is the ground state
dipole moment and MW is the moleculai weight Values of Di spa sc Red 1 m the
same sohent are gnenfor compaiison I stimated aecuracx is JO'/c
Molecule
BTNO
BTCN
,sv-07N
,,ß uß() itß0/MTT^\ (Wm (10-°9 (10-69(nm) - ,
-, -,
nACV-1) mAV4) irrW1)
520 1220
481 980
700
680
1.6
1.3
DR1 510 1550 1030 2.3
Nonlinear Optics of Molecules in Solution

57
B. Phenylethenyl Bithiophenes
Oui next attempt eeas to icplace one bithiophene gioup bv a phenyl gioup and inctease the
clegiee ot BfA Bv doing so we obtained molecules soluble m low polarity solvents and
enhanced molecular nonhneai Utes — compaied to monothrophene analogues- which aie
among the largest tot stable Nf O clnomophoies Dialkvlammo and chphenylammo gioups
wete used as election donors and trice anoviml (1C) and 2-phenyl-tetiacyanobutacfteiiyl (Ph-
TCBD) as election acceptois Molecules with the dialkelaminodonoi gioup exhibit laigei uß0than those with the drphemdannno gioup rot both kinds ot acceptot gtoups Maximum value ol
uß0 (nine times that of DRI) was obtained foi molecule CC176 which has two double bonds
in the 7T-con]iigate budge It's theimal stability, howeeei, is the lowest among the molecules of
this senes Although molecules with a chalkelamino donor group exhibit high decomposition
tempeiatmes of atound 250 °C the diphem lammo was used to increase the theimal stabilityabove 300 °C Ph-ICBD, apait fiom being a eeie stiong elcctton acceptoi, ma> prevent mole¬
cules fiom stacking up on each othet due to the phcrwl iing evhich 'sticks-out" ot the TCBD
gioup. Results on molecular nonhneaillies and decomposition tempetatures aie presented m
Table 2 6 and a compaiison scheme is depicted in Fig 2 5 Pen results in polymci matnees see
Section 3 2 2
Fable 2 6 Molecular nonliruarities of pheinktlnrnl bithiophenes mciisuicd m dioxane with LI IS11 at
> =1907 nm > is the absorption peak of the diaat transfer band ß is the measuied fu st order
Inpa polai i ability \>() is the first aula Inpapohu i ahdi/x extiapolatcd to infinite went length tt is
the giound state dipole moment \I\\ is the moleail a weight and lj is the decompositiontemper attire laines ofDnpase Red 1 cue "noi foi compaiison Estimated acauac) is 10uo
Up uPo VPq/MWj
Molecule "• (|0h9 do69 flO69d
(nm) i , c (°C)nACV1) nACV1) mVv1)
K '
CC 176'1
C H
\sK-J \CN
CN
655 19960 9100 19 9 238
CC 172b
CH,
p(\-x kjT\ pH661 U74() 66S() 134 249
C H,W
V_Q_<i<_>-4 CN
CC 175e
W ( 611 5510 2910 5 4 308V>S /
u
CN
/—'\ 1 7 A-" ^V CN
CN
Nonlinear Optics of Molecules in Solution

58
MoleculeX
u,ß up0 Liß0/M1Teg
(nm)(10
-69(10
-69(10
-69
p5rArV ,_V-i\rlm3CV') mW1) mW)
(°C)
VC 201e
CC 197e
V 77
\ 77
1 V-
x-ô-Q-U i
623 9550
5760
5000
3330
250
343
DRl 510 1550 1030 2.3 308
a Molecule M19 in Table 1 2
b Molecule M18 tillable 1 2
c Molecule M17 m Table 1 2
d. Molecule V121 m 'table 1 2
c Molecule V120 in table 1 2
Donor
c2H5
C2H5
,N—
C„H9
C4H9P-
\ //
N—
\ /
n=2
n=1
ISn=1
®CN
Av^CN
CN
X.
~A
C2H, /=\
j\;—V ®~\ )—N°2HOC2l7
O
On=1
J ffin=1
Acceptor
NC CN
Fig 2S Scheme loi the eompai non ol molceulai nonlinear ities 0/ phernkthanl bithiophenes laliics
and aiea of aides conapond lo uf>0 iioimalized to Disperse Red 1 (DRl) lor results in
pohmei matines see Section 12 2
Nonlinear Optics of Molecules in Solution
59
2.2.3 Molecular Nonlinearities of Phenyltetraenes
The molecules presented in Table 2.7 are based on the phenyltetraene bridge and exhibit
large molecular nonhnearities and very good solubilité. By varying the substituent s of the
chromophores the effect of the intermolecular interaction between the chromophores and their
environment could be studied. The value of iiß0 for molecule CLD-5 is higher when measured
in tetrahydrofuran (THF) than in chloroform. We attribute this difference of 38% to the hydro¬
gen bond formation between the hydroxy (OH) group of CLD-5 and the oxygen atom of the
THF molecule. This bonding reduces the possibility for formation of intramolecular hydrogenbonds (0-H--N, 0-H--0 or O-H— Ph) evhich would result -as in the case of chloroform- in a
decrease of the electron density of the conjugated system and therefore the electron donating
strength of the amino group (see Fig. 2.6).
To confirm the existence of hydrogen bonds, eve performed infrared absorption measure¬
ments of molecule CLD-5 (see Fig. 2.7). For a 2 niM solution in chloroform there are three
bands in the O-H stretching range of the spectrum (3200-3700 cm"1). The sharp band at 3695
cm"3 is assigned to traces of water contamination. The sharp band at 3603 cm"1 is assigned to
the free OH groups possible in the confoimers I-V shown in Fig. 2.7. The broad band at 3420
cm"1 is a strong indication of hydrogen bonding [96]. It can be due to various intermolecular
(e.g. IV) and intramolecular (I. II. V, VI, VII) hydrogen bonds. Both ^-bonding to the conju¬
gated system (I, V, VI, and VII) and «-bonding (II and IV) are possible. Its higher intensity
compared to that of the 3603 cm"1 band indicates that most of the OH groups of the chro¬
mophores participate to the hydrogen bonding and suggests the dominance of conformers VI
and VII without free OH in chloroform solution. In conformers I, V, VI, and VII, where a it-
bonding is involved, part of the electron density of the conjugated system is shared by the
hydrogen bonding, thus the donating strength of the amino group is weakened (Fig. 2.6b). In a
1:3 mixture of THF:chloroform the 3603 cm"1 peak disappears indicating the absence of free
OH groups. The 3420 cm band shifts lo longer evavenumbers (3432 cm" ) indicating that the
OH groups now form hydrogen bonds to the oxygen atom of the THF molecules (Fig. 2.6a).
This can be explained as follows. The 0-H---X angle of an intermolecular hydrogen bond can
be 180 degrees, which is optimum for a hydrogen bonding, while the same angle of intramo¬
lecular hydrogen bonds cannot be 180 degrees. Hydrogen bonding weakens the O-H bond
strength and, consequently, the absorption bands resulting from the O-H bond vibration. So,
the free O-H group needs to absorb more energy (longer evave numbers) to vibrate than the
weaker hydrogen bonded O-H bond (here the intramolecular one) which vibrates at shorter
wave numbers than the intermolecular one |96|. Therefore, by reducing the intramolecular
hydrogen bonds the donating strength and the molecular hyperpolarizability increases. The
attachment of the bulky fc/Y-butyldimethylsilyl (PBDMS) group to the donor (CLD-4 com¬
pared to CLD-5) eliminates the intramolecular hydrogen bond formation. Moreover it can
reduce the intermolecular electrostatic interaction evhich may cause aggregation. A more effec¬
tive way to reduce the formation ot aggregates is by adding a carbon side-chain perpendicularto the conjugated backbone oi the molecule. The use of such a side-chain (CLD-4 compared to
CLD-1) keeps the individual molecules awa\ from each other, greatly reduces the formation of
dipole couples, and leads ro enhanced solubility and optical nonlinearity (upn =86207 0"69
CnA/V). For results in polymer matrices see Section 3.2.2.
Nonlinear Optics of Molecules in Solution

THF
O
IntermolecularH-bond
-H-0
O-» H-0
a.
60
IntramolecularH-bond
b.
Fig. 2.6 Influence on the electron donating strength (indicated by the big arrow) a) ofan intermo¬
lecular hydrogen bond formation in the presence of an oxygen-containing solvent (e.g.
tetrahydrofuran) and b) of an intramolecular hydrogen bond formation in a solvent with¬
out oxygen (e.g. chloroform).
chloroform100
THFrchloroform 1:3
3800 3400
Wavenumber (cm"1)3800 3400
Wavenumber (cm"1)
V
II
III
IV
H
A"A(7 N
b^A
4-0.
\\%- VI
VII
o
O-H
,-o'H
N-A\\
Fig. 2.7 hifrared spectra of molecule CLD-5 in a 2 inM solution in chloroform (left) and in a mixture
of 1:3 tetrahydrofuran (TblFuddoreform (right), and schematic presentation ofpossible con¬
formations of the electron donor group. Conformations I to V should have sharp absorption
bands in the 3500-3700 cm' range which corresponds to the free O-H stretching. Conforma¬
tions I, II, IV V, VI and VII include hydrogen bonds which give rise to a broad band at wave-
numbers lower than the one ofthe free O-H stretching.
Nonlinear Optics of Molecules in Solution

61
Table2
7Moleculai
nonlineaiitics
ofpheinltetiaene
cluomophoies
measuredm
THF
with
EFISH
at
P=1907nm
A.istheabsoiption
peakofthechaige
tiansfeiband,
ßisthe
measiii
eelfust
aider
hvpeipolaiizability,ß0
isthe
fiist-oicleihvpetpolaiizability
extiapolatedto
infinitewavelength,
[xis
the
giound
state
dipolemoment,MW
is
the
moleculai
xveight,and
Tdis
the
decomposition
teinpeiatuie
Estimatedaccutacv
is10%
Molecule
(nm)
tiß|iß0
,ftß0/MW
(10697-1
(1069
(1069
mW1)
m^CV"1)m^V1)
Te
(°C)
CLD-5
650
14320
6780
109
661a
10760d
4920
79
254
649
18140
8620
10
1259
CLD-lc
A-
648
A00
6430
84
275
CLD
1-3
608
6000
3200
54
271
aMcasuiedm
chloiotoim
bMoleculeM33m
fable
f2
cMoleculeV132m
Table
f2
NonlinearOptics
ofMolecules
inSolution

62
3 Nonlinear Optics of Molecules in Polymer Hosts
The macroscopic nonhnearities of the synthesized molecules were determined by forming
guest-host solutions with various polymers such as polymethylmethacrylate (PMMA), poly¬carbonate (PC) and polyqumohne (PQ100). Initially we determined the nonlinear optical coef¬
ficient c/31 of corona poled pohmei films using the Maker-fringe technique (see Section
3.1.1). However, as we arc interested in electro-optic applications where the electro-optic coef¬
ficient rVi is the important material parameter, electrode poling and the elhpsometnc tech¬
nique (see Section 3.1 2) were further used for inducing a noncentrosymmetric alignment of
the molecules and determining their macroscopic electro-optic behavior.
3.1 Experimental Methods
3.1.1 Determination of Nonlinear Optical Coefficients
(Maker-Fringe Measurements)
7 = 1542nm 7= 1064 nm
yf\ methane cell \
Nd'YAG trigger
IF 1 sample on
rotation
PR. P L stage A F 2
>L \ / '"""" ' / ! 11 •" ( £f-j~—/— — p|\y]
boxcar
integrator
polymer -|
film •
laser 0)
beam
bottom
electrode
heating
stage
substrate
signal
Fig. 3.1 Experimental Maker-Fange set-up. Fl is a combination of a RG1000 filtei, two dielectric
mirror s foi 1064 nm, and a BG^9 filter PR is a polar ization rotator, P is a polarizer, I, is a
500 mm lens, A is an anahzei and F2 is a combination ofa water cell an interference filter at
711 nm, and a neutral plter The sample is inoiutte d on a computet controlled rotation stage
For thecpi coefficient to be deteimined, the fundamental beam is s-polcnized and the p polcti-ized second harmonic signal is detected
For the determination of the nonlinear optical coefficients of molecules in polymer hosts the
Maker-Fringe method was used [97]. Films were corona-poled near the glass transition tem¬
perature at a distance of I 5 cm from the needle with a positive voltage of 7 5 kV. After poling,the nonlinear optical coefficients of the polymer films evcre measured evith the Maker-frmge
technique. The experimental set-up used is shown m Fig. 3.1. Measurements were performed
using a fundamental eeaeelength of 7=1542 nm piovided by stimulated Raman scattering m a
methane gas cell induced b\ a Nd'YAG laser (see Section 2 1.2). Using the Maker-fringe tech¬
nique a plane parallel sample is rotated around an axis perpendicular to the s-polanzed funda¬
mental laser beam and the p-polanzed second harmonic signal is detected. The intensity of the
second harmonic wave I2n generated m the sample shows oscillations due to different phasevelocities ol the fundamental and frequency-doubled beams m the material. Such /2o)(0)curves are evaluated using equation [97]
Nonlinear Optics of Molecules in Polymer Hosts

63
/2(0(9) = —rf|, L^°(e)j4r2fo(e)i f2m(e)i2(/w)2f^:80C (n2 + "2co)
(3.1)
- sin20
with 0 the external incidence angle, t and 7' transmission factors, n the refractive index. L
the sample thickness, X the wavelength of the fundamental wave, c the light velocity in vac¬
uum and 80 the permittivity of vacuum. The curves were compared to the Maker-fringes of the
reference quartz crystal whose nonlinear optical coefficient is known (dn = 0.28 pm/V at
À=1542 nm). With this geometry the nonlinear optical coefficient d7t was measured with an
accuracy of about 10%. Typical /2(0(0) curves are shown in Fig. 3.7 in Section 3.2.2.
3.1.2 Determination of Electro-Optic Coefficients
(Ellipsometric Measurements)
100
jo
Modulation voltage
Fig. 3.2 Output characteristics for the ellipsometric set-up used for the measurement of electro-optic
coefficients. A small applied sinusoidal voltage modulates the light intensity around a bias
point.
For the determination of the electro-optic coefficient r^ of the poled polymers the ellipso¬
metric technique [98] evas used modified to allow for measurements during the poling process.
The ellipsometric technique is based on the measurement of the electric field induced change
of the optical phase difference experienced by the s and p components of a laser beam which
propagates through the polymer film (see Fig. 3.2). An mdium tin oxide (ITO) thin semicon¬
ducting layer, deposited on a glass substrate, is used as transparent electrode. A polymer film is
then deposited by spin coating cm it and then coated evith a metal electrode (see Fig. 3.3). A
diode pumped Nd:YLF (7 = 1313 nm) or a diode pumped solid state Er:Yb (A, = 1552 nm) laser
is slightly focused with an incidence angle of 45° on the back surface of the sample after pass¬
ing through a polari/er, which sets its polarization at 45° evith respect to the incidence plane,
and through a phase compensator, which changes the relative phase between the s and p com¬
ponents of the laser beam. After reflection at the polymer/metal interface the beam is analyzed
by a polarizer, that is crossed with respect to the input one. The power of the beam transmitted
Nonlinear Optics of Molecules in Polymer Hosts

64
by the whole system is detected by an infrared sensitive germanium photodiode. A modulation
voltage m the order of 5 V at 1 kHz is applied over the films and used as a reference for a lock-
in amplifier which reveals the modulated optical signal.
To monitor in-situ the poling process during electrode polmg a new set-up was built (see Fig.
3.4). This set-up allows the direct measurement of the clcctio-optic coefficient throughout the
polmg cycle. The sample is mounted on a heating stage letting the measuring beam pass
through a hole and get reflected on the polmg electrode of the sample. In addition to the modu¬
lating AC voltage, a high DC polmg voltage is simultaneously applied on the sample. This
technique was used for obtaining optimized polmg cycles concerning polmg duration and tem¬
perature. An example ol such a polmg cycle is shown m Frg. 3 5 for polyimide A-95 11.
jTO vm 0 9
glass"~~~
contacts —1
l±. &\gold
1 ®l
film —-1 > !.. •!
1 ®l
1 *
Fig. 3 3 Preparation of samples for the measuienient of the electro-optic coefficient The I TO covered
glass substrate is etched foi 5 nun in a mixture of 2^ gi LPO, 25 gl HCl, and 2 gi KNO^ foi
the bottom dee tiodes to be fanned 1 he polxmer film is then spun and the top gold eleetiodes
(2*>0 nm) cue sputtered through a stupe shaped aluminum mask
To determine the rVi coefficient from the experimental data, we used the equation (10) of
Ref. [981 corrected by Morta/avi m Ref. [99]
3 À/„/-,, =
(n2 - sin2©)127i\7 A/ n2 sm-0
(3.2)
under the assumption r3~. = 3rpl and with X the measurement wavelength, Vm the applied
modulation voltage, lm the modulated optical signal. Ai the intensity contrast, n the film's
refractive index assuming there is no birefringence, and 0 the external angle of incidence.
The technique was also used to obseiee the relaxation of electro-optic activity under contin¬
uous application of a modulating voltage. In the case of molecule CC172 in polymer PQ100
we observed a 10% decrease at room temperature, whereas m the case of side-chain polyimideA-95.11 the electro-optic coefficient lost 25% of its initial value after 23 hours of continuous
operation at 100 °C (Fig. 3 6).
Nonlinear Optics of Molecules in Polymer Hosts
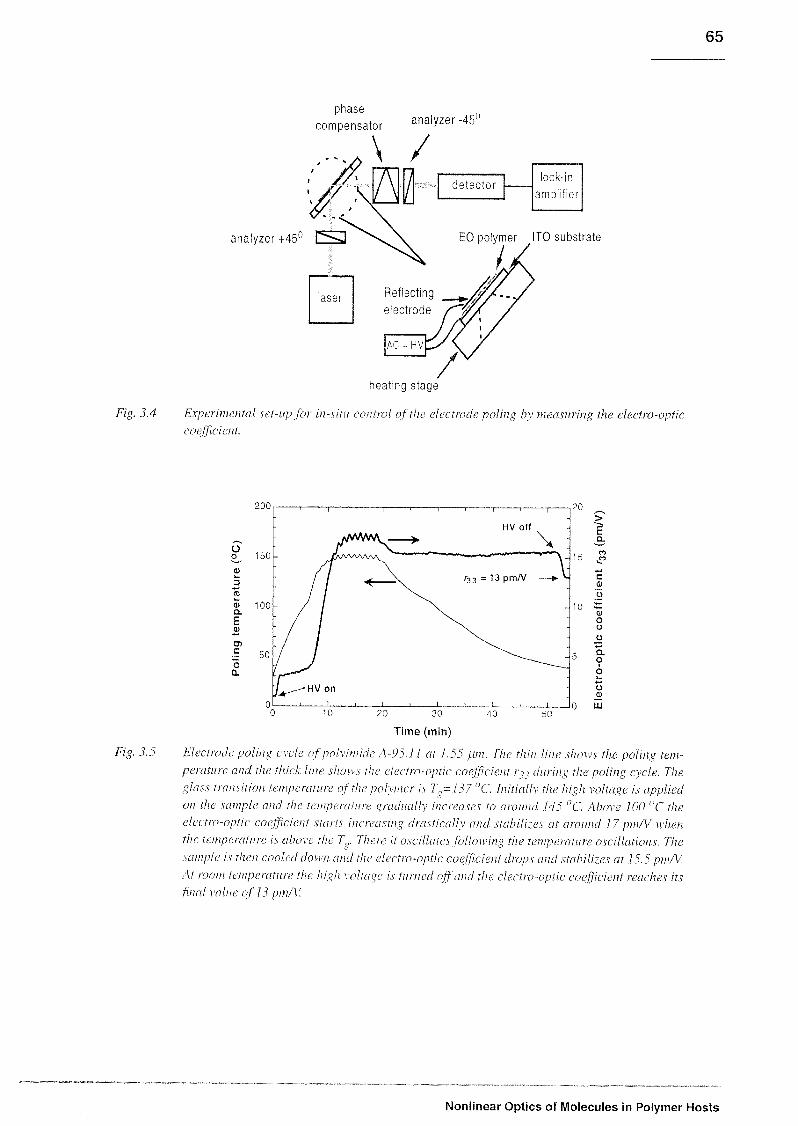
65
phase
compensator analyzer-45'o
analyzer +45° l*1--^
\ /lock-in
amplifierdetector
laser
EO polymer ITO substrate
Reflectingelectrode
heating stage
Fig. 14 Expo intentai set-up fin in-situ contiol of the electiode poling bx meant) mg the electro-optic
coefficient
oo
o
3*-*
<u
a
E
2
c
Öa.
200
150-
100-
a
c
a>
oo
ao
20 30
Time (min)
Flg. 3 5 Electiode poling < u le of pohimule \ 9* 11 at 1 ^ urn I lie thin line slum s the polmg tan-
peiatiiit and the thick line slum s the dectio-optic coefficient i ?,> dining the polmg cycle The
glass transition tempeiatiiie of the pohmei is 1 ,= H7"C Initialh the high voltage is appliedon the sample and the tempeiatiiie gradually incieases to around 14^ "C Above 100 "C the
electio-optic coefficient stents mcieasing dtctsticalh and stabilizes at around 17pm/V xdicn
the taupe icittue is aben e the I, Theie it oscillates follow mg the tempeiatiiie oscillations The
sample is then cooled down and the da tio-optic coefficient chops and stabilizes at F) S pm/VAt loom temperature the high \ oliage is tinned off and the electio optic coeffic tent reeic lies its
final i aliu of 1 ? pm/\
Nonlinear Optics of Molecules in Polymer Hosts

66
CC172/PQ100 @ 23 °C
0.8
CO^
0.4
0.2
0.0 —
0 10 20 30 40
time (h)
frig. 3.6 Measurement of the electro-optic relaxation of molecule CCI 72 in PQ100 at room tempera¬
ture and ofpolyimide A-95.11 at 100 "C. The set-up show n in Fig. 3.4 is used to monitor the
electro-optic coefficient while a 5 V modulating voltage is applied to the sample. We observe a
10% decrease after 40 hours of continuous operation for CC172/PQ100 polymer and a 25%
decrease after 23 hours for poly mer A-95.11.
3.2 Results on Macroscopic Nonlinearities
3.2.1 Nonlinear Optical Coefficients of Guest-Host PolymersBased on Zwitterionic Molecules
Guest-host systems of the chromophores in polycarbonate were made in N-methyl-2-pyr-rolidone (NMP). spun on ITO-coated glass substrates, and poled with corona discharge. Non¬
linear optical coefficients comparable to that of DRl were measured with the Maker-fringe
technique at 7 = 1542 nm. The temperature limit of the thermal stability was determined by
examining the charge-transfer absorption band of the films after consequent heating. Films
were baked at a specific temperature for 30 min and if more than 60% of the initial absorbance
remained they were rcbaked at a higher temperature. This cycle was repeated with increasing
steps of 10 °C until 60% of the initial absorbance remained. The final baking temperature is
defined as the temperature limit of thermal stability [100]. The temperature limit of the chro¬
mophores' thermal stability is in the range of 180-245 °C, smaller than that of Disperse Red 1
in the same host (256 °C). Their solubility in the polymer matrix is limited to a molecular con¬
centration of around 9xl019 cm"1 (~30 vet.97). The reason why the nonlinear optical coeffi¬
cients are not as large as expected from their molecular nonlinearities and compared to
Disperse Red 1, is attributed to their large dipole moment hindering effective poling (see Sec¬
tion 4 for discussion). Results are summarized in Table 3.1.
A-95.11 @ 100 °C
0.6
0.4
-0.2
n n
Nonlinear Optics of Molecules in Polymer Hosts

67
Table 3.1 Temperature limit of theimal stability and nonlinear optical coefficients of zwittenonic
molecules in polycarbonate measured at X=1542 nm. Molecular concentration is
N=5xl() cnfJ (~ 3 wt.%). Disperse Red 1 is given for comparison. Estimated
accuracy is 10%.
Molecules
Temperature limit of
thermal stability
(°C)
Nonlineai optical coefficient d^x
(pm/V)
Z3a 207 0.7
ZIO 245 0.3
Z7 180 0.75
Z8 195—
0.25
DRl 256 0.6
a. Molecule M10 m Tabic l.l"
3.2.2 Electro-Optic Coefficients of Guest-Host PolymersBased on Bithiophene and Phenyltetraene Molecules
The nonlinear optical coefficient of bithiophene molecule CC172 in a 20 wt.%1 solution in
PQ100 was measured with the Maker-fringe method at À = 1907 nm to avoid resonance
enhancement. It was found to be d,{ =9.7±l pm/V (see Fig. 3.7), more than three times higherthan a similar guest-host system of Disperse Red I (c/^ =3. t±0.5 pm/V). The electro-opticcoefficients of the phenylethenyl bithiophenes (CC series) and one phenyltetraene molecule
(CLD-1) in 15 wt.% guest-host solutions in PMMA and PQ100 evcre measured at 1.55 pm
after electrode-poling evith a field of 100 V/r.im. Measurements were also performed with sam¬
ples poled in vacuum and nitrogen atmosphere but no influence on the electro-optic coeffi¬
cients was observed. Results are presented in Table 3.2 and discussed in Section 4 after a short
description in Section 3.3 of the theory of intermolecular electrostatic interactions and how
they influence macroscopic electro-optic activity.
Z3
CO
1.0
:> i. ' i i
_
i
L ,.-.A Quartz À
t ff "7 "l F:\T n-
0.51 1 f I i1 h \ 1
0.01 1 I 1 I„ 1 [
-40 -20 20 40
Incidence angle 0 [deg] Incidence angle 0 [deg]
Fig. 3.7 72ûJ(0) cun-es of a 1560 nm thin film of molecule CC172 in polymer PQ100 in 20 wt% (left)and of a 2 mm thick ejuartz e rx stal (right).
Nonlinear Optics of Molecules in Polymer Hosts

68
table 3 2 Electro-optic coefficient ?-,, of phenylethenyl bithiophene and phenyltetraene molecules
m polymethylmethacrylate (PMMA) and polyqumolme (PQIOO) measured at X=1552
nm A. is the absorption peak ofthe chaige transfer band The polmg field is 100 V/flmand the chiomophoie loading is 15 wt%
MoleculeXes, (nm)
in PMMA
Kg (nm)
in PQ100
r„ (pm/V)
in PMMA
r3. (pm/V)
in PQ100
CC176 686 736 2.7±1 „
CC172 679 rjrjr I0±1 4.5±l
CC201 649 676 5.5+1 2.4+1
CC197 594 611 2.5±l 2.4+1
CLD-1 657 698 19 3+3 11.5+2
CLD-4 656 687 24±3 I9±2
3.3 Competition of Intermolecular Electrostatic and Poling-FieldInteractions in Defining Macroscopic Electro-Optic Activity
As discussed m Section 1.5, the parameter characterizing the performance of electro-optic
modulators is the half-wave voltase V„ .
VAX V An djoA
nhplfAANifl 1
An dtot
lAN„n 1(3.3)
ell
To minimize the half-wave voltage, the device design parameters An/AN ,,, dt0{, and / can
be appropriately adjusted. Optimization is, however, restricted by optical losses and modula¬
tion frequency issues. An additional and more promising approach is to maximize the electro-
optic coefficient r,, (=rv^ for Mach-Zehnder modulators). In the limit of no intermolecular
electrostatic interactions the electro-opttc coefficient is proportional lo the molecule's dipole
moment |i, first-order hyperpolarizability ß, and the molecular concentration in the polymer
host N :
,ttß/V (3 4)
One therefore expects that b\ increasing the concentration and the molecular figure of merit
[iß the electro-optic coefficient will increase hneaily. However, for molecules with large
dipole moment intermolecular electrostatic interactions become a ma] or barrier to achieving
high electro-optic coefficients and high chromophorc loadings without phase separation. Theo¬
retical calculations predict [ 1011 that ?v, will exhibit a maximum, as a function of N, that will
shift to lower N with increasing p.. These calculations [102] explicitly consider the effects of
chromophore shape and pi edict that the attenuation ol desired noncentrosymmetric order will
Nonlinear Optics of Molecules in Polymer Hosts

69
be most severe for chromophores of prolate ellipsoidal shape. Indeed, as the major-to-minor
axis ratio is increased, the position of the maximum shifts to lower number densities.
To depict this we consider the general relation (1.16) between microscopic and macroscopic
optical nonhnearity in the case of electro-optic polymers
= ^(f<A2/'°ß/V<cosA9) (3.5)
with n the refractive index, /' local field factors [see (1.15)], and (cos30) the acentric order
parameter with 0 the angle between the polmg field direction and the chromophorc principal
axis. The acentric order can be computed considering all forces affecting the Gibbs distribution
function G = cxp(-U/kT) evith k the Boltzmann constant and '/' the Kelvin poling temper¬
ature. If intermolecular interactions are neglected, the total electrostatic potential energy U is
Ux = -jiFcosO with F - f°E the effectue polmg field (see Section 1.3.6). If intermolecu¬
lar interactions are included, the total electrostatic potential energy is [101]
U = tA. + LA = -nFcos9-Wcos9 (3.6)
with W the intermolecular electrostatic energy computed by London and given by [103]
AA
W =
1 A-tt
(4îxr0)2 kT(3.7)
Through an equilibrium statistical mechanical treatment the acentric order (cos30) can be
approximated for the cases IF = 0 and c7A ^ 0 and for high or low (jiF « kT) poling fields.
The effect of the molecule's shape can be included by introducing the parameter
c = cos(0m/;(). with Qmin the minimum angle that can be obtained. The parameter c reflects
the fact that chromophores cannot occupy the same region of space at the same time and there¬
fore cannot access certain angles for certain concentrations. For dimensionless molecules
c - 1 whereas for prolate ellipsoids with a and b the long and short axes, respectively, c is
given by [102]
l-(b IdN)'
1 - (b/a)2
1
0
for cc" <N< lr"
(3.8)for N < a
~3
for N > b'2.
Analytical expressions for (cos^O) for all four cases are summarized in Table 3.3. Ln(p)arc the ?/-th order Laneeem functions
E{(p) = cothi»/'
(3.9)
A spheroid generated by the resolution of an ellipse about its longer axis (opposed to oblate).
Nonlinear Optics of Molecules in Polymer Hosts

70
K(P) = \i+^)K(p)~lpzj p
(3.10)
Table 3.3 Analytical expressions for the acentric order without (U2=0) and with (Un^O) intermolecular
interactions.
(cos30> =kT
«A otherwise
U2 = 0\iFsat >m
r/2*oc^F\l-5kF[ m.1 MSf)^ L\kT).. 1
Plots of (cos30)A, a kind of normalized electro-optic coefficient, as a function of concen¬
tration N are shoevn in Fig. 3.8. We note that for small concentrations the relation is linear and
independent of dipole moment and shape. A deviation appears at higher concentrations -
sooner for molecules of larger dipole moment- and maxima arc predicted in accordance to
experimental observations. Increasing dipole moments result in shifting the maxima to lower
chromophore loadings. Also, the curves are observed to sharpen with increasing dipole
moment. These effects are more intense for elliptically shaped molecules of the same volume.
ACDCO
moo
v
3-1026.
'I I I | I I I I |""yr;»T 1 1
u = 6 D /' - si = 8D /*.* '••-..
"T t i | rjrt i i i i it i'-'
/ ,Lt = 13D"
2'1026 - f /
MO26
n
-
X 1 1 1 , i , ,"—1 **. *_^t_L f i i t i i i i i i r*-! —- a.„. .
Fig. 75
5 1026 10 1026
N ImA
5 1026 10 1026
N [m-3l
5-1026 101026
N frrr3!
Plots of { cos71} V (denoting a normalized electro-optic coefficient) versus molecular concen¬
tration ,V for a poling field of E=300 \7ptn, a poling temperature of'7-378 K=105 "C, and
three values of dipole moment p=6, 8, 13 D. Solid lines: no intermolecular interactions, dot¬
ted lines: with intermolecular interactions between spheres, clashed lines: intermolecular
interactions between ellipsoids (the same volume as in the case of spheres is assumed, axes
ratio 20:8 A).
These plots illustrate the fundamental nature of the problem of attempting to optimize mac¬
roscopic electro-optic coefficient utilizing chromophores with increasing values of (.tß. The
linear increase of rr, evith N predicted at low chromophore loading is rapidly offset by the
[L,(/V2)]2 dependence of (cos30) which dominates at higher loading. Therefore, the param¬
eter |iß/MW is not unconditionally the figure-of-mcrit for second-order nonlinear optical
Nonlinear Optics of Molecules in Polymer Hosts
71
chiomophores. Theie is simply no way to avoid some 1 eduction m macroscopic electro-optic
activity associated with intermolecular electrostatic interactions.
One approach to minimizing the attenuation is to control the chromophore shape. Theory
shows that prolate ellipsoidal chromophore shapes are undesirable. Electro-optic activity is
theoretically piedicted to be considerable improved by adding inert substiluents to inhibit close
sicle-by-stde (along the mmoi axes of the prolate ellipsoids) approach of chromophores. Sim¬
ple modification with allvel substituents have been effectively employed m this evoik (mole¬
cules CLD-4 and CLD-5 m Table 2.7). Chromophores evith extended polyene bridges
protected by two or three fused ahexche se stems hae^e been prepared, yielding electro-optic
coefficients larger than 100 pm/V at 1064nm [102,103].
" Nonaiomattc hydiocaibon iing
Nonlinear Optics of Molecules in Polymer Hosts

72
4 Discussion and Conclusions (Part A)
4.1 Discussion
As shown in Section 3.2.1, the zwitterionic molecule series exhibits nonlinear optical coeffi¬
cients comparable to that of DRl although their |iß0 is almost double that of DRl (see Section
2.2.1). We attribute that to their very large ground state dipole moment An the order of |i =
13T0""9 Cm = 39 D- which facilitates the intermolecular electrostatic interactions and restricts
the poling efficiency. As depicted is Fig. 3.8, the molecular nonlinearity of molecules with
large dipole moment drastically deviate from the linear dependence versus molecular concen¬
tration. Although the chromophore loading eevas kept loev (= 3 wt.%) due to signs of aggrega¬
tion at higher concentrations, it may be already in the range where the deviation is significant.
In the case of the thiophene and phenyltetraene molecules the situation is getting more com¬
plex but reveals some interesting conclusions. We performed electro-optic measurements in
two polymers hosts (PMMA and PQ100) to investigate the influence of the environment to the
macroscopic performance of the molecules. In all cases eve notice that the electro-optic coeffi¬
cient is larger in PMMA. This is partially due to different polymer refractive indices and glasstransition temperatures (evhich require different poling temperatures) and partially clue to the
influence of the polymer environment to the poling efficiency. As it can be seen in (3.5), the
electro-optic coefficient is inversely proportional to /A.A difference of 0.2 between the refrac¬
tive indices in the two hosts can lead to changes in rv^ up to 64% in favor of PMMA. The
dependence is, however, more complex as the local field factors are also a function of n. The
higher glass transition temperature of PQ100 requires a higher poling temperature (77 = 190
°C) compared to PMMA (T ~ 100 °C) increasing, in this way, the thermal energy kT during
poling and reducing the poling efficiency. A further parameter influencing the poling process is
the polymer environment attributed to the different dielectric constants (ffmma = 2.3.
e?c?ioo _ 2.8) and reflected in the big red shifts of Xmax (up to 50 nm) observed in PQ100
compared to PMMA (see Table 3.2).
The carbon side-chain attached perpendicular to the main axis of molecule CLD-4 (see
Table 2.7) leads to a larger jiß0 as well as electro-optic coefficient compared to its plain ana¬
logue molecule CLD-1 in both polymer matrices. This is attributed to the ability of the side-
chain to keep neighboring molecules away from each other and thus reduce their intermolecu¬
lar interactions. Seen from the perspective discussed m Section 4, where the shape of the mol¬
ecule is considered, we notice that the carbon chain attached to the side of molecule CLD-4
changes the molecular shape and reduces the axes ratio, if the chromophore is considered an
ellipsoid. More spherical shapes, however, hinder the intermolecular interactions and lead to
larger macroscopic nonlinearities.
We note that although molecule CCI76 exhibits the largest p,ß0, its electro-optic coefficient
measured in PMMA is one of the lowest of the bithiophene series. We attribute this result to
the molecule's length increased by an additional double bonds in its rc-conjugate bridge com¬
pared to that of molecules CCI72/197/201. The extended length may cause the molecule to
fold preventing efficient polmg or can make the molecule susceptible to degradation under the
high field/temperature conditions during poling.We finally notice that especially for the molecules of the CC series the electro-optic coeffi¬
cients arc lower than one would expect from their large u.ß0. We can explain this difference
Discussion and Conclusions (Part A)

73
taking into account the intermolecular electrostatic interactions and especially the molecular
shape as these chromophores are quite long and deviate considerably from the optimal spheri¬
cal shape. As an example we present molecule CC172 which was simulated using the Cenus
v.3 I software (Molecular Simulations Company) and the MOPAC v.6.2 quantum mechanical
calculation package. Its shape (Fig. 4.1) has been determined by geometry optimization and its
ground state dipole moment (it = 2.4T0"- Cm) has been derived using AM 1 semi-empirical
calculations [104]. By placing the molecule in an ellipse (as shown in Fig. 4.1) the two length
of the two axes a = 28.8 À and b = 10 8 Ä were determined. Using these parameters, equation
(3.5) and the equations m Table 3.3, without adjusting any other parameter, the theoretical
curves for the electro-optic coefficient of CCI72 ecrsus molecular concentration were plotted
and compared to measured values m both polymer hosts (Fig. 4.2).
b = 10 8 A
a = 28 8 ACC172
Fig 4 1 Shape of molecule CC172 simulated using the quantum chemistiv softwaie Cenus The two
axes of an ellipsoid including the molecule cue found to be a=28 8 A and b= 10 8 Â
We note that if no interactions are considered the electro-opttc coefficients should be r^ =
40 pm/V for CC172 in PMMA and rVl = 33 pm/V m PQL00 for a loading of 15 wt.%. The
experimentally measured values are lower than 10 pm/V but very close to the values predicted
by the theory when intermolecular electrostatic interactions and the molecule's shajie are taken
into account. The electio-optic coefficients of molecules CCT97 and CC201, however, were
found to be m poor agreement with the theory. A peifect agreement between experiment and
theory is hindered by the fact that many parameters are not precisely defined. For example, the
molecules's shape and the dipole moment are calculated and the value of ß depends on the sol¬
vent used for the EFISH experiments and the method used to extrapolate the values at À =7907
nm to the wavelength of 1552 nm. In our case, the two leeel model was used without taking
into account the contributions of higher lying energy levels to the dispersion of ß. To obtain a
better comparison of experiment to theor> a concentration dependence of the electro-opttccoefficient is necessary as eeell as a more exact determination of some of the above parameters.
p,ß. for example, could be determined in a soleent with a polarity similar to the one of the host
polymer to restrict the influence of the eneironment and the ealue of riß at the wavelength of
the electro-optic measuiement could be determined using tevo oscillators and accounting for
mhomogeneous broadening.
Discussion and Conclusions (Part A)
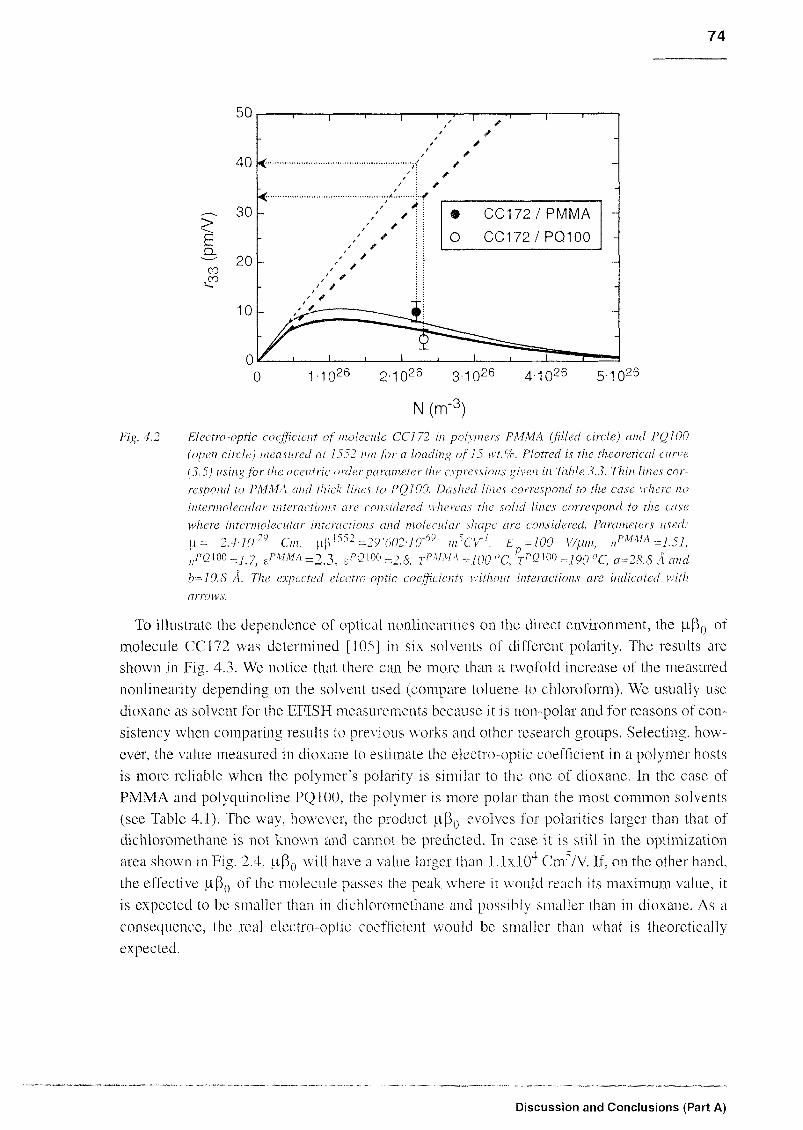
74
50
40 «
>
EQ.
CO
.CO
1 1 ' 1 T
*
;< •
/ ! '
:../
À9 CC172/PMMA
O CC172/PQ100
4-1026 5-1 O26
Fig. 4.2 Electro-optic coefficient of molecule CCI 72 in polymers PMMA (filled circle) and PQ100
(open circle) measured at 1552 nm for a loading of 15 wt.%. Plotted is the theoretical curve
(3.5) using for the acentric order parameter the expressions given in Table 3.3. Thin lines cor¬
respond to PMMA and thick lines to PQ100. Dashed lines correspond to the case where no
intermolecular interactions are considered whereas the solid lines correspond to the case
where intermolecular interactions and molecular shape arc considered. Parameters used:
(i= 2.4-10'29 Cm, uiS^52=29'602d<P69 ii/CV1, E =100 V/pm, nrMMA =1.51
/A>ioo=ii7i ,pmm.\=23. AÖ100=2.7 Tpx»"=100°C.PTpQm=l90"C, a=28.8 Ä and
b=l0.8 A. The expected electro-optic coefficients without interactions arc indicated with
arrows.
To illustrate the dependence of optical nonlinearities on the direct environment, the ttß0 of
molecule CC172 evas determined [105] in six solvents of different polarity. The results are
shown in Fig. 4.3. We notice that there can be more than a twofold increase of the measured
nonlinearity depending on the solvent used (compare toluene to chloroform). We usually use
dioxane as solvent for the EF1SH measurements because it is non-polar and for reasons of con¬
sistency when comparing results to previous works and other research groups. Selecting, how¬
ever, the value measured in dioxane to estimate the electro-optic coefficient in a polymer hosts
is more reliable when the polymer's polarity is similar to the one of dioxane. In the case of
PMMA and polyquinoline PQ100. the polymer is more polar than the most common solvents
(see Table 4.1). The way, however, the product |iß0 evolves for polarities larger than that of
dichloromethane is not known and cannot be predicted. In case it is still in the optimization
area shoevn in Fig. 2.4, ttß0 will have a value larger than I. Ix 104 Cm5/V. If, on the other hand,
the effective p,ß() of the molecule passes the peak where it evould reach its maximum value, it
is expected to be smaller than in dichloromethane and possibly smaller than in dioxane. As a
consequence, the real electro-optic coefficient evould be smaller than what is theoretically
expected.
Discussion and Conclusions (Part A)

75
tabled 1 Normalized polar it\ parameter E!f of selected solvents (those used m Fig 4 3) and polymer s (shaded
tows) Values cue taken fiom lefeieuces [93,94] The exact value foi polycjumoline is not known Foi
the definition of Ej, see footnote of Table 2 3
Solvent / Polymer Normalized polarity FyN
Carbon tetrachloride 0 05
Toluene 0.10
Dioxane 0 16
Tffl- 0 21
Chloroform 0 26
Dichloromethane 0.31
Polymethylmethacrylate 0.41
Polyquinoline >0.41
>
o
CO.
Dichloromethane
v
O 8.0 103-
4.0 103„
PMMA
Normalized polarity ETN
Fig 4 ? |ißj-, of'molecule CC172 mcasuied in different soh ents \ et sus the normalized polcuttx £yof the soh ents /he molec uleti bond length alte rnation (BL \) decreases for me leasing soh cut
polarity I he increase of llfA therefore with increasing sohent polaiil) indicates that mole¬
cule CC172 has a positne BI \ and lies in the shaded aica of frig 2 / Data taken font Ref
[105] The solid line is a guide to the exe
Discussion and Conclusions (Part A)
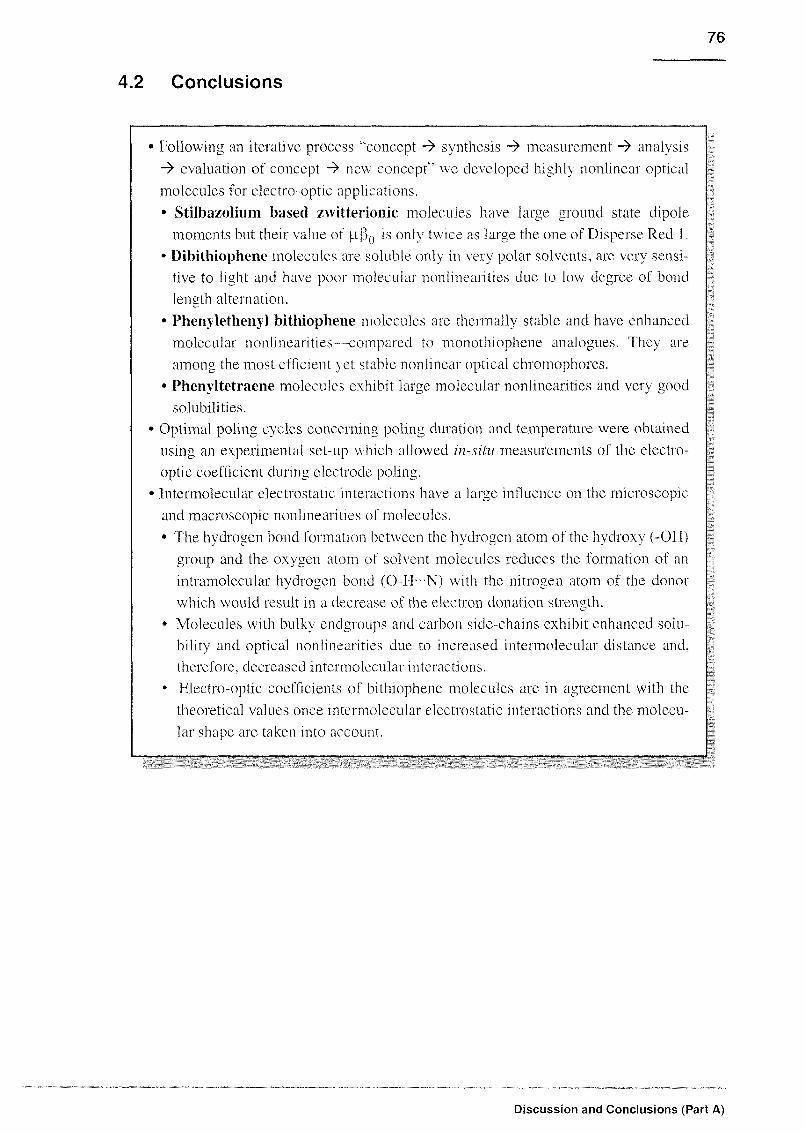
.2 Conclusions
• Following an iterative process "concept -> synthesis -> measurement -> analysis
-> evaluation of concept -> new concept"' eve developed highly nonlinear optical
molecules for electro-optic applications.• Stilbazolium based zwitterionic molecules have large ground state dipole
moments but their value of jaß() is only twice as large the one of Disperse Red 1
• Dibithiophene molecules ate soluble only in eery polar solvents, are very sensi¬
tive to light and have poor molecular nonhnearities due to low degree of bond
length alternation.
• Phenylethenyl bithiophene molecules are thermally stable and have enhanced
molecular nonhneai ities—compaied to monothiophcne analogues. They are
among the most efficient \et stable nonlinear optical chromophores.• Phenyltetraene molecules exhibit large molecular nonhnearities and very good
solubilities.
• Optimal polmg cycles concerning polmg duration and temperature were obtained
using an experimental set-up which alloevcd m-situ measurements of the electro-
optic coefficient during electrode polmg.• Intermolecular electrostatic interactions have a large influence on the microscopic
and macroscopic nonhnearities of molecules.
• The hydrogen bond formation between the hydrogen atom of the hydroxy (-OFÏ)
group and the oxygen atom of solvent molecules reduces the formation ot an
intramolecular hydrogen bond (0-IF--N) with the nitrogen atom of the donor
which evould result m a decrease of the electron donation strength.• Molecules with bulky endgroups and carbon side-chains exhibit enhanced solu¬
bility and optical nonlinearities due to increased intermolecular distance and,
therefore, decreased intermolecular interactions.
• Electro-optic coefficients of bithiophene molecules are in agreement with the
theoretical values once intermolecular electrostatic interactions and the molecu¬
lar shape are taken into account.
Discussion and Conclusions (Part A)

77
Part B: UV-Photobleaching Mechanisms of
Side-Chain Polyimide A-95.11
Photobleaching is an attractive method for fabricating optical channel waveguides m nonlin¬
ear optical polymers [106-109], particularly because ol the simple processing and the possibil¬
ity to adjust the effective refractive indices of the evaveguide precisely by choosing suitable
bleaching parameters. The nonlinear optical polymer adjacent to the anticipated waveguide
channel is irradiated by light that transforms the nonlinear optical chromophores m a state of
altered polarizabihty. The underlying photochemical processes are trans-eis isomerization and/
or photo-oxidation and/or photoreduction (see Fig. 5.2) which lead to an irreversible degrada¬
tion of the chromophores and thus to a permanent index change. We use photobleaching m this
work for forming channel evaveguides and Mach-Zehndei interferometer structures for electro-
optic modulators (see Chapter 10.3). The aim of this chapter is to study the effect of ultra-vio¬
let illumination on the
-thickness
- scattering losses
- UV-Vis and 1R absorption- refractive index
of the A-95.11 Sandoz polyimide system (polymer P22 in Table 1.6; also shown m Fig. 4.4)
used for electro-optic applications. Moreover, the different processes involved m the pho-
tobleacfung are qualitatively and quantitatively determined.
77, =137 °C
p = 1.4 grcm"'
MW = 456 g-moi"1
«6Vl = I 84
»13l3=1.66
amc,x _ 1.35-105 cm-
Glass transition tempeiature
Polymer density
Molecular weight ot the molecule
Refractive index at 633nm
Refractive index at 1313nm
Maximum absorption (7=497nm)
frig 4 4 Stiucttne of the of the studied \ 9* II pohinude Shaded is the nonlinear optically active
part In the table on the light some of the propanes of the pohrner are gn en

78
5 UV-Photoînduced Changes
5.1 Film Thickness Changes
Polymci films of several thicknesses ranging from 300 nm to 4000 nm were illuminated with
a mercury lamp and thickness changes were determined using an a-step profilometer (Tencor
Instruments a-Step 200). Film thickness reduction up to 20 nm was measured after long illu¬
mination times. This effect is attributed to small size moieties, resulting from the photobleach¬
ing process (see Section 5 2), evhich can more easily leave the film's surface. A further reason
is a contraction ol the film based on the change of the dimensions between the eis and trans
form of the azo chromophores (see Fig. 5.2). The isomeri/ation process Irom the trans to the
eis form involves a decrease in the distance between the para carbon atoms (see Fig. 5.1) from
about 9.0 to 5 5 Â [110]. As the chromophore is part of a polymer network, the change m the
conformation of the azo chromophore causes a change in the conformation of an adjacent seg¬
ment which is considered to be the mam effect responsible for the contraction. Such an effect
has already been described for azo-aiomatic chromophores attached to the backbone of a
partly crystalline polyimide [111].
Trans Cis
Fig. 5 J Decrease of the distance of the para carbon atoms of a stilbene analogue molecule due to
trans as isomerization
5.2 Ultraviolet-Visible (UV-Vis) Absorption Spectrum
Most of the information about the photobleaching piocess is provided by the 17 V-Vis absorp¬
tion spectrum of a film and its change during illumination. A thin film of polyimide A-95.11
has been illuminated for 190 mm with a mercury lamp (350 W) and its spectrum evas recorded
at several time intervals evith a spectrometer (Perkm Elmer. Lambda 9). The spectrum changes
significantly mainly at the eeaeelength of maximum absorption (497 nm) eehere the peak com¬
pletely disappears at the end and at a lower wavelength (377 nm) eehere a ncev peak appears
and then again disappears. At lower evavelengths (225-275 nm) there is also a moderate
increase of the absorption (see Fig 5 2) We attnbutc the peak at 497 nm to the trans-TE iso-
UV-Photoinduced Changes
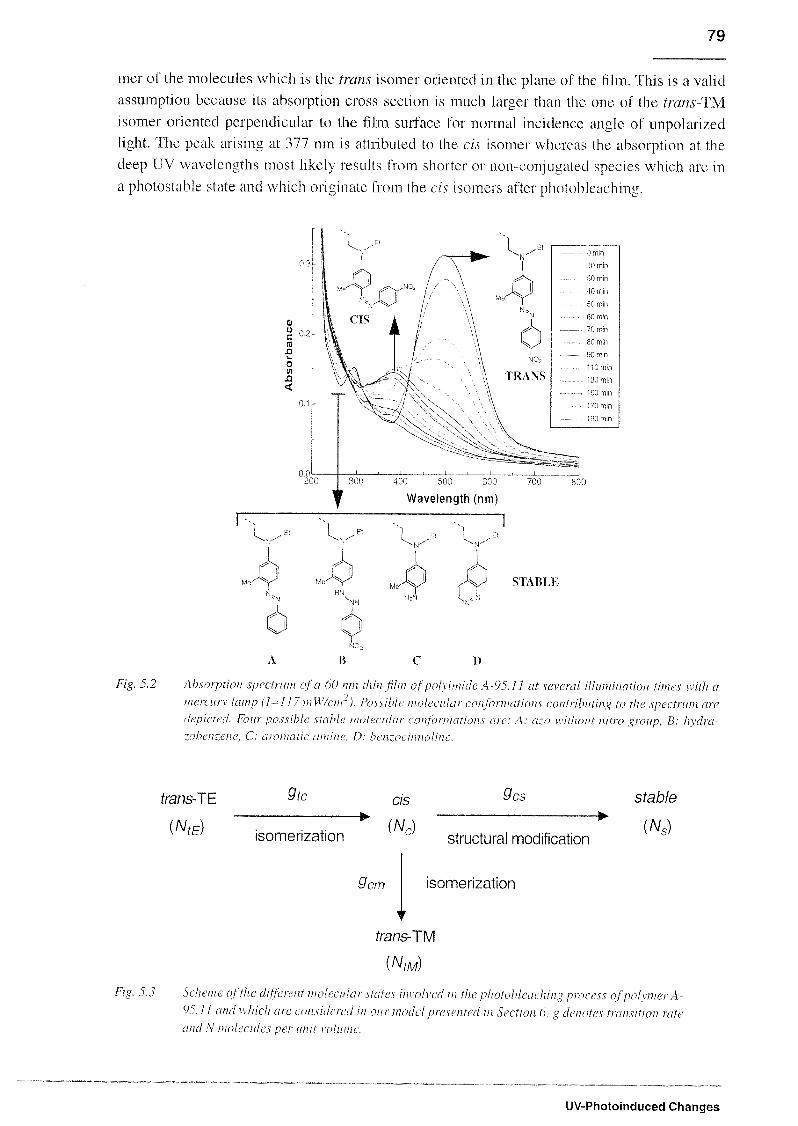
79
mer of the molecules which is the trans isomei oriented m the plane of the film. This is a valid
assumption because its absorption cross section is much largei than the one of the trans-TM
isomer oriented perpendicular to the film surface for normal incidence angle of unpolarized
light. The peak arising at 377 nm is attributed to the eis isomer wheieas the absorption at the
deep UV wavelengths most likely results from shoitei or non-conjugated species which are in
a photostable state and which originate fiom the as isomei s after photobleaching
4Û0 500 600
Wavelength (nm)
STABLE
R C T)
Fig. 5.2 Absorption spectrum of ei 60 nm thin film of pohimide \ 95 11 at several illumination times with a
meicuix lamp (1=117 mW/cm") Possible moleculai conformations contributing to the. spectrum aie
deputed Four possible stable molecular eonfoimations are \ azo without ratio group, B hydra-
zobenzene C aromatic amine D baizoc innolme
trans-TE 9tc
isomerization
CIS
(Nc)
9cm
9,cs
structural modification
stable
(Ns)
isomerization
Fig 5 3
trans-TM
(AW)
Scheme of the diIfen nt molec ulai state s un oh tel in the pliotobleacliing proc eyv ofpohmei A
95 11 and which aie considered in our model presented m Section 6 g denotes transition late
and N mole c tiles per unit \ olunu
UV-Photoinduced Changes

80
We can describe the photomduced changes as follows. The trans-TE isomers undergo ini¬
tially a photoisomcnzation and transform to eis isomers, thus explaining the reduction of the
497 nm peak and the initial increase of the 377 nm peak. The existence of an isosbestic point at
around 420 nm for short illumination times (less than 50 mm) suggests a pseudo-stoichiomet-ric transition. It is not a pure stoichiometric one because eis isomers undergo at the same time
photodegradahon and a photoisomenzation to a trans-TM state. These two transitions become
significant only after the eis isomer population reaches a certain size. After this point the isos¬
bestic point disappears, the eis isomer peak at 377 nm increases, reaches a maximum when the
flow of molecules entering the eis state is equal to the floee of molecules leaving it, and then it
decreases again to its initial level. The peaks emerging at lower wavelengths (225-275 nm) are
due to stable molecules resulting horn the photodegradation of the eis isomers. The exact
structure of these molecules is not known. A Il-NMR spectroscopic analysis could not pro¬
vide any useful insight due to large line eeidths. We performed, however, FT-IR spectroscopic
analysis which revealed a degradation ot the azo bond and the nitro pending group (see Section
5.3). Four of the possible stable conformations are depicted in Fig. 5.2. A possible degradationmechanism was suggested by Ahlheim et al. [112) who showed that possibly the hydrogenabstraction from the polymer by the azo linkage of the chromophore leads to the formation of
the hydra/yl radical, evhich may be subsequently reduced to the colorless hydrazobenzene
compound (conformation B m Fig. 5 2). The partially reduced hydra/yl radical may also fur¬
ther cychze to form the corresponding benzocmnolme (compound D in Fig. 5.2). Earlier
reports [113] and recent studies m our group [114] show eel that an important photodegradahon
process in electro-optic polymers is photo-oxidation. Due to the absorption of a photon the azo
bond is excited and an oxidation takes place resulting to a compound similar to the one named
C m Fig. 5 2.
Although most of the reported studies of photobleaching processes up to now deal evith sin¬
gle transitions, the above described tevo-step parallel reaction ee as also reported by Watanabe et
al. [If5] who revealed a tevo-step change of side-chain type polymer films by UV irradiation,
and by Nakanishi et a\. [107] who obsereed a similar concurrent two-step reaction for DRl-
type side-chain polymers. To investigate whether our qualitatively description of the process is
valid or not, how evell it correlates to the experimental data, and to find out evhat matenal
parameters can be quantitatively deduced from the absorption measurements of Fig. 5.2. the
model described m Section 6 was dee eloped.
5.3 Fourier Transform Infrared (FT-IR) Spectra
The FT-IR spectra of around 4 8 p.m thin films illuminated foi 4 5 and 12 hours as evell as
that of an unbleached one were measured, and the absoibance of the N=N peak at 1600 cm
and the N02 peak at 1336 cm"1 eeas determined (see Fig. 5 4) using the absorption peak at
1729cm [, corresponding to the C-0 stretching vibration m the polymer backbone as a refer¬
ence [113] We observe that photobleaching has a larger influence on ]S02 -22% decrease after
12 hours- than on the N=N bond -67 decrease after 12 hours. This result indicates that the sta¬
ble state of the molecules may be the one without the nitro group (compound A in Fig. 5.2) as
well as the one evith the open azo bond (compound B in Fig. 5 2)
UV-Photoinduced Changes

81
o
z.
CDO
C
03jD
OOTJZZâ
<
07
N=N (1600 cm1)
N02 (1336cm ')
0 122 4 6 8 10
Illumination time (h)
frig. 5.4 fr FIR absoi bam e of the N= V (7600 cm') and N02 (Hiöc m"1) peaks of a 4 8 pin thin fini of
pohirrude A-95 11 before and after illumination with a meicuiy lamp (1=40 mW/cnr) foi 12
hour s
5.4 Refractive Index Changes
Mercury lamp
Photodiode
NF
Polymer film
Fused silica substrate
with etched grating
PR Laser X=1 55cim
Fig 5 5 Experimental set-up for in-situ measurement of the film's lefiactive index Dining UV illumi¬
nation w itli the meicuix lamp, the coupling angles are detected in transmission by performing
an angle scan at scxeral tune intenah 1PF #G ? low pass filtei to block the infra red region
of the lamp spectrum and piexent heating of the sample NF neutral filtei, L 100mm lens,
RS rotation stage P polanzei PR polcnization totettor
The TE and TM refractive indices were measured at 7=1552 nm in-situ during unpolarized
UV illumination and using the grating coupling technique (see Fig. 5.5). This technique is
based on wave vector compensation by using a diffraction grating on the boundary of a
waveguide. The diffraction equation is gieen by
2tcat 2tc,,
2rt„—-JV + — smO, = —KX K A
(57)
with A,0 the wavelength of light in \acuum used for coupling, N the effective refractive index
of the coupled mode, 0( the incidence angle evhere coupling occurs, A the grating period, and
K (fv=±l,±2,±3...) the diffraction order of the gratins. When the diflracted wave vector"'Tt
^
matches the propagation constant 7-N, the K Th diffracted order evill couple to the evaveguideAA
UV-Photoinduced Changes

82
mode. The transmission decreases corresponding to the excitation of a mode. For each
waveguide mode eve have a coupling incidence angle 0,which can be measured, and an effec¬
tive refractive index N which can be calculated using (5.1) and which depends on the refrac¬
tive index of the guiding layer (see Section 8.1.1). During UV illumination with the mercury
lamp, the coupling angles of the incident infrared laser beam are detected in transmission by-
performing an angle scan at several time intervals for both p and s polarized light. A mode
analysis (see Section 8.1.1) yields the TE and TM refractive indices of the film.
A decrease of the TE refractive index of An=7xl(TJ and an increase of the TM refractive
index of An=6xlO° after long illumination times was measured (see Fig. 5.6). This is attrib¬
uted to the trans-eis isomerization eehich alloevs the molecules to orient in the more favorable
direction which is perpendicular to the film surface (seen by the TM modes) rather than paral¬
lel to the film surface (seen by the 'TE modes). A quantitative discussion of the refractive index
changes is given in Section 7.
1 665
X0)
a
E
0) 1 660>
'*-*Ümi~
% 1 655
CC
1 6500 50 100 150 200
Illumination time (min)
Fig. 5.6 FE and FM refractive indices at 1552 nm of a 2.84 pin thin film ofpoh imidcA-95.11 after several
illumination times with a mercury lamp (1=117 mW/cnr). The refractive indices were measured
using a grating period ofA=767 nm etched on fused silica. The solid line is the theoretical curve
(7.5) using the parameters given in Table 6.1 derived from the model described in Section 6. The
clashed line is an exponential used as a guide ter the eve (see Section 7).
5.5 Scattering Losses
Scattering loss measurements were performed using 4.5 to 5 (.tin thin films on glass sub¬
strates. The samples were illuminated for 4.5 and 12 hours evith a mercury lamp (7=40 mW/
cm") and the prism coupling method was used at 7 = 1313 nm to couple light into the planar
evaveguide. The losses were determined by imaging the light scattered onto a CCD camera (see
also Fig. 11.6).
The scattering losses show an increase from 2 dB/cm to about 3.5 dB/cm after 12 hours illu¬
mination (see Fig. 5.7). Preeious studies on DR1/PMMA side-chain copolymers have shoevn
that scattering losses are mainly due to surface roughness (mis of 0.3 nm increased to 2 nm
after photobleaching) induced by low molar mass fragments gasing out from inside the poly¬
mer film during bleaching [116].
• nTE
o nTM
f i—i
UV-Photoinduced Changes
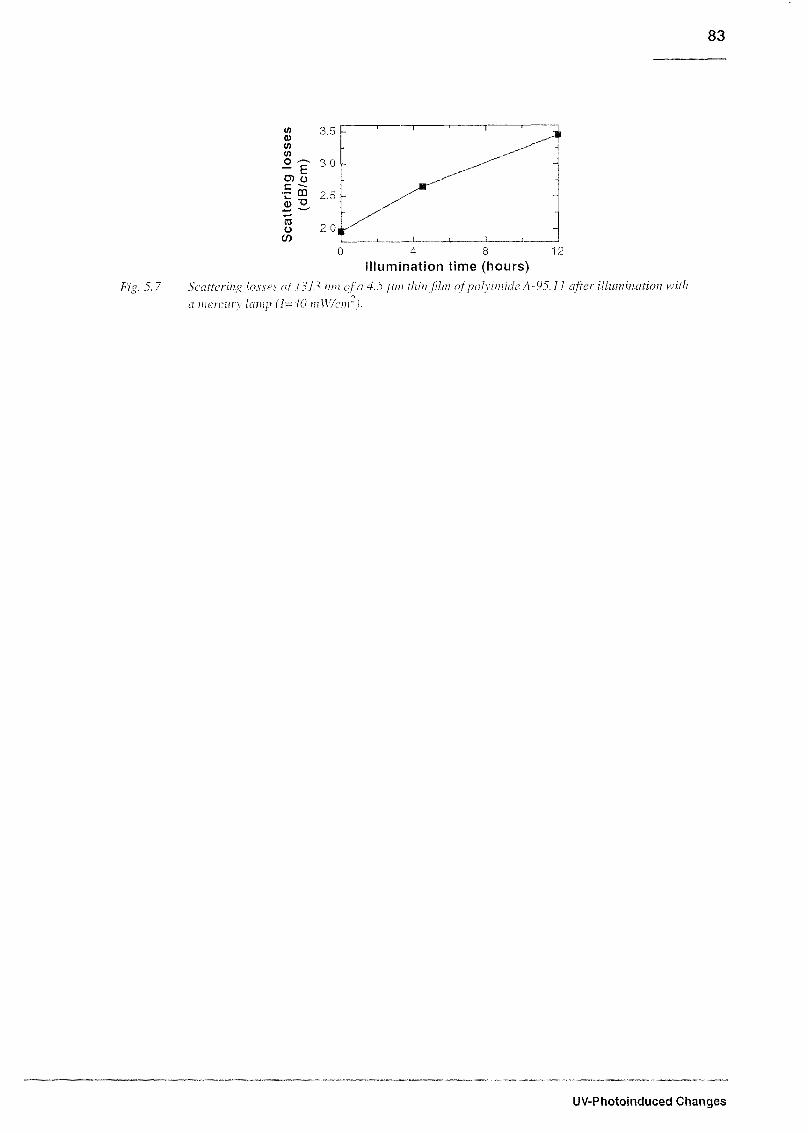
83
m
<u
w</>
o
fco Or "-.«,
0)
m
uw
*-*
TOO
C/>
Fig 5 7
4 8 12
Illumination time (hours)
Scattering losses at Id 1 run of a 4 5 urn thin film ofpohiniide A 95 11 afta illumination viith
a mcicutx lamp {1=40 in\\ A m )
UV-Photoinduced Changes

84
6 Photobleaching Model
The photochemical reactions of dyes have been studied for more than four decades due to
their importance for the textile industry. An interest in such reactions in solids like polymer
thin films arose already 40 years ago but a mathematical description of the dynamics of such
processes was not developed in parallel. Such a description is complicated by the fact that the
reactant molecules cannot readily diffuse in a solid sample, and a concentration gradient is
therefore created by the photochemical reaction. An exact solution was first given by Simmons
[ 117] in 1971 which described the rate of a photochemical reaction of a solid layer for the case
in which the photoproducts are transparent. Simmons considered a single step reaction, an
assumption that remained for most of the models developed thereafter. In 1972 Kaminow et al.
[118] extended the model for the cases of rsotropic and axial molecules, determined bleaching
rates of three different dyes in PMMA and epoxy resin, and showed that the bleaching rate is
linearly proportional to the intensity of incident radiation, indicating that photobleaching is a
one-photon process. Watanabe et al. [115] investigated the bleaching behavior of azo dyes
attached to polyurcthanes and suggested a two-step reaction. They assumed three states: an ini¬
tial trans state (T), a eis state (C) and a thermally and photochemically stable state (S). They
defined the first reaction step as trans-eis isomerization and the second one as photobleaching
step. They assumed, however, that the second step only starts after the first one is finished,
something that requires both steps to be first-order reactions, which corresponds to a linear
change of the absorption peaks with time. This assumption evas not confirmed by experiment.
For a total bleaching time of 60 min, they observed a linear change for the first step only within
the first 5 min. For the second one the linear relationship only appeared after 10 minutes of
illumination. This indicates that the two processes are not successive but concurrent. Palchctti
et al. [108] used the existing model to analyze the bleaching process of side-chain polyttre-thanes and concluded that this model (based on the work of Simmons and Kaminow) could be
used to predict the evolution of the bleaching of thin films and of thick films, but only at the
initial steps of the exposure. Ma et ed. [119] suggested in 1995 a phcnomenological bleaching
model based on the hypothesis that the decay of chromophores in polymer matrices is not
purely an exponential function of time but is a dispersive chemical reaction. Their model was
able to predict optical index profiles for pholobleached polymer films, but it showed good
agreement with experiments only for short enough bleaching times. Nakanishi et al. [107]
investigated the photobleaching of DRl-doped polymer films and came to the same conclusion
as Watanabe, that the photobleaching involves tevo reaction steps (trans-eis isomerization and
photodegradation) which are. nevertheless, concurrent and not successive.
In this work, we develop a model evhich is consistent with the whole bleaching process,
which includes all three states (trans, eis and stable) and evhich accounts for optical anisotropy
induced by trans-eis isomerization. Although its validity is limited to thin films where an uncle-
pletcd light intensity is assumed, it is a first attempt to address the state transitions as a whole
and provide at the same time quantitative results about relevant material parameters. Our
model is described in the following paragraphs.We consider four possible states for the absorbing molecules: a trans state with NtE mole¬
cules per unit volume oriented in the plane of the film (trans-TE) at time t, a trans state with
NtM molecules per unit volume oriented perpendicular to the plane of the film (trans-TM) at
time t, a eis state with Nc molecules per unit volume at time t and a stable state with N mol-
Photobleaching Model

85
ecules per unit volume at time t. We assume that at time / = 0 all molecules are in the trans
state (NtE(t=0) = NfE, NtM(t=0) = N?M, Nc(t=0) = Ns(t=0) = 0). Under unpolarizedillumination the trans-TE molecules undergo isomerization and move to the eis state with a
transition rate gt .Part of the molecules in the eis state undergo once again an isomerization
and move to the energetically favorable trans-TM state with a transition rate gcm and part of
them experience structural changes evith a transition rate gcs and go to a stable state (see also
scheme in Fig. 5.3).
The transition equations for the number of molecules at each state are the following:
dNlETt =-*Ä trans-TE (6.1)
dNr—
C= O N n-(o + Q
)N
jt ^tclytL V<>«T 7)7" cCIS (6.2)
dN,_
s= e N
dt&" c
stable (6.3)
dN
TttM
e No cm c
trans-TM (6.4)
where
Stc'StE-^c = -$tc°,ET (6.5)
Scs-8c->s = ~yY,AV (6.6)
8cm-8c-^tM = ^cin^c1 (6.7)
are the trans-TE^eis, cis~^stabk\ and cis^ trans-TM. transition rates [s ], respectively, with
c|) the quantum yield [W s ], er the absorption cross section [irr] and I the light intensity [Wm ]. The trans-TE-^-eis transition is in our case irreversible and therefore a cis-^trans-TE
transition is not considered. Wc also assume that no direct transition from the trans-TE, to the
stable state is possible, due to larger energy difference, and that the light intensity is the same
at 377 nm and 497 nm (Fig. 6.1).
This assumption was experimentally confirmed by measuring the absorption spectrum of bleachedfilms after storing the films for one month at room temperature or for 5 hours at 100 °C. In both cases
only minor changes of the spectrum \\ ere observed.
Photobleaching Model

86
-S->>
'ena
B
300 400
Wavelength (nm)
500
Fig. Ord Illumination spec triim of a mercury lamp. Indicated are the absorption peaks of the trans-Tls
state (497 nm) and the e is stale (377 nm).
Solving the above transition equations evith the initial condition
N,E + Nc + Ns + NtM = N?E+N?t (6.8)
we obtain the following solutions
N,E = Nfce-'' (6.9)
A = A7•s <^(hi
- O - e ) (6.10)
A\ = N?E><-', s
+ ?, ,
fV, H'.JI
-.fo-^,,,
(6.L
N„U = N){,+N?p\l —-LL-
-!?,„,-St . C\„, *-?,7U-<-,?,,„-.<;, 7,.,-(';,,„+?,,)' (6.12)
for£,(-£,s-(Ct,„*0.We need, however, to find the transition equations for the absorbance as this is what we can
experimentally measure. The absorbance Al (i = tE, c, s, tM) of the molecules in every state /
is given by
7, = of.N, (6.13)
evith L the film thickness. Equation (6.13) is valid tinder the following assumptions:
- the thickness remains constant in time (partially true as shoevn in Section 5.1)
- the light intensity is constant in the material, an assumption valid only for very thin films.
In this case, equations (6.9) and (670) using (6.13) give the absorbance of the trans-TE and
the eis state:
Photobleaching Model

87
Ath = A?Le-*"'
a -W(M
rr
'~
!L\0r
<> — o —
'*> e 111
(e-(?,, + ? „)'
(6.14)
(6.15)
ŒBGand AcBG ireevith A /e = otELN tE the initial absorption of the trans-TE state. If A
the background absorbaiices of the polymer backbone at the evavelength of maximum absorp¬tion of the trans-TE and the eis state respectively, the measured total absorbaiices A"'L and Acare:
a';e = a^^+a
a: =AOj
a,
tE \o.
IBG
*le
tt' 8,ey — e>
o7?[S + ?im)^
) + A, BG
trans-TE state (6.16)
as state (6.17)
Fig. 6.2 shows the evolution of the trans-TE and eis absorption peaks as a function of illumi¬
nation time (data obtained from the spectra of Fig. 5.2) and the theoretical curves predicted byour model and given by equations (6.16) and (6.177 The parameters given in Table 6.1 could
be determined in this way.
9 Peak at 497nm (frans-TE)
m
AtE
O Peak at 377nm (as)
0 50 100 150 200
Illumination time (min)
Fig 02 Alnoibame of the 497 nm (tilled aides} and the F77 nm (open aides) peaks of a 60 nm thm
film of pohumdc \-9s U at \aiious illumination tunes with a nieianx lamp (1-117 mWI
cnr) Data points ene obtained pom Fig 5 2 The full and dotted lines cue the theoretical
curies fetpiations to lb) audio I7).iespetti\eh/ danedporn oui model
Photobleaching Model

88
Table6.1
Values
ofphotobleachmg
relatedparametersdeternimedfromourmodel
using
(6.16),(6.17)
and
the
experimentaldataof
Fig.6.2.
abs.crosssection
{eisstate)
/°c
abs.crosssection(trans-TE
state)alE
Irans-TE-^eistransitionrate
perunitintensity
(=bleachingconstant)
(cis-^stable+ch-^trans-TM)
transitionrateperunitintensity
trans-TE-^cistransitionrate
(c/7->stable+
cis->//YmLv-TM)
transitionrate
initialabsorbanceoftrans-TE
state
backgroundabsorbanceofthe
polymerbackbone
atthewave¬
lengthofmaximum
absorptionof
thetrans-TE,
state
backgroundabsorbanceofthe
polymerbackbone
atthewave¬
lengthofmaximum
absorptionof
the
eisstate
~>te7
=BC
(7rs+.?W
£>tc
tt
+o
A,
AtBG
AcBCr
0.6870.03
2.00+0.15-10~4cm2-min"'
-mW
=3.30+0.25-10-7nAr1
t.35+0.13-10~4cm2-min"1-m'W1
=2.23±0.15-10"7m2-J"1
2.33±0.1770'2min
1.56+0.18-10~2min
'
0.29+0.01
3.28+0.56-10"
Material
parameters
5.65+0.56-10-2
For
/=
117
mW/cnr
For
L=
60nm
PhotobleachingModel

89
7 Discussion and Conclusions (Part B)
7.1 Discussion
As it can be seen in Fig. 6.2, there is a very good agreement between the experimental data
and the theoretical curves derieed from our model. Not only the decay of the trans isomer peak
can be reproduced, but also —for the first time— the behavior of the eis isomer peak. From
Fig. 6.2 the material parameter o( /otE can directly be determined. We notice that the absorp¬
tion cross section of the eis isomer is 68% of the one of the trans isomer. Moreover, the transi¬
tion rates g[( (transition rate to the eis state) and gc^ + gcm (transition rate out of the eis state)
can be deduced. However, the individual rates g and gnn cannot be determined. This is
because we have no means of separating the two processes of cis~^ trans-TM photoisomeriza-
tion and eis-^stable photodegraclation. As the trans-TM state is expected to have a low absorp¬
tion cross section, it can also be considered as a possible stable state like the ones depicted in
Fig. 5.2.
The transition rates per unit light intensity g 71, also known as bleaching constant (BC), can
also be determined for both transitions evhich means that, provided the same light source is
used, the transition rates for any light intensity of the source can be estimated. The bleaching
constant for polymer A-95.11 has been determined in a previous work in a similar way using a
simplified version of our model and correcting for reflections at the interfaces [120]. The value
_7 1 „7 0
obtained there (BC = 2.9-10 ni~/J) is very close to the value of 3.3-10 m7J determined in
this evork. The bleaching constant is the main parameter required to simulate the refractive
index profile of photobleached polymer films (see Chapter 8.2).
To explain the evolution of the refractive indices during bleaching we first obtain the relation
between refractive index and chromophore concentration as follows. The real part of the linear
susceptibility y}^ -taking into account only the contribution from the chromophores and not
from the polymer- is proportional to the chromophore concentration N
Re{x(l)}<*N (7.1)
and related to the complex refractive index ri (q = n + /k ) through
x(n = T|^-l=>/?<'{x(n} = »2-A K-. (7.2)
Outside the absorption band of the material we have n1 - I » k2 and equations (7.1) and (7.2)
lead to
„2-] CC.V^/A 3C,V. (7.3)
Considering tevo oscillators (one for the host material and one for the chromophore) the TE and
TM refractive indices are related to the chromophore concentration through 1116]
'ht = l^t)2 + W^2-0^)2& (7.4)'V /V
tE
Discussion and Conclusions (Part B)

90
»= Ww)2 + [W)2-("orM)2]^ (7-5)A/ N
IM
evhere //^ (i=TE, TM) is the refractive index before bleaching and n'hl (i=TE, TM) is the
refractive index after complete bleaching. Using (7.4), (6.9) and gh =2.33-KT2 min"1 derived
from our model, the TE refractive index change could be reproduced (solid line in Fig. 5.6) in
very good agreement with the measured data. The initial and final values of the refractive index
where found to be /z(f = 1.6602 and z?^ =1.6545, respectively. The change of the TM refractive
index, however, cannot be quantitatively reproduced using (7.5) and (6.12) because parameters
gcs and gcm are not independently known.
7.2 Conclusions
• Scattering losses were found to increase after photobleaching. This is to be
considered when long illumination times are needed for evaveguide structur¬
ing,• The changes of the TE and TM refractive indices were measured and an
induced birefringence was observed resulting from the trans-TE -ïcis-ïtrans-
TM isomerization allowing the molecules to orient along a favorable direction.
• A model including the photomduced birefringence resulting from two isomer-
izations and considering a tevo-step photobleaching process has been devel¬
oped.• With this model not only the trans-TE-^eis transition rate can be determined
but also the sum of cATKstable and eis-^trans-TM transition rates.
• Material parameters like absorption cross section ratio for the eis and the
trans-TE state, and the material's bleaching constant can also be determined
only from absorption spectra measurements and the developed model.
• FT-IR measurements showed that two of the possible conformations constitut¬
ing the stable state can be the absence of the nitro group and the opening of the
double azo bond of the attached nonlinear optical molecule.
Discussion and Conclusions (Part B)
91
Part C: Polyimide-Based Electro-Optic Modulators
The second part of this work is concentrated on the fabrication of prototype phase and
Mach-Zehnder electro-optic modulators based on the active side-chain SANDOZ A-95.11
polyimide and commercial buffer materials. Prior to device fabrication several of the involved
steps such as film spinning, waveguide structuring, electrode structuring, and end-fire coupling
had to be mastered and standardized.
Beam propagation computer simulations were performed to simulate the performance of
various Mach-Zehnder designs and to determine critical design parameters (e.g. Y-branch
angle, waveguide evidth) and non-critical ones (e.g. distance between arms). New photolitho¬
graphic masks evith optimized evaveguide and electrode structures were designed and fabri¬
cated.
In the following sections an introduction to the theory of optical waveguides and electro-
optic modulators is given and the fabrication and characterization of phase and Mach-Zehnder
modulators using the polyimide A-95.11 is described.

92
8 Theory of Optical Waveguides
8.1 Planar Waveguides
8.1.1 Ray Optics Theory of Planar Waveguides
Let us consider a thin film of refractive index nf between a substrate with refractive index
ns and a cover layer of re frac tree index ric ,with /;( < tp< n , .
cover C nc<nf
substrate S nc < ns < nf
Fig. 8 1 Side i tew of a planar was egiude with the guided mode a s a total i eflec ted beam.
In the ray optics theory, the propagation of light m a planar evaveguide is regarded as a beam
which is totally reflected at the boundary surfaces of the guiding layer (see Fig. 8.1). The total
reflection angle at the boundary of teeo isotropic, homogeneous media evithout losses and evith
refractive indices n, and //-, is given by
sin ft, =
n-,
(8.1)
With t) the incidence angle onto the boundary surface, total reflection occurs when ft > ft.
Fig 8 2 Propagation \ ce toi s ol a w a\ e trie nient to tltc boiindcn s smfac e of two media with refreu tivc
indices n^ and n -, I lie uu idenee and reflection angle is i) and the transmission angle is i)'
In the case of total reflection, the reflection coefficient R becomes complex with jA'j =1 and
can be written as R = exp(2/((A. From the Fresnel equations it can be shown that c|> repre¬
sents a phase shift at the boundatx surface and leads to a shift (Goos-Hänchen) of the reflected
beam, the tangent ot this phase shin for the TE and the TM modes is the following (valid onl>
for non-tilted indicatnx):
Theory of Optical Waveguides

93
1.1 2
«]" sin 0 - iptancp,, = —-—= and (8.2)
"-n
|cos t)
n\ dn\ suAO - n-,
tancp7V/ = — :t7k—=. (8.3)
J"
,A h,cos\)
More precisely, the light propagation is considered as a superposition of tevo planar waves
with a propagation vector following the beam shown in Fig. 8.1. These waves are monochro¬
matic and coherent with frequence to and evavelength 7. The propagation vector is kn+
evith
o Jt (Ok = ^ = -
. (8.4)7 e
For guided modes in a planar waveguide evith field amplitude
exp[-ikn A±.vcosf) + ssinf))] a propagation constant ß evith phase velocity v is defined
through
ß = — = /o//, sin ft, (8.5)
VP
corresponding to the r-component of the propagation vector kn,. To show that there is only a
discrete number of angles it evhich lead to guided modes, eve consider the phase shift at
z = const. when a wave moves from v = 0 to .v = d and back. On each propagation dis¬
tance, a phase shift of kit .clcosi) is induced. Due to total reflection, there is an additional
phase shift of —2cps at the lower boundary and of -2cp; at the upper one. The phase shifts are
determined through (8.2) for the TE and through (8.3) for the TM modes by substituting ip
and n2- Demanding unique solutions for the field amplitudes, eve deduce the following mode
equation as condition for the guided waves:
2/A;/t7cosft-2cps--2cpt = him (m = 0, 1. 2, ...) (8.6)
From (8.1) and (8.5) the following condition for guided modes in a waveguide like the one
of Fig. 8.1 is derived:
kns<fi<knf . (8.7)
For the waveguide an effective refractive index N is defined as
P
N =
j= »,sint> with »^<;V</?/ . (8.8)
A.
The mode equation (8.6) can be also written in the following form:
kdjti] - N2 -
c(\ -crt = nm, (m = 0, 1, 2, ... ) (8.9)
Theory of Optical Waveguides
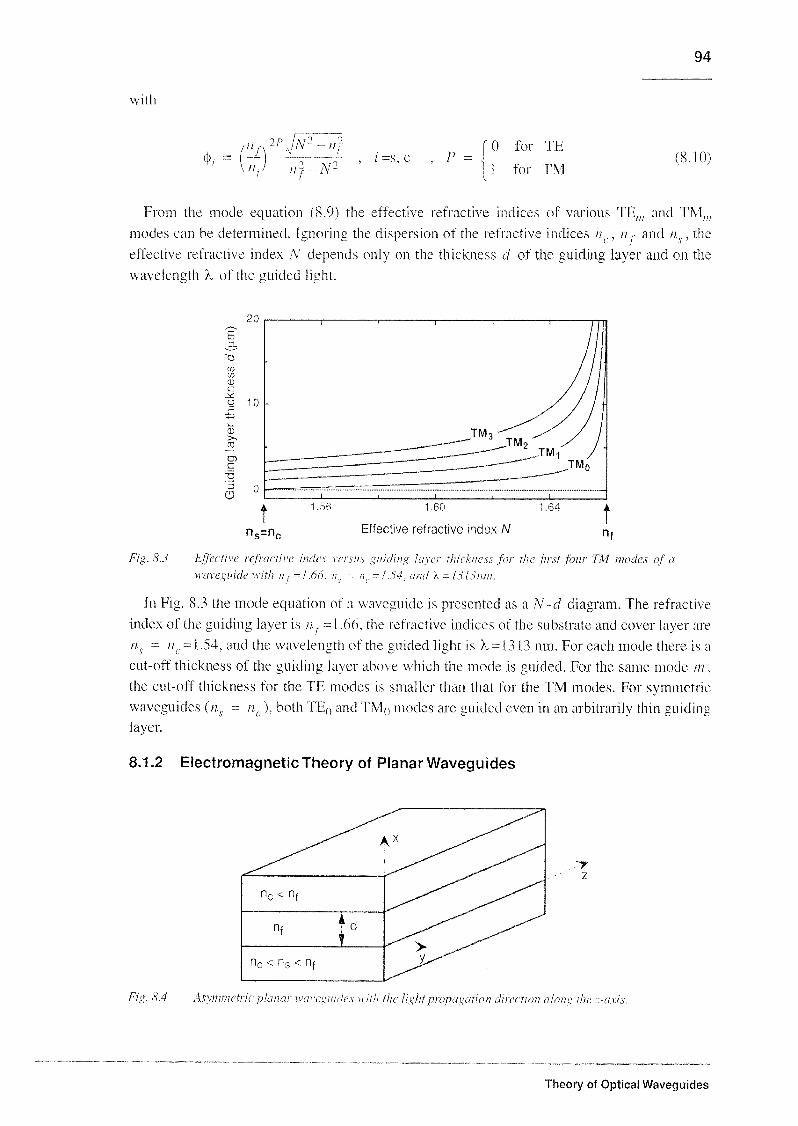
94
with
nr'PjN2-n?N'
?=s c p-\ 0 lot TF
[ l toi lM(8 10)
Tiom the mode equation (8 9) the effective tetiactive indices of vanous '\Em and IM,„modes can be deteimmed Igiioiing the dispeision oJ the tefiactive indices n( ,
n, and rp the
etfectiee i eft active index N depends only on the thickness d ot the guiding layei and on the
waveleneth 7 ol the guided light
nc=n.
1 60
Effective refractive index NM
Ei g S 1 tffeetnc icfiadnt index sa sin nadin^ laxa thickness for the fn st four TM modes of a
waxeginde with n, -1 66 n i =/ 'S4 and k- h hum
In big 8 3 the mode equation ot a waveguide is piesented as a N d chagiam The letiactiee
index ot the guiding laeer is nf=\ 66 the leliactive indices of the substiate and cover layer aie
tp =
/;( =1 54 and the evavelength of the guided light is X = B B nm For each mode theie is a
cut-off thickness of the guiding la>ei aboee evhich the mode is guided Foi the same mode m
the cut-oft thickness loi the IF modes is smallei than that tot the TM modes Fot symmetnc
waveguides (ns = nt ) both TE0 and TMU modes aie guided even in an aibitianly thin guiding
layei
8.1.2 Electromagnetic Theory of Planar Waveguides
1 ig S4 \s\mnu trie plana waxe indes with the light propagation eduction cilon^ the axis
Theory of Optical Waveguides

95
For each layer in Fig. 8.4 a transverse decay constant y,- and a transverse propagation con¬
stant K,- can be defined asi
it >
kT = ipId-lY = -y; .(8.11)
k) = n)k2-\Y ,(8.12)
k; = /irr-ß" = -y; .
were the subscripts x. /', and c refer to substrate, film, and cover, respectively.
Table 8.1 shows the ranges of propagation constants f> corresponding to the various mode
types and categories, and also the associated ranges of the transverse propagation constant kç
in the substrate.
Table S.JDifferent kinds of modes and the corresponding ranges for the propagation
e onstunt f> and the transverse propagation t (instant in the substrate k^ .
Modes ß k
guided modes kn^-^Ltp imaginary
substrate radiation modes kip -* Ln( Q -^ f T. - n~
cover radiation modes knc -* 0 /c A2_ fj2 _^. pfl
evanescent modes imaginarv kn—> co
In planar waveguides the light is confined only in one direction denoted as x -direction. The
refractive indices as evell as all field amplitudes depend only on the ,v-direction, simplifying
the Maxwell equations. In Sections A. and B. the equations governing the field amplitudes of
guided TM and TE modes, respectively, will be briefly presented.
A. TM Modes
The transverse magnetic (TM) modes have zero longitudinal magnetic field (H.--0). For the
electric fields we have
£\ = //, = H. = 0. (8.13)
£, = £//, - (8.14)
7 (WvE. =
--L--.', (8.15)
0)£0 Ar
Theory of Optical Waveguides
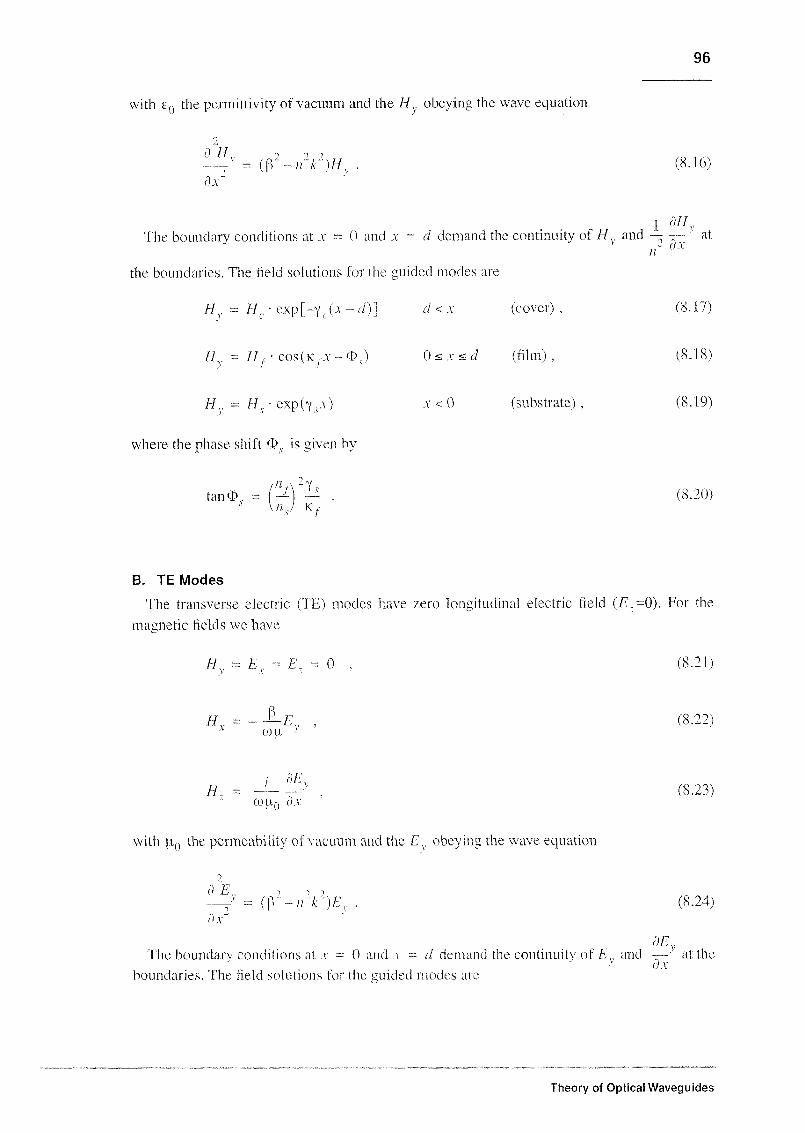
96
evith c0 the peimittreity of vacuum and the Hs obeying the wave equation
2
à IE n ii
-V = (ß- 77)H(de
(8 RA
I all,The boundary conditions at \ = 0 and \ = d demand the continuity of 11
yand — —- at
the boundanes The held solutions toi the suicled modes aie
7/, =I1C evp[-Y((x -d)] d<x (covei) ,(8 17)
Hx = EIf cos(k \ -<ï\) 0<\sc/ (him).
Hx = [If exp(Ys\) \ <() (substi ate),
(8.18)
(8.19)
whcte the phase shift <1>S is gieen by
tanch, =
"A-V.
»7 Kt(8 20)
B. TE Modes
The tiansveise electnc (IE) modes have zeio longitudinal electnc held (F =0). For the
magnetic held s eve have
//=/,=£ = 0 (8 21)
"v =
con
(8 22)
H =
, cd:i \
cou() dx(8 2 A
with u() the peimeabihty of vacuum and the Cv obeying the wave equation
f)>V = (ß -« ni,
ô\
(8 24)
ÔE,the boundaie conditions at \ = 0 and \ = d demand the continuitv of F, and — at the
'(A
boundanes The held solutions foi the guided modes aie
Theory of Optical Waveguides

97
7\ = E( exp|-~Yc( v-c/)] d < z\ (cover)
7\ - Ef-cot(Kf\-<PJ
tandy =
A
0 < \ < d (film) ,
L\ = 7( • exp(ys\) \ <0 (substiate)
evhere the phase shift T>% is grven by
(8.25)
(8.26)
(8.27)
(8.28)
2 104
E 1 104>
x
UJ
«!
80
40
>
N
2 103 -
0 -
-2 103 -
t—i—i—|—i—|—i—i—r
J L.
_J I 1 I 1 I I_
J I 1 1 1 I 1_
J I 1 I 1 L. -j L
Fig <S'3
-0 5 0.0 0.5 1.0 1.5 2.0 2.5
x(ttm)
Electnc fields lf_ lS 14) and F (H IS) and magnetic pdd H% tS l7)-(8 /«) of the T\l{)
mode ol the planai waseguidc d Fig 8 1 \=1311nm n,=l66 n( = /zç=7 v/ el -2
urn, N(jf =1 6408
Theory of Optical Waveguides

98
8.2 Channel Waveguides
In planar waveguides, the light is confined only m one direction. For the fabrication of inte¬
grated optical components, such as Mach-Zehnder modulators, it is necessary that the light is
guided in both directions. In Fig. 8.6 the cross section oi a channel waveguide is depicted.
In this work, photobleaching was used (or the fabrication of channel waveguides. The area b
is covered by a lithographic mask and the sections a and c are illuminated by the ultraviolet
light of a mercury lamp. Through photochemical processes described in Chapter the refractive
index of the illuminated material is decreased and an optical confinement is formed in the v
direction. The refractive indev of the guiding layer in sections a and c is not uniform but has a
profile like the one shoevn in Fig. 8.7. To find this profile the bleaching constant
(BC = iVllatF) is determined from absorption measurements (see Section 7). The refractive
index profile is numerically calculated using (7.4) evith the refractive index and the chro¬
mophore concentration depending on time and the depth of the depth in the polymer film
[121]. The effective refractive index of this profile can then be calculated using a multilayer
waveguide theory where the transmission and reflection of a multilayer system with a quasi-
continuous refractive index profile, as in the approximation foi the case of photobleaching, is
considered [120]. The waveguide fabrication procedure is described in Section 8.3.
* 1,
•
1
Ki I j
"1TM
"s1
1
No
90l rota-
Ni
11s n, nL
TE
--*
Vv
J. 11.
Fig 8 6 Ci oss-sec tion of a c hannel w en egiudc N denotes epet tne lefiac tive index and the anow the
light polauzation I he bleached aieas eue shaded h A planai wcixegiude confines a FM
mode m the x eduction IE) [lie siitictute shown in (1) lotated clockwise bv 90°. A planai
waxeguidc i anpries a IE mode m the x direction
The channel waveguide needs to be monomode in both vertical and horizontal directions to
avoid losses and obtain a better interaction with the applied electric field in the active layer. To
achieve such a condition, the ettective refractive index method is used. First, the planar
waveguide guiding the TM modes is divided in sections a-c, as shoevn in Fig. 8.6.1. Then, these
sections are considered as layers which define a waveguide in the v direction. The effective
refractive index N{
in section b is calculated using (8.9) whereas the ones in sections a and c
(N2) are calculated using the multilayer waveguide theory [120]. Finally, we rotate the
waveguide by 90° around the r-axis (see Fig. 8.6.11) and obtain a second planar waveguide m
the v direction guiding tE modes. This planar evaveguide is defined by a layer of refractive
index Ns being between two layers of refractive index \7 (N
{> N
-, ). By selecting the appro¬
priate bleaching time and the width of the unbleached area b. the effective refractive indices
Theory of Optical Waveguides

99
Njand N2 can be adjusted and monomode conditions in both e and y diiections can be detei
mined (see Section 9 2)
x
"Oc
>
o
CO
»*—
o
or
0s 10 Is
Film thickness (urn)
rig 87 Refiaitne index piofik of a 2 urn thin film of pohimide 1 9^ 11 afta an illumination time of
tlnee hour s with a niacins lamp and a light intensifs of 2ï mWlcrn Ihepiople is calculated
using absorption data similar to those pre sented in I ig "> 2
TM case
AX
Ex(x)
TE case
x
"-ftfr*
Ex(y)
Fig VV Schematic mode piople ot the ]\lutse as wcII as of the IE case of I ig s 6
Actually it is not possible to define sepaiate IE oi TM modes In reality theie exrst I EM
modes In 1 ig. 8 8 the mode piotile ioi both eases ot Fig 8 6 is shown The actual IEM guided
modes can be appioximated be an oveilap ot the TF and the IM modes of Fig 8 8 in such a
way that the \-component of the erectile, held is
7x(i.\) = konst I x(\) 1 x(v) (8 29)
Theory of Optical Waveguides
100
9 Electro-Optic Modulator Device Design
In this work eve fabricated both phase and Mach-Zehnder electro-optic modulators. In a
phase modulator, the light travels through a channel waveguide and when it crosses an area
between two electrodes evhere an electric field is applied, its phase is changed clue to the
refractive index change induced by the electro-optic effect. In a Mach-Zehnder amplitude
modulator (Fig. 1.4a) the light is launched into a channel evaveguide which splits into tevo
equal arms. An unequal optical path beteveen the tevo arms (induced again by the voltage
applied and the electro-optic effect) leads to the recombination of guided waves that are not
necessarily in phase w ith one another. This results in excitation of either the lowest or the next
order mode of the guide in the junction area of the tevo arms (Fig. 1.4b). The higher order mode
is not bound in the single-mode output channel evaveguide and "leaks"' into the planar
waveguide. Amplitude modulation is obtained for the light evhich remains in the output chan¬
nel waveguide (see Fig. 3.2 for principle of electro-optic modulation).
The fabrication of a modulator operating at low voltages, exhibiting high extinction ratio
(see Section 11.1.2) and Ioev losses (see Section 11.1.3) requires a careful design taking into
account several important parameters. With the active material given, the buffer materials ful¬
filling several requirements have to be selected. The thickness of the layers have to be adjustedin a way that the trade-off between low half-evavc voltage and low losses can be optimally han¬
dled. The structure of the Alach-Zehnder interferometer has to be carefully designed to obtain
low cross-talk between the two arms, efficient splitting and recombination of the light at the Y-
junctions, and monomode light propagation. The design of a polymer eleclro-optic modulator
will be discussed in the next sections.
9.1 Buffer Layer Selection
Buffer layers are important for reducing the absorption losses at the electrodes and for
obtaining waveguiding conditions in the vertical direction. At the same time they have to be
compatible with the whole modulator fabrication procedure involved.
As described in Chapter 8, a evaveguide can only exist if the refractive index of the guiding
layer is larger than the refractive index of the buffer materials below and above this layer. The
degree of light confinement in the guiding layer depends on the refractive index difference
between the guiding and the buffer layers. The higher the difference, the better the confine¬
ment. The advantage of a good mode confinement is twofold; first, a larger portion of light
propagates in the electro-optically active material and contributes to the overall electro-opticeffect thus reducing the voltage needed for modulation. Second, a smaller portion of lightextends to the top and bottom electrodes which are highly absorptive and thus the propagationlosses are decreased.
For the waveguiding in the horizontal direction, photobleaching is necessary, as described in
Chapter 8.2. To avoid contamination of the active layer, eve can protect it by spinning a top
buffer layer before bringing the sample in contact evith the photolithographic mask to selec¬
tively illuminate the sample. This requires that the top buffer layer does not absorb light in the
ultra-violet range of the spectrum
The creation of three-layer structures requires tevo successive depositions of a polymer onto
another polymer. This implies that the solvents used for creating the polymer solutions should
not dissolve the underlying layer. Moreover, the structuring of the top driving electrodes
Electro-Optic Modulator Device Design

101
requires a photolithographic procedure where spinning of photoresist and wet-etching treat¬
ment is involved. Therefore, it is necessary that the top buffer layer is compatible with this pro¬
cedure, as well.
In this work the compatibility of several commercial (polymethylmethacrylate, polycarbon¬
ate, polysulfone, cyclotene, polyvinylcarbazol 49.05) as well as not any more commercial
(polyimides Pl-293 and 53.12) polymers evith the active polymer A-95.11 and the fabrication
process was systematically studied (see Table 9.1). Compatibility with A-95.11 concerns
mainly refractive index difference and resistance to solvents. For the fabrication process it con¬
cerns film quality, transparency at the bleaching wavelengths, and compatibility evith the pho¬
tolithographic process for electrode structuring. Best results were obtained with the
commercial polymer cyclotene (Dow Chemicals Europe) which was also used for the fabrica¬
tion of Mach-Zehnder modulators. Some of the properties of cyclotene are given in Table 9.2.
Polyimide PI-293 has been also used but was free floated and deposited as top buffer instead of
being spun. In the free floating technique the polymer is spun onto a glass substrate after a
water soluble polymer, e.g. polyacryhc acid, has been deposited. The film is lifted from the
substrate in water evhere the polyacryhc acid dissolves. The free floating polymer can then be
transferred onto the sample where the active layer has been previously deposited [89].
Table 9.1 Comparison of several polymers with respect to the recpuircinerits for their use as buffer layers with A-
95.11. When a reeptiremen! i s not fulfilled, the cot re spending e ell is marked with X and is shaded. Onlv
cvclotcne meets all the demands (PC' polycarbonate, PS: polysulfone. PMMA:
pohiiiethxlnietliacrx'hite. PI 293- polvimide not anvinore commercially available. PI 53.12: Sandoz
backbone pohmndc, PI 49 05: polyvinyl'carbazoli.
Requirement PC PS PMMA PI 293 PI 53.12 PI 49.05 cyclotene
n < 1.6
(for waveguiding)
transparent 300-400 nm
(for photobleaching)
Not dissolved by
cyclohexanone/NMP
(for use as bottom layer)
Does not dissolve A-95.11
(for use as top layer)
Not dissolved by water
(for electrode
structuring process)
• X • •
(V)
Electro-Optic Modulator Device Design
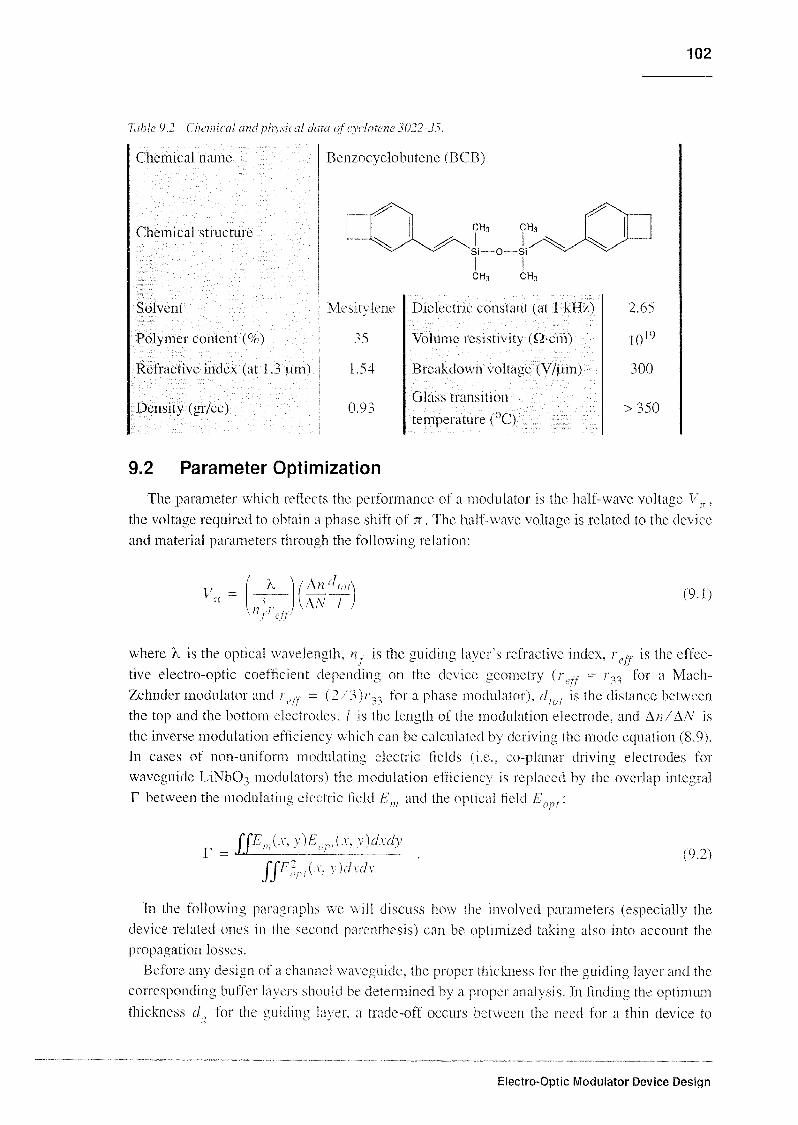
102
labte 9 2 Chenue al and pin suai data of e yc loterie 3022-3 S
Chemical name
Chemical structure
Solvent
Polymer content (v7)
Refractive index (at l .3 um)
Density (gr/cc)
Benzocycfobutene (BCB)
XN ^"N-
Mesitylene
35
1.54
0.93
Dielectric constant (at l kHz)
Volume resistivity (Q-cm)
Breakdown voltage (V/pm)
Glass transition
temperature (°C)
2.65
109
300
> 350
9.2 Parameter Optimization
The parameter evhich reflects the performance of a modulator is the half-wave voltage V\.the voltage required to obtain a phase shift of rt. The half-eeave voltage is related to the device
and material parameters through the following relation:
y=
rK
k
^t'dt
I A» cttot
\AN /(9.1)
where k is the optical wavelength, nt is the guidmg layer's refractive index, r(,,, is the effec¬
tive electro-optic coefficient depending on the device geometry (r,, = r^ for a Mach-
Zehnder modulator and /cf!
= (2 73); ^ for a phase modulator), dtot is the distance between
the top and the bottom electrodes, / is the length of the modulation electrode, and an/AN is
the inverse modulation efficiency which can be calculated by deriving the mode equation (8.9).
In cases of non-uniform modulating electric fields (i.e., co-planar driving electrodes for
waveguide LiNbCA modulators) the modulation efficiency is replaced by the overlap integralF between the modulating electric field Em and the optical field A :
fjF;pl(\.\)d\d\(9.2)
In the following paragraphs we will discuss how the involved parameters (especially the
device related ones in the second parenthesis) can be optimized taking also into account the
propagation losses.
Before any design of a channel evaveguide. the proper thickness for the guiding layer and the
corresponding buffer lay eis should be determined by a propei analysis. In finding the optimum
thickness c/„ for the guidmg layer, a trade-off occurs between the need for a thin device to
Electro-Optic Modulator Device Design

103
lower the operating voltage and the requirement of thick buffers to isolate the optical energy
from the absorbing metal. In devices poled with parallel plate electrodes, the largest electro-
optic coefficient is along the direction of the electric field, thus TM modes will exhibit the
stronger interaction. For single-mode operation, the range of possible guide thickness extends
from the threshold thickness of the TM0 mode dmw to the threshold of the TM( mode dnun .
Smaller guide/buffer index differences require larger thickness for waveguiding. Between dmilland dlpax there exists a strong variation m the spatial width of the mode energy. Near the TMq
threshold, the approximately plane wave nature of the guided mode is marked by evanescent
tails of the field amplitude decaying slowly into the buffers. This signifies very poor confine¬
ment of the waveguide mode. As the guide thickness increases, the mode width goes through a
minimum corresponding to the thickness of maximum energy confinement within the
waveguide. This thickness dlk
for evhich peak confinement occurs, is where the 1/e mode
width is about equal to the wavelength of the guided light.
The next design step is that of finding the buffer thicknesses required to minimize the atten¬
uation due to the electrodes. If one arbitrarily allows 0.01 A of the peak electric field amplitude
of the guided mode to reach the electrodes, the needed buffer thickness can be found. Another
design concern is the modulation efficiency associated with the two operating points. For opti¬
mum device operation, there must be a strong perturbation of the mode effective index for
externally induced changes in the guide index. The modulation efficiency AN/An (see Fig.
9.1) takes into account how effectively a perturbation of the guide index changes the mode
index and can be found by deriving the mode equation (8.9).
c
<
o
c
CD
'o
15c
o
j!
"OO
1 2 3
Film thickness (urn)
Fig 9 1 VoduLition efficient x ici sin pirn thickness of a planar wenegiude made of pohmei A-95 11 and
using eitha cxdoiene I solid lines i or PP293 (dashed line) as tippa and lower buffer leneis
Only the fn st two I M modes aie shown
Optimum operation of a modulator is obtained by maximizing the efficiency AN/An and
minimizing the total thickness dtot. Operating with a thm guide chosen for maximum mode
confinement leads to low modulation efficiency. Choosing a thicker guidmg layer for a more
efficient modulation, the overall thickness is increased. A general rule is that an optimum
design uses a guide thickness close to the threshold of the TMt mode, dnun.
Electro-Optic Modulator Device Design

104
Considering the above mentioned guidelines, the layer thicknesses of the three samples pre¬
sented in Fig. 10.1 were determined. However, the electro-optic device requires a channel
waveguide, and the next step in the design is to determine its lateral dimensions.
1.61
g 1.60
I 1.59
O00
4= 1.580)
CD
£ 1 -57o
SS 1.56
Fig 9.2 Relations between waxegmde width, effettne icpattne index N-, (1 s64 <N~ < 161). and
leqiiued bleaching time for obtaining mcmornode weneguiding conditions m the honzontal
direction Graph coiiesponds to the \47C2 stint tinv of big 10.1
We use the approach described in Chapter 8.2 where we rotate the sample by 90 degrees and
obtain three layers in the v-dircction with effective refractive indices N,, AA ,and A/, respec¬
tively (see Fig. 8.6.II). The effective refractive index A7, is constant and defined by the refrac¬
tive indices of the three layers in the i-direction. The thickness of the middle layer correspondsto the evaveguide width W. The effective refractive index AA depends on the refractive index
profile of the shaded areas of Fig. 8.6.11 which is, in turn, dependent on the bleaching time th .
The relations between W. AA,and //; are described by the curves shoevn in Fig. 9.2. The way
to use this graph to obtain monomode waveguiding conditions in the v-direction is the follow¬
ing. For a certain evaveguide width (e.g. 3.5 pm), using (8.9) with cl equal to that width,
iij= N,, and (8.2) with /;, = A', and n-, = AA . a value of AA can be determined for which
no higher modes than TE0 can be guided. Prom the A -,(lf ) curve of Fig. 9.2 we obtain, for
example N2 = 1.599 for H =3.5 um. For this value ot AA we can then find the needed bleach¬
ing time by using the A ^(th) curve eehich gives fA=3 hours.
To sum up, if the sample MZC2 (see Fig. 10.1) is illuminated with UV light for 3 hours
using a mask with 3.5 urn wide waveguides, monomode TEM propagation is secured and an
optimized effective electro-optic coefficient is theoretically expected. The exact 2-D design of
the Mach-Zehnder waveguides is deteimmed by simulations discussed in Section 9.3.
The AA(f/;) cime is not an anahtieal function but a sequence of points calculated toi sevetal bleach¬
ing times aflei deteiminmg the ichactiee index piofile, as discussed in Cfuptei 8 2
Electro-Optic Modulator Device Design
Bleaching time fo (hours)
J 1 1 1 1 i 1 31.5612 3 4
Waveguide width l4/(iim)

105
9.3 Beam Propagation Method (BPM) Simulations
Once all the effective 1 eh active indices of the multilayeis aie known and the wavelength of
the guided light is given, Mach-Zehndet stiuctuies can be designed and the piopagation of
light thiough them can be simulated using commeiual softwaie packages It is cleai that the
final light piopagation and modulation depends stiongh on the mask used evhich, m tum is
dchned by the matenal paiametets In this woik eve used existing masks provided by the Paul
Sheiiei Institute (PSI) and also cieated new ones using the Prometheus softwaie [122] The
PSI masks eveie designed toi modulaiois based on LiNbO-, In our case, wheie polyineis ate
used, the icfiactive index lange is diffeient and a modified design was necessaiv The
Piometheus piogtam includes a graphics mteiface foi the design ot optical waveguide configu¬
rations, allows beam piopagation simulations, and expoits the stiuctuies to foimats suitable toi
du eel fabncation ot the photolithogiaphic mask needed for the modulatoi pioduction
Waveguidewidth
Junction angle Arm distance
Arm length Junction length
big 9 ? Chcoattenstit dime mums of a Mach Zelnick r mtafaomctei Onh four of them ate inch pen
dent as the aim tintante isduccth idalcd to the pine lion angle and length
3
o
0)
o
e
H
1 0
'0 05
Width - 1 5 urn
Width 2 5 urn
Width -35 urn
Junction length vs junction angle
10 15 20 25
A Junction angle (deg)
30 35
At 1 deg TM3 node output always > 90% and Y junction length - 2 mm
Fig 9 4 BPVI simulations oj output it ttnsitx loi the dctamunition of the Mach Zehnder junction
angle loi tin anahs s the paramtta s of sample V1ZC 2 of F ig 101 wae used
A schematic teptesentation ot a Mach-Zehndei mteifeiometei structure and the design
paiametets contributing to fis peifoimanee aie shoevn in Hs 9 } hoi the design ot oui Mach
Zehnder inteifeiometets we kept the distance beteeeen the two aims constant at ^5 urn to avoid
cioss-talk The lemammg paiameteis to be dchned ate the angle of the \-junction, the arm s
length (which is the mtciaction length of the modulatoi) and the waveguide width
Electro-Optic Modulator Device Design

106
I he smallci the angle the smoothei the light bifurcation and the less the losses at the junc
tion With constant aim distance, hoevcvei, small angles leads to long junction lengths and
theiefoie highei propagatron losses To determme the optimum angle we peifoimed simula
tions (see Fig 9 4) and deteimmed an optimal angle of l deg wheie the output intensity ot the
fM0 mode is moie than 90A of the input one and the junetton length is kept at 2mm boi the
case of 2 5 tun eeide waveguides the losses at the \ junctions aie about 5% coiiesponding to
losses of dB
The longei the aim length ot a Mach-Zehndei modulatoi the longei the mteiaction length
evith the driving elect! odes and theiefoie the low et the driving voltage Once moie howevei
longei aims mean higher piopagation losses and a need of laige area good quality films We
designed Mach-Zehndei mttifeiometcis with a wide lange ot aim lengths, i e 0 5 0 75 1 15
2, 2 5, s em
60 mm
U
60 mm
fej. »fc ^m fywx «.^wii^ww
f
111
Y junction incle r
Intel iction length (cm)
V junction length (mm)
W h collide width (urn)
o s/o 7-yt/
1 1/2/2 sA
0
1 1/2 5/3 s
Electrode width (nm) IS
A
450 urn
V:
i mm
//., 9 i lop loji uni ep the tie i i e I plate htho letp/n masks with (4\"xi S4) Mach Zc hnclt r m d
ulalois f i\7-2l t pli ni nc lull is ar d ( n7_2 / ; sticiight channel wene indes Lightaieas
tot lilt, wtneau It s (1st I ixti i t I n k enteis ait the t'l n /«s tit ctiotlt s (2nd laxa} lliethiet
gioups (i u un tint mill itha different wascaude widths [he masks paiameta s em
^ntn m tht t iblt n tl t i ;.,/ de
Bottom \ a up If in Mi h/thnda inta fat mitei s /s ma nipt t lev reasons ofdaiits
the dune nsiom eut r t 11 scab D/k ne is an the wet t tildes (1st laxa ) and lidit einen an
the din nn da it h s ( ^inl I ist > r
Electro-Optic Modulator Device Design

107
1 he width of the waveguides defines the degiee ot confinement in the horizontal cliiection
(see Section 9 2) Or seen the other way around, the effective letractive indices that can be hoi
izontally achieved will dehne the lange of the waveguide width Piacticallv although wide
waveguides ate needed to easiei match the size of the fibei modes and elect ease the coupling
losses finget widths tequiie smaller refractive index cirfteiences to obtain monomode
waveguiding conditions in the hoit/ontal dnection and as a consequence shoitei illumination
times (see Section 9 2) The illumination time is lesfiicted, howevei, by a simple factoi it the
sample is illuminated ioi less than tepieallv ^ houis the waveguides aie not visible undei the
micioscope and it is impossible to exactly align the mask lot the driving electiodes using the
alignment maiks If the monomode condition is violated, higher oidei modes aie guided and
the extinction îatio is loweied Eoi reasonable illumination times (^ to 24 h) eve designed thiee
sets ol Mach-Zehndei mteifeiometeis with widths of 1 5 2 5 and 3 5 um (see Fig 9 2 and Fig
9 5)
bot a designed Mach-Zehndei mteiteiometer the beam piopagation can be simulated fot any
phase shift between its tevo aims An example of such a simulation toi a phase shift of jt
(destuictive mteifeience coiiesponding to a voltage ol I T) is shown m Fig 9 6
10 mm
tig 96 Beam piopenati m simulation of the Math Zehncla dec tio optic mtufaoim ta VtZCI shown
in Fn 10 land l ig 10^ with i pnase shift ot 7 between the two aims Wene length 7 = 1 si -?
run Par i casons of dm its the dimensions ait not > stale
Electro-Optic Modulator Device Design

108
10 Electro-Optic Modulator Device Fabrication
In this woik two types of phase modulators (PMP and PMC) and tevo types of Mach-
Zehnder modulators (MZCl and MZC2/3) were fabiicaled. Foi PMP and PMC the polyimide
PI-293 and cyclotene eeetc used as buffet material, respectively. For the Mach-Zehndei modu¬
lators cyclotene was used as butfei material. PMP. PMC, and MZCl were fabricated using the
PSI masks whereas the self designed masks were used tor the MZC2/i modulators. The dittei-
ence between the samples MZC2 and MZC3 lies on the active mateiial used. For the fabrica¬
tion of MZC3 areeentiy synthesized A-95.11 polyimide with shghtiy different properties was
used. The comparison of the two polymers is presented in Table 10 1. An overview of the four
modulators is given in Fig. 10.1.
PMP
PI - 293 (2990 nm)
A-95.11 (1720 nm)
PI -293 (3080 nm)
dtot = 7790 nm
PMC & MZC1
Cyclotene (2400 nm)
A-95.11 (2000 nm)
Cyclotene (2400 nm)
7ot 6800 nm
MZC2 & MZC3
Cyclotene (2000 nm)
A-95.11 (965 nm)
Cyclotene (2400 nm)
dtot = 5365 nm
15/25 urn
1000 A Gold
-- 10 Â Gliome
P1-2ÇM/ Cyclotene
Bleached legion
Poleinnde A95 1 1
Pivxn/Cvtlotcnc
2500 A Gold
lOOÂChiome
St wafet
fig 10 1 0\ei\iew of the foui fabin cited elettio-optit modulatoi s The lefiactne indices of the \ai ions
lasers at 7,= l * am tue m \-9S 11 j = / 66 n(PI 29P-1 61 S rUexclotene)-1 ^4 The nan ow
waxegindes and t leetiodt s iS urn and /> um icspa tnt h ) weie used foi the modulatoi s PMP,
PMC and M7C I >\ lieu as the wide ones 12 5 wn and 2^ uni) foi the modulators MZt 2d
The lower electro-optic coefficient as eeell as the highet glass transition tempetature arc
related to the loever ctye concentration The higher glass transition temperature simply requires
poling at higher tempetatuie. Despite the lower molecular weight of the new polymer, high
quality films could be obtained. Then optical losses aie discussed m Section 11.2. The fabnca-
tion steps are summai îzed in Table 10.2 and will be presented for each type of modulator m the
next sections. The complete fabrication procedure is also schematically presented m Fig. 10.2.
Electro-Optic Modulator Device Fabrication

109
Table 10.1 Comparison oj the anginal and the newly synthesized polvinude A-95.11. T„ is the glass transition
temperature, dye concentration is the molar concentration of dye-substituted repeating units. MW is
the average molecular weight, and i.,, is the electro-optic coefficient at 1552 nm.
Polymer/On
7„ ( C) Dye cone. (%) MW r3, (pm/V)
A-95.11 original 137
A-95.11 new 162
90
60-70
647)00
< 10*000
14
11
Table 10.2 Polymer electro-optic modulator fabrication steps.
Discussed in...
Fabrication steps
Section 10.1 Thorough cleaning of Si wafers
Section 10.1 Deposition of the bottom electrode
Section 10.2 Spinning and curing of the bottom buffer layer
Section 10.2 Spinning and curing of the active layer A-95.11
Section 10.2 Spinning and curing of the top buffer layer
Section 10.3 Waveguide structuring using photobleaching
Section 10.4 Deposition of the top electrode
Section 10.4 Top electrode structuring using a direct photolithographic process
Section 10.5 End faces cleaving/dicing
Section 10.6 Electrode poling
Electro-Optic Modulator Device Fabrication

110
v v v
Substrate
cleaning
1Cr & Au layer
deposition
ISpinning of
buffer layer
ISpinning of
active layer
\UV photobleaching
through mask
ICreated
waveguides
\Spinning of top
buffer layer
^^LJjH[^d£i\ùï^^^à
v v I
Electrode
contacts
tDeveloping of
photoresist
tCr & Au etching
tDeveloping of
photoresist
tUV illumination
through mask
i,n,.i ...ti i cu.zü tSpinning of
photoresist
m«^-$»x^|||S||SÉa!S^
tGold layer
deposition
Fig 10 2 Schematic picsentation of the piocediiie foi the fabi nation of pohina electro optic modula
tens Hit U\ photoblnit lung tan be performed either ht fore oi afta tin deposition of the top
bujP i lena
Electro-Optic Modulator Device Fabrication

111
10.1 Substrate Preparation
Silicium wafers were used as substrates. <!()()> cut wafers were prefered over <lll>
because they can be easily cleaved along the crystallographic axes. Rectangular pieces with
dimensions of about 3x7 cm were cleaved out and were carefully cleaned in clean room condi¬
tions using the procedure described m Table 10.3.
lahle 10 3 Cleaning jrioccdiue foi the siliaum wafers
tep In/With Time Temperature
1 Acetone in ultrasonic bath 5 min. 25 °C
2 5:1:1 I120:H202:NPA, cone. 10 min. 80 °C
0 Distilled water (twice) quick dump 25 °C
4 5:1:1 H20:H202:HClconc. 10 min. 80 °C
5 Distilled water (twice) quick dump 25 °C
6 Dry evith nitrogen 2 min. 25 °C
A 250 nm thick gold layer eeas then sputtered on the substrates m high vacuum to form the
bottom electrode. To achieve a good adhesion to the silicium, a thin layer (10 nm) of chromium
is first deposited. The gold plated substrates are then cleaned as described in Table 10.4.
Fable 10.4 Cleaning piocediiie foi the gold plated silicium substitues
Step In/With Time Temperature
1 Acetone in ultrasonic bath 5 min. 25 °C
o Ethanol in ultrasonic bath 5 min. 25 °C
3 Distilled water quick dump 25 AC
4 Dry evith nitrogen 2 min. 25 °C
5 Dry on hot plate 5 min. 80 AC
10.2 Spin-Coating of Polymer Multilayers
The polymer layers are deposited on the gold plated substrates using spin-coating. As men¬
tioned in the previous sections, the thickness of each polymer layer is of gieat importance for
the performance of the modulator. Therefore, it is important to have control over the spm-coat-
ing procedure for each material used. Although the quality of the spin-coated films depends on
Electro-Optic Modulator Device Fabrication

112
many parameters like temperature, material quantity, material purity etc., the thickness
depends only on the rotation speed of the spin-coater and the viscosity of the used solution.
Thickness calibration procedures for the three materials used in this work are presented in the
next paragraphs.
10.2.1 Active Layer A-95.11
Unlike polyimide PI-293 and cyclotene which are available in specific concentrations and
have a standard viscosity, polyimide A-95.11 is a powder and before spin-coating, a solution in
a mixture of 3:1 cyclohexanone/NMP has to be prepared. The concentration of this solution as
well as the rotation speed of the spinning stage determines the film thickness. Solutions of con¬
centration less than 5 wtA are not viscous enough to form films and solutions. More than about
25 wtA do not form uniform films. For four different solutions of 5, 10, 15, and 20 wt% we
have spun films at rotation speeds of 1000, 2000, 3000. and 4000 rpm and measured the thick¬
ness of the film. In this way, the thickness calibration curves shoevn in Fig. 10.3 were deduced.
They were thereafter used for the determination of the right concentration-rotation speed com¬
bination for obtaining a desired film thickness. After spinning, the A-95.11 films were cured at
160 °C for 4 hours to remove any residual solvent traces.
Spinning rate (rpm)
800 1000 2000 3000 4000 5000
3.6
en
o
IE
t- 2.8
O)o
2.4
2.9 3.0 3.1 3.2 3.3 3.4 3.5 3.6 3.7
log (Spinning rate)
Fig. 10 3 Spuming täte — film ihn knesx t in \ es foi pohimtde \-95 II and foi different concentrations in a
cxdohcxanone \PMP (75 2>) solution • 20c/e. H IpSPt. lOPc A 5(i pa weight. The lines are a
guide to the exe
10.2.2 Buffer Layer PI-293
The same thickness calibration procedure was performed also for the polyimide PI-293 but
only for one concentration, the one clelieered by the producer (Ciba-Geigy). The resulting
thickness-rotation speed curve is shown in Fig. 10.4. Due to the quite high viscosity of the
polymer solution, no films thinner than about 2500 nm can be obtained using our spin-coater.
After spinning, the PI-293 films were cured at 250 °C for 75 mm to remove any residual sol¬
vent traces.
Electro-Optic Modulator Device Fabrication
i i i i I i =

113
6000
5000 -
Ê
S 4000
m
wmc
o 3000
2000
10002000 3000 4000 5000 6000 7000
Rotation speed (rpm)
Fig. 10.4 Spinning rate -film thickness curve for polyimide PI-293. The line is a guide to the eye.
10.2.3 Buffer Layer Cyclotene
The polymer cyclotene is available in four versions of different viscosity. The one used in
this work, cvclotene 3022-35, forms uniform films of thickness between 1 and 2.4 um for rota-
tion speeds of 5000 to 1000 rpm, respectively. The thickness versus rotation speed data pro¬
vided by the producer are given in Table 10.5.
Table 10.5 Spinning rate vs. thickness data for Cyclotene 3022-35.
Rotation speed
(rpm)
Film thickness
(nm)
1000 2000 3000 4000 5000
2.4 1.7 1.3 1.0
For better adhesion of the cyclotene films on the gold layer when used as bottom buffer, the
adhesion promoter AP8000 (Dow Chemicals Europe) evas first deposited. It was spun at 500
rpm for 2 sec, at 2000 rpm for 40 sec and then kept on a hot plate at 120 °C for 3 min. Curing
of the cyclotene films was performed in an oven evith flowing nitrogen as presence of oxygen
can be critical at temperatures above 150 °C. The multi-step heating sequence, as shown in
Table 10.6, was used to alloev sufficient time for the oven to be purged evith nitrogen.
Table 10.6 Curing temperature profile for < vdotene in nitrogen atmosphere.
SteP ' 5 min. ramp to 50 °C 5 min. at 50 °C
Step 2 !5 min_ ramp t0 [fjo °C 15 min. at 100 °C
Step 3 15 mirL ramp t0 150 »c 15 min. at 150 °C
StcP 4 60 min. ramp to 250 °C 60 min. at 250 °C
Step 5 natural cool down
Electro-Optic Modulator Device Fabrication

114
10.3 Waveguide Structuring with UV-Photobleaching
The waveguides were formed by means of photobleaching as described in Chapter 8.2. As
light source a mask aligner (Karl Suss M.TB3) with a 350 W mercury lamp was used. The main
peaks of the lamp's emission spectrum appear at 368 nm, 405 nm, and 436 nm (see Fig. 6.1).
When cyclotene was used as buffer layer, the bleaching evas performed also after spinning and
baking of all three layers. This is possible because cyclotene is transparent in the spectral
region of the mercury lamp. Avoiding contact of the mask on the active layer prevents the con¬
tamination of the layer interfaces. In the case of PI-293 which absorbs a large part of the
bleaching light, evaveguide structuring was performed after curing the A-95.11 layer and
before depositing the top buffer.
Tevo different masks were used for the fabrication of modulators. The first one obtained from
the Paul-Scherrer Institute (structure shoevn in Fig. 10.5) was used with the modulators PMP,
PMC, and MZCl whereas the one designed during this work with the Prometheus software
(mask shoevn in Fig. 9.5) evas used evith the modulator MZC2 and MZC3 (see Fig. 10.1 for an
overview of the modulators). A top view of the bleached structures can be seen in Fig. 10.6.
8 i#
<A ATJ
i
?
35 110 ^>T
'
20 na
-""
,-""""*""8 jigi .
10 mm
Fig. 10.5 Dimensions op the channel waveguides and the Mach-Zehnder interferometer (MZI) struc¬
tures of the pliotolithograjthic mask obtained from PSI. A beam propagation simulation of
such a MZI is shown in Fig. 9.6.
20 urn
Y - junction
channel waveguide
tevo MZI arms
Fig. 10.6 Channel waveguides and parts ofMach-Zehnder interferometers formed after 3 hours of illu¬
mination through a photolithographic mask. Top buffer layer is Cyclotene. Ehe width of the
waveguides is 8 um.
Electro-Optic Modulator Device Fabrication

115
10.4 Photolithographic Electrode Structuring
For the structuring of the top electrodes the direct photolithographic process was used. The
process is schematically presented in the right column of Fig. 10.2 and all the needed steps are
given in detail in Table 10.7. A gold layer (and a thin chromium layer for adhesion purposes as
in the case of the bottom electrode) is deposited on the sample and then the areas outside the
electrode structures arc photolithographically defined and removed. This is done by first spin
coating a photoresist layer and illuminating it with ultraviolet light through a positive mask
evith the Mach-Zehnder electrode structures patterned on it. The illuminated areas are then
developed and removed so that the remaining photoresist is exactly where the gold electrode
has to be. The exposed gold areas are then etched in a special etching bath (see Table 10.7).
The remaining photoresist is finally removed to reveal the gold structures. The two arms of two
Mach-Zehnder interferometers (optical waveguides and top electrodes) are shoevn in Fig. 10.7.
Accurate positioning of the electrodes is achieved by exact alignment of the photolithographic
mask to the underlying evaveguide structure by means of implemented alignment marks.
Table 10.7 Direct photolithographic process for the striu hiring erf the top electrode
# Step Description
1 Metal deposition
2 Photoresist coating
10 Ä chromium and J 000 A gold deposited in vacuum
Spin coating of photoresist SP2550a
Els at 500 rpm with acceleration 2b
2. 33 s at 4000 rpm with acceleration 2b
3 Prebake of photoresist 0n hot plate at 95 °C for 90 s
4 Edge material removal With cotton sticks and acetone or
by UV exposure and development of the edges (see steps 5 & 6)
5 Exposure
6 Development
7 Etching
8 Photoresist removal
Sample pressed on the mask at the mask aligner and
illuminated with UV light for « 15 s
Developer bath: photoposit 160 developer'1 : dist. water =1:6
1. sample in devel. bath until structure is visible (« 2-3 min)2. sample for 3 min in stop-bath (dist. water)
Sample in etching baths to remove excess metal
1. 50 s in gold etch bath |NaI : E : H20 ; J 8 : 2 : 80]
2. 40 s in chromium etch bath
1100ml H20, 10ml CH,COOH, 20gr Ce(NH4)2(N03)6|
30 s exposure of rest photoresist (no mask) and development
or sample 10 min in photoresist stripper ACT 150e at 50 °C.
a. Prom Shiplce Europe L kl.
b. Spin-coalei Semitce CPS 10
c. Fioni ACT. Inc.. L'SA
Electro-Optic Modulator Device Fabrication

116
I ig 10 7 lop new of h um wide top t let tioctcs o\a the 2 i am wide optical wen eguide s the two aims
of a Vlach Zeluida modulatoi
10.5 Fabrication of End-Faces
To couple light into the waveguides the end tue coupling method was used The lasei light is
focused to an aiea ot a teee urn" using an objectiee lens The light coming out of the device is
ptO]ected eeith a second ob|ectiec lens onto a photodetectoi oi an infiaied cameia Flat end-
faces are needed, hoevcvei, loi an effective coupling These can be obtained eithei by dicing oi
by cleaving
By dicing, the wafei is cut using a rotating diamond saw lire cut can be done with an accu¬
racy ot about 50 urn but tmy silicium pieces aie pioduced which contaminate the end-faces
making an additional cleaning piocediiie necessaie
By cleaving, a short cut is clone with a diamond at the edge ot the wafer and along a civstal-
lographrc axis The wafei is then cleaved all the eeav along this avis cieatmg a shaip end-face
This method is vety easy to implement but veiv acctnate cleaving lequnes a piecise initial cut
along a ciystallogiaplnc axis I! this is not the case, the cleaving may oceui in a random direc¬
tion It should be noted that cleav mg cannot be used w ith <, 111> oriented silicium wafei s
Foi the modulatoi s evith PI-29 ^ bulfei lavei s the end-faces veeie piepaied by dicing Fot the
modulatoi s with cyclotene as buffet lavei eee noticed that the films evcie lemoved dining the
dicing process We used theiefoie the cleaving method evhich tinned out to pioduce bettet
quality end-faces. We examined the finished end-faces using an election micioscope and
noticed that the chlteient polymer layers aie better distinguishable when cleaving is used (Fig
10 8b) Moieovei, at dicing the saee defoims the top buffet layer as shown m Fig 10 8a
Pig 10 S L la tion miii 'scope p t tili es >f end pices at atcd with two dtffa cut methods a) chain of a
^lll^- silicon wttfa isanpk PMP) and b) deanng ol a v/(W-> silicon wafa (sampleMZC2)
Electro-Optic Modulator Device Fabrication

117
10.6 Poling of Polymer Multilayers
Electrode poling was used for orienting the active molecules along a preferred direction. The
top electrodes were fabricated as described in Section 10.4 and used for both poling and modu¬
lation. The contacts were made using liquid silve. The applied voltage was in the range of 100
to 130 V/pm depending on the film quality. The poling temperature was 10-15 degrees above
the glass transition temperature of polymer A-95.11 (see Table 10.1 ).
top electiode
-«• top buflei lay et
-* active polymer layer
~« - bottom butfei layei
bottom electrode
substiate
"*- heat in« stasc
Fig. 10 9 Sdiematu tepiesentation of the electiode poling
Electro-Optic Modulator Device Fabrication

118
11 Electro-Optic Modulator Device Characterization
The fabricated phase and Mach-Zehnder modulators were characterized at the telecommuni¬
cation wavelengths of 13 13 nm and 1552 nm with respect to their half-wave voltage, extinction
ratio and optical losses. The methods used and the obtained results are presented in the follow¬
ing sections.
11.1 Characterization methods
11.1.1 Determination of the Half-Wave Voltage
To determine the half-wave voltage V^ of an electro-optic modulator we bring the working
point to the linear range of the output characteristic curve (see Fig. I l. I ) either by adjusting a
phase compensator (in the case of phase modulators) or by applying a DC bias voltage (in the
case of Mach-Zehnder modulators), and then eve, apply a modulating AC voltage of variable
amplitude. We observe the modulated optical signal and at the same time we gradually increase
the amplitude of the modulating signal. When the peak-to-peak amplitude of the modulating
signal is larger than the half-wave voltage of the modulator the peaks of the optical signal bend
inwards, as depicted in Fig. I l.i. By monitoring both signals on an oscilloscope, VK is easily
determined as shoevn in Fig. 11.2 for the modulator MZC1. A saw signal is normally used for
better accuracy. The exact experimental set-up used for these measurements is discussed in the
following subsections.
c
O)
Modulated optical signal
>Time
Fig. 11.1 Output characteristics ofan dectro-optit modulator for a modulating sinusoidal signal with a
peak-to-peak amplitude smaller or larger than the half-hare voltage. When the peak-to-peak
amplitude is larger than the half-w ax e voltage the peaks of the modulated optictd signal bend
inwards.
Electro-Optic Modulator Device Characterization

119
Time (ms)
fig 112 Lxpei intentai eleetio-optu i espouse of the fabi ic cited Mach-Zehndei electro-optic modulatoi
MZCl at f=l KHz and k=l d3 nm A saw signal is used foi bettet cicaiiacv Flic half-wene
xoltage (V = ^0 V ) is deduc 11/ fiam the peak-to-peak amplitude of the modulation \ oltage
needed foi the peaks of the modulated optical signal to stai t bending inwards (eompaie lo the
st heme of Fig III)
A. Experimental Set-Up for Phase Modulators
In the case of phase modulators eee transform the phase modulation to intensity modulation
using the set-up of Fig. 11.3. The laser light is polarized at +45° m front of the modulator and
then focused in the optical waveguide evith a microscope objective. The outeoupled light is col¬
lected by a second objective lens and then passes through an analy/cr set at - 45°. Field inde¬
pendent phase differences are compensated by a phase compensator positioned in front of the
analyzer. The modulating voltage from the signal geneiator is amplified and applied between
the top and bottom electrodes of the phase modulator and the transmitted optical signal is
detected by a photodetector. Both signals are monitored using an oscilloscope.
Fiber
Laser
Microscope-objective
x40 Sample
Compensator Photodetector
Polarizer
+ 45°
Microscope-objective
x20
©
Analyzer-45°
Oscilloscope
Fig 113
Signal generator
Expcr intentai set-up foi the half-waxe i oltage then etc ta nation of phase modulatoi i
Electro-Optic Modulator Device Characterization

120
B. Experimental Set-Up for Mach-Zehnder Modulators
The experimental set-up toi Mach-Zehndei modulatoi s is similai to that foi phase modula-
tois (shown in Fig 11 3) In this case howeeei, the transmitted light is already intensity modu¬
lated and theiefoie the analy/ei and the phase compensatoi can be omitted (see Ftg 11 4) To
bring the woikmg point to the lineai tange of the output chaiactei i she cuive a DC voltage
souicc is needed The polaiizei is set at zeio degtees to obtain light polaiization paiallel to the
applied electnc held and access the /13 tensoi element ot the electio-optic coefficient
Fiber
Laser
Microscopeobjective
x40 SamplePhotodetector
Polarizer
0°
Microscopeobjective
x20
©Oscilloscope
DC voltage Signal generatorsource
/ ig 11 4 I \paimaital set up for the half vas e \ rltage chaiac/t 11 ation of Mach Zehnda modulatoi s
11.1.2 Extinction Ratio
93 9 99 90
Losses Extinction ratio (%)
I ig lis Relation between h sscs cxlinctic n icitio in dB and in percent
The extinction latio 1] of an electto optic modulatot is defined as
1 xtinction ratio = lOlog/ ,7
in dB) (11 I)
Electro-Optic Modulator Device Characterization

121
evhere /'""/ (V = 0) is the maximum light intensity output and I"'ut' (V = Vn) is the mini¬
mum intensity that the optical output may be extinguished to. For reliable digital operation an
extinction ratio of 20 dB is required. For the conversion of the extinction ratio and the optical
losses from dB to percent, refer to Fig. I 1.5.
11.1.3 Optical Losses
Several mechanisms contribute to the optical losses of a polymer modulator. Not all of them,
however, can be determined. Tosses at the interfaces beteveen the polymer layers and losses at
imperfections (dust particles, air bubbles, phase separated areas etc.) constitute the scattering
losses usually given in clBAm. The scattering losses plus the intrinsic absorption losses of the
polymer at the operating evavelength are equal to the propagation losses, also measured m dB/
cm. Coupling light m and out ot the modulator induces additional losses -coupling losses—
which added to the propagation losses constitute the total losses of the modulator. The total
losses are defined as
rimes
: '.,,, t
Total losses = -I0loc(4/,
(in dB) (ll.2)
where I'^ffi is the maximum of the output light intensity and / is the input optical intensity.
iog(propagation losses *1 0
(dB/cm)
HS**
distance (cm)
Fig 11 6 Expeiiiiientcil set-up (left) foi the measurement of wasegmde jvopagation losses The light
scattaed pom tin top of the vaxeguiile is detected In an inflated tamera The slope of the
scatlaed light intensitx s logai ilhm \a sits piojxigatctl di staue e in em (left) is related to the
piopagation losses in tlBicrn
The propagation losses are measured using the imaging method. Light is coupled into a
channel waveguide and the light scattered from the top of the waveguide is imaged onto an
infrared camera using a lens. The recorded image is analyzed to obtain the relative scattered
light intensity along the evaveguide \ length, fhe slope of the intensity's logarithm versus prop¬
agated distance in cm is related to the propagation losses in dB/cm using the following expres¬
sion:
Propagation losses = -lOlog1/(07
(in dB/cm when \ in cm) (11.3)
evith /( \ ) the scattered intensity as a function of position v.
Electro-Optic Modulator Device Characterization

122
The total propagation losses of a modulator are found by multiplying the propagation losses
in dB/cm with the total length (in cm) of the modulator. Knowing the total and the propagation
losses, the coupling losses of a phase modulator are found by a simple subtraction. In the case
of Mach-Zehnder modulators losses at the tevo Y-junetions also contribute to the total losses.
They can be determined by subtracting from the total losses the propagation and coupling
losses measured in channel waeeguides of the same sample. An overview of the loss mecha¬
nisms contributing to the total losses of a polymer modulator are presented in Table 11.1.
Table 11.1 An merview of the loss mediaiüsnis contributing to the total losses of a polymer modulator
Losses at interfaces
+
Losses at imperfections
= Scattering losses
+
Absorption losses
= Propagation losses
+
Coupling losses
+
Y-junction losses'1
= Total losses
a. For Mach-Zehnder modulators
11.2 Performance of Fabricated Electro-Optic Modulators
Two kinds of phase modulators (PMP and PMC) and three kinds of Mach-Zehnder modula¬
tors (MZC1/2/3) were fabricated and their performance investigated. Light modulation evas
possible to detect for modulators PMP, PA1C, and MZCl. In the following paragraphs results
on the overall performance of the fabricated modulators are presented. An overview of the
results is given in Table 11.3.
11.2.1 Phase Modulators
Phase modulators were easy to fabricate as no special waveguide design and no electrode
structuring evas required. Losses are substantially loever for phase modulators and there is more
flexibility in the choice of the top buffer layer as no veet treatment is involved.
Electro-Optic Modulator Device Characterization

123
A. Modulator PMP
Ec
o
r-r--
o
73
A
V
PI - 293 (2990 nm)
A-95.11 (1720 nm)
PI - 293 (3080 nm)
Efficient poling (r^ = 13.9 pm/V at 1552 nm)
Short interaction length ( / = 0.3 cm)
Large half-wave voltage (VA = 124 V)
High total losses (13.3 dB)
Free floating deposition of top buffer layer
By using polyimide PI-293 as buffer very efficient poling was obtained. The effective elec¬
tro-optic coefficient is practically the same as in single layer samples. The short interaction
length of the sample (/ = 0.3 cm) resulted in a high half-wave voltage of V = 124 V at 1552
nm. The total losses (13.3 dB) are high for such a short sample and attributed to the poor qual¬
ity of the end-faces created by dicing as evell as to the loev quality of the second A-95.11/PI-
293 layer interface because the top buffer evas deposited by free floating and not by spinning.
B. Modulator PMC
Ec
oo
coco
o
-o
Cyclotene (2400 nm)
A-95.11 (2000 nm)
Cyclotene (2400 nm)
• Moderate poling (r,3 = 4.9 pm/V at 1313 nm)
• Large half-wave voltage (VA = 52 V)c- c? x Jf /
• High losses (18.5 dB)
» Possibility to spin top layer• Wet processing resistant
The use of cyclotene as buffer layer allowed spinning of all layers and evaveguide structuring
by illuminating evith ultraviolet light through the top buffer layer. The total losses are high
(18.5 dB) but acceptable if we consider the length of the sample (/ = 1.5 cm). The poling effi¬
ciency, however, is almost one third (r „ = 4.9 pm/V at 1313 nm) of the maximum obtained by
poling single layer samples. This effective electro-optic coefficient corresponds to a half-wave
voltage of 52 V. The extinction ratio is low (n =9 dB) due to the multimode waveguiding in
the horizontal plane resulting from the ee ide waveguides.
11.2.2 Mach-Zehnder Modulators
The fabrication of Mach-Zehnder modulators is more critical than that of phase modulators
due to the importance of the structure design on the guiding of light, especially at the Y-junc-
tions. to the additional processing steps for the structuring of the driving electrodes, and to
their precise positioning over the waveguides. Using wide waveguides, as in the case of MZCl.
light modulation was obtained but with a loev extinction ratio due to the higher order modes
that may also be guided. By reducing the waveguide width from 8 urn to 2.5 urn to obtain
monomode waveguiding conditions, losses were too high to allow detection of modulation.
Electro-Optic Modulator Device Characterization

124
A. Modulator MZC1
• Moderate poling (r-y = 5.1 pm/V at 1313 nm)
• Large half-wave voltage (VT = 50 V)
• High losses (25 dB)
• Good extinction ratio (r\ =13 dB)
• Possibility to spin top layer
• Wet processing resistant
The MZCl modulator was fabricated from the same sample as the phase modulator PMC.
The interferometric structure eeas successfully imprinted in the active layer by photobleaching
and the driving electrodes were formed and aligned to the underlying structure. Although niuJ-
timode, MZCl has an improved extinction ratio (n = 13 dB). The poling efficiency is similar
to that of the phase modulator PMC (; ^ = 5.1 pm/V at 1313 nm) resulting in a half-wave volt¬
age of Vn = 50 V. The losses (25 dB) are higher than in the phase modulator PMC but still
acceptable for light modulation to be detected.
B. Modulators MZC2 and MZC3
• Monomode evaveguides (width = 2.5 urn)
• High losses (> 25 dB)
• No light modulation detectable
• Possibility to spin top layer• Wet processing resistant
Modulators MZC2 (using the original A-95.11 polyimide) and MZC3 (using the newly syn¬
thesized A-95.1 1 polyimide) are m all aspects, except for the active layer, identical. They were
designed to allow monomode waveguiding and optimum mode confinement in both horizontal
and vertical directions. The total thickness of all three layers is smaller than that of previous
samples to allow smaller half-wave voltages. With flawless samples poling was achieved by
applying an electric field of 100V/um. However, no light modulation could be detected. The
outcoupled light eeas too weak to be detected by a photodetector. The total losses are higher
than 25 dB at 1313 nm. To detennine the origin of these losses, eve measured the total and
propagation losses of channel evaveguides from the same samples and calculated the expected
coupling losses. To couple light into the waveguides an objective lens evith a magnification of
x40 evas normally used. The beam waist at the focal point was around 20 pm. The waveguide's
dimensions being 1x2.5 urn, it is clear that there is a big mismatch between the profile of the
incident light and the mode profile. To reduce this mismatch we used the light coming out
directly from the core of a single mode silica fiber having a core diameter of 8 pm to couple
light into the waveguide. Measurements of propagation losses of samples MZC2 and MZC3
are presented in Fig. I 1.7 and Fig. 11.8. respectively. The results on the losses measured at
1313 nm and 1552 nm are listed in Table 11.2.
tc
o
o
coCD
o
IS
Cyclotene (2400 nm)
A-95.11 (2000 nm)
Cyclotene (2400 nm)
c f Cyclotene (2000 nm)co
g A-95.11 (965 nm)
o ^ Cyclotene (2400 nm)"T-(
Electro-Optic Modulator Device Characterization

125
1.9
1.8
S 1.7 hCO
I 1.6
TO I Pj
1.4
5.5±0.5 dB/cm at 1.3um1.9
1.8
1.6
1.5
1 4
3.7±0.4 dB/cm at 1.5pm
§
1
Z3
É.
mc
Bc
O)o
*¥
i i i
0.0 0.1 0.2
Propagation distance [cm]
0.0 0.1 0.2
Propagation distance [cm]
Fig. Il.7 Propageition losses of seimple MZC2 at 7 =1313 nm and X =1552 nm determined by detec t-
ing the scattered light from a t liannel w en eguide of 2 \»m width.
3
Ä
cöc
CD
.5
o
6.6±0.5 dB/cm at 1.3um1.9
? 1.8çyP
S 1.7
CO
§ i.6k
oKvJ
0.0 0.1 0.2
Propagation distance [cm]
1.4
5.2±0,5 dB/em at 1.5um
£>
0.0 0.1 0.2
Propagation distance [cm]
Fig. 11.8 Propagation losses of sample MZC3 eit 7 =1313 nm and 7 =1552 nm determined by detect¬
ing the scattered light fiom a channel wen eguide of 2 5pm width.
From the results listed in "fable 11.2 eve note that:
• Propagation losses at 1313 nm are higher than at 1552 nm as expected from the Ray-
leigh's inverse fourth-power law.
Coupling losses at 1313 nm are slightly smaller than the coupling losses at 1552 nm
due to the fact that the waveguides were designed to be monomode and to allow better
light confinement at 1313 nm.
Propagation losses of MZC3 are higher than those of MZC2 at both wavelengths. Con¬
sidering that all fabrication steps and parameters are identical, eve attribute this differ¬
ence to the loever molecular weight (< lO'OOO) of the new A-95.11 polyimide used in
MZC3 than that (641)00) of the original polyimide used in MZC2 which increases the
scattering losses of the material.
• Coupling losses are slightly lower when coupling light from the fiber core than when
using a x40 objective lens due to better overlap of fiber and waveguide optical modes.
* Rayleigh scattering law: Scattered intensity x X04. evith 7f) the evavelength of light
in vacuum.
Electro-Optic Modulator Device Characterization

126
Table 112 Coupling and piopagation losses of channel wa\ eguicles from the samples used to fabricatemodulators MZC2 (original A-95 II polyimide) and MZCl (new A-9S~ 11 polyimide) Losses
cue reported at k=HH run and 7 =1552 nm "\40" denotes coupling using an objecto e lens
with a x40 magnification (beam waist = 20 urn) and "fiber" denotes coupling using the lighttluecth coming out of the cote (diametei =8 urn) of a single mode silica fihei
Wavelength 7=1313nm 7= 1552 run
Sample MZCA MZC3 MZC2 MZC3
Coupling x40 x40 fiber x40 x40 fiber
Couplinglosses [dB]
14+1.2 12.2±i 11.2+1 16±1A 14.6+1.2 13.8±1
Propagation, -±() 5 66±()5 37±(}4 52±Q^
losses [dB/cm]
From the data in Table 11.2 we can calculate the total losses of a channel waveguide of 1.5
cm length which corresponds to the total length of the modulators MZC2 and MZC3. By doing
so, we come up with losses in the order of 21-23 dB for both samples at both wavelengths. The
fact that the total measured losses are higher than 25 dB implies that there must be additional
losses, higher than 2-4 dB, at the Y-]unctrons. The ougin of these losses may he on the sharp¬ness of the refractive index boundaries m connection with the small width of the waveguides.El forts to observe such losses by imaging the light scattered at the Y-junctions were not suc¬
cessful due to restricted resolution and low scattered light intensity. We could image, howevei,
the output of a Y-junction (see Fig. 11 9). It can be noticed that not all light is coupled out
through the evaveguides; instead there is light leaking into the planar waveguide either at the
point of the junction or at the mcotiphng end-face.
Table 11 3 Technical and pa foi menue data of the fabricated eleetio-optic modulators The four samples are
depicted m fig 10 1 I is the input light intaisits at the gnat wcnelengtli D stands for dicing and C
fin elecmng of the eittlfates W is the waxegmde width I is the nita action length, F., is the polmgvoltage, \ is the half-wtn e i oltage ineasuiecl at a fiee/uencx of I kHz i
,,is the dec tio-optn
coefficient and 1] is the extinction ratio I he losses toi lespemel to the total losses as defined in Table
11 I
SampleI End- W I Vp 7-t '73 rj Losses
(mW) faces (um) (cm) (V/um) (V) (pm/V) (dB) (dB)
m 14 8 \~>
0PMP ^AA: D 8 0.3 130 7 13.9 - 13.3
<d 3 @Ls.s2 nm 4
i ,3 -,°*
o PMC ,.,A C 8 1.5 100 52 4 9 9 18.5E (a) 1iA nm
MZCl „,7, C 8 1 100 50 5.L 13 25(n)lili nm
^ ts
<U rt
N "3
O C; MZC2/Î1.8
S C @ 111 i nmC 2 5 0 5 100 - - - >25-1
a Outcouplcd light under the deteuion limit of the photodetectoi
Electro-Optic Modulator Device Characterization

127
As the dimensions ot the waveguide decrease, the refractive index boundaries become more
critical for efficient light guiding. The simulations performed to predict the light propagation in
the Mach-Zehnder interferometer and to design the photolithographic masks were based on
step-like defined refractive index boundaries. Although this is true in the vertical direction
where the boundaries are defined by the different polymer layers, in the horizontal direction
boundaries are formed by photobleaching by evhich a refractive index profile is created. It
might therefore be necessary that simulations are performed implementing the refractive index
profile of the bleached areas rather than working with effective refractive indices as described
in Section 8.2.
Fig 119 Light c oupleel out erf a Y-jiuit tion at 15^2 run The w tilth of the w en eguides is 2 S pin
Electro-Optic Modulator Device Characterization

128
12 Discussion and Conclusions (Part C)
12.1 Discussion
Polyimide A-95.11 was developed in the early nineties through a collaboration of the Non¬
linear Optics Laboratory, Sandoz Optoelectronics, and the Paul-Scherrer Institute (PSI). The
first efforts to form optical waveguides were undertaken at the PSI in 1993.The etching tech¬
nique was implemented to form rib evaveguides w ith non-commercial polyimides as buffer lay¬
ers. A Mach-Zehnder modulator with an interaction length of 25 mm was fabricated and poled
with an electric field of 137 V/pm. The half-wave voltage evas 212 V corresponding to an
effective electro-optic coefficient of 0.36 pm/V at 1547 nm. The total losses were 40 dB and
the propagation losses were 3.7-4.9 dB/cm at 1313 nm and 2.2-3.1 dB/cm at 1547 nm. hi this
work, we considerably improved this performance in the following aspects:
• We fabricated optical waveguides using the easier technique of photobleaching.• We used a commercial polymer as buffer layer.• We reduced the half-wave voltage by more than a factor of four.
We improved the poling efficiency by a factor of 14,
• We reduced the total losses by 15 dB.
As far as the modulation improvement is concerned, eve attribute it to the better poling effi¬
ciency. Although we pole at lower electric fields (100 V/itm) eve apply the poling voltage until
the sample is cooled down to room temperature whereas at the PSI attempts voltage was turned
off at 100 °C to prevent shortcuts resulting from high currents and film defects.
Concerning the losses, we used a x40 objective lens (instead of a x20. at the PSI) which
surely reduces the coupling losses. Our propagation losses are about 20% higher. This may be
due to the tails of the optical mode evhich propagate in the buffer layers and the bleached area.
As cyclotene is a low-loss material eee can exclude it as a source of losses. We showed, how¬
ever, in Chapter 5 that photobleaching increases the propagation losses of A-95.11 by around
1.5 dB/cm. The tails of the guided mode in the horizontal direction propagate in the bleached
area and they contribute additional losses to the total propagation losses of the mode.
Despite this improvement compared to previous work, the aim of even lower half-wave volt¬
ages (less than 10 V) could not be achieved. The reason for this is twofold: poling efficiency
and optical losses. High losses restrict us to loee interaction lengths and. therefore, higher half-
wave voltages. Half-wave voltage as a function of interaction length is presented in Fig. 12.1
for three different cases. The solid line corresponds to the MZCl sample evith a filled circle
denoting the fabricated modulator. To reduce half-wave voltage below 10 V an interaction
length of 5 cm is needed. Such a long modulator evould have total losses of more than 40 dB.
The dashed line eorresjwnds to an improved version of MZC2 where waveguide dimensions
are optimized but the poling efficiency is the same. A maximal decrease of 10 V for the half¬
wave voltage could be achieved for the same interaction length. The aim of 10 V could be
attained using an interaction length of 4 cm evhich evould result to total losses of more than 45
dB as can be derived from the data of Table 11.2. Half-wave voltages of less than 10 V could
only be accomplished with a polmg efficiency corresponding to that of a single layer (r^ =14
pm/V at 1313 nm) and an interaction length of 1.5 cm. With the currently used buffer, however,
See "PSI TcchnisLhcr Beucht JMx 17.1 1.93"
Discussion and Conclusions (Part C)

129
this efficiency could not be attained and with the described fabrication approach losses would
be even larger than the ones measured with our samples.
In conclusion, to further impiove the performance of Mach-Zehnder modulators based on
polyimide A-95.11 the folloeemg points should be consideied:
Another buffer material combining the good physical properties of cyclotene evith bet¬
ter polmg efficiency toi the A-95.11 polyimide should be used.
• Tapets should be used at the input waveguides to allow gradual matching of the fibei
mode to the ee ae eguide mode and reduction of the coupling losses.
• Beam propagation simulations of the designed Mach-Zehnder interferometers should
include the retractive index profile of the bleached area to better model the behavioi of
light at the Y-junctions.
60
>
>
50 —;
40
30
20 -
fabricated MZC1 modulator
MZC1 d= 6 8iim, r33 = 5.1 pm/V
MZC2 d= 5 36!_im, r33 = 5 1 pm/V
....... MZC2 d = 5 36iim, r33 = 14 pm/V
10 - -
Aimed V-,
Fie 12 I
0 12 3 4
Interaction length (cm)
Theoieticed am es of half-wax e \oltaçc V \ei sus intente tion P ngth 1 fet/uation (9 1 if foi a
tlucc laxa (cxdotenc A 9i // txdotene) Madi-Zehndei modulatoi I lie solid line represents
modulatoi s based on the MZCl sample lite dashed line upiesents modulators based on the
MZC2 sample assuming same polmg cffiaaicx en m sample MZC I I he dotted line is similar
to the dashed one but assuming optimized poling effit tent v el is the total sample thickness,
i^
is the effettne elettio optic cocffiaatt and the filled aide represents the fabiicateclMZCl modulatoi
Discussion and Conclusions (Part C)

130
12.2 Conclusions
• Solution concentration - spin rate - film thickness curves for forming thin films of
polyimide A-95.1 lwere determined.
• Photobleaching was successfully used for the fabrication of optical evaveguides in
Polyimide A-95.11.
• Cyclotene was found to be the most appropriate buffer material of those investi¬
gated and was used lor the fabrication of phase and Mach-Zehnder modulators.
• Two methods ot electrode structuring (direct and lift-off) were investigated and
the right parameter values for a precise photolithographic process using the best
of these methods (direct structuung) were determined.
• Two methods of creating end-faces (dicing and cleaving) were investigated. Best
results were obtained using cleaving of silicium wafers along their crystallo¬
graphic axes.
• Beam propagation computer simulations were performed to simulate the perfor¬
mance of various Mach-Zehnder interferometer designs.
• New photolithographic masks for the fabrication of thinner waveguides and driv¬
ing electrodes were designed and fabricated.
• Prototype phase and Mach-Zehnder electro-opttc modulators were fabricated and
characterized. A halt-wave voltage ol 50 V for a 1 cm electrode length and an
extinction ratio of 13 dB have been achieved.
• Poling efficiency was found to be substantially reduced when cyclotene is used as
buffer layer and propagation as well as coupling losses of polyimide A-95.11
were found to be considerably high in this three layer system.
Discussion and Conclusions (Part C)

131
13 General Conclusions and Outlook
In this work novel organic molecules were investigated in terms of their nonlinear optical
properties and their potential for offering functionality to electro-optic polymers. Microscopic
nonlinearities as evell as macroscopic electro-optic performance in polymer hosts were deter¬
mined and their dependence on intermolecular electrostatic interactions was studied. The pho¬
tobleaching mechanisms of polyimide A-95.11 eeere studied and modeled. Integrated
polymeric phase and Mach-Zehnder electro-optic modulators were fabricated by forming pho¬
tomduced waveguides and were characterized evith respect to their modulation performance
and optical losses.
Part A: Novel Nonlinear Optical Molecules for Electro-Optic Polymers
Zwitterionie molecules (bearing an anion and a cation) were identified to have large ground
state dipole moments (u ) but average first-order hyperpolari/abilities at infinite wavelength
(ß0) resulting in moderate values for the figure of merit uß0. They easily form aggregates
even at loev concentrations.
Dibithiophene molecules (bearing two bithiophene units) were found to be photochemically
unstable and soluble only in very polar solvents. Their low figure of merit is attributed to the
overcontribution of the charge-transfer state -at the expense of the ground state- to the first-
order hyperpolarizability due to the high solvent polarity and the Icwv aromaticity of the ground
state. A long sequence of thiophene rings seems to lead to a far too low bond-length alterna¬
tion, beyond the value maximizing the first-order hyperpolarizability of the molecule.
Phenylethenyl bithiophene molecules with strong electron donor and acceptor groups are a
substantial improvement ofdibithiophen.es. Values of the figure of merit u.ß0 up to 9300x106C
m^CV (nine times larger than that of the standard nonlinear optical molecule Disperse Red 1)
and thermal stabilities up to 343 °C were obtained. Phenylethenyl bithiophene molecules arc
among the most efficient yet stable nonlinear optical chromophores reported so far.
Phenyltetraene molecules with specially attached bulky endgroups and carbon side-chains
exhibit large molecular nonlinearities and very good solubilities due to increased intermolecu¬
lar distance and, therefore, decreased intermolecular interactions. They add an additional
aspect to the typical strategy of developing highly efficient molecules by using strong donor/
acceptor endgroups and highly conjugated bridges. They introduce the concept of making use
of the full potential of a molecule's nonlinearity by hindering dipole formation and cither inter¬
molecular interactions such as hydrogen bondings. This approach led to electro-optic coeffi¬
cients up to r^= 24 pm/V at 1.5 um for a chromophore loading of 15 weight% in a
polymethylmethacrylate host.
The influence of intermolecular interactions to the nonlinearities of selected compounds evas
investigated and discussed. Microscopic nonlinearities of molecules with hydroxy donor
groups arc enhanced in oxygen-containing solvents clue to the foi rnation of intermolecular with
a concurrent reduction of intramolecular hydrogen bonds. Macroscopic nonlinearities deviate
from the classical linear dtmendence on the molecular number density. When intermolecular
interactions, dipole moment, molecular shape, and dimensions are taken into account, nonlin¬
earities peak at a certain concentration and measured eallies are better related to theoretically
expected ones. Therefore neither u|>() nor uß()/MlV are appropriate figures of merit for com¬
parison of molecules of large dipole moment and/or different shape.
General Conclusions and Outlook

132
Phenylethenyl thiophene molecules are very promising for polymer electro-optic applica¬
tions. They combine large nonlinearities with high thermal stability. First studies to incorporate
them as side-chains to polyimide and polyquinoline hosts showed that loadings up to 70% and
5077 respectively, can be achieved. To hinder aggregation and intermolecular interactions the
molecules should be modified to obtain a more spherical shape. Bulky endgroups and/or car¬
bon side-chains, the approach used for the phenyltetraenes, is one possibility. A second one
recently suggested, is the one using molecules as the core of a dendrimer. This way the shape is
kejit spherical and, as dendrimers can be spun into films, high molecular concentrations can be
achieved. A monothiophene molecule similar to CC201 attached to a dendrimer evas reported
to have an electro-optic coefficient of rv,
= 60 pm/V at J 550 nm and to be stable for more than
1000 hours at 85 °C 11231.
Part B: UV-Photobleaching Mechanisms of Side-Chain Polyimide A-95.11
The photobleaching mechanism of side-chain polyimide A-95.11 was investigated with
respect to the photoinduced changes of the material's optical losses, refractive index, and
absorption spectrum. The losses increased considerably (by 1.5 dB/cm at 1552 nm) after pho¬
tobleaching and a strong birefringence (An = 8x1(7 ) evas observed. Absorption spectra indi¬
cated that the photobleaching process consists of two parallel occurring steps; an isomerization
from a trans-TE state to a eis state and a decay of the eis state to a trans-TM and a stable state.
The processes were theoretically described and the time evolution of the absorption peaks was
modeled to reveal the absorption cross section ratio of the two isomer states and the material's
bleaching constant (3.3 ± 0.25x1(7' m~/J) which evas needed to calculate the refractive index
profile of photobleached films. Fourier-transform infrared spectroscopy pointed out that two of
the possible conformations of the photostable state can be the absence of the nitro group and
the opening of the azo bond of the attached active molecule.
Photobleaching as a technique for the formation of optical channel waveguides in polyimide
A-95.11 is easy to implement and creates thermally stable waveguides. Compared to the etch¬
ing technique, evaveguides are not formed by physical boundaries which may introduce losses.
On the other hand, the refractive index boundaries created by photobleaching are not sharply
defined and mode confinement and propagation become critical at sensitive parts of waveguide
structures such as the Y-junctions of a Mach-Zehnder interferometer. The generated refractive
index profite should therefore be experimentally determined and implemented to the beam
propagation simulations to better account for losses at the junctions.
Part C: Polyimide-Based Electro-Optic Modulators
The design and fabrication of evaveguide electro-optic modulators evas described. Cyclotene
was selected among a number of passive polymers to form the buffer layers as it is commer¬
cial, resistant to the wet processing needed for the electrode structuring, and forms high qualityfilms. Waveguide mode analysis and the beam propagation method were used to determine
layer thicknesses, wae eguide structure, and duration of photobleaching. Direct photolitho¬
graphic structuring was used for the formation of the driving electrodes and substrate cleaving
was applied for the construction of smooth end-faces. Phase and Mach-Zehnder modulators
were fabricated and characterized with respect to their losses, extinction ratio, and half-wave
voltage. We drove a Mach-Zehnder modulator with 50 V and obtained an extinction ratio of 13
General Conclusions and Outlook

133
dB at 1313 nm. The total losses were 25 dB and the effective electro-optic coefficient evas r,, =
5.1 pm/V.
Effective poling of multilayer structures and optical losses were designated to be the main
issues to be addressed to fabricate Mach-Zehnder modulators of improved performance. It is
not possible to obtain a modulator with a half-wave voltage smaller than 10 V and interaction
length shorter than 4 cm using polyimide A-95.11 as active material and cyclotene as buffer
layer. If another buffer polymer alloeeing optimal poling efficiency is used, half-wave voltages
smaller than 10 V for interaction lengths shorter than 1.5 cm are feasible. To further decrease
the driving voltage, however, tevo eeays may be folloeved. A push-pull electrode design would
reduce the half-wave voltage by half at loev frequencies. The device fabrication becomes then
more complicated and poling is more sensitive to sample quality. A further decrease, e.g. \T<
1 V, is only possible if a polymer with an electro-optic coefficient of at least 70 pm/V is used as
active layer. Such performances have almost been realized. A guest-host system of the phe¬
nyltetraene molecule CLD-1 in polymethylmethacrylate (30 evtAo) was measured to have an
electro-oj^tic coefficient of 58 pm/V and was used for the fabrication of a sub-1-Volt half-wave
voltage polymeric electro-optic modulator [81 J.
The following points summarize the main achievements of this work.
• Novel phenylethenyl bithiophene molecules for electro-optic polymer applica¬tions were developed. Having high decomposition temperatures and enhanced
molecular nonlinearities, they are among the most efficient yet stable nonlinear
optical chromophores reported so far.
• The influence of the intermolecular solute-solute and solute-solvent interactions
on the molecular nonlinearity was investigated by changing the shape of jthe-
nyltetraene molecules. Bulky endgroups and carbon side-chains were identified to
enhance the solubility and the optical nonlinearity due to increased intermolecular
distance and, therefore, decreased intermolecular interactions.
• The existing models describing the photobleaching process of molecules undergo¬
ing cis-trans isomerization were extended considering two concurrent bleaching
processes and taking into account photoinduced birefringence. Using this model
the bleaching constant and the absorption cross section ratio of the tevo isomer
states of the electro-optic polyimide A-95.11 were determined.
• The procedure for the design and fabrication of electro-optic waveguide modula¬
tors based on polyimide A-95.11 and commercial buffer polymers was developedand implemented for the production of a prototype Mach-Zehnder modulator.
General Conclusions and Outlook

134
Appendix
A.1 Microscopic Nonlinearities of Investigated Molecules
(Detailed discussion in Section 2.2)
\g(nm)
tißa PPoT ,
Molecule Solvent (KT69
mVv1)(io-60
ir^cr1)
'cl
(°C)
Zwitterionic Molecules
Zl Dioxane 509 3110 2050 _
Z3 Dioxane 524 2990 1950 207
Dibithiophene Molecules
BTNO DMPU 520 1220 790 _
BTCN DMPU 481 980 680 -
Phenylethenyl Bithiophene Molecules
CC172 Dioxane 655 14740 6650 249
CC175 Dioxane 611 5510 2910 308
CC176 Dioxane 655 19960 9300 238
CC 197 Dioxane 575 5760 3330 713
CC201 Dioxane 623 9550 5000 250
Phenyltetraene Molecules
CLD1-3 THF 608 6000 3200 271
CLD-l THF 648 H AX) 64 w) 275
CLD-4 4F1F 649 18140 8620 259
CLD-5 THF 650 14320 6780 254
Chloiotoim 661 10760
1550
4920
Disperse Red 1 Dioxane 510 1030 A18
,i Xleasuicd with F FISH at 1907 nm Hioi = ±tor(
Appendix

135
A.2 Macroscopic Nonlinearities of Investigated Molecules
(Detailed discussion in Section 2.2)
Molecule7(>, (nm)
in PMMA
7(,„ (nm)
inPQlOO
r,-, ,l(pm/V)
m PMMA
2.7+1
r„a(pm/V)
inPQlOO
CC176 686 736 -
CC172 679 725 10+1 4.5+1
CC201 649 676 5.5±1 2.4+1
CC197 594 611 2.5+1 2.4±l
CLD-I 657 698 19.3+3 11.5+2
CLD-4 656 687 24+3 19±2
a Loading I 5 \vi d, poling held 10()V/um
A.3 Photobleaching Parameters of Polyimide A-95.11
abs. cross section (eis state) / °<
abs. cross section (trans-TE state) <j
trans-TE-^eis transition rate
per unit intensity(= bleaching constant)
(ci.s-^.stable + cis-> trans-TM)
transition rate per unit intensity
IF
8lt // = BC
(o + u )//
0.68+0.03
v42.00+0.15-10~4 cnr-miiF '-mW
= 3.30±0.2570"7m2-r1
L35+0.13-10"4 cnr-miif'-mW"
= 2.23+0.157 O^nr-T1
Appendix

136
A.4 Performance Characteristics of Fabricated EO Modulators
Sample/ End- IF / 1
p Vn f^ i] Fosses
(mW) faces (urn) (cm) (V/utrO (V) (pm/V) (dB) (dB)
05
~ PMP I*}'8 D 8 0.3 170*2
13.9 - 13.3S @1.55um 4
^o PMC^,
7, C 8 1.5 100 52 4 9 9 18.5£ (ell M\\m
MZCl ^,7, C 8 1 100 50 5.1 13 25
G o
^ IS
+3 o MZC2/3 ',, C 25 0.5 100 - - > 25a
a Outcoupled light undei the detection limit ol Ihe pliotcxletectot
A.5 Conversion Between Electrostatic and SI Units
u (10lg Cm) =0.333 x u(D=10lscsu)
ß (1040m4/V) =4.192 x ß (10*°esu)
u ß ( 1069 mV/V) = 1.3973 x u ß < 10
48esu)
d (pm/V) =0.4192 x d (I0"9esu)
Appendix

137
List of Publications
Journal Publications
Publications related to this thesis
I. Liakatas. M. S. Wong, Ch. Bosshard. M. Ehrensperger, and P. Günter, "Stilbazolium Based
Zwitteiionic Chromophores for Electro-Optic Polymers". Ferroeleetrics, 202, 299-306 (1997)
C. Cai, 1. Liakatas. M. S. Wong, Ch, Bossbard, and P. Günter, "Synthesis and Nonlinear
Optical Studies of Highly Efficient Chromophores with Bithiophene Stilbene as the Conjugat¬
ing Unit". Polymer Preprint*. 39, 1111 (1998)
C. Cai. I, Liakatas. M. S. Wong. M. Bosch. Ch. Bosshard, P. Günter. N. Tirelli, S. Concilio,
and U. W. Suter, "Donor-Acceptor Substituted Phenylethenyl Bithiophenes: Highly Efficient
and Stable Nonlinear Optical Chromophores", Org. Lett., 1, 11. 1847 (1999)
I. Liakatas, C. Cai, M. Bosch, M. läger, Ch. Bosshard. P. Günter, (7 Zhang, and L. R. Dal-
ton, "Importance of Intermolecular Interactions on the Nonlinear Optical Properties of Poled
Polymers", Appl. Phys. Lett., 76, 1368 (2000)
I. Liakatas. M. läger, Ch. Bosshard. P. Günter, and T Kaino, "Photobleaching Mechanism
Studies of Side-Chain Polyimides"', Nonlinear Optics, in print
Publications not related to this thesis
I. Liakatas, M, S. Wong, V. Gramlieh. Ch. Bosshard, and P. Günter, "Novel, Highly Nonlin¬
ear Optical Molecular Crystals Based on Multi-Donor Substituted 4-Nitrophenylhydrazones",Adv. Mater., 10, 10.777(1998)
C. Cai, M. Bosch. Y. Tao, B. Müller. Z. Gan. A. Kündig, Ch. Bosshard, I. Liakatas, M. Tiger,and P. Günter, "Self-Assembly in Ultrahigh Vacuum: Growth of Organic Thin Films with a
Stable In-Plane Directional Order", 7. Ant. Chem. Soc. 120. 33. 8563 (1998)
C. Cai, M. Bosch, B. Müller, Y. Rio, A. Kündig, Ch. Bosshard, Z. Gan, I. Biaggio. I. Liaka¬
tas, M. Jäger, H. Schwer, and P. Günter, "Oblique Incidence Organic Molecular Beam Deposi¬tion and Nonlinear Optical Properties of Organic Thin Films with a Stable In-Plane Directional
Order", Adv. Mater., 11, 9, 745-749 ( 1998)
I. Liakatas, AI. S. Wong. Ch. Bosshard. and P. Günter, "Highly Polar Molecular Crystals for
Electro-Optic Applications". Ferroelectric v. 223, 345-355 (1999)
M. Bosch. I. Liakatas, M. Jäger, Ch. Bosshard. and P. Günter. "Polymer Based Electro-OpticInline Fiber Modulator", Ferroeleclr ics. 223, 405-412 (1999)
C. Cai, M. Bosch, Ch. Bosshard, B. Müller. Y. Tao, A. Kündig, J. Weckesser, J. V, Barth, L.
Biirgi, O. Jeandupeux, M. Kiy, I. Biaggio, 1. Liakatas, K. Kern, and P. Günter, "Self-Assembly
List of Publications

138
Growth of Organic Thin Films and Nanostructures by Molecular Beam Deposition, An Inter¬
esting and Unexpected Story", ACS Symposium Sen, in print
VI. Bosch, C. Fischer, C. Cai, I. Liakatas, Ch, Bosshard, and P. Günter, "Photochemical Sta¬
bility of Highly Nonlinear Optical Bithiophene Chromophores", Synth. Met., in print
Conference Presentations
Presentations related to this thesis
I. Liakatas, M. S. Wong, Ch. Bosshard, M. Bosch, and P. Günter, "Novel Zwitteiionic Chro¬
mophores for Electro-Optic Polymers", Materials for Nonlinear Optics. Capri, Italy (1997)
I. Liakatas, C. Cai, M. Bosch', M. Jäger, Ch. Bosshard, P. Günter, C. Zhang, and L. R. Dal-
ton, "Intermolecular Interactions of Highly Nonlinear Optical Molecules for Electro-Optic
Polymer Applications", Organic Thin Films, St. Clara. USA ( 1999)
I. Liakatas, C. Cai, M. Bosch, C. Fischer, M. läger, Ch. Bosshard, and P. Günter, "Highly
Efficient and Stable Bithiophene-Based Nonlinear Optical Chromophores for Polymer Electro-
Optic Applications", CLEO2000, San Francisco, USA (2000)
I. Liakatas, M. Bosch, Ch. Bosshard,C. Cai. and P. Günter, "Highly Efficient and Stable
Chromophores for Polymer Electro-Optic Applications", FCAPD-5, Jurmala, Latvia (2000)
1. Liakatas. VI. Jäger, Ch. Bosshard, P. Günter, and T. Kaino, "Photobleaching Mechanism
Studies of Side-Chain Polyimides". ICON'0'5, Davos, Swit/erland (2000)
Ch. Bosshard, I. Liakatas, M. Bosch, C. Cai, C. Fischer, and P. Günter, "Novel Highly Effi¬
cient and Stable Chromophores for Polymer Electro-Optic Applications". EMRS, Strasbourg,
France (2000)
Presentations not related to this thesis
I. Liakatas, M. S. Wong, Ch. Bosshard, and P. Gunter, "Nonlinear Optical Chromophores
based on Multi-Donor Substituted 4-Nitrophenylhydrazones", Materials for Nonlinear Optics,
Capri, Italy (1997)
1. Liakatas, M. S. Wong, Ch. Bosshard, and P. Günter, "Highly Polar Molecular Crystals for
Electro-Optic Applications". ECAPD-4, Montreux, Switzerland (1998)
M. Bosch, 1. Liakatas, M. Jäger. Ch. Bosshard. and P. Giiuter, "Polymer Based Electro-Optic
Inline Fiber Modulator". ECAPD-4, Montreux, Switzerland (1998)
'
Presented b\
List of Publications

139
M. Bosch, C. Fischer, 1. Liakatas, C. Cai, Ch. Bosshard, and P. Günter. "Photochemial Sta¬
bility of Highly Nonlinear Bithiophene Chromophores for Electro-Optic Applications",
Organic Thin Films. St. Clara. USA (1999)
C. Cai. M. Bosch. Y. Tao, B. Müller, A. Kündig, Ch. Bosshard, 1. Liakatas, I. Biaggio, and P.
Günter, "A New Type of Nonlinear Optical Materials Based on Strong Head-to-Tatl Hydrogen
Bonding". Am. Cliem. Soc. National Meeting, New Orleans, USA (1999)
M. Bosch, I. Liakatas. C. Cai, Ch. Bosshard, and P. Günter, "Polymer Based Electro-Optic
Inline Fiber Modulator with 1 GHz Bandwidth", ICONO'5, Davos. Switzerland (2000)
M. Bosch, C. Fischer. C. Cai. I. Liakatas, Ch. Bosshard, and P. Günter, "Photostability of
Highly Nonlinear Chromophores for Electro-Optic Applications", ICONO'5, Davos. Switzer¬
land (2000)
M. Bosch, C. Fischer. C. Cai, I, Liakatas, Ch. Bosshard. and P. Günter, "Photochemical Sta¬
bility of Highly Nonlinear Optical Chromophores for Electro-Optic Applications",
CLEO2000IEurope, Nice. France (2000)
Book chapters
Ch. Bosshard, R. Spreiter, U. Meier, 1. Liakatas. M. Bosch, M. Jäger, S. Manetta, S. Eollo-
nier, and P. Gunter, "Organic Materials for Second-Order Nonlinear Optics", in Crystal Engi¬
neering: From Molecules and Crxstals to Materials, Klüver Academic Publishers, Netherlands
(1999)
Ch. Bosshard, M. Jäger, M. Bosch, I. Liakatas, and P. Günter, "Second-Order Nonlinear
Optical Organic Materials: Recent Developments", in "Nonlinear Optical Effects and Materi¬
als'', Springer-Verlag, Berlin (2000)
List of Publications

140
References
[I] A. Yariv, Quantum Electronics, 2 ed. (John Wiley and Sons, New York, 1975).
[2] J. L. Oudar and D. S. Chemla, J. Chem. Phys. 66, 2664-2668 ( 1977).
[31 C. C. Teng and A. F. Ganto. Phys. Rev. B 28, 6766 6773 ( 1983).
[41 J. Zyss and J. L. Oudar, Phy s. Rev. A26, 2028-2048 (1982).
[5] I. Liakatas, C. Cai. VI, Bosch, M. Jäger, C. Bosshard, P. Günter, C. Zhang, and L. R.
Dalton. Appl. Phys. Lett. 76, 1368 (2000),
L6] K. 1). Singer, J. E. Sohn, L. A. King. H. M. Gordon, H. E. Kafz, and C. W. Dirk, J. Opt.
Soc. Am. B 6, 1339-1350 ( 1989).
[7] L. T. Cheng, W. Tarn, S. H. Stexenson, G. R. Meredith, G. Rikken, and S. Marcler, J.
Phys. Chem. 95, 10631 - 10643 (1991).
[8] C. C. Hsu. C. F. Shu. T. H. Huang, C. H. Wang. J. L. Lin, Y. K. Wang, and Y. L. Zang,
Chem. Phys. Lett. 274, 466-472 (1997).
[9] C. Bosshard, G. Knopfle, P. Prêtre, and P. Günter, J. Appl. Phys. 71,1594-1605 (1992).
[10] C. Moylan and C. Walsh, Nonlinear Optics 6, 113-121 (1993).
[ 11] L. T. Cheng, W. Tarn, S. R. Marder, A. E. Stiegman, G. Rikken, and C. W. Spangler, J.
Phys. Chem. 95, 10643-10652 (1991 ).
[12] M. Barzoukas, A. Foil, G. Klem, A. Boeglin, C. Serbutoviez, L. Oswald, and J. F.
Nicoud, Chem. Phys. 153, 457 (1991).
113] V. P. Rao, A. K.-Y. Jen, K. Y. Wong, and K. J. Drost, J. Chem. Soc, Chem. Commun.,
1118-1120(1993).
[14] C. F. Shu, W. J. Tsai, J. Y. Chen, A. K. Y Jen, Y. Zhang, and T. A. Chen, Chem. Com¬
mun. 19,2279-2280(1996).
[151 V. P. Rao, K. Y. Wong, A. K.-Y. Jen. and K. J. Drost, Chem. Mater. 6, 2210-2212
(1994).
[16] O. K. Kim, A. Fort, M. Barzoukas, and J. M. Lehn. Conf. Proceed. Organic thm films
for photonics applications, Long Beach, California, 1997 (Optical Society ofAmerica),
p. 201-203.
[17] S. Marder. L.-T. Cheng, B. G. Tiemann, A. C. Friedli, M. Blanchard-Desce, J. W. Perry,
and J. Sindhoj, Science 263. 511-514 (1994).
LIB| M. Blanchard-Desce. V. Alain. P. V. Bedworth, S. R. Marder, A. Fort, C. Runser, M.
Barzoukas, S. Lebtis, and R. Wortmann. Chem. Eur. J. 3, 1091-1104 ( 1997).
[19] M. S. Wong, C. Bosshard. F. Pan, and P. Gunter, Adv. Mater. 8, 677-680 ( 1996).
[20] S. Ermer. D. Girton. D. Leung, S. Loxejoy, J. Valley, T. Van Eck. and L. Cheng, Nonlin¬
ear Optics 9, 259-266 (1995).
L21 ] V. P. Rao, A. K. Y. Jen, and Y. M. Cai, Chem. Commun. 10, 1237-1238 ( 1996).
References

141
[221 H. E. Katz, K. D. Singer, J. E. Sohn, C. W. Dirk, L. A. King, and H. M. Gordon, J. Am.
Chem. Soc, 6561 (1987).
[23] C. Moylan, R. Miller. R. Twieg, and V. Lee, in Polymers for Second-Order Nonlinear
Optics, edited by G. Lindsay and K. Singer (American Chemical Society. Washington,
DC. 1995), p. 66-81.
[24] M. Ahlheim. M. Barzoukas. P. V. Bedworth. Al. Blanchard-Desce, A. Fort. Z. Y. Flu, S.
R. Marder, J. W. Perry, C. Ruiiser. M. Stähelin. and B. Zysset, Science 271, 335-337
(1996).
[25] A. K. Y. Jen, Y M. Cai, P. V. Bedworth, and S, R. Marder, Adv. Mater. 9, 132-135
(1997).
[26] D. A. Roberts, IEEE J. Quantum Electron. 28, 2057-2074 (1992).
[27] R. D. Miller, in Organic Thin Films fern Wanegmding Nonlinear Optics, edited by F.
Kaj/ar and J. D. Swalen (Gordon and Breach Publishers, Amsterdam, 1996), p. 329-
456.
[28] M. S. Wong, U. Meier, F. Pan. C. Bosshard, V. Grämlich, and P. Günter, Adv. Mater. 8,
416-420(1996).
[29] 1. Liakatas, M. S. Wong, C. Bosshard. M. Ehrensperger, and P. Günter, Ferroelectric s
202, 299-306 (1997).
[30] P. Nguyen, G. Lesley, T. B. Marder, I. Ledoux, and J. Zyss, Chem. Mater. 9, 406-408
(1997).
[311 C. Cai, I. Liakatas, M.-S. Wong, M. Bosch, C. Bosshard, P. Günter, S. Concilio. N.
Tirelli, and U. W. Suter. Org. Lett. 1, 1847-1849 (1999).
|32] M. Stähelin, B. Zysset, M. Ahlheim, S. R. Marder. P. V. Bedworth, C. Runser, M. Bar¬
zoukas, and A. Fort. J. Opt. Soc. Am. B 13, 2401-2407 (1996).
[33 ] K. D. Singer, M. G. Kuzyk, and J. E. Sohn, J. Opt. Soc. Am. B 4, 968 - 976 ( 1987).
[34] H. E. Katz, C. W. Dirk, M. L. Schilling, K. D. Singer, and .1. E. Sohn, in Nonlinear opti¬cal properties of polymers, edited by A. J. Fleeger. J. Orenstein, and D. R, Ulrich
(Materials Research Society. Pittsburgh, Pennsylvania, 1988), p. 127-132.
[35] S. S. Sun. C. Zhang, L. R. Dation, S. M. Garner, A, Chen, and W. H. Steier. Chem.
Mater. 8, 2539-2541 ( 1996).
[36| Y. Kubo. T Takaba. and S. Aramaki, Chemistry Letters 3, 255-256 (1997).
[37] J. Chen, J. Zhu. A. Harper. F. Wang. Ai. Fie, S. Alao. and L. Dalton, Polymer Preprints
38,215-216(1997).
|38] K. J. Drost, V. P. Rao. and A. K.-Y. Jen, J. Chem. Soc, Chem. Commun., 369-371
(1994).
[391 C. Samyn. G. Claes, M. Vanbeyien, A. Dewachter. and A. Persoons, Macromol. Symp.
102, 145-158(1996).
[40] 7 Y. Chang, T J. Kim. M. J. Han. D. H. Choi, and N. Kim, Polymer 38, 4651-4656
(1997).
References

142
[411 J. Thackara. M. Junch, and J. Swalen, J. Opt. Soc. Am. B 11, 835-839 (1994).
|42] K. D. Singer. M. G. Knzyk, W. R. Holland, J. E. Sohn, and S. J. Lalama. Appl. Phys.
Lett. 53, 1800-1802(1988).
L43] Y Shuto, M. Amano, and T Kaino. IEEE Trans. Photon. Techn. Lett. 3, 1003-1006
(1991).
[44] N. Kim. D. Choi, and S. Park, in Poled Polymers and their Applications to SHG and
EO Devices, edited by S. Miyata and II. Sasabe (Gordon and Breach Science Publish¬
ers, Amsterdam, 1997). p. 47-62.
[451 Y Shi, P. M. Ranon. W. H. Steier, C. Xu, B. Wu. and L. R. Dallon, Appl. Phys. Lett. 63,
2168-2170(1993).
[46] M. Ozawa, M. Nakanishi. H. Nakayama, O. Sugihara, N. Okamoto, and K. Hirota. in
Poled Polymers and their Applications to SHG and EO Devices, edited by S. Aliyata
and FI. Sasabe (Gordon and Breach Science Publishers, Amsterdam, 1997), p. 223-229.
[47] K. Y Wong and A. K.-Y. Jen, .1. Appl. Phys. 75, 3308 - 3310 (1994).
[48] C. Moylan. R. Twieg. V. Lee. R, Miller, W. Volksen, J. Thackara, and C. Walsh, Conf.
Proceed. Nonlinear Optical Properties of Organic Materials VII, San Diego, Califor¬
nia. 1994 (SP1E), p. 17.
[49] A. Jen, V. Rao, and J. Chandrasekhar, in Polymers for Second-Order Nonlinear Optics,
edited by G. Lindsay and K. Singer (American Chemical Society, Washington, DC,
1995), p. 147-157.
[50[ D. Yu, Z. Peng. A. Gharavi. and E. Yu, in Polymers for Second-Order Nonlinear Optics,
edited by G. Lindsay and K. Singer (American Chemical Society, Washington, DC,
1995). p. 172-180.
[511 D. Yu. A. Gharavi, and L. P. Yu. Macromolecules 29, 6139-6142 ( 1996).
[521 P. Prêtre, P. Kaatz, A. Bohren, P. Günter. B. Zysset, M. Ahlheim, M. Stähelin, and E
Lehr, Macromolecules 27, 5476-5486 (1994).
[53] W. Sotoyama, S. Tatsuura. and T Yoshtmura. Appl. Phys. Lett. 64, 2197-2199 (1994).
[54] M. Eich. H. Beismghoff, B. Knodler, M. Ohl. M. Sprave, J. Vydra, M. Ecki, P. Strohr-
iegl, M. Dorr. R. Zentel. M. Ahlheim, M. Stähelin, B. Zysset, J. Liang, R. Levenson,
and J. Zyss. Conf. Proceed. Nonlinear Optical Properties of Organic Materials VII,
San Diego, California, 1994 (SP1E). p. 104.
[551 Y M. Cai and A. K. Y Jen. Appl. Phys. Lett. 67, 299-301 ( 1995).
[56] T. Chen, A. Jen. and Y. Cai, Chem. Mater. 8, 607-609 (1996).
[57] N. Nemoto, F. Miyata. Y Nagase. J. Abe, M, Hasegawa, and Y Shirai, Chem. Mater. 8,
1527-1534(1996).
[58] Y. W. Kim. J. I. Jin. M. Y Jin, K. Y. Choi, J. J. Kim, and T. Zyung, Polymer 38, 2269-
2275(1997).
References

143
1591 C. Weder, B. Glomm, P. Neuenschwander, U. Suter, P. Prêtre, P. Kaatz, and P. Günter,
in Poled Polymers and their Applications to SHG and EO Devic es, edited by S. Miyata
and H. Sasabe (Gordon and Breach Science Publishers, Amsterdam, 1997). p. 63-76.
(60] C. Branger, M. Lequan. R. M. Lequan, M. Large, and F. Kajzar. Chem. Phys. Lett. 272,
265-270(1997).
[61] K. J. Moon. 11. K. Shim, K. S. Lee. J. Zieba. and P. N. Prasad, Macromolecules 29,
861-867(1996).
[62] N. Tsutsumi, O. Maisumoto. W. Sakai, and T Kiyotsukuri, Macromolecules 29, 592-
597(1996).
[63] Y. Shi, W. Steier, M. Chen, L. Yu, and L. Dalton. Appl. Phys. Lett. 60, 2577-2579
(1992).
[64] A. Nahafa. C. Wu, C. Knapp, V. Lu, J. Shan, and J. Yardley, Appl. Phys. Lett. 64, 3371-
3373 (1994).
[65] X. G. Wang, J. Kumar. S. K. Tripathy. L. Lr, J. 1. Chen, and S. Marturunkakul, Macro¬
molecules 30, 219-225 (1997).
[66] D. Jungbauer, B. Reck, R. Twieg, D. Yoon. C. Willson. and 1. Swalen, Appl. Phys. Lett.
56,2610-2612(1990).
[67] M. Dörr, R. Zentel. M. Sprave, J. Vyclra, and AI. Eich, Adv. Mater. 9, 225-230 (1997).
[68] II. Flayashi, II. Nakayama, O. Sugihara, and N. Okamoto, Optics Letters 20, 2264-
2266(1995).
[69] A. Bräuer, T. Gase, L. Erdmann, P. Dannberg, and W. Karthe, SPIE 2042, 438-446
(1994).
[70] J. I. Thackara. J. C. Choir, G. C. Bjorklund, VV. Volksen. and D. M. Burland, Appl.
Phys. Lett. 67, 3874-3876 (1995).
[71] M. H. Lee. H. J. Lee, S. G. Han, H. Y. Kim. K. H. Kim, Y. H. Won, and S. Y. Kang. Tbin
Solid Films 303, 287-91 (1997).
[72] M. Hikita, Y. Shuto, M. Amano, R. Yoshimura, S. Tomaru, and H. Kozawaguchi. Appl.
Phys. Lett. 63, 1161-1163 (1993).
[73] Y. Shuto, S. Tomaru. M. Hikita, and M. Amano, IEEF J. Quant. Electi. 31, 1451-1460
(1995).
[74] M.-C. Oh, W.-Y. Hwang, H.-M. Lee, S.-G. Han. and Y-H. Won, IEEE Phot. Teehn.
Lett. 9, 1232-1234(1997).
[ 75] W.-Y. Hwang, M.-C. Oh, H.-M. Eee, H. Park, and J.-J. Kim, IEEE Phot. Techn. Lett. 9,
761-763 (1997),
[76] Y. Shi, W. Wang, J H, Bechtel. A. Chen, S. Garner, S. Kalluri. W. H. Steier. D. Chen,
Fl. R. Fetterman, L. R. Dalton, and L. Yu, IEEE J. Select. Pop. Quantum Electron. 2,
289-99(1996).
[77] W. Wang, D, Chen, H. R. Fetterman, Y. Shi. W. H. Steier, and L. R. Dalton, Appl. Phys.
Lett. 65, 929-93 1 (19941
References

144
[78] W. Wang, D. Chen, H. R. Fetterman, Y. Shi. W. H. Steier, and L. R. Dalton, IEEE Phot.
Techn. Lett. 7, 638-640 (1995).
179] D. Chen, H. R. Fetterman, A. Chen, W. H. Steier, L. R. Dalton, W. Wang, and Y. Shi,
Appl. Phys. Lett. 70, 3335-7 ( 1997).
[80] K. Noguchi. H. Miya/awa, and O. Mitomi, Elect. Lett. 30, 949-51 ( 1994).
181] Y. Shi, C. Zhang, H. Zhang, J. H. Bechtel. L. R. Dalton, B. H. Robinson, and W. H.
Steier, Science 288, 119(2000).
|82] C. C. Teng. Appl. Phys. Lett. 60, 1538-1540 ( 1992).
[83] A. Chen, V. Chuyanov, F. I. Marti Carrera, S. Garner, W. FI. Steier, J. Chen, S. Sun, and
L. R. Dalton, Proc. SPIE. 3005, 65-76 (1997).
[84] C. C. Teng, in Nonlineai' Optn s of Organic Molec ttlar and Polymeric Materials, edited
by S. Miyata and IL S. Nalwa (CRC Press.. Inc. 1997). p. 441-464.
[85] Y. Shi, W. Wang, L. Weipmg, D. J. Oison, and J. H. Bechtel, Appl. Phys. Lett. 70,
1342-4(1997).
[86] R. Spickermann, S. R. Sakamoto, M. G. Peters, and N. Dagli, Electr. Lett. 32, 1095-6
(1996).
[ 871 K. Clays and A. Persoons, Phys. Rev. Lett. 66, 2980-2983 (1991 ).
[88] A. Willetts. J. E. Rice, D. M. Burland, and D. P. Shelton. .1. Chem. Phys. 97, 7590-7599
(1992).
[89] C. Bosshard, M. Bosch, 1. Liakatas. VI, Jäger, and P. Günter, in Nonlinear OpticalEffects and Materials, edited by P. Günter (Springer, 2000).
[901 S. K. Kurtz and T. T. Perry, J. Appl. Phys. 39, 3798-381Î ( 1968).
[ 911 R. C. Eckardt. H. Masucla. Y. X. Fan, and R. L. Byer, IEEE J. Quant. Electron. 26, 922-
933 (1990).
[92) D. A. Kleinman, Phys. Rev. 126, 1977-1979 (1962).
|93] M. S. Paley, R. A. McCnll, S. C. Howard, S. E. Wallace, and I. M. Harris, Macromole¬
cules 23, 4557-4564 ( 1990).
[94[ C. Reicharclt, Solvents and Solvent Effects in Organic Chemistry, (Verlag Chemie,
Weinheim, 1988),
[951 S. R. Marder, B. Kippelen. A. K.-Y. Jen, and N. Peyghambarian, Nature 388, 845-851
(1997).
[96] M. Langoor, Diss. Thesis. Utrecht University, 1997.
[971 J. Jerphagnon and S. K, Km tz. J. of Appl. Phys. 41, 1667 ( 1970).
[98] C. C. Teng and T H. Man, Vppl. Phys. Lett. 56, 1734-1736 (1990).
[99] VI. Mortazavi. A. Knoesen, S. Kowel, R. Plenry, J. Hoover, and G. Lindsay, Appl. Phys.B 53, 287-295 (1991),
References
145
[ 1001 P. Boldt, G. Bourhill, C. Brauchte. Y. Jim, R. Kammler, C. Muller, J. Rase, and J. Wieh¬
ern, Chem. Commun., 793 (1996).
[101] L. R. Dalton, A. W. Harper, and B. H. Robinson, Proc Netl. Acad. Sei. USA 94, 4842-
4847(1997).
[102] L. R. Dalton, in Advanc es in Polymer Science (Springer-Verlag. Heidelberg. 2000).
[103] B. H. Robinson and L. R. Dalton, J. Phy s. Chem. A. 4785-4795 (2000).
[104] J. J. P. Stewart, Quantum Chemistry Program /Ac liante (QCPE) # 455 (1992).
[105] O. Ostinclli, Diploma Thesis, Swiss Federal Institute of Technology (ETFI). Zürich.
2000.
[106] J.-J. Kim, T Zyung, WAY. Hwang, and Al.-C. Oh, Korean J. of Chem. Eng. 13, 187
(1996).
LI071 M. Nakanishi, O. Sugihara, N. Okamoto, and K. Hirota, Appl. Opt. 37, 1068 (1998).
[108] L. Palchetti, Q. Lt, E. Giorgetti. D. Grando, and S. Sottmi, Appl. Opt. 36, 1204 (J 997).
[109] K. B. Rochford, R. Zanoni. Q. Gong, and G. I. Stegeman, Appl. Phys. Lett. 55, 1161
(1989).
[110) C. D. Eisenbach, Polymer 21, 1175 (1980).
[111[ K Agolmi and F. P. Gay, Macromolecules 3, 349 ( 1970).
[112] M. Ahlheim, F. Lehr, P. G. Kaatz, P. Prêtre, and P. Gunter. Polym. Repr. 35, 250 ( 1994).
[113] M. H. Lee, H. J. Lee, S. G. Han, H.-Y. Kim, and Y H. Won, Thin Solid Films, 247
(1996).
[114| C. Fischer, Diploma Thesis, Swiss Federal Institute of Technology (ETH), Zurich,
2000.
[115] O. Watanabe, M. Tsuchimon, and A. Okada, J. Mater. Chem. 6,1487 ( 1996).
[116] J. Vydra, H. Beisinghoff, T. Tschudi, and M. Eich, Appl. Phys. Lett. 69, 1035 (1996).
[117] E. L. Simmons. Jour, of Phys. Chem. 75, 588 ( 1971 ).
[ 118| LP. Kaminow, L. W. Stub. E. A, Chandross, and C. A. Prycle, Appl. Opt. 11, 1563
(1972).
[119] J. Ma. S. Lin, W. Feng, R. J. Feuerstein, B. Hooker, and A. R. Mickelson, Appl. Opt.
34,5352(1995).
[120] O. Zehnder, Diploma Ihesis, Swiss Federal Institute of Technology (ETH), Zürich,
1999.
1121] O. Zehnder, Semester Thesis. Swiss Federal Institute of Technology (ETFI). Zürich,1998.
[122] Prometheus, Beam piopagation software from BBV Software BV (www.bbv.nl).
[123] H. Ma, B. Chen, S. Takatumi. I, R. Dalton, and A. K.-Y. Jen, J. Am. Chem. Soc, sub¬
mitted (2000).
References

146
Acknowledgements
I wish to express my gratitude to all those who contributed to the completion of this work;
Prof. Dr. P. Günter for giving me the chance to work in the Nonlinear Optics Laboratory-
Prof. Dr. U. W. Suter for accepting to be the co-examiner of this thesis
PD Dr. Ch. Bosshard for being an excellent supervisor of my research work, for carefully
reading and commenting on the manuscript, and for his valuable advice in moments of
despair
M. Bosch for sharing projects, office, hopes, excitement and disappointment with me, for
his excellent "consulting services" when the gomgs were getting tough, and for useful
and interesting discussions on work, science and other (more) important things in life
O. Zehnder for his outstanding diploma work and his important eonhibution to this thesis
Prof. Dr. C. Cai and Prof. Dr. W. S. Wong for their excellent chemical synthetic work
which provided most of the material investigated in this work
Prof. Dr. T. Kaino for giving me the chance to work in his laboratory and get to know
Japan. Special thanks to all his group members for their help and kindness during my
stay in Senclai
Prof. L. Dalton and Dr. Cheng for providing the CLD molecules
Dr. M. Jäger for sharing with me his experience in polymer device fabrication
Dr. Tirelli. Dr. Concilio, Dr. Zang, S. Flösli, and B. Fontana for performing several chem¬
ical analyses for me and for answering my numerous questions on chemistry
H. Scherrer and his team for depositing the metal electrodes and P. Wägli for taking the
electron microscope pictures
O. Ostinalli and M. Lichtenstein for their excellent diploma and semester work,
respectively
Dr. S. Follonier, Dr. R. Spreiter, Dr. U. Gubler, U. Meier, S. Manetta, S. Lecomte, and A.
Schneider for sharing with me offices, laboratories as well as knowledge and experiencein organic nonlinear optics and materials
C. Fischer for useful discussions on photobleaching and for reminding me to smile when
my spirits were low
H. Wtiest, E. Hausammann, and I. Gamboni for their precious technical assistance
The rest of the Nonlinear Optics Laboratory for the nice working atmosphere
Dr. G. Skillas for the fun we had in several common extra-curriculum projects and
activities
All my Greek friends for healing me whenever I was feeling homesick
My family for the moral support
Menga Conrad for her Uwe, care, support, and smile. To her I dedicate this work.
Acknowledgements

Curriculum Vitae
147
Name
Born
1978- 1984
1984- 1987
1987- 1990
1990
1990- 1995
Oct. 1994-Apr. 1995
1995
1995-2000
Jan.-Feb. 1999
1997- 1999
I lias Liakatas
May 26. 1972 in the Democratic Republic of Congo
Primary school in Athens, Greece
Secondary school in Athens, Greece
Lyceum in Athens, Greece
Apolytirio (school leaving exam) and university
qualification examinations
Student at the Aristoteles University of Thessaloniki;
faculty of physics
Research work at the Nonlinear Optics Laboratory of the
Swiss Federal Institute of Technology (ETH) Zurich, in
the framework of the European program Erasmus
Diploma in physics from the Aristoteles University of
Thessaloniki
leaching assistant and Ph.D. student at the Nonlinear
Optics Laboratory of the Swiss Federal Institute of
Technology (ETH) Zurich
Visiting researcher at the Laboratory of Optical Materials
Chemistry at Tohoku University, Sendai, Japan
Studies at the Academic Society for Adult ContinuingEducation (AKAD) and postgraduate degree in Industrial
Engineering from the Swiss Technical Association (STV)
Zurich. 2000
Curriculum Vitae