Glaucoma Detection with the Heidelberg Retina Tomograph 3
13
Glaucoma Detection with the Heidelberg Retina Tomograph 3 Zvia Burgansky-Eliash, MD, Gadi Wollstein, MD, Richard A. Bilonick, PhD, Hiroshi Ishikawa, MD, Larry Kagemann, MSc, and Joel S. Schuman, MD UPMC Eye Center, Eye and Ear Institute, Ophthalmology and Visual Science Research Center, Department of Ophthalmology, University of Pittsburgh School of Medicine, Pittsburgh, Pennsylvania. Abstract Purpose— To compare the ability of the Heidelberg retina tomograph version 3 (HRT 3) and HRT version 2 (HRT 2) to discriminate between healthy and glaucomatous eyes. Design— Retrospective cross-sectional study. Participants— Seventy-one eyes of 71 healthy volunteers and 50 eyes of 50 glaucoma patients were studied. The average visual field mean deviation of the glaucoma group was −6.03±5.78 dB. Intervention— All participants had comprehensive ocular examinations, perimetry, and HRT scanning within 6 months. HRT 2 data were analyzed using HRT 3 software without modifying the disc margin. Main Outcome Measures— Discrimination capabilities between healthy and glaucomatous eyes were determined by areas under the receiver operating characteristics (AROCs) curves. Comparisons between corresponding AROCs obtained by HRT 2 and HRT 3 analyses were performed using the nonparametric DeLong method. Agreement between classifications as defined by the different analysis methods was quantified by κ analysis. Results— The individual stereometric parameters with the best discrimination were linear cup/disc ratio (AROC = 0.897; 95% confidence interval [Cl], 0.836–0.958) for standard HRT 3 analysis and horizontal retinal nerve fiber layer curvature (0.905) for HRT 3 glaucoma probability score (GPS) analysis. Areas under the receiver operating characteristics for discrimination between glaucomatous and healthy eyes of the overall classification by HRT 2 Moorfields regression analysis (MRA), HRT 3 MRA, and GPS were 0.927 (95% Cl, 0.877–0.977), 0.934 (0.888–0.980), and 0.880 (0.812–0.948), respectively. The difference between the 3 AROCs was not significant (P = 0.44). The agreement between HRT 2 and HRT 3 overall MRA classification was good (κ = 0.70; Cl, 0.59–0.80) with HRT 3 tending to report more abnormalities than HRT 2 analysis. The agreement between overall HRT 3 MRA and overall GPS was κ = 0.58 (Cl, 0.45–0.70). Conclusions— The glaucoma discriminating ability of the new HRT 3 software is similar to that of the previous generation HRT 2. The GPS analysis showed promising results in differentiating between healthy and glaucomatous eyes without the need for subjective operator input. Confocal scanning laser ophthalmoscopy uses a diode-laser light source to produce quantitative measurements of the optic nerve head (ONH) and posterior segment. A commercially available confocal scanning laser ophthalmoscopy device, the Heidelberg retina tomograph (HRT; Heidelberg Engineering GmbH, Heidelberg, Germany) has been shown to be capable of Correspondence to Joel S. Schuman, MD, UPMC Eye Center, Department of Ophthalmology, University of Pittsburgh School of Medicine, 203 Lothrop Street, Eye and Ear Institute, Suite 816, Pittsburgh, PA 15213. E-mail: [email protected]. Drs Burgansky-Eliash and Wollstein participated equally in preparation of the manuscript. Dr Schuman receives royalties for intellectual property licensed by Massachusetts Institute of Technology to Carl Zeiss Meditec. Presented at: Association of Research in Vision and Ophthalmology annual meeting, April 2006, Ft. Lauderdale, Florida. NIH Public Access Author Manuscript Ophthalmology. Author manuscript; available in PMC 2008 March 1. Published in final edited form as: Ophthalmology. 2007 March ; 114(3): 466–471. NIH-PA Author Manuscript NIH-PA Author Manuscript NIH-PA Author Manuscript
Transcript of Glaucoma Detection with the Heidelberg Retina Tomograph 3

Glaucoma Detection with the Heidelberg Retina Tomograph 3
Zvia Burgansky-Eliash, MD, Gadi Wollstein, MD, Richard A. Bilonick, PhD, Hiroshi Ishikawa,MD, Larry Kagemann, MSc, and Joel S. Schuman, MDUPMC Eye Center, Eye and Ear Institute, Ophthalmology and Visual Science Research Center,Department of Ophthalmology, University of Pittsburgh School of Medicine, Pittsburgh,Pennsylvania.
AbstractPurpose— To compare the ability of the Heidelberg retina tomograph version 3 (HRT 3) and HRTversion 2 (HRT 2) to discriminate between healthy and glaucomatous eyes.
Design— Retrospective cross-sectional study.
Participants— Seventy-one eyes of 71 healthy volunteers and 50 eyes of 50 glaucoma patientswere studied. The average visual field mean deviation of the glaucoma group was −6.03±5.78 dB.
Intervention— All participants had comprehensive ocular examinations, perimetry, and HRTscanning within 6 months. HRT 2 data were analyzed using HRT 3 software without modifying thedisc margin.
Main Outcome Measures— Discrimination capabilities between healthy and glaucomatous eyeswere determined by areas under the receiver operating characteristics (AROCs) curves. Comparisonsbetween corresponding AROCs obtained by HRT 2 and HRT 3 analyses were performed using thenonparametric DeLong method. Agreement between classifications as defined by the differentanalysis methods was quantified by κ analysis.
Results— The individual stereometric parameters with the best discrimination were linear cup/discratio (AROC = 0.897; 95% confidence interval [Cl], 0.836–0.958) for standard HRT 3 analysis andhorizontal retinal nerve fiber layer curvature (0.905) for HRT 3 glaucoma probability score (GPS)analysis. Areas under the receiver operating characteristics for discrimination between glaucomatousand healthy eyes of the overall classification by HRT 2 Moorfields regression analysis (MRA), HRT3 MRA, and GPS were 0.927 (95% Cl, 0.877–0.977), 0.934 (0.888–0.980), and 0.880 (0.812–0.948),respectively. The difference between the 3 AROCs was not significant (P = 0.44). The agreementbetween HRT 2 and HRT 3 overall MRA classification was good (κ = 0.70; Cl, 0.59–0.80) with HRT3 tending to report more abnormalities than HRT 2 analysis. The agreement between overall HRT 3MRA and overall GPS was κ = 0.58 (Cl, 0.45–0.70).
Conclusions— The glaucoma discriminating ability of the new HRT 3 software is similar to thatof the previous generation HRT 2. The GPS analysis showed promising results in differentiatingbetween healthy and glaucomatous eyes without the need for subjective operator input.
Confocal scanning laser ophthalmoscopy uses a diode-laser light source to produce quantitativemeasurements of the optic nerve head (ONH) and posterior segment. A commercially availableconfocal scanning laser ophthalmoscopy device, the Heidelberg retina tomograph (HRT;Heidelberg Engineering GmbH, Heidelberg, Germany) has been shown to be capable of
Correspondence to Joel S. Schuman, MD, UPMC Eye Center, Department of Ophthalmology, University of Pittsburgh School ofMedicine, 203 Lothrop Street, Eye and Ear Institute, Suite 816, Pittsburgh, PA 15213. E-mail: [email protected] Burgansky-Eliash and Wollstein participated equally in preparation of the manuscript.Dr Schuman receives royalties for intellectual property licensed by Massachusetts Institute of Technology to Carl Zeiss Meditec.Presented at: Association of Research in Vision and Ophthalmology annual meeting, April 2006, Ft. Lauderdale, Florida.
NIH Public AccessAuthor ManuscriptOphthalmology. Author manuscript; available in PMC 2008 March 1.
Published in final edited form as:Ophthalmology. 2007 March ; 114(3): 466–471.
NIH
-PA Author Manuscript
NIH
-PA Author Manuscript
NIH
-PA Author Manuscript

detecting the structural alterations in glaucoma. Numerous studies have reported that HRTmeasurements are highly reproducible.1–7 Previous studies have also shown that HRTmorphologic parameters can discriminate between healthy eyes and eyes with glaucomatousvisual field (VF) defects.8–12
One of the limitations of the HRT is the requirement that the operator manually create a contourline. The contour line is placed at the inner border of scleral ring, and many of the quantitativemeasurements depend on proper line placement. Drawing the contour line is not only timeconsuming, but also may introduce interoperator variability.7,13,14 The newly released HRT3 software (version 3.0) offers an option for alternative analysis that does not require placementof a contour line. The technique provides stereometric data by applying an automatic modelof the ONH shape as suggested by Swindale et al.15 The resultant morphologic parameters areanalyzed by a machine learning classifier (relevance vector machine) resulting in a glaucomaprobability score (GPS).
The new software version also includes a larger and ethnicity-specific normative database.Although the normative database in HRT 2 included 349 subjects for the stereoscopicparameters and 110 subjects for the Moorfields regression analysis (MRA), HRT 3 normativedatabase includes 733 healthy Caucasian eyes and 215 healthy African American eyes.16Based on the enlarged database, the equations of the MRA were modified. In addition,stereometric parameters are compared to the values of the normative dataset and between theeyes.
The objective of this study was to compare the performance of the conventional HRT 3, GPS,and HRT 2 analysis in the discrimination of healthy and glaucomatous eyes.
Materials and MethodsSubjects
In this retrospective cross-sectional study, all subjects were ≥ 18 years with best-correctedvisual acuity of ≥ 20/40 and spherical refraction between +6.00 and −6.00 diopters withcylinder power < 3.00 diopters. The exclusion criteria were a history of diabetes and eyes withsigns of retinal or ONH pathology other than those attributed to glaucoma, significant mediaopacity in which the fundus was not visible, or eyes with any intraocular trauma or surgeryexcept for uneventful cataract or glaucoma surgeries at least 6 months before recruitment.Subjects with neurologic conditions that might affect their VF were also excluded from thestudy.
All participants underwent a comprehensive ophthalmic examination, which included medicaland family history, best-corrected visual acuity and refraction, intraocular pressuremeasurement, detailed stereoscopic biomicroscopy of the anterior and posterior segmentsbefore and after pupil dilation, Swedish interactive thresholding algorithm standard 24-2perimetry (Carl Zeiss Meditec, Dublin, CA), and HRT 2 scanning. Pupillary dilation wasobtained with 1% tropicamide (Alcon Laboratories Inc., Fort Worth, TX) and 2.5%phenylephrine hydrochloride (Alcon Laboratories Inc.).
The study was approved by the institutional review board/ethics committee, and adhered todeclaration of Helsinki and the Health Insurance Portability and Accountability Actregulations. Informed consent was obtained from all participants.
Two clinically defined groups were included in this study: healthy subjects and glaucomapatients. Because the primary outcome parameter of the study was the ability of the variousHRT software packages to discriminate between healthy and glaucomatous eyes, and because
Burgansky-Eliash et al. Page 2
Ophthalmology. Author manuscript; available in PMC 2008 March 1.
NIH
-PA Author Manuscript
NIH
-PA Author Manuscript
NIH
-PA Author Manuscript

the HRT quantifies structural features of the ONH, the definition of normal and glaucoma usedin this study was based on VF findings alone. Eyes were classified as healthy if they had nohistory of glaucoma, intraocular pressure of ≤ 21 mmHg, and normal Swedish interactivethresholding algorithm 24-2 VF.
Eyes were classified as glaucomatous if VF defects were evident on 2 consecutive VF tests.Defects were defined as a glaucoma hemifield test outside normal limits (ONL), or a patternstandard deviation probability of < 5%, or a cluster of ≥ 3 non-edge points in a location typicalfor glaucoma, all of which were depressed on the pattern deviation plot at a P <5% level andat least 1 of which depressed at a P < 1% level. A reliable test was defined as one with <30%fixation losses, <30% false-positive responses, and <30% false-negative responses.
Heidelberg Retina TomographAll participants were scanned with the HRT 2 device. Three scans were acquired automaticallyafter initial positioning by the operator. All scans were assessed subjectively for the presenceof good ONH centration, focus, and uniform illumination. All scans had InterScan standarddeviation of < 50 μm. The operator manually defined the ONH margin as the inner border ofthe Elschnig ring.
Heidelberg retina tomograph 2 data were exported and reanalyzed by HRT 3 software withoutmodifying the disc margin location as identified by the drawn reference circle. Theconventional stereometric parameters were calculated by HRT 3 accounting for the disc marginlocation. The new HRT 3 software included a larger and ethnicity-specific normative database.The parameters were compared to the normative dataset and labeled with ordinal classificationsof within normal limits (WNL), borderline (BL), or ONL. Moorfields regression analysis wassimilarly updated and used the same classifications. In addition, an automatic analysis of thetopographic image was included. The output of the analysis was provided as a GPS rangingfrom 0% to 100%. Scores from 0% to 27% were categorized by the software as WNL, 28% to64% as BL, and 65% to 100% as ONL. The overall GPS diagnosis was provided as an ordinaloutput only.
A horizontal scaling error was reported by the manufacturer, in which horizontal HRT 2stereometric measurements were 4% enlarged; this was corrected in HRT 3.16 The followingglobal HRT 3 stereometric parameters were recorded: linear cup/disc ratio, cup shape measure,rim area, rim volume, height variation contour, and mean retinal nerve fiber layer (RNFL)thickness. Overall, global and sectoral HRT 2 MRA, HRT 3 MRA, and GPS classificationwere recorded. Global stereometric parameters from the GPS printout including cup depth,horizontal RNFL curvature, vertical RNFL curvature, GPS numeric score, rim steepness, andcup size were also recorded. The impact of the inclusion of ethnicity data on discriminatingpower of HRT 3 MRA versus HRT 2 MRA was also examined.
AnalysisThe outcome parameters of WNL, BL, and ONL were treated as ordinal data. All otherparameters were treated as continuous data. The data were collected on a statistical softwaredatabase (IMP software, SAS Institute, Gary, NC). Differences among groups were assessedby a Student’s t test for continuous parameters, chi-square test for categorical parameters, andWilcoxon test for nonparametric comparison. Receiver operating characteristic (ROC) curveswere used with continuous and ordinal categories created from the continuous stereometricvariables to determine the discrimination capabilities between healthy and glaucomatous eyes.Areas under the ROCs curves (AROC) were compared using DeLong’s nonparametric method.17 The agreement among classifications by HRT 2 MRA, HRT 3 MRA, and GPS was assessedusing the κ coefficient. Logistic regression was used to assess the contribution of age, gender,
Burgansky-Eliash et al. Page 3
Ophthalmology. Author manuscript; available in PMC 2008 March 1.
NIH
-PA Author Manuscript
NIH
-PA Author Manuscript
NIH
-PA Author Manuscript

ethnicity, and disc size for the prediction of glaucoma as defined by HRT 2 MRA, HRT 3MRA, and GPS. Interactions between parameters were included in the models when they weresignificant. The most theoretically meaningful models were fitted and the one with the mostexplanatory factors that were statistically significant was chosen. Separate ordinal logisticregression models were created for glaucoma prediction using HRT 2 MRA, HRT 3 MRA,and GPS as categorical 3-level variables with WNL category as the base for comparison. Amultivariate test was done for all 3 AROCs using the DeLong method. In cases where thedifference was not significant, no additional analysis was conducted. In cases where themultivariate test was significant, the 3 possible univariate tests were calculated.
The analysis was conducted using IMP, SAS (SAS Institute) and the R language andenvironment for statistical computing (R Foundation for Statistical Computing, www.r-project.org). A significance level of P <0.05 indicated statistical significance.
ResultsSubjects’ Characteristics
Fifty eyes of 50 glaucoma patients and 71 eyes of 71 healthy volunteers were enrolled in thisstudy. The study demographics are summarized in Table 1. Healthy subjects were significantlyyounger than glaucoma patients (P<0.001). The average VF mean deviation was −6.03±5.78dB in the glaucoma group, spanning the spectrum from early to advanced disease, but reflectingon average a moderate degree of glaucomatous damage, and −0.46±0.96 dB in the healthygroup. The disc area ranged between 0.835 and 3.798 mm2 (average, 1.91 ±0.5 mm2).
Discrimination by Stereometric ParametersThe best discriminating ability between glaucoma and healthy subjects among the conventionalstereometric parameters of HRT 3 was obtained with linear cup/disc ratio (AROC = 0.897;Table 2). The best AROC among GPS individual parameters was obtained with horizontalRNFL curvature (AROC = 0.905). Using the ordinal classification of the stereometricparameters (WNL, BL, or ONL) the discriminating ability of all parameters decreasedcompared to the continuous measure. There was no overlap in the confidence intervals betweenthe numerical and ordinal parameters. Therefore, a significant difference between the methodswas noted for the following parameters: linear cup/disc ratio, cup shape measure, and meanRNFL.
Discrimination by Classification MethodsThe AROC for differentiation between glaucomatous and healthy eyes was 0.927 using HRT2 overall MRA classification, 0.934 for HRT 3, and 0.880 for overall GPS ordinal analysis(P = 0.44 between the 3 methods; Fig 1).
Age was a significant contributor to the prediction of glaucoma as defined by HRT 2 and HRT3 MRA (both P = 0.001). In our sample, gender, ethnicity, and disc size did not contributesignificantly to the prediction of disease (all P >0.05). In reviewing the effect of ethnicity onthe differences in MRA outcomes between HRT 2 and HRT 3, there was 1 African Americansubject for whom the original classification with HRT 2 was BL and that with HRT 3 wasONL. All other differences between the 2 MRA classifications occurred in Caucasian subjects.For GPS analysis, age was the only significant contributor to the prediction (P = 0.0001).Gender, ethnicity, and disc size did not significantly affect the prediction ability of GPS.
Agreements between Classification MethodsTable 3 outlines the agreement between the classification by HRT 2 MRA and HRT 3 MRA.The overall κ agreement was 0.70 (95% confidence interval, 0.59–0.80). Generally, HRT 3
Burgansky-Eliash et al. Page 4
Ophthalmology. Author manuscript; available in PMC 2008 March 1.
NIH
-PA Author Manuscript
NIH
-PA Author Manuscript
NIH
-PA Author Manuscript

MRA defines more eyes as abnormal compared with HRT 2 MRA. Although all 35 eyes thatwere ONL by HRT 2 were also ONL by HRT 3, 20% (15 out of 74) of subjects that wereclassified as WNL by HRT 2 were BL by HRT 3 and 50% (6 out of 12) of the BL eyes by HRT2 were considered ONL by HRT 3. Table 4 outlines the agreement between the classificationby HRT 3 MRA and the ordinal classification of GPS. The overall agreement between HRT 3MRA and GPS was κ = 0.58 (95% confidence interval, 0.45–0.70) and there was no apparentpattern in the classification of eyes that were differently labeled by the 2 methods.
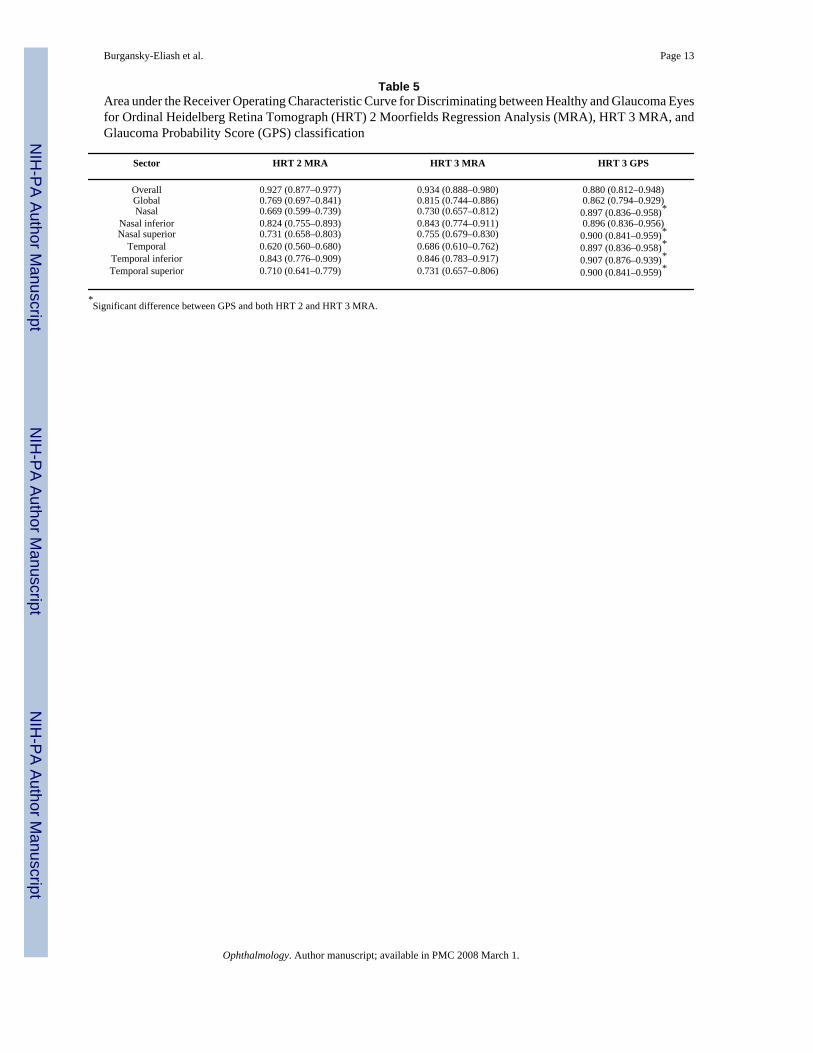
Discrimination by Global and Sectoral Classification MethodsThe AROCs for discrimination between glaucomatous and healthy eyes by sectoral and globalHRT 2 MRA, HRT 3 MRA, and ordinal results of GPS appear in Table 5. The AROC for GPSwas significantly larger than for both HRT 2 MRA and HRT 3 MRA in all sectors except forthe nasal inferior and global. The differences in AROCs between HRT 2 MRA and HRT 3MRA were not significant. Using the continuous numerical GPS results the AROC rangedbetween 0.899 (global) to 0.950 (temporal superior). The differences between the numericaland ordinal GPS AROCs were significant for all sectors except for the global GPS.
Agreement between Global and Sectoral Classification MethodsThe agreement between HRT 2 MRA and HRT 3 MRA sectoral classifications ranged betweenκ = 0.44 (temporal) and κ = 0.76 (temporal inferior). The agreement between HRT 3 MRA andGPS sectoral classification ranged between 0.14 (temporal) and 0.57 (nasal inferior).
DiscussionThe new HRT 3 GPS software utilizes an automated analysis of the ONH shape without theneed for manual definition of the optic disc margin. In this study, we found a similar ability todiscriminate between healthy and glaucomatous eyes by the best individual morphologicparameter of the conventional method (linear cup/disc ratio AROC = 0.897) and the automatedtechnique (horizontal RNFL curvature AROC = 0.905; Table 2). Overall MRA classificationshowed further improvement in the discriminating ability (AROC = 0.934) compared with theability of the best single parameter, whereas for GPS the overall result remained at a similarlevel of discrimination as that of the single parameters (AROC = 0.880).
The HRT 3 software includes a larger normative database than that used in HRT 2. This allowsthe HRT 3 database to be stratified by various ethnic groups. Assessing the effect of thesemodifications on the discriminating ability of HRT, we could not find a significant differencebetween HRT 2 and HRT 3. Good agreement was observed between HRT 2 and HRT 3 MRAclassification, although HRT 3 tended to report a higher degree of abnormality than HRT 2(Table 3). This might be due to a narrower confidence interval in the enlarged normative datasetwith a consequent tendency of reporting higher degree of abnormality. Interestingly, thistendency was not reflected in the discriminatory ability as was observed by the similar AROCs.Ethnicity was not a significant contributor to the prediction of glaucoma for both HRT 2 andHRT 3, and we observed only 1 African American subject where MRA classification wasdifferent in HRT 3 than the classification by HRT 2. This finding might be due to the relativelysmall percentage of non-Caucasians in our study group, or it might imply that the original MRAdataset, although not including non-Caucasians, accounted for most of the variability betweenraces by adjusting for the disc size in the linear regression. Alternatively, it might be due to aninadequate number of subjects in the normative database that would allow appropriate ethnicspecific adjustment.
Glaucoma probability score analysis has the theoretical advantage of obtaining structuralmeasurements without the requirement of operator subjective intervention. We have shown
Burgansky-Eliash et al. Page 5
Ophthalmology. Author manuscript; available in PMC 2008 March 1.
NIH
-PA Author Manuscript
NIH
-PA Author Manuscript
NIH
-PA Author Manuscript

that the discriminating ability of the method is similar to those observed by “conventional”single stereometric parameters or MRA (Tables 2, 5; Fig 1). It should be noted that the studygroup included moderately damaged glaucomatous eyes, which might overestimate thediscriminatory ability of the device in early damaged eyes. Although the GPS algorithm doesnot include disc size, as opposed to MRA, and might be prone to failure in the assessment ofsmall and shallow discs, there was no significant effect of disc size on the prediction ofglaucoma by GPS. Other ocular features such as myopic disc and peripapillary atrophy mightalso influence the reliability of the GPS automatic assessment of the ONH. However, our studygroup included a small number of such features and no firm conclusion could be made. Wefound a significant contribution of age to the prediction of glaucoma by both MRA and GPSthat might be due to less than optimal age adjustment in the normative dataset incorporatedinto the machine’s software.
In the original description of the GPS mathematical model by Swindale et al,15 the best singleparameter of the model was horizontal image curvature (AROC = 0.93). This is in concordancewith our observation that the best parameter in the commercial software was horizontal RNFLcurvature. Horizontal image curvature (Swindale et al15) and horizontal RNFL curvature (thepresent study) each refer to the overall curvature along the nasotemporal axis.
Unlike MRA, where the overall classification outperformed the individual sectors, in GPSanalysis the overall classification had similar discriminating ability compared to GPS analysisof the individual sectors (Table 5). Moreover, although we found that discriminating abilitywas significantly improved by segmental GPS results as compared with segmental MRAresults, the GPS overall classification was not better than the MRA. These findings mightindicate that the method used by the analysis for the overall classification where the worstsegmental classification defined the overall classification might not be the best method for thisparameter. Further investigation is warranted.
Although there was good agreement between HRT 2 and HRT 3 MRA, the agreement betweenthe classification of eyes as defined by MRA and GPS was lower. This was evident both in thesectoral analysis and in the overall classification. Therefore, the anatomic features that eachmethod used for defining glaucoma differed and the results were not interchangeable. Alongitudinal study may determine which method was more accurate in predicting structuralglaucomatous abnormalities.
The ordinal classification provided by HRT 3 software allows easier identification of abnormalresults. However, significant differences were noted between the discrimination performanceof the ordinal and continuous individual stereometric parameters, as well as GPS for most ofthe parameters (Table 2). Although a reduction in the ordinal categorization is expected, a fewparameters showed discriminating ability as good as the continuous parameters. This mightindicate that further tuning of the ordinal cutoffs might improve the performance of thisclassification method.
In summary, the new HRT software provides automatic interpretation of topographic imageswithout the need for manual drawing of the counter line. This eliminates a major source ofvariability in HRT measurements.7,13,14 This mathematical model offers an ability todiscriminate between healthy and glaucomatous eyes, similar to that of the HRT 2 without theneed for subjective user input.
Acknowledgements
Supported in part by the National Institutes of Health, Bethesda, Maryland (grant nos. RO1-EY013178-6, P30-EY008098); Eye and Ear Foundation, Pittsburgh, Pennsylvania; and an unrestricted grant from Research to PreventBlindness, Inc., New York, New York.
Burgansky-Eliash et al. Page 6
Ophthalmology. Author manuscript; available in PMC 2008 March 1.
NIH
-PA Author Manuscript
NIH
-PA Author Manuscript
NIH
-PA Author Manuscript

References1. Kruse FE, Burk RO, Volcker HE, et al. Reproducibility of topographic measurements of the optic
nerve head with laser tomographic scanning. Ophthalmology 1989;96:1320–4. [PubMed: 2780001]2. Dreher AW, Tso PC, Weinreb RN. Reproducibility of topographic measurements of the normal and
glaucomatous optic nerve head with the laser tomographic scanner. Am J Ophthalmol 1991;111:221–9. [PubMed: 1992744]
3. Rohrschneider K, Burk RO, Volcker HE. Reproducibility of topometric data acquisition in normal andglaucomatous optic nerve heads with the laser tomographic scanner. Graefes Arch Clin ExpOphthalmol 1993;231:457–64. [PubMed: 8224945]
4. Rohrschneider K, Burk RO, Kruse FE, Volcker HE. Reproducibility of the optic nerve head topographywith a new laser tomographic scanning device. Ophthalmology 1994;101:1044–9. [PubMed: 8008345]
5. Chauhan BC, LeBlanc RP, McCormick TA, Rogers JB. Test-retest variability of topographicmeasurements with confocal scanning laser tomography in patients with glaucoma and controlsubjects. Am J Ophthalmol 1994;118:9–15. [PubMed: 8023882]
6. Janknecht P, Funk J. Optic nerve head analyser and Heidelberg retina tomograph: accuracy andreproducibility of topographic measurements in a model eye and in volunteers. Br J Ophthalmol1994;78:760–8. [PubMed: 7803352]
7. Miglior S, Albe E, Guareschi M, et al. Intraobserver and interobserver reproducibility in the evaluationof optic disc stereometric parameters by Heidelberg Retina Tomograph. Ophthalmology2002;109:1072–7. [PubMed: 12045046]
8. Mikelberg FS, Parfitt CM, Swindale NV. Ability of the Heidelberg retina tomograph to detect earlyglaucomatous visual field loss. J Glaucoma 1996;4:242–7.
9. Uchida H, Brigatti L, Caprioli J. Detection of structural damage from glaucoma with confocal laserimage analysis. Invest Ophthalmol Vis Sci 1996;37:2393–401. [PubMed: 8933756]
10. Hatch WV, Flanagan JG, Etchells EE, et al. Laser scanning tomography of the optic nerve head inocular hypertension and glaucoma. Br J Ophthalmol 1997;81:871–6. [PubMed: 9486029]
11. Iester M, Mikelberg FS, Drance SM. The effect of optic disc size on diagnostic precision with theHeidelberg retina tomograph. Ophthalmology 1997;104:545–8. [PubMed: 9082287]
12. Wollstein G, Garway-Heath DF, Hitchings RA. Identification of early glaucoma cases with thescanning laser ophthalmoscope. Ophthalmology 1998;105:1557–63. [PubMed: 9709774]
13. Garway-Heath DF, Poinoosawmy D, Wollstein G, et al. Inter-and intraobserver variation in theanalysis of optic disc images: comparison of the Heidelberg retina tomograph and computer assistedplanimetry. Br J Ophthalmol 1999;83:664–9. [PubMed: 10340972]
14. Iester M, Mikelberg FS, Courtright P, et al. Interobserver variability of optic disk variables measuredby confocal scanning laser tomography. Am J Ophthalmol 2001;132:57–62. [PubMed: 11438054]
15. Swindale NV, Stjepanovic G, Chin A, Mikelberg FS. Automated analysis of normal and glaucomatousoptic nerve head topography images. Invest Ophthalmol Vis Sci 2000;41:1730–42. [PubMed:10845593]
16. Heidelberg Retina Tomograph Glaucoma Module. Operating Instructions Software Version 3.0.Heidelberg, Germany: Heidelberg Engineering; 2005.
17. DeLong E, DeLong D. Comparing the area under two or more correlated receiver operatingcharacteristics curves: a non-parametric approach. Biometrics 1988;44:837–45. [PubMed: 3203132]
Burgansky-Eliash et al. Page 7
Ophthalmology. Author manuscript; available in PMC 2008 March 1.
NIH
-PA Author Manuscript
NIH
-PA Author Manuscript
NIH
-PA Author Manuscript
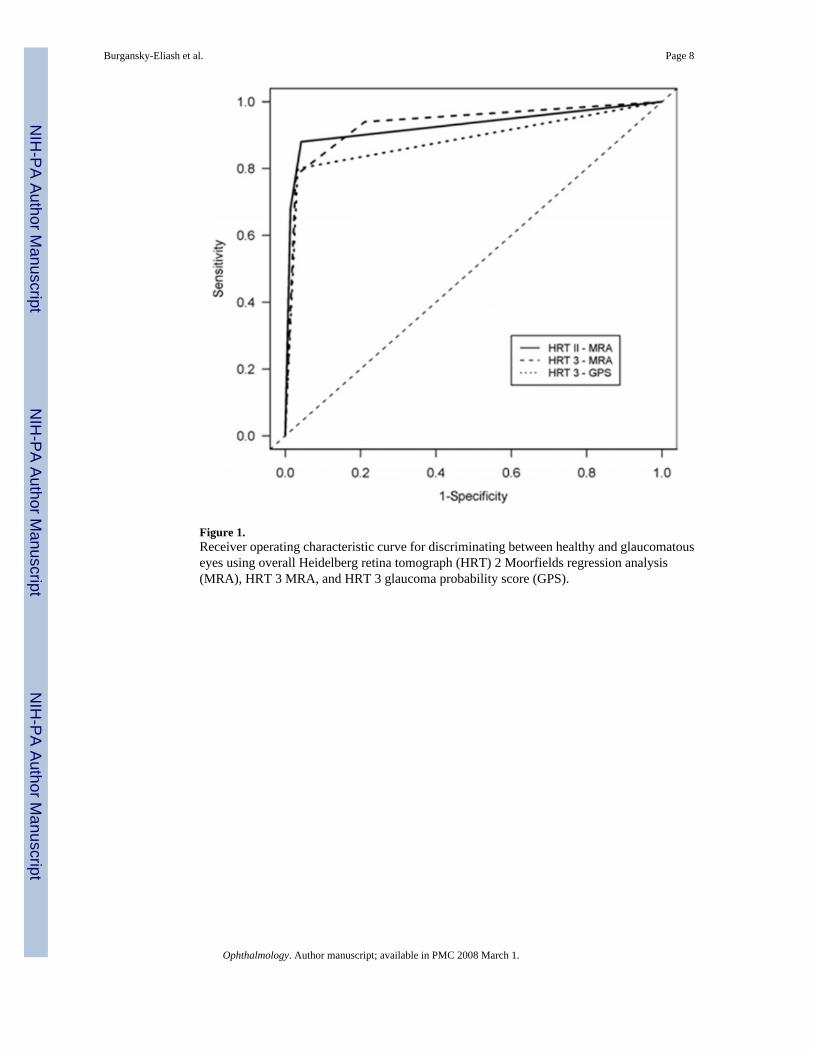
Figure 1.Receiver operating characteristic curve for discriminating between healthy and glaucomatouseyes using overall Heidelberg retina tomograph (HRT) 2 Moorfields regression analysis(MRA), HRT 3 MRA, and HRT 3 glaucoma probability score (GPS).
Burgansky-Eliash et al. Page 8
Ophthalmology. Author manuscript; available in PMC 2008 March 1.
NIH
-PA Author Manuscript
NIH
-PA Author Manuscript
NIH
-PA Author Manuscript

NIH
-PA Author Manuscript
NIH
-PA Author Manuscript
NIH
-PA Author Manuscript
Burgansky-Eliash et al. Page 9
Table 1Characteristics of the Study Population
Healthy (n =71) Glaucoma (n = 50) P
Age (yrs) 45. 1±17.7 (18.6–79.0) 66.4± 12.7 (35.0–88.3) <0.0001*Gender (M/F) 21/50 27/23 0.007†Race 0.11 Caucasian 64 39 Asian 1 3 African American 6 8Eye (R/L) 29/42 26/24 0.2†Mean deviation (dB) −0.46±0.96 (−3.04–1.28) −6.03±5.78 (−21.49–0.32) <0.0001‡SD of HRT scans (mm) 16.1±7.9(8–50) 21.4±8.5 (10–45) <0.0001‡
F = female; HRT = Heidelberg retina tomograph; L = left; M = male; NA = not applicable; R = right; SD = standard deviation.
Values are n or means ± SD.
*t test.
†Chi-square test.
‡Wilcoxon test.
Ophthalmology. Author manuscript; available in PMC 2008 March 1.

NIH
-PA Author Manuscript
NIH
-PA Author Manuscript
NIH
-PA Author Manuscript
Burgansky-Eliash et al. Page 10
Table 2Area under the Receiver Operating Characteristics (95% Confidence Interval) for Discrimination betweenHealthy and Glaucomatous Eyes Using Heidelberg Retina Tomograph (HRT) 3 Stereometric Parameters
Characteristic Numerical Output Ordinal Output
HRT 3 Linear cup/disc ratio 0.897 (0.836–0.958) 0.693 (0.623–0.763) Cup shape measure 0.871 (0.809–0.932) 0.664(0.596–0.731) Rim area 0.839 (0.759–0.920) 0.815 (0.744–0.886) Rim volume 0.825 (0.745–0.906) 0.753 (0.677–0.828) Mean RNFL thickness 0.790 (0.702–0.877) 0.623 (0.560–0.686) Height variation contour 0.615 (0.504–0.726) 0.530 (0.497–0.563)GPS Horizontal RNFL curvature 0.905 (0.844–0.966) NA GPS global 0.899(0.837–0.961) 0.862 (0.794–0.929) Cup size 0.768 (0.678–0.858 NA Vertical RNFL curvature 0.731 (0.636–0.731) NA Rim steepness 0.686 (0.586–0.786) NA Cup depth 0.560 (0.453–0.666) NA
GPS = glaucoma probability score; NA = not applicable; RNFL = retinal nerve fiber layer.
Ophthalmology. Author manuscript; available in PMC 2008 March 1.

NIH
-PA Author Manuscript
NIH
-PA Author Manuscript
NIH
-PA Author Manuscript
Burgansky-Eliash et al. Page 11
Table 3Subjects’ Classification by Overall Heidelberg Retina Tomograph (HRT) 2 Moorfields Regression Analysis(MRA) and HRT 3 MRA
HRT 2
WNL BL ONL Total
HRT3 WNL 59 0 0 59 BL 15 6 0 21 ONL 0 6 35 41 Total 74 12 35 121
BL = borderline; ONL = outside normal limits; WNL = within normal limits.
Ophthalmology. Author manuscript; available in PMC 2008 March 1.

NIH
-PA Author Manuscript
NIH
-PA Author Manuscript
NIH
-PA Author Manuscript
Burgansky-Eliash et al. Page 12
Table 4Subjects’ Classification by Overall Heidelberg Retina Tomograph (HRT) 3 Moorfields Regression Analysis andGlaucoma Probability Score (GPS)
HRT 3
WNL BL ONL Total
GPS WNL 50 11 2 63 BL 6 7 6 19 ONL 3 3 33 39 Total 59 21 41 121
BL = borderline; ONL = outside normal limits; WNL = within normal limits.
Ophthalmology. Author manuscript; available in PMC 2008 March 1.
NIH
-PA Author Manuscript
NIH
-PA Author Manuscript
NIH
-PA Author Manuscript
Burgansky-Eliash et al. Page 13
Table 5Area under the Receiver Operating Characteristic Curve for Discriminating between Healthy and Glaucoma Eyesfor Ordinal Heidelberg Retina Tomograph (HRT) 2 Moorfields Regression Analysis (MRA), HRT 3 MRA, andGlaucoma Probability Score (GPS) classification
Sector HRT 2 MRA HRT 3 MRA HRT 3 GPS
Overall 0.927 (0.877–0.977) 0.934 (0.888–0.980) 0.880 (0.812–0.948)Global 0.769 (0.697–0.841) 0.815 (0.744–0.886) 0.862 (0.794–0.929)Nasal 0.669 (0.599–0.739) 0.730 (0.657–0.812) 0.897 (0.836–0.958)*
Nasal inferior 0.824 (0.755–0.893) 0.843 (0.774–0.911) 0.896 (0.836–0.956)Nasal superior 0.731 (0.658–0.803) 0.755 (0.679–0.830) 0.900 (0.841–0.959)*
Temporal 0.620 (0.560–0.680) 0.686 (0.610–0.762) 0.897 (0.836–0.958)*Temporal inferior 0.843 (0.776–0.909) 0.846 (0.783–0.917) 0.907 (0.876–0.939)*Temporal superior 0.710 (0.641–0.779) 0.731 (0.657–0.806) 0.900 (0.841–0.959)*
*Significant difference between GPS and both HRT 2 and HRT 3 MRA.
Ophthalmology. Author manuscript; available in PMC 2008 March 1.